Embed Size (px)
Citation preview

2017 Half Year Financial Report
January–June 2017 August 8, 2017

1(26)
Nokian Tyres plc Half Year Financial Report January–June 2017, August 8, 2017, 8:00 a.m. Nokian Tyres plc Half Year Financial Report January–June 2017: Strong first half of the year with solid full year expectations April–June 2017
Net sales increased by 16.5% to EUR 393.0 million (337.4 in 4–6/2016). Currency exchange rate changes affected net sales positively by EUR 10.9 million compared with the rates in 4–6/2016.
Operating profit increased by 21.5% to EUR 94.1 million (77.5). Operating profit percentage was 24.0% (23.0%).
The profit for the period increased by 16.0% to EUR 71.1 million (61.3). Earnings per share were EUR 0.52 (0.46). Cash flow from operating activities was EUR -5.9 million (21.3).
January–June 2017
Net sales increased by 17.2% to EUR 718.9 million (613.3 in 1–6/2016). Currency exchange rate changes affected net sales positively by EUR 32.2 million compared with the rates in 1–6/2016.
Operating profit increased by 19.6% to EUR 153.0 million (128.0). Operating profit percentage was 21.3% (20.9%).
The profit for the period increased by 15.1% to EUR 116.4 million (101.2). Earnings per share were EUR 0.86 (0.75). Cash flow from operating activities was EUR -46.0 million (-40.0).
Financial guidance (Updated) In 2017, with the current exchange rates, net sales and operating profit are expected to grow by at least 10% compared to 2016. Previous guidance (May 3, 2017) In 2017, with the current exchange rates, net sales are expected to grow by at least 10% and operating profit is expected to grow by over 5% compared to 2016. Key figures, EUR million
4–6 /17
4–6 /16
Change %
1–6 /17
1–6 /16
Change %
2016
Net sales 393.0 337.4 16.5 718.9 613.3 17.2 1,391.2 Operating profit 94.1 77.5 21.5 153.0 128.0 19.6 310.5 Operating profit % 24.0 23.0 21.3 20.9 22.3 Profit before tax 87.1 74.8 16.5 146.0 123.2 18.5 298.7 Profit for the period 71.1 61.3 16.0 116.4 101.2 15.1 251.8 Earnings per share, EUR 0.52 0.46 14.7 0.86 0.75 13.8 1.87 Equity ratio, % 76.4 72.0 73.8 Cash flow from operating activities
-5.9 21.3 -46.0 -40.0 364.4
Gearing, % -2.6 6.6 -19.7 Interest-bearing net debt -36.0 79.6 -287.4 Capital expenditure 42.6 25.3 68.4 60.0 44.4 35.0 105.6

2(26)
Hille Korhonen, President and CEO: “In H1/2017 Nokian Tyres demonstrated strong performance in all of its main markets. Our net sales and operating profit improved.
The Passenger Car Tyres business unit showed strong growth during H1/2017. Net sales and operating profit increased clearly year-over-year, and we were able to increase our market shares in our main markets. The growth was driven by Russia due to its stronger currency, price increases and low carry-over stocks from 2016. The growth in Russia will be moderate in H2/2017, as H2/2016 was already strong. We have been responding to the growing demand by increasing the production volumes at both factories and by building a new production line at the Russian factory. The new production line will be taken into use by the end of the year. Raw material costs continued to go up during H1. We estimate, that raw material costs will increase by approximately 20% for the full year 2017 compared with 2016. We have already implemented the necessary price increases in all markets, and the full effect of these increases will be seen from H2 onwards due to the seasonality of Nokian Tyres’ business model. We have been building the foundation for future growth by renewing our product range with new winter tyre range: the Nokian Hakkapeliitta 9 and Nokian Hakkapeliitta 9 SUV, along with Nokian Nordman 7 and Nokian Nordman 7 SUV.
Heavy Tyres increased its sales and production volume especially in the forestry business. We have been investing in production technology, people and marketing activities in order to support further growth. Heavy Tyres has announced several new products, including the Nokian E-Truck series of all-season truck and bus tyres and Nokian HTS G2 – the second generation of terminal tyres.
Vianor’s (own equity) sales were impacted by the atypical spring season, and its profitability was affected by non-recurring expenses. However, a profitability improvement program is proceeding according to plan. Our branded distribution network, including Vianor, NAD, and N-Tyre stores, grew by 145 stores during H1/2017.
In May, we announced an investment in a new greenfield factory in Dayton, Tennessee, USA. This factory will enable us to further enhance our position in the North American market with a wider product range and better customer service.
Our personnel have been doing a great job everywhere. As the company’s new President and CEO, I am very proud of all of them. A strong position in our core markets, investments in growth markets, a strong distribution network, competitive products, and the whole organization delivering excellent results provide us a solid foundation for future growth. We have returned to a growth track and intend to stay on this track also in the future.”

3(26)
Market situation
The global recovery continues. For 2017 and 2018, growth is expected in all regions. The global GDP is estimated to grow by 3.5% in 2017 (3.1% in 2016). The GDP growth estimates for the Nordic countries range from +1.6% to +3.0%, whereas for Europe (including the Nordic countries) the number is +1.7% and for the US +2.2%. In Russia, GDP is forecasted to grow by approximately 1.5% to 2.0%.
Raw material prices demonstrated fast growth at the beginning of the year, but this growth levelled off in Q2/2017. The global tyre industry responded to the growing raw material prices by announcing price increases. However, the actual price increases implemented in the markets are not yet fully visible.
In Europe, sales of new cars increased in January–June 2017 by 5% year-over-year. Car tyre sell-in to distributors was down 1% year-over-year, with winter tyre demand increasing by 2%. Overall, tyre demand in Central Europe is estimated to grow slightly year-over-year in 2017.
In the Nordic countries, new car sales increased in January–June 2017 by 2% year-over-year. The market volume of car tyres decreased by 5%. For the full year 2017, car tyre demand is estimated to remain at the same level year-over-year.
In North America, the estimated new car sales were down by 9% in H1/2017 compared with H1/2016. The market volume of car tyres was up slightly year-over-year. However, demand for winter tyres increased 13%. For the full year 2017, car tyre demand is estimated to increase slightly year-over-year.
In the first half of 2017, the Russian economy started growing again after a prolonged recession. Real GDP is estimated to have grown by 1–2% in H1/2017, and the growth forecasts for the full year 2017 are in the range of 1.5–2%. However, private consumption remains quite weak after a 15% decline in 2015–2016. It is expected to start recovering in 2017, but the improvement is unlikely to be rapid. This development is reflected in the retail turnover in Russia, which shows only marginal signs of growth. Sales of new cars in Russia are expected to grow modestly, up to 10% compared with 2016. After the first six months of 2017, sales of new cars increased by 7% compared with the same period in 2016, with growth starting only in March (+9% compared with March 2016) and picking up in June (+15% compared with June 2016). The total replacement tyre market sell-in in Russia is expected to grow by 10–15% in 2017 compared with 2016. Both summer and winter tyre sell-in for the 2017 season showed growth, backed by low carry-over stocks from 2016. The consumer sell-out season in Russia showed a slight decline compared with H1/2016, negatively affected by the weather conditions.
The global demand for special heavy tyres continued to vary strongly between products and market areas in January–June 2017. The demand for OE forestry tyres remained strong. The increased use of wood and the good profitability of pulp manufacturers will also support the demand for forestry machines and tyres in the following quarters. During the review period, the agricultural segment also showed improvement.
In January–June 2017, the sell-in of premium truck tyres was up by 7% in Europe, and in the Nordic countries demand was up by 7%. In Russia, the demand for premium truck tyres decreased by 7% compared with H1/2016. Truck tyre demand in 2017 is estimated to increase in all of Nokian Tyres’ Western markets; in Russia, demand is estimated to remain at the same level year-over-year.

4(26)
Raw materials
Nokian Tyres’ raw material costs (EUR/kg) were up by 20.4% in H1/2017 year-over-year. The raw material costs are estimated to increase by approximately 20% in the full year 2017, leading to a headwind of approximately EUR 60 million compared with 2016.
APRIL–JUNE 2017
Nokian Tyres Group recorded net sales of EUR 393.0 million (337.4), with an increase of 16.5% compared with Q2/2016. Currency exchange rates affected net sales positively by EUR 10.9 million. In the Nordic countries, sales increased by 2.1% year-over-year. The sales in Russia increased by 116.3%. The consolidated sales in Russia and the CIS increased by 113.6%. In Other Europe, sales were up by 4.6% and, in North America, sales increased by 8.1%.
The raw material costs (EUR/kg) in manufacturing increased by 21.7% year-over-year and by 5.1% compared with Q1/2017. Fixed costs amounted to EUR 114.7 million (103.2), thereby accounting for 29.2% (30.6%) of net sales.
Nokian Tyres Group’s operating profit amounted to EUR 94.1 million (77.5), with an increase of 21.5% compared with Q2/2016. The operating profit was negatively affected by the IFRS 2 compliant accrual for share option and performance share plans of EUR 2.2 million (3.1). In Q2/2017, the expensed credit losses and provisions were EUR 0.2 million (6.3).
Net financial expenses were EUR 7.0 million (2.7). Net interest expenses were EUR 2.1 million (1.4). Net financial expenses include a loss of EUR 4.9 million (loss of EUR 1.3 million) due to exchange rate differences.
Profit before tax was EUR 87.1 million (74.8). The profit for the period amounted to EUR 71.1 million (61.3), and EPS were EUR 0.52 (0.46).
Cash flow from operating activities was EUR -5.9 million (21.3).
JANUARY–JUNE 2017
Nokian Tyres Group recorded net sales of EUR 718.9 million (613.3), with an increase of 17.2% compared with H1/2016. Currency exchange rates affected net sales positively by EUR 32.2 million. Net sales development by market area
Growth% % of total net sales
in 1–6/2017
% of total net sales
in 1–6/2016
Nordic countries 3.3 37.3 42.8 Russia and the CIS 84.4 24.5 15.7 Other Europe 10.6 26.4 28.3 North America 8.7 11.3 12.4
Net sales development by business unit
Growth% % of total net sales
in 1–6/2017
% of total net sales
in 1–6/2016
Passenger Car Tyres 21.2 69.5 66.3 Heavy Tyres 9.8 11.1 11.7 Vianor 2.0 19.4 22.0
5(26)
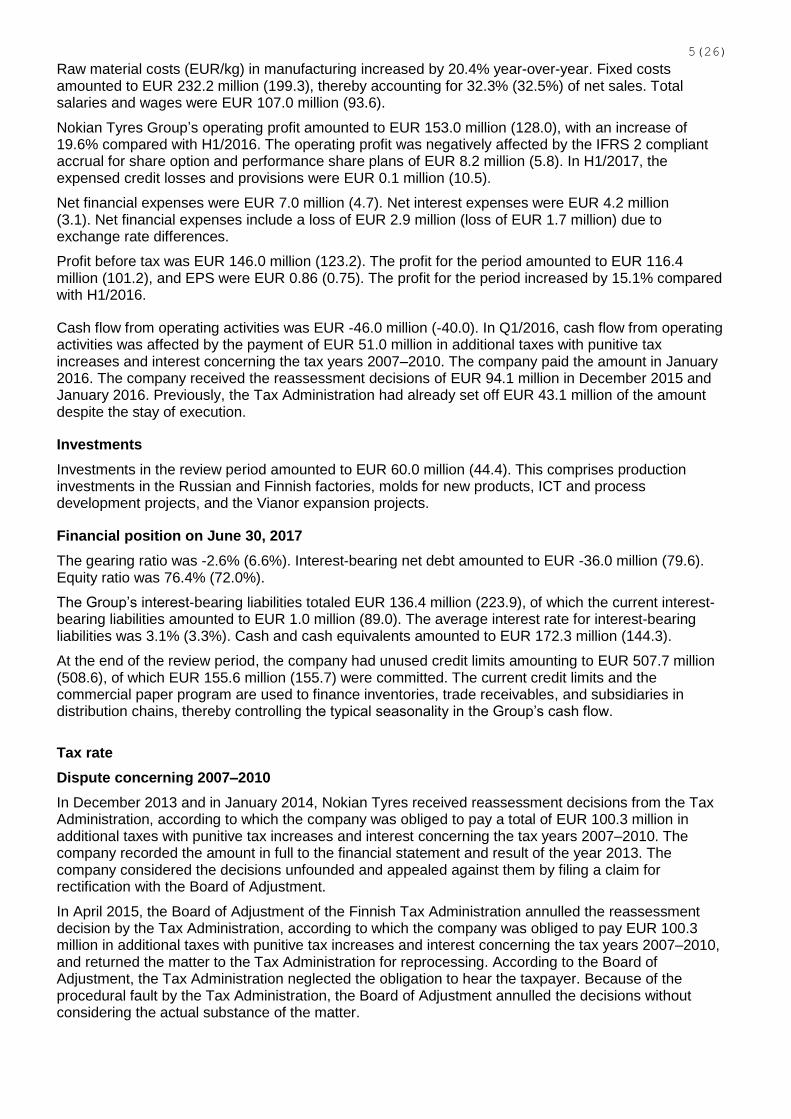
Raw material costs (EUR/kg) in manufacturing increased by 20.4% year-over-year. Fixed costs amounted to EUR 232.2 million (199.3), thereby accounting for 32.3% (32.5%) of net sales. Total salaries and wages were EUR 107.0 million (93.6).
Nokian Tyres Group’s operating profit amounted to EUR 153.0 million (128.0), with an increase of 19.6% compared with H1/2016. The operating profit was negatively affected by the IFRS 2 compliant accrual for share option and performance share plans of EUR 8.2 million (5.8). In H1/2017, the expensed credit losses and provisions were EUR 0.1 million (10.5).
Net financial expenses were EUR 7.0 million (4.7). Net interest expenses were EUR 4.2 million (3.1). Net financial expenses include a loss of EUR 2.9 million (loss of EUR 1.7 million) due to exchange rate differences.
Profit before tax was EUR 146.0 million (123.2). The profit for the period amounted to EUR 116.4 million (101.2), and EPS were EUR 0.86 (0.75). The profit for the period increased by 15.1% compared with H1/2016.
Cash flow from operating activities was EUR -46.0 million (-40.0). In Q1/2016, cash flow from operating activities was affected by the payment of EUR 51.0 million in additional taxes with punitive tax increases and interest concerning the tax years 2007–2010. The company paid the amount in January 2016. The company received the reassessment decisions of EUR 94.1 million in December 2015 and January 2016. Previously, the Tax Administration had already set off EUR 43.1 million of the amount despite the stay of execution.
Investments
Investments in the review period amounted to EUR 60.0 million (44.4). This comprises production investments in the Russian and Finnish factories, molds for new products, ICT and process development projects, and the Vianor expansion projects.
Financial position on June 30, 2017
The gearing ratio was -2.6% (6.6%). Interest-bearing net debt amounted to EUR -36.0 million (79.6). Equity ratio was 76.4% (72.0%).
The Group’s interest-bearing liabilities totaled EUR 136.4 million (223.9), of which the current interest-bearing liabilities amounted to EUR 1.0 million (89.0). The average interest rate for interest-bearing liabilities was 3.1% (3.3%). Cash and cash equivalents amounted to EUR 172.3 million (144.3).
At the end of the review period, the company had unused credit limits amounting to EUR 507.7 million (508.6), of which EUR 155.6 million (155.7) were committed. The current credit limits and the commercial paper program are used to finance inventories, trade receivables, and subsidiaries in distribution chains, thereby controlling the typical seasonality in the Group’s cash flow.
Tax rate
Dispute concerning 2007–2010
In December 2013 and in January 2014, Nokian Tyres received reassessment decisions from the Tax Administration, according to which the company was obliged to pay a total of EUR 100.3 million in additional taxes with punitive tax increases and interest concerning the tax years 2007–2010. The company recorded the amount in full to the financial statement and result of the year 2013. The company considered the decisions unfounded and appealed against them by filing a claim for rectification with the Board of Adjustment.
In April 2015, the Board of Adjustment of the Finnish Tax Administration annulled the reassessment decision by the Tax Administration, according to which the company was obliged to pay EUR 100.3 million in additional taxes with punitive tax increases and interest concerning the tax years 2007–2010, and returned the matter to the Tax Administration for reprocessing. According to the Board of Adjustment, the Tax Administration neglected the obligation to hear the taxpayer. Because of the procedural fault by the Tax Administration, the Board of Adjustment annulled the decisions without considering the actual substance of the matter.

6(26)
The company returned the total additional taxes of EUR 100.3 million from 2007–2010 in full to the financial statement and result for the first quarter of 2015.
In December 2015 and January 2016, the company received renewed reassessment decisions from the Tax Administration, according to which the company was obliged to pay EUR 94.1 million in additional taxes, of which EUR 62.8 million were additional taxes and EUR 31.3 million were punitive tax increases and interest. Previously, the Tax Administration had already set off EUR 43.1 million of the amount despite the stay of execution. The company paid the remaining amount in January 2016. The company still considers the decisions unfounded and appealed against them by filing a claim with the Board of Adjustment.
Based on the renewed reassessment decisions, the company recorded the total additional taxes of EUR 94.1 million in full as expenses in the financial statement and result for 2015.
In November 2016, the company announced that the Board of Adjustment of the Finnish Tax Administration held in force the reassessment decision from the Tax Administration related to additional taxes of EUR 62.8 million but reduced the amount of punitive tax increases and interest from EUR 31.3 million to EUR 26.4 million concerning the tax years 2007–2010. The company has paid the amount of EUR 89.2 million in full. The company considers the decision unfounded and appealed against it by filing a claim with the Administrative Court in January 2017.
The reassessment decision regarding the year 2011 has not yet been received, and the later years have not been tax audited by the Finnish Tax Administration. Dispute concerning the US subsidiary 2007–2013
In 2013 and 2014, Nokian Tyres U.S. Finance Oy, a subsidiary of Nokian Tyres plc (ownership: 100% of the shares), received in reassessment decisions from the Finnish Tax Administration, according to which the company was obliged to pay EUR 15.5 million in additional taxes with punitive tax increases and interest concerning the tax years 2007–2013. EUR 11.0 million of this amount were additional taxes and EUR 4.5 million were punitive tax increases and interest. The company recorded them in full in the financial statement and result for 2013 and 2014.
The Large Taxpayers’ Office carried out a tax audit concerning the Finnish Business Tax Act, where the Tax Administration raised an issue regarding the restructuring of the sales company and acquisitions by Nokian Tyres Group in North America, completely ignoring the business rationale and corresponding precedent rulings presented by the company.
Nokian Tyres U.S. Finance Oy considered the reassessment decision of the Tax Administration unfounded and filed a claim for rectification with the Board of Adjustment.
In June 2017, the Board of Adjustment rejected the company’s claim for rectification. The company considers the decision unfounded and appealed against it by filing a claim with the Administrative Court in July 2017.
Tax rate outcome and estimate
The Group’s tax rate was 20.3% (17.9%) in the review period. The tax rate is positively affected by tax incentives in Russia for current investments and further future investments. The latest agreed tax benefits and incentives for the factory came into force at the beginning of 2013 and, for the sales company, these were renewed in August 2016. The agreements will extend the validity of the benefits and incentives until approximately 2020. Due to the renewed agreement and changes in Russian legislation, the Group’s estimated tax rate is expected to be 19% for 2017–2019.
The tax rate in the coming years will depend on the timetable and final outcome of the ongoing back tax disputes with the Finnish Tax Administration. The Group’s corporate annual tax rate may rise as a result of these cases.
Personnel
In H1/2017 the Group employed, on average, 4,543 (4,384) people and 4,495 (4,266) people at the end of the review period. At the end of the review period, the Group employed 1,715 (1,616) people in

7(26)
Finland, and 1,430 (1,352) people in Russia. The equity-owned Vianor tyre retail chain employed 1,635 (1,661) people at the end of the review period.

8(26)
BUSINESS UNIT REVIEWS Passenger Car Tyres
4–6 /17
4–6 /16
Change %
1–6 /17
1–6 /16
Change %
2016
Net sales, M€ 276.4 230.1 20.1 524.4 432.6 21.2 981.1 Operating profit, M€
84.8 64.7 31.0 160.7 127.0 26.6 305.8
Operating profit, %
30.7 28.1 30.6 29.4 31.2
Net sales of Nokian Passenger Car Tyres totaled EUR 524.4 million (432.6) in H1/2017, up by 21.2% year-over-year. Operating profit was EUR 160.7 million (127.0). Operating profit percentage was 30.6% (29.4%).
Net sales increased clearly during the review period H1/2017 mainly due to a significant net sales increase in Russia. In North America, Other Europe, and the Nordic countries, net sales increased year-over-year. In most countries, the volumes were up. Winter tyre sell-in was very strong in Russia and, remained at a stable level in other markets.
In H1/2017, the ASP in euros increased due to a positive currency impact, improved product mix and price increases. The share of winter tyres in the sales mix was 55% (57%), the share of summer tyres was 32% (32%), and the share of All-Season tyres was 13% (11%). Increased sales of All-Season tyres strengthen our position in North America and Other Europe. Price increases have been implemented in all markets, and the full effect of these increases will be seen from H2/2017 onwards due to the seasonality of Nokian Tyres’ business model.
Raw material costs (€/kg) were up by 20.9% year-over-year. Improved productivity supported the margins.
Nokian Tyres excelled in tyre tests, with several wins in car magazine tests all over the world. Read more at: www.nokiantyres.com/test-success/. A flow of product launches with new innovations – improving safety, comfort, and eco-friendly driving – continued in the review period. For example, the Nokian Hakkapeliitta 9, Nokian Hakkapeliitta 9 SUV, Nokian Nordman 7, and Nokian Nordman 7 SUV were introduced. The key markets for these products are in the Nordic countries, Russia, and North America. The Nokian Hakkapeliitta 44 was also launched; it is used in the harshest environments of the world, such as glaciers, Antarctica, and the northern part of Eurasia. New products have been received well by the markets.
During the review period, capacity utilization increased year-over-year, and the production output (pcs) increased by 13%. The Vsevolozhsk factory is practically running at full capacity, given the current product range. The company increased production at the Nokia factory with the current shift pattern. Productivity (kg/mh) improved by 2% year-over-year. In H1/2017, 86% (86%) of Nokian passenger car tyres (pcs) were manufactured at the Russian factory.

9(26)
Heavy Tyres
4–6 /17
4–6 /16
Change %
1–6 /17
1–6 /16
Change %
2016
Net sales, M€ 44.0 38.7 13.5 83.8 76.3 9.8 155.3 Operating profit, M€
9.1 6.1 50.1 14.8 15.0 -1.2 28.2
Operating profit, %
20.8 15.7 17.7 19.7 18.2
Net sales of Nokian Heavy Tyres totaled EUR 83.8 million (76.3) in H1/2017, up by 9.8% year-over-year. Operating profit was EUR 14.8 million (15.0). Operating profit percentage was 17.7% (19.7%).
In January–June 2017, the demand was good in most of Nokian Heavy Tyres’ core product groups in the Western markets. Sales of forestry and agricultural tyres were strong. Sales increased especially in North America and in Other Europe, and remained at a good level in the Nordic countries. In Russia, sales increased mainly due to currency effects. Especially new product sales developed well. The operating profit decreased slightly due to the raw material cost increases, timing of price increases and fixed costs, larger share of OE sales, and continued investments in future sales and production.
In H1/2017, the ASP increased year-over-year mainly due to currency effects. Price increases have been implemented in all markets, and the full effect of these increases will be seen from H2/2017 onwards. During the review period, sales volumes of the company’s own production increased year-over-year. Productivity remained at the same level year-over-year due to the planned production ramp-up.
Production output (metric tons) increased compared with H1/2016. Investments in production technology continued.

10(26)
Vianor Equity operations
4–6 /17
4–6 /16
Change %
1–6 /17
1–6 /16
Change %
2016
Net sales, M€ 89.8 89.4 0.4 146.1 143.2 2.0 334.8 Operating profit, M€
4.0* 5.5 -27.6 -11.8** -9.2 -29.0 -8.1
Operating profit, %
4.5* 6.2 -8.1** -6.4 -2.4
Equity stores, pcs 205 202 212 * Excluding non-recurring items: Operating profit EUR 5.8 million, operating profit percentage 6.5%. ** Excluding non-recurring items: Operating profit EUR -10.0 million, operating profit percentage -6.8%. Net sales totaled EUR 146.1 million (143.2) in H1/2017, up by 2.0% year-over-year. Operating profit was EUR -11.8 million (-9.2). Operating profit percentage was -8.1% (-6.4%).
In H1/2017, net sales increased slightly year-over-year but were affected by the atypical summer tyre season. The retail business environment continued to be very challenging. The profit improvement program, including the network optimization, progressed according to plan. Operating profit was affected by the expenses of EUR 1.8 million from the profit improvement program. At the end of the review period, Vianor had 205 (202) equity stores in Finland, Sweden, Norway, USA, and Switzerland. Branded distribution network
Nokian Tyres’ branded distribution network includes the Vianor equity chain, Vianor partner chain, Nokian Tyres Authorized Dealers (NAD), and N-Tyre. Vianor chains operate in 27 countries.
In Nokian Tyres’ key markets, the size of the Vianor equity and partner chain increased during H1/2017 (compared with year-end 2016: equity -7, partner +12). At the end of the review period, the Vianor equity and partner network comprised 1,506 stores in total, of which 1,301 were partners.
The Nokian Tyres Authorized Dealers (NAD) network expanded during the review period by 137 stores compared with year-end 2016, and now comprises 1,618 stores operating under contract in 21 European countries and China. N-Tyre, a Nokian Tyres partner network, is operating with 123 stores in Russia and the CIS and expanded during the review period by 3 stores compared with year-end 2016.

11(26)
OTHER MATTERS
1. Stock options on the Nasdaq Helsinki Stock Exchange
The total number of stock options 2013A was 1,150,000. Each stock option 2013A entitled its holder to subscribe to one share in Nokian Tyres plc. The shares were subscribed with the stock options 2013A during the period of May 1, 2015 to May 31, 2017.
The total number of stock options 2013B is 1,150,000. Each stock option 2013B entitles its holder to subscribe to one share in Nokian Tyres plc. The shares can be subscribed with the stock options 2013B during the period of May 1, 2016 to May 31, 2018. The present share subscription price with stock options 2013B is EUR 25.06/share. The dividends payable annually are deducted from the share subscription price.
The total number of stock options 2013C is 1,150,000. Each stock option 2013C entitles its holder to subscribe to one share in Nokian Tyres plc. The shares can be subscribed with the stock options 2013C during the period of May 1, 2017 to May 31, 2019. The present share subscription price with stock options 2013C is EUR 21.39/share. The dividends payable annually are deducted from the share subscription price.
2. Authorizations
In 2017, the Annual General Meeting authorized the Board of Directors to make a decision to offer no more than 25,000,000 shares through a share issue, or by granting special rights under Chapter 10, Section 1 of the Finnish Limited Liability Companies Act that entitle to shares (including convertible bonds), on one or more occasions. The authorization is effective for two years from the decision.
In 2017, the Annual General Meeting authorized the Board of Directors to resolve to repurchase a maximum of 5,000,000 shares in the company by using the funds in the unrestricted shareholders’ equity. The authorization is effective until the next Annual General Meeting, however, at most until October 10, 2018.
3. Own shares
No share repurchases were made in the review period, and the company did not possess any own shares on June 30, 2017.
In 2014, Nokian Tyres entered into an agreement with a third-party service provider concerning the share-based incentive program for key personnel. The third party owns the shares until the shares are given to the participants within the program. In accordance with IFRS, these repurchased 300,000 shares have been reported as treasury shares in the Consolidated Statement of Financial Position. This number of shares corresponded to 0.2% of the total shares and voting rights of the company. On June 30, 2017, the number of these shares was 41,331.
4. Trading in shares
Nokian Tyres’ share price was EUR 36.24 (32.03) at the end of the review period. The volume weighted average share price during the period was EUR 37.33 (30.94), the highest was EUR 40.20 (34.38) and the lowest was EUR 34.24 (27.48). A total of 54,738,458 shares were traded in Nasdaq Helsinki during the period (80,267,597), representing 40% (60%) of the company’s overall share capital. Nokian Tyres’ shares are also traded on alternative exchanges, such as BATS CXE, Turquoise, and BATS BXE. The total trading volume on these alternative exchanges was 48,651,657 (81,351,549) shares during the review period. The company’s market capitalization at the end of the period was EUR 4.940 billion (4.314 billion). The company had 37,259 (35,986) shareholders. The percentage of Finnish shareholders was 23.7% (23.2%), and 76.3% (76.8%) were non-Finnish holders and foreign shareholders registered in the nominee register. This figure includes Bridgestone’s holding of approximately 14.7%.
12(26)
5. Changes in ownership
Nokian Tyres did not receive any flagging notifications during the review period.
Detailed information on flagging can be found at www.nokiantyres.com/company/investors/share/flagging-notifications/.
6. Decisions made at the Annual General Meeting
On April 10, 2017, the Annual General Meeting of Nokian Tyres approved the Financial Statements for 2016 and discharged the members of the Board of Directors and the President and CEO from liability for the 2016 financial year.
6.1. Dividend
The meeting decided that a dividend of EUR 1.53 per share should be paid for the period ending on December 31, 2016. The dividend payment date was April 27, 2017, and the dividend was paid to the shareholders included in the shareholder list maintained by Euroclear Finland Ltd on the record date of April 12, 2017.
6.2. Change to the Articles of Association
The meeting confirmed the new proposed wording for Article 4: The Company’s administration and proper organization of operations shall be the responsibility of the Board of Directors, consisting of a minimum of four and a maximum of eight members, in accordance with the decision made by the General Meeting of the Shareholders. The term of office of the members of the Board of Directors ends at the closing of the first Annual General Meeting following the election. The Board of Directors shall elect a Chairman and a Deputy Chairman from among its members until the closing of the next Annual General Meeting.
6.3. Members of the Board of Directors and Auditors
The meeting decided that the Board of Directors has seven members. Of the current members, Heikki Allonen, Tapio Kuula, Raimo Lind, Veronica Lindholm, Inka Mero, and Petteri Walldén will continue in the Board of Directors. Mr. George Rietbergen was elected as a new member of the Board.
Authorized public accountants KPMG Oy Ab continue as auditors.
6.4. Remuneration of the Members of the Board of Directors
The meeting decided that the monthly fee paid to the Chairman of the Board is EUR 6,667, or EUR 80,000 per year, the monthly fee paid to the Deputy Chairman of the Board and to the Chairman of the Audit Committee is EUR 5,000, or EUR 60,000 per year, and the monthly fee paid to Members of the Board is EUR 3,333, or EUR 40,000 per year.
50% of the annual fee is paid in cash and 50% in Company shares to the effect that, in the period from April 11 to April 30, 2017, EUR 40,000 worth of Nokian Tyres plc shares were purchased at the stock exchange on behalf of the Chairman of the Board, EUR 30,000 worth of Nokian Tyres plc shares were purchased at the stock exchange on behalf of the Deputy Chairman of the Board and Chairman of the Audit committee, and EUR 20,000 worth of shares were purchased on behalf of each Board Member.
The company is liable to pay any asset transfer tax which may arise from the acquisition of shares. Each member of the Board will receive a meeting fee of EUR 600 per attended meeting. If a Board member’s habitual residence is outside Finland, the meeting fee is EUR 1,200 per attended meeting. Travel expenses will be compensated for in accordance with the company’s travel policy.
7. Chairman of the Board, Deputy Chairman of the Board, and Committees of the Board of Directors

13(26)
In the Board meeting on April 10, 2017, Petteri Walldén was elected Chairman of the Board and Tapio Kuula was elected Deputy Chairman of the Board. The Board elected Tapio Kuula (Chairman), Veronica Lindholm, and Petteri Walldén as members of the Personnel and Remuneration Committee. The Board elected Raimo Lind (Chairman), Heikki Allonen, Inka Mero, and George Rietbergen as members of the Audit Committee.
8. Corporate social responsibility
Nokian Tyres published its Corporate Sustainability Report in March 2017. The Corporate Sustainability Report is available in Finnish and English on the company’s website at www.nokiantyres.com/company/sustainability/. The report is based on the international, widely adopted GRI G4 guidelines that divide sustainability into three main groups (financial, environmental, and social sustainability and their different subgroups). Product safety and quality, as well as profitable growth, good HR management, and environmental issues are important for the development of sustainable business operations at Nokian Tyres. The report is the fifth GRI report from Nokian Tyres and, in the interests of quality assurance, it has now been externally assured for the second time.
Nokian Tyres plc is included in the OMX GES Sustainability Finland GI index. The index is designed to provide investors with a liquid, objective, and reliable benchmark for responsible investments. The benchmark index comprises the 40 leading Nasdaq Helsinki listed companies in terms of sustainability. The index criteria are based on international guidelines for environmental, social, and governance (ESG) issues. The index is calculated by Nasdaq in cooperation with GES Investment Services. Nokian Tyres is also included in the STOXX Global ESG Leaders indices, and is a constituent of the FTSE4Good Index.
9. Nokian Tyres introduces new flagship products for its winter tyre range: the Nokian Hakkapeliitta 9 and Nokian Hakkapeliitta 9 SUV utilize unique stud technology
On January 3, 2017, Nokian Tyres announced that Nokian Tyres renews its studded tyre range by launching its new flagship products: the Nokian Hakkapeliitta 9, for passenger cars, and the Nokian Hakkapeliitta 9 SUV for sports utility vehicles. In addition to the Nokian Hakkapeliitta winter tyres, the company is also introducing the new studded Nokian Nordman 7 and Nokian Nordman 7 SUV winter tyres. The Nokian Nordman product family offers an alternative to the premium products in terms of the price–quality ratio and supplements Nokian Tyres’ product range for different consumer groups. Key markets for both product families are the Nordic countries, Russia, and North America.
10. Changes in Nokian Tyres' management team
On January 18, 2017, Nokian Tyres announced that Mr. Timo Tervolin, Vice President, Strategy and Corporate Development, will take over the responsibility for the global Process Development in Nokian Tyres as of February 1, 2017. Mr. Alexej von Bagh, the current Vice President, Process Development will move outside the company.
11. Nokian Tyres plc Performance Share Plan: performance period 2017 and realization of performance period 2016
On February 2, 2017, Nokian Tyres announced that the potential reward from the performance period 2017 will be based on the Nokian Tyres Group’s Net Sales and Operating Profit. The rewards to be paid on the basis of the performance period 2017 correspond to an approximate maximum total of 540,000 Nokian Tyres plc shares, also including the proportion to be paid in cash. During the performance period 2017, the Plan is targeted towards approximately 200 key employees, including the members of the Group’s Management Team. The potential reward from the performance period 2017 will be paid partly in the company’s shares and partly in cash in 2018. The shares paid as a reward may not be transferred during an approximately one-year restriction period established for the shares. For shares paid on the basis of the performance period 2017, the restriction period will end on March 31, 2019.
The rewards to be paid in 2017, on the basis of the achievement of the required performance levels set for the performance criteria of the performance period 2016, correspond to a total of 402,875 Nokian

14(26)
Tyres plc shares, also including the proportion to be paid in cash. The Plan was targeted towards 182 key employees, including the members of the Group’s Management Team. The shares paid as a reward may not be transferred during an approximately one-year restriction period established for the shares. For shares paid on the basis of the performance period 2016, the restriction period will end on March 31, 2018. The members of the Group’s Management Team must hold 25% of the received gross shares until the member’s shareholding in the company equals the member’s fixed gross annual salary.
12. Nokian Tyres plc: Managers’ transactions
Nokian Tyres announced managers’ transactions on February 8, 2017; February 10, 2017; March 7, 2017; March 10, 2017; March 24, 2017; March 27, 2017; and April 13, 2017. Read more at: www.nokiantyres.com/company/publications/releases/2017/managementTransactions/.
13. Nokian Tyres plc: Shares subscribed with option rights
On February 9, 2017, Nokian Tyres announced that, after the registration of new shares on November 10, 2016, a total of 14,146 Nokian Tyres plc’s shares have been subscribed with the 2013A option rights and a total of 80 shares with the 2013B option rights. As a result of the share subscriptions, the number of Nokian Tyres plc shares will increase to 135,925,921 shares.
14. Hille Korhonen appointed President and CEO of Nokian Tyres plc
On March 28, 2017, Nokian Tyres announced that the Board of Directors of Nokian Tyres plc has appointed Licentiate of Science (Technology) Hille Korhonen (born 1961) as the new President and Chief Executive Officer of Nokian Tyres plc. She will start at Nokian Tyres on June 1, 2017. Hille Korhonen has more than 20 years of experience in international consumer business and leading global industrial operations. Andrei Pantioukhov has acted as Interim President and CEO since January 2017, and will continue in this role until Korhonen assumes her duties as CEO. As of June 1, 2017, Mr. Pantioukhov will continue as the Executive Vice President of Nokian Tyres plc, General Manager, Russian operations and a member of the Group’s management team.
15. Nomination to Nokian Tyres' management team
On April 19, 2017, Nokian Tyres announced that Mr. Frans Westerlund has been appointed Vice President, CIO and Processes. He will join Nokian Tyres plc as a member of the management team on August 1, 2017. Mr. Westerlund will report to the President and CEO. Mr. Teppo Huovila, the current Vice President for Quality, Sustainability and ICT, will continue in the company’s management team as Vice President, Quality and Sustainability. Process development is currently part of Mr. Timo Tervolin’s responsibilities. He will continue in the company’s management team as Vice President, Strategy and Corporate Development. Read more at: www.nokiantyres.com/company/news-article/nomination-to-nokian-tyres-management-team-3/.
16. Nokian Tyres’ Board of Directors has made a principal decision to invest in a greenfield factory in the USA
On May 3, 2017, Nokian Tyres announced that Nokian Tyres’ Board of Directors has made a principal decision on the investment in the third factory and authorized the management of the company to sign a Letter of Intent with the respective authorities in the USA. The new greenfield factory will be located in Dayton (Rhea County), Tennessee, USA. The annual capacity of the factory will be 4 million tyres with potential to expand in the future. The site will also house a distribution facility with a storage capacity of 600,000 tyres. The total amount of the investment at this phase is approximately USD 360 million. Construction is scheduled to begin in early 2018 and the first tyres are to be produced in 2020.
17. Nokian Tyres plc: Shares subscribed with option rights
On May 11, 2017, Nokian Tyres announced that, after the registration of new shares on February 9, 2017, a total of 371,314 Nokian Tyres plc’s shares have been subscribed with the 2013A option rights,

15(26)
and a total of 18,399 shares with the 2013B option rights. As a result of the share subscriptions, the number of Nokian Tyres plc shares will increase to 136,315,634 shares.

16(26)
RISKS, UNCERTAINTY, AND DISPUTES IN THE NEAR FUTURE
The global recovery is expected to continue, but political uncertainties could cause serious disruption and additional trade barriers, and affect the company’s sales and credit risk. Brexit, as such, has practically no direct effect on Nokian Tyres’ business.
In H1/2017, the company’s receivables increased year-over-year following the sales increase. The tyre inventories are at the planned level. The company follows the development of NWC very closely. At the end of the review period, Russian trade receivables accounted for 40% (47%) of the Group’s total trade receivables. The collection rate of the 2016 current receivables in Russia was 100%.
Approximately 40% of the Group’s net sales in 2017 are estimated to be generated from Euro-denominated sales. The most important sales currencies in addition to the euro are the Russian ruble, the Swedish and Norwegian krona, and the US and Canadian dollar.
Nokian Tyres’ other risks and uncertainty factors relate to the challenging pricing environment for tyres. As raw material prices rise, maintaining profitability will depend on the company’s ability to raise tyre prices in line with the increasing raw material costs.
The company announced in February 2016 that its practices concerning tyre tests in the past have not always been in line with the sustainable approach of Nokian Tyres. The company emphasizes that its tyres have always been safe and that safety has never been compromised on. There are no court cases in process related to the matter.
More detailed information relating to the risks can be found at www.nokiantyres.com/annual-reports, Financial review 2016, on pages 43–48 and 72–73.
Tax disputes
Nokian Tyres Group has pending disputes with the Finnish Tax Administration. They are described earlier in this report under “Tax rate”.

17(26)
OUTLOOK FOR 2017
The global recovery continues. For 2017 and 2018, growth is expected in all regions. The global GDP is estimated to grow by 3.5% in 2017 (3.1% in 2016). The GDP growth estimates for the Nordic countries range from +1.6% to +3.0%, whereas for Europe (including the Nordic countries) the number is +1.7% and for the US +2.2%. In Russia, GDP is forecasted to grow by approximately 1.5% to 2.0%.
In 2017, the market demand for replacement car tyres is expected to show growth in Central Europe, North America, and the Nordic countries. In Russia, the market is expected to return to growth, but the pace of the recovery is likely to be moderate.
The company’s replacement tyre market position (sell-in) is expected to improve in 2017 in all key markets. In Russia, the company expects to retain and further strengthen its market leader position in the A+B segments in 2017.
Raw material costs are estimated to increase by approximately 20% in 2017 compared with 2016. Price increases have been implemented in all markets, and the full effect of these increases will be seen from H2/2017 onwards due to the seasonality of Nokian Tyres’ business model.
Nokian Tyres retains a competitive advantage by manufacturing in Russia. 62% of the Russian production was exported in H1/2017. In 2017, Nokian Tyres will invest in the expansion of the Vsevolozhsk factory capacity and further improvements in the automation of production. As a result of these investments, the total annual nominal capacity of the Vsevolozhsk factory will increase from 15.5 million tyres in H1/2017 to 17 million tyres in H2/2017.
The demand for Nokian Heavy Tyres’ core products is estimated to remain healthy. The raw material cost increases cause pressure on pricing. Nokian Heavy Tyres’ production capacity and delivery capability have improved and, therefore, the sales and EBIT are expected to increase slightly year-over-year.
Vianor (equity-owned) is expected to increase sales, further develop the service business and improve the operating result in the full year 2017. Vianor (partners) and Nokian Tyres’ other partner channels, such as Nokian Tyres Authorized Dealers (NAD) and the N-Tyre network, will continue to expand.
Nokian Tyres’ budget for total investments in 2017 is EUR 190 million (105.6), of which EUR 83 million will be invested in Russia. EUR 78 million is planned to be invested in the Nokia factory and global development projects and the balance goes to Heavy Tyres, sales companies, and the Vianor chain. Financial guidance (Updated) In 2017, with the current exchange rates, net sales and operating profit are expected to grow by at least 10% compared to 2016. Previous guidance (May 3, 2017) In 2017, with the current exchange rates, net sales are expected to grow by at least 10% and operating profit is expected to grow by over 5% compared to 2016. Nokia, August 8, 2017 Nokian Tyres plc Board of Directors *** The above-said information contains forward-looking statements relating to future events or future financial performance of the company. In some cases, such forward-looking statements can be identified by terminology such as “may”, “will”, “could”, “expect”, “anticipate”, “believe”, “estimate”, “predict” or other comparable terminology. Such statements are based on the current expectations, known factors, decisions, and plans of the management of Nokian Tyres. Forward-looking statements always involve risks and uncertainties because they relate to events and depend on circumstances that may or may not occur in the future. Therefore, future results may even differ significantly from the results expressed in, or implied by, the forward-looking statements. ***

18(26)
This Half Year Financial Report has been prepared in accordance with IAS 34 Interim Reports standard. The company has adopted certain new or revised IFRS standards and IFRIC interpretations at the beginning of the financial period as described in the Financial Statements 2016. However, the adaption of these new or amended standards has not yet had an effect on the reported figures in practice. In other respects, the same accounting policies have been followed as in the Financial Statements 2016. The Half Year Financial Report figures are unaudited. Application of IFRS 15 Revenue from Contracts with Customers IFRS 15 Revenue from Contracts with Customers will be effective for financial years beginning on or after 1 January 2018. The new standard replaces current IAS 18 and IAS 11 -standards and related interpretations. In IFRS 15 a five-step model is applied to determine when to recognise revenue, and at what amount. Revenue is recognised when (or as) a company transfers control of goods or services to a customer either over time or at a point in time. The impacts of IFRS 15 on Nokian Tyres’ consolidated financial statements have been assessed as follows: Key concepts of IFRS 15 have been analysed for different revenue streams and based on that a preliminary survey has been conducted on the standard and its differences to the current reporting practices, and possible needs for adjustments. According to the performed surveys the expected impacts in the Group are limited with the current business operations. Any possible adjustment needs to contracts and thresholds for revenue recognition are assessed to be minimal. In the future as the share of the service business and complexity within is expected to increase the Group will emphasize system development and contract management in relation to revenue recognition. The renewed instruction on agent/principal is assessed not to change present handling of the commissions payable to distributors. Timeline for implementing and the transition options to be used are as follows: the Group intends to implement the standard fully retrospectively with no special relieves applied. NOKIAN TYRES
CONSOLIDATED
INCOME STATEMENT 4-6/17 4-6/16 1-6/17 1-6/16 1-12/16 Change Million euros %
Net sales 393.0 337.4 718.9 613.3 1,391.2 17.2 Cost of sales -209.5 -174.7 -386.3 -321.4 -724.2 -20.2 Gross profit 183.5 162.8 332.6 291.8 667.0 14.0 Other operating income 1.3 0.8 3.1 2.1 3.9 45.2 Selling and marketing expenses -70.9 -64.4 -143.5 -125.9 -267.6 -14.0 Administration expenses -13.4 -10.2 -26.6 -19.0 -49.4 -40.3 Other operating expenses -6.3 -11.6 -12.6 -21.2 -43.4 40.5 Operating profit 94.1 77.5 153.0 128.0 310.5 19.6 Financial income 26.6 34.7 61.0 76.5 140.1 -20.3 Financial expenses -33.6 -37.4 -68.0 -81.3 -151.8 16.3 Profit before tax 87.1 74.8 146.0 123.2 298.7 18.5 Tax expense (1 (2 -16.0 -13.5 -29.6 -22.1 -46.9 -34.2 Profit for the period 71.1 61.3 116.4 101.2 251.8 15.1
Attributable to:
Equity holders of the parent 71.1 61.3 116.4 101.2 251.8 Non-controlling interest - - - - -
Earnings per share from the profit
attributable to equity holders of the
parent
basic, euros 0.52 0.46 0.86 0.75 1.87 13.8 diluted, euros 0.52 0.45 0.85 0.75 1.86 13.3

19(26)
CONSOLIDATED OTHER COMPREHENSIVE INCOME 4-6/17 4-6/16 1-6/17 1-6/16 1-12/16 Million euros Profit for the period 71.1 61.3 116.4 101.2 251.8 Other comprehensive income, items that may be reclassified subsequently to profit and loss, net of tax: Gains/Losses from hedge of net investments in foreign operations - - - - - Cash flow hedges 0.7 0.7 1.0 -0.8 -0.3 Translation differences on foreign operations 3) -58.6 19.2 -18.8 56.7 121.8 Total other comprehensive income for the period, net of tax -57.9 20.0 -17.8 55.9 121.6 Total comprehensive income for the period 13.2 81.3 98.6 157.1 373.4
Total comprehensive income attributable to: Equity holders of the parent 13.2 81.3 98.6 157.1 373.4 Non-controlling interest - - - - -
1) Tax expense in 1-12/2016 has been adjusted with EUR 4.9 million according to the tax reassessment decision on years 2007-2010 by the Board of Adjustment. 2) Otherwise tax expense in the consolidated income statement is based on the taxable result for the period. 3) Since the beginning of year 2014 the Group has internal loans that are recognised as net investments in foreign operations in accordance with IAS 21 "The Effects of Changes in Foreign Exchange Rates". The impact in 1-6/17 is EUR 0.2 million, 1-6/16 EUR -1.8 million and 1-12/16 EUR -1.3 million. These internal loans have now been converted to equity in the subsidiaries. KEY RATIOS 30.6.17 30.6.16 31.12.16 Change
% Equity ratio, % 76.4 72.0 73.8 Gearing, % -2.6 6.6 -19.7 Equity per share, euro 10.16 8.94 10.75 13.7 Interest-bearing net debt, mill. euros -36.0 79.6 -287.4 Capital expenditure, mill. euros 60.0 44.4 105.6 Depreciation, mill. euros 47.6 39.5 84.7 Personnel, average 4,543 4,384 4,433 Number of shares (million units) at the end of period 136.27 134.39 135.68 in average 135.90 134.39 134.86 in average, diluted 137.08 135.02 135.56
20(26)
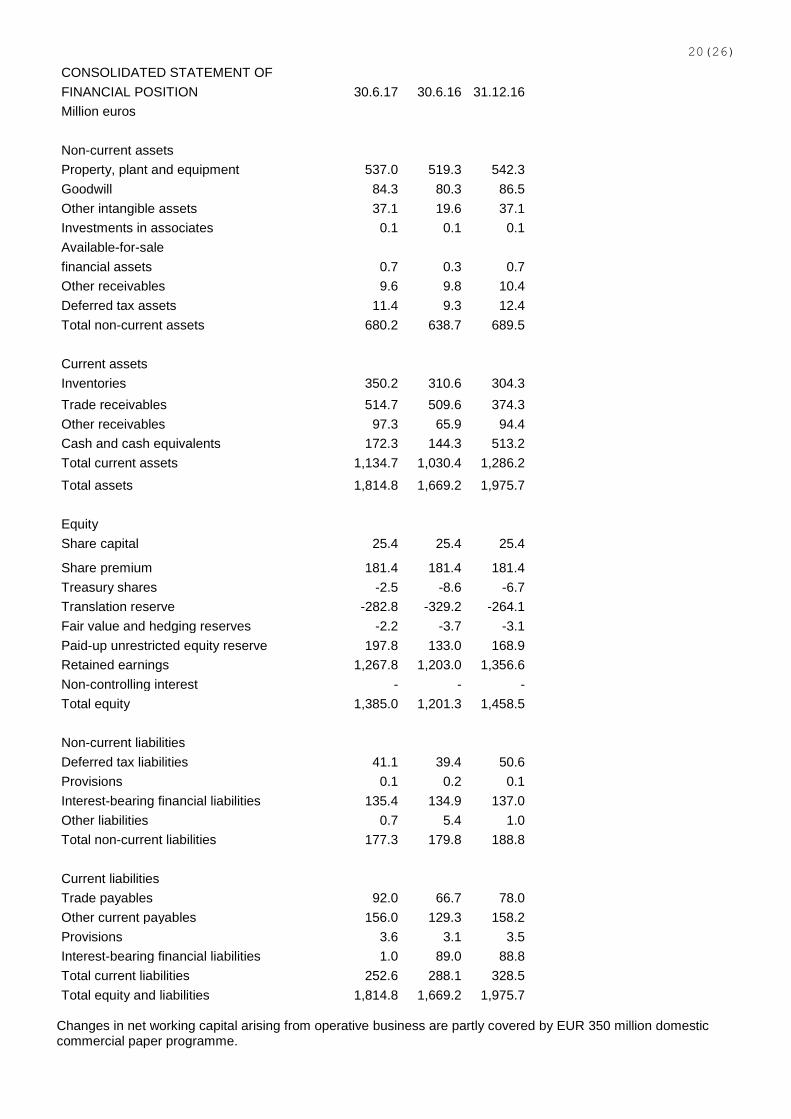
CONSOLIDATED STATEMENT OF FINANCIAL POSITION 30.6.17 30.6.16 31.12.16 Million euros Non-current assets Property, plant and equipment 537.0 519.3 542.3 Goodwill 84.3 80.3 86.5 Other intangible assets 37.1 19.6 37.1 Investments in associates 0.1 0.1 0.1 Available-for-sale financial assets 0.7 0.3 0.7 Other receivables 9.6 9.8 10.4 Deferred tax assets 11.4 9.3 12.4 Total non-current assets 680.2 638.7 689.5
Current assets Inventories 350.2 310.6 304.3 Trade receivables 514.7 509.6 374.3 Other receivables 97.3 65.9 94.4 Cash and cash equivalents 172.3 144.3 513.2 Total current assets 1,134.7 1,030.4 1,286.2
Total assets 1,814.8 1,669.2 1,975.7
Equity Share capital 25.4 25.4 25.4
Share premium 181.4 181.4 181.4 Treasury shares -2.5 -8.6 -6.7 Translation reserve -282.8 -329.2 -264.1 Fair value and hedging reserves -2.2 -3.7 -3.1 Paid-up unrestricted equity reserve 197.8 133.0 168.9 Retained earnings 1,267.8 1,203.0 1,356.6 Non-controlling interest - - - Total equity 1,385.0 1,201.3 1,458.5
Non-current liabilities Deferred tax liabilities 41.1 39.4 50.6 Provisions 0.1 0.2 0.1 Interest-bearing financial liabilities 135.4 134.9 137.0 Other liabilities 0.7 5.4 1.0 Total non-current liabilities 177.3 179.8 188.8
Current liabilities Trade payables 92.0 66.7 78.0 Other current payables 156.0 129.3 158.2 Provisions 3.6 3.1 3.5 Interest-bearing financial liabilities 1.0 89.0 88.8 Total current liabilities 252.6 288.1 328.5 Total equity and liabilities 1,814.8 1,669.2 1,975.7
Changes in net working capital arising from operative business are partly covered by EUR 350 million domestic commercial paper programme.

21(26)
CONSOLIDATED STATEMENT OF CASH FLOWS 1-6/17 1-6/16 1-12/16 Million euros Profit for the period 116.4 101.2 251.8 Adjustments for Depreciation, amortisation and impairment 42.5 49.9 100.5 Financial income and expenses 7.0 4.7 11.8 Gains and losses on sale of intangible assets, other changes 2.8 -5.9 -7.9 Income Taxes 29.6 22.1 46.9 Cash flow before changes in working capital 198.3 172.0 403.2 Changes in working capital Current receivables, non-interest-bearing, increase (-) / decrease (+) -158.0 -95.9 46.3 Inventories, increase (-) / decrease (+) -54.0 -31.1 -9.8 Current liabilities, non-interest-bearing, increase (+) / decrease (-) 36.7 -4.4 6.5 Changes in working capital -175.4 -131.4 43.0 Financial items and taxes Interest and other financial items, received 1.9 1.6 15.5 Interest and other financial items, paid -23.2 -22.2 -27.8 Dividens received 0.0 -0.0 0.0 Income taxes paid -47.6 -60.0 -69.4 Financial items and taxes -68.9 -80.6 -81.7
Cash flow from operating activities (A) -46.0 -40.0 364.4 Cash flows from investing activities Acquisitions of property, plant and equipment and intangible assets -59.9 -45.4 -101.5 Proceeds from sale of property, plant and equipment and intangible assets 1.0 0.2 0.6 Acquisitions of Group companies - -0.0 -11.7 Change in non-controlling interest - - - Acquisitions of other investments 0.0 0.0 -0.4 Cash flows from investing activities (B) -59.0 -45.2 -113.0 Cash flow from financing activities: Proceeds from issue of share capital 28.9 0.0 35.9 Purchase of treasury shares - - - Change in current financial receivables, increase (-) / decrease (+) 7.7 13.1 28.6 Change in non-current financial receivables, increase (-) / decrease (+) 0.3 -0.7 5.1 Change in current financial borrowings, increase (+) / decrease (-) -72.9 63.6 48.9 Change in non-current financial borrowings, increase (+) / decrease (-) 6.7 -74.7 -85.1 Dividens received 0.1 0.5 0.5 Dividends paid -208.0 -201.6 -202.0 Cash flow from financing activities (C) -237.2 -199.9 -168.1
Change in cash and cash equivalents, increase (+) / decrease (-) (A+B+C) -342.2 -285.1 83.2
Cash and cash equivalents at the beginning of the period 513.2 429.3 429.3 Effect of exchange rate fluctuations on cash held -1.3 -0.1 0.8 Cash and cash equivalents at the end of the period 172.3 144.3 513.2
Based on the annulled and later renewed tax reassessment decisions on years 2007-2010 the financial items and taxes contain paid tax increases of EUR 51.0 million in 1-16/16. Additionally in 1-12/16 the Tax Administration refunded EUR 4.9 million tax increases according to the latest decision of the Board of Adjustment.

22(26)
CONSOLIDATED STATEMENT OF CHANGES IN EQUITY A = Share capital B = Share premium C = Treasury shares D = Translation reserve E = Fair value and hedging reserves F = Paid-up unrestricted equity reserve G = Retained earnings H = Non-controlling interest I = Total equity Equity attributable to equity holders of the parent Million euros A B C D E F G H I Equity, 1 Jan 2016 25.4 181.4 -8.6 -385.9 -2.9 133.0 1,299.2 - 1,241.6 Profit for the period 101.2 101.2 Other comprehensive income, net of tax: Cash flow hedges -0.8 -0.8 Net investment hedge 0.0 Translation differences 56.7 56.7 Total comprehensive income for the period 56.7 -0.8 0.0 101.2 157.1 Dividends paid -201.6 -201.6 Exercised warrants 0.0 0.0 Acquisition of treasury shares 0.0 Share-based payments 4.2 4.2 Total transactions with owners for the period -197.4 -197.4 Equity, 30 Jun 2016 25.4 181.4 -8.6 -329.2 -3.7 133.0 1,203.0 - 1,201.3
Equity, 1 Jan 2017 25.4 181.4 -6.7 -264.1 -3.1 168.9 1,356.6 - 1,458.5 Profit for the period 116.4 116.4 Other comprehensive income, net of tax: Cash flow hedges 1.0 1.0 Net investment hedge - Translation differences -18.8 -18.8 Total comprehensive income for the period -18.8 1.0 116.4 98.6 Dividends paid -208.0 - Exercised warrants 28.9 28.9 Acquisition of treasury shares - Share-based payments 4.2 2.7 6.9 Total transactions with owners for the period 4.2 28.9 -205.2 -172.2 Equity, 30 Jun 2017 25.4 181.4 -2.5 -282.8 -2.2 197.8 1,267.8 - 1,385.0

23(26)
SEGMENT INFORMATION 4-6/17 4-6/16 1-6/17 1-6/16 1-12/16 Change Million euros %
Net sales Passenger car tyres 276.4 230.1 524.4 432.6 981.1 21.2 Heavy tyres 44.0 38.7 83.8 76.3 155.3 9.8 Vianor 89.8 89.4 146.1 143.2 334.8 2.0 Other operations 3.1 5.9 5.0 5.9 13.7 -15.9 Eliminations -20.2 -26.8 -40.3 -44.7 -93.8 9.8 Total 393.0 337.4 718.9 613.3 1,391.2 17.2
Operating result Passenger car tyres 84.8 64.7 160.7 127.0 305.8 26.6 Heavy tyres 9.1 6.1 14.8 15.0 28.2 -1.2 Vianor 4.0 5.5 -11.8 -9.2 -8.1 -29.0 Other operations -5.5 -3.5 -10.6 -6.0 -14.6 -77.5 Eliminations 1.7 4.7 0.0 1.2 -0.8 -104.0 Total 94.1 77.5 153.0 128.0 310.5 19.6
Operating result, % of net sales Passenger car tyres 30.7 28.1 30.6 29.4 31.2 Heavy tyres 20.8 15.7 17.7 19.7 18.2 Vianor 4.5 6.2 -8.1 -6.4 -2.4 Total 24.0 23.0 21.3 20.9 22.3 CHANGES IN PROPERTY, PLANT AND EQUIPMENT Million euros 30.6.17 30.6.16 31.12.16 Opening balance 542.3 485.0 485.0 Capital expenditure 62.2 59.5 105.6 Decrease -4.7 -8.2 -11.2 Depreciation for the period -47.6 -39.5 -84.7 Exchange differences -15.2 22.6 47.6 Closing balance 537.0 519.3 542.3 CONTINGENT LIABILITIES 30.6.17 30.6.16 31.12.16 Million euros FOR OWN DEBT Mortgages 1.0 1.0 1.0 Pledged assets 4.7 4.7 4.7 ON BEHALF OF OTHER COMPANIES Guarantees 0.4 0.4 0.4 OTHER OWN COMMITMENTS Guarantees 10.6 8.4 10.9 Leasing and rent commitments 74.7 90.7 71.2 Purchase commitments 1.1 1.6 -

24(26)
CARRYING AMOUNTS AND FAIR VALUES OF FINANCIAL ASSETS AND LIABILITIES 30.6.17 30.6.16 31.12.16
Carrying Fair Carrying Fair Carrying Fair Million euros amount value amount value amount value FINANCIAL ASSETS Financial assets at fair value through profit or loss
Derivatives held for trading 17.0 17.0 10.9 10.9 17.6 17.6 Money market instruments 50.0 50.0 34.0 34.0 16.0 16.0
Loans and receivables Other non-current receivables 9.6 8.0 9.8 7.5 10.4 8.6 Trade and other receivables 515.3 515.8 512.8 513.4 375.1 375.8 Cash in hand and at bank 122.4 122.4 110.3 110.3 497.3 497.3
Available-for-sale financial assets Unquoted shares 0.7 0.7 0.3 0.3 0.7 0.7
Derivative financial instruments designated as hedges 12.0 12.0 14.4 14.4 9.8 9.8 Total financial assets 726.9 725.8 692.5 690.8 926.8 925.7
FINANCIAL LIABILITIES Financial liabilities at fair value through profit or loss
Derivatives held for trading 1.4 1.4 4.0 4.0 9.4 9.4
Financial liabilities measured at amortised cost
Interest-bearing financial liabilities 136.4 137.5 223.9 226.4 225.8 228.5 Trade and other payables 92.0 92.0 66.7 66.7 78.0 78.0
Derivative financial instruments designated as hedges 4.6 4.6 6.4 6.4 6.9 6.9 Total financial liabilities 234.4 235.6 301.0 303.5 320.1 322.7
All fair value measurements have been classified to Level 2 in the fair value hierarchy. Level 2 includes Group's derivative financial instruments and money market investments. To establish the fair value of these instruments the Group uses generally accepted valuation models with inputs based on observable market data. There has been no transfers between the different levels in the fair value hierarchy.

25(26)
DERIVATIVE FINANCIAL INSTRUMENTS 30.6.17 30.6.16 31.12.16 Million euros INTEREST RATE DERIVATIVES Interest rate swaps
Notional amount 100.0 100.0 100.0 Fair value -1.6 -3.1 -2.2
FOREIGN CURRENCY DERIVATIVES Currency forwards
Notional amount 293.5 313.7 545.3 Fair value 7.3 -1.9 8.2
Currency options, purchased Notional amount 18.8 7.0 - Fair value 0.4 0.1 -
Currency options, written Notional amount 47.6 17.4 - Fair value -0.2 -0.1 -
Interest rate and currency swaps Notional amount 87.5 87.5 87.5 Fair value 17.8 22.2 5.8
ELECTRICITY DERIVATIVES Electricity forwards
Notional amount 6.8 7.6 7.7 Fair value -0.8 -2.4 -0.7
BUSINESS COMBINATIONS
No new business combinations have been executed during the period. DEFINITIONS OF CONSOLIDATED KEY FINANCIAL INDICATORS Earnings per share, euro:
Profit for the period attributable to the equity holders of the
parent / Average adjusted number of shares during the period
excluding treasury shares Earnings per share (diluted), euro: Profit for the period attributable to the equity holders of the
parent / Average adjusted and diluted number of shares during
the period excluding treasury shares The share options affect the dilution as the average share market
price for the period exceeds the defined subscription price. Equity ratio, %:
Total equity x 100 / (Total assets - advances received) Gearing, %:
Interest-bearing net debt x 100 / Total equity

26(26)
Equity per share, euro:
Equity attributable to equity holders of the parent / Adjusted
number of shares on the reporting date excluding treasury shares
DEFINITIONS OF SALES AREAS
Nordic countries: Finland, Norway, Sweden.
Russia and the CIS: Russia, Armenia, Belarus, Georgia, Kazakhstan, Moldova, Ukraine.
Other Europe: Albania, Austria, Belgium, Bulgaria, Croatia, Czech Republic, Denmark, Estonia, France, Germany, Greece, Hungary, Iceland, Ireland, Italy, Latvia, Lithuania, The Former Yugoslav Republic of Macedonia, Netherlands, Poland, Portugal, Romania, Serbia, Slovakia, Slovenia, Spain, Switzerland, Turkey, United Kingdom.
North America: Canada, USA.
Core markets: Nordic countries, Russia and the CIS. *** Nokian Tyres published its half year financial report for January–June 2017 on August 8, 2017 at 8:00 a.m. Finnish time.
The result presentation for analysts and media will be held on August 8, 2017 at 10:00 a.m. Finnish time at Hotel Kämp (address Pohjoisesplanadi 29, Helsinki). President and CEO Hille Korhonen will present the half year financial report and answer questions from the audience.
The presentation can be listened to as an audiocast over the internet at www.nokiantyres.com/resultinfo-Q2-2017 starting at 10 a.m.
The event can also be attended via conference call. Please dial in 5–10 minutes before the beginning of the event:
FI: +358981710495 UK: +442031940552 SE: +46856642702 US: +18557161597
An audio file of the event will be available on the company’s website later on the same day.
***
The Interim Report January–September 2017 will be published on November 1, 2017. Releases and company information will be available at: www.nokiantyres.com/company/investors/. *** Nokian Tyres plc
Antti-Jussi Tähtinen, Vice President, Marketing and Communications
Further information: Hille Korhonen, President and CEO, tel: +358 10 401 7733
Distribution: Nasdaq Helsinki, media, www.nokiantyres.com