Embed Size (px)
Citation preview

1
H A L F - Y E A R F I N A N C I A L R E P O R T T E A M V I E W E R A Gfor the first six months of the fiscal year 2020

2
TeamViewer AG at a glance
TeamViewer AG at a glance
Jan. 1 – June 30, 2020 Jan. 1 – June 30, 2019
Key performance indicators of the Group
Billings (m) 225.7 141.6
Number of subscribers (LTM) 534,363 368,166Annual recurring billings of existingsubscription customers/net retention rate
105.4% n.d.
Financial performance of the Group
Revenue (EUR m) 217.4 181.2
EBIT (EUR m) 81.9 90.2
EBIT (as a % of revenue) 37.7 % 49.8 %
EBITDA (EUR m) 101.2 108.1
EBITDA margin (as a % of revenue) 46.5 % 59.7 %
Adjusted EBITDA (EUR m) 131.1 73.5
Adjusted EBITDA margin (as a % of billings) 58.1 % 51.9 %
Financial position and cash flows of the Group
Equity ratio (as a percentage of total assets) 15.0 % (17.2) %
Net cash from operating activities (EUR m) 110.0 52.7Net cash used in investing activities (EUR m)
(15.0) (7.7)
Cash and cash equivalents (EUR m) 149.8 48.8
Other key figures
R&D expenses (EUR m) (19.1) (16.5)Full-time equivalents (at the reporting date 30.06.2020/ 31.12.2019)
1,051 841
Basic earnings per share (EUR) 0.21 0.231
Diluted earnings per share (EUR) 0.21 0.231
1 Earnings per share as of June 30, 2019 were determined based on the hypothetical assumption that TeamViewer AG had already issued 200 million shares in the first half of 2019.
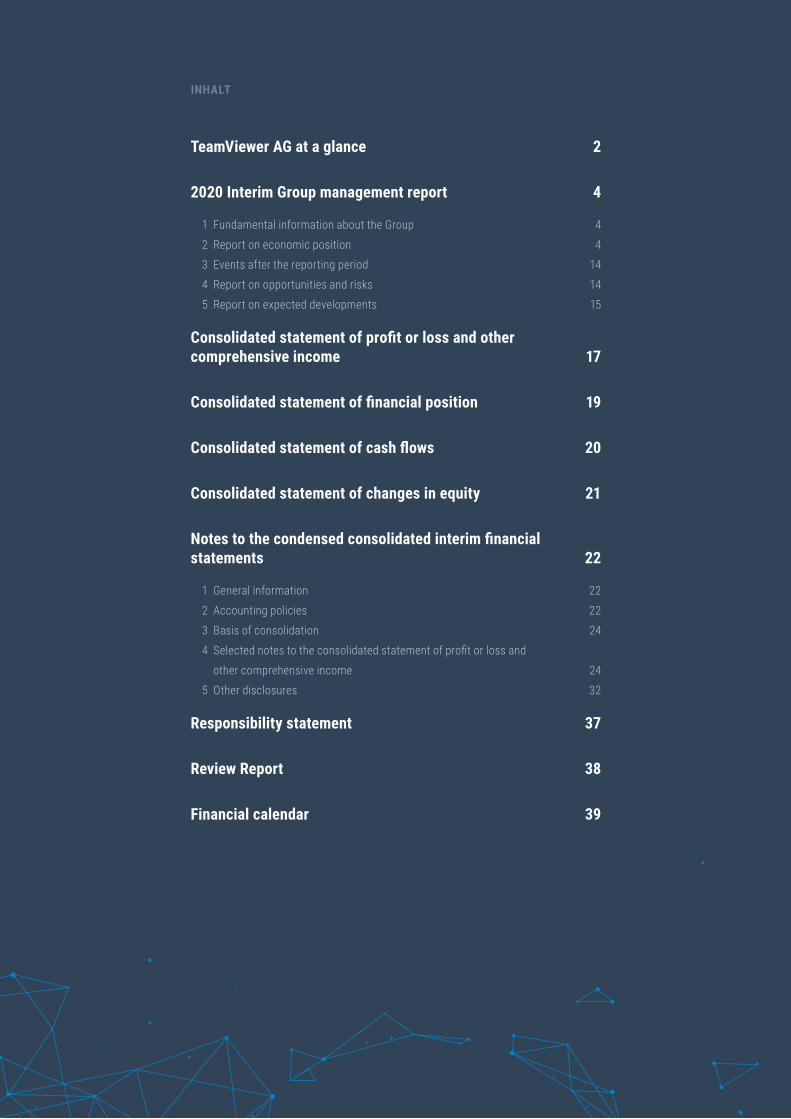
INHALT
TeamViewer AG at a glance 2
2020 Interim Group management report 4
1 Fundamental information about the Group 4
2 Report on economic position 4
3 Events after the reporting period 14
4 Report on opportunities and risks 14
5 Report on expected developments 15
Consolidated statement of profit or loss and other comprehensive income 17
Consolidated statement of financial position 19
Consolidated statement of cash flows 20
Consolidated statement of changes in equity 21
Notes to the condensed consolidated interim financial statements 22
1 General information 22
2 Accounting policies 22
3 Basis of consolidation 24
4 Selected notes to the consolidated statement of profit or loss and
other comprehensive income 24
5 Other disclosures 32
Responsibility statement 37
Review Report 38
Financial calendar 39

4
2020 Interim Group management report
Fundamental information about the Group
2020 Interim Group management report
1 Fundamental information about the GroupThe TeamViewer Group operates a global cloud-based connectivity platform that enables users and customers in all industries to connect a wide variety of different devices in order to control, manage, monitor and repair these devices, to assist other users with problems or to interact digitally with other people.
The information provided in the 2019 Annual Report on the business model, the Group structure, the strategy and objectives of the Group, the management system, research and development activities, and sustainability in the TeamViewer Group was still relevant at the time this interim report was being prepared.
2 Report on economic position2.1 Macroeconomic2 and sector-specific environment2.1.(a) Macroeconomic environmentIn June 2020, the Kiel Institute for the World Economy (IfW) recorded a historic slump in the global economy of almost 10% for the first half of 2020 as a result of the COVID-19 pandemic. Overall, the decline in economic out-put will probably be reduced to an average of 3.8 percentage points in the current fiscal year thanks to massive monetary and fiscal policy support. In 2021, output will rise sharply by 6.2% yet remain below the level expected by the IfW at the beginning of the year for quite some time. Trading volumes, which had already fallen slightly in the final quarter of 2019, declined by 2.6% in the first quarter of 2020. In addition to relatively trade-intensive industrial production, large sections of the services industry are also affected by the slump in demand and restrictions on production as a result of the measures taken to contain the pandemic, in particular exchanges of services across borders, aviation and tourism.
2.1.(b) Sector-specific environment
The market research institute Garner expects global IT spending to decline 8% in 2020 due to the impact of CO-VID-193. By contrast, the markets with relevance for TeamViewer – digital transformation, Internet of Things (IoT), and remote working – continued growing in the first half of 2020, clearly indicating the continuation of the digi-talization megatrend. Another market research institute, IDC, forecasts that global corporate spending on digital transformation technologies and services will grow by 10.4% year-on-year in 2020 to USD 1.3 trillion. However, this is slower than the 17.9% growth in 20194. Global IoT spending is now also expected to grow modestly by 8.2% in 2020. Nevertheless, this is estimated to rise to 11.3% in 20215. At the same time, the measures being taken to combat COVID-19 have accelerated demand for remote working solutions, also a subsegment of the digitalization megatrend. Gartner says that nearly three in four CFOs plan to shift at least 5% of previously on-site employees to permanently remote positions6. This area is part of the public cloud services subsegment, which Gartner forecasts
2 Kiel economic reports of the Kiel Institute for the World Economy (IfW): Global economy in summer 20203 https://www.gartner.com/en/newsroom/press-releases/2020-05-13-gartner-says-global-it-spending-to-decline-8-percent-in-2020-due-to-
impact-of-covid194 https://www.idc.com/getdoc.jsp?containerId=prUS463772205 https://www.businesswire.com/news/home/20200618005125/en/Worldwide-Spending-Internet-Things-Slow-2020-Return6 https://www.gartner.com/en/newsroom/press-releases/2020-04-03-gartner-cfo-survey-reveals-74-percent-of-orgs-to-shift-some-employe-
es-to-remote-work-permanently

5
2020 Interim Group management report
Report on economic position
will grow by 19% in 2020 and peak as early as 2022, something that before the COVID-19 pandemic Gartner only expected to happen in 2023/20247. Based on the favorable developments in the individual segments of the digita-lization megatrend and overall, the sector-specific environment can therefore be considered positive.
2.2 Course of businessTeamViewer continued its robust growth in the opening half of 2020, buoyed by strong business performance in the first two months of the year and a surge in demand for remote access and home office solutions in March, when the COVID-19 crisis turned into a pandemic. Billings continued to grow apace in the second quarter of 2020, despite the normalization of additional demand.
The global quarantine measures implemented to combat the COVID-19 pandemic accelerated TeamViewer’s fun-damental growth drivers. The home office as a working model became a necessity, requiring reliable solutions for remote management of infrastructure and devices across the board. Restrictions on mobility have made remote access and collaboration functions increasingly critical to business success. This has prompted companies in the public and private sectors to catch up on investments in digitalization that had been postponed or foregone.
In anticipation of increased connection activity, partly due to the extension of free usage options, router capacity was expanded further to ensure platform stability and thus faultless functioning of the TeamViewer applications.
In spite of the global lockdown aimed at curbing the spread of COVID-19, operations at TeamViewer largely con-tinued without restriction, mainly thanks to efficient contingency planning, virtual sales processes, and the oppor-tunity to install products remotely at customers quickly and efficiently over the Internet. This enabled the Company to move ahead seamlessly with its three strategic growth initiatives: greater coverage of customer segments, identification of innovative use cases, and geographical expansion.
In light of this situation, the forecast for the fiscal year 2020 was revised upwards at the time the results for the first quarter of 2020 were being published on May 12, 2020. Under the assumption that the general business environ-ment will return to normal, the targets have been adjusted as follows:
‣ Billings of approximately EUR 450 million (previously: EUR 430–440 million) ‣ Revenue of at least EUR 450 million (previously: EUR 420–430 million) based on significantly higher billings
in the first quarter of 2020 and deferred revenues decreasing as the year goes on. ‣ Adjusted EBITDA margin of approximately 56% (previously: adjusted EBITDA of EUR 240–250 million) ‣ Slightly higher capital expenditure of EUR 25–30 million due to delays in the new ERP rollout owing to the
COVID-19 pandemic and the refurbishment of the new company headquarters.
7 https://www.gartner.com/en/newsroom/press-releases/2020-05-13-gartner-says-global-it-spending-to-decline-8-percent-in-2020-due-to-impact-of-covid19

6
2020 Interim Group management report
Report on economic position
2.3 Financial performance of the Group
The condensed statement of profit and loss for the first six months of 2020 shows continued strong revenue growth driven by robust business performance in the first half of the year and by a surge in demand for remote access and home office solutions.
In condensed form, the TeamViewer Group’s financial key performance indicators are as follows:8
In millions of euro Jan. 1 – June 30, 2020 Jan. 1 – June 30, 2019
IFRS Reconciliation Management view IFRS Reconciliation Management
view
Revenue/ billings 217.4 8.3
225.7 181.2 (39.6)
141.6
EBITDA9/ Adjusted EBITDA 101.2 29.9
131.1 108.1 (34.6)
73.5
EBITDA as a % of revenue/Adjusted EBITDA as a % of billings
46.5% 11.6 pp10
58.1%
59.7% (7.8) pp
51.9%
EBIT 81.9 90.2Profit/(loss) for the period 42.5 45.7
2.3.(a) Development of billings and revenue
Since 2019, TeamViewer has been selling all its products using a subscription model. While under the perpetual license model revenue was deferred over three years (up to TeamViewer version 11: four years), under the sub-scription model revenue is deferred over the subscription period (generally twelve months). The revenue develop-ment in the first six months of 2020 and 2019 includes revenue from the release of deferred revenue from perpetual licenses totaling EUR 30.6 million (H1 2020) and EUR 65.6 million (H1 2019).
Billings
Billings represent the (net) value of goods and services that are invoiced to the customer within a specific period and whose realization is probable. They result directly from customer contracts and are not affected by the de-ferral of revenue. They can be calculated from revenue as per IFRS, adjusted for the change in deferred revenue recognized in profit or loss.
The management team of the TeamViewer Group therefore uses billings as a key indicator to observe, measure, and assess the Company’s development.
8 Negative figures in the tables are shown in parentheses.9 Although EBITDA does not constitute an IFRS key performance indicator, it has been included in the table in the interests of transparency. 10 pp = percentage points

7
2020 Interim Group management report
Report on economic position
Broken down by region, billings in the first half of 2020 and the prior-year period are as follows:
In millions of euro Jan. 1 – June 30, 2020 (share of total billings) Jan. 1 – June 30, 2019 (share of total billings)
EMEA 124.9 55.3% 79.9 56.4%
AMERICAS 71.0 31.5% 41.1 29.0%
APAC 29.8 13.2 % 20.6 14.6%
Total billings 225.7 100.0% 141.6 100.0%
TeamViewer’s billings in the first half of 2020 rose by 59.4% over the prior-year period to EUR 225.7 million (H1 2019: EUR 141.6 million). The increase in billings is attributable to strong business performance in the first two months of the year and to a significant increase in demand for remote access and home office solutions in March, when the COVID-19 crisis turned into a pandemic. As a consequence of the measures implemented to contain the pandemic, the additional demand for remote access and home office solutions normalized again at the end of the first half. On the whole, all regions contributed to this positive development with substantial double-digit percentage growth rates.
Accounting for 55.3% of total billings (H1 2019: 56.4%), the EMEA region remained the Group’s largest region in the first six months of the fiscal year 2020. Billings in this region increased by 56.3% in the reporting period. Growth was generated with both existing and new customers, particularly in the enterprise segment.
The AMERICAS region accounted for the second-largest share of total billings in the first six months of 2020, at 31.5% (H1 2019: 29.0%). With billings rising by 72.7% in the first half of the fiscal year 2020, AMERICAS was the fastest growing region. Here, too, both the existing customer business and the expansion of the new customer business, particularly in North America, contributed to growth.
The Group generated 13.2% of total billings in the first half of the fiscal year 2020 in the APAC region (H1 2019: 14.6%), which represents an increase of 44.7% compared with the previous year. This growth is attributable to higher new subscriber figures due to the successful establishment and expansion of the sales and marketing structure in In-dia, China, Japan, and Singapore and the sale of the new Remote Access product, which primarily targets small businesses and individual commercial users.
Overall, the systematic pursuit and implementation of the above-mentioned growth initiatives underpinned these positive developments.
Revenue
Revenue of the Group broken down by region in the first six months of the fiscal year 2020 and the prior-year period developed as follows:
In millions of euro Jan. 1 – June 30, 2020 (share of total revenue) Jan. 1 – June 30, 2019 (share of total revenue)
EMEA 119.5 55.0 % 103.1 56.9%
AMERICAS 70.4 32.4% 56.2 31.0 %
APAC 27.5 12.6 % 21.9 12.1 %
Total revenue 217.4 100.0% 181.2 100.0%

8
2020 Interim Group management report
Report on economic position
TeamViewer generated revenue of EUR 217.4 million in the first six months of 2020. This represents growth of 20.0% over the previous year (H1 2019: EUR 181.2 million). In the first half of 2020, the Company thus sustained the strong revenue growth seen in previous years. Revenue development in the first six months of 2020 was po-sitively influenced in all regions by the change in deferred revenue recognized in profit or loss totaling EUR 30.6 million (H1 2019: EUR 65.6 million). A key driver was the release of deferred revenue from old, perpetual licenses that are gradually expiring following the completion of the switch to a subscription model in 2018. This had a posi-tive impact on the revenue development in the EMEA and APAC regions in particular.
The EMEA region generated the highest absolute revenue growth of EUR 16.4 million, an increase of 15.9%. With revenue of EUR 119.5 million in the first half of 2020, the EMEA region remains the Group’s region with the highest revenue, accounting for 55.0% of total revenue (H1 2019: 56.9%).
The AMERICAS region achieved revenue growth of 25.3% to EUR 70.4 million (an increase of EUR 14.2 million), equivalent to 32.4% (H1 2019: 31.0%) of total revenue.
In the first half of the fiscal year 2020, the APAC region achieved the highest percentage growth rate at 25.6% (an increase of EUR 5.6 million), thereby raising its share of total revenue to 12.6%, up from 12.1% in the previous year.
2.3.(b) Earnings development
Total costs and other income The development of total costs and other income at TeamViewer was related to a substantial degree to the Group’s dynamic development in the past six months.
The Group’s cost of sales increased by 27.4%, from EUR 23.8 million in the same period in 2019 to EUR 30.3 million in the reporting period. The cost of sales as a percentage of revenue rose from 13.1% to 13.9% in the re-porting period. The absolute increase in the cost of sales was driven by use-related higher spending on payment and Internet service providers, increased personnel costs and a rise in infrastructure costs, such as expenditure on routers.
Gross profit, defined as revenue less cost of sales, grew by 18.9%, from EUR 157.5 million to EUR 187.2 million in the first six months of the fiscal year 2020.
The development of selling expenses was marked by the pronounced expansion of the distribution structure. The increase of 63.4% to EUR 33.5 million in the first half of 2020 (H1 2019: EUR 20.5 million) reflects the expansion of the sales organization, for example the establishment of sales offices in India, China, Japan, and Singapore, as well as the further expansion of the US sales team and the sales organization for the enterprise segment. Ex-penses from share-based remuneration and bonus payments to employees constituted a further material driver of the increase.
Operating profit (EBIT) and adjusted EBITDA
Operating profit (EBIT) pursuant to IFRS amounted to EUR 81.9 million in the first six months of the fiscal year 2020 (H1 2019: EUR 90.2 million), a decrease of 9.2% year-on-year. EBIT as a percentage of revenue declined slight-ly, from 49.8% to 37.7%, due to higher expenses from share-based compensation and a decrease in perpetual license revenue.
EBITDA of the Company, defined as EBIT pursuant to IFRS plus depreciation and amortization, declined from EUR 108.1 million in the first half of 2019 to EUR 101.2 million in the reporting period, a decrease of 6.3%. EBITDA
9
2020 Interim Group management report
Report on economic position
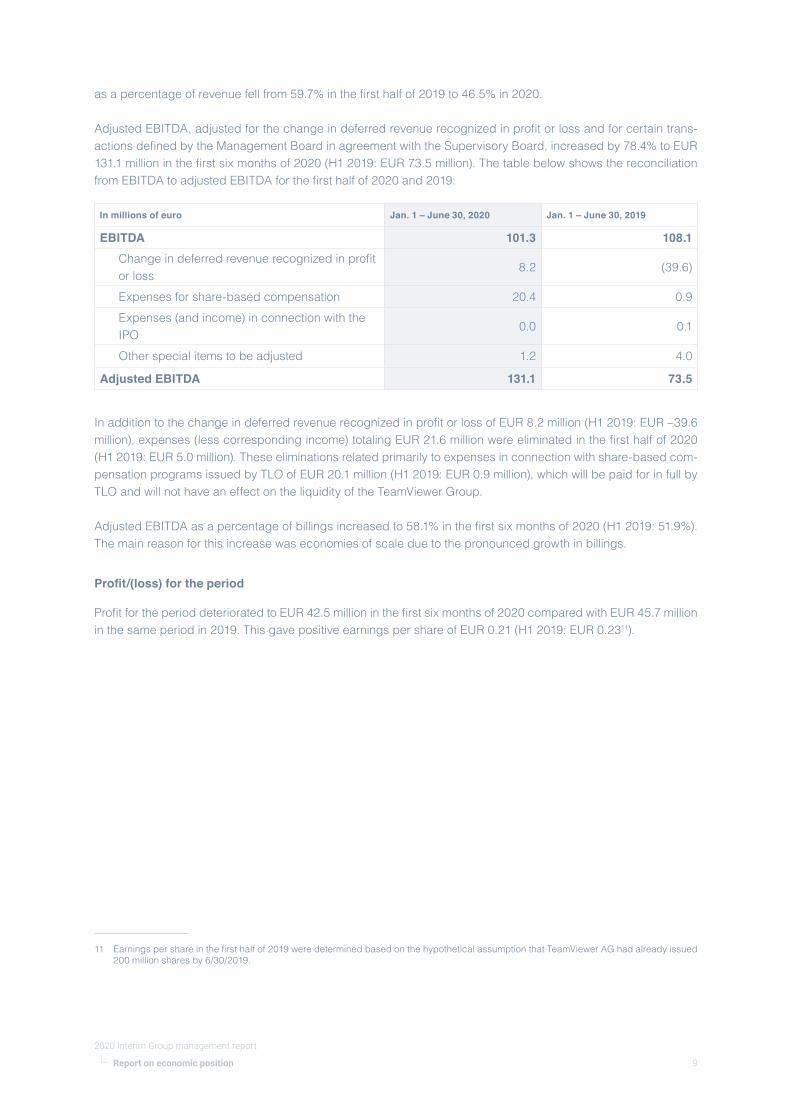
as a percentage of revenue fell from 59.7% in the first half of 2019 to 46.5% in 2020.
Adjusted EBITDA, adjusted for the change in deferred revenue recognized in profit or loss and for certain trans-actions defined by the Management Board in agreement with the Supervisory Board, increased by 78.4% to EUR 131.1 million in the first six months of 2020 (H1 2019: EUR 73.5 million). The table below shows the reconciliation from EBITDA to adjusted EBITDA for the first half of 2020 and 2019:
In millions of euro Jan. 1 – June 30, 2020 Jan. 1 – June 30, 2019
EBITDA 101.3 108.1Change in deferred revenue recognized in profit or loss
8.2 (39.6)
Expenses for share-based compensation 20.4 0.9Expenses (and income) in connection with the IPO
0.0 0.1
Other special items to be adjusted 1.2 4.0
Adjusted EBITDA 131.1 73.5
In addition to the change in deferred revenue recognized in profit or loss of EUR 8.2 million (H1 2019: EUR –39.6 million), expenses (less corresponding income) totaling EUR 21.6 million were eliminated in the first half of 2020 (H1 2019: EUR 5.0 million). These eliminations related primarily to expenses in connection with share-based com-pensation programs issued by TLO of EUR 20.1 million (H1 2019: EUR 0.9 million), which will be paid for in full by TLO and will not have an effect on the liquidity of the TeamViewer Group.
Adjusted EBITDA as a percentage of billings increased to 58.1% in the first six months of 2020 (H1 2019: 51.9%). The main reason for this increase was economies of scale due to the pronounced growth in billings.
Profit/(loss) for the period
Profit for the period deteriorated to EUR 42.5 million in the first six months of 2020 compared with EUR 45.7 million in the same period in 2019. This gave positive earnings per share of EUR 0.21 (H1 2019: EUR 0.2311).
11 Earnings per share in the first half of 2019 were determined based on the hypothetical assumption that TeamViewer AG had already issued 200 million shares by 6/30/2019.

10
2020 Interim Group management report
Report on economic position
2.4 Assets and financial position of the Group2.4.(a) Asset position of the GroupThe structure of TeamViewer’s assets is presented in the following condensed excerpt from the statement of finan-cial position (assets) as of the relevant closing dates for 2020 and 2019:
In millions of euro June 30, 2020 (share of total assets) December 31, 2019 (share of total assets)
Non-current assets
855.1 82.9 % 865.2 90.2%
Current assets 176.7 17.1% 93.7 9.8%
Total assets 1,031.8 100.0 % 958.9 100.0%
Total assets of the Group amounted to EUR 1,031.8 million as of June 30, 2020 (December 31, 2019: EUR 958.9 million). As in the previous year, at EUR 855.1 million as of June 30, 2020 (December 31, 2019: EUR 865.2 million), non-current assets accounted for most of the asset side of the statement of financial position. Current assets tota-led EUR 176.7 million (December 31, 2019: EUR 93.7 million).
The Company’s non-current assets as of June 30, 2020 comprised goodwill, intangible assets, property, plant and equipment, financial assets and other assets.
Goodwill represented the largest item within non-current assets, amounting to EUR 590.4 million as of June 30, 2020 (December 31, 2019: EUR 590.4 million). The EUR 9.9 million decrease in non-current assets in the first half of 2020 resulted from the amortization of intangible assets (EUR 6.5 million) and the write-down of deferred tax assets (EUR 6.3 million).
Deferred tax assets and liabilities are offset when they relate to income taxes levied by the same taxation authority and the taxation authority permits the entity to make or receive a single net payment.
For Germany, there is a net deferred tax liability for the first time as of June 30, 2020. The changeover to a net tax liability from the previous disclosure of a deferred tax asset is due to the decline in tax assets for the interest carryforward and the utilization of tax assets for deferred revenues.
TeamViewer’s current assets as of June 30, 2020 comprised trade receivables, other assets, tax assets, financial assets, and cash and cash equivalents.
At EUR 149.8 million (December 31, 2019: EUR 71.2 million), cash and cash equivalents constituted the largest item under current assets, followed by trade receivables, which amounted to EUR 17.1 million as of June 30, 2020 (December 31, 2019: EUR 11.8 million). The increase in current assets of EUR 82.9 million in the first six months of the fiscal year 2020 was mainly attributable to the increase in cash and cash equivalents of EUR 78.7 million.

11
2020 Interim Group management report
Report on economic position
2.4.(b) Financial position of the Group
Basic principles of financial management
TeamViewer’s financial management is geared to safeguarding the financial stability, flexibility and liquidity of the Group. It comprises the capital structure management and financing of the Company, cash and liquidity ma-nagement and the monitoring and managing of market price risk, such as exchange rate and interest rate risk. The financing structure of TeamViewer is geared to preserving the company’s financial scope so it is able to take advantage of business and investment opportunities, which is achieved through a balanced equity/debt ratio. Pursuant to the terms of the loan agreements dating from 2019, the Group must comply with certain covenants (leverage ratio covenant12).
Capital structure of the Group
The condensed capital structure (equity and liabilities) as of the end of the first half of 2020 and 2019 is as follows:
In millions of euro June 30, 2020 (share of total assets) December 31, 2019 (share of total assets)
Equity 154.3 15.0% 91.9 9.6%Non-current liabilities
582.7 56.4% 585.6 61.1%
Current liabilities 294.8 28.6% 281.4 29.3%Total equity and liabilities
1,031.8 100.0 % 958.9 100.0%
Equity
Equity amounted to EUR 154.3 million as of June 30, 2020, substantially exceeding the figure for December 31, 2019 of EUR 91.9 million. The Group’s issued capital was unchanged at EUR 200.0 million as of June 30, 2020 and was divided into 200 million ordinary bearer shares (no-par value shares).
The increase in the capital reserve in the first six months of the fiscal year 2020 exclusively relates to expenses from share-based compensation by TLO in accordance with IFRS 2 in the amount of EUR 20.1 million.
The equity ratio therefore amounted to 15.0% as of June 30, 2020, up from 9.6% at the end of the same period in 2019.
Non-current and current liabilities
The Group’s non-current liabilities as of June 30, 2020 amounted to EUR 582.7 million and thus fell short of the fi-gure of EUR 585.6 million recorded as of December 31, 2019. Non-current liabilities as a percentage of total equity and liabilities therefore fell to 56.4% (December 31, 2019: 61.1%). Within this item, financial liabilities in particular showed a decline to EUR 579.0 million (December 31, 2019: EUR 582.5 million).
TeamViewer’s current liabilities as of June 30, 2020 amounted to EUR 294.8 million, which represents an increase of EUR 13.4 million compared with the figure as of December 31, 2019 (EUR 281.4 million). This was largely due to the EUR 8.5 million increase in deferred revenue to EUR 218.8 million (December 31, 2019: EUR 210.3 million). Deferred revenue will be released in profit or loss in subsequent years, making a positive contribution to future earnings.
12 Leverage ratio covenant = net financial debt/pro forma EBITDA, as defined by the loan agreement.

12
2020 Interim Group management report
Report on economic position
As of June 30, 2020, the financial liabilities of the TeamViewer Group were as follows:
June 30, 2020
In millions of euro Currency Nominal interest rate
Year of maturity
Principal amount (EUR)
Carrying amount (EUR)
2019 syndicated loan USD USD 3.57 % 2024 401.8 397.3
2019 syndicated loan EUR EUR 2.25% 2024 125.0 123.6
2019 syndicated loan GBP GBP 3.20% 2024 73.0 72.12019 syndicated loan Revolving credit facility13 Various Various 2024 - -0.4
Total interest-bearing liabilities 599.8 592.6
December 31, 2019
In millions of euro Currency Nominal interest rate
Year of maturity
Principal amount (EUR)
Carrying amount (EUR)
2019 syndicated loan USD USD 4.81% 2024 400.6 395.4
2019 syndicated loan EUR EUR 2.50% 2024 125.0 123.4
2019 syndicated loan GBP GBP 3.58% 2024 78.2 77.3Syndicate loan 2019 Revolving credit facility14 Various Various 2024 - (0.4)
Total interest-bearing liabilities 603.8 595.7
The financial liabilities mature in 2024. However, starting from the end of 2020 the Group is required to make a mandatory repayment of at least 5% of the principal amount every year. The first repayment of EUR 30.2 million is due on December 31, 2020.
TeamViewer’s net financial debt, defined as the sum of interest-bearing financial liabilities, current and non-cur-rent, less cash and cash equivalents, amounted to EUR 462.6 million as of June 30, 2020 (December 31, 2019: EUR 545.6 million).
The leverage ratio, i.e., the Group’s net financial debt divided by adjusted EBITDA for the last 12 months, improved in the first half of the fiscal year 2020 from 3.0x at the end of 2019 to 1.9x as of June 30, 2020. The decrease is attributable to the interplay of high net cash from operating activities and thus lower net financial debt, as well as higher adjusted EBITDA.
13 As of June 30, 2020, TeamViewer had an undrawn credit facility of up to EUR 35 million.14 As of December 31, 2019, TeamViewer had an undrawn credit facility of up to EUR 35 million.

13
2020 Interim Group management report
Report on economic position
2.4.(c) Investment and liquidity analysisTeamViewer’s condensed statements of cash flows for the first half of 2020 and the prior-year period are as follows:
In millions of euro Jan. 1 – June 30, 2020 Jan. 1 – June 30, 2019
Cash and cash equivalents at beginning of period
71.2 79.9
Net cash from operating activities 110.0 52.7
Net cash used in investing activities (15.0) (7.7)
Net cash used in financing activities (15.4) (81.2)
Net foreign exchange rate differences (0.5) 0.4
Net change from cash risk provisioning (0.5) 0.9
Internal combinations and transfers 0.0 3.8
Cash and cash equivalents at end of period 149.8 48.8
TeamViewer’s net cash from operating activities amounted to EUR 110.0 million in the first half of the fiscal year 2020 (H1 2019: EUR 52.7 million), an increase of 108.7% year-on-year. This growth is accompanied by the positive development of billings at TeamViewer.
Net cash used in investing activities came to EUR –15.0 million in the first six months of the fiscal year 2020 (H1 2019: EUR –7.7 million). Capital expenditure for property, plant and equipment and intangible assets amounted to EUR 15.1 million in the reporting period (H1 2019: EUR 7.9 million) and related to capital expenditure for infras-tructure, particularly the introduction of a new ERP, CRM, and e-commerce system, but also replacement and expansion investments in the security architecture and TeamViewer’s global network and IT infrastructure.
Net cash used in financing activities amounted to EUR –15.4 million in the first six months of the fiscal year 2020 (H1 2019: EUR –81.2 million). These include cash outflows for interest payments which amounted to EUR 13.6 million in the reporting period, down from EUR 26.3 million in the prior-year period.
TeamViewer reported cash and cash equivalents of EUR 149,8 million as of June 30, 2020, up from EUR 71.2 million at the prior-year reporting date. In the reporting period, the Group was able to meet its payment obligations at all times.
2.5 EmployeesIn the first six months of 2020, the TeamViewer Group had an average of 990 employees, compared with 729 in the first half of 2019.
The headcount therefore increased over the course of the year from 879 employees as of December 31, 2019 to 1,088 employees as of June 30, 2020. This corresponds to 1,051 FTEs as of June 30, 2020 compared with 841 FTEs as of December 31, 2019.
14
2020 Interim Group management report
Events after the reporting period
2.6 Summary of economic position
The Management Board of TeamViewer AG considers business development in the first half of 2020 and the Group’s economic position to be very positive overall. Based on the additional demand for remote access and home office solutions as a result of the measures taken in the first quarter to contain the COVID-19 pandemic, the forecast for the fiscal year 2020 was updated on May 12, 2020. In spite of a normalization of demand in the second quarter, the Company emphatically continued its growth trajectory. This was accompanied by an improvement in profitability and a 78.4% increase in adjusted EBITDA compared with the same period in 2019. On the whole, TeamViewer can look back on a very successful first six months of 2020.
3 Events after the reporting periodNo significant events occurred after the end of the reporting period that could have a material impact on the pre-sentation of the Group’s assets and liabilities, financial position and financial performance, with the exception of those set out below.
Acquisition of Ubimax GmbH
On July 15, 2020, TeamViewer AG signed a definitive contract to acquire Ubimax, a provider of wearable compu-ting technologies and augmented reality (AR) solutions for the frontline workforce. Though the acquisition Team-Viewer will expand its Industry 4.0 and Internet of Things (IoT) offering for enterprise customers.
TeamViewer will acquire 100% of Ubimax for total consideration of EUR 136.5 million on a cash- and debt-free basis, partially paid in cash and partially in shares. The cash component amounts to EUR 85.8 million and will be fully financed from TeamViewer’s cash funds. In addition, the founders of Ubimax will receive 1,070,931 new TeamViewer shares to be issued from the existing authorized capital in a capital increase against contributions in kind. Shareholders’ subscription rights are excluded. The newly issued shares are subject to a three-year lock-up agreement with yearly partial vesting, which underlines the founders’ long-term commitment. Subject to fulfillment of certain conditions, the closing of the transaction is expected to occur in the third quarter of 2020.
Update on 2016 Cyber Attack
As previously disclosed, TeamViewer was in the fall of 2016 target of a cyber-attack. In relation to this, TeamViewer, as a potential victim, cooperated globally with law enforcement agencies. TeamViewer‘s lawyers were contacted by one of those agencies providing a brief factual update on the status of their investigations. In this update, the agency mentioned evidence for data losses derived from the events around 2016, which might lead to notice requirements vis-à-vis data protection authorities and customers - pending detailed analysis. However, they did mention as well that there is no evidence of data misuse following a series of remediation measures and infras-tructure hardening undertaken by TeamViewer ending in mid 2018. Numerous independent certifications, security code reviews and penetration tests over the last years together with a 24/7 Security Operations Center ensure TeamViewer‘s leading cyber defence posture.
4 Report on opportunities and risksCompared with the report on opportunities and risks contained in the 2019 Annual Report, the half-yearly risk as-sessment has resulted in the following significant changes within the risks classified as high or major in the overall assessment:
The Company now categorizes the risk of potential negative effects of the coronavirus pandemic as high, which

15
2020 Interim Group management report
Report on expected developments
means that a risk remains even when internal control measures are taken into account. The COVID-19 pandemic poses significant general, health-related and economic challenges for companies in general, as well as for Team-Viewer. Through a range of measures such as remote working regulations and the introduction of a shift system on site, we have been able to reduce health risks for our employees as far as possible until now, but we cannot rule out the possibility of absences due to illness, with the related economic repercussions this could have moving forward. The Company also considers the medium- to long-term macroeconomic effects on customer behavior to be difficult to estimate.
On the other hand, the legal and regulatory risks, particularly those related to the General Data Protection Regu-lation, are increasingly seen by the Company as an opportunity to position the Company positively in the market, which reduces the risk to a medium level in gross terms.
The Company has continuously expanded its corporate governance structure and control mechanisms, which in the Company’s view has also further reduced the risk of possible infringements and means that this can also be classified as merely a medium-level gross exposure.
The Company also considers the personnel risk of not being able to find enough sufficiently qualified employees in the foreseeable future to be reduced to a medium level in gross terms based on the current number of applicants and in view of the general labor market.
Overall analysis of risks
The Management Board firmly believes that the risks identified currently do not, either individually or in the aggre-gate, jeopardize the continued existence of the Group as a going concern or that of one of its major subsidiaries.
5 Report on expected developments5.1 Expected macroeconomic and sector-specific situationAfter a stabilization of the global economy in 2020 was still expected at the end of the fiscal year 2019, the Kiel Institute for the World Economy (IfW) reported a slump of 10% in the first half of the year due to the COVID-19 pandemic. Assuming that global output had already reached a low point in April, an average decline of 3.8% (measured on the basis of purchasing power parities) is forecast for the current year, 2020. This assumes that the development of the pandemic will allow for a sustained and extensive relaxation of containment policies and that monetary and fiscal policy measures will continue to have a positive effect on the economy15.
On the other hand, in the markets with relevance for TeamViewer – digital transformation, Internet of Things (IoT) and remote working – a continuation of the positive trend seen in 2019 is expected for 2020, as explained in sec-tion 2.1(b) Sector-specific environment above. Global quarantine measures to combat the COVID-19 pandemic have led to rapid growth in demand for remote working solutions in particular. The market for connectivity plat-forms is also expected to continue to show strong double-digit growth in the coming years. McKinsey & Company, for example, is forecasting annual growth (CAGR) of 24% up to a market volume of EUR 30.2 billion in 2023.16 Nu-cleus Research is likewise forecasting annual growth (CAGR) of 21% for the market that is relevant to TeamViewer, with a market volume of USD 16.95 billion in 202217.
15 Kiel economic reports of the Kiel Institute for the World Economy (IfW): Global economy in summer 202016 Growing Opportunities in the Internet of Things, McKinsey & Company, 201917 Guidebook TeamViewer, Nucleus Research, 2019

16
2020 Interim Group management report
Report on expected developments
5.2 Future development of the Group
Excluding any contribution from the Ubimax transaction and despite the weakening of the U.S. Dollar TeamViewer confirms its full year guidance with the following targets:
‣ billings of around EUR 450m, ‣ revenue of at least EUR 450m due to significant first quarter 2020 billings and therefore higher deferred
revenue releases before year end, ‣ an Adjusted EBITDA margin of around 56%, and ‣ capital expenditure of EUR 25-30m.
5.3 Overall assessment of future developmentThe Management Board is confident that the TeamViewer Group will be able to build on the strong fiscal year 2019 and expects robust business performance once again for the fiscal year 2020.
Göppingen, July 29, 2020
The Management Board
Oliver Steil Stefan Gaiser

17
Consolidated statement of profit or loss and other comprehensive income
from January 1 to June 30, 2020
Quarterly report Half-yearly report
In thousands of euro Apr. 1 – June 30, 2020
Apr. 1 – June 30, 2019
Jan. 1 – June 30, 2020
Jan. 1 – June 30, 2019 Note
Revenue 114,729 94,523 217,446 181,236 (4.1)
Cost of sales (16,218) (11,919) (30,285) (23,771)
Gross profit 98,511 82,603 187,161 157,465
Other income 68 7,813 521 8,012
Research and development (9,648) (8,892) (19,121) (16,509)
Sales (17,762) (11,275) (33,467) (20,534)
Marketing (9,043) (5,905) (17,733) (11,158)
General and administrative (13,771) (12,823) (26,600) (20,308)
Other expenses (154) (47) (291) (47)Impairment losses on trade receivables
(3,366) (4,707) (8,523) (6,679)
Operating profit 44,836 46,769 81,947 90,242Unrealized foreign exchange gains/(losses)
10,380 3,927 2,824 (4,683)
Realized foreign exchange gains/(losses)
(1,723) 921 (1,723) 1,266
Finance income 111 878 151 22,281
Finance costs (5,376) (22,427) (13,507) (39,354)
Profit before taxation 48,227 30,067 69,692 69,752
Tax income/(expense) (17,890) (10,885) (27,229) (24,030)
Profit/(loss) for the period 30,337 19,183 42,463 45,722Other comprehensive income for the periodItems that may be reclassified to profit or loss in subsequent periods
(21) 7 (95) 12
Hedge reserve, gross 5 6 (62) 1Exchange differences on translation of foreign opera-tions
(26) 1 (33)10
Total comprehensive income for the period
30,317 19,190 42,368 45,734

18
Earnings per share
In euro Apr. 1 – June 30, 2020
Apr. 1 – June 30, 2019
Jan. 1 – June 30, 2020
Jan. 1 – June 30, 2019
Profit/(loss) for the period 30,337,159 19,183,867 42,463,083 45,722,390
Shares issued and outstanding 200,000,000 200,000,00018 200,000,000 200,000,00018
Earnings per share (profit/(loss) for the period/no. of shares)
0.15 0.10 0.21 0.23
Earnings per share are calculated by dividing the earnings attributable to holders of the parent company’s ordinary shares by the weighted average number of ordinary shares outstanding during the period. There were no conver-sion or option rights outstanding in the period under review or in the prior-year period. Therefore, diluted earnings per share is identical to basic earnings per share.
There were no further transactions involving ordinary shares or potential ordinary shares in the period between the reporting date and the approval of the consolidated financial statements for publication.
18 Earnings per share as of June 30, 2019 were determined based on the hypothetical assumption that TeamViewer AG had already issued 200 million shares in the first half of 2019.

19
Consolidated statement of financial position
as of June 30, 2020
In thousands of euro June 30, 2020 Dec. 31, 2019 Note
Non-current assets
Goodwill 590,437 590,445
Intangible assets 229,318 235,831
Property, plant and equipment 28,898 26,480
Financial assets 5,402 4,424
Other assets 1,106 1,740
Deferred tax assets 0 6,266
Total non-current assets 855,160 865,187
Current assets
Trade receivables 17,127 11,756 (4.2)
Other assets 5,367 5,856
Tax assets 3,497 4,972
Financial assets 918 -
Cash and cash equivalents 149,755 71,153
Total current assets 176,664 93,737
Total assets 1,031,824 958,924
Equity
Issued capital 200,000 200,000 (4.3)
Capital reserve 340,716 320,661 (4.3)
(Accumulated losses)/retained earnings (387,418) (429,881) (4.3)
Hedge reserve (62) - (4.3)
Foreign currency translation reserve 1,048 1,081 (4.3)
Total equity attributable to owners of the parent 154,284 91,861
Non-current liabilities
Provisions 281 235
Financial liabilities 579,017 582,538 (4.4)
Deferred revenue 855 2,572
Other financial liabilities 357 -
Deferred tax liabilities 2,196 308
Total non-current liabilities 582,706 585,652
Current liabilities
Provisions 2,259 3,284
Financial liabilities 33,356 34,260 (4.4)
Trade payables 10,928 9,069
Deferred revenue 218,766 210,250
Deferred and other liabilities 24,222 17,793
Other financial liabilities 5,250 6,642
Tax liabilities 52 114
Total current liabilities 294,834 281,411
Total liabilities 877,540 867,063
Total equity and liabilities 1,031,824 958,924

20
Consolidated statement of cash flows
from January 1 to June 30, 2020
In thousands of euro Jan. 1 – June 30, 2020
Jan. 1 – June 30, 2019 Note
Cash flows from operating activities
Profit before taxation19 69,692 69,752
Depreciation, amortization and impairment of non-current assets19 19,322 17,906
(Gain)/loss from the sale of property, plant and equipment 3 -
Increase/(decrease) in provisions (978) (137)
Non-operating foreign exchange (gains)/losses (3,301) 2,897
Expenses for share-based compensation 20,412 900
Net finance costs19 13,356 17,073
Change in deferred revenue 6,800 (41,529)
Changes in other net working capital19 2,386 (3,888)
Income taxes paid (17,666) (10,262)
Interest received/(paid) (34) (18)
Net cash from operating activities 109,990 52,694
Cash flows from investing activities
Capital expenditure for property, plant and equipment and in-
tangible assets(15,095) (7,926)
Payments for the acquisition of non-current financial assets (51) -
Interest received 151 251
Net cash used in investing activities (14,995) (7,675)
Cash flows from financing activities
Repayments of borrowings 0 (52,461)
Payments for the capital element of lease liabilities (1,757) (2,370)
Interest paid for borrowings and lease liabilities (13,636) (26,280) (4.4)
Proceeds/(payments) from the settlement of derivatives 0 (64)
Net cash used in financing activities (15,393) (81,175)
Net change in cash and cash equivalents 79,603 (36,156)
Net foreign exchange rate difference (531) 388
Net change from cash risk provisioning (471) 844
Internal combinations and transfers 0 3,768
Cash and cash equivalents at beginning of period 71,153 79,939
Cash and cash equivalents at end of period 149,755 48,783
19 Presentation changed compared with prior year. See note 2d in the consolidated financial statements of TeamViewer AG for the fiscal year 2019.

21
Consolidated statement of changes in equity
from January 1 to June 30, 2020
In thousands of euro Issued capital Capital reserve(Accumulated losses)/retained earnings
Hedge reserve Foreign currency translation reserve Total equity Note
Balance at January 1, 2020 200,00020 320,66120 (429,881) - 1,081 91,861
Profit/(loss) for the period - - 42,463 - - 42,463Other comprehensive income for the period
- - - (62) (33) (95)
Share-based compensation - 20,055 - - - 20,055 (5.1)
Balance at June 30, 2020 200,000 340,716 (387,418) (62) 1,048 154,284
Balance at January 1, 2019 25 116,312 (332,876) (14) 4 (216,548)
Profit/(loss) for the period - - 45,722 - - 45,722Other comprehensive income for the period
- - - 2 11 13
Share-based compensation - 900 - - - 900
Shareholder contribution - 8,678 (889) - 889 8,678
Balance at June 30, 2019 25 125,890 (288,043) (12) 903 (161,237)
20 For more information on the changes in issued capital and the capital reserve in the second half of 2019, please refer to the corresponding disclosures in the consolidated financial statements of TeamViewer AG for the fiscal year 2019.

22
Notes to the condensed consolidated interim financial statements
General information
Notes to the condensed consolidated interim financial statements
1 General informationTeamViewer AG is a listed stock corporation headquartered in Göppingen, Germany. The Company is entered in the commercial register of the Ulm Local Court under the number HRB 738852. TeamViewer AG, Göppingen, is the parent company of the TeamViewer Group (hereinafter also referred to as “TeamViewer AG” or the “Group”).
The condensed and unaudited consolidated interim financial statements of TeamViewer AG as of June 30, 2020 are in conformity with the International Financial Reporting Standards (IFRSs) as adopted by the EU. These con-densed consolidated interim financial statements have been reviewed by Ernst & Young GmbH Wirtschaftsprü-fungsgesellschaft, Stuttgart, taking account of IAS 34 “Interim Financial Reporting” in conjunction with IAS 1 “Presentation of Financial Statements”. For more information, please refer to page 38 (REVIEW Report). The con-densed consolidated interim financial statements do not contain all of the information and disclosures required for a set of consolidated financial statements prepared as of the end of a fiscal year and must therefore be read in conjunction with the consolidated financial statements for the year ended December 31, 2019.
Estimates and judgments in response to the COVID-19 pandemic
Estimates and judgments may have an impact on the amounts recognized for assets and liabilities at the reporting date and on the income and expenses recorded for the reporting period. Since the global consequences of the COVID-19 pandemic are unpredictable at present, these estimates and judgments are subject to increased uncer-tainty. The actual amounts realized may differ from the estimates and judgments; variances may have a material impact on the interim financial statements.
Any updates to the estimates and judgments took into account the information available on expected economic developments, in particular with regard to the valuation of the receivables and the assessment of the existence of a contract within the meaning of IFRS 15 when the contract is concluded.
2 Accounting policiesThe same accounting principles and accounting policies were applied as in the consolidated financial statements for the year ended December 31, 2019.
As of June 30, 2020, income tax expense was determined by applying the effective tax rate expected for the full year.
Accounting standards applied for the first time in the current fiscal year
‣ Amendments and References to the Conceptual Framework in IFRS Standards ‣ Amendments to IFRS 3 Business Combinations ‣ Amendments to IAS 1 and IAS 8 – Definition of Material ‣ IBOR reform phase 1 amendments to IFRS 9, IAS 39, and IFRS 7

23
Notes to the condensed consolidated interim financial statements
Accounting policies
The first-time application of the accounting standards listed in the table had no, or no material, effect on the pre-sentation of the assets and liabilities, financial position and financial performance.
IFRSs published but not yet endorsed by the EU and not yet adopted by the Group
In the second quarter of 2020, the International Accounting Standards Board published an amendment to IFRS 16 (“Covid-19-Related Rent Concessions”), which is intended to grant lessees a practical expedient in the accoun-ting treatment of rent concessions resulting from the COVID-19 pandemic. At present, this amendment is not yet applicable in the European Union.
The condensed consolidated interim financial statements are prepared in euro.
The following significant exchange rates changed as follows:
Spot exchange rate
Currency ISO Code June 30, 2020 Dec. 31, 2019
U.S. dollar USD 1.12 1.12
Pound sterling GBP 0.91 0.85
Australian dollar AUD 1.63 1.60
Armenian dram AMD 540.44 537.26
Japanese yen JPY 120.66 121.94
Indian rupee INR 84.62 80.19
Singapore dollar SGD 1.56 1.51
Chinese yuan CNY 7.92 7.82
The following table shows the half-yearly average exchange rates for the most significant currencies, which are used for the translation of cash receipts and cash payments as well as income and expenses of foreign operations into the reporting currency:
Average exchange rates Average rate Average rate
Currency ISO Code Jan. 1 – June 30, 2020
Jan. 1 – June 30, 2019
U.S. dollar USD 1.10 1.13
Pound sterling GBP 0.87 0.87
Australian dollar AUD 1.68 1.60
Armenian dram AMD 532.61 547.07
Japanese yen JPY 119.21 124.29
Indian rupee INR 81.68 79.12
Singapore dollar SGD 1.54 1.54
Chinese yuan CNY 7.75 7.67
Due to rounding, numbers may not add up precisely to the totals provided and percentages presented may not precisely reflect the figures to which they relate.
24
Notes to the condensed consolidated interim financial statements
Basis of consolidation
3 Basis of consolidation
There were no changes in the basis of consolidation compared with December 31, 2019.
4 Selected notes to the consolidated statement of profit or loss and other comprehensive income
4.1 RevenueRevenue in the second quarter was generated in the regions listed below:
Revenue by region
In thousands of euro Apr. 1 – June 30, 2020 Apr. 1 – June 30, 2019
EMEA 63,088 53,832
AMERICAS 37,171 29,115
APAC 14,471 11,576
Total revenue 114,729 94,523
Revenue by license type based on the development of deferred revenue
In thousands of euro April 1 – June 30, 2020
As of April 1 Additions/billings Release/ revenue As of June 30
Perpetual licenses 31,445 - (13,103) 18,342
Subscription licenses 185,499 105,949 (90,169) 201,279Development of item from the statement of financial posi-tion
216,944 105,949 (103,272) 219,621
Other n/a - (11,457) n/a
Effect on profit or loss n/a 105,949 (114,729) n/a
In thousands of euro April 1 – June 30, 2019
As of April 1 Additions/billings Release/ revenue As of June 30
Perpetual licenses 140,923 560 (32,651) 108,831
Subscription licenses 121,234 7,576 (63,707) 131,104Development of item from the statement of financial posi-tion
262,158 74,136 (96,358) 239,936
Other n/a (1,053) 1,835 n/a
Effect on profit or loss n/a 73,083 (94,523) n/a

25
Notes to the condensed consolidated interim financial statements
Selected notes to the consolidated statement of profit or loss and other comprehensive income
Revenue in the first half of the year was generated in the regions listed below:
Revenue by region
In thousands of euro Jan. 1 – June 30, 2020 Jan. 1 – June 30, 2019
EMEA 119,475 103,092
AMERICAS 70,446 56,183
APAC 27,526 21,961
Total revenue 217,446 181,236
The Group lifted its revenue from EUR 181.2 million to EUR 217.4 million. This increase is mainly attributable to billings growth, which is recognized in revenue over the underlying period in which the service is rendered.
Revenue by license type based on the development of deferred revenue
In thousands of euro Jan. 1 – June 30, 2020
As of Jan. 1 Additions/billings Release/revenue As of June 30
Perpetual licenses 48,863 99 (30,619) 18,342
Subscription licenses 163,959 225,594 (188,274) 201,279Development of item from the statement of financial posi-tion
212,822 225,693 (218,893) 219,621
Other n/a - 1,447 n/a
Effect on profit or loss n/a 225,693 (217,446) n/a
In thousands of euro Jan. 1 – June 30, 2019
As of Jan. 1 Additions/billings Release/ revenue As of June 30
Perpetual licenses 173,390 1,024 (65,582) 108,831
Subscription licenses 107,246 141,846 (117,988) 131,104Development of item from the statement of financial posi-tion
280,636 142,870 (183,570) 239,936
Other n/a (1,230) 2,334 n/a
Effect on profit or loss n/a 141,640 (181,236) n/a
In general, the Group grants its customers a payment term of 14 days after the purchase date. The purchase date is usually also the invoice date. The sales representatives are allowed to extend the payment term within a set framework.

26
Notes to the condensed consolidated interim financial statements
Selected notes to the consolidated statement of profit or loss and other comprehensive income
4.2 Trade receivables
The Group only has current trade receivables. Current trade receivables presented on a gross basis including receivables older than 120 days are as follows:
Trade receivables aging
In thousands of euro June 30, 2020 Dec. 31, 2019
Neither past due nor impaired 346 450
Past due and impaired
1-30 days past due 12,384 11,389
31-60 days past due 4,304 2,852
61-90 days past due 3,397 2,554
91-120 days past due 3,091 1,708
More than 120 days past due 13,327 11,238
Total trade receivables, gross 36,849 30,194
Total trade receivables included receivables from related parties in the amount of EUR 31 thousand as of June 30, 2020 (December 31, 2019: EUR 301 thousand).
The loss allowance on the Company’s current trade receivables developed as follows as of June 30, 2020:
Development of loss allowance on trade receivables
In thousands of euro June 30, 2020 Dec. 31, 2019
Loss allowance as of beginning of fiscal year (18,438) (9,560)
Release/(addition) (8,495) (15,489)
Utilization 7,211 6,162
Contribution of foreign entities - 472
Other - (24)
Total loss allowance as of half year end (19,722) (18,438)
The loss allowance for trade receivables rose to EUR 19,722 thousand as of June 30, 2020 (December 31, 2019: EUR 18,438 thousand) mainly due to the increase in trade receivables and higher expected credit losses. Overdue trade receivables are subject to enforcement activities. Trade receivables are derecognized if they are overdue for more than one year and the receivable is not expected to be recovered.
Information about the Group’s exposure to credit and market risks for trade receivables is included in Note 4.5 Fi-nancial instruments – Fair values and risk management.

27
Notes to the condensed consolidated interim financial statements
Selected notes to the consolidated statement of profit or loss and other comprehensive income
4.3 EquityEquity
In thousands of euro June 30, 2020 Dec. 31, 2019
Issued capital 200,000 200,000
Capital reserve 340,716 320,661
(Accumulated losses)/retained earnings (387,418) (429,881)
Cash flow hedges (62) -
Foreign currency translation reserve 1,048 1,081
Total equity 154,284 91,861
Equity rose from EUR 91.9 million in the first half of 2020 to EUR 154.3 million. The increase of EUR 62.4 million is largely attributable to the net profit for the period and the increase in the capital reserve of EUR 20.1 million arising from the recognition of share-based compensation in the statement of profit or loss.
4.4 Financial liabilitiesTerms and repayment structure of the syndicated loans
The following table shows the terms, conditions and carrying amounts of the Group’s interest-bearing liabilities for the syndicated loans:
Interest-bearing liabilities
June 30, 2020
In thousands of euro Currency Nominal inter-est rate Year of maturity Principal
amount (EUR)Carrying amount (EUR)
Syndicated loan USD USD 3.57% 2024 401,857 397,258
Syndicated loan EUR EUR 2.25% 2024 125,000 123,580
Syndicated loan GBP GBP 3.20% 2024 72,967 72,136Syndicated loan – revolving credit facility
Various Various 2024 - (371)
Total interest-bearing liabili-ties
599,825 592,603

28
Notes to the condensed consolidated interim financial statements
Selected notes to the consolidated statement of profit or loss and other comprehensive income
Interest-bearing liabilities
Dec. 31, 2019
In thousands of euro Currency Nominal inter-est rate Year of maturity Principal
amount (EUR)Carrying amount (EUR)
Syndicated loan USD USD 4.81% 2024 400,570 395,442
Syndicated loan EUR EUR 2.50% 2024 125,000 123,404
Syndicated loan GBP GBP 3.58% 2024 78,253 77,252Syndicated loan – revolving credit facility
Various Various 2024 - (415)
Total interest-bearing liabili-ties
603,823 595,683
4.5 Financial instruments – Fair values and risk management4.5.(a) Accounting classifications and fair values
All assets and liabilities for which a fair value is calculated or presented are categorized as follows:
‣ Level 1: quoted prices in active markets for identical assets or liabilities. ‣ Level 2: inputs other than quoted prices included in Level 1 that are observable for the asset or liability, either
directly or indirectly. ‣ Level 3: inputs for the asset or liability that are not based on observable market data.
The following table shows the carrying amounts and fair values of financial assets and financial liabilities, including their levels in the fair value hierarchy.

29
Notes to the condensed consolidated interim financial statements
Selected notes to the consolidated statement of profit or loss and other comprehensive income
Carrying amount and fair value level
June 30, 2020
In thousands of euro Carrying amount Fair value level
Classification in accordance with IFRS 9
Fair value through profit or loss
Amortized cost Total Fair value Level
Financial assets 1,559* - 1,559 1,559 2Total financial assets measu-red at fair value
1,559* 1,559
Trade receivables - 17,127 17,127 17,127 2
Cash and cash equivalents - 149,755 149,755 149,755 2
Other financial assets - 4,760 4,760 4,760 2Total financial assets not measured at fair value
171,642 171,642
Trade payables - 10,928 10,928 10,928 2
Lease liabilities - 19,771 19,771 19,771 2
Bank loans - 592,603 592,603 592,603 2
Other financial liabilities - 5,607 5,607 5,607 2Total financial liabilities not measured at fair value
628,909 628,909
*Of this amount, EUR 65 thousand is designated as a cash flow hedge. Changes in value are recognized in other comprehensive income.

30
Notes to the condensed consolidated interim financial statements
Selected notes to the consolidated statement of profit or loss and other comprehensive income
Carrying amount and fair value level
Dec. 31, 2019
In thousands of euro Carrying amount Fair value level
Classification in accordance with IFRS 9
Fair value through profit or loss
Amortized cost Total Fair value Level
Financial assets - - - -Total financial assets measu-red at fair value
- - - -
Trade receivables - 11,756 11,756 11,756 2
Cash and cash equivalents - 71,153 71,153 71,153 2
Loan receivables - - - -
Other financial assets - 4,424 4,424 4,424 2Total financial assets not measured at fair value
87,333 87,333
Trade payables - 9,069 9,069 9,069 2
Lease liabilities - 21,114 21,114 21,114 2
Bank loans - 595,683 595,683 595,683 2
Other financial liabilities - 6,642 6,642 6,642 2Total financial liabilities not measured at fair value
632,508 632,508
Other financial assets include rent deposits for office space, in particular for the Group’s new headquarters in Göppingen (EUR 4,200 thousand; H1 2019 EUR 4,200 thousand.
4.5.(b) Measurement of fair values
Valuation techniques – The fair values are calculated using standard financial valuation models, based entirely on observable inputs.
The fair values for the derivatives are calculated with an option pricing model in which the most relevant factors are yield curves and, in the case of foreign currency derivatives, realized and expected exchange rate movements.
The fair values of the debt instruments assigned to Level 2 are calculated as the present values of the payments associated with the debts.
Trade receivables, receivables from affiliates, associates and other investments as well as loan receivables, other assets and cash and cash equivalents generally all have current maturities. Therefore, their carrying amounts approximate their fair values on the reporting date.
Trade payables, liabilities due and other non-financial liabilities also generally have current maturities. Therefore, their carrying amounts approximate their fair values on the reporting date.
There were no transfers between fair value levels in the first half of 2020.

31
Notes to the condensed consolidated interim financial statements
Selected notes to the consolidated statement of profit or loss and other comprehensive income
4.5.(c) DerivativesCash flows in USD are hedged in some cases using foreign exchange caps that will hedge USD 3.35 million per month in 2020 and USD 6.25 million per month in 2021 at a strike price of USD/EUR 1.15. The caps are not de-signated as hedges.
The Group has entered into an interest rate cap agreement for partial hedging of the USD syndicated loan. This agreement is designated as a cash flow hedge reserve. There is an economic relationship between the hedged item (USD syndicated loan principal of USD 450 million as of June 30, 2020) and the hedging instrument (cap of USD 315 million as of June 30, 2020) since both are inversely related to the 3M USD LIBOR rate with a 0.70 hedge ratio at the reporting date.

32
Notes to the condensed consolidated interim financial statements
Other disclosures
5 Other disclosures5.1 Related party disclosures
TeamViewer identifies the related parties of TeamViewer AG in accordance with IAS 24.
TigerLuxOne S.à.r.l. (TLO) reduced its interest in TeamViewer AG in the first half of 2020 in two steps from 62.5% to a total of 39.0%, selling 11% in March and subsequently a further 12.5% in June. The remaining 61.0% of the shares are therefore in free float.
There were no significant related party transactions in the first half of 2020.
Transactions involving key management personnel
Remuneration of the Management Board – IFRS figures
In thousands of euro June 30, 2020 June 30, 2019
Short-term employee benefits 1,843 888
Share-based compensation 9,900 900
Total 11,742 1,788
Share-based compensation includes expenses for IPO bonuses of EUR 9.5 million (H1 2019: EUR 0.9 million) and expenses for the Long Term Incentive Program (LTIP) of EUR 0.4 million (H1 2019: EUR 0.0 million).
There were no other transactions with key management personnel during the reporting period (as in the compara-tive period in 2019), nor were there any balances outstanding as of June 30, 2020 or December 31, 2019.
Moreover, under the above-mentioned programs, expenses for share-based compensation of EUR 10.5 million (H1 2019: EUR 0.0 million) from the Employee Participation Program (EPP) for employees outside of the Manage-ment Board were recognized in the first half of 2020.

33Notes to the condensed consolidated interim financial statements
Other disclosures
Business partner
At year-end and for the half-year period121
Sales to related parties
Purchases from related parties
Interest expen-ses to related parties
Interest income from related parties
Trade receiva-bles from related parties
Liabilities to related parties
Loans and borrowings from related parties
Loans and bor-rowings granted to related parties
In thousands of euro
TigerLux One HoldCo S.C.A.June 30, 2020 - - - - - - - -
Dec. 31, 2019 - - - 265 - - - -
TLOJune 30, 2020 4 - - - 31 - - -
Dec. 31, 2019 130 - 7,781 35 301 - - -
TeamViewer Pty LtdJune 30, 2020 - - - - - - - -
Dec. 31, 2019 - 1,545 1 - - - - -
TeamViewer US, LLCJune 30, 2020 - - - - - - - -
Dec. 31, 2019 - 11,944 11 - - - - -
TeamViewer UK, LtdJune 30, 2020 - - - - - - - -
Dec. 31, 2019 33 266 - 45 - - - -
Monitis US, LLCJune 30, 2020 - - - - - - - -
Dec. 31, 2019 528 2 - 1 - - - -
Monitis CJSCJune 30, 2020 - - - - - - - -
Dec. 31, 2019 - 1,995 - 10 - - - -
GFKLJune 30, 2020 - - - - - - - -
Dec. 31, 2019 - 2 - - - - - -
TricorJune 30, 2020 - 104 - - - 10 - -
Dec. 31, 2019 - 226 - - - 22 - -
Bryant StibelJune 30, 2020 - - - - - - - -
Dec. 31, 2019 - 436 - - - - - -
21 The effects on the statement of profit or loss include the first half of 2020 and full-year 2019.

34
Notes to the condensed consolidated interim financial statements
Other disclosures
5.2 Operating segments
The Group is managed on a single segment base, with the TeamViewer connectivity platform as the basis for the segmentation. The decision for the segmentation was based on the internal organization, which is based on the platform as the single line of reporting. Reporting of the platform is based on the different geographical regions as reporting units, namely Europe, Middle East and Africa (EMEA), North, Central and South America (AMERICAS), and Asia-Pacific (APAC).
As there are no other segments, the consolidated statement of comprehensive income already shows the revenu-es and expenses of the segment and the consolidated statement of financial position already shows the segment assets and segment liabilities. Therefore, no further breakdown is prepared. All revenues shown in the consolida-ted statement of comprehensive income are generated with external customers. The segment generates revenue from the following brands: TeamViewer®, ITBrain®, Monitis® and BLIZZ®.
The most significant success indicators on the basis of which the management steers the Group are billings per region and adjusted EBITDA.
Billings by region
In thousands of euro Jan. 1 – June 30, 2020 Jan. 1 – June 30, 2019
EMEA 124,873 79,896
AMERICAS 70,984 41,118
APAC 29,836 20,627
Billings 225,693 141,640Changes in deferred revenue recognized in profit or loss
(8,247) 39,596
Total revenue 217,446 181,236
Adjusted EBITDA is calculated as follows:
In thousands of euro Jan. 1 – June 30, 2020 Jan. 1 – June 30, 2019
Operating profit/(loss) 81,947 90,242
Amortization and depreciation 19,322 17,906
EBITDA 101,269 108,148Changes in deferred revenue recognized in profit or loss
8,247 (39,596)
Further items to be adjusted 21,600 4,991
Adjusted EBITDA 131,116 73,543

35
Notes to the condensed consolidated interim financial statements
Other disclosures
Further items to be adjusted comprise:
In thousands of euro Jan. 1 – June 30, 2020 Jan. 1 – June 30, 2019
Expenses for share-based compensation pro-grams
(20,412) (900)
Expenses and income in connection with the IPO
(0) (1,497)
Other special items to be adjusted (1,188) (2,594)
Total (21,600) (4,991)
Expenses in connection with the share-based compensation established by TLO amounting to EUR 20.0 million (2019: EUR 0.9 million) constitute the largest item to be adjusted. Furthermore, the Group granted share-based compensation to its own staff in the amount of EUR 0.4 million (2019: EUR 0 million).
The other special items to be adjusted primarily include expenses from the implementation of requirements of the General Data Protection Regulation and special IT projects in the amount of EUR 0.3 million (2019: EUR 2.6 mil-lion), expenses from reorganizations in the amount of EUR 0.2 million (2019: EUR 1.4 million), expenses for special one-time legal disputes in the amount of EUR 0.3 million (2019: EUR 0 million), and measurement effects for de-rivatives for hedging exchange rate fluctuations in the amount of EUR 0.2 million (2019: EUR 0 million).
For the split of revenue by geographical regions within the segment, please refer to our disclosures: 4.1 Revenue.
The non-current assets, excluding financial instruments and deferred tax assets, are mainly related to Germany.
The Group has a very diversified customer base. Therefore, no single customer has a share in revenue of more than 10%.

36
Notes to the condensed consolidated interim financial statements
Other disclosures
5.3 Events after the reporting period
No significant events occurred after the end of the reporting period that could have a material impact on the pre-sentation of the Group’s assets and liabilities, financial position and financial performance, with the exception of those set out below.
Ubimax Acquisition
On July 15, 2020, TeamViewer AG signed a definitive contract to acquire Ubimax, a provider of wearable compu-ting technologies and augmented reality (AR) solutions for the frontline workforce. Though the acquisition Team-Viewer will expand its Industry 4.0 and Internet of Things (IoT) offering for enterprise customers.
TeamViewer will acquire 100% of Ubimax for total consideration of EUR 136.5 million on a cash- and debt-free basis, partially paid in cash and partially in shares. The cash component amounts to EUR 85.8 million and will be fully financed from TeamViewer’s cash funds. In addition, the founders of Ubimax will receive 1,070,931 new TeamViewer shares to be issued from the existing authorized capital in a capital increase against contributions in kind. Shareholders’ subscription rights are excluded. The newly issued shares are subject to a three-year lock-up agreement with yearly partial vesting, which underlines the founders’ long-term commitment. Subject to fulfillment of certain conditions, the closing of the transaction is expected to occur in the third quarter of 2020.
Update on 2016 Cyber Attack
As previously disclosed, TeamViewer was in the fall of 2016 target of a cyber-attack. In relation to this, TeamViewer, as a potential victim, cooperated globally with law enforcement agencies. TeamViewer‘s lawyers were contacted by one of those agencies providing a brief factual update on the status of their investigations. In this update, the agency mentioned evidence for data losses derived from the events around 2016, which might lead to notice requirements vis-à-vis data protection authorities and customers - pending detailed analysis. However, they did mention as well that there is no evidence of data misuse following a series of remediation measures and infras-tructure hardening undertaken by TeamViewer ending in mid 2018. Numerous independent certifications, security code reviews and penetration tests over the last years together with a 24/7 Security Operations Center ensure TeamViewer‘s leading cyber defence posture.
Göppingen, July 29, 2020
The Management Board

37
Responsibility statement
To the best of our knowledge, and in accordance with the applicable reporting principles for interim financial reporting, the consolidated interim financial statements give a true and fair view of the assets, liabilities, financial position and profit or loss of the Group, and the Group interim management report includes a fair review of the development and performance of the business and the position of the Group, together with a description of the material opportunities and risks associated with the expected development of the Group for the remaining months of the fiscal year.
Göppingen, July 29, 2020
The Management Board
Oliver Steil Stefan Gaiser

38
Review Report
To TeamViewer AG
We have reviewed the interim condensed consolidated financial statements of TeamViewer AG, Göppingen, which comprise the consolidated statement of profit or loss and other comprehensive income, consolidated statement of financial position, consolidated statement of cash flows, consolidated statement of changes in equity and notes to the condensed consolidated interim financial statements, and the interim group management report for the period from 1 January 2020 to 30 June 2020, which are part of the half-year financial report pursuant to Sec. 115 WpHG [“Wertpapierhandelsgesetz”: German Securities Trading Act]. The executive directors are responsible for the pre-paration of the interim condensed consolidated financial statements in accordance with IFRSs on interim financial reporting as adopted by the EU and of the interim group management report in accordance with the requirements of the WpHG applicable to interim group management reports. Our responsibility is to issue a report on the interim condensed consolidated financial statements and the interim group management report based on our review.
We conducted our review of the interim condensed consolidated financial statements and of the interim group management report in compliance with German Generally Accepted Standards for the Review of Financial State-ments promulgated by the Institut der Wirtschaftsprüfer [Institute of Public Auditors in Germany] (IDW). Those standards require that we plan and perform the review to obtain a certain level of assurance in our critical ap-praisal to preclude that the interim condensed consolidated financial statements are not prepared, in all material respects, in accordance with IFRSs on interim financial reporting as adopted by the EU and that the interim group management report is not prepared, in all material respects, in accordance with the requirements of the WpHG applicable to interim group management reports. A review is limited primarily to making inquiries of the Company’s employees and analytical assessments and therefore does not provide the assurance obtainable from an audit of financial statements. Since, in accordance with our engagement, we have not performed an audit of financial statements, we cannot issue an auditor’s report.
Based on our review, nothing has come to our attention that causes us to believe that the interim condensed consolidated financial statements are not prepared, in all material respects, in accordance with IFRSs on interim financial reporting as adopted by the EU or that the interim group management report is not prepared, in all ma-terial respects, in accordance with the provisions of the WpHG applicable to interim group management reports.
Stuttgart, 29. July 2020 Ernst & Young GmbH Wirtschaftsprüfungsgesellschaft
Koch Maurer Wirtschaftsprüfer Wirtschaftsprüfer [German Public Auditor] [German Public Auditor]

39
Financial calendar
QUARTERLY STATEMENT AS OF SEPTEMBER 30/Q3 2020
Tuesday, November 10, 2020
Further dates and schedule updates available at ir.teamviewer.com