Embed Size (px)
Citation preview
JPMorgan Asian Investment Trust plc
Half Year Report & Accounts for the six months ended 31st March 2009
Half Year Report09

Features
Contents
About the Company
1 Half Year Performance2 Chairman’s Statement4 Investment Managers’ Report
Investment Review
6 Ten Largest Investments7 Portfolio Analyses
Accounts
8 Income Statement 9 Reconciliation of Movements
in Shareholders’ Funds 10 Balance Sheet 11 Cash Flow Statement 12 Notes to the Accounts
Shareholder Information
14 Subscription Shares14 Rollover Apportionments15 Interim Management Report16 Information about the Company17 Glossary of Terms
Objective
Capital growth, primarily from investing in equities quoted on the stockmarkets ofAsia, excluding Japan.
Investment Policies
- To have a diversified portfolio of Asian stocks.
- To have a portfolio comprising 50 to 80 investments.
- To use borrowings from time to time to gear the portfolio within a range of 90%-120% invested.
Benchmark
MSCI AC Asia ex Japan Index with net dividends reinvested in sterling terms.
Capital Structure
The Company has an authorised Share capital of 720,000,000 Ordinary shares of25p each (of which 160,007,154 were in issue as at 31st March 2009) and 32,000,805Subscription shares of 1p each (of which 32,000,805 were in issue as at 31st March2009).
Continuation Vote
In accordance with the Company’s Articles of Association, the Directors are requiredto propose a resolution that the Company continue as an investment trust at theAnnual General Meeting in 2011 and every third year thereafter.
Management Company
The Company employs JPMorgan Asset Management (UK) Limited (‘JPMAM’ or the‘Manager’) to manage its assets.

JPMorgan Asian Investment Trust plc. Half Year Report & Accounts 2009 | 1
Half Year Performance
+2.3%Total return to shareholders1
-1.7%Total return on net assets1
-1.8%Benchmark total return2
A glossary of terms and definitions is provided on page 17.
1Source: J.P.Morgan. These are total returns and assume that the final dividend of 1.70p wasreinvested on the ex-dividend date of 9th January 2009.
2Source: MSCI. The Company’s benchmark is the MSCI AC Asia ex Japan Index with net dividendsreinvested in sterling terms.3Subscription shares were issued during the period by way of a bonus issue. Details of thesubscription rights conferred by these shares are given on page 14.
4Includes the final dividend of 1.70p that was payable to shareholders on 13th February 2009. Inline with industry practice this dividend is deducted from the net asset value when calculatingthe total return on net assets.
31st March 30th September %2009 2008 change
Total net assets (£’000) 231,891 241,612 -4.0
Number of Ordinary shares in issue 160,007,154 160,007,154 –
Number of Subscription shares in issue3 32,000,805 –
Undiluted net asset value per Ordinary share 144.9p 151.0p4 -4.0
Ordinary share price 133.3p 132.0p +1.0
Subscription share price 11.5p –
Discount of Ordinary share price to undilutednet asset value 8.0% 12.6%
Financial Data

2 | JPMorgan Asian Investment Trust plc. Half Year Report & Accounts 2009
Performance
Our investment managers had to contend with another six month period of extremevolatility in Asian markets. In the first twenty seven days of October alone ourbenchmark (the MSCI AC Asia ex Japan Index in sterling terms) fell by more than 29%before rallying by month end to close 17% down. It then staged a number of sharprallies and subsequent steep corrections before ending the reporting period with amodest negative total return of 1.8%. Against this backdrop the Company’s net assetvalue total return declined by 1.7% as our investment managers held their nerve,maintaining their conviction approach to stock picking (which focuses the portfolioon companies they rate highly, regardless of their current benchmark weighting).The Company’s share price performed better and, taking into account the benefit ofa narrowing of the discount, the total return to shareholders in the period was +2.3%.
Subscription Shares
At the Company’s General Meeting held on 4th February 2009, shareholdersapproved a bonus issue of Subscription shares to qualifying shareholders on thebasis of one Subscription share for every five Ordinary shares held. EachSubscription share confers the right (but not the obligation) to subscribe for oneOrdinary share at predetermined prices on any business day during the period from1st April 2009 until 31st March 2014, after which the rights on the Subscriptionshares will lapse.
It is pleasing that, at the time of writing, the Company’s Ordinary share price isquoted at 158.5p, comfortably above the initial exercise price of 137p perSubscription share. The Subscription shares, which are separately quoted, arecurrently priced at 26.25p per share, which equates to a further 5.25p of value perOrdinary share for shareholders who qualified for the bonus issue. Further details onthe Subscription shares, including their exercise prices, the apportionments forcapital gains tax purposes and how they may be exercised, can be found on page 14of this report and on the Company’s website at www.jpmasian.co.uk
Discount Volatility
The level of discount and demand for the Company’s shares remained strong overthe period and, accordingly, the Board did not buy back any shares. However, theBoard continues closely to monitor the level of the discount and is prepared to useits authority to repurchase shares should it deem it necessary.
Gearing
Our investment managers did not gear the portfolio during the review period andactually held cash, which proved to be a wise investment decision. The Board has apolicy of keeping gearing within the range of 90-120% invested and the Companyhas the facilities in place to enable the investment managers to re-gear the portfolioshould buying opportunities present themselves. As markets have rallied over thepast couple of months this policy has remained under close review and, indeed, inmid-April our investment managers decided to draw down on some of theCompany’s committed facilities.
Chairman’s Statement

Outlook
Asian markets have rallied strongly since the beginning of March. Despite someencouraging signs it is, however, too soon to say with confidence that the bearmarket is behind us. Investor sentiment is likely to remain fragile and stock marketssusceptible to further setbacks for some time to come. Our investment managers,however, are well prepared to take advantage of any opportunities.
Despite the continued market uncertainty, your Board remains confident in the longterm prospects for Asia and is fully supportive of our investment managers’ style andapproach which, we expect, should deliver out-performance over the longer term.
JJaammeess MM LLoonnggChairman 27th May 2009
JPMorgan Asian Investment Trust plc. Half Year Report & Accounts 2009 | 3

4 | JPMorgan Asian Investment Trust plc. Half Year Report & Accounts 2009
Market Review
The past six months provided little respite from the highly volatile stock marketconditions which had persisted throughout 2008. Asian markets continued to beimpacted by the global slowdown, with investor confidence taking further batteringsin the fallout from the Lehman Brothers bankruptcy, disappointing economic dataand poor corporate earnings announcements. Pleasingly, many governments wereaggressive in their response with interest rate cuts and large fiscal and monetarystimulus packages. By the end of the review period the results of these measureswere beginning to have some visible impact, with newsflow becoming “less bad”.
China proved to be the best performing market in the region over the six monthreporting period whilst Indonesia, Singapore and Thailand performed poorly due totheir high export exposure and reduced liquidity.
Performance
The Company delivered a total return on net assets (capital plus dividends re-invested) of -1.7% against the total return of our benchmark, the MSCI AC Asia exJapan Index in sterling terms, of –1.8%. A breakdown of how this performance wasachieved is given in the accompanying attribution table. Throughout the period wedid not employ any gearing and held, on average, 6% of the portfolio in cash. Thisdecision contributed approximately 2.3% to total return while asset allocation andstock selection detracted from performance by 0.1% and 1.8% respectively.
In terms of general stock selection, the biggest detractor from performance was theportfolio’s exposure to small to mid cap stocks. Our investments in IndoFood, UnitedTractors, China National Building Materials, China Hongxing Sports and DigitechSystems lost significant value, both on an absolute and relative basis. While this hasbeen painful, we will continue to invest in such stocks where we believe they willdeliver value and performance over a longer term period.
Our strategy to be overweight in China and Hong Kong yielded positive results,delivering in aggregate 110 basis points of relative out-performance. Whilst 2008was extremely difficult for China’s economy, its substantial firepower, illustrated byits 4 trillion renminbi fiscal stimulus package, reignited economic growth back on toan 8% rate and, at the same time, provided strong support to Hong Kong. At thestock level our positions in China Mobile, China Construction Bank, HuabaoInternational and selected property stocks contributed positively to relativeperformance.
In disappointing contrast, Taiwan was a big detractor from portfolio performance.We were wrong to underweight this market and also wrong to avoid the Taiwanesetechnology sector. This market rallied very strongly in the first quarter of 2009 onthe back of improved cross-strait relations with China, strong liquidity flows fromlocal investors and a significant increase in orders to replenish depleted globalinventories which benefited technology stocks. While the portfolio was underweighttechnology, we were able to generate positive returns from our position in AsiaCement which has significant operations in China. Similarly, the defensive nature ofChunghwa Telecom protected value during the sell-off in October 2008.
Investment Managers’ Report
Joshua Tay
Pauline Ng
Performance attribution for the six monthsto 31st March 2009
Contributions to Total Returns
Benchmark total return -1.8%Asset allocation -0.1%Stock selection -1.8%Currency effect -0.8%Gearing / cash 2.3%
Investment manager contribution -0.4%
Portfolio total return -2.2%Management fees/Other expenses -0.5%Residual* 1.0%
Other effects 0.5%
Net asset value total return -1.7%Impact of decrease/(increase)in discount 4.0%
Share price total return 2.3%
Source: Xamin/JPMAM and Fundamental Data. All figures are on a total return basis.
* The Residual arises principally from timing differences inthe treatment of income flows.
The Xamin attribution system accounts for income on areceived (on the xd date) basis whereas Fundamental Datacalculates the Company’s NAV Total Return using the actualdividend(s) paid by the Company (on the xd date).
A glossary of terms and definitions is provided on page 17.

Our bullish position on Singapore did not reward us. We took the view that countrieswith strong fiscal and corporate balance sheets, such as Singapore, would be arelatively safe haven at a time when banks globally were in turmoil. Whilst that wastrue, investors chose instead to focus on Singapore’s relatively high leverage toglobal trade and, as a result, it was the worst performing market in the Asia ex-Japanregion during the period. The main detractors to performance were our holdings ofKeppel Corp and City Development. Conversely CapitaLand, which we purchased at agood price at the end of 2008, and Wilmar International were both material positivecontributors to performance.
Market Outlook
At the time of writing, Asian markets are showing healthy returns year to date assentiment has shifted from ultra bearish to optimistic. We continue, however, toremain cautious and believe that the recent upturn represents no more than a bearmarket rally at this stage. High cash levels have exacerbated this rally as investorschase performance, but we would stress that, whilst credit markets have recentlyeased, concerns over the financial sector remain. Unemployment also continues torise and private sector spending is falling and, whilst valuations in Asia are stillrelatively inexpensive, significant pressure on corporate earnings remains, as doespolitical risk from protectionism and forthcoming elections.
China will again hold the key to Asian stock market performance. Weaker-than-expected Chinese growth in 2009 would come as a big shock to investors. ButChina’s healthy public debt/GDP ratio allows scope for more fiscal stimulus if neededwhile China is a clear beneficiary of lower commodity prices, unlike Latin America.The effects of the fiscal stimulus package are already visibly impacting domesticdemand and we believe that China will perform strongly relative to its BRIC rivalsand to the advanced economies.
Within the portfolio we remain overweight in China, India and Singapore andunderweight in Taiwan, Korea and Hong Kong.
JJoosshhuuaa TTaayyPPaauulliinnee NNgg
Investment Managers 27th May 2009
JPMorgan Asian Investment Trust plc. Half Year Report & Accounts 2009 | 5

6 | JPMorgan Asian Investment Trust plc. Half Year Report & Accounts 2009
at 31st March 2009
Ten Largest Investments
Valuation Portfolio Benchmark Active PositionCompany Country Sector £’000 %1 % %
China Life Insurance Hong Kong & China Financials 10,391 4.5 1.9 +2.6Samsung Electronics South Korea Information Technology 9,472 4.1 3.7 +0.4China Construction Bank Hong Kong & China Financials 8,971 3.9 2.1 +1.8Reliance Industries India Energy 7,520 3.2 1.5 +1.7China Shenhua Energy Hong Kong & China Energy 6,829 2.9 0.6 +2.3Olam Singapore Consumer Staples 6,654 2.9 0.1 +2.8KB Financial South Korea Financials 6,648 2.9 0.7 +2.2Hon Hai Precision Taiwan Information Technology 6,304 2.7 1.1 +1.6CNOOC Hong Kong & China Energy 6,086 2.6 1.3 +1.3Ping An Insurance Hong Kong & China Financials 6,050 2.6 0.6 +2.0
Total2 74,925 32.3 13.6 –
1Based on total assets less current liabilities of £232.0m.2As at 30th September 2008, the value of the ten largest investments amounted to £88.5m representing 36.6% of total assets less current liabilities.

JPMorgan Asian Investment Trust plc. Half Year Report & Accounts 2009 | 7
Portfolio Analyses
31st March 2009 30th September 2008Active Active
Portfolio Benchmark Position Portfolio Benchmark PositionSector %1 % % %1 % %
Financials 35.6 30.2 +5.4 25.1 30.6 –5.5Materials 10.7 6.8 +3.9 9.2 6.7 +2.5Information Technology 10.5 17.3 -6.8 6.5 16.4 –9.9Consumer Discretionary 10.3 5.9 +4.4 5.9 6.1 –0.2Industrials 9.9 11.2 -1.3 15.6 12.1 +3.5Energy 8.8 8.6 +0.2 6.8 9.2 -2.4Consumer Staples 6.7 4.4 +2.3 12.0 3.9 +8.1Telecommunication Services 3.6 10.0 -6.4 12.0 9.9 +2.1Utilities 1.2 5.1 -3.9 — 4.7 –4.7Healthcare — 0.5 -0.5 — 0.4 –0.4Net Current Assets 2.7 — +2.7 6.9 — +6.9
100.0 100.0 100.0 100.0
1Based on total assets less current liabilities of £232.0m (30th September 2008: £241.7m).
Sector Analysis
31st March 2009 30th September 2008Active Active
Portfolio Benchmark Position Portfolio Benchmark PositionSector %1 % % %1 % %
Hong Kong and China 44.7 39.7 +5.0 37.2 35.6 +1.6South Korea 14.4 19.2 -4.8 17.7 20.7 –3.0Singapore 12.7 6.3 +6.4 14.0 7.3 +6.7Taiwan 12.1 16.8 -4.7 6.2 16.2 –10.0India 7.1 9.1 -2.0 7.8 10.5 –2.7Indonesia 5.2 2.1 +3.1 9.5 2.6 +6.9Thailand 1.1 1.9 -0.8 — 2.2 –2.2Malaysia — 4.2 -4.2 0.7 4.0 –3.3Philippines — 0.7 -0.7 — 0.8 –0.8Pakistan — — — — 0.1 –0.1Net Current Assets 2.7 — +2.7 6.9 — +6.9
100.0 100.0 100.0 100.0
1Based on total assets less current liabilities of £232.0m (30th September 2008: £241.7m).
Geographical Analysis

8 | JPMorgan Asian Investment Trust plc. Half Year Report & Accounts 2009
Income Statementfor the six months ended 31st March 2009
(Unaudited) (Unaudited) (Audited)Six months ended Six months ended Year ended31st March 2009 31st March 2008 30th September 2008
Revenue Capital Total Revenue Capital Total Revenue Capital Total£’000 £’000 £’000 £’000 £’000 £’000 £’000 £’000 £’000
Losses frominvestments held at fair value through profit or loss — (9,617) (9,617) — (56,472) (56,472) — (137,354) (137,354)
Net foreign currency gains — 2,449 2,449 — 1,253 1,253 — 1,570 1,570Income from investments 1,696 — 1,696 1,877 — 1,877 6,658 — 6,658Other interest receivable and
similar income 49 — 49 397 — 397 622 — 622
Gross return/(loss) 1,745 (7,168) (5,423) 2,274 (55,219) (52,945) 7,280 (135,784) (128,504)Management fee (699) — (699) (1,163) — (1,163) (2,126) — (2,126)Performance fee
writeback — — — — 2,501 2,501 — 2,501 2,501Other administrative
expenses (650) — (650) (313) — (313) (732) — (732)
Net return/(loss) on ordinary activities before finance costs and taxation 396 (7,168) (6,772) 798 (52,718) (51,920) 4,422 (133,283) (128,861)
Finance costs (43) — (43) (803) — (803) (1,067) — (1,067)
Net return/(loss) on ordinaryactivities before taxation 353 (7,168) (6,815) (5) (52,718) (52,723) 3,355 (133,283) (129,928)
Taxation (186) — (186) (127) — (127) (618) (168) (786)
Net return/(loss) on ordinaryactivities after taxation 167 (7,168) (7,001) (132) (52,718) (52,850) 2,737 (133,451) (130,714)
Return/(loss) per share (note 4) 0.1p (4.5)p (4.4)p (0.1)p (32.9)p (33.0)p 1.7p (83.4)p (81.7)p
All revenue and capital items in the above statement derive from continuing operations. No operations were acquired or discontinued in the period.
The ‘Total’ column of this statement is the profit and loss account of the Company and the ‘Revenue’ and ‘Capital’ columns represent supplementary information prepared underguidance issued by the Association of Investment Companies. The Total column represents all the information that is required to be disclosed in a ‘Statement of Total RecognisedGains and Losses’ (‘STRGL’). For this reason a STRGL has not been presented.

JPMorgan Asian Investment Trust plc. Half Year Report & Accounts 2009 | 9
Reconciliation of Movements inShareholders’ FundsSix months ended 31st March 2009 Called up Exercised Capital (Unaudited) share Share warrant redemption Other Capital Revenue
capital premium reserve reserve reserve reserve reserve Total£’000 £’000 £’000 £’000 £’000 £’000 £’000 £’000
At 30th September 2008 40,002 4,347 977 3,009 106,481 83,633 3,163 241,612Net (loss)/return on ordinary activities — — — — — (7,168) 167 (7,001)Dividends appropriated in the period — — — — — — (2,720) (2,720)
At 31st March 2009 40,002 4,347 977 3,009 106,481 76,465 610 231,891
Six months ended 31st March 2008 Called up Exercised Capital (Unaudited) share Share warrant redemption Other Capital Revenue
capital premium reserve reserve reserve reserve reserve Total£’000 £’000 £’000 £’000 £’000 £’000 £’000 £’000
At 30th September 2007 40,002 4,347 977 3,009 106,481 217,084 2,506 374,406Net loss on ordinary activities – – – – – (52,718) (132) (52,850)Dividends appropriated in the period – – – – – – (2,080) (2,080)
At 31st March 2008 40,002 4,347 977 3,009 106,481 164,366 294 319,476
Year ended 30th September 2008 Called up Exercised Capital (Audited) share Share warrant redemption Other Capital Revenue
capital premium reserve reserve reserve reserve reserve Total£’000 £’000 £’000 £’000 £’000 £’000 £’000 £’000
At 30th September 2007 40,002 4,347 977 3,009 106,481 217,084 2,506 374,406Net (loss)/return on ordinary activities – – – – – (133,451) 2,737 (130,714)Dividends appropriated in the year – – – – – – (2,080) (2,080)
At 30th September 2008 40,002 4,347 977 3,009 106,481 83,633 3,163 241,612

10 | JPMorgan Asian Investment Trust plc. Half Year Report & Accounts 2009
(Unaudited) (Unaudited) (Audited)31st March 2009 31st March 2008 30th September 2008
£’000 £’000 £’000
Fixed assetsInvestments at fair value through profit or loss 225,607 308,556 225,104
Current assetsDebtors 6,437 612 681
Cash at bank and in hand 5,453 41,134 17,702
Derivative financial instruments 8 1 —
11,898 41,747 18,363
Creditors: amounts falling due within one year (5,543) (5,670) (1,823)
Net current assets 6,355 36,077 16,560
Total assets less current liabilities 231,962 344,633 241,664
Creditors: amounts falling due after more than one yearBank loans — (25,157) —
Provisions for liabilities and chargesDeferred tax (71) — (52)
Total net assets 231,891 319,476 241,612
Capital and reservesCalled up share capital 40,002 40,002 40,002
Share premium 4,347 4,347 4,347
Exercised warrant reserve 977 977 977
Capital redemption reserve 3,009 3,009 3,009
Other reserve 106,481 106,481 106,481
Capital reserve 76,465 164,366 83,633
Revenue reserve 610 294 3,163
Shareholders’ funds 231,891 319,476 241,612
Net asset value per share (note 5) 144.9p 199.7p 151.0p
Balance Sheet as at 31st March 2009

JPMorgan Asian Investment Trust plc. Half Year Report & Accounts 2009 | 11
(Unaudited) (Unaudited) (Audited)Six months ended Six months ended Year ended
31st March 2009 31st March 2008 30th September 2008£’000 £’000 £’000
Net cash inflow/(outflow) from operating activities (note 6) 229 (1,824) 1,802
Net cash outflow from return on investmentsand servicing of finance (43) (807) (1,118)
Net cash (outflow)/inflow from capital expenditure and financial investment (12,156) 40,089 38,180
Dividends paid (2,720) (2,080) (2,080)
Net cash outflow from financing — (16,393) (42,725)
(Decrease)/increase in cash for the period (14,690) 18,985 (5,941)
Reconciliation of net cash flow to movement in net funds/debtNet cash movement (14,690) 18,985 (5,941)
Loans repaid in the period — — 42,725
Exchange movements 2,441 1,866 1,570
Changes in net funds/debt arising from cash flows (12,249) 20,851 38,354
Net funds/(debt) at the beginning of the period 17,702 20,283 (20,652)
Net funds at the end of the period 5,453 41,134 17,702
Represented by:Cash at bank and in hand 5,453 41,134 17,702
Cash Flow Statementfor the six months ended 31st March 2009
12 | JPMorgan Asian Investment Trust plc. Half Year Report & Accounts 2009
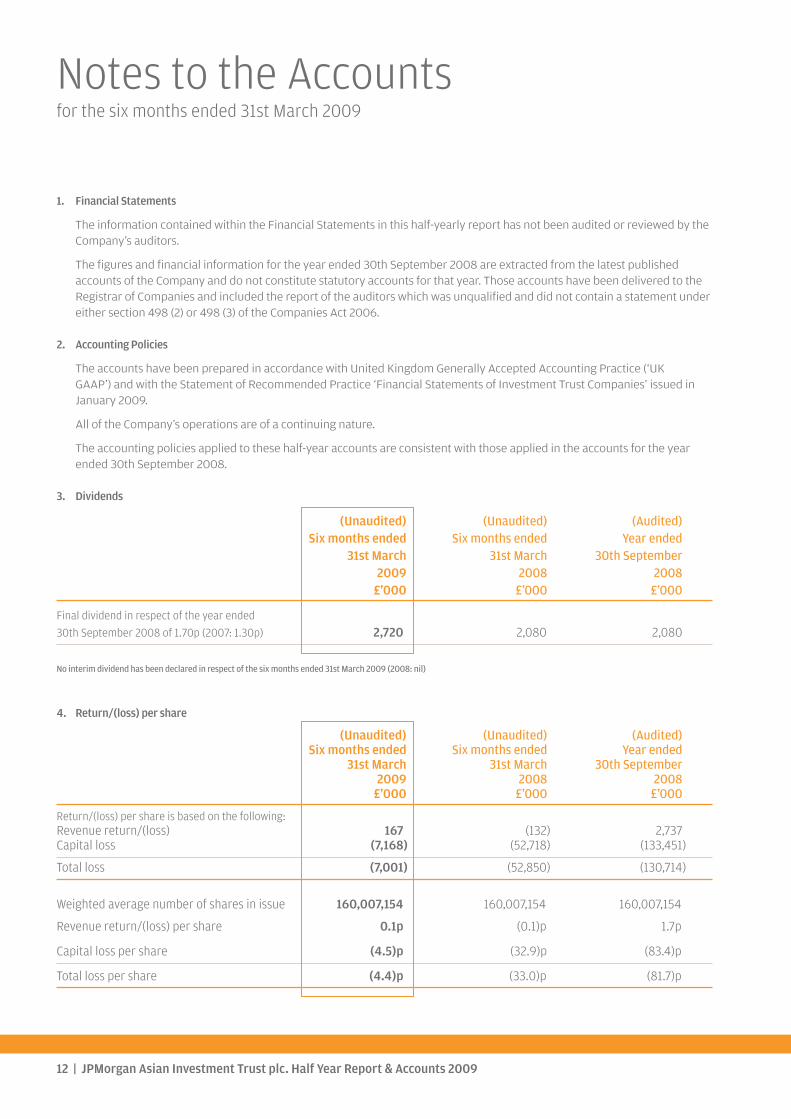
1. Financial Statements
The information contained within the Financial Statements in this half-yearly report has not been audited or reviewed by theCompany’s auditors.
The figures and financial information for the year ended 30th September 2008 are extracted from the latest publishedaccounts of the Company and do not constitute statutory accounts for that year. Those accounts have been delivered to theRegistrar of Companies and included the report of the auditors which was unqualified and did not contain a statement undereither section 498 (2) or 498 (3) of the Companies Act 2006.
2. Accounting Policies
The accounts have been prepared in accordance with United Kingdom Generally Accepted Accounting Practice (‘UKGAAP’) and with the Statement of Recommended Practice ‘Financial Statements of Investment Trust Companies’ issued inJanuary 2009.
All of the Company’s operations are of a continuing nature.
The accounting policies applied to these half-year accounts are consistent with those applied in the accounts for the yearended 30th September 2008.
3. Dividends
(Unaudited) (Unaudited) (Audited)Six months ended Six months ended Year ended
31st March 31st March 30th September2009 2008 2008
£’000 £’000 £’000
Final dividend in respect of the year ended 30th September 2008 of 1.70p (2007: 1.30p) 2,720 2,080 2,080
No interim dividend has been declared in respect of the six months ended 31st March 2009 (2008: nil)
4. Return/(loss) per share
(Unaudited) (Unaudited) (Audited)Six months ended Six months ended Year ended
31st March 31st March 30th September2009 2008 2008
£’000 £’000 £’000
Return/(loss) per share is based on the following:Revenue return/(loss) 167 (132) 2,737Capital loss (7,168) (52,718) (133,451)
Total loss (7,001) (52,850) (130,714)
Weighted average number of shares in issue 160,007,154 160,007,154 160,007,154
Revenue return/(loss) per share 0.1p (0.1)p 1.7p
Capital loss per share (4.5)p (32.9)p (83.4)p
Total loss per share (4.4)p (33.0)p (81.7)p
Notes to the Accountsfor the six months ended 31st March 2009

JPMorgan Asian Investment Trust plc. Half Year Report & Accounts 2009 | 13
5. Net asset value per share
Net asset value per share is based on the net assets attributable to Ordinary shareholders of £231,891,000 (31st March 2008:£319,476,000 and 30th September 2008: £241,612,000) and on the 160,007,154 (31st March 2008: 160,007,154 and 30thSeptember 2008: 160,007,154) shares in issue at the period end.
6. Reconciliation of net loss on ordinary activities before finance costs and taxation to net cash inflow/(outflow) from operating activities
(Unaudited) (Unaudited) (Audited)Six months ended Six months ended Year ended
31st March 31st March 30th September2009 2008 2008
£’000 £’000 £’000
Net loss on ordinary activities before finance costsand taxation (6,772) (51,920) (128,861)
Add back capital loss before finance costs and taxation 7,168 52,718 133,283
Scrip dividends received as income (6) (84) (166)
(Increase)/decrease in accrued income (207) (44) 301
(Increase)/decrease in other debtors (3) 76 4
Increase/(decrease) in accrued expenses 195 (51) 26
Overseas taxation (146) (127) (393)
Performance fee — (2,392) (2,392)
Net cash inflow/(outflow) from operating activities 229 (1,824) 1,802

14 | JPMorgan Asian Investment Trust plc. Half Year Report & Accounts 2009
Subscription Shares
On 4th February 2009 the Company issued Subscriptionshares as a bonus issue to the Ordinary shareholders on thebasis of one Subscription share for every five Ordinary sharesheld. Each Subscription share confers the right (but not theobligation) to subscribe for one Ordinary share on anybusiness day during the period from 1st April 2009 until 31stMarch 2014, after which the rights on the Subscription shareswill lapse.
For the purposes of UK taxation, the issue of Subscriptionshares is treated as a reorganisation of the Company’s sharecapital. Whereas such reorganisations do not trigger achargeable disposal for the purposes of the taxation of capitalgains, they do require shareholders to reallocate the basecosts of their Ordinary shares between Ordinary shares andSubscription shares received.
At the close of business on 5th February 2009 the middlemarket prices of the Company’s Ordinary shares andSubscription shares were as follows:
Ordinary shares: 127.5 pence
Subscription shares: 21.25 pence
Accordingly an individual investor who on 4th February 2009held five Ordinary shares (or a multiple thereof) would havereceived a bonus issue of one Subscription share (or therelevant multiple thereof) and would apportion the base costof such holding 96.77% to the five Ordinary shares and 3.23%to the Subscription shares.
Rollover ApportionmentsFor shareholders who rolled their investment in The Fleming Far Eastern Investment Trust plc into the Company, the CapitalGains Tax apportionments are shown below. The apportionment of the original base cost will depend upon which option underthe Fleming Far Eastern reconstruction scheme was chosen.
Option 1 All share option JPMorgan Asian Ordinary shares 0.95853JPMorgan Asian Warrants 0.04147
Option 2 Share and Japanese unit option JPMorgan Asian Ordinary shares 0.64066JPMorgan Asian Warrants 0.02772S&P Japanese Units 0.33162
Option 3 Share and cash option JPMorgan Asian Ordinary shares 0.25082JPMorgan Asian Warrants 0.01085S&P Cash Units 0.73833
The conversion prices of the Subscription shares are as follows:
If Subscription share rights are exercised on any day between and including 1 April 2009 and 31 March 2010, 137 pence.
If Subscription share rights are exercised on any day between and including 1 April 2010 and 31 March 2012, 176 pence.
If Subscription share rights are exercised on any day between and including 1 April 2012 and 31 March 2014, 203 pence.
Notice of the exercise of the Subscription share rights may be given at any time from 1st April 2009 until 31st March 2014 and theOrdinary shares arising on conversion will be issued within ten business days of the first business day of the calendar monthfollowing the month in which the relevant notices are received by the registrars. For further details on how to exercise theSubscription share rights please refer to the Company’s website at www.jpmasian.co.uk or contact the Company Secretary on020 7742 6000.

JPMorgan Asian Investment Trust plc. Half Year Report & Accounts 2009 | 15
Interim Management Report
The Company is required to make the following disclosures inits half year report:
Principal Risks and Uncertainties
The principal risks and uncertainties faced by the Company fallinto five broad categories: investment and strategy;accounting, legal and regulatory; corporate governance andshareholder relations; operational; and financial. Informationon each of these areas is given in the Business Review withinthe Annual Report and Accounts for the year ended30th September 2008.
During the market turmoil in the second half of 2008, JPMAMreacted with heightened management scrutiny ofcounterparty risk. In addition, reviews were initiated ofexposures, policies, procedures and legal arrangementsapplicable to the major sources of counterparty exposure.
Related Parties Transactions
During the first six months of the current financial year, notransactions with related parties have taken place which havematerially affected the financial position or the performanceof the Company during the period.
Directors’ Responsibilities
The Board of Directors confirms that, to the best of itsknowledge:
i) the condensed set of financial statements contained withinthe half yearly financial report has been prepared inaccordance with the Accounting Standards Board’sStatement ‘Half-Yearly Financial Reports’; and
ii) the interim management report includes a fair review ofthe information required by 4.2.7R and 4.2.8R of the UKListing Authority Disclosure and Transparency Rules.
For and on behalf of the Board
JJaammeess MM LLoonnggChairman 27th May 2009

16 | JPMorgan Asian Investment Trust plc. Half Year Report & Accounts 2009
Information about the Company
History
The Company was launched in September 1997 as a rollover vehiclefor shareholders in The Fleming Far Eastern Investment Trust plc.The Company adopted its present name following approval fromshareholders at the Annual General Meeting in February 2006.
Directors
James M Long TD (Chairman)Alun Evans CMGRonald GouldAndrew Sykes
Company Numbers
Company’s registration number: 3374850
Ordinary shares
London Stock Exchange Sedol number: 0132077ISIN: GB0001320778Bloomberg Code: JAI.LN
Subscription shares
London Stock Exchange Sedol number: B3KHYY3ISIN: GB00B3KHYY38Bloomberg Code: JAIS.LN
Market Information
The Company’s Ordinary and Subscription shares are listed on theLondon Stock Exchange. The market price of the Ordinary shares isshown daily in the Financial Times, The Times, The Daily Telegraph,The Scotsman and The Independent. The market price of theSubscription shares is listed in the Financial Times. The Share priceof both the Ordinary and Subscription shares are on the JPMorganinternet site at www.jpmasian.co.uk where the prices are updatedevery fifteen minutes during trading hours.
Website
www.jpmasian.co.uk
Share Transactions
The Company’s shares may be dealt in directly through astockbroker or through a professional adviser acting on aninvestor’s behalf. They may also be purchased and held through theJPMorgan Investment Trust Share Plan, Individual Savings Account(ISA) and the Pension Account.
Manager and Secretary
JPMorgan Asset Management (UK) Limited.
Company’s Registered Office
Finsbury Dials20 Finsbury StreetLondon EC2Y 9AQTelephone number: 020 7742 6000
For company secretarial and administrative matters pleasecontact Alison Vincent.
Registrars
EquinitiReference 1357Aspect HouseSpencer RoadLancingWest Sussex BN99 6DATelephone number: 0871 384 2373
Notifications of changes of address and enquiries regarding sharecertificates or dividend cheques should be made in writing to theRegistrar.
Registered shareholders can obtain further details on their holdingson the internet by visiting www.shareview.co.uk
Auditors
PricewaterhouseCoopers LLPHay’s Galleria1 Hay’s LaneLondon SE1 2RD
Brokers
Cenkos Securities plc6, 7, 8 Tokenhouse YardLondon EC2R 7AS
Savings Products Administrators
For queries on the JPMorgan ISA, Share Plan or Pension Account,see contact details on the back cover of this report.
Financial CalendarFinancial year end 30th September
Final results announced November
Half year end 31st March
Half year results announced May
Interim Management Statement announced February and July
Dividend on Ordinary shares paid (if any) February
Annual General Meeting February

JPMorgan Asian Investment Trust plc. Half Year Report & Accounts 2009 | 17
Glossary of Terms
Total return to shareholders
Total return to the investor, on a mid-market price to mid-market price basis, assuming that all dividends received byshareholders were reinvested in the shares of the Companyat the time the shares were quoted ex-dividend. Transactioncosts of reinvestment are not taken into account.
Total return on net assets
Total return on net asset value (‘NAV’) per share, on a bidvalue to bid value basis, assuming that all dividends paid outby the Company were reinvested in the shares of theCompany at the NAV per share at the time the shares werequoted ex-dividend. Transaction costs of reinvestment arenot taken into account.
Benchmark total return
Total return on the benchmark, on a mid-market value tomid-market value basis, assuming that all dividends received(net of tax) were reinvested in the shares of the underlyingcompanies at the time the shares were quoted ex-dividend.
The benchmark is a recognised index of stocks which shouldnot be taken as wholly representative of the Company’sinvestment universe. The Company’s investment strategydoes not follow or “track” this index and consequently, theremay be some divergence between the Company’sperformance and that of the stated benchmark index.
Discount/premium
If the share price of an investment company is lower thanthe NAV per share, the trust is said to be trading at adiscount. The discount is shown as a percentage of the NAV.The opposite of a discount is a premium. It is more commonfor an investment company to trade at a discount than apremium.
Active position
The active position shows the difference between theCompany’s holding of an individual stock, sector or countrycompared with that stock, sector or country’s weighting inthe Company’s benchmark index. A positive numberindicates an active decision by the investment manager toown more (i.e. be overweight) of a particular stock, sector orcountry versus the benchmark and a negative numberindicates a decision to hold less (i.e. be underweight) of aparticular stock, sector or country versus the benchmark.
Performance attribution definitions:
Asset allocation
Measures the impact of allocating assets differently fromthose in the benchmark, via the portfolio’s weighting indifferent countries, sectors or asset types.
Stock selection
Measures the effect of investing in securities to a greater orlesser extent than their weighting in the benchmark, or ofinvesting in securities outside the benchmark.
Gearing/cash
Measures the impact on returns of borrowings or cashbalances on the Company’s relative performance.
Currency
Measures the impact of currency exposure differencesbetween the Company’s portfolio and its benchmark.
Management fees/other expenses
The payment of fees and expenses reduces the level of totalassets and therefore has a negative effect on relativeperformance.

18 | JPMorgan Asian Investment Trust plc. Half Year Report & Accounts 2009

JPMorgan HelplineFreephone 0800 20 40 20 or 0207 742 99999.00 am to 5.30 pm Monday to Friday
JPMorgan Pension HelplineFreephone 0800 41 31 76 or 0172 241 48889.00 am to 5.00 pm Monday to FridayPlease use this number if you have any queries relating to the Pension Account.
Your telephone call may be recorded for your security
www.jpmasian.co.uk