Embed Size (px)
Citation preview

HALF YEAR RESULTS 2013

A dAgenda
1 Philip Rogerson Chairman: Welcome1. Philip Rogerson, Chairman: Welcome
2 Brian May FD: Financial Results2. Brian May, FD: Financial Results
3. Michael Roney, CEO: Business Review
4. Q&A
2013 Half Year Results Presentation-1-

Hi hli htHighlights
Excellent set of results
Consistent and proven
t t
Six acquisitions to
d tof results strategy date
Adjusted earnings per Dividend up
14%g pshare up 10%* 14%
2013 Half Year Results Presentation
*At constant exchange, before intangible amortisation and acquisition related costs
-2-

A dAgenda
1 Philip Rogerson Chairman: Welcome1. Philip Rogerson, Chairman: Welcome
2 Brian May FD: Financial Results2. Brian May, FD: Financial Results
3 Michael Roney CEO: Business Review3. Michael Roney, CEO: Business Review
4. Q&A
2013 Half Year Results Presentation-3-
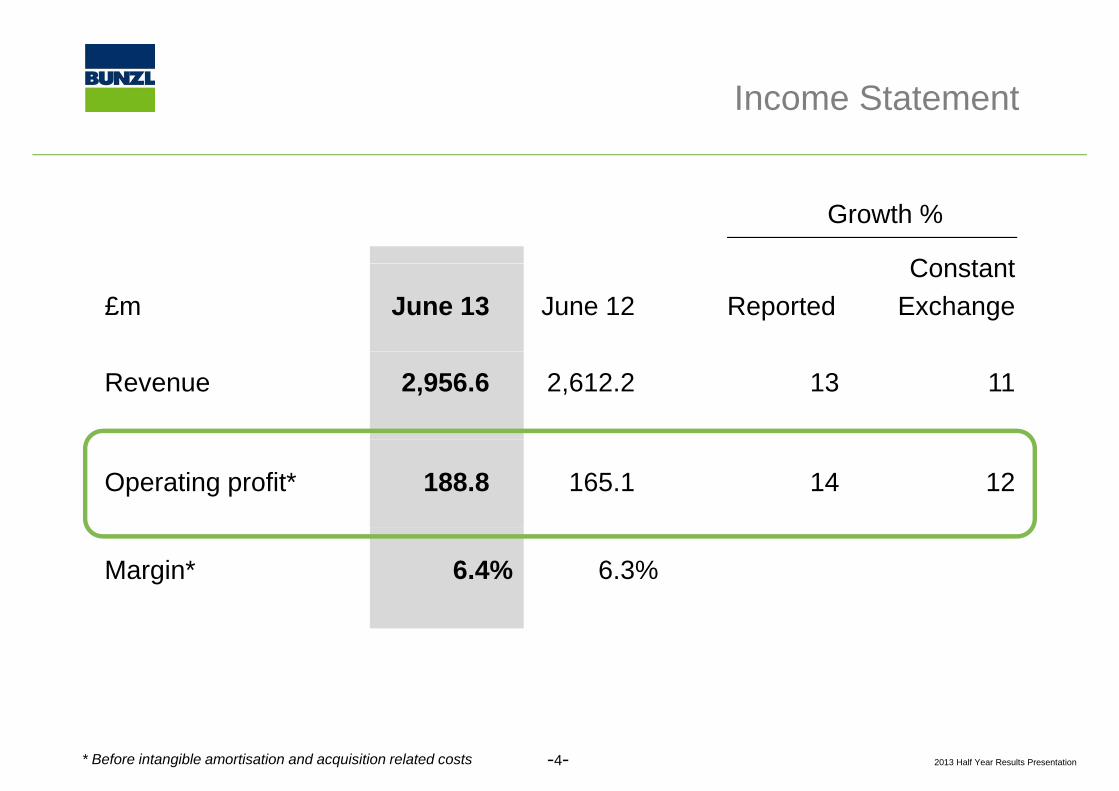
I St t tIncome Statement
Constant
Growth %
£m June 13% June 12% ReportedConstant
Exchange
Revenue 2,956.6% 2,612.2% 13 11
Operating profit* 188.8% 165.1% 14 12
Margin* 6.4% 6.3%
2013 Half Year Results Presentation* Before intangible amortisation and acquisition related costs -4-
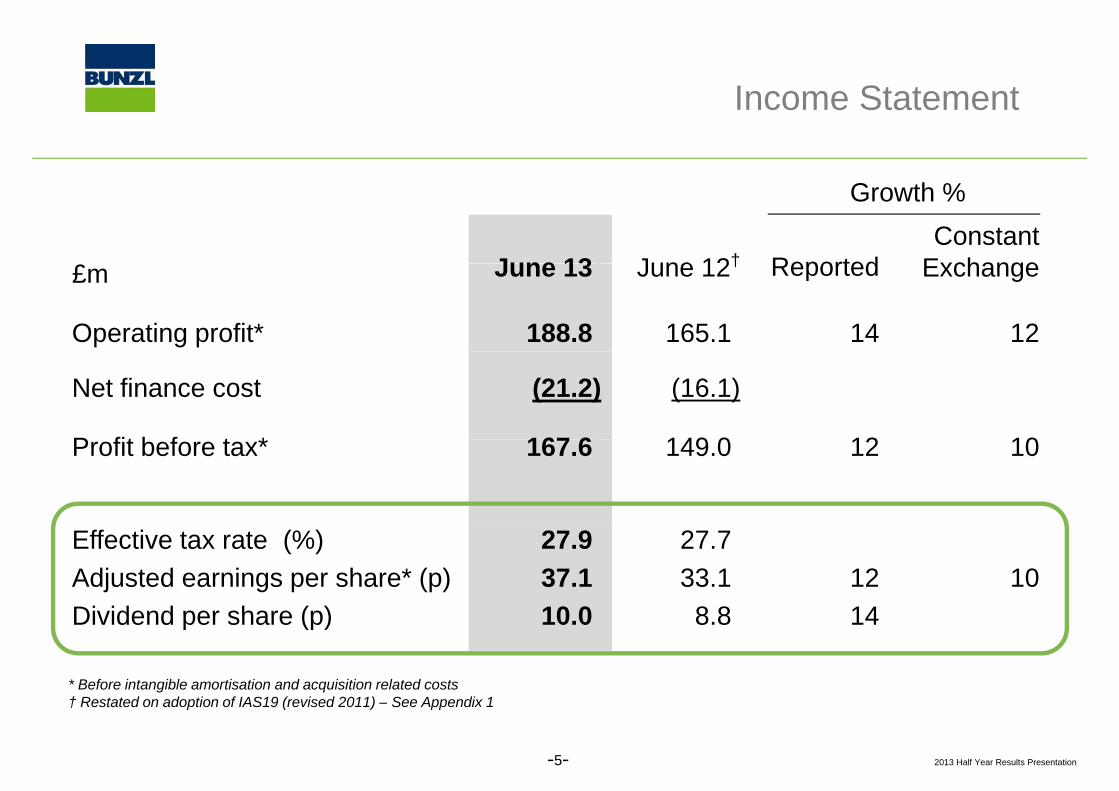
I St t tIncome Statement
June 13) June 12† ReportedConstant
Exchange
Growth %
£m June 13) June 12† Reported Exchange
Operating profit* 188.8) 165.1) 14 12
Net finance cost (21.2) (16.1)
P fit b f t * 167 6) 149 0) 12 10Profit before tax* 167.6)
)
149.0))
12 10
Effective tax rate (%)Adjusted earnings per share* (p)Dividend per share (p)
27.9)37.1)10 0)
27.7)33.1)8 8)
1214
10Dividend per share (p) 10.0) 8.8) 14
* Before intangible amortisation and acquisition related costs† Restated on adoption of IAS19 (revised 2011) – See Appendix 1
2013 Half Year Results Presentation
† Restated on adoption of IAS19 (revised 2011) – See Appendix 1
-5-
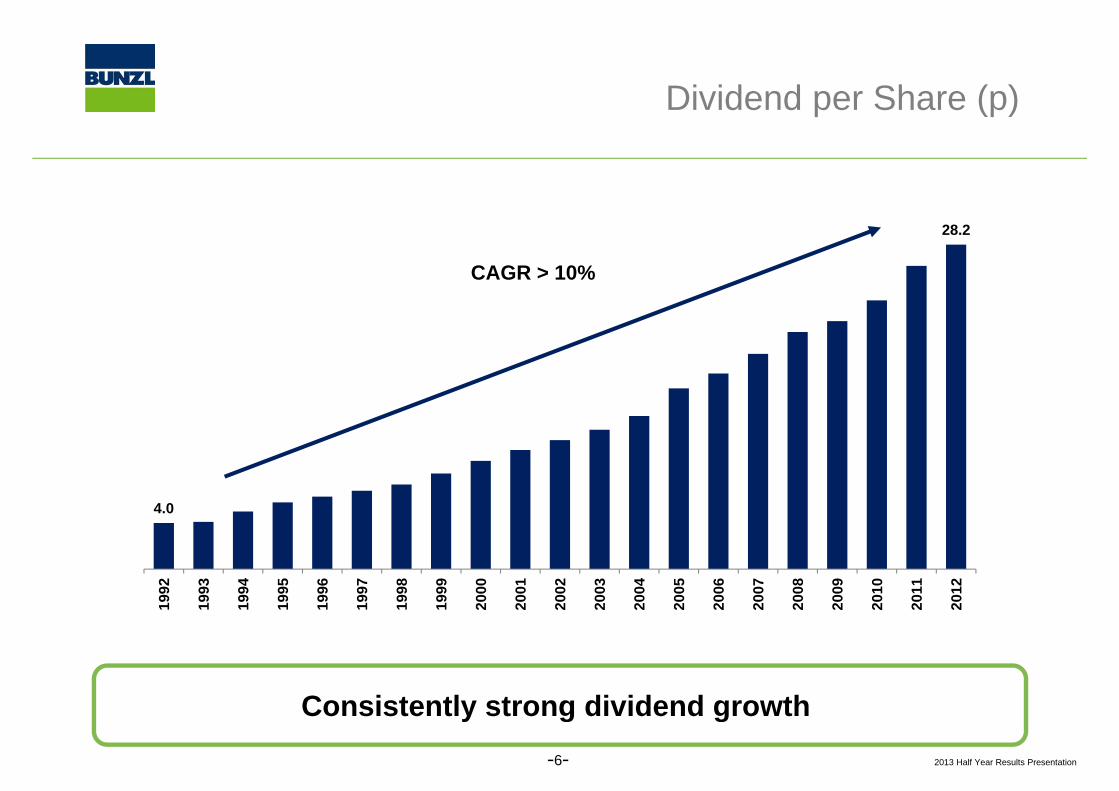
Di id d Sh ( )Dividend per Share (p)
28.2
CAGR > 10%
4.0
1992
1993
1994
1995
1996
1997
1998
1999
2000
2001
2002
2003
2004
2005
2006
2007
2008
2009
2010
2011
2012
Consistently strong dividend growth2013 Half Year Results Presentation-6-
Consistently strong dividend growth
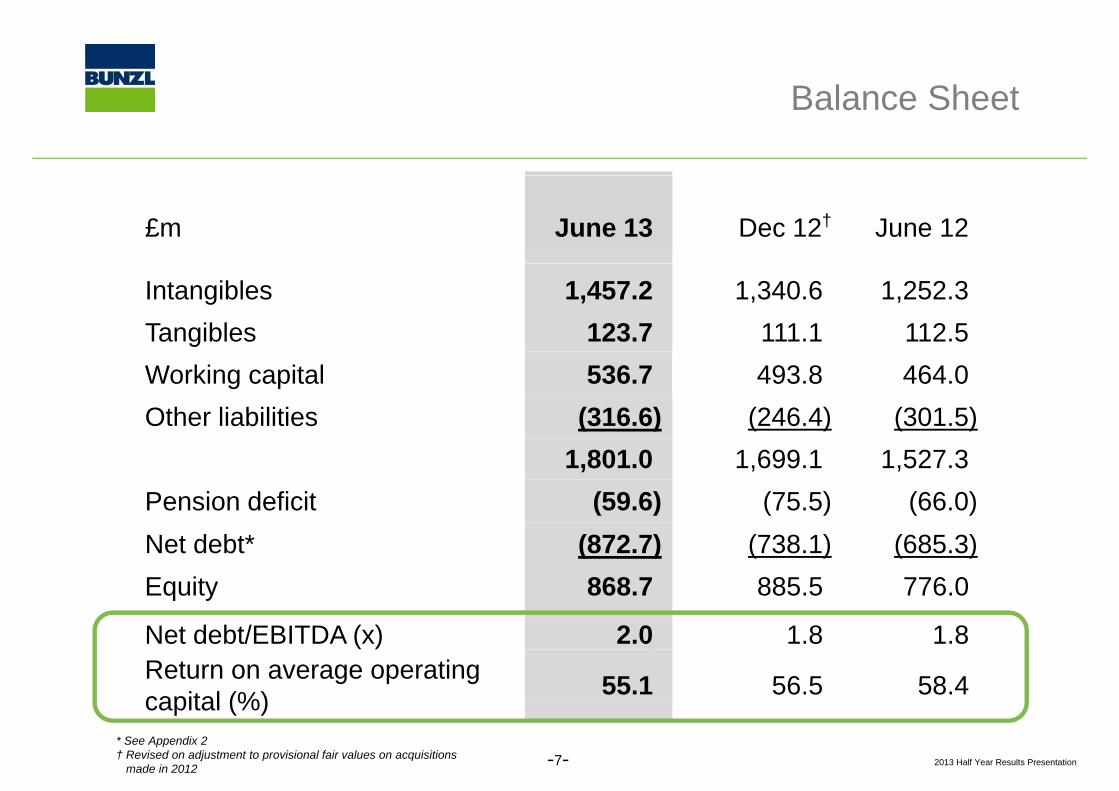
B l Sh tBalance Sheet
£m June 13) Dec 12† June 12)
Intangibles 1,457.2) 1,340.6) 1,252.3)Tangibles 123.7) 111.1) 112.5)Working capital 536.7) 493.8) 464.0)Other liabilities (316.6) (246.4) (301.5)
1,801.0) 1,699.1) 1,527.3)Pension deficit (59.6) (75.5) (66.0)Net debt* (872.7) (738.1) (685.3)Equity 868.7) 885.5) 776.0)
Net debt/EBITDA (x) 2.0) 1.8) 1.8)Return on average operating capital (%) 55.1) 56.5) 58.4)
2013 Half Year Results Presentation
capital (%)* See Appendix 2† Revised on adjustment to provisional fair values on acquisitions
made in 2012 -7-

C h FlCash Flow
£m June 13)% June 12)%
Operating cash flow* 193 9)% 122 3)%Operating cash flow 193.9)% 122.3)%
Interest (17.1)% (15.3)%
T (37 9)% (29 8)%Tax (37.9)% (29.8)%
Free cash flow 138.9)% 77.2)%
Dividends (28.8)% (26.1)%
Acquisitions (150.0)% (77.2)%
Employee share schemes (54.5)% (15.5)%
Net cash flow (94.4)% (41.6)%
Operating cash flow* to operating profit† 103%) 74%)* See Appendix 3
2013 Half Year Results Presentation
See Appendix 3† Before intangible amortisation and acquisition related costs
-8-
Fi i l SFinancial Summary
• Revenue growth 11%†Revenue growth 11%
• Operating profit* up 12%†
• Operating margin* up 10 bp
Adj t d EPS* th 10%†• Adjusted EPS* growth 10%†
• Cash conversion at 103%, all business areas >100%,
• Dividend per share increases 14%
2013 Half Year Results Presentation
† At constant exchange rates * Before intangible amortisation and acquisition related costs -9-

A dAgenda
1 Philip Rogerson Chairman: Welcome1. Philip Rogerson, Chairman: Welcome
2 Brian May FD: Financial Results2. Brian May, FD: Financial Results
3. Michael Roney, CEO: Business Review3. Michael Roney, CEO: Business Review
4. Q&A4. Q&A
2013 Half Year Results Presentation-10-
B i R iBusiness Review
1. Operations Review
2. Strategy
3 Market Developments3. Market Developments
4. Prospectsp
2013 Half Year Results Presentation-11-

O iOverview
Consistent and proven strategy
• Organic growth• High quality acquisitionsg q y q• Cost reduction and efficiency initiatives
Excellent overall performance
• North America – strong growth led by acquisitions• Continental Europe – good progress in a tough economic environmentp g p g g• UK & Ireland – operating profit* up 8% / ROACE 93%• Rest of the World – 48%† growth in operating profit*
2013 Half Year Results Presentation-12-* Before intangible amortisation and acquisition related costs† At constant exchange rates
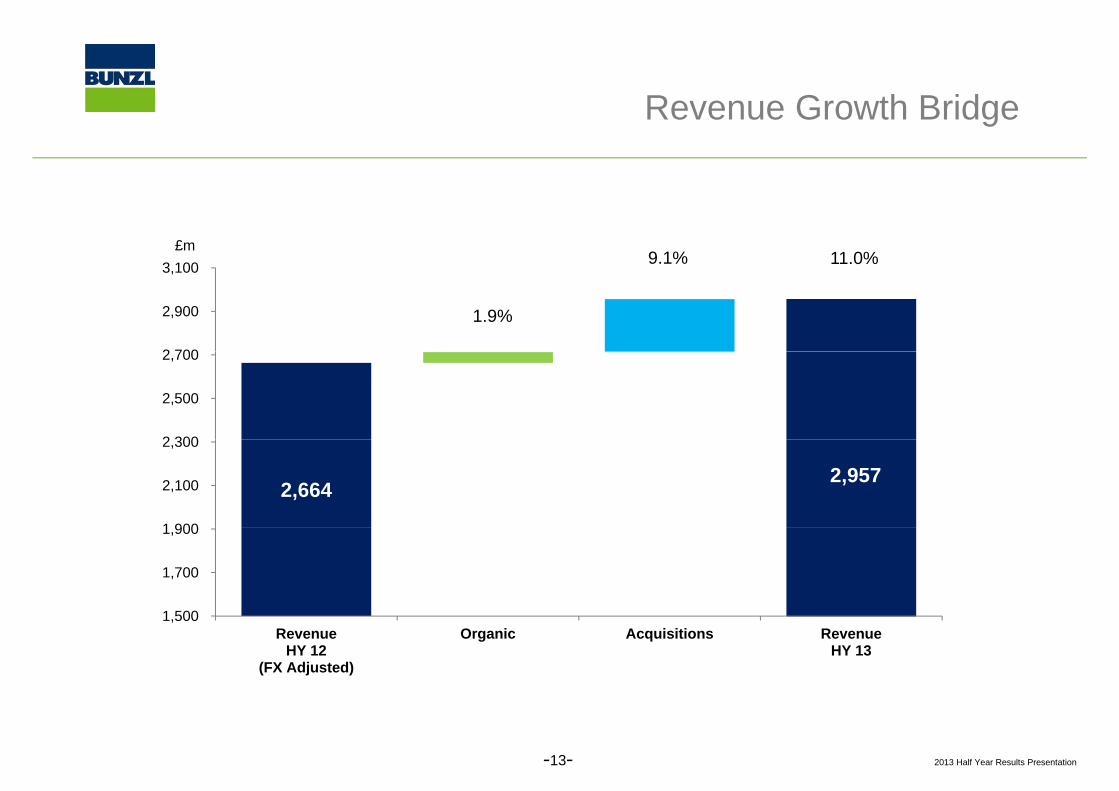
Revenue Growth Bridge
9.1% 11.0%3 100£m
1.9%
9.1% 11.0%
2 700
2,900
3,100
4,704 4,8302 300
2,500
2,700
2,664 2,957
1 900
2,100
2,300
1 500
1,700
1,900
1,500 Revenue
HY 12(FX Adjusted)
Organic Acquisitions Revenue HY 13
2013 Half Year Results Presentation-13-
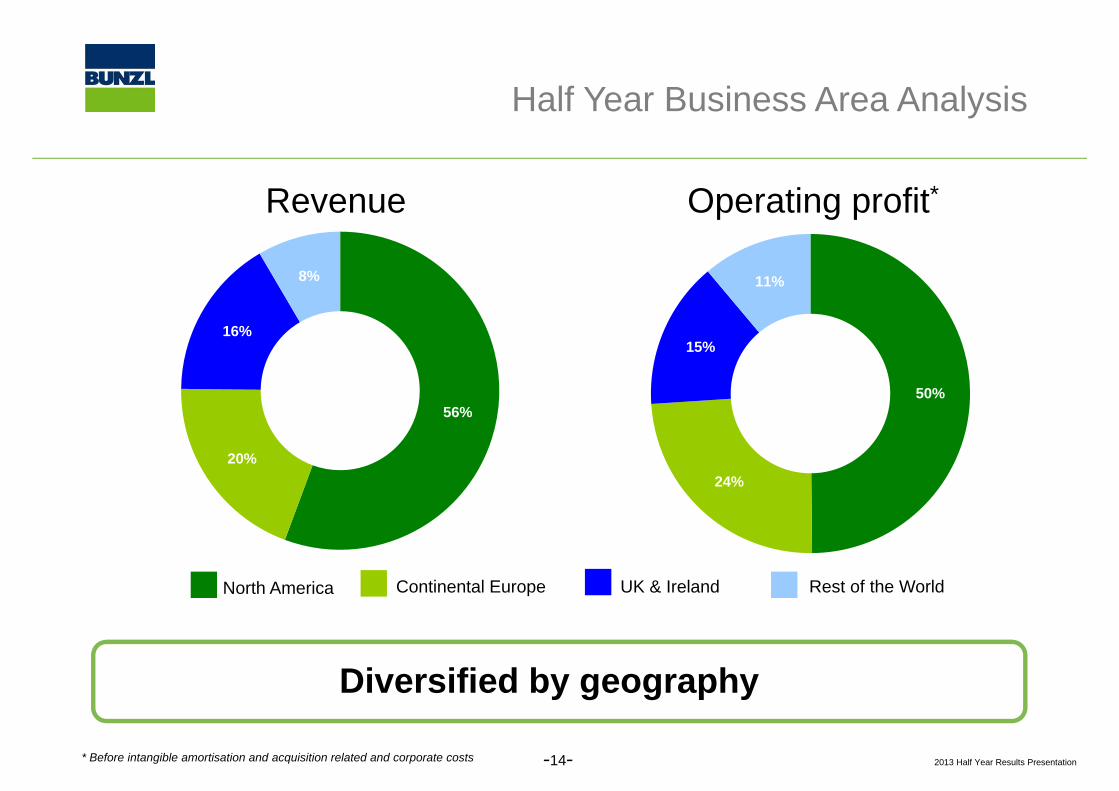
H lf Y B i A A l iHalf Year Business Area Analysis
Revenue Operating profit*
16%
8%
15%
11%
56%50%
15%
20%24%
North America Continental Europe Rest of the WorldUK & Ireland
Diversified by geography
2013 Half Year Results Presentation* Before intangible amortisation and acquisition related and corporate costs -14-
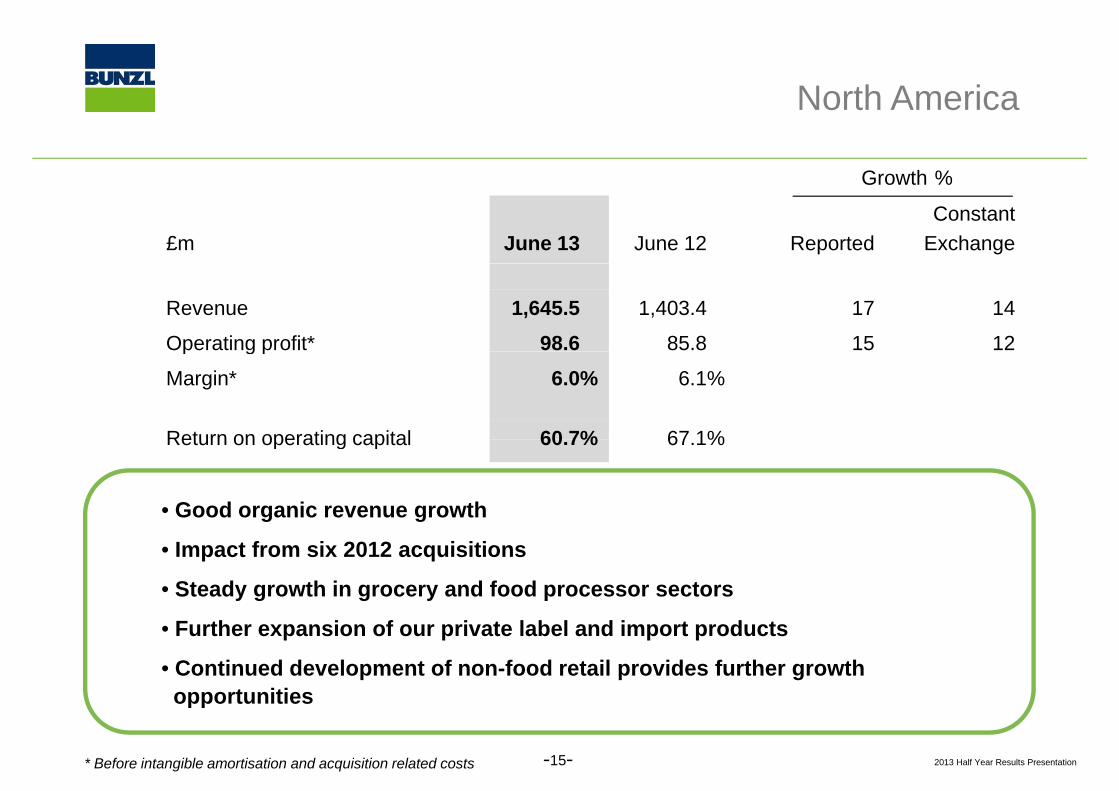
N th A iNorth America
Growth %
£m June 13% June 12% ReportedConstant
Exchange
Growth %
Revenue 1,645.5% 1,403.4% 17 14
Operating profit* 98.6% 85.8% 15 12p g p
Margin* 6.0% 6.1%
Return on operating capital 60 7% 67 1%Return on operating capital 60.7% 67.1%
• Good organic revenue growth
• Impact from six 2012 acquisitions
• Steady growth in grocery and food processor sectors
• Further expansion of our private label and import products
• Continued development of non-food retail provides further growthopportunities
2013 Half Year Results Presentation
opportunities
* Before intangible amortisation and acquisition related costs -15-
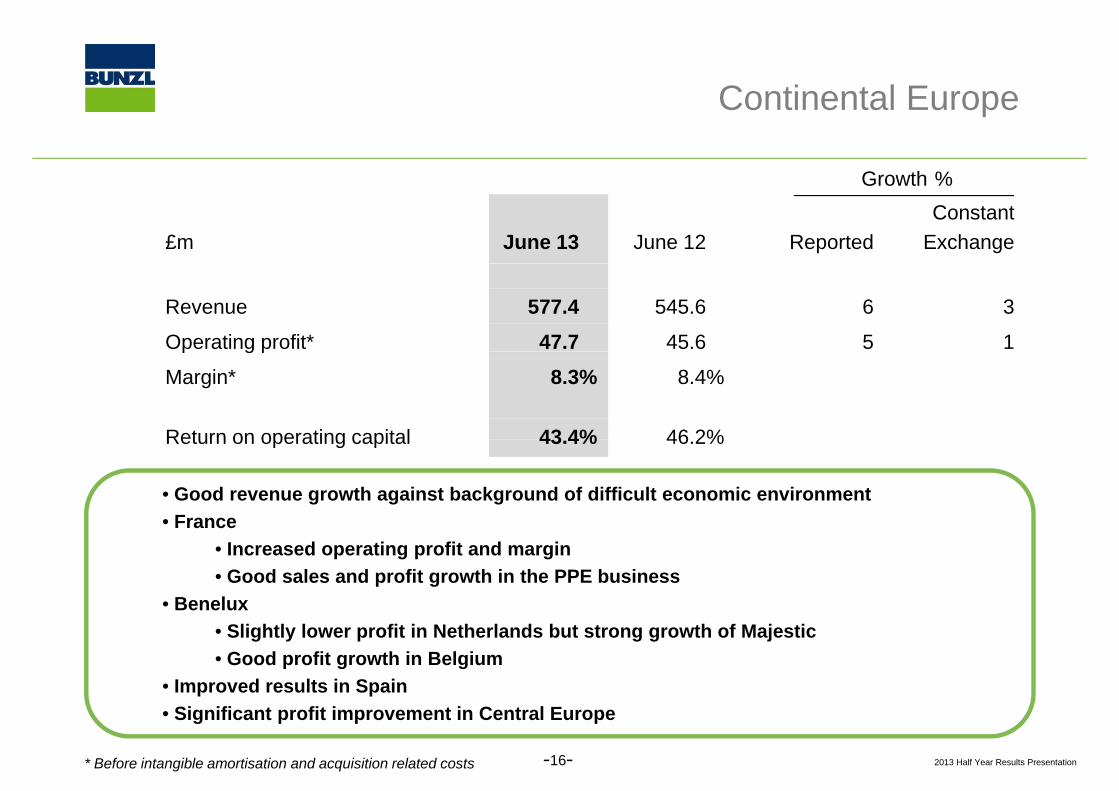
C ti t l EContinental Europe
Growth %
£m June 13% June 12% ReportedConstant
Exchange
Growth %
Revenue 577.4% 545.6% 6 3
Operating profit* 47.7% 45.6% 5 1p g p
Margin* 8.3% 8.4%
Return on operating capital 43 4% 46 2%Return on operating capital 43.4% 46.2%
• Good revenue growth against background of difficult economic environment• FranceFrance
• Increased operating profit and margin• Good sales and profit growth in the PPE business
• Benelux• Slightly lower profit in Netherlands but strong growth of Majestic• Good profit growth in Belgium
• Improved results in Spain
2013 Half Year Results Presentation* Before intangible amortisation and acquisition related costs
• Significant profit improvement in Central Europe
-16-
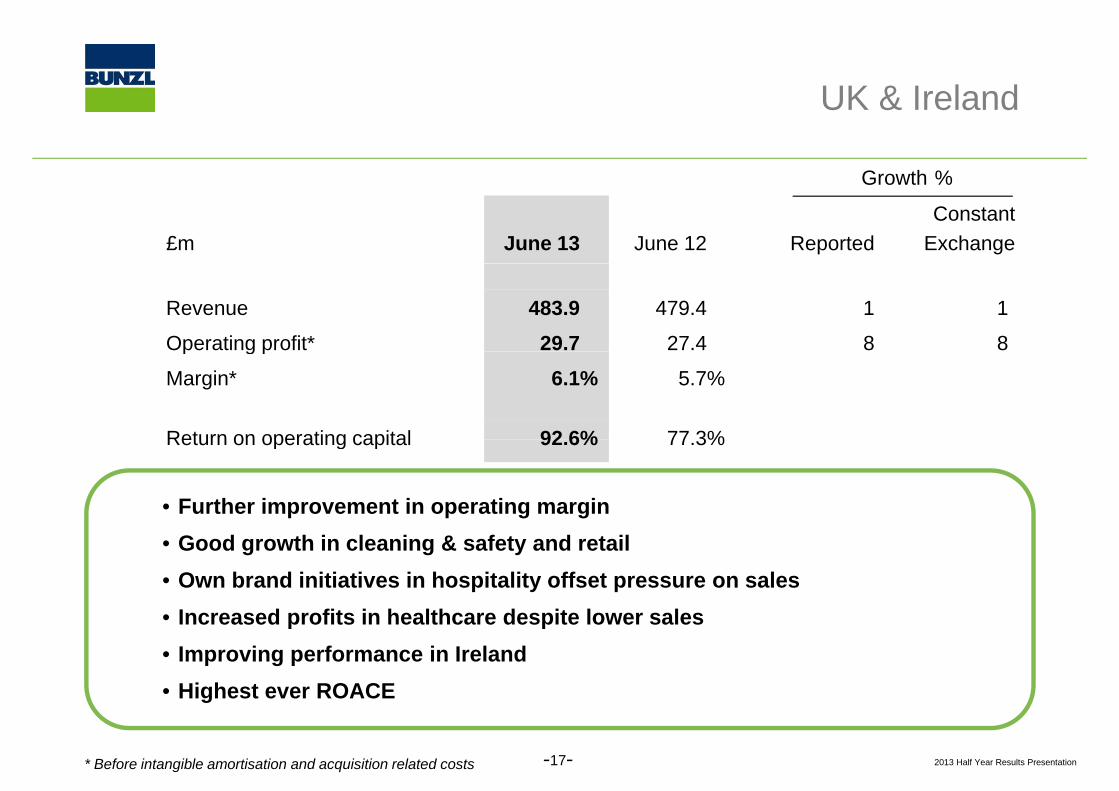
UK & I l dUK & Ireland
Growth %
£m June 13% June 12% ReportedConstant
Exchange
Growth %
Revenue 483.9% 479.4% 1 1)
Operating profit* 29.7% 27.4% 8 8)p g p )
Margin* 6.1% 5.7%
Return on operating capital 92 6% 77 3%Return on operating capital 92.6% 77.3%
• Further improvement in operating margin• Good growth in cleaning & safety and retail• Own brand initiatives in hospitality offset pressure on sales• Increased profits in healthcare despite lower sales• Increased profits in healthcare despite lower sales• Improving performance in Ireland• Highest ever ROACE
2013 Half Year Results Presentation
g
* Before intangible amortisation and acquisition related costs -17-
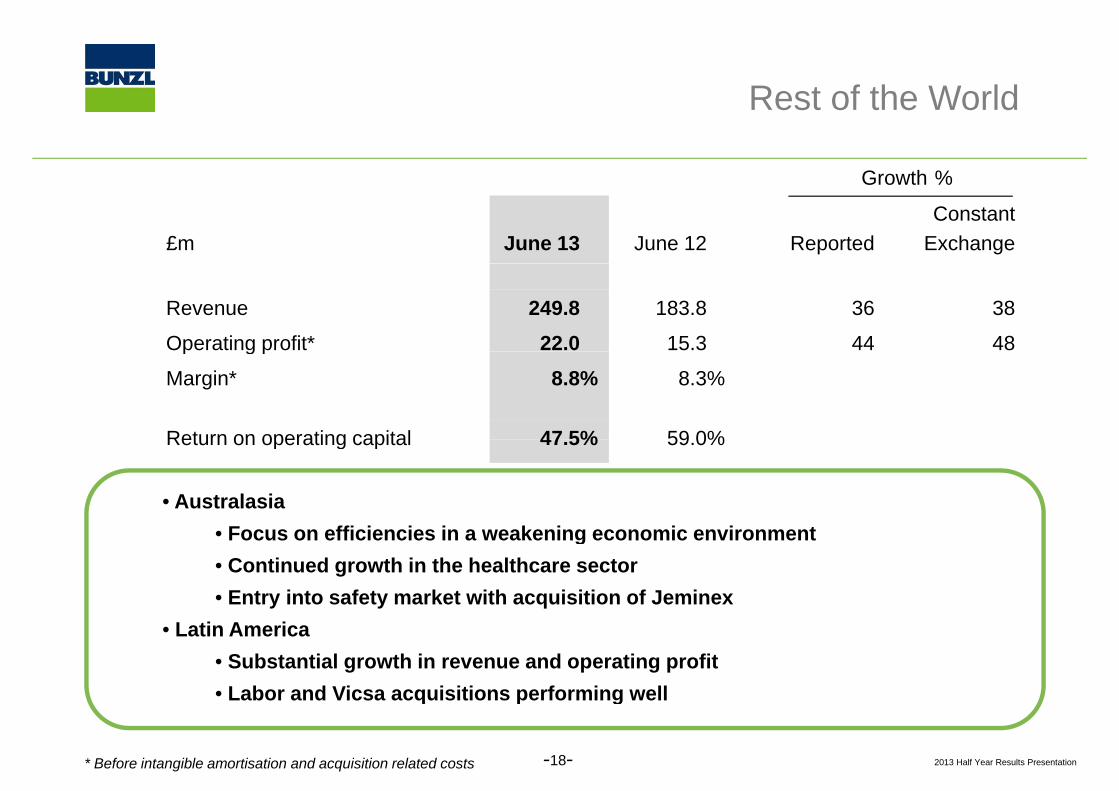
R t f th W ldRest of the World
Growth %
£m June 13% June 12% ReportedConstant
Exchange
Growth %
Revenue 249.8% 183.8% 36 38
Operating profit* 22.0% 15.3% 44 48p g p
Margin* 8.8% 8.3%
Return on operating capital 47 5% 59 0%Return on operating capital 47.5% 59.0%
• AustralasiaF ffi i i i k i i i t• Focus on efficiencies in a weakening economic environment
• Continued growth in the healthcare sector • Entry into safety market with acquisition of Jeminex
• Latin America• Substantial growth in revenue and operating profit• Labor and Vicsa acquisitions performing well
2013 Half Year Results Presentation
q p g
* Before intangible amortisation and acquisition related costs -18-
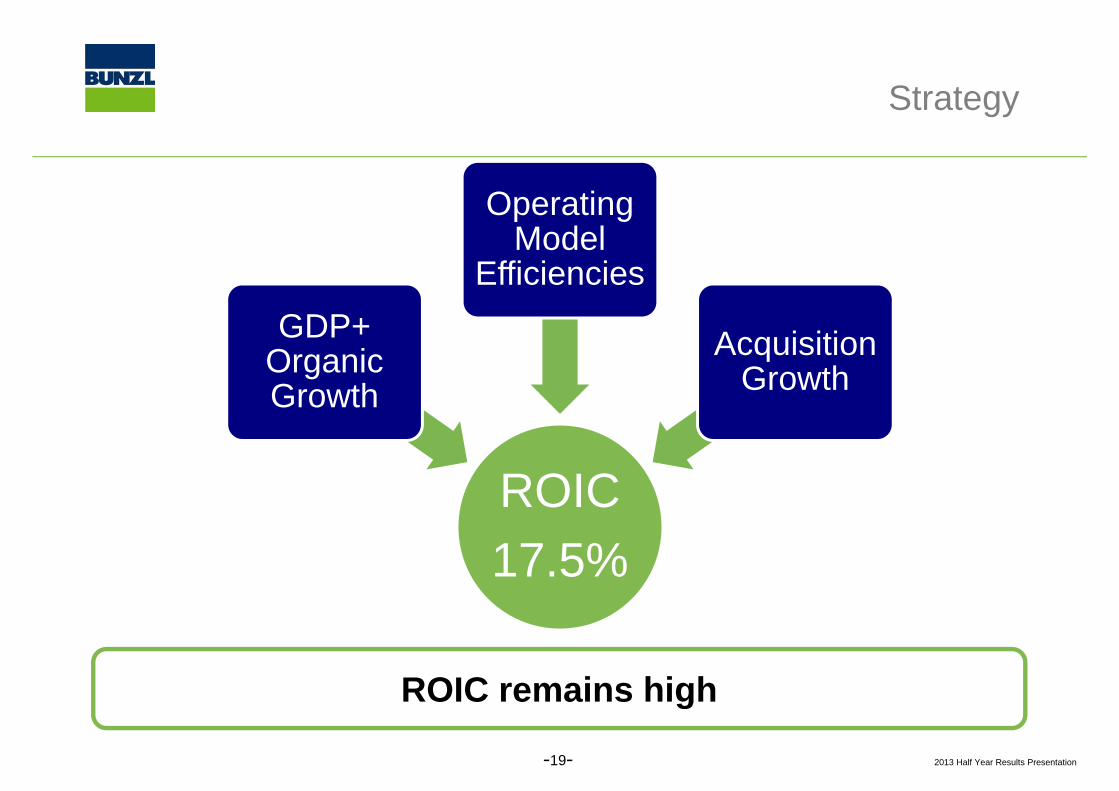
St tStrategy
Operating Model
Effi i iGDP+
O i
Efficiencies
AcquisitionOrganic Growth
Acquisition Growth
Acquisition GrowthROIC17.5%
ROIC remains high
2013 Half Year Results Presentation
g
-19-
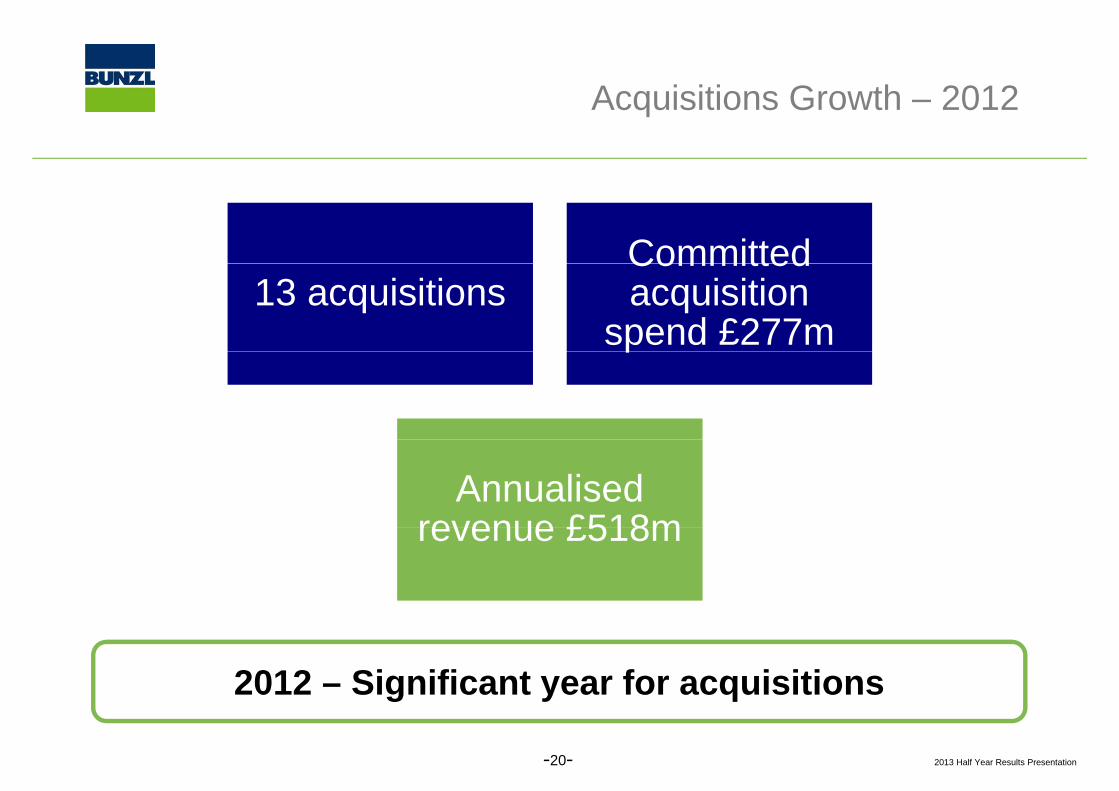
A i iti G th 2012Acquisitions Growth – 2012
Committed13 acquisitions
Committed acquisition
spend £277mp
Annualised revenue £518mrevenue £518m
2012 – Significant year for acquisitions
2013 Half Year Results Presentation-20-

A i iti G th 2013 tdAcquisition Growth – 2013 ytd
Business Acquired† Country Sector Revenue*
McNeil January† Australia Healthcare £11m
Labor March† Brazil Healthcare £16m
MDA March† UK Non-food retail £23m
Jeminex April† Australia Safety £104m
TFS July† UK Non-food retail £8m
Espomega August† Mexico Safety £28m
Strong period for acquisitions
Espomega August Mexico Safety £28m
2013 Half Year Results Presentation* Annualised and converted at average exchange rates† Completion due to take place at the end of August 2013
Strong period for acquisitions-21-
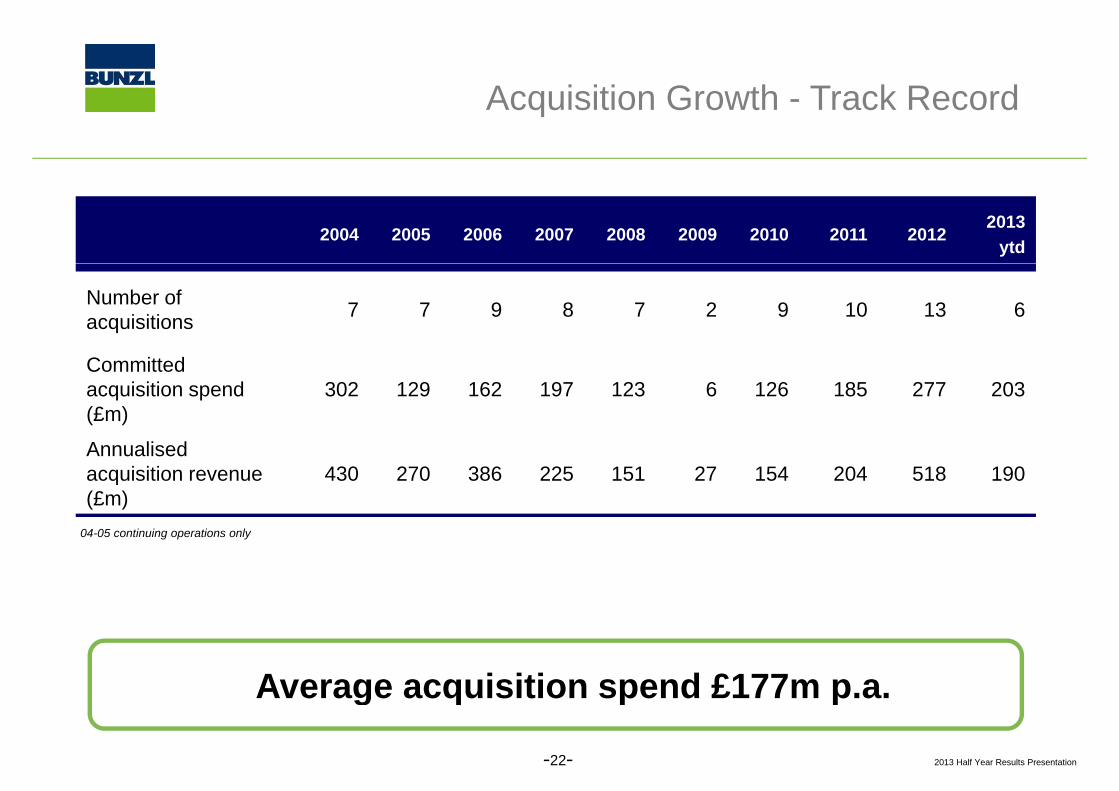
A i iti G th T k R dAcquisition Growth - Track Record
2004 2005 2006 2007 2008 2009 2010 2011 20122013
ytd
Number of acquisitions 7 7 9 8 7 2 9 10 13 6
Committed acquisition spend (£m)
302 129 162 197 123 6 126 185 277 203
Annualised acquisition revenue (£m)
430 270 386 225 151 27 154 204 518 190
04-05 continuing operations only
Average acquisition spend £177m p.a.
2013 Half Year Results Presentation
g q p p
-22-

A li d A i iti RAnnualised Acquisition Revenue
£m 2004 2005 2006 2007 2008 2009 2010 2011 2012 2013ytd
North America 115 198 103 15 - - 35 7 410 -
Continental Europe 301 61 7 100 52 - 115 96 23 -Continental Europe 301 61 7 100 52 - 115 96 23 -
UK & Ireland - 2 267 110 39 27 - 39 16 31
Rest of the World 14 9 9 - 60 - 4 62 69 159
Group 430 270 386 225 151 27 154 204 518 190
04-05 continuing operations only
Leading spend in year
Acquisitions across all business areas
2013 Half Year Results Presentation
q
-23-
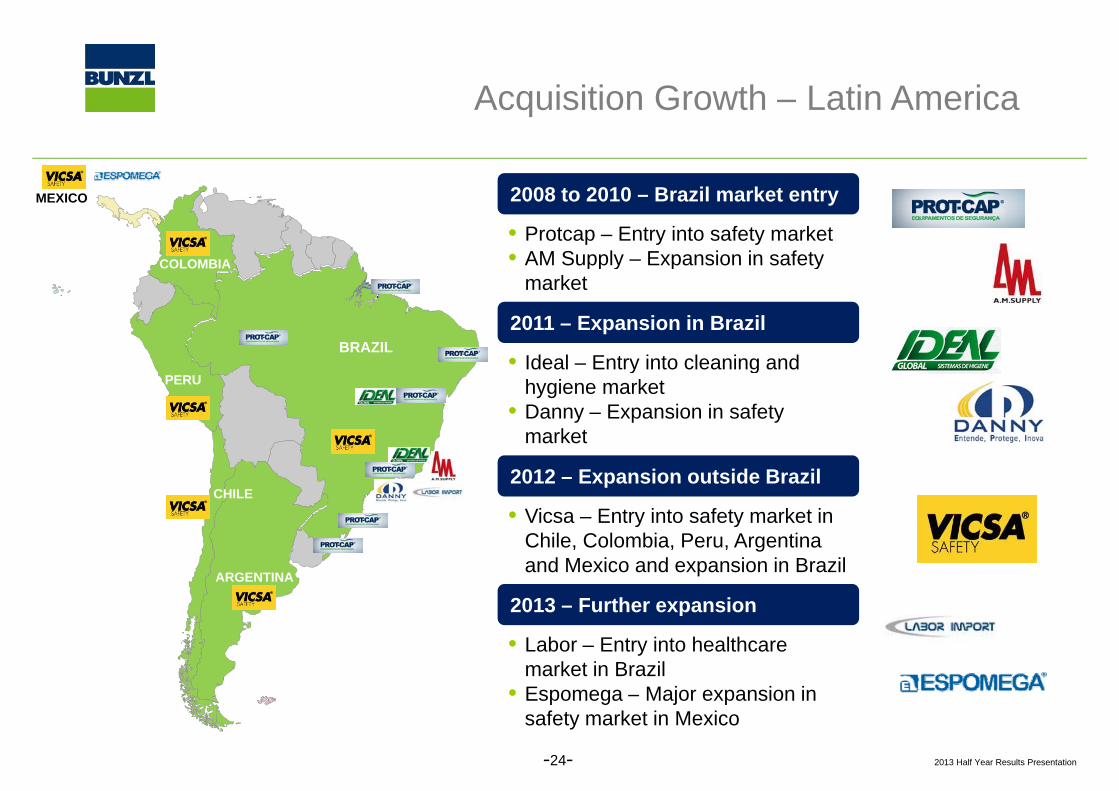
A i iti G th L ti A iAcquisition Growth – Latin America
• Protcap – Entry into safety market• AM Supply – Expansion in safety
2008 to 2010 – Brazil market entry
COLOMBIA
MEXICO
AM Supply Expansion in safety market
COLOMBIA
BRAZIL2011 – Expansion in Brazil
• Ideal – Entry into cleaning and hygiene market
• Danny – Expansion in safety market
PERU BRAZIL
BRAZIL
market
2011 – DannyCHILE
2012 – Expansion outside Brazil
• Vicsa – Entry into safety market in
ARGENTINA
Chile, Colombia, Peru, Argentina and Mexico and expansion in Brazil
2013 – Further expansionp
• Labor – Entry into healthcare market in Brazil
• Espomega – Major expansion in
2013 Half Year Results Presentation
p g j psafety market in Mexico
-24-
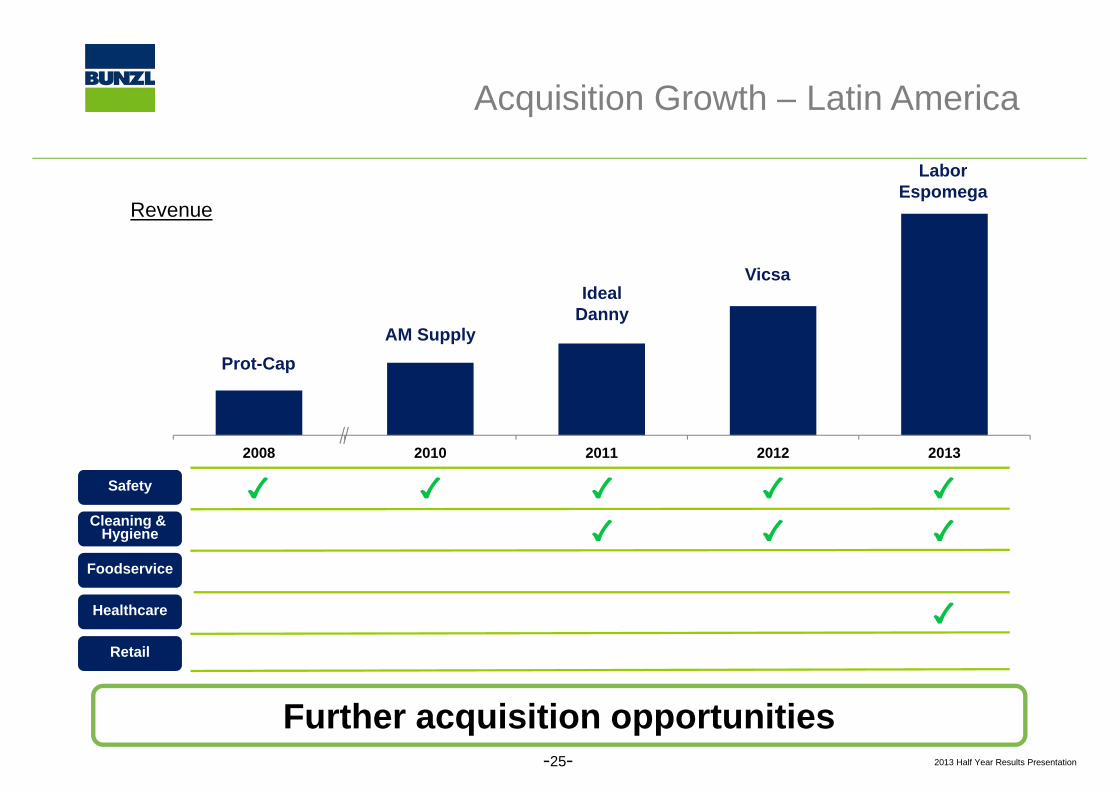
A i iti G th L ti A iAcquisition Growth – Latin America
Labor
Revenue
LaborEspomega
AM Supply
IdealDanny
Vicsa
Prot-Cap
2008 2010 2011 2012 2013
Safety
Cleaning & gHygiene
Foodservice
HealthcareHealthcare
Retail
2013 Half Year Results Presentation-25-
Further acquisition opportunities
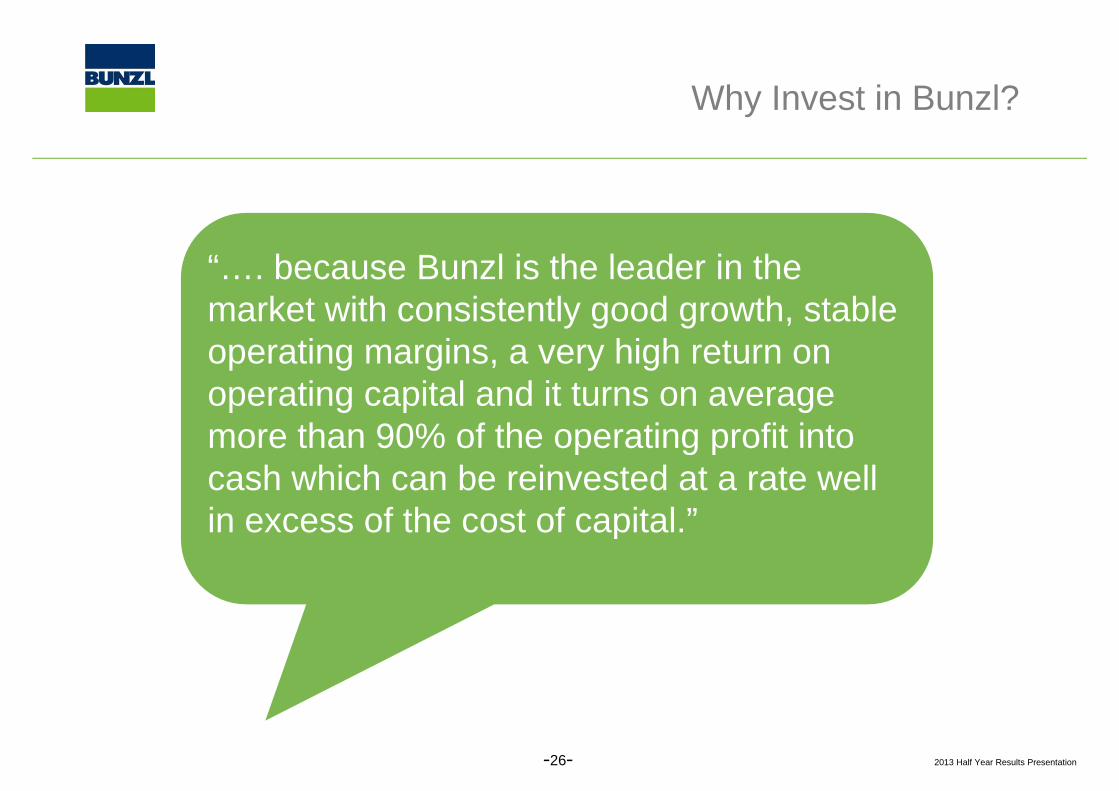
Wh I t i B l?Why Invest in Bunzl?
“ because Bunzl is the leader in the…. because Bunzl is the leader in the market with consistently good growth, stable operating margins a very high return onoperating margins, a very high return on operating capital and it turns on average more than 90% of the operating profit intomore than 90% of the operating profit into cash which can be reinvested at a rate well in excess of the cost of capital ”in excess of the cost of capital.
2013 Half Year Results Presentation-26-

Fi i l T k R dFinancial Track Record
Revenue (£bn)
4 64.8
5.15.4
Operating profit (£m)
312 323
353 37104-05 continuing operations only Before amortisation and acquisition
related and corporate costs
2.4
2.93.3
3.6
4.24.6
183
218241
259
297312
04-05 continuing operations only
2004 2005 2006 2007 2008 2009 2010 2011 2012 2004 2005 2006 2007 2008 2009 2010 2011 2012
Adjusted eps (p) Dividend per share (p)
60 6
68.571.8
As reported
Adjusted eps (p)
23.4
26.428.2
As reported
Dividend per share (p)
32.1
38.741.7
45.1
52.755.9
60.6As reported
13.3
15.717.0
18.720.6
21.6As reported
2004 2005 2006 2007 2008 2009 2010 2011 2012 2004 2005 2006 2007 2008 2009 2010 2011 2012
CAGRs 9% to 11%2013 Half Year Results Presentation
CAGRs 9% to 11% -27-
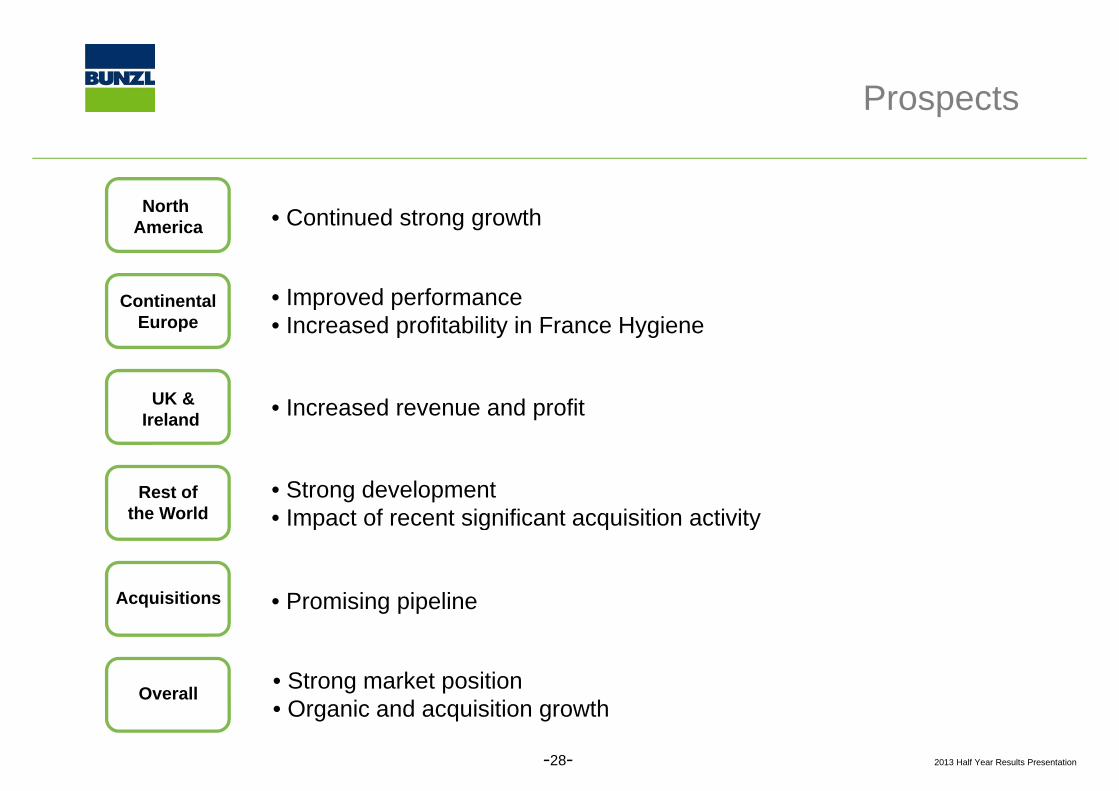
P tProspects
North America • Continued strong growth
Continental Europe
• Improved performance• Increased profitability in France Hygiene
UK &Ireland • Increased revenue and profit
Rest ofthe World
• Strong development• Impact of recent significant acquisition activity
Acquisitions
p g q y
• Promising pipeline
Overall • Strong market positionO i d i iti th
2013 Half Year Results Presentation
• Organic and acquisition growth
-28-

HALF YEAR RESULTS 2013
2013 Half Year Results Presentation
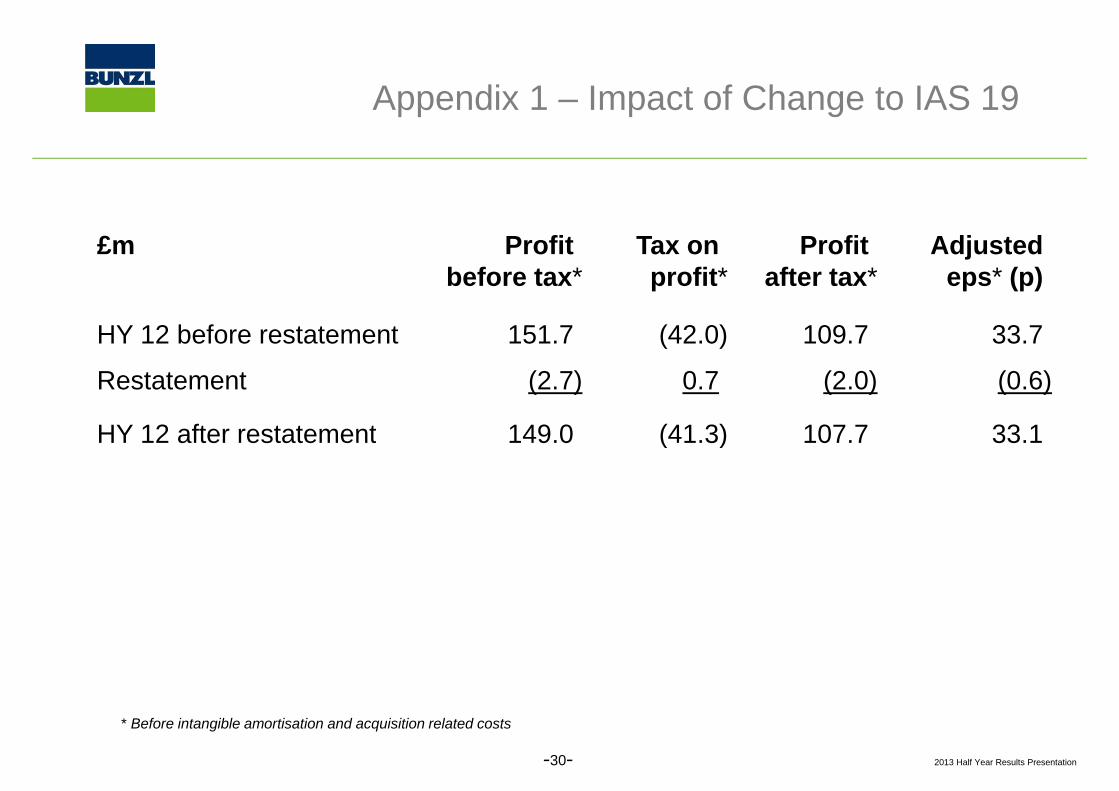
A di 1 I t f Ch t IAS 19Appendix 1 – Impact of Change to IAS 19
£m Profit) Tax on) Profit) Adjusted)before tax* profit* after tax* ) eps* (p))
HY 12 before restatement 151.7) (42.0) 109.7) 33.7)
Restatement (2.7) 0.7) (2.0) (0.6)
HY 12 after restatement 149 0) (41 3) 107 7) 33 1)HY 12 after restatement 149.0) (41.3) 107.7) 33.1)
2013 Half Year Results Presentation
* Before intangible amortisation and acquisition related costs
-30-
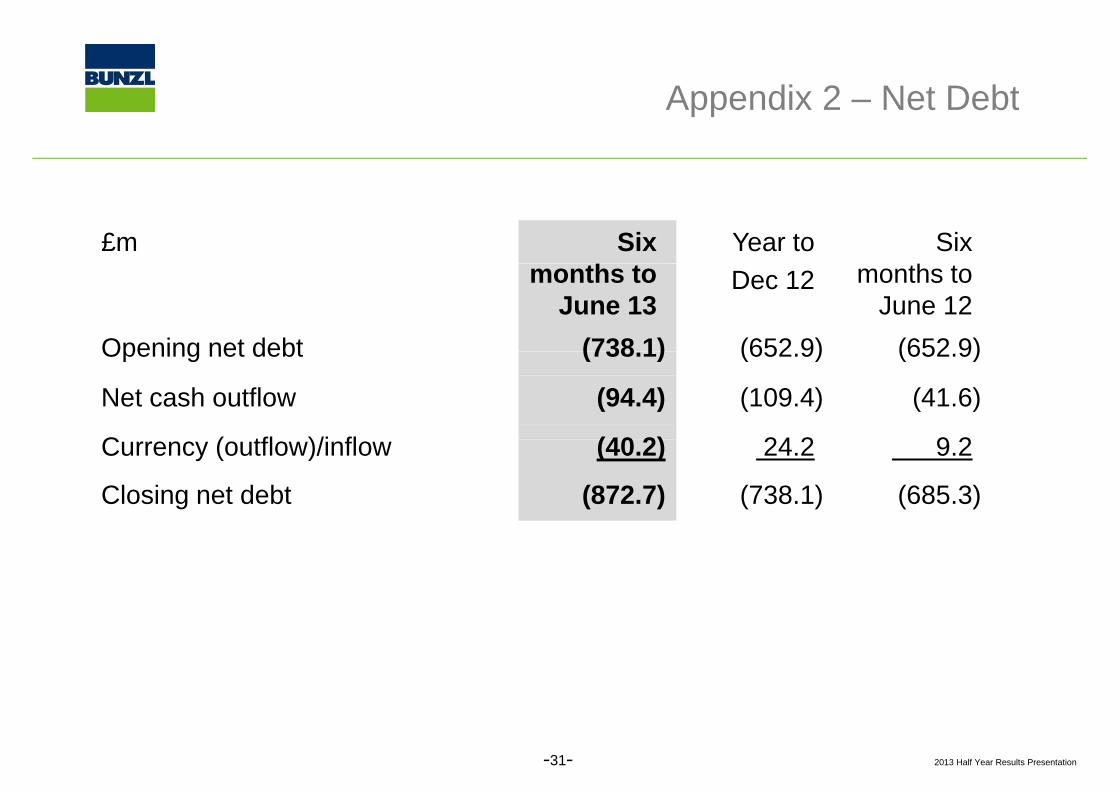
A di 2 N t D btAppendix 2 – Net Debt
£m Six))
Year to) Six))months to)
June 13)Dec 12) months to)
June 12)Opening net debt (738 1) (652 9) (652 9)Opening net debt (738.1) (652.9) (652.9)
Net cash outflow (94.4) (109.4) (41.6)
C ( tfl )/i fl (40 2) 24 2) 9 2)Currency (outflow)/inflow (40.2) 24.2) 9.2)
Closing net debt (872.7) (738.1) (685.3)
2013 Half Year Results Presentation-31-
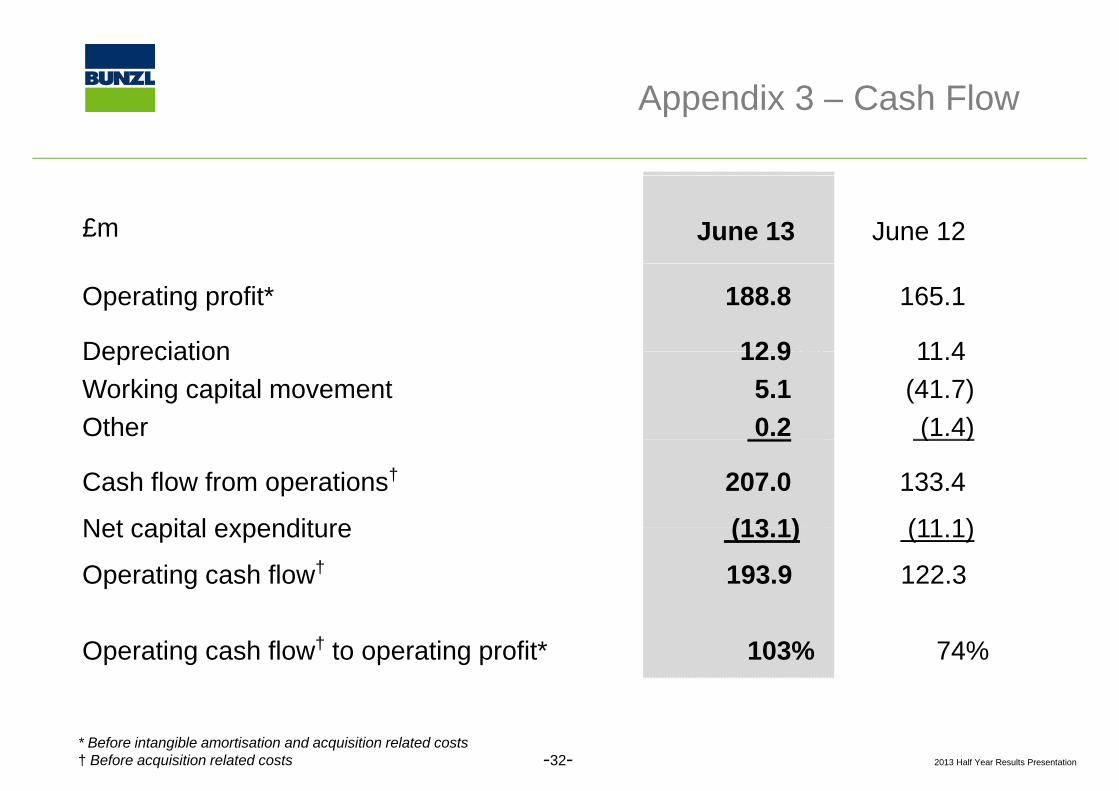
A di 3 C h FlAppendix 3 – Cash Flow
£m June 13)% June 12)%
Operating profit*
Depreciation
188.8)%
12 9)%
165.1)%
11 4)%DepreciationWorking capital movementOther
12.9)%5.1)%0.2)%
11.4)%(41.7)%(1.4)%
Cash flow from operations†
Net capital expenditure
)
207.0%)
(13 1)%
( )
133.4%)
(11 1)%Net capital expenditure
Operating cash flow†
(13.1)%
193.9%)
(11.1)%
122.3%)
Operating cash flow† to operating profit* 103%) 74%)
2013 Half Year Results Presentation
* Before intangible amortisation and acquisition related costs† Before acquisition related costs -32-
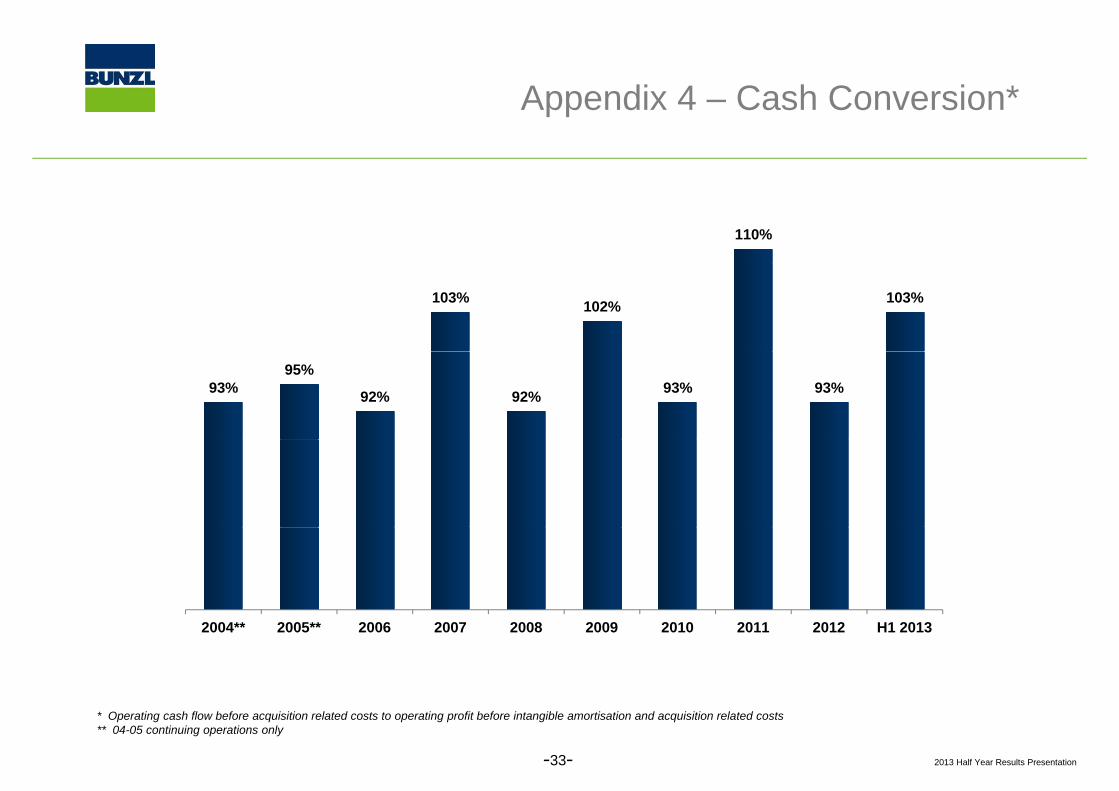
A di 4 C h C i *Appendix 4 – Cash Conversion*
110%
103% 102% 103%
93%95%
92% 92% 93% 93%
2004** 2005** 2006 2007 2008 2009 2010 2011 2012 H1 2013
2013 Half Year Results Presentation-33-
* Operating cash flow before acquisition related costs to operating profit before intangible amortisation and acquisition related costs** 04-05 continuing operations only
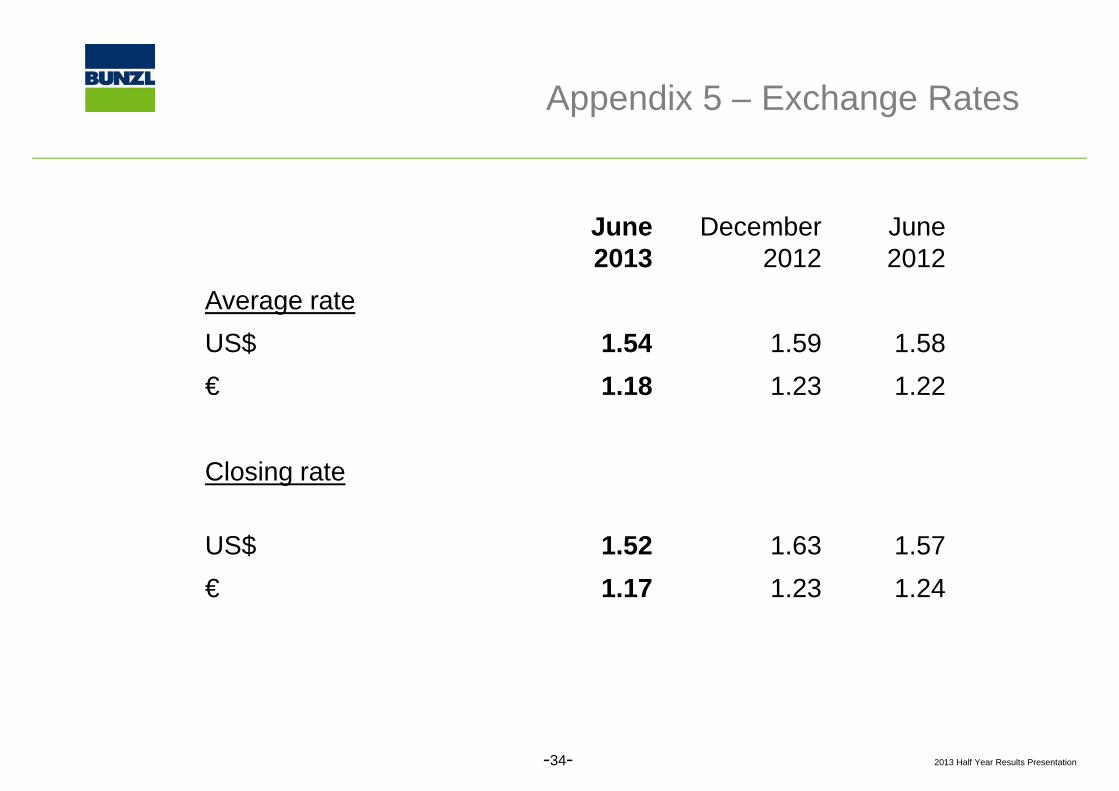
A di 5 E h R tAppendix 5 – Exchange Rates
June 2013
December 2012
June 20122013 2012 2012
Average rateUS$ 1.54 1.59 1.58US$ 1.54 1.59 1.58€ 1.18 1.23 1.22
Closing rate
US$ 1.52 1.63 1.57€ 1.17 1.23 1.24
2013 Half Year Results Presentation-34-
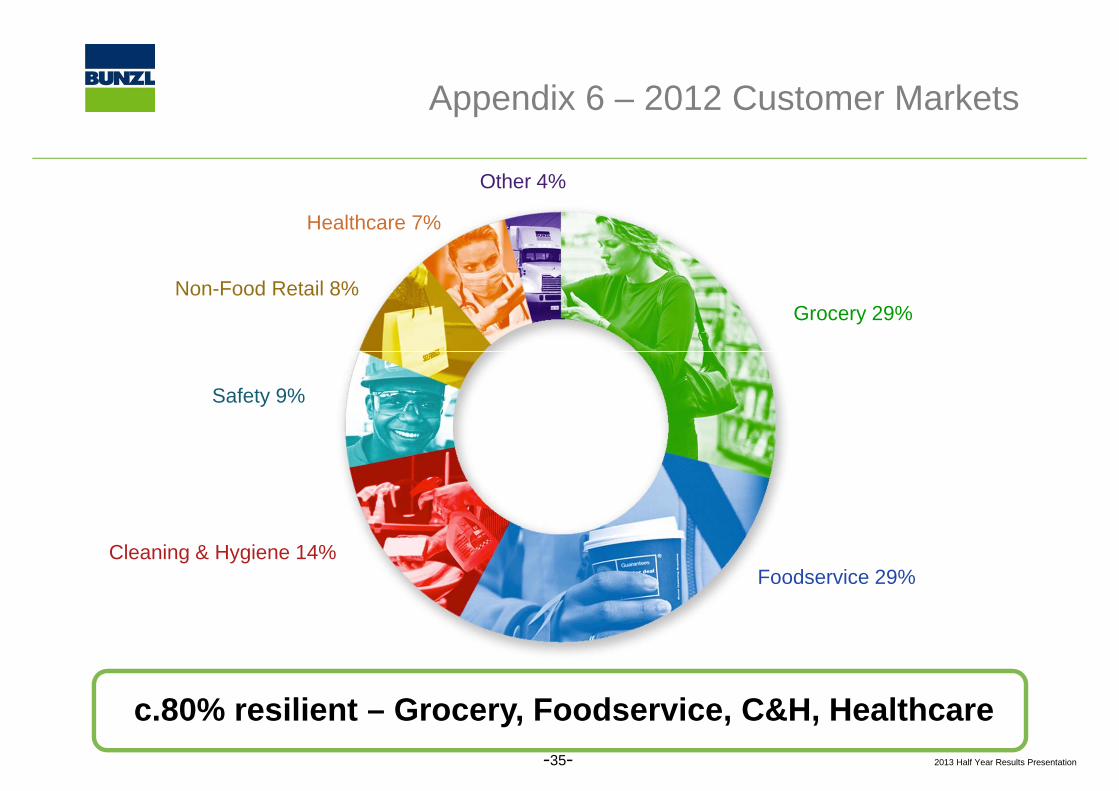
A di 6 2012 C t M k tAppendix 6 – 2012 Customer Markets
Oth 4%
Healthcare 7%
Other 4%
Non-Food Retail 8%Grocery 29%
Safety 9%
Cleaning & Hygiene 14%Foodservice 29%
80% ili t G F d i C&H H lth2013 Half Year Results Presentation-35-
c.80% resilient – Grocery, Foodservice, C&H, Healthcare
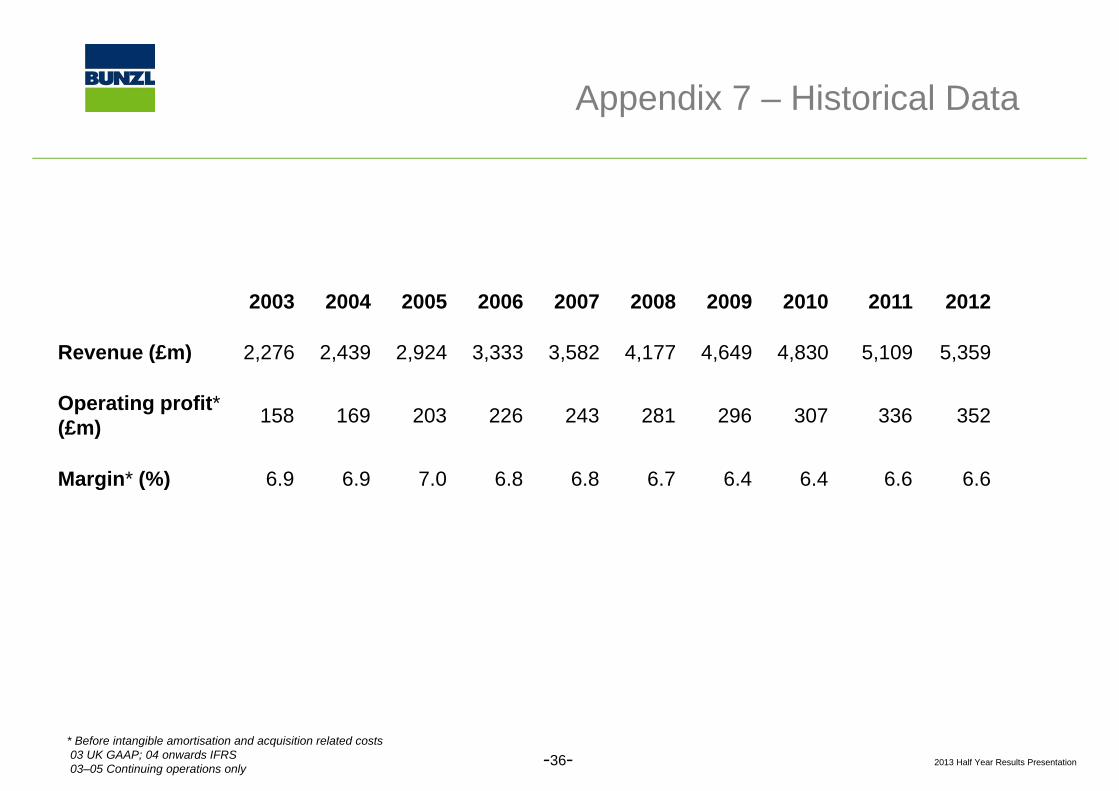
A di 7 Hi t i l D tAppendix 7 – Historical Data
2003 2004 2005 2006 2007 2008 2009 2010 2011 2012
Revenue (£m) 2 276 2 439 2 924 3 333 3 582 4 177 4 649 4 830 5 109 5 359Revenue (£m) 2,276 2,439 2,924 3,333 3,582 4,177 4,649 4,830 5,109 5,359
Operating profit*(£m) 158 169 203 226 243 281 296 307 336 352
Margin* (%) 6.9 6.9 7.0 6.8 6.8 6.7 6.4 6.4 6.6 6.6
2013 Half Year Results Presentation
* Before intangible amortisation and acquisition related costs03 UK GAAP; 04 onwards IFRS03–05 Continuing operations only -36-
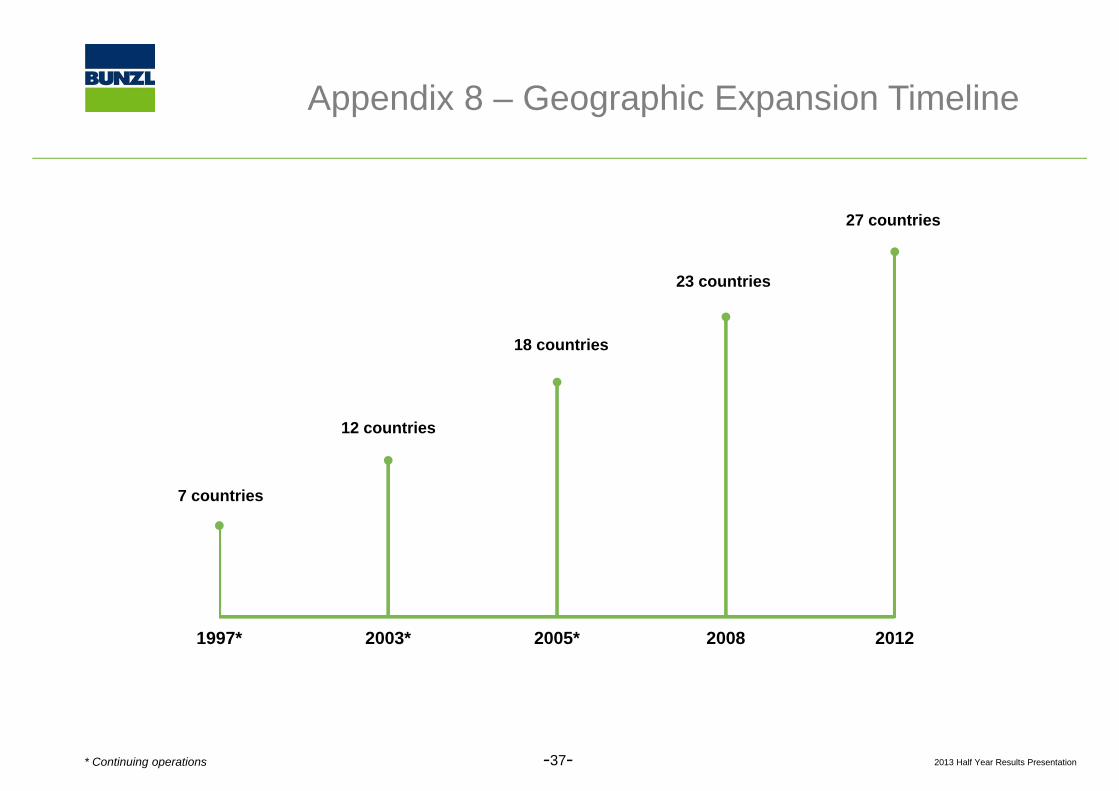
A di 8 G hi E i Ti liAppendix 8 – Geographic Expansion Timeline
27 countries
23 countries
18 countries
12 countries
7 countries
1997* 2003* 2005* 2008 2012
2013 Half Year Results Presentation-37-* Continuing operations

Appendix 9 Value PropositionAppendix 9 – Value Proposition
COSTTO
• In-house procurement and lf di t ib ti i tl
INVENTORY INVESTMENTPRODUCT COST ACQUIREself distribution is costly
• Bunzl applies its resources
COST
INVENTORY INVESTMENT
CASH FLOW
DIRECT LABOUR & OVERTIME
and expertise to reduce or eliminate many of the “hidden” costs of in house COST
TOPROCESS
INVENTORY FINANCE COST
EXPEDITED ORDERS
INBOUND FREIGHT
PURCHASE ORDER ADMINISTRATION
hidden costs of in-house procurement and self distribution
PURCHASE ORDER ADMINISTRATION
INVENTORY DAMAGE & SHRINKAGE
ACCOUNTS PAYABLE ADMIN
STORAGE SPACE
• The benefits to customers are a lower cost of doing business
CAPITAL EMPLOYEDa lower cost of doing business and reduced working capital
2013 Half Year Results Presentation-38-
Di l iDisclaimer
This document has been prepared by Bunzl plc (the “Company”) solely for use at the presentation ofthe Company’s results announcement in respect of the six months ended 30 June 2013. For thepurposes of this disclaimer, “Presentation” shall mean this document, the oral presentation of thelid b th C d l t d ti d i d t i l di t ib t d tslides by the Company and related question-and-answer session and any materials distributed at, or
in connection with, that presentation.
The Presentation does not constitute or form part of and should not be construed as, an offer to sellor issue or the solicitation of an offer to buy or acquire securities of the Company in any jurisdictionor issue, or the solicitation of an offer to buy or acquire, securities of the Company in any jurisdictionor an inducement to enter into investment activity. No part of this Presentation, nor the fact of itsdistribution, should form the basis of, or be relied on or in connection with, any contract orcommitment or investment decision whatsoever.
The Presentation contains forward-looking statements. They are subject to risks and uncertaintiesthat might cause actual results and outcomes to differ materially from the expectations expressed inthem. You are cautioned not to place undue reliance on such forward-looking statements whichspeak only as of the date hereof. The Company undertakes no obligation to revise or update anyp y p y g p ysuch forward-looking statements.
The information and opinions contained in this Presentation do not purport to be comprehensive, areprovided as at the date of the Presentation and are subject to change without notice. The Companyis not under any obligation to update or keep current the information contained herein.
2013 Half Year Results Presentation-39-