Embed Size (px)
Citation preview

2018
Delivering better nutrition for every step of life’s journey Thursday, 9 August 2018
Half year results
Glanbia HY 2018 results in line with expectations,
reiterating FY 2018 guidance of 5% to 8% growth in pro-forma Adjusted EPS, Constant currency
9 August 2018 - Glanbia plc (“Glanbia”, the “Group”, the “plc”), the global nutrition group, announces its results for the six month period ended 30 June 2018 (“financial half year 2018”, “first half of 2018”, “HY 2018” or “H1 2018”).
Results summary for the financial half year 2018 Wholly owned revenues from continuing operations of €1,112.0 million (2017: €1,185.7 million), up 3.6% constant currency on prior half year (down 6.2%
reported); Wholly owned volume growth of 5.7% versus prior half year;
Wholly owned EBITA from continuing operations of €123.7 million (2017: €148.3 million), down 7.3% constant currency on prior half year (down 16.6% reported);
On a pro-forma basis adjusted earnings per share1 of 38.83 cent, a decline of 7.1% constant currency (down 15.8% reported);
Glanbia Performance Nutrition, revenue growth of 4.9% constant currency (down 4.4% reported) and EBITA decline of 16.4% constant currency (down 24.6% reported);
Glanbia Nutritionals, revenue growth of 2.4% constant currency (down 7.8% reported) and EBITA growth of 4.5% constant currency (down 6.2% reported);
Joint Ventures pro-forma share of pre-exceptional profit after tax from continuing operations was €17.8 million, down €8.2 million on prior half year; Operating cash flow from continuing operations of €59.8 million, up €93.1 million on prior half year on a pro-forma basis primarily due to working capital
improvements;
Interim dividend of 9.71 cent per share up 64.3% on prior half year reflecting revised dividend policy; and Full year 2018 guidance reiterated of 5% to 8% growth in pro-forma adjusted earnings per share1, constant currency.
Commenting today Siobhán Talbot, Group Managing Director, said: “Glanbia delivered in line with expectations in the first half of 2018 and reiterates guidance for 2018 full year earnings growth. We continue to drive volume
momentum with 5.7% growth in the first half and reiterate guidance for full year volume growth in the key portfolios of Glanbia Performance Nutrition and Glanbia Nutritional Solutions in the mid-to-high single digit range. We expect margins for the full year to be similar to 2017; we prioritised investment in our brands and operational infrastructure in the first half in advance of input cost reductions which are materialising as expected in the second half of the year.”
2018 financial half year results highlights
Reported Constant
€m HY 2018 HY 2017 Change Currency Change2
Wholly owned business (continuing operations)
Revenue 1,112.0 1,185.7 -6.2% +3.6%
EBITA3 123.7 148.3 -16.6% -7.3%
EBITA margin 11.1% 12.5% - 140 bps - 130bps
Joint Ventures4 (continuing operations)
Share of profit after tax (pre-exceptional items) 17.8 26.0 -31.5% -29.4%
Total Group profit for the period5 98.2 114.9 -14.5% Reported basic earnings per share 33.27c 38.96c -14.6%
Pro-forma
Pro-forma adjusted earnings per share1 38.83c 46.09c -15.8% -7.1%
1. Pro-forma adjusted earnings per share calculation excludes the impact of discontinued operations from the 2017 financial year. A reconciliation is set
out on page 35 of the glossary to the financial statements.
2. To arrive at the constant currency change, the average exchange rate for the current period is applied to the relevant reported result from the same period in the prior year. The average Euro US Dollar exchange rate for the first half of 2018 was €1 = $1.211 (HY 2017: €1 = $1.083).
3. EBITA is defined as earnings before interest, tax and amortisation and is stated before exceptional items.
4. Prior year number are presented on a pro-forma basis to include the share of results of Dairy Ireland, consistent with current year reported numbers. 5. Total Group profit number for HY 2017 includes the impact of discontinued operations which were sold on 2 July 2017.
This release contains certain alternative performance measures. A detailed glossary of the key performance indicators and non-IFRS performance measures can be found on pages 32 to 39.
Foreign exchange Glanbia generates a significant amount of its revenues in US Dollars and reports in Euro. To eliminate the impact of exchange rates on translation of results the
Group uses constant currency reporting. To arrive at the constant currency change, the average exchange rate for the current period is applied to the relevant reported result from the same period in the prior year. The average Euro US Dollar exchange rate for the first half of 2018 was €1 = $1.211 (HY 2017: €1 = $1.083). Therefore this leads to a difference between the constant currency change and the reported result.
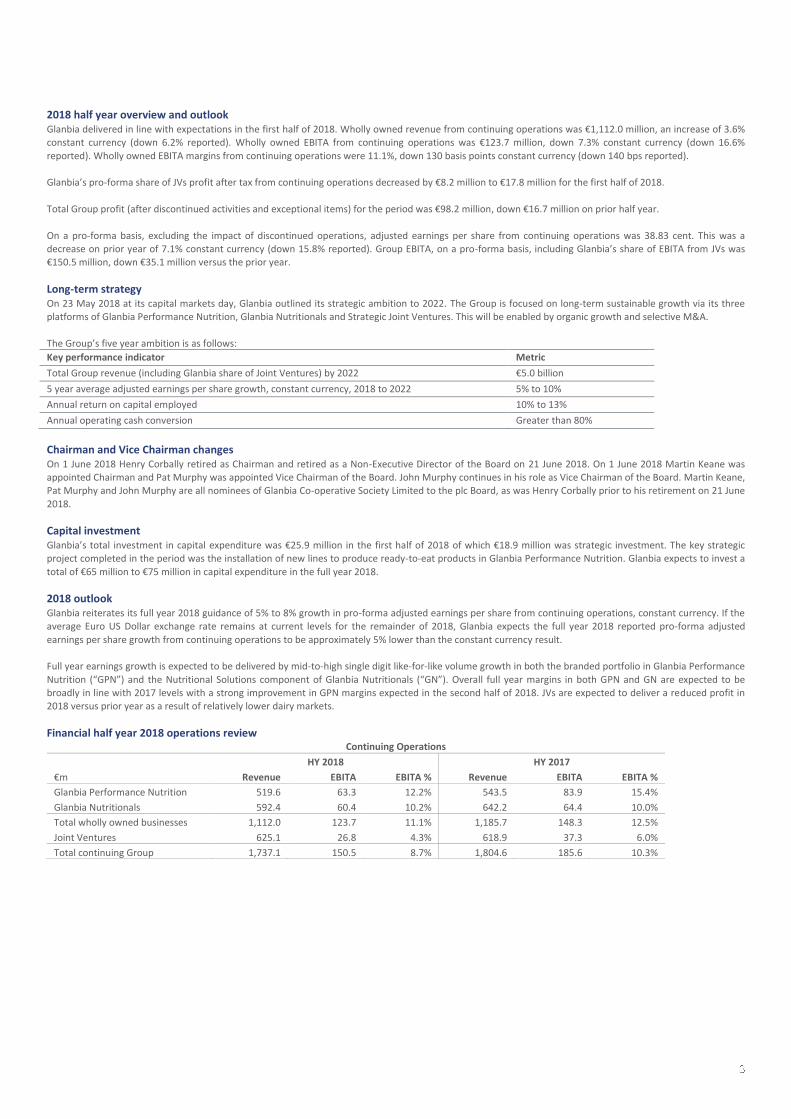
2018 half year overview and outlook Glanbia delivered in line with expectations in the first half of 2018. Wholly owned revenue from continuing operations was €1,112.0 million, an increase of 3.6% constant currency (down 6.2% reported). Wholly owned EBITA from continuing operations was €123.7 million, down 7.3% constant currency (down 16.6%
reported). Wholly owned EBITA margins from continuing operations were 11.1%, down 130 basis points constant currency (down 140 bps reported). Glanbia’s pro-forma share of JVs profit after tax from continuing operations decreased by €8.2 million to €17.8 million for the first half of 2018.
Total Group profit (after discontinued activities and exceptional items) for the period was €98.2 million, down €16.7 million on prior half year.
On a pro-forma basis, excluding the impact of discontinued operations, adjusted earnings per share from continuing operations was 38.83 cent. This was a decrease on prior year of 7.1% constant currency (down 15.8% reported). Group EBITA, on a pro-forma basis, including Glanbia’s share of EBITA from JVs was €150.5 million, down €35.1 million versus the prior year.
Long-term strategy On 23 May 2018 at its capital markets day, Glanbia outlined its strategic ambition to 2022. The Group is focused on long-term sustainable growth via its three platforms of Glanbia Performance Nutrition, Glanbia Nutritionals and Strategic Joint Ventures. This will be enabled by organic growth and selective M&A.
The Group’s five year ambition is as follows:
Key performance indicator Metric
Total Group revenue (including Glanbia share of Joint Ventures) by 2022 €5.0 billion
5 year average adjusted earnings per share growth, constant currency, 2018 to 2022 5% to 10%
Annual return on capital employed 10% to 13%
Annual operating cash conversion Greater than 80%
Chairman and Vice Chairman changes On 1 June 2018 Henry Corbally retired as Chairman and retired as a Non-Executive Director of the Board on 21 June 2018. On 1 June 2018 Martin Keane was appointed Chairman and Pat Murphy was appointed Vice Chairman of the Board. John Murphy continues in his role as Vice Chairman of the Board. Martin Keane, Pat Murphy and John Murphy are all nominees of Glanbia Co-operative Society Limited to the plc Board, as was Henry Corbally prior to his retirement on 21 June
2018.
Capital investment Glanbia’s total investment in capital expenditure was €25.9 million in the first half of 2018 of which €18.9 million was strategic investment. The key strategic project completed in the period was the installation of new lines to produce ready-to-eat products in Glanbia Performance Nutrition. Glanbia expects to invest a
total of €65 million to €75 million in capital expenditure in the full year 2018.
2018 outlook Glanbia reiterates its full year 2018 guidance of 5% to 8% growth in pro-forma adjusted earnings per share from continuing operations, constant currency. If the average Euro US Dollar exchange rate remains at current levels for the remainder of 2018, Glanbia expects the full year 2018 reported pro-forma adjusted
earnings per share growth from continuing operations to be approximately 5% lower than the constant currency result. Full year earnings growth is expected to be delivered by mid-to-high single digit like-for-like volume growth in both the branded portfolio in Glanbia Performance
Nutrition (“GPN”) and the Nutritional Solutions component of Glanbia Nutritionals (“GN”). Overall full year margins in both GPN and GN are expected to be broadly in line with 2017 levels with a strong improvement in GPN margins expected in the second half of 2018. JVs are expected to deliver a reduced profit in 2018 versus prior year as a result of relatively lower dairy markets.
Financial half year 2018 operations review Continuing Operations
HY 2018 HY 2017
€m Revenue EBITA EBITA % Revenue EBITA EBITA %
Glanbia Performance Nutrition 519.6 63.3 12.2% 543.5 83.9 15.4%
Glanbia Nutritionals 592.4 60.4 10.2% 642.2 64.4 10.0%
Total wholly owned businesses 1,112.0 123.7 11.1% 1,185.7 148.3 12.5%
Joint Ventures 625.1 26.8 4.3% 618.9 37.3 6.0%
Total continuing Group 1,737.1 150.5 8.7% 1,804.6 185.6 10.3%
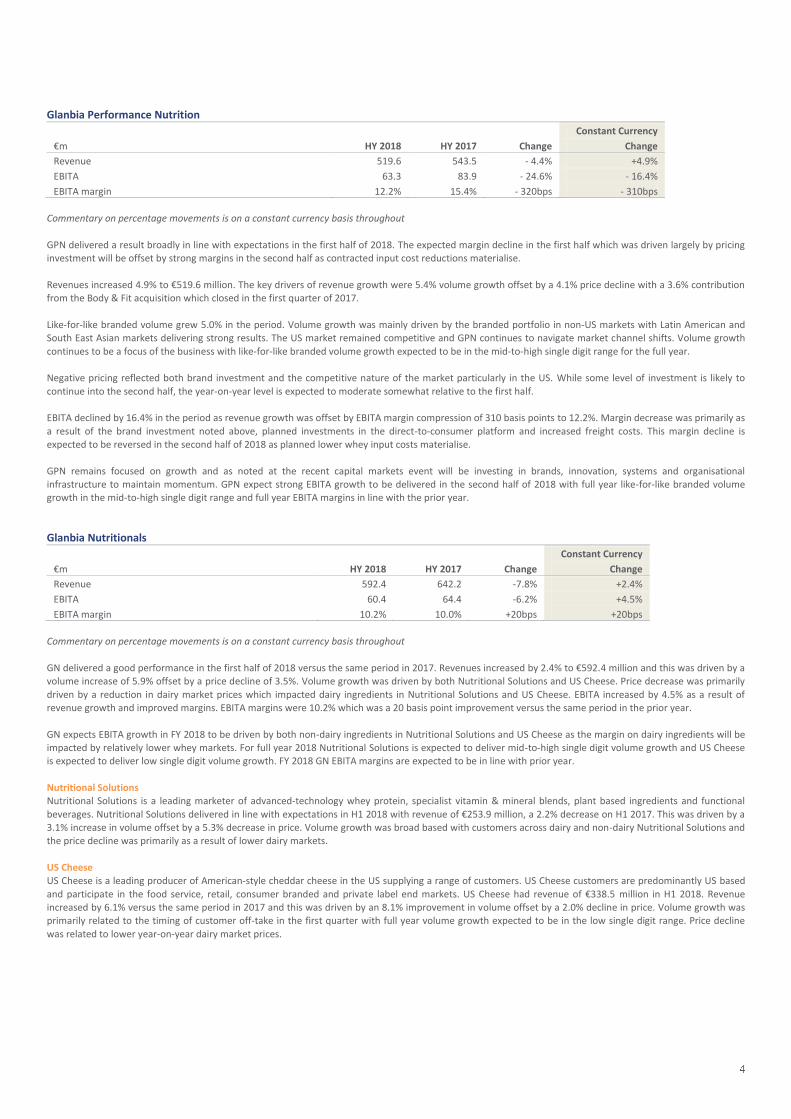
Glanbia Performance Nutrition
Constant Currency
€m HY 2018 HY 2017 Change Change
Revenue 519.6 543.5 - 4.4% +4.9%
EBITA 63.3 83.9 - 24.6% - 16.4%
EBITA margin 12.2% 15.4% - 320bps - 310bps
Commentary on percentage movements is on a constant currency basis throughout
GPN delivered a result broadly in line with expectations in the first half of 2018. The expected margin decline in the first half which was driven largely by pricing investment will be offset by strong margins in the second half as contracted input cost reductions materialise.
Revenues increased 4.9% to €519.6 million. The key drivers of revenue growth were 5.4% volume growth offset by a 4.1% price decline with a 3.6% contribution from the Body & Fit acquisition which closed in the first quarter of 2017.
Like-for-like branded volume grew 5.0% in the period. Volume growth was mainly driven by the branded portfolio in non-US markets with Latin American and South East Asian markets delivering strong results. The US market remained competitive and GPN continues to navigate market channel shifts. Volume growth
continues to be a focus of the business with like-for-like branded volume growth expected to be in the mid-to-high single digit range for the full year. Negative pricing reflected both brand investment and the competitive nature of the market particularly in the US. While some level of investment is likely to
continue into the second half, the year-on-year level is expected to moderate somewhat relative to the first half. EBITA declined by 16.4% in the period as revenue growth was offset by EBITA margin compression of 310 basis points to 12.2%. Margin decrease was primarily as
a result of the brand investment noted above, planned investments in the direct-to-consumer platform and increased freight costs. This margin decline is expected to be reversed in the second half of 2018 as planned lower whey input costs materialise.
GPN remains focused on growth and as noted at the recent capital markets event will be investing in brands, innovation, systems and organisational infrastructure to maintain momentum. GPN expect strong EBITA growth to be delivered in the second half of 2018 with full year like-for-like branded volume growth in the mid-to-high single digit range and full year EBITA margins in line with the prior year.
Glanbia Nutritionals
Constant Currency
€m HY 2018 HY 2017 Change Change
Revenue 592.4 642.2 -7.8% +2.4%
EBITA 60.4 64.4 -6.2% +4.5%
EBITA margin 10.2% 10.0% +20bps +20bps
Commentary on percentage movements is on a constant currency basis throughout
GN delivered a good performance in the first half of 2018 versus the same period in 2017. Revenues increased by 2.4% to €592.4 million and this was driven by a volume increase of 5.9% offset by a price decline of 3.5%. Volume growth was driven by both Nutritional Solutions and US Cheese. Price decrease was primarily
driven by a reduction in dairy market prices which impacted dairy ingredients in Nutritional Solutions and US Cheese. EBITA increased by 4.5% as a result of revenue growth and improved margins. EBITA margins were 10.2% which was a 20 basis point improvement versus the same period in the prior year.
GN expects EBITA growth in FY 2018 to be driven by both non-dairy ingredients in Nutritional Solutions and US Cheese as the margin on dairy ingredients will be impacted by relatively lower whey markets. For full year 2018 Nutritional Solutions is expected to deliver mid-to-high single digit volume growth and US Cheese is expected to deliver low single digit volume growth. FY 2018 GN EBITA margins are expected to be in line with prior year.
Nutritional Solutions Nutritional Solutions is a leading marketer of advanced‐technology whey protein, specialist vitamin & mineral blends, plant based ingredients and functional
beverages. Nutritional Solutions delivered in line with expectations in H1 2018 with revenue of €253.9 million, a 2.2% decrease on H1 2017. This was driven by a 3.1% increase in volume offset by a 5.3% decrease in price. Volume growth was broad based with customers across dairy and non-dairy Nutritional Solutions and the price decline was primarily as a result of lower dairy markets.
US Cheese US Cheese is a leading producer of American‐style cheddar cheese in the US supplying a range of customers. US Cheese customers are predominantly US based
and participate in the food service, retail, consumer branded and private label end markets. US Cheese had revenue of €338.5 million in H1 2018. Revenue increased by 6.1% versus the same period in 2017 and this was driven by an 8.1% improvement in volume offset by a 2.0% decline in price. Volume growth was primarily related to the timing of customer off-take in the first quarter with full year volume growth expected to be in the low single digit range. Price decline
was related to lower year-on-year dairy market prices.
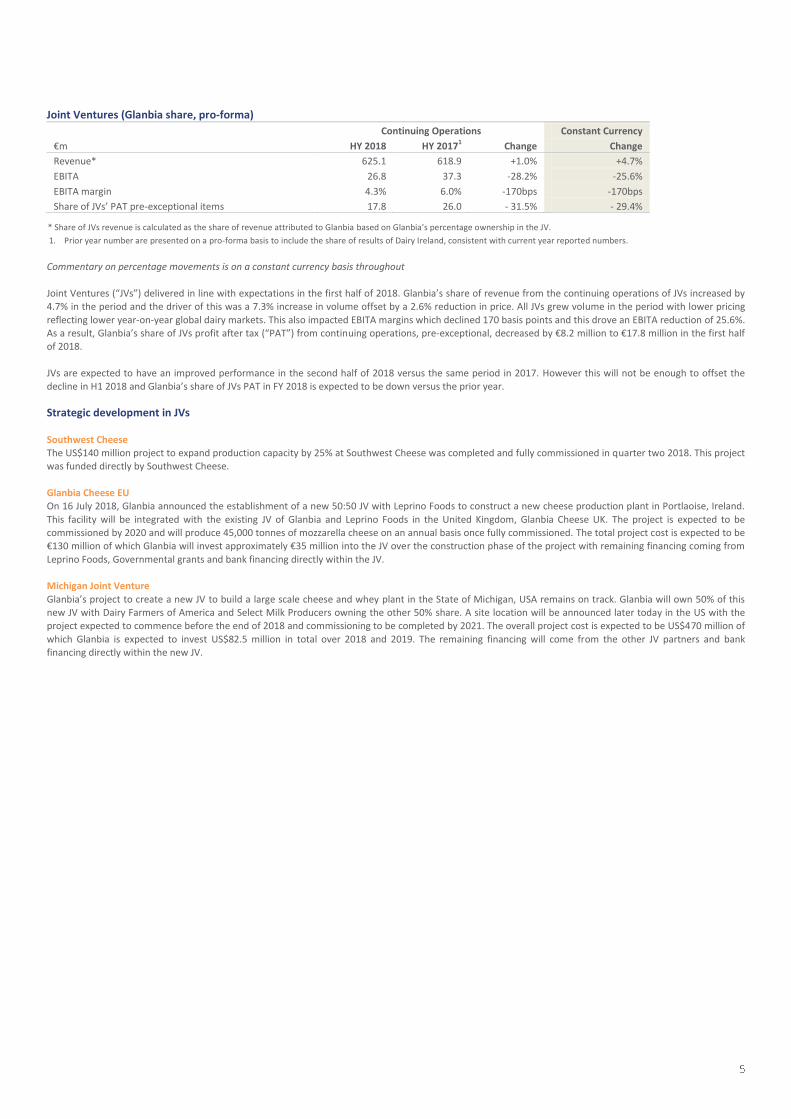
Joint Ventures (Glanbia share, pro-forma)
Continuing Operations Constant Currency
€m HY 2018 HY 20171 Change Change
Revenue* 625.1 618.9 +1.0% +4.7%
EBITA 26.8 37.3 -28.2% -25.6%
EBITA margin 4.3% 6.0% -170bps -170bps
Share of JVs’ PAT pre-exceptional items 17.8 26.0 - 31.5% - 29.4%
* Share of JVs revenue is calculated as the share of revenue attributed to Glanbia based on Glanbia’s percentage ownership in the JV.
1. Prior year number are presented on a pro-forma basis to include the share of results of Dairy Ireland, consistent with current year reported numbers.
Commentary on percentage movements is on a constant currency basis throughout
Joint Ventures (“JVs”) delivered in line with expectations in the first half of 2018. Glanbia’s share of revenue from the continuing operations of JVs increased by 4.7% in the period and the driver of this was a 7.3% increase in volume offset by a 2.6% reduction in price. All JVs grew volume in the period with lower pricing
reflecting lower year-on-year global dairy markets. This also impacted EBITA margins which declined 170 basis points and this drove an EBITA reduction of 25.6%. As a result, Glanbia’s share of JVs profit after tax (“PAT”) from continuing operations, pre-exceptional, decreased by €8.2 million to €17.8 million in the first half of 2018.
JVs are expected to have an improved performance in the second half of 2018 versus the same period in 2017. However this will not be enough to offset the decline in H1 2018 and Glanbia’s share of JVs PAT in FY 2018 is expected to be down versus the prior year.
Strategic development in JVs
Southwest Cheese The US$140 million project to expand production capacity by 25% at Southwest Cheese was completed and fully commissioned in quarter two 2018. This project was funded directly by Southwest Cheese.
Glanbia Cheese EU On 16 July 2018, Glanbia announced the establishment of a new 50:50 JV with Leprino Foods to construct a new cheese production plant in Portlaoise, Ireland.
This facility will be integrated with the existing JV of Glanbia and Leprino Foods in the United Kingdom, Glanbia Cheese UK. The project is expected to be commissioned by 2020 and will produce 45,000 tonnes of mozzarella cheese on an annual basis once fully commissioned. The total project cost is expected to be €130 million of which Glanbia will invest approximately €35 million into the JV over the construction phase of the project with remaining financing coming from
Leprino Foods, Governmental grants and bank financing directly within the JV. Michigan Joint Venture
Glanbia’s project to create a new JV to build a large scale cheese and whey plant in the State of Michigan, USA remains on track. Glanbia will own 50% of this new JV with Dairy Farmers of America and Select Milk Producers owning the other 50% share. A site location will be announced later today in the US with the project expected to commence before the end of 2018 and commissioning to be completed by 2021. The overall project cost is expected to be US$470 million of
which Glanbia is expected to invest US$82.5 million in total over 2018 and 2019. The remaining financing will come from the other JV partners and bank financing directly within the new JV.
Half year 2018 finance review
Half year 2018 results summary pre-exceptional Constant Currency
€m HY 2018 HY 2017 Change Change
Continuing operations:
Revenue 1,112.0 1,185.7 (6.2%) +3.6%
EBITA 123.7 148.3 (16.6%) (7.3%)
EBITA margin 11.1% 12.5% -140bps -130bps
- Amortisation of intangible assets (21.5) (21.8)
- Net finance costs (7.6) (11.8)
- Share of results of Joint Ventures 17.8 22.3
- Income tax (14.2) (20.5)
Profit for the half year – continuing operations 98.2 116.5 Profit after tax from discontinued operations - 9.3
Profit for the half year – Group 98.2 125.8
Basic earnings per share 33.27c 38.96c (14.6%)
Pro-forma adjusted earnings per share 38.83c 46.09c (15.8%) (7.1%)
Income statement
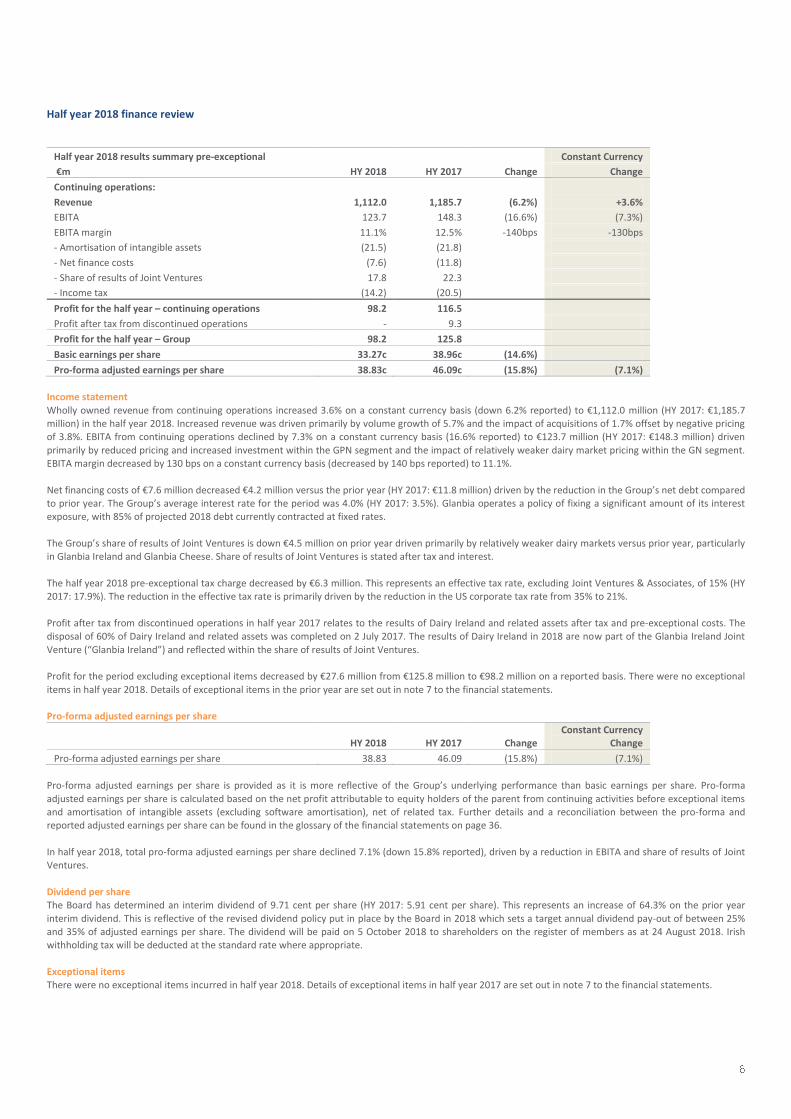
Wholly owned revenue from continuing operations increased 3.6% on a constant currency basis (down 6.2% reported) to €1,112.0 million (HY 2017: €1,185.7 million) in the half year 2018. Increased revenue was driven primarily by volume growth of 5.7% and the impact of acquisitions of 1.7% offset by negative pricing of 3.8%. EBITA from continuing operations declined by 7.3% on a constant currency basis (16.6% reported) to €123.7 million (HY 2017: €148.3 million) driven
primarily by reduced pricing and increased investment within the GPN segment and the impact of relatively weaker dairy market pricing within the GN segment. EBITA margin decreased by 130 bps on a constant currency basis (decreased by 140 bps reported) to 11.1%.
Net financing costs of €7.6 million decreased €4.2 million versus the prior year (HY 2017: €11.8 million) driven by the reduction in the Group’s net debt compared to prior year. The Group’s average interest rate for the period was 4.0% (HY 2017: 3.5%). Glanbia operates a policy of fixing a significant amount of its interest exposure, with 85% of projected 2018 debt currently contracted at fixed rates.
The Group’s share of results of Joint Ventures is down €4.5 million on prior year driven primarily by relatively weaker dairy markets versus prior year, particularly in Glanbia Ireland and Glanbia Cheese. Share of results of Joint Ventures is stated after tax and interest.
The half year 2018 pre-exceptional tax charge decreased by €6.3 million. This represents an effective tax rate, excluding Joint Ventures & Associates, of 15% (HY 2017: 17.9%). The reduction in the effective tax rate is primarily driven by the reduction in the US corporate tax rate from 35% to 21%.
Profit after tax from discontinued operations in half year 2017 relates to the results of Dairy Ireland and related assets after tax and pre-exceptional costs. The disposal of 60% of Dairy Ireland and related assets was completed on 2 July 2017. The results of Dairy Ireland in 2018 are now part of the Glanbia Ireland Joint
Venture (“Glanbia Ireland”) and reflected within the share of results of Joint Ventures. Profit for the period excluding exceptional items decreased by €27.6 million from €125.8 million to €98.2 million on a reported basis. There were no exceptional
items in half year 2018. Details of exceptional items in the prior year are set out in note 7 to the financial statements. Pro-forma adjusted earnings per share
HY 2018 HY 2017 Change Constant Currency
Change
Pro-forma adjusted earnings per share 38.83 46.09 (15.8%) (7.1%)
Pro-forma adjusted earnings per share is provided as it is more reflective of the Group’s underlying performance than basic earnings per share. Pro-forma
adjusted earnings per share is calculated based on the net profit attributable to equity holders of the parent from continuing activities before exceptional items and amortisation of intangible assets (excluding software amortisation), net of related tax. Further details and a reconciliation between the pro-forma and reported adjusted earnings per share can be found in the glossary of the financial statements on page 36.
In half year 2018, total pro-forma adjusted earnings per share declined 7.1% (down 15.8% reported), driven by a reduction in EBITA and share of results of Joint Ventures.
Dividend per share The Board has determined an interim dividend of 9.71 cent per share (HY 2017: 5.91 cent per share). This represents an increase of 64.3% on the prior year
interim dividend. This is reflective of the revised dividend policy put in place by the Board in 2018 which sets a target annual dividend pay-out of between 25% and 35% of adjusted earnings per share. The dividend will be paid on 5 October 2018 to shareholders on the register of members as at 24 August 2018. Irish withholding tax will be deducted at the standard rate where appropriate.
Exceptional items There were no exceptional items incurred in half year 2018. Details of exceptional items in half year 2017 are set out in note 7 to the financial statements.
Group financing
Financing key performance indicators HY 2018 HY 2017 FY 2017
Net debt €m 402.1 608.4 367.7
Net debt: adjusted EBITDA1 1.22 times 1.63 times 1.07 times
Adjusted EBIT1: net finance cost 7.3 times 11.3 times 7.0 times
1. Definitions of net debt, adjusted EBITDA and adjusted EBIT are as per financing agreements which include dividends from Joint Ventures and the pro-forma effect of acquisitions. A
detailed glossary of the key performance indicators and non-IFRS performance measures can be found on pages 32 to 39.
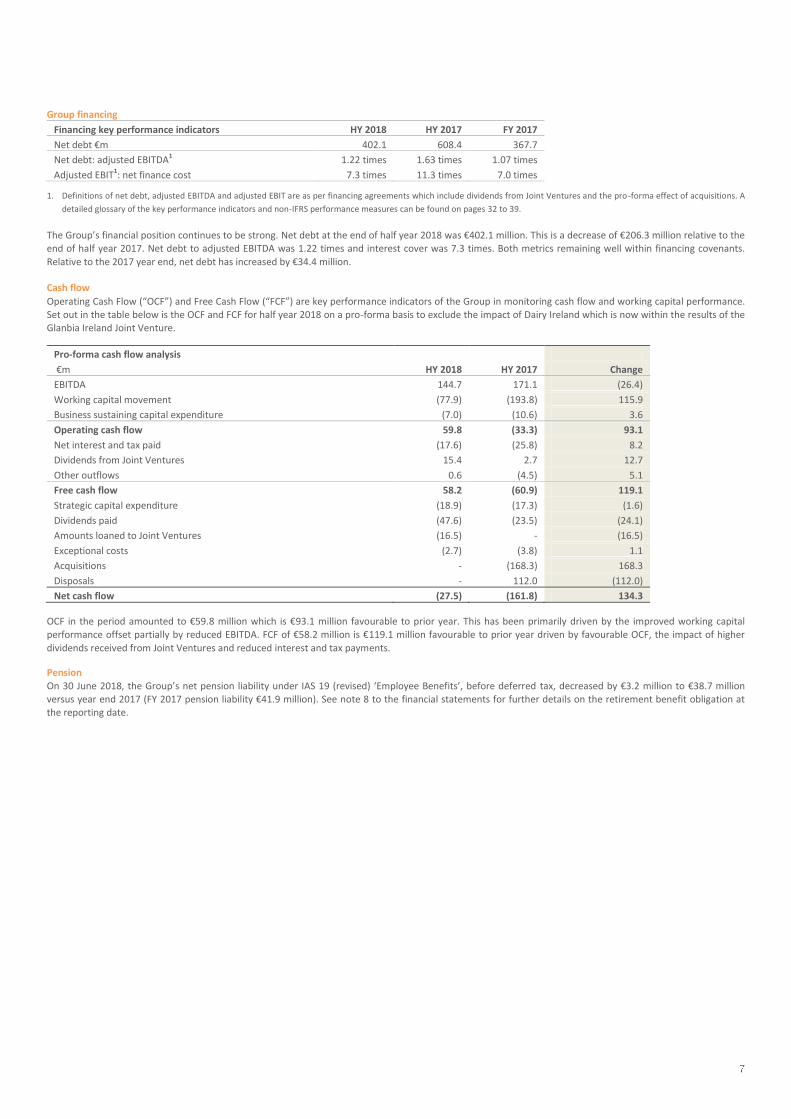
The Group’s financial position continues to be strong. Net debt at the end of half year 2018 was €402.1 million. This is a decrease of €206.3 million relative to the end of half year 2017. Net debt to adjusted EBITDA was 1.22 times and interest cover was 7.3 times. Both metrics remaining well within financing covenants.
Relative to the 2017 year end, net debt has increased by €34.4 million. Cash flow
Operating Cash Flow (“OCF”) and Free Cash Flow (“FCF”) are key performance indicators of the Group in monitoring cash flow and working capital performance. Set out in the table below is the OCF and FCF for half year 2018 on a pro-forma basis to exclude the impact of Dairy Ireland which is now within the results of the Glanbia Ireland Joint Venture.
Pro-forma cash flow analysis
€m HY 2018 HY 2017 Change
EBITDA 144.7 171.1 (26.4)
Working capital movement (77.9) (193.8) 115.9
Business sustaining capital expenditure (7.0) (10.6) 3.6
Operating cash flow 59.8 (33.3) 93.1
Net interest and tax paid (17.6) (25.8) 8.2
Dividends from Joint Ventures 15.4 2.7 12.7
Other outflows 0.6 (4.5) 5.1
Free cash flow 58.2 (60.9) 119.1
Strategic capital expenditure (18.9) (17.3) (1.6)
Dividends paid (47.6) (23.5) (24.1)
Amounts loaned to Joint Ventures (16.5) - (16.5)
Exceptional costs (2.7) (3.8) 1.1
Acquisitions - (168.3) 168.3
Disposals - 112.0 (112.0)
Net cash flow (27.5) (161.8) 134.3
OCF in the period amounted to €59.8 million which is €93.1 million favourable to prior year. This has been primarily driven by the improved working capital performance offset partially by reduced EBITDA. FCF of €58.2 million is €119.1 million favourable to prior year driven by favourable OCF, the impact of higher
dividends received from Joint Ventures and reduced interest and tax payments.
Pension
On 30 June 2018, the Group’s net pension liability under IAS 19 (revised) ‘Employee Benefits’, before deferred tax, decreased by €3.2 million to €38.7 million versus year end 2017 (FY 2017 pension liability €41.9 million). See note 8 to the financial statements for further details on the retirement benefit obligation at the reporting date.
Principal risks and uncertainties The Board of Glanbia plc has the ultimate responsibility for the Group’s systems of risk management and internal control. The Group’s risk management framework outlines the key stakeholder risk management responsibilities. It is designed to ensure that there is input across all levels of the business to the
management of risk and to enable the Group to remain responsive to the ever changing environment in which it operates. This framework, together with the processes to identify, manage and mitigate potential material risks to the achievement of the Group’s strategic objectives are set out in detail on pages 44-51 of the plc’s 2017 Annual Report.
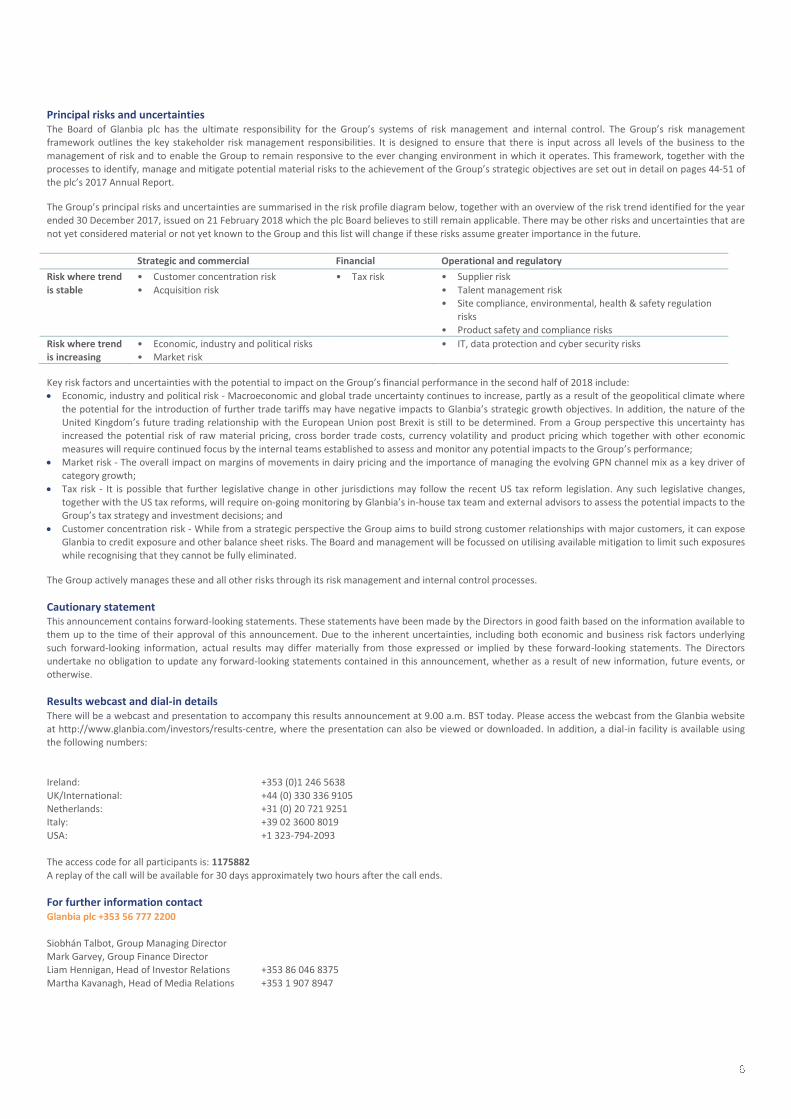
The Group’s principal risks and uncertainties are summarised in the risk profile diagram below, together with an overview of the risk trend identified for the year ended 30 December 2017, issued on 21 February 2018 which the plc Board believes to still remain applicable. There may be other risks and uncertainties that are
not yet considered material or not yet known to the Group and this list will change if these risks assume greater importance in the future.
Strategic and commercial Financial Operational and regulatory
Risk where trend
is stable
• Customer concentration risk
• Acquisition risk
• Tax risk • Supplier risk
• Talent management risk • Site compliance, environmental, health & safety regulation
risks
• Product safety and compliance risks
Risk where trend is increasing
• Economic, industry and political risks • Market risk
• IT, data protection and cyber security risks
Key risk factors and uncertainties with the potential to impact on the Group’s financial performance in the second half of 2018 include: Economic, industry and political risk - Macroeconomic and global trade uncertainty continues to increase, partly as a result of the geopolitical climate where
the potential for the introduction of further trade tariffs may have negative impacts to Glanbia’s strategic growth objectives. In addition, the nature of the United Kingdom’s future trading relationship with the European Union post Brexit is still to be determined. From a Group perspective this uncertainty has increased the potential risk of raw material pricing, cross border trade costs, currency volatility and product pricing which together with other economic
measures will require continued focus by the internal teams established to assess and monitor any potential impacts to the Group’s performance; Market risk - The overall impact on margins of movements in dairy pricing and the importance of managing the evolving GPN channel mix as a key driver of
category growth;
Tax risk - It is possible that further legislative change in other jurisdictions may follow the recent US tax reform legislation. Any such legislative changes, together with the US tax reforms, will require on-going monitoring by Glanbia’s in-house tax team and external advisors to assess the potential impacts to the Group’s tax strategy and investment decisions; and
Customer concentration risk - While from a strategic perspective the Group aims to build strong customer relationships with major customers, it can expose Glanbia to credit exposure and other balance sheet risks. The Board and management will be focussed on utilising available mitigation to limit such exposures while recognising that they cannot be fully eliminated.
The Group actively manages these and all other risks through its risk management and internal control processes.
Cautionary statement This announcement contains forward-looking statements. These statements have been made by the Directors in good faith based on the information available to them up to the time of their approval of this announcement. Due to the inherent uncertainties, including both economic and business risk factors underlying
such forward-looking information, actual results may differ materially from those expressed or implied by these forward-looking statements. The Directors undertake no obligation to update any forward-looking statements contained in this announcement, whether as a result of new information, future events, or otherwise.
Results webcast and dial-in details There will be a webcast and presentation to accompany this results announcement at 9.00 a.m. BST today. Please access the webcast from the Glanbia website at http://www.glanbia.com/investors/results-centre, where the presentation can also be viewed or downloaded. In addition, a dial-in facility is available using the following numbers:
Ireland: +353 (0)1 246 5638
UK/International: +44 (0) 330 336 9105 Netherlands: +31 (0) 20 721 9251 Italy: +39 02 3600 8019
USA: +1 323-794-2093 The access code for all participants is: 1175882
A replay of the call will be available for 30 days approximately two hours after the call ends.
For further information contact Glanbia plc +353 56 777 2200
Siobhán Talbot, Group Managing Director Mark Garvey, Group Finance Director
Liam Hennigan, Head of Investor Relations +353 86 046 8375
Martha Kavanagh, Head of Media Relations +353 1 907 8947
Responsibility statement The Directors are responsible for preparing the half yearly financial report in accordance with the Transparency (Directive 2004/109/EC) Regulations 2007 as amended, the related Transparency Rules of the Central Bank of Ireland and with IAS 34 ‘Interim Financial Reporting’, as adopted by the European Union.
The Directors of Glanbia plc confirm that, to the best of their knowledge:
The condensed Group interim financial statements for the period commencing 31 December 2017 and ended 30 June 2018 (six months/half year)
have been prepared in accordance with the International Accounting Standard applicable to interim financial reporting (IAS 34) adopted pursuant to the procedure provided for under Article 6 of the Regulation (EC) No. 1606/2002 of the European Parliament and of the Council of 19 July 2002;
The half yearly financial report includes a true review of the development and performance of the business and the position of the Group;
The half yearly financial report includes a true review of the important events that have occurred during the first six months of the financial year, their impact on the condensed Group financial statements for the half year ended 30 June 2018, and a description of the principal risks and uncertainties for the remaining six months; and
The half yearly financial report includes a true review of related party transactions that have occurred during the first six months of the current financial year that have materially affected the financial position or the performance of the Group during that period and any changes in the related party transactions described in the last Annual Report that could have a material effect on the financial position or the performance of the Group in
the first six months of the current financial year.
Board changes The Directors of Glanbia plc are as listed in the Glanbia plc 2017 Annual Report, with the exception of the following changes in the period relating to Glanbia Co-operative Society Limited (“Glanbia Co-op”) nominees on the Glanbia plc Board:
On 25 April 2018, Michael Keane retired as a Non-Executive Director of the Board at the plc’s AGM. On 1 June 2018 Henry Corbally retired as Chairman and
retired as a Non-Executive Director of the Board on 21 June 2018. On 1 June 2018 Martin Keane was appointed Chairman and Pat Murphy was appointed Vice
Chairman of the Board. On the same date, Patsy Ahern and Tom Grant retired as Non-Executive Directors of the Board and Jer Doheny was re-appointed Non-Executive Director. On 21 June Patsy Ahern was re-appointed Non-Executive Director of the Board.
Glanbia Co-operative Society Limited - Right to nominate Glanbia plc Directors In compliance with Listing Rule 6.2.2 A of the ISE/Listing Rule 9.2.2 AD of the UKLA, Glanbia plc has entered into a written legally binding agreement (the 'Relationship Agreement') with Glanbia Co-op, which is intended to ensure that Glanbia Co-op complies with the independence provisions/undertakings set out
in Listing Rule 3.3.7 A of the ISE and 6.5.4 R of the UKLA. This relationship agreement provides that the governance arrangements set out below will apply with respect to the composition and size of the Board of Glanbia plc. Glanbia Co-op currently owns 31.5% of the issued share capital of Glanbia plc. Between 2012 and 2017, Glanbia Co-op and the Board agreed the following changes, which will impact the composition and size of the Board between 2018 and 2022:
In 2018 the number of Glanbia Co-op Nominee Directors has reduced from ten to eight; In 2020 the number of Glanbia Co-op Nominee Directors will reduce from eight to seven, and In 2022 the number of Glanbia Co-op Nominee Directors will reduce from seven to six. It is the intention that Glanbia Co-op would continue to nominate a
Glanbia Co-op Nominee as Chairman of the Board until no later than 30 June 2020. Further, if Glanbia Co-op's shareholding in Glanbia plc falls below 28% of the issued share capital, discussions will take place regarding a further reduction in the
size of Glanbia Co-op's representation on the Board. A list of current directors is maintained on the Glanbia plc website: www.glanbia.com
On behalf of the Board
Siobhán Talbot Group Managing Director
Mark Garvey Group Finance Director
9 August 2018
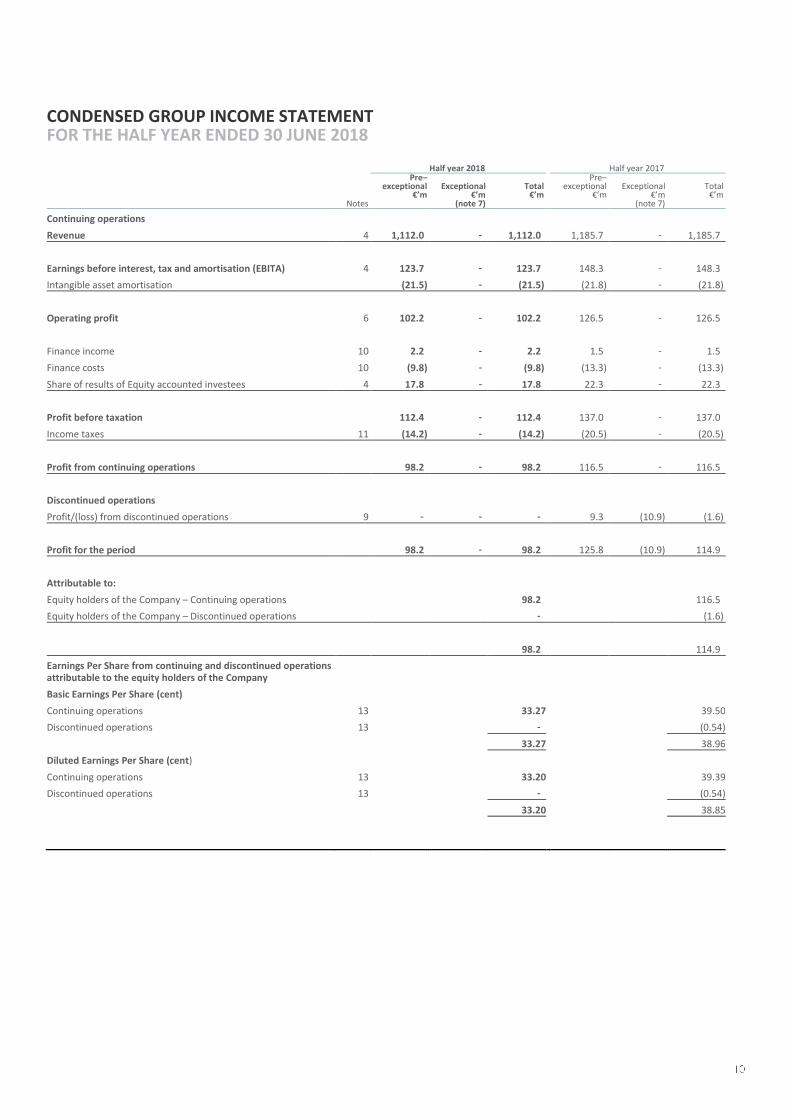
CONDENSED GROUP INCOME STATEMENT FOR THE HALF YEAR ENDED 30 JUNE 2018
Half year 2018 Half year 2017
Notes
Pre–exceptional
€’m
Exceptional
€’m (note 7)
Total €’m
Pre–exceptional
€’m
Exceptional
€’m (note 7)
Total €’m
Continuing operations
Revenue 4 1,112.0 - 1,112.0 1,185.7 - 1,185.7
Earnings before interest, tax and amortisation (EBITA) 4 123.7 - 123.7 148.3 - 148.3
Intangible asset amortisation (21.5) - (21.5) (21.8) - (21.8)
Operating profit 6 102.2 - 102.2 126.5 - 126.5
Finance income 10 2.2 - 2.2 1.5 - 1.5
Finance costs 10 (9.8) - (9.8) (13.3) - (13.3)
Share of results of Equity accounted investees 4 17.8 - 17.8 22.3 - 22.3
Profit before taxation 112.4 - 112.4 137.0 - 137.0
Income taxes 11 (14.2) - (14.2) (20.5) - (20.5)
Profit from continuing operations 98.2 - 98.2 116.5 - 116.5
Discontinued operations
Profit/(loss) from discontinued operations 9 - - - 9.3 (10.9) (1.6)
Profit for the period 98.2 - 98.2 125.8 (10.9) 114.9
Attributable to:
Equity holders of the Company – Continuing operations 98.2 116.5
Equity holders of the Company – Discontinued operations - (1.6)
98.2 114.9
Earnings Per Share from continuing and discontinued operations attributable to the equity holders of the Company
Basic Earnings Per Share (cent)
Continuing operations 13 33.27 39.50
Discontinued operations 13 - (0.54)
33.27 38.96
Diluted Earnings Per Share (cent)
Continuing operations 13 33.20 39.39
Discontinued operations 13 - (0.54)
33.20 38.85
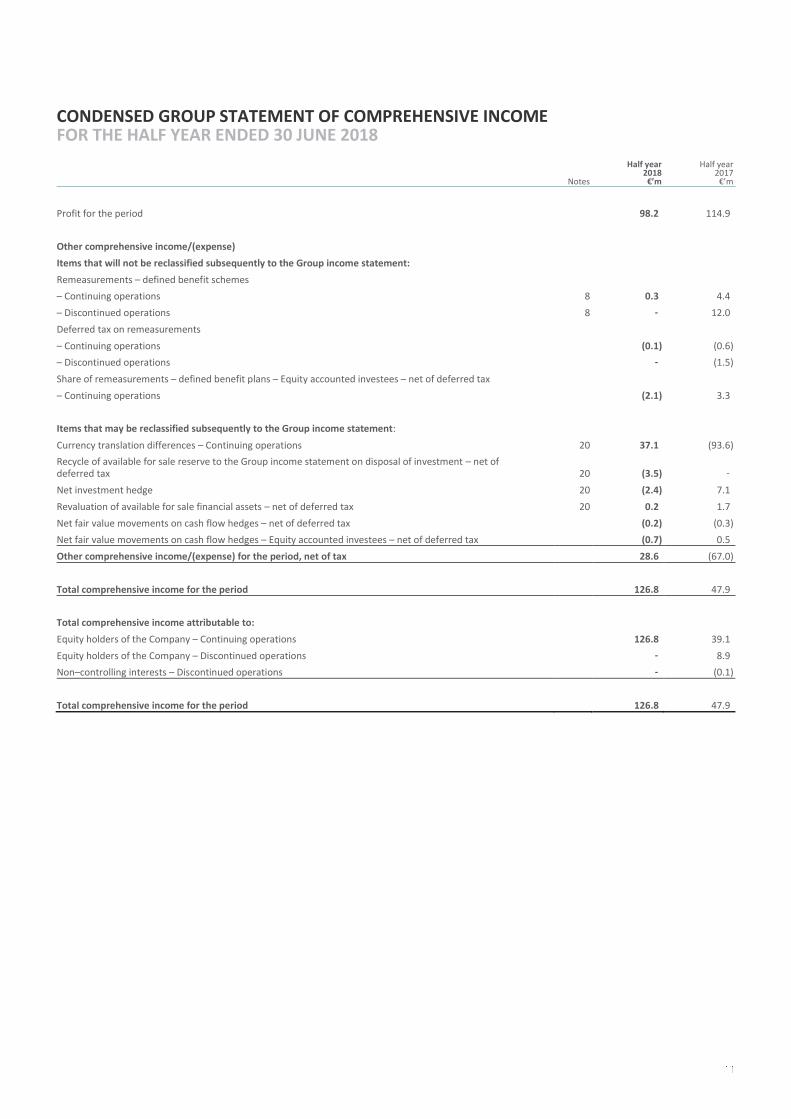
CONDENSED GROUP STATEMENT OF COMPREHENSIVE INCOME FOR THE HALF YEAR ENDED 30 JUNE 2018
Notes
Half year 2018 €’m
Half year 2017
€’m
Profit for the period 98.2 114.9
Other comprehensive income/(expense)
Items that will not be reclassified subsequently to the Group income statement:
Remeasurements – defined benefit schemes
– Continuing operations 8 0.3 4.4
– Discontinued operations 8 - 12.0
Deferred tax on remeasurements
– Continuing operations (0.1) (0.6)
– Discontinued operations - (1.5)
Share of remeasurements – defined benefit plans – Equity accounted investees – net of deferred tax
– Continuing operations (2.1) 3.3
Items that may be reclassified subsequently to the Group income statement:
Currency translation differences – Continuing operations 20 37.1 (93.6)
Recycle of available for sale reserve to the Group income statement on disposal of investment – net of deferred tax 20 (3.5) -
Net investment hedge 20 (2.4) 7.1
Revaluation of available for sale financial assets – net of deferred tax 20 0.2 1.7
Net fair value movements on cash flow hedges – net of deferred tax (0.2) (0.3)
Net fair value movements on cash flow hedges – Equity accounted investees – net of deferred tax (0.7) 0.5
Other comprehensive income/(expense) for the period, net of tax 28.6 (67.0)
Total comprehensive income for the period 126.8 47.9
Total comprehensive income attributable to:
Equity holders of the Company – Continuing operations 126.8 39.1
Equity holders of the Company – Discontinued operations - 8.9
Non–controlling interests – Discontinued operations - (0.1)
Total comprehensive income for the period 126.8 47.9
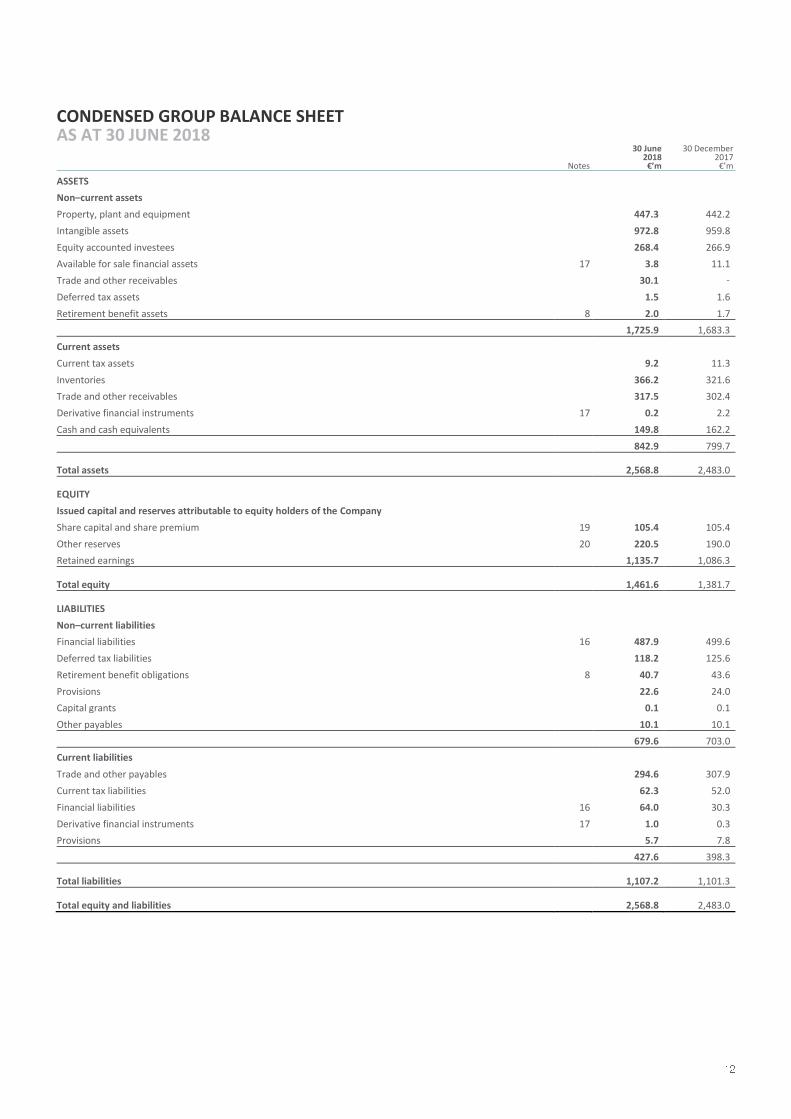
CONDENSED GROUP BALANCE SHEET AS AT 30 JUNE 2018
Notes
30 June 2018 €’m
30 December 2017
€’m
ASSETS Non–current assets
Property, plant and equipment 447.3 442.2
Intangible assets 972.8 959.8
Equity accounted investees 268.4 266.9
Available for sale financial assets 17 3.8 11.1
Trade and other receivables 30.1 -
Deferred tax assets 1.5 1.6
Retirement benefit assets 8 2.0 1.7
1,725.9 1,683.3
Current assets
Current tax assets 9.2 11.3
Inventories 366.2 321.6
Trade and other receivables 317.5 302.4
Derivative financial instruments 17 0.2 2.2
Cash and cash equivalents 149.8 162.2
842.9 799.7
Total assets 2,568.8 2,483.0
EQUITY
Issued capital and reserves attributable to equity holders of the Company
Share capital and share premium 19 105.4 105.4
Other reserves 20 220.5 190.0
Retained earnings 1,135.7 1,086.3
Total equity 1,461.6 1,381.7
LIABILITIES
Non–current liabilities
Financial liabilities 16 487.9 499.6
Deferred tax liabilities 118.2 125.6
Retirement benefit obligations 8 40.7 43.6
Provisions 22.6 24.0
Capital grants 0.1 0.1
Other payables 10.1 10.1
679.6 703.0
Current liabilities
Trade and other payables 294.6 307.9
Current tax liabilities 62.3 52.0
Financial liabilities 16 64.0 30.3
Derivative financial instruments 17 1.0 0.3
Provisions 5.7 7.8
427.6 398.3
Total liabilities 1,107.2 1,101.3 Total equity and liabilities 2,568.8 2,483.0
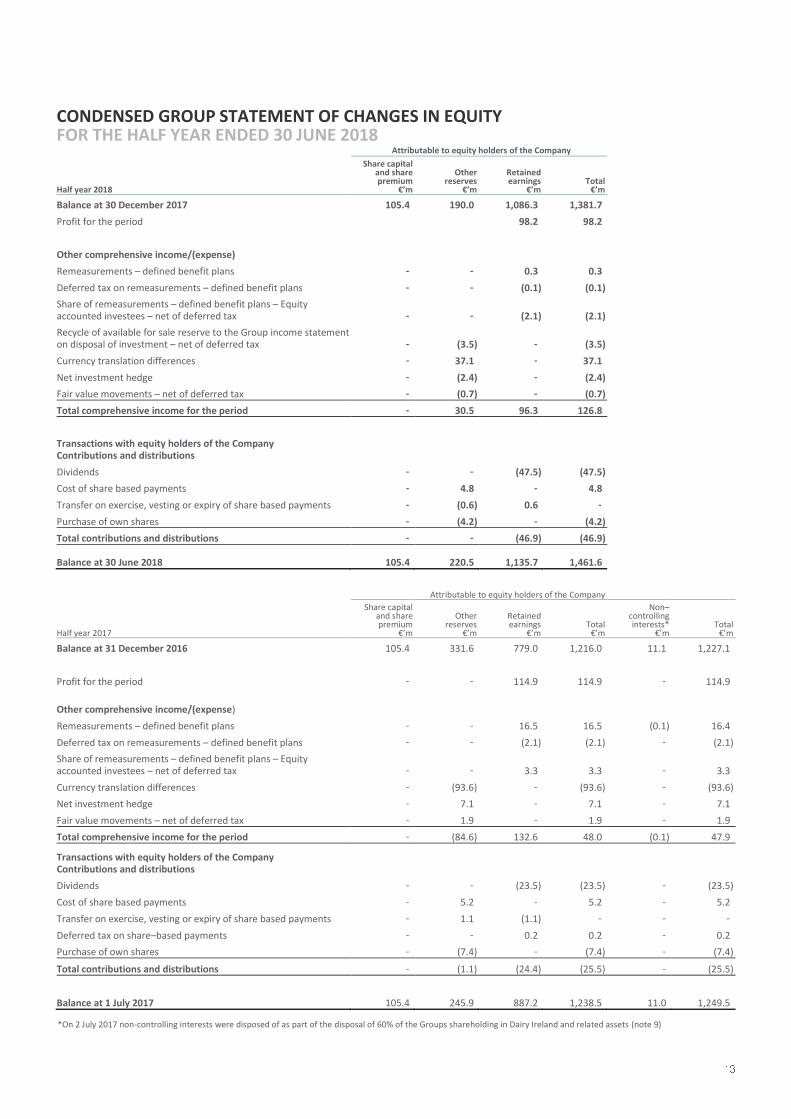
CONDENSED GROUP STATEMENT OF CHANGES IN EQUITY FOR THE HALF YEAR ENDED 30 JUNE 2018
Attributable to equity holders of the Company
Half year 2018
Share capital and share premium
€’m
Other reserves
€’m
Retained earnings
€’m Total
€’m
Balance at 30 December 2017 105.4 190.0 1,086.3 1,381.7
Profit for the period 98.2 98.2
Other comprehensive income/(expense)
Remeasurements – defined benefit plans - - 0.3 0.3
Deferred tax on remeasurements – defined benefit plans - - (0.1) (0.1)
Share of remeasurements – defined benefit plans – Equity accounted investees – net of deferred tax - - (2.1) (2.1)
Recycle of available for sale reserve to the Group income statement on disposal of investment – net of deferred tax - (3.5) - (3.5)
Currency translation differences - 37.1 - 37.1
Net investment hedge - (2.4) - (2.4)
Fair value movements – net of deferred tax - (0.7) - (0.7)
Total comprehensive income for the period - 30.5 96.3 126.8
Transactions with equity holders of the Company Contributions and distributions
Dividends - - (47.5) (47.5)
Cost of share based payments - 4.8 - 4.8
Transfer on exercise, vesting or expiry of share based payments - (0.6) 0.6 -
Purchase of own shares - (4.2) - (4.2)
Total contributions and distributions - - (46.9) (46.9) Balance at 30 June 2018 105.4 220.5 1,135.7 1,461.6
Attributable to equity holders of the Company
Half year 2017
Share capital and share premium
€’m
Other reserves
€’m
Retained earnings
€’m Total
€’m
Non– controlling interests*
€’m Total
€’m
Balance at 31 December 2016 105.4 331.6 779.0 1,216.0 11.1 1,227.1
Profit for the period - - 114.9 114.9 - 114.9
Other comprehensive income/(expense)
Remeasurements – defined benefit plans - - 16.5 16.5 (0.1) 16.4
Deferred tax on remeasurements – defined benefit plans - - (2.1) (2.1) - (2.1)
Share of remeasurements – defined benefit plans – Equity accounted investees – net of deferred tax - - 3.3 3.3 - 3.3
Currency translation differences - (93.6) - (93.6) - (93.6)
Net investment hedge - 7.1 - 7.1 - 7.1
Fair value movements – net of deferred tax - 1.9 - 1.9 - 1.9
Total comprehensive income for the period - (84.6) 132.6 48.0 (0.1) 47.9 Transactions with equity holders of the Company Contributions and distributions
Dividends - - (23.5) (23.5) - (23.5)
Cost of share based payments - 5.2 - 5.2 - 5.2
Transfer on exercise, vesting or expiry of share based payments - 1.1 (1.1) - - -
Deferred tax on share–based payments - - 0.2 0.2 - 0.2
Purchase of own shares - (7.4) - (7.4) - (7.4)
Total contributions and distributions - (1.1) (24.4) (25.5) - (25.5)
Balance at 1 July 2017 105.4 245.9 887.2 1,238.5 11.0 1,249.5
*On 2 July 2017 non-controlling interests were disposed of as part of the disposal of 60% of the Groups shareholding in Dairy Ireland and related assets (note 9)
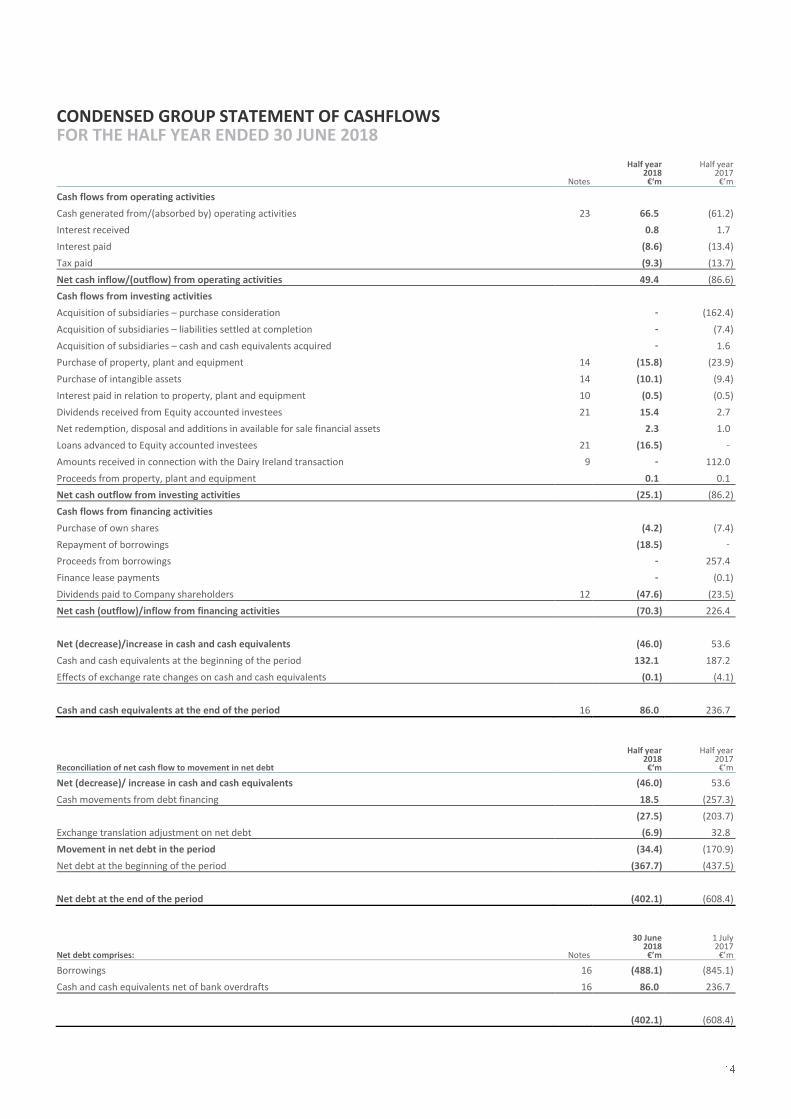
CONDENSED GROUP STATEMENT OF CASHFLOWS FOR THE HALF YEAR ENDED 30 JUNE 2018
Notes
Half year 2018 €‘m
Half year 2017
€’m
Cash flows from operating activities
Cash generated from/(absorbed by) operating activities 23 66.5 (61.2)
Interest received 0.8 1.7
Interest paid (8.6) (13.4)
Tax paid (9.3) (13.7)
Net cash inflow/(outflow) from operating activities 49.4 (86.6)
Cash flows from investing activities
Acquisition of subsidiaries – purchase consideration - (162.4)
Acquisition of subsidiaries – liabilities settled at completion - (7.4)
Acquisition of subsidiaries – cash and cash equivalents acquired - 1.6
Purchase of property, plant and equipment 14 (15.8) (23.9)
Purchase of intangible assets 14 (10.1) (9.4)
Interest paid in relation to property, plant and equipment 10 (0.5) (0.5)
Dividends received from Equity accounted investees 21 15.4 2.7
Net redemption, disposal and additions in available for sale financial assets 2.3 1.0
Loans advanced to Equity accounted investees 21 (16.5) -
Amounts received in connection with the Dairy Ireland transaction 9 - 112.0
Proceeds from property, plant and equipment 0.1 0.1
Net cash outflow from investing activities (25.1) (86.2)
Cash flows from financing activities
Purchase of own shares (4.2) (7.4)
Repayment of borrowings (18.5) -
Proceeds from borrowings - 257.4
Finance lease payments - (0.1)
Dividends paid to Company shareholders 12 (47.6) (23.5)
Net cash (outflow)/inflow from financing activities (70.3) 226.4
Net (decrease)/increase in cash and cash equivalents (46.0) 53.6
Cash and cash equivalents at the beginning of the period 132.1 187.2
Effects of exchange rate changes on cash and cash equivalents (0.1) (4.1)
Cash and cash equivalents at the end of the period 16 86.0 236.7
Reconciliation of net cash flow to movement in net debt
Half year 2018 €‘m
Half year 2017
€’m
Net (decrease)/ increase in cash and cash equivalents (46.0) 53.6
Cash movements from debt financing 18.5 (257.3)
(27.5) (203.7)
Exchange translation adjustment on net debt (6.9) 32.8
Movement in net debt in the period (34.4) (170.9)
Net debt at the beginning of the period (367.7) (437.5)
Net debt at the end of the period (402.1) (608.4)
Net debt comprises: Notes
30 June 2018 €’m
1 July 2017
€’m
Borrowings 16 (488.1) (845.1)
Cash and cash equivalents net of bank overdrafts 16 86.0 236.7
(402.1) (608.4)
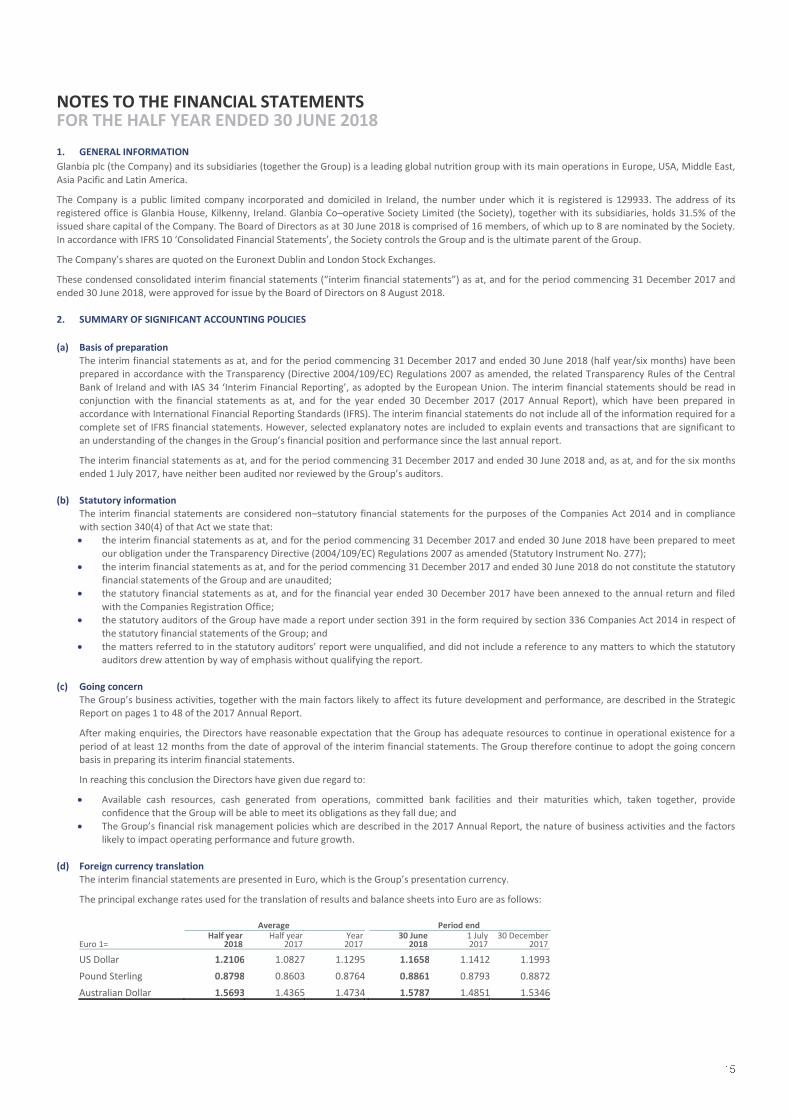
NOTES TO THE FINANCIAL STATEMENTS FOR THE HALF YEAR ENDED 30 JUNE 2018
1. GENERAL INFORMATION
Glanbia plc (the Company) and its subsidiaries (together the Group) is a leading global nutrition group with its main operations in Europe, USA, Middle East,
Asia Pacific and Latin America.
The Company is a public limited company incorporated and domiciled in Ireland, the number under which it is registered is 129933. The address of its registered office is Glanbia House, Kilkenny, Ireland. Glanbia Co–operative Society Limited (the Society), together with its subsidiaries, holds 31.5% of the issued share capital of the Company. The Board of Directors as at 30 June 2018 is comprised of 16 members, of which up to 8 are nominated by the Society.
In accordance with IFRS 10 ‘Consolidated Financial Statements’, the Society controls the Group and is the ultimate parent of the Group.
The Company’s shares are quoted on the Euronext Dublin and London Stock Exchanges.
These condensed consolidated interim financial statements (“interim financial statements”) as at, and for the period commencing 31 December 2017 and ended 30 June 2018, were approved for issue by the Board of Directors on 8 August 2018.
2. SUMMARY OF SIGNIFICANT ACCOUNTING POLICIES
(a) Basis of preparation The interim financial statements as at, and for the period commencing 31 December 2017 and ended 30 June 2018 (half year/six months) have been prepared in accordance with the Transparency (Directive 2004/109/EC) Regulations 2007 as amended, the related Transparency Rules of the Central
Bank of Ireland and with IAS 34 ‘Interim Financial Reporting’, as adopted by the European Union. The interim financial statements should be read in conjunction with the financial statements as at, and for the year ended 30 December 2017 (2017 Annual Report), which have been prepared in accordance with International Financial Reporting Standards (IFRS). The interim financial statements do not include all of the information required for a
complete set of IFRS financial statements. However, selected explanatory notes are included to explain events and transactions that are significant to an understanding of the changes in the Group’s financial position and performance since the last annual report.
The interim financial statements as at, and for the period commencing 31 December 2017 and ended 30 June 2018 and, as at, and for the six months ended 1 July 2017, have neither been audited nor reviewed by the Group’s auditors.
(b) Statutory information
The interim financial statements are considered non–statutory financial statements for the purposes of the Companies Act 2014 and in compliance
with section 340(4) of that Act we state that: the interim financial statements as at, and for the period commencing 31 December 2017 and ended 30 June 2018 have been prepared to meet
our obligation under the Transparency Directive (2004/109/EC) Regulations 2007 as amended (Statutory Instrument No. 277);
the interim financial statements as at, and for the period commencing 31 December 2017 and ended 30 June 2018 do not constitute the statutory financial statements of the Group and are unaudited;
the statutory financial statements as at, and for the financial year ended 30 December 2017 have been annexed to the annual return and filed
with the Companies Registration Office; the statutory auditors of the Group have made a report under section 391 in the form required by section 336 Companies Act 2014 in respect of
the statutory financial statements of the Group; and
the matters referred to in the statutory auditors’ report were unqualified, and did not include a reference to any matters to which the statutory auditors drew attention by way of emphasis without qualifying the report.
(c) Going concern The Group’s business activities, together with the main factors likely to affect its future development and performance, are described in the Strategic Report on pages 1 to 48 of the 2017 Annual Report.
After making enquiries, the Directors have reasonable expectation that the Group has adequate resources to continue in operational existence for a
period of at least 12 months from the date of approval of the interim financial statements. The Group therefore continue to adopt the going concern basis in preparing its interim financial statements.
In reaching this conclusion the Directors have given due regard to:
Available cash resources, cash generated from operations, committed bank facilities and their maturities which, taken together, provide confidence that the Group will be able to meet its obligations as they fall due; and
The Group’s financial risk management policies which are described in the 2017 Annual Report, the nature of business activities and the factors likely to impact operating performance and future growth.
(d) Foreign currency translation The interim financial statements are presented in Euro, which is the Group’s presentation currency.
The principal exchange rates used for the translation of results and balance sheets into Euro are as follows: Average Period end
Euro 1= Half year
2018 Half year
2017 Year 2017
30 June 2018
1 July 2017
30 December 2017
US Dollar 1.2106 1.0827 1.1295 1.1658 1.1412 1.1993
Pound Sterling 0.8798 0.8603 0.8764 0.8861 0.8793 0.8872
Australian Dollar 1.5693 1.4365 1.4734 1.5787 1.4851 1.5346
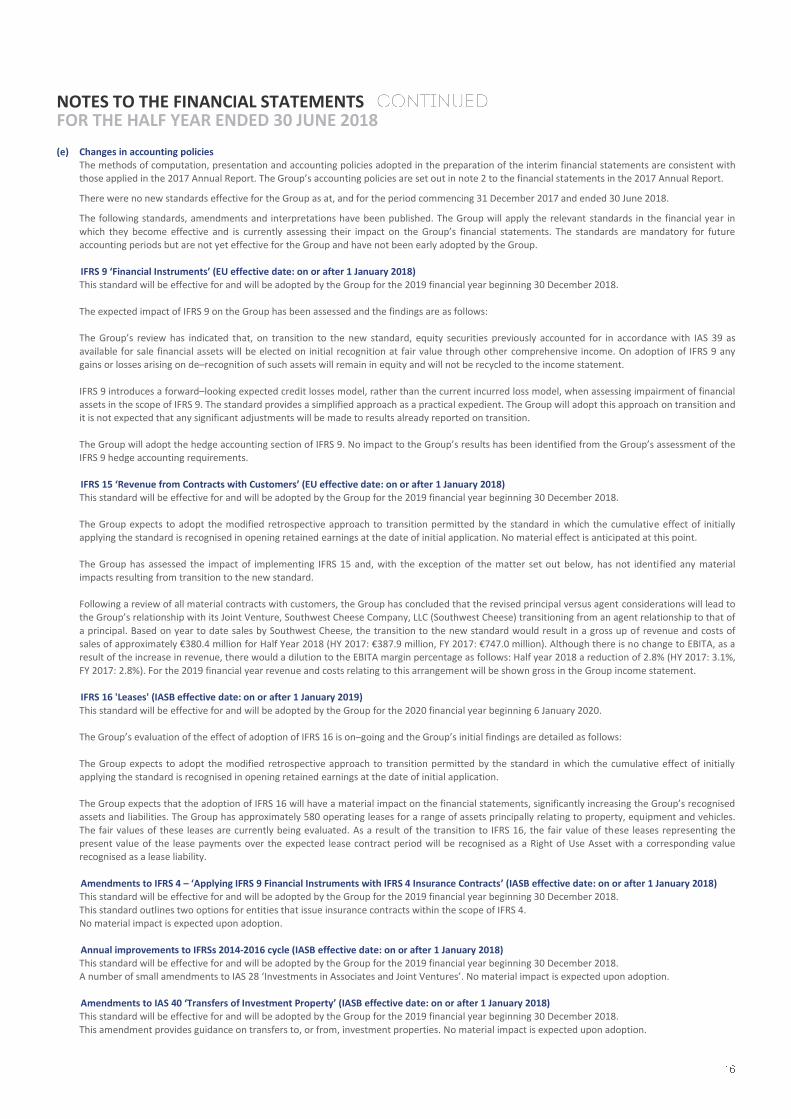
NOTES TO THE FINANCIAL STATEMENTS FOR THE HALF YEAR ENDED 30 JUNE 2018
(e) Changes in accounting policies The methods of computation, presentation and accounting policies adopted in the preparation of the interim financial statements are consistent with those applied in the 2017 Annual Report. The Group’s accounting policies are set out in note 2 to the financial statements in the 2017 Annual Report.
There were no new standards effective for the Group as at, and for the period commencing 31 December 2017 and ended 30 June 2018.
The following standards, amendments and interpretations have been published. The Group will apply the relevant standards in the financial year in
which they become effective and is currently assessing their impact on the Group’s financial statements. The standards are mandatory for future accounting periods but are not yet effective for the Group and have not been early adopted by the Group.
IFRS 9 ‘Financial Instruments’ (EU effective date: on or after 1 January 2018) This standard will be effective for and will be adopted by the Group for the 2019 financial year beginning 30 December 2018.
The expected impact of IFRS 9 on the Group has been assessed and the findings are as follows: The Group’s review has indicated that, on transition to the new standard, equity securities previously accounted for in accordance with IAS 39 as
available for sale financial assets will be elected on initial recognition at fair value through other comprehensive income. On adoption of IFRS 9 any gains or losses arising on de–recognition of such assets will remain in equity and will not be recycled to the income statement.
IFRS 9 introduces a forward–looking expected credit losses model, rather than the current incurred loss model, when assessing impairment of financial assets in the scope of IFRS 9. The standard provides a simplified approach as a practical expedient. The Group will adopt this approach on transition and it is not expected that any significant adjustments will be made to results already reported on transition.
The Group will adopt the hedge accounting section of IFRS 9. No impact to the Group’s results has been identified from the Group’s assessment of the IFRS 9 hedge accounting requirements.
IFRS 15 ‘Revenue from Contracts with Customers’ (EU effective date: on or after 1 January 2018) This standard will be effective for and will be adopted by the Group for the 2019 financial year beginning 30 December 2018.
The Group expects to adopt the modified retrospective approach to transition permitted by the standard in which the cumulative effect of initially applying the standard is recognised in opening retained earnings at the date of initial application. No material effect is anticipated at this point.
The Group has assessed the impact of implementing IFRS 15 and, with the exception of the matter set out below, has not identified any material impacts resulting from transition to the new standard.
Following a review of all material contracts with customers, the Group has concluded that the revised principal versus agent considerations will lead to the Group’s relationship with its Joint Venture, Southwest Cheese Company, LLC (Southwest Cheese) transitioning from an agent relationship to that of
a principal. Based on year to date sales by Southwest Cheese, the transition to the new standard would result in a gross up of revenue and costs of sales of approximately €380.4 million for Half Year 2018 (HY 2017: €387.9 million, FY 2017: €747.0 million). Although there is no change to EBITA, as a result of the increase in revenue, there would a dilution to the EBITA margin percentage as follows: Half year 2018 a reduction of 2.8% (HY 2017: 3.1%,
FY 2017: 2.8%). For the 2019 financial year revenue and costs relating to this arrangement will be shown gross in the Group income statement. IFRS 16 'Leases' (IASB effective date: on or after 1 January 2019)
This standard will be effective for and will be adopted by the Group for the 2020 financial year beginning 6 January 2020. The Group’s evaluation of the effect of adoption of IFRS 16 is on–going and the Group’s initial findings are detailed as follows:
The Group expects to adopt the modified retrospective approach to transition permitted by the standard in which the cumulative effect of initially applying the standard is recognised in opening retained earnings at the date of initial application.
The Group expects that the adoption of IFRS 16 will have a material impact on the financial statements, significantly increasing the Group’s recognised assets and liabilities. The Group has approximately 580 operating leases for a range of assets principally relating to property, equipment and vehicles.
The fair values of these leases are currently being evaluated. As a result of the transition to IFRS 16, the fair value of these leases representing the present value of the lease payments over the expected lease contract period will be recognised as a Right of Use Asset with a corresponding value recognised as a lease liability.
Amendments to IFRS 4 – ‘Applying IFRS 9 Financial Instruments with IFRS 4 Insurance Contracts’ (IASB effective date: on or after 1 January 2018) This standard will be effective for and will be adopted by the Group for the 2019 financial year beginning 30 December 2018.
This standard outlines two options for entities that issue insurance contracts within the scope of IFRS 4. No material impact is expected upon adoption.
Annual improvements to IFRSs 2014-2016 cycle (IASB effective date: on or after 1 January 2018) This standard will be effective for and will be adopted by the Group for the 2019 financial year beginning 30 December 2018. A number of small amendments to IAS 28 ‘Investments in Associates and Joint Ventures’. No material impact is expected upon adoption.
Amendments to IAS 40 ‘Transfers of Investment Property’ (IASB effective date: on or after 1 January 2018) This standard will be effective for and will be adopted by the Group for the 2019 financial year beginning 30 December 2018.
This amendment provides guidance on transfers to, or from, investment properties. No material impact is expected upon adoption.
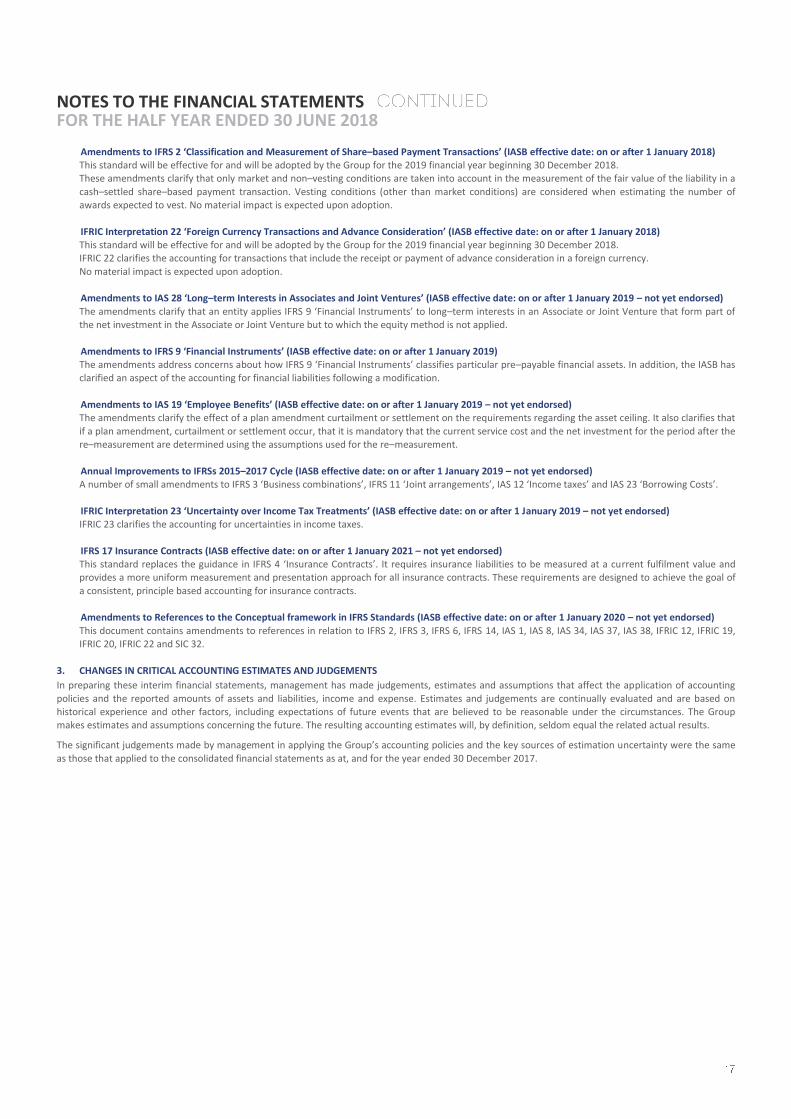
NOTES TO THE FINANCIAL STATEMENTS FOR THE HALF YEAR ENDED 30 JUNE 2018
Amendments to IFRS 2 ‘Classification and Measurement of Share–based Payment Transactions’ (IASB effective date: on or after 1 January 2018) This standard will be effective for and will be adopted by the Group for the 2019 financial year beginning 30 December 2018. These amendments clarify that only market and non–vesting conditions are taken into account in the measurement of the fair value of the liability in a
cash–settled share–based payment transaction. Vesting conditions (other than market conditions) are considered when estimating the number of awards expected to vest. No material impact is expected upon adoption.
IFRIC Interpretation 22 ‘Foreign Currency Transactions and Advance Consideration’ (IASB effective date: on or after 1 January 2018) This standard will be effective for and will be adopted by the Group for the 2019 financial year beginning 30 December 2018. IFRIC 22 clarifies the accounting for transactions that include the receipt or payment of advance consideration in a foreign currency.
No material impact is expected upon adoption. Amendments to IAS 28 ‘Long–term Interests in Associates and Joint Ventures’ (IASB effective date: on or after 1 January 2019 – not yet endorsed)
The amendments clarify that an entity applies IFRS 9 ‘Financial Instruments’ to long–term interests in an Associate or Joint Venture that form part of the net investment in the Associate or Joint Venture but to which the equity method is not applied.
Amendments to IFRS 9 ‘Financial Instruments’ (IASB effective date: on or after 1 January 2019) The amendments address concerns about how IFRS 9 ‘Financial Instruments’ classifies particular pre–payable financial assets. In addition, the IASB has clarified an aspect of the accounting for financial liabilities following a modification.
Amendments to IAS 19 ‘Employee Benefits’ (IASB effective date: on or after 1 January 2019 – not yet endorsed) The amendments clarify the effect of a plan amendment curtailment or settlement on the requirements regarding the asset ceiling. It also clarifies that
if a plan amendment, curtailment or settlement occur, that it is mandatory that the current service cost and the net investment for the period after the re–measurement are determined using the assumptions used for the re–measurement.
Annual Improvements to IFRSs 2015–2017 Cycle (IASB effective date: on or after 1 January 2019 – not yet endorsed) A number of small amendments to IFRS 3 ‘Business combinations’, IFRS 11 ‘Joint arrangements’, IAS 12 ‘Income taxes’ and IAS 23 ‘Borrowing Costs’.
IFRIC Interpretation 23 ‘Uncertainty over Income Tax Treatments’ (IASB effective date: on or after 1 January 2019 – not yet endorsed) IFRIC 23 clarifies the accounting for uncertainties in income taxes.
IFRS 17 Insurance Contracts (IASB effective date: on or after 1 January 2021 – not yet endorsed) This standard replaces the guidance in IFRS 4 ‘Insurance Contracts’. It requires insurance liabilities to be measured at a current fulfilment value and provides a more uniform measurement and presentation approach for all insurance contracts. These requirements are designed to achieve the goal of
a consistent, principle based accounting for insurance contracts.
Amendments to References to the Conceptual framework in IFRS Standards (IASB effective date: on or after 1 January 2020 – not yet endorsed)
This document contains amendments to references in relation to IFRS 2, IFRS 3, IFRS 6, IFRS 14, IAS 1, IAS 8, IAS 34, IAS 37, IAS 38, IFRIC 12, IFRIC 19, IFRIC 20, IFRIC 22 and SIC 32.
3. CHANGES IN CRITICAL ACCOUNTING ESTIMATES AND JUDGEMENTS
In preparing these interim financial statements, management has made judgements, estimates and assumptions that affect the application of accounting
policies and the reported amounts of assets and liabilities, income and expense. Estimates and judgements are continually evaluated and are based on historical experience and other factors, including expectations of future events that are believed to be reasonable under the circumstances. The Group makes estimates and assumptions concerning the future. The resulting accounting estimates will, by definition, seldom equal the related actual results.
The significant judgements made by management in applying the Group’s accounting policies and the key sources of estimation uncertainty were the same
as those that applied to the consolidated financial statements as at, and for the year ended 30 December 2017.
NOTES TO THE FINANCIAL STATEMENTS FOR THE HALF YEAR ENDED 30 JUNE 2018
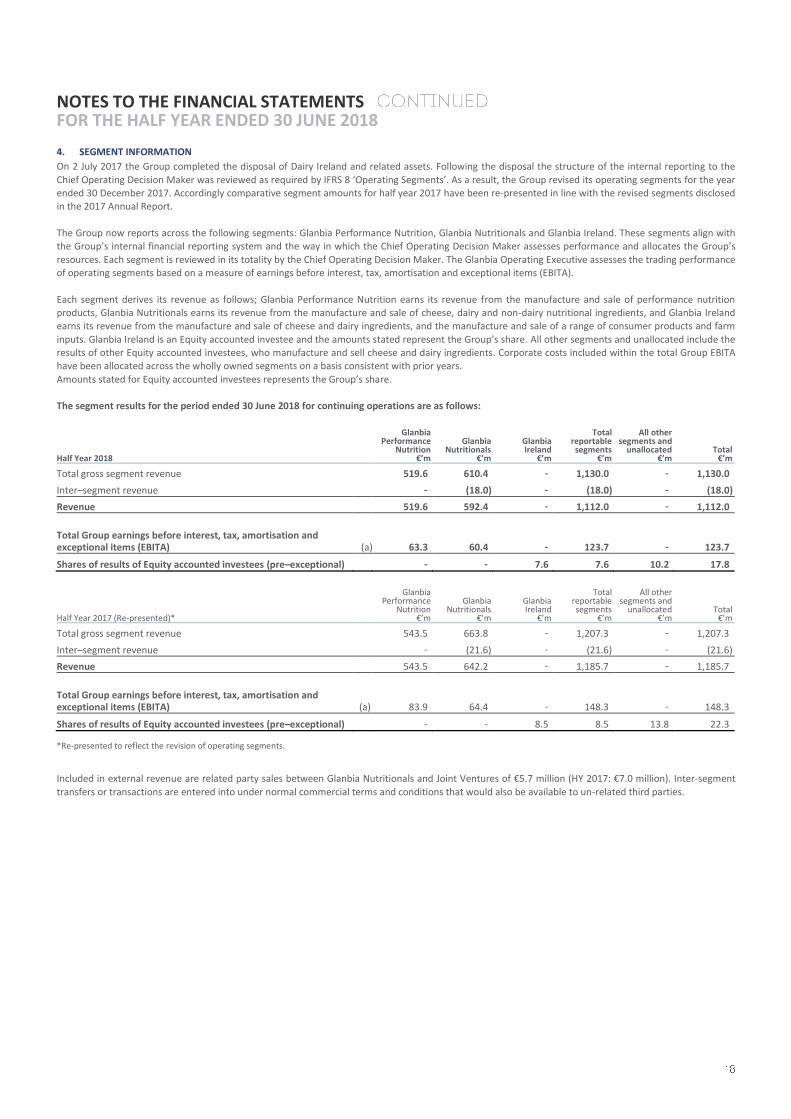
4. SEGMENT INFORMATION
On 2 July 2017 the Group completed the disposal of Dairy Ireland and related assets. Following the disposal the structure of the internal reporting to the
Chief Operating Decision Maker was reviewed as required by IFRS 8 ‘Operating Segments’. As a result, the Group revised its operating segments for the year ended 30 December 2017. Accordingly comparative segment amounts for half year 2017 have been re-presented in line with the revised segments disclosed in the 2017 Annual Report.
The Group now reports across the following segments: Glanbia Performance Nutrition, Glanbia Nutritionals and Glanbia Ireland. These segments align with the Group’s internal financial reporting system and the way in which the Chief Operating Decision Maker assesses performance and allocates the Group’s
resources. Each segment is reviewed in its totality by the Chief Operating Decision Maker. The Glanbia Operating Executive assesses the trading performance of operating segments based on a measure of earnings before interest, tax, amortisation and exceptional items (EBITA).
Each segment derives its revenue as follows; Glanbia Performance Nutrition earns its revenue from the manufacture and sale of performance nutrition products, Glanbia Nutritionals earns its revenue from the manufacture and sale of cheese, dairy and non-dairy nutritional ingredients, and Glanbia Ireland earns its revenue from the manufacture and sale of cheese and dairy ingredients, and the manufacture and sale of a range of consumer products and farm
inputs. Glanbia Ireland is an Equity accounted investee and the amounts stated represent the Group’s share. All other segments and unallocated include the results of other Equity accounted investees, who manufacture and sell cheese and dairy ingredients. Corporate costs included within the total Group EBITA have been allocated across the wholly owned segments on a basis consistent with prior years.
Amounts stated for Equity accounted investees represents the Group’s share. The segment results for the period ended 30 June 2018 for continuing operations are as follows:
Half Year 2018
Glanbia Performance
Nutrition €’m
Glanbia Nutritionals
€’m
Glanbia Ireland
€’m
Total reportable segments
€’m
All other segments and
unallocated €’m
Total €’m
Total gross segment revenue 519.6 610.4 - 1,130.0 - 1,130.0
Inter–segment revenue - (18.0) - (18.0) - (18.0)
Revenue 519.6 592.4 - 1,112.0 - 1,112.0
Total Group earnings before interest, tax, amortisation and exceptional items (EBITA) (a) 63.3 60.4 - 123.7 - 123.7
Shares of results of Equity accounted investees (pre–exceptional) - - 7.6 7.6 10.2 17.8
Half Year 2017 (Re-presented)*
Glanbia Performance
Nutrition €’m
Glanbia Nutritionals
€’m
Glanbia Ireland
€’m
Total reportable segments
€’m
All other segments and
unallocated €’m
Total €’m
Total gross segment revenue 543.5 663.8 - 1,207.3 - 1,207.3
Inter–segment revenue - (21.6) - (21.6) - (21.6)
Revenue 543.5 642.2 - 1,185.7 - 1,185.7
Total Group earnings before interest, tax, amortisation and exceptional items (EBITA) (a) 83.9 64.4 - 148.3 - 148.3
Shares of results of Equity accounted investees (pre–exceptional) - - 8.5 8.5 13.8 22.3
*Re-presented to reflect the revision of operating segments.
Included in external revenue are related party sales between Glanbia Nutritionals and Joint Ventures of €5.7 million (HY 2017: €7.0 million). Inter-segment
transfers or transactions are entered into under normal commercial terms and conditions that would also be available to un-related third parties.
NOTES TO THE FINANCIAL STATEMENTS FOR THE HALF YEAR ENDED 30 JUNE 2018
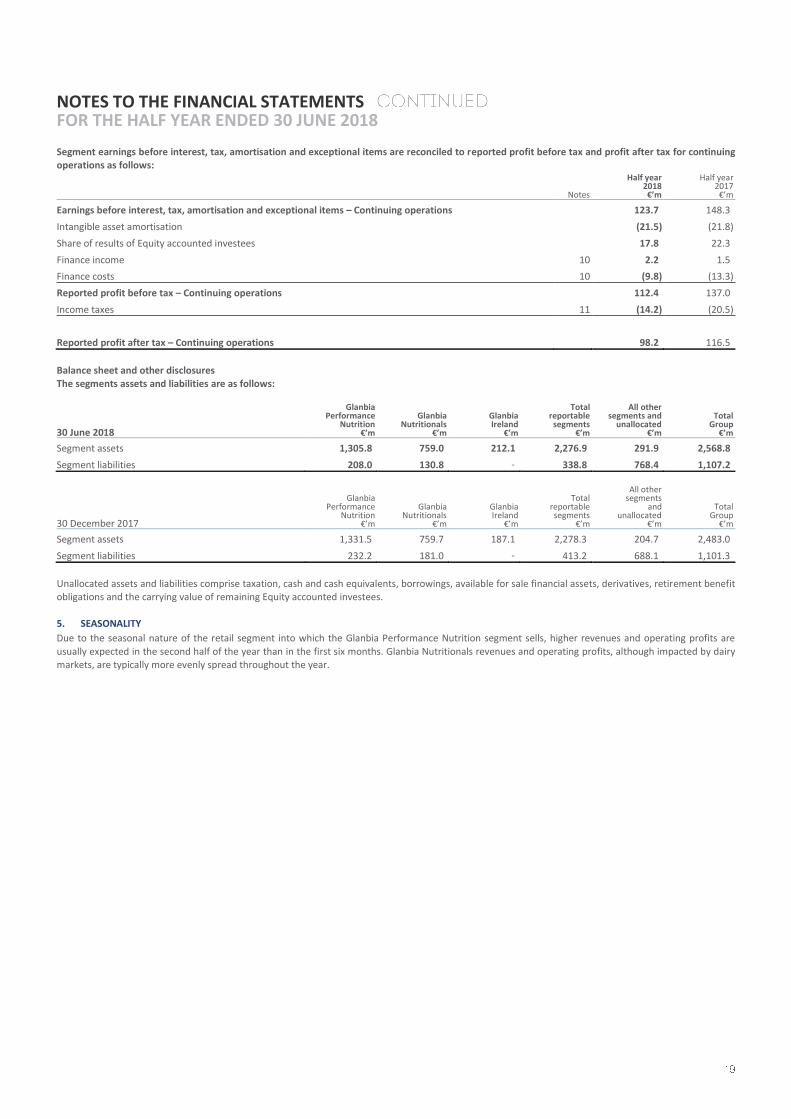
Segment earnings before interest, tax, amortisation and exceptional items are reconciled to reported profit before tax and profit after tax for continuing operations as follows:
Notes
Half year 2018 €’m
Half year 2017
€’m
Earnings before interest, tax, amortisation and exceptional items – Continuing operations 123.7 148.3
Intangible asset amortisation (21.5) (21.8)
Share of results of Equity accounted investees 17.8 22.3
Finance income 10 2.2 1.5
Finance costs 10 (9.8) (13.3)
Reported profit before tax – Continuing operations 112.4 137.0
Income taxes 11 (14.2) (20.5)
Reported profit after tax – Continuing operations 98.2 116.5
Balance sheet and other disclosures The segments assets and liabilities are as follows:
30 June 2018
Glanbia Performance
Nutrition €’m
Glanbia Nutritionals
€’m
Glanbia Ireland
€’m
Total reportable segments
€’m
All other segments and
unallocated €’m
Total Group
€’m
Segment assets 1,305.8 759.0 212.1 2,276.9 291.9 2,568.8
Segment liabilities 208.0 130.8 - 338.8 768.4 1,107.2
30 December 2017
Glanbia Performance
Nutrition €’m
Glanbia Nutritionals
€’m
Glanbia Ireland
€’m
Total reportable
segments €’m
All other segments
and unallocated
€’m
Total Group
€’m
Segment assets 1,331.5 759.7 187.1 2,278.3 204.7 2,483.0
Segment liabilities 232.2 181.0 - 413.2 688.1 1,101.3
Unallocated assets and liabilities comprise taxation, cash and cash equivalents, borrowings, available for sale financial assets, derivatives, retirement benefit obligations and the carrying value of remaining Equity accounted investees.
5. SEASONALITY
Due to the seasonal nature of the retail segment into which the Glanbia Performance Nutrition segment sells, higher revenues and operating profits are
usually expected in the second half of the year than in the first six months. Glanbia Nutritionals revenues and operating profits, although impacted by dairy markets, are typically more evenly spread throughout the year.
NOTES TO THE FINANCIAL STATEMENTS FOR THE HALF YEAR ENDED 30 JUNE 2018
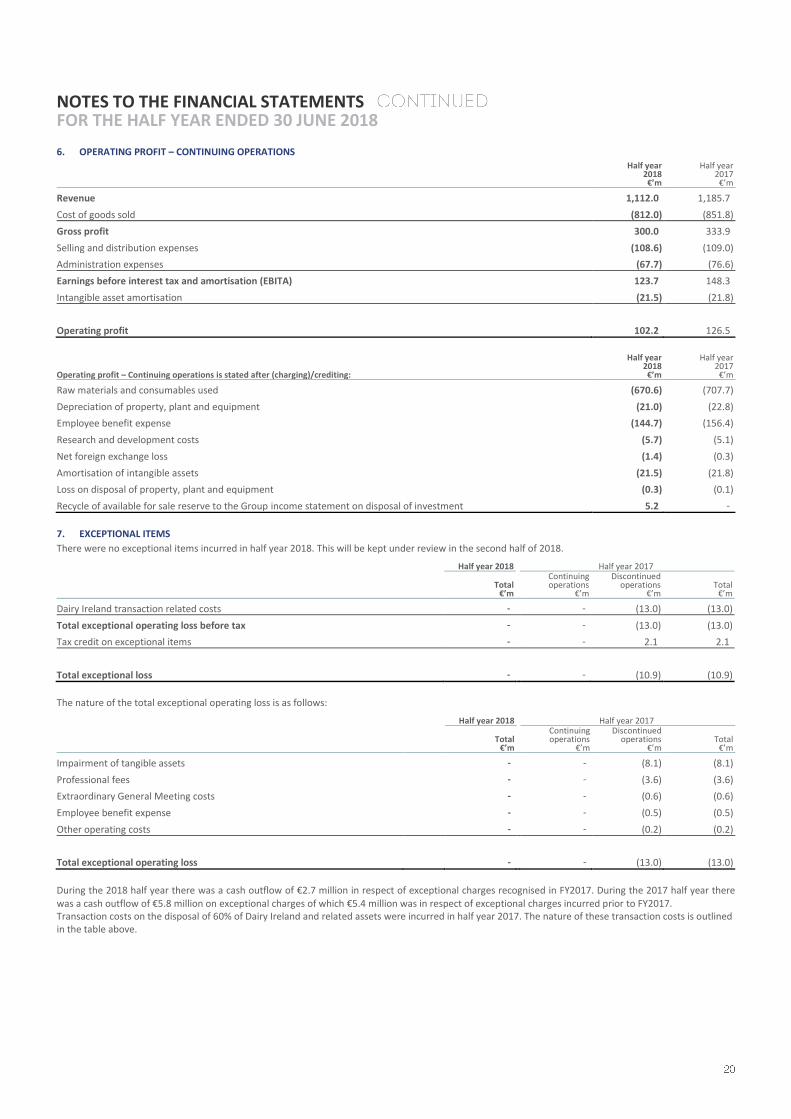
6. OPERATING PROFIT – CONTINUING OPERATIONS
Half year 2018 €’m
Half year 2017
€’m
Revenue 1,112.0 1,185.7
Cost of goods sold (812.0) (851.8)
Gross profit 300.0 333.9
Selling and distribution expenses (108.6) (109.0)
Administration expenses (67.7) (76.6)
Earnings before interest tax and amortisation (EBITA) 123.7 148.3
Intangible asset amortisation (21.5) (21.8)
Operating profit 102.2 126.5
Operating profit – Continuing operations is stated after (charging)/crediting:
Half year 2018 €’m
Half year 2017
€’m
Raw materials and consumables used (670.6) (707.7)
Depreciation of property, plant and equipment (21.0) (22.8)
Employee benefit expense (144.7) (156.4)
Research and development costs (5.7) (5.1)
Net foreign exchange loss (1.4) (0.3)
Amortisation of intangible assets (21.5) (21.8)
Loss on disposal of property, plant and equipment (0.3) (0.1)
Recycle of available for sale reserve to the Group income statement on disposal of investment 5.2 -
7. EXCEPTIONAL ITEMS
There were no exceptional items incurred in half year 2018. This will be kept under review in the second half of 2018.
Half year 2018 Half year 2017
Total
€’m
Continuing operations
€’m
Discontinued operations
€’m Total
€’m
Dairy Ireland transaction related costs - - (13.0) (13.0)
Total exceptional operating loss before tax - - (13.0) (13.0)
Tax credit on exceptional items - - 2.1 2.1
Total exceptional loss - - (10.9) (10.9)
The nature of the total exceptional operating loss is as follows:
Half year 2018 Half year 2017
Total
€’m
Continuing operations
€’m
Discontinued operations
€’m Total
€’m
Impairment of tangible assets - - (8.1) (8.1)
Professional fees - - (3.6) (3.6)
Extraordinary General Meeting costs - - (0.6) (0.6)
Employee benefit expense - - (0.5) (0.5)
Other operating costs - - (0.2) (0.2)
Total exceptional operating loss - - (13.0) (13.0)
During the 2018 half year there was a cash outflow of €2.7 million in respect of exceptional charges recognised in FY2017. During the 2017 half year there was a cash outflow of €5.8 million on exceptional charges of which €5.4 million was in respect of exceptional charges incurred prior to FY2017. Transaction costs on the disposal of 60% of Dairy Ireland and related assets were incurred in half year 2017. The nature of these transaction costs is outlined in the table above.
NOTES TO THE FINANCIAL STATEMENTS FOR THE HALF YEAR ENDED 30 JUNE 2018
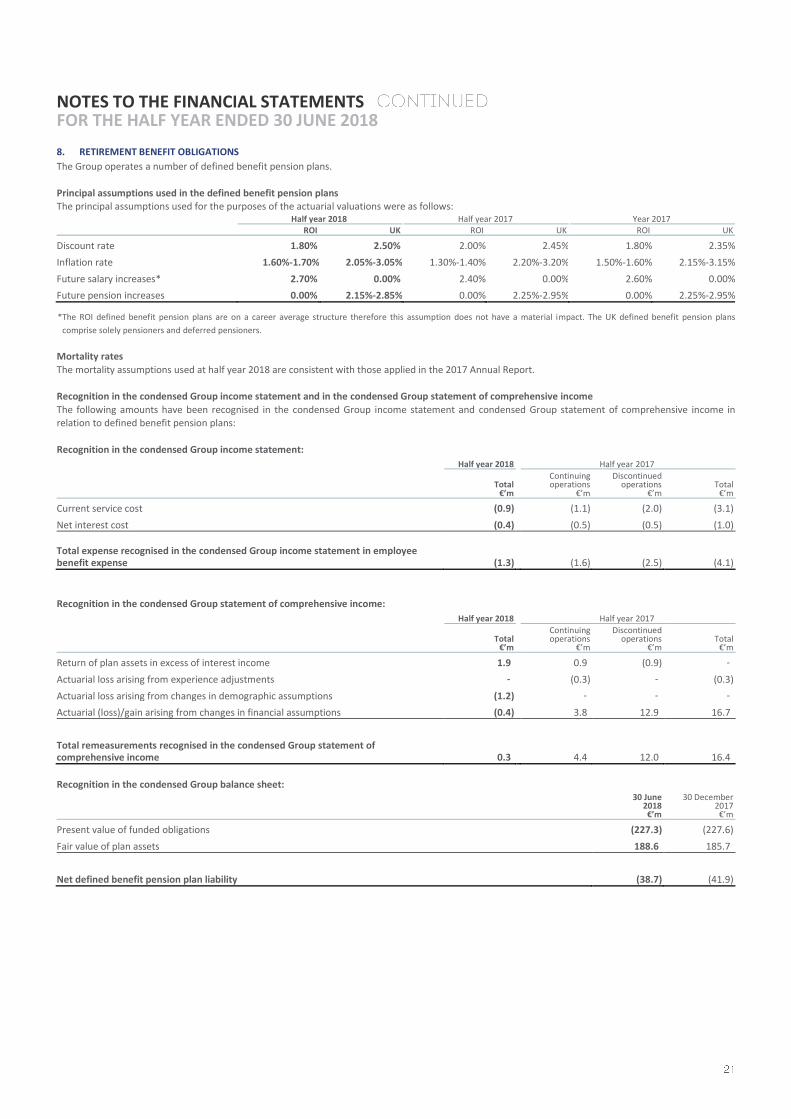
8. RETIREMENT BENEFIT OBLIGATIONS
The Group operates a number of defined benefit pension plans.
Principal assumptions used in the defined benefit pension plans The principal assumptions used for the purposes of the actuarial valuations were as follows:
Half year 2018 Half year 2017 Year 2017 ROI UK ROI UK ROI UK
Discount rate 1.80% 2.50% 2.00% 2.45% 1.80% 2.35%
Inflation rate 1.60%-1.70% 2.05%-3.05% 1.30%-1.40% 2.20%-3.20% 1.50%-1.60% 2.15%-3.15%
Future salary increases* 2.70% 0.00% 2.40% 0.00% 2.60% 0.00%
Future pension increases 0.00% 2.15%-2.85% 0.00% 2.25%-2.95% 0.00% 2.25%-2.95%
*The ROI defined benefit pension plans are on a career average structure therefore this assumption does not have a material impact. The UK defined benefit pension plans
comprise solely pensioners and deferred pensioners.
Mortality rates
The mortality assumptions used at half year 2018 are consistent with those applied in the 2017 Annual Report. Recognition in the condensed Group income statement and in the condensed Group statement of comprehensive income
The following amounts have been recognised in the condensed Group income statement and condensed Group statement of comprehensive income in relation to defined benefit pension plans:
Recognition in the condensed Group income statement:
Half year 2018 Half year 2017
Total
€’m
Continuing operations
€’m
Discontinued operations
€’m Total
€’m
Current service cost (0.9) (1.1) (2.0) (3.1)
Net interest cost (0.4) (0.5) (0.5) (1.0)
Total expense recognised in the condensed Group income statement in employee benefit expense (1.3)
(1.6) (2.5) (4.1)
Recognition in the condensed Group statement of comprehensive income:
Half year 2018 Half year 2017
Total
€’m
Continuing operations
€’m
Discontinued operations
€’m Total
€’m
Return of plan assets in excess of interest income 1.9 0.9 (0.9) -
Actuarial loss arising from experience adjustments - (0.3) - (0.3)
Actuarial loss arising from changes in demographic assumptions (1.2) - - -
Actuarial (loss)/gain arising from changes in financial assumptions (0.4) 3.8 12.9 16.7
Total remeasurements recognised in the condensed Group statement of comprehensive income 0.3
4.4 12.0 16.4
Recognition in the condensed Group balance sheet:
30 June 2018 €’m
30 December 2017
€’m
Present value of funded obligations (227.3) (227.6)
Fair value of plan assets 188.6 185.7
Net defined benefit pension plan liability (38.7) (41.9)
NOTES TO THE FINANCIAL STATEMENTS FOR THE HALF YEAR ENDED 30 JUNE 2018
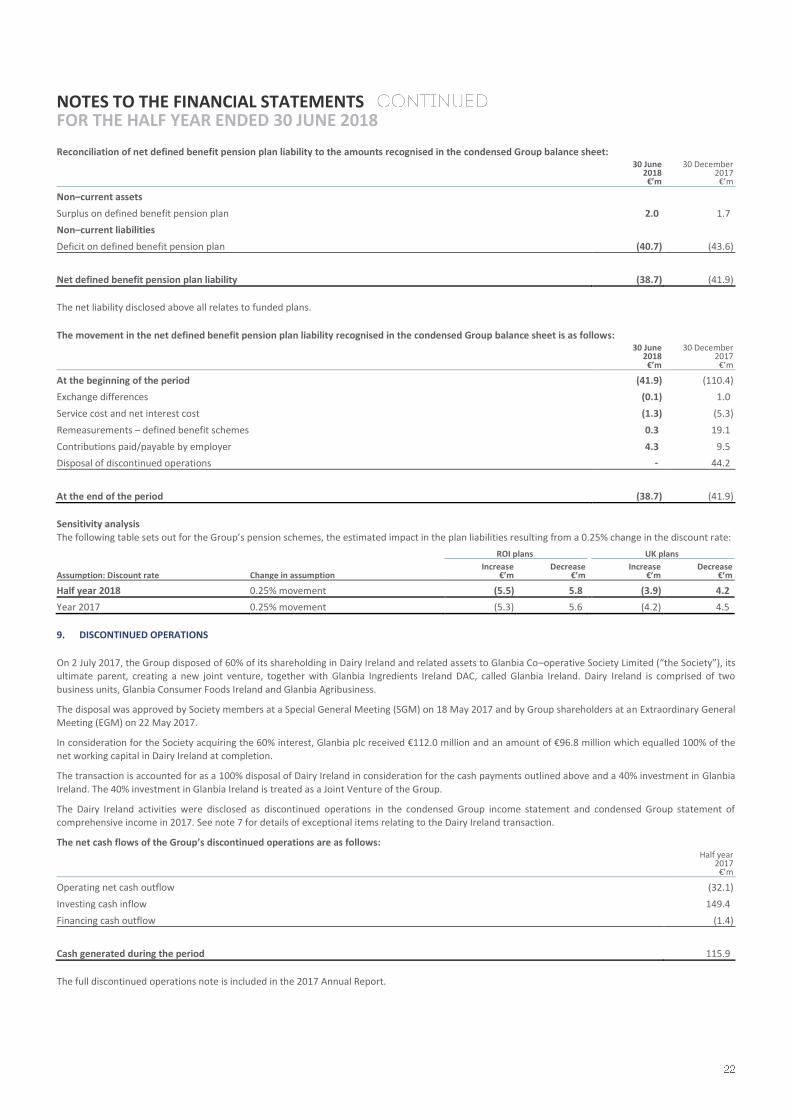
Reconciliation of net defined benefit pension plan liability to the amounts recognised in the condensed Group balance sheet:
30 June 2018 €’m
30 December 2017
€’m
Non–current assets
Surplus on defined benefit pension plan 2.0 1.7
Non–current liabilities
Deficit on defined benefit pension plan (40.7) (43.6)
Net defined benefit pension plan liability (38.7) (41.9)
The net liability disclosed above all relates to funded plans.
The movement in the net defined benefit pension plan liability recognised in the condensed Group balance sheet is as follows: 30 June
2018 €’m
30 December 2017
€’m
At the beginning of the period (41.9) (110.4)
Exchange differences (0.1) 1.0
Service cost and net interest cost (1.3) (5.3)
Remeasurements – defined benefit schemes 0.3 19.1
Contributions paid/payable by employer 4.3 9.5
Disposal of discontinued operations - 44.2
At the end of the period (38.7) (41.9)
Sensitivity analysis
The following table sets out for the Group’s pension schemes, the estimated impact in the plan liabilities resulting from a 0.25% change in the discount rate:
ROI plans UK plans
Assumption: Discount rate Change in assumption Increase
€’m Decrease
€’m Increase
€’m Decrease
€’m
Half year 2018 0.25% movement (5.5) 5.8 (3.9) 4.2
Year 2017 0.25% movement (5.3) 5.6 (4.2) 4.5
9. DISCONTINUED OPERATIONS
On 2 July 2017, the Group disposed of 60% of its shareholding in Dairy Ireland and related assets to Glanbia Co–operative Society Limited (“the Society”), its ultimate parent, creating a new joint venture, together with Glanbia Ingredients Ireland DAC, called Glanbia Ireland. Dairy Ireland is comprised of two
business units, Glanbia Consumer Foods Ireland and Glanbia Agribusiness.
The disposal was approved by Society members at a Special General Meeting (SGM) on 18 May 2017 and by Group shareholders at an Extraordinary General Meeting (EGM) on 22 May 2017.
In consideration for the Society acquiring the 60% interest, Glanbia plc received €112.0 million and an amount of €96.8 million which equalled 100% of the net working capital in Dairy Ireland at completion.
The transaction is accounted for as a 100% disposal of Dairy Ireland in consideration for the cash payments outlined above and a 40% investment in Glanbia
Ireland. The 40% investment in Glanbia Ireland is treated as a Joint Venture of the Group.
The Dairy Ireland activities were disclosed as discontinued operations in the condensed Group income statement and condensed Group statement of comprehensive income in 2017. See note 7 for details of exceptional items relating to the Dairy Ireland transaction.
The net cash flows of the Group’s discontinued operations are as follows:
Half year 2017
€’m
Operating net cash outflow (32.1)
Investing cash inflow 149.4
Financing cash outflow (1.4)
Cash generated during the period 115.9
The full discontinued operations note is included in the 2017 Annual Report.
NOTES TO THE FINANCIAL STATEMENTS FOR THE HALF YEAR ENDED 30 JUNE 2018
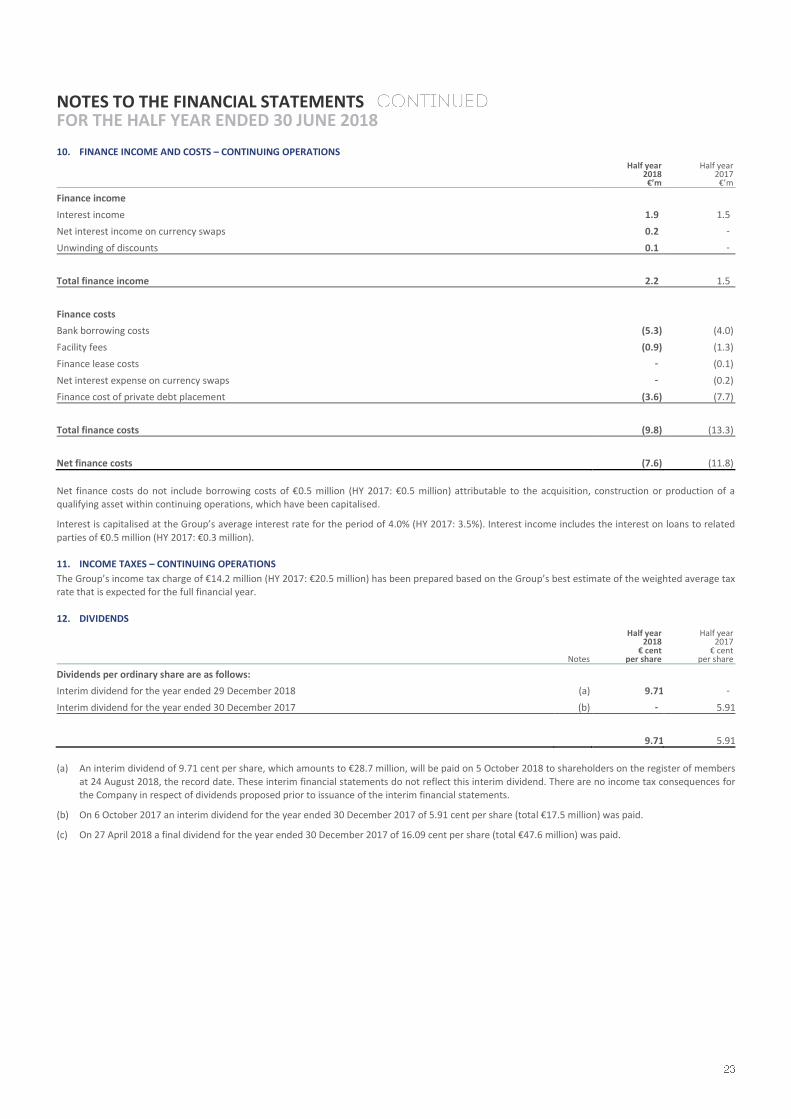
10. FINANCE INCOME AND COSTS – CONTINUING OPERATIONS
Half year 2018 €’m
Half year 2017
€’m
Finance income
Interest income 1.9 1.5
Net interest income on currency swaps 0.2 -
Unwinding of discounts 0.1 -
Total finance income 2.2 1.5
Finance costs
Bank borrowing costs (5.3) (4.0)
Facility fees (0.9) (1.3)
Finance lease costs - (0.1)
Net interest expense on currency swaps - (0.2)
Finance cost of private debt placement (3.6) (7.7)
Total finance costs (9.8) (13.3)
Net finance costs (7.6) (11.8)
Net finance costs do not include borrowing costs of €0.5 million (HY 2017: €0.5 million) attributable to the acquisition, construction or production of a qualifying asset within continuing operations, which have been capitalised.
Interest is capitalised at the Group’s average interest rate for the period of 4.0% (HY 2017: 3.5%). Interest income includes the interest on loans to related
parties of €0.5 million (HY 2017: €0.3 million). 11. INCOME TAXES – CONTINUING OPERATIONS
The Group’s income tax charge of €14.2 million (HY 2017: €20.5 million) has been prepared based on the Group’s best estimate of the weighted average tax rate that is expected for the full financial year.
12. DIVIDENDS
Notes
Half year 2018
€ cent per share
Half year 2017
€ cent per share
Dividends per ordinary share are as follows:
Interim dividend for the year ended 29 December 2018 (a) 9.71 -
Interim dividend for the year ended 30 December 2017 (b) - 5.91
9.71 5.91
(a) An interim dividend of 9.71 cent per share, which amounts to €28.7 million, will be paid on 5 October 2018 to shareholders on the register of members
at 24 August 2018, the record date. These interim financial statements do not reflect this interim dividend. There are no income tax consequences for the Company in respect of dividends proposed prior to issuance of the interim financial statements.
(b) On 6 October 2017 an interim dividend for the year ended 30 December 2017 of 5.91 cent per share (total €17.5 million) was paid.
(c) On 27 April 2018 a final dividend for the year ended 30 December 2017 of 16.09 cent per share (total €47.6 million) was paid.
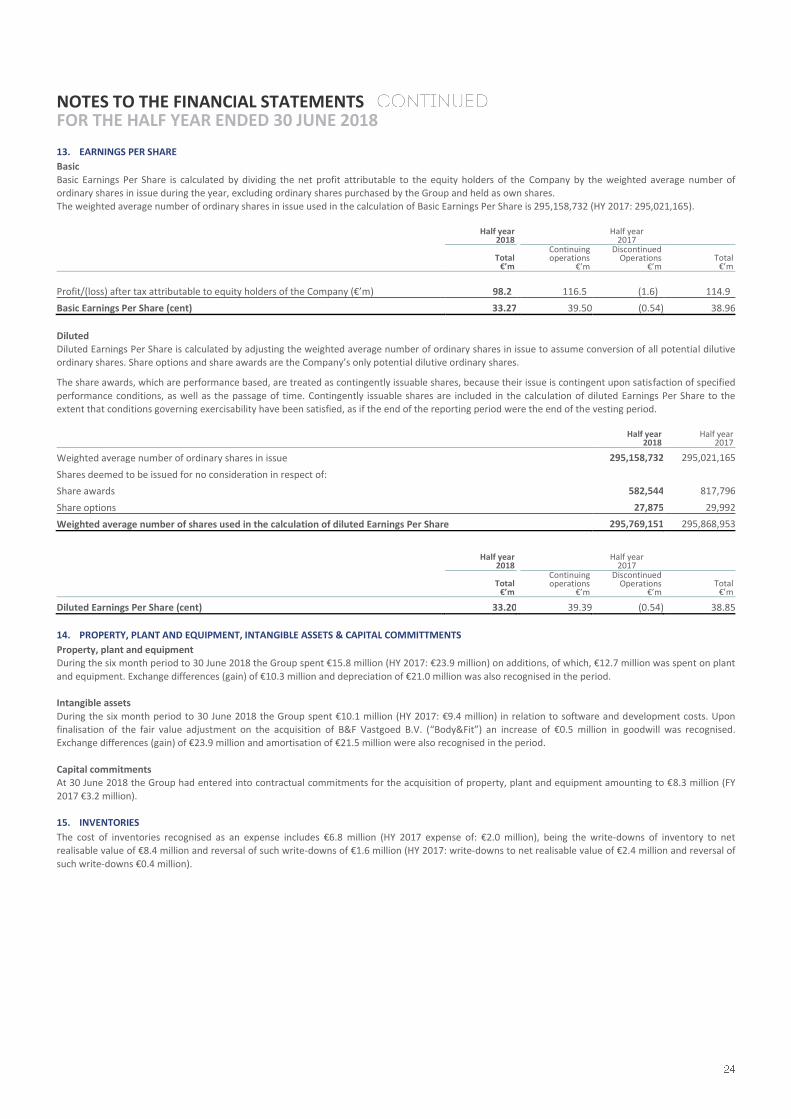
NOTES TO THE FINANCIAL STATEMENTS FOR THE HALF YEAR ENDED 30 JUNE 2018
13. EARNINGS PER SHARE
Basic
Basic Earnings Per Share is calculated by dividing the net profit attributable to the equity holders of the Company by the weighted average number of ordinary shares in issue during the year, excluding ordinary shares purchased by the Group and held as own shares. The weighted average number of ordinary shares in issue used in the calculation of Basic Earnings Per Share is 295,158,732 (HY 2017: 295,021,165).
Half year
2018
Half year
2017
Total
€’m
Continuing operations
€’m
Discontinued Operations
€’m Total
€’m
Profit/(loss) after tax attributable to equity holders of the Company (€’m) 98.2
116.5 (1.6) 114.9
Basic Earnings Per Share (cent) 33.27
39.50 (0.54) 38.96
Diluted Diluted Earnings Per Share is calculated by adjusting the weighted average number of ordinary shares in issue to assume conversion of all potential dilutive ordinary shares. Share options and share awards are the Company’s only potential dilutive ordinary shares.
The share awards, which are performance based, are treated as contingently issuable shares, because their issue is contingent upon satisfaction of specified
performance conditions, as well as the passage of time. Contingently issuable shares are included in the calculation of diluted Earnings Per Share to the extent that conditions governing exercisability have been satisfied, as if the end of the reporting period were the end of the vesting period.
Half year
2018 Half year
2017
Weighted average number of ordinary shares in issue 295,158,732 295,021,165
Shares deemed to be issued for no consideration in respect of:
Share awards 582,544 817,796
Share options 27,875 29,992
Weighted average number of shares used in the calculation of diluted Earnings Per Share 295,769,151 295,868,953
Half year
2018
Half year
2017
Total
€’m
Continuing operations
€’m
Discontinued Operations
€’m Total
€’m
Diluted Earnings Per Share (cent) 33.20
39.39 (0.54) 38.85
14. PROPERTY, PLANT AND EQUIPMENT, INTANGIBLE ASSETS & CAPITAL COMMITTMENTS
Property, plant and equipment During the six month period to 30 June 2018 the Group spent €15.8 million (HY 2017: €23.9 million) on additions, of which, €12.7 million was spent on plant
and equipment. Exchange differences (gain) of €10.3 million and depreciation of €21.0 million was also recognised in the period. Intangible assets
During the six month period to 30 June 2018 the Group spent €10.1 million (HY 2017: €9.4 million) in relation to software and development costs. Upon finalisation of the fair value adjustment on the acquisition of B&F Vastgoed B.V. (“Body&Fit”) an increase of €0.5 million in goodwill was recognised. Exchange differences (gain) of €23.9 million and amortisation of €21.5 million were also recognised in the period.
Capital commitments At 30 June 2018 the Group had entered into contractual commitments for the acquisition of property, plant and equipment amounting to €8.3 million (FY
2017 €3.2 million). 15. INVENTORIES
The cost of inventories recognised as an expense includes €6.8 million (HY 2017 expense of: €2.0 million), being the write-downs of inventory to net realisable value of €8.4 million and reversal of such write-downs of €1.6 million (HY 2017: write-downs to net realisable value of €2.4 million and reversal of
such write-downs €0.4 million).
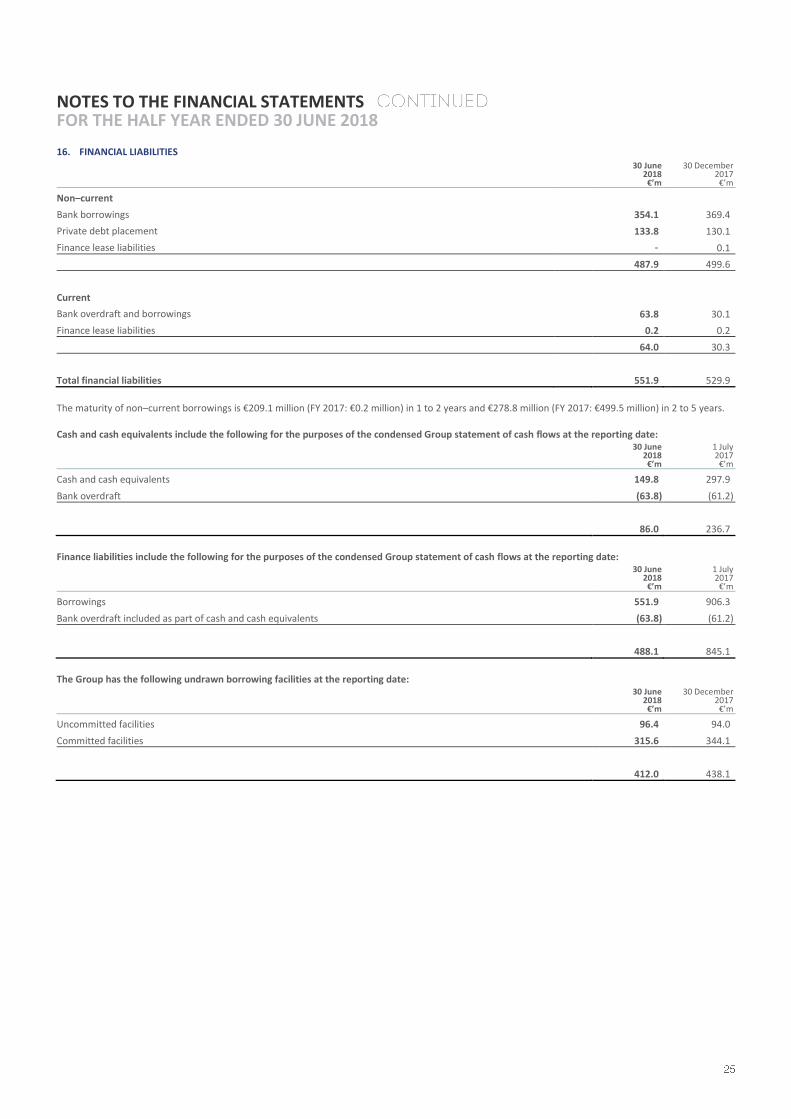
NOTES TO THE FINANCIAL STATEMENTS FOR THE HALF YEAR ENDED 30 JUNE 2018
16. FINANCIAL LIABILITIES
30 June 2018 €’m
30 December 2017
€’m
Non–current
Bank borrowings 354.1 369.4
Private debt placement 133.8 130.1
Finance lease liabilities - 0.1
487.9 499.6
Current
Bank overdraft and borrowings 63.8 30.1
Finance lease liabilities 0.2 0.2
64.0 30.3
Total financial liabilities 551.9 529.9
The maturity of non–current borrowings is €209.1 million (FY 2017: €0.2 million) in 1 to 2 years and €278.8 million (FY 2017: €499.5 million) in 2 to 5 years.
Cash and cash equivalents include the following for the purposes of the condensed Group statement of cash flows at the reporting date:
30 June 2018 €’m
1 July 2017
€’m
Cash and cash equivalents 149.8 297.9
Bank overdraft (63.8) (61.2)
86.0 236.7
Finance liabilities include the following for the purposes of the condensed Group statement of cash flows at the reporting date:
30 June 2018 €’m
1 July 2017
€’m
Borrowings 551.9 906.3
Bank overdraft included as part of cash and cash equivalents (63.8) (61.2)
488.1 845.1
The Group has the following undrawn borrowing facilities at the reporting date:
30 June 2018 €’m
30 December 2017
€’m
Uncommitted facilities 96.4 94.0
Committed facilities 315.6 344.1
412.0 438.1
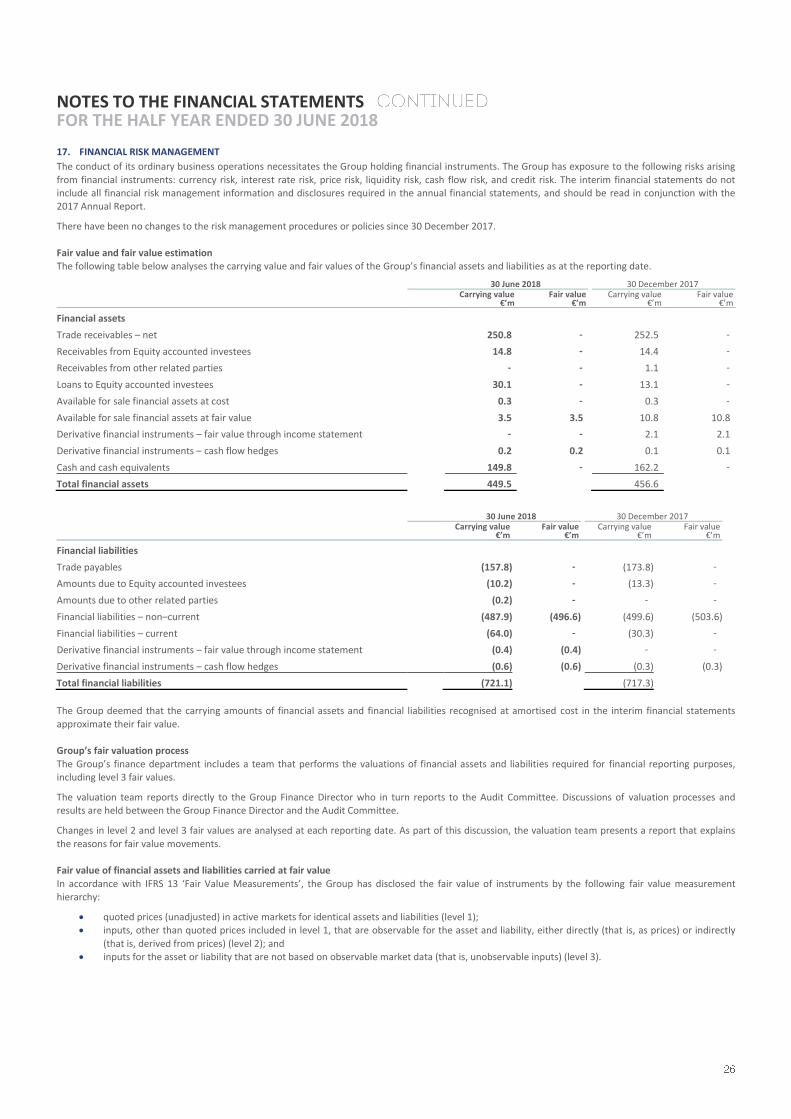
NOTES TO THE FINANCIAL STATEMENTS FOR THE HALF YEAR ENDED 30 JUNE 2018
17. FINANCIAL RISK MANAGEMENT
The conduct of its ordinary business operations necessitates the Group holding financial instruments. The Group has exposure to the following risks arising
from financial instruments: currency risk, interest rate risk, price risk, liquidity risk, cash flow risk, and credit risk. The interim financial statements do not include all financial risk management information and disclosures required in the annual financial statements, and should be read in conjunction with the 2017 Annual Report.
There have been no changes to the risk management procedures or policies since 30 December 2017.
Fair value and fair value estimation The following table below analyses the carrying value and fair values of the Group’s financial assets and liabilities as at the reporting date.
30 June 2018
30 December 2017
Carrying value
€’m Fair value
€’m Carrying value
€’m Fair value
€’m
Financial assets
Trade receivables – net 250.8 - 252.5 -
Receivables from Equity accounted investees 14.8 - 14.4 -
Receivables from other related parties - - 1.1 -
Loans to Equity accounted investees 30.1 - 13.1 -
Available for sale financial assets at cost 0.3 - 0.3 -
Available for sale financial assets at fair value 3.5 3.5 10.8 10.8
Derivative financial instruments – fair value through income statement - - 2.1 2.1
Derivative financial instruments – cash flow hedges 0.2 0.2 0.1 0.1
Cash and cash equivalents 149.8 - 162.2 -
Total financial assets 449.5 456.6
30 June 2018
30 December 2017
Carrying value
€’m Fair value
€’m Carrying value
€’m Fair value
€’m
Financial liabilities
Trade payables (157.8) - (173.8) -
Amounts due to Equity accounted investees (10.2) - (13.3) -
Amounts due to other related parties (0.2) - - -
Financial liabilities – non–current (487.9) (496.6) (499.6) (503.6)
Financial liabilities – current (64.0) - (30.3) -
Derivative financial instruments – fair value through income statement (0.4) (0.4) - -
Derivative financial instruments – cash flow hedges (0.6) (0.6) (0.3) (0.3)
Total financial liabilities (721.1) (717.3)
The Group deemed that the carrying amounts of financial assets and financial liabilities recognised at amortised cost in the interim financial statements
approximate their fair value. Group’s fair valuation process
The Group’s finance department includes a team that performs the valuations of financial assets and liabilities required for financial reporting purposes, including level 3 fair values.
The valuation team reports directly to the Group Finance Director who in turn reports to the Audit Committee. Discussions of valuation processes and results are held between the Group Finance Director and the Audit Committee.
Changes in level 2 and level 3 fair values are analysed at each reporting date. As part of this discussion, the valuation team presents a report that explains
the reasons for fair value movements. Fair value of financial assets and liabilities carried at fair value
In accordance with IFRS 13 ‘Fair Value Measurements’, the Group has disclosed the fair value of instruments by the following fair value measurement hierarchy:
quoted prices (unadjusted) in active markets for identical assets and liabilities (level 1); inputs, other than quoted prices included in level 1, that are observable for the asset and liability, either directly (that is, as prices) or indirectly
(that is, derived from prices) (level 2); and inputs for the asset or liability that are not based on observable market data (that is, unobservable inputs) (level 3).
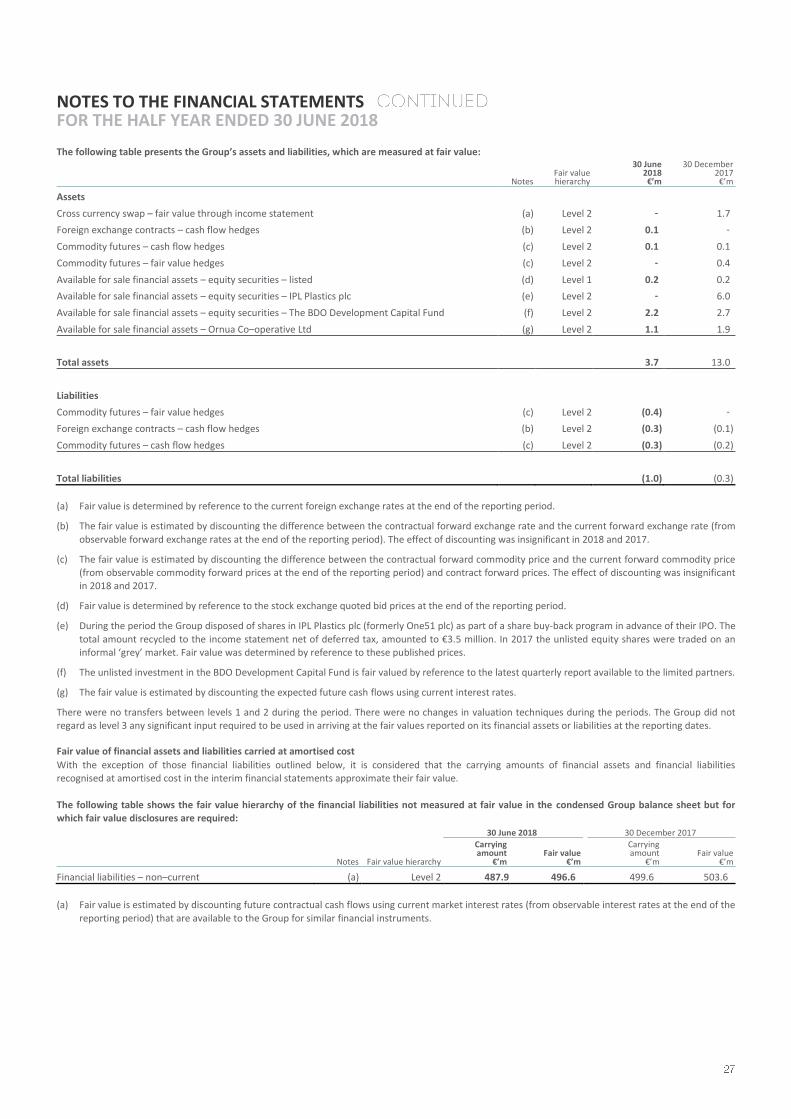
NOTES TO THE FINANCIAL STATEMENTS FOR THE HALF YEAR ENDED 30 JUNE 2018
The following table presents the Group’s assets and liabilities, which are measured at fair value:
Notes Fair value hierarchy
30 June 2018
€’m
30 December 2017
€’m
Assets
Cross currency swap – fair value through income statement (a) Level 2 - 1.7
Foreign exchange contracts – cash flow hedges (b) Level 2 0.1 -
Commodity futures – cash flow hedges (c) Level 2 0.1 0.1
Commodity futures – fair value hedges (c) Level 2 - 0.4
Available for sale financial assets – equity securities – listed (d) Level 1 0.2 0.2
Available for sale financial assets – equity securities – IPL Plastics plc (e) Level 2 - 6.0
Available for sale financial assets – equity securities – The BDO Development Capital Fund (f) Level 2 2.2 2.7
Available for sale financial assets – Ornua Co–operative Ltd (g) Level 2 1.1 1.9
Total assets
3.7 13.0
Liabilities
Commodity futures – fair value hedges (c) Level 2 (0.4) -
Foreign exchange contracts – cash flow hedges (b) Level 2 (0.3) (0.1)
Commodity futures – cash flow hedges (c) Level 2 (0.3) (0.2)
Total liabilities
(1.0) (0.3)
(a) Fair value is determined by reference to the current foreign exchange rates at the end of the reporting period.
(b) The fair value is estimated by discounting the difference between the contractual forward exchange rate and the current forward exchange rate (from
observable forward exchange rates at the end of the reporting period). The effect of discounting was insignificant in 2018 and 2017.
(c) The fair value is estimated by discounting the difference between the contractual forward commodity price and the current forward commodity price (from observable commodity forward prices at the end of the reporting period) and contract forward prices. The effect of discounting was insignificant in 2018 and 2017.
(d) Fair value is determined by reference to the stock exchange quoted bid prices at the end of the reporting period.
(e) During the period the Group disposed of shares in IPL Plastics plc (formerly One51 plc) as part of a share buy-back program in advance of their IPO. The
total amount recycled to the income statement net of deferred tax, amounted to €3.5 million. In 2017 the unlisted equity shares were traded on an informal ‘grey’ market. Fair value was determined by reference to these published prices.
(f) The unlisted investment in the BDO Development Capital Fund is fair valued by reference to the latest quarterly report available to the limited partners.
(g) The fair value is estimated by discounting the expected future cash flows using current interest rates.
There were no transfers between levels 1 and 2 during the period. There were no changes in valuation techniques during the periods. The Group did not regard as level 3 any significant input required to be used in arriving at the fair values reported on its financial assets or liabilities at the reporting dates. Fair value of financial assets and liabilities carried at amortised cost
With the exception of those financial liabilities outlined below, it is considered that the carrying amounts of financial assets and financial liabilities recognised at amortised cost in the interim financial statements approximate their fair value.
The following table shows the fair value hierarchy of the financial liabilities not measured at fair value in the condensed Group balance sheet but for which fair value disclosures are required: 30 June 2018 30 December 2017
Notes Fair value hierarchy
Carrying amount
€’m Fair value
€’m
Carrying amount
€’m Fair value
€’m
Financial liabilities – non–current (a) Level 2 487.9 496.6 499.6 503.6
(a) Fair value is estimated by discounting future contractual cash flows using current market interest rates (from observable interest rates at the end of the
reporting period) that are available to the Group for similar financial instruments.
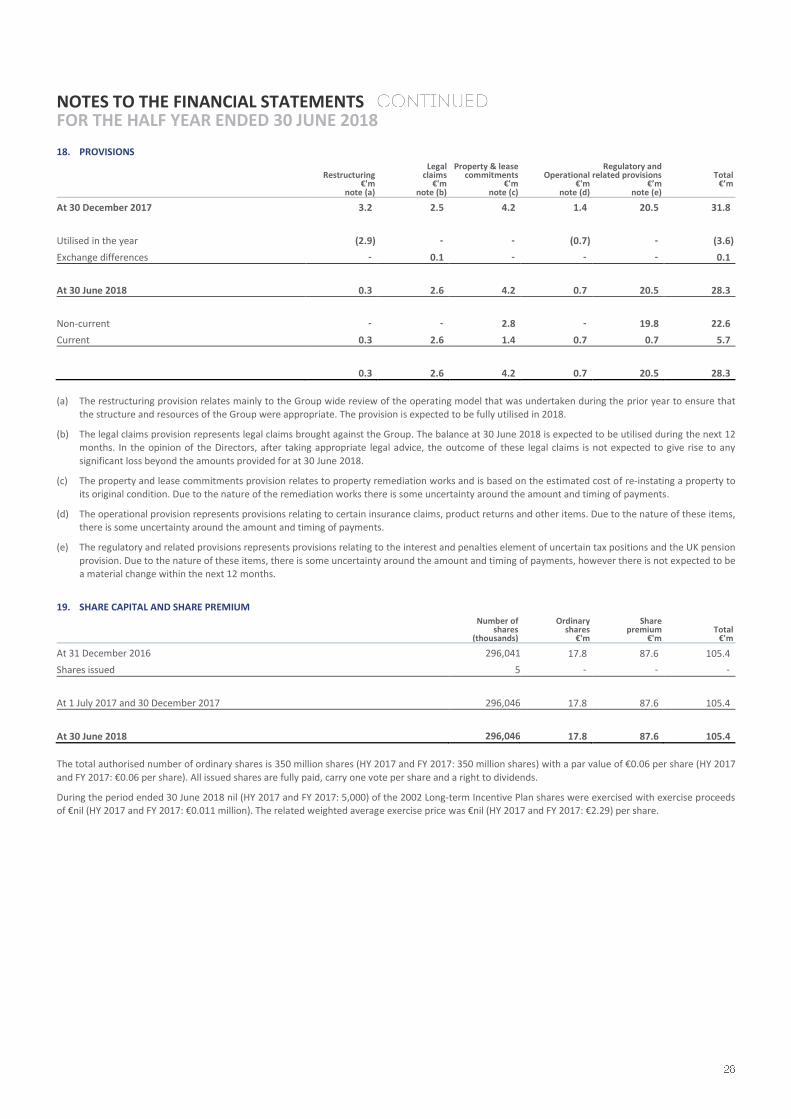
NOTES TO THE FINANCIAL STATEMENTS FOR THE HALF YEAR ENDED 30 JUNE 2018
18. PROVISIONS
Restructuring €'m
note (a)
Legal claims
€'m note (b)
Property & lease commitments
€'m note (c)
Operational €'m
note (d)
Regulatory and related provisions
€’m note (e)
Total €’m
At 30 December 2017 3.2 2.5 4.2 1.4 20.5 31.8
Utilised in the year (2.9) - - (0.7) - (3.6)
Exchange differences - 0.1 - - - 0.1
At 30 June 2018 0.3 2.6 4.2 0.7 20.5 28.3
Non-current - - 2.8 - 19.8 22.6
Current 0.3 2.6 1.4 0.7 0.7 5.7
0.3 2.6 4.2 0.7 20.5 28.3
(a) The restructuring provision relates mainly to the Group wide review of the operating model that was undertaken during the prior year to ensure that the structure and resources of the Group were appropriate. The provision is expected to be fully utilised in 2018.
(b) The legal claims provision represents legal claims brought against the Group. The balance at 30 June 2018 is expected to be utilised during the next 12 months. In the opinion of the Directors, after taking appropriate legal advice, the outcome of these legal claims is not expected to give rise to any
significant loss beyond the amounts provided for at 30 June 2018.
(c) The property and lease commitments provision relates to property remediation works and is based on the estimated cost of re-instating a property to its original condition. Due to the nature of the remediation works there is some uncertainty around the amount and timing of payments.
(d) The operational provision represents provisions relating to certain insurance claims, product returns and other items. Due to the nature of these items, there is some uncertainty around the amount and timing of payments.
(e) The regulatory and related provisions represents provisions relating to the interest and penalties element of uncertain tax positions and the UK pension
provision. Due to the nature of these items, there is some uncertainty around the amount and timing of payments, however there is not expected to be a material change within the next 12 months.
19. SHARE CAPITAL AND SHARE PREMIUM
Number of shares
(thousands)
Ordinary shares
€'m
Share premium
€'m Total
€'m
At 31 December 2016 296,041 17.8 87.6 105.4
Shares issued 5 - - -
At 1 July 2017 and 30 December 2017 296,046 17.8 87.6 105.4
At 30 June 2018 296,046 17.8 87.6 105.4
The total authorised number of ordinary shares is 350 million shares (HY 2017 and FY 2017: 350 million shares) with a par value of €0.06 per share (HY 2017
and FY 2017: €0.06 per share). All issued shares are fully paid, carry one vote per share and a right to dividends.
During the period ended 30 June 2018 nil (HY 2017 and FY 2017: 5,000) of the 2002 Long-term Incentive Plan shares were exercised with exercise proceeds of €nil (HY 2017 and FY 2017: €0.011 million). The related weighted average exercise price was €nil (HY 2017 and FY 2017: €2.29) per share.
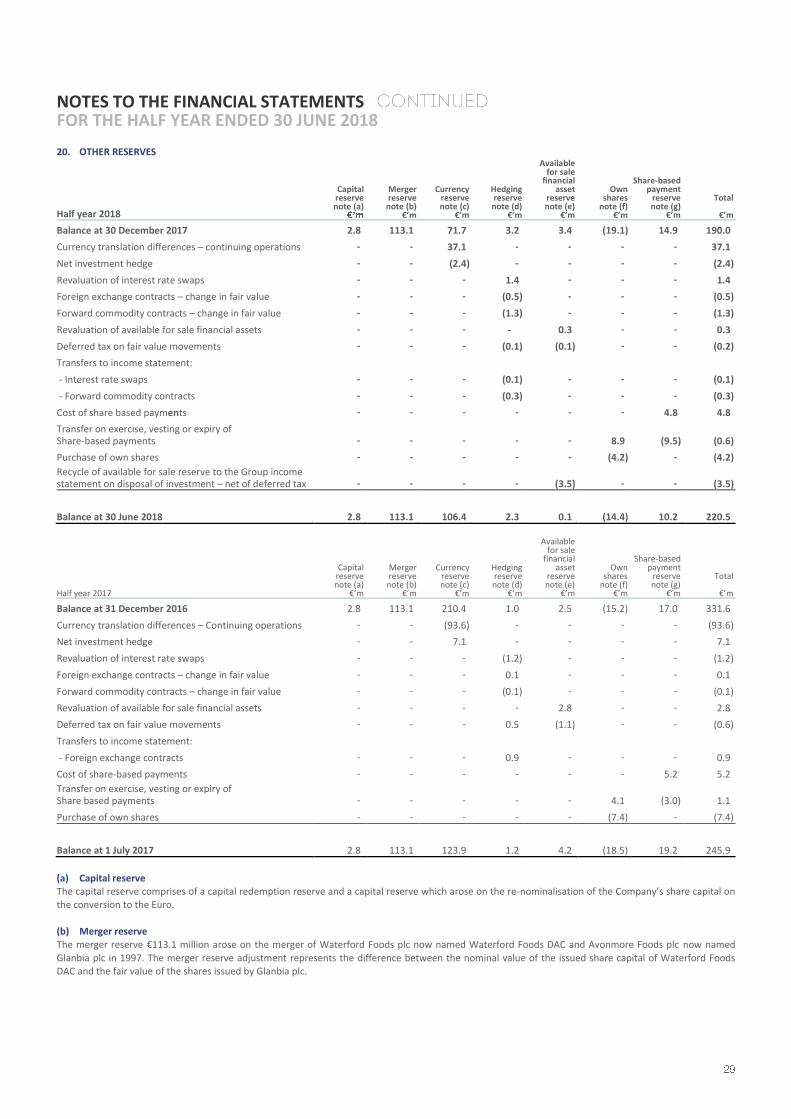
NOTES TO THE FINANCIAL STATEMENTS FOR THE HALF YEAR ENDED 30 JUNE 2018
20. OTHER RESERVES
Half year 2018
Capital reserve note (a)
Merger reserve note (b)
€’m
Currency reserve note (c)
€’m
Hedging reserve note (d)
€’m
Available for sale
financial asset
reserve note (e)
€’m
Own shares note (f)
€’m
Share-based payment
reserve note (g)
€’m
Total
€’m
Balance at 30 December 2017 2.8 113.1 71.7 3.2 3.4 (19.1) 14.9 190.0
Currency translation differences – continuing operations - - 37.1 - - - - 37.1
Net investment hedge - - (2.4) - - - - (2.4)
Revaluation of interest rate swaps - - - 1.4 - - - 1.4
Foreign exchange contracts – change in fair value - - - (0.5) - - - (0.5)
Forward commodity contracts – change in fair value - - - (1.3) - - - (1.3)
Revaluation of available for sale financial assets - - - - 0.3 - - 0.3
Deferred tax on fair value movements - - - (0.1) (0.1) - - (0.2)
Transfers to income statement:
- Interest rate swaps - - - (0.1) - - - (0.1)
- Forward commodity contracts - - - (0.3) - - - (0.3)
Cost of share based payments - - - - - - 4.8 4.8
Transfer on exercise, vesting or expiry of Share-based payments - - - - - 8.9 (9.5) (0.6)
Purchase of own shares - - - - - (4.2) - (4.2)
Recycle of available for sale reserve to the Group income statement on disposal of investment – net of deferred tax - - - - (3.5) - - (3.5)
Balance at 30 June 2018 2.8 113.1 106.4 2.3 0.1 (14.4) 10.2 220.5
Half year 2017
Capital reserve note (a)
€’m
Merger reserve note (b)
€’m
Currency reserve note (c)
€’m
Hedging reserve note (d)
€’m
Available for sale
financial asset
reserve note (e)
€’m
Own shares note (f)
€’m
Share-based payment
reserve note (g)
€’m
Total
€’m
Balance at 31 December 2016 2.8 113.1 210.4 1.0 2.5 (15.2) 17.0 331.6
Currency translation differences – Continuing operations - - (93.6) - - - - (93.6)
Net investment hedge - - 7.1 - - - - 7.1
Revaluation of interest rate swaps - - - (1.2) - - - (1.2)
Foreign exchange contracts – change in fair value - - - 0.1 - - - 0.1
Forward commodity contracts – change in fair value - - - (0.1) - - - (0.1)
Revaluation of available for sale financial assets - - - - 2.8 - - 2.8
Deferred tax on fair value movements - - - 0.5 (1.1) - - (0.6)
Transfers to income statement:
- Foreign exchange contracts - - - 0.9 - - - 0.9
Cost of share-based payments - - - - - - 5.2 5.2
Transfer on exercise, vesting or expiry of Share based payments - - - - - 4.1 (3.0) 1.1
Purchase of own shares - - - - - (7.4) - (7.4)
Balance at 1 July 2017 2.8 113.1 123.9 1.2 4.2 (18.5) 19.2 245.9
(a) Capital reserve The capital reserve comprises of a capital redemption reserve and a capital reserve which arose on the re-nominalisation of the Company’s share capital on the conversion to the Euro.
(b) Merger reserve The merger reserve €113.1 million arose on the merger of Waterford Foods plc now named Waterford Foods DAC and Avonmore Foods plc now named
Glanbia plc in 1997. The merger reserve adjustment represents the difference between the nominal value of the issued share capital of Waterford Foods DAC and the fair value of the shares issued by Glanbia plc.
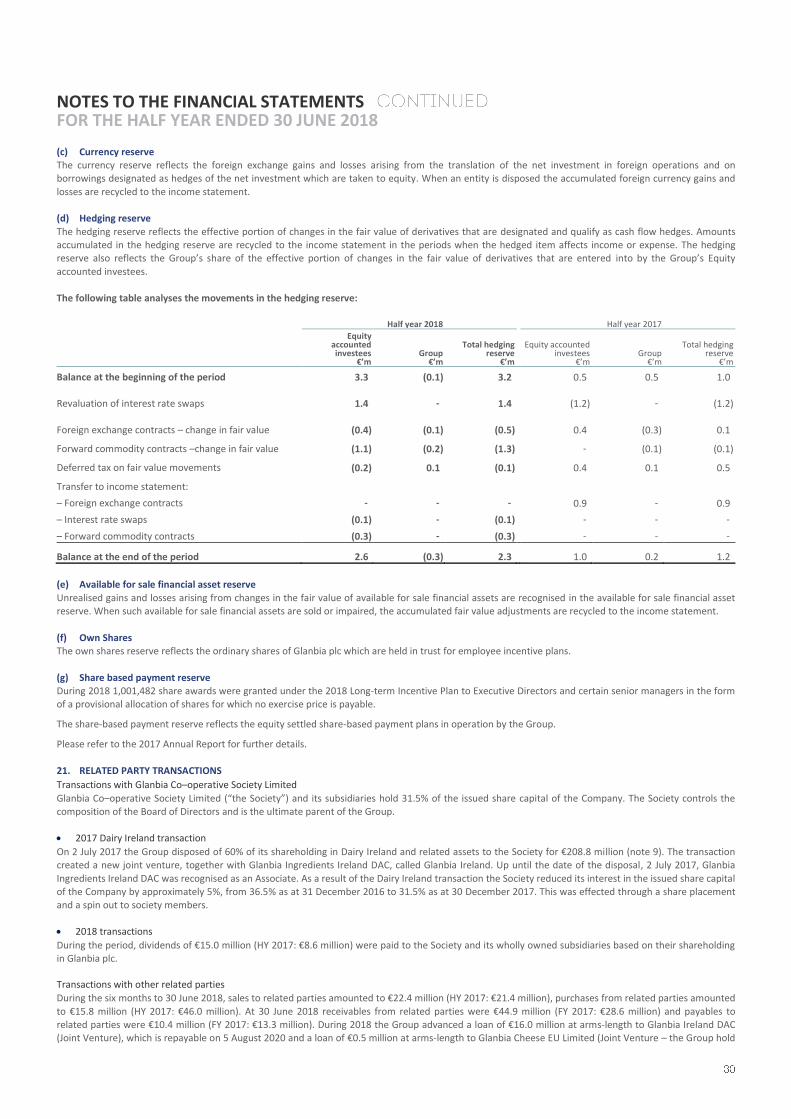
NOTES TO THE FINANCIAL STATEMENTS FOR THE HALF YEAR ENDED 30 JUNE 2018
(c) Currency reserve The currency reserve reflects the foreign exchange gains and losses arising from the translation of the net investment in foreign operations and on borrowings designated as hedges of the net investment which are taken to equity. When an entity is disposed the accumulated foreign currency gains and
losses are recycled to the income statement. (d) Hedging reserve
The hedging reserve reflects the effective portion of changes in the fair value of derivatives that are designated and qualify as cash flow hedges. Amounts accumulated in the hedging reserve are recycled to the income statement in the periods when the hedged item affects income or expense. The hedging reserve also reflects the Group’s share of the effective portion of changes in the fair value of derivatives that are entered into by the Group’s Equity
accounted investees. The following table analyses the movements in the hedging reserve:
Half year 2018 Half year 2017
Equity accounted investees
€’m Group
€’m
Total hedging reserve
€’m
Equity accounted
investees €’m
Group €’m
Total hedging reserve
€’m
Balance at the beginning of the period 3.3 (0.1) 3.2 0.5 0.5 1.0
Revaluation of interest rate swaps 1.4 - 1.4
(1.2) - (1.2)
Foreign exchange contracts – change in fair value (0.4) (0.1) (0.5)
0.4 (0.3) 0.1
Forward commodity contracts –change in fair value (1.1) (0.2) (1.3)
- (0.1) (0.1)
Deferred tax on fair value movements (0.2) 0.1 (0.1)
0.4 0.1 0.5
Transfer to income statement:
– Foreign exchange contracts - - - 0.9 - 0.9
– Interest rate swaps (0.1) - (0.1) - - -
– Forward commodity contracts (0.3) - (0.3) - - -
Balance at the end of the period 2.6 (0.3) 2.3 1.0 0.2 1.2
(e) Available for sale financial asset reserve
Unrealised gains and losses arising from changes in the fair value of available for sale financial assets are recognised in the available for sale financial asset reserve. When such available for sale financial assets are sold or impaired, the accumulated fair value adjustments are recycled to the income statement.
(f) Own Shares The own shares reserve reflects the ordinary shares of Glanbia plc which are held in trust for employee incentive plans.
(g) Share based payment reserve During 2018 1,001,482 share awards were granted under the 2018 Long-term Incentive Plan to Executive Directors and certain senior managers in the form of a provisional allocation of shares for which no exercise price is payable.
The share-based payment reserve reflects the equity settled share-based payment plans in operation by the Group.
Please refer to the 2017 Annual Report for further details.
21. RELATED PARTY TRANSACTIONS
Transactions with Glanbia Co–operative Society Limited
Glanbia Co–operative Society Limited (“the Society”) and its subsidiaries hold 31.5% of the issued share capital of the Company. The Society controls the composition of the Board of Directors and is the ultimate parent of the Group.
2017 Dairy Ireland transaction
On 2 July 2017 the Group disposed of 60% of its shareholding in Dairy Ireland and related assets to the Society for €208.8 million (note 9). The transaction created a new joint venture, together with Glanbia Ingredients Ireland DAC, called Glanbia Ireland. Up until the date of the disposal, 2 July 2017, Glanbia
Ingredients Ireland DAC was recognised as an Associate. As a result of the Dairy Ireland transaction the Society reduced its interest in the issued share capital of the Company by approximately 5%, from 36.5% as at 31 December 2016 to 31.5% as at 30 December 2017. This was effected through a share placement and a spin out to society members.
2018 transactions
During the period, dividends of €15.0 million (HY 2017: €8.6 million) were paid to the Society and its wholly owned subsidiaries based on their shareholding in Glanbia plc. Transactions with other related parties
During the six months to 30 June 2018, sales to related parties amounted to €22.4 million (HY 2017: €21.4 million), purchases from related parties amounted
to €15.8 million (HY 2017: €46.0 million). At 30 June 2018 receivables from related parties were €44.9 million (FY 2017: €28.6 million) and payables to related parties were €10.4 million (FY 2017: €13.3 million). During 2018 the Group advanced a loan of €16.0 million at arms-length to Glanbia Ireland DAC (Joint Venture), which is repayable on 5 August 2020 and a loan of €0.5 million at arms-length to Glanbia Cheese EU Limited (Joint Venture – the Group hold
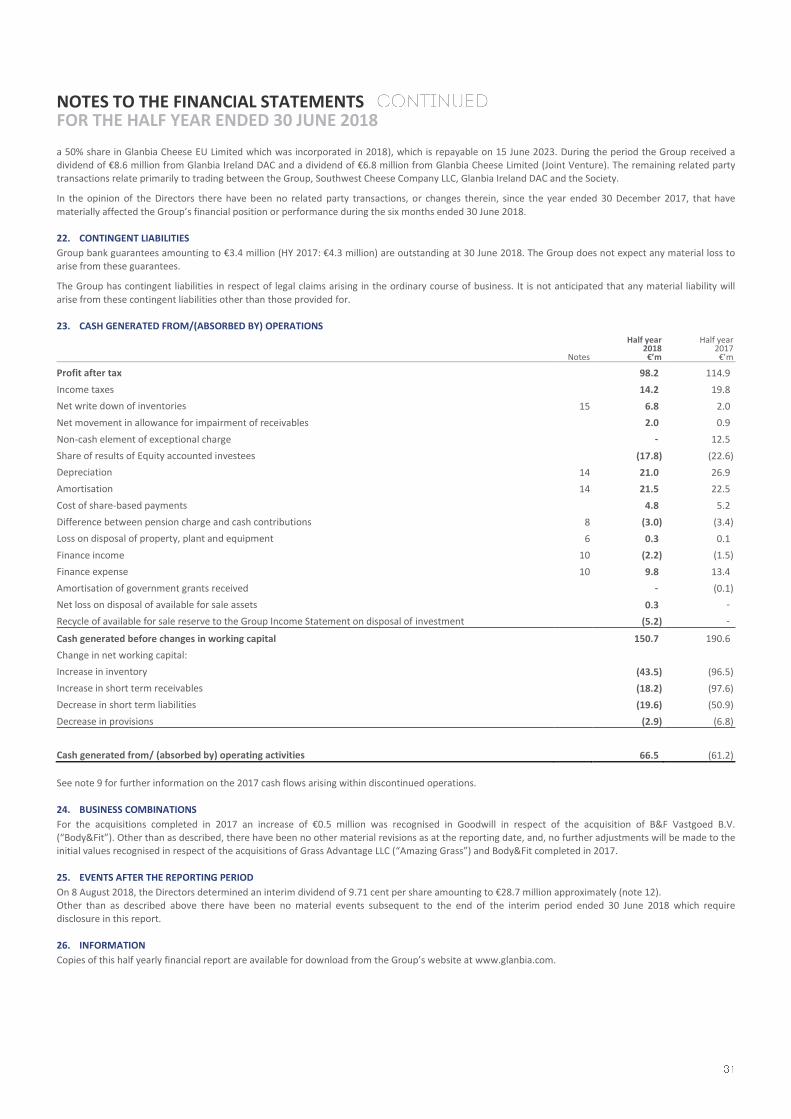
NOTES TO THE FINANCIAL STATEMENTS FOR THE HALF YEAR ENDED 30 JUNE 2018
a 50% share in Glanbia Cheese EU Limited which was incorporated in 2018), which is repayable on 15 June 2023. During the period the Group received a dividend of €8.6 million from Glanbia Ireland DAC and a dividend of €6.8 million from Glanbia Cheese Limited (Joint Venture). The remaining related party transactions relate primarily to trading between the Group, Southwest Cheese Company LLC, Glanbia Ireland DAC and the Society.
In the opinion of the Directors there have been no related party transactions, or changes therein, since the year ended 30 December 2017, that have
materially affected the Group’s financial position or performance during the six months ended 30 June 2018. 22. CONTINGENT LIABILITIES
Group bank guarantees amounting to €3.4 million (HY 2017: €4.3 million) are outstanding at 30 June 2018. The Group does not expect any material loss to arise from these guarantees.
The Group has contingent liabilities in respect of legal claims arising in the ordinary course of business. It is not anticipated that any material liability will
arise from these contingent liabilities other than those provided for. 23. CASH GENERATED FROM/(ABSORBED BY) OPERATIONS
Notes
Half year 2018 €’m
Half year 2017
€’m
Profit after tax 98.2 114.9
Income taxes 14.2 19.8
Net write down of inventories 15 6.8 2.0
Net movement in allowance for impairment of receivables 2.0 0.9
Non-cash element of exceptional charge - 12.5
Share of results of Equity accounted investees (17.8) (22.6)
Depreciation 14 21.0 26.9
Amortisation 14 21.5 22.5
Cost of share-based payments 4.8 5.2
Difference between pension charge and cash contributions 8 (3.0) (3.4)
Loss on disposal of property, plant and equipment 6 0.3 0.1
Finance income 10 (2.2) (1.5)
Finance expense 10 9.8 13.4
Amortisation of government grants received - (0.1)
Net loss on disposal of available for sale assets 0.3 -
Recycle of available for sale reserve to the Group Income Statement on disposal of investment (5.2) -
Cash generated before changes in working capital 150.7 190.6
Change in net working capital:
Increase in inventory (43.5) (96.5)
Increase in short term receivables (18.2) (97.6)
Decrease in short term liabilities (19.6) (50.9)
Decrease in provisions (2.9) (6.8)
Cash generated from/ (absorbed by) operating activities 66.5 (61.2)
See note 9 for further information on the 2017 cash flows arising within discontinued operations.
24. BUSINESS COMBINATIONS
For the acquisitions completed in 2017 an increase of €0.5 million was recognised in Goodwill in respect of the acquisition of B&F Vastgoed B.V. (“Body&Fit”). Other than as described, there have been no other material revisions as at the reporting date, and, no further adjustments will be made to the initial values recognised in respect of the acquisitions of Grass Advantage LLC (“Amazing Grass”) and Body&Fit completed in 2017.
25. EVENTS AFTER THE REPORTING PERIOD
On 8 August 2018, the Directors determined an interim dividend of 9.71 cent per share amounting to €28.7 million approximately (note 12). Other than as described above there have been no material events subsequent to the end of the interim period ended 30 June 2018 which require disclosure in this report.
26. INFORMATION
Copies of this half yearly financial report are available for download from the Group’s website at www.glanbia.com.
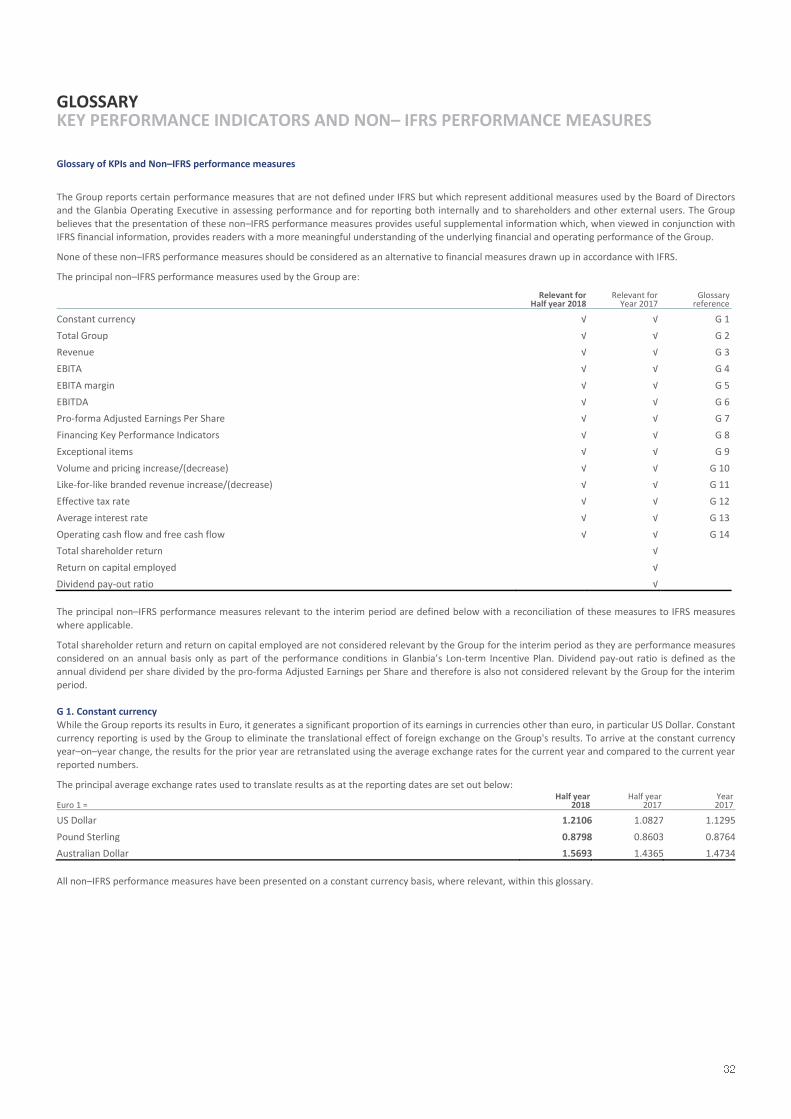
GLOSSARY KEY PERFORMANCE INDICATORS AND NON– IFRS PERFORMANCE MEASURES
Glossary of KPIs and Non–IFRS performance measures
The Group reports certain performance measures that are not defined under IFRS but which represent additional measures used by the Board of Directors and the Glanbia Operating Executive in assessing performance and for reporting both internally and to shareholders and other external users. The Group
believes that the presentation of these non–IFRS performance measures provides useful supplemental information which, when viewed in conjunction with IFRS financial information, provides readers with a more meaningful understanding of the underlying financial and operating performance of the Group.
None of these non–IFRS performance measures should be considered as an alternative to financial measures drawn up in accordance with IFRS.
The principal non–IFRS performance measures used by the Group are:
Relevant for Half year 2018
Relevant for Year 2017
Glossary reference
Constant currency √ √ G 1
Total Group √ √ G 2
Revenue √ √ G 3
EBITA √ √ G 4
EBITA margin √ √ G 5
EBITDA √ √ G 6
Pro-forma Adjusted Earnings Per Share √ √ G 7
Financing Key Performance Indicators √ √ G 8
Exceptional items √ √ G 9
Volume and pricing increase/(decrease) √ √ G 10
Like-for-like branded revenue increase/(decrease) √ √ G 11
Effective tax rate √ √ G 12
Average interest rate √ √ G 13
Operating cash flow and free cash flow √ √ G 14
Total shareholder return √
Return on capital employed √
Dividend pay-out ratio √
The principal non–IFRS performance measures relevant to the interim period are defined below with a reconciliation of these measures to IFRS measures
where applicable.
Total shareholder return and return on capital employed are not considered relevant by the Group for the interim period as they are performance measures considered on an annual basis only as part of the performance conditions in Glanbia’s Lon-term Incentive Plan. Dividend pay-out ratio is defined as the annual dividend per share divided by the pro-forma Adjusted Earnings per Share and therefore is also not considered relevant by the Group for the interim
period. G 1. Constant currency
While the Group reports its results in Euro, it generates a significant proportion of its earnings in currencies other than euro, in particular US Dollar. Constant currency reporting is used by the Group to eliminate the translational effect of foreign exchange on the Group's results. To arrive at the constant currency year–on–year change, the results for the prior year are retranslated using the average exchange rates for the current year and compared to the current year
reported numbers.
The principal average exchange rates used to translate results as at the reporting dates are set out below:
Euro 1 = Half year
2018 Half year
2017 Year 2017
US Dollar 1.2106 1.0827 1.1295
Pound Sterling 0.8798 0.8603 0.8764
Australian Dollar 1.5693 1.4365 1.4734
All non–IFRS performance measures have been presented on a constant currency basis, where relevant, within this glossary.
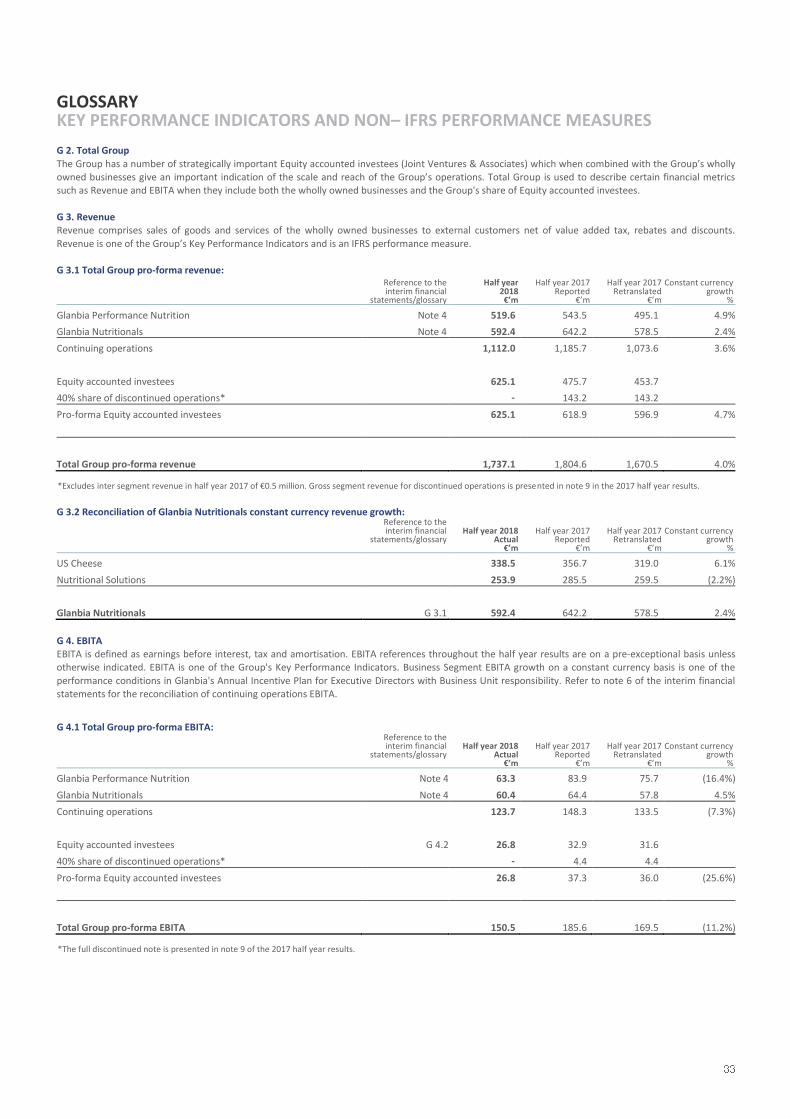
GLOSSARY KEY PERFORMANCE INDICATORS AND NON– IFRS PERFORMANCE MEASURES G 2. Total Group
The Group has a number of strategically important Equity accounted investees (Joint Ventures & Associates) which when combined with the Group’s wholly owned businesses give an important indication of the scale and reach of the Group’s operations. Total Group is used to describe certain financial metrics such as Revenue and EBITA when they include both the wholly owned businesses and the Group's share of Equity accounted investees.
G 3. Revenue Revenue comprises sales of goods and services of the wholly owned businesses to external customers net of value added tax, rebates and discounts.
Revenue is one of the Group’s Key Performance Indicators and is an IFRS performance measure. G 3.1 Total Group pro-forma revenue:
Reference to the interim financial
statements/glossary
Half year 2018 €’m
Half year 2017 Reported
€’m
Half year 2017 Retranslated
€’m
Constant currency growth
%
Glanbia Performance Nutrition Note 4 519.6 543.5 495.1 4.9%
Glanbia Nutritionals Note 4 592.4 642.2 578.5 2.4%
Continuing operations 1,112.0 1,185.7 1,073.6 3.6%
Equity accounted investees 625.1 475.7 453.7
40% share of discontinued operations* - 143.2 143.2
Pro-forma Equity accounted investees 625.1 618.9 596.9 4.7%
Total Group pro-forma revenue 1,737.1 1,804.6 1,670.5 4.0%
*Excludes inter segment revenue in half year 2017 of €0.5 million. Gross segment revenue for discontinued operations is presented in note 9 in the 2017 half year results.
G 3.2 Reconciliation of Glanbia Nutritionals constant currency revenue growth:
Reference to the interim financial
statements/glossary
Half year 2018 Actual
€’m
Half year 2017
Reported €’m
Half year 2017 Retranslated
€’m
Constant currency growth
%
US Cheese 338.5 356.7 319.0 6.1%
Nutritional Solutions 253.9 285.5 259.5 (2.2%)
Glanbia Nutritionals G 3.1 592.4 642.2 578.5 2.4%
G 4. EBITA EBITA is defined as earnings before interest, tax and amortisation. EBITA references throughout the half year results are on a pre-exceptional basis unless otherwise indicated. EBITA is one of the Group's Key Performance Indicators. Business Segment EBITA growth on a constant currency basis is one of the
performance conditions in Glanbia's Annual Incentive Plan for Executive Directors with Business Unit responsibility. Refer to note 6 of the interim financial statements for the reconciliation of continuing operations EBITA.
G 4.1 Total Group pro-forma EBITA:
Reference to the interim financial
statements/glossary
Half year 2018 Actual
€’m
Half year 2017
Reported €’m
Half year 2017 Retranslated
€’m
Constant currency growth
%
Glanbia Performance Nutrition Note 4 63.3 83.9 75.7 (16.4%)
Glanbia Nutritionals Note 4 60.4 64.4 57.8 4.5%
Continuing operations 123.7 148.3 133.5 (7.3%)
Equity accounted investees G 4.2 26.8 32.9 31.6
40% share of discontinued operations* - 4.4 4.4
Pro-forma Equity accounted investees 26.8 37.3 36.0 (25.6%)
Total Group pro-forma EBITA 150.5 185.6 169.5 (11.2%)
*The full discontinued note is presented in note 9 of the 2017 half year results.
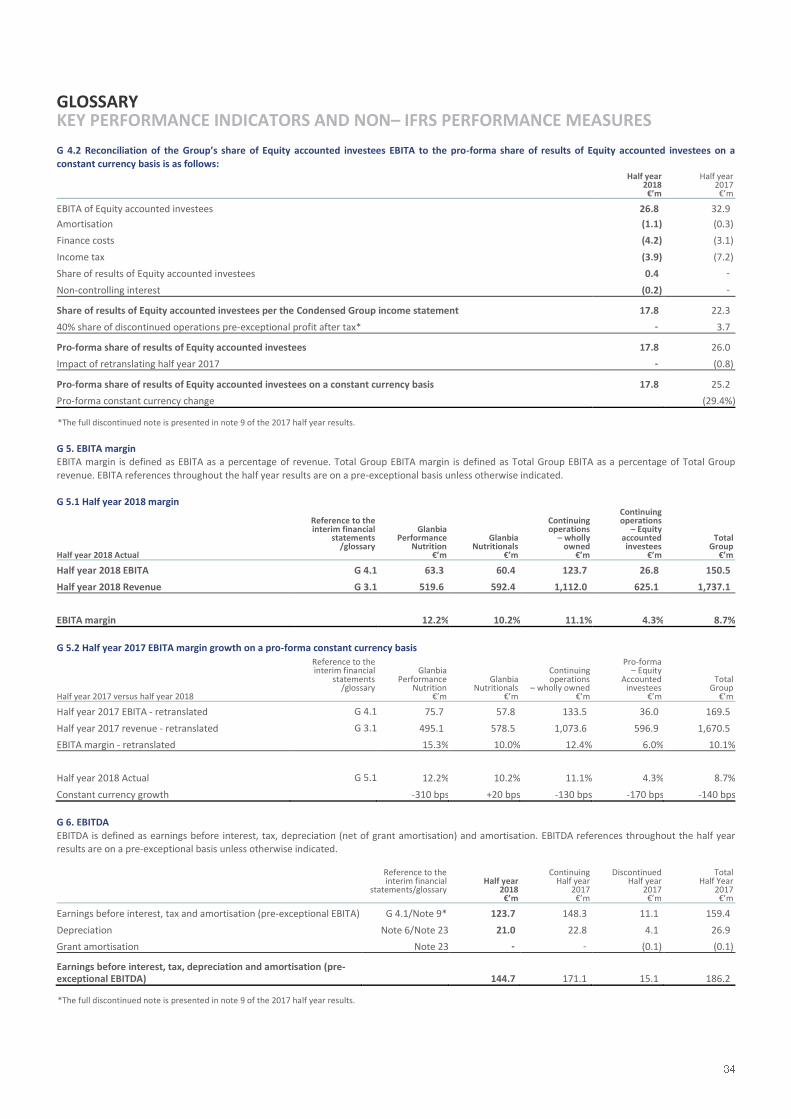
GLOSSARY KEY PERFORMANCE INDICATORS AND NON– IFRS PERFORMANCE MEASURES G 4.2 Reconciliation of the Group’s share of Equity accounted investees EBITA to the pro-forma share of results of Equity accounted investees on a
constant currency basis is as follows:
Half year 2018 €’m
Half year 2017
€’m
EBITA of Equity accounted investees 26.8 32.9
Amortisation (1.1) (0.3)
Finance costs (4.2) (3.1)
Income tax (3.9) (7.2)
Share of results of Equity accounted investees 0.4 -
Non-controlling interest (0.2) - Share of results of Equity accounted investees per the Condensed Group income statement 17.8 22.3
40% share of discontinued operations pre-exceptional profit after tax* - 3.7 Pro-forma share of results of Equity accounted investees 17.8 26.0
Impact of retranslating half year 2017 - (0.8) Pro-forma share of results of Equity accounted investees on a constant currency basis 17.8 25.2
Pro-forma constant currency change (29.4%)
*The full discontinued note is presented in note 9 of the 2017 half year results.
G 5. EBITA margin EBITA margin is defined as EBITA as a percentage of revenue. Total Group EBITA margin is defined as Total Group EBITA as a percentage of Total Group
revenue. EBITA references throughout the half year results are on a pre-exceptional basis unless otherwise indicated. G 5.1 Half year 2018 margin
Half year 2018 Actual
Reference to the interim financial
statements /glossary
Glanbia Performance
Nutrition €’m
Glanbia Nutritionals
€’m
Continuing operations
– wholly owned
€’m
Continuing operations
– Equity accounted investees
€’m
Total Group
€’m
Half year 2018 EBITA G 4.1 63.3 60.4 123.7 26.8 150.5
Half year 2018 Revenue G 3.1 519.6 592.4 1,112.0 625.1 1,737.1
EBITA margin 12.2% 10.2% 11.1% 4.3% 8.7%
G 5.2 Half year 2017 EBITA margin growth on a pro-forma constant currency basis
Half year 2017 versus half year 2018
Reference to the interim financial
statements /glossary
Glanbia Performance
Nutrition €’m
Glanbia Nutritionals
€’m
Continuing operations
– wholly owned €’m
Pro-forma – Equity
Accounted investees
€’m
Total Group
€’m
Half year 2017 EBITA - retranslated G 4.1 75.7 57.8 133.5 36.0 169.5
Half year 2017 revenue - retranslated G 3.1 495.1 578.5 1,073.6 596.9 1,670.5
EBITA margin - retranslated 15.3% 10.0% 12.4% 6.0% 10.1%
Half year 2018 Actual G 5.1 12.2% 10.2% 11.1% 4.3% 8.7%
Constant currency growth -310 bps +20 bps -130 bps -170 bps -140 bps
G 6. EBITDA
EBITDA is defined as earnings before interest, tax, depreciation (net of grant amortisation) and amortisation. EBITDA references throughout the half year results are on a pre-exceptional basis unless otherwise indicated.
Reference to the interim financial
statements/glossary
Half year
2018 €’m
Continuing Half year
2017 €’m
Discontinued Half year
2017 €’m
Total Half Year
2017 €’m
Earnings before interest, tax and amortisation (pre-exceptional EBITA) G 4.1/Note 9* 123.7 148.3 11.1 159.4
Depreciation Note 6/Note 23 21.0 22.8 4.1 26.9
Grant amortisation Note 23 - - (0.1) (0.1) Earnings before interest, tax, depreciation and amortisation (pre-exceptional EBITDA) 144.7 171.1 15.1 186.2
*The full discontinued note is presented in note 9 of the 2017 half year results.
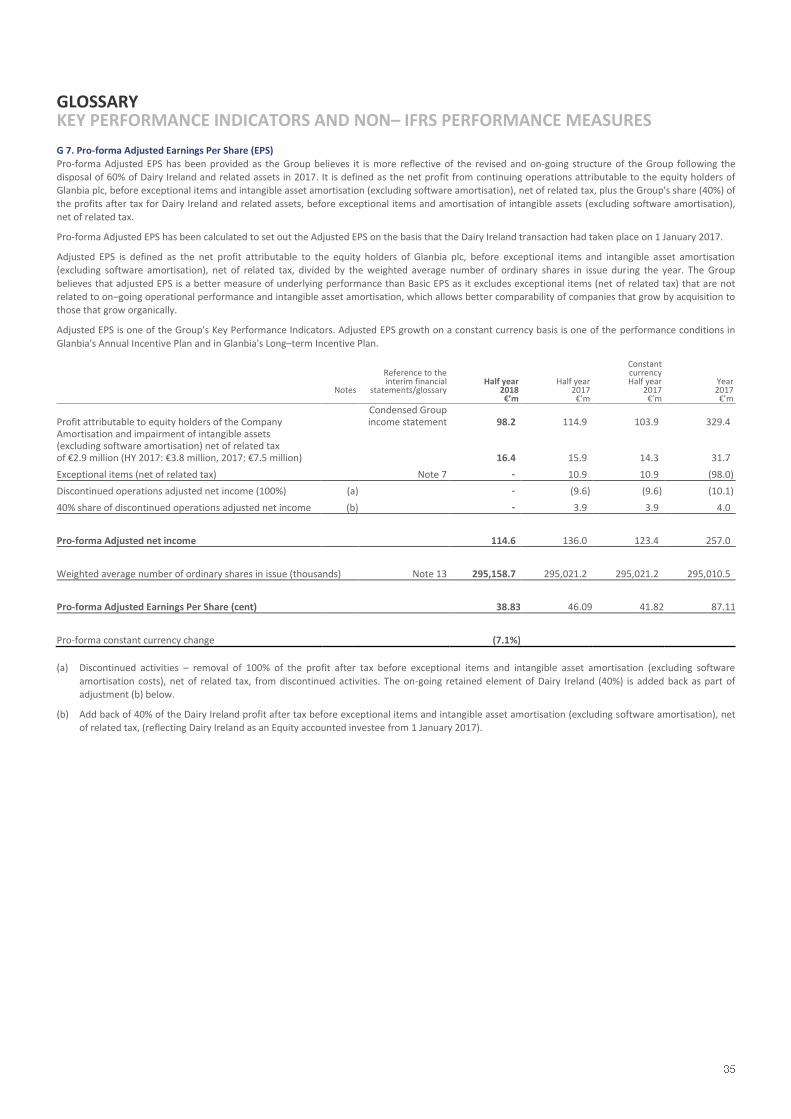
GLOSSARY KEY PERFORMANCE INDICATORS AND NON– IFRS PERFORMANCE MEASURES G 7. Pro-forma Adjusted Earnings Per Share (EPS)
Pro-forma Adjusted EPS has been provided as the Group believes it is more reflective of the revised and on-going structure of the Group following the disposal of 60% of Dairy Ireland and related assets in 2017. It is defined as the net profit from continuing operations attributable to the equity holders of Glanbia plc, before exceptional items and intangible asset amortisation (excluding software amortisation), net of related tax, plus the Group's share (40%) of
the profits after tax for Dairy Ireland and related assets, before exceptional items and amortisation of intangible assets (excluding software amortisation), net of related tax.
Pro-forma Adjusted EPS has been calculated to set out the Adjusted EPS on the basis that the Dairy Ireland transaction had taken place on 1 January 2017.
Adjusted EPS is defined as the net profit attributable to the equity holders of Glanbia plc, before exceptional items and intangible asset amortisation (excluding software amortisation), net of related tax, divided by the weighted average number of ordinary shares in issue during the year. The Group
believes that adjusted EPS is a better measure of underlying performance than Basic EPS as it excludes exceptional items (net of related tax) that are not related to on–going operational performance and intangible asset amortisation, which allows better comparability of companies that grow by acquisition to those that grow organically.
Adjusted EPS is one of the Group's Key Performance Indicators. Adjusted EPS growth on a constant currency basis is one of the performance conditions in
Glanbia's Annual Incentive Plan and in Glanbia's Long–term Incentive Plan.
Notes
Reference to the interim financial
statements/glossary
Half year 2018
€’m
Half year 2017
€’m
Constant currency Half year
2017 €’m
Year 2017
€’m
Profit attributable to equity holders of the Company Condensed Group income statement 98.2 114.9 103.9 329.4
Amortisation and impairment of intangible assets (excluding software amortisation) net of related tax of €2.9 million (HY 2017: €3.8 million, 2017: €7.5 million) 16.4 15.9 14.3 31.7
Exceptional items (net of related tax) Note 7 - 10.9 10.9 (98.0)
Discontinued operations adjusted net income (100%) (a) - (9.6) (9.6) (10.1)
40% share of discontinued operations adjusted net income (b) - 3.9 3.9 4.0
Pro-forma Adjusted net income 114.6 136.0 123.4 257.0
Weighted average number of ordinary shares in issue (thousands) Note 13 295,158.7 295,021.2 295,021.2 295,010.5
Pro-forma Adjusted Earnings Per Share (cent) 38.83 46.09 41.82 87.11
Pro-forma constant currency change (7.1%)
(a) Discontinued activities – removal of 100% of the profit after tax before exceptional items and intangible asset amortisation (excluding software
amortisation costs), net of related tax, from discontinued activities. The on-going retained element of Dairy Ireland (40%) is added back as part of adjustment (b) below.
(b) Add back of 40% of the Dairy Ireland profit after tax before exceptional items and intangible asset amortisation (excluding software amortisation), net of related tax, (reflecting Dairy Ireland as an Equity accounted investee from 1 January 2017).
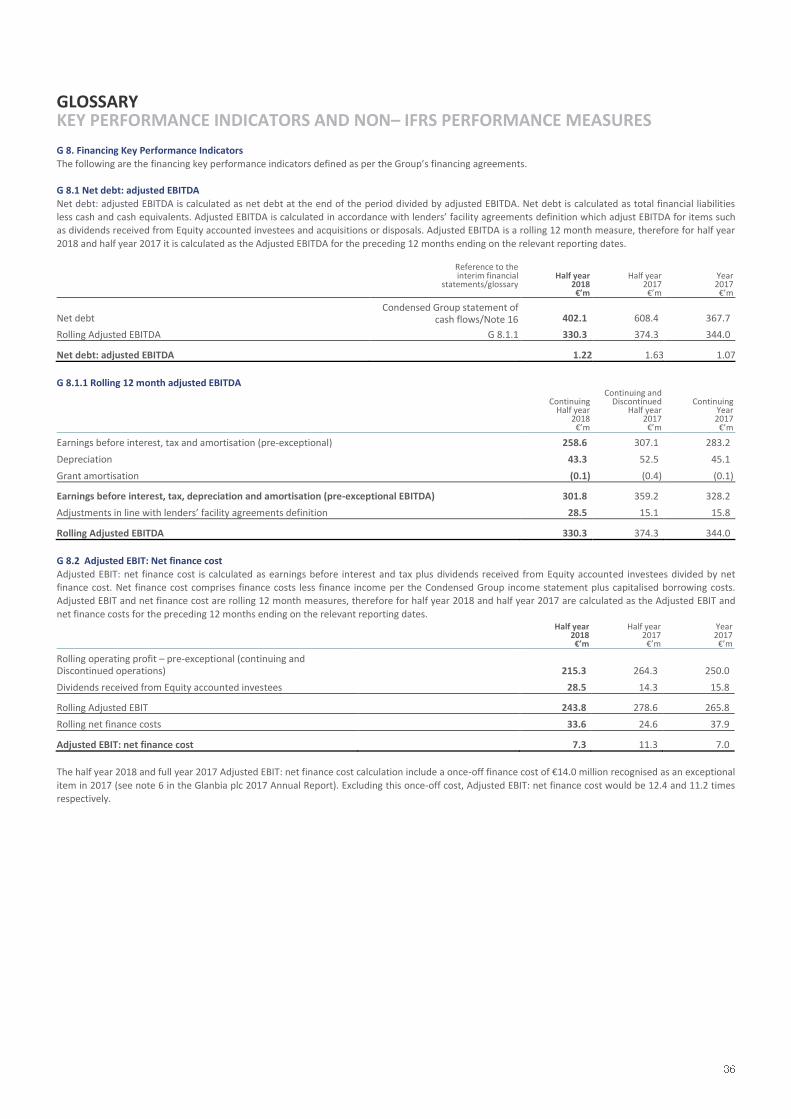
GLOSSARY KEY PERFORMANCE INDICATORS AND NON– IFRS PERFORMANCE MEASURES G 8. Financing Key Performance Indicators
The following are the financing key performance indicators defined as per the Group’s financing agreements. G 8.1 Net debt: adjusted EBITDA
Net debt: adjusted EBITDA is calculated as net debt at the end of the period divided by adjusted EBITDA. Net debt is calculated as total financial liabilities less cash and cash equivalents. Adjusted EBITDA is calculated in accordance with lenders’ facility agreements definition which adjust EBITDA for items such as dividends received from Equity accounted investees and acquisitions or disposals. Adjusted EBITDA is a rolling 12 month measure, therefore for half year
2018 and half year 2017 it is calculated as the Adjusted EBITDA for the preceding 12 months ending on the relevant reporting dates.
Reference to the interim financial
statements/glossary
Half year 2018 €’m
Half year 2017
€’m
Year 2017
€’m
Net debt Condensed Group statement of
cash flows/Note 16 402.1 608.4 367.7
Rolling Adjusted EBITDA G 8.1.1 330.3 374.3 344.0 Net debt: adjusted EBITDA 1.22 1.63 1.07
G 8.1.1 Rolling 12 month adjusted EBITDA
Continuing Half year
2018 €’m
Continuing and Discontinued
Half year 2017
€’m
Continuing Year
2017 €’m
Earnings before interest, tax and amortisation (pre-exceptional) 258.6 307.1 283.2
Depreciation 43.3 52.5 45.1
Grant amortisation (0.1) (0.4) (0.1) Earnings before interest, tax, depreciation and amortisation (pre-exceptional EBITDA) 301.8 359.2 328.2
Adjustments in line with lenders’ facility agreements definition 28.5 15.1 15.8 Rolling Adjusted EBITDA 330.3 374.3 344.0
G 8.2 Adjusted EBIT: Net finance cost
Adjusted EBIT: net finance cost is calculated as earnings before interest and tax plus dividends received from Equity accounted investees divided by net finance cost. Net finance cost comprises finance costs less finance income per the Condensed Group income statement plus capitalised borrowing costs. Adjusted EBIT and net finance cost are rolling 12 month measures, therefore for half year 2018 and half year 2017 are calculated as the Adjusted EBIT and
net finance costs for the preceding 12 months ending on the relevant reporting dates.
Half year 2018 €’m
Half year 2017
€’m
Year 2017
€’m
Rolling operating profit – pre-exceptional (continuing and Discontinued operations) 215.3 264.3 250.0
Dividends received from Equity accounted investees 28.5 14.3 15.8 Rolling Adjusted EBIT 243.8 278.6 265.8
Rolling net finance costs 33.6 24.6 37.9 Adjusted EBIT: net finance cost 7.3 11.3 7.0
The half year 2018 and full year 2017 Adjusted EBIT: net finance cost calculation include a once-off finance cost of €14.0 million recognised as an exceptional
item in 2017 (see note 6 in the Glanbia plc 2017 Annual Report). Excluding this once-off cost, Adjusted EBIT: net finance cost would be 12.4 and 11.2 times respectively.
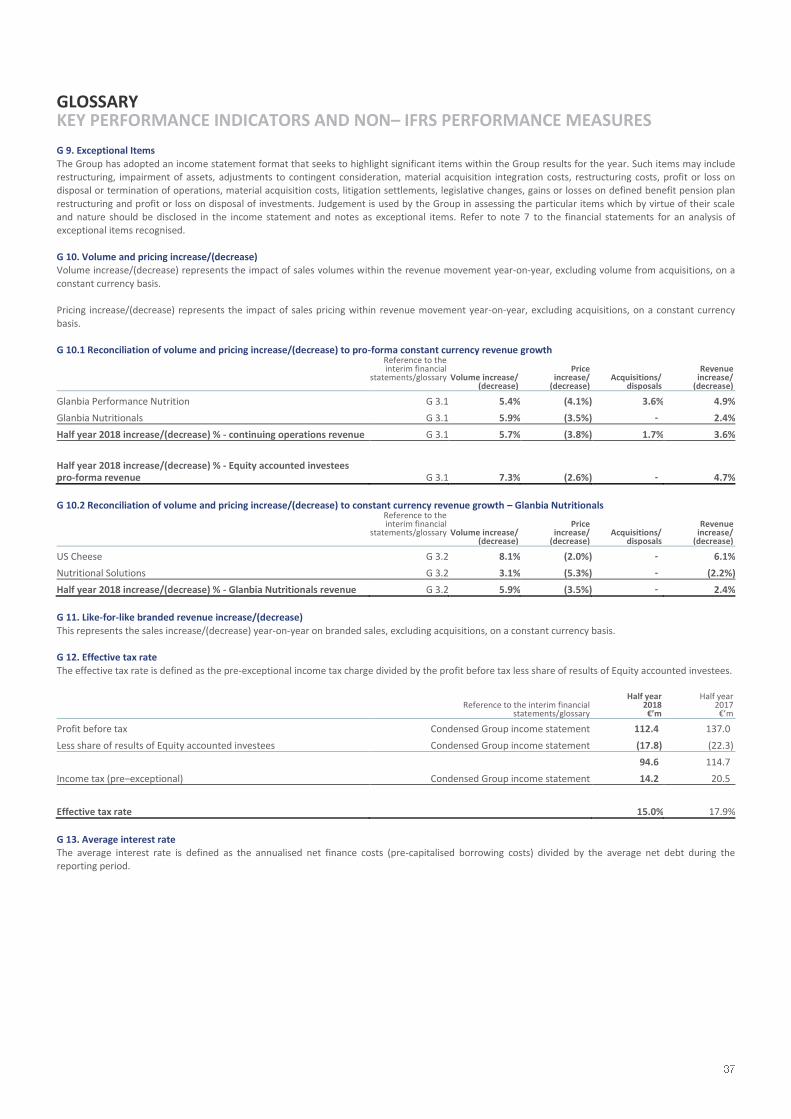
GLOSSARY KEY PERFORMANCE INDICATORS AND NON– IFRS PERFORMANCE MEASURES G 9. Exceptional Items
The Group has adopted an income statement format that seeks to highlight significant items within the Group results for the year. Such items may include restructuring, impairment of assets, adjustments to contingent consideration, material acquisition integration costs, restructuring costs, profit or loss on disposal or termination of operations, material acquisition costs, litigation settlements, legislative changes, gains or losses on defined benefit pension plan
restructuring and profit or loss on disposal of investments. Judgement is used by the Group in assessing the particular items which by virtue of their scale and nature should be disclosed in the income statement and notes as exceptional items. Refer to note 7 to the financial statements for an analysis of exceptional items recognised.
G 10. Volume and pricing increase/(decrease) Volume increase/(decrease) represents the impact of sales volumes within the revenue movement year-on-year, excluding volume from acquisitions, on a
constant currency basis. Pricing increase/(decrease) represents the impact of sales pricing within revenue movement year-on-year, excluding acquisitions, on a constant currency
basis. G 10.1 Reconciliation of volume and pricing increase/(decrease) to pro-forma constant currency revenue growth
Reference to the interim financial
statements/glossary Volume increase/
(decrease)
Price increase/
(decrease) Acquisitions/
disposals
Revenue increase/
(decrease)
Glanbia Performance Nutrition G 3.1 5.4% (4.1%) 3.6% 4.9%
Glanbia Nutritionals G 3.1 5.9% (3.5%) - 2.4%
Half year 2018 increase/(decrease) % - continuing operations revenue G 3.1 5.7% (3.8%) 1.7% 3.6%
Half year 2018 increase/(decrease) % - Equity accounted investees pro-forma revenue G 3.1 7.3% (2.6%) - 4.7%
G 10.2 Reconciliation of volume and pricing increase/(decrease) to constant currency revenue growth – Glanbia Nutritionals
Reference to the interim financial
statements/glossary Volume increase/
(decrease)
Price increase/
(decrease) Acquisitions/
disposals
Revenue increase/
(decrease)
US Cheese G 3.2 8.1% (2.0%) - 6.1%
Nutritional Solutions G 3.2 3.1% (5.3%) - (2.2%)
Half year 2018 increase/(decrease) % - Glanbia Nutritionals revenue G 3.2 5.9% (3.5%) - 2.4%
G 11. Like-for-like branded revenue increase/(decrease)
This represents the sales increase/(decrease) year-on-year on branded sales, excluding acquisitions, on a constant currency basis. G 12. Effective tax rate
The effective tax rate is defined as the pre-exceptional income tax charge divided by the profit before tax less share of results of Equity accounted investees.
Reference to the interim financial statements/glossary
Half year 2018
€’m
Half year 2017
€’m
Profit before tax Condensed Group income statement 112.4 137.0
Less share of results of Equity accounted investees Condensed Group income statement (17.8) (22.3)
94.6 114.7
Income tax (pre–exceptional) Condensed Group income statement 14.2 20.5
Effective tax rate
15.0% 17.9%
G 13. Average interest rate The average interest rate is defined as the annualised net finance costs (pre-capitalised borrowing costs) divided by the average net debt during the reporting period.
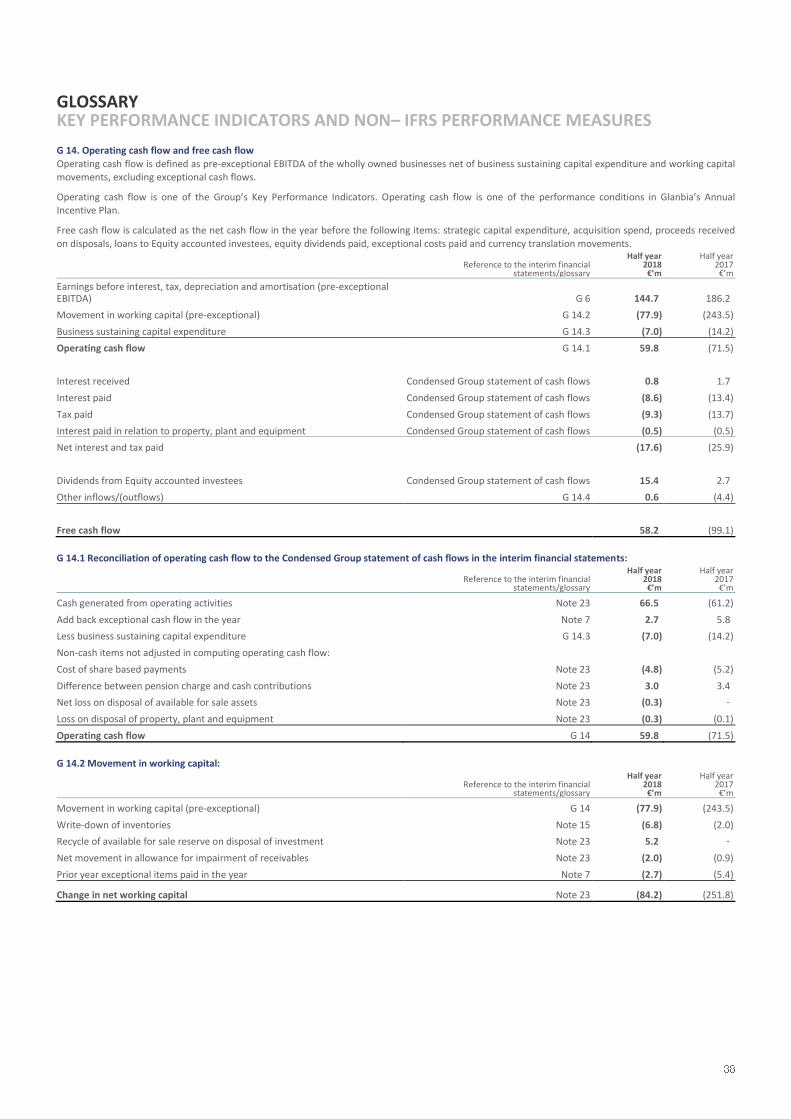
GLOSSARY KEY PERFORMANCE INDICATORS AND NON– IFRS PERFORMANCE MEASURES G 14. Operating cash flow and free cash flow
Operating cash flow is defined as pre-exceptional EBITDA of the wholly owned businesses net of business sustaining capital expenditure and working capital movements, excluding exceptional cash flows.
Operating cash flow is one of the Group’s Key Performance Indicators. Operating cash flow is one of the performance conditions in Glanbia’s Annual Incentive Plan.
Free cash flow is calculated as the net cash flow in the year before the following items: strategic capital expenditure, acquisition spend, proceeds received
on disposals, loans to Equity accounted investees, equity dividends paid, exceptional costs paid and currency translation movements.
Reference to the interim financial statements/glossary
Half year 2018
€’m
Half year 2017
€’m
Earnings before interest, tax, depreciation and amortisation (pre-exceptional EBITDA) G 6 144.7 186.2
Movement in working capital (pre-exceptional) G 14.2 (77.9) (243.5)
Business sustaining capital expenditure G 14.3 (7.0) (14.2)
Operating cash flow G 14.1 59.8 (71.5)
Interest received Condensed Group statement of cash flows 0.8 1.7
Interest paid Condensed Group statement of cash flows (8.6) (13.4)
Tax paid Condensed Group statement of cash flows (9.3) (13.7)
Interest paid in relation to property, plant and equipment Condensed Group statement of cash flows (0.5) (0.5)
Net interest and tax paid (17.6) (25.9)
Dividends from Equity accounted investees Condensed Group statement of cash flows 15.4 2.7
Other inflows/(outflows) G 14.4 0.6 (4.4)
Free cash flow 58.2 (99.1)
G 14.1 Reconciliation of operating cash flow to the Condensed Group statement of cash flows in the interim financial statements:
Reference to the interim financial statements/glossary
Half year 2018
€’m
Half year 2017
€’m
Cash generated from operating activities Note 23 66.5 (61.2)
Add back exceptional cash flow in the year Note 7 2.7 5.8
Less business sustaining capital expenditure G 14.3 (7.0) (14.2)
Non-cash items not adjusted in computing operating cash flow:
Cost of share based payments Note 23 (4.8) (5.2)
Difference between pension charge and cash contributions Note 23 3.0 3.4
Net loss on disposal of available for sale assets Note 23 (0.3) -
Loss on disposal of property, plant and equipment Note 23 (0.3) (0.1)
Operating cash flow G 14 59.8 (71.5)
G 14.2 Movement in working capital:
Reference to the interim financial statements/glossary
Half year 2018
€’m
Half year 2017
€’m
Movement in working capital (pre-exceptional) G 14 (77.9) (243.5)
Write-down of inventories Note 15 (6.8) (2.0)
Recycle of available for sale reserve on disposal of investment Note 23 5.2 -
Net movement in allowance for impairment of receivables Note 23 (2.0) (0.9)
Prior year exceptional items paid in the year Note 7 (2.7) (5.4) Change in net working capital Note 23 (84.2) (251.8)
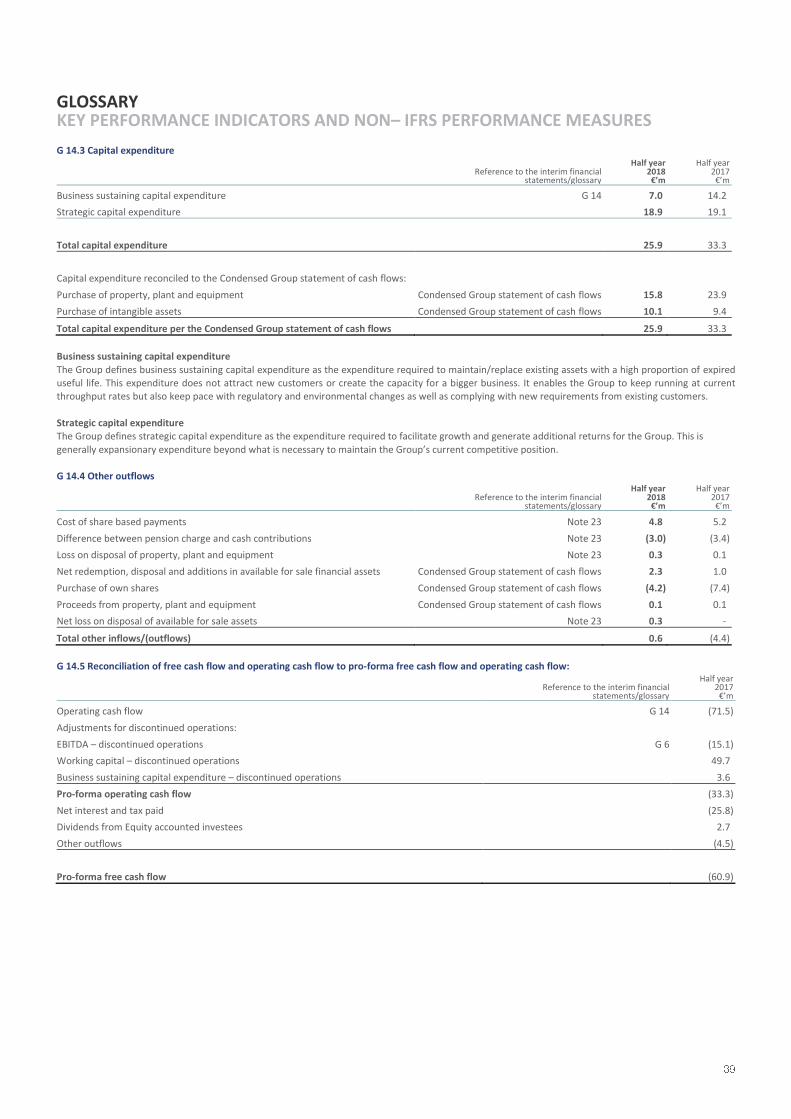
GLOSSARY KEY PERFORMANCE INDICATORS AND NON– IFRS PERFORMANCE MEASURES G 14.3 Capital expenditure
Reference to the interim financial statements/glossary
Half year 2018
€’m
Half year 2017
€’m
Business sustaining capital expenditure G 14 7.0 14.2
Strategic capital expenditure 18.9 19.1
Total capital expenditure 25.9 33.3
Capital expenditure reconciled to the Condensed Group statement of cash flows:
Purchase of property, plant and equipment Condensed Group statement of cash flows 15.8 23.9
Purchase of intangible assets Condensed Group statement of cash flows 10.1 9.4
Total capital expenditure per the Condensed Group statement of cash flows 25.9 33.3
Business sustaining capital expenditure
The Group defines business sustaining capital expenditure as the expenditure required to maintain/replace existing assets with a high proportion of expired useful life. This expenditure does not attract new customers or create the capacity for a bigger business. It enables the Group to keep running at current throughput rates but also keep pace with regulatory and environmental changes as well as complying with new requirements from existing customers.
Strategic capital expenditure The Group defines strategic capital expenditure as the expenditure required to facilitate growth and generate additional returns for the Group. This is
generally expansionary expenditure beyond what is necessary to maintain the Group’s current competitive position. G 14.4 Other outflows
Reference to the interim financial statements/glossary
Half year 2018
€’m
Half year 2017
€’m
Cost of share based payments Note 23 4.8 5.2
Difference between pension charge and cash contributions Note 23 (3.0) (3.4)
Loss on disposal of property, plant and equipment Note 23 0.3 0.1
Net redemption, disposal and additions in available for sale financial assets Condensed Group statement of cash flows 2.3 1.0
Purchase of own shares Condensed Group statement of cash flows (4.2) (7.4)
Proceeds from property, plant and equipment Condensed Group statement of cash flows 0.1 0.1
Net loss on disposal of available for sale assets Note 23 0.3 -
Total other inflows/(outflows) 0.6 (4.4)
G 14.5 Reconciliation of free cash flow and operating cash flow to pro-forma free cash flow and operating cash flow:
Reference to the interim financial statements/glossary
Half year 2017
€’m
Operating cash flow G 14 (71.5)
Adjustments for discontinued operations:
EBITDA – discontinued operations G 6 (15.1)
Working capital – discontinued operations 49.7
Business sustaining capital expenditure – discontinued operations 3.6
Pro-forma operating cash flow (33.3)
Net interest and tax paid (25.8)
Dividends from Equity accounted investees 2.7
Other outflows (4.5)
Pro-forma free cash flow (60.9)