Embed Size (px)
Citation preview

Confidentiality level on slide master
Version number on slide master
Half-Year Results Presentation | 30 September 2010
Vodafone Qatar Q.S.C.
Results Presentation
Half-Year to 30 September 2010

Confidentiality level on slide master
Version number on slide master
Half-Year Results Presentation | 30 September 20102
Disclaimer
• The following presentation is made only to, and is directed only at, persons to whom such a
presentation may lawfully be communicated (“relevant persons”). Any person who is not a
relevant person should not act or rely on this presentation or any of its contents.
• This presentation contains forward-looking statements that are subject to risks and uncertainties,
including statements about Vodafone Qatar’s beliefs and expectations.
• These forward-looking statements are based on assumptions that Vodafone Qatar has made in
light of its experience in the industry in which it operates, as well as its perceptions of historical
trends, current conditions, expected future developments and other factors which Vodafone
Qatar believes are appropriate under the circumstances. Prospective investors should understand that these statements are not guarantees of future performance or results.
• Due to these factors, Vodafone Qatar cautions that prospective investors should not place
undue reliance on any forward-looking statements. Further, any forward-looking statement
speaks only as of the date on which it is made. New risks and uncertainties arise from time-to-time, and it is impossible to predict these events or how they may affect Vodafone Qatar.
• Vodafone, Vodafone Money Transfer and the Vodafone logo are trademarks of the Vodafone
Group.

Confidentiality level on slide master
Version number on slide master
Half-Year Results Presentation | 30 September 20103
Agenda
• Key Highlights
• PBO & Update on Strategies
• Customer Growth
• Financial Highlights
• Revenue
• ARPU
• EBITDA
• EBIT
• Capitalised Fixed Asset Additions
• Debt
• Shareholding Structure
• Q3 FY11 Outlook
• Condensed Statement of Income & Cash Flows
• Condensed Statement of Financial Position
• Contact Details

Confidentiality level on slide master
Version number on slide master
Half-Year Results Presentation | 30 September 20104
Key Highlights
Network
• 100% geographic coverage of 2G & >98% population coverage of 3G
• QR 28m capex brought forward for 2G & 3G improvements, plus indoor
• Trouble tickets significantly reduced this quarter
• Increase agreements to enable more inbound roamers
Distribution & Care
• 9 VF retail stores, 2 mobile truck stores & online shop
• 600 outlets to join at & 2,000 where you can recharge. Increased kiosks
• Call Centre in 5 languages & dedicated Business Customer Care
• >30 specialist retailer outlets & SME channel progressing
• Increased Al-Johara team
Recent Launches
• Vodafone iPhone4 launched September 2010
• Vodafone Business solutions launched November 2010
• International Calling Card launched October 2010
• Freedom relaunch October 2010
• 600,890 Mobile Customers at 30 September 2010
• Mobile Customers grew 12% last quarterCustomer Numbers
Market Share• 37% Population Share at 30 September
• 19.5% Mobile Revenue Market Share for the September quarter
• 22% Mobile Customer Market Share at 30 September
Revenue, ARPU & Profit• Total Revenue 20% increase QoQ
• Total ARPU of QAR 112 for quarter ended 30 September, up 7% QoQ
• EBITDA improvement of 53% from 6mths ended 31 March 2010
• Connected Broadband to The Pearl in May
• Commercial Broadband service launched at The Pearl 14 July 2010Fixed Line

Confidentiality level on slide master
Version number on slide master
Half-Year Results Presentation | 30 September 20105
Our Updated Purpose Based Organisation is:
Confidentiality level on slide master
Version number on slide master
Half-Year Results Presentation | 30 September 20106
Update on delivering to our five Strategies:
• Aggressively Compete to Grow in All Segments
• Really Deliver an Awesome Customer Experience
• Actively Develop All Talent and Be the Role Model for Qatarisation
• Bravely Take a Few Risks on Cool New Stuff
• Partner with the Government to Build Superfast Broadband for All
19.5% Mobile Revenue Market Share for September quarter
CDI & NPS scores improving
9% Qatarisation at September 2010
Vodafone Money Transfer launch due in November 2010

Confidentiality level on slide master
Version number on slide master
Half-Year Results Presentation | 30 September 20107
This slide is intentionally left blank

Confidentiality level on slide master
Version number on slide master
Half-Year Results Presentation | 30 September 20108
Mobile Customer Growth
Quarterly Growth in Mobile Customers & Mobile Customer Market Share
15,404
150,799
353,580
464,962
534,497
600,890
22%
20%
18%
14%
7%
0.8%
-
100,000
200,000
300,000
400,000
500,000
600,000
700,000
Q1 Jun-09 Q2 Sep-09 Q3 Dec-09 Q4 Mar-10 Q1 Jun-10 Q2 Sep-10
Qua
rterly Mobile
Customer N
umbers
-2%
3%
8%
13%
18%
23%
Quarterly Mobile
Custom
er Marke
t Share
Total Mobile Customers Mobile Customer Market Share
*
• 12% growth in Customer Numbers in September quarter

Confidentiality level on slide master
Version number on slide master
Half-Year Results Presentation | 30 September 20109
Financial Highlights
(1) EBIT includes licence cost of QR 7.7bn amortised over 20 years from 1 May 09
Financial Performance
H2 FY09 H1 FY10 H2 FY10 H1 FY11
Mar-09 Sep-09 Mar-10 Sep-10
QARm QARm QARm QARm
Total Revenue n/a 39.2 322.3 385.4
EBITDA (87.1) (156.1) (69.2) (31.9)
EBIT (87.9) (347.4) (327.2) (299.9)
Operating Free Cash Flow (excl. license payment)
(471.0) (88.9) (462.7) (116.9)
Capitalised Fixed Asset Additions 385.7 182.3 341.5 167.7
KPIs
Dec-09 Mar-10 Jun-10 Sep-10
Total Mobile Customers 353,580 464,962 534,497 600,890
Total Quarterly Mobile ARPU 171 101 104 112
Population 1.631M 1.677M 1.678M 1.642M
Annual Population growth 5% 2% 2% 1%
Mobile Penetration 152% 156% 160% 167%
Mobile Population Share 22% 28% 32% 37%
Mobile Customer Market Share 14% 18% 20% 22%
Quarterly
Half-Yearly Periods
1 1 1

Confidentiality level on slide master
Version number on slide master
Half-Year Results Presentation | 30 September 201010
Total Revenue (Fixed Line & Mobile)
Growth in Half-Yearly Total Revenue
385
39
322
-
50
100
150
200
250
300
350
400
450
H1 FY10 H2 FY10 H1 FY11
QA
R (
mill
ions)
+20%

Confidentiality level on slide master
Version number on slide master
Half-Year Results Presentation | 30 September 201011
Total Revenue (Fixed Line & Mobile)
Growth in Quarterly Total Revenue
176
210
36
3
145
178
-
50
100
150
200
250
Q1 Jun-09 Q2 Sep-09 Q3 Dec-09 Q4 Mar-10 Q1 Jun-10 Q2 Sep-10
QA
R (
mill
ions)
+19%

Confidentiality level on slide master
Version number on slide master
Half-Year Results Presentation | 30 September 201012
Total Mobile ARPU
Growth in Quarterly Total Mobile ARPU
101
104
112
94
96
98
100
102
104
106
108
110
112
114
Mar-10 Jun-10 Sep-10
Quart
erly A
RP
U (
QA
R)
+7%

Confidentiality level on slide master
Version number on slide master
Half-Year Results Presentation | 30 September 201013
EBITDA
Progress in Half-Yearly Adjusted EBITDA*
• Forecast first quarter of positive EBITDA by Q4 FY11
• Forecast to be EBITDA positive on a cumulative basis by mid-2012
• Forecast to be cash flow positive on a cumulative basis in the calendar year 2013
*Quarterly EBITDA has been adjusted to align the Vodafone Group management fees with when revenues were earned
H1 FY10 H2 FY10 H1 FY11
Unadjusted EBITDA -156 -69 -32
-32
-158
-67
-180-160-140
-120-100-80-60
-40-20-
QA
R (
mill
ions)
+53%

Confidentiality level on slide master
Version number on slide master
Half-Year Results Presentation | 30 September 201014
EBITDA
Progress in Quarterly Adjusted EBITDA*
*Quarterly EBITDA has been adjusted to align the Vodafone Group management fees with when revenues were earned
-39
-29
-9
-23
-85
-73
-90
-80
-70
-60
-50
-40
-30
-20
-10
-
Q1 Jun-09 Q2 Sep-09 Q3 Dec-09 Q4 Mar-10 Q1 Jun-10 Q2 Sep-10
QA
R (
mill
ions)
Q1 Jun-09 Q2 Sep-09 Q3 Dec-09 Q4 Mar-10 Q1 Jun-10 Q2 Sep-10
Unadjusted
EBITDA-73 -83 -30 -39 -9 -23
• Forecast first quarter of positive EBITDA by Q4 FY11
• Forecast to be EBITDA positive on a cumulative basis by mid-2012
• Forecast to be cash flow positive on a cumulative basis in the calendar year 2013
Confidentiality level on slide master
Version number on slide master
Half-Year Results Presentation | 30 September 2010
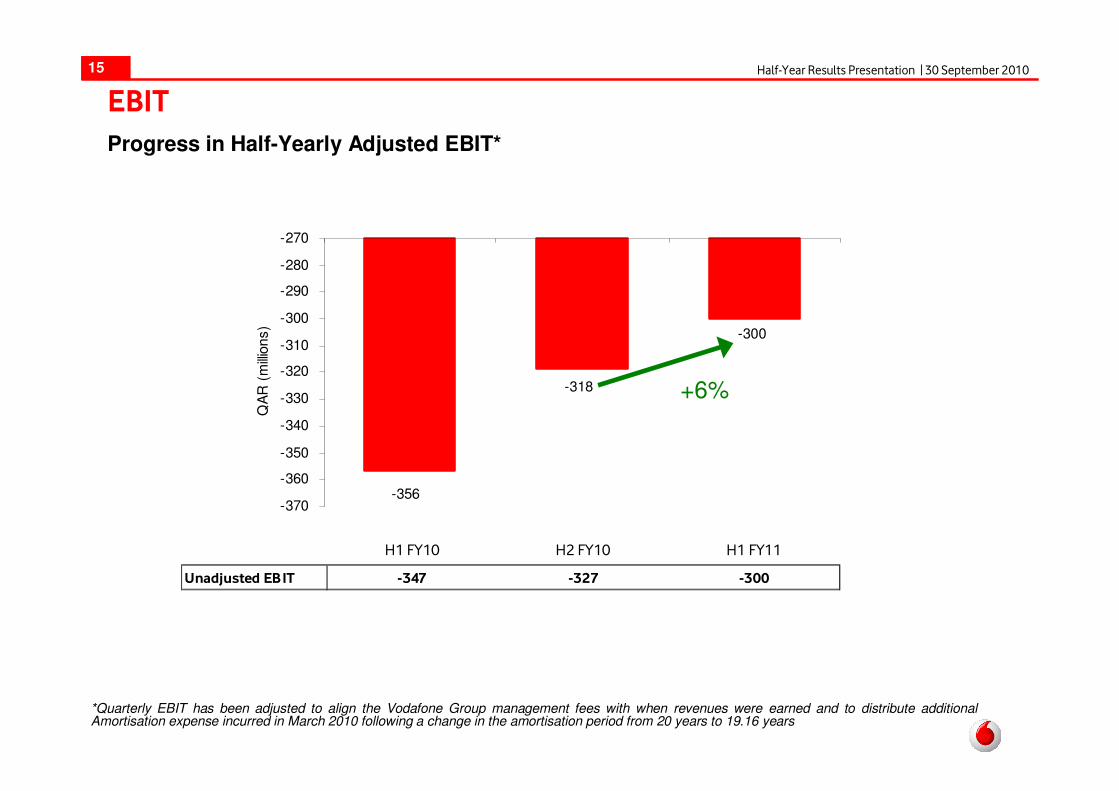
-300
-318
-356-370
-360
-350
-340
-330
-320
-310
-300
-290
-280
-270
QA
R (
millio
ns)
15
EBIT
Progress in Half-Yearly Adjusted EBIT*
*Quarterly EBIT has been adjusted to align the Vodafone Group management fees with when revenues were earned and to distribute additional Amortisation expense incurred in March 2010 following a change in the amortisation period from 20 years to 19.16 years
H1 FY10 H2 FY10 H1 FY11
Unadjusted EBIT -347 -327 -300
+6%

Confidentiality level on slide master
Version number on slide master
Half-Year Results Presentation | 30 September 201016
EBIT
Progress in Quarterly Adjusted EBIT*
*Quarterly EBIT has been adjusted to align the Vodafone Group management fees with when revenues were earned and to distribute additional Amortisation expense incurred in March 2010 following a change in the amortisation period from 20 years to 19.16 years
-162 -156-142
-158-152
-205
-250
-200
-150
-100
-50
-
QA
R (
millio
ns)
Q1 Jun-09 Q2 Sep-09 Q3 Dec-09 Q4 Mar-10 Q1 Jun-10 Q2 Sep-10
Unadjusted
EBIT-149 -199 -149 -178 -142 -158

Confidentiality level on slide master
Version number on slide master
Half-Year Results Presentation | 30 September 2010
524
168
82
389
0
100
200
300
400
500
600
FY 09 FY 10 H1 FY11 H2 FY11
QA
R (
mill
ions)
17
Capitalised Fixed Asset Additions (Mobile only)
• QAR 28m of capital expenditure brought forward from FY12 to FY11 for further network improvements.
• Long-term capital expenditure expected to stabilise at 7% of revenue from FY13 onwards.
Full Year Capex spend
Management forecast

Confidentiality level on slide master
Version number on slide master
Half-Year Results Presentation | 30 September 201018
Net Debt Borrowings less Term Deposits
• Borrowing facility extended from US$110m to US$230m to cater for increase in capex due to accelerated
customer uptake. US$110m facility is at 1mth US Libor + 3.55%; the additional US$120m facility is at an interest
rate of US Libor + 1.55%.
• Future borrowing will be required for fixed line.
433
371
-34
269
156
-42
-294
-360
-407
(500)
(400)
(300)
(200)
(100)
-
100
200
300
400
500
Sep-08 Dec-08 Mar-09 Jun-09 Sep-09 Dec-09 Mar-10 Jun-10 Sep-10
QAR (millions)
Confidentiality level on slide master
Version number on slide master
Half-Year Results Presentation | 30 September 201019
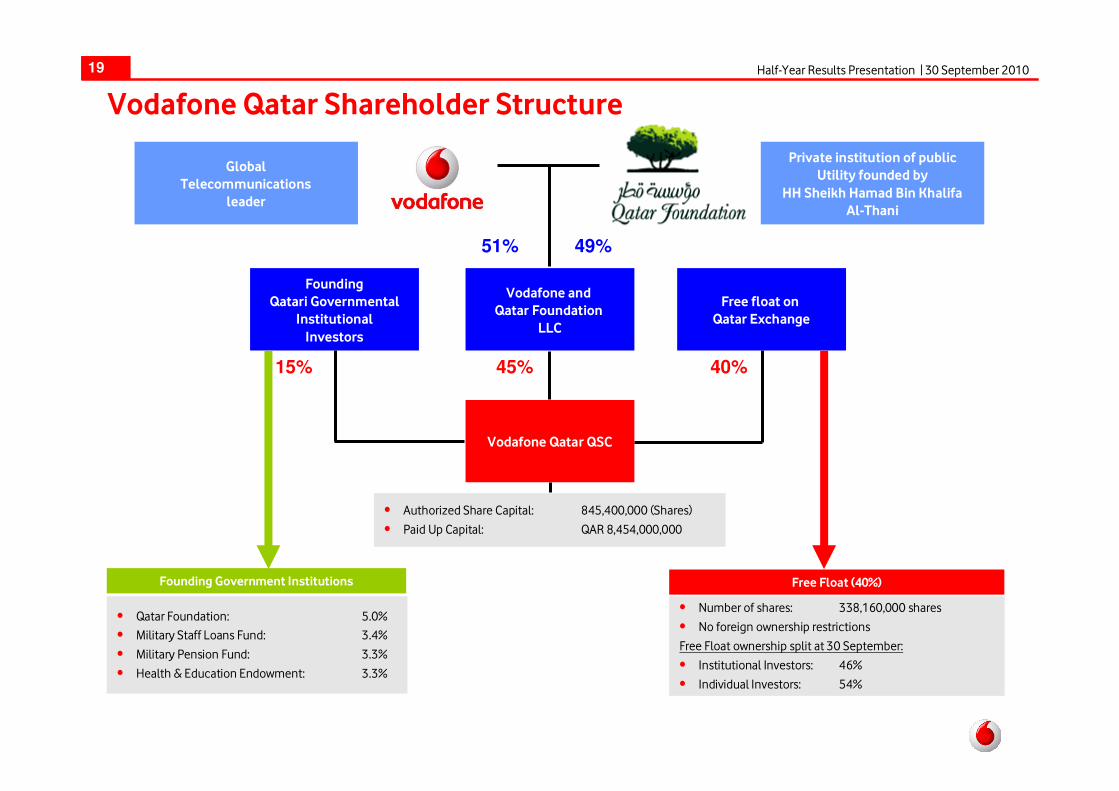
Vodafone Qatar Shareholder Structure
Global
Telecommunications
leader
Private institution of public
Utility founded by
HH Sheikh Hamad Bin Khalifa
Al-Thani
Founding
Qatari Governmental
Institutional
Investors
Free float on
Qatar Exchange
Vodafone and
Qatar Foundation
LLC
Vodafone Qatar QSC
40%15% 45%
49%51%
• Qatar Foundation: 5.0%
• Military Staff Loans Fund: 3.4%
• Military Pension Fund: 3.3%
• Health & Education Endowment: 3.3%
• Number of shares: 338,160,000 shares
• No foreign ownership restrictions
Free Float ownership split at 30 September:
• Institutional Investors: 46%
• Individual Investors: 54%
Founding Government Institutions Free Float (40%)
• Authorized Share Capital: 845,400,000 (Shares)
• Paid Up Capital: QAR 8,454,000,000

Confidentiality level on slide master
Version number on slide master
Half-Year Results Presentation | 30 September 201020
Outlook Q3 FY11
• Focus on customer acquisition to new segments – Qatari, Khaliji,
Business
• Increase distribution footprint for business customers
• Commercial launch of Vodafone Money Transfer
• Further enhancements to the mobile network (QAR 28m brought
forward)
• Additional 2G sites
• Improving 3G speeds from 3.6 to HSDP+
• Greater UMTS900 coverage
• Launch of fixed line voice services to The Pearl-Qatar

Confidentiality level on slide master
Version number on slide master
Half-Year Results Presentation | 30 September 201021
Condensed Statement of Income and Cash Flows – 6 months ended 30 Sep 10
Six months
ended
September 2010
Six months
ended September
2009
Six months
ended
September 2010
Six months
ended September
2009QAR ‘000 QAR ‘000 QAR ‘000 QAR ‘000
Revenue 385,447 39,188 Net cash flows used in operating
activities
23,760 (42,636)
Direct costs (196,854) (36,857)
Other expenses (220,444) (158,419) Cash flows from investing activities
EBITDA (31,851) (156,088) Purchase of property, plant and
equipment
(114,684) (47,906)
Payment for intangible assets (10,000) (3,086,400)
Depreciation (66,828) (30,567) Interest received 994 4,002
Amortisation of licence (201,269) (160,750) Net cash flows used in investing
activities
(123,690) (3,130,304)
Interest income 2,171 11,858
Financing costs (14,598) (13,869) Cash flows from financing activities
Loss before taxation (312,375) (349,416) Proceeds from issue of ordinary share
capital
- 3,393,042
Proceeds from long term borrowings 109,200 363,911
Income tax expense - - Repayment of short term borrowings - (35,000)
Interest paid (1,810) (24,123)Loss for the period (312,375) (349,416) Net cash flows from financing activities 107,390 3,697,830
Basic and diluted loss per share (QAR) (0.37) (0.44)
Net cash flows 7,460 524,890
Six months
ended
September 2010
Six months
ended September
2009
85,356 554
QAR ‘000 QAR ‘00092,816 525,444
Loss for the period (312,375) (349,416)
Other comprehensive income -
Fair value gains transferred to income
statement
32,049
Total comprehensive loss for the period (280,326) (349,416)
Cash and cash equivalents at the end of
the financial period
Cash and cash equivalents at the beginning of the financial period

Confidentiality level on slide master
Version number on slide master
Half-Year Results Presentation | 30 September 201022
Condensed Statement of Financial Position – as at 30 Sep 2010
30 September
2010
30 September
2009
30 September
2010
30 September
2009QAR ‘000 QAR ‘000 QAR ‘000 QAR ‘000
Non-current assets Equity
Property, plant and equipment 954,205 832,283 Share capital 8,454,000 8,454,000Intangible assets 7,155,466 7,346,735 Legal reserve 11,442 11,442
Trade and other receivables 6,383 4,432 Accumulated other comprehensive income
32,049 -
Total non-current assets 8,116,054 8,183,450 Retained losses (1,118,686) (806,311)
Total equity 7,378,805 7,659,131Current assets Non-current liabilities
Inventory 13,953 21,713 End of employment benefits 3,405 1,972
Trade and other receivables 180,618 118,207 Provisions 6,184 4,848Cash and cash equivalents 92,816 85,356 Long term borrowings 499,894 379,083Total current assets 287,387 225,276 Total non-current liabilities 509,483 385,903
Total assets 8,403,441 8,408,726
Current liabilities
Trade and other payables 515,153 363,692Total current liabilities 515,153 363,692Total liabilities 1,024,636 749,595
Total equity and liabilities 8,403,441 8,408,726

Confidentiality level on slide master
Version number on slide master
Half-Year Results Presentation | 30 September 201023
Contact Details
John Tombleson
Chief Financial Officer & Acting CEO
M +974 777 5835
Address: Vodafone QatarPO BOX 27727Doha, Qatar
Website: www.vodafone.com.qa
Rachael Mayo-Smith
Head of Investor Relations
M +974 777 5642
Khalid BarzakInvestor Relations ManagerM +974 777 5413E [email protected]