Embed Size (px)
Citation preview
2 March 2010
Centennial Coal Half Year Results 1
Centennial CoalUBS Australasian Investor Briefings(December 2009 - Half Year Results)
Bob Cameron, Managing Director/CEOandTony Macko, General Manager: Corporate Affairs
4 & 5 March 2010 (Singapore and Hong Kong)
2 March 2010
Centennial Coal Half Year Results 2
3
Disclaimer ‐ SingaporeIn attending or viewing this presentation you agree to be bound by the following terms and conditions.
This presentation has been prepared by Centennial Coal Company Limited (the Company). This presentation may contain information (including information derived from publicly available sources) that has not been independently verified by the Company.
Any forward looking information in this presentation has been prepared on the basis of a number of current assumptions which mayultimately prove to be materially incorrect. Therefore actual results, outcomes and achievements may be materially greater or less than estimated. This presentation should not be relied upon as a forecast by the Company.
Neither the Company nor its directors, officers, employees or advisors make any representation or warranty and accordingly no reliance should be placed on the fairness, accuracy, completeness or reliability of the information contained in this presentation. To the maximum extent permitted by law, the Company its directors, officers, employees or advisors do not accept any liability for any errors, omissions or loss (including because of negligence or otherwise) arising, directly or indirectly, from any use of this presentation or information contained in this presentation.
This presentation is for information purposes only and does not constitute or form part of any offer for sale or issue for any securities or an offer or invitation to purchase or subscribe for any such securities.
This presentation and its contents must not be distributed or circulated to any person in Singapore other than an institutional investor pursuant to Section 274 of the Securities and Futures Act, Chapter 289 of Singapore.
This presentation and its contents must not be distributed, transmitted or viewed by any person in any jurisdiction where the distribution, transmission or viewing of this presentation would be unlawful under the securities or other laws of that or any other jurisdiction.
This presentation and its content is not intended to be relied upon as advice to investors or potential investors and does not take into account an individual investor’s investment objectives or financial situation. Investors or potential investors should consider their individual circumstances and consult professional advisors where appropriate.
4
Disclaimer – Hong KongIn attending or viewing this presentation you agree to be bound by the following terms and conditions.
This presentation has been prepared by Centennial Coal Company Limited (the Company). This presentation may contain information (including information derived from publicly available sources) that has not been independently verified by the Company.
The information contained in this presentation is provided as at the date of this presentation and is subject to change without notice. There is no obligation to update, modify or amend this presentation or otherwise to notify recipients if any information, opinion, projection, forecast or estimate set forth herein, changes or subsequently becomes inaccurate. Any forward looking information in this presentation has been prepared on the basis of a number of current assumptions and expectations of future events which may ultimately prove to be materially incorrect or may not be realised. Therefore actual results, outcomes and achievements may be materially greater or less than estimated.
This presentation should not be relied upon as a forecast by the Company. The Company assumes no responsibility publicly to amend, modify or revise any forward looking statements, on the basis of any subsequent developments, information or events, or otherwise.
Neither the Company nor any of its respective affiliates, directors, officers, employees, representatives or advisors make any representation or warranty and accordingly no reliance should be placed on the fairness, correctness, accuracy, completeness or reliability of the information contained in this presentation. To the maximum extent permitted by law, the Company, its respective affiliates, directors, officers, employees, representatives or advisors do not accept any liability for any errors, omissions or loss (including because of negligence or otherwise) arising, directly or indirectly, from any use of this presentation or information contained in this presentation.
This presentation is being communicated only to persons who have professional experience in matters relating to investments and to persons to whom it is lawful to communicate (all such persons being referred to as "relevant persons"). This presentation is only directed at relevant persons.
This presentation is for information purposes only, and may not be forwarded, reproduced or redistributed to any other person in whole or in part. This presentation does not constitute or form part of, and may not be used in connection with, any offer for sale or issue for any securities or an offer or invitation to purchase, acquire or subscribe for any such securities, and nothing contained herein shall form the basis of any contract or commitment whatsoever. This presentation and its contents must not be distributed, transmitted or viewed by any person in any jurisdiction where the distribution, transmission or viewing of this presentation would be unlawful under the securities or other laws of that or any other jurisdiction.
This presentation and its content is not intended to be relied upon as advice to investors or potential investors and does not take into account an individual investor’s investment objectives or financial situation. Investors or potential investors should make their own independent investigation and appraisal of the business and financial condition of the Company (including, but not limited to any tax, legal, accounting and economic considerations relevant to the Company), consider their own individual circumstances and consult professional advisors where appropriate.
2 March 2010
Centennial Coal Half Year Results 3
5
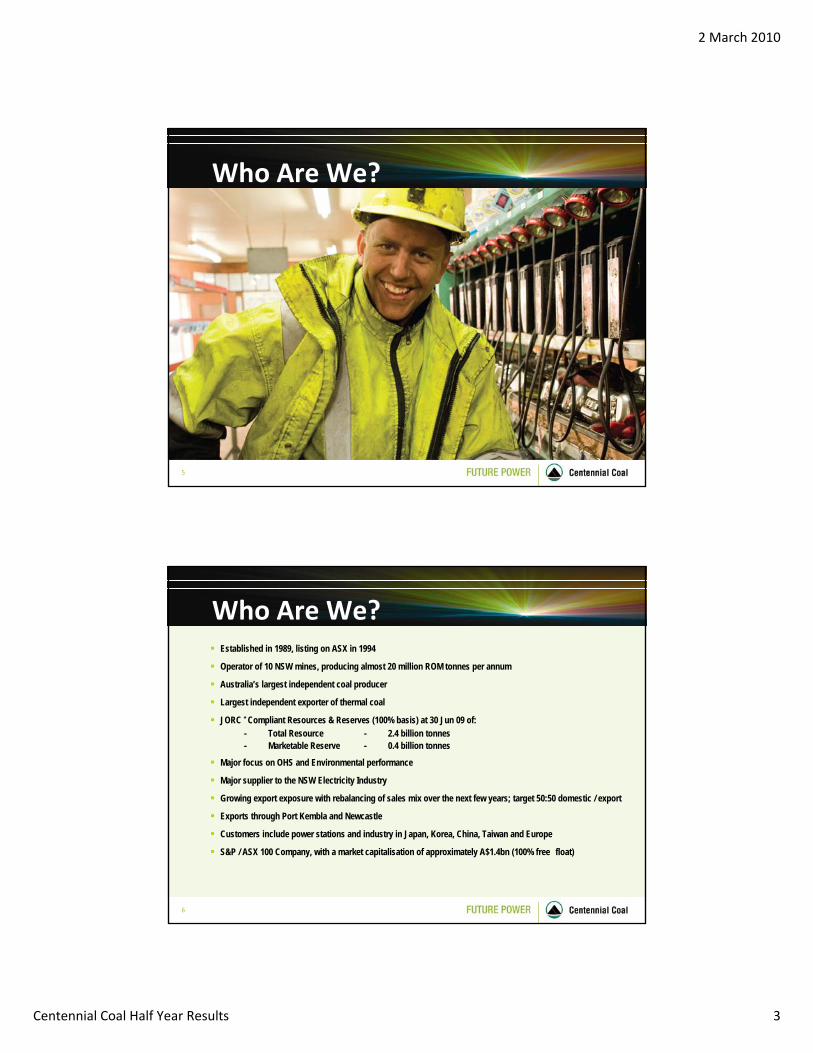
Who Are We?
6
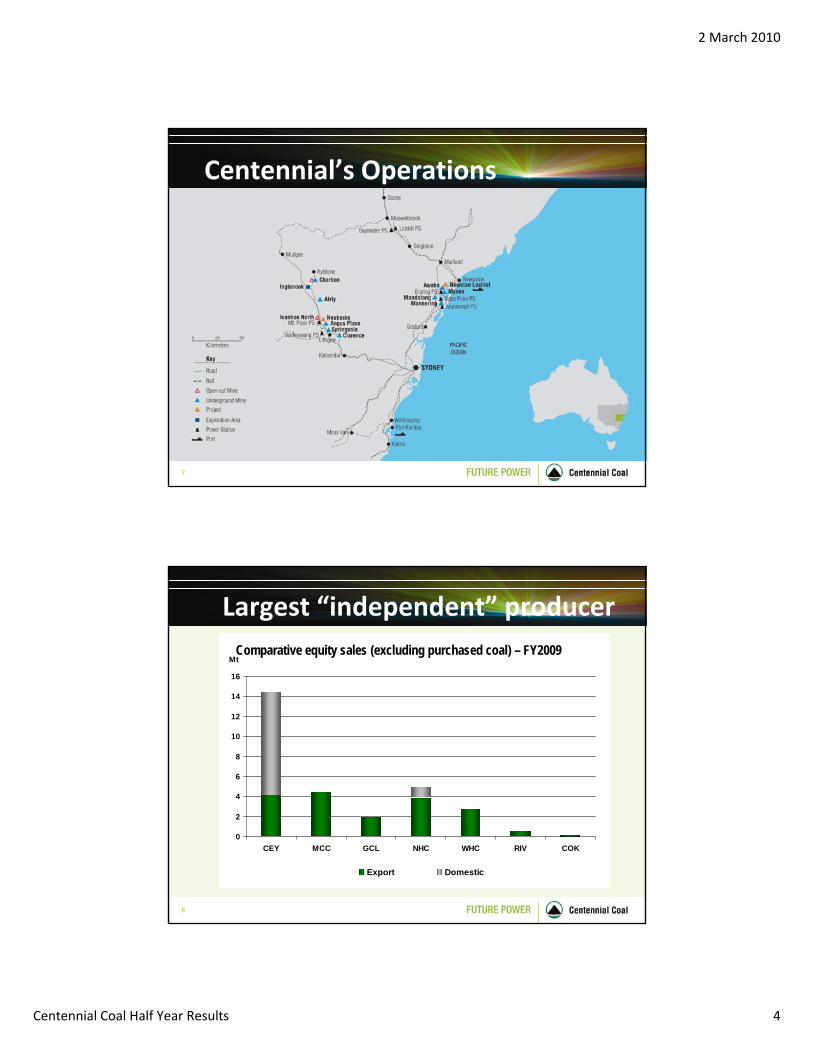
Who Are We?Established in 1989, listing on ASX in 1994
Operator of 10 NSW mines, producing almost 20 million ROM tonnes per annum
Australia’s largest independent coal producer
Largest independent exporter of thermal coal
JORC * Compliant Resources & Reserves (100% basis) at 30 Jun 09 of:- Total Resource - 2.4 billion tonnes- Marketable Reserve - 0.4 billion tonnes
Major focus on OHS and Environmental performance
Major supplier to the NSW Electricity Industry
Growing export exposure with rebalancing of sales mix over the next few years; target 50:50 domestic / export
Exports through Port Kembla and Newcastle
Customers include power stations and industry in Japan, Korea, China, Taiwan and Europe
S&P / ASX 100 Company, with a market capitalisation of approximately A$1.4bn (100% free float)
2 March 2010
Centennial Coal Half Year Results 4
7
Centennial’s Operations
8
0
2
4
6
8
10
12
14
16
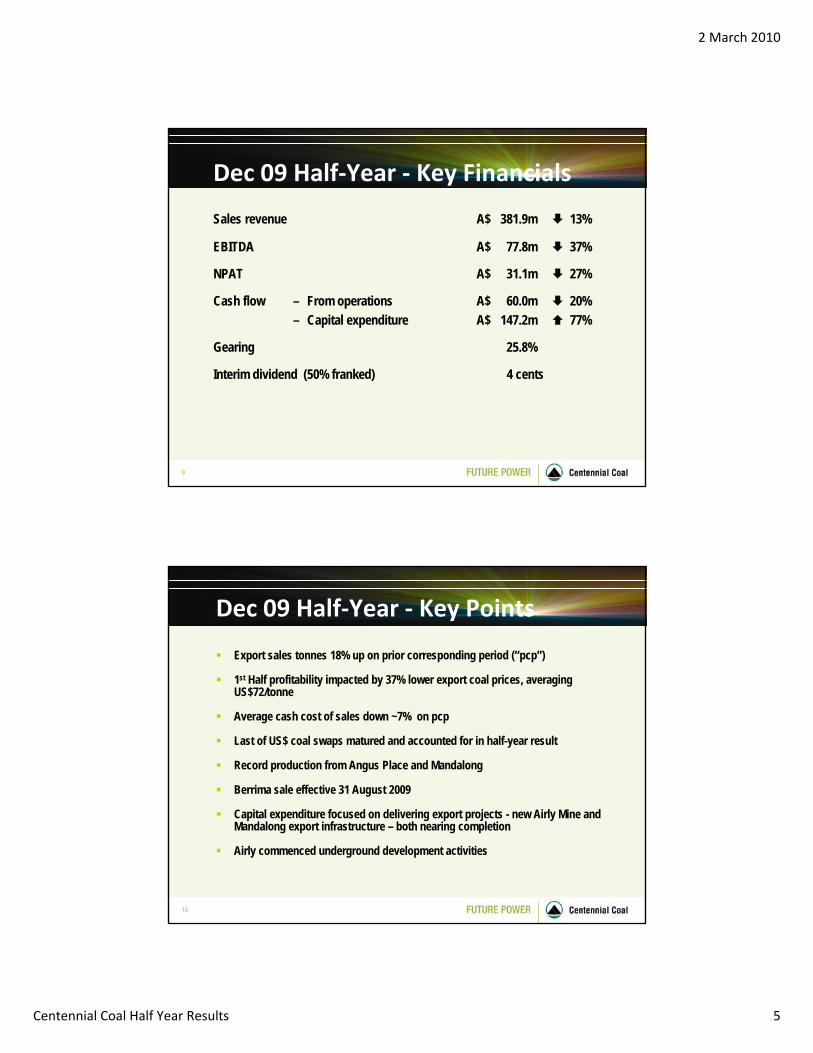
CEY MCC GCL NHC WHC RIV COK
Mt
Export Domestic
Largest “independent” producerComparative equity sales (excluding purchased coal) – FY2009
2 March 2010
Centennial Coal Half Year Results 5
9
Dec 09 Half‐Year ‐ Key Financials
Sales revenue A$ 381.9m 13%
EBITDA A$ 77.8m 37%
NPAT A$ 31.1m 27%
Cash flow – From operations A$ 60.0m 20%– Capital expenditure A$ 147.2m 77%
Gearing 25.8%
Interim dividend (50% franked) 4 cents
10
Dec 09 Half‐Year ‐ Key Points
Export sales tonnes 18% up on prior corresponding period (“pcp”)
1st Half profitability impacted by 37% lower export coal prices, averaging US$72/tonne
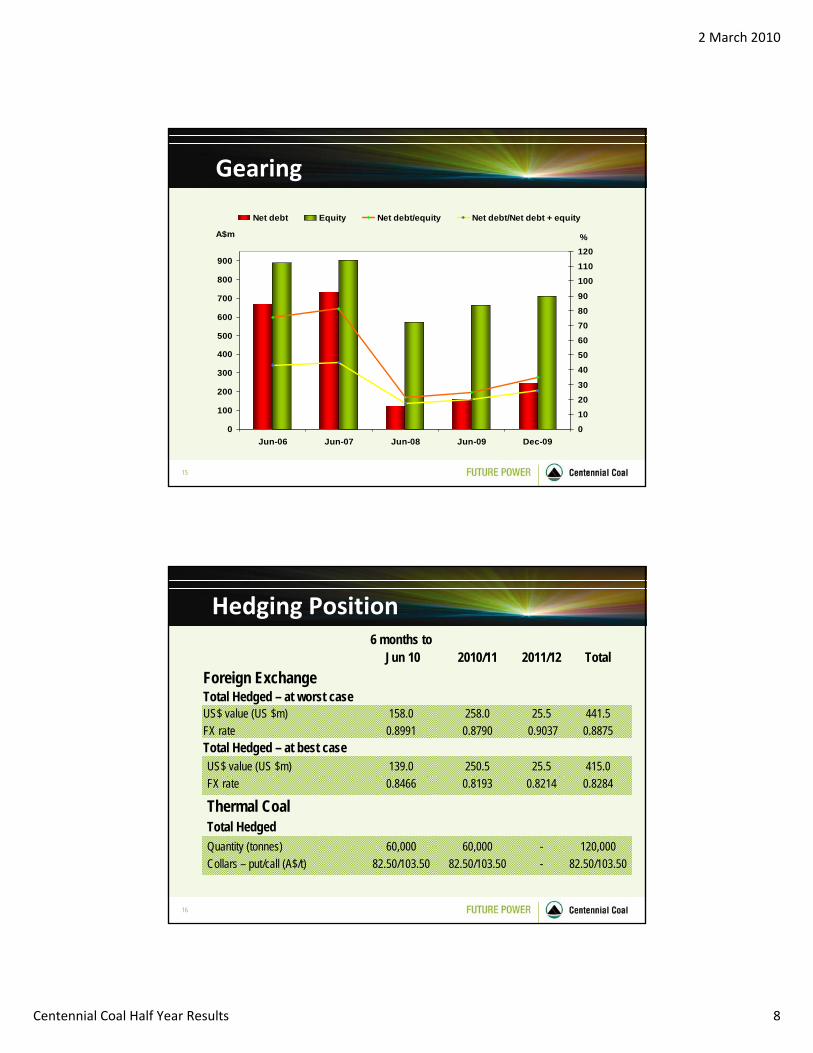
Average cash cost of sales down ~7% on pcp
Last of US$ coal swaps matured and accounted for in half-year result
Record production from Angus Place and Mandalong
Berrima sale effective 31 August 2009
Capital expenditure focused on delivering export projects - new Airly Mine and Mandalong export infrastructure – both nearing completion
Airly commenced underground development activities
2 March 2010
Centennial Coal Half Year Results 6
11
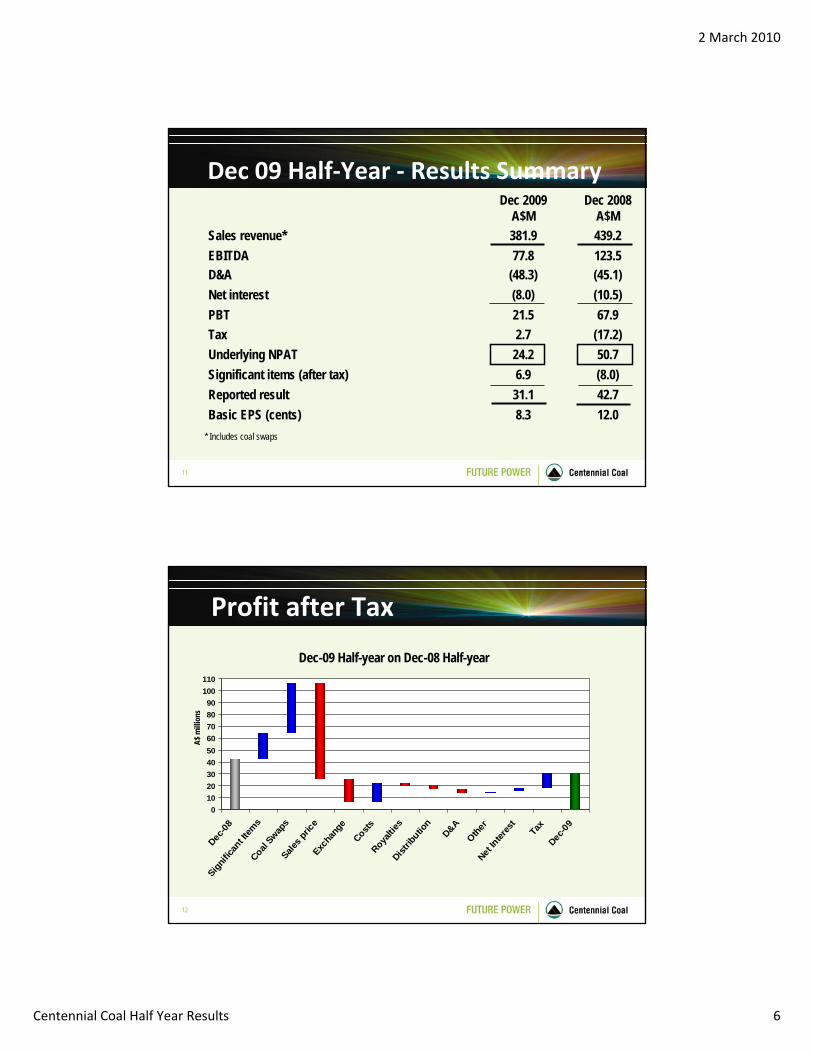
Dec 09 Half‐Year ‐ Results Summary
42.731.1Reported result12.08.3Basic EPS (cents)
(8.0)50.7
(17.2)67.9
(10.5)(45.1)123.5439.2
Dec 2008A$M
2.7Tax
6.9Significant items (after tax)24.2Underlying NPAT
(48.3)D&A (8.0)Net interest 21.5PBT
77.8EBITDA 381.9Sales revenue*
Dec 2009A$M
* Includes coal swaps
12
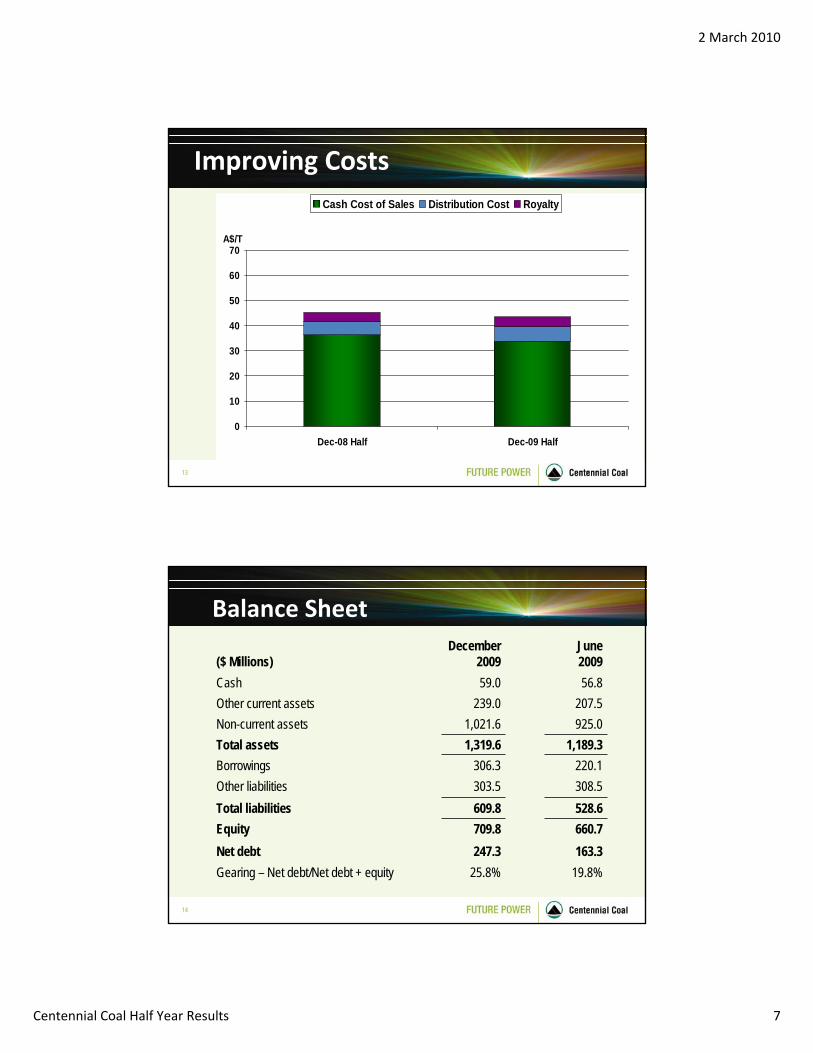
Profit after Tax
0102030405060708090
100110
Dec-08
Signific
ant It
ems
Coal Swap
sSale
s pric
eExc
hang
eCosts
Royaltie
sDist
ributio
n
D&AOthe
rNet
Interes
t
Tax
Dec-09
Dec-09 Half-year on Dec-08 Half-year
A$ m
illion
s
2 March 2010
Centennial Coal Half Year Results 7
13
Improving Costs
0
10
20
30
40
50
60
70
Dec-08 Half Dec-09 Half
A$/T
Cash Cost of Sales Distribution Cost Royalty
14
Balance Sheet
19.8%25.8%Gearing – Net debt/Net debt + equity163.3247.3Net debt660.7709.8Equity528.6609.8Total liabilities308.5303.5Other liabilities220.1306.3Borrowings
1,189.31,319.6Total assets925.01,021.6Non-current assets207.5239.0Other current assets56.859.0Cash
June2009
December2009($ Millions)
2 March 2010
Centennial Coal Half Year Results 8
15
Gearing
0
100
200
300
400
500
600
700
800
900
Jun-06 Jun-07 Jun-08 Jun-09 Dec-09
A$m
0
1020
30
40
5060
7080
90
100110
120%
Net debt Equity Net debt/equity Net debt/Net debt + equity
16
Hedging Position6 months to
--
25.50.8214
25.50.9037
2011/12
120,00082.50/103.50
60,00082.50/103.50
60,00082.50/103.50
Quantity (tonnes) Collars – put/call (A$/t)
Total HedgedThermal Coal
415.00.8284
250.50.8193
139.00.8466
US$ value (US $m)FX rate
Total Hedged – at best case
441.50.8875
258.00.8790
158.00.8991
US$ value (US $m)FX rate
Foreign ExchangeTotal Hedged – at worst case
Total2010/11Jun 10
2 March 2010
Centennial Coal Half Year Results 9
17
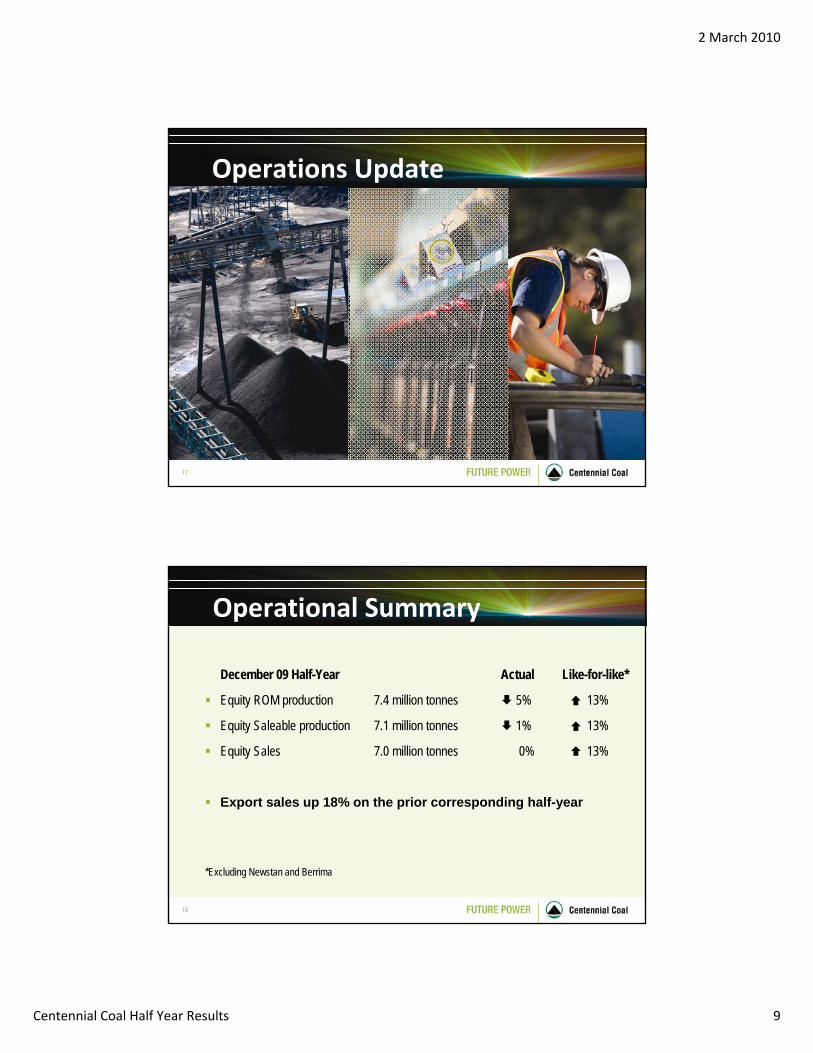
Operations Update
18
Operational Summary
December 09 Half-Year Actual Like-for-like*
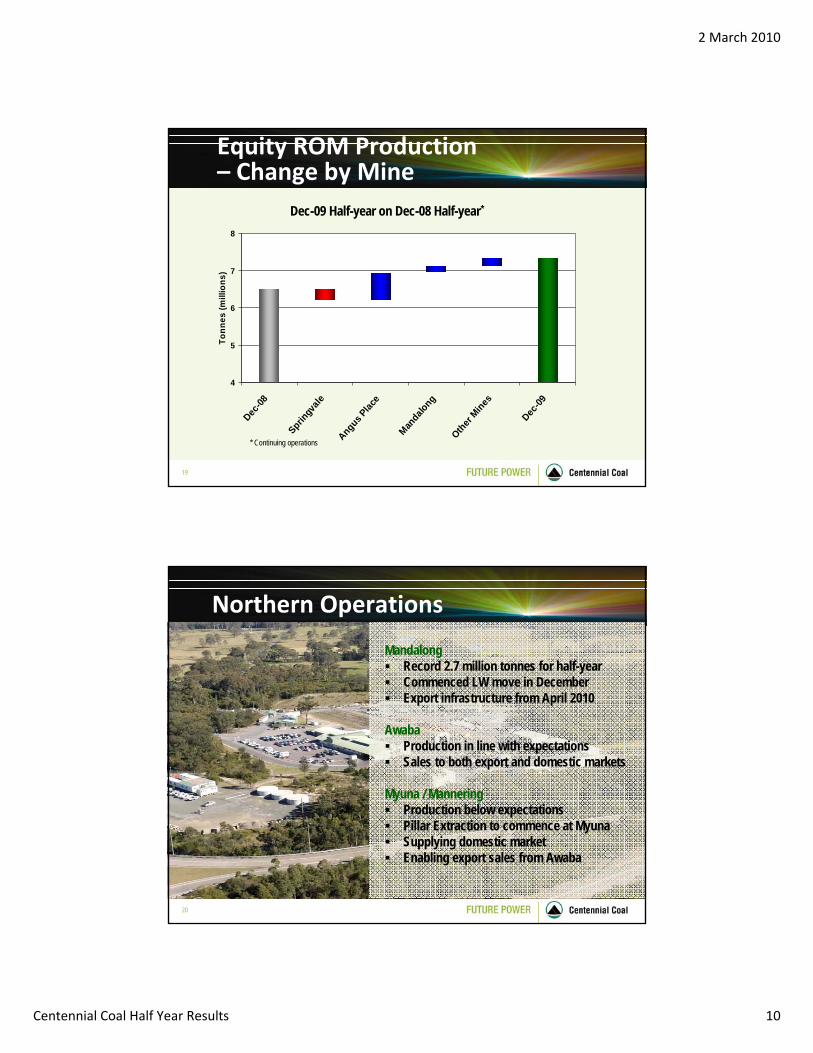
Equity ROM production 7.4 million tonnes 5% 13%
Equity Saleable production 7.1 million tonnes 1% 13%
Equity Sales 7.0 million tonnes 0% 13%
Export sales up 18% on the prior corresponding half-year
*Excluding Newstan and Berrima
2 March 2010
Centennial Coal Half Year Results 10
19
Equity ROM Production – Change by Mine
4
5
6
7
8Dec
-08
Springv
ale
Angus Plac
e
Mandalo
ng
Other
Mines
Dec-09
Tonn
es (m
illio
ns)
Dec-09 Half-year on Dec-08 Half-year*
* Continuing operations
20
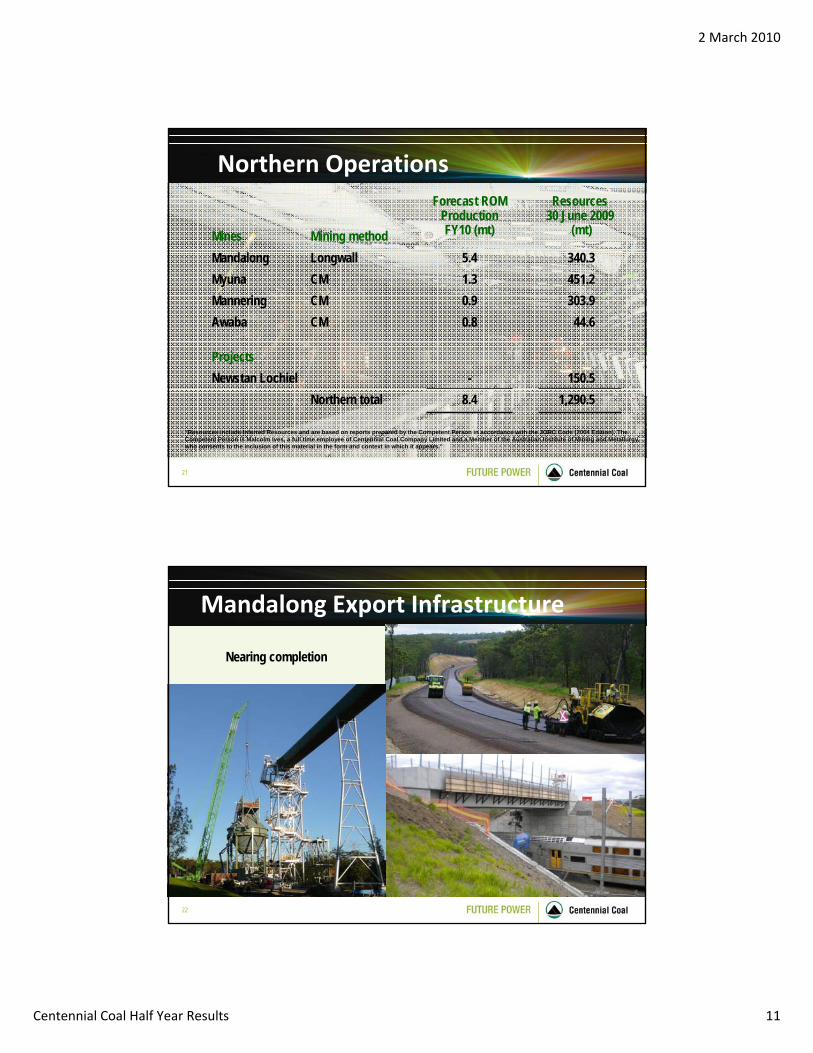
Northern Operations
MandalongRecord 2.7 million tonnes for half-yearCommenced LW move in DecemberExport infrastructure from April 2010
AwabaProduction in line with expectationsSales to both export and domestic markets
Myuna / ManneringProduction below expectationsPillar Extraction to commence at MyunaSupplying domestic marketEnabling export sales from Awaba
2 March 2010
Centennial Coal Half Year Results 11
21
Northern Operations
1,290.58.4Northern total
Projects
CMCMCMLongwallMining method
150.5-Newstan Lochiel
44.60.8Awaba303.90.9Mannering451.21.3Myuna340.35.4Mandalong
Resources30 June 2009
(mt)
Forecast ROM Production FY10 (mt)Mines
"Resources include Inferred Resources and are based on reports prepared by the Competent Person in accordance with the JORC Code (2004 Edition). The Competent Person is Malcolm Ives, a full time employee of Centennial Coal Company Limited and a Member of the Australian Institute of Mining and Metallurgy, who consents to the inclusion of this material in the form and context in which it appears."
22
Mandalong Export Infrastructure
Nearing completion
2 March 2010
Centennial Coal Half Year Results 12
23
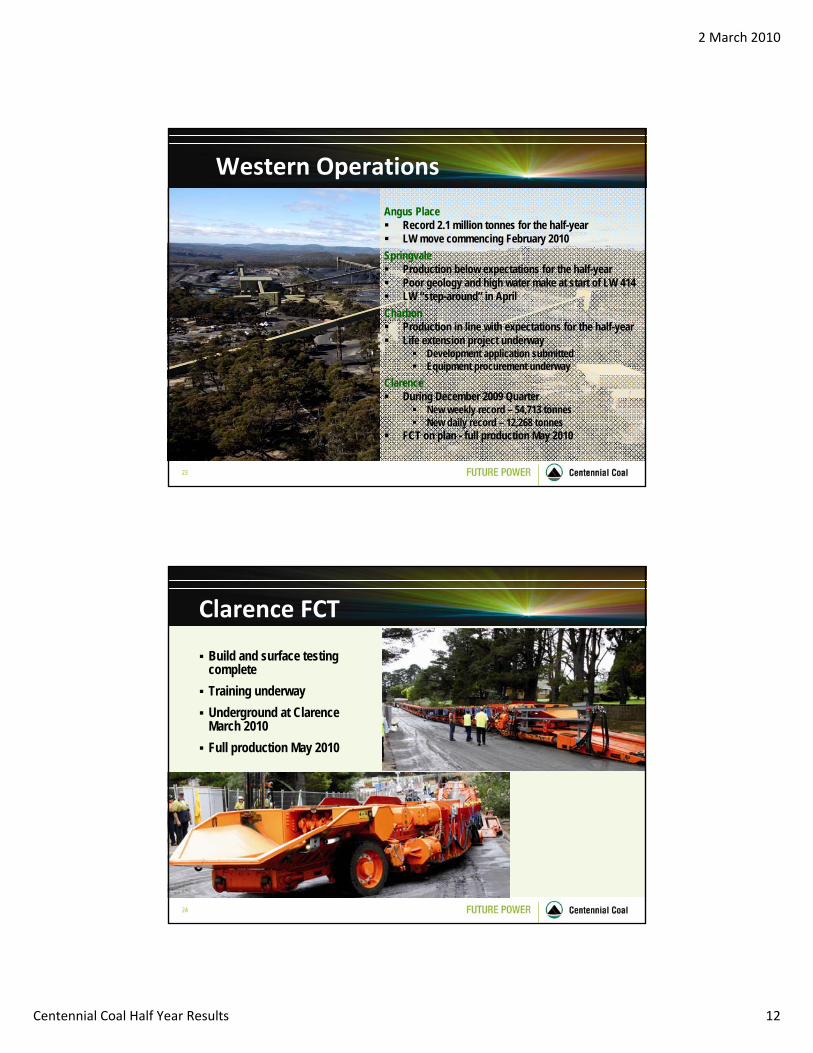
Western Operations
Angus PlaceRecord 2.1 million tonnes for the half-yearLW move commencing February 2010
SpringvaleProduction below expectations for the half-yearPoor geology and high water make at start of LW 414LW “step-around” in April
CharbonProduction in line with expectations for the half-yearLife extension project underway
Development application submittedEquipment procurement underway
ClarenceDuring December 2009 Quarter
New weekly record – 54,713 tonnesNew daily record – 12,268 tonnes
FCT on plan - full production May 2010
24
Clarence FCT
Build and surface testing completeTraining underwayUnderground at Clarence March 2010Full production May 2010
2 March 2010
Centennial Coal Half Year Results 13
25
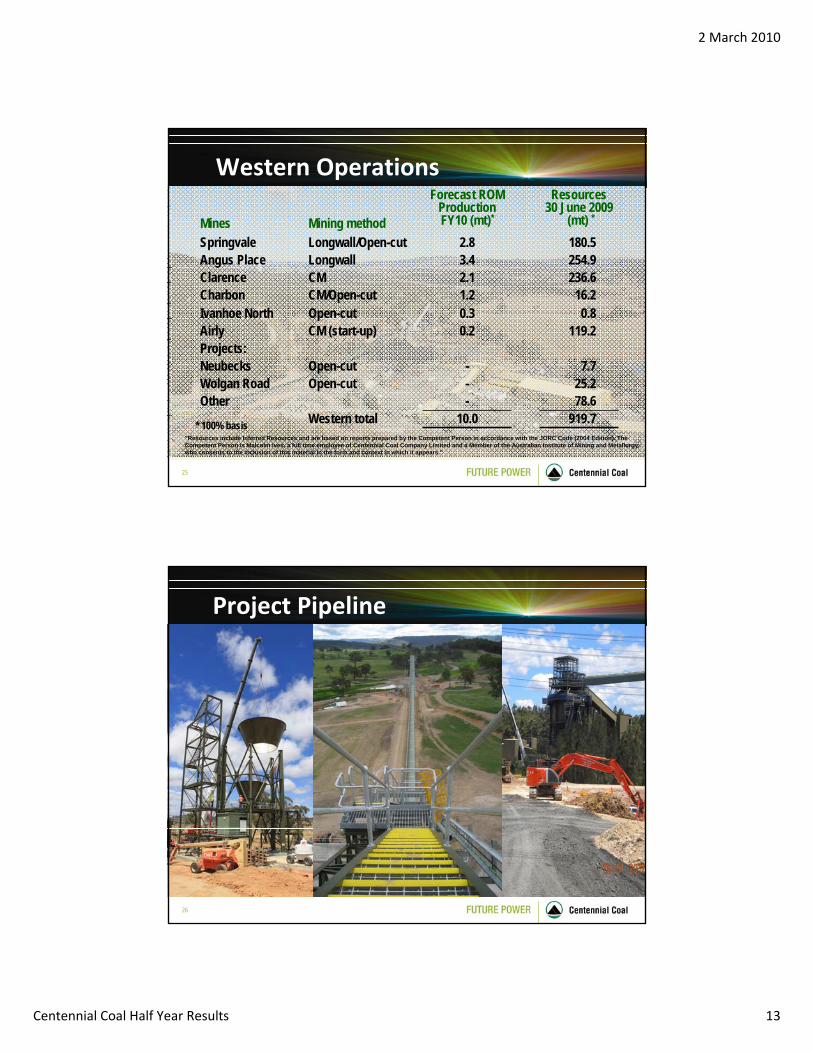
Western Operations
78.6-OtherWestern total
Open-cutOpen-cut
CM (start-up)Open-cutCM/Open-cutCMLongwallLongwall/Open-cutMining method
919.710.0
25.2-Wolgan Road7.7-Neubecks
Projects:119.20.2Airly
0.80.3Ivanhoe North16.21.2Charbon
236.62.1Clarence254.93.4Angus Place180.52.8Springvale
Resources30 June 2009
(mt) *Forecast ROM
Production FY10 (mt)*Mines
* 100% basis "Resources include Inferred Resources and are based on reports prepared by the Competent Person in accordance with the JORC Code (2004 Edition). The Competent Person is Malcolm Ives, a full time employee of Centennial Coal Company Limited and a Member of the Australian Institute of Mining and Metallurgy, who consents to the inclusion of this material in the form and context in which it appears."
26
Project Pipeline
2 March 2010
Centennial Coal Half Year Results 14
27
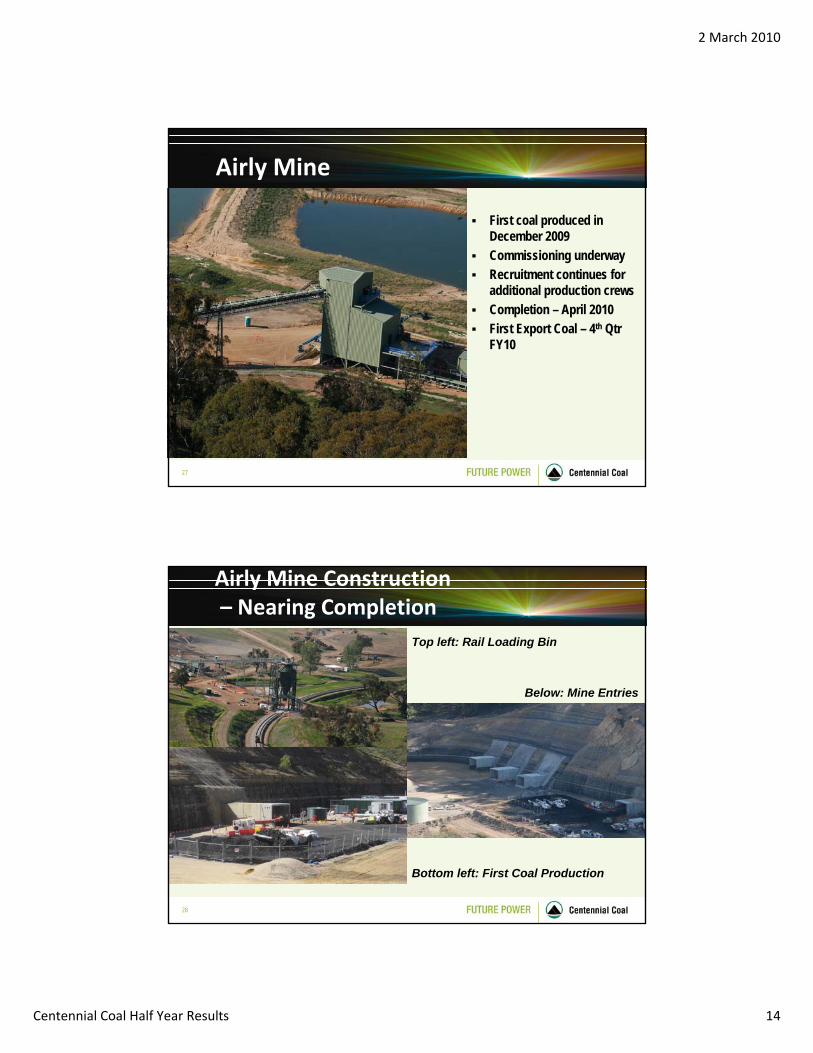
First coal produced in December 2009Commissioning underwayRecruitment continues for additional production crewsCompletion – April 2010First Export Coal – 4th Qtr FY10
Airly Mine
28
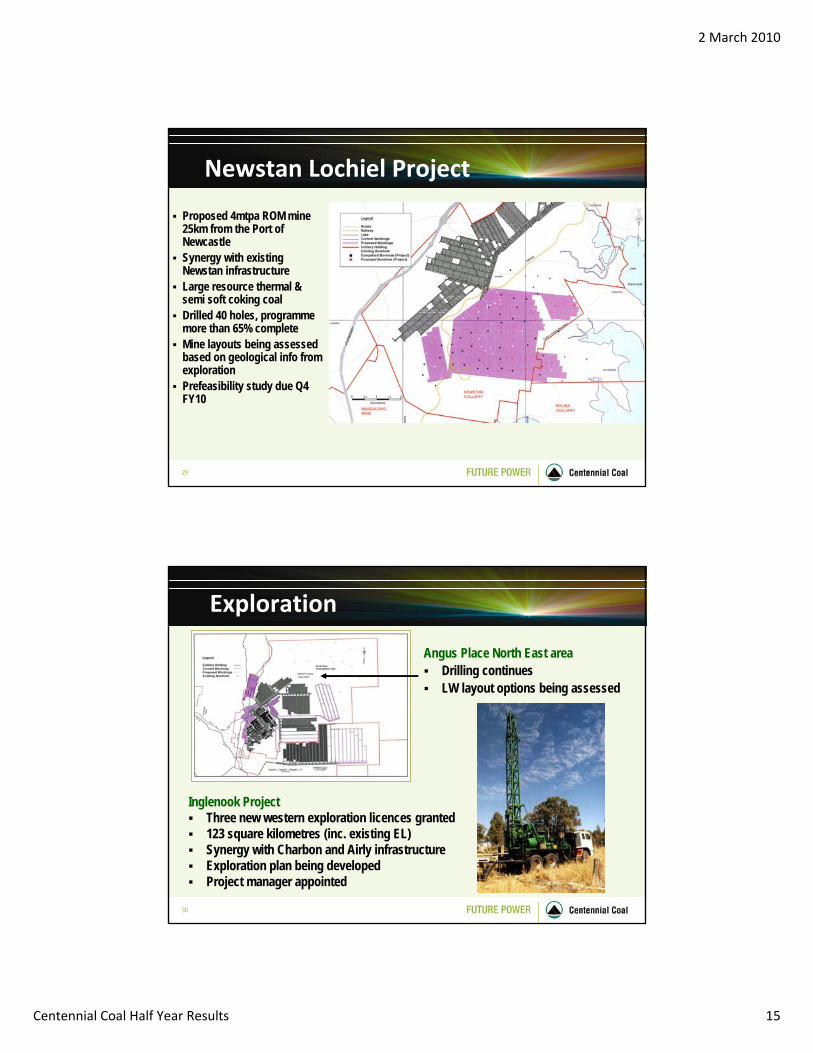
Airly Mine Construction– Nearing Completion
Top left: Rail Loading Bin
Bottom left: First Coal Production
Below: Mine Entries
2 March 2010
Centennial Coal Half Year Results 15
29
Newstan Lochiel Project
Proposed 4mtpa ROM mine 25km from the Port of NewcastleSynergy with existing Newstan infrastructureLarge resource thermal & semi soft coking coalDrilled 40 holes, programme more than 65% completeMine layouts being assessed based on geological info from explorationPrefeasibility study due Q4 FY10
30
Inglenook ProjectThree new western exploration licences granted 123 square kilometres (inc. existing EL) Synergy with Charbon and Airly infrastructureExploration plan being developedProject manager appointed
Exploration
Angus Place North East areaDrilling continuesLW layout options being assessed
2 March 2010
Centennial Coal Half Year Results 16
31
Coal Markets
32
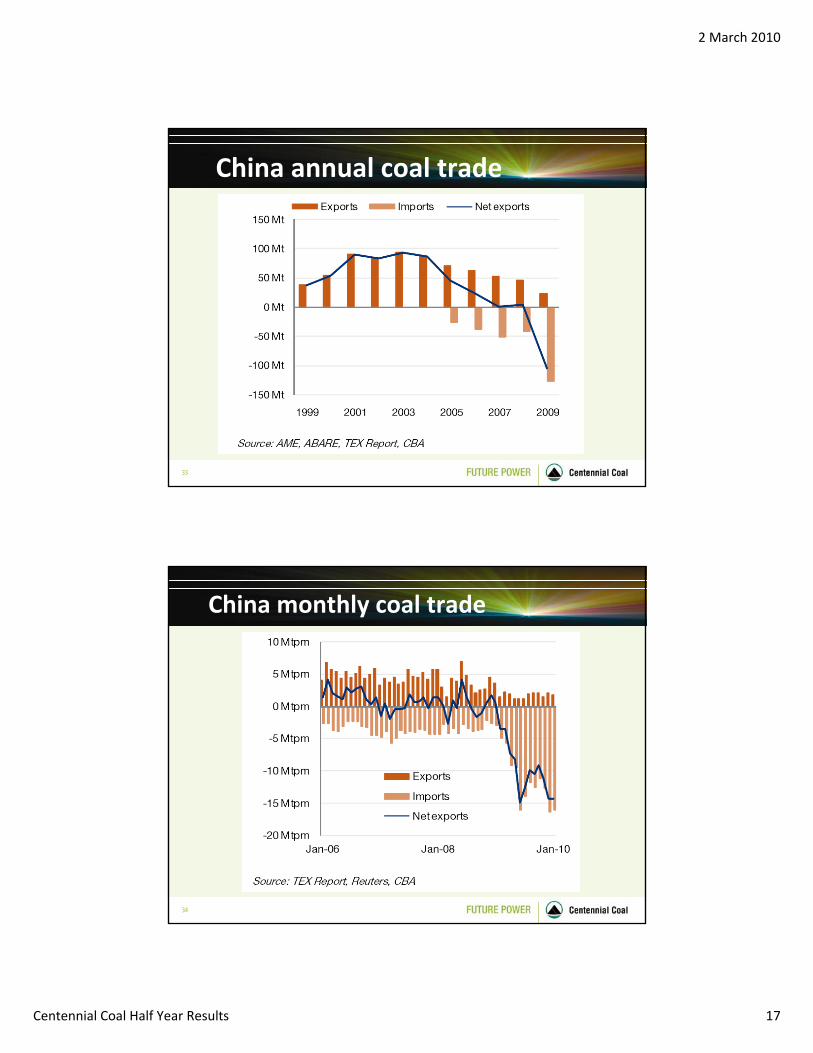
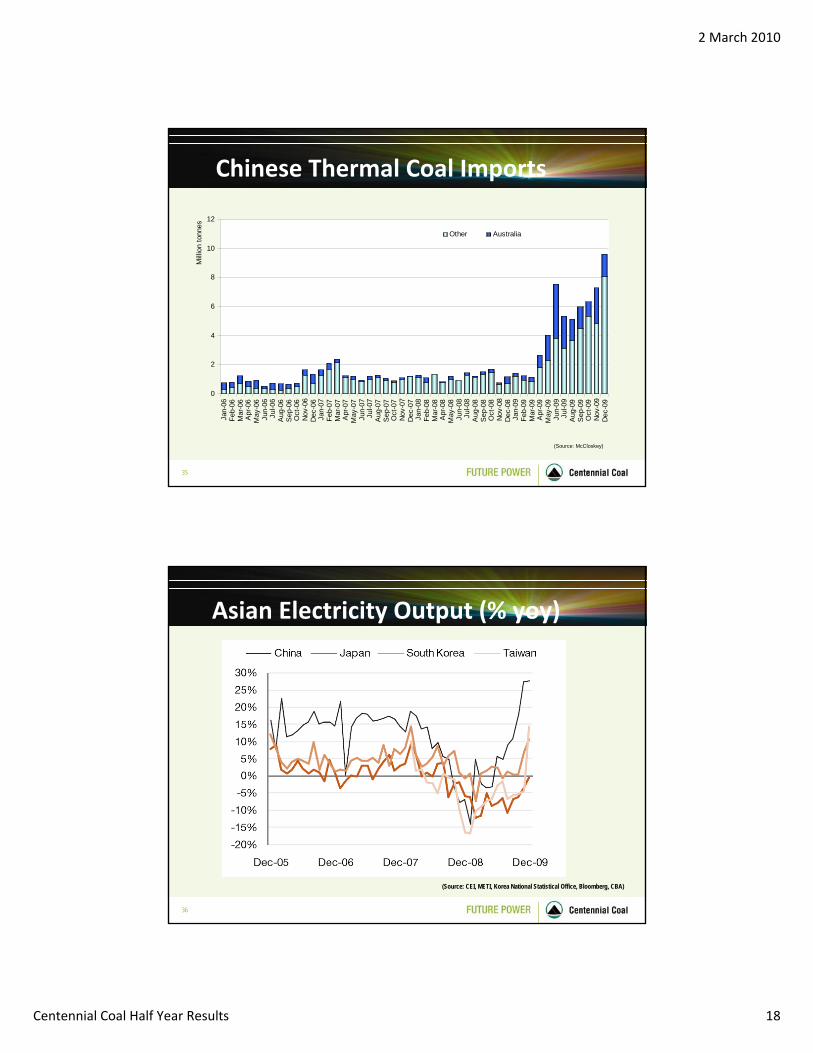
Export – Thermal CoalIncreasing base-load Asian power requirements driving continued strength and growing demand for thermal coalChina anticipated to remain a net importer, with Australia and Indonesia to benefitTotal Chinese coal imports December 2009 were a record 16.4 million tonnesSignificant enquiries from Chinese power companies for supply in 2010Other South East Asian demand continues to grow inc. India, Korea, Vietnam, etcSupply remains tightCalendar-year thermal coal contract price for Japanese Power Utilities approximately US$85.00 Spot prices and GlobalCoal NEWC index above US$95.00 JFY 2010 contract price expected to increase Customers continue to focus on security of supply and reliable counter parties
2 March 2010
Centennial Coal Half Year Results 17
33
China annual coal trade
34
China monthly coal trade
2 March 2010
Centennial Coal Half Year Results 18
35
Chinese Thermal Coal Imports
(Source: McCloskey)
0
2
4
6
8
10
12Ja
n-06
Feb-
06M
ar-0
6A
pr-0
6M
ay-0
6Ju
n-06
Jul-0
6A
ug-0
6S
ep-0
6O
ct-0
6N
ov-0
6D
ec-0
6Ja
n-07
Feb-
07M
ar-0
7A
pr-0
7M
ay-0
7Ju
n-07
Jul-0
7A
ug-0
7S
ep-0
7O
ct-0
7N
ov-0
7D
ec-0
7Ja
n-08
Feb-
08M
ar-0
8A
pr-0
8M
ay-0
8Ju
n-08
Jul-0
8A
ug-0
8S
ep-0
8O
ct-0
8N
ov-0
8D
ec-0
8Ja
n-09
Feb-
09M
ar-0
9A
pr-0
9M
ay-0
9Ju
n-09
Jul-0
9A
ug-0
9S
ep-0
9O
ct-0
9N
ov-0
9D
ec-0
9
Mill
ion
tonn
es
Other Australia
36
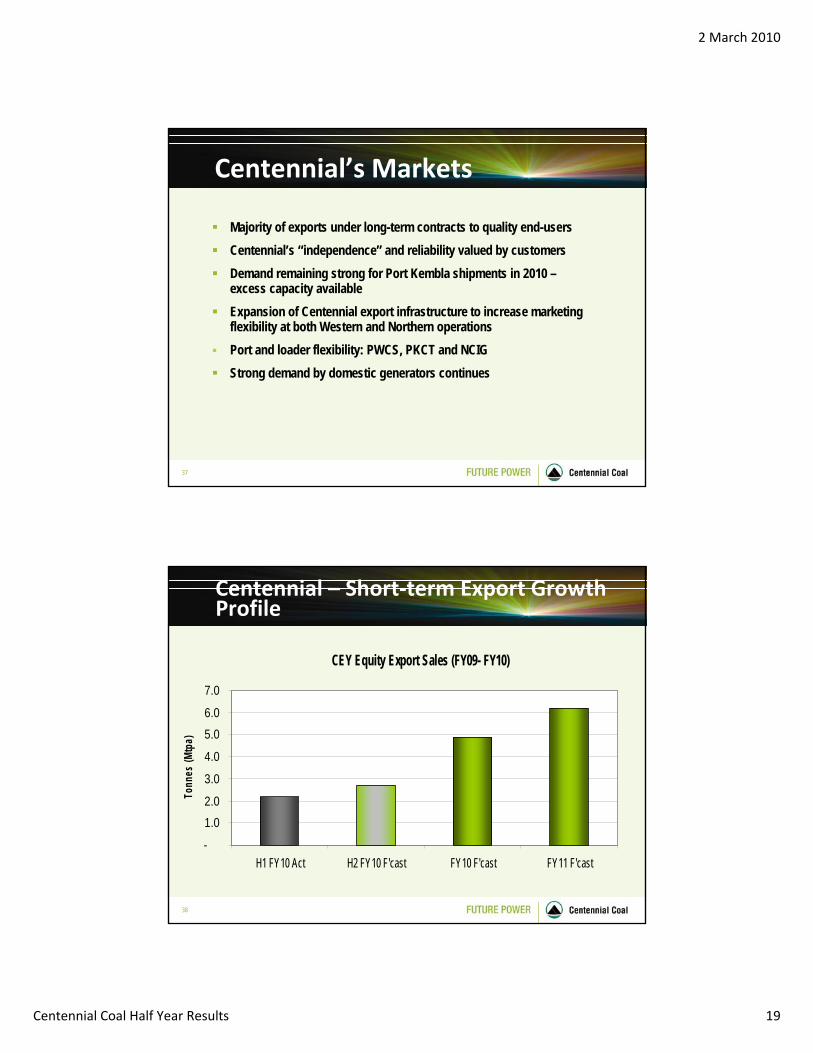
Asian Electricity Output (% yoy)
(Source: CEI, METI, Korea National Statistical Office, Bloomberg, CBA)
2 March 2010
Centennial Coal Half Year Results 19
37
Centennial’s Markets
Majority of exports under long-term contracts to quality end-usersCentennial’s “independence” and reliability valued by customersDemand remaining strong for Port Kembla shipments in 2010 –excess capacity availableExpansion of Centennial export infrastructure to increase marketing flexibility at both Western and Northern operationsPort and loader flexibility: PWCS, PKCT and NCIGStrong demand by domestic generators continues
38
CEY Equity Export Sales (FY09- FY10)
-
1.02.0
3.0
4.0
5.06.0
7.0
H1 FY10 Act H2 FY10 F'cast FY10 F'cast FY11 F'cast
Tonn
es (M
tpa)
Centennial – Short‐term Export Growth Profile
2 March 2010
Centennial Coal Half Year Results 20
39
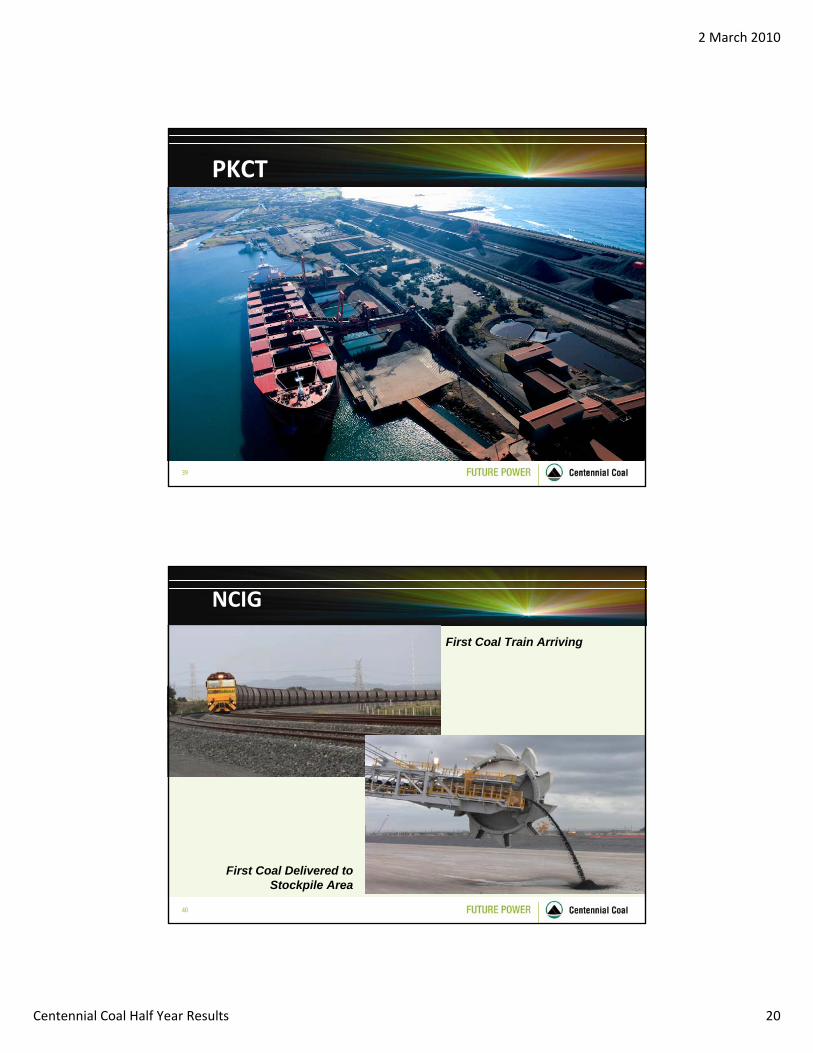
PKCT
40
NCIG
First Coal Train Arriving
First Coal Delivered to Stockpile Area
2 March 2010
Centennial Coal Half Year Results 21
41
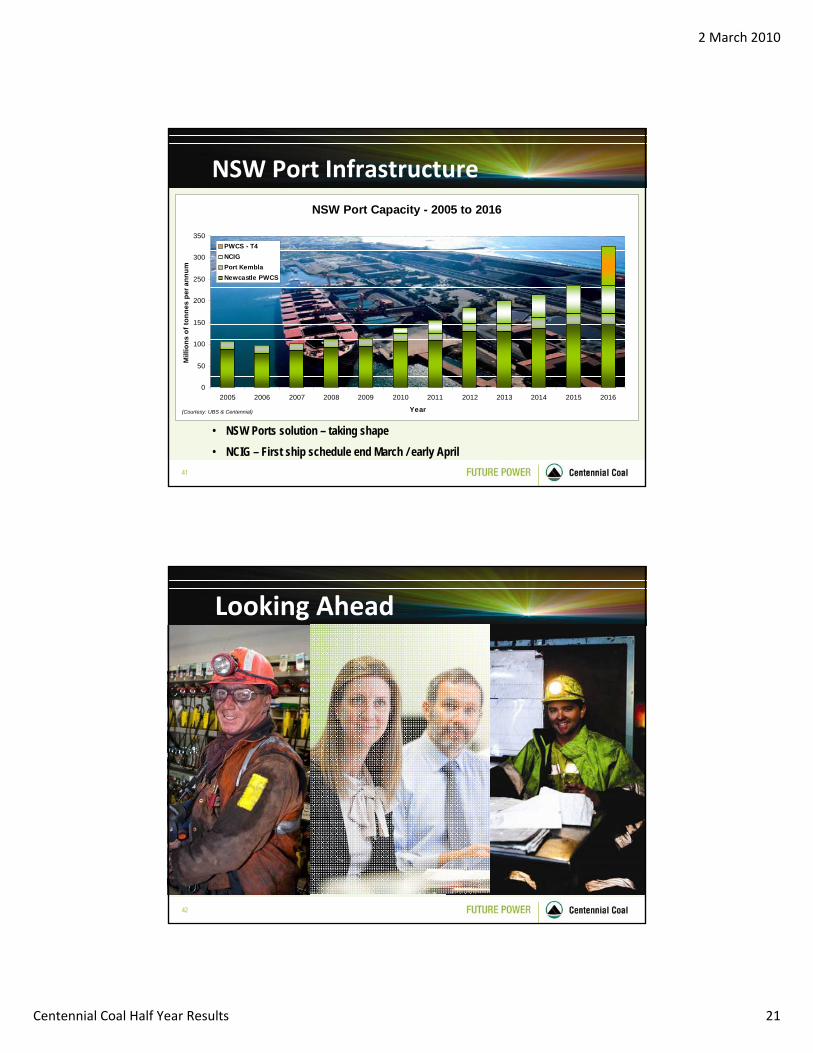
NSW Port Infrastructure
• NSW Ports solution – taking shape• NCIG – First ship schedule end March / early April
Courtesy: Centennial & UBS
NSW Port Capacity - 2005 to 2016
0
50
100
150
200
250
300
350
2005 2006 2007 2008 2009 2010 2011 2012 2013 2014 2015 2016
Year
Mill
ions
of t
onne
s pe
r ann
um
PWCS - T4NCIGPort KemblaNewcastle PWCS
(Courtesy: UBS & Centennial)
42
Looking Ahead
2 March 2010
Centennial Coal Half Year Results 22
43
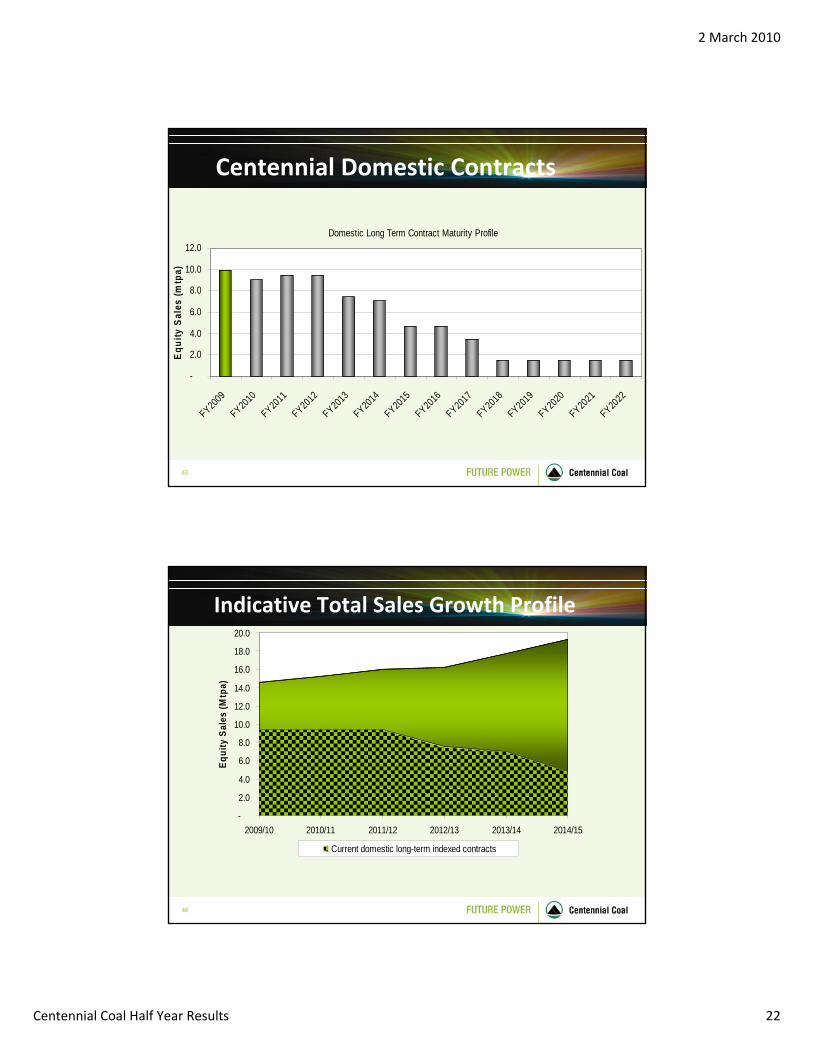
Centennial Domestic Contracts
-
2.0
4.0
6.0
8.0
10.0
12.0
FY2009
FY2010
FY2011
FY2012
FY2013
FY2014
FY2015
FY2016
FY2017
FY2018
FY2019
FY2020
FY2021
FY2022
Equ
ity S
ales
(mtp
a)
Domestic Long Term Contract Maturity Profile
44
Indicative Total Sales Growth Profile
Current Domestic Long-Term Indexed Contracts
-
2.0
4.0
6.0
8.0
10.0
12.0
14.0
16.0
18.0
20.0
2009/10 2010/11 2011/12 2012/13 2013/14 2014/15
Equi
ty S
ales
(Mtp
a)
Current domestic long-term indexed contracts
2 March 2010
Centennial Coal Half Year Results 23
45
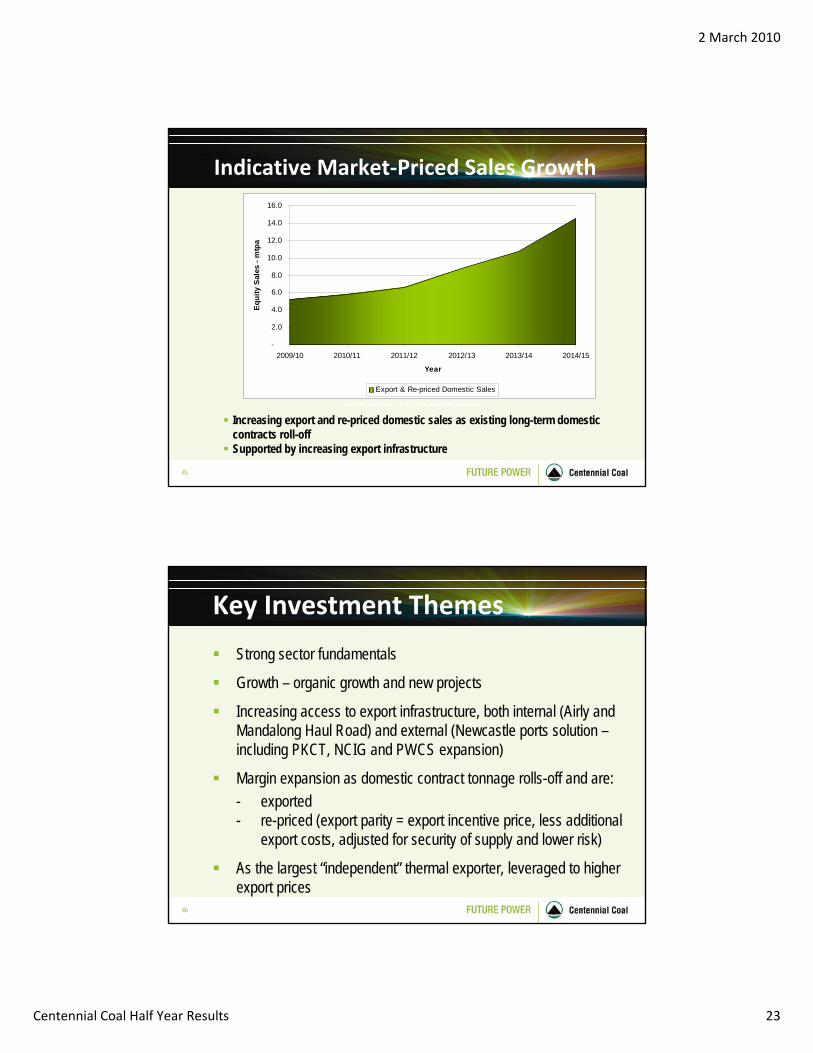
Indicative Market‐Priced Sales Growth
Current Domestic Long-Term Indexed Contracts
Increasing export and re-priced domestic sales as existing long-term domestic contracts roll-offSupported by increasing export infrastructure
-
2.0
4.0
6.0
8.0
10.0
12.0
14.0
16.0
2009/10 2010/11 2011/12 2012/13 2013/14 2014/15
Year
Equ
ity S
ales
- m
tpa
Export & Re-priced Domestic Sales
46
Key Investment Themes
Strong sector fundamentals
Growth – organic growth and new projects
Increasing access to export infrastructure, both internal (Airly and Mandalong Haul Road) and external (Newcastle ports solution –including PKCT, NCIG and PWCS expansion)
Margin expansion as domestic contract tonnage rolls-off and are:- exported- re-priced (export parity = export incentive price, less additional
export costs, adjusted for security of supply and lower risk)
As the largest “independent” thermal exporter, leveraged to higher export prices
2 March 2010
Centennial Coal Half Year Results 24
47
Centennial Coal –Thank you