Embed Size (px)
Citation preview
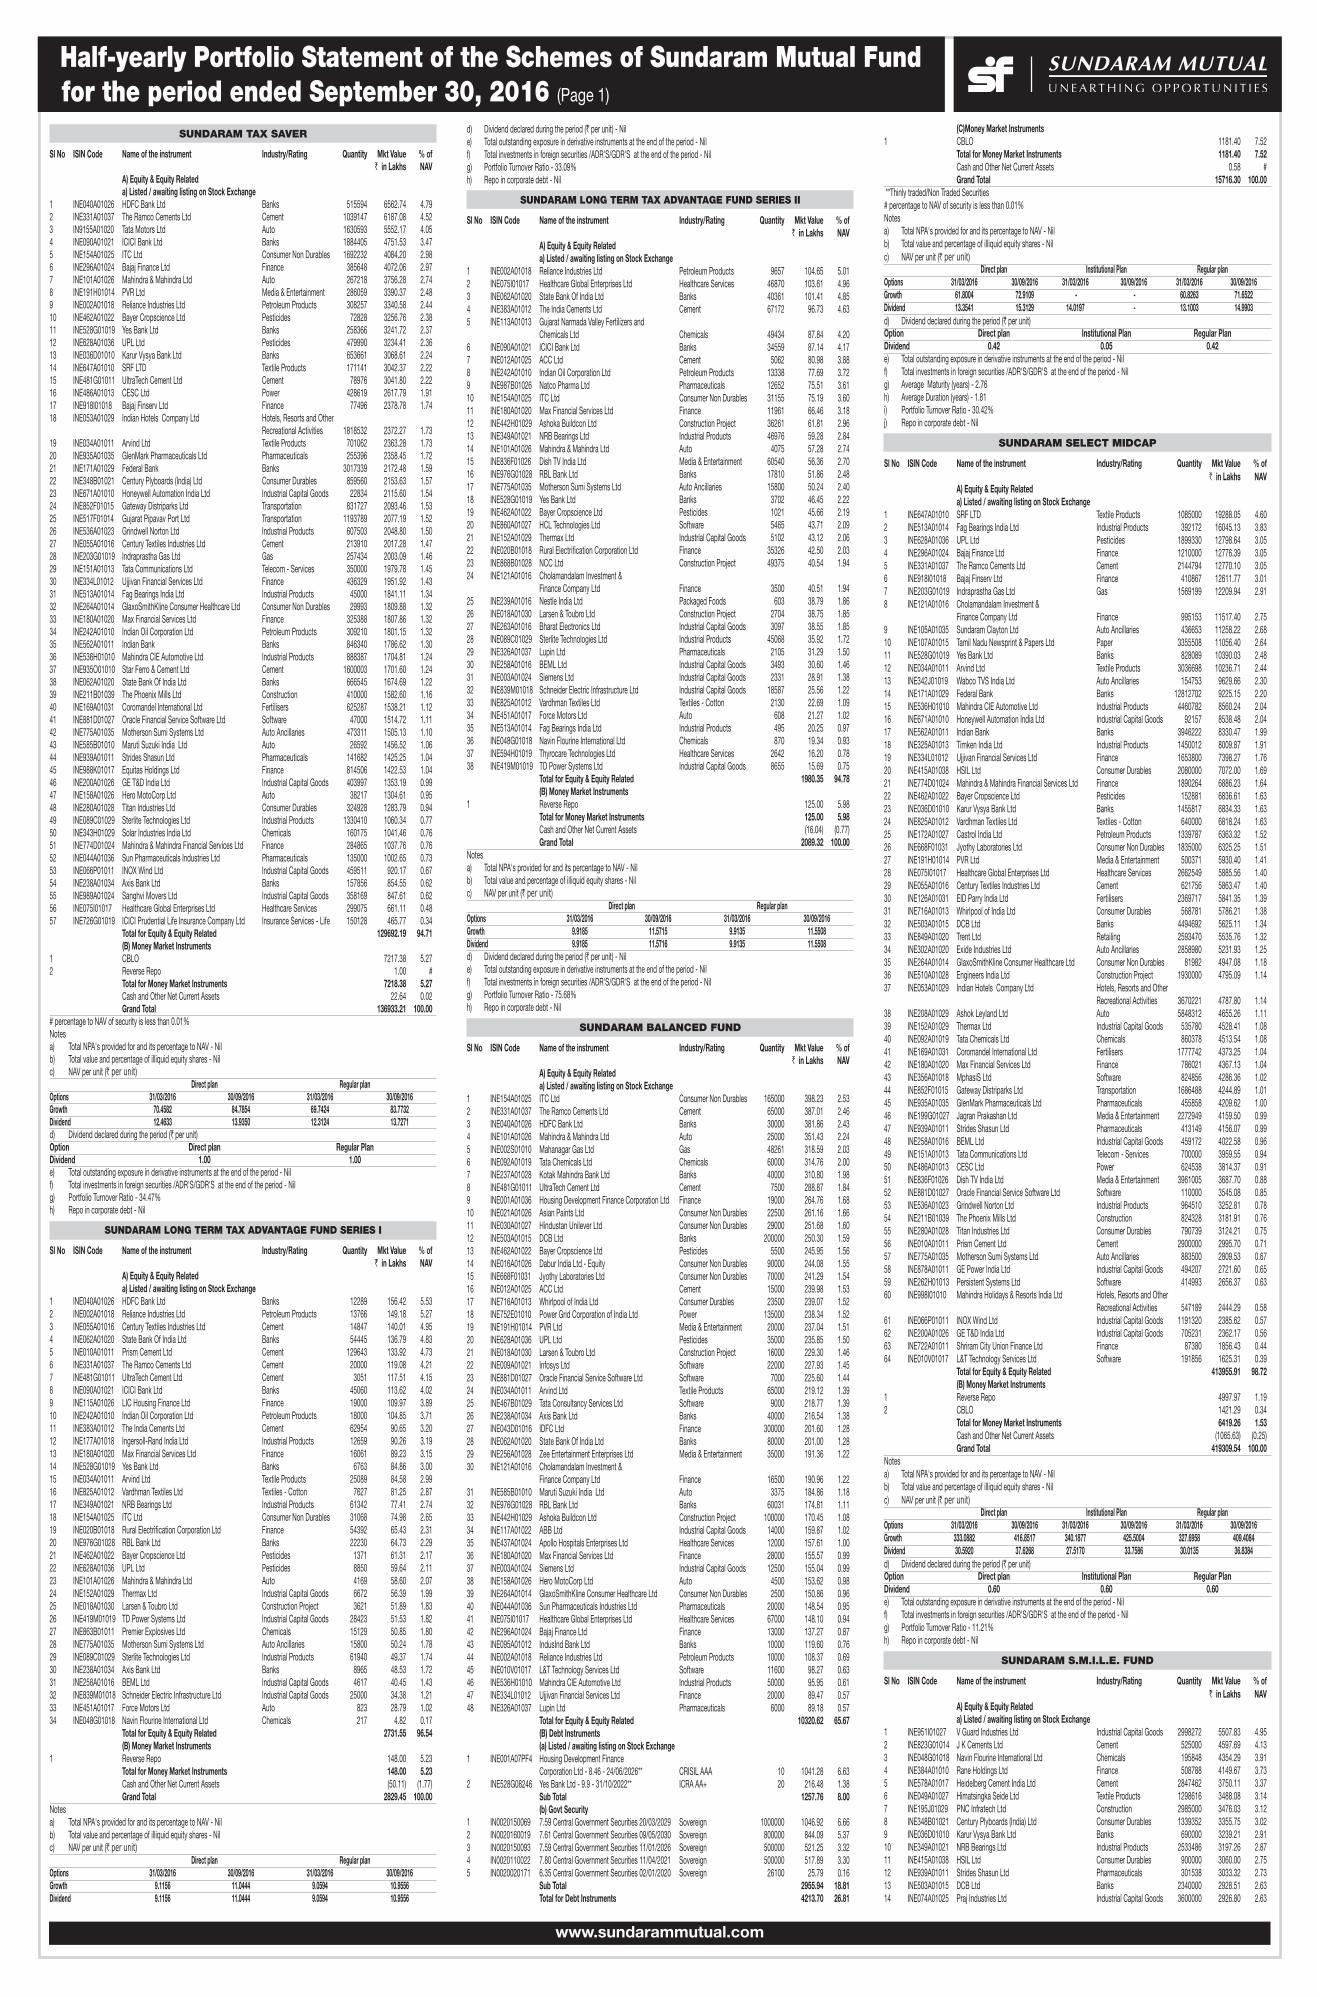
Half-yearly Portfolio Statement of the Schemes of Sundaram Mutual Fund for the period ended September 30, 2016 (Page 1)
SUNDARAM TAX SAVER
Sl No ISIN Code Name of the instrument Industry/Rating Quantity Mkt Value % of ` in Lakhs NAV A) Equity & Equity Related a) Listed / awaiting listing on Stock Exchange 1 INE040A01026 HDFC Bank Ltd Banks 515594 6562.74 4.792 INE331A01037 The Ramco Cements Ltd Cement 1039147 6187.08 4.523 IN9155A01020 Tata Motors Ltd Auto 1630593 5552.17 4.054 INE090A01021 ICICI Bank Ltd Banks 1884405 4751.53 3.475 INE154A01025 ITC Ltd Consumer Non Durables 1692232 4084.20 2.986 INE296A01024 Bajaj Finance Ltd Finance 385648 4072.06 2.977 INE101A01026 Mahindra & Mahindra Ltd Auto 267218 3756.28 2.748 INE191H01014 PVR Ltd Media & Entertainment 286059 3390.37 2.489 INE002A01018 Reliance Industries Ltd Petroleum Products 308257 3340.58 2.4410 INE462A01022 Bayer Cropscience Ltd Pesticides 72828 3256.76 2.3811 INE528G01019 Yes Bank Ltd Banks 258366 3241.72 2.3712 INE628A01036 UPL Ltd Pesticides 479990 3234.41 2.3613 INE036D01010 Karur Vysya Bank Ltd Banks 653661 3068.61 2.2414 INE647A01010 SRF LTD Textile Products 171141 3042.37 2.2215 INE481G01011 UltraTech Cement Ltd Cement 78976 3041.80 2.2216 INE486A01013 CESC Ltd Power 428619 2617.79 1.9117 INE918I01018 Bajaj Finserv Ltd Finance 77496 2378.78 1.7418 INE053A01029 Indian Hotels Company Ltd Hotels, Resorts and Other Recreational Activities 1818532 2372.27 1.7319 INE034A01011 Arvind Ltd Textile Products 701062 2363.28 1.7320 INE935A01035 GlenMark Pharmaceuticals Ltd Pharmaceuticals 255396 2358.45 1.7221 INE171A01029 Federal Bank Banks 3017339 2172.48 1.5922 INE348B01021 Century Plyboards (India) Ltd Consumer Durables 859560 2153.63 1.5723 INE671A01010 Honeywell Automation India Ltd Industrial Capital Goods 22834 2115.60 1.5424 INE852F01015 Gateway Distriparks Ltd Transportation 831727 2093.46 1.5325 INE517F01014 Gujarat Pipavav Port Ltd Transportation 1193789 2077.19 1.5226 INE536A01023 Grindwell Norton Ltd Industrial Products 607503 2048.80 1.5027 INE055A01016 Century Textiles Industries Ltd Cement 213910 2017.28 1.4728 INE203G01019 Indraprastha Gas Ltd Gas 257434 2003.09 1.4629 INE151A01013 Tata Communications Ltd Telecom - Services 350000 1979.78 1.4530 INE334L01012 Ujjivan Financial Services Ltd Finance 436329 1951.92 1.4331 INE513A01014 Fag Bearings India Ltd Industrial Products 45000 1841.11 1.3432 INE264A01014 GlaxoSmithKline Consumer Healthcare Ltd Consumer Non Durables 29993 1809.88 1.3233 INE180A01020 Max Financial Services Ltd Finance 325388 1807.86 1.3234 INE242A01010 Indian Oil Corporation Ltd Petroleum Products 309210 1801.15 1.3235 INE562A01011 Indian Bank Banks 846340 1786.62 1.3036 INE536H01010 Mahindra CIE Automotive Ltd Industrial Products 888387 1704.81 1.2437 INE935O01010 Star Ferro & Cement Ltd Cement 1600003 1701.60 1.2438 INE062A01020 State Bank Of India Ltd Banks 666545 1674.69 1.2239 INE211B01039 The Phoenix Mills Ltd Construction 410000 1582.60 1.1640 INE169A01031 Coromandel International Ltd Fertilisers 625287 1538.21 1.1241 INE881D01027 Oracle Financial Service Software Ltd Software 47000 1514.72 1.1142 INE775A01035 Motherson Sumi Systems Ltd Auto Ancillaries 473311 1505.13 1.1043 INE585B01010 Maruti Suzuki India Ltd Auto 26592 1456.52 1.0644 INE939A01011 Strides Shasun Ltd Pharmaceuticals 141682 1425.25 1.0445 INE988K01017 Equitas Holdings Ltd Finance 814506 1422.53 1.0446 INE200A01026 GE T&D India Ltd Industrial Capital Goods 403997 1353.19 0.9947 INE158A01026 Hero MotoCorp Ltd Auto 38217 1304.61 0.9548 INE280A01028 Titan Industries Ltd Consumer Durables 324928 1283.79 0.9449 INE089C01029 Sterlite Technologies Ltd Industrial Products 1330410 1060.34 0.7750 INE343H01029 Solar Industries India Ltd Chemicals 160175 1041.46 0.7651 INE774D01024 Mahindra & Mahindra Financial Services Ltd Finance 284865 1037.76 0.7652 INE044A01036 Sun Pharmaceuticals Industries Ltd Pharmaceuticals 135000 1002.65 0.7353 INE066P01011 INOX Wind Ltd Industrial Capital Goods 459511 920.17 0.6754 INE238A01034 Axis Bank Ltd Banks 157856 854.55 0.6255 INE989A01024 Sanghvi Movers Ltd Industrial Capital Goods 358169 847.61 0.6256 INE075I01017 Healthcare Global Enterprises Ltd Healthcare Services 299075 661.11 0.4857 INE726G01019 ICICI Prudential Life Insurance Company Ltd Insurance Services - Life 150128 465.77 0.34 Total for Equity & Equity Related 129692.19 94.71 (B) Money Market Instruments 1 CBLO 7217.38 5.272 Reverse Repo 1.00 # Total for Money Market Instruments 7218.38 5.27 Cash and Other Net Current Assets 22.64 0.02 Grand Total 136933.21 100.00# percentage to NAV of security is less than 0.01%Notesa) Total NPA's provided for and its percentage to NAV - Nilb) Total value and percentage of illiquid equity shares - Nilc) NAV per unit (` per unit)
Direct plan Regular plan Options 31/03/2016 30/09/2016 31/03/2016 30/09/2016Growth 70.4582 84.7854 69.7424 83.7732 Dividend 12.4633 13.9350 12.3124 13.7271 d) Dividend declared during the period (` per unit)Option Direct plan Regular PlanDividend 1.00 1.00e) Total outstanding exposure in derivative instruments at the end of the period - Nilf) Total investments in foreign securities /ADR'S/GDR'S at the end of the period - Nilg) Portfolio Turnover Ratio - 34.47%h) Repo in corporate debt - Nil
SUNDARAM LONG TERM TAX ADVANTAGE FUND SERIES I
Sl No ISIN Code Name of the instrument Industry/Rating Quantity Mkt Value % of ` in Lakhs NAV A) Equity & Equity Related a) Listed / awaiting listing on Stock Exchange 1 INE040A01026 HDFC Bank Ltd Banks 12289 156.42 5.532 INE002A01018 Reliance Industries Ltd Petroleum Products 13766 149.18 5.273 INE055A01016 Century Textiles Industries Ltd Cement 14847 140.01 4.954 INE062A01020 State Bank Of India Ltd Banks 54445 136.79 4.835 INE010A01011 Prism Cement Ltd Cement 129643 133.92 4.736 INE331A01037 The Ramco Cements Ltd Cement 20000 119.08 4.217 INE481G01011 UltraTech Cement Ltd Cement 3051 117.51 4.158 INE090A01021 ICICI Bank Ltd Banks 45060 113.62 4.029 INE115A01026 LIC Housing Finance Ltd Finance 19000 109.97 3.8910 INE242A01010 Indian Oil Corporation Ltd Petroleum Products 18000 104.85 3.7111 INE383A01012 The India Cements Ltd Cement 62954 90.65 3.2012 INE177A01018 Ingersoll-Rand India Ltd Industrial Products 12659 90.26 3.1913 INE180A01020 Max Financial Services Ltd Finance 16061 89.23 3.1514 INE528G01019 Yes Bank Ltd Banks 6763 84.86 3.0015 INE034A01011 Arvind Ltd Textile Products 25089 84.58 2.9916 INE825A01012 Vardhman Textiles Ltd Textiles - Cotton 7627 81.25 2.8717 INE349A01021 NRB Bearings Ltd Industrial Products 61342 77.41 2.7418 INE154A01025 ITC Ltd Consumer Non Durables 31068 74.98 2.6519 INE020B01018 Rural Electrification Corporation Ltd Finance 54392 65.43 2.3120 INE976G01028 RBL Bank Ltd Banks 22230 64.73 2.2921 INE462A01022 Bayer Cropscience Ltd Pesticides 1371 61.31 2.1722 INE628A01036 UPL Ltd Pesticides 8850 59.64 2.1123 INE101A01026 Mahindra & Mahindra Ltd Auto 4169 58.60 2.0724 INE152A01029 Thermax Ltd Industrial Capital Goods 6672 56.39 1.9925 INE018A01030 Larsen & Toubro Ltd Construction Project 3621 51.89 1.8326 INE419M01019 TD Power Systems Ltd Industrial Capital Goods 28423 51.53 1.8227 INE863B01011 Premier Explosives Ltd Chemicals 15129 50.85 1.8028 INE775A01035 Motherson Sumi Systems Ltd Auto Ancillaries 15800 50.24 1.7829 INE089C01029 Sterlite Technologies Ltd Industrial Products 61940 49.37 1.7430 INE238A01034 Axis Bank Ltd Banks 8965 48.53 1.7231 INE258A01016 BEML Ltd Industrial Capital Goods 4617 40.45 1.4332 INE839M01018 Schneider Electric Infrastructure Ltd Industrial Capital Goods 25000 34.38 1.2133 INE451A01017 Force Motors Ltd Auto 823 28.79 1.0234 INE048G01018 Navin Flourine International Ltd Chemicals 217 4.82 0.17 Total for Equity & Equity Related 2731.55 96.54 (B) Money Market Instruments 1 Reverse Repo 148.00 5.23 Total for Money Market Instruments 148.00 5.23 Cash and Other Net Current Assets (50.11) (1.77) Grand Total 2829.45 100.00Notesa) Total NPA's provided for and its percentage to NAV - Nilb) Total value and percentage of illiquid equity shares - Nilc) NAV per unit (` per unit)
Direct plan Regular plan Options 31/03/2016 30/09/2016 31/03/2016 30/09/2016Growth 9.1156 11.0444 9.0594 10.9556 Dividend 9.1156 11.0444 9.0594 10.9556
d) Dividend declared during the period (` per unit) - Nile) Total outstanding exposure in derivative instruments at the end of the period - Nilf) Total investments in foreign securities /ADR'S/GDR'S at the end of the period - Nilg) Portfolio Turnover Ratio - 33.09%h) Repo in corporate debt - Nil
SUNDARAM LONG TERM TAX ADVANTAGE FUND SERIES II
Sl No ISIN Code Name of the instrument Industry/Rating Quantity Mkt Value % of ` in Lakhs NAV A) Equity & Equity Related a) Listed / awaiting listing on Stock Exchange 1 INE002A01018 Reliance Industries Ltd Petroleum Products 9657 104.65 5.012 INE075I01017 Healthcare Global Enterprises Ltd Healthcare Services 46870 103.61 4.963 INE062A01020 State Bank Of India Ltd Banks 40361 101.41 4.854 INE383A01012 The India Cements Ltd Cement 67172 96.73 4.635 INE113A01013 Gujarat Narmada Valley Fertilizers and Chemicals Ltd Chemicals 49434 87.84 4.206 INE090A01021 ICICI Bank Ltd Banks 34559 87.14 4.177 INE012A01025 ACC Ltd Cement 5062 80.98 3.888 INE242A01010 Indian Oil Corporation Ltd Petroleum Products 13338 77.69 3.729 INE987B01026 Natco Pharma Ltd Pharmaceuticals 12652 75.51 3.6110 INE154A01025 ITC Ltd Consumer Non Durables 31155 75.19 3.6011 INE180A01020 Max Financial Services Ltd Finance 11961 66.46 3.1812 INE442H01029 Ashoka Buildcon Ltd Construction Project 36261 61.81 2.9613 INE349A01021 NRB Bearings Ltd Industrial Products 46976 59.28 2.8414 INE101A01026 Mahindra & Mahindra Ltd Auto 4075 57.28 2.7415 INE836F01026 Dish TV India Ltd Media & Entertainment 60540 56.36 2.7016 INE976G01028 RBL Bank Ltd Banks 17810 51.86 2.4817 INE775A01035 Motherson Sumi Systems Ltd Auto Ancillaries 15800 50.24 2.4018 INE528G01019 Yes Bank Ltd Banks 3702 46.45 2.2219 INE462A01022 Bayer Cropscience Ltd Pesticides 1021 45.66 2.1920 INE860A01027 HCL Technologies Ltd Software 5465 43.71 2.0921 INE152A01029 Thermax Ltd Industrial Capital Goods 5102 43.12 2.0622 INE020B01018 Rural Electrification Corporation Ltd Finance 35326 42.50 2.0323 INE868B01028 NCC Ltd Construction Project 49375 40.54 1.9424 INE121A01016 Cholamandalam Investment & Finance Company Ltd Finance 3500 40.51 1.9425 INE239A01016 Nestle India Ltd Packaged Foods 603 38.79 1.8626 INE018A01030 Larsen & Toubro Ltd Construction Project 2704 38.75 1.8527 INE263A01016 Bharat Electronics Ltd Industrial Capital Goods 3097 38.55 1.8528 INE089C01029 Sterlite Technologies Ltd Industrial Products 45068 35.92 1.7229 INE326A01037 Lupin Ltd Pharmaceuticals 2105 31.29 1.5030 INE258A01016 BEML Ltd Industrial Capital Goods 3493 30.60 1.4631 INE003A01024 Siemens Ltd Industrial Capital Goods 2331 28.91 1.3832 INE839M01018 Schneider Electric Infrastructure Ltd Industrial Capital Goods 18587 25.56 1.2233 INE825A01012 Vardhman Textiles Ltd Textiles - Cotton 2130 22.69 1.0934 INE451A01017 Force Motors Ltd Auto 608 21.27 1.0235 INE513A01014 Fag Bearings India Ltd Industrial Products 495 20.25 0.9736 INE048G01018 Navin Flourine International Ltd Chemicals 870 19.34 0.9337 INE594H01019 Thyrocare Technologies Ltd Healthcare Services 2642 16.20 0.7838 INE419M01019 TD Power Systems Ltd Industrial Capital Goods 8655 15.69 0.75 Total for Equity & Equity Related 1980.35 94.78 (B) Money Market Instruments 1 Reverse Repo 125.00 5.98 Total for Money Market Instruments 125.00 5.98 Cash and Other Net Current Assets (16.04) (0.77) Grand Total 2089.32 100.00Notesa) Total NPA's provided for and its percentage to NAV - Nil b) Total value and percentage of illiquid equity shares - Nil c) NAV per unit (` per unit)
Direct plan Regular plan Options 31/03/2016 30/09/2016 31/03/2016 30/09/2016Growth 9.9185 11.5715 9.9135 11.5508 Dividend 9.9185 11.5716 9.9135 11.5508 d) Dividend declared during the period (` per unit) - Nile) Total outstanding exposure in derivative instruments at the end of the period - Nilf) Total investments in foreign securities /ADR'S/GDR'S at the end of the period - Nilg) Portfolio Turnover Ratio - 75.68%h) Repo in corporate debt - Nil
SUNDARAM BALANCED FUND
Sl No ISIN Code Name of the instrument Industry/Rating Quantity Mkt Value % of ` in Lakhs NAV A) Equity & Equity Related a) Listed / awaiting listing on Stock Exchange 1 INE154A01025 ITC Ltd Consumer Non Durables 165000 398.23 2.532 INE331A01037 The Ramco Cements Ltd Cement 65000 387.01 2.463 INE040A01026 HDFC Bank Ltd Banks 30000 381.86 2.434 INE101A01026 Mahindra & Mahindra Ltd Auto 25000 351.43 2.245 INE002S01010 Mahanagar Gas Ltd Gas 48261 318.59 2.036 INE092A01019 Tata Chemicals Ltd Chemicals 60000 314.76 2.007 INE237A01028 Kotak Mahindra Bank Ltd Banks 40000 310.80 1.988 INE481G01011 UltraTech Cement Ltd Cement 7500 288.87 1.849 INE001A01036 Housing Development Finance Corporation Ltd Finance 19000 264.76 1.6810 INE021A01026 Asian Paints Ltd Consumer Non Durables 22500 261.16 1.6611 INE030A01027 Hindustan Unilever Ltd Consumer Non Durables 29000 251.68 1.6012 INE503A01015 DCB Ltd Banks 200000 250.30 1.5913 INE462A01022 Bayer Cropscience Ltd Pesticides 5500 245.95 1.5614 INE016A01026 Dabur India Ltd - Equity Consumer Non Durables 90000 244.08 1.5515 INE668F01031 Jyothy Laboratories Ltd Consumer Non Durables 70000 241.29 1.5416 INE012A01025 ACC Ltd Cement 15000 239.98 1.5317 INE716A01013 Whirlpool of India Ltd Consumer Durables 23500 239.07 1.5218 INE752E01010 Power Grid Corporation of India Ltd Power 135000 238.34 1.5219 INE191H01014 PVR Ltd Media & Entertainment 20000 237.04 1.5120 INE628A01036 UPL Ltd Pesticides 35000 235.85 1.5021 INE018A01030 Larsen & Toubro Ltd Construction Project 16000 229.30 1.4622 INE009A01021 Infosys Ltd Software 22000 227.93 1.4523 INE881D01027 Oracle Financial Service Software Ltd Software 7000 225.60 1.4424 INE034A01011 Arvind Ltd Textile Products 65000 219.12 1.3925 INE467B01029 Tata Consultancy Services Ltd Software 9000 218.77 1.3926 INE238A01034 Axis Bank Ltd Banks 40000 216.54 1.3827 INE043D01016 IDFC Ltd Finance 300000 201.60 1.2828 INE062A01020 State Bank Of India Ltd Banks 80000 201.00 1.2829 INE256A01028 Zee Entertainment Enterprises Ltd Media & Entertainment 35000 191.36 1.2230 INE121A01016 Cholamandalam Investment & Finance Company Ltd Finance 16500 190.96 1.2231 INE585B01010 Maruti Suzuki India Ltd Auto 3375 184.86 1.1832 INE976G01028 RBL Bank Ltd Banks 60031 174.81 1.1133 INE442H01029 Ashoka Buildcon Ltd Construction Project 100000 170.45 1.0834 INE117A01022 ABB Ltd Industrial Capital Goods 14000 159.87 1.0235 INE437A01024 Apollo Hospitals Enterprises Ltd Healthcare Services 12000 157.61 1.0036 INE180A01020 Max Financial Services Ltd Finance 28000 155.57 0.9937 INE003A01024 Siemens Ltd Industrial Capital Goods 12500 155.04 0.9938 INE158A01026 Hero MotoCorp Ltd Auto 4500 153.62 0.9839 INE264A01014 GlaxoSmithKline Consumer Healthcare Ltd Consumer Non Durables 2500 150.86 0.9640 INE044A01036 Sun Pharmaceuticals Industries Ltd Pharmaceuticals 20000 148.54 0.9541 INE075I01017 Healthcare Global Enterprises Ltd Healthcare Services 67000 148.10 0.9442 INE296A01024 Bajaj Finance Ltd Finance 13000 137.27 0.8743 INE095A01012 IndusInd Bank Ltd Banks 10000 119.60 0.7644 INE002A01018 Reliance Industries Ltd Petroleum Products 10000 108.37 0.6945 INE010V01017 L&T Technology Services Ltd Software 11600 98.27 0.6346 INE536H01010 Mahindra CIE Automotive Ltd Industrial Products 50000 95.95 0.6147 INE334L01012 Ujjivan Financial Services Ltd Finance 20000 89.47 0.5748 INE326A01037 Lupin Ltd Pharmaceuticals 6000 89.18 0.57 Total for Equity & Equity Related 10320.62 65.67 (B) Debt Instruments (a) Listed / awaiting listing on Stock Exchange 1 INE001A07PF4 Housing Development Finance Corporation Ltd - 8.46 - 24/06/2026** CRISIL AAA 10 1041.28 6.632 INE528G08246 Yes Bank Ltd - 9.9 - 31/10/2022** ICRA AA+ 20 216.48 1.38 Sub Total 1257.76 8.00 (b) Govt Security 1 IN0020150069 7.59 Central Government Securities 20/03/2029 Sovereign 1000000 1046.92 6.662 IN0020160019 7.61 Central Government Securities 09/05/2030 Sovereign 800000 844.09 5.373 IN0020150093 7.59 Central Government Securities 11/01/2026 Sovereign 500000 521.25 3.324 IN0020110022 7.80 Central Government Securities 11/04/2021 Sovereign 500000 517.89 3.305 IN0020020171 6.35 Central Government Securities 02/01/2020 Sovereign 26100 25.79 0.16 Sub Total 2955.94 18.81 Total for Debt Instruments 4213.70 26.81
(C)Money Market Instruments 1 CBLO 1181.40 7.52 Total for Money Market Instruments 1181.40 7.52 Cash and Other Net Current Assets 0.58 # Grand Total 15716.30 100.00**Thinly traded/Non Traded Securities# percentage to NAV of security is less than 0.01%Notesa) Total NPA's provided for and its percentage to NAV - Nil b) Total value and percentage of illiquid equity shares - Nil c) NAV per unit (` per unit)
Direct plan Institutional Plan Regular plan Options 31/03/2016 30/09/2016 31/03/2016 30/09/2016 31/03/2016 30/09/2016Growth 61.8004 72.9109 - - 60.8263 71.6522 Dividend 13.3541 15.3129 14.0197 - 13.1003 14.9903 d) Dividend declared during the period (` per unit)Option Direct plan Institutional Plan Regular PlanDividend 0.42 0.05 0.42e) Total outstanding exposure in derivative instruments at the end of the period - Nilf) Total investments in foreign securities /ADR'S/GDR'S at the end of the period - Nilg) Average Maturity (years) - 2.76 h) Average Duration (years) - 1.81 i) Portfolio Turnover Ratio - 30.42%j) Repo in corporate debt - Nil
SUNDARAM SELECT MIDCAP
Sl No ISIN Code Name of the instrument Industry/Rating Quantity Mkt Value % of ` in Lakhs NAV A) Equity & Equity Related a) Listed / awaiting listing on Stock Exchange 1 INE647A01010 SRF LTD Textile Products 1085000 19288.05 4.602 INE513A01014 Fag Bearings India Ltd Industrial Products 392172 16045.13 3.833 INE628A01036 UPL Ltd Pesticides 1899330 12798.64 3.054 INE296A01024 Bajaj Finance Ltd Finance 1210000 12776.39 3.055 INE331A01037 The Ramco Cements Ltd Cement 2144794 12770.10 3.056 INE918I01018 Bajaj Finserv Ltd Finance 410867 12611.77 3.017 INE203G01019 Indraprastha Gas Ltd Gas 1569199 12209.94 2.918 INE121A01016 Cholamandalam Investment & Finance Company Ltd Finance 995153 11517.40 2.759 INE105A01035 Sundaram Clayton Ltd Auto Ancillaries 436653 11258.22 2.6810 INE107A01015 Tamil Nadu Newsprint & Papers Ltd Paper 3355508 11056.40 2.6411 INE528G01019 Yes Bank Ltd Banks 828089 10390.03 2.4812 INE034A01011 Arvind Ltd Textile Products 3036698 10236.71 2.4413 INE342J01019 Wabco TVS India Ltd Auto Ancillaries 154753 9629.66 2.3014 INE171A01029 Federal Bank Banks 12812702 9225.15 2.2015 INE536H01010 Mahindra CIE Automotive Ltd Industrial Products 4460782 8560.24 2.0416 INE671A01010 Honeywell Automation India Ltd Industrial Capital Goods 92157 8538.48 2.0417 INE562A01011 Indian Bank Banks 3946222 8330.47 1.9918 INE325A01013 Timken India Ltd Industrial Products 1450012 8009.87 1.9119 INE334L01012 Ujjivan Financial Services Ltd Finance 1653800 7398.27 1.7620 INE415A01038 HSIL Ltd Consumer Durables 2080000 7072.00 1.6921 INE774D01024 Mahindra & Mahindra Financial Services Ltd Finance 1890264 6886.23 1.6422 INE462A01022 Bayer Cropscience Ltd Pesticides 152881 6836.61 1.6323 INE036D01010 Karur Vysya Bank Ltd Banks 1455817 6834.33 1.6324 INE825A01012 Vardhman Textiles Ltd Textiles - Cotton 640000 6818.24 1.6325 INE172A01027 Castrol India Ltd Petroleum Products 1339787 6363.32 1.5226 INE668F01031 Jyothy Laboratories Ltd Consumer Non Durables 1835000 6325.25 1.5127 INE191H01014 PVR Ltd Media & Entertainment 500371 5930.40 1.4128 INE075I01017 Healthcare Global Enterprises Ltd Healthcare Services 2662549 5885.56 1.4029 INE055A01016 Century Textiles Industries Ltd Cement 621756 5863.47 1.4030 INE126A01031 EID Parry India Ltd Fertilisers 2369717 5841.35 1.3931 INE716A01013 Whirlpool of India Ltd Consumer Durables 568781 5786.21 1.3832 INE503A01015 DCB Ltd Banks 4494692 5625.11 1.3433 INE849A01020 Trent Ltd Retailing 2593470 5535.76 1.3234 INE302A01020 Exide Industries Ltd Auto Ancillaries 2858980 5231.93 1.2535 INE264A01014 GlaxoSmithKline Consumer Healthcare Ltd Consumer Non Durables 81982 4947.08 1.1836 INE510A01028 Engineers India Ltd Construction Project 1930000 4795.09 1.1437 INE053A01029 Indian Hotels Company Ltd Hotels, Resorts and Other Recreational Activities 3670221 4787.80 1.1438 INE208A01029 Ashok Leyland Ltd Auto 5848312 4655.26 1.1139 INE152A01029 Thermax Ltd Industrial Capital Goods 535780 4528.41 1.0840 INE092A01019 Tata Chemicals Ltd Chemicals 860378 4513.54 1.0841 INE169A01031 Coromandel International Ltd Fertilisers 1777742 4373.25 1.0442 INE180A01020 Max Financial Services Ltd Finance 786021 4367.13 1.0443 INE356A01018 MphasiS Ltd Software 824856 4286.36 1.0244 INE852F01015 Gateway Distriparks Ltd Transportation 1686488 4244.89 1.0145 INE935A01035 GlenMark Pharmaceuticals Ltd Pharmaceuticals 455858 4209.62 1.0046 INE199G01027 Jagran Prakashan Ltd Media & Entertainment 2272949 4159.50 0.9947 INE939A01011 Strides Shasun Ltd Pharmaceuticals 413149 4156.07 0.9948 INE258A01016 BEML Ltd Industrial Capital Goods 459172 4022.58 0.9649 INE151A01013 Tata Communications Ltd Telecom - Services 700000 3959.55 0.9450 INE486A01013 CESC Ltd Power 624538 3814.37 0.9151 INE836F01026 Dish TV India Ltd Media & Entertainment 3961005 3687.70 0.8852 INE881D01027 Oracle Financial Service Software Ltd Software 110000 3545.08 0.8553 INE536A01023 Grindwell Norton Ltd Industrial Products 964510 3252.81 0.7854 INE211B01039 The Phoenix Mills Ltd Construction 824328 3181.91 0.7655 INE280A01028 Titan Industries Ltd Consumer Durables 790739 3124.21 0.7556 INE010A01011 Prism Cement Ltd Cement 2900000 2995.70 0.7157 INE775A01035 Motherson Sumi Systems Ltd Auto Ancillaries 883500 2809.53 0.6758 INE878A01011 GE Power India Ltd Industrial Capital Goods 494207 2721.60 0.6559 INE262H01013 Persistent Systems Ltd Software 414993 2656.37 0.6360 INE998I01010 Mahindra Holidays & Resorts India Ltd Hotels, Resorts and Other Recreational Activities 547189 2444.29 0.5861 INE066P01011 INOX Wind Ltd Industrial Capital Goods 1191320 2385.62 0.5762 INE200A01026 GE T&D India Ltd Industrial Capital Goods 705231 2362.17 0.5663 INE722A01011 Shriram City Union Finance Ltd Finance 87380 1856.43 0.4464 INE010V01017 L&T Technology Services Ltd Software 191856 1625.31 0.39 Total for Equity & Equity Related 413955.91 98.72 (B) Money Market Instruments 1 Reverse Repo 4997.97 1.192 CBLO 1421.29 0.34 Total for Money Market Instruments 6419.26 1.53 Cash and Other Net Current Assets (1065.63) (0.25) Grand Total 419309.54 100.00Notesa) Total NPA's provided for and its percentage to NAV - Nil b) Total value and percentage of illiquid equity shares - Nil c) NAV per unit (` per unit)
Direct plan Institutional Plan Regular plan Options 31/03/2016 30/09/2016 31/03/2016 30/09/2016 31/03/2016 30/09/2016Growth 333.0882 416.8517 340.1877 425.5004 327.6958 409.4084 Dividend 30.5920 37.6268 27.5170 33.7586 30.0135 36.8384 d) Dividend declared during the period (` per unit) Option Direct plan Institutional Plan Regular PlanDividend 0.60 0.60 0.60e) Total outstanding exposure in derivative instruments at the end of the period - Nilf) Total investments in foreign securities /ADR'S/GDR'S at the end of the period - Nilg) Portfolio Turnover Ratio - 11.21%h) Repo in corporate debt - Nil
SUNDARAM S.M.I.L.E. FUND
Sl No ISIN Code Name of the instrument Industry/Rating Quantity Mkt Value % of ` in Lakhs NAV A) Equity & Equity Related a) Listed / awaiting listing on Stock Exchange 1 INE951I01027 V Guard Industries Ltd Industrial Capital Goods 2998272 5507.83 4.952 INE823G01014 J K Cements Ltd Cement 525000 4597.69 4.133 INE048G01018 Navin Flourine International Ltd Chemicals 195848 4354.29 3.914 INE384A01010 Rane Holdings Ltd Finance 508788 4149.67 3.735 INE578A01017 Heidelberg Cement India Ltd Cement 2847462 3750.11 3.376 INE049A01027 Himatsingka Seide Ltd Textile Products 1298616 3488.08 3.147 INE195J01029 PNC Infratech Ltd Construction 2985000 3476.03 3.128 INE348B01021 Century Plyboards (India) Ltd Consumer Durables 1339352 3355.75 3.029 INE036D01010 Karur Vysya Bank Ltd Banks 690000 3239.21 2.9110 INE349A01021 NRB Bearings Ltd Industrial Products 2533486 3197.26 2.8711 INE415A01038 HSIL Ltd Consumer Durables 900000 3060.00 2.7512 INE939A01011 Strides Shasun Ltd Pharmaceuticals 301538 3033.32 2.7313 INE503A01015 DCB Ltd Banks 2340000 2928.51 2.6314 INE074A01025 Praj Industries Ltd Industrial Capital Goods 3600000 2926.80 2.63
www.sundarammutual.com
Half-yearly Portfolio Statement of the Schemes of Sundaram Mutual Fund for the period ended September 30, 2016 (Page 2)
15 INE442H01029 Ashoka Buildcon Ltd Construction Project 1714124 2921.72 2.6316 INE383A01012 The India Cements Ltd Cement 1975493 2844.71 2.5617 INE852F01015 Gateway Distriparks Ltd Transportation 1117483 2812.70 2.5318 INE686A01026 ITD Cementation India Ltd Construction 1980700 2792.79 2.5119 INE978A01019 Heritage Foods Ltd Consumer Non Durables 300000 2575.35 2.3120 INE325A01013 Timken India Ltd Industrial Products 457892 2529.40 2.2721 INE142I01023 Take Solutions Ltd Software 1492559 2497.80 2.2522 INE614A01028 Ramco Industries Ltd Cement 1435462 2359.90 2.1223 INE312H01016 INOX Leisure Ltd Media & Entertainment 828556 2174.13 1.9524 INE337A01034 LG Balakrishnan Bros Ltd Auto Ancillaries 386365 2173.69 1.9525 INE858B01011 ISGEC Heavy Engineering Ltd Industrial Capital Goods 45976 2073.84 1.8626 INE331A01037 The Ramco Cements Ltd Cement 340587 2027.85 1.8227 INE419M01019 TD Power Systems Ltd Industrial Capital Goods 1081726 1961.17 1.7628 INE791I01019 Brigade Enterprises Ltd Construction 1061326 1841.93 1.6629 INE220B01022 Kalpataru Power Transmission Ltd Power 660000 1719.30 1.5530 INE246B01019 Ramco Systems Ltd Software 373024 1719.08 1.5531 INE098F01023 Amrutanjan Health Care Ltd Pharmaceuticals 390000 1691.43 1.5232 INE391D01019 TRF Ltd Industrial Capital Goods 621699 1669.57 1.5033 INE172N01012 Adlabs Entertainment Ltd Hotels, Resorts and Other Recreational Activities 1675000 1662.44 1.4934 INE387A01021 Sundaram Fasteners Ltd Auto Ancillaries 529802 1545.70 1.3935 INE120A01034 Carborundum Universal Ltd Industrial Products 559433 1522.78 1.3736 INE891D01026 Redington (India) Ltd Trading 1400000 1447.60 1.3037 INE180A01020 Max Financial Services Ltd Finance 254931 1416.40 1.2738 INE386C01029 Astra Microwave Products Ltd Telecom - Equipment & Accessories 1260755 1401.96 1.2639 INE999A01015 KSB Pumps Ltd Industrial Products 226467 1342.61 1.2140 INE089C01029 Sterlite Technologies Ltd Industrial Products 1611461 1284.33 1.1541 INE956G01038 Vatech Wabag Ltd Engineering Services 220458 1211.31 1.0942 INE070I01018 Insecticides India Ltd Pesticides 240176 1116.34 1.0043 INE594H01019 Thyrocare Technologies Ltd Healthcare Services 177044 1085.46 0.9844 INE989A01024 Sanghvi Movers Ltd Industrial Capital Goods 383273 907.02 0.8245 INE935O01010 Star Ferro & Cement Ltd Cement 790000 840.17 0.7646 INE181G01025 Gammon Infrastructure Projects Ltd Construction Project 10428590 484.93 0.4447 INE586B01026 Taj GVK Hotels Hotels, Resorts and Other Recreational Activities 365000 441.47 0.4048 INE495B01038 Suven Life Science Ltd Pharmaceuticals 200000 400.50 0.3649 INE268C01029 Easun Reyrolle Ltd Industrial Capital Goods 1200000 350.40 0.3150 INE551A01022 Hindustan Dorr Oliver Ltd Engineering Services 2592616 335.74 0.30 Total for Equity & Equity Related 110248.04 99.09 (B) Money Market Instruments 1 CBLO 1463.27 1.32 Total for Money Market Instruments 1463.27 1.32 Cash and Other Net Current Assets (452.59) (0.41) Grand Total 111258.72 100.00Notesa) Total NPA's provided for and its percentage to NAV - Nil b) Total value and percentage of illiquid equity shares - Nil c) NAV per unit (` per unit)
Direct plan Institutional Plan Regular plan Options 31/03/2016 30/09/2016 31/03/2016 30/09/2016 31/03/2016 30/09/2016Growth 64.7832 79.3321 66.1764 81.0062 63.7745 77.9855 Dividend 18.3778 21.9949 18.8319 22.5405 18.0228 21.5281d) Dividend declared during the period (` per unit)Option Direct plan Institutional Plan Regular plan Dividend 0.50 0.50 0.50e) Total outstanding exposure in derivative instruments at the end of the period - Nilf) Total investments in foreign securities /ADR'S/GDR'S at the end of the period - Nilg) Portfolio Turnover Ratio - 8.49%h) Repo in corporate debt - Nil
SUNDARAM SELECT FOCUS
Sl No ISIN Code Name of the instrument Industry/Rating Quantity Mkt Value % of ` in Lakhs NAV A) Equity & Equity Related a) Listed / awaiting listing on Stock Exchange 1 INE040A01026 HDFC Bank Ltd Banks 345000 4391.33 9.852 INE154A01025 ITC Ltd Consumer Non Durables 1590000 3837.47 8.613 INE009A01021 Infosys Ltd Software 250000 2590.13 5.814 INE090A01021 ICICI Bank Ltd Banks 890000 2244.14 5.035 INE001A01036 Housing Development Finance Corporation Ltd Finance 152000 2118.04 4.756 INE018A01030 Larsen & Toubro Ltd Construction Project 146000 2092.40 4.697 INE002A01018 Reliance Industries Ltd Petroleum Products 190000 2059.03 4.628 INE062A01020 State Bank Of India Ltd Banks 712000 1788.90 4.019 INE237A01028 Kotak Mahindra Bank Ltd Banks 229500 1783.22 4.0010 INE101A01026 Mahindra & Mahindra Ltd Auto 100000 1405.70 3.1511 INE155A01022 Tata Motors Ltd Auto 262000 1401.31 3.1412 INE238A01034 Axis Bank Ltd Banks 247000 1337.13 3.0013 INE030A01027 Hindustan Unilever Ltd Consumer Non Durables 137663 1194.71 2.6814 INE585B01010 Maruti Suzuki India Ltd Auto 20500 1122.85 2.5215 INE012A01025 ACC Ltd Cement 70000 1119.90 2.5116 INE467B01029 Tata Consultancy Services Ltd Software 42000 1020.94 2.2917 INE242A01010 Indian Oil Corporation Ltd Petroleum Products 175000 1019.38 2.2918 INE094A01015 Hindustan Petroleum Corpn Ltd Petroleum Products 240000 1017.48 2.2819 INE044A01036 Sun Pharmaceuticals Industries Ltd Pharmaceuticals 130000 965.51 2.1720 INE095A01012 IndusInd Bank Ltd Banks 75000 896.96 2.0121 INE733E01010 NTPC Ltd Power 600000 888.00 1.9922 INE628A01036 UPL Ltd Pesticides 115000 774.93 1.7423 INE129A01019 GAIL (India) Ltd Gas 204000 764.29 1.7124 INE752E01010 Power Grid Corporation of India Ltd Power 400000 706.20 1.5825 INE180A01020 Max Financial Services Ltd Finance 122000 677.83 1.5226 INE462A01022 Bayer Cropscience Ltd Pesticides 15000 670.78 1.5027 INE256A01028 Zee Entertainment Enterprises Ltd Media & Entertainment 110000 601.43 1.3528 INE020B01018 Rural Electrification Corporation Ltd Finance 440000 529.32 1.1929 INE881D01027 Oracle Financial Service Software Ltd Software 15000 483.42 1.0830 INE726G01019 ICICI Prudential Life Insurance Company Ltd Insurance Services - Life 100100 310.56 0.7031 INE028A01039 Bank of Baroda Banks 170000 284.58 0.6432 INE016A01026 Dabur India Ltd Consumer Non Durables 100000 271.20 0.6133 INE860A01027 HCL Technologies Ltd Software 28000 223.97 0.5034 INE245A01021 Tata Power Company Ltd Power 92000 69.37 0.16 Sub Total 42662.37 95.68 (b) Overseas Security 1 US1924461023 Cognizant Technology Solutions GRP Software 20000 733.26 1.64 Sub Total 733.26 1.64 (c) Derivative 1 Nifty Option Oct2016 8500 PUT Index Option 10350 10.17 0.022 Nifty Option Dec2017 8300 CALL Index Option 25 0.28 #3 Nifty Option Dec2017 8500 CALL Index Option 25 0.24 #4 Nifty Option Dec2017 8700 CALL Index Option 25 0.22 # Sub Total 10.90 0.03 Total for Equity & Equity Related 43406.52 97.35 (B) Money Market Instruments 1 CBLO 1226.39 2.752 Reverse Repo 1.00 # Total for Money Market Instruments 1227.39 2.75 Cash and Other Net Current Assets (46.50) (0.10) Grand Total 44587.41 100.00# percentage to NAV of security is less than 0.01%Notesa) Total NPA's provided for and its percentage to NAV - Nil b) Total value and percentage of illiquid equity shares - Nil c) NAV per unit (` per unit)
Direct plan Institutional Plan Regular plan Options 31/03/2016 30/09/2016 31/03/2016 30/09/2016 31/03/2016 30/09/2016Growth 119.2591 130.2593 121.9171 133.1425 117.5536 128.2598 Dividend 12.8876 13.0876 13.0381 13.2534 12.7181 12.8866 d) Dividend declared during the period (` per unit)Option Direct plan Institutional Plan Regular plan Dividend 1.00 1.00 1.00e) Total outstanding exposure in derivative instruments at the end of the period - As Per Annexure-A.f) Total investments in foreign securities /ADR'S/GDR'S at the end of the period (`) - 733.26 Lacsg) Portfolio Turnover Ratio - 42.64%
h) Repo in corporate debt - Nil
SUNDARAM RURAL INDIA FUND
Sl No ISIN Code Name of the instrument Industry/Rating Quantity Mkt Value % of ` in Lakhs NAV A) Equity & Equity Related a) Listed / awaiting listing on Stock Exchange 1 INE978A01019 Heritage Foods Ltd Consumer Non Durables 235000 2017.36 4.372 INE462A01022 Bayer Cropscience Ltd Pesticides 44007 1967.93 4.263 INE101A01026 Mahindra & Mahindra Ltd Auto 131888 1853.95 4.024 INE585B01010 Maruti Suzuki India Ltd Auto 30149 1651.35 3.585 INE722A01011 Shriram City Union Finance Ltd Finance 73603 1563.73 3.396 INE049A01027 Himatsingka Seide Ltd Textile Products 581527 1561.98 3.387 INE951I01027 V Guard Industries Ltd Industrial Capital Goods 848370 1558.46 3.388 INE613A01020 Rallis India Ltd Pesticides 638939 1425.79 3.099 INE154A01025 ITC Ltd Consumer Non Durables 562561 1357.74 2.9410 INE199G01027 Jagran Prakashan Ltd Media & Entertainment 740959 1355.95 2.9411 INE121A01016 Cholamandalam Investment & Finance Company Ltd Finance 104817 1213.10 2.6312 INE179A01014 Procter & Gamble Hygiene and Health Care Ltd Consumer Non Durables 17118 1164.91 2.5213 INE764D01017 VST Tillers Tractors Ltd Auto 60234 1131.31 2.4514 INE472A01039 Blue Star Ltd Consumer Durables 172981 948.02 2.0515 INE774D01024 Mahindra & Mahindra Financial Services Ltd Finance 256541 934.58 2.0216 INE180A01020 Max Financial Services Ltd Finance 166621 925.75 2.0017 INE239A01016 Nestle India Ltd Packaged Foods 14310 920.54 1.9918 INE628A01036 UPL Ltd Pesticides 136129 917.31 1.9919 INE030A01027 Hindustan Unilever Ltd Consumer Non Durables 104584 907.63 1.9720 INE048G01018 Navin Flourine International Ltd Chemicals 39530 878.87 1.9021 INE383A01012 The India Cements Ltd Cement 572053 823.76 1.7822 INE435G01025 Dhanuka Agritech Ltd Pesticides 114104 763.76 1.6523 INE726G01019 ICICI Prudential Life Insurance Company Ltd Insurance Services - Life 217532 674.89 1.4624 INE021A01026 Asian Paints Ltd Consumer Non Durables 52434 608.60 1.3225 INE260B01028 Godfrey Philips Ltd Consumer Non Durables 46862 602.93 1.3126 INE274B01011 Monsanto India Ltd Pesticides 23390 559.16 1.2127 INE107A01015 Tamil Nadu Newsprint & Papers Ltd Paper 165775 546.23 1.1828 INE935O01010 Star Ferro & Cement Ltd Cement 505000 537.07 1.1629 INE092A01019 Tata Chemicals Ltd Chemicals 97565 511.83 1.1130 INE001B01026 KRBL LTD Consumer Non Durables 199189 510.52 1.1131 INE348B01021 Century Plyboards (India) Ltd Consumer Durables 203578 510.06 1.1032 INE323C01030 Indian Hume Pipe Company Ltd Construction Project 77000 504.50 1.0933 INE256A01028 Zee Entertainment Enterprises Ltd Media & Entertainment 85999 470.20 1.0234 INE716A01013 Whirlpool of India Ltd Consumer Durables 45511 462.98 1.0035 INE113A01013 Gujarat Narmada Valley Fertilizers and Chemicals Ltd Chemicals 255310 453.69 0.9836 INE868B01028 NCC Ltd Construction Project 548301 450.16 0.9737 INE603J01030 P I Industries Ltd Pesticides 52523 436.68 0.9538 INE836F01026 Dish TV India Ltd Media & Entertainment 462672 430.75 0.9339 INE058A01010 SANOFI India Ltd Pharmaceuticals 10000 413.82 0.9040 INE119A01028 Balrampur Chini Mills Ltd Consumer Non Durables 377657 406.93 0.8841 INE331A01037 The Ramco Cements Ltd Cement 68000 404.87 0.8842 INE085A01013 Chambal Fertilizers and Chemicals Ltd Fertilisers 683667 398.24 0.8643 INE070I01018 Insecticides India Ltd Pesticides 84789 394.10 0.8544 INE988K01017 Equitas Holdings Ltd Finance 223499 390.34 0.8545 INE493A01027 Tata Coffee Ltd Consumer Non Durables 297000 366.20 0.7946 INE041A01016 Dhampur Sugar Mills Ltd Consumer Non Durables 301159 347.84 0.7547 INE825A01012 Vardhman Textiles Ltd Textiles - Cotton 31732 338.06 0.7348 INE415A01038 HSIL Ltd Consumer Durables 94900 322.66 0.7049 INE334L01012 Ujjivan Financial Services Ltd Finance 70250 314.26 0.6850 INE296A01024 Bajaj Finance Ltd Finance 27530 290.69 0.6351 INE169A01031 Coromandel International Ltd Fertilisers 112125 275.83 0.6052 INE079A01024 Ambuja Cements Ltd Cement 97430 245.28 0.5353 INE481G01011 UltraTech Cement Ltd Cement 5500 211.84 0.4654 INE146L01010 Kirloskar Oil Engines Ltd Industrial Products 15490 51.79 0.11 Total for Equity & Equity Related 41286.76 89.41 (B) Money Market Instruments 1 CBLO 5213.38 11.29 Total for Money Market Instruments 5213.38 11.29 Cash and Other Net Current Assets (324.59) (0.70) Grand Total 46175.55 100.00Notesa) Total NPA's provided for and its percentage to NAV - Nil b) Total value and percentage of illiquid equity shares - Nil c) NAV per unit (` per unit)
Direct plan Institutional Plan Regular plan Options 31/03/2016 30/09/2016 31/03/2016 30/09/2016 31/03/2016 30/09/2016Growth 26.4654 34.6377 - - 26.1121 34.0137 Dividend 17.7009 22.6813 25.8914 33.3297 17.4832 22.2529d) Dividend declared during the period (` per unit)Option Direct plan Institutional Plan Regular plan Dividend 0.50 0.50 0.50e) Total outstanding exposure in derivative instruments at the end of the period - Nilf) Total investments in foreign securities /ADR'S/GDR'S at the end of the period - Nilg) Portfolio Turnover Ratio - 35.91%h) Repo in corporate debt - Nil
SUNDARAM EQUITY MULTIPLIER
Sl No ISIN Code Name of the instrument Industry/Rating Quantity Mkt Value % of ` in Lakhs NAV A) Equity & Equity Related a) Listed / awaiting listing on Stock Exchange 1 INE040A01026 HDFC Bank Ltd Banks 120000 1527.42 5.722 INE001A01036 Housing Development Finance Corporation Ltd Finance 75000 1045.09 3.923 INE009A01021 Infosys Ltd Software 85000 880.64 3.304 INE002A01018 Reliance Industries Ltd Petroleum Products 80000 866.96 3.255 INE154A01025 ITC Ltd Consumer Non Durables 300000 724.05 2.716 INE018A01030 Larsen & Toubro Ltd Construction Project 50000 716.58 2.697 INE062A01020 State Bank Of India Ltd Banks 280000 703.50 2.648 INE203G01019 Indraprastha Gas Ltd Gas 85000 661.39 2.489 INE237A01028 Kotak Mahindra Bank Ltd Banks 80000 621.60 2.3310 INE090A01021 ICICI Bank Ltd Banks 230000 579.95 2.1711 INE094A01015 Hindustan Petroleum Corpn Ltd Petroleum Products 135000 572.33 2.1512 INE334L01012 Ujjivan Financial Services Ltd Finance 127800 571.71 2.1413 INE101A01026 Mahindra & Mahindra Ltd Auto 40000 562.28 2.1114 INE733E01010 NTPC Ltd Power 375000 555.00 2.0815 INE242A01010 Indian Oil Corporation Ltd Petroleum Products 95000 553.38 2.0716 INE129A01019 GAIL (India) Ltd Gas 140000 524.51 1.9717 INE113A01013 Gujarat Narmada Valley Fertilizers and Chemicals Ltd Chemicals 275000 488.68 1.8318 INE155A01022 Tata Motors Ltd Auto 90000 481.37 1.8019 INE180A01020 Max Financial Services Ltd Finance 85000 472.26 1.7720 INE280B01018 Elantas Beck India Ltd Chemicals 26000 429.87 1.6121 INE572A01028 JB Chemicals and Pharma Ltd Pharmaceuticals 120000 427.08 1.6022 INE179A01014 Procter & Gamble Hygiene and Health Care Ltd Consumer Non Durables 6000 408.31 1.5323 INE030A01027 Hindustan Unilever Ltd Consumer Non Durables 45000 390.53 1.4624 INE050A01025 Bombay Burmah Trading Corporation Ltd Consumer Non Durables 68000 388.18 1.4525 INE881D01027 Oracle Financial Service Software Ltd Software 12000 386.74 1.4526 INE585B01010 Maruti Suzuki India Ltd Auto 7000 383.41 1.4427 INE043D01016 IDFC Ltd Finance 550000 369.60 1.3928 INE467B01029 Tata Consultancy Services Ltd Software 14000 340.31 1.2829 INE002S01010 Mahanagar Gas Ltd Gas 50174 331.22 1.2430 INE092A01019 Tata Chemicals Ltd Chemicals 60161 315.60 1.1831 INE373A01013 BASF India Ltd Chemicals 26000 314.46 1.1832 INE503A01015 DCB Ltd Banks 250000 312.88 1.1733 INE151A01013 Tata Communications Ltd Telecom - Services 55000 311.11 1.1734 INE095A01012 IndusInd Bank Ltd Banks 26000 310.95 1.1735 INE976G01028 RBL Bank Ltd Banks 106665 310.61 1.1636 INE020B01018 Rural Electrification Corporation Ltd Finance 250000 300.75 1.1337 INE133A01011 AKZO Nobel India Ltd Consumer Non Durables 17000 288.61 1.0838 INE640A01023 SKF Bearings Ltd Industrial Products 20000 280.44 1.0539 INE725G01011 ICRA Ltd Finance 7000 274.60 1.0340 INE263A01016 Bharat Electronics Ltd Industrial Capital Goods 22000 273.85 1.0341 INE116C01012 Z F Steering Gear (India) Ltd Auto Ancillaries 18000 270.17 1.0142 INE164A01016 Balmer Lawrie & Company Ltd Transportation 40000 269.84 1.0143 INE058A01010 SANOFI India Ltd Pharmaceuticals 6500 268.98 1.0144 INE877F01012 Power Trading Corporation Ltd Power 350000 260.58 0.9845 INE506A01018 Dredging Corporation Ltd Engineering Services 65000 254.54 0.9546 INE628A01036 UPL Ltd Pesticides 37500 252.69 0.9547 INE203A01020 Astra Zeneca Pharma India Ltd Pharmaceuticals 27000 250.78 0.9448 INE238A01034 Axis Bank Ltd Banks 44000 238.19 0.89
49 INE044A01036 Sun Pharmaceuticals Industries Ltd Pharmaceuticals 32000 237.66 0.8950 INE868B01028 NCC Ltd Construction Project 275000 225.78 0.8551 INE230A01023 East India Hotels Ltd Hotels, Resorts and Other Recreational Activities 190000 209.29 0.7852 INE260B01028 Godfrey Philips Ltd Consumer Non Durables 16000 205.86 0.7753 INE275B01026 Huhtamaki PPL Ltd Industrial Products 75000 192.86 0.7254 INE075A01022 Wipro Ltd Software 38844 186.04 0.7055 INE397D01024 Bharti Airtel Ltd Telecom - Services 50000 157.00 0.5956 INE852F01015 Gateway Distriparks Ltd Transportation 47293 119.04 0.4557 INE146L01010 Kirloskar Oil Engines Ltd Industrial Products 30986 103.60 0.39 Sub Total 23960.68 89.81 (b) Derivative 1 Nifty Option Oct2016 8500 PUT Index Option 6150 6.04 0.02 Total for Equity & Equity Related 23966.72 89.83 (B) Money Market Instruments 1 CBLO 2242.87 8.412 Reverse Repo 327.80 1.23 Total for Money Market Instruments 2570.66 9.63 Cash and Other Net Current Assets 143.26 0.54 Grand Total 26680.64 100.00Notesa) Total NPA's provided for and its percentage to NAV - Nil b) Total value and percentage of illiquid equity shares - Nil c) NAV per unit (` per unit)
Direct plan Regular plan Options 31/03/2016 30/09/2016 31/03/2016 30/09/2016Growth 22.0212 25.2935 21.6361 24.7686 Dividend 16.5217 18.9367 16.2424 18.5003d) Dividend declared during the period (` per unit) - Nile) Total outstanding exposure in derivative instruments at the end of the period - As Per Annexure-Af) Total investments in foreign securities /ADR'S/GDR'S at the end of the period -Nilg) Portfolio Turnover Ratio - 81.88%h) Repo in corporate debt - NIL
SUNDARAM EQUITY PLUS
Sl No ISIN Code Name of the instrument Industry/Rating Quantity Mkt Value % of ` in Lakhs NAV A) Equity & Equity Related a) Listed / awaiting listing on Stock Exchange 1 INE040A01026 HDFC Bank Ltd Banks 28000 356.40 7.342 INE001A01036 Housing Development Finance Corporation Ltd Finance 18000 250.82 5.173 INE154A01025 ITC Ltd Consumer Non Durables 90000 217.22 4.474 INE002A01018 Reliance Industries Ltd Petroleum Products 20000 216.74 4.465 INE090A01021 ICICI Bank Ltd Banks 70000 176.51 3.646 INE009A01021 Infosys Ltd Software 15000 155.41 3.207 INE062A01020 State Bank Of India Ltd Banks 60000 150.75 3.118 INE018A01030 Larsen & Toubro Ltd Construction Project 10000 143.32 2.959 INE242A01010 Indian Oil Corporation Ltd Petroleum Products 22000 128.15 2.6410 INE237A01028 Kotak Mahindra Bank Ltd Banks 15000 116.55 2.4011 INE481G01011 UltraTech Cement Ltd Cement 3000 115.55 2.3812 INE101A01026 Mahindra & Mahindra Ltd Auto 8000 112.46 2.3213 INE733E01010 NTPC Ltd Power 75000 111.00 2.2914 INE238A01034 Axis Bank Ltd Banks 20000 108.27 2.2315 INE585B01010 Maruti Suzuki India Ltd Auto 1700 93.11 1.9216 INE030A01027 Hindustan Unilever Ltd Consumer Non Durables 10000 86.79 1.7917 IN9155A01020 Tata Motors Ltd Auto 25000 85.13 1.7518 INE467B01029 Tata Consultancy Services Ltd Software 2750 66.85 1.3819 INE021A01026 Asian Paints Ltd Consumer Non Durables 5000 58.04 1.2020 INE256A01028 Zee Entertainment Enterprises Ltd Media & Entertainment 10000 54.68 1.1321 INE860A01027 HCL Technologies Ltd Software 6500 51.99 1.0722 INE397D01024 Bharti Airtel Ltd Telecom - Services 16000 50.24 1.0323 INE522F01014 Coal India Ltd Minerals/Mining 15000 48.35 1.0024 INE075A01022 Wipro Ltd Software 10000 47.90 0.9925 INE089A01023 Dr. Reddy's Laboratories Ltd Pharmaceuticals 1500 46.61 0.9626 INE326A01037 Lupin Ltd Pharmaceuticals 2500 37.16 0.7727 INE029A01011 Bharat Petroleum Corporation Ltd Petroleum Products 6000 36.76 0.7628 INE095A01012 IndusInd Bank Ltd Banks 3000 35.88 0.7429 INE044A01036 Sun Pharmaceuticals Industries Ltd Pharmaceuticals 4000 29.71 0.61 Sub Total 3188.29 65.67 (b) Derivative 1 HDFC Bank NSE Oct2016 FUT Stock Future (500) (6.42) (0.13) Sub Total (6.42) (0.13) Total for Equity & Equity Related 3181.87 65.54 (B) Money Market Instruments 1 Reverse Repo 276.00 5.68 Total for Money Market Instruments 276.00 5.68 (C) Mutual Fund Units (a) Investment in Mutual Fund Units 1 INF732E01102 Goldman Sachs Gold ETF Mutual Fund 20000 565.04 11.642 INF789F01059 UTI Gold ETF Mutual Fund 10000 283.02 5.833 INF373I01049 Kotak Gold ETF Mutual Fund 100000 280.65 5.784 INF733I01010 Reliance Gold ETF Mutual Fund 10000 277.11 5.71 Total for Money Market Instruments 1405.81 28.96 Margin Money For Derivatives 12.35 0.25 Cash and Other Net Current Assets (20.99) (0.43) Grand Total 4855.04 100.00Notesa) Total NPA's provided for and its percentage to NAV - Nil b) Total value and percentage of illiquid equity shares - Nil c) NAV per unit (` per unit)
Direct plan Regular plan Options 31/03/2016 30/09/2016 31/03/2016 30/09/2016Growth 13.0850 14.3353 12.8168 13.9777 Dividend 12.0336 12.6916 11.7989 12.3765d) Dividend declared during the period (` per unit)Option Direct plan Regular plan Dividend 0.50 0.50e) Total outstanding exposure in derivative instruments at the end of the period - As Per Annexure-Af) Total investments in foreign securities /ADR'S/GDR'S at the end of the period - Nilg) Portfolio Turnover Ratio - 3.81%h) Repo in corporate debt - Nil
SUNDARAM FINANCIAL SERVICES OPPORTUNITIES FUND
Sl No ISIN Code Name of the instrument Industry/Rating Quantity Mkt Value % of ` in Lakhs NAV A) Equity & Equity Related a) Listed / awaiting listing on Stock Exchange 1 INE040A01026 HDFC Bank Ltd Banks 250000 3182.13 23.972 INE090A01021 ICICI Bank Ltd Banks 735000 1853.30 13.963 INE237A01028 Kotak Mahindra Bank Ltd Banks 150000 1165.50 8.784 INE238A01034 Axis Bank Ltd Banks 200000 1082.70 8.165 INE062A01020 State Bank Of India Ltd Banks 370000 929.63 7.006 INE095A01012 IndusInd Bank Ltd Banks 60000 717.57 5.417 INE528G01019 Yes Bank Ltd Banks 40000 501.88 3.788 INE180A01020 Max Financial Services Ltd Finance 60000 333.36 2.519 INE334L01012 Ujjivan Financial Services Ltd Finance 65000 290.78 2.1910 INE115A01026 LIC Housing Finance Ltd Finance 50000 289.40 2.1811 INE028A01039 Bank of Baroda Banks 165000 276.21 2.0812 INE503A01015 DCB Ltd Banks 220000 275.33 2.0713 INE562A01011 Indian Bank Banks 130000 274.43 2.0714 INE043D01016 IDFC Ltd Finance 400000 268.80 2.0315 INE726G01019 ICICI Prudential Life Insurance Company Ltd Insurance Services - Life 80080 248.45 1.8716 INE752H01013 Credit Analysis & Research Ltd Finance 15000 204.20 1.5417 INE612J01015 Repco Home Finance Ltd Finance 23368 191.01 1.4418 INE976G01028 RBL Bank Ltd Banks 62205 181.14 1.3619 INE725G01011 ICRA Ltd Finance 4000 156.92 1.1820 INE020B01018 Rural Electrification Corporation Ltd Finance 120000 144.36 1.0921 INE988K01017 Equitas Holdings Ltd Finance 75000 130.99 0.9922 INE160A01022 Punjab National Bank Banks 70000 98.49 0.7423 INE498L01015 L&T Finance Holdings Ltd Finance 30000 27.50 0.21 Sub Total 12824.05 96.62 (b) Derivative 1 Bank Nifty Option-P NSE Oct2016 19000.000 Index Option 1360 3.84 0.03 Sub Total 3.84 0.03 Total for Equity & Equity Related 12827.89 96.65 (B) Money Market Instruments 1 CBLO 394.80 2.97 Total for Money Market Instruments 394.80 2.97 Cash and Other Net Current Assets 50.64 0.38 Grand Total 13273.33 100.00
www.sundarammutual.com
Half-yearly Portfolio Statement of the Schemes of Sundaram Mutual Fund for the period ended September 30, 2016 (Page 3)
Notesa) Total NPA's provided for and its percentage to NAV - Nil b) Total value and percentage of illiquid equity shares - Nil c) NAV per unit (` per unit)
Direct plan Institutional Plan Regular planOptions 31/03/2016 30/09/2016 31/03/2016 30/09/2016 31/03/2016 30/09/2016Growth 25.6340 32.3234 26.3942 33.2360 25.3038 31.7714 Dividend 14.6180 17.9410 14.8519 18.1891 14.4020 17.5710d) Dividend declared during the period (` per unit)
Direct plan Institutional Plan Regular plan Dividend 0.50 0.50 0.50e) Total outstanding exposure in derivative instruments at the end of the period - As Per Annexure-Af) Total investments in foreign securities /ADR'S/GDR'S at the end of the period - Nilg) Portfolio Turnover Ratio - 13.91%h) Repo in corporate debt - Nil
SUNDARAM SELECT MICRO CAP - SERIES I
Sl No ISIN Code Name of the instrument Industry/Rating Quantity Mkt Value % of ` in Lakhs NAV A) Equity & Equity Related a) Listed / awaiting listing on Stock Exchange 1 INE782A01015 Johnson Controls Hitachi Air Conditioning India Ltd Consumer Durables 36964 600.02 5.282 INE325A01013 Timken India Ltd Industrial Products 96280 531.85 4.683 INE578A01017 Heidelberg Cement India Ltd Cement 382162 503.31 4.434 INE536A01023 Grindwell Norton Ltd Industrial Products 140606 474.19 4.175 INE999A01015 KSB Pumps Ltd Industrial Products 75886 449.89 3.966 INE280B01018 Elantas Beck India Ltd Chemicals 25700 424.91 3.747 INE671A01010 Honeywell Automation India Ltd Industrial Capital Goods 4425 409.98 3.618 INE823G01014 J K Cements Ltd Cement 46698 408.96 3.609 INE839M01018 Schneider Electric Infrastructure Ltd Industrial Capital Goods 278536 382.99 3.3710 INE373A01013 BASF India Ltd Chemicals 31368 379.38 3.3411 INE177A01018 Ingersoll-Rand India Ltd Industrial Products 51496 367.19 3.2312 INE349A01021 NRB Bearings Ltd Industrial Products 288489 364.07 3.2113 INE045A01017 Ador Welding Ltd Industrial Products 136192 363.02 3.2014 INE536H01010 Mahindra CIE Automotive Ltd Industrial Products 170249 326.71 2.8815 INE503A01015 DCB Ltd Banks 223496 279.71 2.4616 INE386A01015 Vesuvius India Ltd Industrial Products 27942 278.68 2.4517 INE472A01039 Blue Star Ltd Consumer Durables 50478 276.64 2.4418 INE462A01022 Bayer Cropscience Ltd Pesticides 5581 249.57 2.2019 INE142I01023 Take Solutions Ltd Software 148870 249.13 2.1920 INE533A01012 Good Year (I) Ltd Auto Ancillaries 34397 237.08 2.0921 INE234A01025 Novartis India Ltd Pharmaceuticals 33766 231.23 2.0422 INE334L01012 Ujjivan Financial Services Ltd Finance 48900 218.75 1.9323 INE457F01013 Salzer Electronics Ltd Industrial Capital Goods 100037 209.98 1.8524 INE312H01016 INOX Leisure Ltd Media & Entertainment 75423 197.91 1.7425 INE612J01015 Repco Home Finance Ltd Finance 23291 190.38 1.6826 INE878A01011 GE Power India Ltd Industrial Capital Goods 33430 184.10 1.6227 INE415A01038 HSIL Ltd Consumer Durables 53237 181.01 1.5928 INE260B01028 Godfrey Philips Ltd Consumer Non Durables 13678 175.98 1.5529 INE686A01026 ITD Cementation India Ltd Construction 118689 167.35 1.4730 INE294B01019 Swaraj Mazda Ltd Auto 12892 163.56 1.4431 INE793A01012 Accelya Kale Solution Ltd Software 11239 150.61 1.3332 INE258A01016 BEML Ltd Industrial Capital Goods 16016 140.31 1.2433 INE287B01021 Subros Ltd Auto Ancillaries 106252 135.10 1.1934 INE274B01011 Monsanto India Ltd Pesticides 5524 132.06 1.1635 INE116C01012 Z F Steering Gear (India) Ltd Auto Ancillaries 8035 120.60 1.0636 INE201K01015 SQS India BFSI Ltd Software 13727 116.84 1.0337 INE517F01014 Gujarat Pipavav Port Ltd Transportation 64415 112.08 0.9938 INE322A01010 Gillette India Ltd Consumer Non Durables 2491 108.11 0.9539 INE070I01018 Insecticides India Ltd Pesticides 23172 107.70 0.9540 INE717A01029 Kennametal India Ltd Industrial Products 14925 94.21 0.8341 INE189B01011 INEOS Styrolution India Ltd Industrial Products 15992 92.83 0.8242 INE278M01019 Navkar Corporation Ltd Transportation 48683 90.57 0.8043 INE089C01029 Sterlite Technologies Ltd Industrial Products 90942 72.48 0.6444 INE268C01029 Easun Reyrolle Ltd Industrial Capital Goods 235696 68.82 0.6145 INE934S01014 GNA Axles Ltd Auto Ancillaries 13012 29.69 0.26 Total for Equity & Equity Related 11049.56 97.27 (B) Money Market Instruments 1 Reverse Repo 306.00 2.70 Total for Money Market Instruments 306.00 2.70 Cash and Other Net Current Assets 3.66 0.03 Grand Total 11359.22 100.00Notesa) Total NPA's provided for and its percentage to NAV - Nil b) Total value and percentage of illiquid equity shares - Nil c) NAV per unit (` per unit)
Direct plan Regular plan Options 31/03/2016 30/09/2016 31/03/2016 30/09/2016Growth 23.5952 27.6423 22.9398 26.8219 Dividend 14.5434 16.5325 14.0337 15.9035d) Dividend declared during the period (` per unit)Option Direct plan Regular PlanDividend 0.50 0.50e) Total outstanding exposure in derivative instruments at the end of the period - Nilf) Total investments in foreign securities /ADR'S/GDR'S at the end of the period - Nilg) Portfolio Turnover Ratio - 6.64%h) Repo in corporate debt - Nil
SUNDARAM SELECT MICRO CAP - SERIES II
Sl No ISIN Code Name of the instrument Industry/Rating Quantity Mkt Value % of ` in Lakhs NAV A) Equity & Equity Related a) Listed / awaiting listing on Stock Exchange 1 INE782A01015 Johnson Controls Hitachi AirConditioning India Ltd Consumer Durables 24453 396.93 5.282 INE325A01013 Timken India Ltd Industrial Products 63541 351.00 4.673 INE578A01017 Heidelberg Cement India Ltd Cement 252243 332.20 4.424 INE536A01023 Grindwell Norton Ltd Industrial Products 92984 313.59 4.175 INE999A01015 KSB Pumps Ltd Industrial Products 50170 297.43 3.966 INE280B01018 Elantas Beck India Ltd Chemicals 16928 279.88 3.727 INE823G01014 J K Cements Ltd Cement 31263 273.79 3.648 INE671A01010 Honeywell Automation India Ltd Industrial Capital Goods 2921 270.64 3.609 INE839M01018 Schneider Electric Infrastructure Ltd Industrial Capital Goods 182425 250.83 3.3410 INE373A01013 BASF India Ltd Chemicals 20560 248.66 3.3111 INE177A01018 Ingersoll-Rand India Ltd Industrial Products 34812 248.23 3.3012 INE349A01021 NRB Bearings Ltd Industrial Products 190225 240.06 3.1913 INE045A01017 Ador Welding Ltd Industrial Products 89735 239.19 3.1814 INE536H01010 Mahindra CIE Automotive Ltd Industrial Products 112343 215.59 2.8715 INE503A01015 DCB Ltd Banks 146587 183.45 2.4416 INE386A01015 Vesuvius India Ltd Industrial Products 18392 183.43 2.4417 INE472A01039 Blue Star Ltd Consumer Durables 33189 181.89 2.4218 INE462A01022 Bayer Cropscience Ltd Pesticides 3693 165.15 2.2019 INE142I01023 Take Solutions Ltd Software 98330 164.56 2.1920 INE533A01012 Good Year (I) Ltd Auto Ancillaries 22631 155.98 2.0721 INE234A01025 Novartis India Ltd Pharmaceuticals 22077 151.18 2.0122 INE334L01012 Ujjivan Financial Services Ltd Finance 32300 144.49 1.9223 INE457F01013 Salzer Electronics Ltd Industrial Capital Goods 65785 138.08 1.8424 INE312H01016 INOX Leisure Ltd Media & Entertainment 49967 131.11 1.7425 INE612J01015 Repco Home Finance Ltd Finance 15239 124.56 1.6626 INE878A01011 GE Power India Ltd Industrial Capital Goods 21931 120.77 1.6127 INE415A01038 HSIL Ltd Consumer Durables 34942 118.80 1.5828 INE260B01028 Godfrey Philips Ltd Consumer Non Durables 8939 115.01 1.5329 INE686A01026 ITD Cementation India Ltd Construction 78260 110.35 1.4730 INE294B01019 Swaraj Mazda Ltd Auto 8516 108.04 1.4431 INE793A01012 Accelya Kale Solution Ltd Software 7427 99.53 1.3232 INE274B01011 Monsanto India Ltd Pesticides 3819 91.30 1.2133 INE287B01021 Subros Ltd Auto Ancillaries 70450 89.58 1.1934 INE116C01012 Z F Steering Gear (India) Ltd Auto Ancillaries 5324 79.91 1.0635 INE258A01016 BEML Ltd Industrial Capital Goods 9052 79.30 1.0536 INE201K01015 SQS India BFSI Ltd Software 9099 77.45 1.0337 INE517F01014 Gujarat Pipavav Port Ltd Transportation 42629 74.17 0.9938 INE322A01010 Gillette India Ltd Consumer Non Durables 1650 71.61 0.9539 INE070I01018 Insecticides India Ltd Pesticides 15157 70.45 0.9440 INE717A01029 Kennametal India Ltd Industrial Products 9837 62.09 0.8341 INE278M01019 Navkar Corporation Ltd Transportation 32139 59.79 0.8042 INE189B01011 INEOS Styrolution India Ltd Industrial Products 10270 59.62 0.7943 INE089C01029 Sterlite Technologies Ltd Industrial Products 60706 48.38 0.6444 INE268C01029 Easun Reyrolle Ltd Industrial Capital Goods 151399 44.21 0.5945 INE934S01014 GNA Axles Ltd Auto Ancillaries 9105 20.78 0.28 Total for Equity & Equity Related 7283.06 96.87
(B) Money Market Instruments 1 Reverse Repo 232.00 3.09 Total for Money Market Instruments 232.00 3.09 Cash and Other Net Current Assets 3.01 0.04 Grand Total 7518.07 100.00Notesa) Total NPA's provided for and its percentage to NAV - Nil b) Total value and percentage of illiquid equity shares - Nil c) NAV per unit (` per unit)
Direct plan Regular plan Options 31/03/2016 30/09/2016 31/03/2016 30/09/2016Growth 23.5015 27.5176 22.8999 26.7623 Dividend 14.4703 16.4374 13.9905 15.8448d) Dividend declared during the period (` per unit) Option Direct plan Regular PlanDividend 0.50 0.50e) Total outstanding exposure in derivative instruments at the end of the period - Nilf) Total investments in foreign securities /ADR'S/GDR'S at the end of the period - Nilg) Portfolio Turnover Ratio - 6.67%h) Repo in corporate debt - Nil
SUNDARAM SELECT MICRO CAP - SERIES III
Sl No ISIN Code Name of the instrument Industry/Rating Quantity Mkt Value % of ` in Lakhs NAV A) Equity & Equity Related a) Listed / awaiting listing on Stock Exchange 1 INE782A01015 Johnson Controls Hitachi AirConditioning India LtdConsumer Durables 20463 332.17 5.292 INE325A01013 Timken India Ltd Industrial Products 53194 293.84 4.683 INE578A01017 Heidelberg Cement India Ltd Cement 211095 278.01 4.434 INE536A01023 Grindwell Norton Ltd Industrial Products 77774 262.29 4.185 INE999A01015 KSB Pumps Ltd Industrial Products 41959 248.75 3.966 INE280B01018 Elantas Beck India Ltd Chemicals 14212 234.97 3.747 INE671A01010 Honeywell Automation India Ltd Industrial Capital Goods 2445 226.53 3.618 INE823G01014 J K Cements Ltd Cement 25745 225.46 3.599 INE839M01018 Schneider Electric Infrastructure Ltd Industrial Capital Goods 153788 211.46 3.3710 INE177A01018 Ingersoll-Rand India Ltd Industrial Products 29572 210.86 3.3611 INE373A01013 BASF India Ltd Chemicals 17282 209.02 3.3312 INE349A01021 NRB Bearings Ltd Industrial Products 159475 201.26 3.2013 INE045A01017 Ador Welding Ltd Industrial Products 75254 200.59 3.1914 INE536H01010 Mahindra CIE Automotive Ltd Industrial Products 94033 180.45 2.8715 INE472A01039 Blue Star Ltd Consumer Durables 29053 159.22 2.5316 INE386A01015 Vesuvius India Ltd Industrial Products 15412 153.71 2.4517 INE503A01015 DCB Ltd Banks 122716 153.58 2.4418 INE462A01022 Bayer Cropscience Ltd Pesticides 3084 137.91 2.2019 INE142I01023 Take Solutions Ltd Software 82193 137.55 2.1920 INE533A01012 Good Year (I) Ltd Auto Ancillaries 19371 133.51 2.1321 INE234A01025 Novartis India Ltd Pharmaceuticals 18597 127.35 2.0322 INE334L01012 Ujjivan Financial Services Ltd Finance 27000 120.78 1.9223 INE457F01013 Salzer Electronics Ltd Industrial Capital Goods 55216 115.90 1.8424 INE312H01016 INOX Leisure Ltd Media & Entertainment 41580 109.11 1.7425 INE612J01015 Repco Home Finance Ltd Finance 12926 105.66 1.6826 INE878A01011 GE Power India Ltd Industrial Capital Goods 18444 101.57 1.6227 INE415A01038 HSIL Ltd Consumer Durables 29375 99.88 1.5928 INE260B01028 Godfrey Philips Ltd Consumer Non Durables 7525 96.82 1.5429 INE686A01026 ITD Cementation India Ltd Construction 65554 92.43 1.4730 INE294B01019 Swaraj Mazda Ltd Auto 7087 89.91 1.4331 INE793A01012 Accelya Kale Solution Ltd Software 6236 83.57 1.3332 INE287B01021 Subros Ltd Auto Ancillaries 59022 75.05 1.1933 INE274B01011 Monsanto India Ltd Pesticides 3035 72.55 1.1534 INE116C01012 Z F Steering Gear (India) Ltd Auto Ancillaries 4407 66.15 1.0535 INE201K01015 SQS India BFSI Ltd Software 7591 64.61 1.0336 INE517F01014 Gujarat Pipavav Port Ltd Transportation 35618 61.98 0.9937 INE258A01016 BEML Ltd Industrial Capital Goods 6870 60.18 0.9638 INE322A01010 Gillette India Ltd Consumer Non Durables 1381 59.93 0.9539 INE070I01018 Insecticides India Ltd Pesticides 12800 59.49 0.9540 INE189B01011 INEOS Styrolution India Ltd Industrial Products 9097 52.81 0.8441 INE717A01029 Kennametal India Ltd Industrial Products 8242 52.02 0.8342 INE278M01019 Navkar Corporation Ltd Transportation 26925 50.09 0.8043 INE089C01029 Sterlite Technologies Ltd Industrial Products 50531 40.27 0.6444 INE268C01029 Easun Reyrolle Ltd Industrial Capital Goods 124526 36.36 0.5845 INE934S01014 GNA Axles Ltd Auto Ancillaries 7479 17.07 0.27 Total for Equity & Equity Related 6102.71 97.14 (B) Money Market Instruments 1 Reverse Repo 177.00 2.82 Total for Money Market Instruments 177.00 2.82 Cash and Other Net Current Assets 2.30 0.04 Grand Total 6282.01 100.00Notesa) Total NPA's provided for and its percentage to NAV - Nil b) Total value and percentage of illiquid equity shares - Nil c) NAV per unit (` per unit)
Direct plan Regular plan Options 31/03/2016 30/09/2016 31/03/2016 30/09/2016Growth 23.0032 26.9483 22.4433 26.2431 Dividend 14.1461 16.0663 13.6955 15.5086d) Dividend declared during the period (` per unit)Option Direct plan Regular PlanDividend 0.50 0.50e) Total outstanding exposure in derivative instruments at the end of the period - Nilf) Total investments in foreign securities /ADR'S/GDR'S at the end of the period - Nilg) Portfolio Turnover Ratio - 6.66%h) Repo in corporate debt - Nil
SUNDARAM SELECT MICRO CAP - SERIES IV
Sl No ISIN Code Name of the instrument Industry/Rating Quantity Mkt Value % of ` in Lakhs NAV A) Equity & Equity Related a) Listed / awaiting listing on Stock Exchange 1 INE782A01015 Johnson Controls Hitachi Air Conditioning India Ltd Consumer Durables 15357 249.28 5.292 INE325A01013 Timken India Ltd Industrial Products 39879 220.29 4.683 INE578A01017 Heidelberg Cement India Ltd Cement 158195 208.34 4.424 INE536A01023 Grindwell Norton Ltd Industrial Products 58274 196.53 4.175 INE999A01015 KSB Pumps Ltd Industrial Products 31513 186.82 3.976 INE280B01018 Elantas Beck India Ltd Chemicals 10641 175.93 3.747 INE823G01014 J K Cements Ltd Cement 19371 169.64 3.608 INE177A01018 Ingersoll-Rand India Ltd Industrial Products 22750 162.22 3.459 INE671A01010 Honeywell Automation India Ltd Industrial Capital Goods 1719 159.27 3.3810 INE839M01018 Schneider Electric Infrastructure Ltd Industrial Capital Goods 115586 158.93 3.3811 INE373A01013 BASF India Ltd Chemicals 13074 158.12 3.3612 INE349A01021 NRB Bearings Ltd Industrial Products 119729 151.10 3.2113 INE045A01017 Ador Welding Ltd Industrial Products 56612 150.90 3.2014 INE536H01010 Mahindra CIE Automotive Ltd Industrial Products 70759 135.79 2.8815 INE503A01015 DCB Ltd Banks 93960 117.59 2.5016 INE472A01039 Blue Star Ltd Consumer Durables 20972 114.94 2.4417 INE386A01015 Vesuvius India Ltd Industrial Products 11389 113.59 2.4118 INE142I01023 Take Solutions Ltd Software 61800 103.42 2.2019 INE462A01022 Bayer Cropscience Ltd Pesticides 2311 103.34 2.1920 INE533A01012 Good Year (I) Ltd Auto Ancillaries 14609 100.69 2.1421 INE234A01025 Novartis India Ltd Pharmaceuticals 13999 95.87 2.0422 INE334L01012 Ujjivan Financial Services Ltd Finance 20300 90.81 1.9323 INE457F01013 Salzer Electronics Ltd Industrial Capital Goods 41634 87.39 1.8624 INE312H01016 INOX Leisure Ltd Media & Entertainment 31434 82.48 1.7525 INE878A01011 GE Power India Ltd Industrial Capital Goods 13747 75.70 1.6126 INE415A01038 HSIL Ltd Consumer Durables 22160 75.34 1.6027 INE686A01026 ITD Cementation India Ltd Construction 49334 69.56 1.4828 INE294B01019 Swaraj Mazda Ltd Auto 5336 67.70 1.4429 INE260B01028 Godfrey Philips Ltd Consumer Non Durables 5169 66.50 1.4130 INE612J01015 Repco Home Finance Ltd Finance 8092 66.14 1.4031 INE793A01012 Accelya Kale Solution Ltd Software 4664 62.50 1.3332 INE287B01021 Subros Ltd Auto Ancillaries 43857 55.76 1.1833 INE116C01012 Z F Steering Gear (India) Ltd Auto Ancillaries 3391 50.90 1.0834 INE201K01015 SQS India BFSI Ltd Software 5707 48.58 1.0335 INE274B01011 Monsanto India Ltd Pesticides 1996 47.72 1.0136 INE517F01014 Gujarat Pipavav Port Ltd Transportation 26696 46.45 0.9937 INE070I01018 Insecticides India Ltd Pesticides 9800 45.55 0.9738 INE322A01010 Gillette India Ltd Consumer Non Durables 1035 44.92 0.9539 INE189B01011 INEOS Styrolution India Ltd Industrial Products 6753 39.20 0.83
40 INE717A01029 Kennametal India Ltd Industrial Products 6202 39.15 0.8341 INE278M01019 Navkar Corporation Ltd Transportation 20193 37.57 0.8042 INE258A01016 BEML Ltd Industrial Capital Goods 4213 36.91 0.7843 INE089C01029 Sterlite Technologies Ltd Industrial Products 38477 30.67 0.6544 INE268C01029 Easun Reyrolle Ltd Industrial Capital Goods 91095 26.60 0.5645 INE934S01014 GNA Axles Ltd Auto Ancillaries 5693 12.99 0.28 Total for Equity & Equity Related 4539.71 96.41 (B) Money Market Instruments 1 Reverse Repo 164.00 3.48 Total for Money Market Instruments 164.00 3.48 Cash and Other Net Current Assets 4.99 0.11 Grand Total 4708.70 100.00Notesa) Total NPA's provided for and its percentage to NAV - Nil b) Total value and percentage of illiquid equity shares - Nil c) NAV per unit (` per unit)
Direct plan Regular plan Options 31/03/2016 30/09/2016 31/03/2016 30/09/2016Growth 21.8252 25.5626 21.3168 24.9225 Dividend 12.9306 14.6387 12.5307 14.1443d) Dividend declared during the period (` per unit)Option Direct plan Regular PlanDividend 0.50 0.50e) Total outstanding exposure in derivative instruments at the end of the period - Nilf) Total investments in foreign securities /ADR'S/GDR'S at the end of the period -Nilg) Portfolio Turnover Ratio - 9.73%h) Repo in corporate debt - Nil
SUNDARAM SELECT MICRO CAP - SERIES V
Sl No ISIN Code Name of the instrument Industry/Rating Quantity Mkt Value % of ` in Lakhs NAV A) Equity & Equity Related a) Listed / awaiting listing on Stock Exchange 1 INE951I01027 V Guard Industries Ltd Industrial Capital Goods 511926 940.41 4.942 INE049A01027 Himatsingka Seide Ltd Textile Products 332896 894.16 4.703 INE191H01014 PVR Ltd Media & Entertainment 66295 785.73 4.134 INE823G01014 J K Cements Ltd Cement 85394 747.84 3.935 INE472A01039 Blue Star Ltd Consumer Durables 133613 732.27 3.856 INE348B01021 Century Plyboards (India) Ltd Consumer Durables 289356 724.98 3.817 INE978A01019 Heritage Foods Ltd Consumer Non Durables 73873 634.16 3.338 INE383A01012 The India Cements Ltd Cement 438972 632.12 3.329 INE048G01018 Navin Flourine International Ltd Chemicals 27839 618.94 3.2510 INE536A01023 Grindwell Norton Ltd Industrial Products 172304 581.10 3.0511 INE325A01013 Timken India Ltd Industrial Products 100421 554.73 2.9112 INE384A01010 Rane Holdings Ltd Finance 66016 538.43 2.8313 INE442H01029 Ashoka Buildcon Ltd Construction Project 315606 537.95 2.8314 INE503A01015 DCB Ltd Banks 373773 467.78 2.4615 INE074A01025 Praj Industries Ltd Industrial Capital Goods 552507 449.19 2.3616 INE227C01017 M M Forgings Ltd Industrial Products 105166 441.22 2.3217 INE224A01026 Greaves Cotton Ltd Industrial Products 297975 387.07 2.0318 INE415A01038 HSIL Ltd Consumer Durables 113793 386.90 2.0319 INE126A01031 EID Parry India Ltd Fertilisers 155084 382.28 2.0120 INE045A01017 Ador Welding Ltd Industrial Products 142957 381.05 2.0021 INE195J01029 PNC Infratech Ltd Construction 307425 358.00 1.8822 INE612J01015 Repco Home Finance Ltd Finance 43096 352.27 1.8523 INE501G01024 HT Media Ltd Media & Entertainment 413872 345.58 1.8224 INE334L01012 Ujjivan Financial Services Ltd Finance 77000 344.46 1.8125 INE457F01013 Salzer Electronics Ltd Industrial Capital Goods 156243 327.95 1.7226 INE378D01032 Madhucon Projects Ltd Construction 723583 305.71 1.6127 INE286K01024 Techno Electric & Engineering Company Ltd Construction Project 94756 282.80 1.4928 INE621L01012 Texmaco Rail and Engineering Ltd Industrial Capital Goods 261764 278.26 1.4629 INE631A01022 Shanti Gears Ltd Auto Ancillaries 231109 277.68 1.4630 INE878A01011 GE Power India Ltd Industrial Capital Goods 49225 271.08 1.4231 INE387A01021 Sundaram Fasteners Ltd Auto Ancillaries 87068 254.02 1.3332 INE999A01015 KSB Pumps Ltd Industrial Products 41575 246.48 1.3033 INE863B01011 Premier Explosives Ltd Chemicals 69506 233.61 1.2334 INE142I01023 Take Solutions Ltd Software 137000 229.27 1.2035 INE287B01021 Subros Ltd Auto Ancillaries 176185 224.02 1.1836 INE578A01017 Heidelberg Cement India Ltd Cement 168897 222.44 1.1737 INE877F01012 Power Trading Corporation Ltd Power 274544 204.40 1.0738 INE765D01014 WPIL Ltd Industrial Products 54677 197.11 1.0439 INE116C01012 Z F Steering Gear (India) Ltd Auto Ancillaries 12806 192.21 1.0140 INE517F01014 Gujarat Pipavav Port Ltd Transportation 108659 189.07 0.9941 INE852F01015 Gateway Distriparks Ltd Transportation 75000 188.78 0.9942 INE782A01015 Johnson Controls Hitachi Air Conditioning India Ltd Consumer Durables 10248 166.35 0.8743 INE089C01029 Sterlite Technologies Ltd Industrial Products 208674 166.31 0.8744 INE070I01018 Insecticides India Ltd Pesticides 35500 165.00 0.8745 INE278M01019 Navkar Corporation Ltd Transportation 87276 162.38 0.8546 INE181G01025 Gammon Infrastructure Projects Ltd Construction Project 2698834 125.50 0.6647 INE717A01029 Kennametal India Ltd Industrial Products 15369 97.01 0.5148 INE934S01014 GNA Axles Ltd Auto Ancillaries 24393 55.66 0.2949 INE686A01026 ITD Cementation India Ltd Construction 32692 46.10 0.24 Total for Equity & Equity Related 18327.79 96.30 (B) Money Market Instruments 1 Reverse Repo 752.00 3.95 Total for Money Market Instruments 752.00 3.95 Cash and Other Net Current Assets (47.66) (0.25) Grand Total 19032.12 100.00Notesa) Total NPA's provided for and its percentage to NAV - Nil b) Total value and percentage of illiquid equity shares - Nil c) NAV per unit (` per unit)
Direct plan Regular plan Options 31/03/2016 30/09/2016 31/03/2016 30/09/2016Growth 13.4716 16.6736 13.2259 16.3368 Dividend 12.0481 14.3962 11.8069 14.0686d) Dividend declared during the period (` per unit) Option Direct plan Regular PlanDividend 0.50 0.50e) Total outstanding exposure in derivative instruments at the end of the period - Nilf) Total investments in foreign securities /ADR'S/GDR'S at the end of the period -Nilg) Portfolio Turnover Ratio - 9.37%h) Repo in corporate debt - Nil
SUNDARAM SELECT MICRO CAP - SERIES VI
Sl No ISIN Code Name of the instrument Industry/Rating Quantity Mkt Value % of ` in Lakhs NAV A) Equity & Equity Related a) Listed / awaiting listing on Stock Exchange 1 INE951I01027 V Guard Industries Ltd Industrial Capital Goods 754795 1386.56 4.952 INE049A01027 Himatsingka Seide Ltd Textile Products 492319 1322.37 4.723 INE191H01014 PVR Ltd Media & Entertainment 97552 1156.19 4.134 INE348B01021 Century Plyboards (India) Ltd Consumer Durables 433385 1085.85 3.875 INE823G01014 J K Cements Ltd Cement 123733 1083.59 3.876 INE472A01039 Blue Star Ltd Consumer Durables 196681 1077.91 3.857 INE325A01013 Timken India Ltd Industrial Products 172211 951.29 3.398 INE978A01019 Heritage Foods Ltd Consumer Non Durables 108790 933.91 3.339 INE383A01012 The India Cements Ltd Cement 646172 930.49 3.3210 INE048G01018 Navin Flourine International Ltd Chemicals 41024 912.09 3.2511 INE536A01023 Grindwell Norton Ltd Industrial Products 260000 876.85 3.1312 INE384A01010 Rane Holdings Ltd Finance 97302 793.60 2.8313 INE442H01029 Ashoka Buildcon Ltd Construction Project 460000 784.07 2.8014 INE503A01015 DCB Ltd Banks 546975 684.54 2.4415 INE074A01025 Praj Industries Ltd Industrial Capital Goods 832099 676.50 2.4116 INE227C01017 M M Forgings Ltd Industrial Products 140977 591.47 2.1117 INE126A01031 EID Parry India Ltd Fertilisers 239838 591.20 2.1118 INE224A01026 Greaves Cotton Ltd Industrial Products 437769 568.66 2.0319 INE045A01017 Ador Welding Ltd Industrial Products 212328 565.96 2.0220 INE415A01038 HSIL Ltd Consumer Durables 160708 546.41 1.9521 INE195J01029 PNC Infratech Ltd Construction 463350 539.57 1.9322 INE612J01015 Repco Home Finance Ltd Finance 64744 529.22 1.8923 INE501G01024 HT Media Ltd Media & Entertainment 608660 508.23 1.8124 INE334L01012 Ujjivan Financial Services Ltd Finance 113400 507.29 1.8125 INE457F01013 Salzer Electronics Ltd Industrial Capital Goods 221263 464.43 1.6626 INE378D01032 Madhucon Projects Ltd Construction 1063320 449.25 1.6027 INE286K01024 Techno Electric & Engineering Company Ltd Construction Project 139314 415.78 1.4828 INE621L01012 Texmaco Rail and Engineering Ltd Industrial Capital Goods 389483 414.02 1.4829 INE631A01022 Shanti Gears Ltd Auto Ancillaries 339944 408.44 1.46
www.sundarammutual.com
Half-yearly Portfolio Statement of the Schemes of Sundaram Mutual Fund for the period ended September 30, 2016 (Page 4)
30 INE878A01011 GE Power India Ltd Industrial Capital Goods 70385 387.61 1.3831 INE387A01021 Sundaram Fasteners Ltd Auto Ancillaries 127800 372.86 1.3332 INE863B01011 Premier Explosives Ltd Chemicals 105720 355.32 1.2733 INE877F01012 Power Trading Corporation Ltd Power 470848 350.55 1.2534 INE142I01023 Take Solutions Ltd Software 200000 334.70 1.1935 INE287B01021 Subros Ltd Auto Ancillaries 259592 330.07 1.1836 INE578A01017 Heidelberg Cement India Ltd Cement 248650 327.47 1.1737 INE999A01015 KSB Pumps Ltd Industrial Products 53749 318.65 1.1438 INE765D01014 WPIL Ltd Industrial Products 80249 289.30 1.0339 INE116C01012 Z F Steering Gear (India) Ltd Auto Ancillaries 18864 283.14 1.0140 INE852F01015 Gateway Distriparks Ltd Transportation 111209 279.91 1.0041 INE517F01014 Gujarat Pipavav Port Ltd Transportation 160019 278.43 0.9942 INE782A01015 Johnson Controls Hitachi Air Conditioning India Ltd Consumer Durables 15106 245.21 0.8743 INE089C01029 Sterlite Technologies Ltd Industrial Products 307050 244.72 0.8744 INE070I01018 Insecticides India Ltd Pesticides 51600 239.84 0.8645 INE278M01019 Navkar Corporation Ltd Transportation 127215 236.68 0.8446 INE181G01025 Gammon Infrastructure Projects Ltd Construction Project 3647788 169.62 0.6147 INE717A01029 Kennametal India Ltd Industrial Products 22119 139.62 0.5048 INE934S01014 GNA Axles Ltd Auto Ancillaries 34149 77.93 0.2849 INE686A01026 ITD Cementation India Ltd Construction 48124 67.85 0.24 Total for Equity & Equity Related 27085.21 96.64 (B) Money Market Instruments 1 Reverse Repo 992.00 3.54 Total for Money Market Instruments 992.00 3.54 Cash and Other Net Current Assets (51.08) (0.18) Grand Total 28026.13 100.00Notesa) Total NPA's provided for and its percentage to NAV - Nil b) Total value and percentage of illiquid equity shares - Nil c) NAV per unit (` per unit)
Direct plan Regular plan Options 31/03/2016 30/09/2016 31/03/2016 30/09/2016Growth 11.8740 14.7055 11.6743 14.4281 Dividend 11.4337 13.6446 11.2354 13.3703d) Dividend declared during the period (` per unit) Option Direct plan Regular PlanDividend 0.50 0.50e) Total outstanding exposure in derivative instruments at the end of the period - Nilf) Total investments in foreign securities /ADR'S/GDR'S at the end of the period -Nilg) Portfolio Turnover Ratio - 9.37%h) Repo in corporate debt - Nil
SUNDARAM SELECT MICRO CAP - SERIES VII
Sl No ISIN Code Name of the instrument Industry/Rating Quantity Mkt Value % of ` in Lakhs NAV A) Equity & Equity Related a) Listed / awaiting listing on Stock Exchange 1 INE951I01027 V Guard Industries Ltd Industrial Capital Goods 405005 743.99 4.952 INE049A01027 Himatsingka Seide Ltd Textile Products 276371 742.33 4.943 INE191H01014 PVR Ltd Media & Entertainment 52281 619.63 4.124 INE348B01021 Century Plyboards (India) Ltd Consumer Durables 237852 595.94 3.965 INE472A01039 Blue Star Ltd Consumer Durables 105543 578.43 3.856 INE823G01014 J K Cements Ltd Cement 64235 562.54 3.747 INE325A01013 Timken India Ltd Industrial Products 92749 512.35 3.418 INE978A01019 Heritage Foods Ltd Consumer Non Durables 58470 501.94 3.349 INE383A01012 The India Cements Ltd Cement 346515 498.98 3.3210 INE048G01018 Navin Flourine International Ltd Chemicals 21988 488.86 3.2511 INE536A01023 Grindwell Norton Ltd Industrial Products 135230 456.06 3.0312 INE384A01010 Rane Holdings Ltd Finance 52226 425.96 2.8313 INE442H01029 Ashoka Buildcon Ltd Construction Project 248010 422.73 2.8114 INE503A01015 DCB Ltd Banks 290222 363.21 2.4215 INE074A01025 Praj Industries Ltd Industrial Capital Goods 440764 358.34 2.3816 INE126A01031 EID Parry India Ltd Fertilisers 132965 327.76 2.1817 INE415A01038 HSIL Ltd Consumer Durables 94000 319.60 2.1318 INE227C01017 M M Forgings Ltd Industrial Products 73772 309.51 2.0619 INE045A01017 Ador Welding Ltd Industrial Products 113987 303.83 2.0220 INE224A01026 Greaves Cotton Ltd Industrial Products 232741 302.33 2.0121 INE195J01029 PNC Infratech Ltd Construction 248500 289.38 1.9222 INE612J01015 Repco Home Finance Ltd Finance 34770 284.21 1.8923 INE501G01024 HT Media Ltd Media & Entertainment 326342 272.50 1.8124 INE334L01012 Ujjivan Financial Services Ltd Finance 60800 271.99 1.8125 INE457F01013 Salzer Electronics Ltd Industrial Capital Goods 118106 247.90 1.6526 INE378D01032 Madhucon Projects Ltd Construction 570672 241.11 1.6027 INE286K01024 Techno Electric & Engineering Company Ltd Construction Project 74898 223.53 1.4928 INE621L01012 Texmaco Rail and Engineering Ltd Industrial Capital Goods 210000 223.23 1.4829 INE631A01022 Shanti Gears Ltd Auto Ancillaries 182000 218.67 1.4530 INE878A01011 GE Power India Ltd Industrial Capital Goods 36998 203.75 1.3531 INE387A01021 Sundaram Fasteners Ltd Auto Ancillaries 68258 199.14 1.3232 INE863B01011 Premier Explosives Ltd Chemicals 56015 188.27 1.2533 INE142I01023 Take Solutions Ltd Software 107000 179.06 1.1934 INE999A01015 KSB Pumps Ltd Industrial Products 30000 177.86 1.1835 INE287B01021 Subros Ltd Auto Ancillaries 139154 176.93 1.1836 INE578A01017 Heidelberg Cement India Ltd Cement 133290 175.54 1.1737 INE877F01012 Power Trading Corporation Ltd Power 235733 175.50 1.1738 INE765D01014 WPIL Ltd Industrial Products 43162 155.60 1.0339 INE116C01012 Z F Steering Gear (India) Ltd Auto Ancillaries 10115 151.82 1.0140 INE852F01015 Gateway Distriparks Ltd Transportation 60166 151.44 1.0141 INE517F01014 Gujarat Pipavav Port Ltd Transportation 85878 149.43 0.9942 INE278M01019 Navkar Corporation Ltd Transportation 74181 138.01 0.9243 INE782A01015 Johnson Controls Hitachi Air Conditioning India Ltd Consumer Durables 8096 131.42 0.8744 INE070I01018 Insecticides India Ltd Pesticides 27700 128.75 0.8645 INE089C01029 Sterlite Technologies Ltd Industrial Products 143155 114.09 0.7646 INE181G01025 Gammon Infrastructure Projects Ltd Construction Project 2206440 102.60 0.6847 INE717A01029 Kennametal India Ltd Industrial Products 11873 74.94 0.5048 INE934S01014 GNA Axles Ltd Auto Ancillaries 17889 40.82 0.2749 INE686A01026 ITD Cementation India Ltd Construction 25825 36.41 0.24 Total for Equity & Equity Related 14558.24 96.80 (B) Money Market Instruments 1 Reverse Repo 507.00 3.37 Total for Money Market Instruments 507.00 3.37 Cash and Other Net Current Assets (26.27) (0.17) Grand Total 15038.97 100.00Notesa) Total NPA's provided for and its percentage to NAV - Nil b) Total value and percentage of illiquid equity shares - Nil c) NAV per unit (` per unit)
Direct plan Regular plan Options 31/03/2016 30/09/2016 31/03/2016 30/09/2016Growth 11.6954 14.4693 11.5269 14.2329 Dividend 11.2608 13.4159 11.0880 13.1756d) Dividend declared during the period (` per unit) Option Direct plan Regular PlanDividend 0.50 0.50e) Total outstanding exposure in derivative instruments at the end of the period - Nilf) Total investments in foreign securities /ADR'S/GDR'S at the end of the period -Nilg) Portfolio Turnover Ratio - 9.38%h) Repo in corporate debt - Nil
SUNDARAM SELECT MICRO CAP - SERIES VIII
Sl No ISIN Code Name of the instrument Industry/Rating Quantity Mkt Value % of ` in Lakhs NAV A) Equity & Equity Related a) Listed / awaiting listing on Stock Exchange 1 INE075I01017 Healthcare Global Enterprises Ltd Healthcare Services 254857 563.36 5.052 INE951I01027 V Guard Industries Ltd Industrial Capital Goods 273156 501.79 4.503 INE578A01017 Heidelberg Cement India Ltd Cement 362334 477.19 4.284 INE472A01039 Blue Star Ltd Consumer Durables 79082 433.41 3.895 INE120A01034 Carborundum Universal Ltd Industrial Products 144972 394.61 3.546 INE386C01029 Astra Microwave Products Ltd Telecom - Equipment & Accessories 343952 382.47 3.437 INE383A01012 The India Cements Ltd Cement 250620 360.89 3.248 INE049A01027 Himatsingka Seide Ltd Textile Products 132788 356.67 3.209 INE220B01022 Kalpataru Power Transmission Ltd Power 134934 351.50 3.1510 INE348B01021 Century Plyboards (India) Ltd Consumer Durables 126155 316.08 2.8411 INE878B01027 KEI Industries Ltd Industrial Products 259576 296.18 2.6612 INE536A01023 Grindwell Norton Ltd Industrial Products 82886 279.53 2.5113 INE631A01022 Shanti Gears Ltd Auto Ancillaries 224110 269.27 2.42
14 INE107A01015 Tamil Nadu Newsprint & Papers Ltd Paper 80719 265.97 2.3915 INE956G01038 Vatech Wabag Ltd Engineering Services 46225 253.98 2.2816 INE286K01024 Techno Electric & Engineering Company Ltd Construction Project 75088 224.10 2.0117 INE195J01029 PNC Infratech Ltd Construction 191150 222.59 2.0018 INE868B01028 NCC Ltd Construction Project 260808 214.12 1.9219 INE191H01014 PVR Ltd Media & Entertainment 18008 213.43 1.9120 INE988K01017 Equitas Holdings Ltd Finance 121437 212.09 1.9021 INE621L01012 Texmaco Rail and Engineering Ltd Industrial Capital Goods 198076 210.55 1.8922 INE501G01024 HT Media Ltd Media & Entertainment 244488 204.15 1.8323 INE686A01026 ITD Cementation India Ltd Construction 144000 203.04 1.8224 INE334L01012 Ujjivan Financial Services Ltd Finance 45100 201.75 1.8125 INE074A01025 Praj Industries Ltd Industrial Capital Goods 218747 177.84 1.6026 INE048G01018 Navin Flourine International Ltd Chemicals 7958 176.93 1.5927 INE852F01015 Gateway Distriparks Ltd Transportation 68030 171.23 1.5428 INE878A01011 GE Power India Ltd Industrial Capital Goods 30998 170.71 1.5329 INE457F01013 Salzer Electronics Ltd Industrial Capital Goods 81070 170.17 1.5330 INE877F01012 Power Trading Corporation Ltd Power 216688 161.32 1.4531 INE978A01019 Heritage Foods Ltd Consumer Non Durables 18700 160.53 1.4432 INE442H01029 Ashoka Buildcon Ltd Construction Project 90543 154.33 1.3833 INE384A01010 Rane Holdings Ltd Finance 17000 138.65 1.2434 INE041A01016 Dhampur Sugar Mills Ltd Consumer Non Durables 118688 137.08 1.2335 INE142I01023 Take Solutions Ltd Software 81000 135.55 1.2236 INE287B01021 Subros Ltd Auto Ancillaries 105038 133.56 1.2037 INE782A01015 Johnson Controls Hitachi Air Conditioning India Ltd Consumer Durables 7735 125.56 1.1338 INE863B01011 Premier Explosives Ltd Chemicals 36290 121.97 1.0939 INE227C01017 M M Forgings Ltd Industrial Products 28512 119.62 1.0740 INE116C01012 Z F Steering Gear (India) Ltd Auto Ancillaries 7851 117.84 1.0641 INE765D01014 WPIL Ltd Industrial Products 32023 115.44 1.0442 INE517F01014 Gujarat Pipavav Port Ltd Transportation 63719 110.87 0.9943 INE278M01019 Navkar Corporation Ltd Transportation 56519 105.15 0.9444 INE614A01028 Ramco Industries Ltd Cement 60656 99.72 0.8945 INE089C01029 Sterlite Technologies Ltd Industrial Products 120868 96.33 0.8646 INE070I01018 Insecticides India Ltd Pesticides 20673 96.09 0.8647 INE999A01015 KSB Pumps Ltd Industrial Products 15060 89.28 0.8048 INE378D01032 Madhucon Projects Ltd Construction 199248 84.18 0.7649 INE717A01029 Kennametal India Ltd Industrial Products 12854 81.13 0.7350 INE356A01018 MphasiS Ltd Software 12668 65.83 0.5951 INE934S01014 GNA Axles Ltd Auto Ancillaries 11382 25.97 0.2352 INE045A01017 Ador Welding Ltd Industrial Products 2263 6.03 0.05 Total for Equity & Equity Related 10757.69 96.51 (B) Money Market Instruments 1 Reverse Repo 380.00 3.41 Total for Money Market Instruments 380.00 3.41 Cash and Other Net Current Assets 9.37 0.08 Grand Total 11147.06 100.00Notesa) Total NPA's provided for and its percentage to NAV - Nil b) Total value and percentage of illiquid equity shares - Nil c) NAV per unit (` per unit)
Direct plan Regular plan Options 31/03/2016 30/09/2016 31/03/2016 30/09/2016Growth 9.6843 11.9237 9.6213 11.8691 Dividend 9.6843 11.9237 9.6213 11.8691d) Dividend declared during the period (` per unit) - Nile) Total outstanding exposure in derivative instruments at the end of the period - Nilf) Total investments in foreign securities /ADR'S/GDR'S at the end of the period -Nilg) Portfolio Turnover Ratio - 21.93%h) Repo in corporate debt - Nil
SUNDARAM SELECT MICRO CAP - SERIES IX
Sl No ISIN Code Name of the instrument Industry/Rating Quantity Mkt Value % of ` in Lakhs NAV A) Equity & Equity Related a) Listed / awaiting listing on Stock Exchange 1 INE075I01017 Healthcare Global Enterprises Ltd Healthcare Services 152317 336.70 5.092 INE951I01027 V Guard Industries Ltd Industrial Capital Goods 162068 297.72 4.503 INE578A01017 Heidelberg Cement India Ltd Cement 215122 283.32 4.284 INE472A01039 Blue Star Ltd Consumer Durables 46860 256.82 3.885 INE120A01034 Carborundum Universal Ltd Industrial Products 86060 234.26 3.546 INE386C01029 Astra Microwave Products Ltd Telecom - Equipment & Accessories 204184 227.05 3.437 INE383A01012 The India Cements Ltd Cement 148446 213.76 3.238 INE049A01027 Himatsingka Seide Ltd Textile Products 78951 212.06 3.219 INE220B01022 Kalpataru Power Transmission Ltd Power 80133 208.75 3.1610 INE348B01021 Century Plyboards (India) Ltd Consumer Durables 74800 187.41 2.8311 INE878B01027 KEI Industries Ltd Industrial Products 153931 175.64 2.6612 INE536A01023 Grindwell Norton Ltd Industrial Products 49226 166.01 2.5113 INE631A01022 Shanti Gears Ltd Auto Ancillaries 136042 163.45 2.4714 INE107A01015 Tamil Nadu Newsprint & Papers Ltd Paper 47833 157.61 2.3815 INE956G01038 Vatech Wabag Ltd Engineering Services 27444 150.79 2.2816 INE286K01024 Techno Electric & Engineering Company Ltd Construction Project 44658 133.28 2.0217 INE195J01029 PNC Infratech Ltd Construction 113955 132.70 2.0118 INE868B01028 NCC Ltd Construction Project 154683 126.99 1.9219 INE191H01014 PVR Ltd Media & Entertainment 10681 126.59 1.9120 INE621L01012 Texmaco Rail and Engineering Ltd Industrial Capital Goods 117424 124.82 1.8921 INE988K01017 Equitas Holdings Ltd Finance 70055 122.35 1.8522 INE501G01024 HT Media Ltd Media & Entertainment 144945 121.03 1.8323 INE686A01026 ITD Cementation India Ltd Construction 85500 120.56 1.8224 INE334L01012 Ujjivan Financial Services Ltd Finance 26700 119.44 1.8125 INE074A01025 Praj Industries Ltd Industrial Capital Goods 129929 105.63 1.6026 INE048G01018 Navin Flourine International Ltd Chemicals 4719 104.92 1.5927 INE457F01013 Salzer Electronics Ltd Industrial Capital Goods 49040 102.93 1.5628 INE878A01011 GE Power India Ltd Industrial Capital Goods 18383 101.24 1.5329 INE852F01015 Gateway Distriparks Ltd Transportation 40109 100.95 1.5330 INE877F01012 Power Trading Corporation Ltd Power 128748 95.85 1.4531 INE978A01019 Heritage Foods Ltd Consumer Non Durables 11154 95.75 1.4532 INE442H01029 Ashoka Buildcon Ltd Construction Project 54044 92.12 1.3933 INE384A01010 Rane Holdings Ltd Finance 10000 81.56 1.2334 INE041A01016 Dhampur Sugar Mills Ltd Consumer Non Durables 70000 80.85 1.2235 INE287B01021 Subros Ltd Auto Ancillaries 62396 79.34 1.2036 INE142I01023 Take Solutions Ltd Software 47000 78.65 1.1937 INE782A01015 Johnson Controls Hitachi Air Conditioning India Ltd Consumer Durables 4593 74.56 1.1338 INE863B01011 Premier Explosives Ltd Chemicals 21541 72.40 1.0939 INE116C01012 Z F Steering Gear (India) Ltd Auto Ancillaries 4721 70.86 1.0740 INE227C01017 M M Forgings Ltd Industrial Products 16489 69.18 1.0541 INE765D01014 WPIL Ltd Industrial Products 18992 68.47 1.0442 INE614A01028 Ramco Industries Ltd Cement 40287 66.23 1.0043 INE517F01014 Gujarat Pipavav Port Ltd Transportation 37797 65.77 0.9944 INE278M01019 Navkar Corporation Ltd Transportation 33577 62.47 0.9445 INE089C01029 Sterlite Technologies Ltd Industrial Products 70738 56.38 0.8546 INE070I01018 Insecticides India Ltd Pesticides 12040 55.96 0.8547 INE999A01015 KSB Pumps Ltd Industrial Products 8931 52.95 0.8048 INE378D01032 Madhucon Projects Ltd Construction 114839 48.52 0.7349 INE717A01029 Kennametal India Ltd Industrial Products 7636 48.20 0.7350 INE356A01018 MphasiS Ltd Software 7678 39.90 0.6051 INE934S01014 GNA Axles Ltd Auto Ancillaries 6504 14.84 0.2252 INE045A01017 Ador Welding Ltd Industrial Products 1343 3.58 0.05 Total for Equity & Equity Related 6389.16 96.63 (B) Money Market Instruments 1 Reverse Repo 220.00 3.33 Total for Money Market Instruments 220.00 3.33 Cash and Other Net Current Assets 3.10 0.04 Grand Total 6612.26 100.00Notesa) Total NPA's provided for and its percentage to NAV - Nil b) Total value and percentage of illiquid equity shares - Nil c) NAV per unit (` per unit)
Direct plan Regular plan Options 31/03/2016 30/09/2016 31/03/2016 30/09/2016Growth 9.6429 11.8811 9.5872 11.8303 Dividend 9.6430 11.8811 9.5872 11.8303d) Dividend declared during the period (` per unit) - Nile) Total outstanding exposure in derivative instruments at the end of the period - Nilf) Total investments in foreign securities /ADR'S/GDR'S at the end of the period -Nilg) Portfolio Turnover Ratio - 21.65%h) Repo in corporate debt - Nil
SUNDARAM SELECT MICRO CAP - SERIES X
Sl No ISIN Code Name of the instrument Industry/Rating Quantity Mkt Value % of ` in Lakhs NAV A) Equity & Equity Related a) Listed / awaiting listing on Stock Exchange 1 INE075I01017 Healthcare Global Enterprises Ltd Healthcare Services 99136 219.14 5.122 INE951I01027 V Guard Industries Ltd Industrial Capital Goods 104797 192.51 4.503 INE578A01017 Heidelberg Cement India Ltd Cement 139351 183.53 4.294 INE472A01039 Blue Star Ltd Consumer Durables 30346 166.31 3.885 INE120A01034 Carborundum Universal Ltd Industrial Products 55567 151.25 3.536 INE386C01029 Astra Microwave Products Ltd Telecom - Equipment & Accessories 132299 147.12 3.447 INE383A01012 The India Cements Ltd Cement 96298 138.67 3.248 INE049A01027 Himatsingka Seide Ltd Textile Products 51093 137.24 3.209 INE220B01022 Kalpataru Power Transmission Ltd Power 51758 134.83 3.1510 INE348B01021 Century Plyboards (India) Ltd Consumer Durables 48531 121.59 2.8411 INE878B01027 KEI Industries Ltd Industrial Products 99827 113.90 2.6612 INE536A01023 Grindwell Norton Ltd Industrial Products 31684 106.85 2.5013 INE631A01022 Shanti Gears Ltd Auto Ancillaries 88464 106.29 2.4814 INE107A01015 Tamil Nadu Newsprint & Papers Ltd Paper 30871 101.72 2.3815 INE956G01038 Vatech Wabag Ltd Engineering Services 17295 95.03 2.2216 INE286K01024 Techno Electric & Engineering Company Ltd Construction Project 28724 85.73 2.0017 INE195J01029 PNC Infratech Ltd Construction 73375 85.45 2.0018 INE868B01028 NCC Ltd Construction Project 100549 82.55 1.9319 INE191H01014 PVR Ltd Media & Entertainment 6914 81.94 1.9120 INE621L01012 Texmaco Rail and Engineering Ltd Industrial Capital Goods 75387 80.14 1.8721 INE686A01026 ITD Cementation India Ltd Construction 56391 79.51 1.8622 INE988K01017 Equitas Holdings Ltd Finance 45360 79.22 1.8523 INE501G01024 HT Media Ltd Media & Entertainment 94002 78.49 1.8324 INE334L01012 Ujjivan Financial Services Ltd Finance 17300 77.39 1.8125 INE048G01018 Navin Flourine International Ltd Chemicals 3067 68.19 1.5926 INE074A01025 Praj Industries Ltd Industrial Capital Goods 83835 68.16 1.5927 INE878A01011 GE Power India Ltd Industrial Capital Goods 11933 65.72 1.5328 INE852F01015 Gateway Distriparks Ltd Transportation 25615 64.47 1.5129 INE978A01019 Heritage Foods Ltd Consumer Non Durables 7239 62.14 1.4530 INE877F01012 Power Trading Corporation Ltd Power 83066 61.84 1.4431 INE457F01013 Salzer Electronics Ltd Industrial Capital Goods 29411 61.73 1.4432 INE442H01029 Ashoka Buildcon Ltd Construction Project 35171 59.95 1.4033 INE041A01016 Dhampur Sugar Mills Ltd Consumer Non Durables 47000 54.29 1.2734 INE384A01010 Rane Holdings Ltd Finance 6500 53.01 1.2435 INE287B01021 Subros Ltd Auto Ancillaries 40312 51.26 1.2036 INE142I01023 Take Solutions Ltd Software 30046 50.28 1.1737 INE782A01015 Johnson Controls Hitachi Air Conditioning India Ltd Consumer Durables 2962 48.08 1.1238 INE863B01011 Premier Explosives Ltd Chemicals 13971 46.96 1.1039 INE227C01017 M M Forgings Ltd Industrial Products 10964 46.00 1.0740 INE116C01012 Z F Steering Gear (India) Ltd Auto Ancillaries 3037 45.58 1.0641 INE765D01014 WPIL Ltd Industrial Products 12309 44.37 1.0442 INE517F01014 Gujarat Pipavav Port Ltd Transportation 24467 42.57 0.9943 INE278M01019 Navkar Corporation Ltd Transportation 21447 39.90 0.9344 INE089C01029 Sterlite Technologies Ltd Industrial Products 45680 36.41 0.8545 INE070I01018 Insecticides India Ltd Pesticides 7822 36.36 0.8546 INE999A01015 KSB Pumps Ltd Industrial Products 5799 34.38 0.8047 INE717A01029 Kennametal India Ltd Industrial Products 5014 31.65 0.7448 INE356A01018 MphasiS Ltd Software 4992 25.94 0.6149 INE378D01032 Madhucon Projects Ltd Construction 60375 25.51 0.6050 INE934S01014 GNA Axles Ltd Auto Ancillaries 4878 11.13 0.2651 INE614A01028 Ramco Industries Ltd Cement 2638 4.34 0.1052 INE045A01017 Ador Welding Ltd Industrial Products 864 2.30 0.05 Total for Equity & Equity Related 4088.92 95.48 (B) Money Market Instruments 1 Reverse Repo 188.00 4.39 Total for Money Market Instruments 188.00 4.39 Cash and Other Net Current Assets 5.73 0.13 Grand Total 4282.65 100.00Notesa) Total NPA's provided for and its percentage to NAV - Nil b) Total value and percentage of illiquid equity shares - Nil c) NAV per unit (` per unit)
Direct plan Regular plan Options 31/03/2016 30/09/2016 31/03/2016 30/09/2016Growth 9.6065 11.8161 9.5720 11.7755 Dividend 9.6065 11.8161 9.5720 11.7755d) Dividend declared during the period (` per unit) - Nile) Total outstanding exposure in derivative instruments at the end of the period - Nilf) Total investments in foreign securities /ADR'S/GDR'S at the end of the period -Nilg) Portfolio Turnover Ratio - 22.16%h) Repo in corporate debt - Nil
SUNDARAM INFRASTRUCTURE ADVANTAGE FUND
Sl No ISIN Code Name of the instrument Industry/Rating Quantity Mkt Value % of ` in Lakhs NAV A) Equity & Equity Related a) Listed / awaiting listing on Stock Exchange 1 INE203G01019 Indraprastha Gas Ltd Gas 449635 3498.61 5.942 INE331A01037 The Ramco Cements Ltd Cement 544000 3238.98 5.503 INE018A01030 Larsen & Toubro Ltd Construction Project 199210 2854.98 4.854 INE918I01018 Bajaj Finserv Ltd Finance 84757 2601.66 4.425 INE671A01010 Honeywell Automation India Ltd Industrial Capital Goods 25571 2369.19 4.036 INE237A01028 Kotak Mahindra Bank Ltd Banks 286693 2227.60 3.797 INE528G01019 Yes Bank Ltd Banks 168128 2109.50 3.588 INE040A01026 HDFC Bank Ltd Banks 149541 1903.43 3.239 INE472A01039 Blue Star Ltd Consumer Durables 346742 1900.32 3.2310 INE442H01029 Ashoka Buildcon Ltd Construction Project 1088359 1855.11 3.1511 INE195J01029 PNC Infratech Ltd Construction 1442500 1679.79 2.8512 INE062A01020 State Bank Of India Ltd Banks 627413 1576.38 2.6813 INE200A01026 GE T&D India Ltd Industrial Capital Goods 418726 1402.52 2.3814 INE531A01024 Kansai Nerolac Paints Ltd Consumer Non Durables 375682 1353.02 2.3015 INE298A01020 Cummins India Ltd Industrial Products 145636 1318.73 2.2416 INE956G01038 Vatech Wabag Ltd Engineering Services 238371 1309.73 2.2317 INE220B01022 Kalpataru Power Transmission Ltd Power 500000 1302.50 2.2118 INE686A01026 ITD Cementation India Ltd Construction 850000 1198.50 2.0419 INE066P01011 INOX Wind Ltd Industrial Capital Goods 566481 1134.38 1.9320 INE415A01038 HSIL Ltd Consumer Durables 329000 1118.60 1.9021 INE090A01021 ICICI Bank Ltd Banks 411645 1037.96 1.7622 INE242A01010 Indian Oil Corporation Ltd Petroleum Products 173550 1010.93 1.7223 INE852F01015 Gateway Distriparks Ltd Transportation 401339 1010.17 1.7224 INE481G01011 UltraTech Cement Ltd Cement 26000 1001.40 1.7025 INE286K01024 Techno Electric & Engineering Company Ltd Construction Project 320000 955.04 1.6226 INE002A01018 Reliance Industries Ltd Petroleum Products 87966 953.29 1.6227 INE517F01014 Gujarat Pipavav Port Ltd Transportation 490961 854.27 1.4528 INE074A01025 Praj Industries Ltd Industrial Capital Goods 1040688 846.08 1.4429 INE001A01036 Housing Development Finance Corporation Ltd Finance 60000 836.07 1.4230 INE935O01010 Star Ferro & Cement Ltd Cement 750000 797.63 1.3631 INE070A01015 Shree Cements Ltd Cement 4502 767.26 1.3032 INE278M01019 Navkar Corporation Ltd Transportation 400000 744.20 1.2633 INE503A01015 DCB Ltd Banks 554931 694.50 1.1834 INE089C01029 Sterlite Technologies Ltd Industrial Products 858931 684.57 1.1635 INE383A01012 The India Cements Ltd Cement 472369 680.21 1.1636 INE585B01010 Maruti Suzuki India Ltd Auto 11911 652.40 1.1137 INE180A01020 Max Financial Services Ltd Finance 115798 643.37 1.0938 INE325A01013 Timken India Ltd Industrial Products 115000 635.26 1.0839 INE029A01011 Bharat Petroleum Corporation Ltd Petroleum Products 102442 627.56 1.0740 INE012A01025 ACC Ltd Cement 37508 600.07 1.0241 INE258A01016 BEML Ltd Industrial Capital Goods 61640 540.00 0.9242 INE101A01026 Mahindra & Mahindra Ltd Auto 34374 483.20 0.8243 INE536H01010 Mahindra CIE Automotive Ltd Industrial Products 240000 460.56 0.7844 INE386C01029 Astra Microwave Products Ltd Telecom - Equipment & Accessories 407685 453.35 0.7745 INE120A01034 Carborundum Universal Ltd Industrial Products 161398 439.33 0.7546 INE152A01029 Thermax Ltd Industrial Capital Goods 43071 364.04 0.6247 INE989A01024 Sanghvi Movers Ltd Industrial Capital Goods 132735 314.12 0.5348 INE010V01017 L&T Technology Services Ltd Software 34880 295.49 0.5049 INE551A01022 Hindustan Dorr Oliver Ltd Engineering Services 2267384 293.63 0.5050 INE181G01025 Gammon Infrastructure Projects Ltd Construction Project 5500000 255.75 0.4351 INE146L01010 Kirloskar Oil Engines Ltd Industrial Products 21437 71.67 0.12 Total for Equity & Equity Related 57956.89 98.48
www.sundarammutual.com
Half-yearly Portfolio Statement of the Schemes of Sundaram Mutual Fund for the period ended September 30, 2016 (Page 5)
(B) Money Market Instruments 1 CBLO 978.51 1.66 Total for Money Market Instruments 978.51 1.66 Cash and Other Net Current Assets (83.77) (0.14) Grand Total 58851.63 100.00Notesa) Total NPA's provided for and its percentage to NAV - Nil b) Total value and percentage of illiquid equity shares - Nil c) NAV per unit (` per unit)
Direct plan Regular plan Options 31/03/2016 30/09/2016 31/03/2016 30/09/2016Growth 23.4242 27.2096 23.0954 26.8001 Dividend 22.3821 25.4994 22.0607 25.0998d) Dividend declared during the period (` per unit)Option Direct plan Regular PlanDividend 0.50 0.50e) Total outstanding exposure in derivative instruments at the end of the period - Nilf) Total investments in foreign securities /ADR'S/GDR'S at the end of the period -Nilg) Portfolio Turnover Ratio - 14.08%h) Repo in corporate debt - Nil
SUNDARAM TOP 100 - SERIES I
Sl No ISIN Code Name of the instrument Industry/Rating Quantity Mkt Value % of ` in Lakhs NAV A) Equity & Equity Related a) Listed / awaiting listing on Stock Exchange 1 INE040A01026 HDFC Bank Ltd Banks 41471 527.86 7.042 INE002A01018 Reliance Industries Ltd Petroleum Products 42567 461.30 6.153 INE918I01018 Bajaj Finserv Ltd Finance 11500 353.00 4.714 INE155A01022 Tata Motors Ltd Auto 57603 308.09 4.115 INE101A01026 Mahindra & Mahindra Ltd Auto 21681 304.77 4.066 INE090A01021 ICICI Bank Ltd Banks 120730 304.42 4.067 INE154A01025 ITC Ltd Consumer Non Durables 119820 289.19 3.868 INE242A01010 Indian Oil Corporation Ltd Petroleum Products 46363 270.06 3.609 INE528G01019 Yes Bank Ltd Banks 17820 223.59 2.9810 INE733E01010 NTPC Ltd Power 141238 209.03 2.7911 INE009A01021 Infosys Ltd Software 19917 206.35 2.7512 INE237A01028 Kotak Mahindra Bank Ltd Banks 25000 194.25 2.5913 INE585B01010 Maruti Suzuki India Ltd Auto 3465 189.79 2.5314 INE062A01020 State Bank Of India Ltd Banks 74635 187.52 2.5015 INE481G01011 UltraTech Cement Ltd Cement 4646 178.94 2.3916 INE115A01026 LIC Housing Finance Ltd Finance 30570 176.94 2.3617 INE158A01026 Hero MotoCorp Ltd Auto 4891 166.96 2.2318 INE628A01036 UPL Ltd Pesticides 24272 163.56 2.1819 INE001A01036 Housing Development Finance Corporation Ltd Finance 11700 163.03 2.1720 INE238A01034 Axis Bank Ltd Banks 29711 160.84 2.1421 INE029A01011 Bharat Petroleum Corporation Ltd Petroleum Products 25830 158.23 2.1122 INE298A01020 Cummins India Ltd Industrial Products 16964 153.61 2.0523 INE012A01025 ACC Ltd Cement 9355 149.67 2.0024 INE881D01027 Oracle Financial Service Software Ltd Software 4526 145.86 1.9525 INE467B01029 Tata Consultancy Services Ltd Software 5967 145.05 1.9326 INE018A01030 Larsen & Toubro Ltd Construction Project 9983 143.07 1.9127 INE256A01028 Zee Entertainment Enterprises Ltd Media & Entertainment 23111 126.36 1.6928 INE917I01010 Bajaj Auto Ltd Auto 4369 123.54 1.6529 INE021A01026 Asian Paints Ltd Consumer Non Durables 10564 122.62 1.6430 INE361B01024 Divis Labarotories Ltd Pharmaceuticals 8746 112.89 1.5131 INE935A01035 GlenMark Pharmaceuticals Ltd Pharmaceuticals 11721 108.24 1.4432 INE510A01028 Engineers India Ltd Construction Project 42700 106.09 1.4133 INE774D01024 Mahindra & Mahindra Financial Services Ltd Finance 26996 98.35 1.3134 INE117A01022 ABB Ltd Industrial Capital Goods 8597 98.17 1.3135 INE669C01036 Tech Mahindra Ltd Software 21920 92.03 1.2336 INE192A01025 Tata Global Beverages Ltd Consumer Non Durables 64228 89.66 1.2037 INE020B01018 Rural Electrification Corporation Ltd Finance 73706 88.67 1.1838 INE263A01016 Bharat Electronics Ltd Industrial Capital Goods 5486 68.29 0.9139 INE111A01017 Container Corporation of India Ltd Transportation 4570 63.04 0.8440 INE059A01026 Cipla Ltd Pharmaceuticals 10747 62.34 0.8341 INE258A01016 BEML Ltd Industrial Capital Goods 5858 51.32 0.6842 INE589A01014 Neyveli Lignite Corporation Ltd Power 52908 38.04 0.51 Total for Equity & Equity Related 7384.62 98.48 (B) Money Market Instruments 1 Reverse Repo 133.00 1.77 Total for Money Market Instruments 133.00 1.77 Cash and Other Net Current Assets (19.17) (0.26) Grand Total 7498.45 100.00Notesa) Total NPA's provided for and its percentage to NAV - Nil b) Total value and percentage of illiquid equity shares - Nil c) NAV per unit (` per unit)
Direct plan Regular plan Options 31/03/2016 30/09/2016 31/03/2016 30/09/2016Growth 11.5317 13.3348 11.2662 13.0024 Dividend 11.0390 12.2777 10.7795 11.9535d) Dividend declared during the period (` per unit)Option Direct plan Regular PlanDividend 0.50 0.50e) Total outstanding exposure in derivative instruments at the end of the period - Nilf) Total investments in foreign securities /ADR'S/GDR'S at the end of the period -Nilg) Portfolio Turnover Ratio - 17.40%h) Repo in corporate debt - Nil
SUNDARAM TOP 100 - SERIES II
Sl No ISIN Code Name of the instrument Industry/Rating Quantity Mkt Value % of ` in Lakhs NAV A) Equity & Equity Related a) Listed / awaiting listing on Stock Exchange 1 INE040A01026 HDFC Bank Ltd Banks 23300 296.57 7.012 INE002A01018 Reliance Industries Ltd Petroleum Products 23883 258.82 6.123 INE918I01018 Bajaj Finserv Ltd Finance 6470 198.60 4.694 INE155A01022 Tata Motors Ltd Auto 32395 173.26 4.095 INE090A01021 ICICI Bank Ltd Banks 68022 171.52 4.056 INE101A01026 Mahindra & Mahindra Ltd Auto 12176 171.16 4.047 INE154A01025 ITC Ltd Consumer Non Durables 67217 162.23 3.838 INE242A01010 Indian Oil Corporation Ltd Petroleum Products 26068 151.85 3.599 INE528G01019 Yes Bank Ltd Banks 10011 125.61 2.9710 INE733E01010 NTPC Ltd Power 79367 117.46 2.7811 INE009A01021 Infosys Ltd Software 11158 115.60 2.7312 INE237A01028 Kotak Mahindra Bank Ltd Banks 14500 112.67 2.6613 INE585B01010 Maruti Suzuki India Ltd Auto 1959 107.30 2.5414 INE062A01020 State Bank Of India Ltd Banks 41996 105.51 2.4915 INE481G01011 UltraTech Cement Ltd Cement 2607 100.41 2.3716 INE115A01026 LIC Housing Finance Ltd Finance 17200 99.55 2.3517 INE628A01036 UPL Ltd Pesticides 13656 92.02 2.1718 INE238A01034 Axis Bank Ltd Banks 16685 90.32 2.1319 INE029A01011 Bharat Petroleum Corporation Ltd Petroleum Products 14552 89.15 2.1120 INE001A01036 Housing Development Finance Corporation Ltd Finance 6287 87.61 2.0721 INE158A01026 Hero MotoCorp Ltd Auto 2564 87.53 2.0722 INE298A01020 Cummins India Ltd Industrial Products 9578 86.73 2.0523 INE012A01025 ACC Ltd Cement 5256 84.09 1.9924 INE881D01027 Oracle Financial Service Software Ltd Software 2539 81.83 1.9325 INE467B01029 Tata Consultancy Services Ltd Software 3347 81.36 1.9226 INE018A01030 Larsen & Toubro Ltd Construction Project 5603 80.30 1.9027 INE256A01028 Zee Entertainment Enterprises Ltd Media & Entertainment 12989 71.02 1.6828 INE917I01010 Bajaj Auto Ltd Auto 2452 69.33 1.6429 INE021A01026 Asian Paints Ltd Consumer Non Durables 5934 68.88 1.6330 INE361B01024 Divis Labarotories Ltd Pharmaceuticals 4932 63.66 1.5031 INE935A01035 GlenMark Pharmaceuticals Ltd Pharmaceuticals 6577 60.74 1.4432 INE510A01028 Engineers India Ltd Construction Project 23953 59.51 1.4133 INE774D01024 Mahindra & Mahindra Financial Services Ltd Finance 15170 55.26 1.3134 INE117A01022 ABB Ltd Industrial Capital Goods 4830 55.15 1.3035 INE669C01036 Tech Mahindra Ltd Software 12762 53.58 1.2736 INE192A01025 Tata Global Beverages Ltd Consumer Non Durables 36094 50.39 1.1937 INE020B01018 Rural Electrification Corporation Ltd Finance 41412 49.82 1.1838 INE111A01017 Container Corporation of India Ltd Transportation 2852 39.34 0.9339 INE263A01016 Bharat Electronics Ltd Industrial Capital Goods 3081 38.35 0.9140 INE059A01026 Cipla Ltd Pharmaceuticals 6033 34.99 0.8341 INE258A01016 BEML Ltd Industrial Capital Goods 2615 22.91 0.5442 INE589A01014 Neyveli Lignite Corporation Ltd Power 28969 20.83 0.49 Total for Equity & Equity Related 4142.82 97.90
(B) Money Market Instruments 1 Reverse Repo 99.00 2.34 Total for Money Market Instruments 99.00 2.34 Cash and Other Net Current Assets (9.99) (0.24) Grand Total 4231.83 100.00Notesa) Total NPA's provided for and its percentage to NAV - Nil b) Total value and percentage of illiquid equity shares - Nil c) NAV per unit (` per unit)
Direct plan Regular plan Options 31/03/2016 30/09/2016 31/03/2016 30/09/2016Growth 11.0391 12.7732 10.7982 12.4710 Dividend 11.0391 12.2857 10.7982 11.9836d) Dividend declared during the period (` per unit)Option Direct plan Regular PlanDividend 0.50 0.50e) Total outstanding exposure in derivative instruments at the end of the period - Nilf) Total investments in foreign securities /ADR'S/GDR'S at the end of the period -Nilg) Portfolio Turnover Ratio - 17.3%h) Repo in corporate debt - Nil
SUNDARAM TOP 100 - SERIES III
Sl No ISIN Code Name of the instrument Industry/Rating Quantity Mkt Value % of ` in Lakhs NAV A) Equity & Equity Related a) Listed / awaiting listing on Stock Exchange 1 INE040A01026 HDFC Bank Ltd Banks 28360 360.98 7.062 INE002A01018 Reliance Industries Ltd Petroleum Products 28994 314.21 6.143 INE918I01018 Bajaj Finserv Ltd Finance 7850 240.96 4.714 INE155A01022 Tata Motors Ltd Auto 39398 210.72 4.125 INE090A01021 ICICI Bank Ltd Banks 82688 208.50 4.086 INE101A01026 Mahindra & Mahindra Ltd Auto 14788 207.87 4.067 INE154A01025 ITC Ltd Consumer Non Durables 81811 197.45 3.868 INE242A01010 Indian Oil Corporation Ltd Petroleum Products 31692 184.61 3.619 INE528G01019 Yes Bank Ltd Banks 12167 152.66 2.9910 INE733E01010 NTPC Ltd Power 96476 142.78 2.7911 INE009A01021 Infosys Ltd Software 13593 140.83 2.7512 INE237A01028 Kotak Mahindra Bank Ltd Banks 17400 135.20 2.6413 INE585B01010 Maruti Suzuki India Ltd Auto 2356 129.05 2.5214 INE062A01020 State Bank Of India Ltd Banks 51010 128.16 2.5115 INE481G01011 UltraTech Cement Ltd Cement 3160 121.71 2.3816 INE115A01026 LIC Housing Finance Ltd Finance 20810 120.45 2.3617 INE628A01036 UPL Ltd Pesticides 16583 111.74 2.1918 INE238A01034 Axis Bank Ltd Banks 20306 109.93 2.1519 INE158A01026 Hero MotoCorp Ltd Auto 3211 109.61 2.1420 INE029A01011 Bharat Petroleum Corporation Ltd Petroleum Products 17804 109.07 2.1321 INE001A01036 Housing Development Finance Corporation Ltd Finance 7743 107.89 2.1122 INE298A01020 Cummins India Ltd Industrial Products 11643 105.43 2.0623 INE012A01025 ACC Ltd Cement 6392 102.26 2.0024 INE881D01027 Oracle Financial Service Software Ltd Software 3083 99.36 1.9425 INE467B01029 Tata Consultancy Services Ltd Software 4067 98.86 1.9326 INE018A01030 Larsen & Toubro Ltd Construction Project 6804 97.51 1.9127 INE256A01028 Zee Entertainment Enterprises Ltd Media & Entertainment 15790 86.33 1.6928 INE917I01010 Bajaj Auto Ltd Auto 2982 84.32 1.6529 INE021A01026 Asian Paints Ltd Consumer Non Durables 6550 76.03 1.4930 INE935A01035 GlenMark Pharmaceuticals Ltd Pharmaceuticals 7991 73.79 1.4431 INE510A01028 Engineers India Ltd Construction Project 29136 72.39 1.4232 INE361B01024 Divis Labarotories Ltd Pharmaceuticals 5560 71.77 1.4033 INE774D01024 Mahindra & Mahindra Financial Services Ltd Finance 18442 67.18 1.3134 INE117A01022 ABB Ltd Industrial Capital Goods 5874 67.08 1.3135 INE669C01036 Tech Mahindra Ltd Software 15633 65.64 1.2836 INE192A01025 Tata Global Beverages Ltd Consumer Non Durables 43875 61.25 1.2037 INE020B01018 Rural Electrification Corporation Ltd Finance 50368 60.59 1.1838 INE263A01016 Bharat Electronics Ltd Industrial Capital Goods 3748 46.65 0.9139 INE111A01017 Container Corporation of India Ltd Transportation 3198 44.11 0.8640 INE059A01026 Cipla Ltd Pharmaceuticals 7325 42.49 0.8341 INE258A01016 BEML Ltd Industrial Capital Goods 4222 36.99 0.7242 INE589A01014 Neyveli Lignite Corporation Ltd Power 35620 25.61 0.50 Total for Equity & Equity Related 5030.02 98.35 (B) Money Market Instruments 1 Reverse Repo 95.00 1.86 Total for Money Market Instruments 95.00 1.86 Cash and Other Net Current Assets (10.85) (0.21) Grand Total 5114.16 100.00Notesa) Total NPA's provided for and its percentage to NAV - Nil b) Total value and percentage of illiquid equity shares - Nil c) NAV per unit (` per unit)
Direct plan Regular plan Options 31/03/2016 30/09/2016 31/03/2016 30/09/2016Growth 10.8111 12.4926 10.5961 12.2208 Dividend 10.8111 12.0053 10.5961 11.7337d) Dividend declared during the period (` per unit)Option Direct plan Regular PlanDividend 0.50 0.50e) Total outstanding exposure in derivative instruments at the end of the period - Nilf) Total investments in foreign securities /ADR'S/GDR'S at the end of the period -Nilg) Portfolio Turnover Ratio - 22.42%h) Repo in corporate debt - Nil
SUNDARAM TOP 100 - SERIES IV
Sl No ISIN Code Name of the instrument Industry/Rating Quantity Mkt Value % of ` in Lakhs NAV A) Equity & Equity Related a) Listed / awaiting listing on Stock Exchange 1 INE040A01026 HDFC Bank Ltd Banks 22342 284.38 6.822 INE002A01018 Reliance Industries Ltd Petroleum Products 23119 250.54 6.013 INE918I01018 Bajaj Finserv Ltd Finance 6609 202.87 4.864 INE155A01022 Tata Motors Ltd Auto 31343 167.64 4.025 INE090A01021 ICICI Bank Ltd Banks 65850 166.04 3.986 INE101A01026 Mahindra & Mahindra Ltd Auto 11697 164.42 3.947 INE154A01025 ITC Ltd Consumer Non Durables 64627 155.98 3.748 INE242A01010 Indian Oil Corporation Ltd Petroleum Products 25123 146.34 3.519 INE528G01019 Yes Bank Ltd Banks 9707 121.79 2.9210 INE733E01010 NTPC Ltd Power 76582 113.34 2.7211 INE009A01021 Infosys Ltd Software 10770 111.58 2.6812 INE361B01024 Divis Labarotories Ltd Pharmaceuticals 8518 109.95 2.6413 INE237A01028 Kotak Mahindra Bank Ltd Banks 13685 106.33 2.5514 INE585B01010 Maruti Suzuki India Ltd Auto 1931 105.77 2.5415 INE062A01020 State Bank Of India Ltd Banks 38675 97.17 2.3316 INE481G01011 UltraTech Cement Ltd Cement 2520 97.06 2.3317 INE115A01026 LIC Housing Finance Ltd Finance 16500 95.50 2.2918 INE628A01036 UPL Ltd Pesticides 13093 88.23 2.1219 INE238A01034 Axis Bank Ltd Banks 16124 87.29 2.0920 INE298A01020 Cummins India Ltd Industrial Products 9600 86.93 2.0821 INE158A01026 Hero MotoCorp Ltd Auto 2539 86.67 2.0822 INE029A01011 Bharat Petroleum Corporation Ltd Petroleum Products 14031 85.95 2.0623 INE092A01019 Tata Chemicals Ltd Chemicals 16219 85.08 2.0424 INE012A01025 ACC Ltd Cement 5061 80.97 1.9425 INE881D01027 Oracle Financial Service Software Ltd Software 2452 79.02 1.8926 INE018A01030 Larsen & Toubro Ltd Construction Project 5390 77.25 1.8527 INE256A01028 Zee Entertainment Enterprises Ltd Media & Entertainment 12563 68.69 1.6528 INE917I01010 Bajaj Auto Ltd Auto 2356 66.62 1.6029 INE510A01028 Engineers India Ltd Construction Project 23772 59.06 1.4230 INE021A01026 Asian Paints Ltd Consumer Non Durables 5037 58.46 1.4031 INE263A01016 Bharat Electronics Ltd Industrial Capital Goods 4674 58.18 1.4032 INE935A01035 GlenMark Pharmaceuticals Ltd Pharmaceuticals 6263 57.84 1.3933 INE258A01016 BEML Ltd Industrial Capital Goods 6156 53.93 1.2934 INE774D01024 Mahindra & Mahindra Financial Services Ltd Finance 14620 53.26 1.2835 INE117A01022 ABB Ltd Industrial Capital Goods 4593 52.45 1.2636 INE192A01025 Tata Global Beverages Ltd Consumer Non Durables 34741 48.50 1.1637 INE020B01018 Rural Electrification Corporation Ltd Finance 39712 47.77 1.1538 INE111A01017 Container Corporation of India Ltd Transportation 2552 35.20 0.8439 INE059A01026 Cipla Ltd Pharmaceuticals 5746 33.33 0.8040 INE589A01014 Neyveli Lignite Corporation Ltd Power 30319 21.80 0.5241 INE001A01036 Housing Development Finance Corporation Ltd Finance 600 8.36 0.20 Total for Equity & Equity Related 3977.55 95.38 (B) Money Market Instruments 1 Reverse Repo 204.00 4.89 Total for Money Market Instruments 204.00 4.89
Cash and Other Net Current Assets (11.13) (0.27) Grand Total 4170.43 100.00Notesa) Total NPA's provided for and its percentage to NAV - Nil b) Total value and percentage of illiquid equity shares - Nil c) NAV per unit (` per unit)
Direct plan Regular plan Options 31/03/2016 30/09/2016 31/03/2016 30/09/2016Growth 9.4676 11.0043 9.3844 10.8870 Dividend 9.4676 11.0043 9.3838 10.8863d) Dividend declared during the period (` per unit) - Nile) Total outstanding exposure in derivative instruments at the end of the period - Nilf) Total investments in foreign securities /ADR'S/GDR'S at the end of the period -Nilg) Portfolio Turnover Ratio - 16.18%h) Repo in corporate debt - Nil
SUNDARAM TOP 100 - SERIES V
Sl No ISIN Code Name of the instrument Industry/Rating Quantity Mkt Value % of ` in Lakhs NAV A) Equity & Equity Related a) Listed / awaiting listing on Stock Exchange 1 INE040A01026 HDFC Bank Ltd Banks 22204 282.62 6.822 INE002A01018 Reliance Industries Ltd Petroleum Products 22986 249.10 6.013 INE918I01018 Bajaj Finserv Ltd Finance 6420 197.07 4.754 INE155A01022 Tata Motors Ltd Auto 31163 166.68 4.025 INE090A01021 ICICI Bank Ltd Banks 65410 164.93 3.986 INE101A01026 Mahindra & Mahindra Ltd Auto 11641 163.64 3.957 INE154A01025 ITC Ltd Consumer Non Durables 64246 155.06 3.748 INE242A01010 Indian Oil Corporation Ltd Petroleum Products 24952 145.35 3.519 INE528G01019 Yes Bank Ltd Banks 9648 121.05 2.9210 INE733E01010 NTPC Ltd Power 76120 112.66 2.7211 INE009A01021 Infosys Ltd Software 10724 111.11 2.6812 INE361B01024 Divis Labarotories Ltd Pharmaceuticals 8400 108.43 2.6213 INE237A01028 Kotak Mahindra Bank Ltd Banks 13585 105.56 2.5514 INE585B01010 Maruti Suzuki India Ltd Auto 1917 105.00 2.5315 INE062A01020 State Bank Of India Ltd Banks 38322 96.28 2.3216 INE481G01011 UltraTech Cement Ltd Cement 2496 96.13 2.3217 INE115A01026 LIC Housing Finance Ltd Finance 16370 94.75 2.2918 INE092A01019 Tata Chemicals Ltd Chemicals 17090 89.65 2.1619 INE628A01036 UPL Ltd Pesticides 13053 87.96 2.1220 INE158A01026 Hero MotoCorp Ltd Auto 2575 87.90 2.1221 INE298A01020 Cummins India Ltd Industrial Products 9698 87.82 2.1222 INE238A01034 Axis Bank Ltd Banks 15994 86.58 2.0923 INE029A01011 Bharat Petroleum Corporation Ltd Petroleum Products 13941 85.40 2.0624 INE012A01025 ACC Ltd Cement 5032 80.50 1.9425 INE881D01027 Oracle Financial Service Software Ltd Software 2441 78.67 1.9026 INE018A01030 Larsen & Toubro Ltd Construction Project 5350 76.67 1.8527 INE256A01028 Zee Entertainment Enterprises Ltd Media & Entertainment 12543 68.58 1.6528 INE917I01010 Bajaj Auto Ltd Auto 2343 66.25 1.6029 INE510A01028 Engineers India Ltd Construction Project 23645 58.75 1.4230 INE263A01016 Bharat Electronics Ltd Industrial Capital Goods 4716 58.70 1.4231 INE021A01026 Asian Paints Ltd Consumer Non Durables 5021 58.28 1.4132 INE935A01035 GlenMark Pharmaceuticals Ltd Pharmaceuticals 6239 57.61 1.3933 INE774D01024 Mahindra & Mahindra Financial Services Ltd Finance 14532 52.94 1.2834 INE117A01022 ABB Ltd Industrial Capital Goods 4550 51.96 1.2535 INE258A01016 BEML Ltd Industrial Capital Goods 5813 50.92 1.2336 INE192A01025 Tata Global Beverages Ltd Consumer Non Durables 34529 48.20 1.1637 INE020B01018 Rural Electrification Corporation Ltd Finance 39658 47.71 1.1538 INE111A01017 Container Corporation of India Ltd Transportation 2516 34.71 0.8439 INE059A01026 Cipla Ltd Pharmaceuticals 5734 33.26 0.8040 INE589A01014 Neyveli Lignite Corporation Ltd Power 30131 21.66 0.52 Total for Equity & Equity Related 3946.10 95.19 (B) Money Market Instruments 1 Reverse Repo 210.00 5.07 Total for Money Market Instruments 210.00 5.07 Cash and Other Net Current Assets (10.61) (0.26) Grand Total 4145.48 100.00Notesa) Total NPA's provided for and its percentage to NAV - Nil b) Total value and percentage of illiquid equity shares - Nil c) NAV per unit (` per unit)
Direct plan Regular plan Options 31/03/2016 30/09/2016 31/03/2016 30/09/2016Growth 9.2144 10.7105 9.1575 10.6246 Dividend 9.2144 10.7105 9.1575 10.6246d) Dividend declared during the period (` per unit) - Nile) Total outstanding exposure in derivative instruments at the end of the period - Nilf) Total investments in foreign securities /ADR'S/GDR'S at the end of the period -Nilg) Portfolio Turnover Ratio - 15.96%h) Repo in corporate debt - Nil
SUNDARAM VALUE FUND - SERIES I
Sl No ISIN Code Name of the instrument Industry/Rating Quantity Mkt Value % of ` in Lakhs NAV A) Equity & Equity Related a) Listed / awaiting listing on Stock Exchange 1 INE348B01021 Century Plyboards (India) Ltd Consumer Durables 250000 626.38 5.592 INE105A01035 Sundaram Clayton Ltd Auto Ancillaries 21000 541.44 4.833 INE383A01012 The India Cements Ltd Cement 350323 504.47 4.504 INE121A01016 Cholamandalam Investment & Finance Company Ltd Finance 42359 490.24 4.375 INE707A01012 Vindhya Telelinks Ltd Telecom - Equipment & Accessories 79000 472.62 4.216 INE048G01018 Navin Flourine International Ltd Chemicals 18112 402.68 3.597 INE939A01011 Strides Shasun Ltd Pharmaceuticals 40000 402.38 3.598 INE825A01012 Vardhman Textiles Ltd Textiles - Cotton 31181 332.19 2.969 INE107A01015 Tamil Nadu Newsprint & Papers Ltd Paper 100755 331.99 2.9610 INE891D01026 Redington (India) Ltd Trading 309995 320.53 2.8611 INE349A01021 NRB Bearings Ltd Industrial Products 250967 316.72 2.8212 INE774D01024 Mahindra & Mahindra Financial Services Ltd Finance 85000 309.66 2.7613 INE036D01010 Karur Vysya Bank Ltd Banks 62225 292.12 2.6014 INE386C01029 Astra Microwave Products Ltd Telecom - Equipment & Accessories 246000 273.55 2.4415 INE858B01011 ISGEC Heavy Engineering Ltd Industrial Capital Goods 6000 270.64 2.4116 INE415A01038 HSIL Ltd Consumer Durables 75100 255.34 2.2817 INE647A01010 SRF LTD Textile Products 14000 248.88 2.2218 INE337A01034 LG Balakrishnan Bros Ltd Auto Ancillaries 43068 242.30 2.1619 INE177A01018 Ingersoll-Rand India Ltd Industrial Products 33670 240.08 2.1420 INE628A01036 UPL Ltd Pesticides 34666 233.60 2.0821 INE287B01021 Subros Ltd Auto Ancillaries 175621 223.30 1.9922 INE034A01011 Arvind Ltd Textile Products 64781 218.38 1.9523 INE041A01016 Dhampur Sugar Mills Ltd Consumer Non Durables 176000 203.28 1.8124 INE378D01032 Madhucon Projects Ltd Construction 479048 202.40 1.8025 INE050A01025 Bombay Burmah Trading Corporation Ltd Consumer Non Durables 33997 194.07 1.7326 INE716A01013 Whirlpool of India Ltd Consumer Durables 18429 187.48 1.6727 INE203G01019 Indraprastha Gas Ltd Gas 21899 170.40 1.5228 INE614A01028 Ramco Industries Ltd Cement 103277 169.79 1.5129 INE220B01022 Kalpataru Power Transmission Ltd Power 50000 130.25 1.1630 INE075I01017 Healthcare Global Enterprises Ltd Healthcare Services 58577 129.48 1.1531 INE611L01021 Indian Terrain Fashions Ltd Textile Products 84503 124.85 1.1132 INE164A01016 Balmer Lawrie & Company Ltd Transportation 17876 120.59 1.0833 INE791I01019 Brigade Enterprises Ltd Construction 66666 115.70 1.0334 INE878A01011 GE Power India Ltd Industrial Capital Goods 20860 114.88 1.0235 INE113A01013 Gujarat Narmada Valley Fertilizers and Chemicals Ltd Chemicals 64145 113.99 1.0236 INE621L01012 Texmaco Rail and Engineering Ltd Industrial Capital Goods 91838 97.62 0.8737 INE089C01029 Sterlite Technologies Ltd Industrial Products 113206 90.23 0.80 Sub Total 9714.48 86.62 (b) Derivative 1 Nifty Option Dec2017 8300 CALL Index Option 95500 1055.22 9.41 Sub Total 1055.22 9.41 Total for Equity & Equity Related 10769.69 96.03 (B) Money Market Instruments 1 Reverse Repo 430.00 3.83 Total for Money Market Instruments 430.00 3.83 Cash and Other Net Current Assets 15.43 0.14 Grand Total 11215.12 100.00
www.sundarammutual.com
Half-yearly Portfolio Statement of the Schemes of Sundaram Mutual Fund for the period ended September 30, 2016 (Page 6)
Notesa) Total NPA's provided for and its percentage to NAV - Nil b) Total value and percentage of illiquid equity shares - Nil c) NAV per unit (` per unit)
Direct plan Regular plan Options 31/03/2016 30/09/2016 31/03/2016 30/09/2016Growth 9.5472 11.5080 9.4590 11.3804 Dividend 9.5472 11.5079 9.4590 11.3804d) Dividend declared during the period (` per unit) - Nil e) Total outstanding exposure in derivative instruments at the end of the period - As Per Annexure-Af) Total investments in foreign securities /ADR'S/GDR'S at the end of the period -Nilg) Portfolio Turnover Ratio - 8.87%h) Repo in corporate debt - Nil
SUNDARAM VALUE FUND - SERIES II
Sl No ISIN Code Name of the instrument Industry/Rating Quantity Mkt Value % of ` in Lakhs NAV A) Equity & Equity Related a) Listed / awaiting listing on Stock Exchange 1 INE918I01018 Bajaj Finserv Ltd Finance 5500 168.83 5.882 INE383A01012 The India Cements Ltd Cement 87326 125.75 4.383 INE707A01012 Vindhya Telelinks Ltd Telecom - Equipment & Accessories 19547 116.94 4.074 INE242A01010 Indian Oil Corporation Ltd Petroleum Products 20000 116.50 4.055 INE155A01022 Tata Motors Ltd Auto 20000 106.97 3.726 INE562A01011 Indian Bank Banks 48000 101.33 3.537 INE048G01018 Navin Flourine International Ltd Chemicals 4500 100.05 3.488 INE199G01027 Jagran Prakashan Ltd Media & Entertainment 50000 91.50 3.189 INE107A01015 Tamil Nadu Newsprint & Papers Ltd Paper 25000 82.38 2.8710 INE825A01012 Vardhman Textiles Ltd Textiles - Cotton 7518 80.09 2.7911 INE349A01021 NRB Bearings Ltd Industrial Products 62837 79.30 2.7612 INE092A01019 Tata Chemicals Ltd Chemicals 15000 78.69 2.7413 INE472A01039 Blue Star Ltd Consumer Durables 14064 77.08 2.6814 INE034A01011 Arvind Ltd Textile Products 22750 76.69 2.6715 INE510A01028 Engineers India Ltd Construction Project 30000 74.54 2.5916 INE069A01017 Aditya Birla Nuvo Ltd Services 5450 74.30 2.5917 INE287B01021 Subros Ltd Auto Ancillaries 57407 72.99 2.5418 INE224A01026 Greaves Cotton Ltd Industrial Products 50000 64.95 2.2619 INE075I01017 Healthcare Global Enterprises Ltd Healthcare Services 29309 64.79 2.2520 INE614A01028 Ramco Industries Ltd Cement 38000 62.47 2.1721 INE337A01034 LG Balakrishnan Bros Ltd Auto Ancillaries 11000 61.89 2.1522 INE628A01036 UPL Ltd Pesticides 8937 60.22 2.1023 INE121A01016 Cholamandalam Investment & Finance Company Ltd Finance 4900 56.71 1.9724 INE415A01038 HSIL Ltd Consumer Durables 16400 55.76 1.9425 INE878A01011 GE Power India Ltd Industrial Capital Goods 10000 55.07 1.9226 INE522F01014 Coal India Ltd Minerals/Mining 16683 53.77 1.8727 INE074A01025 Praj Industries Ltd Industrial Capital Goods 65000 52.85 1.8428 INE041A01016 Dhampur Sugar Mills Ltd Consumer Non Durables 45000 51.98 1.8129 INE036D01010 Karur Vysya Bank Ltd Banks 11000 51.64 1.8030 INE101A01026 Mahindra & Mahindra Ltd Auto 3609 50.73 1.7731 INE018A01030 Larsen & Toubro Ltd Construction Project 3494 50.07 1.7432 INE203G01019 Indraprastha Gas Ltd Gas 5766 44.87 1.5633 INE263A01016 Bharat Electronics Ltd Industrial Capital Goods 3300 41.08 1.4334 INE066P01011 INOX Wind Ltd Industrial Capital Goods 14617 29.27 1.0235 INE419M01019 TD Power Systems Ltd Industrial Capital Goods 14500 26.29 0.9136 INE258A01016 BEML Ltd Industrial Capital Goods 2915 25.54 0.8937 INE113A01013 Gujarat Narmada Valley Fertilizers and Chemicals Ltd Chemicals 10000 17.77 0.6238 INE356A01018 MphasiS Ltd Software 861 4.47 0.16 Total for Equity & Equity Related 2606.09 90.70 (B) Money Market Instruments 1 Reverse Repo 258.00 8.98 Total for Money Market Instruments 258.00 8.98 Cash and Other Net Current Assets 9.32 0.32 Grand Total 2873.41 100.00Notesa) Total NPA's provided for and its percentage to NAV - Nil b) Total value and percentage of illiquid equity shares - Nil c) NAV per unit (` per unit)
Direct plan Regular plan Options 31/03/2016 30/09/2016 31/03/2016 30/09/2016Growth 9.8517 12.4816 9.7758 12.3641 Dividend 9.8517 11.9884 9.7758 11.8710d) Dividend declared during the period (` per unit)Option Direct plan Regular PlanDividend 0.50 0.50e) Total outstanding exposure in derivative instruments at the end of the period - Nilf) Total investments in foreign securities /ADR'S/GDR'S at the end of the period -Nilg) Portfolio Turnover Ratio - 30.49%h) Repo in corporate debt - Nil
SUNDARAM VALUE FUND - SERIES III
Sl No ISIN Code Name of the instrument Industry/Rating Quantity Mkt Value % of ` in Lakhs NAV A) Equity & Equity Related a) Listed / awaiting listing on Stock Exchange 1 INE075I01017 Healthcare Global Enterprises Ltd Healthcare Services 74394 164.45 5.322 INE012A01025 ACC Ltd Cement 9336 149.36 4.833 INE383A01012 The India Cements Ltd Cement 101691 146.44 4.744 INE155A01022 Tata Motors Ltd Auto 26711 142.86 4.625 INE113A01013 Gujarat Narmada Valley Fertilizers and Chemicals Ltd Chemicals 77913 138.45 4.486 IN9155A01020 Tata Motors Ltd Auto 39410 134.19 4.347 INE002A01018 Reliance Industries Ltd Petroleum Products 11233 121.73 3.948 INE090A01021 ICICI Bank Ltd Banks 46724 117.81 3.819 INE791I01019 Brigade Enterprises Ltd Construction 66666 115.70 3.7410 INE055A01016 Century Textiles Industries Ltd Cement 10987 103.61 3.3511 INE510A01028 Engineers India Ltd Construction Project 38000 94.41 3.0512 INE349A01021 NRB Bearings Ltd Industrial Products 67704 85.44 2.7613 INE101A01026 Mahindra & Mahindra Ltd Auto 6049 85.03 2.7514 INE442H01029 Ashoka Buildcon Ltd Construction Project 48370 82.45 2.6715 INE048G01018 Navin Flourine International Ltd Chemicals 3489 77.57 2.5116 INE034A01011 Arvind Ltd Textile Products 21816 73.54 2.3817 INE020B01018 Rural Electrification Corporation Ltd Finance 60238 72.47 2.3418 INE242A01010 Indian Oil Corporation Ltd Petroleum Products 12220 71.18 2.3019 INE062A01020 State Bank Of India Ltd Banks 28018 70.40 2.2820 INE337A01034 LG Balakrishnan Bros Ltd Auto Ancillaries 11884 66.86 2.1621 INE121A01016 Cholamandalam Investment & Finance Company Ltd Finance 5200 60.18 1.9522 INE326A01037 Lupin Ltd Pharmaceuticals 3910 58.11 1.8823 INE041A01016 Dhampur Sugar Mills Ltd Consumer Non Durables 50000 57.75 1.8724 INE868B01028 NCC Ltd Construction Project 69951 57.43 1.8625 INE018A01030 Larsen & Toubro Ltd Construction Project 3819 54.73 1.7726 INE562A01011 Indian Bank Banks 23754 50.14 1.6227 INE203G01019 Indraprastha Gas Ltd Gas 6195 48.20 1.5628 INE765D01014 WPIL Ltd Industrial Products 12625 45.51 1.4729 INE860A01027 HCL Technologies Ltd Software 5461 43.68 1.4130 INE486A01013 CESC Ltd Power 6214 37.95 1.2331 INE066P01011 INOX Wind Ltd Industrial Capital Goods 18637 37.32 1.2132 INE356A01018 MphasiS Ltd Software 6208 32.26 1.0433 INE258A01016 BEML Ltd Industrial Capital Goods 2629 23.03 0.74 Total for Equity & Equity Related 2720.27 87.99 (B) Money Market Instruments 1 Reverse Repo 361.00 11.68 Total for Money Market Instruments 361.00 11.68 Cash and Other Net Current Assets 10.31 0.33 Grand Total 3091.58 100.00Notesa) Total NPA's provided for and its percentage to NAV - Nil b) Total value and percentage of illiquid equity shares - Nil c) NAV per unit (` per unit)
Direct plan Regular plan Options 31/03/2016 30/09/2016 31/03/2016 30/09/2016Growth 10.3640 12.7179 10.3582 12.6898 Dividend 10.3640 12.2229 10.3582 12.1949d) Dividend declared during the period (` per unit)Option Direct plan Regular PlanDividend 0.50 0.50
e) Total outstanding exposure in derivative instruments at the end of the period - Nilf) Total investments in foreign securities /ADR'S/GDR'S at the end of the period -Nilg) Portfolio Turnover Ratio - 56.13%h) Repo in corporate debt - Nil
SUNDARAM SELECT SMALL CAP SERIES - II
Sl No ISIN Code Name of the instrument Industry/Rating Quantity Mkt Value % of ` in Lakhs NAV A) Equity & Equity Related a) Listed / awaiting listing on Stock Exchange 1 INE918I01018 Bajaj Finserv Ltd Finance 12405 380.78 5.182 INE331A01037 The Ramco Cements Ltd Cement 54839 326.51 4.443 INE647A01010 SRF LTD Textile Products 18140 322.47 4.394 INE774D01024 Mahindra & Mahindra Financial Services Ltd Finance 85264 310.62 4.235 INE180A01020 Max Financial Services Ltd Finance 43637 242.45 3.306 INE462A01022 Bayer Cropscience Ltd Pesticides 5222 233.52 3.187 INE513A01014 Fag Bearings India Ltd Industrial Products 5357 219.17 2.988 INE825A01012 Vardhman Textiles Ltd Textiles - Cotton 20382 217.14 2.959 INE203G01019 Indraprastha Gas Ltd Gas 27731 215.77 2.9410 INE055A01016 Century Textiles Industries Ltd Cement 22524 212.41 2.8911 INE121A01016 Cholamandalam Investment & Finance Company Ltd Finance 18100 209.48 2.8512 INE034A01011 Arvind Ltd Textile Products 61856 208.52 2.8413 INE988K01017 Equitas Holdings Ltd Finance 118125 206.31 2.8114 INE891D01026 Redington (India) Ltd Trading 196362 203.04 2.7615 INE172A01027 Castrol India Ltd Petroleum Products 42282 200.82 2.7316 INE211B01039 The Phoenix Mills Ltd Construction 50789 196.05 2.6717 INE169A01031 Coromandel International Ltd Fertilisers 79507 195.59 2.6618 INE171A01029 Federal Bank Banks 271434 195.43 2.6619 INE562A01011 Indian Bank Banks 89905 189.79 2.5820 INE628A01036 UPL Ltd Pesticides 27703 186.68 2.5421 INE152A01029 Thermax Ltd Industrial Capital Goods 20327 171.80 2.3422 INE716A01013 Whirlpool of India Ltd Consumer Durables 16864 171.56 2.3323 INE976G01028 RBL Bank Ltd Banks 57785 168.27 2.2924 INE036D01010 Karur Vysya Bank Ltd Banks 35346 165.93 2.2625 INE302A01020 Exide Industries Ltd Auto Ancillaries 90399 165.43 2.2526 INE486A01013 CESC Ltd Power 25243 154.17 2.1027 INE775A01035 Motherson Sumi Systems Ltd Auto Ancillaries 47400 150.73 2.0528 INE010V01017 L&T Technology Services Ltd Software 17440 147.74 2.0129 INE428A01015 Allahabad Bank Banks 186550 143.36 1.9530 INE356A01018 MphasiS Ltd Software 27217 141.43 1.9231 INE264A01014 GlaxoSmithKline Consumer Healthcare Ltd Consumer Non Durables 2000 120.69 1.6432 INE823G01014 J K Cements Ltd Cement 13169 115.33 1.5733 INE935A01035 GlenMark Pharmaceuticals Ltd Pharmaceuticals 12169 112.37 1.5334 INE836F01026 Dish TV India Ltd Media & Entertainment 108914 101.40 1.3835 INE348B01021 Century Plyboards (India) Ltd Consumer Durables 38783 97.17 1.3236 INE839M01018 Schneider Electric Infrastructure Ltd Industrial Capital Goods 67193 92.39 1.2637 INE066P01011 INOX Wind Ltd Industrial Capital Goods 42585 85.28 1.1638 INE010A01011 Prism Cement Ltd Cement 82454 85.17 1.1639 INE451A01017 Force Motors Ltd Auto 2135 74.68 1.0240 INE536H01010 Mahindra CIE Automotive Ltd Industrial Products 32617 62.59 0.8541 INE263A01016 Bharat Electronics Ltd Industrial Capital Goods 4776 59.45 0.81 Total for Equity & Equity Related 7259.50 98.78 (B) Money Market Instruments 1 Reverse Repo 97.00 1.32 Total for Money Market Instruments 97.00 1.32 Cash and Other Net Current Assets (7.39) (0.10) Grand Total 7349.10 100.00Notesa) Total NPA's provided for and its percentage to NAV - Nil b) Total value and percentage of illiquid equity shares - Nil c) NAV per unit (` per unit)
Direct plan Regular plan Options 31/03/2016 30/09/2016 31/03/2016 30/09/2016Growth 9.6095 12.2529 9.4851 12.0712 Dividend 9.6095 12.2529 9.4851 12.0712d) Dividend declared during the period (` per unit) - Nile) Total outstanding exposure in derivative instruments at the end of the period - Nilf) Total investments in foreign securities /ADR'S/GDR'S at the end of the period -Nilg) Portfolio Turnover Ratio - 26.17%h) Repo in corporate debt - Nil
SUNDARAM SELECT SMALL CAP SERIES - III
Sl No ISIN Code Name of the instrument Industry/Rating Quantity Mkt Value % of ` in Lakhs NAV A) Equity & Equity Related a) Listed / awaiting listing on Stock Exchange 1 INE918I01018 Bajaj Finserv Ltd Finance 7816 239.92 5.202 INE331A01037 The Ramco Cements Ltd Cement 34408 204.87 4.443 INE647A01010 SRF LTD Textile Products 11229 199.62 4.334 INE774D01024 Mahindra & Mahindra Financial Services Ltd Finance 53540 195.05 4.235 INE180A01020 Max Financial Services Ltd Finance 27561 153.13 3.326 INE462A01022 Bayer Cropscience Ltd Pesticides 3279 146.63 3.187 INE825A01012 Vardhman Textiles Ltd Textiles - Cotton 12796 136.32 2.958 INE513A01014 Fag Bearings India Ltd Industrial Products 3322 135.91 2.959 INE203G01019 Indraprastha Gas Ltd Gas 17442 135.72 2.9410 INE121A01016 Cholamandalam Investment & Finance Company Ltd Finance 11350 131.36 2.8511 INE055A01016 Century Textiles Industries Ltd Cement 13929 131.36 2.8512 INE034A01011 Arvind Ltd Textile Products 38903 131.14 2.8413 INE988K01017 Equitas Holdings Ltd Finance 74630 130.34 2.8214 INE891D01026 Redington (India) Ltd Trading 125723 130.00 2.8215 INE169A01031 Coromandel International Ltd Fertilisers 51565 126.85 2.7516 INE171A01029 Federal Bank Banks 174656 125.75 2.7217 INE172A01027 Castrol India Ltd Petroleum Products 26472 125.73 2.7218 INE211B01039 The Phoenix Mills Ltd Construction 31849 122.94 2.6619 INE562A01011 Indian Bank Banks 56146 118.52 2.5720 INE628A01036 UPL Ltd Pesticides 17340 116.85 2.5321 INE152A01029 Thermax Ltd Industrial Capital Goods 12782 108.03 2.3422 INE036D01010 Karur Vysya Bank Ltd Banks 22340 104.88 2.2723 INE716A01013 Whirlpool of India Ltd Consumer Durables 10303 104.81 2.2724 INE302A01020 Exide Industries Ltd Auto Ancillaries 56626 103.63 2.2525 INE976G01028 RBL Bank Ltd Banks 35555 103.54 2.2426 INE775A01035 Motherson Sumi Systems Ltd Auto Ancillaries 31600 100.49 2.1827 INE010V01017 L&T Technology Services Ltd Software 11600 98.27 2.1328 INE486A01013 CESC Ltd Power 16069 98.14 2.1329 INE356A01018 MphasiS Ltd Software 17075 88.73 1.9230 INE428A01015 Allahabad Bank Banks 114825 88.24 1.9131 INE264A01014 GlaxoSmithKline Consumer Healthcare Ltd Consumer Non Durables 1200 72.41 1.5732 INE823G01014 J K Cements Ltd Cement 8058 70.57 1.5333 INE935A01035 GlenMark Pharmaceuticals Ltd Pharmaceuticals 7396 68.30 1.4834 INE836F01026 Dish TV India Ltd Media & Entertainment 68399 63.68 1.3835 INE348B01021 Century Plyboards (India) Ltd Consumer Durables 24498 61.38 1.3336 INE839M01018 Schneider Electric Infrastructure Ltd Industrial Capital Goods 41438 56.98 1.2337 INE066P01011 INOX Wind Ltd Industrial Capital Goods 27451 54.97 1.1938 INE010A01011 Prism Cement Ltd Cement 52654 54.39 1.1839 INE451A01017 Force Motors Ltd Auto 1340 46.87 1.0240 INE263A01016 Bharat Electronics Ltd Industrial Capital Goods 3000 37.34 0.8141 INE536H01010 Mahindra CIE Automotive Ltd Industrial Products 17066 32.75 0.71 Total for Equity & Equity Related 4556.39 98.73 (B) Money Market Instruments 1 Reverse Repo 57.00 1.24 Total for Money Market Instruments 57.00 1.24 Cash and Other Net Current Assets 1.59 0.03 Grand Total 4614.98 100.00Notesa) Total NPA's provided for and its percentage to NAV - Nil b) Total value and percentage of illiquid equity shares - Nil c) NAV per unit (` per unit)
Direct plan Regular plan Options 31/03/2016 30/09/2016 31/03/2016 30/09/2016Growth 9.4150 11.9986 9.3578 11.9047 Dividend 9.4294 12.0171 9.3578 11.9048d) Dividend declared during the period (` per unit) - Nile) Total outstanding exposure in derivative instruments at the end of the period - Nilf) Total investments in foreign securities /ADR'S/GDR'S at the end of the period -Nilg) Portfolio Turnover Ratio - 26.45%h) Repo in corporate debt - Nil
SUNDARAM SELECT SMALL CAP SERIES - IV
Sl No ISIN Code Name of the instrument Industry/Rating Quantity Mkt Value % of ` in Lakhs NAV A) Equity & Equity Related a) Listed / awaiting listing on Stock Exchange 1 INE918I01018 Bajaj Finserv Ltd Finance 8286 254.34 5.232 INE331A01037 The Ramco Cements Ltd Cement 36317 216.23 4.453 INE647A01010 SRF LTD Textile Products 11862 210.87 4.344 INE774D01024 Mahindra & Mahindra Financial Services Ltd Finance 56464 205.70 4.235 INE180A01020 Max Financial Services Ltd Finance 29021 161.24 3.316 INE462A01022 Bayer Cropscience Ltd Pesticides 3454 154.46 3.187 INE825A01012 Vardhman Textiles Ltd Textiles - Cotton 13561 144.47 2.978 INE513A01014 Fag Bearings India Ltd Industrial Products 3500 143.20 2.949 INE203G01019 Indraprastha Gas Ltd Gas 18380 143.01 2.9410 INE034A01011 Arvind Ltd Textile Products 41226 138.97 2.8611 INE121A01016 Cholamandalam Investment & Finance Company Ltd Finance 12000 138.88 2.8612 INE055A01016 Century Textiles Industries Ltd Cement 14671 138.35 2.8413 INE988K01017 Equitas Holdings Ltd Finance 78600 137.27 2.8214 INE891D01026 Redington (India) Ltd Trading 131056 135.51 2.7915 INE172A01027 Castrol India Ltd Petroleum Products 27980 132.89 2.7316 INE171A01029 Federal Bank Banks 184442 132.80 2.7317 INE169A01031 Coromandel International Ltd Fertilisers 52736 129.73 2.6718 INE211B01039 The Phoenix Mills Ltd Construction 33568 129.57 2.6619 INE562A01011 Indian Bank Banks 59183 124.94 2.5720 INE628A01036 UPL Ltd Pesticides 18272 123.13 2.5321 INE356A01018 MphasiS Ltd Software 22948 119.25 2.4522 INE976G01028 RBL Bank Ltd Banks 39975 116.41 2.3923 INE152A01029 Thermax Ltd Industrial Capital Goods 13482 113.95 2.3424 INE036D01010 Karur Vysya Bank Ltd Banks 23688 111.20 2.2925 INE716A01013 Whirlpool of India Ltd Consumer Durables 10862 110.50 2.2726 INE302A01020 Exide Industries Ltd Auto Ancillaries 59743 109.33 2.2527 INE486A01013 CESC Ltd Power 16938 103.45 2.1328 INE775A01035 Motherson Sumi Systems Ltd Auto Ancillaries 31600 100.49 2.0729 INE010V01017 L&T Technology Services Ltd Software 11600 98.27 2.0230 INE428A01015 Allahabad Bank Banks 121151 93.10 1.9131 INE264A01014 GlaxoSmithKline Consumer Healthcare Ltd Consumer Non Durables 1300 78.45 1.6132 INE823G01014 J K Cements Ltd Cement 8495 74.39 1.5333 INE935A01035 GlenMark Pharmaceuticals Ltd Pharmaceuticals 7796 71.99 1.4834 INE836F01026 Dish TV India Ltd Media & Entertainment 72075 67.10 1.3835 INE348B01021 Century Plyboards (India) Ltd Consumer Durables 26037 65.24 1.3436 INE839M01018 Schneider Electric Infrastructure Ltd Industrial Capital Goods 43205 59.41 1.2237 INE066P01011 INOX Wind Ltd Industrial Capital Goods 28905 57.88 1.1938 INE010A01011 Prism Cement Ltd Cement 55629 57.46 1.1839 INE451A01017 Force Motors Ltd Auto 1413 49.42 1.0240 INE263A01016 Bharat Electronics Ltd Industrial Capital Goods 3162 39.36 0.8141 INE536H01010 Mahindra CIE Automotive Ltd Industrial Products 17817 34.19 0.70 Total for Equity & Equity Related 4826.42 99.23 (B) Money Market Instruments 1 Reverse Repo 36.00 0.74 Total for Money Market Instruments 36.00 0.74 Cash and Other Net Current Assets 1.77 0.04 Grand Total 4864.19 100.00Notesa) Total NPA's provided for and its percentage to NAV - Nil b) Total value and percentage of illiquid equity shares - Nil c) NAV per unit (` per unit)
Direct plan Regular plan Options 31/03/2016 30/09/2016 31/03/2016 30/09/2016Growth 9.3714 11.9434 9.3228 11.8606 Dividend 9.3714 11.9434 9.3228 11.8606d) Dividend declared during the period (` per unit) - Nile) Total outstanding exposure in derivative instruments at the end of the period - Nilf) Total investments in foreign securities /ADR'S/GDR'S at the end of the period -Nilg) Portfolio Turnover Ratio - 26.16%h) Repo in corporate debt - Nil
SUNDARAM WORLD BRAND FUND SERIES I
Sl No ISIN Code Name of the instrument Industry/Rating Quantity Mkt Value % of ` in Lakhs NAV (A) Equity & Equity related Foreign Securities (a) American Depository Receipt 1 US8923313071 Toyota Motor Corp - Spon ADR Automotive 2,740 211.98 4.202 US4381283088 Honda Motor Co Ltd-Spon ADR Consumer Discretionary 6,282 121.10 2.403 US4258831050 Hennes & Mauritz AB-Unspon ADR Consumer Discretionary 27,524 102.65 2.034 US4557931098 Inditex-Unspon ADR Consumer Discretionary 7,316 89.98 1.785 US03524a1088 Anheuser-Busch Inbev-Spon ADR Beverages 895 78.40 1.556 US5024413065 LVMH Moet Hennessy Louis Vuitton SA-Unspon ADR Consumer Discretionary 1,197 27.11 0.54 Sub Total 631.22 12.49 (b) Overseas Equity Shares 1 US0231351067 Amazon.Com Inc Product Distribution 624 348.28 6.892 US02079k3059 Alphabet Inc. Class A Internet / Intranet 589 315.69 6.253 US5949181045 Microsoft Corporation Computers - Software 7,472 286.89 5.684 US5801351017 Mcdonald's Corporation Restaurant 3,278 252.07 4.995 US3696041033 General Electric Company Diversified Manufacturing 12,643 249.63 4.946 US1912161007 Coca-Cola Company Beverage 7,589 214.09 4.247 US0378331005 Apple Inc Manufacturing 2,796 210.70 4.178 US4592001014 International Business Machines Corp Computer Services 1,919 203.20 4.029 DE0005190003 Bayerische Motoren Werke AG Automobile Industry 3,104 173.58 3.4410 US4581401001 Intel Corporation Electronic Compon/ Instruments 6,316 158.94 3.1511 US7427181091 Procter & Gamble Co Consumer Staples 2,600 155.55 3.0812 US17275r1023 Cisco Systems Inc Networking 6,206 131.22 2.6013 US2546871060 The Walt Disney Company Media & Broadcasting 2,012 124.54 2.4614 FR0000121014 LVMH Moet Hennessy Louis Vuitton SA Consumer Discretionary 1,073 121.76 2.4115 US30303m1027 Facebook Inc Internet / Intranet 1,417 121.16 2.4016 US68389x1054 Oracle Corporation Software & Services 4,481 117.33 2.3217 US9113121068 United Parcel Service Inc Courier 1,478 107.74 2.1318 US42824c1099 Hewlett Packard Enterprise Company-WI Information Technology 6,817 103.38 2.0519 US6541061031 Nike Inc Footware 2,868 100.66 1.9920 DE0007164600 SAP SE Information Technology 1,607 97.21 1.9221 US7134481081 Pepsico Inc Beverage 1,298 94.11 1.8622 DE0007100000 Daimler AG-Registered Shares Consumer Discretionary 2,000 93.75 1.8623 US0258161092 American Express Company Financials 1,824 77.86 1.5424 US46625h1005 JP Morgan Chase & Co Financials 1,694 75.19 1.4925 US40434l1052 HP Inc Information Technology 6,817 70.57 1.4026 US2786421030 Ebay Inc Commerce 1,877 41.16 0.8127 DE0007100000 Daimler AG-Registered Shares Consumer Discretionary 676 31.83 0.63 Total for Equity & Equity Related 4,709.31 93.21 (B) Money Market Instruments Reverse Repo 351.00 6.95 Total for Money Market Instruments 351.00 6.95 Cash and Other Net Current Assets (7.90) (0.16) Grand Total 5,052.41 100.00Notesa) Total NPA's provided for and its percentage to NAV - Nil b) Total value and percentage of illiquid equity shares - Nil c) NAV per unit (` per unit)
Direct plan Regular plan Options 31/03/16 30/09/16 31/03/16 30/09/16Dividend 10.8961 11.3773 10.7643 11.2209Growth 10.8961 11.3773 10.7643 11.2209d) Dividend declared during the period (` per unit) - Nile) Total outstanding exposure in derivative instruments at the end of the period - Nilf) Total investments in foreign securities /ADR'S/GDR'S at the end of the period - ` 4709.31 Lacsg) Portfolio Turnover Ratio - 0.00h) Investment in repo in corporate debt - Nil
SUNDARAM WORLD BRAND FUND SERIES II
Sl No ISIN Code Name of the instrument Industry/Rating Quantity Mkt Value % of ` in Lakhs NAV (A) Equity & Equity related Foreign Securities (a) American Depository Receipt 1 US8923313071 Toyota Motor Corp - Spon ADR Automotive 2,464 190.63 4.192 US4381283088 Honda Motor Co Ltd-Spon ADR Consumer Discretionary 5,684 109.58 2.413 US4258831050 Hennes & Mauritz AB-Unspon ADR Consumer Discretionary 24,752 92.32 2.034 US4557931098 Inditex-Unspon ADR Consumer Discretionary 6,545 80.49 1.77
www.sundarammutual.com
Half-yearly Portfolio Statement of the Schemes of Sundaram Mutual Fund for the period ended September 30, 2016 (Page 7)
5 US03524A1088 Anheuser-Busch Inbev-Spon ADR Beverages 805 70.52 1.556 US5024413065 LVMH Moet Hennessy Louis Vuitton SA-Unspon ADR Consumer Discretionary 1,077 24.39 0.54 Sub Total 567.93 12.49 (b) Overseas Equity Shares 1 US0231351067 Amazon.Com Inc Product Distribution 561 313.12 6.892 US02079K3059 Alphabet Inc. Class A Internet / Intranet 533 285.68 6.283 US5949181045 Microsoft Corporation Computers - Software 6,717 257.91 5.674 US5801351017 Mcdonald'S Corporation Restaurant 2,969 228.31 5.025 US3696041033 General Electric Company Diversified Manufacturing 11,447 226.02 4.976 US1912161007 Coca-Cola Company Beverage 6,873 193.89 4.267 US0378331005 Apple Inc Manufacturing 2,514 189.45 4.178 US4592001014 International Business Machines Corp Computer Services 1,725 182.66 4.029 DE0005190003 Bayerische Motoren Werke AG Automobile Industry 2,705 151.27 3.3310 US4581401001 Intel Corporation Electronic Compon/ Instruments 5,719 143.91 3.1611 US7427181091 Procter & Gamble Co Consumer Staples 2,352 140.71 3.0912 US17275R1023 Cisco Systems Inc Networking 5,623 118.90 2.6113 US2546871060 The Walt Disney Company Media & Broadcasting 1,820 112.66 2.4814 FR0000121014 Lvmh Moet Hennessy Louis Vuitton SA Consumer Discretionary 970 110.07 2.4215 US30303M1027 Facebook Inc Internet / Intranet 1,283 109.70 2.4116 US68389X1054 Oracle Corporation Software & Services 4,059 106.28 2.3417 US9113121068 United Parcel Service Inc Courier 1,337 97.47 2.1418 US42824C1099 Hewlett Packard Enterprise Company-WI Information Technology 6,169 93.55 2.0619 US6541061031 Nike Inc Footware 2,596 91.11 2.0020 DE0007164600 SAP SE Information Technology 1,446 87.47 1.9221 US7134481081 Pepsico Inc Beverage 1,177 85.34 1.8822 DE0007100000 Daimler AG-Registered Shares Consumer Discretionary 1,777 83.30 1.8323 US0258161092 American Express Company Financials 1,650 70.44 1.5524 US46625H1005 JP Morgan Chase & Co Financials 1,523 67.60 1.4925 US40434L1052 HP Inc Information Technology 6,169 63.86 1.4026 US2786421030 Ebay Inc Commerce 1,702 37.33 0.8227 DE0007100000 Daimler AG-Registered Shares Consumer Discretionary 615 28.96 0.64 Sub Total 3,676.97 80.86 Total for Equity & Equity Related 4,244.90 93.35 (B) Money Market Instruments Reverse Repo 310.00 6.82 Total for Money Market Instruments 310.00 6.82 Cash and Other Net Current Assets (7.71) (0.17) GRAND TOTAL 4,547.19 100.00Notesa) Total NPA's provided for and its percentage to NAV - Nil b) Total value and percentage of illiquid equity shares - Nil c) NAV per unit (` per unit)
Direct plan Regular plan Options 31/03/16 30/09/16 31/03/16 30/09/16Dividend 10.9086 11.3912 10.7814 11.2396Growth 10.9086 11.3912 10.7814 11.2396d) Dividend declared during the period (Rupees per unit) - Nil e) Total outstanding exposure in derivative instruments at the end of the period - Nil f) Total investments in foreign securities /ADR'S/GDR'S at the end of the period - Rs 4244.9 Lacs g) Portfolio Turnover Ratio - 0.00% h) Investment in repo in corporate debt - Nil
SUNDARAM WORLD BRAND FUND SERIES III
Sl No ISIN Code Name of the instrument Industry/Rating Quantity Mkt Value % of ` in Lakhs NAV (A) Equity & Equity related Foreign Securities (a) American Depository Receipt1 US8923313071 Toyota Motor Corp - Spon ADR Automotive 1,780 137.71 4.202 US4381283088 Honda Motor Co Ltd-Spon ADR Consumer Discretionary 4,079 78.63 2.403 US4258831050 Hennes & Mauritz AB-Unspon ADR Consumer Discretionary 17,875 66.67 2.034 US4557931098 Inditex-Unspon ADR Consumer Discretionary 4,724 58.10 1.775 US03524A1088 Anheuser-Busch Inbev-Spon ADR Beverages 581 50.89 1.556 US5024413065 LVMH Moet Hennessy Louis Vuitton SA-Unspon ADR Consumer Discretionary 778 17.62 0.54 Sub Total 409.62 12.48 (b) Overseas Equity Shares 1 US0231351067 Amazon.Com Inc Product Distribution 406 226.61 6.912 US02079K3059 Alphabet Inc. Class A Internet / Intranet 383 205.28 6.263 US5949181045 Microsoft Corporation Computers - Software 4,851 186.26 5.684 US5801351017 Mcdonald'S Corporation Restaurant 2,129 163.72 4.995 US3696041033 General Electric Company Diversified Manufacturing 8,208 162.06 4.946 US1912161007 Coca-Cola Company Beverage 4,928 139.02 4.247 US0378331005 Apple Inc Manufacturing 1,816 136.85 4.178 US4592001014 International Business Machines Corp Computer Services 1,247 132.04 4.029 DE0005190003 Bayerische Motoren Werke AG Automobile Industry 2,015 112.68 3.4310 US4581401001 Intel Corporation Electronic Compon/ Instruments 4,102 103.22 3.1511 US7427181091 Procter & Gamble Co Consumer Staples 1,688 100.99 3.0812 US17275R1023 Cisco Systems Inc Networking 4,029 85.19 2.6013 DE0007100000 Daimler AG-Registered Shares Consumer Discretionary 1,728 81.00 2.4714 US2546871060 The Walt Disney Company Media & Broadcasting 1,306 80.84 2.4615 FR0000121014 LVMH Moet Hennessy Louis Vuitton SA Consumer Discretionary 701 79.55 2.4216 US30303M1027 Facebook Inc Internet / Intranet 921 78.75 2.4017 US68389X1054 Oracle Corporation Software & Services 2,911 76.22 2.3218 US9113121068 United Parcel Service Inc Courier 959 69.91 2.1319 US42824C1099 Hewlett Packard Enterprise Company-WI Information Technology 4,427 67.14 2.0520 US6541061031 Nike Inc Footware 1,862 65.35 1.9921 DE0007164600 SAP SE Information Technology 1,044 63.15 1.9222 US7134481081 Pepsico Inc Beverage 843 61.12 1.8623 US0258161092 American Express Company Financials 1,185 50.59 1.5424 US46625H1005 JP Morgan Chase & Co Financials 1,099 48.78 1.4925 US40434L1052 HP Inc Information Technology 4,427 45.83 1.4026 US2786421030 Ebay Inc Commerce 1,219 26.73 0.81 Sub Total 2,648.88 80.73 Total for Equity & Equity Related 3,058.50 93.21 (B) Money Market Instruments Reverse Repo 227.00 6.92 Total for Money Market Instruments 227.00 6.92 Cash and Other Net Current Assets (4.22) (0.13) Grand Total 3,281.28 100.00Notesa) Total NPA's provided for and its percentage to NAV - Nil b) Total value and percentage of illiquid equity shares - Nil c) NAV per unit (` per unit)
Direct plan Regular plan Options 31/03/16 30/09/16 31/03/16 30/09/16Dividend 11.0339 11.5215 10.9123 11.3754Growth 11.0339 11.5215 10.9123 11.3754d) Dividend declared during the period (` per unit) - Nile) Total outstanding exposure in derivative instruments at the end of the period - Nilf) Total investments in foreign securities /ADR'S/GDR'S at the end of the period - ` 3058.50 Lacsg) Portfolio Turnover Ratio - 0.00h) Investment in repo in corporate debt - Nil
SUNDARAM BOND SAVER
Sl No ISIN Code Name of the instrument Industry/ Quantity Mkt Value % of Rating ` in Lakhs NAV A) Debt Instruments a) Listed / awaiting listing on Stock Exchange 1 INE001A07PB3 Housing Development Finance Corporation Ltd - 8.44 - 01/06/2026** CRISIL AAA 15 1559.55 8.802 INE202B07HV0 Dewan Housing Finance Corporation Ltd - 9.3 - 16/08/2026 BWR AAA 120000 1201.65 6.783 INE296A08771 Bajaj Finance Ltd - 8.85 - 15/07/2026** IND AAA 100 1023.20 5.784 INE953L08170 Janalakshmi Financial Services Ltd - 12.25 - 19/01/2018** ICRA A+ 100 1021.20 5.765 INE694L07057 Talwandi Sabo Power Ltd - 9.27 - 10/11/2017** CRISIL AA-(SO) 80 803.81 4.546 INE038A07266 Hindalco Industries Ltd - 9.55 - 27/06/2022** CRISIL AA- 50 529.82 2.997 INE206D08360 Nuclear Power Corporation of India Ltd - 8.13 - 28/03/2027** CRISIL AAA 50 529.32 2.998 INE115A07JB4 LIC Housing Finance Ltd - 8.75 - 12/02/2021** CRISIL AAA 50 516.12 2.91 Sub Total 7184.68 40.55 (b) Govt Security 1 IN0020160019 7.61 Central Government Securities 09/05/2030 Sovereign 5350000 5644.84 31.862 IN0020150093 7.59 Central Government Securities 11/01/2026 Sovereign 1100000 1146.74 6.473 IN2220130057 9.60 Maharashtra State Development Loan 14/08/2023 Sovereign 500000 561.40 3.174 IN0020150051 7.73 Central Government Securities 19/12/2034 Sovereign 500000 530.70 3.005 IN2220140148 8.43 Maharashtra State Development Loan 12/11/2024 Sovereign 350000 373.51 2.116 IN2920160115 8.33 Rajasthan State Development Loan 23/06/2025 Sovereign 274000 288.87 1.637 IN2920160123 8.19 Rajasthan State Development Loan 23/06/2026 Sovereign 274000 287.77 1.628 IN2920160107 8.29 Rajasthan State Development Loan 23/06/2024 Sovereign 274000 286.88 1.629 IN2920160099 8.27 Rajasthan State Development Loan 23/06/2023 Sovereign 274000 285.57 1.61
10 IN2920160081 8.27 Rajasthan State Development Loan 23/06/2022 Sovereign 274000 283.96 1.6011 IN2920160073 8.15 Rajasthan State Development Loan 23/06/2021 Sovereign 274000 282.37 1.59 Sub Total 9972.61 56.29 Total for Debt Instruments 17157.29 96.84 (B) Money Market Instruments 1 Reverse Repo 40.00 0.23 Total for Money Market Instruments 40.00 0.23 Cash and Other Net Current Assets 519.04 2.93 Grand Total 17716.32 100.00** Thinly traded / Non Traded securities Notesa) Total NPA's provided for and its percentage to NAV - Nil b) Total value and percentage of illiquid equity shares - Nil c) NAV per unit (` per unit)
Direct Plan Institutional Plan Regular planOptions 31/03/2016 30/09/2016 31/03/2016 30/09/2016 31/03/2016 30/09/2016Growth 43.1864 46.2564 47.4791 50.7261 42.0140 44.8760 Bonus - - - - 14.3495 15.3272 Quarterly Div. 18.5074 19.3547 - - 11.5984 11.9209 Halfyearly Div. - - - - 11.5061 11.9887 Annual Div. 11.5021 12.3195 - - 11.2052 11.9687d) Dividend declared during the period (` per unit)
Direct plan Regular PlanOption Individual & HUF Others Individual & HUF Others Quarterly Div. 0.325020 - 0.325020 0.301125Halfyearly Div. - - 0.216680 - e) Bonus declared during the period-Nilf) Total outstanding exposure in derivative instruments at the end of the period - Nilg) Total investments in foreign securities /ADR'S/GDR'S at the end of the period - Nilh) Average Maturity (years) - 9.40 i) Average Duration (years) - 6.05 j) Repo in corporate debt - Nil
SUNDARAM MONEY FUND (Liquid Fund)
Sl No ISIN Code Name of the instrument Industry/ Quantity Mkt Value % of Rating ` in Lakhs NAV A) Debt Instruments a) Listed / awaiting listing on Stock Exchange 1 INE148I07CY5 Indiabulls Housing Finance Ltd - 9.1 - 24/10/2016** CRISIL AA+ 550 5505.70 1.022 INE688I07154 Capital First Ltd - 9.4 - 27/12/2016** CARE AA+ 500 5023.47 0.933 INE001A07LU2 Housing Development Finance Corporation Ltd - 9.75 - 10/10/2016** CRISIL AAA 51 510.25 0.094 INE001A07HO3 Housing Development Finance Corporation Ltd - 9.5 - 23/12/2016** CRISIL AAA 50 502.48 0.09 Sub Total 11541.89 2.13 Total for Debt Instruments 11541.89 2.13 (b) Money Market Instruments (a) Certificate of Deposits 1 INE092T16223 IDFC Bank Ltd - 25/11/2016** CRISIL A1+ 12000 11879.61 2.192 INE095A16TU8 IndusInd Bank Ltd - 17/11/2016** CRISIL A1+ 10000 9915.49 1.833 INE238A16G27 Axis Bank Ltd - 21/12/2016** CRISIL A1+ 10000 9858.35 1.824 INE238A16O01 Axis Bank Ltd - 22/12/2016** CRISIL A1+ 10000 9856.62 1.825 INE238A16F44 Axis Bank Ltd - 01/12/2016** CRISIL A1+ 5000 4946.39 0.916 INE238A16F51 Axis Bank Ltd - 02/12/2016** CRISIL A1+ 5000 4945.53 0.917 INE112A16JE6 Corporation Bank - 14/12/2016** CRISIL A1+ 5000 4935.36 0.918 INE238A16C96 Axis Bank Ltd - 27/10/2016** CRISIL A1+ 2500 2488.32 0.469 INE095A16TL7 IndusInd Bank Ltd - 31/10/2016** CRISIL A1+ 500 497.22 0.0910 INE428A16RB5 Allahabad Bank - 21/11/2016** CRISIL A1+ 500 495.43 0.09 Sub Total 59818.31 11.05 (b) Commercial Papers 1 INE202B14IJ9 Dewan Housing Finance Corporation Ltd - 28/10/2016** CARE A1+ 5900 29342.70 5.422 INE085A14BB2 Chambal Fertilizers & Chemicals Ltd - 28/10/2016** CRISIL A1+ 5800 28850.88 5.333 INE114A14DC4 Steel Authority of India Ltd - 04/11/2016** CRISIL A1+ 5800 28814.30 5.324 INE245A14495 Tata Power Company Ltd - 29/11/2016** CRISIL A1+ 4000 19784.96 3.655 INE804I14NG3 ECL Finance Ltd - 15/11/2016** CRISIL A1+ 3500 17344.03 3.206 INE759E14DJ3 L & T Fin Corp Ltd - 28/10/2016** CRISIL A1+ 3000 14923.25 2.767 INE053T14410 ONGC Mangalore Petrochemicals Ltd - 28/10/2016** CRISIL A1+ 2900 14427.10 2.668 INE909H14JN6 Tata Motors Finance Ltd - 27/10/2016** CRISIL A1+ 2900 14426.04 2.669 INE134E14782 Power Finance Corporation Ltd - 14/10/2016** CRISIL A1+ 2600 12969.53 2.3910 INE657N14HN3 Edelweiss Commodities Services Ltd - 15/11/2016** CRISIL A1+ 2000 9912.64 1.8311 INE248U14349 IIFL Wealth Finance Ltd - 25/11/2016** CRISIL A1+ 2000 9893.43 1.8312 INE851M14EL5 Volkswagen Finance Private Ltd - 01/12/2016** IND A1+ 2000 9889.60 1.8313 INE962S14224 Tata Power Solar Systems - 02/12/2016** CRISIL A1 2000 9887.89 1.8314 INE729N14731 TVS Credit Services Ltd - 29/11/2016** CRISIL A1+ 2000 9881.43 1.8215 INE729N14780 TVS Credit Services Ltd - 27/12/2016** ICRA A1+ 2000 9828.52 1.8116 INE148I14NU6 Indiabulls Housing Finance Ltd - 02/11/2016** CRISIL A1+ 1900 9440.85 1.7417 INE114A14DD2 Steel Authority of India Ltd - 07/11/2016** CRISIL A1+ 1900 9433.82 1.7418 INE539K14508 Credila Financial Services Pvt Ltd - 21/11/2016** CRISIL A1+ 1500 7427.63 1.3719 INE020E14GN5 STCI Finance Ltd - 02/12/2016** CRISIL A1+ 1500 7412.49 1.3720 INE140A14LX8 Piramal Enterprises Ltd - 13/12/2016** ICRA A1+ 1500 7395.17 1.3721 INE597H14FR8 TGS Investment & Trade Pvt Ltd - 14/10/2016** CRISIL A1+ 1000 4986.96 0.9222 INE322J14014 Bharat Oman Refinery Ltd - 27/10/2016** CRISIL A1+ 1000 4975.67 0.9223 INE763G14DG6 ICICI Securities Ltd - 28/10/2016** CRISIL A1+ 1000 4974.39 0.9224 INE978J14DQ3 Turqoise Investment and Finance - 28/10/2016** CRISIL A1+ 1000 4974.08 0.9225 INE850D14EV5 Godrej Agrovet Ltd - 08/11/2016** CRISIL A1+ 1000 4965.43 0.9226 INE962S14216 Tata Power Solar Systems - 17/11/2016** CRISIL A1+ 1000 4956.71 0.9227 INE957N14621 Hero Fincorp Ltd - 21/11/2016** CRISIL A1+ 1000 4952.57 0.9128 INE267A14069 Hindustan Zinc Ltd - 29/11/2016** CRISIL A1+ 1000 4946.68 0.9129 INE804I14NP4 ECL Finance Ltd - 29/11/2016** CRISIL A1+ 1000 4944.07 0.9130 INE121H14FG0 Infrastructure Leasing & Financial Services ltd - 01/12/2016** ICRA A1+ 1000 4943.66 0.9131 INE027E14BH3 Family Credit Ltd - 05/12/2016** CARE A1+ 1000 4941.57 0.9132 INE729N14772 TVS Credit Services Ltd - 09/12/2016** ICRA A1+ 1000 4931.99 0.9133 INE523H14XG0 JM Financial Products Ltd - 14/12/2016** CRISIL A1+ 1000 4931.86 0.9134 INE668E14268 Hero Cycles Ltd - 10/11/2016** CRISIL A1+ 800 3970.80 0.7335 INE140A14LZ3 Piramal Enterprises Ltd - 30/11/2016** ICRA A1+ 800 3953.98 0.7336 INE179J14EG7 Birla Tmt Holdings Private Ltd - 14/10/2016** CRISIL A1+ 500 2493.48 0.4637 INE523H14WW9 JM Financial Products Ltd - 11/11/2016** CRISIL A1+ 500 2479.94 0.46 Sub Total 358610.06 66.22 (c) Treasury Bills 1 IN002016X215 91 Days T Bill Maturing on 24/11/2016 Sovereign 29594000 29311.41 5.412 IN002016X231 91 Days T Bill Maturing on 08/12/2016 Sovereign 28698900 28360.65 5.243 IN002016X264 91 Days T Bill Maturing on 29/12/2016 Sovereign 22122000 21781.03 4.024 IN002016X256 91 Days T Bill Maturing on 22/12/2016 Sovereign 20000000 19715.64 3.645 IN002016X181 91 Days T Bill Maturing on 03/11/2016 Sovereign 4064000 4040.19 0.756 IN002016X223 91 Days T Bill Maturing on 01/12/2016 Sovereign 367400 363.52 0.07 Sub Total 103572.45 19.131 Reverse Repo 543.00 0.10 Sub Total 543.00 0.10 Total for Money Market Instruments 522543.81 96.49 (C) Others (a) Deposits with Commercial Banks 1 Deutsche Bank Ltd - 6.85 - 26/12/2016 25000.00 4.622 IndusInd Bank Ltd - 6.75 - 28/11/2016 20000.00 3.693 Yes Bank Ltd - 6.75 - 15/12/2016 10000.00 1.854 IDFC Bank Ltd - 6.75 - 20/12/2016 10000.00 1.855 IndusInd Bank Ltd - 6.9 - 03/11/2016 3000.00 0.55 Total for Others 68000.00 12.56 Cash and Other Net Current Assets (60534.83) (11.18) Grand Total 541550.87 100.00** Thinly traded / Non Traded securities Notesa) Total NPA's provided for and its percentage to NAV - Nil b) Total value and percentage of illiquid equity shares - Nil c) NAV per unit (` per unit)
Direct plan Retail Plan Institutional Plan Regular PlanOptions 31/03/2016 30/09/2016 31/03/2016 30/09/2016 31/03/2016 30/09/2016 31/03/2016 30/09/2016Growth 31.9555 33.1759 29.8002 30.9245 31.0967 32.2696 31.8883 33.0911 Bonus 11.4358 11.8725 - - - - 11.3983 11.8283 Daily Div. 10.1025 10.1025 10.0953 10.0953 10.0953 10.0953 10.0953 10.0953 Weekly Div. 11.4808 11.5543 11.4227 11.4950 - - 11.4646 11.5371 Fortnightly Div. 25.7065 25.8650 10.8539 10.9103 - - 10.8772 10.9434 Monthly Div. 10.6216 10.7019 10.4934 10.5717 - - 10.4803 10.5585 Quarterly Div. 31.7605 32.6768 11.7507 11.8909 - - 31.7383 32.6323d) Dividend declared during the period (` per unit)
Direct plan Retail Plan Institutional Plan Regular PlanOption Individual & HUF Others Individual & HUF Others Individual & HUF Others Individual & HUF Others Daily Div. 0.273537 0.253426 0.270045 0.250198 0.279780 0.259204 0.270002 0.250152Weekly Div. 0.268287 - 0.263758 0.244366 - - 0.264719 0.245261
Fortnightly Div. 0.653309 - 0.280006 0.259418 - - 0.273162 0.253079Monthly Div. 0.280077 - 0.273212 0.253125 - - 0.273039 0.252967Quarterly Div. 0.216680 - 0.216680 - - - 0.216680 - e) Bonus declared during the period-Nilf) Total outstanding exposure in derivative instruments at the end of the period - Nilg) Total investments in foreign securities /ADR'S/GDR'S at the end of the period - Nilh) Average Maturity (years) - 0.16 i) Average Duration (years) - 0.16 j) Repo in corporate debt - Nil
SUNDARAM ULTRA SHORT TERM FUND
Sl No ISIN Code Name of the instrument Industry/ Quantity Mkt Value % of Rating ` in Lakhs NAV A) Debt Instruments a) Listed / awaiting listing on Stock Exchange 1 INE148I07761 Indiabulls Housing Finance Ltd - 4 - 30/12/2016** BWR AAA 900 10438.25 4.832 INE115A07KK3 LIC Housing Finance Ltd - 7.81 - 19/10/2021** CRISIL AAA 750 7510.22 3.473 INE261F08576 National Bank for Agricultural & Rural Development - 8.05 - 04/01/2019 CRISIL AAA 685 6876.87 3.184 INE202B07IJ3 Dewan Housing Finance Corporation Ltd - 9.05 - 09/09/2019** BWR AAA 488225 4874.51 2.255 INE957N07203 Hero Fincorp Ltd - 8.8 - 12/07/2019** ICRA AA+ 400 4052.39 1.876 INE202B07IO3 Dewan Housing Finance Corporation Ltd - 9.25 - 09/09/2023 BWR AAA 350000 3481.59 1.617 INE721A07HH0 Shriram Transport Finance Company Ltd - 9.85 - 15/07/2017** CRISIL AA+ 277000 2801.66 1.308 INE306N07DJ8 Tata Capital Financial Services Ltd - 9.66 - 26/09/2017** ICRA AA+ 250 2540.10 1.179 INE001A07LJ5 Housing Development Finance Corporation Ltd - 8.58 - 08/05/2018** CRISIL AAA 250 2528.41 1.1710 INE115A07JZ3 LIC Housing Finance Ltd - 8.18 - 27/09/2018** CRISIL AAA 250 2516.96 1.1611 INE202B07HQ0 Dewan Housing Finance Corporation Ltd - 9.1 - 16/08/2019** BWR AAA 251722 2515.83 1.1612 INE148I07FQ4 Indiabulls Housing Finance Ltd - 8.8 - 10/08/2018** BWR AAA 250 2502.85 1.1613 INE148I07FL5 Indiabulls Housing Finance Ltd - 8.8 - 09/08/2018** CARE AAA 250 2502.79 1.1614 INE115A07FN7 LIC Housing Finance Ltd - 9.3532 - 19/08/2019** CRISIL AAA 200 2076.28 0.9615 INE572E09379 PNB Housing Finance Ltd - 8.65 - 28/06/2019** IND AAA 200 2036.05 0.9416 INE121A07IT6 Cholamandalam Investment and Finance Company Ltd - 9.5228 - 15/03/2017** ICRA AA 200 2018.73 0.9317 INE202B07IK1 Dewan Housing Finance Corporation Ltd - 9.1 - 09/09/2019** BWR AAA 200000 1999.31 0.9218 INE202B07HV0 Dewan Housing Finance Corporation Ltd - 9.3 - 16/08/2026 BWR AAA 190163 1904.25 0.8819 INE202B07EG8 Dewan Housing Finance Corporation Ltd - 9.74 - 09/06/2017** CARE AAA 154 1547.52 0.7220 INE053T07026 ONGC Mangalore Petrochemicals Ltd - 8.12 - 10/06/2019** IND AAA 150 1523.98 0.7021 INE134E07406 Power Finance Corporation Ltd - 9.81 - 07/10/2018** CRISIL AAA 114 1190.80 0.5522 INE296A08789 Bajaj Finance Ltd - 8.85 - 21/07/2026** IND AAA 100 1023.26 0.4723 INE115A07GF1 LIC Housing Finance Ltd - 8.79 - 24/11/2017** CRISIL AAA 100 1010.69 0.4724 INE115A07ES9 LIC Housing Finance Ltd - 9.69 - 11/01/2017** CARE AAA 100 1006.46 0.4725 INE134E08BH9 Power Finance Corporation Ltd - 11.25 - 28/11/2018** CRISIL AAA 50 537.25 0.2526 INE134E08HU9 Power Finance Corporation Ltd - 8.28 - 04/09/2018 CRISIL AAA 50 507.99 0.2327 INE556F09601 Small Industries Development Bank of India - 8.04 - 15/03/2019** CARE AAA 50 507.50 0.2328 INE238A08286 Axis Bank Ltd - 10.1 - 30/03/2017** ICRA AAA 50 506.41 0.2329 INE261F09EW8 National Bank for Agricultural & Rural Development - 01/01/2019** CRISIL AAA 2500 426.74 0.2030 INE134E08GN6 Power Finance Corporation Ltd - 8.96 - 21/10/2019** CRISIL AAA 36 374.95 0.1731 INE115A07JH1 LIC Housing Finance Ltd - 09/04/2019** CRISIL AAA 20 212.39 0.1032 INE001A07PB3 Housing Development Finance Corporation Ltd - 8.44 - 01/06/2026** CRISIL AAA 2 207.94 0.1033 INE134E08CK1 Power Finance Corporation Ltd - 9.2 - 20/11/2019** CRISIL AAA 17 174.60 0.0834 INE001A07OO9 Housing Development Finance Corporation Ltd - 8.75 - 04/03/2021** CRISIL AAA 1 103.32 0.0535 INE667F08046 Sundaram BNP Paribas Home Finance Ltd - 10 - 03/02/2017** CARE AA 8 80.61 0.0436 INE756I07894 HDB Financial Services Ltd - 8.54 - 12/06/2019** CRISIL AAA 3 30.43 0.01 Sub Total 76149.88 35.21 Total for Debt Instruments 76149.88 35.21 (B) Money Market Instruments (a) Certificate of Deposits 1 INE238A16O43 Axis Bank Ltd - 06/01/2017** CRISIL A1+ 20000 19647.04 9.082 INE261F16207 National Bank for Agricultural & Rural Development - 21/03/2017** CRISIL A1+ 20000 19388.24 8.963 INE526V16036 Abu Dhabi Commercial Bank Ltd - 29/12/2016** CRISIL A1+ 10000 9831.00 4.554 INE112A16JU2 Corporation Bank - 03/03/2017** CRISIL A1+ 7500 7295.12 3.375 INE514E16AL9 Export Import Bank of India - 10/02/2017** CRISIL A1+ 5000 4881.12 2.266 INE514E16AO3 Export Import Bank of India - 01/03/2017** CRISIL A1+ 5000 4864.47 2.257 INE090A163G6 ICICI Bank Ltd - 13/03/2017** ICRA A1+ 5000 4853.70 2.248 INE556F16101 Small Industries Development Bank of India - 31/03/2017** CRISIL A1+ 5000 4838.41 2.249 INE238A16N36 Axis Bank Ltd - 21/07/2017** CRISIL A1+ 5000 4733.63 2.1910 INE112A16JY4 Corporation Bank - 09/03/2017** CRISIL A1+ 4580 4450.12 2.0611 INE008A16L28 IDBI Bank Ltd - 09/02/2017** CRISIL A1+ 2500 2441.17 1.1312 INE090A169E8 ICICI Bank Ltd - 22/02/2017** ICRA A1+ 2500 2435.15 1.1313 INE514E16AM7 Export Import Bank of India - 24/02/2017** CRISIL A1+ 2500 2434.42 1.1314 INE112A16JK3 Corporation Bank - 02/03/2017** CRISIL A1+ 2500 2432.14 1.1215 INE457A16HP5 Bank of Maharashtra - 15/03/2017** CRISIL A1+ 2500 2426.08 1.1216 INE503A16DL4 DCB Bank Ltd - 27/03/2017** CRISIL A1+ 2500 2418.04 1.1217 INE090A168F7 ICICI Bank Ltd - 07/03/2017** ICRA A1+ 2000 1943.57 0.9018 INE112A16KI5 Corporation Bank - 14/03/2017** CRISIL A1+ 2000 1941.55 0.9019 INE608A16MO6 Punjab and Sind Bank - 21/03/2017** ICRA A1+ 2000 1938.91 0.9020 INE238A16I25 Axis Bank Ltd - 17/03/2017** CRISIL A1+ 1070 1037.90 0.4821 INE008A16K29 IDBI Bank Ltd - 07/02/2017** CRISIL A1+ 40 39.07 0.02 Sub Total 106270.83 49.14 (b) Commercial Papers 1 INE657N14IA8 Edelweiss Commodities Services Ltd - 13/03/2017** CRISIL A1+ 3000 14500.73 6.702 INE020E14GY2 STCI Finance Ltd - 28/02/2017** CRISIL A1+ 1000 4844.61 2.243 INE804I14NX8 ECL Finance Ltd - 29/03/2017** CRISIL A1+ 1000 4817.84 2.234 INE020E14HA0 STCI Finance Ltd - 13/03/2017** CRISIL A1+ 500 2415.80 1.125 INE657N14HI3 Edelweiss Commodities Services Ltd - 28/03/2017** CRISIL A1+ 500 2409.41 1.116 INE140A14LY6 Piramal Enterprises Ltd - 28/02/2017** ICRA A1+ 200 969.15 0.457 INE523H14VM2 JM Financial Products Ltd - 06/03/2017** CRISIL A1+ 100 484.14 0.22 Sub Total 30441.67 14.08 (c) Treasury Bills 1 IN002016Y080 182 Days T Bill Maturing on 12/01/2017 Sovereign 312500 306.90 0.14 Sub Total 306.90 0.14 (d) Reverse Repo / CBLO 1 Reverse Repo 936.00 0.43 Sub Total 936.00 0.43 Total for Money Market Instruments 137955.40 63.79 Cash and Other Net Current Assets 2172.47 1.00 Grand Total 216277.74 100.00 ** Thinly traded / Non Traded securities Notesa) Total NPA's provided for and its percentage to NAV - Nil b) Total value and percentage of illiquid equity shares - Nil c) NAV per unit (` per unit)
Direct Plan Retail Plan Institutional Plan Regular PlanOptions 31/03/2016 30/09/2016 31/03/2016 30/09/2016 31/03/2016 30/09/2016 31/03/2016 30/09/2016Growth 20.9792 21.8879 18.8756 19.5469 19.9370 20.6784 20.6898 21.5276 Bonus 11.9845 12.5038 - - - - 11.8443 12.3239 Daily Div. 10.0439 10.0439 10.0370 10.0370 10.0370 10.0370 10.0370 10.0370 Weekly Div. 11.7366 11.8448 11.5381 11.6297 - - 11.6859 11.7881 Fortnightly Div. 11.4234 11.5238 10.9315 11.0134 - - 11.0325 11.1242 Monthly Div. 11.0424 11.1532 10.7127 10.8026 10.7898 10.8839 10.8893 10.9918 Quarterly Div. 11.5315 11.5718 11.2340 11.1757 - - 11.4699 11.4754d) Dividend declared during the period (` per unit)
Direct plan Retail Plan Institutional Plan Regular PlanOption Individual & HUF Others Individual & HUF Others Individual & HUF Others Individual & HUF Others Daily Div. 0.307798 0.285168 0.253385 0.234765 - 0.245202 0.287828 0.266674Weekly Div. 0.291990 - 0.233603 0.216429 - - 0.271420 0.251463Fortnightly Div. 0.314302 - 0.245511 - - 0.282500 - Monthly Div. 0.317862 0.294492 0.251857 0.233340 0.265534 0.246013 0.292610 0.271099Quarterly Div. 0.325020 - 0.325020 0.301125 - - 0.325020 0.301125e) Bonus declared during the period-Nilf) Total outstanding exposure in derivative instruments at the end of the period - Nilg) Total investments in foreign securities /ADR'S/GDR'S at the end of the period - Nilh) Average Maturity (years) - 1.19 i) Average Duration (years) - 0.85 j) Repo in corporate debt - Nil
SUNDARAM INCOME PLUS
Sl No ISIN Code Name of the instrument Industry/ Quantity Mkt Value % of Rating ` in Lakhs NAV A) Debt Instruments a) Listed / awaiting listing on Stock Exchange 1 INE261F08576 National Bank for Agricultural & Rural Development - 8.05 - 04/01/2019 CRISIL AAA 165 1656.47 7.202 INE953L08170 Janalakshmi Financial Services Ltd - 12.25 - 19/01/2018** ICRA A+ 150 1531.80 6.653 INE587O07032 Altico Capital India Private Ltd - 10 - 05/09/2017** IND AA- 15 1500.64 6.524 INE134E08GC9 Power Finance Corporation Ltd - 9.32 - 19/08/2017** CRISIL AAA 100 1016.77 4.425 INE557F08EX9 National Housing Bank - 8.24 - 08/03/2019 CRISIL AAA 100 1004.54 4.366 INE514E08EW5 Export Import Bank of India - 8.2 - 18/02/2019** CRISIL AAA 100 1003.56 4.367 INE202B07HQ0 Dewan Housing Finance Corporation Ltd - 9.1 - 16/08/2019** BWR AAA 88278 882.29 3.83
www.sundarammutual.com
Half-yearly Portfolio Statement of the Schemes of Sundaram Mutual Fund for the period ended September 30, 2016 (Page 8)
8 INE115A07EO8 LIC Housing Finance Ltd - 9.55 - 25/10/2018** CRISIL AAA 50 516.06 2.249 INE694L07057 Talwandi Sabo Power Ltd - 9.27 - 10/11/2017** CRISIL AA-(SO) 50 502.38 2.1810 INE202B07IJ3 Dewan Housing Finance Corporation Ltd - 9.05 - 09/09/2019** BWR AAA 50000 499.21 2.1711 INE202B07HV0 Dewan Housing Finance Corporation Ltd - 9.3 - 16/08/2026 BWR AAA 30000 300.41 1.3012 INE134E07406 Power Finance Corporation Ltd - 9.81 - 07/10/2018** CRISIL AAA 25 261.14 1.1313 INE134E08BE6 Power Finance Corporation Ltd - 11 - 15/09/2018** CRISIL AAA 6 63.85 0.2814 INE053F09FO3 Indian Railway Finance Corporation Ltd - 10.6 - 11/09/2018** CRISIL AAA 5 53.12 0.2315 INE752E07FY6 Power Grid Corporation of India Ltd - 8.8 - 29/09/2019** CRISIL AAA 4 51.95 0.23 Total for Debt Instruments 10844.21 47.11 (B) Money Market Instruments (a) Certificate of Deposits 1 INE008A16M68 IDBI Bank Ltd - 15/02/2017** CRISIL A1+ 2500 2438.54 10.592 INE556F16101 Small Industries Development Bank of India - 31/03/2017** CRISIL A1+ 1000 967.68 4.203 INE261F16181 National Bank for Agricultural & Rural Development - 16/02/2017** CRISIL A1+ 500 487.58 2.124 INE090A168F7 ICICI Bank Ltd - 07/03/2017** ICRA A1+ 500 485.89 2.11 Sub Total 4379.70 19.02 (b) Commercial Papers 1 INE523H14VM2 JM Financial Products Ltd - 06/03/2017** CRISIL A1+ 300 1452.42 6.312 INE657N14IA8 Edelweiss Commodities Services Ltd - 13/03/2017** CRISIL A1+ 300 1450.07 6.303 INE140A14LZ3 Piramal Enterprises Ltd - 30/11/2016** ICRA A1+ 200 988.50 4.294 INE140A14LX8 Piramal Enterprises Ltd - 13/12/2016** ICRA A1+ 200 986.02 4.285 INE657N14HI3 Edelweiss Commodities Services Ltd - 28/03/2017** CRISIL A1+ 200 963.76 4.19 Sub Total 5840.77 25.371 (c) Reverse Repo 512.00 2.22 Sub Total 512.00 2.22 Total for Money Market Instruments 10732.47 46.62 Cash and Other Net Current Assets 1444.46 6.27 Grand Total 23021.14 100.00** Thinly traded / Non Traded securities Notesa) Total NPA's provided for and its percentage to NAV - Nil b) Total value and percentage of illiquid equity shares - Nil c) NAV per unit (` per unit)
Direct plan Regular planOptions 31/03/2016 30/09/2016 31/03/2016 30/09/2016Growth 22.3010 23.3441 22.2441 23.0531 Dividend 11.1549 11.6766 11.1227 11.5241 Weekly Div. - 10.8639 11.6748 11.1245 Monthly Div. 11.6062 11.8929 11.5736 11.7455 Quarterly Div. - - 11.5741 11.6887d) Dividend declared during the period (` per unit)
Direct plan Regular planOption Individual & HUF Others Individual & HUF OthersWeekly Div. 0.613921 - 0.722260 0.434954Monthly Div. 0.216678 - 0.216678 0.100374Quarterly Div. - - 0.216680 - e) Total outstanding exposure in derivative instruments at the end of the period - Nilf) Total investments in foreign securities /ADR'S/GDR'S at the end of the period - Nilg) Average Maturity (years) - 1.14 h) Average Duration (years) - 0.72 i) Repo in corporate debt - Nil
SUNDARAM FLEXIBLE FUND SHORT TERM PLAN
Sl No ISIN Code Name of the instrument Industry/ Quantity Mkt Value % of Rating ` in Lakhs NAV A) Money Market Instruments a) Certificate of Deposits 1 INE095A16RZ1 IndusInd Bank Ltd - 13/03/2017** CRISIL A1+ 20000 19412.24 12.632 INE112A16KN5 Corporation Bank - 20/03/2017** CRISIL A1+ 15000 14546.09 9.473 INE261F16181 National Bank for Agricultural & Rural Development - 16/02/2017** CRISIL A1+ 14500 14139.95 9.204 INE556F16101 Small Industries Development Bank of India - 31/03/2017** CRISIL A1+ 11000 10644.50 6.935 INE090A164F6 ICICI Bank Ltd - 03/03/2017** ICRA A1+ 10000 9724.85 6.336 INE556F16093 Small Industries Development Bank of India - 13/03/2017** CRISIL A1+ 10000 9708.02 6.327 INE238A16I58 Axis Bank Ltd - 30/03/2017** CRISIL A1+ 10000 9677.39 6.308 INE008A16K52 IDBI Bank Ltd - 14/02/2017** CRISIL A1+ 7500 7316.93 4.769 INE434A16MX8 andhra Bank - 07/03/2017** IND A1+ 7500 7288.85 4.7410 INE705A16NU5 Vijaya Bank - 21/03/2017** CARE A1+ 7500 7270.76 4.7311 INE514E16AM7 Export Import Bank of India - 24/02/2017** CRISIL A1+ 7110 6923.48 4.5112 INE434A16MW0 andhra Bank - 03/03/2017** IND A1+ 5000 4862.72 3.1613 INE476A16RG3 Canara Bank - 16/03/2017** CRISIL A1+ 5000 4852.47 3.1614 INE040A16AV2 HDFC Bank Ltd - 20/03/2017** IND A1+ 5000 4847.93 3.1515 INE238A16J99 Axis Bank Ltd - 28/03/2017** CRISIL A1+ 5000 4840.43 3.1516 INE261F16173 National Bank for Agricultural & Rural Development - 15/02/2017** CRISIL A1+ 2500 2438.36 1.5917 INE112A16JK3 Corporation Bank - 02/03/2017** CRISIL A1+ 2500 2432.14 1.5818 INE476A16QX0 Canara Bank - 06/03/2017** CRISIL A1+ 2500 2430.56 1.5819 INE705A16NQ3 Vijaya Bank - 10/03/2017** CARE A1+ 2500 2428.36 1.5820 INE649A16FW7 State Bank of Hyderabad - 15/03/2017** ICRA A1+ 2500 2427.04 1.5821 INE514E16AP0 Export Import Bank of India - 14/03/2017** CRISIL A1+ 2500 2426.57 1.5822 INE261F16207 National Bank for Agricultural & Rural Development - 21/03/2017** CRISIL A1+ 2500 2423.53 1.5823 INE008A16K29 IDBI Bank Ltd - 07/02/2017** CRISIL A1+ 500 488.41 0.32 Sub Total 153551.56 99.93 (b) Reverse Repo / CBLO 1 Reverse Repo 127.00 0.08 Sub Total 127.00 0.08 Total for Money Market Instruments 153678.56 100.01 Cash and Other Net Current Assets (15.38) (0.01) Grand Total 153663.19 100.00** Thinly traded / Non Traded securities Notesa) Total NPA's provided for and its percentage to NAV - Nil b) Total value and percentage of illiquid equity shares - Nil c) NAV per unit (` per unit)
Direct plan Retail Plan Regular PlanOptions 31/03/2016 30/09/2016 31/03/2016 30/09/2016 31/03/2016 30/09/2016Growth 23.9595 24.8796 21.7336 22.4182 23.8901 24.8037 Bonus 11.9870 12.4473 - - 12.0472 12.5079 Daily Div. 10.0519 10.0519 - - 10.0519 10.0519 Weekly Div. - - - - 10.7980 10.9019 Monthly Div. 10.8297 10.9153 10.7319 10.8013 10.8259 10.9111 d) Dividend declared during the period (` per unit)
Direct plan Retail Plan Regular PlanOption Individual & HUF Others Individual & HUF Others Individual & HUF Others Daily Div. 0.273964 0.176926 - - 0.272927 0.252863Weekly Div. - - - - 0.227232 0.170292Monthly Div. 0.289231 - 0.231738 0.214703 0.283650 0.262797 e) Bonus declared during the period-Nilf) Total outstanding exposure in derivative instruments at the end of the period - Nilg) Total investments in foreign securities /ADR'S/GDR'S at the end of the period - Nilh) Average Maturity (years) - 0.44i) Average Duration (years) - 0.44j) Repo in corporate debt - Nil
SUNDARAM FLEXIBLE FUND FLEXIBLE INCOME PLAN
Sl No ISIN Code Name of the instrument Industry/ Quantity Mkt Value % of Rating ` in Lakhs NAV A) Debt Instruments a) Listed / awaiting listing on Stock Exchange 1 INE020B08831 Rural Electrification Corporation Ltd - 8.82 - 12/04/2023** CRISIL AAA 800 8527.74 13.102 INE115A07JO7 LIC Housing Finance Ltd - 8.48 - 09/06/2023** CRISIL AAA 650 6694.36 10.293 INE752E07KN9 Power Grid Corporation of India Ltd - 8.8 - 13/03/2023** CRISIL AAA 500 5327.88 8.194 INE134E08FN8 Power Finance Corporation Ltd - 8.9 - 18/03/2023** CRISIL AAA 450 4801.01 7.385 INE134E08FJ6 Power Finance Corporation Ltd - 8.84 - 04/03/2023** CRISIL AAA 450 4786.32 7.356 INE941D07133 Reliance Ports and Terminals Ltd - 8.45 - 12/06/2023** CRISIL AAA 400 4091.62 6.297 INE936D07067 Reliance Utilities and Power Private Ltd - 8.95 - 26/04/2023** CRISIL AAA 300 3118.22 4.798 INE053F07603 Indian Railway Finance Corporation Ltd - 8.83 - 25/03/2023** CRISIL AAA 250 2676.58 4.119 INE752E07LX6 Power Grid Corporation of India Ltd - 8.93 - 20/10/2023** CRISIL AAA 200 2155.85 3.3110 INE514E08CK4 Export Import Bank of India - 8.5 - 26/04/2023** CRISIL AAA 200 2105.22 3.2311 INE895D08576 Tata Sons Ltd - 8.32 - 21/05/2023** CRISIL AAA 200 2039.17 3.1312 INE514E08CI8 Export Import Bank of India - 8.8 - 15/03/2023** CRISIL AAA 150 1600.12 2.4613 INE752E07KU4 Power Grid Corporation of India Ltd - 7.93 - 20/05/2023** CRISIL AAA 150 1534.42 2.3614 INE514E08CT5 Export Import Bank of India - 9.4 - 14/08/2023** CRISIL AAA 100 1101.94 1.6915 INE848E07831 NHPC Ltd - 8.5 - 14/07/2023 IND AAA 1000 1054.25 1.6216 INE514E08CQ1 Export Import Bank of India - 8.5 - 08/07/2023** CRISIL AAA 100 1054.08 1.6217 INE001A07KU4 Housing Development Finance Corporation Ltd - 8.95 - 21/03/2023** CRISIL AAA 100 1053.85 1.6218 INE115A07CY1 LIC Housing Finance Ltd - 9.3 - 14/09/2022** CRISIL AAA 50 532.96 0.8219 INE752E07LB2 Power Grid Corporation of India Ltd - 8.7 - 15/07/2023 CRISIL AAA 50 531.82 0.8220 INE020B08849 Rural Electrification Corporation Ltd - 8.06 - 31/05/2023** CRISIL AAA 50 513.17 0.79 Sub Total 55300.58 84.97
(b) Govt Security 1 IN2920160099 8.27 Rajasthan State Development Loan 23/06/2023 Sovereign 2500000 2605.55 4.002 IN1620160029 8.18 Haryana State Development Loan 15/06/2023 Sovereign 2500000 2593.59 3.99 Sub Total 5199.14 7.99 Total for Debt Instruments 60499.72 92.96 (B) Money Market Instruments 1 Reverse Repo 2528.00 3.88 Total for Money Market Instruments 2528.00 3.88 Cash and Other Net Current Assets 2053.19 3.15 Grand Total 65080.90 100.00 ** Thinly traded / Non Traded securities Notesa) Total NPA's provided for and its percentage to NAV - Nil b) Total value and percentage of illiquid equity shares - Nil c) NAV per unit (` per unit)
Direct plan Regular PlanOptions 31/03/2016 30/09/2016 31/03/2016 30/09/2016Growth 21.0021 22.5820 20.9107 22.4445 Monthly Div. 10.8127 11.5424 10.5605 11.2521 Quarterly Div. - 14.0709 13.3804 14.0532 Halfyearly Div. - - 12.5487 13.1684 Annual Div. - 13.1470 12.2470 13.1453 d) Dividend declared during the period (` per unit)
Direct Plan Regular plan Option Individual & HUF Others Individual & HUF Others Monthly Div. 0.072225 0.026766 0.072225 0.066915Quarterly Div. 0.108340 - 0.216680 0.200750Halfyearly Div. - - 0.216680 - e) Total outstanding exposure in derivative instruments at the end of the period - Nilf) Total investments in foreign securities /ADR'S/GDR'S at the end of the period -Nilg) Average Maturity (years) - 6.13h) Average Duration (years) - 4.46i) Repo in corporate debt - Nil
SUNDARAM GILT FUND
Sl No ISIN Code Name of the instrument Industry/ Quantity Mkt Value % of Rating ` in Lakhs NAV A) Debt Instruments (a) Govt Security 1 IN0020150010 7.68 Central Government Securities 15/12/2023 Sovereign 1000000 1040.62 31.702 IN0020160019 7.61 Central Government Securities 09/05/2030 Sovereign 550000 580.31 17.683 IN0020140060 8.15 Central Government Securities 24/11/2026 Sovereign 500000 537.51 16.374 IN0020150069 7.59 Central Government Securities 20/03/2029 Sovereign 500000 523.46 15.955 IN0020150093 7.59 Central Government Securities 11/01/2026 Sovereign 400000 417.00 12.706 IN2220140148 8.43 Maharashtra State Development Loan 12/11/2024 Sovereign 70800 75.56 2.30 Total for Debt Instruments 3174.46 96.70 (B) Money Market Instruments 1 Reverse Repo 48.00 1.46 Total for Money Market Instruments 48.00 1.46 Cash and Other Net Current Assets 60.35 1.84 Grand Total 3282.81 100.00Notesa) Total NPA's provided for and its percentage to NAV - Nil b) Total value and percentage of illiquid equity shares - Nil c) NAV per unit (` per unit)
Direct plan Regular planOptions 31/03/2016 30/09/2016 31/03/2016 30/09/2016Growth 25.0035 26.7389 24.6985 26.3446 Dividend 11.6726 12.4823 11.4851 12.2506d) Dividend declared during the period (` per unit) - Nil e) Total outstanding exposure in derivative instruments at the end of the period - Nilf) Total investments in foreign securities /ADR'S/GDR'S at the end of the period -Nilg) Average Maturity (years) - 9.71h) Average Duration (years) - 6.55i) Repo in corporate debt - Nil
SUNDARAM SELECT DEBT SHORT TERM ASSET PLAN
Sl No ISIN Code Name of the instrument Industry/ Quantity Mkt Value % of Rating ` in Lakhs NAV A) Debt Instruments a) Listed / awaiting listing on Stock Exchange 1 INE261F08576 National Bank for Agricultural & Rural Development - 8.05 - 04/01/2019 CRISIL AAA 900 9035.30 7.862 INE557F08EX9 National Housing Bank - 8.24 - 08/03/2019 CRISIL AAA 400 4018.17 3.493 INE001A07PB3 Housing Development Finance Corporation Ltd - 8.44 - 01/06/2026** CRISIL AAA 35 3638.95 3.164 INE556F09601 Small Industries Development Bank of India - 8.04 - 15/03/2019** CARE AAA 300 3044.99 2.655 INE001A07PM0 Housing Development Finance Corporation Ltd - 7.95 - 23/09/2019** CRISIL AAA 30 3011.66 2.626 INE115A07JB4 LIC Housing Finance Ltd - 8.75 - 12/02/2021** CRISIL AAA 275 2838.66 2.477 INE115A07JM1 LIC Housing Finance Ltd - 8.45 - 22/05/2026** CRISIL AAA 250 2598.72 2.268 INE134E08HU9 Power Finance Corporation Ltd - 8.28 - 04/09/2018 CRISIL AAA 250 2539.96 2.219 INE110L07054 Reliance Jio Infocomm Ltd - 8.1 - 29/04/2019 CRISIL AAA 250 2519.02 2.1910 INE976I08219 Tata Capital Ltd - 8.75 - 17/08/2018** CRISIL AA+ 250 2507.01 2.1811 INE202B07HV0 Dewan Housing Finance Corporation Ltd - 9.3 - 16/08/2026 BWR AAA 250000 2503.45 2.1812 INE115A07KK3 LIC Housing Finance Ltd - 7.81 - 19/10/2021** CRISIL AAA 250 2503.41 2.1813 INE202B07IJ3 Dewan Housing Finance Corporation Ltd - 9.05 - 09/09/2019** BWR AAA 250000 2496.04 2.1714 INE202B07IO3 Dewan Housing Finance Corporation Ltd - 9.25 - 09/09/2023 BWR AAA 250000 2486.85 2.1615 INE121A07IT6 Cholamandalam Investment and Finance Company Ltd - 9.5228 - 15/03/2017** ICRA AA 230 2321.54 2.0216 INE306N07GZ7 Tata Capital Financial Services Ltd - 8.99 - 23/06/2017** CRISIL AA+ 230 2317.33 2.0117 INE202B07654 Dewan Housing Finance Corporation Ltd - 11.45 - 12/09/2019** CARE AAA 200 2119.38 1.8418 INE957N07203 Hero Fincorp Ltd - 8.8 - 12/07/2019** ICRA AA+ 200 2026.20 1.7619 INE115A07JY6 LIC Housing Finance Ltd - 8.3 - 15/07/2021** CRISIL AAA 150 1526.36 1.3320 INE110L07070 Reliance Jio Infocomm Ltd - 8.32 - 08/07/2021** CRISIL AAA 150 1525.32 1.3321 INE020B08971 Rural Electrification Corporation Ltd - 8.05 - 07/12/2018** CRISIL AAA 150 1520.97 1.3222 INE514E08EW5 Export Import Bank of India - 8.2 - 18/02/2019** CRISIL AAA 150 1505.34 1.3123 INE134E07406 Power Finance Corporation Ltd - 9.81 - 07/10/2018** CRISIL AAA 104 1086.34 0.9424 INE134E08GX5 Power Finance Corporation Ltd - 8.36 - 26/02/2020** CRISIL AAA 100 1027.75 0.8925 INE053F07850 Indian Railway Finance Corporation Ltd - 8.33 - 26/03/2019** CRISIL AAA 100 1023.78 0.8926 INE134E08HB9 Power Finance Corporation Ltd - 8.4 - 19/06/2018** CRISIL AAA 100 1016.18 0.8827 INE053T07026 ONGC Mangalore Petrochemicals Ltd - 8.12 - 10/06/2019** IND AAA 100 1015.98 0.8828 INE134E08IC5 Power Finance Corporation Ltd - 7.85 - 15/04/2019** CRISIL AAA 100 1009.91 0.8829 INE134E08II2 Power Finance Corporation Ltd - 7.63 - 14/08/2026** CRISIL AAA 100 1008.21 0.8830 INE752E07OB6 Power Grid Corporation of India Ltd - 7.55 - 21/09/2031 CRISIL AAA 100 1006.82 0.8831 INE115A07JZ3 LIC Housing Finance Ltd - 8.18 - 27/09/2018** CRISIL AAA 100 1006.78 0.8832 INE752E07HG9 Power Grid Corporation of India Ltd - 8.64 - 08/07/2018** CRISIL AAA 78 995.66 0.8733 INE134E08GC9 Power Finance Corporation Ltd - 9.32 - 19/08/2017** CRISIL AAA 55 559.22 0.4934 INE020B07IA8 Rural Electrification Corporation Ltd - 9.63 - 05/02/2019** CRISIL AAA 50 523.50 0.4635 INE115A07JT6 LIC Housing Finance Ltd - 8.48 - 29/06/2026** CRISIL AAA 50 520.95 0.4536 INE134E08HV7 Power Finance Corporation Ltd - 8.36 - 04/09/2020** CRISIL AAA 50 516.01 0.4537 INE134E08BO5 Power Finance Corporation Ltd - 8.6 - 07/08/2019** CRISIL AAA 50 514.92 0.4538 INE752E07LA4 Power Grid Corporation of India Ltd - 8.7 - 15/07/2018** CRISIL AAA 50 511.21 0.4439 INE001A07OS0 Housing Development Finance Corporation Ltd - 8.35 - 26/04/2021** CRISIL AAA 5 509.66 0.4440 INE001A07LU2 Housing Development Finance Corporation Ltd - 9.75 - 10/10/2016** CRISIL AAA 50 500.24 0.4341 INE202B07IK1 Dewan Housing Finance Corporation Ltd - 9.1 - 09/09/2019** BWR AAA 50000 499.83 0.4342 INE752E07LS6 Power Grid Corporation of India Ltd - 8.93 - 20/10/2018** CRISIL AAA 41 422.37 0.3743 INE261F08527 National Bank for Agricultural & Rural Development - 8.37 - 22/06/2020** CRISIL AAA 22 227.17 0.2044 INE115A07IU6 LIC Housing Finance Ltd - 8.69 - 17/05/2019** CRISIL AAA 2 20.40 0.02 Sub Total 76127.49 66.19 (b) Govt Security 1 IN0020150010 7.68 Central Government Securities 15/12/2023 Sovereign 4500000 4682.81 4.072 IN2920160123 8.19 Rajasthan State Development Loan 23/06/2026 Sovereign 2048000 2150.91 1.873 IN2920160057 7.86 Rajasthan State Development Loan 23/06/2019 Sovereign 2022000 2058.65 1.794 IN0020160019 7.61 Central Government Securities 09/05/2030 Sovereign 1700000 1793.69 1.565 IN2920160115 8.33 Rajasthan State Development Loan 23/06/2025 Sovereign 1548000 1631.99 1.426 IN2920150280 8.39 Rajasthan State Development Loan 15/03/2019 Sovereign 1300000 1336.81 1.167 IN2220120116 8.62 Maharashtra State Development Loan 06/03/2023 Sovereign 1000000 1067.13 0.938 IN2920160065 8.01 Rajasthan State Development Loan 23/06/2020 Sovereign 822000 842.08 0.739 IN2920160107 8.29 Rajasthan State Development Loan 23/06/2024 Sovereign 548000 573.77 0.5010 IN2920160099 8.27 Rajasthan State Development Loan 23/06/2023 Sovereign 548000 571.14 0.5011 IN2920160081 8.27 Rajasthan State Development Loan 23/06/2022 Sovereign 548000 567.92 0.4912 IN2920160073 8.15 Rajasthan State Development Loan 23/06/2021 Sovereign 548000 564.75 0.4913 IN2820150026 8.32 Punjab State Development Loan 13/05/2025 Sovereign 500000 531.01 0.4614 IN1620140039 8.81 Haryana State Development Loan 09/07/2018 Sovereign 350000 360.41 0.31 Sub Total 18733.05 16.29 Total for Debt Instruments 94860.54 82.48 (B) Money Market Instruments (a) Certificate of Deposits 1 INE008A16L36 IDBI Bank Ltd - 17/02/2017** CRISIL A1+ 5000 4875.33 4.24
2 INE514E16AL9 Export Import Bank of India - 10/02/2017** CRISIL A1+ 2500 2440.56 2.123 INE008A16M68 IDBI Bank Ltd - 15/02/2017** CRISIL A1+ 2500 2438.54 2.124 INE556F16093 Small Industries Development Bank of India - 13/03/2017** CRISIL A1+ 2500 2427.01 2.115 INE556F16101 Small Industries Development Bank of India - 31/03/2017** CRISIL A1+ 2500 2419.21 2.106 INE238A16I25 Axis Bank Ltd - 17/03/2017** CRISIL A1+ 540 523.80 0.46 Sub Total 15124.44 13.151 (b) Reverse Repo 7621.00 6.63 Sub Total 7621.00 6.63 Total for Money Market Instruments 22745.44 19.78 Cash and Other Net Current Assets (2594.45) (2.26) Grand Total 115011.53 100.00** Thinly traded/Non Traded Securities Notesa) Total NPA's provided for and its percentage to NAV - Nil b) Total value and percentage of illiquid equity shares - Nil c) NAV per unit (` per unit)
Direct plan Regular planOptions 31/03/2016 30/09/2016 31/03/2016 30/09/2016Growth 26.5802 28.0309 25.9335 27.2161 Bonus 13.2282 13.9507 12.9502 13.5908 Weekly Div. 13.7331 14.0202 13.5688 13.8409 Fortnightly Div. 12.7477 12.9864 12.6856 12.9123 Monthly Div. 12.4391 12.6491 12.2888 12.4832 Quarterly Div. 11.5101 11.6765 11.4863 11.5930 Halfyearly Div. 11.8107 12.1562 11.6076 11.8811 Annual Div. - - 11.2568 11.8135 d) Dividend declared during the period (` per unit)
Direct plan Regular planOption Individual & HUF Others Individual & HUF Others Weekly Div. 0.344396 - 0.289361 0.251187Fortnightly Div. 0.359718 - 0.314566 - Monthly Div. 0.391551 0.362763 0.344098 0.120479Quarterly Div. 0.325020 - 0.325020 0.301125Halfyearly Div. 0.216680 - 0.216680 - e) Bonus declared during the period-Nilf) Total outstanding exposure in derivative instruments at the end of the period - Nilg) Total investments in foreign securities /ADR'S/GDR'S at the end of the period - Nilh) Average Maturity (years) - 3.76 i) Average Duration (years) - 2.54 j) Repo in corporate debt - Nil
SUNDARAM MONTHLY INCOME PLAN - AGGRESSIVE
Sl No ISIN Code Name of the instrument Industry/ Quantity Mkt Value % of Rating ` in Lakhs NAV A) Equity & Equity Related a) Listed / awaiting listing on Stock Exchange 1 INE203G01019 Indraprastha Gas Ltd Gas 30000 233.43 1.782 INE668F01031 Jyothy Laboratories Ltd Consumer Non Durables 58627 202.09 1.543 INE331A01037 The Ramco Cements Ltd Cement 30000 178.62 1.364 INE107A01015 Tamil Nadu Newsprint & Papers Ltd Paper 50000 164.75 1.255 INE002S01010 Mahanagar Gas Ltd Gas 24877 164.23 1.256 INE296A01024 Bajaj Finance Ltd Finance 15000 158.39 1.217 INE036D01010 Karur Vysya Bank Ltd Banks 30000 140.84 1.078 INE976G01028 RBL Bank Ltd Banks 46364 135.01 1.039 INE043D01016 Infrastructure Development Finance Finance 200000 134.40 1.0210 INE233B01017 Blue Dart Express Ltd Transportation 2400 131.57 1.0011 INE092A01019 Tata Chemicals Ltd Chemicals 25000 131.15 1.0012 INE262H01013 Persistent Systems Ltd Software 20000 128.02 0.9713 INE075I01017 Healthcare Global Enterprises Ltd Healthcare Services 55000 121.58 0.9314 INE334L01012 Ujjivan Financial Services Ltd Finance 25000 111.84 0.8515 INE010V01017 L&T Technology Services Ltd Software 11600 98.27 0.7516 INE203A01020 Astra Zeneca Pharma India Ltd Pharmaceuticals 10000 92.88 0.7117 INE935A01035 GlenMark Pharmaceuticals Ltd Pharmaceuticals 10000 92.35 0.7018 INE628A01036 UPL Ltd Pesticides 11500 77.49 0.5919 INE536H01010 Mahindra CIE Automotive Ltd Industrial Products 40000 76.76 0.5820 INE462A01022 Bayer Cropscience Ltd Pesticides 1500 67.08 0.5121 INE383A01012 The India Cements Ltd Cement 45000 64.80 0.4922 INE066P01011 INOX Wind Ltd Industrial Capital Goods 30000 60.08 0.4623 INE415A01038 HSIL Ltd Consumer Durables 15000 51.00 0.39 Total for Equity & Equity Related 2816.60 21.45 (B) Debt Instruments (a) Listed / awaiting listing on Stock Exchange 1 INE694L07040 Talwandi Sabo Power Ltd - 9.7 - 18/09/2017** CRISIL AA-(SO) 110 1108.16 8.442 INE121A07IT6 Cholamandalam Investment and Finance Company Ltd - 9.5228 - 15/03/2017** ICRA AA 70 706.55 5.383 INE752E07LQ0 Power Grid Corporation of India Ltd - 9.3 - 04/09/2024** CRISIL AAA 50 553.31 4.214 INE895D07487 Tata Sons Ltd - 9.3 - 19/06/2024** CRISIL AAA 50 538.49 4.105 INE202B07654 Dewan Housing Finance Corporation Ltd - 11.45 - 12/09/2019** CARE AAA 50 529.84 4.036 INE001A07OY8 Housing Development Finance Corporation Ltd - 8.45 - 18/05/2026** CRISIL AAA 5 520.11 3.967 INE001A07PB3 Housing Development Finance Corporation Ltd - 8.44 - 01/06/2026** CRISIL AAA 5 519.85 3.968 INE020B07HY0 Rural Electrification Corporation Ltd - 9.38 - 06/11/2018** CRISIL AAA 50 519.34 3.959 INE084A08078 Bank of India - 11.5 - 22/06/2021** CRISIL A+ 50 514.60 3.9210 INE053F07850 Indian Railway Finance Corporation Ltd - 8.33 - 26/03/2019** CRISIL AAA 50 511.89 3.9011 INE694L07057 Talwandi Sabo Power Ltd - 9.27 - 10/11/2017** CRISIL AA-(SO) 50 502.38 3.8312 INE202B07HV0 Dewan Housing Finance Corporation Ltd - 9.3 - 16/08/2026 BWR AAA 50000 500.69 3.8113 INE134E08CK1 Power Finance Corporation Ltd - 9.2 - 20/11/2019** CRISIL AAA 33 338.93 2.5814 INE752E07GK3 Power Grid Corporation of India Ltd - 8.9 - 25/02/2020** CRISIL AAA 20 261.24 1.9915 INE115A07JB4 LIC Housing Finance Ltd - 8.75 - 12/02/2021** CRISIL AAA 25 258.06 1.9616 INE134E07513 Power Finance Corporation Ltd - 9.69 - 02/03/2019** CRISIL AAA 22 230.72 1.7617 INE134E08HP9 Power Finance Corporation Ltd - 8.53 - 24/07/2020** CRISIL AAA 21 217.63 1.6618 INE134E08GJ4 Power Finance Corporation Ltd - 9.32 - 17/09/2019** CRISIL AAA 20 209.95 1.6019 INE306N07GZ7 Tata Capital Financial Services Ltd - 8.99 - 23/06/2017** CRISIL AA+ 20 201.51 1.5320 INE020B07JB4 Rural Electrification Corporation Ltd - 9.06 - 23/09/2017** CRISIL AAA 16 162.59 1.2421 INE296A07BC7 Bajaj Finance Ltd - 9.9 - 25/04/2017** CRISIL AA+ 15 151.53 1.1522 INE667F08046 Sundaram BNP Paribas Home Finance Ltd - 10 - 03/02/2017** CARE AA 3 30.23 0.23 Sub Total 9087.60 69.20 (b) Govt Security 1 IN2920150280 8.39 Rajasthan State Development Loan 15/03/2019 Sovereign 200000 205.66 1.57 Sub Total 205.66 1.57 Total for Debt Instruments 9293.27 70.76 (C) Money Market Instruments 1 Reverse Repo 648.00 4.93 Total for Money Market Instruments 648.00 4.93 Cash and Other Net Current Assets 374.97 2.86 Grand Total 13132.84 100.00** Thinly traded / Non Traded securities Notesa) Total NPA's provided for and its percentage to NAV - Nil b) Total value and percentage of illiquid equity shares - Nil c) NAV per unit (` per unit)
Direct plan Regular planOptions 31/03/2016 30/09/2016 31/03/2016 30/09/2016Growth 15.8026 17.4115 15.6414 17.1855 Monthly Div. - 14.2502 13.1724 14.1579 Quarterly Div. 13.1386 14.1667 13.0532 14.0326 Halfyearly Div. - 14.0165 12.8677 13.8374 d) Dividend declared during the period (˜` per unit)
Direct plan Regular PlanOption Individual & HUF Others Individual & HUF Others Monthly Div. 0.036113 0.033458 0.216678 0.200748Quarterly Div. 0.216680 - 0.216680 0.200750Halfyearly Div. 0.216680 - 0.216680 0.200749e) Total outstanding exposure in derivative instruments at the end of the period - Nilf) Total investments in foreign securities /ADR'S/GDR'S at the end of the period - Nilg) Average Maturity (years) - 2.88h) Average Duration (years) - 2.08i) Repo in corporate debt - Nil
SUNDARAM MONTHLY INCOME PLAN - CONSERVATIVE
Sl No ISIN Code Name of the instrument Industry/ Quantity Mkt Value % of Rating ` in Lakhs NAV A) Equity & Equity Related a) Listed / awaiting listing on Stock Exchange 1 INE237A01028 Kotak Mahindra Bank Ltd Banks 2000 15.54 0.192 INE030A01027 Hindustan Unilever Ltd Consumer Non Durables 1400 12.15 0.153 INE101A01026 Mahindra & Mahindra Ltd Auto 800 11.25 0.14
www.sundarammutual.com
Half-yearly Portfolio Statement of the Schemes of Sundaram Mutual Fund for the period ended September 30, 2016 (Page 9)
4 INE075A01022 Wipro Ltd Software 1700 8.14 0.105 INE018A01030 Larsen & Toubro Ltd Construction Project 500 7.17 0.09 Total for Equity & Equity Related 54.24 0.68 (B) Debt Instruments (a) Listed / awaiting listing on Stock Exchange 1 INE121A07HX0 Cholamandalam Investment and Finance Company Ltd - 9.9022 - 28/06/2019** ICRA AA 100 1038.26 13.032 INE860H07466 Aditya Birla Finance Ltd - 9.75 - 04/04/2019** IND AA+ 78 808.31 10.143 INE556F09601 Small Industries Development Bank of India - 8.04 - 15/03/2019** CARE AAA 78 791.70 9.934 INE134E07513 Power Finance Corporation Ltd - 9.69 - 02/03/2019** CRISIL AAA 73 765.58 9.615 INE476M07131 L&T Housing Finance Ltd - 9.79 - 28/06/2019** ICRA AA+ 23 597.61 7.506 INE752E07ML9 Power Grid Corporation of India Ltd - 8.4 - 27/05/2019** CRISIL AAA 50 512.53 6.437 INE310L07522 IOT Utkal Energy Services Ltd - 9.843 - 20/06/2019** CRISIL AAA 430 465.03 5.838 INE020B07HZ7 Rural Electrification Corporation Ltd - 9.61 - 03/01/2019** CRISIL AAA 37 386.66 4.859 INE310L07514 IOT Utkal Energy Services Ltd - 9.843 - 20/05/2019** CRISIL AAA 210 226.56 2.8410 INE261F08642 National Bank for Agricultural & Rural Development - 7.85 - 31/05/2019** CRISIL AAA 22 222.75 2.7911 INE752E07HG9 Power Grid Corporation of India Ltd - 8.64 - 08/07/2018** CRISIL AAA 17 217.00 2.7212 INE020B07IA8 Rural Electrification Corporation Ltd - 9.63 - 05/02/2019** CRISIL AAA 20 209.40 2.6313 INE895D07479 Tata Sons Ltd - 9.25 - 19/06/2019** CRISIL AAA 20 206.55 2.5914 INE020B07IV4 Rural Electrification Corporation Ltd - 9.02 - 18/06/2019** CRISIL AAA 16 166.30 2.0915 INE020B07HY0 Rural Electrification Corporation Ltd - 9.38 - 06/11/2018** CRISIL AAA 10 103.87 1.3016 INE296A07BB9 Bajaj Finance Ltd - 10 - 25/04/2019** CRISIL AA+ 4 41.87 0.53 Sub Total 6759.98 84.81 (b) Govt Security 1 IN2920150280 8.39 Rajasthan State Development Loan 15/03/2019 Sovereign 500000 514.16 6.45 Sub Total 514.16 6.45 Total for Debt Instruments 7274.14 91.27 (C) Money Market Instruments 1 Reverse Repo 242.00 3.04 Total for Money Market Instruments 242.00 3.04 Cash and Other Net Current Assets 399.96 5.02 Grand Total 7970.35 100.00** Thinly traded / Non Traded securities Notesa) Total NPA's provided for and its percentage to NAV - Nil b) Total value and percentage of illiquid equity shares - Nil c) NAV per unit (` per unit)
Direct plan Regular planOptions 31/03/2016 30/09/2016 31/03/2016 30/09/2016Growth 14.5697 15.3748 14.3225 15.0840 Monthly Div. 11.7818 12.1005 Quarterly Div. 11.3895 11.7135 11.3574 11.6561 Halfyearly Div. 11.5425 11.8558d) Dividend declared during the period (` per unit)
Direct plan Regular PlanOption Individual & HUF Others Individual & HUF Others Monthly Div. - - 0.216678 0.200748Quarterly Div. 0.216680 - 0.216680 - Halfyearly Div. - - 0.216680 - e) Total outstanding exposure in derivative instruments at the end of the period - Nilf) Total investments in foreign securities /ADR'S/GDR'S at the end of the period -Nilg) Average Maturity (years) - 2.32h) Average Duration (years) - 1.98i) Repo in corporate debt - Nil
SUNDARAM CAPITAL PROTECTION ORIENTED FUND 5 YEARS (SERIES 3)
Sl No ISIN Code Name of the instrument Industry/ Quantity Mkt Value % of Rating ` in Lakhs NAV A) Equity & Equity Related a) Listed / awaiting listing on Stock Exchange 1 INE040A01026 HDFC Bank Ltd Banks 27025 343.99 2.292 INE001A01036 Housing Development Finance Corporation Ltd Finance 21867 304.71 2.033 INE009A01021 Infosys Ltd Software 27048 280.23 1.874 INE090A01021 ICICI Bank Ltd Banks 84465 212.98 1.425 INE154A01025 ITC Ltd Consumer Non Durables 83937 202.58 1.356 INE018A01030 Larsen & Toubro Ltd Construction Project 13941 199.80 1.337 INE467B01029 Tata Consultancy Services Ltd Software 6780 164.81 1.108 INE155A01022 Tata Motors Ltd Auto 27401 146.55 0.989 INE062A01020 State Bank Of India Ltd Banks 57650 144.85 0.9710 INE326A01037 Lupin Ltd Pharmaceuticals 8412 125.02 0.8311 INE585B01010 Maruti Suzuki India Ltd Auto 2269 124.28 0.8312 INE030A01027 Hindustan Unilever Ltd Consumer Non Durables 11075 96.11 0.6413 INE101A01026 Mahindra & Mahindra Ltd Auto 6724 94.52 0.6314 INE029A01011 Bharat Petroleum Corporation Ltd Petroleum Products 14898 91.27 0.6115 INE044A01036 Sun Pharmaceuticals Industries Ltd Pharmaceuticals 11358 84.36 0.5616 INE669C01036 Tech Mahindra Ltd Software 19936 83.70 0.5617 INE213A01029 Oil & Natural Gas Corporation Ltd Oil 31557 80.99 0.5418 INE397D01024 Bharti Airtel Ltd Telecom - Services 24945 78.33 0.5219 INE089A01023 Dr. Reddy's Laboratories Ltd Pharmaceuticals 2512 78.06 0.5220 INE237A01028 Kotak Mahindra Bank Ltd Banks 9210 71.56 0.4821 INE860A01027 HCL Technologies Ltd Software 8930 71.43 0.4822 INE121J01017 Bharti Infratel Ltd Telecom-Equipment & Accessories 18319 66.92 0.4523 INE481G01011 UltraTech Cement Ltd Cement 1644 63.32 0.4224 INE075A01022 Wipro Ltd Software 10202 48.86 0.3325 INE158A01026 Hero MotoCorp Ltd Auto 1271 43.39 0.2926 INE245A01021 Tata Power Company Ltd Power 56410 42.53 0.2827 INE059A01026 Cipla Ltd Pharmaceuticals 6925 40.17 0.2728 INE021A01026 Asian Paints Ltd Consumer Non Durables 3208 37.24 0.2529 INE910H01017 Cairn India Ltd Oil 17310 34.63 0.2330 INE081A01012 Tata Steel Ltd Ferrous Metals 9179 34.35 0.2331 INE256A01028 Zee Entertainment Enterprises Ltd Media & Entertainment 5666 30.98 0.2132 INE522F01014 Coal India Ltd Minerals/Mining 9607 30.96 0.2133 INE129A01019 GAIL (India) Ltd Gas 7941 29.75 0.2034 INE160A01022 Punjab National Bank Banks 15590 21.94 0.1535 INE205A01025 Vedanta Ltd Non - Ferrous Metals 9974 17.16 0.1136 INE669E01016 Idea Cellular Ltd Telecom - Services 18904 14.95 0.10 Total for Equity & Equity Related 3637.27 24.25 (B) Debt Instruments (a) Listed / awaiting listing on Stock Exchange 1 INE975F07EO4 Kotak Mahindra Investments Ltd - 07/11/2016** CRISIL AAA 220 2184.03 14.562 INE001A07LU2 Housing Development Finance Corporation Ltd - 9.75 - 10/10/2016** CRISIL AAA 30 300.15 2.00 Total for Debt Instruments 2484.18 16.56 (C) Money Market Instruments (a) Treasury Bills 1 IN002016X181 91 Days T Bill Maturing on 03/11/2016 Sovereign 4500000 4473.64 29.832 IN002016Y031 182 Days T Bill Maturing on 03/11/2016 Sovereign 1800000 1789.49 11.93 Sub Total 6263.13 41.76 (b) Reverse Repo/CBLO1 Reverse Repo 2526.00 16.84 Sub Total 2526.00 16.84 Total for Money Market Instruments 8789.13 58.60 Cash and Other Net Current Assets 88.82 0.59 Sub Total 88.82 0.59 Grand Total 14999.40 100.00** Thinly traded / Non Traded securities Notesa) Total NPA's provided for and its percentage to NAV - Nil b) Total value and percentage of illiquid equity shares - Nil c) NAV per unit (` per unit)
Regular planOptions 31/03/2016 30/09/2016Growth 13.9424 14.5785 Dividend 13.9429 14.5791d) Dividend declared during the period (` per unit) - Nile) Total outstanding exposure in derivative instruments at the end of the period - Nilf) Total investments in foreign securities /ADR'S/GDR'S at the end of the period - Nilg) Average Maturity (years) - 0.06h) Average Duration (years) - 0.05i) Repo in corporate debt - Nil
SUNDARAM CAPITAL PROTECTION ORIENTED FUND 5 YEARS (SERIES 4)
Sl No ISIN Code Name of the instrument Industry/ Quantity Mkt Value % of Rating ` in Lakhs NAV A) Equity & Equity Related a) Listed / awaiting listing on Stock Exchange 1 INE040A01026 HDFC Bank Ltd Banks 21271 270.75 2.302 INE001A01036 Housing Development Finance Corporation Ltd Finance 16054 223.70 1.903 INE009A01021 Infosys Ltd Software 21316 220.84 1.884 INE002A01018 Reliance Industries Ltd Petroleum Products 18679 202.42 1.725 INE090A01021 ICICI Bank Ltd Banks 66500 167.68 1.436 INE154A01025 ITC Ltd Consumer Non Durables 67191 162.17 1.387 INE018A01030 Larsen & Toubro Ltd Construction Project 11058 158.48 1.358 INE467B01029 Tata Consultancy Services Ltd Software 5308 129.03 1.109 INE155A01022 Tata Motors Ltd Auto 21453 114.74 0.9810 INE062A01020 State Bank Of India Ltd Banks 45340 113.92 0.9711 INE326A01037 Lupin Ltd Pharmaceuticals 6624 98.45 0.8412 INE585B01010 Maruti Suzuki India Ltd Auto 1792 98.15 0.8313 INE030A01027 Hindustan Unilever Ltd Consumer Non Durables 8682 75.35 0.6414 INE101A01026 Mahindra & Mahindra Ltd Auto 5280 74.22 0.6315 INE029A01011 Bharat Petroleum Corporation Ltd Petroleum Products 11816 72.38 0.6216 INE044A01036 Sun Pharmaceuticals Industries Ltd Pharmaceuticals 8842 65.67 0.5617 INE669C01036 Tech Mahindra Ltd Software 15616 65.56 0.5618 INE213A01029 Oil & Natural Gas Corporation Ltd Oil 24857 63.80 0.5419 INE397D01024 Bharti Airtel Ltd Telecom - Services 19727 61.94 0.5320 INE089A01023 Dr. Reddy's Laboratories Ltd Pharmaceuticals 1979 61.50 0.5221 INE860A01027 HCL Technologies Ltd Software 7058 56.46 0.4822 INE237A01028 Kotak Mahindra Bank Ltd Banks 7146 55.52 0.4723 INE121J01017 Bharti Infratel Ltd Telecom - Equipment & Accessories 14452 52.79 0.4524 INE481G01011 UltraTech Cement Ltd Cement 1289 49.65 0.4225 INE075A01022 Wipro Ltd Software 8069 38.65 0.3326 INE158A01026 Hero MotoCorp Ltd Auto 1008 34.41 0.2927 INE245A01021 Tata Power Company Ltd Power 44740 33.73 0.2928 INE059A01026 Cipla Ltd Pharmaceuticals 5456 31.65 0.2729 INE021A01026 Asian Paints Ltd Consumer Non Durables 2537 29.45 0.2530 INE910H01017 Cairn India Ltd Oil 13663 27.33 0.2331 INE081A01012 Tata Steel Ltd Ferrous Metals 7243 27.11 0.2332 INE522F01014 Coal India Ltd Minerals/Mining 7583 24.44 0.2133 INE256A01028 Zee Entertainment Enterprises Ltd Media & Entertainment 4440 24.28 0.2134 INE129A01019 GAIL (India) Ltd Gas 6260 23.45 0.2035 INE003A01024 Siemens Ltd Industrial Capital Goods 1450 17.98 0.1536 INE160A01022 Punjab National Bank Banks 12275 17.27 0.1537 INE205A01025 Vedanta Ltd Non - Ferrous Metals 7911 13.61 0.1238 INE669E01016 Idea Cellular Ltd Telecom - Services 14861 11.76 0.10 Total for Equity & Equity Related 3070.29 26.10 (B) Debt Instruments (a) Listed / awaiting listing on Stock Exchange 1 INE001A07HN5 Housing Development Finance Corporation Ltd - 9.75 - 07/12/2016** CRISIL AAA 150 1506.65 12.812 INE115A07BO4 LIC Housing Finance Ltd - 9.75 - 30/11/2016** CRISIL AAA 100 1003.95 8.533 INE752E07HQ8 Power Grid Corporation of India Ltd - 8.84 - 21/10/2016** CRISIL AAA 80 1000.90 8.514 INE001A07LU2 Housing Development Finance Corporation Ltd - 9.75 - 10/10/2016** CRISIL AAA 50 500.24 4.25 Total for Debt Instruments 4011.74 34.10 (C) Money Market Instruments (a) Treasury Bills 1 IN002016X223 91 Days T Bill Maturing on 01/12/2016 Sovereign 1000000 989.43 8.412 IN002015Z196 364 Days T Bill Maturing on 08/12/2016 Sovereign 1000000 988.21 8.403 IN002016Y056 182 Days T Bill Maturing on 01/12/2016 Sovereign 500000 494.71 4.214 IN002016Y031 182 Days T Bill Maturing on 03/11/2016 Sovereign 200000 198.83 1.69 Sub Total 2671.19 22.71 (b) Reverse Repo/CBLO1 Reverse Repo 1640.00 13.94 Sub Total 1640.00 13.94 Total for Money Market Instruments 4311.19 36.65 Cash and Other Net Current Assets 371.50 3.16 Sub Total 371.50 3.16 Grand Total 11764.71 100.00** Thinly traded / Non Traded securities Notesa) Total NPA's provided for and its percentage to NAV - Nil b) Total value and percentage of illiquid equity shares - Nil c) NAV per unit (` per unit)
Regular planOptions 31/03/2016 30/09/2016Growth 13.8053 14.4412 Dividend 13.8053 14.4412d) Dividend declared during the period (` per unit) - Nil e) Total outstanding exposure in derivative instruments at the end of the period - Nilf) Total investments in foreign securities /ADR'S/GDR'S at the end of the period -Nilg) Average Maturity (years) - 0.08h) Average Duration (years) - 0.08i) Repo in corporate debt - Nil
SUNDARAM CAPITAL PROTECTION ORIENTED FUND 5 YEARS (SERIES 7)
Sl No ISIN Code Name of the instrument Industry/ Quantity Mkt Value % of Rating ` in Lakhs NAV A) Equity & Equity Related a) Listed / awaiting listing on Stock Exchange 1 INE040A01026 HDFC Bank Ltd Banks 13977 177.91 2.162 INE001A01036 Housing Development Finance Corporation Ltd Finance 12073 168.23 2.043 INE009A01021 Infosys Ltd Software 13440 139.25 1.694 INE090A01021 ICICI Bank Ltd Banks 47812 120.56 1.465 INE002A01018 Reliance Industries Ltd Petroleum Products 10868 117.78 1.436 INE018A01030 Larsen & Toubro Ltd Construction Project 6579 94.29 1.157 INE467B01029 Tata Consultancy Services Ltd Software 3572 86.83 1.058 INE238A01034 Axis Bank Ltd Banks 12563 68.01 0.839 INE062A01020 State Bank Of India Ltd Banks 26481 66.53 0.8110 INE044A01036 Sun Pharmaceuticals Industries Ltd Pharmaceuticals 8201 60.91 0.7411 INE585B01010 Maruti Suzuki India Ltd Auto 1103 60.41 0.7312 INE101A01026 Mahindra & Mahindra Ltd Auto 2894 40.68 0.4913 INE021A01026 Asian Paints Ltd Consumer Non Durables 2911 33.79 0.4114 INE860A01027 HCL Technologies Ltd Software 4212 33.69 0.4115 INE522F01014 Coal India Ltd Minerals/Mining 10366 33.41 0.4116 INE326A01037 Lupin Ltd Pharmaceuticals 2146 31.89 0.3917 INE397D01024 Bharti Airtel Ltd Telecom - Services 9471 29.74 0.3618 INE481G01011 UltraTech Cement Ltd Cement 648 24.96 0.3019 INE528G01019 Yes Bank Ltd Banks 1849 23.20 0.2820 INE029A01011 Bharat Petroleum Corporation Ltd Petroleum Products 3570 21.87 0.27 Total for Equity & Equity Related 1433.93 17.42 (B) Debt Instruments (a) Listed / awaiting listing on Stock Exchange 1 INE752E07NJ1 Power Grid Corporation of India Ltd - 8.32 - 23/12/2020** CRISIL AAA 90 930.86 11.312 INE001A07OO9 Housing Development Finance Corporation Ltd - 8.75 - 04/03/2021** CRISIL AAA 9 929.92 11.303 INE115A07IY8 LIC Housing Finance Ltd - 8.75 - 08/03/2021** CRISIL AAA 90 929.24 11.294 INE134E08HV7 Power Finance Corporation Ltd - 8.36 - 04/09/2020** CRISIL AAA 88 908.17 11.035 INE261F08527 National Bank for Agricultural & Rural Development - 8.37 - 22/06/2020** CRISIL AAA 86 888.02 10.796 INE020B08468 Rural Electrification Corporation Ltd - 8.8 - 29/11/2020** CRISIL AAA 50 524.82 6.377 INE020B08955 Rural Electrification Corporation Ltd - 8.36 - 22/09/2020** CRISIL AAA 39 403.00 4.898 INE848E07690 NHPC Ltd - 8.54 - 26/11/2020** IND AAA 300 312.97 3.809 INE895D08253 Tata Sons Ltd - 8.97 - 15/07/2020** CRISIL AAA 30 310.34 3.7710 INE733E07JZ5 NTPC Ltd - 8.33 - 24/02/2021** CRISIL AAA 20 206.99 2.51 Total for Debt Instruments 6344.34 77.06 (C) Money Market Instruments 1 Reverse Repo 186.00 2.26 Total for Money Market Instruments 186.00 2.26 Cash and Other Net Current Assets 268.68 3.26 Grand Total 8232.95 100.00** Thinly traded / Non Traded securities Notesa) Total NPA's provided for and its percentage to NAV - Nil b) Total value and percentage of illiquid equity shares - Nil c) NAV per unit (` per unit)
Direct plan Regular planOptions 31/03/2016 30/09/2016 31/03/2016 30/09/2016Growth 10.1218 10.7376 10.1121 10.7133 Dividend 10.1218 10.7376 10.1121 10.7133
d) Dividend declared during the period (` per unit) - Nil e) Total outstanding exposure in derivative instruments at the end of the period - Nilf) Total investments in foreign securities /ADR'S/GDR'S at the end of the period -Nilg) Average Maturity (years) - 3.19h) Average Duration (years) - 2.52i) Repo in corporate debt - Nil
SUNDARAM CAPITAL PROTECTION ORIENTED FUND 5 YEARS (SERIES 8)
Sl No ISIN Code Name of the instrument Industry/ Quantity Mkt Value % of Rating ` in Lakhs NAV A) Equity & Equity Related a) Listed / awaiting listing on Stock Exchange 1 INE040A01026 HDFC Bank Ltd Banks 12437 158.30 2.152 INE001A01036 Housing Development Finance Corporation Ltd Finance 11129 155.08 2.113 INE009A01021 Infosys Ltd Software 12123 125.60 1.704 INE090A01021 ICICI Bank Ltd Banks 43747 110.31 1.505 INE002A01018 Reliance Industries Ltd Petroleum Products 9710 105.23 1.436 INE018A01030 Larsen & Toubro Ltd Construction Project 5941 85.14 1.167 INE467B01029 Tata Consultancy Services Ltd Software 3192 77.59 1.058 INE238A01034 Axis Bank Ltd Banks 11444 61.95 0.849 INE062A01020 State Bank Of India Ltd Banks 24205 60.82 0.8310 INE585B01010 Maruti Suzuki India Ltd Auto 1008 55.21 0.7511 INE044A01036 Sun Pharmaceuticals Industries Ltd Pharmaceuticals 7393 54.91 0.7512 INE101A01026 Mahindra & Mahindra Ltd Auto 2604 36.60 0.5013 INE021A01026 Asian Paints Ltd Consumer Non Durables 2616 30.36 0.4114 INE860A01027 HCL Technologies Ltd Software 3758 30.06 0.4115 INE522F01014 Coal India Ltd Minerals/Mining 9270 29.88 0.4116 INE326A01037 Lupin Ltd Pharmaceuticals 1931 28.70 0.3917 INE397D01024 Bharti Airtel Ltd Telecom - Services 8540 26.82 0.3618 INE481G01011 UltraTech Cement Ltd Cement 585 22.53 0.3119 INE528G01019 Yes Bank Ltd Banks 1634 20.50 0.2820 INE029A01011 Bharat Petroleum Corporation Ltd Petroleum Products 3154 19.32 0.26 Total for Equity & Equity Related 1294.91 17.58 (B) Debt Instruments (a) Listed / awaiting listing on Stock Exchange 1 INE733E07JZ5 NTPC Ltd - 8.33 - 24/02/2021** CRISIL AAA 80 827.96 11.242 INE001A07OO9 Housing Development Finance Corporation Ltd - 8.75 - 04/03/2021** CRISIL AAA 8 826.60 11.223 INE115A07JB4 LIC Housing Finance Ltd - 8.75 - 12/02/2021** CRISIL AAA 80 825.79 11.214 INE261F08527 National Bank for Agricultural & Rural Development - 8.37 - 22/06/2020** CRISIL AAA 72 743.46 10.095 INE752E07HI5 Power Grid Corporation of India Ltd - 8.64 - 08/07/2020** CRISIL AAA 40 520.59 7.076 INE134E08HV7 Power Finance Corporation Ltd - 8.36 - 04/09/2020** CRISIL AAA 50 516.01 7.007 INE020B08948 Rural Electrification Corporation Ltd - 8.37 - 14/08/2020 CRISIL AAA 50 515.61 7.008 INE134E08HP9 Power Finance Corporation Ltd - 8.53 - 24/07/2020** CRISIL AAA 29 300.54 4.089 INE848E07690 NHPC Ltd - 8.54 - 26/11/2020** IND AAA 200 208.65 2.8310 INE895D08253 Tata Sons Ltd - 8.97 - 15/07/2020** CRISIL AAA 20 206.89 2.8111 INE020B08955 Rural Electrification Corporation Ltd - 8.36 - 22/09/2020** CRISIL AAA 11 113.67 1.5412 INE752E07NJ1 Power Grid Corporation of India Ltd - 8.32 - 23/12/2020** CRISIL AAA 10 103.43 1.40 Total for Debt Instruments 5709.20 77.50 (C) Money Market Instruments 1 Reverse Repo 142.00 1.93 Total for Money Market Instruments 142.00 1.93 Cash and Other Net Current Assets 220.87 3.00 Grand Total 7366.98 100.00** Thinly traded / Non Traded securities Notesa) Total NPA's provided for and its percentage to NAV - Nil b) Total value and percentage of illiquid equity shares - Nil c) NAV per unit (` per unit)
Direct plan Regular planOptions 06/04/2016 30/09/2016 06/04/2016 30/09/2016Growth 10.0000 10.5687 10.0000 10.5543 Dividend 10.0000 10.5687 10.0000 10.5543d) Dividend declared during the period (` per unit) - Nil e) Total outstanding exposure in derivative instruments at the end of the period - Nilf) Total investments in foreign securities /ADR'S/GDR'S at the end of the period -Nilg) Average Maturity (years) - 3.17h) Average Duration (years) - 2.52i) Repo in corporate debt - Nil
SUNDARAM HYBRID FUND SERIES-C
Sl No ISIN Code Name of the instrument Industry/ Quantity Mkt Value % of Rating ` in Lakhs NAV A) Equity & Equity Related a) Listed / awaiting listing on Stock Exchange 1 INE040A01026 HDFC Bank Ltd Banks 6125 77.96 2.922 INE009A01021 Infosys Ltd Software 6616 68.55 2.563 INE001A01036 Housing Development Finance Corporation Ltd Finance 4564 63.60 2.384 INE002A01018 Reliance Industries Ltd Petroleum Products 5420 58.74 2.205 INE090A01021 ICICI Bank Ltd Banks 20270 51.11 1.916 INE154A01025 ITC Ltd Consumer Non Durables 19815 47.82 1.797 INE018A01030 Larsen & Toubro Ltd Construction Project 2985 42.78 1.608 INE467B01029 Tata Consultancy Services Ltd Software 1541 37.46 1.409 INE237A01028 Kotak Mahindra Bank Ltd Banks 3646 28.33 1.0610 INE238A01034 Axis Bank Ltd Banks 5045 27.31 1.0211 INE062A01020 State Bank Of India Ltd Banks 10170 25.55 0.9612 INE155A01022 Tata Motors Ltd Auto 4709 25.19 0.9413 INE326A01037 Lupin Ltd Pharmaceuticals 1428 21.22 0.7914 INE029A01011 Bharat Petroleum Corporation Ltd Petroleum Products 3300 20.22 0.7615 INE044A01036 Sun Pharmaceuticals Industries Ltd Pharmaceuticals 2533 18.81 0.7016 INE030A01027 Hindustan Unilever Ltd Consumer Non Durables 1996 17.32 0.6517 INE101A01026 Mahindra & Mahindra Ltd Auto 1213 17.05 0.6418 INE860A01027 HCL Technologies Ltd Software 2046 16.37 0.6119 INE089A01023 Dr. Reddy's Laboratories Ltd Pharmaceuticals 452 14.05 0.5320 INE397D01024 Bharti Airtel Ltd Telecom - Services 4392 13.79 0.5221 INE669C01036 Tech Mahindra Ltd Software 3224 13.54 0.5122 INE021A01026 Asian Paints Ltd Consumer Non Durables 1026 11.91 0.4523 INE075A01022 Wipro Ltd Software 2430 11.64 0.4424 INE481G01011 UltraTech Cement Ltd Cement 295 11.36 0.4325 INE256A01028 Zee Entertainment Enterprises Ltd Media & Entertainment 1588 8.68 0.3226 INE158A01026 Hero MotoCorp Ltd Auto 250 8.53 0.3227 INE003A01024 Siemens Ltd Industrial Capital Goods 582 7.22 0.2728 INE213A01029 Oil & Natural Gas Corporation Ltd Oil 2500 6.42 0.2429 INE081A01012 Tata Steel Ltd Ferrous Metals 1545 5.78 0.2230 INE059A01026 Cipla Ltd Pharmaceuticals 975 5.66 0.2131 INE585B01010 Maruti Suzuki India Ltd Auto 100 5.48 0.2032 INE129A01019 GAIL (India) Ltd Gas 1430 5.36 0.2033 INE079A01024 Ambuja Cements Ltd Cement 2075 5.22 0.2034 INE012A01025 ACC Ltd Cement 301 4.82 0.1835 INE245A01021 Tata Power Company Ltd Power 6107 4.60 0.1736 INE910H01017 Cairn India Ltd Oil 2136 4.27 0.1637 INE669E01016 Idea Cellular Ltd Telecom - Services 5295 4.19 0.1638 INE038A01020 Hindalco Industries Ltd Non - Ferrous Metals 2706 4.13 0.1539 INE028A01039 Bank of Baroda Banks 2460 4.12 0.1540 INE205A01025 Vedanta Ltd Non - Ferrous Metals 2175 3.74 0.1441 INE160A01022 Punjab National Bank Banks 2545 3.58 0.1342 INE522F01014 Coal India Ltd Minerals/Mining 1046 3.37 0.13 Total for Equity & Equity Related 836.84 31.31 (B) Money Market Instruments 1 Reverse Repo 1795.00 67.17 Total for Money Market Instruments 1795.00 67.17 Cash and Other Net Current Assets 40.60 1.52 Grand Total 2672.44 100.00** Thinly traded / Non Traded securities Notesa) Total NPA's provided for and its percentage to NAV - Nil b) Total value and percentage of illiquid equity shares - Nil c) NAV per unit (` per unit)
Direct plan Regular planOptions 31/03/2016 30/09/2016 31/03/2016 30/09/2016Growth 12.6206 13.3982 11.8963 12.4605 Halfyearly Div. - - 11.8963 12.4605 Annual Div. - - 11.8963 12.4605
www.sundarammutual.com
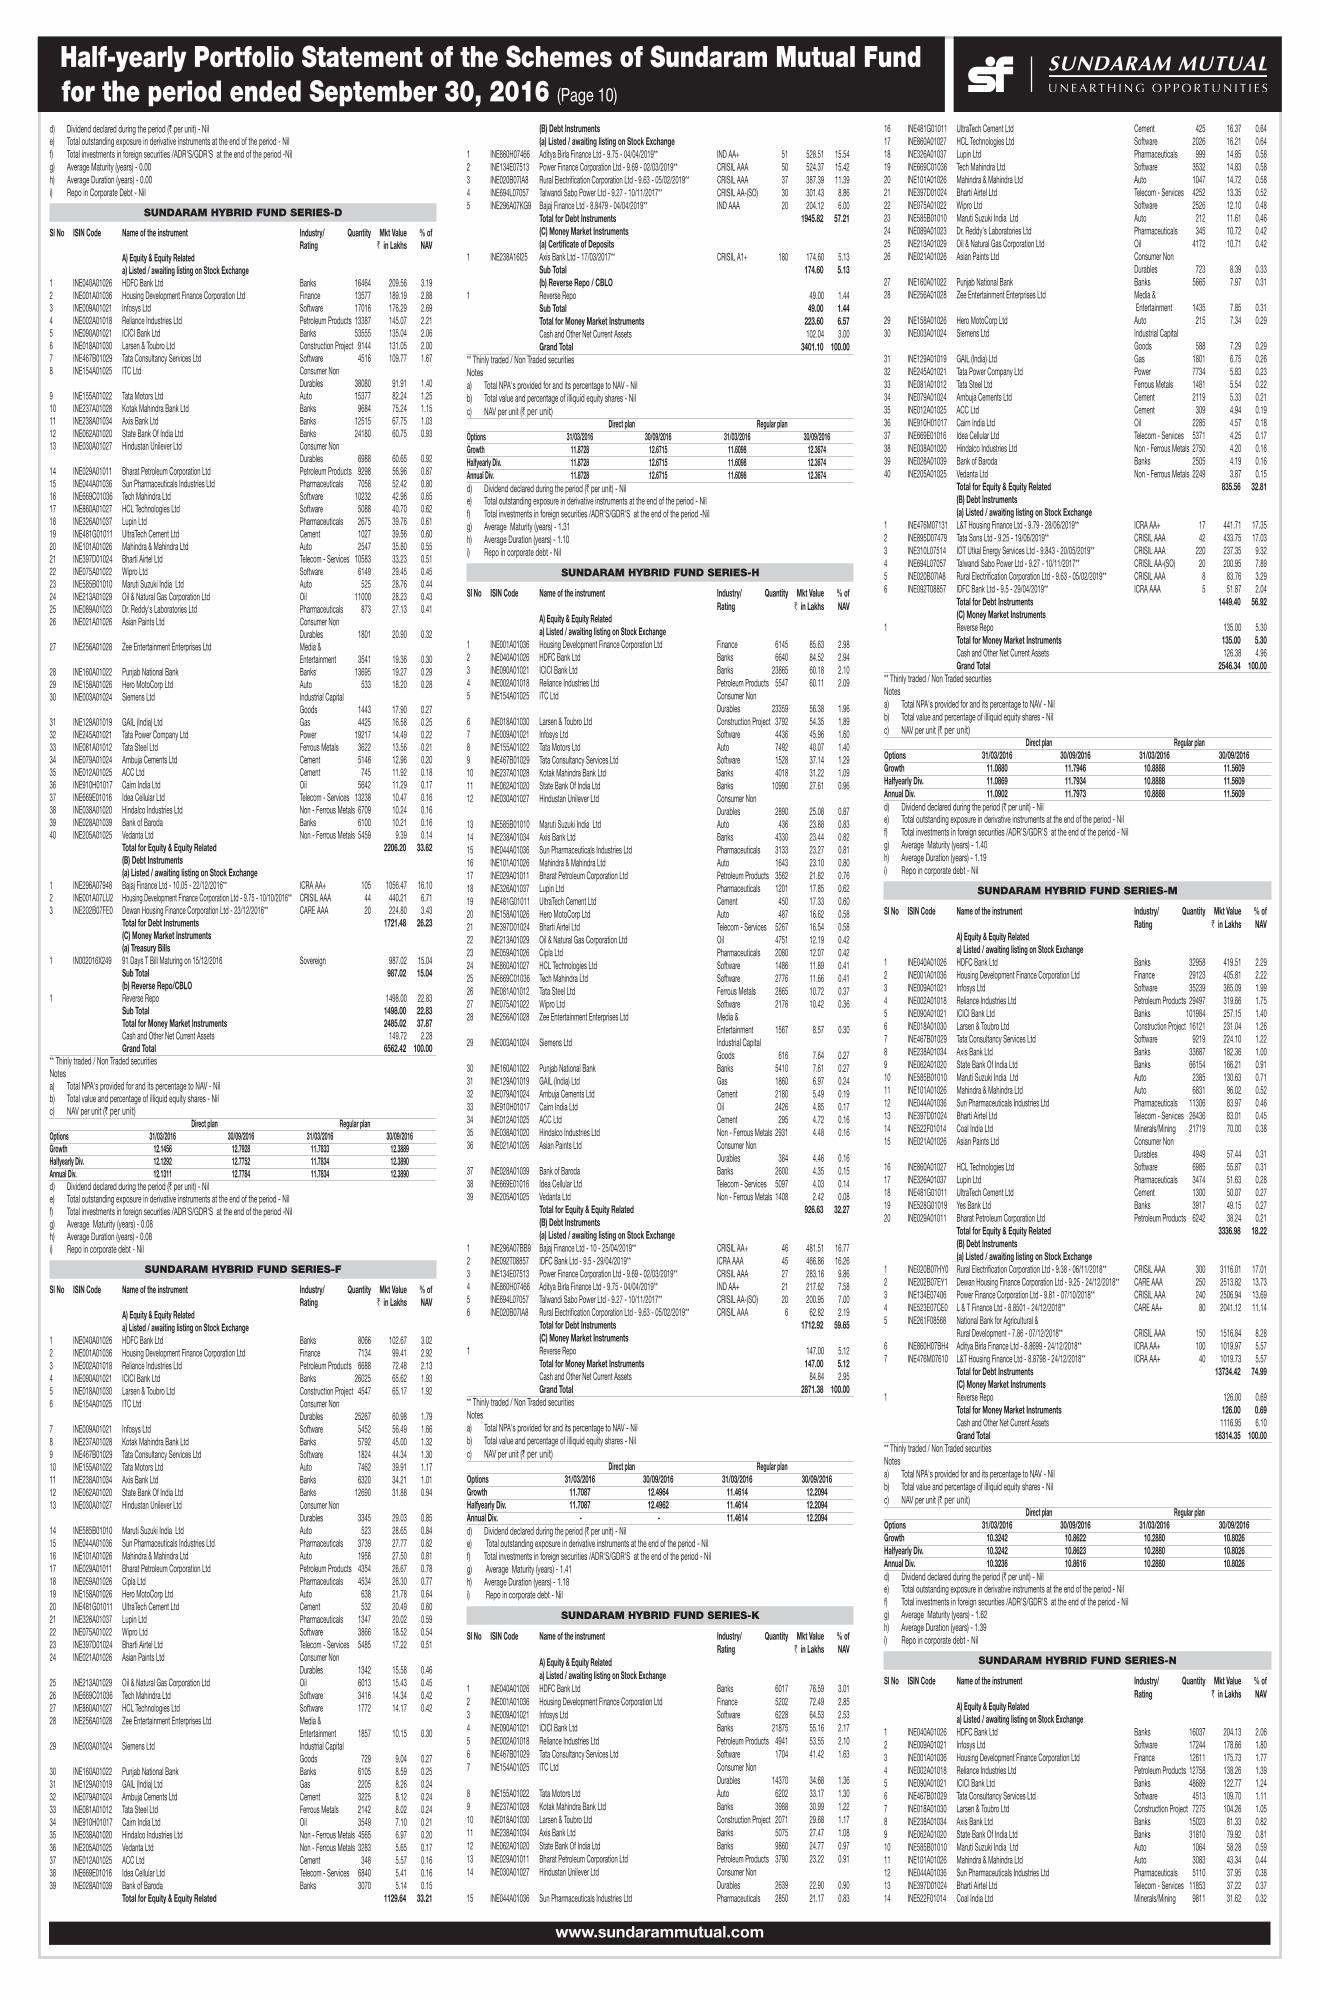
Half-yearly Portfolio Statement of the Schemes of Sundaram Mutual Fund for the period ended September 30, 2016 (Page 10)
d) Dividend declared during the period (` per unit) - Nil e) Total outstanding exposure in derivative instruments at the end of the period - Nilf) Total investments in foreign securities /ADR'S/GDR'S at the end of the period -Nilg) Average Maturity (years) - 0.00h) Average Duration (years) - 0.00i) Repo in Corporate Debt - Nil
SUNDARAM HYBRID FUND SERIES-D
Sl No ISIN Code Name of the instrument Industry/ Quantity Mkt Value % of Rating ` in Lakhs NAV A) Equity & Equity Related a) Listed / awaiting listing on Stock Exchange 1 INE040A01026 HDFC Bank Ltd Banks 16464 209.56 3.192 INE001A01036 Housing Development Finance Corporation Ltd Finance 13577 189.19 2.883 INE009A01021 Infosys Ltd Software 17016 176.29 2.694 INE002A01018 Reliance Industries Ltd Petroleum Products 13387 145.07 2.215 INE090A01021 ICICI Bank Ltd Banks 53555 135.04 2.066 INE018A01030 Larsen & Toubro Ltd Construction Project 9144 131.05 2.007 INE467B01029 Tata Consultancy Services Ltd Software 4516 109.77 1.678 INE154A01025 ITC Ltd Consumer Non Durables 38080 91.91 1.409 INE155A01022 Tata Motors Ltd Auto 15377 82.24 1.2510 INE237A01028 Kotak Mahindra Bank Ltd Banks 9684 75.24 1.1511 INE238A01034 Axis Bank Ltd Banks 12515 67.75 1.0312 INE062A01020 State Bank Of India Ltd Banks 24180 60.75 0.9313 INE030A01027 Hindustan Unilever Ltd Consumer Non Durables 6988 60.65 0.9214 INE029A01011 Bharat Petroleum Corporation Ltd Petroleum Products 9298 56.96 0.8715 INE044A01036 Sun Pharmaceuticals Industries Ltd Pharmaceuticals 7058 52.42 0.8016 INE669C01036 Tech Mahindra Ltd Software 10232 42.96 0.6517 INE860A01027 HCL Technologies Ltd Software 5088 40.70 0.6218 INE326A01037 Lupin Ltd Pharmaceuticals 2675 39.76 0.6119 INE481G01011 UltraTech Cement Ltd Cement 1027 39.56 0.6020 INE101A01026 Mahindra & Mahindra Ltd Auto 2547 35.80 0.5521 INE397D01024 Bharti Airtel Ltd Telecom - Services 10583 33.23 0.5122 INE075A01022 Wipro Ltd Software 6149 29.45 0.4523 INE585B01010 Maruti Suzuki India Ltd Auto 525 28.76 0.4424 INE213A01029 Oil & Natural Gas Corporation Ltd Oil 11000 28.23 0.4325 INE089A01023 Dr. Reddy's Laboratories Ltd Pharmaceuticals 873 27.13 0.4126 INE021A01026 Asian Paints Ltd Consumer Non Durables 1801 20.90 0.3227 INE256A01028 Zee Entertainment Enterprises Ltd Media & Entertainment 3541 19.36 0.3028 INE160A01022 Punjab National Bank Banks 13695 19.27 0.2929 INE158A01026 Hero MotoCorp Ltd Auto 533 18.20 0.2830 INE003A01024 Siemens Ltd Industrial Capital Goods 1443 17.90 0.2731 INE129A01019 GAIL (India) Ltd Gas 4425 16.58 0.2532 INE245A01021 Tata Power Company Ltd Power 19217 14.49 0.2233 INE081A01012 Tata Steel Ltd Ferrous Metals 3622 13.56 0.2134 INE079A01024 Ambuja Cements Ltd Cement 5146 12.96 0.2035 INE012A01025 ACC Ltd Cement 745 11.92 0.1836 INE910H01017 Cairn India Ltd Oil 5642 11.29 0.1737 INE669E01016 Idea Cellular Ltd Telecom - Services 13238 10.47 0.1638 INE038A01020 Hindalco Industries Ltd Non - Ferrous Metals 6709 10.24 0.1639 INE028A01039 Bank of Baroda Banks 6100 10.21 0.1640 INE205A01025 Vedanta Ltd Non - Ferrous Metals 5459 9.39 0.14 Total for Equity & Equity Related 2206.20 33.62 (B) Debt Instruments (a) Listed / awaiting listing on Stock Exchange 1 INE296A07948 Bajaj Finance Ltd - 10.05 - 22/12/2016** ICRA AA+ 105 1056.47 16.102 INE001A07LU2 Housing Development Finance Corporation Ltd - 9.75 - 10/10/2016** CRISIL AAA 44 440.21 6.713 INE202B07FE0 Dewan Housing Finance Corporation Ltd - 23/12/2016** CARE AAA 20 224.80 3.43 Total for Debt Instruments 1721.48 26.23 (C) Money Market Instruments (a) Treasury Bills 1 IN002016X249 91 Days T Bill Maturing on 15/12/2016 Sovereign 987.02 15.04 Sub Total 987.02 15.04 (b) Reverse Repo/CBLO1 Reverse Repo 1498.00 22.83 Sub Total 1498.00 22.83 Total for Money Market Instruments 2485.02 37.87 Cash and Other Net Current Assets 149.72 2.28 Grand Total 6562.42 100.00** Thinly traded / Non Traded securities Notesa) Total NPA's provided for and its percentage to NAV - Nil b) Total value and percentage of illiquid equity shares - Nil c) NAV per unit (` per unit)
Direct plan Regular planOptions 31/03/2016 30/09/2016 31/03/2016 30/09/2016Growth 12.1456 12.7928 11.7833 12.3889 Halfyearly Div. 12.1292 12.7752 11.7834 12.3890 Annual Div. 12.1311 12.7784 11.7834 12.3890d) Dividend declared during the period (` per unit) - Nil e) Total outstanding exposure in derivative instruments at the end of the period - Nilf) Total investments in foreign securities /ADR'S/GDR'S at the end of the period -Nilg) Average Maturity (years) - 0.08h) Average Duration (years) - 0.08i) Repo in corporate debt - Nil
SUNDARAM HYBRID FUND SERIES-F
Sl No ISIN Code Name of the instrument Industry/ Quantity Mkt Value % of Rating ` in Lakhs NAV A) Equity & Equity Related a) Listed / awaiting listing on Stock Exchange 1 INE040A01026 HDFC Bank Ltd Banks 8066 102.67 3.022 INE001A01036 Housing Development Finance Corporation Ltd Finance 7134 99.41 2.923 INE002A01018 Reliance Industries Ltd Petroleum Products 6688 72.48 2.134 INE090A01021 ICICI Bank Ltd Banks 26025 65.62 1.935 INE018A01030 Larsen & Toubro Ltd Construction Project 4547 65.17 1.926 INE154A01025 ITC Ltd Consumer Non Durables 25267 60.98 1.797 INE009A01021 Infosys Ltd Software 5452 56.49 1.668 INE237A01028 Kotak Mahindra Bank Ltd Banks 5792 45.00 1.329 INE467B01029 Tata Consultancy Services Ltd Software 1824 44.34 1.3010 INE155A01022 Tata Motors Ltd Auto 7462 39.91 1.1711 INE238A01034 Axis Bank Ltd Banks 6320 34.21 1.0112 INE062A01020 State Bank Of India Ltd Banks 12690 31.88 0.9413 INE030A01027 Hindustan Unilever Ltd Consumer Non Durables 3345 29.03 0.8514 INE585B01010 Maruti Suzuki India Ltd Auto 523 28.65 0.8415 INE044A01036 Sun Pharmaceuticals Industries Ltd Pharmaceuticals 3739 27.77 0.8216 INE101A01026 Mahindra & Mahindra Ltd Auto 1956 27.50 0.8117 INE029A01011 Bharat Petroleum Corporation Ltd Petroleum Products 4354 26.67 0.7818 INE059A01026 Cipla Ltd Pharmaceuticals 4534 26.30 0.7719 INE158A01026 Hero MotoCorp Ltd Auto 638 21.78 0.6420 INE481G01011 UltraTech Cement Ltd Cement 532 20.49 0.6021 INE326A01037 Lupin Ltd Pharmaceuticals 1347 20.02 0.5922 INE075A01022 Wipro Ltd Software 3866 18.52 0.5423 INE397D01024 Bharti Airtel Ltd Telecom - Services 5485 17.22 0.5124 INE021A01026 Asian Paints Ltd Consumer Non Durables 1342 15.58 0.4625 INE213A01029 Oil & Natural Gas Corporation Ltd Oil 6013 15.43 0.4526 INE669C01036 Tech Mahindra Ltd Software 3416 14.34 0.4227 INE860A01027 HCL Technologies Ltd Software 1772 14.17 0.4228 INE256A01028 Zee Entertainment Enterprises Ltd Media & Entertainment 1857 10.15 0.3029 INE003A01024 Siemens Ltd Industrial Capital Goods 729 9.04 0.2730 INE160A01022 Punjab National Bank Banks 6105 8.59 0.2531 INE129A01019 GAIL (India) Ltd Gas 2205 8.26 0.2432 INE079A01024 Ambuja Cements Ltd Cement 3225 8.12 0.2433 INE081A01012 Tata Steel Ltd Ferrous Metals 2142 8.02 0.2434 INE910H01017 Cairn India Ltd Oil 3549 7.10 0.2135 INE038A01020 Hindalco Industries Ltd Non - Ferrous Metals 4565 6.97 0.2036 INE205A01025 Vedanta Ltd Non - Ferrous Metals 3283 5.65 0.1737 INE012A01025 ACC Ltd Cement 348 5.57 0.1638 INE669E01016 Idea Cellular Ltd Telecom - Services 6840 5.41 0.1639 INE028A01039 Bank of Baroda Banks 3070 5.14 0.15 Total for Equity & Equity Related 1129.64 33.21
(B) Debt Instruments (a) Listed / awaiting listing on Stock Exchange 1 INE860H07466 Aditya Birla Finance Ltd - 9.75 - 04/04/2019** IND AA+ 51 528.51 15.542 INE134E07513 Power Finance Corporation Ltd - 9.69 - 02/03/2019** CRISIL AAA 50 524.37 15.423 INE020B07IA8 Rural Electrification Corporation Ltd - 9.63 - 05/02/2019** CRISIL AAA 37 387.39 11.394 INE694L07057 Talwandi Sabo Power Ltd - 9.27 - 10/11/2017** CRISIL AA-(SO) 30 301.43 8.865 INE296A07KG9 Bajaj Finance Ltd - 8.8479 - 04/04/2019** IND AAA 20 204.12 6.00 Total for Debt Instruments 1945.82 57.21 (C) Money Market Instruments (a) Certificate of Deposits 1 INE238A16I25 Axis Bank Ltd - 17/03/2017** CRISIL A1+ 180 174.60 5.13 Sub Total 174.60 5.13 (b) Reverse Repo / CBLO 1 Reverse Repo 49.00 1.44 Sub Total 49.00 1.44 Total for Money Market Instruments 223.60 6.57 Cash and Other Net Current Assets 102.04 3.00 Grand Total 3401.10 100.00** Thinly traded / Non Traded securities Notesa) Total NPA's provided for and its percentage to NAV - Nil b) Total value and percentage of illiquid equity shares - Nil c) NAV per unit (` per unit)
Direct plan Regular planOptions 31/03/2016 30/09/2016 31/03/2016 30/09/2016Growth 11.8728 12.6715 11.6098 12.3674 Halfyearly Div. 11.8728 12.6715 11.6098 12.3674 Annual Div. 11.8728 12.6715 11.6098 12.3674d) Dividend declared during the period (` per unit) - Nil e) Total outstanding exposure in derivative instruments at the end of the period - Nilf) Total investments in foreign securities /ADR'S/GDR'S at the end of the period -Nilg) Average Maturity (years) - 1.31h) Average Duration (years) - 1.10i) Repo in corporate debt - Nil
SUNDARAM HYBRID FUND SERIES-H
Sl No ISIN Code Name of the instrument Industry/ Quantity Mkt Value % of Rating ` in Lakhs NAV A) Equity & Equity Related a) Listed / awaiting listing on Stock Exchange 1 INE001A01036 Housing Development Finance Corporation Ltd Finance 6145 85.63 2.982 INE040A01026 HDFC Bank Ltd Banks 6640 84.52 2.943 INE090A01021 ICICI Bank Ltd Banks 23865 60.18 2.104 INE002A01018 Reliance Industries Ltd Petroleum Products 5547 60.11 2.095 INE154A01025 ITC Ltd Consumer Non Durables 23359 56.38 1.966 INE018A01030 Larsen & Toubro Ltd Construction Project 3792 54.35 1.897 INE009A01021 Infosys Ltd Software 4436 45.96 1.608 INE155A01022 Tata Motors Ltd Auto 7492 40.07 1.409 INE467B01029 Tata Consultancy Services Ltd Software 1528 37.14 1.2910 INE237A01028 Kotak Mahindra Bank Ltd Banks 4018 31.22 1.0911 INE062A01020 State Bank Of India Ltd Banks 10990 27.61 0.9612 INE030A01027 Hindustan Unilever Ltd Consumer Non Durables 2890 25.08 0.8713 INE585B01010 Maruti Suzuki India Ltd Auto 436 23.88 0.8314 INE238A01034 Axis Bank Ltd Banks 4330 23.44 0.8215 INE044A01036 Sun Pharmaceuticals Industries Ltd Pharmaceuticals 3133 23.27 0.8116 INE101A01026 Mahindra & Mahindra Ltd Auto 1643 23.10 0.8017 INE029A01011 Bharat Petroleum Corporation Ltd Petroleum Products 3562 21.82 0.7618 INE326A01037 Lupin Ltd Pharmaceuticals 1201 17.85 0.6219 INE481G01011 UltraTech Cement Ltd Cement 450 17.33 0.6020 INE158A01026 Hero MotoCorp Ltd Auto 487 16.62 0.5821 INE397D01024 Bharti Airtel Ltd Telecom - Services 5267 16.54 0.5822 INE213A01029 Oil & Natural Gas Corporation Ltd Oil 4751 12.19 0.4223 INE059A01026 Cipla Ltd Pharmaceuticals 2080 12.07 0.4224 INE860A01027 HCL Technologies Ltd Software 1486 11.89 0.4125 INE669C01036 Tech Mahindra Ltd Software 2776 11.66 0.4126 INE081A01012 Tata Steel Ltd Ferrous Metals 2865 10.72 0.3727 INE075A01022 Wipro Ltd Software 2176 10.42 0.3628 INE256A01028 Zee Entertainment Enterprises Ltd Media & Entertainment 1567 8.57 0.3029 INE003A01024 Siemens Ltd Industrial Capital Goods 616 7.64 0.2730 INE160A01022 Punjab National Bank Banks 5410 7.61 0.2731 INE129A01019 GAIL (India) Ltd Gas 1860 6.97 0.2432 INE079A01024 Ambuja Cements Ltd Cement 2180 5.49 0.1933 INE910H01017 Cairn India Ltd Oil 2426 4.85 0.1734 INE012A01025 ACC Ltd Cement 295 4.72 0.1635 INE038A01020 Hindalco Industries Ltd Non - Ferrous Metals 2931 4.48 0.1636 INE021A01026 Asian Paints Ltd Consumer Non Durables 384 4.46 0.1637 INE028A01039 Bank of Baroda Banks 2600 4.35 0.1538 INE669E01016 Idea Cellular Ltd Telecom - Services 5097 4.03 0.1439 INE205A01025 Vedanta Ltd Non - Ferrous Metals 1408 2.42 0.08 Total for Equity & Equity Related 926.63 32.27 (B) Debt Instruments (a) Listed / awaiting listing on Stock Exchange 1 INE296A07BB9 Bajaj Finance Ltd - 10 - 25/04/2019** CRISIL AA+ 46 481.51 16.772 INE092T08857 IDFC Bank Ltd - 9.5 - 29/04/2019** ICRA AAA 45 466.86 16.263 INE134E07513 Power Finance Corporation Ltd - 9.69 - 02/03/2019** CRISIL AAA 27 283.16 9.864 INE860H07466 Aditya Birla Finance Ltd - 9.75 - 04/04/2019** IND AA+ 21 217.62 7.585 INE694L07057 Talwandi Sabo Power Ltd - 9.27 - 10/11/2017** CRISIL AA-(SO) 20 200.95 7.006 INE020B07IA8 Rural Electrification Corporation Ltd - 9.63 - 05/02/2019** CRISIL AAA 6 62.82 2.19 Total for Debt Instruments 1712.92 59.65 (C) Money Market Instruments 1 Reverse Repo 147.00 5.12 Total for Money Market Instruments 147.00 5.12 Cash and Other Net Current Assets 84.84 2.95 Grand Total 2871.38 100.00** Thinly traded / Non Traded securities Notesa) Total NPA's provided for and its percentage to NAV - Nil b) Total value and percentage of illiquid equity shares - Nil c) NAV per unit (` per unit)
Direct plan Regular planOptions 31/03/2016 30/09/2016 31/03/2016 30/09/2016Growth 11.7087 12.4964 11.4614 12.2094 Halfyearly Div. 11.7087 12.4962 11.4614 12.2094 Annual Div. - - 11.4614 12.2094d) Dividend declared during the period (` per unit) - Nil e) Total outstanding exposure in derivative instruments at the end of the period - Nilf) Total investments in foreign securities /ADR'S/GDR'S at the end of the period - Nilg) Average Maturity (years) - 1.41h) Average Duration (years) - 1.18i) Repo in corporate debt - Nil
SUNDARAM HYBRID FUND SERIES-K
Sl No ISIN Code Name of the instrument Industry/ Quantity Mkt Value % of Rating ` in Lakhs NAV A) Equity & Equity Related a) Listed / awaiting listing on Stock Exchange 1 INE040A01026 HDFC Bank Ltd Banks 6017 76.59 3.012 INE001A01036 Housing Development Finance Corporation Ltd Finance 5202 72.49 2.853 INE009A01021 Infosys Ltd Software 6228 64.53 2.534 INE090A01021 ICICI Bank Ltd Banks 21875 55.16 2.175 INE002A01018 Reliance Industries Ltd Petroleum Products 4941 53.55 2.106 INE467B01029 Tata Consultancy Services Ltd Software 1704 41.42 1.637 INE154A01025 ITC Ltd Consumer Non Durables 14370 34.68 1.368 INE155A01022 Tata Motors Ltd Auto 6202 33.17 1.309 INE237A01028 Kotak Mahindra Bank Ltd Banks 3988 30.99 1.2210 INE018A01030 Larsen & Toubro Ltd Construction Project 2071 29.68 1.1711 INE238A01034 Axis Bank Ltd Banks 5075 27.47 1.0812 INE062A01020 State Bank Of India Ltd Banks 9860 24.77 0.9713 INE029A01011 Bharat Petroleum Corporation Ltd Petroleum Products 3790 23.22 0.9114 INE030A01027 Hindustan Unilever Ltd Consumer Non Durables 2639 22.90 0.9015 INE044A01036 Sun Pharmaceuticals Industries Ltd Pharmaceuticals 2850 21.17 0.83
16 INE481G01011 UltraTech Cement Ltd Cement 425 16.37 0.6417 INE860A01027 HCL Technologies Ltd Software 2026 16.21 0.6418 INE326A01037 Lupin Ltd Pharmaceuticals 999 14.85 0.5819 INE669C01036 Tech Mahindra Ltd Software 3532 14.83 0.5820 INE101A01026 Mahindra & Mahindra Ltd Auto 1047 14.72 0.5821 INE397D01024 Bharti Airtel Ltd Telecom - Services 4252 13.35 0.5222 INE075A01022 Wipro Ltd Software 2526 12.10 0.4823 INE585B01010 Maruti Suzuki India Ltd Auto 212 11.61 0.4624 INE089A01023 Dr. Reddy's Laboratories Ltd Pharmaceuticals 345 10.72 0.4225 INE213A01029 Oil & Natural Gas Corporation Ltd Oil 4172 10.71 0.4226 INE021A01026 Asian Paints Ltd Consumer Non Durables 723 8.39 0.3327 INE160A01022 Punjab National Bank Banks 5665 7.97 0.3128 INE256A01028 Zee Entertainment Enterprises Ltd Media & Entertainment 1435 7.85 0.3129 INE158A01026 Hero MotoCorp Ltd Auto 215 7.34 0.2930 INE003A01024 Siemens Ltd Industrial Capital Goods 588 7.29 0.2931 INE129A01019 GAIL (India) Ltd Gas 1801 6.75 0.2632 INE245A01021 Tata Power Company Ltd Power 7734 5.83 0.2333 INE081A01012 Tata Steel Ltd Ferrous Metals 1481 5.54 0.2234 INE079A01024 Ambuja Cements Ltd Cement 2119 5.33 0.2135 INE012A01025 ACC Ltd Cement 309 4.94 0.1936 INE910H01017 Cairn India Ltd Oil 2285 4.57 0.1837 INE669E01016 Idea Cellular Ltd Telecom - Services 5371 4.25 0.1738 INE038A01020 Hindalco Industries Ltd Non - Ferrous Metals 2750 4.20 0.1639 INE028A01039 Bank of Baroda Banks 2505 4.19 0.1640 INE205A01025 Vedanta Ltd Non - Ferrous Metals 2249 3.87 0.15 Total for Equity & Equity Related 835.56 32.81 (B) Debt Instruments (a) Listed / awaiting listing on Stock Exchange 1 INE476M07131 L&T Housing Finance Ltd - 9.79 - 28/06/2019** ICRA AA+ 17 441.71 17.352 INE895D07479 Tata Sons Ltd - 9.25 - 19/06/2019** CRISIL AAA 42 433.75 17.033 INE310L07514 IOT Utkal Energy Services Ltd - 9.843 - 20/05/2019** CRISIL AAA 220 237.35 9.324 INE694L07057 Talwandi Sabo Power Ltd - 9.27 - 10/11/2017** CRISIL AA-(SO) 20 200.95 7.895 INE020B07IA8 Rural Electrification Corporation Ltd - 9.63 - 05/02/2019** CRISIL AAA 8 83.76 3.296 INE092T08857 IDFC Bank Ltd - 9.5 - 29/04/2019** ICRA AAA 5 51.87 2.04 Total for Debt Instruments 1449.40 56.92 (C) Money Market Instruments 1 Reverse Repo 135.00 5.30 Total for Money Market Instruments 135.00 5.30 Cash and Other Net Current Assets 126.38 4.96 Grand Total 2546.34 100.00** Thinly traded / Non Traded securities Notesa) Total NPA's provided for and its percentage to NAV - Nil b) Total value and percentage of illiquid equity shares - Nil c) NAV per unit (` per unit)
Direct plan Regular planOptions 31/03/2016 30/09/2016 31/03/2016 30/09/2016Growth 11.0880 11.7946 10.8888 11.5609 Halfyearly Div. 11.0869 11.7934 10.8888 11.5609 Annual Div. 11.0902 11.7973 10.8888 11.5609d) Dividend declared during the period (` per unit) - Nil e) Total outstanding exposure in derivative instruments at the end of the period - Nilf) Total investments in foreign securities /ADR'S/GDR'S at the end of the period - Nilg) Average Maturity (years) - 1.40h) Average Duration (years) - 1.19i) Repo in corporate debt - Nil
SUNDARAM HYBRID FUND SERIES-M
Sl No ISIN Code Name of the instrument Industry/ Quantity Mkt Value % of Rating ` in Lakhs NAV A) Equity & Equity Related a) Listed / awaiting listing on Stock Exchange 1 INE040A01026 HDFC Bank Ltd Banks 32958 419.51 2.292 INE001A01036 Housing Development Finance Corporation Ltd Finance 29123 405.81 2.223 INE009A01021 Infosys Ltd Software 35239 365.09 1.994 INE002A01018 Reliance Industries Ltd Petroleum Products 29497 319.66 1.755 INE090A01021 ICICI Bank Ltd Banks 101984 257.15 1.406 INE018A01030 Larsen & Toubro Ltd Construction Project 16121 231.04 1.267 INE467B01029 Tata Consultancy Services Ltd Software 9219 224.10 1.228 INE238A01034 Axis Bank Ltd Banks 33687 182.36 1.009 INE062A01020 State Bank Of India Ltd Banks 66154 166.21 0.9110 INE585B01010 Maruti Suzuki India Ltd Auto 2385 130.63 0.7111 INE101A01026 Mahindra & Mahindra Ltd Auto 6831 96.02 0.5212 INE044A01036 Sun Pharmaceuticals Industries Ltd Pharmaceuticals 11306 83.97 0.4613 INE397D01024 Bharti Airtel Ltd Telecom - Services 26436 83.01 0.4514 INE522F01014 Coal India Ltd Minerals/Mining 21719 70.00 0.3815 INE021A01026 Asian Paints Ltd Consumer Non Durables 4949 57.44 0.3116 INE860A01027 HCL Technologies Ltd Software 6985 55.87 0.3117 INE326A01037 Lupin Ltd Pharmaceuticals 3474 51.63 0.2818 INE481G01011 UltraTech Cement Ltd Cement 1300 50.07 0.2719 INE528G01019 Yes Bank Ltd Banks 3917 49.15 0.2720 INE029A01011 Bharat Petroleum Corporation Ltd Petroleum Products 6242 38.24 0.21 Total for Equity & Equity Related 3336.98 18.22 (B) Debt Instruments (a) Listed / awaiting listing on Stock Exchange 1 INE020B07HY0 Rural Electrification Corporation Ltd - 9.38 - 06/11/2018** CRISIL AAA 300 3116.01 17.012 INE202B07EY1 Dewan Housing Finance Corporation Ltd - 9.25 - 24/12/2018** CARE AAA 250 2513.82 13.733 INE134E07406 Power Finance Corporation Ltd - 9.81 - 07/10/2018** CRISIL AAA 240 2506.94 13.694 INE523E07CE0 L & T Finance Ltd - 8.8501 - 24/12/2018** CARE AA+ 80 2041.12 11.145 INE261F08568 National Bank for Agricultural & Rural Development - 7.86 - 07/12/2018** CRISIL AAA 150 1516.84 8.286 INE860H07BH4 Aditya Birla Finance Ltd - 8.8699 - 24/12/2018** ICRA AA+ 100 1019.97 5.577 INE476M07610 L&T Housing Finance Ltd - 8.8798 - 24/12/2018** ICRA AA+ 40 1019.73 5.57 Total for Debt Instruments 13734.42 74.99 (C) Money Market Instruments 1 Reverse Repo 126.00 0.69 Total for Money Market Instruments 126.00 0.69 Cash and Other Net Current Assets 1116.95 6.10 Grand Total 18314.35 100.00** Thinly traded / Non Traded securities Notesa) Total NPA's provided for and its percentage to NAV - Nil b) Total value and percentage of illiquid equity shares - Nil c) NAV per unit (` per unit)
Direct plan Regular planOptions 31/03/2016 30/09/2016 31/03/2016 30/09/2016Growth 10.3242 10.8622 10.2880 10.8026 Halfyearly Div. 10.3242 10.8623 10.2880 10.8026 Annual Div. 10.3236 10.8616 10.2880 10.8026d) Dividend declared during the period (` per unit) - Nil e) Total outstanding exposure in derivative instruments at the end of the period - Nilf) Total investments in foreign securities /ADR'S/GDR'S at the end of the period - Nilg) Average Maturity (years) - 1.62h) Average Duration (years) - 1.39i) Repo in corporate debt - Nil
SUNDARAM HYBRID FUND SERIES-N
Sl No ISIN Code Name of the instrument Industry/ Quantity Mkt Value % of Rating ` in Lakhs NAV A) Equity & Equity Related a) Listed / awaiting listing on Stock Exchange 1 INE040A01026 HDFC Bank Ltd Banks 16037 204.13 2.062 INE009A01021 Infosys Ltd Software 17244 178.66 1.803 INE001A01036 Housing Development Finance Corporation Ltd Finance 12611 175.73 1.774 INE002A01018 Reliance Industries Ltd Petroleum Products 12758 138.26 1.395 INE090A01021 ICICI Bank Ltd Banks 48689 122.77 1.246 INE467B01029 Tata Consultancy Services Ltd Software 4513 109.70 1.117 INE018A01030 Larsen & Toubro Ltd Construction Project 7275 104.26 1.058 INE238A01034 Axis Bank Ltd Banks 15023 81.33 0.829 INE062A01020 State Bank Of India Ltd Banks 31810 79.92 0.8110 INE585B01010 Maruti Suzuki India Ltd Auto 1064 58.28 0.5911 INE101A01026 Mahindra & Mahindra Ltd Auto 3083 43.34 0.4412 INE044A01036 Sun Pharmaceuticals Industries Ltd Pharmaceuticals 5110 37.95 0.3813 INE397D01024 Bharti Airtel Ltd Telecom - Services 11853 37.22 0.3714 INE522F01014 Coal India Ltd Minerals/Mining 9811 31.62 0.32
www.sundarammutual.com
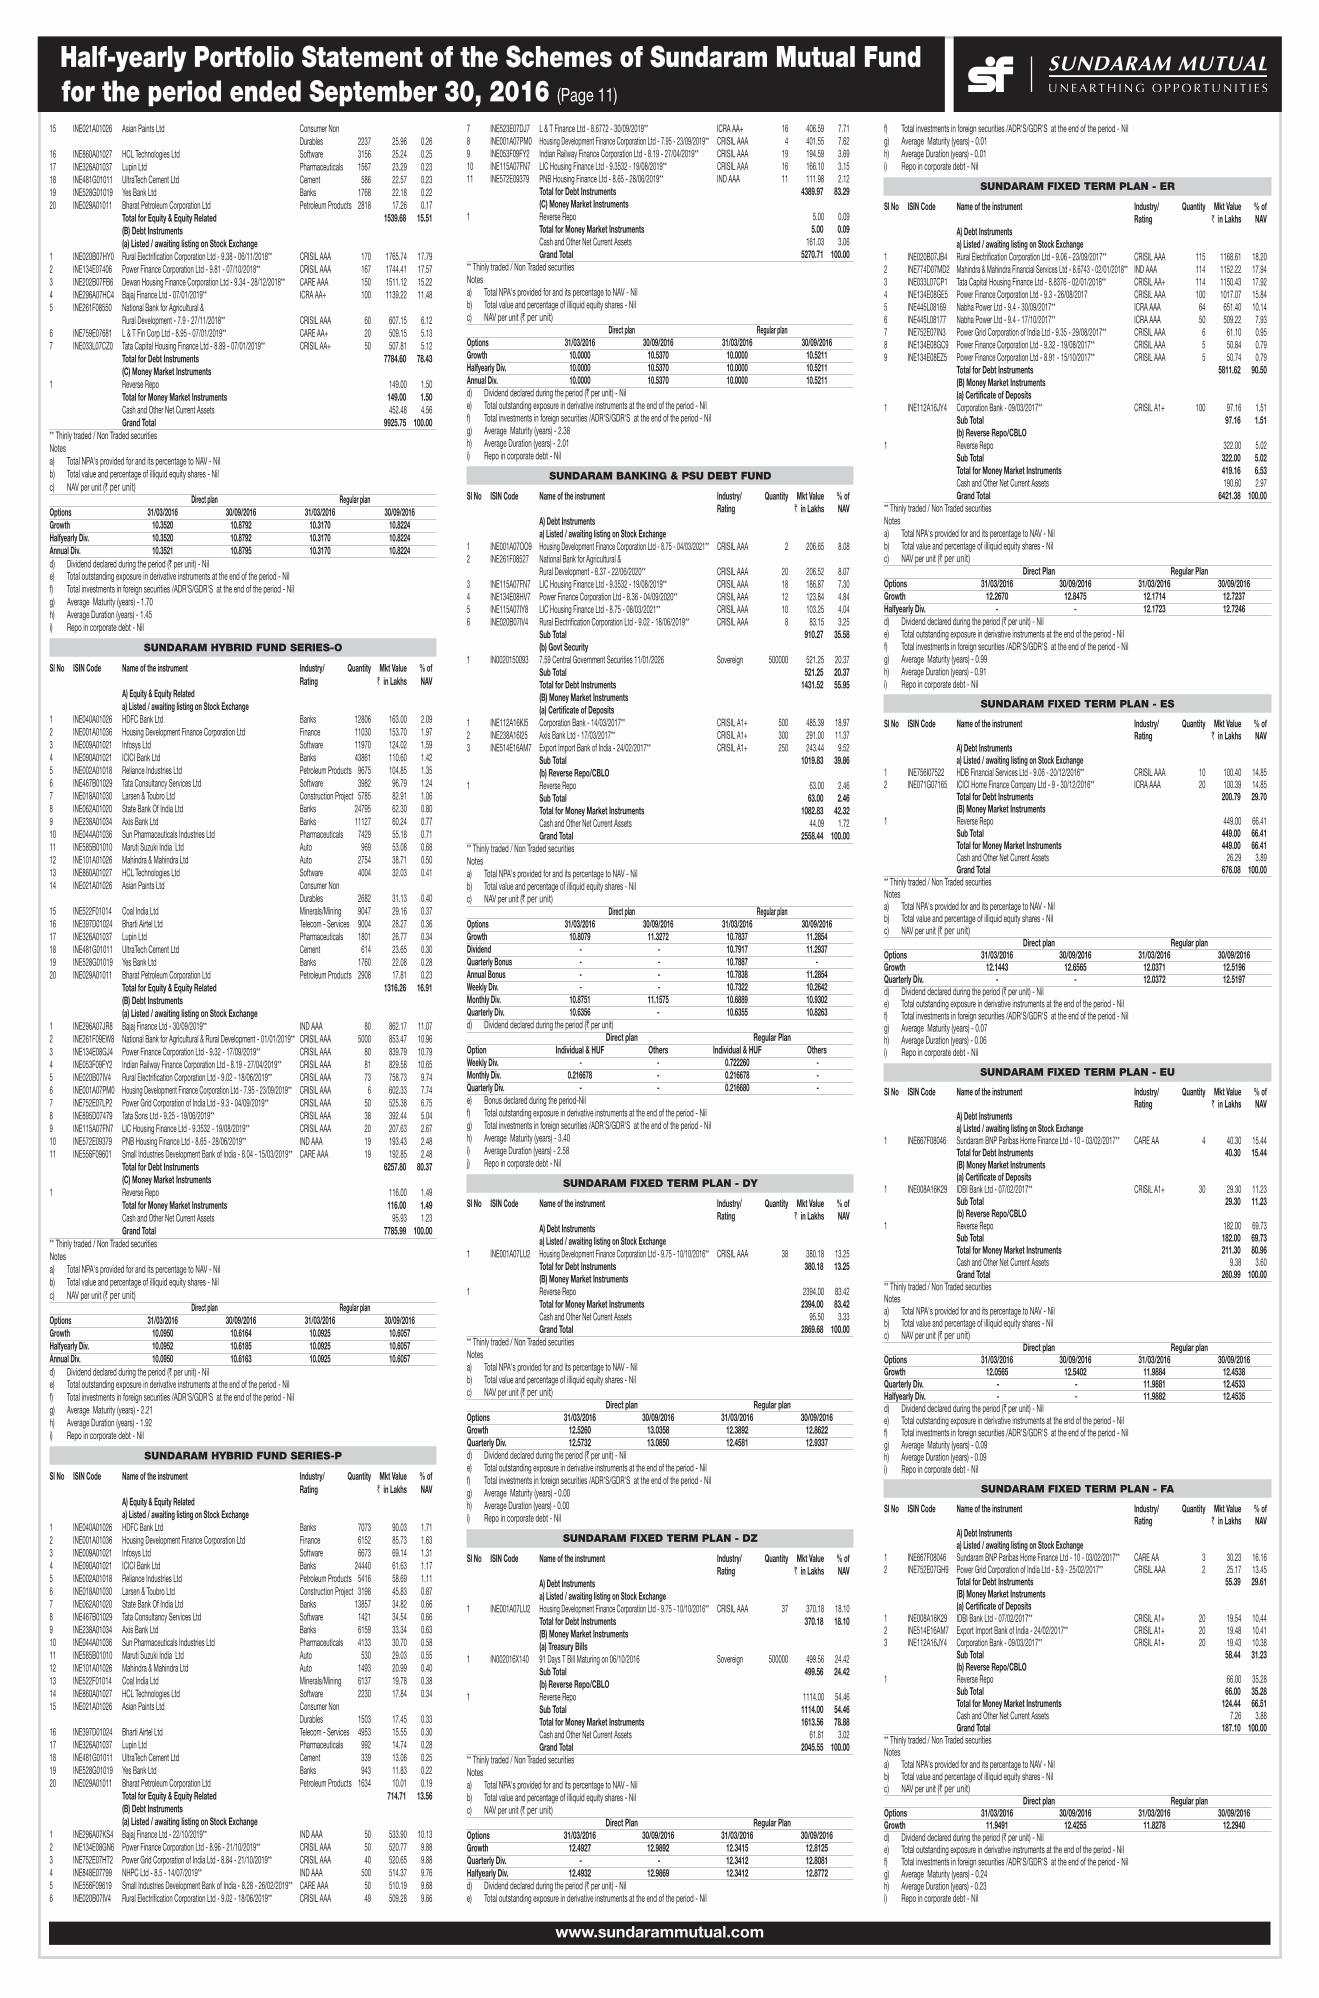
Half-yearly Portfolio Statement of the Schemes of Sundaram Mutual Fund for the period ended September 30, 2016 (Page 11)
15 INE021A01026 Asian Paints Ltd Consumer Non Durables 2237 25.96 0.2616 INE860A01027 HCL Technologies Ltd Software 3156 25.24 0.2517 INE326A01037 Lupin Ltd Pharmaceuticals 1567 23.29 0.2318 INE481G01011 UltraTech Cement Ltd Cement 586 22.57 0.2319 INE528G01019 Yes Bank Ltd Banks 1768 22.18 0.2220 INE029A01011 Bharat Petroleum Corporation Ltd Petroleum Products 2818 17.26 0.17 Total for Equity & Equity Related 1539.68 15.51 (B) Debt Instruments (a) Listed / awaiting listing on Stock Exchange 1 INE020B07HY0 Rural Electrification Corporation Ltd - 9.38 - 06/11/2018** CRISIL AAA 170 1765.74 17.792 INE134E07406 Power Finance Corporation Ltd - 9.81 - 07/10/2018** CRISIL AAA 167 1744.41 17.573 INE202B07FB6 Dewan Housing Finance Corporation Ltd - 9.34 - 28/12/2018** CARE AAA 150 1511.12 15.224 INE296A07HC4 Bajaj Finance Ltd - 07/01/2019** ICRA AA+ 100 1139.22 11.485 INE261F08550 National Bank for Agricultural & Rural Development - 7.9 - 27/11/2018** CRISIL AAA 60 607.15 6.126 INE759E07681 L & T Fin Corp Ltd - 8.95 - 07/01/2019** CARE AA+ 20 509.15 5.137 INE033L07CZ0 Tata Capital Housing Finance Ltd - 8.89 - 07/01/2019** CRISIL AA+ 50 507.81 5.12 Total for Debt Instruments 7784.60 78.43 (C) Money Market Instruments 1 Reverse Repo 149.00 1.50 Total for Money Market Instruments 149.00 1.50 Cash and Other Net Current Assets 452.48 4.56 Grand Total 9925.75 100.00** Thinly traded / Non Traded securities Notesa) Total NPA's provided for and its percentage to NAV - Nil b) Total value and percentage of illiquid equity shares - Nil c) NAV per unit (` per unit)
Direct plan Regular planOptions 31/03/2016 30/09/2016 31/03/2016 30/09/2016Growth 10.3520 10.8792 10.3170 10.8224 Halfyearly Div. 10.3520 10.8792 10.3170 10.8224 Annual Div. 10.3521 10.8795 10.3170 10.8224d) Dividend declared during the period (` per unit) - Nil e) Total outstanding exposure in derivative instruments at the end of the period - Nilf) Total investments in foreign securities /ADR'S/GDR'S at the end of the period - Nilg) Average Maturity (years) - 1.70h) Average Duration (years) - 1.45i) Repo in corporate debt - Nil
SUNDARAM HYBRID FUND SERIES-O
Sl No ISIN Code Name of the instrument Industry/ Quantity Mkt Value % of Rating ` in Lakhs NAV A) Equity & Equity Related a) Listed / awaiting listing on Stock Exchange 1 INE040A01026 HDFC Bank Ltd Banks 12806 163.00 2.092 INE001A01036 Housing Development Finance Corporation Ltd Finance 11030 153.70 1.973 INE009A01021 Infosys Ltd Software 11970 124.02 1.594 INE090A01021 ICICI Bank Ltd Banks 43861 110.60 1.425 INE002A01018 Reliance Industries Ltd Petroleum Products 9675 104.85 1.356 INE467B01029 Tata Consultancy Services Ltd Software 3982 96.79 1.247 INE018A01030 Larsen & Toubro Ltd Construction Project 5785 82.91 1.068 INE062A01020 State Bank Of India Ltd Banks 24795 62.30 0.809 INE238A01034 Axis Bank Ltd Banks 11127 60.24 0.7710 INE044A01036 Sun Pharmaceuticals Industries Ltd Pharmaceuticals 7429 55.18 0.7111 INE585B01010 Maruti Suzuki India Ltd Auto 969 53.08 0.6812 INE101A01026 Mahindra & Mahindra Ltd Auto 2754 38.71 0.5013 INE860A01027 HCL Technologies Ltd Software 4004 32.03 0.4114 INE021A01026 Asian Paints Ltd Consumer Non Durables 2682 31.13 0.4015 INE522F01014 Coal India Ltd Minerals/Mining 9047 29.16 0.3716 INE397D01024 Bharti Airtel Ltd Telecom - Services 9004 28.27 0.3617 INE326A01037 Lupin Ltd Pharmaceuticals 1801 26.77 0.3418 INE481G01011 UltraTech Cement Ltd Cement 614 23.65 0.3019 INE528G01019 Yes Bank Ltd Banks 1760 22.08 0.2820 INE029A01011 Bharat Petroleum Corporation Ltd Petroleum Products 2908 17.81 0.23 Total for Equity & Equity Related 1316.26 16.91 (B) Debt Instruments (a) Listed / awaiting listing on Stock Exchange 1 INE296A07JR8 Bajaj Finance Ltd - 30/09/2019** IND AAA 80 862.17 11.072 INE261F09EW8 National Bank for Agricultural & Rural Development - 01/01/2019** CRISIL AAA 5000 853.47 10.963 INE134E08GJ4 Power Finance Corporation Ltd - 9.32 - 17/09/2019** CRISIL AAA 80 839.79 10.794 INE053F09FY2 Indian Railway Finance Corporation Ltd - 8.19 - 27/04/2019** CRISIL AAA 81 829.58 10.655 INE020B07IV4 Rural Electrification Corporation Ltd - 9.02 - 18/06/2019** CRISIL AAA 73 758.73 9.746 INE001A07PM0 Housing Development Finance Corporation Ltd - 7.95 - 23/09/2019** CRISIL AAA 6 602.33 7.747 INE752E07LP2 Power Grid Corporation of India Ltd - 9.3 - 04/09/2019** CRISIL AAA 50 525.38 6.758 INE895D07479 Tata Sons Ltd - 9.25 - 19/06/2019** CRISIL AAA 38 392.44 5.049 INE115A07FN7 LIC Housing Finance Ltd - 9.3532 - 19/08/2019** CRISIL AAA 20 207.63 2.6710 INE572E09379 PNB Housing Finance Ltd - 8.65 - 28/06/2019** IND AAA 19 193.43 2.4811 INE556F09601 Small Industries Development Bank of India - 8.04 - 15/03/2019** CARE AAA 19 192.85 2.48 Total for Debt Instruments 6257.80 80.37 (C) Money Market Instruments 1 Reverse Repo 116.00 1.49 Total for Money Market Instruments 116.00 1.49 Cash and Other Net Current Assets 95.93 1.23 Grand Total 7785.99 100.00** Thinly traded / Non Traded securities Notesa) Total NPA's provided for and its percentage to NAV - Nil b) Total value and percentage of illiquid equity shares - Nil c) NAV per unit (` per unit)
Direct plan Regular planOptions 31/03/2016 30/09/2016 31/03/2016 30/09/2016Growth 10.0950 10.6164 10.0925 10.6057 Halfyearly Div. 10.0952 10.6185 10.0925 10.6057 Annual Div. 10.0950 10.6163 10.0925 10.6057d) Dividend declared during the period (` per unit) - Nil e) Total outstanding exposure in derivative instruments at the end of the period - Nilf) Total investments in foreign securities /ADR'S/GDR'S at the end of the period - Nilg) Average Maturity (years) - 2.21h) Average Duration (years) - 1.92i) Repo in corporate debt - Nil
SUNDARAM HYBRID FUND SERIES-P
Sl No ISIN Code Name of the instrument Industry/ Quantity Mkt Value % of Rating ` in Lakhs NAV A) Equity & Equity Related a) Listed / awaiting listing on Stock Exchange 1 INE040A01026 HDFC Bank Ltd Banks 7073 90.03 1.712 INE001A01036 Housing Development Finance Corporation Ltd Finance 6152 85.73 1.633 INE009A01021 Infosys Ltd Software 6673 69.14 1.314 INE090A01021 ICICI Bank Ltd Banks 24440 61.63 1.175 INE002A01018 Reliance Industries Ltd Petroleum Products 5416 58.69 1.116 INE018A01030 Larsen & Toubro Ltd Construction Project 3198 45.83 0.877 INE062A01020 State Bank Of India Ltd Banks 13857 34.82 0.668 INE467B01029 Tata Consultancy Services Ltd Software 1421 34.54 0.669 INE238A01034 Axis Bank Ltd Banks 6159 33.34 0.6310 INE044A01036 Sun Pharmaceuticals Industries Ltd Pharmaceuticals 4133 30.70 0.5811 INE585B01010 Maruti Suzuki India Ltd Auto 530 29.03 0.5512 INE101A01026 Mahindra & Mahindra Ltd Auto 1493 20.99 0.4013 INE522F01014 Coal India Ltd Minerals/Mining 6137 19.78 0.3814 INE860A01027 HCL Technologies Ltd Software 2230 17.84 0.3415 INE021A01026 Asian Paints Ltd Consumer Non Durables 1503 17.45 0.3316 INE397D01024 Bharti Airtel Ltd Telecom - Services 4953 15.55 0.3017 INE326A01037 Lupin Ltd Pharmaceuticals 992 14.74 0.2818 INE481G01011 UltraTech Cement Ltd Cement 339 13.06 0.2519 INE528G01019 Yes Bank Ltd Banks 943 11.83 0.2220 INE029A01011 Bharat Petroleum Corporation Ltd Petroleum Products 1634 10.01 0.19 Total for Equity & Equity Related 714.71 13.56 (B) Debt Instruments (a) Listed / awaiting listing on Stock Exchange 1 INE296A07KS4 Bajaj Finance Ltd - 22/10/2019** IND AAA 50 533.90 10.132 INE134E08GN6 Power Finance Corporation Ltd - 8.96 - 21/10/2019** CRISIL AAA 50 520.77 9.883 INE752E07HT2 Power Grid Corporation of India Ltd - 8.84 - 21/10/2019** CRISIL AAA 40 520.65 9.884 INE848E07799 NHPC Ltd - 8.5 - 14/07/2019** IND AAA 500 514.37 9.765 INE556F09619 Small Industries Development Bank of India - 8.28 - 26/02/2019** CARE AAA 50 510.19 9.686 INE020B07IV4 Rural Electrification Corporation Ltd - 9.02 - 18/06/2019** CRISIL AAA 49 509.28 9.66
7 INE523E07DJ7 L & T Finance Ltd - 8.6772 - 30/09/2019** ICRA AA+ 16 406.59 7.718 INE001A07PM0 Housing Development Finance Corporation Ltd - 7.95 - 23/09/2019** CRISIL AAA 4 401.55 7.629 INE053F09FY2 Indian Railway Finance Corporation Ltd - 8.19 - 27/04/2019** CRISIL AAA 19 194.59 3.6910 INE115A07FN7 LIC Housing Finance Ltd - 9.3532 - 19/08/2019** CRISIL AAA 16 166.10 3.1511 INE572E09379 PNB Housing Finance Ltd - 8.65 - 28/06/2019** IND AAA 11 111.98 2.12 Total for Debt Instruments 4389.97 83.29 (C) Money Market Instruments 1 Reverse Repo 5.00 0.09 Total for Money Market Instruments 5.00 0.09 Cash and Other Net Current Assets 161.03 3.06 Grand Total 5270.71 100.00** Thinly traded / Non Traded securities Notesa) Total NPA's provided for and its percentage to NAV - Nil b) Total value and percentage of illiquid equity shares - Nil c) NAV per unit (` per unit)
Direct plan Regular planOptions 31/03/2016 30/09/2016 31/03/2016 30/09/2016Growth 10.0000 10.5370 10.0000 10.5211 Halfyearly Div. 10.0000 10.5370 10.0000 10.5211 Annual Div. 10.0000 10.5370 10.0000 10.5211d) Dividend declared during the period (` per unit) - Nil e) Total outstanding exposure in derivative instruments at the end of the period - Nilf) Total investments in foreign securities /ADR'S/GDR'S at the end of the period - Nilg) Average Maturity (years) - 2.38h) Average Duration (years) - 2.01i) Repo in corporate debt - Nil
SUNDARAM BANKING & PSU DEBT FUND
Sl No ISIN Code Name of the instrument Industry/ Quantity Mkt Value % of Rating ` in Lakhs NAV A) Debt Instruments a) Listed / awaiting listing on Stock Exchange 1 INE001A07OO9 Housing Development Finance Corporation Ltd - 8.75 - 04/03/2021** CRISIL AAA 2 206.65 8.082 INE261F08527 National Bank for Agricultural & Rural Development - 8.37 - 22/06/2020** CRISIL AAA 20 206.52 8.073 INE115A07FN7 LIC Housing Finance Ltd - 9.3532 - 19/08/2019** CRISIL AAA 18 186.87 7.304 INE134E08HV7 Power Finance Corporation Ltd - 8.36 - 04/09/2020** CRISIL AAA 12 123.84 4.845 INE115A07IY8 LIC Housing Finance Ltd - 8.75 - 08/03/2021** CRISIL AAA 10 103.25 4.046 INE020B07IV4 Rural Electrification Corporation Ltd - 9.02 - 18/06/2019** CRISIL AAA 8 83.15 3.25 Sub Total 910.27 35.58 (b) Govt Security 1 IN0020150093 7.59 Central Government Securities 11/01/2026 Sovereign 500000 521.25 20.37 Sub Total 521.25 20.37 Total for Debt Instruments 1431.52 55.95 (B) Money Market Instruments (a) Certificate of Deposits 1 INE112A16KI5 Corporation Bank - 14/03/2017** CRISIL A1+ 500 485.39 18.972 INE238A16I25 Axis Bank Ltd - 17/03/2017** CRISIL A1+ 300 291.00 11.373 INE514E16AM7 Export Import Bank of India - 24/02/2017** CRISIL A1+ 250 243.44 9.52 Sub Total 1019.83 39.86 (b) Reverse Repo/CBLO1 Reverse Repo 63.00 2.46 Sub Total 63.00 2.46 Total for Money Market Instruments 1082.83 42.32 Cash and Other Net Current Assets 44.09 1.72 Grand Total 2558.44 100.00** Thinly traded / Non Traded securities Notesa) Total NPA's provided for and its percentage to NAV - Nil b) Total value and percentage of illiquid equity shares - Nil c) NAV per unit (` per unit)
Direct plan Regular planOptions 31/03/2016 30/09/2016 31/03/2016 30/09/2016Growth 10.8079 11.3272 10.7837 11.2854 Dividend - - 10.7917 11.2937 Quarterly Bonus - - 10.7887 -Annual Bonus - - 10.7838 11.2854 Weekly Div. - - 10.7322 10.2642 Monthly Div. 10.8751 11.1575 10.6889 10.9302 Quarterly Div. 10.6356 - 10.6355 10.8263d) Dividend declared during the period (` per unit)
Direct plan Regular PlanOption Individual & HUF Others Individual & HUF Others Weekly Div. - - 0.722260 - Monthly Div. 0.216678 - 0.216678 - Quarterly Div. - - 0.216680 - e) Bonus declared during the period-Nilf) Total outstanding exposure in derivative instruments at the end of the period - Nilg) Total investments in foreign securities /ADR'S/GDR'S at the end of the period - Nilh) Average Maturity (years) - 3.40 i) Average Duration (years) - 2.58 j) Repo in corporate debt - Nil
SUNDARAM FIXED TERM PLAN - DY
Sl No ISIN Code Name of the instrument Industry/ Quantity Mkt Value % of Rating ` in Lakhs NAV A) Debt Instruments a) Listed / awaiting listing on Stock Exchange 1 INE001A07LU2 Housing Development Finance Corporation Ltd - 9.75 - 10/10/2016** CRISIL AAA 38 380.18 13.25 Total for Debt Instruments 380.18 13.25 (B) Money Market Instruments 1 Reverse Repo 2394.00 83.42 Total for Money Market Instruments 2394.00 83.42 Cash and Other Net Current Assets 95.50 3.33 Grand Total 2869.68 100.00 ** Thinly traded / Non Traded securities Notesa) Total NPA's provided for and its percentage to NAV - Nil b) Total value and percentage of illiquid equity shares - Nil c) NAV per unit (` per unit)
Direct plan Regular planOptions 31/03/2016 30/09/2016 31/03/2016 30/09/2016Growth 12.5260 13.0358 12.3892 12.8622 Quarterly Div. 12.5732 13.0850 12.4581 12.9337 d) Dividend declared during the period (` per unit) - Nil e) Total outstanding exposure in derivative instruments at the end of the period - Nilf) Total investments in foreign securities /ADR'S/GDR'S at the end of the period - Nilg) Average Maturity (years) - 0.00h) Average Duration (years) - 0.00i) Repo in corporate debt - Nil
SUNDARAM FIXED TERM PLAN - DZ
Sl No ISIN Code Name of the instrument Industry/ Quantity Mkt Value % of Rating ` in Lakhs NAV A) Debt Instruments a) Listed / awaiting listing on Stock Exchange 1 INE001A07LU2 Housing Development Finance Corporation Ltd - 9.75 - 10/10/2016** CRISIL AAA 37 370.18 18.10 Total for Debt Instruments 370.18 18.10 (B) Money Market Instruments (a) Treasury Bills 1 IN002016X140 91 Days T Bill Maturing on 06/10/2016 Sovereign 500000 499.56 24.42 Sub Total 499.56 24.42 (b) Reverse Repo/CBLO1 Reverse Repo 1114.00 54.46 Sub Total 1114.00 54.46 Total for Money Market Instruments 1613.56 78.88 Cash and Other Net Current Assets 61.81 3.02 Grand Total 2045.55 100.00 ** Thinly traded / Non Traded securities Notesa) Total NPA's provided for and its percentage to NAV - Nil b) Total value and percentage of illiquid equity shares - Nil c) NAV per unit (` per unit)
Direct Plan Regular PlanOptions 31/03/2016 30/09/2016 31/03/2016 30/09/2016Growth 12.4927 12.9892 12.3415 12.8125 Quarterly Div. - - 12.3412 12.8081 Halfyearly Div. 12.4932 12.9869 12.3412 12.8772 d) Dividend declared during the period (` per unit) - Nil e) Total outstanding exposure in derivative instruments at the end of the period - Nil
f) Total investments in foreign securities /ADR'S/GDR'S at the end of the period - Nilg) Average Maturity (years) - 0.01h) Average Duration (years) - 0.01i) Repo in corporate debt - Nil
SUNDARAM FIXED TERM PLAN - ER
Sl No ISIN Code Name of the instrument Industry/ Quantity Mkt Value % of Rating ` in Lakhs NAV A) Debt Instruments a) Listed / awaiting listing on Stock Exchange 1 INE020B07JB4 Rural Electrification Corporation Ltd - 9.06 - 23/09/2017** CRISIL AAA 115 1168.61 18.202 INE774D07MD2 Mahindra & Mahindra Financial Services Ltd - 8.6743 - 02/01/2018** IND AAA 114 1152.22 17.943 INE033L07CP1 Tata Capital Housing Finance Ltd - 8.8376 - 02/01/2018** CRISIL AA+ 114 1150.43 17.924 INE134E08GE5 Power Finance Corporation Ltd - 9.3 - 26/08/2017 CRISIL AAA 100 1017.07 15.845 INE445L08169 Nabha Power Ltd - 9.4 - 30/09/2017** ICRA AAA 64 651.40 10.146 INE445L08177 Nabha Power Ltd - 9.4 - 17/10/2017** ICRA AAA 50 509.22 7.937 INE752E07IN3 Power Grid Corporation of India Ltd - 9.35 - 29/08/2017** CRISIL AAA 6 61.10 0.958 INE134E08GC9 Power Finance Corporation Ltd - 9.32 - 19/08/2017** CRISIL AAA 5 50.84 0.799 INE134E08EZ5 Power Finance Corporation Ltd - 8.91 - 15/10/2017** CRISIL AAA 5 50.74 0.79 Total for Debt Instruments 5811.62 90.50 (B) Money Market Instruments (a) Certificate of Deposits 1 INE112A16JY4 Corporation Bank - 09/03/2017** CRISIL A1+ 100 97.16 1.51 Sub Total 97.16 1.51 (b) Reverse Repo/CBLO1 Reverse Repo 322.00 5.02 Sub Total 322.00 5.02 Total for Money Market Instruments 419.16 6.53 Cash and Other Net Current Assets 190.60 2.97 Grand Total 6421.38 100.00 ** Thinly traded / Non Traded securities Notesa) Total NPA's provided for and its percentage to NAV - Nil b) Total value and percentage of illiquid equity shares - Nil c) NAV per unit (` per unit)
Direct Plan Regular PlanOptions 31/03/2016 30/09/2016 31/03/2016 30/09/2016Growth 12.2670 12.8475 12.1714 12.7237 Halfyearly Div. - - 12.1723 12.7246 d) Dividend declared during the period (` per unit) - Nil e) Total outstanding exposure in derivative instruments at the end of the period - Nilf) Total investments in foreign securities /ADR'S/GDR'S at the end of the period - Nilg) Average Maturity (years) - 0.99h) Average Duration (years) - 0.91i) Repo in corporate debt - Nil
SUNDARAM FIXED TERM PLAN - ES
Sl No ISIN Code Name of the instrument Industry/ Quantity Mkt Value % of Rating ` in Lakhs NAV A) Debt Instruments a) Listed / awaiting listing on Stock Exchange 1 INE756I07522 HDB Financial Services Ltd - 9.06 - 20/12/2016** CRISIL AAA 10 100.40 14.852 INE071G07165 ICICI Home Finance Company Ltd - 9 - 30/12/2016** ICRA AAA 20 100.39 14.85 Total for Debt Instruments 200.79 29.70 (B) Money Market Instruments 1 Reverse Repo 449.00 66.41 Sub Total 449.00 66.41 Total for Money Market Instruments 449.00 66.41 Cash and Other Net Current Assets 26.29 3.89 Grand Total 676.08 100.00 ** Thinly traded / Non Traded securities Notesa) Total NPA's provided for and its percentage to NAV - Nil b) Total value and percentage of illiquid equity shares - Nil c) NAV per unit (` per unit)
Direct plan Regular planOptions 31/03/2016 30/09/2016 31/03/2016 30/09/2016Growth 12.1443 12.6565 12.0371 12.5196 Quarterly Div. - - 12.0372 12.5197 d) Dividend declared during the period (` per unit) - Nil e) Total outstanding exposure in derivative instruments at the end of the period - Nilf) Total investments in foreign securities /ADR'S/GDR'S at the end of the period - Nilg) Average Maturity (years) - 0.07h) Average Duration (years) - 0.06i) Repo in corporate debt - Nil
SUNDARAM FIXED TERM PLAN - EU
Sl No ISIN Code Name of the instrument Industry/ Quantity Mkt Value % of Rating ` in Lakhs NAV A) Debt Instruments a) Listed / awaiting listing on Stock Exchange 1 INE667F08046 Sundaram BNP Paribas Home Finance Ltd - 10 - 03/02/2017** CARE AA 4 40.30 15.44 Total for Debt Instruments 40.30 15.44 (B) Money Market Instruments (a) Certificate of Deposits 1 INE008A16K29 IDBI Bank Ltd - 07/02/2017** CRISIL A1+ 30 29.30 11.23 Sub Total 29.30 11.23 (b) Reverse Repo/CBLO1 Reverse Repo 182.00 69.73 Sub Total 182.00 69.73 Total for Money Market Instruments 211.30 80.96 Cash and Other Net Current Assets 9.38 3.60 Grand Total 260.99 100.00 ** Thinly traded / Non Traded securities Notesa) Total NPA's provided for and its percentage to NAV - Nil b) Total value and percentage of illiquid equity shares - Nil c) NAV per unit (` per unit)
Direct plan Regular planOptions 31/03/2016 30/09/2016 31/03/2016 30/09/2016Growth 12.0565 12.5402 11.9884 12.4538 Quarterly Div. - - 11.9881 12.4533 Halfyearly Div. - - 11.9882 12.4535 d) Dividend declared during the period (` per unit) - Nil e) Total outstanding exposure in derivative instruments at the end of the period - Nilf) Total investments in foreign securities /ADR'S/GDR'S at the end of the period - Nilg) Average Maturity (years) - 0.09h) Average Duration (years) - 0.09i) Repo in corporate debt - Nil
SUNDARAM FIXED TERM PLAN - FA
Sl No ISIN Code Name of the instrument Industry/ Quantity Mkt Value % of Rating ` in Lakhs NAV A) Debt Instruments a) Listed / awaiting listing on Stock Exchange 1 INE667F08046 Sundaram BNP Paribas Home Finance Ltd - 10 - 03/02/2017** CARE AA 3 30.23 16.162 INE752E07GH9 Power Grid Corporation of India Ltd - 8.9 - 25/02/2017** CRISIL AAA 2 25.17 13.45 Total for Debt Instruments 55.39 29.61 (B) Money Market Instruments (a) Certificate of Deposits 1 INE008A16K29 IDBI Bank Ltd - 07/02/2017** CRISIL A1+ 20 19.54 10.442 INE514E16AM7 Export Import Bank of India - 24/02/2017** CRISIL A1+ 20 19.48 10.413 INE112A16JY4 Corporation Bank - 09/03/2017** CRISIL A1+ 20 19.43 10.38 Sub Total 58.44 31.23 (b) Reverse Repo/CBLO1 Reverse Repo 66.00 35.28 Sub Total 66.00 35.28 Total for Money Market Instruments 124.44 66.51 Cash and Other Net Current Assets 7.26 3.88 Grand Total 187.10 100.00 ** Thinly traded / Non Traded securities Notesa) Total NPA's provided for and its percentage to NAV - Nil b) Total value and percentage of illiquid equity shares - Nil c) NAV per unit (` per unit)
Direct plan Regular planOptions 31/03/2016 30/09/2016 31/03/2016 30/09/2016Growth 11.9491 12.4255 11.8278 12.2940 d) Dividend declared during the period (` per unit) - Nil e) Total outstanding exposure in derivative instruments at the end of the period - Nilf) Total investments in foreign securities /ADR'S/GDR'S at the end of the period - Nilg) Average Maturity (years) - 0.24h) Average Duration (years) - 0.23i) Repo in corporate debt - Nil
www.sundarammutual.com
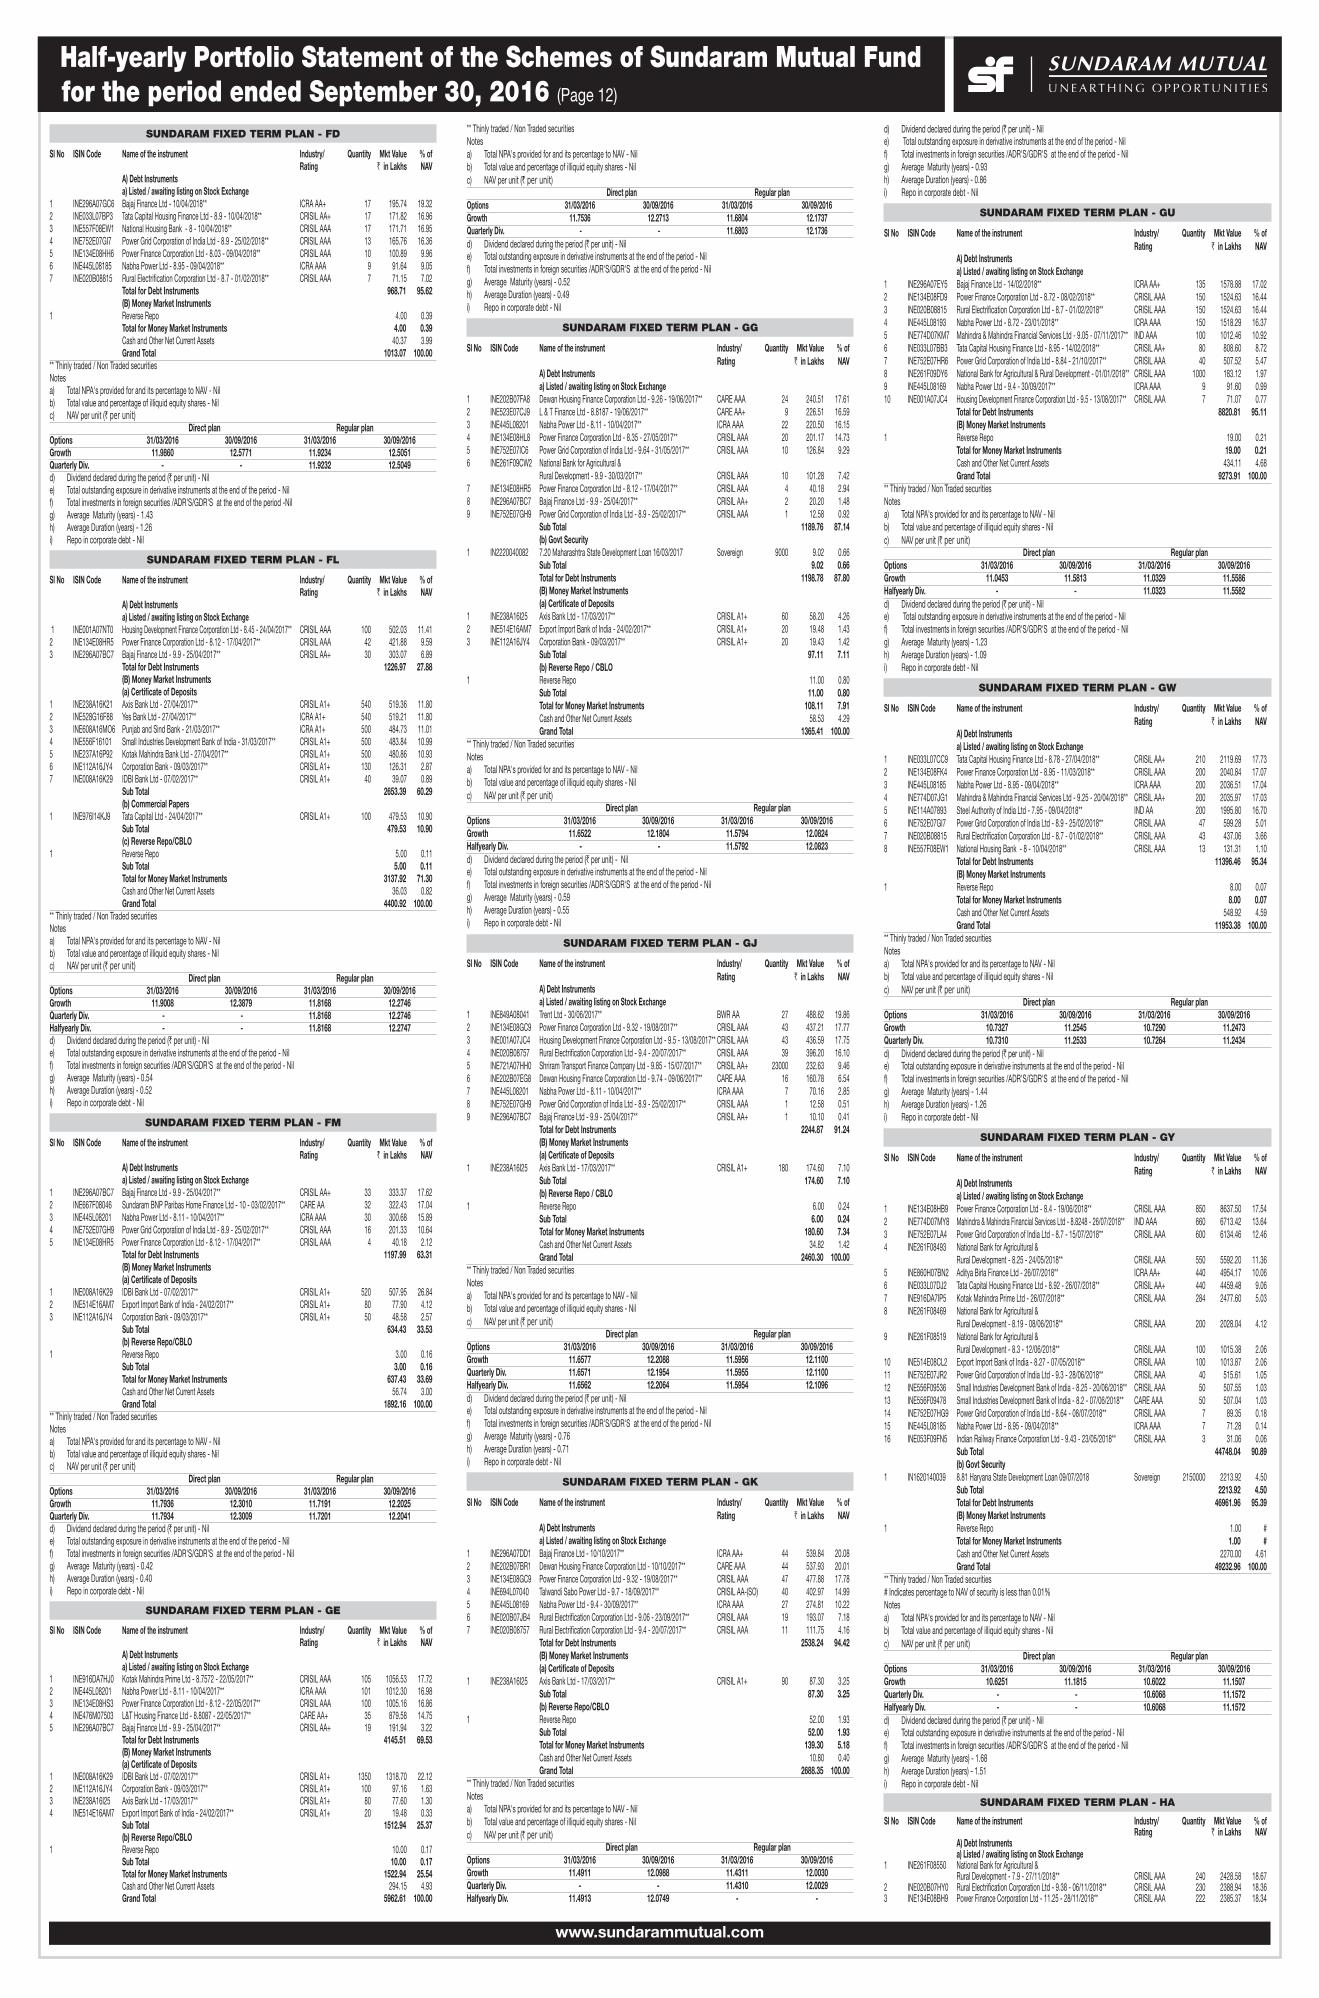
Half-yearly Portfolio Statement of the Schemes of Sundaram Mutual Fund for the period ended September 30, 2016 (Page 12)
SUNDARAM FIXED TERM PLAN - FD
Sl No ISIN Code Name of the instrument Industry/ Quantity Mkt Value % of Rating ` in Lakhs NAV A) Debt Instruments a) Listed / awaiting listing on Stock Exchange 1 INE296A07GC6 Bajaj Finance Ltd - 10/04/2018** ICRA AA+ 17 195.74 19.322 INE033L07BP3 Tata Capital Housing Finance Ltd - 8.9 - 10/04/2018** CRISIL AA+ 17 171.82 16.963 INE557F08EW1 National Housing Bank - 8 - 10/04/2018** CRISIL AAA 17 171.71 16.954 INE752E07GI7 Power Grid Corporation of India Ltd - 8.9 - 25/02/2018** CRISIL AAA 13 165.76 16.365 INE134E08HH6 Power Finance Corporation Ltd - 8.03 - 09/04/2018** CRISIL AAA 10 100.89 9.966 INE445L08185 Nabha Power Ltd - 8.95 - 09/04/2018** ICRA AAA 9 91.64 9.057 INE020B08815 Rural Electrification Corporation Ltd - 8.7 - 01/02/2018** CRISIL AAA 7 71.15 7.02 Total for Debt Instruments 968.71 95.62 (B) Money Market Instruments 1 Reverse Repo 4.00 0.39 Total for Money Market Instruments 4.00 0.39 Cash and Other Net Current Assets 40.37 3.99 Grand Total 1013.07 100.00 ** Thinly traded / Non Traded securities Notesa) Total NPA's provided for and its percentage to NAV - Nil b) Total value and percentage of illiquid equity shares - Nil c) NAV per unit (` per unit)
Direct plan Regular planOptions 31/03/2016 30/09/2016 31/03/2016 30/09/2016Growth 11.9860 12.5771 11.9234 12.5051 Quarterly Div. - - 11.9232 12.5049 d) Dividend declared during the period (` per unit) - Nil e) Total outstanding exposure in derivative instruments at the end of the period - Nilf) Total investments in foreign securities /ADR'S/GDR'S at the end of the period -Nilg) Average Maturity (years) - 1.43h) Average Duration (years) - 1.26i) Repo in corporate debt - Nil
SUNDARAM FIXED TERM PLAN - FL
Sl No ISIN Code Name of the instrument Industry/ Quantity Mkt Value % of Rating ` in Lakhs NAV A) Debt Instruments a) Listed / awaiting listing on Stock Exchange 1 INE001A07NT0 Housing Development Finance Corporation Ltd - 8.45 - 24/04/2017** CRISIL AAA 100 502.03 11.412 INE134E08HR5 Power Finance Corporation Ltd - 8.12 - 17/04/2017** CRISIL AAA 42 421.88 9.593 INE296A07BC7 Bajaj Finance Ltd - 9.9 - 25/04/2017** CRISIL AA+ 30 303.07 6.89 Total for Debt Instruments 1226.97 27.88 (B) Money Market Instruments (a) Certificate of Deposits 1 INE238A16K21 Axis Bank Ltd - 27/04/2017** CRISIL A1+ 540 519.36 11.802 INE528G16F88 Yes Bank Ltd - 27/04/2017** ICRA A1+ 540 519.21 11.803 INE608A16MO6 Punjab and Sind Bank - 21/03/2017** ICRA A1+ 500 484.73 11.014 INE556F16101 Small Industries Development Bank of India - 31/03/2017** CRISIL A1+ 500 483.84 10.995 INE237A16P92 Kotak Mahindra Bank Ltd - 27/04/2017** CRISIL A1+ 500 480.86 10.936 INE112A16JY4 Corporation Bank - 09/03/2017** CRISIL A1+ 130 126.31 2.877 INE008A16K29 IDBI Bank Ltd - 07/02/2017** CRISIL A1+ 40 39.07 0.89 Sub Total 2653.39 60.29 (b) Commercial Papers 1 INE976I14KJ9 Tata Capital Ltd - 24/04/2017** CRISIL A1+ 100 479.53 10.90 Sub Total 479.53 10.90 (c) Reverse Repo/CBLO1 Reverse Repo 5.00 0.11 Sub Total 5.00 0.11 Total for Money Market Instruments 3137.92 71.30 Cash and Other Net Current Assets 36.03 0.82 Grand Total 4400.92 100.00** Thinly traded / Non Traded securities Notesa) Total NPA's provided for and its percentage to NAV - Nil b) Total value and percentage of illiquid equity shares - Nil c) NAV per unit (` per unit)
Direct plan Regular planOptions 31/03/2016 30/09/2016 31/03/2016 30/09/2016Growth 11.9008 12.3879 11.8168 12.2746 Quarterly Div. - - 11.8168 12.2746 Halfyearly Div. - - 11.8168 12.2747d) Dividend declared during the period (` per unit) - Nil e) Total outstanding exposure in derivative instruments at the end of the period - Nilf) Total investments in foreign securities /ADR'S/GDR'S at the end of the period - Nilg) Average Maturity (years) - 0.54h) Average Duration (years) - 0.52i) Repo in corporate debt - Nil
SUNDARAM FIXED TERM PLAN - FM
Sl No ISIN Code Name of the instrument Industry/ Quantity Mkt Value % of Rating ` in Lakhs NAV A) Debt Instruments a) Listed / awaiting listing on Stock Exchange 1 INE296A07BC7 Bajaj Finance Ltd - 9.9 - 25/04/2017** CRISIL AA+ 33 333.37 17.622 INE667F08046 Sundaram BNP Paribas Home Finance Ltd - 10 - 03/02/2017** CARE AA 32 322.43 17.043 INE445L08201 Nabha Power Ltd - 8.11 - 10/04/2017** ICRA AAA 30 300.68 15.894 INE752E07GH9 Power Grid Corporation of India Ltd - 8.9 - 25/02/2017** CRISIL AAA 16 201.33 10.645 INE134E08HR5 Power Finance Corporation Ltd - 8.12 - 17/04/2017** CRISIL AAA 4 40.18 2.12 Total for Debt Instruments 1197.99 63.31 (B) Money Market Instruments (a) Certificate of Deposits 1 INE008A16K29 IDBI Bank Ltd - 07/02/2017** CRISIL A1+ 520 507.95 26.842 INE514E16AM7 Export Import Bank of India - 24/02/2017** CRISIL A1+ 80 77.90 4.123 INE112A16JY4 Corporation Bank - 09/03/2017** CRISIL A1+ 50 48.58 2.57 Sub Total 634.43 33.53 (b) Reverse Repo/CBLO1 Reverse Repo 3.00 0.16 Sub Total 3.00 0.16 Total for Money Market Instruments 637.43 33.69 Cash and Other Net Current Assets 56.74 3.00 Grand Total 1892.16 100.00** Thinly traded / Non Traded securities Notesa) Total NPA's provided for and its percentage to NAV - Nil b) Total value and percentage of illiquid equity shares - Nil c) NAV per unit (` per unit)
Direct plan Regular planOptions 31/03/2016 30/09/2016 31/03/2016 30/09/2016Growth 11.7936 12.3010 11.7191 12.2025 Quarterly Div. 11.7934 12.3009 11.7201 12.2041d) Dividend declared during the period (` per unit) - Nil e) Total outstanding exposure in derivative instruments at the end of the period - Nilf) Total investments in foreign securities /ADR'S/GDR'S at the end of the period - Nilg) Average Maturity (years) - 0.42h) Average Duration (years) - 0.40i) Repo in corporate debt - Nil
SUNDARAM FIXED TERM PLAN - GE
Sl No ISIN Code Name of the instrument Industry/ Quantity Mkt Value % of Rating ` in Lakhs NAV A) Debt Instruments a) Listed / awaiting listing on Stock Exchange 1 INE916DA7HJ0 Kotak Mahindra Prime Ltd - 8.7572 - 22/05/2017** CRISIL AAA 105 1056.53 17.722 INE445L08201 Nabha Power Ltd - 8.11 - 10/04/2017** ICRA AAA 101 1012.30 16.983 INE134E08HS3 Power Finance Corporation Ltd - 8.12 - 22/05/2017** CRISIL AAA 100 1005.16 16.864 INE476M07503 L&T Housing Finance Ltd - 8.8087 - 22/05/2017** CARE AA+ 35 879.58 14.755 INE296A07BC7 Bajaj Finance Ltd - 9.9 - 25/04/2017** CRISIL AA+ 19 191.94 3.22 Total for Debt Instruments 4145.51 69.53 (B) Money Market Instruments (a) Certificate of Deposits 1 INE008A16K29 IDBI Bank Ltd - 07/02/2017** CRISIL A1+ 1350 1318.70 22.122 INE112A16JY4 Corporation Bank - 09/03/2017** CRISIL A1+ 100 97.16 1.633 INE238A16I25 Axis Bank Ltd - 17/03/2017** CRISIL A1+ 80 77.60 1.304 INE514E16AM7 Export Import Bank of India - 24/02/2017** CRISIL A1+ 20 19.48 0.33 Sub Total 1512.94 25.37 (b) Reverse Repo/CBLO1 Reverse Repo 10.00 0.17 Sub Total 10.00 0.17 Total for Money Market Instruments 1522.94 25.54 Cash and Other Net Current Assets 294.15 4.93 Grand Total 5962.61 100.00
** Thinly traded / Non Traded securities Notesa) Total NPA's provided for and its percentage to NAV - Nil b) Total value and percentage of illiquid equity shares - Nil c) NAV per unit (` per unit)
Direct plan Regular planOptions 31/03/2016 30/09/2016 31/03/2016 30/09/2016Growth 11.7536 12.2713 11.6804 12.1737 Quarterly Div. - - 11.6803 12.1736d) Dividend declared during the period (` per unit) - Nil e) Total outstanding exposure in derivative instruments at the end of the period - Nil f) Total investments in foreign securities /ADR'S/GDR'S at the end of the period - Nil g) Average Maturity (years) - 0.52 h) Average Duration (years) - 0.49 i) Repo in corporate debt - Nil
SUNDARAM FIXED TERM PLAN - GG
Sl No ISIN Code Name of the instrument Industry/ Quantity Mkt Value % of Rating ` in Lakhs NAV A) Debt Instruments a) Listed / awaiting listing on Stock Exchange 1 INE202B07FA8 Dewan Housing Finance Corporation Ltd - 9.26 - 19/06/2017** CARE AAA 24 240.51 17.612 INE523E07CJ9 L & T Finance Ltd - 8.8187 - 19/06/2017** CARE AA+ 9 226.51 16.593 INE445L08201 Nabha Power Ltd - 8.11 - 10/04/2017** ICRA AAA 22 220.50 16.154 INE134E08HL8 Power Finance Corporation Ltd - 8.35 - 27/05/2017** CRISIL AAA 20 201.17 14.735 INE752E07IC6 Power Grid Corporation of India Ltd - 9.64 - 31/05/2017** CRISIL AAA 10 126.84 9.296 INE261F09CW2 National Bank for Agricultural & Rural Development - 9.9 - 30/03/2017** CRISIL AAA 10 101.28 7.427 INE134E08HR5 Power Finance Corporation Ltd - 8.12 - 17/04/2017** CRISIL AAA 4 40.18 2.948 INE296A07BC7 Bajaj Finance Ltd - 9.9 - 25/04/2017** CRISIL AA+ 2 20.20 1.489 INE752E07GH9 Power Grid Corporation of India Ltd - 8.9 - 25/02/2017** CRISIL AAA 1 12.58 0.92 Sub Total 1189.76 87.14 (b) Govt Security 1 IN2220040082 7.20 Maharashtra State Development Loan 16/03/2017 Sovereign 9000 9.02 0.66 Sub Total 9.02 0.66 Total for Debt Instruments 1198.78 87.80 (B) Money Market Instruments (a) Certificate of Deposits 1 INE238A16I25 Axis Bank Ltd - 17/03/2017** CRISIL A1+ 60 58.20 4.262 INE514E16AM7 Export Import Bank of India - 24/02/2017** CRISIL A1+ 20 19.48 1.433 INE112A16JY4 Corporation Bank - 09/03/2017** CRISIL A1+ 20 19.43 1.42 Sub Total 97.11 7.11 (b) Reverse Repo / CBLO 1 Reverse Repo 11.00 0.80 Sub Total 11.00 0.80 Total for Money Market Instruments 108.11 7.91 Cash and Other Net Current Assets 58.53 4.29 Grand Total 1365.41 100.00** Thinly traded / Non Traded securities Notesa) Total NPA's provided for and its percentage to NAV - Nil b) Total value and percentage of illiquid equity shares - Nil c) NAV per unit (` per unit)
Direct plan Regular planOptions 31/03/2016 30/09/2016 31/03/2016 30/09/2016Growth 11.6522 12.1804 11.5794 12.0824 Halfyearly Div. - - 11.5792 12.0823d) Dividend declared during the period (` per unit) - Nil e) Total outstanding exposure in derivative instruments at the end of the period - Nil f) Total investments in foreign securities /ADR'S/GDR'S at the end of the period - Nil g) Average Maturity (years) - 0.59 h) Average Duration (years) - 0.55 i) Repo in corporate debt - Nil
SUNDARAM FIXED TERM PLAN - GJ
Sl No ISIN Code Name of the instrument Industry/ Quantity Mkt Value % of Rating ` in Lakhs NAV A) Debt Instruments a) Listed / awaiting listing on Stock Exchange 1 INE849A08041 Trent Ltd - 30/06/2017** BWR AA 27 488.62 19.862 INE134E08GC9 Power Finance Corporation Ltd - 9.32 - 19/08/2017** CRISIL AAA 43 437.21 17.773 INE001A07JC4 Housing Development Finance Corporation Ltd - 9.5 - 13/08/2017** CRISIL AAA 43 436.59 17.754 INE020B08757 Rural Electrification Corporation Ltd - 9.4 - 20/07/2017** CRISIL AAA 39 396.20 16.105 INE721A07HH0 Shriram Transport Finance Company Ltd - 9.85 - 15/07/2017** CRISIL AA+ 23000 232.63 9.466 INE202B07EG8 Dewan Housing Finance Corporation Ltd - 9.74 - 09/06/2017** CARE AAA 16 160.78 6.547 INE445L08201 Nabha Power Ltd - 8.11 - 10/04/2017** ICRA AAA 7 70.16 2.858 INE752E07GH9 Power Grid Corporation of India Ltd - 8.9 - 25/02/2017** CRISIL AAA 1 12.58 0.519 INE296A07BC7 Bajaj Finance Ltd - 9.9 - 25/04/2017** CRISIL AA+ 1 10.10 0.41 Total for Debt Instruments 2244.87 91.24 (B) Money Market Instruments (a) Certificate of Deposits 1 INE238A16I25 Axis Bank Ltd - 17/03/2017** CRISIL A1+ 180 174.60 7.10 Sub Total 174.60 7.10 (b) Reverse Repo / CBLO 1 Reverse Repo 6.00 0.24 Sub Total 6.00 0.24 Total for Money Market Instruments 180.60 7.34 Cash and Other Net Current Assets 34.82 1.42 Grand Total 2460.30 100.00** Thinly traded / Non Traded securities Notesa) Total NPA's provided for and its percentage to NAV - Nil b) Total value and percentage of illiquid equity shares - Nil c) NAV per unit (` per unit)
Direct plan Regular planOptions 31/03/2016 30/09/2016 31/03/2016 30/09/2016Growth 11.6577 12.2088 11.5956 12.1100 Quarterly Div. 11.6571 12.1954 11.5955 12.1100 Halfyearly Div. 11.6562 12.2064 11.5954 12.1096d) Dividend declared during the period (` per unit) - Nil e) Total outstanding exposure in derivative instruments at the end of the period - Nil f) Total investments in foreign securities /ADR'S/GDR'S at the end of the period - Nil g) Average Maturity (years) - 0.76 h) Average Duration (years) - 0.71i) Repo in corporate debt - Nil
SUNDARAM FIXED TERM PLAN - GK
Sl No ISIN Code Name of the instrument Industry/ Quantity Mkt Value % of Rating ` in Lakhs NAV A) Debt Instruments a) Listed / awaiting listing on Stock Exchange 1 INE296A07DD1 Bajaj Finance Ltd - 10/10/2017** ICRA AA+ 44 539.84 20.082 INE202B07BR1 Dewan Housing Finance Corporation Ltd - 10/10/2017** CARE AAA 44 537.93 20.013 INE134E08GC9 Power Finance Corporation Ltd - 9.32 - 19/08/2017** CRISIL AAA 47 477.88 17.784 INE694L07040 Talwandi Sabo Power Ltd - 9.7 - 18/09/2017** CRISIL AA-(SO) 40 402.97 14.995 INE445L08169 Nabha Power Ltd - 9.4 - 30/09/2017** ICRA AAA 27 274.81 10.226 INE020B07JB4 Rural Electrification Corporation Ltd - 9.06 - 23/09/2017** CRISIL AAA 19 193.07 7.187 INE020B08757 Rural Electrification Corporation Ltd - 9.4 - 20/07/2017** CRISIL AAA 11 111.75 4.16 Total for Debt Instruments 2538.24 94.42 (B) Money Market Instruments (a) Certificate of Deposits 1 INE238A16I25 Axis Bank Ltd - 17/03/2017** CRISIL A1+ 90 87.30 3.25 Sub Total 87.30 3.25 (b) Reverse Repo/CBLO1 Reverse Repo 52.00 1.93 Sub Total 52.00 1.93 Total for Money Market Instruments 139.30 5.18 Cash and Other Net Current Assets 10.80 0.40 Grand Total 2688.35 100.00** Thinly traded / Non Traded securities Notesa) Total NPA's provided for and its percentage to NAV - Nil b) Total value and percentage of illiquid equity shares - Nil c) NAV per unit (` per unit)
Direct plan Regular planOptions 31/03/2016 30/09/2016 31/03/2016 30/09/2016Growth 11.4911 12.0988 11.4311 12.0030 Quarterly Div. - - 11.4310 12.0029 Halfyearly Div. 11.4913 12.0749 - -
d) Dividend declared during the period (` per unit) - Nil e) Total outstanding exposure in derivative instruments at the end of the period - Nil f) Total investments in foreign securities /ADR'S/GDR'S at the end of the period - Nil g) Average Maturity (years) - 0.93 h) Average Duration (years) - 0.86 i) Repo in corporate debt - Nil
SUNDARAM FIXED TERM PLAN - GU
Sl No ISIN Code Name of the instrument Industry/ Quantity Mkt Value % of Rating ` in Lakhs NAV A) Debt Instruments a) Listed / awaiting listing on Stock Exchange 1 INE296A07EY5 Bajaj Finance Ltd - 14/02/2018** ICRA AA+ 135 1578.88 17.022 INE134E08FD9 Power Finance Corporation Ltd - 8.72 - 08/02/2018** CRISIL AAA 150 1524.63 16.443 INE020B08815 Rural Electrification Corporation Ltd - 8.7 - 01/02/2018** CRISIL AAA 150 1524.63 16.444 INE445L08193 Nabha Power Ltd - 8.72 - 23/01/2018** ICRA AAA 150 1518.29 16.375 INE774D07KM7 Mahindra & Mahindra Financial Services Ltd - 9.05 - 07/11/2017** IND AAA 100 1012.46 10.926 INE033L07BB3 Tata Capital Housing Finance Ltd - 8.95 - 14/02/2018** CRISIL AA+ 80 808.60 8.727 INE752E07HR6 Power Grid Corporation of India Ltd - 8.84 - 21/10/2017** CRISIL AAA 40 507.52 5.478 INE261F09DY6 National Bank for Agricultural & Rural Development - 01/01/2018** CRISIL AAA 1000 183.12 1.979 INE445L08169 Nabha Power Ltd - 9.4 - 30/09/2017** ICRA AAA 9 91.60 0.9910 INE001A07JC4 Housing Development Finance Corporation Ltd - 9.5 - 13/08/2017** CRISIL AAA 7 71.07 0.77 Total for Debt Instruments 8820.81 95.11 (B) Money Market Instruments 1 Reverse Repo 19.00 0.21 Total for Money Market Instruments 19.00 0.21 Cash and Other Net Current Assets 434.11 4.68 Grand Total 9273.91 100.00** Thinly traded / Non Traded securities Notesa) Total NPA's provided for and its percentage to NAV - Nil b) Total value and percentage of illiquid equity shares - Nil c) NAV per unit (` per unit)
Direct plan Regular planOptions 31/03/2016 30/09/2016 31/03/2016 30/09/2016Growth 11.0453 11.5813 11.0329 11.5586 Halfyearly Div. - - 11.0323 11.5582d) Dividend declared during the period (` per unit) - Nil e) Total outstanding exposure in derivative instruments at the end of the period - Nil f) Total investments in foreign securities /ADR'S/GDR'S at the end of the period - Nil g) Average Maturity (years) - 1.23 h) Average Duration (years) - 1.09 i) Repo in corporate debt - Nil
SUNDARAM FIXED TERM PLAN - GW
Sl No ISIN Code Name of the instrument Industry/ Quantity Mkt Value % of Rating ` in Lakhs NAV A) Debt Instruments a) Listed / awaiting listing on Stock Exchange 1 INE033L07CC9 Tata Capital Housing Finance Ltd - 8.78 - 27/04/2018** CRISIL AA+ 210 2119.69 17.732 INE134E08FK4 Power Finance Corporation Ltd - 8.95 - 11/03/2018** CRISIL AAA 200 2040.84 17.073 INE445L08185 Nabha Power Ltd - 8.95 - 09/04/2018** ICRA AAA 200 2036.51 17.044 INE774D07JG1 Mahindra & Mahindra Financial Services Ltd - 9.25 - 20/04/2018** CRISIL AA+ 200 2035.97 17.035 INE114A07893 Steel Authority of India Ltd - 7.95 - 09/04/2018** IND AA 200 1995.80 16.706 INE752E07GI7 Power Grid Corporation of India Ltd - 8.9 - 25/02/2018** CRISIL AAA 47 599.28 5.017 INE020B08815 Rural Electrification Corporation Ltd - 8.7 - 01/02/2018** CRISIL AAA 43 437.06 3.668 INE557F08EW1 National Housing Bank - 8 - 10/04/2018** CRISIL AAA 13 131.31 1.10 Total for Debt Instruments 11396.46 95.34 (B) Money Market Instruments 1 Reverse Repo 8.00 0.07 Total for Money Market Instruments 8.00 0.07 Cash and Other Net Current Assets 548.92 4.59 Grand Total 11953.38 100.00** Thinly traded / Non Traded securities Notesa) Total NPA's provided for and its percentage to NAV - Nil b) Total value and percentage of illiquid equity shares - Nil c) NAV per unit (` per unit)
Direct plan Regular planOptions 31/03/2016 30/09/2016 31/03/2016 30/09/2016Growth 10.7327 11.2545 10.7290 11.2473 Quarterly Div. 10.7310 11.2533 10.7264 11.2434d) Dividend declared during the period (` per unit) - Nil e) Total outstanding exposure in derivative instruments at the end of the period - Nil f) Total investments in foreign securities /ADR'S/GDR'S at the end of the period - Nil g) Average Maturity (years) - 1.44 h) Average Duration (years) - 1.26 i) Repo in corporate debt - Nil
SUNDARAM FIXED TERM PLAN - GY
Sl No ISIN Code Name of the instrument Industry/ Quantity Mkt Value % of Rating ` in Lakhs NAV A) Debt Instruments a) Listed / awaiting listing on Stock Exchange 1 INE134E08HB9 Power Finance Corporation Ltd - 8.4 - 19/06/2018** CRISIL AAA 850 8637.50 17.542 INE774D07MY8 Mahindra & Mahindra Financial Services Ltd - 8.8248 - 26/07/2018** IND AAA 660 6713.42 13.643 INE752E07LA4 Power Grid Corporation of India Ltd - 8.7 - 15/07/2018** CRISIL AAA 600 6134.46 12.464 INE261F08493 National Bank for Agricultural & Rural Development - 8.25 - 24/05/2018** CRISIL AAA 550 5592.20 11.365 INE860H07BN2 Aditya Birla Finance Ltd - 26/07/2018** ICRA AA+ 440 4954.17 10.066 INE033L07DJ2 Tata Capital Housing Finance Ltd - 8.92 - 26/07/2018** CRISIL AA+ 440 4459.48 9.067 INE916DA7IP5 Kotak Mahindra Prime Ltd - 26/07/2018** CRISIL AAA 284 2477.60 5.038 INE261F08469 National Bank for Agricultural & Rural Development - 8.19 - 08/06/2018** CRISIL AAA 200 2028.04 4.129 INE261F08519 National Bank for Agricultural & Rural Development - 8.3 - 12/06/2018** CRISIL AAA 100 1015.38 2.0610 INE514E08CL2 Export Import Bank of India - 8.27 - 07/05/2018** CRISIL AAA 100 1013.87 2.0611 INE752E07JR2 Power Grid Corporation of India Ltd - 9.3 - 28/06/2018** CRISIL AAA 40 515.61 1.0512 INE556F09536 Small Industries Development Bank of India - 8.25 - 20/06/2018** CRISIL AAA 50 507.55 1.0313 INE556F09478 Small Industries Development Bank of India - 8.2 - 07/06/2018** CARE AAA 50 507.04 1.0314 INE752E07HG9 Power Grid Corporation of India Ltd - 8.64 - 08/07/2018** CRISIL AAA 7 89.35 0.1815 INE445L08185 Nabha Power Ltd - 8.95 - 09/04/2018** ICRA AAA 7 71.28 0.1416 INE053F09FN5 Indian Railway Finance Corporation Ltd - 9.43 - 23/05/2018** CRISIL AAA 3 31.06 0.06 Sub Total 44748.04 90.89 (b) Govt Security 1 IN1620140039 8.81 Haryana State Development Loan 09/07/2018 Sovereign 2150000 2213.92 4.50 Sub Total 2213.92 4.50 Total for Debt Instruments 46961.96 95.39 (B) Money Market Instruments 1 Reverse Repo 1.00 # Total for Money Market Instruments 1.00 # Cash and Other Net Current Assets 2270.00 4.61 Grand Total 49232.96 100.00** Thinly traded / Non Traded securities# Indicates percentage to NAV of security is less than 0.01% Notesa) Total NPA's provided for and its percentage to NAV - Nil b) Total value and percentage of illiquid equity shares - Nil c) NAV per unit (` per unit)
Direct plan Regular planOptions 31/03/2016 30/09/2016 31/03/2016 30/09/2016Growth 10.6251 11.1815 10.6022 11.1507 Quarterly Div. - - 10.6068 11.1572 Halfyearly Div. - - 10.6068 11.1572d) Dividend declared during the period (` per unit) - Nil e) Total outstanding exposure in derivative instruments at the end of the period - Nil f) Total investments in foreign securities /ADR'S/GDR'S at the end of the period - Nil g) Average Maturity (years) - 1.68 h) Average Duration (years) - 1.51 i) Repo in corporate debt - Nil
SUNDARAM FIXED TERM PLAN - HA
Sl No ISIN Code Name of the instrument Industry/ Quantity Mkt Value % of Rating ` in Lakhs NAV A) Debt Instruments a) Listed / awaiting listing on Stock Exchange 1 INE261F08550 National Bank for Agricultural & Rural Development - 7.9 - 27/11/2018** CRISIL AAA 240 2428.58 18.672 INE020B07HY0 Rural Electrification Corporation Ltd - 9.38 - 06/11/2018** CRISIL AAA 230 2388.94 18.363 INE134E08BH9 Power Finance Corporation Ltd - 11.25 - 28/11/2018** CRISIL AAA 222 2385.37 18.34
www.sundarammutual.com
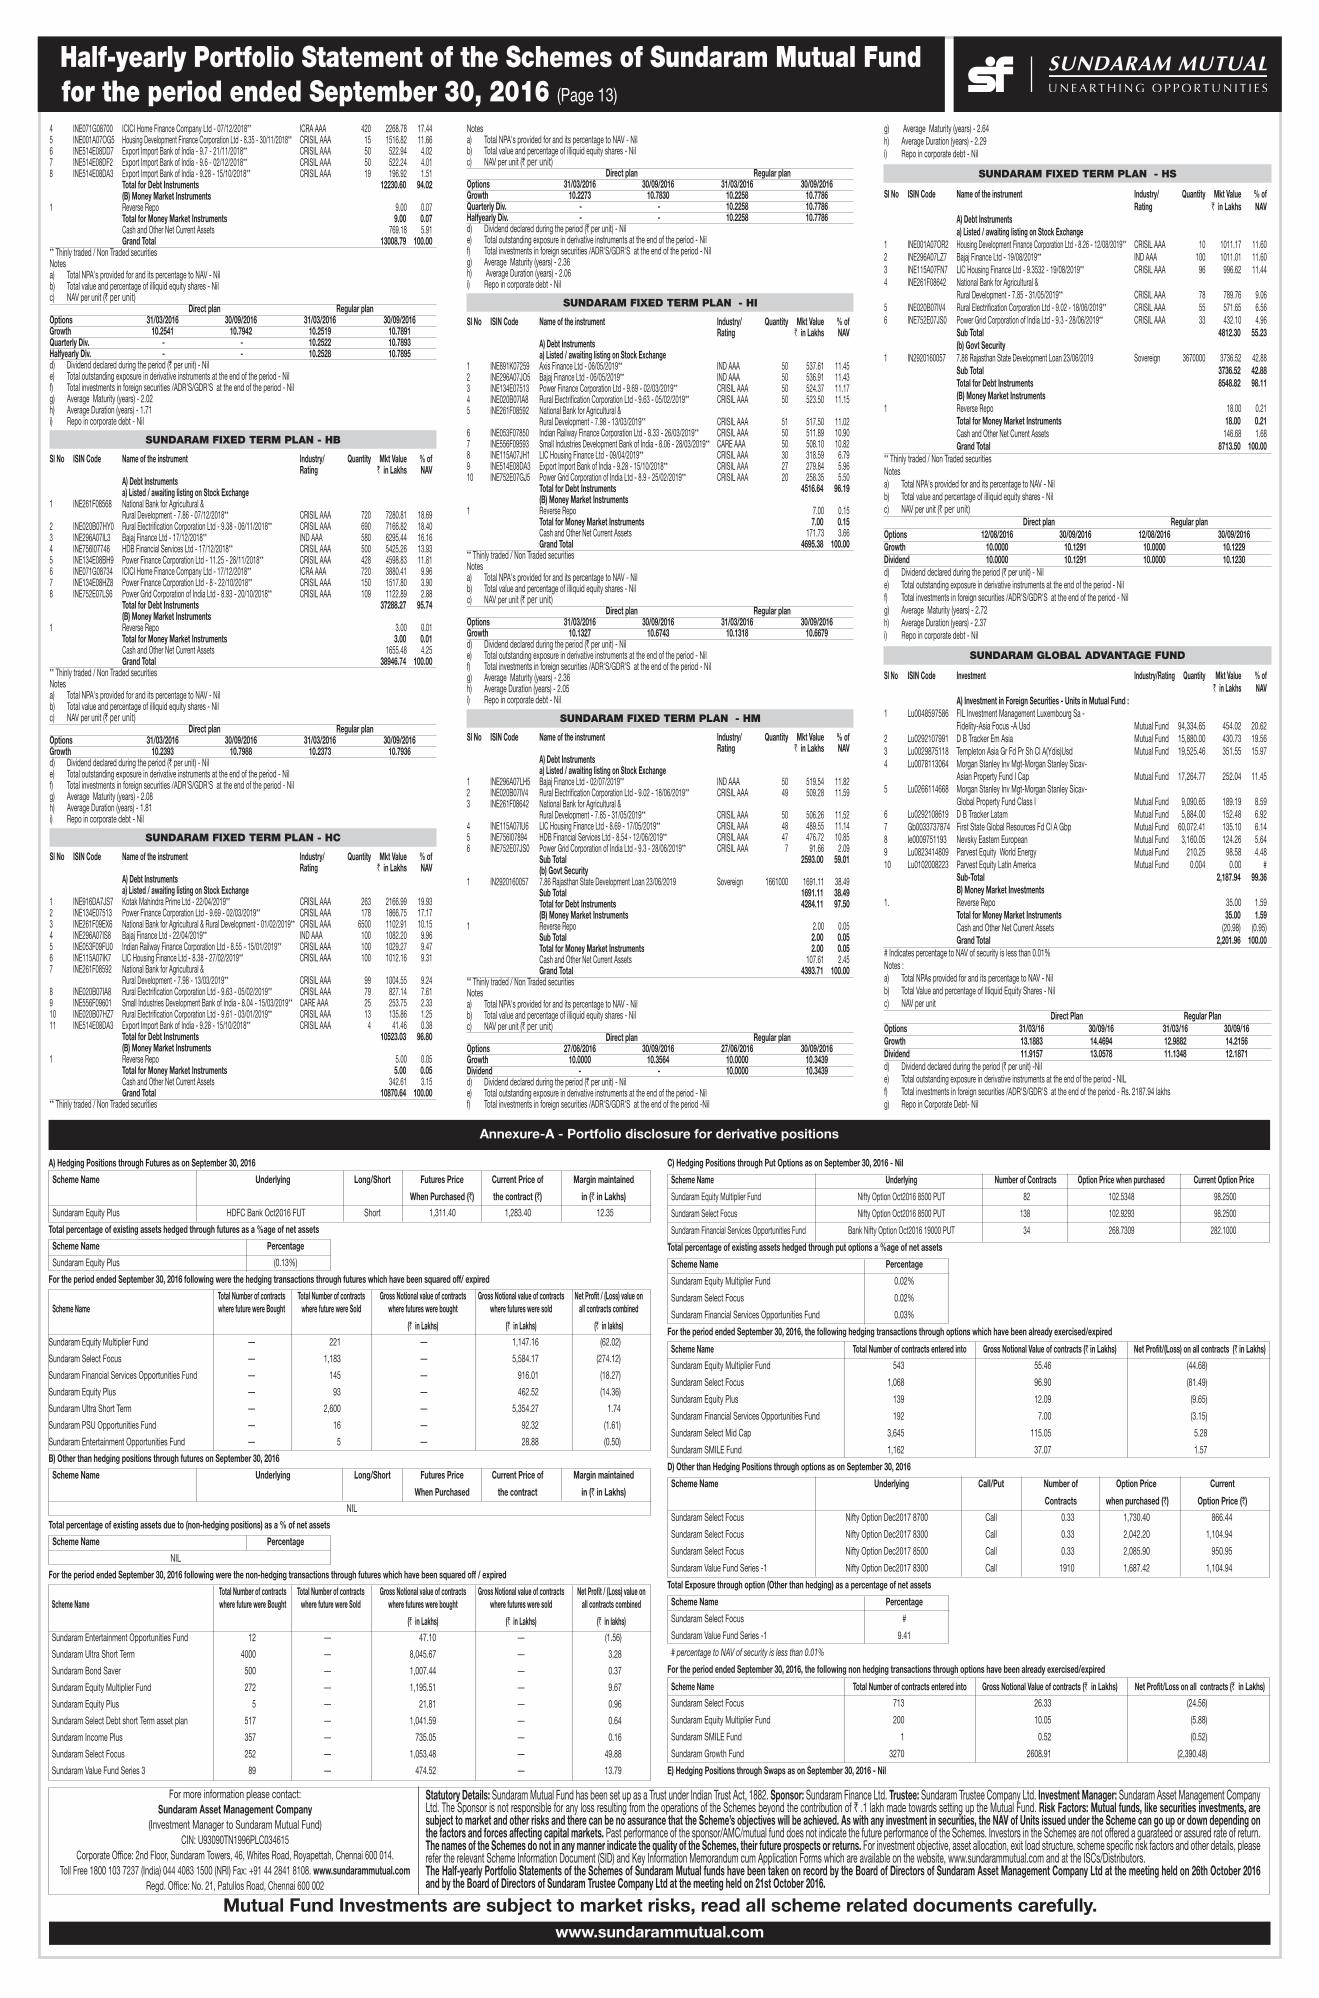
Half-yearly Portfolio Statement of the Schemes of Sundaram Mutual Fund for the period ended September 30, 2016 (Page 13)
4 INE071G08700 ICICI Home Finance Company Ltd - 07/12/2018** ICRA AAA 420 2268.78 17.445 INE001A07OG5 Housing Development Finance Corporation Ltd - 8.35 - 30/11/2018** CRISIL AAA 15 1516.82 11.666 INE514E08DD7 Export Import Bank of India - 9.7 - 21/11/2018** CRISIL AAA 50 522.94 4.027 INE514E08DF2 Export Import Bank of India - 9.6 - 02/12/2018** CRISIL AAA 50 522.24 4.018 INE514E08DA3 Export Import Bank of India - 9.28 - 15/10/2018** CRISIL AAA 19 196.92 1.51 Total for Debt Instruments 12230.60 94.02 (B) Money Market Instruments 1 Reverse Repo 9.00 0.07 Total for Money Market Instruments 9.00 0.07 Cash and Other Net Current Assets 769.18 5.91 Grand Total 13008.79 100.00** Thinly traded / Non Traded securities Notesa) Total NPA's provided for and its percentage to NAV - Nil b) Total value and percentage of illiquid equity shares - Nil c) NAV per unit (` per unit)
Direct plan Regular planOptions 31/03/2016 30/09/2016 31/03/2016 30/09/2016Growth 10.2541 10.7942 10.2519 10.7891 Quarterly Div. - - 10.2522 10.7893 Halfyearly Div. - - 10.2528 10.7895d) Dividend declared during the period (` per unit) - Nil e) Total outstanding exposure in derivative instruments at the end of the period - Nil f) Total investments in foreign securities /ADR'S/GDR'S at the end of the period - Nil g) Average Maturity (years) - 2.02 h) Average Duration (years) - 1.71 i) Repo in corporate debt - Nil
SUNDARAM FIXED TERM PLAN - HB
Sl No ISIN Code Name of the instrument Industry/ Quantity Mkt Value % of Rating ` in Lakhs NAV A) Debt Instruments a) Listed / awaiting listing on Stock Exchange 1 INE261F08568 National Bank for Agricultural & Rural Development - 7.86 - 07/12/2018** CRISIL AAA 720 7280.81 18.692 INE020B07HY0 Rural Electrification Corporation Ltd - 9.38 - 06/11/2018** CRISIL AAA 690 7166.82 18.403 INE296A07IL3 Bajaj Finance Ltd - 17/12/2018** IND AAA 580 6295.44 16.164 INE756I07746 HDB Financial Services Ltd - 17/12/2018** CRISIL AAA 500 5425.26 13.935 INE134E08BH9 Power Finance Corporation Ltd - 11.25 - 28/11/2018** CRISIL AAA 428 4598.83 11.816 INE071G08734 ICICI Home Finance Company Ltd - 17/12/2018** ICRA AAA 720 3880.41 9.967 INE134E08HZ8 Power Finance Corporation Ltd - 8 - 22/10/2018** CRISIL AAA 150 1517.80 3.908 INE752E07LS6 Power Grid Corporation of India Ltd - 8.93 - 20/10/2018** CRISIL AAA 109 1122.89 2.88 Total for Debt Instruments 37288.27 95.74 (B) Money Market Instruments 1 Reverse Repo 3.00 0.01 Total for Money Market Instruments 3.00 0.01 Cash and Other Net Current Assets 1655.48 4.25 Grand Total 38946.74 100.00** Thinly traded / Non Traded securities Notesa) Total NPA's provided for and its percentage to NAV - Nil b) Total value and percentage of illiquid equity shares - Nil c) NAV per unit (` per unit)
Direct plan Regular planOptions 31/03/2016 30/09/2016 31/03/2016 30/09/2016Growth 10.2393 10.7988 10.2373 10.7936d) Dividend declared during the period (` per unit) - Nil e) Total outstanding exposure in derivative instruments at the end of the period - Nil f) Total investments in foreign securities /ADR'S/GDR'S at the end of the period - Nil g) Average Maturity (years) - 2.08 h) Average Duration (years) - 1.81 i) Repo in corporate debt - Nil
SUNDARAM FIXED TERM PLAN - HC
Sl No ISIN Code Name of the instrument Industry/ Quantity Mkt Value % of Rating ` in Lakhs NAV A) Debt Instruments a) Listed / awaiting listing on Stock Exchange 1 INE916DA7JS7 Kotak Mahindra Prime Ltd - 22/04/2019** CRISIL AAA 263 2166.99 19.932 INE134E07513 Power Finance Corporation Ltd - 9.69 - 02/03/2019** CRISIL AAA 178 1866.75 17.173 INE261F09EX6 National Bank for Agricultural & Rural Development - 01/02/2019** CRISIL AAA 6500 1102.91 10.154 INE296A07IS8 Bajaj Finance Ltd - 22/04/2019** IND AAA 100 1082.20 9.965 INE053F09FU0 Indian Railway Finance Corporation Ltd - 8.55 - 15/01/2019** CRISIL AAA 100 1029.27 9.476 INE115A07IK7 LIC Housing Finance Ltd - 8.38 - 27/02/2019** CRISIL AAA 100 1012.16 9.317 INE261F08592 National Bank for Agricultural & Rural Development - 7.98 - 13/03/2019** CRISIL AAA 99 1004.55 9.248 INE020B07IA8 Rural Electrification Corporation Ltd - 9.63 - 05/02/2019** CRISIL AAA 79 827.14 7.619 INE556F09601 Small Industries Development Bank of India - 8.04 - 15/03/2019** CARE AAA 25 253.75 2.3310 INE020B07HZ7 Rural Electrification Corporation Ltd - 9.61 - 03/01/2019** CRISIL AAA 13 135.86 1.2511 INE514E08DA3 Export Import Bank of India - 9.28 - 15/10/2018** CRISIL AAA 4 41.46 0.38 Total for Debt Instruments 10523.03 96.80 (B) Money Market Instruments 1 Reverse Repo 5.00 0.05 Total for Money Market Instruments 5.00 0.05 Cash and Other Net Current Assets 342.61 3.15 Grand Total 10870.64 100.00** Thinly traded / Non Traded securities
Notesa) Total NPA's provided for and its percentage to NAV - Nil b) Total value and percentage of illiquid equity shares - Nil c) NAV per unit (` per unit)
Direct plan Regular planOptions 31/03/2016 30/09/2016 31/03/2016 30/09/2016Growth 10.2273 10.7830 10.2258 10.7786 Quarterly Div. - - 10.2258 10.7786 Halfyearly Div. - - 10.2258 10.7786d) Dividend declared during the period (` per unit) - Nil e) Total outstanding exposure in derivative instruments at the end of the period - Nil f) Total investments in foreign securities /ADR'S/GDR'S at the end of the period - Nil g) Average Maturity (years) - 2.36 h) Average Duration (years) - 2.06 i) Repo in corporate debt - Nil
SUNDARAM FIXED TERM PLAN - HI
Sl No ISIN Code Name of the instrument Industry/ Quantity Mkt Value % of Rating ` in Lakhs NAV A) Debt Instruments a) Listed / awaiting listing on Stock Exchange 1 INE891K07259 Axis Finance Ltd - 06/05/2019** IND AAA 50 537.61 11.452 INE296A07JO5 Bajaj Finance Ltd - 06/05/2019** IND AAA 50 536.91 11.433 INE134E07513 Power Finance Corporation Ltd - 9.69 - 02/03/2019** CRISIL AAA 50 524.37 11.174 INE020B07IA8 Rural Electrification Corporation Ltd - 9.63 - 05/02/2019** CRISIL AAA 50 523.50 11.155 INE261F08592 National Bank for Agricultural & Rural Development - 7.98 - 13/03/2019** CRISIL AAA 51 517.50 11.026 INE053F07850 Indian Railway Finance Corporation Ltd - 8.33 - 26/03/2019** CRISIL AAA 50 511.89 10.907 INE556F09593 Small Industries Development Bank of India - 8.06 - 28/03/2019** CARE AAA 50 508.10 10.828 INE115A07JH1 LIC Housing Finance Ltd - 09/04/2019** CRISIL AAA 30 318.59 6.799 INE514E08DA3 Export Import Bank of India - 9.28 - 15/10/2018** CRISIL AAA 27 279.84 5.9610 INE752E07GJ5 Power Grid Corporation of India Ltd - 8.9 - 25/02/2019** CRISIL AAA 20 258.35 5.50 Total for Debt Instruments 4516.64 96.19 (B) Money Market Instruments 1 Reverse Repo 7.00 0.15 Total for Money Market Instruments 7.00 0.15 Cash and Other Net Current Assets 171.73 3.66 Grand Total 4695.38 100.00** Thinly traded / Non Traded securities Notesa) Total NPA's provided for and its percentage to NAV - Nil b) Total value and percentage of illiquid equity shares - Nil c) NAV per unit (` per unit)
Direct plan Regular planOptions 31/03/2016 30/09/2016 31/03/2016 30/09/2016Growth 10.1327 10.6743 10.1318 10.6679d) Dividend declared during the period (` per unit) - Nil e) Total outstanding exposure in derivative instruments at the end of the period - Nil f) Total investments in foreign securities /ADR'S/GDR'S at the end of the period - Nil g) Average Maturity (years) - 2.36 h) Average Duration (years) - 2.05 i) Repo in corporate debt - Nil
SUNDARAM FIXED TERM PLAN - HM
Sl No ISIN Code Name of the instrument Industry/ Quantity Mkt Value % of Rating ` in Lakhs NAV A) Debt Instruments a) Listed / awaiting listing on Stock Exchange 1 INE296A07LH5 Bajaj Finance Ltd - 02/07/2019** IND AAA 50 519.54 11.822 INE020B07IV4 Rural Electrification Corporation Ltd - 9.02 - 18/06/2019** CRISIL AAA 49 509.28 11.593 INE261F08642 National Bank for Agricultural & Rural Development - 7.85 - 31/05/2019** CRISIL AAA 50 506.26 11.524 INE115A07IU6 LIC Housing Finance Ltd - 8.69 - 17/05/2019** CRISIL AAA 48 489.55 11.145 INE756I07894 HDB Financial Services Ltd - 8.54 - 12/06/2019** CRISIL AAA 47 476.72 10.856 INE752E07JS0 Power Grid Corporation of India Ltd - 9.3 - 28/06/2019** CRISIL AAA 7 91.66 2.09 Sub Total 2593.00 59.01 (b) Govt Security 1 IN2920160057 7.86 Rajasthan State Development Loan 23/06/2019 Sovereign 1661000 1691.11 38.49 Sub Total 1691.11 38.49 Total for Debt Instruments 4284.11 97.50 (B) Money Market Instruments 1 Reverse Repo 2.00 0.05 Sub Total 2.00 0.05 Total for Money Market Instruments 2.00 0.05 Cash and Other Net Current Assets 107.61 2.45 Grand Total 4393.71 100.00** Thinly traded / Non Traded securities Notesa) Total NPA's provided for and its percentage to NAV - Nil b) Total value and percentage of illiquid equity shares - Nil c) NAV per unit (` per unit)
Direct plan Regular planOptions 27/06/2016 30/09/2016 27/06/2016 30/09/2016Growth 10.0000 10.3564 10.0000 10.3439 Dividend - - 10.0000 10.3439d) Dividend declared during the period (` per unit) - Nil e) Total outstanding exposure in derivative instruments at the end of the period - Nil f) Total investments in foreign securities /ADR'S/GDR'S at the end of the period -Nil
g) Average Maturity (years) - 2.64 h) Average Duration (years) - 2.29 i) Repo in corporate debt - Nil
SUNDARAM FIXED TERM PLAN - HS
Sl No ISIN Code Name of the instrument Industry/ Quantity Mkt Value % of Rating ` in Lakhs NAV A) Debt Instruments a) Listed / awaiting listing on Stock Exchange 1 INE001A07OR2 Housing Development Finance Corporation Ltd - 8.26 - 12/08/2019** CRISIL AAA 10 1011.17 11.602 INE296A07LZ7 Bajaj Finance Ltd - 19/08/2019** IND AAA 100 1011.01 11.603 INE115A07FN7 LIC Housing Finance Ltd - 9.3532 - 19/08/2019** CRISIL AAA 96 996.62 11.444 INE261F08642 National Bank for Agricultural & Rural Development - 7.85 - 31/05/2019** CRISIL AAA 78 789.76 9.065 INE020B07IV4 Rural Electrification Corporation Ltd - 9.02 - 18/06/2019** CRISIL AAA 55 571.65 6.566 INE752E07JS0 Power Grid Corporation of India Ltd - 9.3 - 28/06/2019** CRISIL AAA 33 432.10 4.96 Sub Total 4812.30 55.23 (b) Govt Security 1 IN2920160057 7.86 Rajasthan State Development Loan 23/06/2019 Sovereign 3670000 3736.52 42.88 Sub Total 3736.52 42.88 Total for Debt Instruments 8548.82 98.11 (B) Money Market Instruments 1 Reverse Repo 18.00 0.21 Total for Money Market Instruments 18.00 0.21 Cash and Other Net Current Assets 146.68 1.68 Grand Total 8713.50 100.00** Thinly traded / Non Traded securities Notesa) Total NPA's provided for and its percentage to NAV - Nil b) Total value and percentage of illiquid equity shares - Nil c) NAV per unit (` per unit)
Direct plan Regular planOptions 12/08/2016 30/09/2016 12/08/2016 30/09/2016Growth 10.0000 10.1291 10.0000 10.1229 Dividend 10.0000 10.1291 10.0000 10.1230d) Dividend declared during the period (` per unit) - Nil e) Total outstanding exposure in derivative instruments at the end of the period - Nil f) Total investments in foreign securities /ADR'S/GDR'S at the end of the period - Nil g) Average Maturity (years) - 2.72 h) Average Duration (years) - 2.37 i) Repo in corporate debt - Nil
SUNDARAM GLOBAL ADVANTAGE FUND
Sl No ISIN Code Investment Industry/Rating Quantity Mkt Value % of ` in Lakhs NAV A) Investment in Foreign Securities - Units in Mutual Fund : 1 Lu0048597586 FIL Investment Management Luxembourg Sa - Fidelity-Asia Focus -A Usd Mutual Fund 94,334.65 454.02 20.622 Lu0292107991 D B Tracker Em Asia Mutual Fund 15,880.00 430.73 19.563 Lu0029875118 Templeton Asia Gr Fd Pr Sh Cl A(Ydis)Usd Mutual Fund 19,525.46 351.55 15.974 Lu0078113064 Morgan Stanley Inv Mgt-Morgan Stanley Sicav- Asian Property Fund I Cap Mutual Fund 17,264.77 252.04 11.455 Lu0266114668 Morgan Stanley Inv Mgt-Morgan Stanley Sicav- Global Property Fund Class I Mutual Fund 9,090.65 189.19 8.596 Lu0292108619 D B Tracker Latam Mutual Fund 5,884.00 152.48 6.927 Gb0033737874 First State Global Resources Fd Cl A Gbp Mutual Fund 60,072.41 135.10 6.148 Ie0009751193 Nevsky Eastern European Mutual Fund 3,160.05 124.26 5.649 Lu0823414809 Parvest Equity World Energy Mutual Fund 210.25 98.58 4.4810 Lu0102008223 Parvest Equity Latin America Mutual Fund 0.004 0.00 # Sub-Total 2,187.94 99.36 B) Money Market Investments1. Reverse Repo 35.00 1.59 Total for Money Market Instruments 35.00 1.59 Cash and Other Net Current Assets (20.98) (0.95) Grand Total 2,201.96 100.00# Indicates percentage to NAV of security is less than 0.01%Notes : a) Total NPAs provided for and its percentage to NAV - Nil b) Total Value and percentage of Illiquid Equity Shares - Nil c) NAV per unit
Direct Plan Regular PlanOptions 31/03/16 30/09/16 31/03/16 30/09/16Growth 13.1883 14.4694 12.9882 14.2156Dividend 11.9157 13.0578 11.1348 12.1871d) Dividend declared during the period (` per unit) -Nil e) Total outstanding exposure in derivative instruments at the end of the period - NIL f) Total investments in foreign securities /ADR'S/GDR'S at the end of the period - Rs. 2187.94 lakhs g) Repo in Corporate Debt- Nil
www.sundarammutual.com
Mutual Fund Investments are subject to market risks, read all scheme related documents carefully.
A) Hedging Positions through Futures as on September 30, 2016
Scheme Name Underlying Long/Short Futures Price Current Price of Margin maintained
When Purchased (`) the contract (`) in (` in Lakhs)
Sundaram Equity Plus HDFC Bank Oct2016 FUT Short 1,311.40 1,283.40 12.35
Total percentage of existing assets hedged through futures as a %age of net assets
Scheme Name Percentage
Sundaram Equity Plus (0.13%)
For the period ended September 30, 2016 following were the hedging transactions through futures which have been squared off/ expired
Total Number of contracts Total Number of contracts Gross Notional value of contracts Gross Notional value of contracts Net Profit / (Loss) value onScheme Name where future were Bought where future were Sold where futures were bought where futures were sold all contracts combined
(` in Lakhs) (` in Lakhs) (` in lakhs)
Sundaram Equity Multiplier Fund — 221 — 1,147.16 (62.02)
Sundaram Select Focus — 1,183 — 5,584.17 (274.12)
Sundaram Financial Services Opportunities Fund — 145 — 916.01 (18.27)
Sundaram Equity Plus — 93 — 462.52 (14.36)
Sundaram Ultra Short Term — 2,600 — 5,354.27 1.74
Sundaram PSU Opportunities Fund — 16 — 92.32 (1.61)
Sundaram Entertainment Opportunities Fund — 5 — 28.88 (0.50)
B) Other than hedging positions through futures on September 30, 2016
Scheme Name Underlying Long/Short Futures Price Current Price of Margin maintained
When Purchased the contract in (` in Lakhs)
NIL
Total percentage of existing assets due to (non-hedging positions) as a % of net assets
Scheme Name Percentage
NIL
For the period ended September 30, 2016 following were the non-hedging transactions through futures which have been squared off / expired
Total Number of contracts Total Number of contracts Gross Notional value of contracts Gross Notional value of contracts Net Profit / (Loss) value onScheme Name where future were Bought where future were Sold where futures were bought where futures were sold all contracts combined
(` in Lakhs) (` in Lakhs) (` in lakhs)
Sundaram Entertainment Opportunities Fund 12 — 47.10 — (1.56)
Sundaram Ultra Short Term 4000 — 8,045.67 — 3.28
Sundaram Bond Saver 500 — 1,007.44 — 0.37
Sundaram Equity Multiplier Fund 272 — 1,195.51 — 9.67
Sundaram Equity Plus 5 — 21.81 — 0.96
Sundaram Select Debt short Term asset plan 517 — 1,041.59 — 0.64
Sundaram Income Plus 357 — 735.05 — 0.16
Sundaram Select Focus 252 — 1,053.48 — 49.88
Sundaram Value Fund Series 3 89 — 474.52 — 13.79
C) Hedging Positions through Put Options as on September 30, 2016 - Nil
Scheme Name Underlying Number of Contracts Option Price when purchased Current Option Price
Sundaram Equity Multiplier Fund Nifty Option Oct2016 8500 PUT 82 102.5348 98.2500
Sundaram Select Focus Nifty Option Oct2016 8500 PUT 138 102.9293 98.2500
Sundaram Financial Services Opportunities Fund Bank Nifty Option Oct2016 19000 PUT 34 268.7309 282.1000
Total percentage of existing assets hedged through put options a %age of net assets
Scheme Name Percentage
Sundaram Equity Multiplier Fund 0.02%
Sundaram Select Focus 0.02%
Sundaram Financial Services Opportunities Fund 0.03%
For the period ended September 30, 2016, the following hedging transactions through options which have been already exercised/expired
Scheme Name Total Number of contracts entered into Gross Notional Value of contracts (` in Lakhs) Net Profit/(Loss) on all contracts (` in Lakhs)
Sundaram Equity Multiplier Fund 543 55.46 (44.68)
Sundaram Select Focus 1,068 96.90 (81.49)
Sundaram Equity Plus 139 12.09 (9.65)
Sundaram Financial Services Opportunities Fund 192 7.00 (3.15)
Sundaram Select Mid Cap 3,645 115.05 5.28
Sundaram SMILE Fund 1,162 37.07 1.57
D) Other than Hedging Positions through options as on September 30, 2016
Scheme Name Underlying Call/Put Number of Option Price Current
Contracts when purchased (`) Option Price (`)
Sundaram Select Focus Nifty Option Dec2017 8700 Call 0.33 1,730.40 866.44
Sundaram Select Focus Nifty Option Dec2017 8300 Call 0.33 2,042.20 1,104.94
Sundaram Select Focus Nifty Option Dec2017 8500 Call 0.33 2,085.90 950.95
Sundaram Value Fund Series -1 Nifty Option Dec2017 8300 Call 1910 1,687.42 1,104.94
Total Exposure through option (Other than hedging) as a percentage of net assets
Scheme Name Percentage
Sundaram Select Focus #
Sundaram Value Fund Series -1 9.41
# percentage to NAV of security is less than 0.01%
For the period ended September 30, 2016, the following non hedging transactions through options have been already exercised/expired
Scheme Name Total Number of contracts entered into Gross Notional Value of contracts (` in Lakhs) Net Profit/Loss on all contracts (` in Lakhs)
Sundaram Select Focus 713 26.33 (24.56)
Sundaram Equity Multiplier Fund 200 10.05 (5.88)
Sundaram SMILE Fund 1 0.52 (0.52)
Sundaram Growth Fund 3270 2608.91 (2,390.48)
E) Hedging Positions through Swaps as on September 30, 2016 - Nil
Annexure-A - Portfolio disclosure for derivative positions
For more information please contact:Sundaram Asset Management Company
(Investment Manager to Sundaram Mutual Fund)CIN: U93090TN1996PLC034615
Corporate Office: 2nd Floor, Sundaram Towers, 46, Whites Road, Royapettah, Chennai 600 014. Toll Free 1800 103 7237 (India) 044 4083 1500 (NRI) Fax: +91 44 2841 8108. www.sundarammutual.com
Regd. Office: No. 21, Patullos Road, Chennai 600 002
Statutory Details: Sundaram Mutual Fund has been set up as a Trust under Indian Trust Act, 1882. Sponsor: Sundaram Finance Ltd. Trustee: Sundaram Trustee Company Ltd. Investment Manager: Sundaram Asset Management CompanyLtd. The Sponsor is not responsible for any loss resulting from the operations of the Schemes beyond the contribution of ` .1 lakh made towards setting up the Mutual Fund. Risk Factors: Mutual funds, like securities investments, aresubject to market and other risks and there can be no assurance that the Scheme’s objectives will be achieved. As with any investment in securities, the NAV of Units issued under the Scheme can go up or down depending onthe factors and forces affecting capital markets. Past performance of the sponsor/AMC/mutual fund does not indicate the future performance of the Schemes. Investors in the Schemes are not offered a guarateed or assured rate of return.The names of the Schemes do not in any manner indicate the quality of the Schemes, their future prospects or returns. For investment objective, asset allocation, exit load structure, scheme specific risk factors and other details, pleaserefer the relevant Scheme Information Document (SID) and Key Information Memorandum cum Application Forms which are available on the website, www.sundarammutual.com and at the ISCs/Distributors. The Half-yearly Portfolio Statements of the Schemes of Sundaram Mutual funds have been taken on record by the Board of Directors of Sundaram Asset Management Company Ltd at the meeting held on 26th October 2016and by the Board of Directors of Sundaram Trustee Company Ltd at the meeting held on 21st October 2016.