Embed Size (px)
Citation preview
0
HAND BOOK ON CIVIL AVIATION STATISTICS
a glimpse of aviation statistics…..
2015-16

B. S. BHULLAR, rAS
DIRECTOR GENERAL OF CIVIL AVIATIONTECHNICAL CENTRE
OPPOS ITE SAFDARJUNG AI RPORTNew Delhi - 110003
ff.gtt. Tffi, rn.c.t.
FOREWORD
DGCA has been publishing on its website the monthly operating statisticsof scheduled airlines and air transport statistics every year. The annualpublication includes besides traffic statistics, fleet, and personnel statisticsas well as time series data.
In the year 20 13, it was decided to bring out regular annual publication viz.Handbook on civil aviation statistics, which illustrates civil aviation dataand brief analysis on passenger & freight traffic, aircraft, air safety, humanresources, operating economics and other aviation related statistics. I havegreat pleasure in releasing the fourth edition of Handbook on Civil AviationStatiStics pertaining to the year,2015-16.
In2O15-16, air traffic registered a robust growth compared to the previousyear. While the domestic passenger traffic registered a growth of 2I.6%o,international passenger traffic witnessed a growth of 8.9o/o during theperiod.
I am sure that the information containJd in this Handbook would be usefulto civil aviation stakeholders and researchers. I wish to complement thestaff of Statistics Division for their efforts to put all the data together andbring out this Handbook.
It will be our endeavour to include more topics in subsequent editions.Users are welcome to send in their suggestions to the Statistics Division ate-mail id:
--e(B.S. Bhullar)
Dated: 24th January, 2OI7
Tef.: +91 11 24620784, +91 11 24627830 . Fax: +91 11 24652760 . email : [email protected]

1
DGCA OVERVIEW
The Directorate General of Civil Aviation (DGCA) is a regulatory body in the field of Civil
Aviation primarily dealing with Air Safety issues. It is responsible for regulation of air
transport services to/from/within India and for enforcement of civil air regulations, air
safety and air worthiness standards. It also interfaces with all the regulatory functions of
International Civil Aviation Organization.
DGCA’s Vision Statement:
“Endeavour to promote safe and efficient Air Transportation through regulation and
proactive safety oversight system.”
DGCA has several directorates and divisions under its purview to carry out its functions and
services. Apart from this, there are 5 regional offices and 10 sub-regional offices as shown
below.

2
Sl. No. CONTENTS PAGE No.
1. PASSENGER TRAFFIC STATISTICS 1-5
2. FREIGHT TRAFFIC STATISTICS 6-7
3. AIRCRAFT STATISTICS 8-10
4. NSOP STATISTICS 11-12
5. OPERATING ECONOMICS STATISTICS 13-15
6. HUMAN RESOURCE STATISTICS 16-19
7. AIR SAFETY STATISTICS 20
8. OTHER AVIATION RELATED STATISTICS 21-22

1
PASSENGER TRAFFIC
Air Passenger Traffic in India, both domestic and international witnessed a positive growth in the year 2015-16 compared to the previous year.
TABLE 1: PASSENGER TRAFFIC AT A GLANCE
PASSENGER TRAFFIC UNIT 2015-16 2014-15
Domestic Passengers Departing Passengers
85.20 million
(21.58)
70.08 million (15.51)
Domestic Airline Demand Revenue Passenger Kilometers (RPK)
80.96 billion (20.80)
67.02 billion (13.32)
Domestic Airline Capacity Available Seat Kilometers (ASK)
97.71 billion (15.21)
84.81 billion (5.07)
International Passengers Departing and Arriving Passengers
49.78 million
(8.85)
45.74 million (5.85)
Total Passengers (Domestic & International) 134.98 (16.54)
115.82 (11.63)
Figures in parenthesis refer to percentage change over previous year.
ASK is calculated as the sum of products obtained by multiplying the total number of seats that are available in each flight by the
flight stage distance.
RPK is calculated as the sum of the product obtained by multiplying the number of revenue passengers carried on each flight stage
by the stage distance.
The domestic passenger traffic registered a compound annual growth rate (CAGR) of 10.10% during the period 2006-07 to 2015-16 while the international passenger traffic grew at 8.75% (CAGR) during the same period.
During the years from 2006-07 to 2015-16, the capacity (ASK) in the domestic market grew at a rate of 8.04% (CAGR) while the demand (RPK) grew at 10.29% (CAGR) during the same period.
35.844.4 39.5 45.3
53.860.8 57.6 60.6
70.1
85.2
23.4 27.2 28.9 32.1 35.1 38.1 40.3 43.1 45.7 49.8
59.271.6 68.4
77.488.9
98.9 97.9 103.7115.8
135.0
0
20
40
60
80
100
120
140
160
2006-07 2007-08 2008-09 2009-10 2010-11 2011-12 2012-13 2013-14 2014-15 2015-16
----
-Pas
sen
gers
(In
Mill
ion
)---
--
CHART 1. PASSENGER TRAFFIC CARRIED BY SCHEDULED CARRIERS OVER THE PAST DECADE
DOMESTIC PASSENGERS INTERNATIONAL PASSENGERS TOTAL PASSENGERS

2
TABLE 2: YEAR ON YEAR GROWTH IN PASSENGERS AND PASSENGER LOAD FACTOR (PLF)
NAME OF THE AIRLINE
PASSENGERS (2014-15)
(In Number)
PASSENGERS (2015-16)
(In Number)
YoY GROWTH IN PASSENGERS
(%)
PLF (2014-15)
(%)
PLF (2015-16)
(%)
YoY GROWTH IN
PLF (%)
AIR INDIA 11727171 12742163 8.7 77.2 79.2 2.6
AIR INDIA EXPRESS
191095 149217 -21.9 73.5 80.1 9.0
ALLIANCE AIR 310492 400340 28.9 68.3 66.5 -2.6
SPICEJET 10716089 10670866 -0.4 81.8 92.0 12.5
JET ARWAYS 12473808 15961308 28.0 78.4 80.6 2.8
INDIGO 23727080 31453451 32.6 79.4 84.1 5.9
GO AIR 6529936 7160189 9.7 79.1 83.7 5.7
JETLITE 3030638 2439721 -19.5 80.1 79.3 -0.9
AIR ASIA 553106 1705808 208.4 76.1 80.2 5.4
AIR COSTA 723627 711836 -1.6 74.1 80.7 9.0
VISTARA 100919 1422611 1309.7 53.7 69.4 29.1
TRUJET 0 204588 - - 80.1 -
AIR PEGASUS 0 175577 - - 78.5 -
Note: VISTARA OPERATED FOR ONLY THREE MONTHS i.e. JANUARY-MARCH DURING THE YEAR 2014-15.
AIR PEGASUS STARTED ITS OPERATIONS IN JULY 2015 AND TRUJET IN MAY 2015.
If we look at Airline-wise Growth in the number of Domestic Passengers, it is found that the high growth of 21.58 % in the total domestic passengers during 2015-16 is mainly due to the high growth in passengers carried by Alliance Air, Jet Airways, IndiGo and Air Asia. Another factor which led to the high growth is the introduction of the new Airlines such as Vistara, Trujet and Air Pegasus.
In the year 2015-16, both ASK and RPK in the domestic market registered a positive growth compared to the previous year. The Passenger Load Factor in the domestic market, which fell from 74.6% in 2012-13 to 73.3% in 2013-14, went up to 82.9% in 2015-16 after rising to 79.0 % in 2014-15.
33
51
9
41
71
8
37
70
4
43
95
9
52
70
7
59
08
4
56
55
3
59
13
9
67
02
3
80
95
8
48
70
2
60
59
0
59
16
0
61
09
1
68
21
6
78
63
9
75
84
3
80
71
6
84
80
5
97
71
3
68.8 68.963.7
72.077.3 75.1 74.6 73.3
79.082.9
0.0
10.0
20.0
30.0
40.0
50.0
60.0
70.0
80.0
90.0
10000
20000
30000
40000
50000
60000
70000
80000
90000
100000
2006-07 2007-08 2008-09 2009-10 2010-11 2011-12 2012-13 2013-14 2014-15 2015-16
----
-Pax
Lo
ad F
acto
r (%
)---
--
----
-RP
K &
ASK
(In
Mill
ion
)---
--
CHART 2: CAPACITY V/S DEMAND IN DOMESTIC MARKET OVER THE PAST DECADE
RPK (DEMAND) ASK (CAPACITY) PAX LOAD FACTOR

3
In the year 2015-16, domestic market experienced expansion in capacity as well as demand which is evident from the Chart 3 as both RPK & ASK witnessed positive growth in all the months as compared to the corresponding months in the previous year. Also, in most of the months YoY growth in RPK exceeded the YoY growth in ASK implying an improvement in the passenger load factor and hence efficiency except for the months of September, December and February.
In the year 2015-16 both in terms of passenger carried and RPK, IndiGo had the maximum market share
followed by Jet Airways, Air India and SpiceJet.
21.6
18.0
15.6
28.1
18.0
12.5
17.5
24.9
19.6
22.8 24.3
27.0
7.8 8.1 8.7
10.912.3
12.6
13.2
20.1
20.221.8
26.8
20.8
-4.0
-2.0
0.0
2.0
4.0
6.0
8.0
10.0
12.0
14.0
16.0
18.0
0.0
5.0
10.0
15.0
20.0
25.0
30.0
APR MAY JUN JUL AUG SEP OCT NOV DEC JAN FEB MAR
----
Yo
Y G
row
th in
Pax
Lo
ad F
acto
r (%
)---
-
---Y
oY
Gro
wth
in R
PK
& A
SK (
%)-
--
CHART 3: MONTH-WISE GROWTH IN CAPACITY V/S DEMAND IN DOMESTIC MARKET, 2015-16
YoY Growth in RPK YoY Growth in ASK YoY Growth in PLF
39.9
17.0
15.1
11.5
8.42.6
2.31.8
0.7
0.3
0.10.10.1
1.3
CHART 4: MARKET SHARE(%) IN TERMS OF DOMESTIC MARKET DEMAND (RPK) -
2015-16
INDIGO JET AIRWAYS AIR INDIA
SPICEJET GO AIR JETLITE
AIR ASIA VISTARA AIR COSTA
ALLIANCE AIR TRUEJET AIR PEGASUS
AIR INDIA EXPRESS
36.9
18.7
15.0
12.5
8.42.9
2.01.7
0.8
0.5
0.2
0.2
0.2
0.6
CHART 5: DOMESTIC MARKET SHARE(%) IN TERMS OF PASSENGERS CARRIED -
2015-16
INDIGO JET AIRWAYS AIR INDIA
SPICEJET GO AIR JETLITE
AIR ASIA VISTARA AIR COSTA
ALLIANCE AIR TRUEJET AIR PEGASUS
AIR INDIA EXPRESS

4
In terms of Passenger Load Factor (PLF), a measure of capacity utilisation of airlines, for scheduled domestic operations, SpiceJet registered the highest PLF of 92.0 % followed by IndiGo (84.1%), Go Air (83.7%). SpiceJet also topped the position in terms of scheduled international operations with a PLF of 85.4% followed by Jet Airways (83.7%) and IndiGo (82.8%).
INTERNATIONAL PASSENGER MARKET SHARE
TABLE 3: MARKET SHARE (%) OF INTERNATIONAL PASSENGERS CARRIED BY SCHEDULED INDIAN CARRIERS
AND FOREIGN CARRIERS.
YEAR FOREIGN CARRIERS INDIAN CARRIERS
2004-05 71.1 28.9
2009-10 65.5 34.5
2010-11 63.8 36.2
2011-12 64.1 35.9
2012-13 66.2 33.8
2013-14 61.7 38.3
2014-15 63.0 37.0
2015-16 63.4 36.6
92.084.1
80.6 80.1 79.2 83.7 80.7 80.2 80.1 79.3 78.5
69.4 66.5
85.482.8
83.7 82.4
73.9
0.0
10.0
20.0
30.0
40.0
50.0
60.0
70.0
80.0
90.0
100.0
----
-Pax
Lo
ad f
cato
r (%
)---
--CHART 6: PASSENGER LOAD FACTOR (PLF) OF SCHEDULED INDIAN CARRIERS, 2015-16
DOMESTIC INTERNATIONAL
5
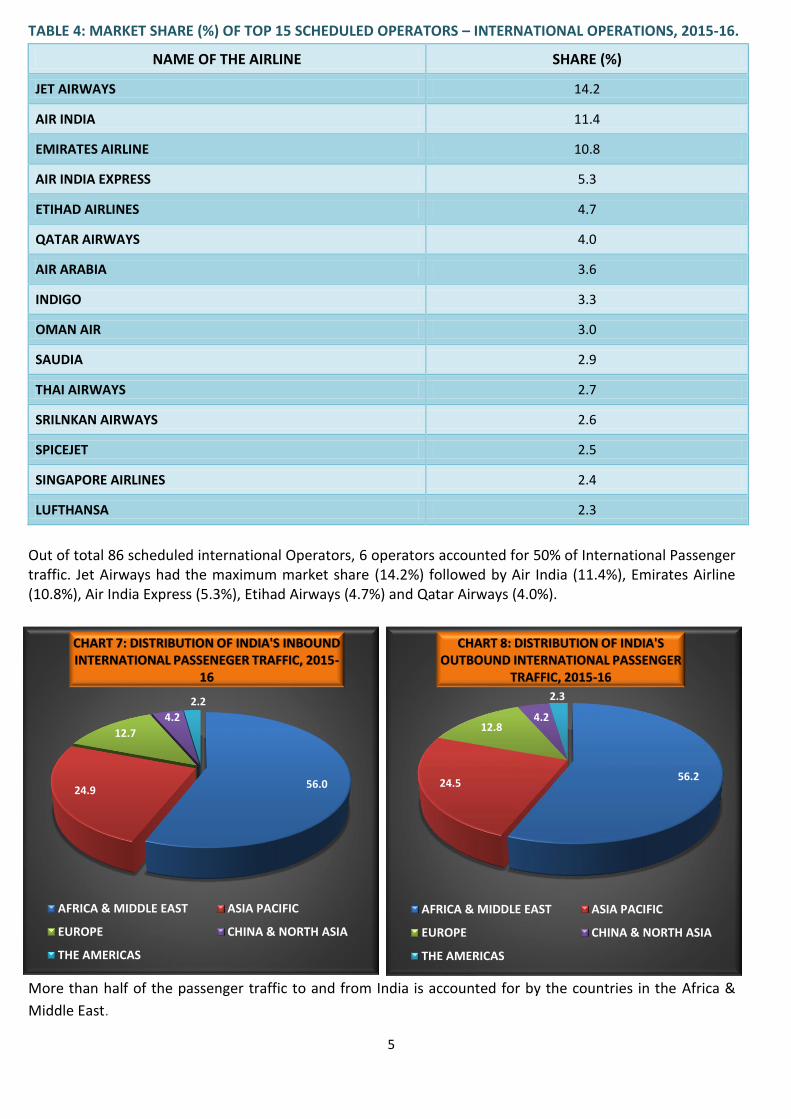
TABLE 4: MARKET SHARE (%) OF TOP 15 SCHEDULED OPERATORS – INTERNATIONAL OPERATIONS, 2015-16.
NAME OF THE AIRLINE SHARE (%)
JET AIRWAYS 14.2
AIR INDIA 11.4
EMIRATES AIRLINE 10.8
AIR INDIA EXPRESS 5.3
ETIHAD AIRLINES 4.7
QATAR AIRWAYS 4.0
AIR ARABIA 3.6
INDIGO 3.3
OMAN AIR 3.0
SAUDIA 2.9
THAI AIRWAYS 2.7
SRILNKAN AIRWAYS 2.6
SPICEJET 2.5
SINGAPORE AIRLINES 2.4
LUFTHANSA 2.3
Out of total 86 scheduled international Operators, 6 operators accounted for 50% of International Passenger traffic. Jet Airways had the maximum market share (14.2%) followed by Air India (11.4%), Emirates Airline (10.8%), Air India Express (5.3%), Etihad Airways (4.7%) and Qatar Airways (4.0%).
More than half of the passenger traffic to and from India is accounted for by the countries in the Africa &
Middle East.
56.024.9
12.7
4.2
2.2
CHART 7: DISTRIBUTION OF INDIA'S INBOUND INTERNATIONAL PASSENEGER TRAFFIC, 2015-
16
AFRICA & MIDDLE EAST ASIA PACIFIC
EUROPE CHINA & NORTH ASIA
THE AMERICAS
56.224.5
12.84.2
2.3
CHART 8: DISTRIBUTION OF INDIA'S OUTBOUND INTERNATIONAL PASSENGER
TRAFFIC, 2015-16
AFRICA & MIDDLE EAST ASIA PACIFIC
EUROPE CHINA & NORTH ASIA
THE AMERICAS

6
FREIGHT TRAFFIC
Air cargo carried by scheduled airline operators, both domestic and international witnessed a positive growth
in 2015-16.
TABLE 5: FREIGHT TRAFFIC AT A GLANCE
The domestic cargo traffic registered a growth of 7.6% (CAGR) over the period from 2006-07 to 2015-16 while International cargo traffic grew at 4.7% (CAGR) during the same period.
Dedicated cargo refers to the cargo carried by aircrafts solely meant for freight carriage.
The proportion of the total domestic cargo carried as belly cargo has generally been declining over the years
since 2005-06 with the exception of 2014-15.
9271025 1072
1139
12921219 1238 1262
1368 1404
322 368 342 394465 453 452 508
591 624
0
200
400
600
800
1000
1200
1400
1600
2006-07 2007-08 2008-09 2009-10 2010-11 2011-12 2012-13 2013-14 2014-15 2015-16
--Fr
eig
ht
(Th
ou
san
d M
etr
ic T
on
ne
)--
CHART 9: FREIGHT TRAFFIC CARRIED BY SCHEDULED CARRIERS OVER THE PAST DECADE
INTERNATIONAL DOMESTIC
86.0 83.3 82.1 79.7 78.8 76.9 80.0 79.9
14.0 16.7 17.9 20.3 21.2 23.1 20.0 20.1
0.0
20.0
40.0
60.0
80.0
100.0
120.0
2005-06 2009-10 2010-11 2011-12 2012-13 2013-14 2014-15 2015-16
CHART 10: PROPORTION OF DOMESTIC CARGO CARRIED AS BELLY CARGO AND IN DEDICATED FREIGHTERS
BELLY CARGO DEDICATED CARGO
FREIGHT TRAFFIC 2015-16 2014-15
DOMESTIC 6.24 Lakh MT
(5.41) 5.91 Lakh MT
(16.54)
INTERNATIONAL 14.04 Lakh MT
(2.63) 13.68 Lakh MT
(8.57)
Figures in parenthesis refer to percentage change over previous year; MT: Metric Tonne.

7
TABLE 6: PROPORTION OF INTERNATIONAL CARGO CARRIED BY INDIAN AND FOREIGN CARRIERS
Freight traffic is coming to India in almost equal proportion from around the World except the freight traffic
from the Americas while from India, more than half of the freight traffic is carried to the countries in the
Africa & Middle East.
27.0
26.3
22.6
22.6 1.5
CHART 11: DISTRIBUION OF INDIA'S INBOUND INTERNATIONAL FREIGHT
TRAFFIC, 2015-16
EUROPE AFRICA & MIDDLE EAST
ASIA PACIFIC CHINA & NORTH ASIA
THE AMERICAS
52.0
23.5
15.58.0
1.0
CHART 12: DISTRIBUTION OF INDIA'S OUTBOUND INTERNATIONAL FREIGHT
TRAFFIC, 2015-16
AFRICA & MIDDLE EAST EUROPE
ASIA PACIFIC CHINA & NORTH ASIA
THE AMERICAS
YEAR INDIAN CARRIERS (%) FOREIGN CARRIERS (%)
2004-05 13.6 86.4
2009-10 16.1 83.9
2010-11 20.3 79.7
2011-12 21.1 78.9
2012-13 17.7 82.3
2013-14 18.3 81.7
2014-15 17.8 82.2
2015-16 16.9 83.1

8
AIRCRAFT
TABLE 7: AIRCRAFT STATISTICS AT A GLANCE
SCHEDULED AIRCRAFT MOVEMENTS( IN LAKHS)
2015-16 2014-15
DOMESTIC 7.00 (13.45) 6.17
INTERNATIONAL 3.22 (10.65) 2.91
Figures in parenthesis refer to percentage change over previous year.
As in the case of passenger and freight traffic, aircraft movements (both domestic and international) also have
registered a positive growth in the year 2015-16 over 2014-15.
*Average Seat Capacity= Total ASK flown/ Total Aircraft Km. Flown.
149
185180
158
133
176 180
157148
105
70 66
47
212
186
180 179
160
0
50
100
150
200
250
----
Ave
rage
Se
at C
apac
ity
(In
No
.)--
--
Chart 13: AVERAGE SEAT CAPACITY* OF SCHEDULED OPERATING INDIAN FLEET (2015-16)
DOMESTIC INTERNATIONAL

9
TABLE 8: FLEET STATISTICS OF SCHEDULED INDIAN OPERATORS AS ON 31st MARCH, 2015.
NAME OF THE OPERATOR TYPE OF AIRCRAFT NUMBER OF AIRCRAFTS
SEAT CAPACITY
AIR INDIA
Boeing747-400 5 423
777-200LR 3 238
777-300ER 12 342
B-787 19 256
A-319 22 122/144
A-320 20 150/168/180
A-321 20 182
Total (All Types) 101
AIR INDIA EXPRESS Boeing 737-800 17 186
ALLIANCE AIR
ATR 42-320 4 48
CRJ-700 4 70
ATR-72-212A 2 70
Total (All Types) 10
INDIGO A320-200 94 180
SPICEJET
Boeing 737-800 18 186
Boeing 737-900ER 1 212
Q-400 15 78
Total (All Types) 34
GO AIR A320 Leased 19 180
JETLITE
Boeing 737-700 3 134
Boeing 737-800 5 168
Boeing 737-900ER 1 202
Total (All Types) 9
BLUE DART Boeing 757-200 5 Freighter
JET AIRWAYS
B-737-700 3 134
B-737-800 59 168
B-737-900 5 184
ATR72-500/600 18 68
A330-200/300 12 293
B-777-300ER 10 346
Total (All Types) 107
AIR COSTA
Embraer and ERJ 170 -100 LR (VT-LSR)
1 67
Embraer and ERJ 170 -100 LR (VT-LNR)
1 67
Embraer and ERJ 190 -100 STD (VT-LBR)
1 112
Embraer and ERJ 190 -100 STD (VT-LVR)
1 112
Total (All Types) 4
VISTARA Airbus A320 6 148
AIR ASIA Airbus A320 3 180
Total All Airlines (All Types) 409

10
STAGE LENGTH
TABLE 9: AVERAGE STAGE LENGTH* FLOWN (IN KILOMETRES) BY SCHEDULED INDIAN FLEET, 2015-16.
NAME OF THE AIRLINE DOMESTIC OPERATION INTERNATIONAL OPERATION
AIR INDIA 1117.4 6200.2
INDIGO 947.5 2219.8
AIR INDIA EXPRESS 919.4 2374.6
JET AIRWAYS 748.7 2946.9
SPICEJET 739.6 1714.0
AIR ASIA 1093.2
No Operation
VISTARA 1022.6
GO AIR 949.9
JETLITE 790.1
AIR COSTA 751.6
ALLIANCE AIR 677.8
TRUJET 437.6
AIR PEGASUS 416.2
*Average Stage Length is calculated by dividing the total aircraft km flown by the total number of aircraft departure.
TABLE 10: SUMMARY OF AIR OBJECTS REGISTERED WITH DGCA AS ON 8th April, 2016.
OPERATOR TYPE
AIR
CR
AFT
HEL
ICO
PTE
R
BA
LLO
ON
HA
NG
GLI
DER
GLI
DER
MO
TOR
GLI
DER
ULT
RA
-LIG
HT
EXP
ERIM
ENTA
L
TOTA
L SCHEDULED 468 0 0 0 0 0 0 0 468
NON-SCHEDULED 186 213 7 0 0 0 0 0 406
GOVERNMENT 125 37 0 5 41 0 0 1 209
PRIVATE 164 52 14 15 6 0 6 0 257
TRAINING 285 1 0 1 16 1 6 1 311
MISCELLANEOUS 6 0 0 3 0 0 28 4 41
GRAND TOTAL 1234 303 21 24 63 1 40 6 1692
Source: Directorate of Air Worthiness, DGCA.

11
NON-SCHEDULED OPERATORS (NSOP)
Source: Directorate of Air Transport- I and Directorate of Air Worthiness.
Out of the total 72 NSOP domestic (aircraft) operators, top 15 operators accounted for more than half of the
total number of domestic flights operated in the year 2015-16.
156183
229
272
327
370
409 412
366 361
393406
44 56 66
99122 127 134
147125 120 126 123
0
50
100
150
200
250
300
350
400
450
----
---N
um
be
r---
----
CHART 14: NON-SCHEDULED OPERATORS
Number of aircrafts (including helicopters) Number of OperatorsAs on 31st March
12.6
5.7
5.4
3.8
3.7
3.1
2.9
2.8
2.6
2.5
2.5
2.2
2.2
2.2
2.2
0.0 2.0 4.0 6.0 8.0 10.0 12.0 14.0
Relience Commercial
A R Airways
BG Shirke
Pinnacle
Saraya
Air Charter Services
Himayaputra
Orbit
VRL
Span
Joy Jets
Airmid
GMR
Trans Bharat
Karnawati
CHART 15: TOP 15* NSOP-DOMESTIC (AIRCRAFT) OPERATIONS (% SHARE)- 2015-16
* In terms of number of flights operated.

12
Out of the total 32 non-scheduled international (aircraft) operators, top 15 operators accounted for more
than 80% of the total number of international flights operated in the year 2015-16.
Out of the total 54 non-scheduled Helicopter operators, top 3 operators accounted for 87% of the total
number of flights operated in the year 2015-16.
14.8
9.6
9.0
6.5
6.1
5.6
4.6
4.3
4.3
4.0
2.9
2.8
2.8
2.5
2.3
0.0 2.0 4.0 6.0 8.0 10.0 12.0 14.0 16.0
Reliance Commercial (P) Ltd.
VRL Logistics Ltd.
A R Airways (P) Ltd.
Poonawalla Aviation (P) Ltd.
Zest Aviaition (P) Ltd.
Karnavati Aviaition (P) Ltd.
Airmid Aviaition Services
Raymond Ltd.
Universal Airways (P) Ltd.
Relience Transport & Travels Ltd.
Taj Air Ltd.
L&T Aviaiton Service (P) Ltd.
Coromandal Travels Ltd.
Ligare Aviation Ltd.
Ashley Aviation Ltd.
CHART 16: TOP 15* NSOP-INTERNATIONAL (AIRCRAFT) OPERATIONS (% SHARE)- 2015-16
* In terms of number of flights operated
36.7
31.1
19.2
0.0 5.0 10.0 15.0 20.0 25.0 30.0 35.0 40.0
Global Vectra
Pawan Hans
Himalyan helicharters
CHART 17: TOP 3* NON-SCHEDULED HELICOPTER OPERATORS (% SHARE)- 2015-16
* In terms of number of flights operated.
13
OPERATING ECONOMICS
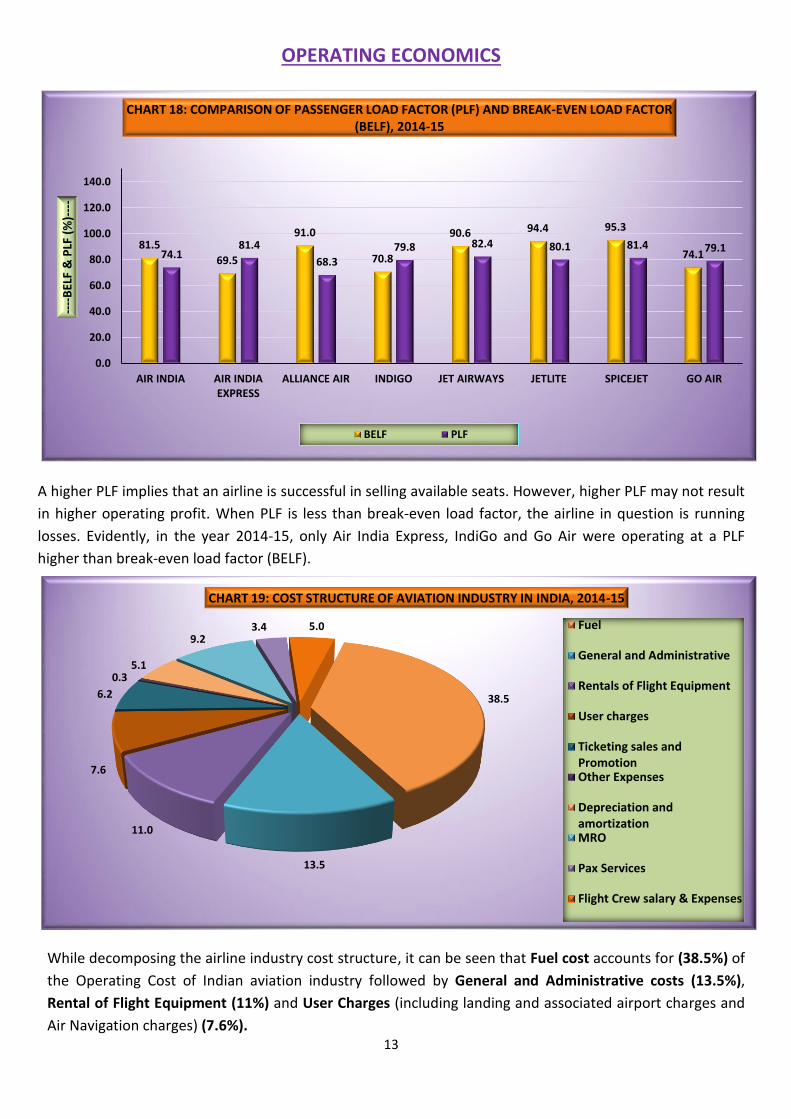
A higher PLF implies that an airline is successful in selling available seats. However, higher PLF may not result
in higher operating profit. When PLF is less than break-even load factor, the airline in question is running
losses. Evidently, in the year 2014-15, only Air India Express, IndiGo and Go Air were operating at a PLF
higher than break-even load factor (BELF).
While decomposing the airline industry cost structure, it can be seen that Fuel cost accounts for (38.5%) of
the Operating Cost of Indian aviation industry followed by General and Administrative costs (13.5%),
Rental of Flight Equipment (11%) and User Charges (including landing and associated airport charges and
Air Navigation charges) (7.6%).
81.5
69.5
91.0
70.8
90.6 94.4 95.3
74.174.181.4
68.379.8 82.4 80.1 81.4 79.1
0.0
20.0
40.0
60.0
80.0
100.0
120.0
140.0
AIR INDIA AIR INDIAEXPRESS
ALLIANCE AIR INDIGO JET AIRWAYS JETLITE SPICEJET GO AIR
----
BEL
F &
PLF
(%
)---
-
CHART 18: COMPARISON OF PASSENGER LOAD FACTOR (PLF) AND BREAK-EVEN LOAD FACTOR (BELF), 2014-15
BELF PLF
38.5
13.5
11.0
7.6
6.2
0.35.1
9.23.4 5.0
CHART 19: COST STRUCTURE OF AVIATION INDUSTRY IN INDIA, 2014-15
Fuel
General and Administrative
Rentals of Flight Equipment
User charges
Ticketing sales andPromotionOther Expenses
Depreciation andamortizationMRO
Pax Services
Flight Crew salary & Expenses
14
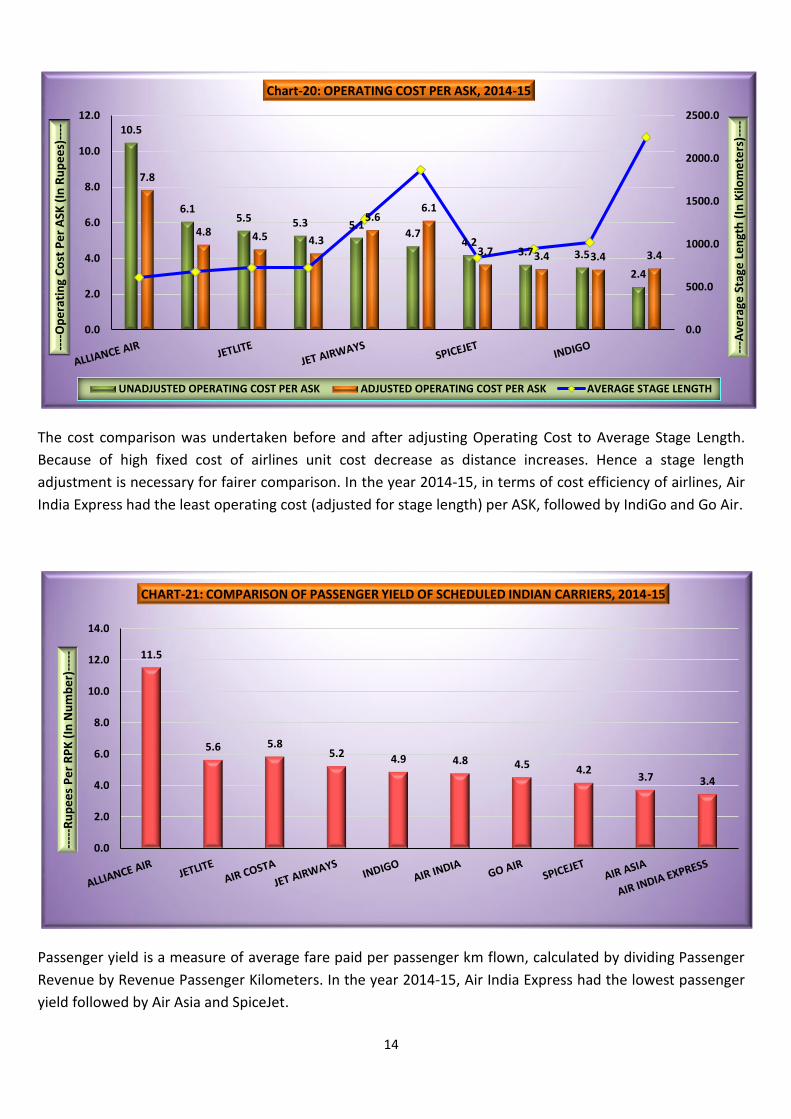
The cost comparison was undertaken before and after adjusting Operating Cost to Average Stage Length.
Because of high fixed cost of airlines unit cost decrease as distance increases. Hence a stage length
adjustment is necessary for fairer comparison. In the year 2014-15, in terms of cost efficiency of airlines, Air
India Express had the least operating cost (adjusted for stage length) per ASK, followed by IndiGo and Go Air.
Passenger yield is a measure of average fare paid per passenger km flown, calculated by dividing Passenger
Revenue by Revenue Passenger Kilometers. In the year 2014-15, Air India Express had the lowest passenger
yield followed by Air Asia and SpiceJet.
10.5
6.15.5 5.3 5.1
4.74.2
3.7 3.5
2.4
7.8
4.8 4.5 4.3
5.66.1
3.7 3.4 3.4 3.4
0.0
500.0
1000.0
1500.0
2000.0
2500.0
0.0
2.0
4.0
6.0
8.0
10.0
12.0
---A
vera
ge S
tage
Le
ngt
h (
In K
ilom
ete
rs)-
---
----
Op
era
tin
g C
ost
Pe
r A
SK (
In R
up
ee
s)--
--
Chart-20: OPERATING COST PER ASK, 2014-15
UNADJUSTED OPERATING COST PER ASK ADJUSTED OPERATING COST PER ASK AVERAGE STAGE LENGTH
11.5
5.6 5.85.2 4.9 4.8 4.5 4.2
3.7 3.4
0.0
2.0
4.0
6.0
8.0
10.0
12.0
14.0
----
-Ru
pe
es
Pe
r R
PK
(In
Nu
mb
er)
----
-
CHART-21: COMPARISON OF PASSENGER YIELD OF SCHEDULED INDIAN CARRIERS, 2014-15

15
TABLE 11: FINANCIAL SUMMARY OF ALL SCHEDULED INDIAN CARRIERS- 2014-15
(RS. IN MILLION)
OPERATING REVENUE OPERATING EXPENSES OPERATING RESULT
SCHEDULED NATIONAL CARRIERS
AIR INDIA 2,06,131.60 2,26,854.40 -20,722.80
AI EXPRESS 22,948.20 19,597.60 3,350.60
ALLIANCE AIR 2,279.50 3,034.00 -754.50
SUB TOTAL (A) 2,31,359.30 2,49,486.00 -18,126.70
SCHEDULED DOMESTIC PRIVATE CARRIERS
JET AIRWAYS 1,95,606.05 2,15,030.10 -19,424.04
JET LITE (P) LTD. 14,229.36 16,775.22 -2,545.86
GO AIR 30,664.24 28,715.82 1,948.43
SPICE JET 52,015.25 60,884.99 -8,869.74
INDIGO 1,39,253.36 1,23,578.64 15,674.72
AIR COSTA 3,268.62 4,571.57 -1,302.96
AIR ASIA 1,551.87 2,885.01 -1,333.14
VISTARA 691.28 2,681.94 -1,990.66
SUB TOTAL (B) 4,37,280.03 4,55,123.29 -17,843.26
GRAND TOTAL (A+B) 6,68,639.33 7,04,609.29 -35,969.96

16
HUMAN RESOURCE
TABLE 12: PERSONNEL STATISTICS OF SCHEDULED INDIAN OPERATORS FOR THE YEAR 2014-15. NAME OF
THE AIRLINE Pilots & Co-
Pilots Other
Flight Crew Cabin Crew Maintenance
& Overhaul Personal Overhaul
Ticketing & Sales
Personnel
All Other Personnel
Total
AIR INDIA 1457 - 2321 5931 4221 7383 21313
AIR INDIA EXPRESS
236 - 729 133 145 1243
ALLIANCE AIR 59 37 402 40 167 705
JET AIRWAYS 1488 318 2974 2116 967 5615 13478
JETLITE 164 1 243 322 79 809
INDIGO 1320 140 2520 739 69 5748 10536
SPICEJET 403 60 718 569 116 2326 4192
GO AIR 216 71 418 339 397 739 2180
AIR COSTA 47 27 76 105 159 332 746
AIR ASIA 63 138 138 169 178 686
VISTARA 62 5 205 17 35 348 672
TOTAL 5515 797 10744 10480 5964 23060 56560
Out of the total airline staff of 56560, 37.7% is employed by Air India Ltd followed by Jet Airways (23.8%), IndiGo
(18.6%) and SpiceJet (7.4%).
Source: Directorate of Training & Licensing, DGCA. CPL- Commercial Pilot License; ATPL-Air Transport Pilot License.
720
108
828
474
64
538
395
66
461
384
47
431
0
100
200
300
400
500
600
700
800
900
MALE FEMALE TOTAL MALE FEMALE TOTAL
2014-15 2015-16
----
-Nu
mb
er o
f Li
cen
ses
issu
ed--
---
CHART-22: PILOT LICENCES ISSUED BY DGCA
CPL ATPL

17
ASK PER EMPLOYEE
Available Seat Kilometer (ASK) per Employee is an indicator of efficiency both in terms of capacity planning
and utilization of work force and is calculated by dividing Average Seat Kilometers by Number of Employees.
In terms of the ASK per employee, Jetlite is the most efficient followed by Go Air and SpiceJet.
REVENUE PER EMPLOYEE
Revenue per employee is an indicator of productivity of human resource of an airline and is calculated by dividing Operating Revenue by Number of Employees. Employee productivity was highest for JetLite followed by Jet Airways and Go Air.
3.73.6
3.53.4
3.1
2.4
1.0 1.0
0.0
0.5
1.0
1.5
2.0
2.5
3.0
3.5
4.0
----
-ASK
Pe
r Em
plo
yee
(In
Mill
ion
)---
--
CHART-23: ASK PER EMPLOYEE, (2014-15)
* National Airlines Includes Air India, Air India Express & Alliance Air.
17.6
14.5 14.113.2
12.4
10.2
4.4
2.8
0.0
2.0
4.0
6.0
8.0
10.0
12.0
14.0
16.0
18.0
20.0
----
-Re
ven
ue
Pe
r Em
plo
yee
(R
s. I
n M
illio
n)-
---
CHART 24: REVENUE PER EMPLOYEE- 2014-15
* National Airlines Includes Air India, Air India Express & Alliance Air.

18
TABLE 13: DGCA APPROVED AME TRAINING INSTITUTES (AS ON 08th APRIL, 2016)
REGION STATE NUMBER OF AME INSTITUTES
NORTH
Delhi 3
Haryana 2
Uttar Pradesh 4
Rajasthan 1
Himachal Pradesh 1
Uttarakhand 1
EAST
West Bengal 1
Assam 1
Bihar 1
Odisha 1
WEST
Maharashtra 9
Gujarat 1
Madhya Pradesh 2
Chhattisgarh 1
SOUTH
Tamil Nadu 6
Kerala 5
Karnataka 3
Telangana 3
TOTAL 46
Source: Directorate of Air Worthiness, DGCA.

19
TABLE 14: DGCA APPROVED FLYING TRAINING ORGANISATIONS (AS ON 10th AUGUST, 2016).
STATE OWNERSHIP NUMBER OF FLYING ORGANIZATION
TELANGANA
Private/Public Ltd. 3
State Govt. 1
GUJARAT Private/Public Ltd. 2
HARYANA State Govt. 1
KARNATAKA
State Govt. 1
Private 1
MADHYA PRADESH Private/ Trust/ Public Ltd. 4
MAHARASHTRA
Society 1
Private 3
BIHAR State Govt. 1
ODISHA State Govt. 1
PUNJAB State Govt. 1
RAJASTHAN Private 1
TAMIL NADU Private 1
UTTAR PRADESH
Private/Trust 5
Central Govt. 1
UTTRAKHAND Private 1
TOTAL 29
Source: Directorate of Flying Training, DGCA.

20
AIR SAFETY
TABLE 15: YEAR-WISE NUMBER OF ACCIDENTS.
TABLE 16: YEAR-WISE NUMBER OF SERIOUS INCIDENTS.
YEAR
TYPE OF OPERATOR
SCHEDULED OPERATORS
NON-SCHEDULED OPERATORS
FLYING TRAINING INSTITUTE
GOVT. OPERATORS
PRIVATE OPERATORS
FOREIGN OPERATORS
TOTAL ACCIDENTS
2011 0 6 2 2 0 1 11
2012 0 3 2 2 2 0 9
2013 0 5 2 1 0 0 8
2014 1 2 2 1 0 0 6
2015 4 5 1 0 0 0 10
2016* 2 1 0 1 0 0 4
*As in May 2016 Source: Directorate of Air Safety, DGCA.
Year
TYPE OF INCIDENT
ENGINEERING OPERATIONAL RUNWAY
EXCURSION WEATHER MISCELLANEOUS
TOTAL INCIDENTS
2011 1 1 1 1 1 5
2012 3 4 0 0 0 7
2013 2 3 1 0 0 6
2014 6 1 1 1 2 11
2015 1 3 0 0 1 5
2016* 0 2 0 0 0 2
*As in May 2016 Source: Directorate of Air Safety, DGCA.

21
OTHER AVIATION RELATED STATISTICS
Source: Ministry of Tourism.
An important aspect of international traffic to and from India pertains to trend in foreign tourist arrivals in India. In 2015, Foreign Tourist Arrivals accounted for 33.6% of inbound international traffic in India.
Source: Ministry of Petroleum & Natural Gas.
3.9 4.5 5.1 5.3 5.2 5.8 6.3 6.6 7.0 7.7 8.0
9.711.3
13.1 14.1 15.717.4
18.9 19.821.2
22.423.8
0.0
5.0
10.0
15.0
20.0
25.0
30.0
35.0
2005 2006 2007 2008 2009 2010 2011 2012 2013 2014 2015
----
No
. o
f P
asse
nge
rs (
In M
illio
n)-
---
CHART-25: FOREIGN TOURIST ARRIVAL & INTERNATIONAL INBOUND PAX TRAFFIC
FOREIGN TOURISTS ARRIVAL INBOUND INTERNATIONAL PAX
3983
4543 44234627
50785536
52715505
5723
6220
0
1000
2000
3000
4000
5000
6000
7000
2006-07 2007-08 2008-09 2009-10 2010-11 2011-12 2012-13 2013-14 2014-15 2015-16----
ATF
Co
nsu
mp
tio
n (
Tho
usa
nd
me
tric
to
nn
e)-
---
CHART 26: ATF CONSUMPTION OVER THE DECADE

22
The Air Turbine Fuel (ATF) consumption growth in India has been moving in tandem with the growth of air
traffic. In the year 2015-16, ATF consumption went up by 8.7% which is consistent with increase in aircraft and
air traffic movement.
Source: Ministry of Petroleum & Natural Gas.
TABLE 17: AIRPORTS IN INDIA (AS ON 31st March, 2016).
TOTAL INTERNATIONAL AIRPORTS 24
AAI Airports 18
Civil Enclave 3
Private Airports (JVs)
3
TOTAL CUSTOMS AIRPORTS 8
AAI Airports 4
Civil Enclave 4
TOTAL DOMESTIC AIRPORTS 101
AAI Operational Airports 47
AAI Operational Civil Enclave 18
AAI Non-Operational 31
STATE/ PRIVATE GOVERNMENT 5
TOTAL AIRPORTS (ALL TYPES) 133 Source: Airport Authority of India.
GLIDER TRAINING CENTRES IN INDIA*
1. Gliding Centre, Pune, Maharashtra: - It is attached with DGCA and its gliders belong to Government of India.
2. Deolali Gliding Club, Nasik, Maharashtra:- It is registered under Society Act, 1816 by Charitable Commissioner F68
and the gliders of this club belong to Government of India.
*Source: Directorate of Air Worthiness, DGCA
0.0
2.0
4.0
6.0
8.0
10.0
12.0
14.0
16.0
18.0
0
100
200
300
400
500
600
----
Yo
Y G
row
th in
ATF
Co
nsu
mp
tio
n (
%)-
---
----
ATF
Co
nsu
mp
tio
n (
00
0 m
etr
ic t
on
ne
)---
-
Chart 27: YoY GROWTH OF ATF CONSUMPTION, 2015-16
2014-15 2015-16 YoY GROWTH OF ATF CONSUMPTION

23
OFFICERS AND STAFF OF DIRECTORATE OF AIR TRANSPORT-II, DGCA ASSOCIATED WITH THE PUBLICATION
Notes:
1. Sources of data: Directorate of Air Transport- II, unless otherwise specified.
2. Data published in the handbook is provisional.
DEPUTY DIRECTOR GENERAL (SAG)
Sh. P C Cyriac
DIRECTOR
Smt. Ruchika Gupta
DEPUTY DIRECTOR
Sh. P K Srivastava
Sh. Narendra Singh
ASSISTANT DIRECTOR
Sh. Devendra Kumar
Sh. B P Majhi
STATISTICAL OFFICER
Sh. Mani Bhushan
Smt. Shweta Sharma
Sh. Ravi Kant Soni
Sh. Sandeep Verma