Embed Size (px)
Citation preview

HÖGANÄS HANDBOOK FOR
MACHINING GUIDELINES

Foreword
This handbook is intended to establish a ‘platform’ of practicable knowledge (or methodology) for machining of P/M materials. In particular, the chapters on specific machining techniques provide cutting parameters for materials, tools and methods. Also shown is the influence of alternative approaches such as with additives, oil impregnation, and selection of tool, which aim to improve cutting operations. Thus this handbook should serve as a practical guide and handy reference for those working with machining of P/M materials.
Chapter three was written in cooperation with Sandvik Coromant and the Swedish Institute of Metal Research. Chapters four and five were written in cooperation with Dormer Tools and IVF. All tests were sintered in a production furnace at GKN Sinter Metals AB, Sweden.
Höganäs AB2004

3
Table of contents
1. Machinability . . . . . . . . . . . . . . . . . . . . . . . . . . . 51.1. Application of powder metallurgy . . . . . . . . . . . . . . . . . 61.2. History . . . . . . . . . . . . . . . . . . . . . . . . . . . . . . . . . . . . 61.3. Metal Powder Production . . . . . . . . . . . . . . . . . . . . . . . 7
2. Metal alloys . . . . . . . . . . . . . . . . . . . . . . . . . . . 152.1. Alloying methods . . . . . . . . . . . . . . . . . . . . . . . . . . . . 152.2. The powder metallurgy process . . . . . . . . . . . . . . . . . 172.3. Materials development . . . . . . . . . . . . . . . . . . . . . . . . 192.4. Sintered Iron-based materials . . . . . . . . . . . . . . . . . . . 202.5. Alloying system: Microstructures and
mechanical properties . . . . . . . . . . . . . . . . . . . . . . . . 23
3. Turning . . . . . . . . . . . . . . . . . . . . . . . . . . . . . . 393.1. Analysis of the Machining Process . . . . . . . . . . . . . . . . 393.2. Tool Wear and Tool Life . . . . . . . . . . . . . . . . . . . . . . . 443.3. Classification of P/M Materials for Turning . . . . . . . . . . 513.4. Influence of material, properties and
machining processes. . . . . . . . . . . . . . . . . . . . . . . . . 553.5. Surface Finish . . . . . . . . . . . . . . . . . . . . . . . . . . . . . . 663.6. Cutting Forces . . . . . . . . . . . . . . . . . . . . . . . . . . . . . . 683.7. Summary: Machining of P/M Materials . . . . . . . . . . . . . 823.8. Turning tool recommendations and cutting data . . . . . . 84
4. Drilling . . . . . . . . . . . . . . . . . . . . . . . . . . . . . . 874.1. Quality and Performance in Machining . . . . . . . . . . . . . 874.2. Increasing machinability . . . . . . . . . . . . . . . . . . . . . . . 884.3. Classification of P/M Materials for Drilling . . . . . . . . . . 884.4. Influence of Properties of P/M Materials . . . . . . . . . . . 914.5. Tool Materials . . . . . . . . . . . . . . . . . . . . . . . . . . . . . . 994.6. Tool Treatments . . . . . . . . . . . . . . . . . . . . . . . . . . . 1014.7. Selection of Drill Type . . . . . . . . . . . . . . . . . . . . . . . 1024.8. Drill Dimensions . . . . . . . . . . . . . . . . . . . . . . . . . . . . 1064.9. Use of Cutting Fluids . . . . . . . . . . . . . . . . . . . . . . . . 1074.10. Hints for Optimal Drilling . . . . . . . . . . . . . . . . . . . . . 1094.11. Economy and Productivity in Drilling . . . . . . . . . . . . 1114.12. Setting Machine Limits . . . . . . . . . . . . . . . . . . . . . . 112
4
4.13. Formulae for Cutting Forces . . . . . . . . . . . . . . . . . . 1134.14. Drill Recommendations and Cutting Data . . . . . . . . . 115
5. Tapping . . . . . . . . . . . . . . . . . . . . . . . . . . . . 1195.1. Classification of P/M Materials for Tapping . . . . . . . . 1195.2. Influence of Additives . . . . . . . . . . . . . . . . . . . . . . . . 1215.3. Selection of taps . . . . . . . . . . . . . . . . . . . . . . . . . . . 1235.4. Hints on Optimal Tapping . . . . . . . . . . . . . . . . . . . . . 1275.5. Tapping Guidelines . . . . . . . . . . . . . . . . . . . . . . . . . . 1285.6. Tap and Cutting Data Recommendations . . . . . . . . . . 129
6. References . . . . . . . . . . . . . . . . . . . . . . . . . . 135

5
1 Machinability
Powder metallurgy (P/M) is known for producing complex parts to very close tolerances without the necessity of machining operations, yet machinability is still important for some applications. Many components require surface-finish machining to reach final shape due to particular geometries (such as holes perpendicular to the pressing direction, bevels, slots and threads), and also due to demands for even finer tolerances.
What then is machinability? One useful definition is: “The material with the best machinability is the one permitting the fastest metal removal rate with reliable and satisfactory tool life and surface finish.” Thus machinability focuses on efficiency with finishing processes for metal products.
Investigation of the P/M market reveals that about 60% of all components need some kind of machining operation. Turning is by far the most frequently occurring operation, but tapping, drilling, and discontinuous turning, are considered the most difficult. Machining operations can account for up to 20% of the total production cost of a component.
The machinability of a P/M component is dependent on the work-piece and tool material properties, cutting conditions, and machine and cutting tool parameters. Chemical composition, porosity, free machining additives, and production process parameters such as compaction and sintering methods, also collectively influence machinability.
Optimization of machinability is limited by the mechanical properties of a given component. The selection of a material grade for a component is mainly based on its required mechanical properties. Consequently, there are limitations on chemical composition adjustment for machinability. The addition of free machining additives, and oil impregnation, remain as alternatives. New technologies, such as warm compaction, can increase machinability due to an increase in density.
Since developments with more highly alloyed materials have increased the mechanical strength of components, P/M technology requires guidelines for the selection of tool material and cutting conditions. If certain guidelines are followed, production costs are reduced and P/M is able to compete strongly with other manufacturing processes.
Machinability
6
1.1 Application of powder metallurgy
As a metal-working technology, powder metallurgy (P/M) has the advantage compared to other processes, that it can produce complex parts of high quality with close tolerances, in an economical way. This is due to low energy consumption, high material utilization and low capital cost for the technology. Additional advantages are its high flexibility and particular mechanical properties, related to microstructure, and the possibility for development of new materials. Accordingly, the market share for P/M has been increasing rather rapidly.
1.2 History
Industrial production of iron powder began in 1937 on the incentive of the General Motors Corporation in the USA. In Europe, Höganäs was active from 1922 in producing high-quality sponge iron for the Swedish steel industry. This product was used as high-purity melting stock for the production of special steels, such as tool steels and stainless steel. Sponge iron, owing to its high porosity, could easily be comminuted (reduced) to iron powder. However, due to its high content of reducible oxygen (2%) and carbon (0.15%), the compressibility for this material was poor. After 1940, Höganäs introduced an annealing procedure, with which the residual oxygen and carbon content were considerably lowered.
During World War II, iron metallurgy was dramatically developed in Germany. Mainly due to a shortage of copper, artillery driving bands were produced from iron powder, and 30,000 metric tons were produced in 1944. The iron material for this purpose was mainly made by grinding wire cuttings and sheet clippings in hammer mills of the type ‘Hametag’. Wartime innovations meant important iron powder processes were developed. For example: gas atomization of a desulphurized cast iron melt, later converted to the now commonly used water atomization process, and the electrolytic process for production of iron, became practicable. Today water atomization is the dominating process because it produces high compressibility in conjunction with high density.
Metal Powder Production
7
1.3 Production - Introduction
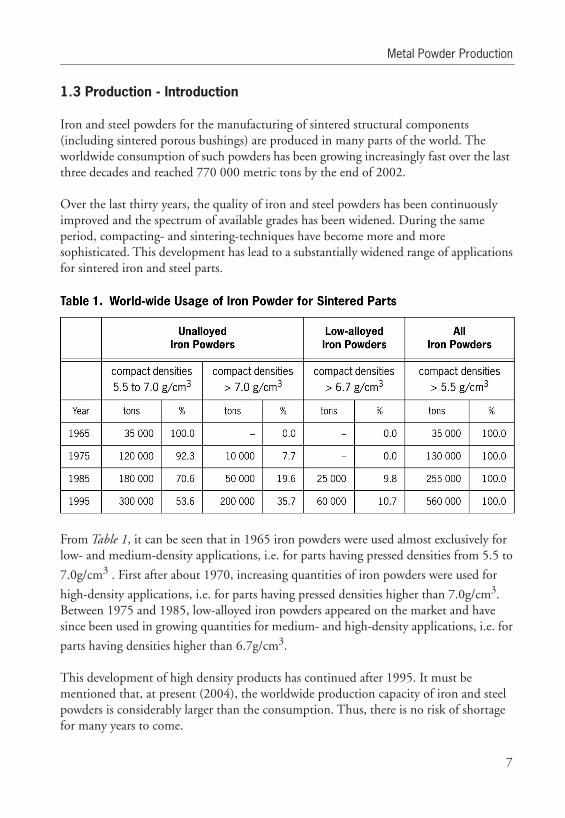
Iron and steel powders for the manufacturing of sintered structural components (including sintered porous bushings) are produced in many parts of the world. The worldwide consumption of such powders has been growing increasingly fast over the last three decades and reached 770 000 metric tons by the end of 2002.
Over the last thirty years, the quality of iron and steel powders has been continuouslyimproved and the spectrum of available grades has been widened. During the sameperiod, compacting- and sintering-techniques have become more and moresophisticated. This development has lead to a substantially widened range of applicationsfor sintered iron and steel parts.
From Table 1, it can be seen that in 1965 iron powders were used almost exclusively forlow- and medium-density applications, i.e. for parts having pressed densities from 5.5 to
7.0g/cm3 . First after about 1970, increasing quantities of iron powders were used for
high-density applications, i.e. for parts having pressed densities higher than 7.0g/cm3.Between 1975 and 1985, low-alloyed iron powders appeared on the market and havesince been used in growing quantities for medium- and high-density applications, i.e. for
parts having densities higher than 6.7g/cm3.
This development of high density products has continued after 1995. It must be mentioned that, at present (2004), the worldwide production capacity of iron and steel powders is considerably larger than the consumption. Thus, there is no risk of shortage for many years to come.

Machinability
8
At present there are two basically different production methods which together account for more than 90% of the world production of iron and steel powders, viz. the Höganäs sponge-iron process and the water-atomizing process. The former process is based on reduction of iron ore, yielding a highly porous sponge-iron which subsequently is comminuted to powder. The latter process is based on atomization of a stream of liquid iron (or steel) by means of a jet of pressurized water. Both processes will be described in detail further below.
In the manufacturing of sintered parts, iron powders are always used admixed with a small amount of lubricant in powder form in order to minimize the friction in the compacting tool. In many cases, they are also blended with alloying elements in powder form, like graphite, copper, nickel, molybdenum and others (in order to achieve increased strength properties).
Since powder blends tend to segregate when transported and handled, Höganäs AB has developed special blending processes in which the alloying additives are safely bound to the iron powder particles. Powdermixes produced according to these processes are known as the trade names Distaloy™ and Starmix. These two processes are treated in detail further below.
Metal Powder Production
9
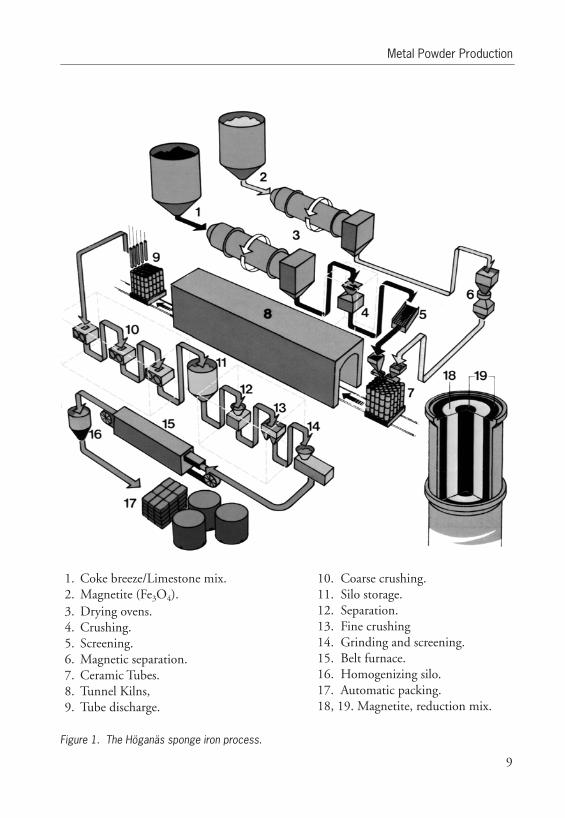
Figure 1. The Höganäs sponge iron process.
1. Coke breeze/Limestone mix.2. Magnetite (Fe3O4).3. Drying ovens.4. Crushing.5. Screening.6. Magnetic separation.7. Ceramic Tubes.8. Tunnel Kilns, 9. Tube discharge.
10. Coarse crushing.11. Silo storage.12. Separation.13. Fine crushing14. Grinding and screening.15. Belt furnace.16. Homogenizing silo.17. Automatic packing.18, 19. Magnetite, reduction mix.

Machinability
10
The sponge iron process starts with two raw materials: (1) a reduction mix consisting of coke breeze blended with ground limestone, and (2) a pre-processed fine magnetite. The magnetite and the reduction mix are dried separately in two rotary ovens (3). The slightly agglomerated dried reduction mix is crushed (4) and screened (5), and the dried magnetite is passed through a magnetic separator (6).
Both materials are then charged, with an automatic charging device, into tube-like ceramic retorts, as illustrated (7), (18), (19). These retorts consist of four tube segments of silicon carbide stacked on top of each other. The retorts stand on rail-bound cars. The cars travel slowly through a tunnel kiln, approximately 260m long (8), within which the retorts are gradually heated to a maximum temperature close to 1200°C. As the temperature inside the retorts increases, the coke breeze begins to burn, forming CO, which in turn reduces the magnetite to metallic iron, while itself oxidizing to CO2.
The generated CO2 reacts with the remaining coke breeze forming new CO, which again reduces more magnetite to metallic iron. This reaction cycle continues until all magnetite has been reduced to metallic iron and the major part of the coke breeze is burned off. Parallel to this reduction cycle, the limestone in the reduction mix binds the sulfur arising from the burning coke breeze.
After reduction is completed, the retorts are slowly cooled to approximately 250°C before leaving the kiln. Inside each retort there is now a tube-like sponge iron cake with a porosity of about 75%, a residue of unburned coke breeze, and a sulfur-rich ash. At an automatic discharging station (9), the sponge iron tubes are removed for cleaning and the remaining coke breeze and ash is exhausted from the retorts. Thereafter, the retorts are ready to be recharged for a new trip through the kiln.
The sponge iron tubes are, in several steps, crushed and comminuted to a particle size below 3mm (10). The thus-obtained crude powder is then put into temporary silage to await further processing. From the intermediate silo (11), the crude powder is passed through a specially designed chain of magnetic separators (12), mills (13) and screens (14), in order to be refined to a particle size below 150µm and a well-defined bulk density.
Subsequently, the powder is passing a belt furnace (15) where it is soft-annealed at 800-1000°C in based atmosphere, and the remaining content of carbon and oxygen is reduced to a minimal level. During annealing, the powder agglomerates to a very crumbly cake which is gently comminuted again in a special mill. The so-treated powder has good compressibility and high green strength. Powder from several belt furnaces is collected in a special silo (16), where it is homogenized in lots of 60 or 120 tons. Each lot is carefully checked with respect to specified properties, and packaged and stored, ready for shipment (17).
Metal Powder Production
11
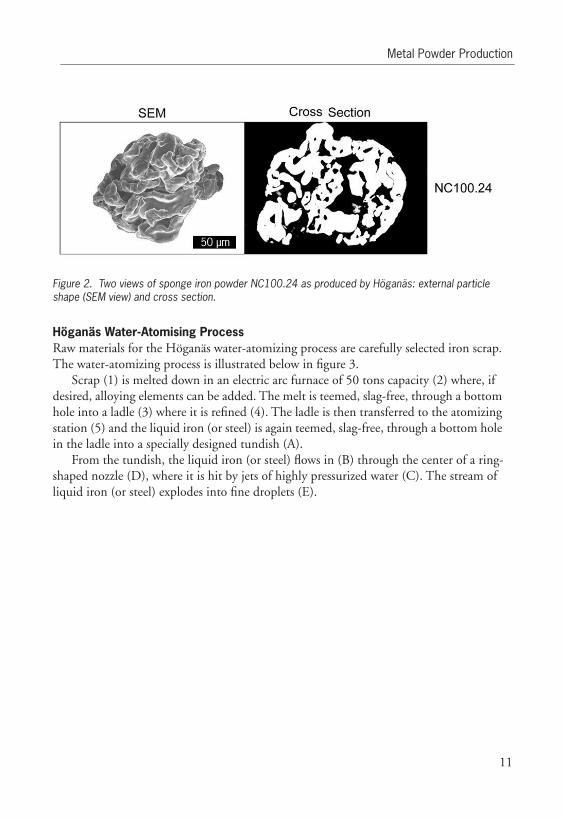
Figure 2. Two views of sponge iron powder NC100.24 as produced by Höganäs: external particle shape (SEM view) and cross section.
Höganäs Water-Atomising Process Raw materials for the Höganäs water-atomizing process are carefully selected iron scrap. The water-atomizing process is illustrated below in figure 3.
Scrap (1) is melted down in an electric arc furnace of 50 tons capacity (2) where, if desired, alloying elements can be added. The melt is teemed, slag-free, through a bottom hole into a ladle (3) where it is refined (4). The ladle is then transferred to the atomizing station (5) and the liquid iron (or steel) is again teemed, slag-free, through a bottom hole in the ladle into a specially designed tundish (A).
From the tundish, the liquid iron (or steel) flows in (B) through the center of a ring-shaped nozzle (D), where it is hit by jets of highly pressurized water (C). The stream of liquid iron (or steel) explodes into fine droplets (E).

Machinability
12
Figure 3. The Höganäs water-atomizing process.

Metal Powder Production
13
Air, swept along by the water jet and water vapor arising in the atomizing process, causes superficial oxidation of the small metal droplets. The solidified droplets and the atomizing water are collected in a container, where they settle as a mud. This mud powder is de-watered (6) and dried (7). The dried powder is magnetically separated from slag particles (8), screened (9), homogenized (10), and eventually transported in special containers (11) for further processing.
On leaving the atomizing plant, the metal particles are not only superficially oxidized, but also very hard. Due to the extremely high cooling rates residing in the atomizing process, the particles solidify in a martensitic state - despite their low carbon content. The particles are therefore soft annealed, and their surface oxides and residual carbon are reduced in a belt furnace, as occurs in the sponge iron process.
Figure 4. Two views of water-atomized iron powder ASC100.29 as produced by Höganäs: external partical shape (SEM view) and cross section.
SEM Cross Section

Machinability
14

Alloying methods
15
2 Metal alloys
Alloyed materials often have markedly different physical properties from those of pure metals. In particular, alloys can significantly increase hardness, and mechanical strength has obvious benefits for both component applications and machining possibilities.
2.1 Alloying methods
In order to achieve hardenable sintered ferrous materials, carbon and other suitable alloying elements (e.g. copper, nickel, molybdenum) must be introduced. While carbon is normally admixed to the iron powder in the form of graphite, metallic alloying elements are commonly introduced by either of the following methods:
1. Admixing of the alloying element to the iron powder.
2. Diffusion bonding of the alloying elements to the iron powder.
3. Coating of the alloying element to the iron powder.
4. Manufacture of fully pre-alloyed powder, e.g. atomisation.
The methods most frequently used today are 1 and 2, mainly because they do not deteriorate compressibility, unlike method 4, which has mostly been used in powder forging applications. Method 3 is seldom applied in ferrous P/M, probably because the cost of the coating operation is too high.
Method 1 represents the easiest and most flexible way of alloying in P/M. Mixes of this kind, however, consist of particles which often differ considerably in size, shape and density. This means that it can be difficult to prepare a mix with uniform distribution, and to avoid segregation and dusting during handling. During a production run this might lead to variations in the chemical analysis from sample to sample. These variations will influence the tolerances of a sintered part in a negative way.
Pre-alloyed powders The partially pre-alloyed technique (method 2), was developed by Höganäs during the 1960s. Diffusion bonding of the alloying elements reduces the risk of segregation without decreasing the compressibility of the material. Powders manufactured by this technique are known as Distaloys to all producers of P/M metal parts, and have proved to give substantially improved tolerances of the sintered properties. The alloying powder particles are bonded to the surface of iron powder particles during heat treatment in a reducing atmosphere. Improved homogeneity results in closer tolerances compared to a plain mix.

Metal alloys
16
Graphite, one of the most commonly used alloying elements, is very sensitive to handling due to its tendency to dusting. It has a considerable influence on dimensional change and the other mechanical properties achieved during sintering, and thereby also, the tolerances of the sintered parts. In order to improve tolerances, Höganäs has developed a technique called STARMIX, in which graphite and other fine particles are bonded to iron powder during blending.
Summary of advantages and disadvantages of alloy powder mixes:
Powder mixes, methods 1-3. Advantages:
• Have higher compressibility.
• No additional mixing operation is required as the powder has to be admixed with a lubricant anyway.
• The composition of a powder mix can easily be changed or corrected by re-mixing it with additional amounts of either iron powder or alloying elements.
Disadvantages:
• Yield less homogeneity of alloyed sintered parts, because the admixed alloying elements (except carbon) diffuse very slowly in the solid iron.
• Alloying elements tend to segregate when the powder mix is transported and handled.
Homogeneously alloyed powders, method 4. Advantages:
• Alloying elements do not segregate when the powder is handled.
• Yield fully homogeneously alloyed sintered parts.
Disadvantages:
• Have low compressibility, because their particles are solution-hardened.
• In order to change or correct the composition of a fully alloyed powder, if ever so little, a new melt has to be atomised.

The powder metallurgy process
17
2.2 The powder metallurgy process
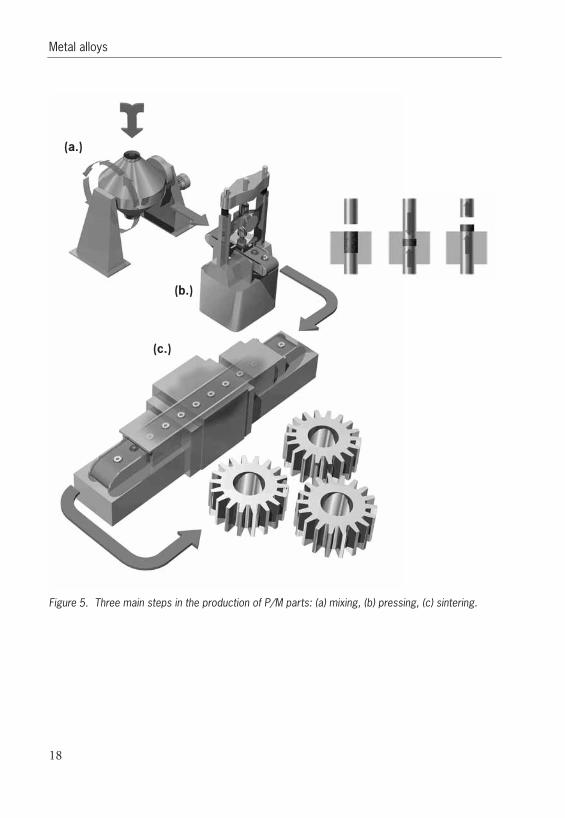
The production of P/M parts, as illustrated in figure 5, consists of three main process steps: mixing, pressing, sintering. Initially, iron powder and various alloying powders are blended together with a lubricant. The powder mix is then compacted in a press to produce components of a desired shape. In this operation the volume of the powder mass is decreased to more than 50% of the original volume, depending on the applied compacting pressure. The compacted components are sintered in the protective atmosphere in a furnace for 20-40 minutes at about 1130°C. In order to improve the dimensional accuracy of the components, a second pressing operation (or coining) is often performed. Finished components can be hardened, machined, plated, et cetera, in the same way as ordinary steel components.
Metal alloys
18
Figure 6. Three main steps in the production of P/M parts: (a) mixing, (b) pressing, (c) sintering.
(a.)
(b.)
(c.)
5.

Materials development
19
2.3 Materials development
Development of materials has to a large extent contributed to new P/M applications. Highly compressible powders have made possible the manufacture of high density components without double pressing and double sintering. This has also minimized tool wear and tool breakage, as well as making it possible to reduce the required compacting force and thereby to utilise available press capacity for large components.
The advantage of an increased sintered density is clearly demonstrated by the relation between mechanical properties and porosity. See figure 6.
Figure 7. Increase of sintered properties with sintered density. Schematically:a = compacting + sintering; a’ = warm compacting+sintering; b = compacting+sintering+re-pressing +re-sintering; c = powder forging.
Relative density, %
Density, g/cm3
Prop
ertie
s, %
of t
heor
etic
al m
axim
um
Tensile Strength
Fatigue Strength
Elongation
Impact Strength
6.

Metal alloys
20
Due to the highly favourable effects obtained through high densities, it has always been important for the P/M industry to find ways to further improve the density of produced parts. An important innovation in this field was warm compaction. As developed by Höganäs, warm compaction is a cost effective method compared to double pressing/sintering and powder forging. The cost advantage, combined with the simplicity and stability of the warm compaction process, has already enabled mass production of P/M parts.
2.4 Sintered Iron-based materials
There are several ways to achieve desired strength properties with iron-based sintered materials. The most important parameters of influence are:
• Density
• Sintering conditions
• Alloying elements
• Heat-treating conditions
These parameters should be controlled to within the closest possible limits, because even small variations may cause an unacceptably wide scatter of dimensional changes during sintering, and thus spoil the dimensional stability of the sintered parts.
DensityDensity is of prime importance with respect to the physical properties of sintered structural parts. The influence of density was reviewed above in Materials Development. See figure 6. Tensile strength and fatigue strength increase in approximately linear proportions, and elongation and impact strengths increase exponentially, with increases in sintered density.
Sintering conditions The following outcomes depend on what sintering conditions are used:
1. How fast and efficiently powder particles in the compact weld together and pores become rounded.
2. How quickly homogenisation of alloying elements takes place.
3. The extent of oxidation of sensitive elements.
Alloying elements Alloying elements, dissolved in a base metal, give rise to the formation of various microstructures and increase the material’s resistance to deformation. Tensile strengths

Sintered Iron-based materials
21
arising from various alloys are shown in figure 7. The use of alloying elements also influences the dimensional change of structural parts during sintering. Alloying elements are indispensable with respect to the hardenability of conventional as well as sintered steels. Hardenability factors arising from various alloys are shown in figure 8.
Figure 8. Influence of alloying elements upon tensile strengths.
Alloying element, wt. -%
Tens
ile s
tren
gth,
N/m
m2
7.

Metal alloys
22
Figure 9. Influence of alloying elements on hardenability.
In principle, alloying elements have the same effect on sintered steels as on conventional steels. However, not all elements commonly alloyed with conventional steels can be used in sintered steels. Some of them (e.g. Mn and V) are too easily oxidized in commercial sintering atmospheres. On the other hand, elements undesirable in conventional steels (e.g. phosphorous or “blue brittleness”) can have beneficial effects in sintered steels.
Alloy compositions of sintered steels for structural parts have to be carefully selected not only with respect to desired strength, but also with respect to dimensional stability during sintering. With alloy compositions yielding hardness levels above 150 - 180 HV, it is important that dimensional changes of the structural parts during sintering are as small as possible and, even more importantly, that the scatter of these dimensional changes is kept within the closest possible limits.
While parts with hardnesses up to 150 HV can be sized or coined fairly easily, as hardness increases beyond this threshold, sizing or coining becomes increasingly difficult and eventually impossible. In the mass production of high-strength high-precision parts, it is therefore of utmost importance that dimensional changes during sintering (and subsequent heat-treatment) are insensitive to small unavoidable variations in process parameters and material composition.
Alloying element, wt. -%
Mul
tiplic
atio
n fa
ctor
8.

Alloying system: Microstructures and mechanical properties
23
Heat-treating conditions Heat-treating conditions, when applied to sintered steel components, must be especially well controlled to ensure the highest possible degree of dimensional stability of the component in the hardening and tempering procedure. Asymmetric cooling during quenching of a sintered component, especially with parts of complex shape, may lead to distortions so severe that the part must either be rejected or subjected to expensive re-machining. This would wipe out the cost advantage of P/M technology over conventional production methods.
2.5 Alloying system: Microstructures and mechanical properties
Microstructures of sintered alloyed steels, produced from powder mixes, are typically much more heterogeneous than those of conventional alloyed steels. While carbon diffuses rapidly in iron lattice and reaches equilibrium during sintering, other alloying elements like copper, nickel, and molybdenum diffuse slower and reaches equilibrium after longer sintering times. Hence, when produced under commercially acceptable sintering conditions, these materials will always exhibit a certain degree of heterogeneity.
The following experimental alloying system has been investigated regarding machinability:
• Plain Iron
• Iron - Carbon
• Iron - Copper
• Iron - Copper - Carbon
• Iron - Phosphorus
• Iron - Molybdenum
• Iron - Molybdenum - Carbon
• Iron - Copper - Nickel - Molybdenum
• Iron - Copper - Nickel - Molybdenum - Carbon
Microstructure and selected properties for the above alloys are presented below. (For more detailed information see Höganäs AB Iron and Steel Powders for Sintered Components - Handbook.)

Metal alloys
24
Plain iron and iron-carbon systems Plain iron has a pure ferritic microstructure. Formation of pearlite is a consequence of carbon addition, and varies with the amount added. The microstructures produced with additions of different amounts of carbon in iron-carbon alloys can be seen in figure 9.

Alloying system: Microstructures and mechanical properties
25
Figure 10. Microstructure of two iron-carbon alloys: (a) ASC100.29+0.2% C, (b) ASC100.29+0.5% C. Both materials compacted with 589 N/mm2 and sintered 30 min. at 1120° C. Sintered densities: (a) 7.15 g/cm3 and (b) 7.10 g/cm3.
(a.)
(b.)
50 µm
50 µm
9.
Metal alloys
26
Parameters such as grain size will influence the physical properties of P/M alloys. With decreasing grain size, strength increases, but with increasing grain size, ductility is improved. A very efficient way to boost tensile strength and hardness of sintered iron is to alloy it with carbon. Most conveniently, this is achieved by adding graphite powder to the iron powder, before compacting and sintering. Being an interstitial alloying element, carbon dissolves rapidly in the lattice during sintering.
Pure ferritic material is difficult to machine, due to smearing on tools. If carbon is added, the microstructure will be a mix of ferrite and pearlite. This microstructure has the best performance regarding machinability.
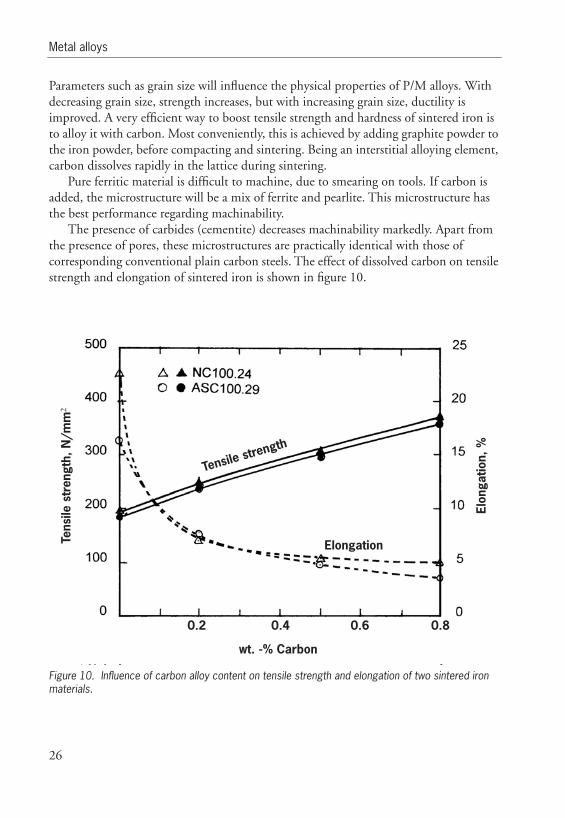
The presence of carbides (cementite) decreases machinability markedly. Apart from the presence of pores, these microstructures are practically identical with those of corresponding conventional plain carbon steels. The effect of dissolved carbon on tensile strength and elongation of sintered iron is shown in figure 10.
Figure 11. Influence of carbon alloy content on tensile strength and elongation of two sintered iron materials.
Tens
ile s
tren
gth,
N/m
m2
Tensile strength
Elongation
Elon
gatio
n, %
0.2
wt. -% Carbon
0.4 0.6 0.8
10.

Alloying system: Microstructures and mechanical properties
27
Iron-copper and iron-copper-carbon systems Mixtures of iron and copper powder have a two-fold benefit:
• Copper melts at 1083°C (i.e. below sintering temperature) and rapidly infiltrates the pore system of a compact powder, from where it diffuses relatively easily into the iron particles.
• Copper is dissolvable in γ-iron (austenite) up to approximately 9 wt.-%, but only up to 0.4 wt.-% in α-iron (ferrite); consequently, iron-copper alloys can be precipita-tion-hardened by low-temperature annealing after sintering – and they actually do so to a certain extent anyway, when passing the cooling zone of the sintering furnace.
Copper is added to the basic iron powder usually in amounts from 1.5 to 4 wt.-%.
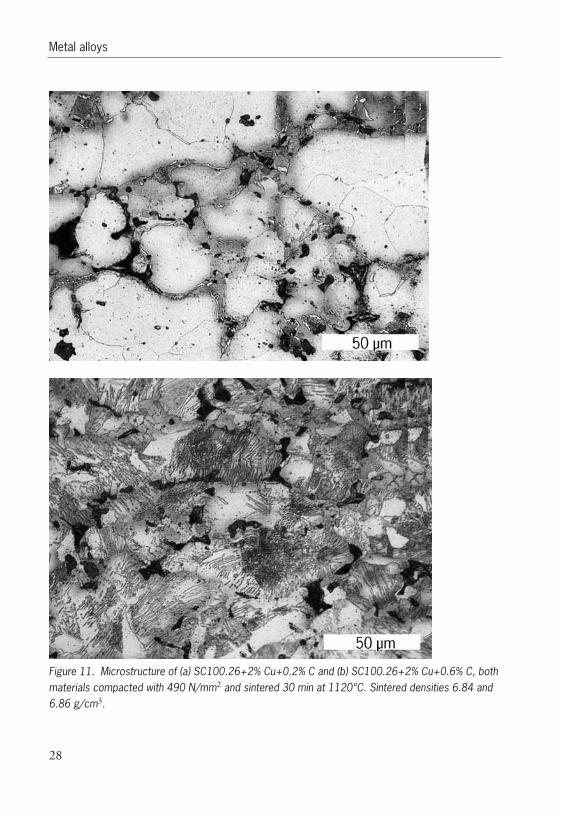
Microstructures of two iron-copper materials (containing 2 wt.-% copper, and 0.2 and 0.6 wt.-% carbon, respectively) are shown in figure 11. These materials were compacted to densities of 6.9 g/cm3 and sintered for 30 minutes at 1120°C in endogas. In the micrograph with 0.2 wt.-% carbon, it appears that dissolved copper has concentrated in carbon-rich areas of the iron structure where it has partly disintegrated the pearlite.
Metal alloys
28
Figure 12. Microstructure of (a) SC100.26+2% Cu+0.2% C and (b) SC100.26+2% Cu+0.6% C, both materials compacted with 490 N/mm2 and sintered 30 min at 1120°C. Sintered densities 6.84 and 6.86 g/cm3.
11.
Alloying system: Microstructures and mechanical properties
29
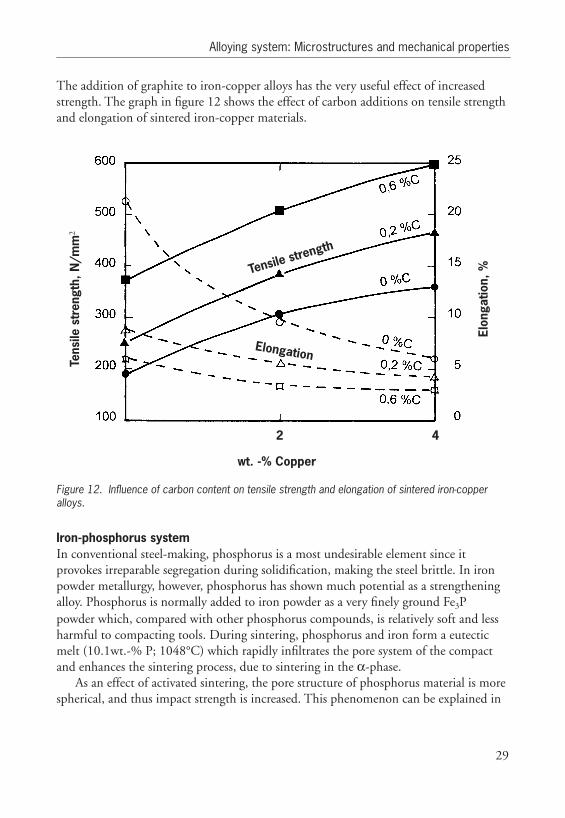
The addition of graphite to iron-copper alloys has the very useful effect of increased strength. The graph in figure 12 shows the effect of carbon additions on tensile strength and elongation of sintered iron-copper materials.
Figure 13. Influence of carbon content on tensile strength and elongation of sintered iron-copper alloys.
Iron-phosphorus system In conventional steel-making, phosphorus is a most undesirable element since it provokes irreparable segregation during solidification, making the steel brittle. In iron powder metallurgy, however, phosphorus has shown much potential as a strengthening alloy. Phosphorus is normally added to iron powder as a very finely ground Fe3Ppowder which, compared with other phosphorus compounds, is relatively soft and less harmful to compacting tools. During sintering, phosphorus and iron form a eutectic melt (10.1wt.-% P; 1048°C) which rapidly infiltrates the pore system of the compact and enhances the sintering process, due to sintering in the α-phase.
As an effect of activated sintering, the pore structure of phosphorus material is more spherical, and thus impact strength is increased. This phenomenon can be explained in
Tens
ile s
tren
gth,
N/m
m2
Tensile strength
Elongation
Elon
gatio
n, %
2
wt. -% Copper
4
12.

Metal alloys
30
terms of a substantially reduced notch effect. See figure 13 for micrography of a phosphorus alloy, showing ‘rounded-off ’ pores of medium size and an absence of small pores.
Figure 14. Microstructure of a phosphorus alloy (NC100.24+0.45% P); compacted with 690 N/mm2
and sintered 30 min at 1120°C. Note well-formed spherical pores of good size.
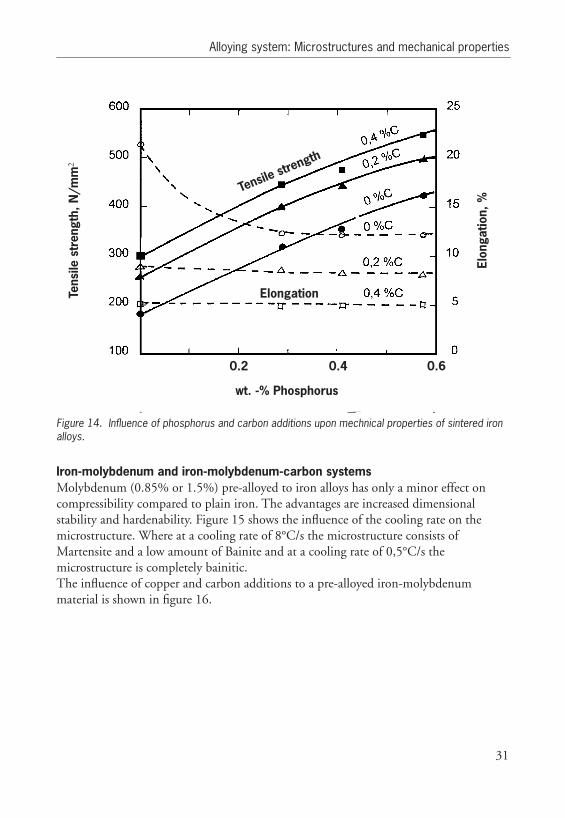
As expected with alloys, there is a relationship seen in the mechanical properties found in sintered materials. The graph in figure 14 shows the influence of phosphorus and carbon upon tensile strength and elongation of iron compacts. The addition of 0.3 to 0.6 % phosphorus has a similar effect on tensile strength and elongation as has addition of 2 to 4 % copper (cf. figure 14 vis-à-vis figure 12).
13.
Alloying system: Microstructures and mechanical properties
31
Figure 15. Influence of phosphorus and carbon additions upon mechnical properties of sintered iron alloys.
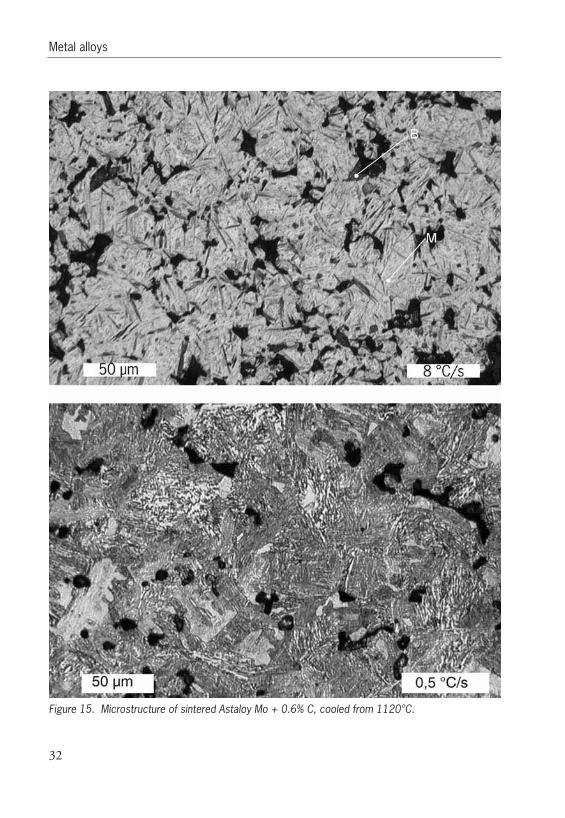
Iron-molybdenum and iron-molybdenum-carbon systems Molybdenum (0.85% or 1.5%) pre-alloyed to iron alloys has only a minor effect on compressibility compared to plain iron. The advantages are increased dimensional stability and hardenability. Figure 15 shows the influence of the cooling rate on the microstructure. Where at a cooling rate of 8°C/s the microstructure consists of Martensite and a low amount of Bainite and at a cooling rate of 0,5°C/s the microstructure is completely bainitic.The influence of copper and carbon additions to a pre-alloyed iron-molybdenum material is shown in figure 16.
Tens
ile s
tren
gth,
N/m
m2
Tensile strength
Elongation
Elon
gatio
n, %
wt. -% Phosphorus
0.2 0.4 0.6
14.
Metal alloys
32
Figure 16. Microstructure of sintered Astaloy Mo + 0.6% C, cooled from 1120°C.15.

Alloying system: Microstructures and mechanical properties
33
Figure 17. Influence of copper and carbon additions upon the properties of sintered iron materials pre-alloyed with molybdenum (Astaloy Mo).
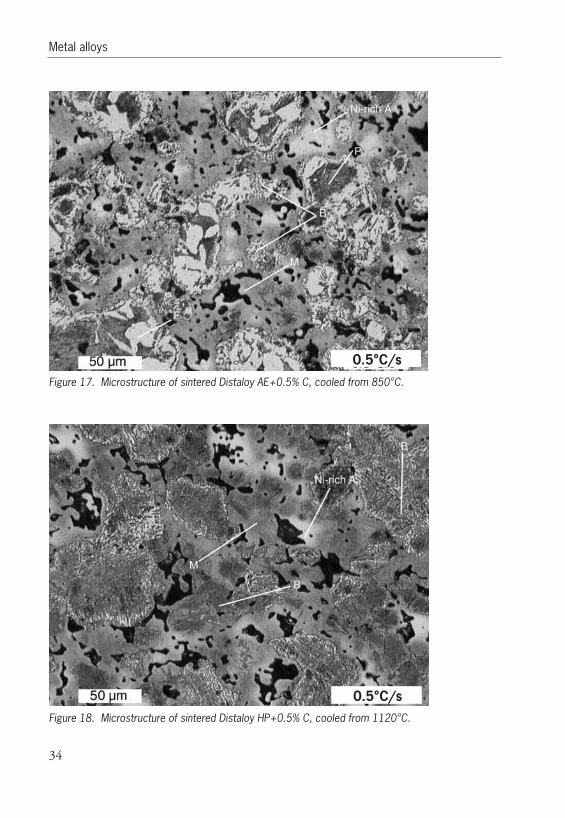
Iron-copper-nickel-molybdenum-carbon system This system covers a wide range of iron alloy powders available for P/M applications. Two of the most useful grades from this range are described here: a diffusion bonded nickel, molybdenum and copper (known as Distaloy AE), and a grade based on pre-alloyed molybdenum with diffusion bonded nickel and copper (Distaloy HP). See figure 17 for micrography of Distaloy AE +0.5% C and figure 18 for micrography of Distaloy HP+0.5% C.
Tens
ile s
tren
gth,
N/m
m2
Tens
ile st
reng
th
Elongation
Elon
gatio
n, %
wt. -% Carbon
0.2 0.4 0.6
16.
Metal alloys
34
Figure 18. Microstructure of sintered Distaloy AE+0.5% C, cooled from 850°C.
Figure 19. Microstructure of sintered Distaloy HP+0.5% C, cooled from 1120°C.
0.5°C/s
0.5°C/s
17.
18.
Alloying system: Microstructures and mechanical properties
35
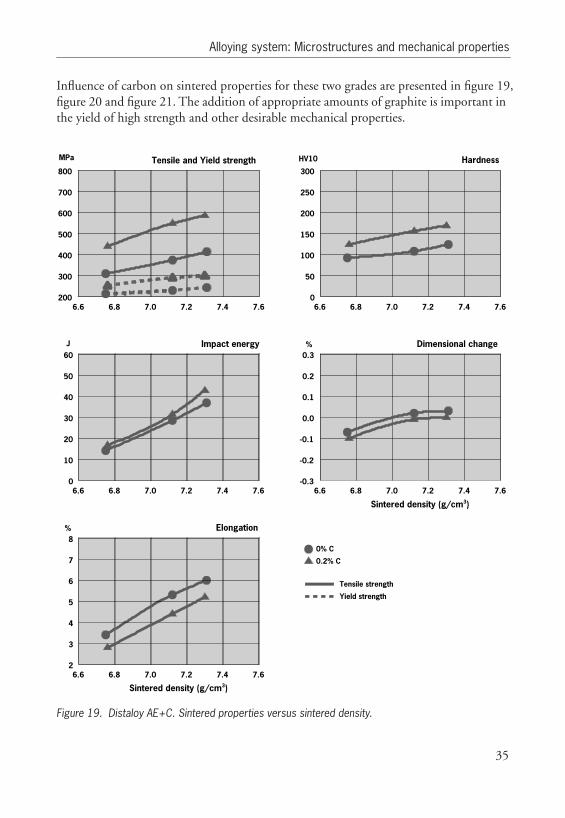
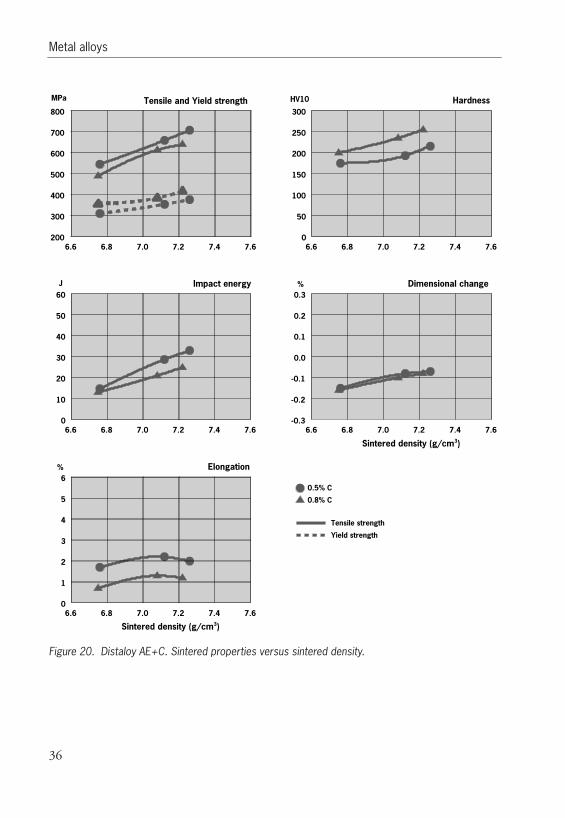
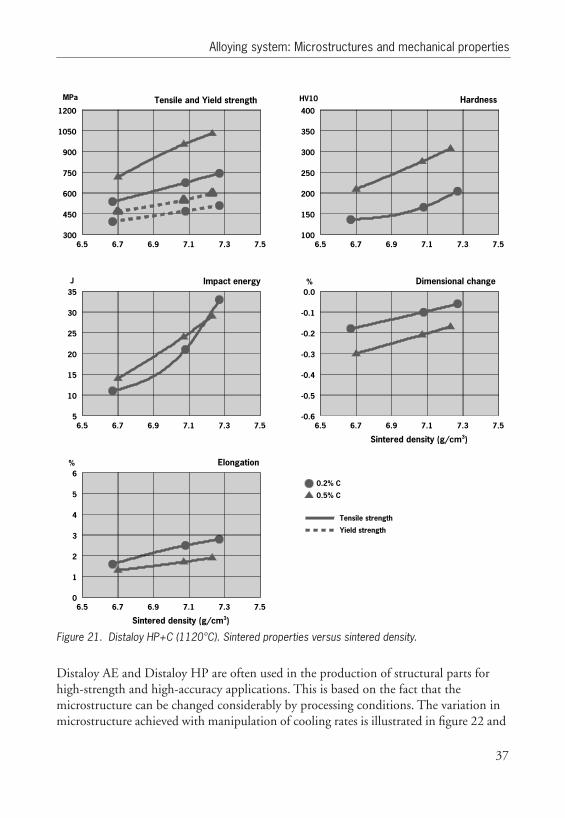
Influence of carbon on sintered properties for these two grades are presented in figure 19, figure 20 and figure 21. The addition of appropriate amounts of graphite is important in the yield of high strength and other desirable mechanical properties.
Figure 20. Distaloy AE+C. Sintered properties versus sintered density.
6.6 6.8 7.0 7.2 7.4 7.6
MPa
200
300
400
500
600
700
800
0% C
0.2% C
Tensile and Yield strength
Tensile strength
Yield strength
6.6 6.8 7.0 7.2 7.4 7.60
50
100
150
200
250
300
HV10 Hardness
6.6 6.8 7.0 7.2 7.4 7.60
10
20
30
40
50
60J Impact energy
6.6 6.8 7.0 7.2 7.4 7.6
Sintered density (g/cm3)
-0.3
-0.2
-0.1
0.0
0.1
0.2
0.3Dimensional change%
6.6 6.8 7.0 7.2 7.4 7.6
Sintered density (g/cm3)
2
3
4
5
6
7
8Elongation%
19.
Metal alloys
36
Figure 21. Distaloy AE+C. Sintered properties versus sintered density.
6.6 6.8 7.0 7.2 7.4 7.6
MPa
200
300
400
500
600
700
800
0.5% C
0.8% C
Tensile and Yield strength
Tensile strength
Yield strength
6.6 6.8 7.0 7.2 7.4 7.60
50
100
150
200
250
300
HV10 Hardness
6.6 6.8 7.0 7.2 7.4 7.60
10
20
30
40
50
60J Impact energy
6.6 6.8 7.0 7.2 7.4 7.6
Sintered density (g/cm3)
-0.3
-0.2
-0.1
0.0
0.1
0.2
0.3Dimensional change%
6.6 6.8 7.0 7.2 7.4 7.6
Sintered density (g/cm3)
0
1
2
3
4
5
6Elongation%
20.
Alloying system: Microstructures and mechanical properties
37
Figure 22. Distaloy HP+C (1120°C). Sintered properties versus sintered density.
Distaloy AE and Distaloy HP are often used in the production of structural parts for high-strength and high-accuracy applications. This is based on the fact that the microstructure can be changed considerably by processing conditions. The variation in microstructure achieved with manipulation of cooling rates is illustrated in figure 22 and
6.5 6.7 6.9 7.1 7.3 7.5
MPa
300
450
600
750
900
1050
1200
0.2% C
0.5% C
Tensile and Yield strength
Tensile strength
Yield strength
6.5 6.7 6.9 7.1 7.3 7.5100
150
200
250
300
350
400
HV10 Hardness
6.5 6.7 6.9 7.1 7.3 7.55
10
15
20
25
30
35J Impact energy
6.5 6.7 6.9 7.1 7.3 7.5
Sintered density (g/cm3)
-0.6
-0.5
-0.4
-0.3
-0.2
-0.1
0.0Dimensional change%
6.5 6.7 6.9 7.1 7.3 7.5
Sintered density (g/cm3)
0
1
2
3
4
5
6Elongation%
21.

Metal alloys
38
figure 23. Both materials respond very well to subsequent heat-treatment and can be used as non-segregatable materials since the alloy elements are diffusion bonded to the iron particles.
Figure 23. Microstructure of sintered Distaloy AE + 0.5% C, cooled from 850°C.
Figure 24. Microstructure of sintered Distaloy HP + 0.5% C, cooled from 1120°C.
10°C/s
8°C/s
22.
23.

Analysis of the Machining Process
39
3 Turning
This chapter was written in cooperation with Sandvik Coromant and the Swedish Institute of Metal Research. Machinability is not a universally defined property. Generally, it is the ability of a workpiece material to be machined, meaning how easy or demanding it is to shape a workpiece with a cutting tool. Machinability can be divided into three main aspects [Ref 1]:
1. Tool life.
2. Surface finish.
3. Power required to cut.
In order to state cutting parameters for machining of P/M materials these three aspects must be investigated.
3.1 Analysis of the Machining Process
The machining process is complex. In order to select the right tool and machining parameters, knowledge is necessary of the loads on the tool material and the properties of the tool material, together with an analysis of wear mechanisms.
Machining performance is determined by the physical properties and condition of the workpiece and the cutting operation. P/M technology contributes with almost infinitely possible modifications to material microstructures. Tool concept (i.e. chip breaker profile, stability and geometry of tool holder, insert style, etc.) defines the wear process which can be divided into four main load factors [Ref 2]: Mechanical, Thermal, Chemical, and Abrasive.
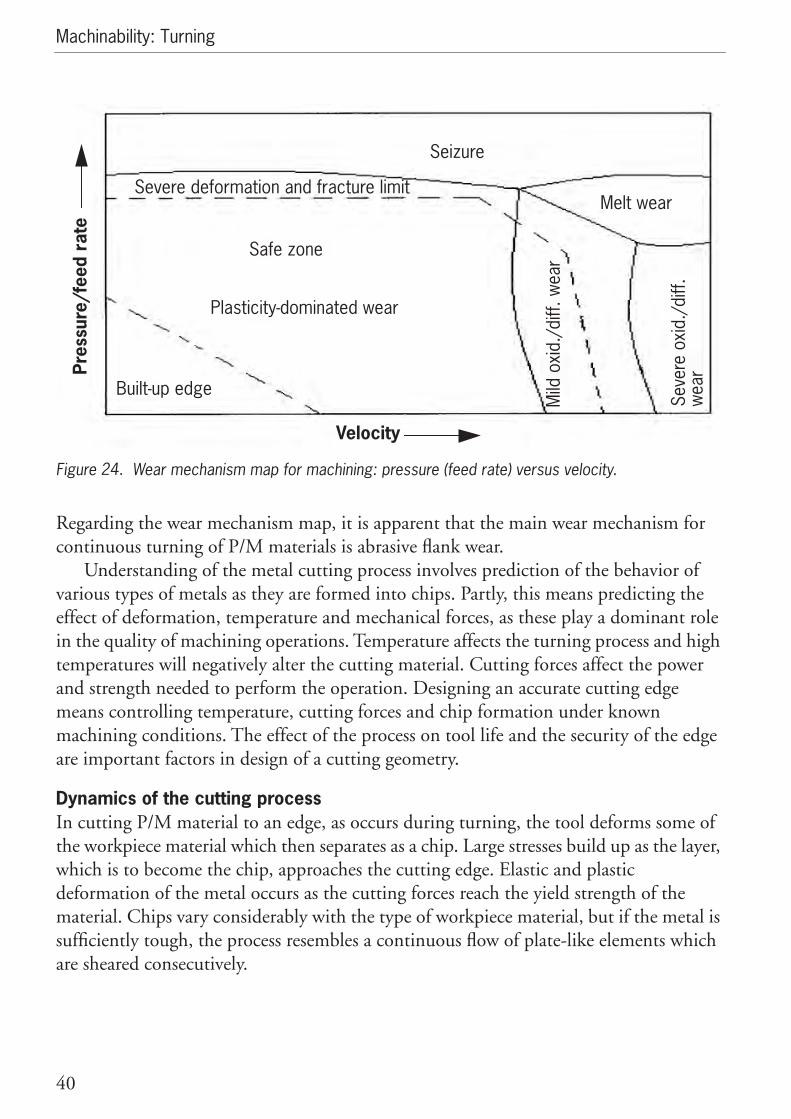
To determine cutting parameters, the load factors acting on the tool must be controlled according to the active wear mechanisms. Typically, the loads on the edge of a cutting tool are different at various locations. Consequently, different wear mechanisms are activated and proceed at different rates at each location. Wear mechanism maps can be constructed to describe the area of constant wear (or ‘safe zone’). The primary input factors are feed rate (or pressure) and cutting speed (or velocity). The interaction of these forces is shown schematically in the wear mechanism map at figure 24.
Machinability: Turning
40
Figure 25. Wear mechanism map for machining: pressure (feed rate) versus velocity.
Regarding the wear mechanism map, it is apparent that the main wear mechanism for continuous turning of P/M materials is abrasive flank wear.
Understanding of the metal cutting process involves prediction of the behavior of various types of metals as they are formed into chips. Partly, this means predicting the effect of deformation, temperature and mechanical forces, as these play a dominant role in the quality of machining operations. Temperature affects the turning process and high temperatures will negatively alter the cutting material. Cutting forces affect the power and strength needed to perform the operation. Designing an accurate cutting edge means controlling temperature, cutting forces and chip formation under known machining conditions. The effect of the process on tool life and the security of the edge are important factors in design of a cutting geometry.
Dynamics of the cutting process In cutting P/M material to an edge, as occurs during turning, the tool deforms some of the workpiece material which then separates as a chip. Large stresses build up as the layer, which is to become the chip, approaches the cutting edge. Elastic and plastic deformation of the metal occurs as the cutting forces reach the yield strength of the material. Chips vary considerably with the type of workpiece material, but if the metal is sufficiently tough, the process resembles a continuous flow of plate-like elements which are sheared consecutively.
Seizure
Severe deformation and fracture limit
Safe zone
Plasticity-dominated wear
Built-up edge
Melt wear
Seve
re o
xid.
/diff
. w
ear
Mild
oxi
d./d
iff. w
ear
Velocity
Pres
sure
/fee
d ra
te
24.

Analysis of the Machining Process
41
The basic dynamic of the cutting process (i.e. chip formation) is illustrated in figure 25. The boundary between the chip and workpiece, the zone which separates the deformed and undeformed metal is called the shear plane (SP). This has an angle to the workpiece called the shear plane angle (∅). In figure 25, the metal to the right of the plane is the deformed chip, with thickness (h2), and the metal to the left is the undeformed chip, thickness (h1).
Chip deformation is related mainly to three factors: the thickness of the undeformed chip, the rake angle (γ) between the chip face and the normal workpiece surface, and the mechanical properties of the workpiece material. These factors also affect the shear plane angle during the cutting process.
Figure 26. Fundamentals of cutting process: shear plane (SP) and chip-forming factors. (See text in this section for key with details of each factor.)
During cutting a stagnation zone follows the tip of the edge. Softened metal protects the tool by sticking or sliding on the surface. A flow zone takes over after the shear plane and is visible at the division of undeformed and deformed material. Thus the principal cutting action occurs at the shear plane, determined to a great extent by the cutting ratio between the undeformed and deformed chip thickness. Microstructure at the shear plane of a P/M material is shown in figure 26.
25.
Machinability: Turning
42
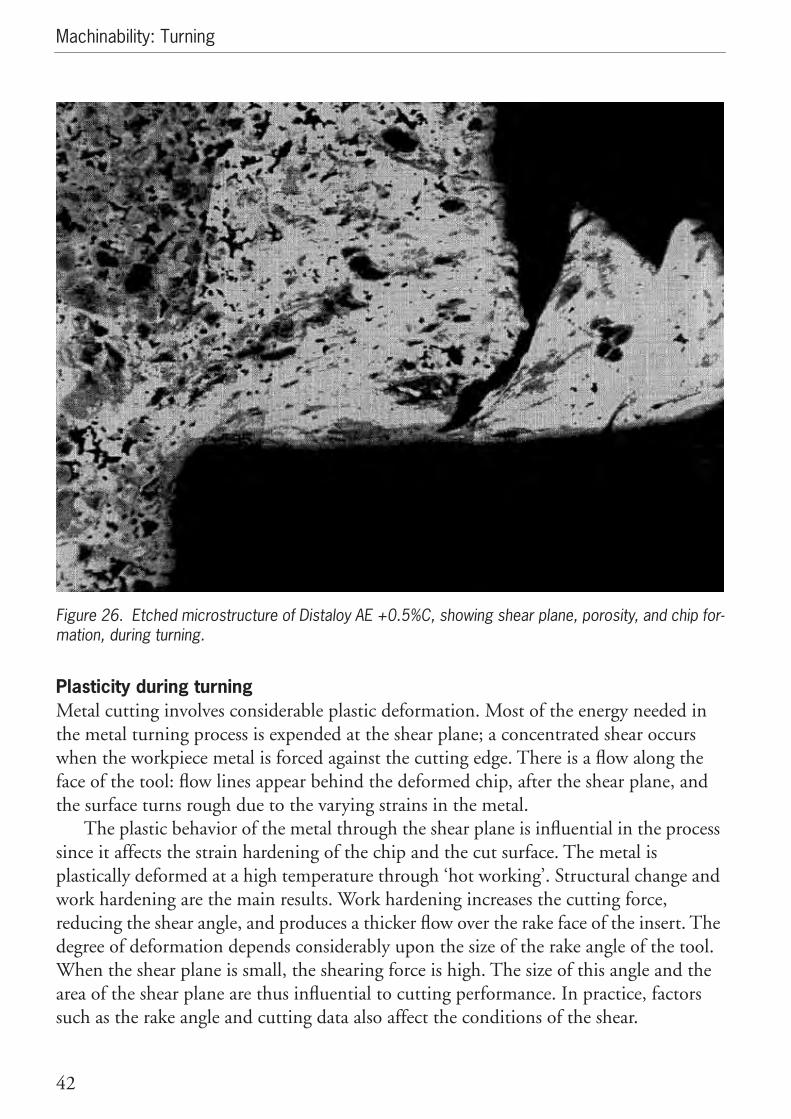
Figure 27. Etched microstructure of Distaloy AE +0.5%C, showing shear plane, porosity, and chip for-mation, during turning.
Plasticity during turning Metal cutting involves considerable plastic deformation. Most of the energy needed in the metal turning process is expended at the shear plane; a concentrated shear occurs when the workpiece metal is forced against the cutting edge. There is a flow along the face of the tool: flow lines appear behind the deformed chip, after the shear plane, and the surface turns rough due to the varying strains in the metal.
The plastic behavior of the metal through the shear plane is influential in the process since it affects the strain hardening of the chip and the cut surface. The metal is plastically deformed at a high temperature through ‘hot working’. Structural change and work hardening are the main results. Work hardening increases the cutting force, reducing the shear angle, and produces a thicker flow over the rake face of the insert. The degree of deformation depends considerably upon the size of the rake angle of the tool. When the shear plane is small, the shearing force is high. The size of this angle and the area of the shear plane are thus influential to cutting performance. In practice, factors such as the rake angle and cutting data also affect the conditions of the shear.
26.

Analysis of the Machining Process
43
The created shear plane is the turning point for the metal being cut; it is the surface where materials yield and the chip is born. The strain and stress occurring at this point depends on dynamics in the shear plane and the contact between the chip and tool. The chip formation process is affected by the shearing angle which in turn influences the contact length.
The character of the movement of the chip along the contact length with the tool face is another important factor in metal cutting. Friction is a factor in the process as the metal is forced along at great pressures and high temperature. The flow zone is thus created when the surface seizes but the movement between chip and tool continues. The speed of the chip material increases from zero at the interface, to higher levels further from the tool. Thus the chip moves along the tool face through a shear movement. Consequently, more heat is generated in this zone of both stationary and flowing metal. The pattern of movement is to a large extent characteristic of the material being cut as well as the cutting data in use.
Built up edgeThe meeting between chip and tool along the contact length can be divided into three areas where different reactions take place during the turning process:
1. Sticking.
2. Adhesion and diffusion.
3. Abrasion, where with higher temperatures, diffusion and adhesion increase.
With certain conditions and materials, successive layers of the flow zone material will build up and harden on the tool face. The flow zone moves up and along with the top of the formed layer and, in this way, a built up edge (BUE) is formed. Metal is pressure-welded continuously on the rake angle of the tool and eventually becomes unstable. It breaks off at a certain point in the process whereupon the build up of a new layer commences. BUE is a negative factor appearing in various forms and conditions in machining. It can usually be eliminated by altering the conditions of the machining process on which it thrives.
Often there is a certain temperature and cutting speed range which promotes the growth of BUE and certain workpieces and tool materials are more prone than others. High speeds soften the layer and replace it with a flow zone. The BUE can also take some of the cutting edge with it when it breaks off, and it may itself be hard enough to function as a cutting edge. Some forms of BUE particularly affect the rake angle and also the chip thickness. Formation of BUE increases with larger rounding of the cutting edge (ER) but decreases with more positive rake angles. The strength of the BUE decreases with increasing temperatures.

Machinability: Turning
44
3.2 Tool Wear and Tool Life
Analyzing tool wear and taking measures to ensure that there is optimal, balanced wear is important for the quality and performance of turning operations. Wear affects how much and in what way the cutting edge deviates from the nominal dimension and the surface finish required.
In turning for surface finishing, flank wear dominates as the wear type. A balanced, predictable development of wear over a long time is the normal goal. The way in which this development takes place determines the fluctuation of the machined dimensions within the tolerance area and thereby the frequency of positional adjustments of the cutting edge. There are five main wear mechanisms which dominate in metal cutting (as illustrated in figure 27):
1. Abrasion.
2. Diffusion.
3. Oxidation.
4. Fatigue.
5. Adhesion.
These wear mechanisms combine to attack the cutting edge in various ways depending upon the tool material, cutting geometry, workpiece material and cutting data. A basic analysis of the tool wear is an important strategy in optimizing performance and quality in finish turning. In the following summary, eight forms of tool wear are related to the above wear mechanisms.

Tool Wear and Tool Life
45
Figure 28. Schematic representation of five forms of tool wear during metal cutting: 1. Abrasion, 2. Diffusion, 3. Oxidation, 4. Fatigue, 5. Adhesion.
Forms of tool wear
1. Flank wear takes place at the flank or clearance face of the cutting edge along the length of engagement. In this way it affects the position of the edge and the insert geometry. Its development can be positive in that it makes the edge sharper as machining progresses, however, after a certain amount of wear, increasing friction against the machined surface deteriorates performance of the edge. The main cause is the abrasive wear mechanism and the effect grows with higher cutting speeds.
2. Crater wear takes place on the chip face, where high temperatures and pressure pre-vail. Diffusion and abrasion wear mechanisms cause tool material to be worn away
1.
2. 3.
4. 5.
27.

Machinability: Turning
46
and if this is allowed to develop excessively, a change in cutting geometry can occur, affecting chip formation and cutting forces, and weakening the cutting edge.
3. Plastic deformation can take place as a result of a combination of high temperatures and high pressures on the cutting edge. High cutting speeds and feeds along with hard workpiece materials lead to heat and high compression. ‘Hot hardness’ is a nec-essary property for the tool to stand up to this effect. Once the deformation starts to take place, further deterioration follows as a result of even higher temperatures, lead-ing to an escalation of critical effects between the edge and workpiece.
4. Thermal cracking is mainly a type of fatigue wear due to intermittent heat effect. With tool materials having a smaller coefficient of thermal expansion, cracks can form on the cutting edge, leading to edge weakness and the risk of rapid edge break-down due to failure. The application of cutting fluid is often a negative factor if tem-perature fluctuations are allowed to amplify during machining.
5. Chipping of the cutting edge takes place when the edge-line breaks, rather than wears, due to load pressure from the cutting action or due to material adhesion. Intermittent cutting is a frequent cause of edge chipping or uneven breaking, and ultimately fracturing. There are various degrees of this wear type with either micro to macro pieces breaking away from the cutting edge. In many cases the tool material type or grade is not suitable for the operation in question, indicating that more strength is required.
6. Built up edge formation is a wear type occurring largely as a function of temperature and cutting speed interaction. The workpiece material plays an important role as does the tool material, with some types being much more prone than others. Low carbon steels generally have a severe tendency to smear. Surface finish is first to be affected negatively, followed by a change in cutting geometry and then edge break-down.
7. Notch wear on the trailing edge is to a great extent an oxidation wear mechanism occurring where the cutting edge leaves the machined workpiece material in the feed direction. But abrasion and adhesion wear in a combined effect can contribute to the formation of one or several notches. There is a state of tension where the cutting edge leaves the workpiece material and the surface can be deformation-hardened leading to concentrated notch wear. Notch wear has a considerable effect on surface finish as the notch leaves high peaks and burrs which rapidly exceed the permitted profile height in finishing. Excessively high cutting speeds for the tool material in question, combined with a large entering angle, are typical causes of notch wear. Notch wear may involve the effect of squeezing, also called side-flow. This involves the material from the machined peaks being partly pulled away on either side of the chip. The side-flow affects the surface finish, depending upon chip flow direction, in that the
Tool Wear and Tool Life
47
newly cut and deformed material is hard and the peaks wear abrasively against the cutting edge. Notches are worn due to concentrated wear, spaced at a distance equal to the feed per revolution.
8. Flaking involves the coating being damaged at an early stage, usually because of demanding machining conditions and/or inferior coating. Poor adhesion of the coated layer on the grade, as well as plastic deformation, lead to flaking when the workpiece material is smearing or if the cut is intermittent. If the exposed substrate is more susceptible to wear, this is also a critical factor. (Modern coated GC 1525 and GC 4015 have been developed to resist flaking tendencies).
Speed and feed rates and tool wear Cutting speed and cutting depth do not affect the tension build up in the workpiece to any great extent, but the feed rate does. Both small and large feed rates can give rise to material tension. This is another reason for testing to find the median, optimum feed rate for an application. Edge sharpness and a positive geometry help to keep material tension from building up during machining. A smaller entering angle gives rise to less build up of material tension through a more even magnitude of the cutting forces.
Increased velocity (cutting speed) and temperature has varied influences on different forms of tool wear. The tendencies for several different forms of wear are shown in figure 28.

Machinability: Turning
48
Figure 29. Influence of cutting speed and temperature on four types of tool wear: 1. abrasive (flank and crater), 2. diffusion (crater), 3. oxidation (notch), 4. built up edge.
Tool life criteria The tool life for a cutting edge is determined according to its ability to satisfy demands such as:
• Maintaining tolerances.
• Obtaining the required surface finish.
• Satisfactory chip breaking.
Tool life determination is a key factor for setting productivity levels. Often, experience is the only available guide in judging what degree of wear to allow on a cutting edge before machining is discontinued. Degree of wear on the flank is considered a reasonably reliable criterion on which to base decisions about economical tool life.
Tool wear is determined by observing and measuring the degree of wear as it occurs and specifying the effective cutting time (T) which elapses before a stipulated degree of wear is reached. This formula is represented in figure 29: the curve Vc1 indicates the highest cutting speed which produces the shortest tool life (T1).
28.

Tool Wear and Tool Life
49
Figure 30. Relationship between cutting speed (m/min) and tool life (min), as indicators of tool wear.
Figure 31. Tool life test (vT-curve) based on cutting speed values as shown in the above (figure 29).
29.
30.

Machinability: Turning
50
In figure 30 a curve, which is practically a straight line, known as ‘Taylor’s curve’ and often referred to as the ‘vT-curve’ describes a relationship used to determine optimal tool life. The first generally accepted single point turning test using “Taylor ’s tool life test” was conducted in 1975 for an ISO standard. The details of the test procedure and tool life evaluation data are explained in ISO document No. 3685 of 1977.
Cutting forces in balance Metal cutting requires a lot of power to separate chips from the workpiece. An understanding of cutting forces will lead to well balanced cutting edges through positive cutting actions and good cutting edge strength.
There is a relationship between the power needed for the cutting process and the cutting forces involved. Seen from an orthogonal point of view, a state of equilibrium exists with the forces involved and in relation to the shear plan. The forces at work on the workpiece and chip, along the shear plane, and between the tool face and chip are, in principle, equal.
Seen in three dimensions, the cutting forces can be divided into three components: tangential or main force (FC), radial or passive force (FCN) and axial or feed force (FP), as shown in figure 31.
Figure 32. Forces at work to produce cutting during machine turning: there is a dynamic equilibrium between tangential (FC), radial (FCN) and axial (FP) forces.
The main is to a great extent dependent upon the contact and friction between, not only the workpiece and tool, but also the condition of contact between chip and rake face of
31.

Classification of P/M Materials for Turning
51
the cutting edge. The quality of the actual chip formation and breaking, affects the main force considerably. There is also a direct relationship between the undeformed chip thickness (h1) and the magnitude of this force. For most workpiece materials, increasing cutting speed leads to lower cutting forces. The higher temperature in the flow zone and reduced contact area contribute to this effect. The decrease in forces varies with material and the range of cutting speeds in question.
3.3 Classification of P/M Materials for Turning
In order to state cutting data regarding turning, cylinders (∆out: 64 mm, ∆in: 35 mm, H ≈ 62 mm) compacted to 7.0 g/cm3 were produced from the mixes shown in Table 2 on page 52). Influence of density was evaluated at 6.7 , 7.0 and 7.1 g/cm3. Carbon enriched components were sintered in endogas with 0.3% CO2 ; dissociated ammonia was used for carbon free components. All components were sintered in a production furnace at GKN Sinter Metals AB, Sweden. Sintering was at 1120°C for 30 minutes. The main turning evaluation was performed by the Swedish Institute for Metal Research, in a SMT lathe.

Machinability: Turning
52
A wide range of tools is used in cutting operations with P/M components. In this investigation tools of the following types were selected: Cermet, PVD TiN coated HM, CVD - multi coated HM and CBN. To determine tool life (i.e. when ‘worn out’), a criteria of 0.3 mm flank wear was chosen. For the main investigation a depth of cut of0.5 mm was used. All tests were performed in dry conditions (i.e. no cutting fluid applied).
Since P/M technology provides many alternative ways to add alloying elements, a large number of mixes is on the market. The classification of P/M materials is necessary so that machining recommendations can be given for specific materials and operations.
Classification for turning was mainly based on cutting performance at 15 minutes tool life, with a PVD-TiN coated tool (GC1015MF). The results for the mixes from the
Table 1. Description and classification of three groups of P/M materials investigated in turning performance tests.
Machina-bility
groups
Ferrite(%)
Tensile strength (MPa)
Hardness(HV10)
Elong.(%)
Iron base
ASC100.29 100 180 50 16
ASC100.29 + 0,45% P 100 400 100 12
ASC100.29 + 2% Cu 100 280 70 10
ASC100.29 + 2% Cu + 0,25% C 85 400 120 5.4
ASC100.29 + 2% Cu + 0,5% C 30 490 130 4.3
ASC100.29 + 2% Cu + 0,8% C 1 600 150 3.4
Diffusion bonded
Distaloy AE (4% Ni, 1,5% Cu, 0,5% Mo) 90 360 100 8
Distaloy AE (4% Ni, 1,5% Cu, 0,5% Mo) + 0,25% C 35 550 160 4
Distaloy AE (4% Ni, 1,5% Cu, 0,5% Mo) + 0,5% C 8 620 200 2.6
Distaloy AE (4% Ni, 1,5% Cu, 0,5% Mo) + 0,8% C 2 590 230 2
Pre-alloyed with 1,5% Mo
Astaloy Mo + 0,5% C 500 160 1.8
Distaloy HP (4% Ni, 2% Cu) + 0,5% C <1 900 270 2.2
2.
Classification of P/M Materials for Turning
53
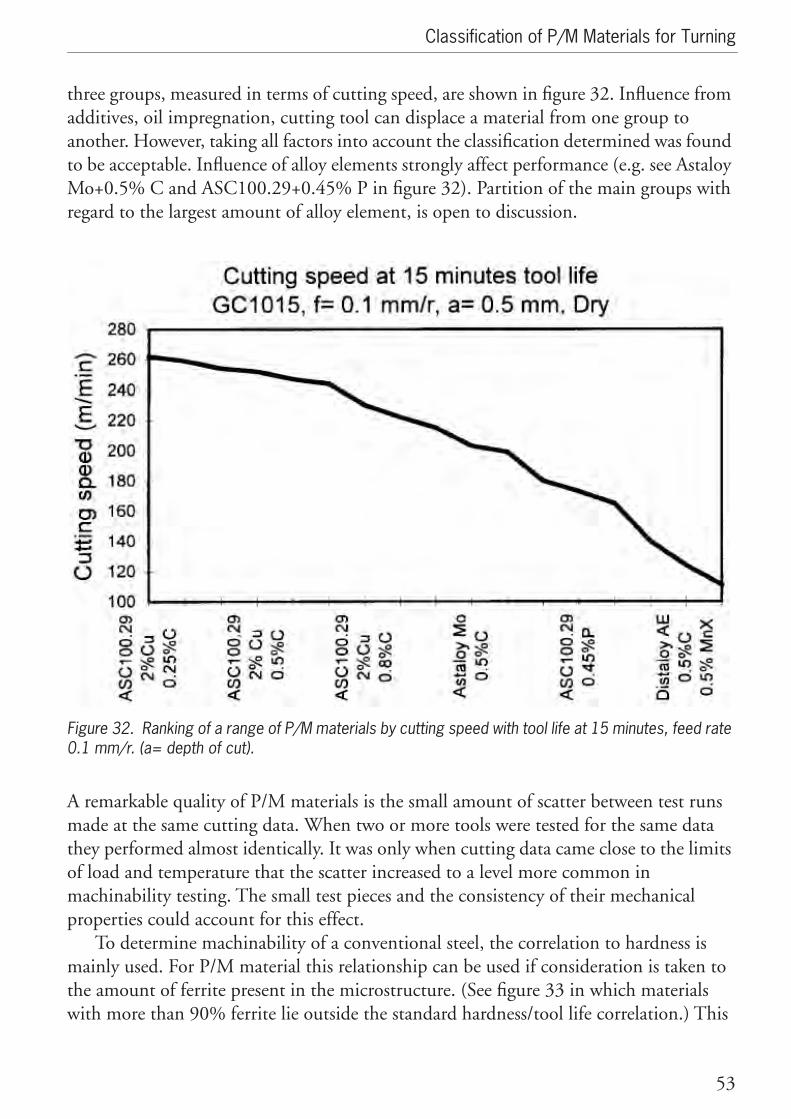
three groups, measured in terms of cutting speed, are shown in figure 32. Influence from additives, oil impregnation, cutting tool can displace a material from one group to another. However, taking all factors into account the classification determined was found to be acceptable. Influence of alloy elements strongly affect performance (e.g. see Astaloy Mo+0.5% C and ASC100.29+0.45% P in figure 32). Partition of the main groups with regard to the largest amount of alloy element, is open to discussion.
Figure 33. Ranking of a range of P/M materials by cutting speed with tool life at 15 minutes, feed rate 0.1 mm/r. (a= depth of cut).
A remarkable quality of P/M materials is the small amount of scatter between test runs made at the same cutting data. When two or more tools were tested for the same data they performed almost identically. It was only when cutting data came close to the limits of load and temperature that the scatter increased to a level more common in machinability testing. The small test pieces and the consistency of their mechanical properties could account for this effect.
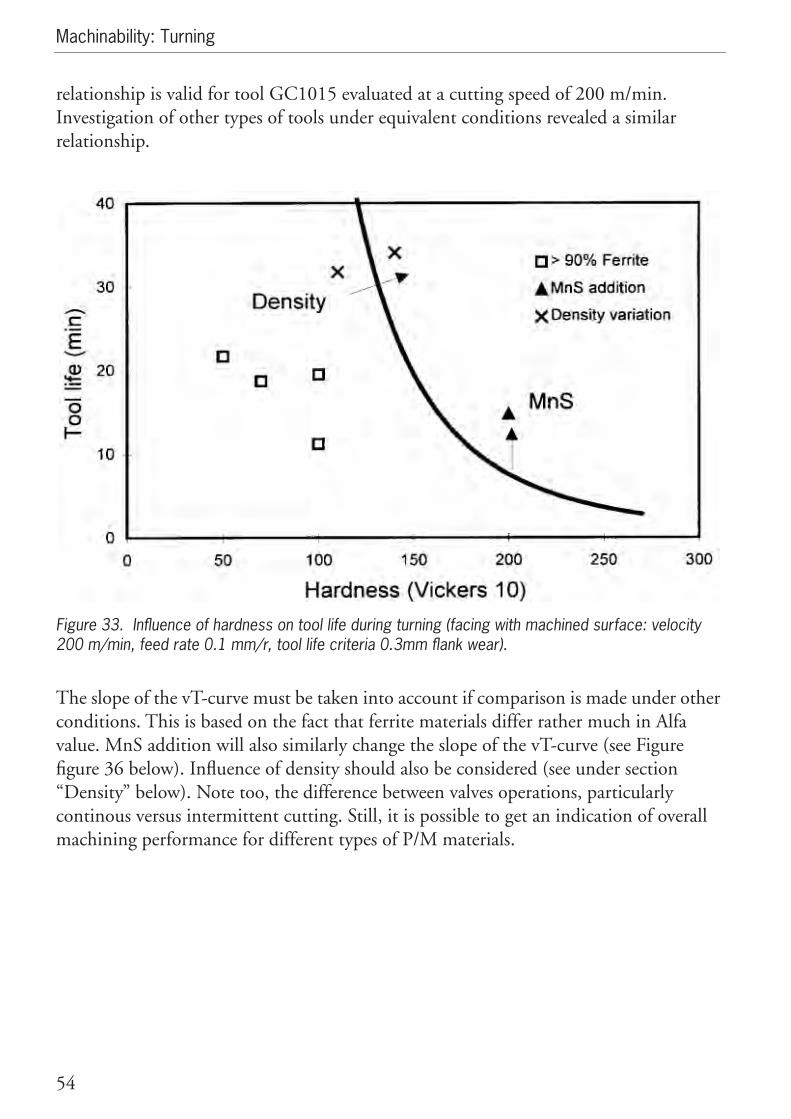
To determine machinability of a conventional steel, the correlation to hardness is mainly used. For P/M material this relationship can be used if consideration is taken to the amount of ferrite present in the microstructure. (See figure 33 in which materials with more than 90% ferrite lie outside the standard hardness/tool life correlation.) This
32.
Machinability: Turning
54
relationship is valid for tool GC1015 evaluated at a cutting speed of 200 m/min. Investigation of other types of tools under equivalent conditions revealed a similar relationship.
Figure 34. Influence of hardness on tool life during turning (facing with machined surface: velocity 200 m/min, feed rate 0.1 mm/r, tool life criteria 0.3mm flank wear).
The slope of the vT-curve must be taken into account if comparison is made under other conditions. This is based on the fact that ferrite materials differ rather much in Alfa value. MnS addition will also similarly change the slope of the vT-curve (see Figure figure 36 below). Influence of density should also be considered (see under section “Density” below). Note too, the difference between valves operations, particularly continous versus intermittent cutting. Still, it is possible to get an indication of overall machining performance for different types of P/M materials.
33.

Influence of material, properties and machining processes
55
3.4 Influence of material, properties and machining processes
This section deals with the main material and process influences on machinability, particularly in relation to turning.
Alloy elements The diffusion rate during sintering can be used as an indication of machining performance for P/M materials. Sintered plain iron has a ferritic iron particle. If copper, phosphorous, nickel or molybdenum, et cetera, is added, the central part of the iron particle is also ferritic, due to the slow diffusion rate of these alloying elements in the iron lattice at the investigated sintering condition. A zone is formed around the central part of the iron particle (see micrographs in Chapter 2). As a consequence of this ferritic microstructure, machinability is decreased.
The amount of ferrite present in the microstructure of a P/M material roughly states its machining performance. (See Table 2 for proportions of ferrite in a range of mixes). Ferrite in amounts of 90% or more can act as a rule of thumb to indicate decreased performance, relative to the hardness correlation (cf. figure 33).
Contrary influences of carbon addition Interstitial elements like carbon generally diffuse very rapidly in the iron lattice. As a consequence pearlite forms in the central part of the iron particle. This structure, from a machining point of view, is “easy” to work with. Depending on the type of tool and machining operation, an optimum amount of carbon can be stated for particular materials.
In figure 34 the influence of carbon is shown for two mixes (viz. Distaloy AE and ASC100.29+2% Cu). It is apparent that these two materials have distinct, but very differing, optimum levels of carbon content in relation to effect on tool life during cutting.

Machinability: Turning
56
Figure 35. Influence on tool life in a cutting operation of carbon content in two materials (i.e. Distaloy AE and ASC100.29 +2%Cu). Tool: GC1015MF; velocity: 150m/min; feed rate: 0.1 mm/r).
In turning ASC100.29+2% Cu without carbon addition, the influence from the proportion of ferrite is obvious. But note that as the amount of added carbon is increased beyond 0.25%, tool life decreases towards that occurring without added carbon. Regarding the effect on Distaloy AE, the same positive influence from carbon addition could be expected due to the fact that the microstructure contains 95% ferrite, but this is not the case. The hardness of Distaloy AE is 100 (HV10); deviation from the hardness relationship shown in figure 33 is apparent. Amount of martensite increases with carbon addition. This particular phase can explain the decrease in machinability for the Distaloy™ grade when any amount of carbon is added.
OxidesSurface oxides which are more or less present in P/M materials clearly influence machining performance. The influence of oxides is well known for conventional material [Ref 1]. Oxides present in the workpiece structure cause notch wear. Turning the ‘skin’ surface of an oxidized component causes a sharp notch to immediately form on a new tool.
34.

Influence of material, properties and machining processes
57
AdditivesInvestigations of the influence of additives on turning are detailed here. Based on its negligible effect on mechanical properties, MnS additive has been investigated regarding performance in continuous and intermittent cutting. For the test of intermittent cutting, turning of a synchronizing hub was used (see figure 35).
Figure 36. Synchronizing hub component turned with intermittent cutting, as used in tests of MnS addition to P/M materials.
The effect of MnS can be interpreted according to different ‘roles’ it can play [Ref 1]. In particular it can:1. Reduce strain on the shear plane during chip formation. 2. Increase tool face friction.An intermittent cutting test of a hub component (pictured above) found that MnS added to a Distaloy AE+0.5% C mix gave substantially longer tool life irrespective of changes in cutting speed (see figure 36).
35.

Machinability: Turning
58
Figure 37. Influence on tool life of MnS addition to a Distaloy™ mix, compacted as a hub component and turned intermittently with a GC3025 tool, shown as vT-curves. Feed rate 0.1 mm/r; depth of cut 0.5 mm; entry angle 95°; dry cutting; criterion: Vb of =0.25 mm.
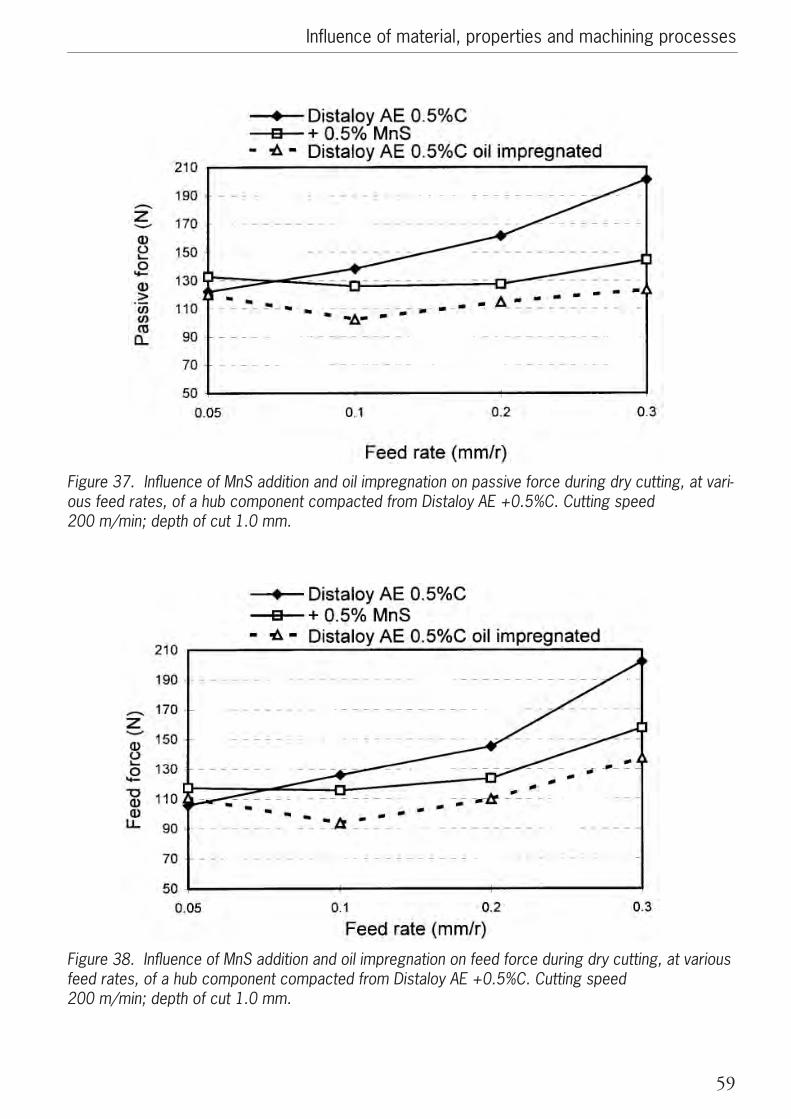
One possible explanation for the large effect found in the cutting operation described above is reduced strain in the shear plane as a result of added MnS. Tests of the forces acting on the cutting tool were conducted with a comparison of MnS addition, and oil impregnation, of Distaloy AE+0.5% C. Figure 37, figure 38, and figure 39 show the values found for passive force, feed force, and main force, respectively. The effect of MnS on a continuos cutting operation is shown in figure 40.
36.
Influence of material, properties and machining processes
59
Figure 38. Influence of MnS addition and oil impregnation on passive force during dry cutting, at vari-ous feed rates, of a hub component compacted from Distaloy AE +0.5%C. Cutting speed 200 m/min; depth of cut 1.0 mm.
Figure 39. Influence of MnS addition and oil impregnation on feed force during dry cutting, at various feed rates, of a hub component compacted from Distaloy AE +0.5%C. Cutting speed 200 m/min; depth of cut 1.0 mm.
37.
38.
Machinability: Turning
60
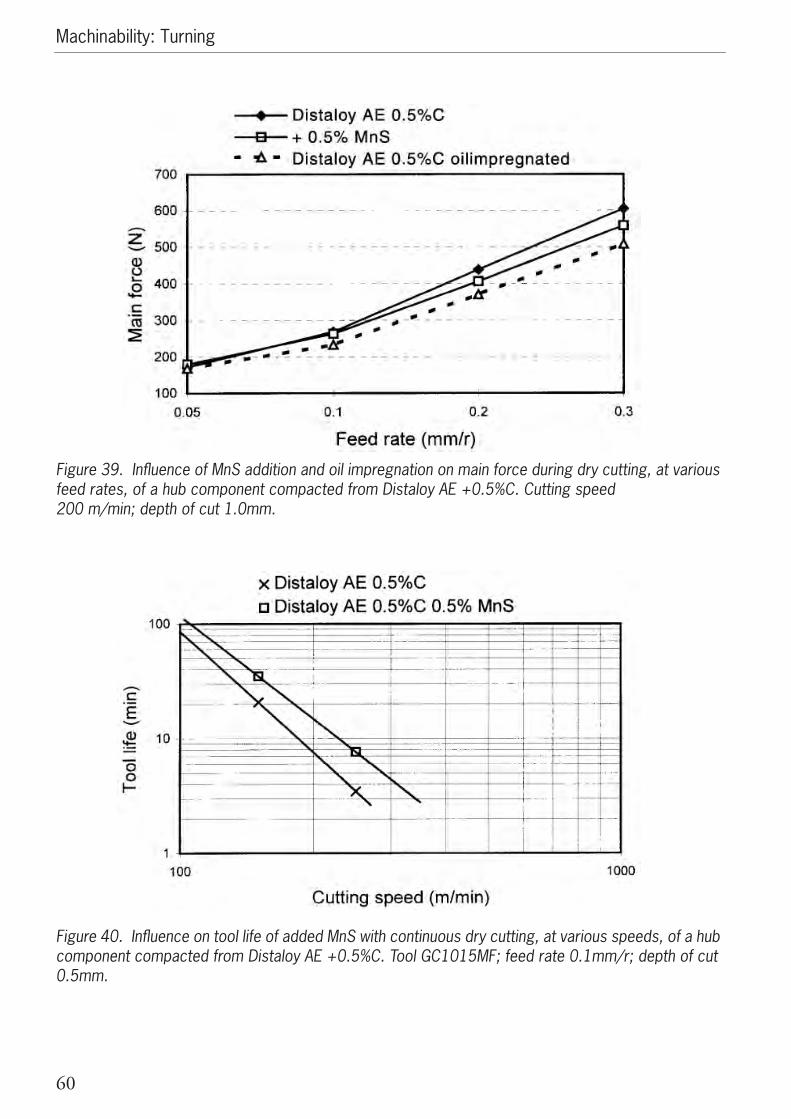
Figure 40. Influence of MnS addition and oil impregnation on main force during dry cutting, at various feed rates, of a hub component compacted from Distaloy AE +0.5%C. Cutting speed 200 m/min; depth of cut 1.0mm.
Figure 41. Influence on tool life of added MnS with continuous dry cutting, at various speeds, of a hub component compacted from Distaloy AE +0.5%C. Tool GC1015MF; feed rate 0.1mm/r; depth of cut 0.5mm.
39.
40.

Influence of material, properties and machining processes
61
In summary regarding the above tests, we can see that increased cutting speeds give an increase in the MnS benefit. This can be expected if the strain on the shear plane is reduced, as appears the case according to the force tests. Increased feed rates reveal an interesting effect. Added MnS actually decreased tool life at a feed rate of 0.2 mm/r, while at 0.3 mm/r the effect from MnS was negligible (see figure 41).
Figure 42. Influence of feed rate on tool life with continuous dry cutting of a hub component com-pacted from Distaloy AE +0.5%C, and with alternatively, added MnS, and oil impregnation. Tool GC1015MF; cutting speed 200m/min; depth of cut 0.5mm.
The reason for the result shown in figure 41 is not clear. The influence of MnS on built up edge (BUE) could be one explanation for the negative outcome at feed rate 0.2 mm/r. Surface roughness (Ras /Ral) measurements with MnS addition reveal higher values compared with no addition. This indicates that a BUE is formed on the tool. To solve this the temperature on the tool must be changed. This can be achieved by increased cutting speed or by alternative tool selection. Use of cutting fluid could avoid BUE formation, but cutting fluid is not recommended for turning of P/M materials. This situation demonstrates how complex determinations of machinability can be due to the interaction of several mechanisms which occur simultaneously during a particular operation. (See below for more on surface roughness, Section 3.5)
DensityThe influence of density on tool life is shown in Table 3. This investigation was made with ASC100.29+2% Cu+0.5% C in the density range 6.7 to 7.1 g/cm3.
41.

Machinability: Turning
62
Improvement with longer tool life was achieved at higher densities. This is despite an increase in hardness which logically should act in the opposite direction (see figure 33). The effect of variation in the density range 6.7 to 7.1 g/cm3 is small. Evaluation of cutting forces revealed no significant difference with the investigated mix.
The influence of feed rate revealed improved tool life for high densities at higher feed rates (in tests with the same ASC100.29+2% Cu+0.5% C workpieces). The increase in tool life was apparent when the feed rate was increased above 0.2 mm/r, particularly with the material of density 7.1g/cm3 (see figure 42). This result suggests that vibrations may be a negative influence on cutting performance.
Figure 43. Influence of density on tool life with turning, at three feed rates, of ASC100.29+2% Cu+ 0.5% C compacted and sintered to densities of 6.7, 7.0 and 7.1 g/cm3.
CoolantUse of coolant during cutting is common with conventional steel. The situation is different with P/M materials since those have pores in the micro structure. Porosity combined with the presence of water can be detrimental to mechanical properties due to the resulting oxidation. The effect on performance in cutting a Distaloy AE+0.5% C
Table 2. Influence of density on tool life with ASC100.29+2%Cu+0.5%C, at cutting speeds of 200 and 300 m/min.
Cutting speed (m/min)Density
6.7 g/cm3
Density7.0 g/cm3
Density7.1 g/cm3
200 31.8 min. 33.3 min. 34.1 min.
300 7.6 min. 9.6 min. 8.5 min.
3.
42.

Influence of material, properties and machining processes
63
alloy when dry, wet, and dry with oil impregnation, is shown in figure 43. Flank wear increased markedly with continued wet cutting; oil impregnated workpieces cut dry performed somewhat better than dry-cutting. An obvious conclusion is that applied liquid is detrimental for turning of P/M material.
Figure 44. Influence on cutting performance (in flank wear) of applied liquid, and oil impregnation, with turning of Distaloy AE 0.5%C. Tool: GC1015 MF; cutting speed 200m/min; feed rate 0.1 mm/r; depth of cut: 0.5 mm.
The obvious deterioration in tool performance with cutting fluid can be traced back to the severe thermo-mechanical load cycle associated with the test mode. When cutting fluid is introduced to machining of P/M materials, the effects can include:
• Severe fluctuations in the tool temperature due to the better heat transfer characteris-tics of the water based cutting fluid, leading to severe thermal cycling.
• Probable reaction between wet workpieces and the atmosphere during the interrup-tion period of the machining cycle.
Oil impregnation Internal lubrication on the cutting edge is possible with P/M technology, an advantage it can offer compared with conventional steels. Porous P/M materials can be readily oil impregnated to good effect, as shown in the above tests. Improvement in dry cutting by a factor between 1.48 and 2.21 was achieved at various feed rates with oil impregnation of Distaloy AE +0.5% C (see figure 41). This can be explained by the reduction in cutting forces as found in the tests with Distaloy AE alloys, discussed above in Section 3.3 (see figure 37, figure 38 and figure 39).
43.
Machinability: Turning
64
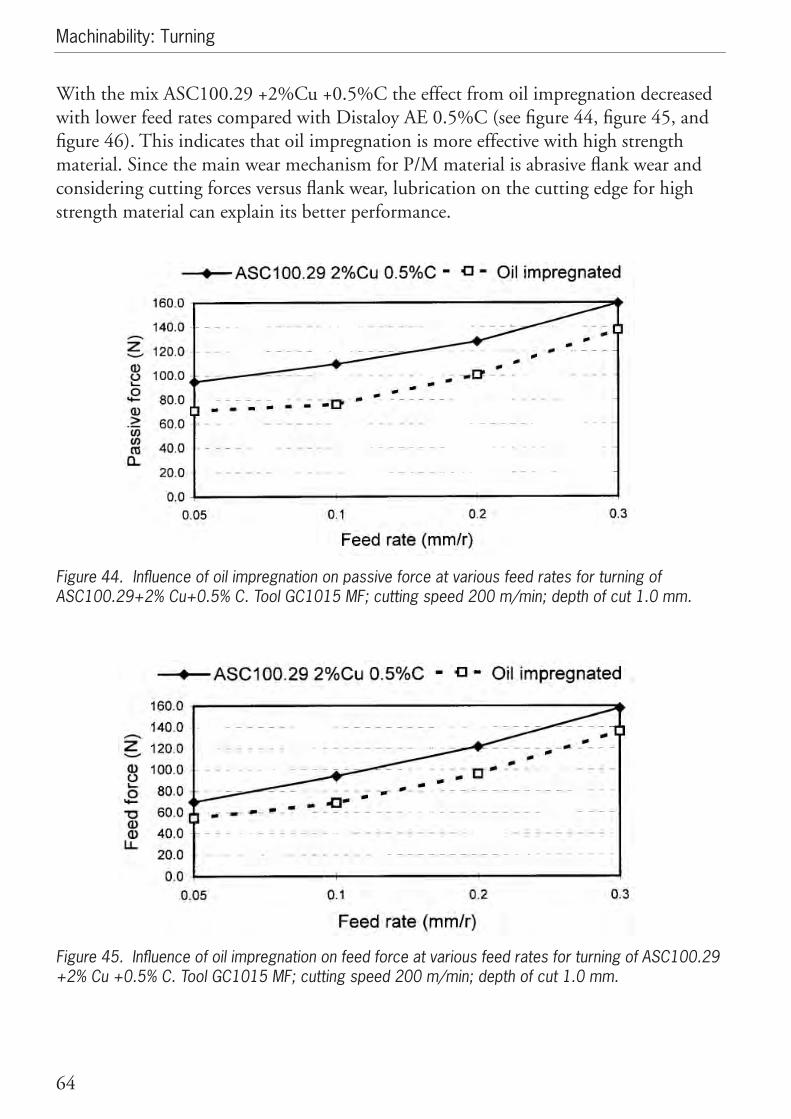
With the mix ASC100.29 +2%Cu +0.5%C the effect from oil impregnation decreased with lower feed rates compared with Distaloy AE 0.5%C (see figure 44, figure 45, and figure 46). This indicates that oil impregnation is more effective with high strength material. Since the main wear mechanism for P/M material is abrasive flank wear and considering cutting forces versus flank wear, lubrication on the cutting edge for high strength material can explain its better performance.
Figure 45. Influence of oil impregnation on passive force at various feed rates for turning of ASC100.29+2% Cu+0.5% C. Tool GC1015 MF; cutting speed 200 m/min; depth of cut 1.0 mm.
Figure 46. Influence of oil impregnation on feed force at various feed rates for turning of ASC100.29 +2% Cu +0.5% C. Tool GC1015 MF; cutting speed 200 m/min; depth of cut 1.0 mm.
44.
45.

Influence of material, properties and machining processes
65
Figure 47. Influence of oil impregnation on main force at various feed rates for turning of ASC100.29 +2% Cu+0.5% C. Tool GC1015 MF; cutting speed 200 m/min; depth of cut 1.0 mm.
46.

Machinability: Turning
66
3.5 Surface Finish
An important quality outcome of machining is surface finish, and in particular, degrees of roughness of turned surfaces. The influence of various P/M parameters and machining conditions was investigated to determine influences on surface roughness.
Machined P/M items were tested for surface profiles using a Rodenstock RM600 laser measuring station. Ra values were evaluated using two combinations of cut-off lengths (Lc) and measuring lengths (L), each set reflecting one range of the surface roughness. The small Lc of 0.025 mm (L = 1 mm) was four times less than the feed level. Ra values from this run describe the surface between the feed marks according to micro surface roughness, while the standard parameter set of Lc = 0.8 mm, L = 5.6 mm, includes the feed marks in the roughness test and gives an idea of the macro surface roughness (Ral). See figure 47.
The tool used in the surface roughness investigation was a CNMG 120408, PVD-TiN coated HM with the depth of cut set at 0.5 mm.
Figure 48. Schematic structure of turned metal surface profile, indicating dimensions of Ral and Ras measures of surface roughness.
Surface roughness and feed rate Assessment in mean values of all 12 P/M materials included in the turning tests (see Table 2), showed a decrease in surface roughness within single feed marks (Ras), with increased feed rates. The variation (max.- min., excluding extreme values) for Ras is shown in figure 48. The variation in micro surface roughness decreased with increased feed rate.
Influence from the tool on surface roughness can be described by Ral. As a result of increased feed rates, macro surface roughness (Ral) will increase (see figure 48).
A conclusion regarding the influence of feed rates on surface roughness is that the possibility of using a high feed rate is limited by the tool geometry. To obtain the required limit in surface roughness, an additional machining operation is needed in many cases.
47.

Surface Finish
67
Figure 49. Influence of feed rate on micro (Ras) and macro (Ral) surface roughness of various cut off lengths of P/M material. Tool: CNMG 120408 MF, GC 1015; cutting speed 200 mm/m; depth of cut 0.5 mm.
Surface roughness and cutting speed Tests of the influence of cutting speed on surface roughness revealed that at speeds of 100-120 m/min, roughness was minimal. These tests were made with a feed rate of 0.1 mm/r. When turned at this rate and at speeds above 100 m/min, all 12 investigated P/M materials had surface roughness of less than 0.4 µm (Ras) and 0.9 µm (Ral), as shown in figure 49.
Figure 50. Influence of cutting speed on micro (Ras) and macro (Ral) surface roughness of various cut off lengths of P/M material. Tool: CNMG 120408KF, CVD-TiN coated HM.
48.
49.

Machinability: Turning
68
3.6 Cutting Forces
Cutting forces were measured for a range of 18 P/M materials turned with a GC1015MF tool at three feed rates (viz. 0.1, 0.2 and 0.3 mm/r). In addition, a special study was made of the influence of oil impregnation on two P/M materials: Distaloy AE+0.5% C and ASC100.29+2% Cu+0.5% C. A minor test was conducted showing the influence of increasing tool wear. It is important to consider the effect of tool wear in regard to cutting forces when reviewing the following tests since they were all done with new tools. The 18 materials investigated for cutting forces are listed in Table 4.
The variation in cutting forces during turning of Material P (Distaloy AE +0.5% C) are shown in figure 50.
Table 3. Key to materials in figure 51: 18 materials as investigated for tests of cutting forces.
Key MaterialA ASC100.29
B ASC100.29+2% C
C Distaloy AE
D ASC100.29+2% Cu+0.25% C
E ASC100.29+2% Cu+0.5% C, ρ: 7.1 g/cm3
F ASC100.29+0.45% P
G ASC100.29+2% Cu+0.5% C, ρ: 6.7 g/cm3
H ASC100.29+2% Cu+0.8% C
I Reference: OVAKO 234S (16MnCr5)
J Astaloy Mo+0.5% C
K ASC100.29+2% Cu+0.5% C, ρ: 7.0 g/cm3
L Distaloy AE+0.5% C, oil impregnated
M ASC100.29+2% Cu+0.5% C, ρ: 7.0 g/cm3 (second evaluation)
N Distaloy AE+0.25% C
O Distaloy AE+0.5% C+0.5% MnS
P Distaloy AE+0.5% C
Q Distaloy AE+0.8% C
R Distaloy HP+0.5% C
4.

Cutting Forces
69
Figure 51. Passive, feed and main force, in raw values, for Distaloy AE with 0,5% C material turned with a GC1015MF tool at a speed of 200 m/min and feed rate at 0.1 mm/r.
Variation in mean cutting forces Mean values were calculated for each cutting force at each of three feed rates (0.1, 0.2 and 0.3mm/r). When the mean cutting forces are compared at each feed level the differences between the materials are small. The force values are closely related to hardness, above a certain hardness level, and the ranking for all three force dimensions is very similar with only the hardest materials (viz., Distaloy HP+0.5% C, Distaloy AE+0.8%C and Distaloy AE+0.5% C) being distinct with considerably higher forces. Among the remainder of the materials shown in figure 51, ASC100.29, ASC100.29+2% Cu and Distaloy AE gave the lowest cutting forces.
Figure 52. Mean cutting force values for 18 P/M materials turned with a GC1015MF tool at a speed of 200 m/min and feed rate at 0.1 mm/r. See Table 3.
50.
51.4.

Machinability: Turning
70
The variation in the force at steady state is of interest if it differs between materials, creating a significant amplitude in forces and possibly higher maximum forces and increased fatigue loads. The variation in the forces was evaluated as the standard deviation at steady state.
The oscillation in the cutting forces at steady state was greater for the P/M materials than for the wrought reference material, OVAKO 234S (16MnCr5). Measured as the standard deviation, the oscillation was about 10 to15 % of the mean value, at the feed levels 0.05 and 0.1 mm/r for all three force dimensions. At a feed rate of 0.1 mm/r, the variation in absolute values was almost the same for all P/M materials. A force level closer to the maximum measured force was evaluated by adding the scatter to the mean value. However the rank order of the materials shown in figure 51 was not altered.
For the higher feed rates (0.2 and 0.3 mm/r), the scatter in the feed force and passive force can become considerable, in some instances up to 30 or 40% of the mean value while it remains at 10 to 15% of the mean value for the main cutting force.
Hardness and cutting forces Cutting forces were found to be relatively limited (in the range 70-110 N) for all but the hardest materials. Figure 52 shows the relationship between hardness and cutting forces Fx (feed force) and Fy (radial or passive force) for a range of P/M materials. The curve for each cutting force is almost horizontal, except for the two hardest materials.
Of the three force dimensions, passive force shows the clearest differences between materials. Feed force also shows material dependent variations, while with main cutting force (Fz) there is only quite small differences between materials.
Figure 53. Influence of hardness on feed force (Fx) and passive force (Fy) for a range of P/M materials.
52.

Cutting Forces
71
Tool wear and passive force Of the three cutting forces, passive force is most effected by increased tool wear. It can surpass both the feed force and the main cutting force, when the flank wear reaches a certain level, as shown in figure 53. (See Section 3.2 for types of tool wear.)
Figure 54. Influence of flank wear on three dimensions of cutting force during dry turning of Distaloy AE+0.5% C. Tool GC1015MF, velocity 200 m/min, depth of cut 0.5 mm.
The strong influence of flank wear seems to be very apparent in these tests of P/M materials with a cutting situation of small cutting depths and lower feed rates, during radial turning. It is also consistent with general principles which stress the importance of a sharp tool edge.
Increased feed rates lead to increased cutting forces. With a higher feed rate, the absolute and relative increase in forces is greater for the main cutting force, than for feed force and passive force. However, when considering differences between materials, comparisons show up most clearly with passive force and feed force.
Influence of changes in feed rate Cutting forces were measured for the 18 materials listed above with feed rates varied from 0.05 mm/r to 0.30 mm/r. Figure 54, figure 55 and figure 56 show the mean force measurements for feed, passive and main forces, respectively. All tests were for dry cutting with tool GC1015MF.
Some of the P/M materials have shown particularly good results with higher feed rates, in terms of reduced wear and longer tool life, while also producing improved surface finish. Therefore it is interesting to investigate how the cutting forces are altered with increased feed rates. It is possible, for example, to determine if a smaller than
53.

Machinability: Turning
72
average increase can be correlated with a greater than average increase in tool life. This is indicated by a steady incline in the curve (i.e. less change in values) in these three figures. The distribution of the forces on the cutting edge is altered when the feed is increased.
Figure 55. Influence of feed rate on feed force for eight Distaloy materials and the reference OVAKO 234S (16MnCr5). Dry cutting with tool GC1015MF; cutting speed 200 mm/min.Materials: a= Distaloy HP+0.5% C, b= Distaloy AE+0.8% C, c= Distaloy AE+0.5% C, d= Reference OVAKO 234S (16 MnCr5), e= Distaloy AE, f= Astaloy Mo+0.5% C, g= Distaloy AE+0.5% C+ 0.5% MnS, h= Distaloy AE+0.25% C, i= Distaloy AE+0.5% C, oil impregnated.
54.

Cutting Forces
73
Figure 56. Influence of feed rate on passive force for eight Distaloy materials and the reference OVAKO 234S (16MnCr5). Dry cutting with tool GC1015MF; cutting speed 200 mm/min.Materials: a= Distaloy HP+0.5% C, b= Distaloy AE+0.8% C, c= Distaloy AE+0.5% C, d= Reference OVAKO 234S (16 MnCr5), e= Distaloy AE, f= Astaloy Mo+0.5% C, g= Distaloy AE+0.5% C+0.5% MnS, h= Distaloy AE+0.25 C, i= Distaloy AE+0.5% C, oil impregnated.
Figure 57. Influence of feed rate on mainforce for eight Distaloy materials and the reference OVAKO 234S (16MnCr5). Dry cutting with tool GC1015MF; cutting speed 200 mm/min.Materials: a= Distaloy HP+0.5% C, b= Distaloy AE+0.8% C, c= Distaloy AE+0.5% C, d= Reference OVAKO 234S (16 MnCr5), e= Distaloy AE, f= Astaloy Mo+0.5% C, g= Distaloy AE+0.5% C+ 0.5% MnS, h= Distaloy AE+0.25 C, i= Distaloy AE+0.5% C, oil impregnated.
56.
55.

Machinability: Turning
74
Estimated friction on rake face The ratio between the feed force and the main force varies with increased feed rate during cutting of the different materials. The change in ratio across four feed rates is shown in figure 57.
The ratio between feed and main forces can be used as a very rough estimate of the friction on the rake face. At f = 0.05 where the edge radius constitutes a great part of the contact length on the tool, the Fx/Fz ratio is quite high, between 0.5 and 0.9. As the feed is increased more and more force is distributed to the rake face and purely geometrical factors make the curves look very similar for all materials. The relative difference between the materials is however maintained and thus should somehow be material related.
It is interesting to note the beneficial effect on this estimated friction with the MnS and oil impregnated materials, where especially the latter gives a substantial decrease at the highest feed rate. The lowest feed rate (0.05 mm/r) is clearly at the limit of the useful feed range and was not included in subsequent evaluations.
Figure 58. Influence of feed rate on the relationship between feed and main forces, during cutting of a range of P/M materials. Two of the hardest materials, Distaloy HP+0.5% C and Distaloy AE+ 0.8% C, are indicated.
57.

Cutting Forces
75
Influence of feed rate on passive force The 18 materials investigated in the tests of cutting forces were ranked according to absolute increase in passive force when feed rate was increased from 0.1 to 0.3 mm/r. This rank is given in figure 58, with the relative increase in passive force. See Table 5 for key to the materials as ranked from this test.
The materials showing the largest absolute force increase when the feed rate was increased from 0.1mm/r to 0.3mm/r were Distaloy HP+0.5% C, ASC100.29 and ASC100.29+2% Cu. To some extent the low density material ASC100.29+2% Cu+ 0.5% C (density 6.7 g/cm3), showed a different behaviour to the other ASC100.29+ 2% Cu +0.5% C variants. The Distaloy HP+0.5% C material is unique in that it had such high cutting forces and absolute increases in passive force. This effect was even more evident with main and feed force. The two machinability enhanced materials (i.e. oil impregnated and MnS added) and Distaloy AE+0.25% C showed the lowest absolute increases in passive force, much less than the Distaloy AE+0.5% C.
Figure 59. Influence of increased feed rate in terms of relative and absolute increases in passive force during turning of 18 materials, including reference. (See Table 5 for key to materials as ranked in this test.)
ABC
EFGHI
D
JKL
R
MNOPQ
58.

Machinability: Turning
76
Increase in passive force and tool life When the relative increase in the number of cuts before tool failure was plotted against the relative increase in passive force, most of the materials showed predictable behaviour. Values for a range of P/M materials, the reference OVAKO 234S (16MnCr5), and pure ferrite are shown in figure 59.
With greater increases in passive force there is a ‘reasonable’ reduction in tool life for nearly all the P/M materials tested. A few fall out of the normal range found with these materials. The high ferrite variants of ASC100.29 and Distaloy AE show increasing tool life with increased passive force. ASC100.29+2% Cu+0.5% C and ASC100.29+2% Cu +0.8% C both perform similarly to the wrought reference material.
Table 4. Key to P/M materials investigated for cutting forces, as ranked in figure 58 (above).
Key MaterialA Distaloy AE+0.5% C+0.5% MnS
B Distaloy AE+0.5% C
C Distaloy AE+0.25% C
D ASC100.29+2% Cu+0.8% C
E ASC100.29+2% Cu+0.5% C
F ASC100.29+2% Cu+0.5% C (second evaluation)
G Reference: OVAKO 234S (16MnCr5)
H Astaloy Mo+0.5% C
I Distaloy AE+0.5% C
J ASC100.29+2% Cu+0.5% C, ρ: 7.1 g/cm3
K Distaloy AE
L Distaloy AE+0.8% C
M ASC100.29+0.45% P
N ASC100.29+2% Cu+0.25% C
O ASC100.29+2% Cu
P ASC100.29
Q ASC100.29+2% Cu+0.5% C, ρ: 6.7 g/cm3
R Distaloy HP+0.5% C
5.

Cutting Forces
77
Figure 60. Relative tool life as a function of relative increase in passive force for a range of P/M mate-rials, indicating the ‘normal’ behaviour curve (with exceptions Distaloy AE, ASC100.29 variants and the wrought reference material).
Influence of carbon content The proportion of carbon content in P/M materials is known to be critical to machinablity. Figure 60, figure 61 and figure 62 show the effect of carbon content on passive force for a range of feed rates. With ASC100.29+2% Cu, carbon content variants showed a clear ranking at f=0.1mm/r (see figure 60). With increased feed rate the rank order was completely reversed (cf. values at f=0.1 and f=0.3 mm/r). This effect was not the case for the Distaloy AE carbon variants (see figure 61) where the carbon free Distaloy AE has a slightly higher increase but not enough to alter the fact that a higher carbon content (and hardness) gives a higher passive force. The ranking of materials with the same carbon level (0.5%) but different microstructures and hardness levels, remains the same at 0.3 as for 0.1 mm/r with the harder materials giving higher passive forces (see figure 62).
59.

Machinability: Turning
78
Figure 61. Effect of carbon content on passive force at three feed rates for cutting of ASC100.29 + 2% Cu.
Figure 62. Effect of carbon content on passive force at three feed rates for cutting of Distaloy AE.
Feed rate (mm/r)
60.
61.

Cutting Forces
79
Figure 63. Influence of feed rate on passive force at three feed rates for cutting of five materials of various hardness and microstructure. Materials: A= Distaloy HP+0.5% C, B= Distaloy AE+0.5% C, C= ASC100.29+2% Cu+0.5% C, D= Astaloy Mo+0.5% C, E= Reference OVAKO 234S (16 MnCr5).
Influence of alloysPassive forces were investigated in relation to ASC100.29 variants which included copper and phosphorus. The differences between the pure ferrite material with and without additions (2%Cu or 0.45%P) were very small (see figure 63). All three variants gave great increases in the cutting force with increased feed rates. The hardest material showed the smallest increase. However, the increased forces do not seem to influence the tool life or surface finish in any negative way with these variants.
Figure 64. Influence on passive force of addition of copper and phosphorus to ferrite material, at three feed rates. (Key to materials: A = ASC100.29; B = ASC100.29+0.45% P; C = ASC100.29 + 2% Cu.)
62.
63.

Machinability: Turning
80
Influence of density Increased density did not influence the cutting forces in any clear way over the interval of feed rates investigated (see figure 64). The density variant (d=6.7, Hv=110) showed a greater increase than harder, high density variants.
Figure 65. Influence of density on passive force during cutting of ASC100.29+2% Cu+0.5% C, at three feed rates.
Machinability enhancement Machinability enhancing additive MnS and oil impregnation gave good results, lowering cutting forces considerably at f=0.1 mm/r. The effect was even more accentuated at high feed rates. Oil impregnation was found to be so interesting with regard to tool life and cutting forces that additional testing was performed.
The impregnated variants lead to substantial cutting force reductions as shown in figure 65 and figure 66. The reductions range between 10 and 20% and seem to increase with higher feed rates for Distaloy AE+0.5% C, while they are reduced for ASC100.29+ 2% Cu+0.5% C when the feed is increased.
64.

Cutting Forces
81
Figure 66. Reduction in cutting forces (in %) with oil impregnation of Distaloy AE+0.5% C. Fx: feed force; Fy: passive force; Fz: main force.
Figure 67. Reduction in cutting forces (in %) with oil impregnation of ASC100.29+2% Cu +0.5% C. Fx: feed force; Fy: passive force; Fz: main force.
65.
66.

Machinability: Turning
82
3.7 Summary: Machining of P/M Materials
The machinability of materials produced with powder metallurgy varies considerably. The various types of P/M materials impose different demands on the cutting edge; some have excellent machinability, while others are rather demanding to machine.
At one end of the scale are materials with high demands in abrasive wear resistance on the tool. Soft low carbon materials are also demanding since they produce a high degree of built up edge formation and smearing on tools, which in turn causes chipping of the edge especially with interrupted cutting.
The pores which are characteristic of P/M materials, give rise to micro-fatigue and poor thermal conductivity. In many cases hard phases occur in a relatively soft matrix, creating very high demands on the tool. Some P/M materials are very sensitive to burr formation.
However, by choosing proper tool material/insert geometry and working with the specific behaviors of P/M materials, in many cases it is possible to reach a productivity level as high as that of standard steel. In order to achieve the best possible machining economics, care must be taken with several specific factors. These are summarized below.
Insert geometry Use a geometry with positive rake and small edge rounding. The smaller the feed, the more important is to ensure appropriate insert geometry. In many cases this applies to interrupted cutting, especially when the selected grade has sufficient toughness.
Cutting tool The type of cutting tool used should be selected carefully. Coated cemented carbide (CVD and PVD) as well as Cermet and CBN (high CBN) tools can be used in P/M machining. CBN should preferably be used with the high abrasive alloys of Distaloy AE and Distaloy HP. Uncoated cemented carbide is seldom the best alternative unless a very low cutting speed is used.
Cutting data Cutting speed recommendations depend upon the grade of tool material used and the type of P/M material being worked. Speeds can range from around 100 m/min for an uncoated grade, up to 500 m/min with CBN.
Selection of feed rate is of utmost importance with P/M materials, more so than with most other workpiece materials in fact. With the exception of high speed applications, in particular CBN, most operations are limited by flank wear development. An increase of feed rate (i.e. chip thickness) does not seem to have any negative effect on flank wear. It seems that flank wear is more dependent on the turned distance. Obviously the highest feed rate possible should be selected; unnecessarily low rates should be avoided.

Summary: Machining of P/M Materials
83
There are now inserts on the market (e.g. Sandvik Coromant WF and WM) which permit an increased feed rate while keeping surface roughness at a low level.
Oil impregnation The use of oil impregnation will invariably improve machinability. Oil impregnation also increases the possibility of obtaining the greatest benefit from wear resistant, coated CVD tools.
CoolantWhenever possible the use of coolant and cutting fluid should be avoided. From a tool-life point of view, it is usually better to machine dry. This is in particularly true with high performance grades such as coated CBN and CVD tools.
Difficult materials It is best to avoid working with pure iron. Whenever possible, include a small portion of carbon which will change the material from one of the worst to one of the best to machine within the P/M group. Have in mind also that a standard low- carbon steel gives rise to problems due to smearing and built up edge. In pure iron there is no carbon (i.e. ‘much less’ than in a low - carbon steel).

Machinability: Turning
84
3.8 Turning tool recommendations and cutting data
Table 5. Recommended Sandvik Coromant insert geometry and grade for turning P/M materials.
3005 3025 5015 1025 H13A
UF X X X X X
UM X X X X X
WF X – X X –
WM X – – X –
KF X X – – –
KM X X – – –
MF – – – X –
6.
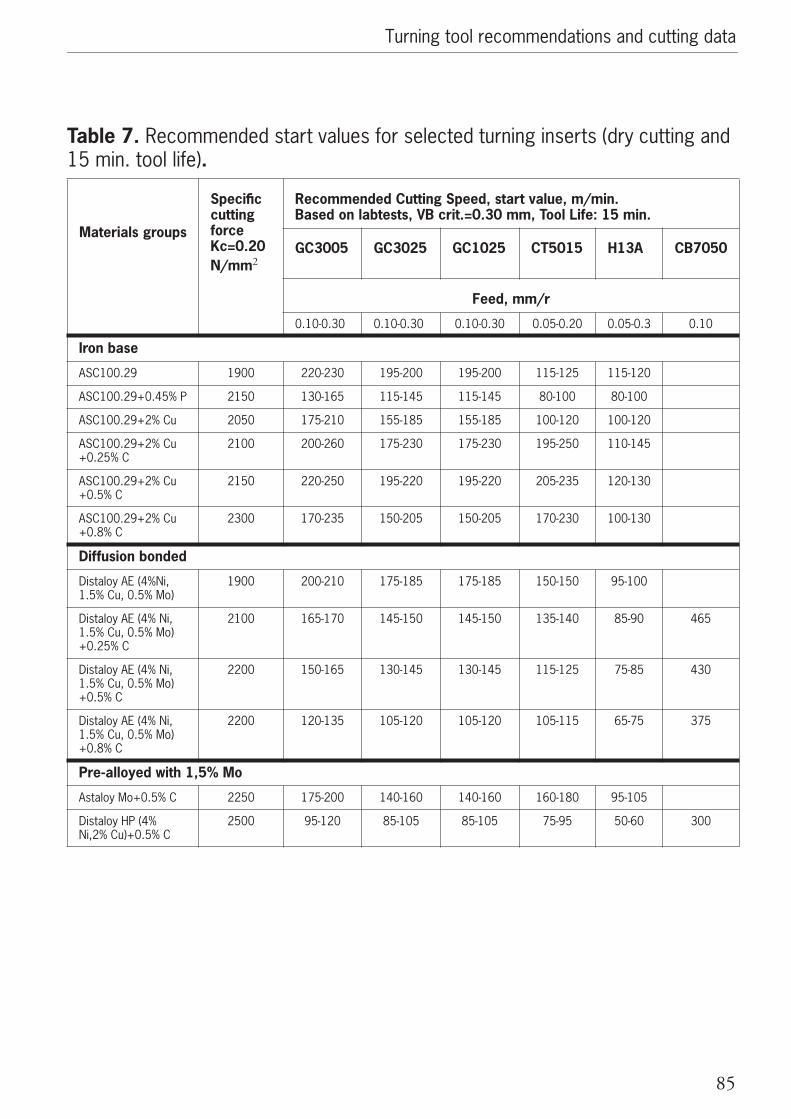
Turning tool recommendations and cutting data
85
Table 6. Recommended start values for selected turning inserts (dry cutting and 15 min. tool life).
Materials groups
SpecificcuttingforceKc=0.20N/mm2
Recommended Cutting Speed, start value, m/min.Based on labtests, VB crit.=0.30 mm, Tool Life: 15 min.
GC3005 GC3025 GC1025 CT5015 H13A CB7050
Feed, mm/r
0.10-0.30 0.10-0.30 0.10-0.30 0.05-0.20 0.05-0.3 0.10
Iron base
ASC100.29 1900 220-230 195-200 195-200 115-125 115-120
ASC100.29+0.45% P 2150 130-165 115-145 115-145 80-100 80-100
ASC100.29+2% Cu 2050 175-210 155-185 155-185 100-120 100-120
ASC100.29+2% Cu +0.25% C
2100 200-260 175-230 175-230 195-250 110-145
ASC100.29+2% Cu +0.5% C
2150 220-250 195-220 195-220 205-235 120-130
ASC100.29+2% Cu +0.8% C
2300 170-235 150-205 150-205 170-230 100-130
Diffusion bonded
Distaloy AE (4%Ni, 1.5% Cu, 0.5% Mo)
1900 200-210 175-185 175-185 150-150 95-100
Distaloy AE (4% Ni, 1.5% Cu, 0.5% Mo) +0.25% C
2100 165-170 145-150 145-150 135-140 85-90 465
Distaloy AE (4% Ni, 1.5% Cu, 0.5% Mo) +0.5% C
2200 150-165 130-145 130-145 115-125 75-85 430
Distaloy AE (4% Ni, 1.5% Cu, 0.5% Mo) +0.8% C
2200 120-135 105-120 105-120 105-115 65-75 375
Pre-alloyed with 1,5% Mo
Astaloy Mo+0.5% C 2250 175-200 140-160 140-160 160-180 95-105
Distaloy HP (4% Ni,2% Cu)+0.5% C
2500 95-120 85-105 85-105 75-95 50-60 300
7.

Machinability: Turning
86

Quality and Performance in Machining
87
4 Drilling
This chapter is written in cooperation with Dormer Tools and IVF. Drilling is a term covering all methods of making cylindrical holes in metal products. The term can be divided into two categories: short hole and deep hole drilling. The difference between the two is not restricted to the relationship between depth and diameter. Parameters such as chip evacuation (i.e. quality and removal rate) also form the basis for differentiating short and long hole drilling methods. The term drilling usually also covers subsequent machining, including reaming, counter boring, and various forms of finishing operations. For P/M components most drilling involves short holes.
Drilling is a combination of two movements: a main rotating motion plus a linear feed motion. With short hole drilling in conventional machines the most usual form of working is that the tool does both rotating and feeding motion. The use of universal NC and CNC controlled lathes for short hole drilling has lead to an increase in the combination of a rotating workpiece and non-rotating drill.
4.1 Quality and Performance in Machining
Approximately 60% of all P/M-derived parts need some kind of machining. Geometric qualities such as annular grooves, threads, undercuts and re-entrant angles, and the demands of tight tolerances, are all reasons which may make a machining operation necessary. It is common in machining of P/M-components to have small metal removal volumes.
A stable set up, the right cutting tool, and accurate cutting data, are all prerequisites for acceptable machining. A stable machine and set up, does not in itself, ensure good machining, but it is essential for work of a consistent quality.
Quality and productivity in machining operations rely on a combination of several factors:
1. Machinability of P/M materials.
2. The machine performance.
3. Tool life: performance and quality of the cutting tool.
See figure 67 for a summary of vital considerations for approved cutting operations, and an indication of the way these factors are related.
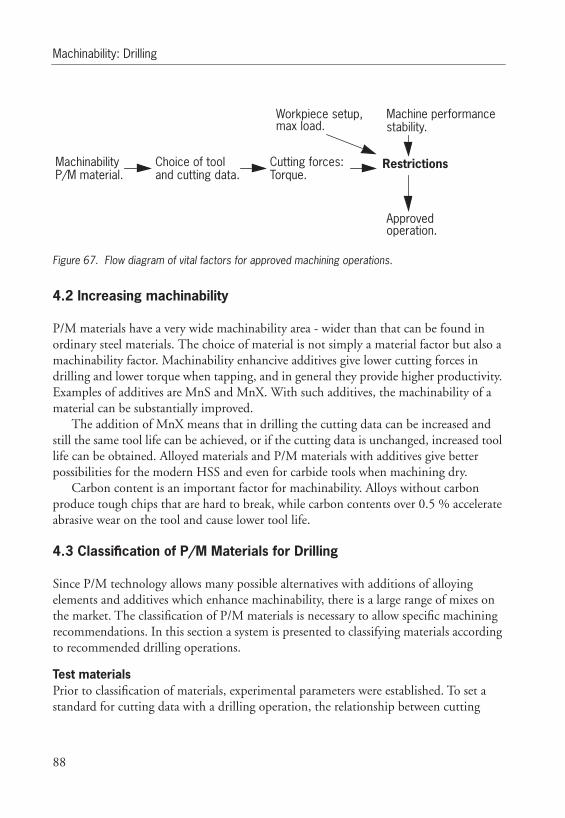
Machinability: Drilling
88
Figure 68. Flow diagram of vital factors for approved machining operations.
4.2 Increasing machinability
P/M materials have a very wide machinability area - wider than that can be found in ordinary steel materials. The choice of material is not simply a material factor but also a machinability factor. Machinability enhancive additives give lower cutting forces in drilling and lower torque when tapping, and in general they provide higher productivity. Examples of additives are MnS and MnX. With such additives, the machinability of a material can be substantially improved.
The addition of MnX means that in drilling the cutting data can be increased and still the same tool life can be achieved, or if the cutting data is unchanged, increased tool life can be obtained. Alloyed materials and P/M materials with additives give better possibilities for the modern HSS and even for carbide tools when machining dry.
Carbon content is an important factor for machinability. Alloys without carbon produce tough chips that are hard to break, while carbon contents over 0.5 % accelerate abrasive wear on the tool and cause lower tool life.
4.3 Classification of P/M Materials for Drilling
Since P/M technology allows many possible alternatives with additions of alloying elements and additives which enhance machinability, there is a large range of mixes on the market. The classification of P/M materials is necessary to allow specific machining recommendations. In this section a system is presented to classifying materials according to recommended drilling operations.
Test materials Prior to classification of materials, experimental parameters were established. To set a standard for cutting data with a drilling operation, the relationship between cutting
MachinabilityP/M material.
Choice of tool and cutting data.
Cutting forces:Torque.
Workpiece setup,max load.
Machine performancestability.
Approvedoperation.
Restrictions
67.

Classification of P/M Materials for Drilling
89
speed and hardness was demonstrated. Test materials were cylindrical plates (∅ 80mm, H = 10mm) compacted to 7.0 g/cm3 produced from the materials indicated below. Density was evaluated at 6.7, 7.0 and 7.3 g/cm3. Carbon enriched components were sintered in endogas with 0.3% CO2, and for carbon-free components dissociated ammonia was used. All components were sintered in a production furnace at GKN Sinter Metals AB, Sweden. Sintering was at 1120°C for 30 minutes. The range of P/M materials investigated is shown in Table 8.
The main drilling evaluation was performed by IVF, Sweden, in a MODIG-CNC machine center. As tool life criteria, total failure of the drill was used [Ref. 1]. For the main investigation a drill diameter of 4 mm was used. Performance was evaluated in dry condition (no cutting fluid applied), unless otherwise stated. In all evaluations the vT-curve test was used. (For more on the vT-curve test see Section 3.2. in the previous chapter or ISO document No. 3685 from 1977).

Machinability: Drilling
90
Initial evaluation An initial evaluation, of the relationship between cutting speed and hardness, was made with a tool life of 200 holes and a feed rate of 0.06 mm/r with a High Speed Steel (HSS) drill. As shown in figure 68, the speed/hardness relationship is insufficient to describe machinability of P/M materials. Material with a microstructure containing more than 70% ferrite diverged from the standard relationship, therefore the amount of ferrite present in materials must be taken into account when describing machinability. The effect of feed rate on tool life and different drill types must also be taken into account, as discussed later in this chapter.
Table 7. Ferritecontent of investigated materials.
Iron base Ferrite(%)
ASC100.29 100
ASC100.29 +0.5% C 55
ASC100.29 +0.45% P 100
ASC100.29+0.45% P +0,5% C 45
ASC100.29+2% Cu 100
ASC100.29+2% Cu +0.25% C 80
ASC100.29+2% Cu +0.5% C 30
ASC100.29+2% Cu +0.8% C 1
Diffusion bonded Ferrite(%)
Distaloy AE (4%Ni, 1.5% Cu, 0.5% Mo) 90
Distaloy AE (4% Ni, 1.5% Cu, 0.5% Mo) +0.25% C 35
Distaloy AE (4% Ni, 1.5% Cu, 0.5% Mo) +0.5% C 8
Distaloy AE (4% Ni, 1.5% Cu, 0.5% Mo) +0.8% C 2
Pre-alloyed with 1,5% Mo Ferrite(%)
Astaloy Mo+0.5% C –
Distaloy HP (4% Ni,2% Cu)+0.5% C 1
8.
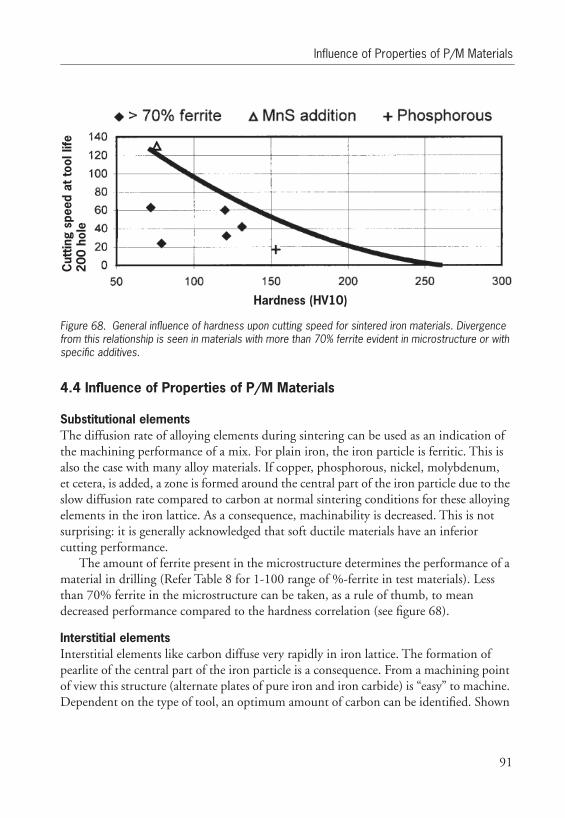
Influence of Properties of P/M Materials
91
Figure 69. General influence of hardness upon cutting speed for sintered iron materials. Divergence from this relationship is seen in materials with more than 70% ferrite evident in microstructure or with specific additives.
4.4 Influence of Properties of P/M Materials
Substitutional elements The diffusion rate of alloying elements during sintering can be used as an indication of the machining performance of a mix. For plain iron, the iron particle is ferritic. This is also the case with many alloy materials. If copper, phosphorous, nickel, molybdenum, et cetera, is added, a zone is formed around the central part of the iron particle due to the slow diffusion rate compared to carbon at normal sintering conditions for these alloying elements in the iron lattice. As a consequence, machinability is decreased. This is not surprising: it is generally acknowledged that soft ductile materials have an inferior cutting performance.
The amount of ferrite present in the microstructure determines the performance of a material in drilling (Refer Table 8 for 1-100 range of %-ferrite in test materials). Less than 70% ferrite in the microstructure can be taken, as a rule of thumb, to mean decreased performance compared to the hardness correlation (see figure 68).
Interstitial elements Interstitial elements like carbon diffuse very rapidly in iron lattice. The formation of pearlite of the central part of the iron particle is a consequence. From a machining point of view this structure (alternate plates of pure iron and iron carbide) is “easy” to machine. Dependent on the type of tool, an optimum amount of carbon can be identified. Shown
Hardness (HV10)
Cut
ting
spee
d at
tool
life
20
0 ho
le
68.

Machinability: Drilling
92
here is the influence of carbon addition for ASC100.29+2% Cu and Distaloy AE (see figure 69).
Figure 70. Influence of carbon content on relative tool life for two sintered iron materials.
OxidesSurface oxides which are more or less present in various P/M materials influence cutting performance. Generally, oxides decrease the machining performance.
The influence of oxides is well known for conventional materials [Ref. 4]. For P/M materials steam treatment is used for some components in order to improve machining. Here the oxide layer can act as chip breaker for ductile material. The tendency for smearing can be avoided, which explains the improvement that is usually reported when oxides are removed.
AdditivesA large number of additives are reported to improve the machinability of P/M material (e.g. MoS2, S, Se, Te, Bi, Pb, MnS, MnX, BN, glasses, plastic impregnation, and compounds containing group V11B elements). These additives must fulfil two main requirements:
Effect of carbon addition on relative tool life.Feed rate = 0.06 mm/r, Dry, HSS drill
69.

Influence of Properties of P/M Materials
93
1. Mechanical properties retained at same values as for material without additive.
2. Improved machinability.
Investigation of the influence of additives reveals that nearly all decrease the mechanical properties of P/M materials. Additives as MnS, MnX, and BN, can produce satisfactory influences on mechanical properties, for the sake of improved machinability.
If decreased mechanical properties can be accepted, sulfur, selenium and tellurium will improve machinability. The benefit is progressively better, from sulphur to selenium and to tellurium, respectively [Ref. 5]. Additional effects such as rounded pore shape was found for sulfur, tellurium (due to low boiling point), and MoS2 (due to dissociation into elemental molybdenum and sulfur). Due to the marked effect on mechanical properties produced by other additives, only MnS and MnX have been investigated regarding machinability.
MnS used as an additive, is commonly known to improve machinability. Addition of 0.5% is acceptable, taking into account the effect on mechanical properties. Evaluation of the performance at a tool life of 200 holes and feed rate of 0.06 mm/r for a 4 mm HSS drill revealed a large influence from MnS with plain iron. The effect decreased with the amount of alloying elements (see figure 70). Lubrication on the cutting edge, improved chip breaking, and a reduction in cutting force, are believed to be likely reasons for the improvement seen with addition of MnS.
Figure 71. Influence of additive MnS on relative tool life for three P/M materials.
Investigation of the cutting force and torque when drilling, as influenced by MnS addition, reveals a decrease in both cutting force and torque (see figure 71 and figure 72, respectively).
With hole quality, MnS has a large influence. From investigation of Distaloy SA (with density 6.2 and 6.6 g/cm3, sintering time 20 minutes at 1150°C in endogas
Rel
ativ
e to
ol li
fe (%
)
ASC100.29 ASC100.29+2% CU+0.5% C
Distaloy AE+0.5% C
70.

Machinability: Drilling
94
[Ref. 6]), torque and thrust increased with cutting speed for plain Distaloy SA, but decreased with cutting speed when MnS was added. Increased feed rate caused increases in both torque and thrust. Measured variations in surface finish and roundness of the hole for Distaloy SA, with and without MnS addition, revealed strong relationships regarding cutting speed and feed rate (see figure 73 and figure 74, respectively). MnS was seen to make a marked difference, especially with roundedness. It should be noted that in this investigation, a rather wide 95% confidence band was found with both variation in surface finish and roundedness.
Figure 72. Influence at three feed rates of additives MnS and MnX on drill feed force, with Distaloy AE +0.5% C.
71.

Influence of Properties of P/M Materials
95
Figure 73. Influence at three feed rates of additives MnS and MnX on drill torque, with Distaloy AE + 0.5%C.
Figure 74. The effect of drilling feed rate on variations in surface finish and roundedness with Distaloy SA (with and without additive MnS).
Feed rate (m/min)
Surf
ace
finis
h (µ
m)
Rou
nded
ness
(µm
)
73.
72.

Machinability: Drilling
96
Figure 75. The effect of drill cutting speed on variations in surface finish and roundedness with Distaloy SA (with and without additive MnS).
MnX added at 0.3% has a smaller effect on mechanical properties compared to MnS [Ref. 7]. Improved results were achieved compared to 0.5% MnS addition, upon testing with Distaloy AE+0.5% C. For high strength materials, the effect of MnX is greater. With the mix ASC100.29+2% Cu+0.5% C, the effect is in the same range as 0.5% MnS. (See figure 75; compare with figure 70.)
The effect of MnX is in the same range or better compared to MnS, in regard to feed force (thrust) and torque (see figure 71 and figure 72, respectively).
Cutting speed (m/min)
Surf
ace
finis
h (µ
m)
Rou
nded
ness
(µm
)
74.

Influence of Properties of P/M Materials
97
Figure 76. Effect of MnX additive on relative tool life for two P/M materials. A = ASC100.29+2% Cu+ 0.5% C+0.3% MnX. B = Distaloy AE+0.8% C+0.3% MnX.
The additive MnX prevents the decreases in machinability which otherwise occur when machining feed rates are increased (see figure 76). In this case machinability is measured by relative tool life.
To fully utilize the benefits of MnX, the machine feed rate has to be increased. The shorter tool life at higher feed rates does not balance the apparent increase in productivity. Another conclusion is that MnX has an improved effect for high performance grades of P/M mixes. It must be stated that drilling Distaloy AE +0.8% C (or 0.5% as per figure 76) with an uncoated HSS drill is, from a productivity point of view, not to be recommended without addition of MnX.
75.

Machinability: Drilling
98
Figure 77. Influence on relative tool life of MnX added to two P/M materials, at various feed rates. A=ASC100.29 +2% Cu+0.5% C. B=ASC100.29+2% Cu+0.5% C+0.3% MnX. C=Distaloy AE+0.5% C. D=Distaloy AE+0.5% C+0.3% MnX.
DensityThe main investigated mix (ASC100.29+2% Cu+0.5% C) revealed an increase of 5% in tool life for the density range of 6.7 to 7.3 g/cm3. It is reported that a better machining response, in terms of reduced drill torque and thrust levels, is obtained with increased densities [Ref. 6].
Oil impregnation The option of oil impregnation is one advantage that P/M technology can offer compared with conventional steel. Internal lubrication on the cutting edge is possible when material has been impregnated with oil. As a consequence, the cutting force required and the variation of cutting forces are decreased. Performance for oil impregnation compared with cutting fluid and dry cutting of Distaloy HP+0.5% C is shown in figure 77.
In recent years an alternative with minimal lubrication has been introduced. This involves applied oil suspension on the tool every time it leaves the work material. Initial tests reveal improvements in the same range as cutting fluid and oil impregnation.
Feed rate (mm/r)
Rel
ativ
e to
ol li
fe (%
)
76.

Tool Materials
99
Figure 78. Cutting performance in terms of relative tool life for three conditions with Distaloy HP + 0.5% C: dry cutting, fluid-aided cutting, material oil-impregnated.
4.5 Tool Materials
Several grades of high speed steel and cemented carbide materials have been vital in the development of machining tools for P/M components. Some of these materials have themselves been produced with P/M technology. In a later Section 4.7 on drill selection the application of these materials in the manufacture of drills will be apparent. The general properties of these materials are covered in this section, along with a comparison of two important tool materials. Treatment processes used with alloyed steels to achieve high quality tools are discussed in the next section.
HSS - High speed steel Since its introduction at the end of the 19th century high speed steel has become one of the most important materials in the manufacture of cutting tools. High speed steels exhibit hardness, toughness and wear resistance, characteristics which make them useful in a wide range of applications.
HSCo - Cobalt high speed steel Over the years new types of high speed steels have been developed. The principal improvement in the field of alloying has been use of cobalt. This development has led to grades that feature excellent high temperature strength properties without compromise to wear resistance and toughness. Drills, milling cutters, reamers and taps manufactured from these grades meet the exacting demands of high productive machining.
Dry f=0.2 mm/r Liquid coolantf=0.12 mm/r
Oil impregnationf=0.12 mm/r
77.
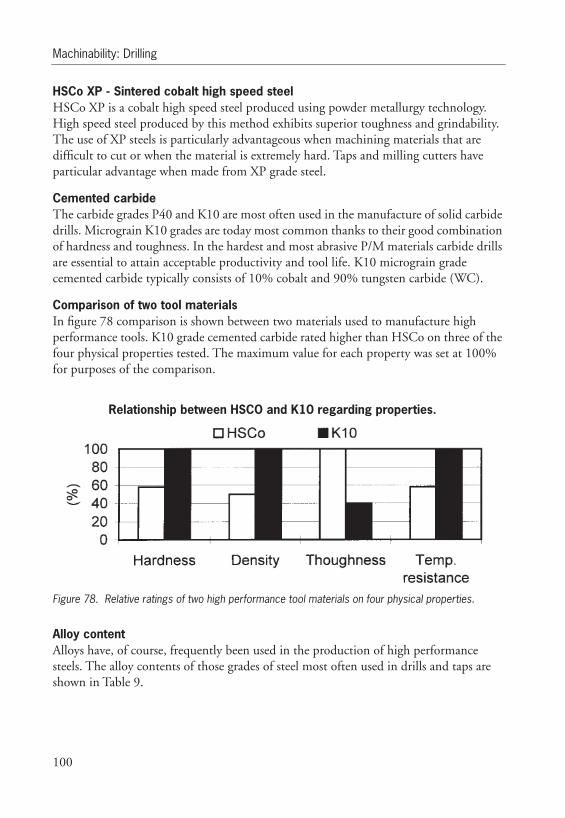
Machinability: Drilling
100
HSCo XP - Sintered cobalt high speed steel HSCo XP is a cobalt high speed steel produced using powder metallurgy technology. High speed steel produced by this method exhibits superior toughness and grindability. The use of XP steels is particularly advantageous when machining materials that are difficult to cut or when the material is extremely hard. Taps and milling cutters have particular advantage when made from XP grade steel.
Cemented carbide The carbide grades P40 and K10 are most often used in the manufacture of solid carbide drills. Micrograin K10 grades are today most common thanks to their good combination of hardness and toughness. In the hardest and most abrasive P/M materials carbide drills are essential to attain acceptable productivity and tool life. K10 micrograin grade cemented carbide typically consists of 10% cobalt and 90% tungsten carbide (WC).
Comparison of two tool materials In figure 78 comparison is shown between two materials used to manufacture high performance tools. K10 grade cemented carbide rated higher than HSCo on three of the four physical properties tested. The maximum value for each property was set at 100% for purposes of the comparison.
Figure 79. Relative ratings of two high performance tool materials on four physical properties.
Alloy content Alloys have, of course, frequently been used in the production of high performance steels. The alloy contents of those grades of steel most often used in drills and taps are shown in Table 9.
Relationship between HSCO and K10 regarding properties.
78.

Tool Treatments
101
4.6 Tool Treatments
Tools materials may be treated with a variety of surface treatments and coatings. These allow tools to better meet the demands of more economical machining and improved quality of machined surfaces. The following surface treatments and coatings have been used to good effect, particularly with P/M materials.
Heat treatment The highly alloyed high speed steels used today in the manufacture of cutting tools require precision heat treatment. Extensive experience in heat treatment utilising the most modern equipment, such as vacuum furnaces, ensures that the optimum combination of properties essential to the efficient performance of a tool can be achieved consistently. Meticulous attention to detail in all aspects of heat treatment is the only guarantee of high and consistent quality in tool production.
Steam tempering Steam tempering gives a strongly adhering blue oxide surface that acts to retain cutting fluid and prevent chip-to-tool welding, and thereby counteracts the formation of built up edge. This is an advantage particularly in softer, less abrasive P/M materials (ASC100.29, ASC100.29+2% Cu and Distaloy AE). Steam tempering can be applied to any bright tool but its most useful applications are with drills and taps.
NitridingNitriding is a process that is used to increase the hardness and wear resistance of the surface of a tool. It is particularly suitable for taps used on abrasive P/M materials. Used on twist drills when it is desirable to increase the strength and wear resistance of the cylindrical lands.
TiN Titanium Nitride is a gold colored ceramic coating applied by physical vapor deposition (PVD). High hardness combined with low friction properties ensure
Table 8. Alloying proportions in four high speed steels.
Grade C% W % Mo% Cr% V% Co%M2 0.83 6.0 5.0 4.0 2.0
M35 0.80 6.0 5.0 4.0 2.0 5.0
M42 1.10 1.5 9.5 3.75 1.15 8.0
HSCo - XP 1.27 6.4 5.0 4.0 3.1 8.5
9.
Machinability: Drilling
102
considerably longer service life or alternatively, better cutting performance, with tools that have been TiN coated. TiN is used mainly for coating of drills and taps. It gives in most P/M materials longer tool life and allows tools to be used at higher cutting speeds.
AlTiN Aluminum Titanium Nitride is a multi layer ceramic coating applied by PVD technology, which exhibits high toughness and oxidation stability. These properties make it ideal for higher speeds and feed rates whilst at the same time improving tool life. It is recommended to use AlTiN when machining abrasive P/M materials and for dry machining.
4.7 Selection of Drill Type
Dormer Tools, as used in the tests reported here, are available in an extensive range of standard and special drills. Materials and geometries are optimised to take account of the cutting behaviour of particular work-pieces. When drilling a particular material at a given speed and feed rate, drill performance is governed by the drill quality and a range of other related factors. These are summarised below.Factors influencing drilling performance:
• P/M-Material Drilled
• Choice of Tool Holding
• Depth of Hole
• Stability of Work-piece Hold
• Through or Blind Hole
• Horizontal or Vertical Drilling
• Dry or Cutting Fluid
• Stationary or Revolving Drill
• Condition of the Machine
• Swarf Control
• Machine Power Capacity
Most drills could be used to produce a hole in any material, but at what cost? Commercial production requires skilful matching of tools, drills, materials and machining processes. For maximum productivity in terms of greater tool life, hole accuracy and other indicators of optimum performance, careful selection of drills, drill

Selection of Drill Type
103
speeds and feed rates is essential. The tables given in the final section of this chapter provide recommendations of drill types for different materials and applications (see Section 4.14, figure 88 and Table 14).
The selection of drill type should be related to both the hardness of the material being machined and productivity. This is shown schematically in figure 79.
Figure 80. Three drill types as a function of productivity and hardness of material to be drilled.
A range of High Speed Steel (HSS), High Speed Cobalt (HSCo) and solid carbide drill types has been tested with P/M materials. Those drills listed in the recommendations given later in this chapter (see figure 88 on page 117 ), are presented in the following sections. For details of drills with other than cylindrical shanks see Dormer catalogues.
HSS standard drills Standard HSS jobber drills for general applications and hole depths down to 4xD are the A100, and for depths to 2.5xD, the A120. The shorter A120 has a special split point that ensures easy starting and accurate drill location. Both drills have a standard cylindrical shank (see images A and B in figure 80).
Standard HSS drills are useful with a large variety of P/M materials. They show best performance in soft materials where an open point geometry ensures the cut material will cleanly leave the flutes.
79.

Machinability: Drilling
104
Figure 81. Standard HSS drill, (a) A100 and (b) A120.
HSS/HSCo high performance drills The high performance family of ADX drills, which includes A510 and A520, has a patented design. The design features include a quick helix, a 130 degree point with special thinning, optimised flute space, and a bowed convex lip shape. The benefits include excellent swarf removal and accurate holes normally to H9. The major advantage, however, is high attainable productivity. The special design combined with the wear resistance of the TiN-coating substantially performs better than the uncoated drills in most P/M materials. The A510 (Image C in figure 81) can be used down to 4xD and the A520 (Image D in figure 81) down to 2.5xD. Both have cylindrical shanks.
Figure 82. High performance drill, (c) A510 and (d) A520.
(a) (b)
(c) (d)
80.
81.
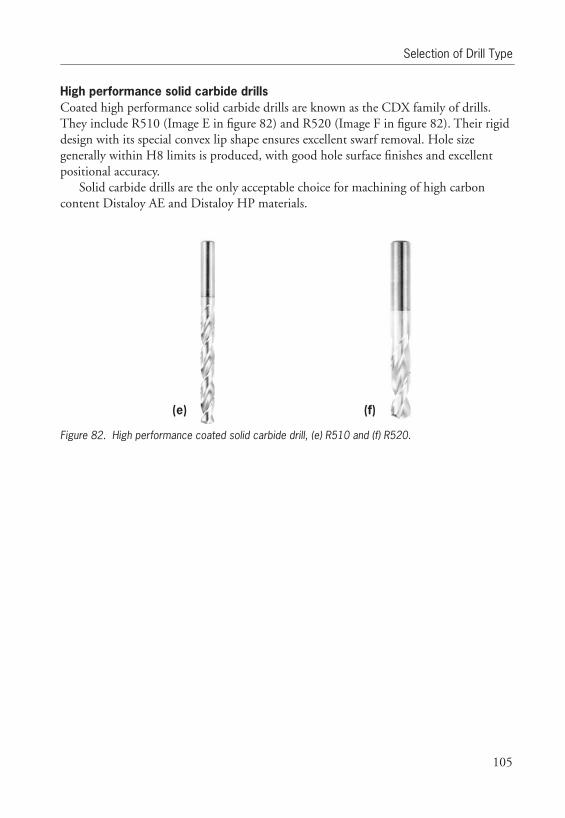
Selection of Drill Type
105
High performance solid carbide drills Coated high performance solid carbide drills are known as the CDX family of drills. They include R510 (Image E in figure 82) and R520 (Image F in figure 82). Their rigid design with its special convex lip shape ensures excellent swarf removal. Hole size generally within H8 limits is produced, with good hole surface finishes and excellent positional accuracy.
Solid carbide drills are the only acceptable choice for machining of high carbon content Distaloy AE and Distaloy HP materials.
Figure 83. High performance coated solid carbide drill, (e) R510 and (f) R520.
(e) (f)
82.
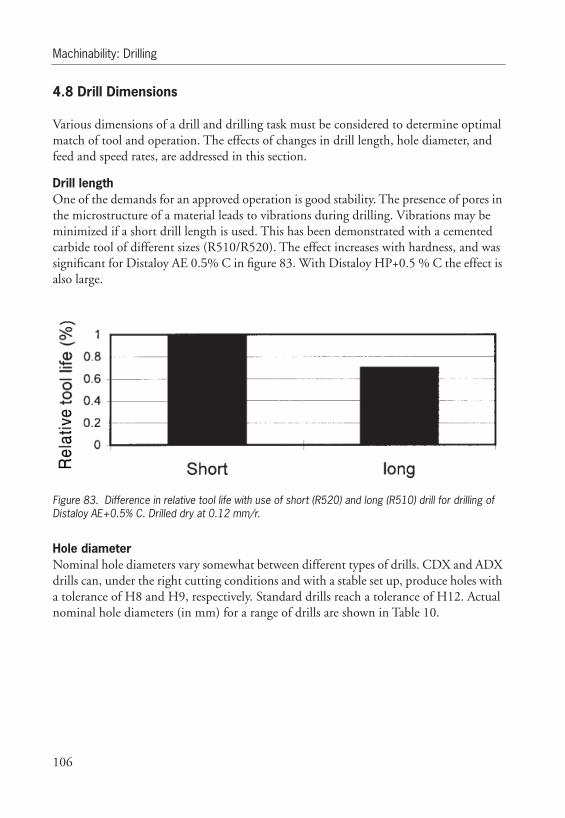
Machinability: Drilling
106
4.8 Drill Dimensions
Various dimensions of a drill and drilling task must be considered to determine optimal match of tool and operation. The effects of changes in drill length, hole diameter, and feed and speed rates, are addressed in this section.
Drill length One of the demands for an approved operation is good stability. The presence of pores in the microstructure of a material leads to vibrations during drilling. Vibrations may be minimized if a short drill length is used. This has been demonstrated with a cemented carbide tool of different sizes (R510/R520). The effect increases with hardness, and was significant for Distaloy AE 0.5% C in figure 83. With Distaloy HP+0.5 % C the effect is also large.
Figure 84. Difference in relative tool life with use of short (R520) and long (R510) drill for drilling of Distaloy AE+0.5% C. Drilled dry at 0.12 mm/r.
Hole diameter Nominal hole diameters vary somewhat between different types of drills. CDX and ADX drills can, under the right cutting conditions and with a stable set up, produce holes with a tolerance of H8 and H9, respectively. Standard drills reach a tolerance of H12. Actual nominal hole diameters (in mm) for a range of drills are shown in Table 10.
83.

Use of Cutting Fluids
107
Hole depth and speed and feed rate The depth of holes to be drilled has an influence on the setting of optimal speed and feed rates. As the ratio of hole depth to diameter increases, speed and feed rates should be proportionally decreased. The recommendations given in Table 11 can be used as a guideline for calculating reductions in machine rates when drilling holes deeper than twice their diameter.
4.9 Use of Cutting Fluids
The application of cutting fluids or liquid coolants generally improves machining performance (see figure 84). If the additional operation to prevent oxidation can be performed, taking the increased cost into account, the use of cutting fluids has a beneficial effect. However, all recommendations given at the conclusion of this chapter are for dry cutting conditions. This is due to the fact that oxidation of the component in most cases cannot be tolerated.
Table 9. Selection of four drills showing nominal hole diameters: Deviations in (mm).
Diameter(∅ mm)
CDX = H8 ADX = H9 PFX = H9 A100 = H12
≤ 3 0 / +0.014 0 / +0.025 0 / +0.040 0 / +0.100
> 3 < 6 0 / +0.018 0 / +0.030 0 / +0.048 0 / +0.120
> 6 < 10 0 / +0.022 0 / +0.036 0 / +0.058 0 / +0.150
> 10 < 18 0 / +0.027 0 / +0.043 0 / +0.070 0 / +0.180
Table 10. Recommended cutting speeds and feed rates at four hole depths.
Hole depth Percentage ofrecommended speed, Vc
Percentage ofrecommended feed, f
2 x D 100 % 100 %
3 x D 90 % 90 %
4 x D 80 % 80 %
5 x D 70 % 70 %
10.
11.

Machinability: Drilling
108
Figure 85. Influence of cutting fluid on relative tool life with three P/M mixes. A=Distaloy AE+0.5% C, A510 f=0.2 mm/r. B=ASC100.29+2% Cu+0.5% C, A510 f=0.2 mm/r. C=ASC100.29+2% Cu +0.5% C, A100 f=0.06 mm/r.
The effect of cutting fluids is strongly dependent on the cutting speed. The α-value for cutting speed (vT-curve) is lower if a fluid is used (see figure 85). For Distaloy AE the same behaviour has been found [Ref. 8].
Figure 86. Effect of cutting speed on tool life (vT-curve) for drilling with and without cutting fluid.
Using cutting fluid when drilling with HSS-drills in P/M materials increases tool life at factors approximately between 1.1 and 1.5 (see Table 12). These factors are valued for a tool life of 300 hole. When the α-value is taken into account, large differences can be expected if an evaluation is made at a different tool life.
84.
85.

Hints for Optimal Drilling
109
An additional conclusion for machining of plain iron (>70% ferrite; see figure 68) with a PVD-TiN coated HSS drill (A510), is that there is much to gain by use of cutting fluid and an increased cutting speed. With these materials, cutting fluid will have more of a lubricating than cooling effect. Taking into account the additional operation required to protect the component from oxidation, the benefit of cutting fluid should be considered.
The total cost of the use of fluids, work piece cleaning and the required changes to the work environment should be compared with the cost of modern drilling tools, especially those made of coated HSS and solid carbide. Coated carbide tools may be used so that they have an impressively long tool life, even with low-speed machines, if special attention is given to the control of vibrations. (See below for more on cutting data with specific drills.)
4.10 Hints for Optimal Drilling
1. Select the best type of drill for your application. The tables at the end of this chapter indicate the best drill to suit the P/M-material being drilled and give recommended speeds and feed rates.
2. The work piece must be held rigid and the machine spindle should have no runout. Rigidity can also be helped by using as short drill as possible.
3. The holder in which a straight shank drill is held must be of good quality. If the drill slips in the holder and the feed is automatic, breakage of the drill can be the result. With drills up to ∅6 mm a runout in the holder of up to 0.015 mm can be accepted.
4. If possible use recommended lubricants for cutting fluid to enhance the life of the tool. Ensure lubricants reach the drill point.
5. Do not allow the flutes of a drill to become choked with swarf, especially on holes deeper than 4X diameter. Withdrawal to clear the swarf may be required. Use special parabolic flute drills for deeper holes.
6. Do not use 2-fluted drills to open out existing drilled or cored holes as they are not designed for this application.
Table 11. Correction factors for drill life increase with use of cutting fluid.
Drill FactorA100 1.25
A510 1.1 - 1.5
12.

Machinability: Drilling
110
7. When the drill is reground ensure that all wear is removed and check that the correct point geometry is produced. Keep drills sharp.
Hints for carbide drilling
1. Use shortest possible drill.
2. Use machines with adequate stability.
3. Avoid unstable or weak tool-holders and work-pieces.
4. When vibrations are present, carbide tools are more prone to chipping than HSS-tools.
5. Use shortest possible overhang for the application. It is better to use modularadapters than to have a long overhang on the tool.
6. The tool-holder is very important so use holders of good quality and with small runout (up to 0.01 mm).

Economy and Productivity in Drilling
111
4.11 Economy and Productivity in Drilling
Machining cost and productivity are probably the two most important parameters to consider when deciding which tool that should be used and how to set up a drilling process. The information in this section gives an indication of what can be expected from different tools with four P/M materials.
Cost per hole Economy in drilling has been determined according to cost per hole for a standard machining procedure. Calculations of cost per hole were made on cutting data giving a tool life of 15 minutes, no regrinding and a drill depth of 2xD. Tests were conducted to allow comparisons with a standard iron powder and three P/M alloy materials when machined with appropriate drill. (See figure 86 and refer to Section 4.7 above regarding drill types.)
Figure 87. Comparative cost per hole with recommended drills (from a selection of three drills) in four sintered iron materials. A=ASC100.29. B=Distaloy AE+0.5% C. C=Distaloy AE+0.8% C. D=Distaloy HP+0.5% C.
The results shown in figure 86 indicate the economic limits of different tools. Material classified as group 1 (i.e. ASC100.29 alloys) can be machined economically by a HSS tool (A100). There is a clear difference for Distaloy AE+0.5% C: a coated HSS drill (e.g. A510) should be selected. For Distaloy HP+0.5% C, the cemented carbide tool (R520) replaces the coated HSS (A510) as the best choice.
The limits shown in figure 86 are only indications of drilling-material combinations with different tools, and are likely to be the best choice from an economic point of view.
Time per hole Productivity in drilling was determined according to time per hole for a standard machining procedure. Calculations of seconds per hole were made on recommended
86.

Machinability: Drilling
112
cutting data and a drill depth of 2xD. See figure 87 for productivity results relevant to the tool and material combinations as used in the above test for economy.
Figure 88. Comparative time for drilling single holes with recommended drills (from a selection of three drills) in four sintered iron materials. A=ASC100.29. B=Distaloy AE+0.5% C. C=Distaloy AE+0.8% C. D=Distaloy HP+0.5% C.
4.12 Setting Machine Limits
The drilling machine and the set up for a work piece are required to conform to particular limits in order to maintain a certain quality of output and tool life. The limits set should provide for the cutting forces and power input required, according to the choice of tool and cutting data. The traditional choice of shortest possible drill is important when machining P/M materials, as is a well-centering holder and a good fixture of the work piece.
It is difficult to set a stiffness value for a drilling machine in the same way as for turning and milling operations. One procedure to reach a good reference for drilling machines, is a follows:
1. Choose a P/M material similar to one listed in Table 8.
2. Use a drill for which specific feed force and cutting force values are indicated.
3. Determine the data from the cutting data chart (see figure 88).
4. Use the formulae shown below to calculate actual feed and cutting forces.
5. Test the drilling operation with the machine in question.
87.

Formulae for Cutting Forces
113
6. Evaluate as follows:i. If the operation is running well: Repeat the test with higher cutting data until there are vibrations or unacceptable work quality.
ii. If the operation fails: Repeat the test with reduced cutting data until the opera-tion proceeds smoothly.
The cutting force levels thus determined, should be considered as the limit for the machine. These limits, in cutting and feed forces, can then be used in planning new operations and other diameters. (It is important to note that drilling with some tool wear will increase the cutting force by up to 25%.).
4.13 Formulae for Cutting Forces
The following formulae are useful for calculating cutting data.
The maximum rotational speed (rpm) and the machine stability affect tool choice and the choice of cutting data. Specific feed force and torque for some significant P/M materials.
Factor Symbol Formula MeasurementCutting speed Vc Vc = (π·Dc·n) / 1000 m/min
Rotational speed n n = (Vc·1000) / (π·Dc) rev/min
Feed rate f f = fn·n mm/min

Machinability: Drilling
114
The formulae below can be used for approximate calculations of feed force and net power consumption. (NB: Wear on tool and machine efficiency is not considered in these calculations.)
Table 12. Specific feed force and cutting force for A100 and R520 drills and a range of P/M materials.
Specific feed force, kf Specific cutting force, kc
Material groups A100Fn=0.16-0.06
mm/rev
R520Fn=0.12-0.20
mm/rev
Fn=0.16-0.06 mm/rev
Iron base
ASC100.29 2800-4600 4600-5800
ASC100.29+0.5% C 1900-3100 2800-3500
ASC100.29+0.45% P 2000-3300 3800-3500
ASC100.29+0.45%P+0.5% C 3100-5000 2800-3500
ASC100.29+2% Cu 2600-3800 4600-5800
ASC100.29+2% Cu+0.25% C 2400-3500 4100-5200
ASC100.29+2% Cu+0.5% C 2400-3500 2900-3700
ASC100.29+2% Cu+0.8% C 2900-4200 2800-3500
Diffusion bonded
Distaloy AE (4% Ni+1.5% Cu+0.5% Mo) 2200-3500 3700-4600
Distaloy AE (4% Ni+1.5% Cu + 0.5% Mo)+0.5% C 3600-5000 3200-4000
Distaloy AE (4% Ni+1.5% Cu + 0.5% Mo)+0.8% C 3500-4400 2700-4600
Pre-alloyed with 1,5% Mo
Astaloy Mo+0.5% C 2700-4400 3500-4400
Distaloy HP (4% Ni+2% Cu) + 0.5% C 3700-4700
13.

Drill Recommendations and Cutting Data
115
4.14 Drill Recommendations and Cutting Data
In the following tables recommendations are given for drills to match materials in three P/M alloy groups. In the drill table (figure 88), each recommended drill application is rated as either excellent or acceptable. The speed and feed rates given are start values for dry cutting of P/M material with a density of approximately 7.0 g/cm3. For each drill application, numerical data represent recommended cutting speeds for a tool life of 15 minutes. With each cutting speed is a letter (T - Y) indicating recommended feed rate for the cutting operation. The key to the letter notation is given in Table 14 on page 118, where the code is transformed to numerical data (i.e. feed rate recommended for various diameter drills).
Factor Symbol Formula MeasurementDrill diameter Dc mm
Feed per revolution fn mm/rev
Specific feed force kf from Table 12 N/mm2
Specific cutting force kc from Table 12 N/mm2
Feed force F F = (Dc·fn·kf) / 2 N
Power P P = (D2·f·kc·n·π) / 240·106 kW
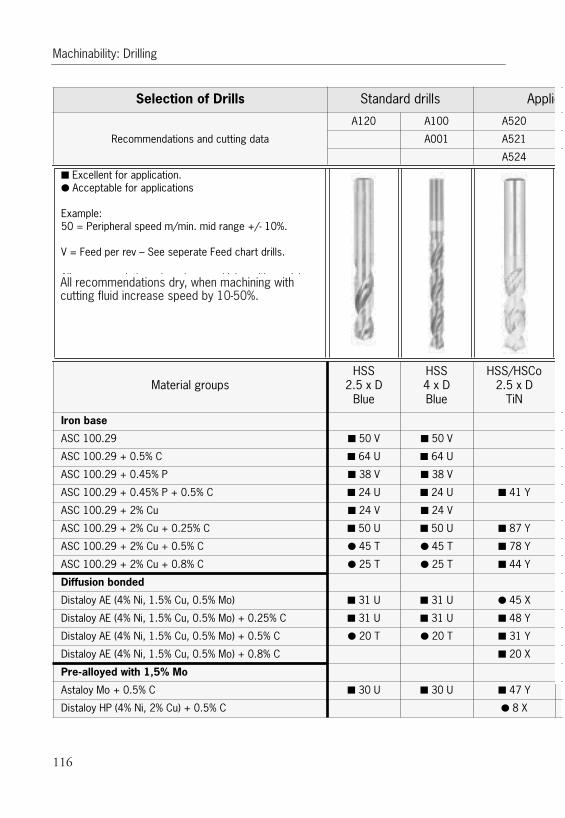
Machinability: Drilling
116
Selection of Drills Standard drills Applica
Recommendations and cutting data
A120 A100 A520
A001 A521
A524
■ Excellent for application.● Acceptable for applications
Example:50 = Peripheral speed m/min. mid range +/- 10%.
V = Feed per rev – See seperate Feed chart drills.
All recommendations dry, when machining with emulsion speed by 10 - 50 %.
Material groupsHSS
2.5 x DBlue
HSS4 x DBlue
HSS/HSCo2.5 x D
TiN
ASC 100.29 ■ 50 V ■ 50 V
ASC 100.29 + 0.5% C
Iron base
■ 64 U ■ 64 U
ASC 100.29 + 0.45% P ■ 38 V ■ 38 V
ASC 100.29 + 0.45% P + 0.5% C ■ 24 U ■ 24 U ■ 41 Y
ASC 100.29 + 2% Cu ■ 24 V ■ 24 V
ASC 100.29 + 2% Cu + 0.25% C ■ 50 U ■ 50 U ■ 87 Y
ASC 100.29 + 2% Cu + 0.5% C ● 45 T ● 45 T ■ 78 Y
ASC 100.29 + 2% Cu + 0.8% C ● 25 T ● 25 T ■ 44 Y
Distaloy AE (4% Ni, 1.5% Cu, 0.5% Mo) ■ 31 U ■ 31 U ● 45 X
Distaloy AE (4% Ni, 1.5% Cu, 0.5% Mo) + 0.25% C
Diffusion bonded
■ 31 U ■ 31 U ■ 48 Y
Distaloy AE (4% Ni, 1.5% Cu, 0.5% Mo) + 0.5% C ● 20 T ● 20 T ■ 31 Y
Distaloy AE (4% Ni, 1.5% Cu, 0.5% Mo) + 0.8% C ■ 20 X
Astaloy Mo + 0.5% C ■ 30 U ■ 30 U ■ 47 Y
Distaloy HP (4% Ni, 2% Cu) + 0.5% C
Pre-alloyed with 1,5% Mo
● 8 X
All recommendations dry, when machining withcutting fluid increase speed by 10-50%.
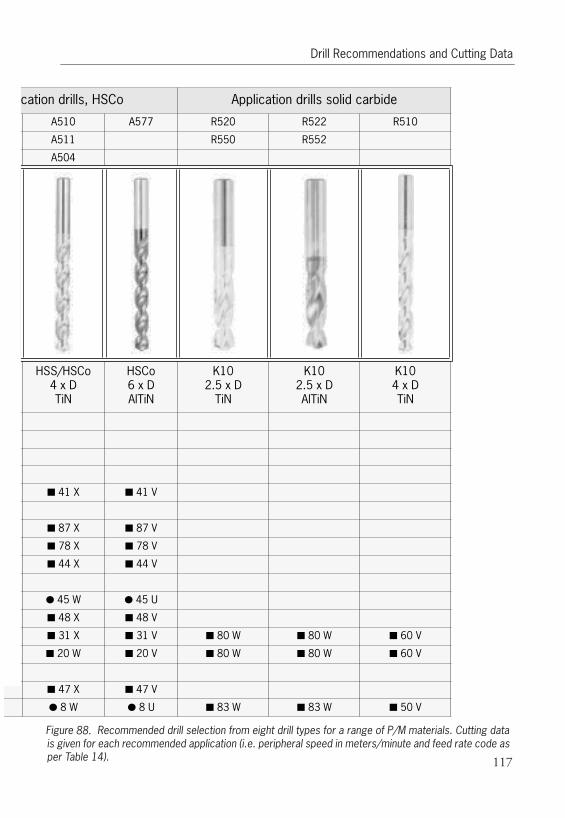
Drill Recommendations and Cutting Data
117
Figure 89. Recommended drill selection from eight drill types for a range of P/M materials. Cutting data is given for each recommended application (i.e. peripheral speed in meters/minute and feed rate code as per Table 14).
pplication drills, HSCo Application drills solid carbide
A510 A577 R520 R522 R510
A511 R550 R552
A504
o HSS/HSCo 4 x DTiN
HSCo6 x DAlTiN
K102.5 x D
TiN
K102.5 x DAlTiN
K104 x DTiN
■ 41 X ■ 41 V
■ 87 X ■ 87 V
■ 78 X ■ 78 V
■ 44 X ■ 44 V
● 45 W ● 45 U
■ 48 X ■ 48 V
■ 31 X ■ 31 V ■ 80 W ■ 80 W ■ 60 V
■ 20 W ■ 20 V ■ 80 W ■ 80 W ■ 60 V
■ 47 X ■ 47 V
● 8 W ● 8 U ■ 83 W ■ 83 W ■ 50 V
88.
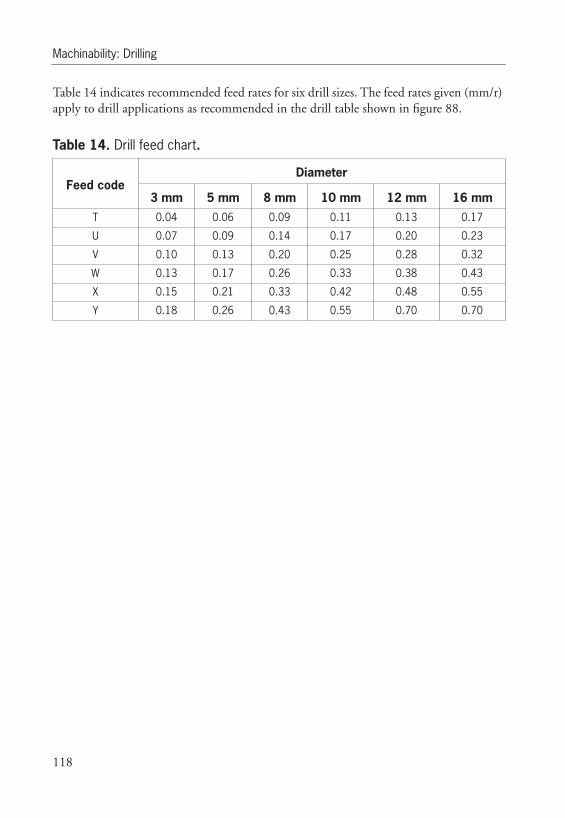
Machinability: Drilling
118
Table 14 indicates recommended feed rates for six drill sizes. The feed rates given (mm/r) apply to drill applications as recommended in the drill table shown in figure 88.
Table 13. Drill feed chart.
Feed codeDiameter
3 mm 5 mm 8 mm 10 mm 12 mm 16 mmT 0.04 0.06 0.09 0.11 0.13 0.17
U 0.07 0.09 0.14 0.17 0.20 0.23
V 0.10 0.13 0.20 0.25 0.28 0.32
W 0.13 0.17 0.26 0.33 0.38 0.43
X 0.15 0.21 0.33 0.42 0.48 0.55
Y 0.18 0.26 0.43 0.55 0.70 0.70
14.

Classification of P/M Materials for Tapping
119
5 Tapping
This chapter was written in cooperation with Dormer Tools and IVF. Tapping is one of the most difficult machining operations, according to a study among Höganäs customers. This would explain the reported use of oil impregnation to assist the operation. Straight flute taps of coated or uncoated high speed steel (HSS) are most often used.
Tapping is closely related to drilling. There is an obvious need for a hole to perform a tapping operation. The diameter of the hole is very important factor in determining both thread quality and the useful life of a tap. A correct thread can only be made if the hole is round and straight.
The recommendations given regarding drilling also apply to obtain a good thread. (See previous chapter 4.)
5.1 Classification of P/M Materials for Tapping
Materials investigated for performance with tapping were the same as those evaluated for drilling (see Chapter 4, Table 8). The tap used for the main evaluation was a straight flute tap (E500).
With tapping in the dry condition, chip clamping severely influenced performance and therefore it was decided to perform the main comparison of materials with use of applied emulsion.
To classify P/M material regarding tapping, evaluation of tool life of the tap is necessary. The only investigation made was of torque. For this reason the classification stated in the drilling and turning evaluations was used. Torque evaluated at a speed of 6.3 m/min (straight flute tap, applied fluid) showed a correlation to hardness (see figure 89).

Machining of P/M materials regarding Tapping
120
Figure 90. Correlation of torque in tapping and hardness of a range of P/M materials (as per Table 8). Tapping with E500 straight fluted tap, applied emulsion.
High strength material such as Distaloy AE + 0.8% C was only possible to tap if 0.3% MnX was added. Materials with superior properties were impossible to tap. A further conclusion from this evaluation is that density has a strong influence on torque during tapping. Additives as MnS and MnX and minimal lubrication decrease the torque.
Wet versus dry tapping The turning and drilling evaluations (see previous chapters) demonstrated the fundamental influence in machining of the amount of ferrite present in the microstructure of materials. However, tapping with emulsion revealed no such relationship (see figure 89). With dry tapping, the effect of ferrite was apparent (see Table 15).
There is a clear difference between the two machinability groups identified (viz. alloys of ASC100.29 and Distaloy AE). With Distaloy AE+0.5% C, chip length was much smaller compared to ASC100.29+2% Cu+0.5% C. This would explain the performance shown in Table 15, torque values for tapping under dry and wet conditions, with comparison of P/M materials according to proportion of ferrite present in microstructures. For dry tapping the amount of ferrite must be taken into account.
89.
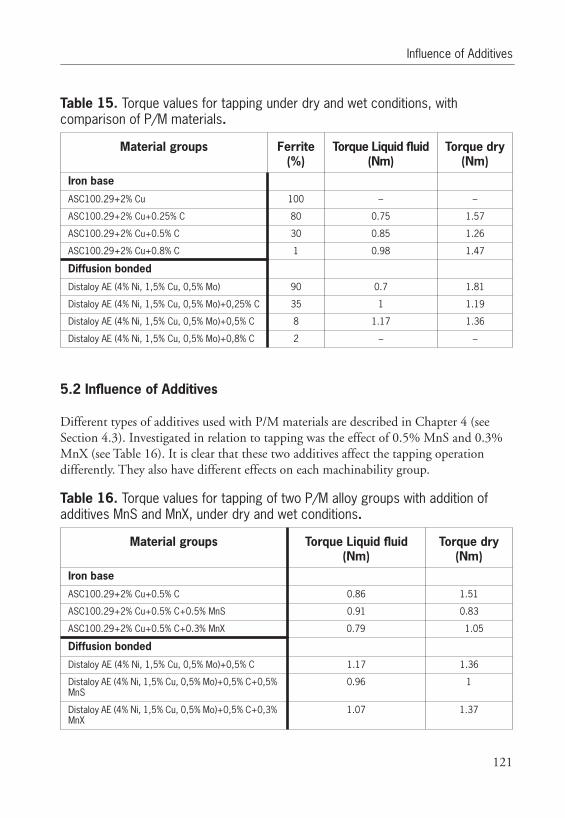
Influence of Additives
121
5.2 Influence of Additives
Different types of additives used with P/M materials are described in Chapter 4 (see Section 4.3). Investigated in relation to tapping was the effect of 0.5% MnS and 0.3% MnX (see Table 16). It is clear that these two additives affect the tapping operation differently. They also have different effects on each machinability group.
Table 14. Torque values for tapping under dry and wet conditions, with comparison of P/M materials.
Material groups Ferrite(%)
Torque Liquid fluid(Nm)
Torque dry(Nm)
Iron base
ASC100.29+2% Cu 100 – –
ASC100.29+2% Cu+0.25% C 80 0.75 1.57
ASC100.29+2% Cu+0.5% C 30 0.85 1.26
ASC100.29+2% Cu+0.8% C 1 0.98 1.47
Diffusion bonded
Distaloy AE (4% Ni, 1,5% Cu, 0,5% Mo) 90 0.7 1.81
Distaloy AE (4% Ni, 1,5% Cu, 0,5% Mo)+0,25% C 35 1 1.19
Distaloy AE (4% Ni, 1,5% Cu, 0,5% Mo)+0,5% C 8 1.17 1.36
Distaloy AE (4% Ni, 1,5% Cu, 0,5% Mo)+0,8% C 2 – –
Table 15. Torque values for tapping of two P/M alloy groups with addition of additives MnS and MnX, under dry and wet conditions.
Material groups Torque Liquid fluid(Nm)
Torque dry(Nm)
Iron base
ASC100.29+2% Cu+0.5% C 0.86 1.51
ASC100.29+2% Cu+0.5% C+0.5% MnS 0.91 0.83
ASC100.29+2% Cu+0.5% C+0.3% MnX 0.79 1.05
Diffusion bonded
Distaloy AE (4% Ni, 1,5% Cu, 0,5% Mo)+0,5% C 1.17 1.36
Distaloy AE (4% Ni, 1,5% Cu, 0,5% Mo)+0,5% C+0,5% MnS
0.96 1
Distaloy AE (4% Ni, 1,5% Cu, 0,5% Mo)+0,5% C+0,3% MnX
1.07 1.37
15.
16.

Machining of P/M materials regarding Tapping
122
MnSIn the turning evaluation, the forces acting on the tool decreased with MnS addition (see Chapter 3, figure 37, figure 38 and figure 39).
Comparison of the MnS effect on torque for emulsion and dry tapping revealed a large decrease in torque under the dry condition. In tapping of ASC100.29+2% Cu+ 0.5% C with applied emulsion, there was a small increase in torque.
With Distaloy AE+0.5% C, the torque decreased. The effect from MnS seems to increase with hardness.
MnXIt is clear from the evaluation that MnX has no effect on tapping Distaloy AE +0.5% C under a dry condition. For ASC100.29+2% Cu+0.5% C the effect is significant. Improved chip breaking would explain the difference in performance.
For material with a high amount of ferrite, MnX addition in combination with lubrication by either oil impregnation or minimal applied lubricant, is believed to be beneficial. In the case of tapping with a cold forming tap, the thread is formed by plastic deformation of the material. Internal lubrication (oil impregnation) or MnS addition is believed to be beneficial for the threading operation. Some kind of lubrication is very important when using cold forming taps.

Selection of taps
123
5.3 Selection of taps
A range of taps was investigated for use with P/M materials. The four main taps tested are shown in Table 17. Different types of tool materials influence tap performance (see Chapter 4, Section 4.5 for discussion of tool materials). Details of surface treatments and coatings used with tool materials were also given in Chapter 4 (see Section 4.6).
Descriptive characteristics of taps used in these evaluations are shown in figure 90. The illustrations serve as definitions for those characteristics that are important in the performance of taps.
Table 16. Images of four types of taps evaluated for use with P/M alloys.
Spiral point tap Spiral flute tap Straight flute tap Cold forming tap
17.

Machining of P/M materials regarding Tapping
124
Figure 91. Defining characteristics of quality taps.
Five main hole configurations were considered for tapping. Figure 91 illustrates these hole types. Guidelines for tap selection and general recommendations for tapping of P/M materials are given below.
Figure 92. Five main type of holes in tapping operations.
1 2 3 4 5
91.
90.

Selection of taps
125
Straight fluted taps Straight flutes are the most commonly used type of tap. Suitable for use on most materials, straight-fluted taps form the basis of most tapping operations. They are recommended for hole types 1, 2 and 3. The E500 is the model of this type evaluated here.
Spiral point taps A tap with a straight, fairly shallow flute is often referred to as a gun nose or spiral point tap. The gun nose or spiral point is designed to drive the swarf forward. The relatively shallow flutes ensure that the section strength is maximised and they also act to allow emulsion to reach the cutting edges. This type of tap is recommended for threading through-holes and is used for hole types 1 and 2. It may also may be used in blind hole applications where there is sufficient space to accommodate the swarf, hole type 3. The model evaluated was the E509.
Spiral fluted taps Taps with spiral flutes are intended primarily for threading in blind holes of type 3, 4 or 5. The helical flute transports the swarf back away from the cutting edges and out of the hole thus avoids packing of swarf in the flutes or at the bottom of the hole. In this way the danger of breaking the tap or damaging the thread is minimised. The model evaluated was the E507.
Cold forming tapsCold forming taps differ from cutting taps in that the thread is produced by plastic deformation of the component material rather than by the traditional cutting action. Thus no swarf is produced by cold forming taps. The application range is materials with good formability: tensile strength (Rm) should not exceed 1200 N/mm2 and the elongation factor (A5) should not be less than 10%. The model evaluated was the E565.
Cold forming taps without flutes are suitable for normal machining and are especially suitable when working with vertically tapped blind holes. Conversely, cold forming taps with flutes are especially suited for applications in horizontal holes and vertical through-holes. The flutes act to facilitate the supply of lubricant to the working area. With difficult to machine materials, TiN coating has been shown to give outstanding tool life.
Determination of hole width The diameter of the hole prior to tapping is an extremely important factor in determining both thread quality and the useful life of the tap. Normally, a drilled hole is slightly larger than the diameter of the drill. The amount of ‘oversize’ depends upon the material being drilled, the cutting conditions selected and the condition of the equipment being used. Note:

Machining of P/M materials regarding Tapping
126
• If material is pushed up at the thread entry by the tap and/or the life of the tap is too short - select a slightly larger drill diameter.
• If on the other hand the profile of the thread formed is insufficient - select a slightly smaller drill diameter.
Torque comparison A selection of four taps of various types was tested for torque values on a range of P/M materials. A tap dimension of M4 was used and emulsion was applied in each case. Results in Nm values are shown in Table 18.
(Emulsion applied in each case; tap dimension M4; values in Nm.)
Table 17. Comparison of torque in tapping of 11 P/M materials with a selection of four taps.
Material groups E565 E973 E507 E500Iron base
ASC100.29 1.00 0.81
ASC100.29+0.5% C 1.81 1.16 1.31
ASC100.29+0.45% P+0.5% C 1.10
ASC100.29+2% Cu+0.25% C 1.06
ASC100.29+2% Cu+0.5% C 1.19
ASC100.29+2% Cu+0.8% C 1.38
Diffusion bonded
Distaloy AE (4% Ni, 1,5% Cu, 0,5% Mo)
1.50 1.31 1.00
Distaloy AE (4% Ni, 1,5% Cu, 0,5% Mo)+0.25% C
1.40
Distaloy AE (4% Ni, 1,5% Cu, 0,5% Mo)+0.5% C
1.31 1.62
Distaloy AE (4% Ni, 1,5% Cu, 0,5% Mo)+0.8% C
1.66
Pre-alloyed with 1,5% Mo
Astaloy Mo+0.5% C 1.70
18.

Hints on Optimal Tapping
127
5.4 Hints on Optimal Tapping
The success of any tapping operation depends on a number of factors all of which affect the quality of the finished product. Brief guidelines for optimal tapping are given here, followed by discussion of some important factors affecting performance:
• Select the correct design of tap for the component material and type of hole (i.e. through or blind). See cutting data recommendations for tapping in Section 5.6, at the end of this chapter.
• Ensure the component is securely clamped: lateral movement may cause tap breakage or poor quality threads.
• Select the correct size of drill from the tapping drill charts. Remember: drill sizes dif-fer between cutting and forming taps.
• Select the correct cutting speed as shown in the cutting data recommendations for tapping.
• Use appropriate cutting fluid for each application.
• In NC applications ensure that the pitch value chosen for the program is correct. When using a tapping attachment, 95% to 97% pitch is recommended to allow the tap to generate its own pitch.
• Where possible hold the tap in a good quality torque-limiting tapping attachment. This should ensure free axial movement of the tap and that it is presented squarely to the hole. It also protects the tap from breakage if it is accidentally ‘bottomed’ in a blind hole.
Core hole dimensions A correct thread can only be obtained if the hole is round and straight. The diameter of the hole must never be smaller than the minor diameter of the thread. The larger the hole diameter, the lower the generated torque will be on the tap. Recommended core sizes are given in the concluding section of this chapter (see Table 18).
LubricationIt is important that the cutting part of the tap is ensured a good supply of lubricant or cooling fluid. The need for good lubrication increases with the depth of the hole and the hardness of the material being machined. Any ‘cooling fluid’ must have a lubricating effect in order to reduce friction.
One solution to avoid applied emulsion is to use minimal lubrication. A small amount of oil, (20-40 ml/h) can then be directed to the thread part of the tap.

Machining of P/M materials regarding Tapping
128
Guidelines when using equipment for minimal lubrication are:
• Direct the nozzles to the tap and the core hole.
• Use only oil recommended for minimal lubrication.
Dry tapping When selection of the most suitable cutting fluid is not possible, or when dry cutting, the useful life of the tool will be shorter than normal. When tapping dry, cutting speeds must be reduced.
Tapping attachment In order to ensure the best possible result a high quality tapping attachment with axial float should be used. See Dormer catalogue for available tapping attachments.
Clamping and centring The tap must be carefully centred with the work piece for the best result to be obtained. When thin materials are to be threaded it is important that the work piece is properly secured in order to prevent the formation of oblong holes.
5.5 Tapping Guidelines
The following conclusions have been drawn from experimental and practical experiences in tapping of P/M materials. These are ‘rules of thumb’ or a general guide to optimal tapping:
• For materials of lowest hardness use high spiral taps.
• For materials of medium hardness use straight fluted or low spiral taps.
• For materials of highest hardness use surfaced-treated low spiral taps.
• Lubrication should be used whenever possible. It is of particular importance with materials of lowest and greatest hardness, and with cold forming taps.

Tap and Cutting Data Recommendations
129
5.6 Tap and Cutting Data Recommendations
Recommendations for tap application and related cutting data are presented in figure 92. The speed rates shown are start values for tapping with emulsion of P/M materials with a density of 7.0 g/cm3.
In Table 19 - Table 22 drill diameters recommended for cutting taps and cold forming taps are stated. In each case drill diameter refers to ISO metric coarse thread.

Machining of P/M materials regarding Tapping
130
Selection of Taps Spiral point taps S
Recommendations and cutting datafor thread form M coarse. For other thread forms contact Dormer Tools.
ISO E509 E511 E507 E
DIN 371 E214 E206 E208 E
DIN 376 E265 E257 E259 E
■ Excellent for application.● Acceptable for applications
Example:15 = Peripheral speed m/min. mid range +/- 10%.
All recommendations with lubricants.
Material groupsHSS
-2.5 x DBright
HSS-2.5 x D
TiN
HSS-2 x DBright
H-2T
ASC 100.29
ASC 100.29 + 0.5% C
Iron base
ASC 100.29 + 0.45% P
ASC 100.29 + 0.45% P + 0.5% C
ASC 100.29 + 2% Cu
ASC 100.29 + 2% Cu + 0.25% C
ASC 100.29 + 2% Cu + 0.5% C
ASC 100.29 + 2% Cu + 0.8% C
Distaloy AE (4% Ni, 1.5% Cu ,0.5% Mo)
Distaloy AE (4% Ni, 1.5% Cu ,0.5% Mo) + 0.25% C
Diffusion bonded
Distaloy AE (4% Ni, 1.5% Cu ,0.5% Mo) + 0.5% C
Distaloy AE (4% Ni, 1.5% Cu ,0.5% Mo) + 0.8% C
Astaloy Mo + 0.5% C
Distaloy HP (4% Ni, 2% Cu) + 0.5% C
Pre-alloyed with 1.5% Mo
■ 20
■ 15
■ 10
■ 8
■ 15
■ 10
■ 8
■ 10
■ 8
■ 8
● 35
■ 25
■ 20
■ 16
● 25
■ 20
■ 16
■ 20
■ 16
■ 16
■ 20
■ 15
■ 10
■ 8
■ 15
■ 10
■ 8
■ 10
■ 8
■ 8
● 35
■ 25
■ 20
■ 16
● 25
■ 20
■ 16
■ 20
■ 16
■
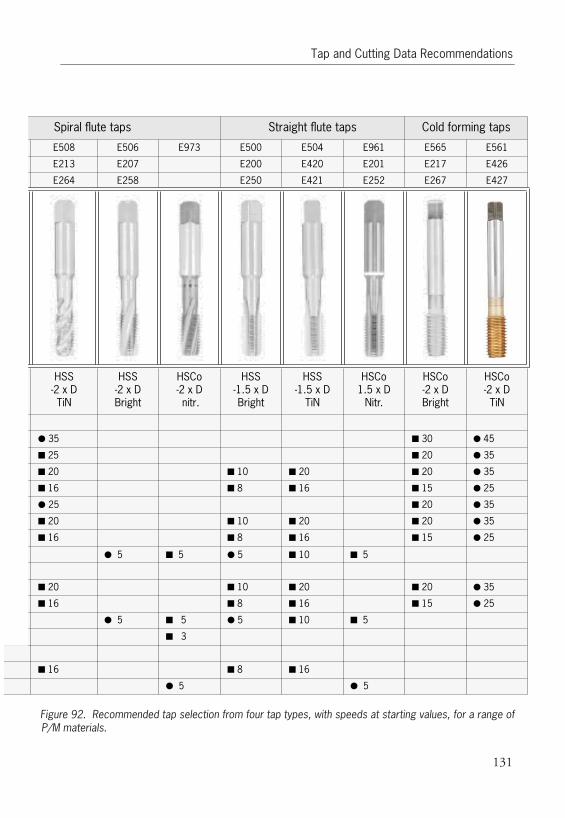
Tap and Cutting Data Recommendations
131
Figure 93. Recommended tap selection from four tap types, with speeds at starting values, for a range of P/M materials.
Spiral flute taps Straight flute taps Cold forming taps
7 E508 E506 E973 E500 E504 E961 E565 E561
8 E213 E207 E200 E420 E201 E217 E426
9 E264 E258 E250 E421 E252 E267 E427
SDht
HSS-2 x DTiN
HSS-2 x DBright
HSCo-2 x Dnitr.
HSS-1.5 x DBright
HSS-1.5 x D
TiN
HSCo1.5 x D
Nitr.
HSCo-2 x DBright
HSCo-2 x DTiN
● 35
■ 25
■ 20
■ 16
● 25
■ 20
■ 16
■ 20
■ 16
■ 16
● 5 ■ 5
● 5 ■ 5
■ 3
● 5
■ 10
■ 8
■ 10
■ 8
● 5
■ 10
■ 8
● 5
■ 8
■ 20
■ 16
■ 20
■ 16
■ 10
■ 20
■ 16
■ 10
■ 16
■ 5
■ 5
● 5
■ 30
■ 20
■ 20
■ 15
■ 20
■ 20
■ 15
■ 20
■ 15
● 45
● 35
● 35
● 25
● 35
● 35
● 25
● 35
● 25
92.

Machining of P/M materials regarding Tapping
132
Recommended drill diameters (ISO metric coarse thread).
Table 18. Drill diameter for cutting taps.
Tap M Pitch, mm Max. Internal diameter, mm
Drilldiameter, mm
1.8 0.35 1.521 1.45
2 0.4 1.679 1.6
2.5 0.45 2.138 2.05
3 0.5 2.599 2.5
3.5 0.6 3.010 2.9
4 0.7 3.422 3.3
5 0.8 4.334 4.2
6 1 5.153 5
8 1.25 6.912 6.8
9 1.25 7.912 7.8
10 1.5 8.676 8.5
12 1.75 10.441 10.3
14 2 12.210 12
16 2 14.210 14
18 2.5 15.744 15.5
20 2.5 17.744 17.5
Table 19. Recommended diameters when using Dormer ADX and CDX drills, forcutting taps.
Tap M Pitch, mm Drilldiameter, mm
4 0.70 3.40
5 0.80 4.30
6 1.00 5.10
8 1.25 6.90
10 1.50 8.60
12 1.75 10.40
14 2.00 12.20
16 2.00 14.20
19.
20.

Tap and Cutting Data Recommendations
133
Table 20. Drill diameters for cold forming taps.
Tap M Max. Internal diameter, mm
Drilldiameter, mm
2 1.679 1.8
2.5 2.138 2.3
3 2.599 2.8
3.5 3.010 3.2
4 3.422 3.7
5 4.334 4.6
6 5.153 5.5
8 6.912 7.4
10 8.676 9.3
12 10.441 11.2
14 12.210 13.0
16 14.210 15.0
For cold forming taps the drill diameter is calculated on 65% of the theoretical thread profileheight.
Table 21. Recommended diameters when using Dormer ADX and CDX drills, forcutting taps.
Tap M Pitch, mm Drilldiameter, mm
4 0.70 3.40
5 0.80 4.30
6 1.00 5.10
8 1.25 6.90
10 1.50 8.60
12 1.75 10.40
14 2.00 12.20
16 2.00 14.20
21.
22.

Machining of P/M materials regarding Tapping
134

135
6 References
3 Turning [1] M. C. Shaw. Metal Cutting Principles, Oxford, 1997.
[2] A Thelin, “Verschleissmechanismen und Leistungen von Zerspanwerkzeugen” VDI Berichte, No. 762, 1989, pp. 111-126.
4 Drilling [1] O. W Reen: ‘The machinability of P/M materials’, Modern Developments in Powder
Metallurgy, Vol 10, pp. 431-452 (1977).
[2] M. C. Shaw. Metal cutting principles, Oxford, 1997.
[5] U. Engström: Machinability of Sintered Steel, Powder Mettalurgy, Vol 26, No 3 1983, p. 137-144.
[6] P. J. James: ‘The machinability of Sintered Steels’, PMI vol. 22 no. 6, 1990.
[7] O. Mårs. ‘Dynamic Properties of Warm Compacted High Strength Steels’ PM2 TEC ’96, Washington, 1996.
[8] L. Hultman, H Thoors, B. Steen: ” Influence of machining parameters on the machinability of sintered steels”, PM2TEC’96, Washington 1996.


![Machining Guidelines for Semi Finished Plastics [1]](https://img.pdfslide.net/doc/110x75/577cc6f41a28aba7119fa1c8/machining-guidelines-for-semi-finished-plastics-1.jpg)