Embed Size (px)
Citation preview
Chapter 38Network Intrusion Detection
David J. Marchette
38.1 Introduction
Attacks against computers and the Internet are in the news every week. Theseprimarily take the form of malicious code such as viruses and worms, or denialof service attacks. Less commonly reported are attacks which gain access tocomputers, either for the purpose of producing damage (such as defacing web sitesor deleting data) or for the opportunities such access provides to the attacker, suchas access to bank accounts or control systems of power stations. In a perspectivesarticle in Science (Wulf and Jones 2009) the authors argue that computer systemsare getting less secure, not more, and that traditional models of security based onperimeter defenses are not working. They argue for a “defense in depth” approach,but not one based on more layers of perimeter defense, but rather on different typesof defense; different security protocols; different types of detection methodologies;security protocols and defenses designed for the specific applications. Our view isthat one of the tools needed is statistical analysis, in particular for detecting suspi-cious activity. This chapter will discuss some of the areas in which computationalstatistics can be applied to these and related problems. We focus exclusively onthe detection of attacks, rather than defense (such as firewalls and other securityprotocols).
Several books are available that describe the basic ideas in intrusion detection.These include Amoroso (1999), anonymous (1997), Bace (2000), Escamilla (1998),Marchette (2001), Northcutt et al. (2001) and Proctor (2001). Intrusion detection istypically split into two separate problems. Network intrusion detection typicallylooks at traffic on the network, while host based intrusion detection involvescollecting data on a single host. Both involve very large and complex data sets, and
D.J. Marchette (�)Naval Surface Warfare Center, Dahlgren, VA, USAe-mail: [email protected]
J.E. Gentle et al. (eds.), Handbook of Computational Statistics, Springer Handbooksof Computational Statistics, DOI 10.1007/978-3-642-21551-3__38,© Springer-Verlag Berlin Heidelberg 2012
1139
1140 D.J. Marchette
both have aspects that lend themselves to statistical solutions. We will only touchon a few such; the reader is encouraged to investigate the references.
There are two basic approaches to network intrusion detection. Most existingsystems rely on signatures of attacks. This approach relies on some set of featuresthat can be extracted from the data that indicate the existence of an attack. Thisis analogous to the virus scanners, which look for a sequence of bytes that areindicative of a virus. In the network realm, this could be attempts to access servicesthat are denied, malformed packets, too many failed attempts to log in, et cetera.The second approach is anomaly detection. The “normal” activity of the networkis modeled, and outliers are indicative of attacks. The definition of “normal” isdependent on the type of attacks that one is interested in, and requires statisticalmodels.
This chapter will first describe the basics of the TCP/IP protocol, sufficientto understand the data and the examples given. Then we will look at detectingdenial of service attacks, and estimating the number of attacks on the Internet.Network data is streaming data, and we will discuss this and some areas in whichcomputational statistics can play a part. This will lead to a discussion of simplevisualization techniques applied to network data, with some discussion of the typesof insights that can be gained from this. We will then take a detour from networkdata and consider profiling. This will illustrate a type of anomaly detection, whichwill then be discussed within a network context. Finally we discuss some statisticaltechniques for anomaly detection in network security.
38.2 Basic TCP/IP
When you visit a web site, your request and the response data are sent as aseries of packets, each consisting of a header containing addressing and sequencinginformation, and a payload or data section in which the information resides. Packetsare typically relatively small (less than 1500 bytes). In order to analyze the trafficand detect attacks, one needs to collect the packets, and may need to process eitherthe header or the payload. We will (somewhat arbitrarily) denote an attack that canbe detected by investigating the header only a “network attack” while leaving thosethat require investigation of the payload in the “host attack” realm.
One reason for this distinction is encryption. If the data are encrypted (forexample, data from a secure web site), the header remains in the clear, and sothis information is still available for analysis by the statistician. The payload isinaccessible (assuming a sufficiently strong encryption scheme) and so cannot beused to detect attacks until it is decrypted at the destination host. For this reason (andothers), we consider any attack that requires investigation of the data in a packet tobe better detected at the host than on the network.
There are several protocols used on the Internet to ensure a level of performanceor reliability in the communication. We will briefly discuss TCP (the TransmissionControl Protocol), since it is one of the most important ones, and will allow us to
38 Network Intrusion Detection 1141
discuss a class of denial of service attacks. For more information about the variousprotocols, see Stevens (1994).
First, however, it is necessary that we discuss the Internet Protocol (IP). Thisprotocol is not reliable, in the sense that there is no mechanism in place to ensure thatpackets are received. The IP header contains the source and destination IP addresses,which are 32-bit integers identifying the sending and receiving computer for thepacket. There are other fields in the packet that are used to control the routing of thepacket, et cetera, but we will not dwell on these here. As always, interested readersshould investigate Stevens (1994) or any of the many books on the TCP/IP protocolsuite.
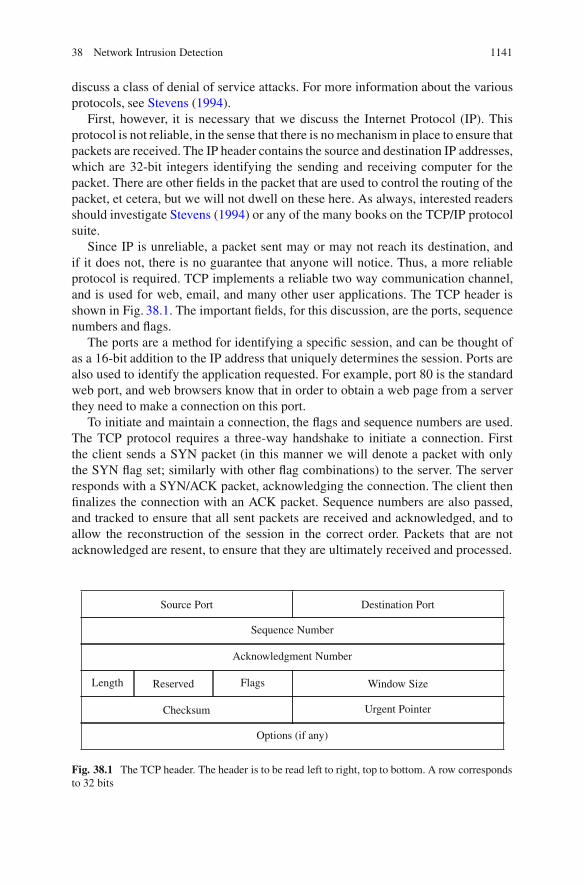
Since IP is unreliable, a packet sent may or may not reach its destination, andif it does not, there is no guarantee that anyone will notice. Thus, a more reliableprotocol is required. TCP implements a reliable two way communication channel,and is used for web, email, and many other user applications. The TCP header isshown in Fig. 38.1. The important fields, for this discussion, are the ports, sequencenumbers and flags.
The ports are a method for identifying a specific session, and can be thought ofas a 16-bit addition to the IP address that uniquely determines the session. Ports arealso used to identify the application requested. For example, port 80 is the standardweb port, and web browsers know that in order to obtain a web page from a serverthey need to make a connection on this port.
To initiate and maintain a connection, the flags and sequence numbers are used.The TCP protocol requires a three-way handshake to initiate a connection. Firstthe client sends a SYN packet (in this manner we will denote a packet with onlythe SYN flag set; similarly with other flag combinations) to the server. The serverresponds with a SYN/ACK packet, acknowledging the connection. The client thenfinalizes the connection with an ACK packet. Sequence numbers are also passed,and tracked to ensure that all sent packets are received and acknowledged, and toallow the reconstruction of the session in the correct order. Packets that are notacknowledged are resent, to ensure that they are ultimately received and processed.
Source Port Destination Port
Sequence Number
Acknowledgment Number
Length Reserved Flags Window Size
Checksum Urgent Pointer
Options (if any)
Fig. 38.1 The TCP header. The header is to be read left to right, top to bottom. A row correspondsto 32 bits
1142 D.J. Marchette
Once a session has been instantiated through the three-way handshake, packetsare acknowledged with packets in which the ACK flag is set. In this manner theprotocol can determine which packets have been received and which need to beresent. If a packet has not been acknowledged within a given time, the packetis resent, and this can happen several times before the system determines thatsomething has gone wrong and the session is dropped (usually by sending a reset(RST) packet). Note that this means that if there is no response to the SYN/ACKpacket acknowledging the initiation of the session there will be a period (of severalseconds) in which the session is kept open by the destination host as it tries resendingthe SYN/ACK hoping for a response. This is the basis of some denial of serviceattacks, which we will discuss in the next section.
38.3 Passive Sensing of Denial of Service Attacks
The TCP protocol provides a simple (and popular) method for denial of serviceattacks. The server has a finite number of connections that it can handle at a time,and will refuse connections when its table is full. Thus, if an attacker can fill thetable with bogus connections, legitimate users will be locked out.
This attack relies on two fundamental flaws in the protocols. The first is that thesource IP address is never checked, and thus can be “spoofed” by putting an arbitrary32 bit number in its place. Second, the three-way handshake requires the third(acknowledgment) packet, and the server will wait several seconds before timingout a connection. With each requested connection, the server allocates a space in itstable and waits for the final acknowledgment (or for the connection to time out). Theattacker can easily fill the table and keep it filled by sending spoofed SYN packetsto the server.
Thus, the attacker sends many SYN packets to the server, spoofed to appear tocome from a large number of different hosts. The server responds with SYN/ACKpackets to these hosts, and puts the connection in its table to await the final ACK, ora time-out (usually several seconds). Since the ACK packets are not forthcoming,the table quickly fills up, and stays full for as long as the attacker continues to sendpackets.
There are clever ways to mitigate this problem, which can keep the table fromfilling up. One, the “SYN-cookie” involves encoding the sequence number of theSYN/ACK in a way that allows the server to recognize legitimate ACK packetswithout needing to save a spot in the table for the connection. However, even thesecan be defeated through a sufficiently high volume attack.
These unsolicited SYN/ACK packets can be observed by any network sensor,and thus provide a method for estimating the number and severity of such attacksthroughout the Internet. These unsolicited packets are referred to as backscatter.They may take other forms than SYN/ACK packets, depending on the type of packetsent in the attack. See Moore et al. (2001), Marchette (2002), Marchette for moreinformation.
38 Network Intrusion Detection 1143
Typically, the attacker first compromises a large number of computers, usingspecial distributed attack software, and it is these computers that launch the attack.This makes it very difficult to block the attack, and essentially impossible to trackdown the attacker, at least through information available to the victim.
Backscatter packets provide several opportunities for statistical analysis. Theyallow the estimation of the number of attacks on the Internet in real time. One maybe able to estimate the severity of the attacks and number of attackers. Finally, itmay be possible to characterize different types of attacks or different attack toolsand identify them from the pattern of the packets. Some initial work describingsome of these ideas is found in Giles et al. (2003).
A network sensor is a computer that captures packets (usually just the packetheaders) as they traverse the network. These are usually placed either just before orjust after a firewall to collect all the packets coming into a network. Through such asystem, one can observe all the unsolicited SYN/ACK packets addressed to one ofthe IP addresses owned by the network.
Note that this means that only a fraction of the backscatter packets resulting fromthe attack are seen by any sensor. If we assume that the sensor is monitoring a classB network (an address space of 65; 536 IP addresses), then we observe a randomsample of 1=65; 536 of the packets, assuming the attack selects randomly from all232 possible IP addresses. This points to several areas of interest to statisticians: weobserve a subset of the packets sent to a subset of the victims, and wish to estimatethe number of victims, the number of packets sent to any given victim, and thenumber of attackers for any given victim.
38.4 Streaming Data
Network packets are streaming data. Standard statistical and data mining methodsdeal with a fixed data set. There is a concept of the size of the data set (usuallydenoted n) and algorithms are chosen based in part on their performance as afunction of n. In streaming data there is no n: the data are continually capturedand must be processed as they arrive. While one may collect a set of data to use todevelop algorithms, the nonstationarity of the data requires methods that can handlethe streaming data directly, and update their models on the fly.
Consider the problem of estimating the average amount of data transferred ina session for a web server. This is not stationary: there are diurnal effects; theremay be seasonal effects (for example at a university); there may be changes in thecontent at the server. We’d like a number calculated on a window of time that allowsus to track (and account for) the normal trends and detect changes from this normalactivity.
This requires some type of windowing or recursive technique. The recursiveversion of the sample mean is well known:
NXn D n � 1
nNXn�1 C 1
nXn:
1144 D.J. Marchette
Replacing n on the right hand side with a fixed constant N implements anexponential window on the mean. This was exploited in the NIDES intrusiondetection system (Anderson et al. 1995). Similar techniques can be used to computeother moments. An alternative formulation is:
OXn D .1 � �/XnC1 C � Oxn�1;
for 0 < � < 1. � may be fixed or may itself change based on some statistic of thedata.
In fact, the kernel density estimator has a simple recursive version, that allows therecursive estimate of the kernel density estimator at a fixed grid of points. Yamato(1971), Wegman and Davies (1979) give two versions of this:
Ofn.x/ D n � 1
nOfn�1.x/ C 1
nhn
K
�x � Xn
hn
�
Lfn.x/ D n � 1
n
�hn�1
hn
� 12 Lfn�1.x/ C 1
nhn
K
�x � Xn
hn
�:
In either case, fixing n at a constant and hn either at a constant or a recursivelyestimated value implements an exponentially windowed version of the kernelestimator. (Similarly, one can phrase this in terms of � as was done with themean; see Wegman and Marchette 2004). These can in turn be used to estimatethe “normal” activity of various measurements on the network, and provide amechanism for detecting changes from normal, which in turn may indicate attacks.More information on these issues can be found in Wegman and Marchette (2004).
Similar approaches can be implemented for other density estimation techniques.In particular, the adaptive mixtures approach of Priebe (1994) has a simple recursiveformulation that can be adapted to streaming data.
There are several applications of density estimation to intrusion detection thatone might consider. It is obvious that unusually large downloads (or uploads) maybe suspicious in some environments. While it is not clear that density estimationis needed for this application, there might be some value in detecting changes inupload/download behavior. This can be detected through the tracking of the numberof bytes transferred per session.
Perhaps a more compelling application is the detection of trojan programs.A trojan is a program that appears to be a legitimate program (such as a telnet server)but acts maliciously, for example to allow access to the computer by unauthorizedusers. Obviously the detection of trojans is an important aspect of computer security.
Most applications (web, email, ftp, et cetera) have assigned ports on which theyoperate. Other applications may choose to use fixed ports, or may choose anyavailable port. Detecting new activity on a given port is a simple way to detecta trojan program. More sophisticated trojans will replace a legitimate application,such as a web server. It is thus desirable to determine when a legitimate applicationis acting in a manner that is unusual.
38 Network Intrusion Detection 1145
0 500 1000 1500
0.00
000.
0010
0.00
200.
0030
Web
Packet Length
Den
sity
30 40 50 60 70 80 90
0.00
0.02
0.04
0.06
Secure Shell
Packet Length
Den
sity
0.00 0.05 0.10 0.15 0.20
100
500
150
Web
Interarrival Time
Den
sity
0 2 4 6 8 10
0.00
0.05
0.10
0.15
0.20
0.25
Secure Shell
Interarrival Time
Den
sity
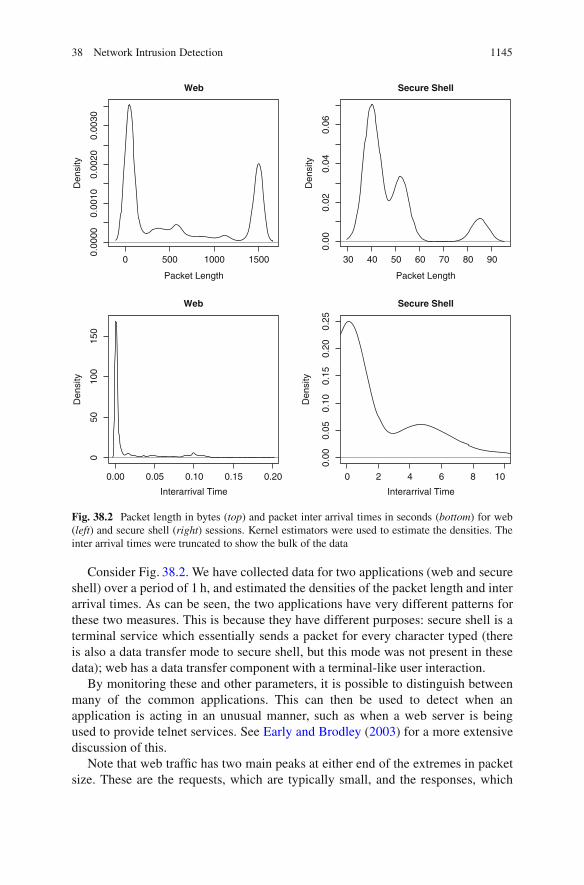
Fig. 38.2 Packet length in bytes (top) and packet inter arrival times in seconds (bottom) for web(left) and secure shell (right) sessions. Kernel estimators were used to estimate the densities. Theinter arrival times were truncated to show the bulk of the data
Consider Fig. 38.2. We have collected data for two applications (web and secureshell) over a period of 1 h, and estimated the densities of the packet length and interarrival times. As can be seen, the two applications have very different patterns forthese two measures. This is because they have different purposes: secure shell is aterminal service which essentially sends a packet for every character typed (thereis also a data transfer mode to secure shell, but this mode was not present in thesedata); web has a data transfer component with a terminal-like user interaction.
By monitoring these and other parameters, it is possible to distinguish betweenmany of the common applications. This can then be used to detect when anapplication is acting in an unusual manner, such as when a web server is beingused to provide telnet services. See Early and Brodley (2003) for a more extensivediscussion of this.
Note that web traffic has two main peaks at either end of the extremes in packetsize. These are the requests, which are typically small, and the responses, which
1146 D.J. Marchette
are pages or images and are broken up into the largest packets possible. The massbetween the peaks mostly represent the last packets of transfers which are not amultiple of the maximum packet size, and small transfers that fit within a singlepacket.
The inter packet arrival times for secure shell also have two peaks. The shorttimes correspond to responses (such as the response to a directory list command)and to characters typed quickly. The later bump probably corresponds to the pausesbetween commands, as the user processes the response. These arrival times arevery heavy tailed because of the nature of secure shell. Sessions can be left openindefinitely, and if no activity occurs for a sufficiently long time, “keep alive”packets are sent to ensure that the session is still valid.
In Early and Brodley (2003) it is shown, in fact, that differences in the counts forthe TCP flags can be used to differentiate applications. These, combined with meaninter packet arrival times and packet lengths (all computed on a window of n packetsfor various values of n), do a very creditable job of distinguishing applications. Thisis clearly an area in which recursive methods like those mentioned above would beof value. It also is reasonable to hypothesize that estimating densities, rather thenonly computing the mean, would improve the performance.
By detecting changes in the densities of applications it may be possible to detectwhen they have been compromised (or replaced) by a trojan program. It may alsobe possible to detect programs that are not performing as advertised (web serversacting like telnet servers, for example).
38.5 Visualization
Visualization of complex data is important but difficult. This is especially trueof streaming data. While many complex techniques for visualization have beendeveloped, simple scatter plots can be used effectively, and should not be shunned.
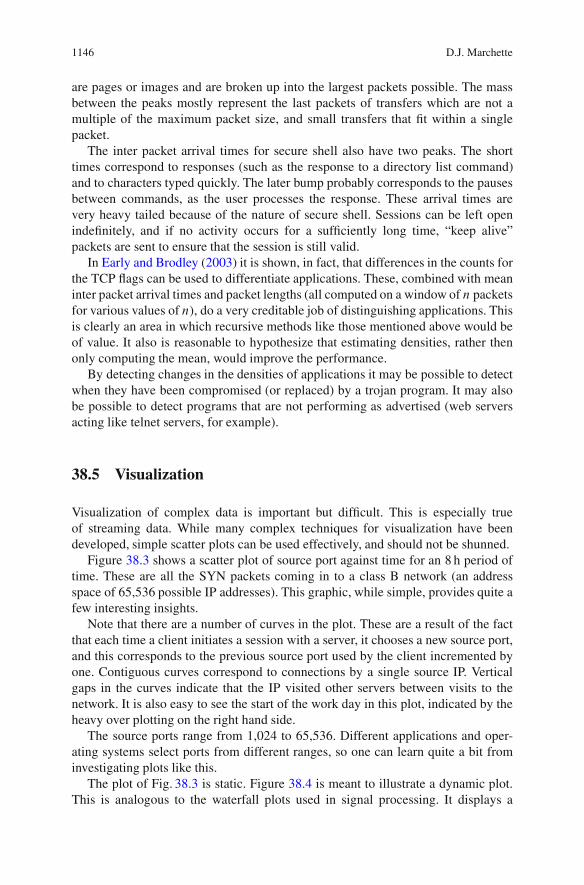
Figure 38.3 shows a scatter plot of source port against time for an 8 h period oftime. These are all the SYN packets coming in to a class B network (an addressspace of 65,536 possible IP addresses). This graphic, while simple, provides quite afew interesting insights.
Note that there are a number of curves in the plot. These are a result of the factthat each time a client initiates a session with a server, it chooses a new source port,and this corresponds to the previous source port used by the client incremented byone. Contiguous curves correspond to connections by a single source IP. Verticalgaps in the curves indicate that the IP visited other servers between visits to thenetwork. It is also easy to see the start of the work day in this plot, indicated by theheavy over plotting on the right hand side.
The source ports range from 1,024 to 65,536. Different applications and oper-ating systems select ports from different ranges, so one can learn quite a bit frominvestigating plots like this.
The plot of Fig. 38.3 is static. Figure 38.4 is meant to illustrate a dynamic plot.This is analogous to the waterfall plots used in signal processing. It displays a

38 Network Intrusion Detection 1147
1000
2000
3000
4000
5000
Time (hours)0 2 4 6 8
Sou
rce
Por
t
Fig. 38.3 Source port versus time for all the incoming SYN packets for an 8 h period
Time
Sou
rce
Por
t
Fig. 38.4 Source port versus time for a short time period, the last two hours from Fig. 38.3. Astime progresses, the plot shifts from right to left, dropping the left most column and adding a newcolumn on the right
1148 D.J. Marchette
snapshot in time that is continuously updated. As new observations are obtainedthey are plotted on the right, with the rest of the data shifting left, dropping the leftmost column. Plots like this are required for streaming data.
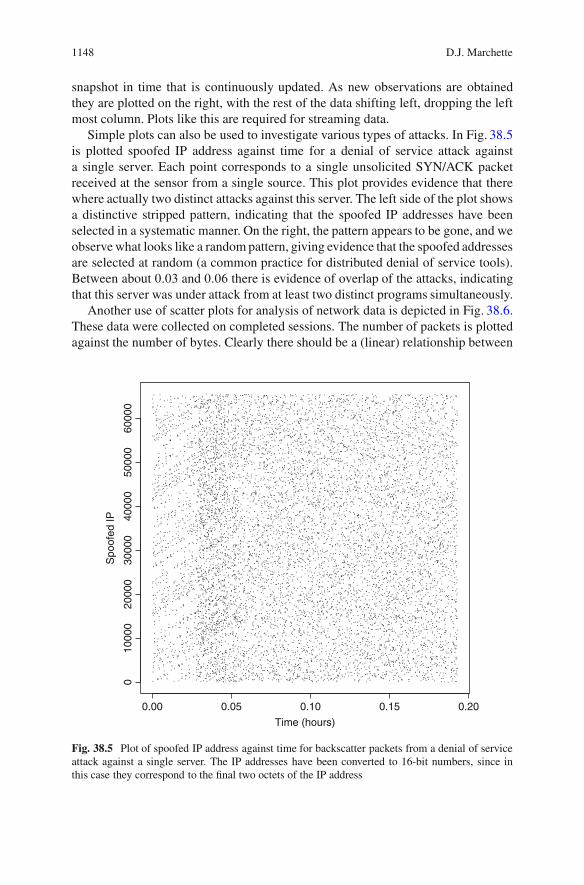
Simple plots can also be used to investigate various types of attacks. In Fig. 38.5is plotted spoofed IP address against time for a denial of service attack againsta single server. Each point corresponds to a single unsolicited SYN/ACK packetreceived at the sensor from a single source. This plot provides evidence that therewhere actually two distinct attacks against this server. The left side of the plot showsa distinctive stripped pattern, indicating that the spoofed IP addresses have beenselected in a systematic manner. On the right, the pattern appears to be gone, and weobserve what looks like a random pattern, giving evidence that the spoofed addressesare selected at random (a common practice for distributed denial of service tools).Between about 0:03 and 0:06 there is evidence of overlap of the attacks, indicatingthat this server was under attack from at least two distinct programs simultaneously.
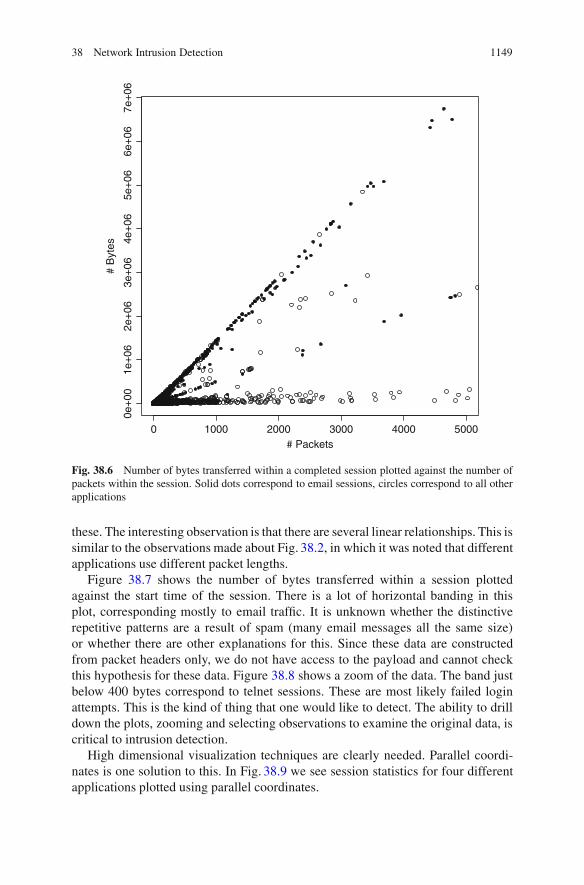
Another use of scatter plots for analysis of network data is depicted in Fig. 38.6.These data were collected on completed sessions. The number of packets is plottedagainst the number of bytes. Clearly there should be a (linear) relationship between
0.00 0.05 0.10 0.15 0.20
010
000
2000
030
000
4000
050
000
6000
0
Time (hours)
Spo
ofed
IP
Fig. 38.5 Plot of spoofed IP address against time for backscatter packets from a denial of serviceattack against a single server. The IP addresses have been converted to 16-bit numbers, since inthis case they correspond to the final two octets of the IP address
38 Network Intrusion Detection 1149
0 1000 2000 3000 4000 5000
0e+
001e
+06
2e+
063e
+06
4e+
065e
+06
6e+
067e
+06
# Packets
# B
ytes
Fig. 38.6 Number of bytes transferred within a completed session plotted against the number ofpackets within the session. Solid dots correspond to email sessions, circles correspond to all otherapplications
these. The interesting observation is that there are several linear relationships. This issimilar to the observations made about Fig. 38.2, in which it was noted that differentapplications use different packet lengths.
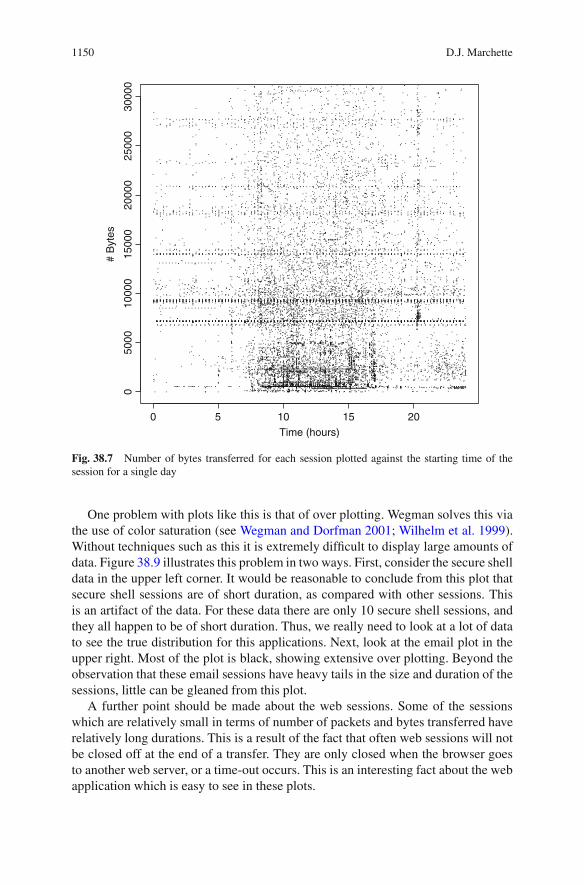
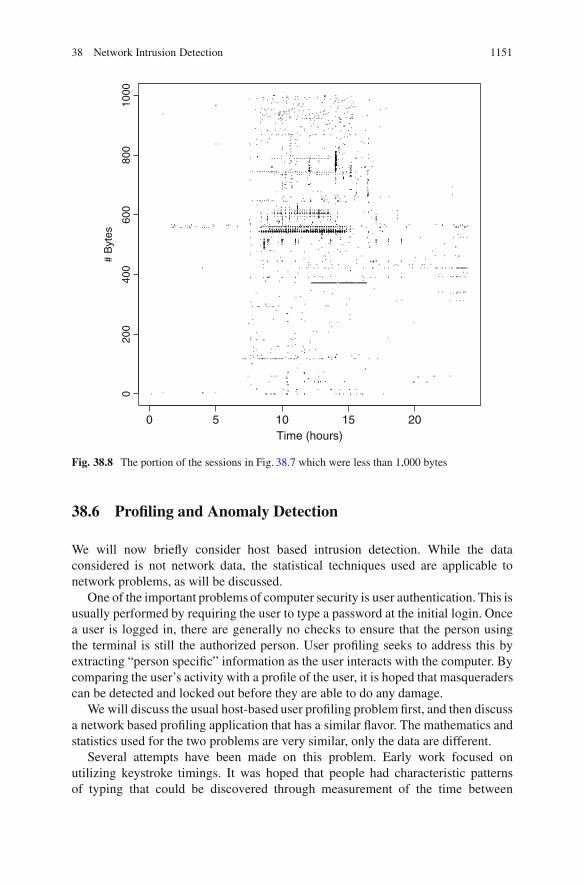
Figure 38.7 shows the number of bytes transferred within a session plottedagainst the start time of the session. There is a lot of horizontal banding in thisplot, corresponding mostly to email traffic. It is unknown whether the distinctiverepetitive patterns are a result of spam (many email messages all the same size)or whether there are other explanations for this. Since these data are constructedfrom packet headers only, we do not have access to the payload and cannot checkthis hypothesis for these data. Figure 38.8 shows a zoom of the data. The band justbelow 400 bytes correspond to telnet sessions. These are most likely failed loginattempts. This is the kind of thing that one would like to detect. The ability to drilldown the plots, zooming and selecting observations to examine the original data, iscritical to intrusion detection.
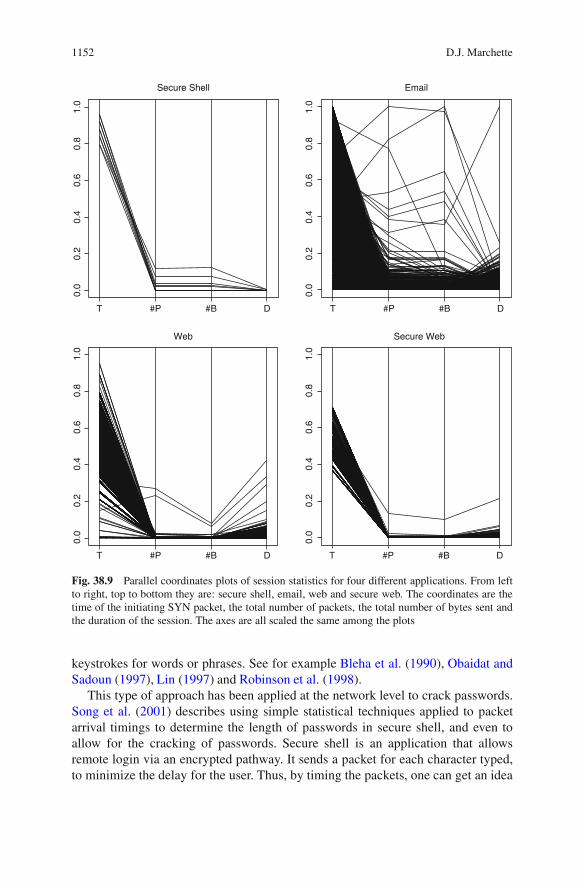
High dimensional visualization techniques are clearly needed. Parallel coordi-nates is one solution to this. In Fig. 38.9 we see session statistics for four differentapplications plotted using parallel coordinates.
1150 D.J. Marchette
151050 20
050
0010
000
1500
020
000
2500
030
000
Time (hours)
# B
ytes
Fig. 38.7 Number of bytes transferred for each session plotted against the starting time of thesession for a single day
One problem with plots like this is that of over plotting. Wegman solves this viathe use of color saturation (see Wegman and Dorfman 2001; Wilhelm et al. 1999).Without techniques such as this it is extremely difficult to display large amounts ofdata. Figure 38.9 illustrates this problem in two ways. First, consider the secure shelldata in the upper left corner. It would be reasonable to conclude from this plot thatsecure shell sessions are of short duration, as compared with other sessions. Thisis an artifact of the data. For these data there are only 10 secure shell sessions, andthey all happen to be of short duration. Thus, we really need to look at a lot of datato see the true distribution for this applications. Next, look at the email plot in theupper right. Most of the plot is black, showing extensive over plotting. Beyond theobservation that these email sessions have heavy tails in the size and duration of thesessions, little can be gleaned from this plot.
A further point should be made about the web sessions. Some of the sessionswhich are relatively small in terms of number of packets and bytes transferred haverelatively long durations. This is a result of the fact that often web sessions will notbe closed off at the end of a transfer. They are only closed when the browser goesto another web server, or a time-out occurs. This is an interesting fact about the webapplication which is easy to see in these plots.
38 Network Intrusion Detection 1151
1050 15 20
020
040
060
080
010
00
Time (hours)
# B
ytes
Fig. 38.8 The portion of the sessions in Fig. 38.7 which were less than 1,000 bytes
38.6 Profiling and Anomaly Detection
We will now briefly consider host based intrusion detection. While the dataconsidered is not network data, the statistical techniques used are applicable tonetwork problems, as will be discussed.
One of the important problems of computer security is user authentication. This isusually performed by requiring the user to type a password at the initial login. Oncea user is logged in, there are generally no checks to ensure that the person usingthe terminal is still the authorized person. User profiling seeks to address this byextracting “person specific” information as the user interacts with the computer. Bycomparing the user’s activity with a profile of the user, it is hoped that masqueraderscan be detected and locked out before they are able to do any damage.
We will discuss the usual host-based user profiling problem first, and then discussa network based profiling application that has a similar flavor. The mathematics andstatistics used for the two problems are very similar, only the data are different.
Several attempts have been made on this problem. Early work focused onutilizing keystroke timings. It was hoped that people had characteristic patternsof typing that could be discovered through measurement of the time between
1152 D.J. Marchette
T #P #B D0.
00.
20.
40.
60.
81.
0T #P #B D
0.0
0.2
0.4
0.6
0.8
1.0
Secure Shell Email
T #P #B D
0.0
0.2
0.4
0.6
0.8
1.0
T #P #B D
0.0
0.2
0.4
0.6
0.8
1.0
Web Secure Web
Fig. 38.9 Parallel coordinates plots of session statistics for four different applications. From leftto right, top to bottom they are: secure shell, email, web and secure web. The coordinates are thetime of the initiating SYN packet, the total number of packets, the total number of bytes sent andthe duration of the session. The axes are all scaled the same among the plots
keystrokes for words or phrases. See for example Bleha et al. (1990), Obaidat andSadoun (1997), Lin (1997) and Robinson et al. (1998).
This type of approach has been applied at the network level to crack passwords.Song et al. (2001) describes using simple statistical techniques applied to packetarrival timings to determine the length of passwords in secure shell, and even toallow for the cracking of passwords. Secure shell is an application that allowsremote login via an encrypted pathway. It sends a packet for each character typed,to minimize the delay for the user. Thus, by timing the packets, one can get an idea
38 Network Intrusion Detection 1153
of what key combinations are being sent (it takes longer to type two characters withthe same finger than it does if the characters are typed by fingers on different hands,for example). By utilizing statistics such as these, the authors were able to show thatthey could dramatically reduce the search space needed to crack the passwords.
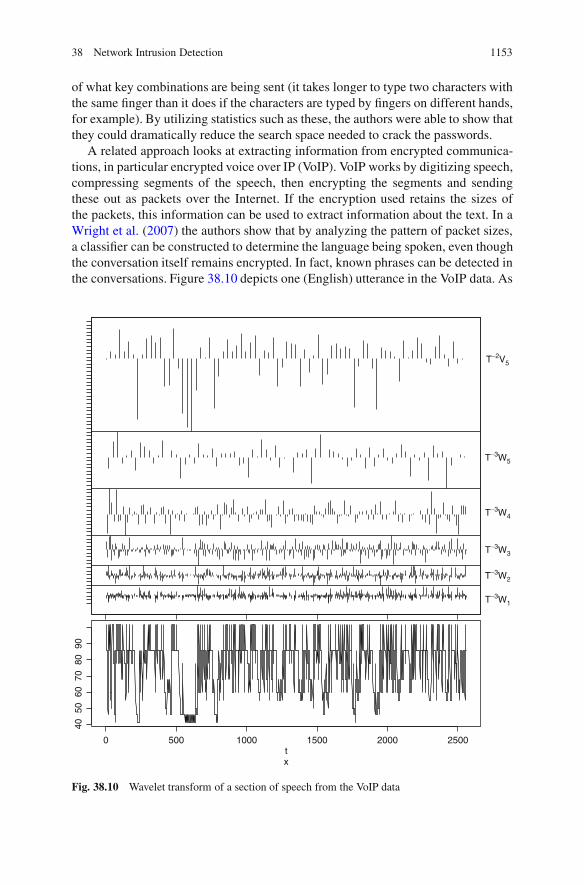
A related approach looks at extracting information from encrypted communica-tions, in particular encrypted voice over IP (VoIP). VoIP works by digitizing speech,compressing segments of the speech, then encrypting the segments and sendingthese out as packets over the Internet. If the encryption used retains the sizes ofthe packets, this information can be used to extract information about the text. In aWright et al. (2007) the authors show that by analyzing the pattern of packet sizes,a classifier can be constructed to determine the language being spoken, even thoughthe conversation itself remains encrypted. In fact, known phrases can be detected inthe conversations. Figure 38.10 depicts one (English) utterance in the VoIP data. As
0 500 1000 1500 2000 2500
4050
6070
8090
xt
T−2V5
T−3W5
T−3W4
T−3W3
T−3W2
T−3W1
Fig. 38.10 Wavelet transform of a section of speech from the VoIP data
1154 D.J. Marchette
can be seen, there is quite a bit of structure in the data, and Wright et al. (2007) showthat this structure can be exploited to extract information about the conversation.This kind of statistical analysis of encrypted information has important implicationsfor privacy as well as security.
Other profiling work focuses on tracking user commands. The idea is that thecommand streams that users type (ignoring the arguments to the commands) couldbe used to authenticate the user in much the same way that keystroke timings could.A good discussion of this for statisticians can be found in Schonlau et al. (2001).See also Maxion (2003), Maxion and Townsend (2002) for some critiques of thiswork and extensions. The former paper considers arguments to the commands aswell.
For Microsoft Windows operating systems, user command sequences are gener-ally not applicable. Instead, window titles may be used. These correspond roughlyto the same information that is contained in the Unix command lines. They typicallycontain the application name and the arguments to the applications such as the fileopen, the email subject, the web page visited, et cetera.
To illustrate this, we consider a set of data taken from six users on seven WindowsNT machines over a period of several months. All window titles generated from thelogin to the logout were retained for each user/host pair (only one of the users wasobserved on a second host). Each time a window became active it was recorded.These data are a subset of a larger set. More information on these data, with someanalysis of the data and performance of various classifiers can be found in DeVaultet al. (2003).
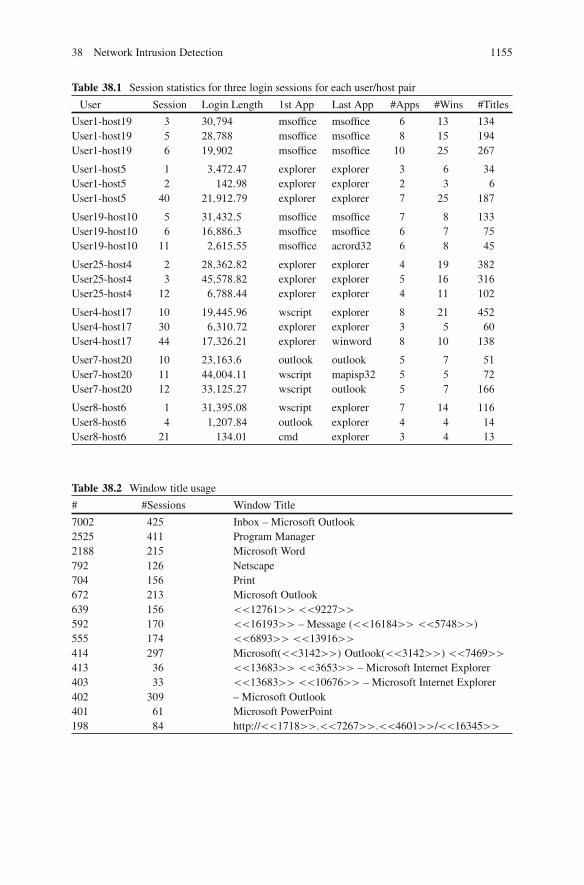
Table 38.1 shows some statistics on these data. Three sessions are shown foreach user/host pair. The length of the login session (in seconds), the name ofthe first and last applications used within the session, and the number of distinctapplications, windows and window titles are shown. The task is to extract statisticsfrom a completed login session that allow one to determine whether the user was theauthorized user indicated by the userid. This is an easier problem than masqueraderdetection, in which one tries to detect the masquerader (or authenticate the user) asthe session progresses, and it is not assumed that the entire session corresponds to asingle user (or masquerader).
The table indicates that there is some variability among the sessions of individualusers, and this is born out by further analysis. Table 38.2 shows the most commonwindow titles. The number of times the title occurs in the data set, the number oflogin sessions in which the title occurs, and the title itself are shown. Some wordsin the titles have been obfuscated by replacement with numbers in double brackets,to protect the privacy of the users. All common application and operating systemwords were left alone. The obfuscation is consistent across all sessions: there is abijection between numbers and words that holds throughout the data.
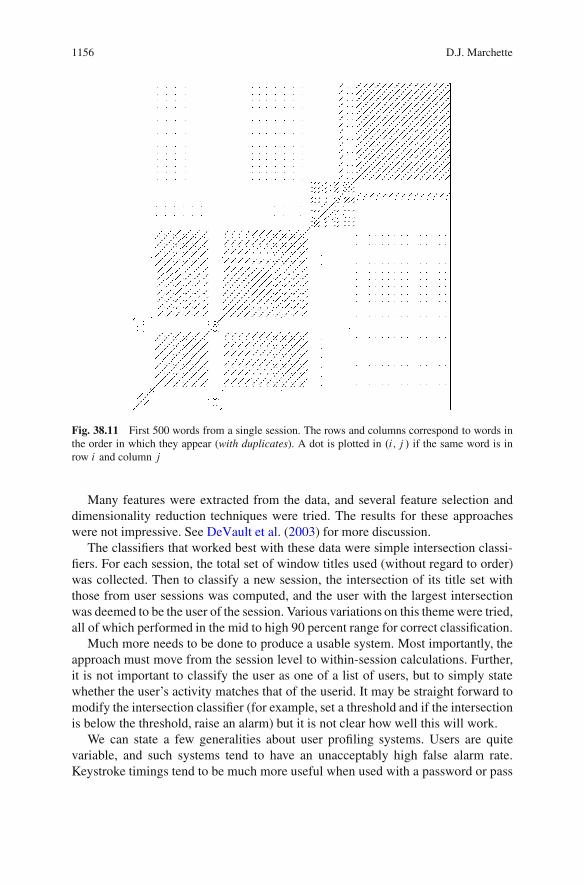
Figure 38.11 shows part of a single login session. The rows and columnscorrespond to the list of words (as they appear in the titles) and a dot is placedwhere the word appears in both the row and column. The blocks of diagonal linesare characteristic of a single window in session. The “plus” in the lower left cornershows a case of the user switching windows, then switching back. This type ofbehavior is seen throughout the data.
38 Network Intrusion Detection 1155
Table 38.1 Session statistics for three login sessions for each user/host pair
User Session Login Length 1st App Last App #Apps #Wins #Titles
User1-host19 3 30;794 msoffice msoffice 6 13 134
User1-host19 5 28;788 msoffice msoffice 8 15 194
User1-host19 6 19;902 msoffice msoffice 10 25 267
User1-host5 1 3;472:47 explorer explorer 3 6 34
User1-host5 2 142:98 explorer explorer 2 3 6
User1-host5 40 21;912:79 explorer explorer 7 25 187
User19-host10 5 31;432:5 msoffice msoffice 7 8 133
User19-host10 6 16;886:3 msoffice msoffice 6 7 75
User19-host10 11 2;615:55 msoffice acrord32 6 8 45
User25-host4 2 28;362:82 explorer explorer 4 19 382
User25-host4 3 45;578:82 explorer explorer 5 16 316
User25-host4 12 6;788:44 explorer explorer 4 11 102
User4-host17 10 19;445:96 wscript explorer 8 21 452
User4-host17 30 6;310:72 explorer explorer 3 5 60
User4-host17 44 17;326:21 explorer winword 8 10 138
User7-host20 10 23;163:6 outlook outlook 5 7 51
User7-host20 11 44;004:11 wscript mapisp32 5 5 72
User7-host20 12 33;125:27 wscript outlook 5 7 166
User8-host6 1 31;395:08 wscript explorer 7 14 116
User8-host6 4 1;207:84 outlook explorer 4 4 14
User8-host6 21 134:01 cmd explorer 3 4 13
Table 38.2 Window title usage
# #Sessions Window Title
7002 425 Inbox – Microsoft Outlook2525 411 Program Manager2188 215 Microsoft Word792 126 Netscape704 156 Print672 213 Microsoft Outlook639 156 <<12761>> <<9227>>
592 170 <<16193>> – Message (<<16184>> <<5748>>)555 174 <<6893>> <<13916>>
414 297 Microsoft(<<3142>>) Outlook(<<3142>>) <<7469>>
413 36 <<13683>> <<3653>> – Microsoft Internet Explorer403 33 <<13683>> <<10676>> – Microsoft Internet Explorer402 309 – Microsoft Outlook401 61 Microsoft PowerPoint198 84 http://<<1718>>.<<7267>>.<<4601>>/<<16345>>
1156 D.J. Marchette
Fig. 38.11 First 500 words from a single session. The rows and columns correspond to words inthe order in which they appear (with duplicates). A dot is plotted in .i; j / if the same word is inrow i and column j
Many features were extracted from the data, and several feature selection anddimensionality reduction techniques were tried. The results for these approacheswere not impressive. See DeVault et al. (2003) for more discussion.
The classifiers that worked best with these data were simple intersection classi-fiers. For each session, the total set of window titles used (without regard to order)was collected. Then to classify a new session, the intersection of its title set withthose from user sessions was computed, and the user with the largest intersectionwas deemed to be the user of the session. Various variations on this theme were tried,all of which performed in the mid to high 90 percent range for correct classification.
Much more needs to be done to produce a usable system. Most importantly, theapproach must move from the session level to within-session calculations. Further,it is not important to classify the user as one of a list of users, but to simply statewhether the user’s activity matches that of the userid. It may be straight forward tomodify the intersection classifier (for example, set a threshold and if the intersectionis below the threshold, raise an alarm) but it is not clear how well this will work.
We can state a few generalities about user profiling systems. Users are quitevariable, and such systems tend to have an unacceptably high false alarm rate.Keystroke timings tend to be much more useful when used with a password or pass

38 Network Intrusion Detection 1157
phrase than in free typing. No single technique exists which can be used reliably toauthenticate users as they work.
The intersection classifier leads to interesting statistics. We can construct graphsusing these intersections, each node of the graph corresponding to a session, with anedge between two nodes if their sets intersect nontrivially (or have an intersectionof size at least T ).
In another context (profiling the web server usage of users) Marchette (2003)discusses various analyses that can be done on these graphs. This uses networkdata, extracting the source and destination IP addresses from the sessions. In thesedata there is a one-to-one correspondence between source IP address and user, sinceall the machines considered were single user machines.
In this case the nodes correspond to users and the sets consist of the web serversvisited by the user within a period of a week. A random graph model, first describedin Karonski et al. (1999) is used as the null hypothesis corresponding to randomselection of servers. The model assumes a set S of servers from which the usersdraw. To define the set of servers for a given user, each server is drawn withprobability p. Thus, given the observations of the sets Si drawn by the users, wemust estimate the two parameters of the model: m D jSj and p. These can beestimated using maximum likelihood (see also Marchette 2004 for discussion ofthis and other types of intersection graphs). With the notation
ki D jSi j
Mi D ji[
j D1
Sj j
ui D Mi � Mi�1;
the likelihood is easily shown to be
L DnY
j D1
Mj �1
kj � uj
! m � Mj �1
uj
!pkj .1 � p/m�kj :
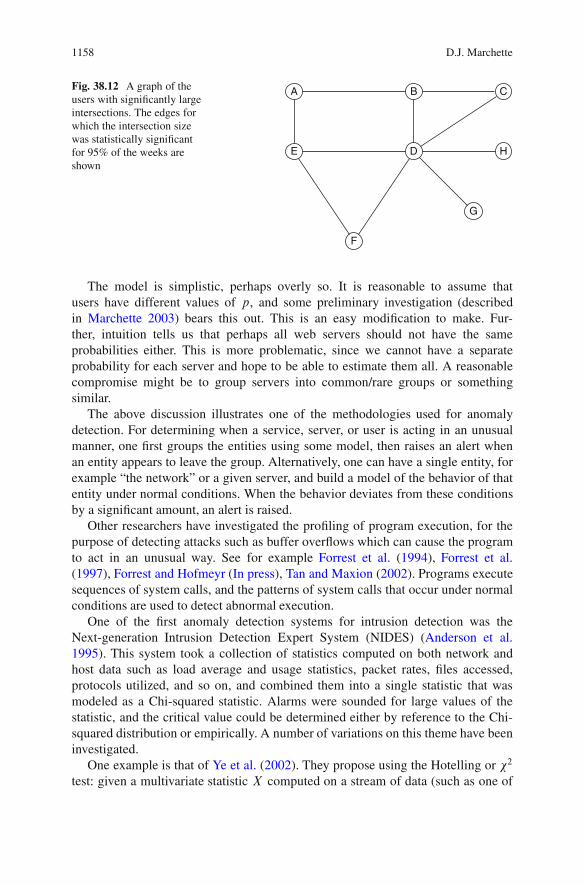
Using data collected for several months, Marchette (2003) computed the prob-ability of any given edge, under the null hypothesis, and retained those that had asignificantly large intersection (after correcting for the multiple hypotheses tested).The most common of these were retained, and the resulting graph is shown inFig. 38.12.
There are two triangles in Fig. 38.12, and it turns out that the users in thesecorrespond to physicists working on fluid dynamics problems. Users A, D and E aresystem administrators. Thus, there is some reason to believe that the relationshipswe have discovered are interesting.
1158 D.J. Marchette
A B C
DE
F
G
H
Fig. 38.12 A graph of theusers with significantly largeintersections. The edges forwhich the intersection sizewas statistically significantfor 95% of the weeks areshown
The model is simplistic, perhaps overly so. It is reasonable to assume thatusers have different values of p, and some preliminary investigation (describedin Marchette 2003) bears this out. This is an easy modification to make. Fur-ther, intuition tells us that perhaps all web servers should not have the sameprobabilities either. This is more problematic, since we cannot have a separateprobability for each server and hope to be able to estimate them all. A reasonablecompromise might be to group servers into common/rare groups or somethingsimilar.
The above discussion illustrates one of the methodologies used for anomalydetection. For determining when a service, server, or user is acting in an unusualmanner, one first groups the entities using some model, then raises an alert whenan entity appears to leave the group. Alternatively, one can have a single entity, forexample “the network” or a given server, and build a model of the behavior of thatentity under normal conditions. When the behavior deviates from these conditionsby a significant amount, an alert is raised.
Other researchers have investigated the profiling of program execution, for thepurpose of detecting attacks such as buffer overflows which can cause the programto act in an unusual way. See for example Forrest et al. (1994), Forrest et al.(1997), Forrest and Hofmeyr (In press), Tan and Maxion (2002). Programs executesequences of system calls, and the patterns of system calls that occur under normalconditions are used to detect abnormal execution.
One of the first anomaly detection systems for intrusion detection was theNext-generation Intrusion Detection Expert System (NIDES) (Anderson et al.1995). This system took a collection of statistics computed on both network andhost data such as load average and usage statistics, packet rates, files accessed,protocols utilized, and so on, and combined them into a single statistic that wasmodeled as a Chi-squared statistic. Alarms were sounded for large values of thestatistic, and the critical value could be determined either by reference to the Chi-squared distribution or empirically. A number of variations on this theme have beeninvestigated.
One example is that of Ye et al. (2002). They propose using the Hotelling or �2
test: given a multivariate statistic X computed on a stream of data (such as one of
38 Network Intrusion Detection 1159
the collections of variables used in the NIDES approach), compute
T 2 D n.n � p/
p.n C 1/.n � 1/.X � X/0S�1.X � X/ (38.1)
�2 DpX
j D1
.Xj � Xj /2
Xj
(38.2)
where X is the mean and S is the sample covariance. If everything is normallydistributed, these have known distributions, and critical values can be set fordetection of anomalies. As always, in real problems it is advisable to set thecritical values empirically, or at least to verify that the theoretical distributions areapproximately correct. A similar approach is described in Oshima et al. (2009) fordetection of denial of service attacks, and in Zhou et al. (2006) for user profiling.
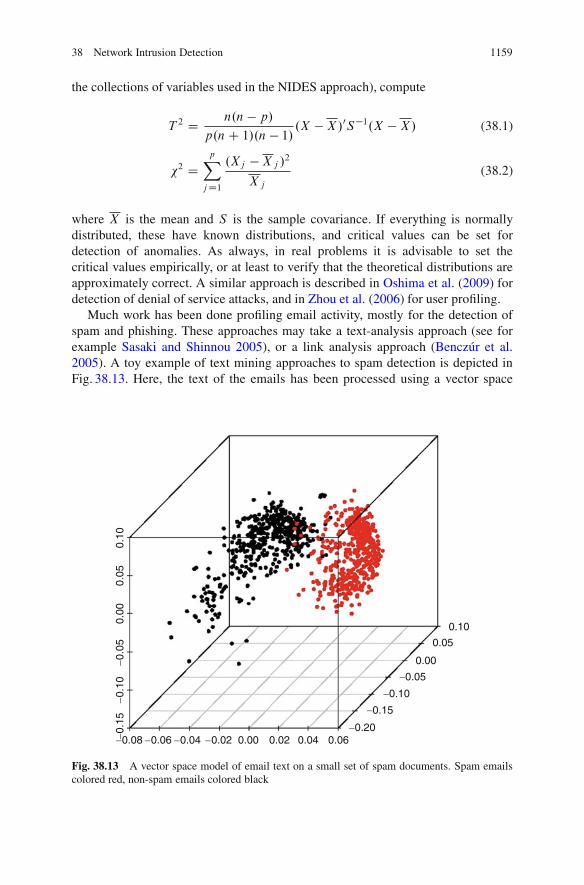
Much work has been done profiling email activity, mostly for the detection ofspam and phishing. These approaches may take a text-analysis approach (see forexample Sasaki and Shinnou 2005), or a link analysis approach (Benczúr et al.2005). A toy example of text mining approaches to spam detection is depicted inFig. 38.13. Here, the text of the emails has been processed using a vector space
−0.08−0.1
5−0
.10
−0.0
50.
000.
050.
10
−0.20
−0.15
−0.10
−0.05
0.00
0.05
0.10
−0.06 −0.04 −0.02 0.00 0.02 0.04 0.06
Fig. 38.13 A vector space model of email text on a small set of spam documents. Spam emailscolored red, non-spam emails colored black
1160 D.J. Marchette
(bag-of-words) model. Each email message d is represented as a vector of valuesfor each possible word w:
XŒd; w� D log
�f .w; d /
f .w; C /
�; (38.3)
where C is the corpus of all emails, and f denotes frequency: thus f .w; d / is thefrequency with which the word w occurs in the email (document) d , and f .w; C /
is the frequency with which the word occurs overall in the corpus of emails. Here,X corresponds to mutual information. As can be seen in the figure, for this tinyexample corpus (about 400 emails), the spam separates quite well from the non-spam.
Spam has many other properties that must be taken into account to turn asimple like this into a useful approach to the problem, however. Spammers areconstantly modifying their emails to defeat anti-spam filters. Adaptive approaches,and more sophisticated text analysis approaches, must be combined with approachesthat utilize the way spam is addressed and routed to produce good reliable spamdetection algorithms.
Email activity can also be profiled to look for unusual activity that could beindicative of either a virus propagating or an insider threat. Related work can befound in Priebe et al. (2005), where the problem of detecting an unusual patternof activity in an email communications graph is considered. This work defined ascan statistic on graphs, analogous to the scan statistic approach used in many otherapplications for one and two dimensional data (Glaz et al. 2010). This approach usesscan statistics to detect regions in the time series of Enron communications graphsin which Enron executives had an unusual amount of communication (“chatter”).The Enron graphs correspond to directed graphs computed weekly: and edge existsfrom one email address to another if there was at least one email sent during thecorresponding week.
The scan statistic for graphs is defined as follows. Given a directed graph G withvertex set V D V.G/ and edge set E D E.G/, the digraph distance d.v; w/ betweentwo vertices v; w 2 V is defined to be the minimum directed path length from v to win G. For a non-negative integer k and vertex v 2 V consider the closed kth-orderneighborhood of v in G, denoted NkŒvI G� D fw 2 V.G/ W d.v; w/ � kg. The scanregion is the induced subdigraph of this neighborhood, denoted ˝.NkŒvI G�/. Alocality statistic at location v and scale k is any specified digraph invariant �k.vI G/
of the scan region ˝.NkŒvI G�/. The scan statistic is the maximum of the localitystatistics over the vertices.
In Priebe et al. (2005), a time series of graphs is considered, G1; : : : ; GT , and thelocality statistics are normalized: given a window width � , define
�.v; t/ D 1
�
�XiD1
�k.vI Gt�i / (38.4)
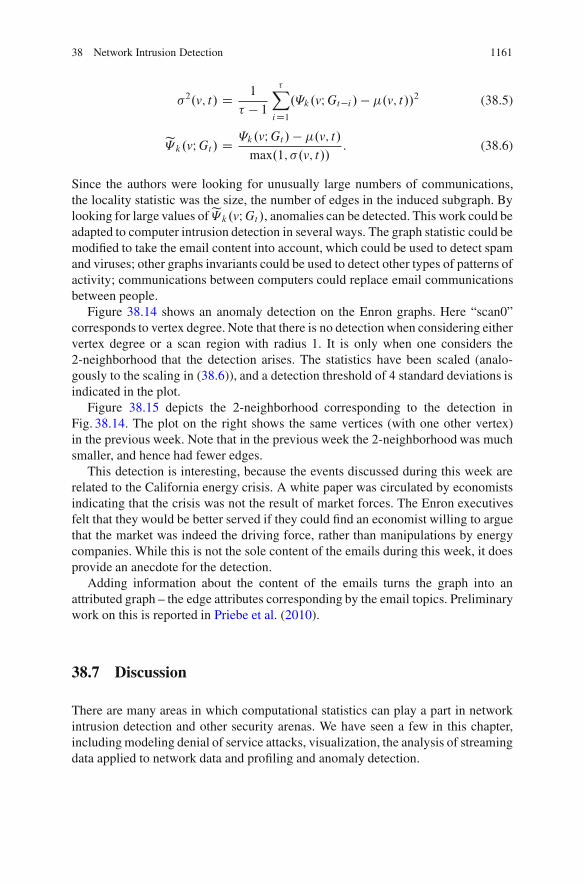
38 Network Intrusion Detection 1161
�2.v; t/ D 1
� � 1
�XiD1
.�k.vI Gt�i / � �.v; t//2 (38.5)
e� k.vI Gt / D �k.vI Gt / � �.v; t/
max.1; �.v; t//: (38.6)
Since the authors were looking for unusually large numbers of communications,the locality statistic was the size, the number of edges in the induced subgraph. Bylooking for large values ofe� k.vI Gt /, anomalies can be detected. This work could beadapted to computer intrusion detection in several ways. The graph statistic could bemodified to take the email content into account, which could be used to detect spamand viruses; other graphs invariants could be used to detect other types of patterns ofactivity; communications between computers could replace email communicationsbetween people.
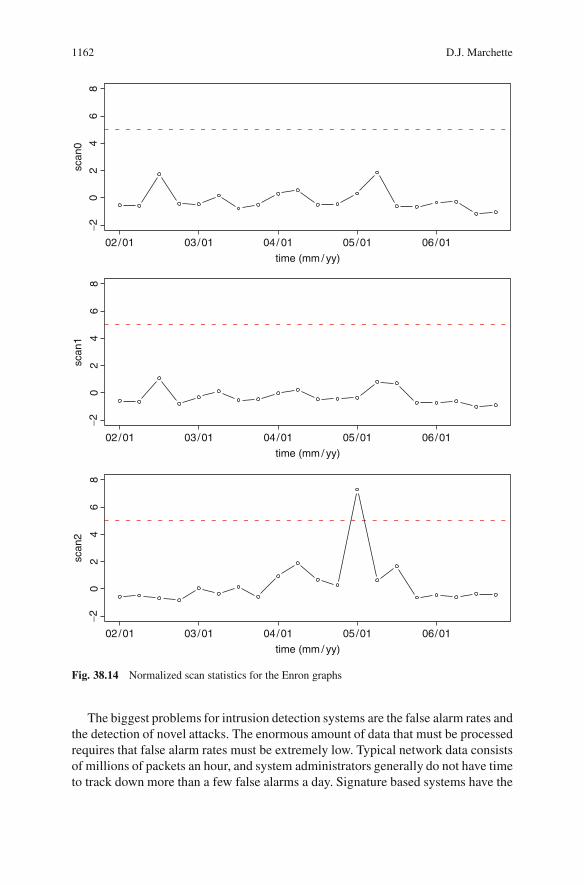
Figure 38.14 shows an anomaly detection on the Enron graphs. Here “scan0”corresponds to vertex degree. Note that there is no detection when considering eithervertex degree or a scan region with radius 1. It is only when one considers the2-neighborhood that the detection arises. The statistics have been scaled (analo-gously to the scaling in (38.6)), and a detection threshold of 4 standard deviations isindicated in the plot.
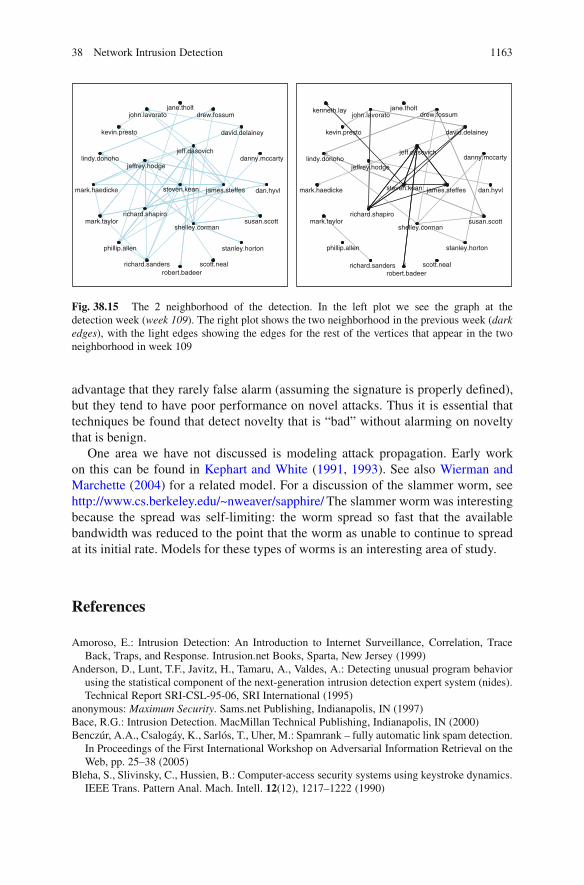
Figure 38.15 depicts the 2-neighborhood corresponding to the detection inFig. 38.14. The plot on the right shows the same vertices (with one other vertex)in the previous week. Note that in the previous week the 2-neighborhood was muchsmaller, and hence had fewer edges.
This detection is interesting, because the events discussed during this week arerelated to the California energy crisis. A white paper was circulated by economistsindicating that the crisis was not the result of market forces. The Enron executivesfelt that they would be better served if they could find an economist willing to arguethat the market was indeed the driving force, rather than manipulations by energycompanies. While this is not the sole content of the emails during this week, it doesprovide an anecdote for the detection.
Adding information about the content of the emails turns the graph into anattributed graph – the edge attributes corresponding by the email topics. Preliminarywork on this is reported in Priebe et al. (2010).
38.7 Discussion
There are many areas in which computational statistics can play a part in networkintrusion detection and other security arenas. We have seen a few in this chapter,including modeling denial of service attacks, visualization, the analysis of streamingdata applied to network data and profiling and anomaly detection.
1162 D.J. Marchette
−20
24
68
time (mm / yy)
scan
0
02 /01 03/01 04/ 01 05/01 06/01
−20
24
68
time (mm / yy)
scan
1
02 /01 03/01 04/01 05/01 06/01
−20
24
68
time (mm / yy)
scan
2
02 /01 03/01 04/01 05/01 06/01
Fig. 38.14 Normalized scan statistics for the Enron graphs
The biggest problems for intrusion detection systems are the false alarm rates andthe detection of novel attacks. The enormous amount of data that must be processedrequires that false alarm rates must be extremely low. Typical network data consistsof millions of packets an hour, and system administrators generally do not have timeto track down more than a few false alarms a day. Signature based systems have the
38 Network Intrusion Detection 1163
dan.hyvl
danny.mccarty
david.delainey
drew.fossum
james.steffes
jane.tholt
jeff.dasovich
jeffrey.hodge
john.lavorato
kevin.presto
lindy.donoho
mark.haedicke
mark.taylor
phillip.allen
richard.sanders
richard.shapiro
robert.badeerscott.neal
shelley.corman
stanley.horton
steven.kean
susan.scott
dan.hyvl
danny.mccarty
david.delainey
drew.fossum
james.steffes
jane.tholt
jeff.dasovich
jeffrey.hodge
john.lavorato
kevin.presto
lindy.donoho
mark.haedicke
mark.taylor
phillip.allen
richard.sanders
richard.shapiro
robert.badeerscott.neal
shelley.corman
stanley.horton
steven.kean
susan.scott
kenneth.lay
Fig. 38.15 The 2 neighborhood of the detection. In the left plot we see the graph at thedetection week (week 109). The right plot shows the two neighborhood in the previous week (darkedges), with the light edges showing the edges for the rest of the vertices that appear in the twoneighborhood in week 109
advantage that they rarely false alarm (assuming the signature is properly defined),but they tend to have poor performance on novel attacks. Thus it is essential thattechniques be found that detect novelty that is “bad” without alarming on noveltythat is benign.
One area we have not discussed is modeling attack propagation. Early workon this can be found in Kephart and White (1991, 1993). See also Wierman andMarchette (2004) for a related model. For a discussion of the slammer worm, seehttp://www.cs.berkeley.edu/~nweaver/sapphire/ The slammer worm was interestingbecause the spread was self-limiting: the worm spread so fast that the availablebandwidth was reduced to the point that the worm as unable to continue to spreadat its initial rate. Models for these types of worms is an interesting area of study.
References
Amoroso, E.: Intrusion Detection: An Introduction to Internet Surveillance, Correlation, TraceBack, Traps, and Response. Intrusion.net Books, Sparta, New Jersey (1999)
Anderson, D., Lunt, T.F., Javitz, H., Tamaru, A., Valdes, A.: Detecting unusual program behaviorusing the statistical component of the next-generation intrusion detection expert system (nides).Technical Report SRI-CSL-95-06, SRI International (1995)
anonymous: Maximum Security. Sams.net Publishing, Indianapolis, IN (1997)Bace, R.G.: Intrusion Detection. MacMillan Technical Publishing, Indianapolis, IN (2000)Benczúr, A.A., Csalogáy, K., Sarlós, T., Uher, M.: Spamrank – fully automatic link spam detection.
In Proceedings of the First International Workshop on Adversarial Information Retrieval on theWeb, pp. 25–38 (2005)
Bleha, S., Slivinsky, C., Hussien, B.: Computer-access security systems using keystroke dynamics.IEEE Trans. Pattern Anal. Mach. Intell. 12(12), 1217–1222 (1990)
1164 D.J. Marchette
DeVault, K., Tucey, N., Marchette, D.: Analyzing process table and window title data foruser identification in a windows environment. Technical Report NSWCDD/TR-03/122, NavalSurface Warfare Center (2003)
Early, J.P., Brodley, C.E.: Behavioral authentication of server flows. In The 19th Annual ComputerSecurity Applications Conference, pp. 49–55 (2003)
Escamilla, T.: Intrusion Detection: Network Security Beyond the Firewall. Wiley, New York (1998)Forrest, S., Hofmeyr, S.A.: Immunology as information processing. In: Segel, L.A., Cohen, I. (eds.)
Design Prinicples for the Immune System and Other Distributed Autonomous Systems, SantaFe Institute Studies in the Sciences of Complexity. Oxford University Press, Oxford, UK, 361–387, (2000) Also available at www.cs.unm.edu/�forrest/ism_papers.htm.
Forrest, S., Perelson, A.S., Allen, L., Cherukuri, R.: Self-nonself discrimination in a computer. In1994 IEEE Symposium on Research in Security and Privacy, pp. 202–212. Los Alamitos, CA(1994); Also available at www.cs.unm.edu/�forrest/isa_papers.htm.
Forrest, S., Hofmeyr, S.A., Somayaji, A.: Computer immunology. Comm. ACM 40, 88–96 (1997)Giles, K., Marchette, D.J., Priebe, C.E.: A backscatter characterization of denial-of-service attacks.
In Proceedings of the Joint Statistical Meetings, CDROM (2003)Glaz, J., Naus, J., Wallenstein, S.: Scan Statistics. Springer, New York (2010)Karonski, M., Singer, K., Scheinerman, E.: Random intersection graphs: the subgraph problem.
Combinator. Probab. Comput. 8, 131–159 (1999)Kephart, J.O., White, S.R.: Directed-graph epidemiological models of computer viruses. In
Proceedings of the IEEE Computer Society Symposium on Research in Security and Privacy,pp. 343–359 (1991)
Kephart, J.O., White, S.R.: Measuring and modeling computer virus prevalence. In Proceedings ofthe IEEE Computer Society Symposium on Research in Security and Privacy, pp. 2–15 (1993)
Lin, D.-T.: Computer-access authentication with neural network based keystroke identity verifica-tion. In International Conference on Neural Networks, pp. 174–178 (1997)
Marchette, D.J.: Computer Intrusion Detection and Network Monitoring: A Statistical Viewpoint.Springer, New York (2001)
Marchette, D.J.: A study of denial of service attacks on the internet. In Proceedings of the ArmyConference on Applied Statistics (2002); 41–40, available at http://www.armyconference.org/ACAS00-02/Master02.pdf
Marchette, D.J.: Passive detection of denial of service attacks on the internet. In: Chen, W. (eds.)Statistical Methods in Computer Security. Marcel Dekker; 183–211.
Marchette, D.J.: Profiling users by their network activity. In Proceedings of the Joint StatisticalMeetings 219–228 (2003).
Marchette, D.J.: Random Graphs for Statistical Pattern Recognition. Wiley, New York (2004)Maxion, R.A.: Masquerade detection using enriched command lines. In International conference
on dependable systems and networks(DNS-03). IEEE Computer Society Press, Washington, DC(2003)
Maxion, R.A., Townsend, T.N.: Masquerade detection using truncated command lines. In Inter-national conference on dependable systems and networks(DNS-02). IEEE Computer SocietyPress, Washington, DC (2002)
Moore, D., Voelker, G.M., Savage, S.: Infering Internet denial-of-service activity. In Proceedingsof the 2001 USENIX Security Symposium, pp. 9–22 (2001). Available on the web atwww.usenix.org/publications/library/proceedings/sec01/moore.html USENIX Security ’01.
Northcutt, S., Novak, J., McLaclan, D.: Network Intrusion Detection. An Analyst’s Handbook.New Riders, Indianapolis, IN (2001)
Obaidat, M.S., Sadoun, B.: Verification of computer users using keystroke dynamics. IEEE Trans.Syst. Man Cybernetics 27(2), 261–269 (1997)
Oshima, S., Nakshima, T., Nishikido, Y.: Extraction of characteristics of anomaly accessed IPpackets using chi-square method. In Complex, Intelligent and Softawre Intensive Systems,CISIS ’09, pp. 287–292 (2009)
Priebe, C.E.: Adaptive mixture density estimation. J. Am. Stat. Assoc. 89, 796–806 (1994)
38 Network Intrusion Detection 1165
Priebe, C.E., Conroy, J.M., Marchette, D.J., Park, Y.: Scan statistics on enron graphs. Comput.Math. Organ. Theor. 11, 229–247 (2005)
Priebe, C.E., Park, Y., Marchette, D.J., Conroy, J.M., Grothendieck, J., Gorin, A.L.: Statisticalinference on attributed random graphs: Fusion of graph features and content: An experiment ontime series of enron graphs. Comput. Stat. Data Anal. 54, 1766–1776 (2010)
Proctor, P.E.: The Practical Intrusion Detection Handbook. Prentice-Hall, Englewood Cliffs, NJ(2001)
Robinson, J.A., Liang, V.M., Chambers, J.A.M., MacKenzie, C.L.: Computer user verificationusing login string keystroke dynamics. IEEE Trans. Syst. Man Cybernetics 28(2), 236–241(1998)
Sasaki, M., Shinnou, H.: Spam detection using text clustering. International Conference onCyberworlds. 0, 316–319 (2005); http://doi.ieeecomputersociety.org/10.1109/CW.2005.83.
Schonlau, M., DuMouchel, W., Ju, W.-H., Karr, A.F., Theus, M., Vardi, Y.: Computer intrusion:Detecting masquerades. Stat. Sci. 16, 58–74 (2001)
Song, D.X., Wagner, D., Tian, X.: Timing analysis of keystrokes and timing attacks on SSH.In Proceedings of the 10th USENIX Security Symposium (2001); http://www.usenix.org/publications/library/proceedings/sec01/song.html.
Stevens, W.R.: TCP/IP Illustrated, Volume 1: The Protocols. Addison-Wesley, Reading, MA (1994)Tan, K.M.C., Maxion, R.A.: “Why 6?” defining the operational limits of stide, an anomaly-based
intrusion detector. In IEEE Symposium on Security and Privacy. IEEE Computer Society Press,Washington, DC (2002)
Wegman, E.J., Davies, H.I.: Remarks on some recursive estimators of a probability density. Ann.Stat. 7, 316–327 (1979)
Wegman, E.J., Dorfman, A.: Visualizing cereal world. Technical Report TR 178, George MasonUniversity, Center for Computational Statistics (2001)
Wegman, E.J., Marchette, D.J.: On some techniques for streaming data: a case study of Internetpacket headers. JCGS (2003), 12(4), 893–914.
Wierman, J.C., Marchette, D.J.: Modeling computer virus prevalence with a susceptible-infected-susceptible model with reintroduction. Computational Statistics and Data Analysis (2004),45(1), 3–23.
Wilhelm, A.F.X., Wegman, E.J., Symanzik, J.: Visual clustering and classification: The oronsayparticle size data set revisited. Comput. Stat. 109–146 (1999)
Wright, C.V., Ballard, L., Monrose, F., Masson, G.M.: Language identification of encrypted voiptraffic: Alejandra y roberto or alice and bob? In SS’07: Proceedings of 16th USENIX SecuritySymposium on USENIX Security Symposium, pp. 1–12, Berkeley, CA, USA (2007); USENIXAssociation.
Wulf, W.A., Jones, A.K.: Reflections on cybersecurity. Science 326, 943–944 (2009)Yamato, H.: Sequential estimation of a continuous probability density function and the mode.
Bulletin Math. Stat. 14, 1–12 (1971)Ye, N., Emran, S.M., Chen, Q., Vilbert, S.: Multivariate statistical analysis of audit trails for host-
based intrusion detection. IEEE Trans. Comput. 51, 810–820 (2002)Zhou, B., Shi, Q., Merabti, M.: Intrusion detection in pervasive networks based on a chi-square
statistic test. In Computer Software and Applications Conference, COMPSAC ’06, vol. 2,pp. 203–208 (2006)