Embed Size (px)
Citation preview
To cite this chapter:
Wasserman, J. D., & Bracken, B. A. (2013). Fundamental psychometric
considerations in assessment. In I. B. Weiner, J. R. Graham, & J. A. Naglieri
(Eds.), Handbook of psychology. Assessment psychology (2nd ed., Vol. 10, pp.
50-81). Hoboken, NJ: John Wiley & Sons.
To access this volume online, please visit:
http://online library.wiley.com
To purchase this volume from the publisher, please visit:
http://www.wiley.com/WileyCDA/WileyTitle/productCd-0470891270.html
CHAPTER 3
Fundamental Psychometric Considerationsin Assessment
JOHN D. WASSERMAN AND BRUCE A. BRACKEN
PSYCHOMETRIC THEORIES 51CLASSICAL TEST THEORY 51SAMPLING AND NORMING 52CALIBRATION AND DERIVATION
OF REFERENCE NORMS 57
TEST SCORE VALIDITY 59TEST SCORE RELIABILITY 66TEST SCORE FAIRNESS 70LIMITS OF PSYCHOMETRICS 75REFERENCES 76
“Whenever you can, count!” advised Sir Francis Galton,according to his biographer Karl Pearson (1924, p. 340),who reported that Galton seldom went for a walk orattended a lecture without counting something. The fatherof contemporary psychometrics, Galton is credited withapplying the normal probability distribution to the studyof individual differences and initiating the first large-scaleefforts to measure physical, sensory, motor, and higher-order mental characteristics in his London Anthropomet-ric Laboratories. Moreover, Galton is recognized for hisdiscovery of the phenomena of regression, his conceptu-alization of the covariance between variables as a basisfor understanding bivariate relations (with the product-moment correlation coefficient introduced by Pearson),and his execution of the first multivariate analyses (e.g.,Stigler, 1999, 2010). Galton quantified everything fromfingerprint characteristics, to variations in weather condi-tions, to the number of brush strokes taken by artists whilehe sat for portraits. At scientific meetings, he was knownto count the number of times per minute that members ofthe audience fidgeted, computing an average and deducingthat the frequency of fidgeting was inversely associatedwith level of audience interest in the presentation.
Of course, the challenge in contemporary assessmentis to know what to measure, how to measure it, and whenthe measurements are meaningful. In a definition thatstill remains appropriate, Galton (1879) defined psychom-etry as “the art of imposing measurement and numberupon operations of the mind” (p. 149). Derived from
the Greek psyche (ψυχη, meaning “soul”) and metro(μετρω, meaning “measure”), psychometry may be bestconsidered an evolving set of scientific rules for the devel-opment and application of psychological tests.
Construction of psychological tests is guided by psy-chometric theories in the midst of a paradigm shift.Classical test theory (CTT), epitomized by Gulliksen’s(1950) Theory of Mental Tests, dominated psychologicaltest development through the latter two-thirds of the 20thcentury. Item response theory (IRT), beginning with thework of Rasch (1960) and Lord and Novick’s (1968)Statistical Theories of Mental Test Scores, is growing ininfluence and use, with calls by its advocates for a “vel-vet revolution” in psychological measurement (Borsboom,2006b, p. 467). Embretson (2004) summarized the currentstatus of the paradigm shift from CTT to IRT: “[A]t theend of the 20th century, the impact of IRT on abilitytesting was still limited. Only a few large-scale tests hadapplied IRT by the late 1990s. The majority of psycho-logical tests still were based on classical test theory thatwas developed early in the 20th century” (p. 8).
This chapter describes the most salient psychometriccharacteristics of psychological tests, incorporating ele-ments from both CTT and IRT. It provides guidelinesfor the evaluation of test technical adequacy. Althoughpsychometricians frequently warn that such guidelines areoversimplified, we consider them to be rules of thumbthat have practical value for test consumers using anapplied handbook. The guidelines may be applied to
50
Fundamental Psychometric Considerations in Assessment 51
a wide array of tests, including those in the domainsof academic achievement, adaptive behavior, cognitive-intellectual abilities, neuropsychological functions, per-sonality and psychopathology, and personnel selection.The guidelines are based in part on conceptual exten-sions of the Standards for Educational and PsychologicalTesting (1999; currently undergoing revision) and recom-mendations from such authorities as Anastasi and Urbina(1997; see also Urbina, 2004); Bracken (1987); Cattell(1986); Cohen (1992); Neuendorf (2002); Nunnally &Bernstein (1994); Salvia, Ysseldyke, & Bolt (2010); andStreiner (2003).
PSYCHOMETRIC THEORIES
The psychometric characteristics of mental tests are gen-erally derived from one or both of the two leading the-oretical approaches to test construction: CTT and IRT.Although it is common for psychometricians to con-trast these two approaches and advocate for more con-temporary techniques (e.g., Embretson, 1995; Embretson& Hershberger, 1999), most contemporary test develop-ers in practicality use elements from both approaches ina complementary manner (e.g., Nunnally & Bernstein,1994). For many challenges in test development, CTT andIRT findings may be largely interchangeable; Fan (1998)reported empirical findings indicating that person anditem statistics derived from both theories are functionallycomparable.
CLASSICAL TEST THEORY
CTT traces its origins to the procedures pioneered byGalton, Pearson, C. E. Spearman, and E. L. Thorndike,and is usually defined by Gulliksen’s (1950) classic book.CTT has shaped contemporary investigations of test scorereliability, validity, and fairness as well as the widespreaduse of statistical techniques such as factor analysis.
At its heart, CTT is based on the assumption that anobtained test score reflects both true score and error score.Test scores may be expressed in the familiar equation:
Observed Score = True Score + Error
In this framework, the observed score is the test scorethat was actually obtained. The true score is the hypo-thetical amount of the designated trait specific to the
examinee, a quantity that would be expected if the entireuniverse of relevant content were assessed or if the exam-inee were tested an infinite number of times without anyconfounding effects of such things as practice or fatigue.Measurement error is defined as the difference betweentrue score and observed score. Error is uncorrelated withthe true score and with other variables, and it is distributednormally and uniformly about the true score. Because itsinfluence is random, the average measurement error acrossmany testing occasions is expected to be zero.
Many of the key elements from contemporary psy-chometrics may be derived from this core assumption.For example, internal consistency reliability is a psycho-metric function of random measurement error, equal tothe ratio of the true score variance to the observed scorevariance. By comparison, validity depends on the extentof nonrandom measurement error. Systematic sources ofmeasurement error negatively influence validity, becauseerror prevents measures from validly representing whatthey purport to assess. Issues of test fairness and bias aresometimes considered to constitute a special case of valid-ity in which systematic sources of error across racial andethnic groups constitute threats to validity generalization.
CTT places more emphasis on test score propertiesthan on item parameters. According to Gulliksen (1950),the essential item statistics are the proportion of personsanswering each item correctly (item difficulties, or p-values), the point-biserial correlation between item andtotal score multiplied by the item standard deviation (reli-ability index), and the point-biserial correlation betweenitem and criterion score multiplied by the item standarddeviation (validity index).
As a critic, Borsboom (2006a, 2006b; Borsboom, Mel-lenbergh, & Van Heerden, 2004) has argued that CTT hasgrave limitations in theory and model building through itsmisplaced emphasis on observed scores and true scoresrather than the latent trait itself. Moreover, he has arguedthat it thereby creates a never-ending black hole needfor continued accumulation of construct validity evidence(Borsboom 2006a, p. 431). At a more specific level, Ham-bleton, Swaminathan, and Rogers (1991) identified fourlimitations of CTT: (1) it has limited utility for con-structing tests for dissimilar examinee populations (sampledependence); (2) it is not amenable for making com-parisons of examinee performance on different tests pur-porting to measure the trait of interest (test dependence);(3) it operates under the assumption that equal measure-ment error exists for all examinees (invariant reliability);and (4) it provides no basis for predicting the likeli-hood of a given response of an examinee to a given test
52 Assessment Issues
item, based on responses to other items. In general, withCTT, it is difficult to separate examinee characteristicsfrom test characteristics. IRT addresses many of theselimitations.
Item Response Theory
IRT may be traced to two separate lines of development.Its origins may be traced to the work of Danish math-ematician Georg Rasch (1960), who developed a familyof IRT models that separated person and item parameters.Rasch influenced the thinking of leading European andAmerican psychometricians such as Gerhard Fischer andBenjamin Wright. A second line of development stemmedfrom research at the Educational Testing Service that cul-minated in Frederick Lord and Melvin Novick’s (1968)classic textbook, including four chapters on IRT writtenby Allan Birnbaum. This book provided a unified statisti-cal treatment of test theory and moved beyond Gulliksen’searlier CTT work.
IRT addresses the issue of how individual test itemsand observations map in a linear manner onto a targetedconstruct (termed the latent trait, with the amount ofthe trait denoted by θ). The frequency distribution ofa total score, factor score, or other trait estimates iscalculated on a standardized scale with a mean θ of 0and a standard deviation (SD) of 1. An item responsefunction (IRF; also known as an item characteristic curve,ICC) can then be created by plotting the proportion ofpeople who have a score at each level of θ, so thatthe probability of a person’s passing an item dependssolely on the ability of that person and the propertiesof the item. The IRF curve yields several parameters,including item difficulty and item discrimination. Itemdifficulty is the location on the latent trait continuumcorresponding to chance responding or, alternatively, theprobability of responding accurately (or not) given aspecified ability level. Item discrimination is the rate orslope at which the probability of success changes withtrait level (i.e., the ability of the item to differentiatethose with more of the trait from those with less). A thirdparameter denotes the probability of answering correctlyby guessing in low-ability respondents (as with multiple-choice tests). A fourth parameter describes the probabilityof carelessness in high-ability respondents (i.e., thosemay answer an easy item incorrectly). IRT based on theone-parameter model (i.e., item difficulty) assumes equaldiscrimination for all items and negligible probabilityof guessing, and is generally referred to as the Raschmodel. Two-parameter models (those that estimate both
item difficulty and discrimination) and three-parametermodels (those that estimate item difficulty, discrimination,and probability of guessing) may also be used. Only noware four-parameter models being considered of potentialvalue, especially for their relevance in psychopathology(e.g., Loken & Rulison, 2010).
IRT posits several assumptions: (1) unidimensionalityand stability of the latent trait, which is usually estimatedfrom an aggregation of individual items; (2) local inde-pendence of items, meaning that the only influence onitem responses is the latent trait and not adjacent (or anyother) items; and (3) item parameter invariance —that is,item properties are a function of the item itself ratherthan the sample, test form, or interaction between itemand respondent. Knowles and Condon (2000) argued thatthese assumptions may not always be made safely. WhileIRT offers technology that makes test development moreefficient than CTT, its potential to lead to future advancesin psychometrics is questionable. As Wainer (2010) askedrhetorically, “What more do we need to know about IRTto be able to use it well?” (p. 18).
SAMPLING AND NORMING
Under ideal circumstances, individual test results wouldbe referenced to the performance of the entire collectionof individuals (target population) for whom the test isintended. Statewide educational tests given to all studentsat specified grade levels have this potential, although theyare often used only as criterion-referenced benchmarksof academic progress. Without government mandates, itis rarely feasible to measure performance of every mem-ber in a population. Accordingly, standardized tests aredeveloped with the use of sampling procedures designedto provide an unbiased estimation of the score distributionand characteristics of a target population within a subset ofindividuals randomly selected from that population. Testresults may then be interpreted with reference to samplecharacteristics, which are presumed to accurately estimatestable population parameters.
Appropriate Samples for Test Applications
When a test is intended to yield information about exam-inees’ standing relative to peers of some kind, the chiefobjective of sampling should be to provide a referencegroup that is representative of the greater population forwhom the test is intended. Norm-referenced test scores
Fundamental Psychometric Considerations in Assessment 53
provide information about an examinee’s standing relativeto the distribution of test scores found in an appropri-ate peer comparison group. As a point of comparison,criterion-referenced tests yield scores that are interpretedrelative to predetermined standards of performance, suchas proficiency at a specific academic skill or activity ofdaily life.
If the test is intended to compare the performance ofan individual to that of the general population, the samplemay need to be stratified on demographic variables, typ-ically those that account for substantial variation in testperformance. Stratification divides the target populationinto smaller subpopulations, which can then be randomlysampled, provided that the population proportions in thestrata are known (Kalton, 1983). Variables unrelated tothe trait being assessed need not be included in the sam-pling plan. For example, a developmentally sensitive testneeds to be stratified by age level, but a test that showslittle variation in performance as a function of maturationmay cover broad age ranges and not require age strat-ifications. The advantages of stratified sampling includegreater ease of sampling and estimation, improved likeli-hood of representing important subpopulations in the nor-mative sample, the option to conduct additional analyseson samples within strata (if independent from each other),and enhancement of sampling precision (e.g., Lehtonen &Pahkinen, 2004).
Variables frequently used for sample stratificationinclude:
• Sex (female, male)• Race (White, African American, Asian/Pacific Islander,
Native American, Other)• Ethnicity (Hispanic origin, non-Hispanic origin)• Geographic region (Midwest, Northeast, South, West)• Community setting (urban/suburban, rural)• Parent educational attainment (less than high school
degree, high school graduate or equivalent, some col-lege or technical school, 4 or more years of college)
The most challenging of stratification variables issocioeconomic status (SES), particularly because it tendsto be associated with cognitive test performance and is dif-ficult to define operationally (e.g., Oakes & Rossi, 2003).Parent educational attainment is often used as an esti-mate of SES because it is readily available and objectiveand because parent education correlates moderately withfamily income. For children’s measures, parent occupa-tion and income are also sometimes combined as esti-mates of SES, although income information is generally
difficult to obtain. Community estimates of SES add anadditional level of sampling rigor, because the commu-nity in which an individual lives may be a greater factorin the child’s everyday life experience than his or herparents’ educational attainment. Similarly, the number ofpeople residing in the home or whether one or two par-ents head the family are all factors that can influence afamily’s SES. For example, a family of three that has anannual income of $40,000 may have more economic via-bility than a family of six that earns the same income. Also,a college-educated single parent may earn less income thantwo lesser-educated cohabiting parents. The influences ofSES on construct development clearly represent an areaof further study, even as the relation of SES to cognitiveand behavioral outcome proves complex (e.g., Turkheimer,Haley, Waldron, D’Onofrio, & Gottesman, 2003).
A classic example of an inappropriate normative ref-erence sample is found with the original MinnesotaMultiphasic Personality Inventory (MMPI; Hathaway &McKinley, 1943), which was normed on 724 MinnesotaWhite adults who were, for the most part, relatives orvisitors of patients in the University of Minnesota Hospi-tals. The original MMPI normative reference group wasprimarily composed of Minnesota farmers.
When test users intend to rank individuals relativeto the special populations to which they belong, it mayalso be desirable to ensure that proportionate represen-tation of those special populations are included in thenormative sample (e.g., individuals who are intellectu-ally disabled, conduct disordered, or learning disabled).Alternatively, it is not unusual to collect norms on spe-cial reference groups, such as individuals with a knowndiagnosis (e.g., autism spectrum disorders), when levelof test performance is important in understanding thenature and severity of any impairments (e.g., specifica-tion of high-functioning autism versus lower-functioningautism). Millon, Davis, and Millon (1997) noted that testsnormed on special populations may require the use ofbase rate scores rather than traditional standard scores,because assumptions of a normal distribution of scoresoften cannot be met within clinical populations.
Appropriate Sampling Methodology
One of the principal objectives of sampling is to ensurethat each individual in the target population has anequal and independent chance of being selected. Samplingmethodologies include both probability and nonprobabil-ity approaches, which have different strengths and weak-nesses in terms of accuracy, cost, and feasibility (Levy &Lemeshow, 1999).
54 Assessment Issues
Probability sampling is a randomized approach thatpermits the use of statistical theory to estimate theproperties of sample estimators. Probability sampling isgenerally too expensive for norming educational and psy-chological tests, but it offers the advantage of permittingthe determination of the degree of sampling error, suchas is frequently reported with the results of most publicopinion polls. Sampling error may be defined as the dif-ference between a sample statistic and its correspondingpopulation parameter. When sampling error in psycholog-ical test norms is not reported, an important source of truescore error that transcends measurement error alone willbe neglected.
A probability sampling approach sometimes employedin psychological test norming is known as multistagestratified random cluster sampling ; this approach uses asampling strategy in which a large or dispersed populationis divided into a large number of groups, with participantsin the groups selected via random sampling. In two-stagecluster sampling, each group undergoes a second roundof simple random sampling based on the expectationthat each cluster closely resembles every other cluster.For example, a set of schools may constitute the firststage of sampling, with students randomly drawn fromthe schools in the second stage. Cluster sampling ismore economical than random sampling, but incrementalamounts of error may be introduced at each stage ofsample selection. Moreover, cluster sampling commonlyresults in high standard errors when cases from a clusterare homogeneous (Levy & Lemeshow, 1999). Samplingerror can be estimated with the cluster sampling approach,so long as the selection process at the various stagesinvolves random sampling.
In general, sampling error tends to be largest whennonprobability-sampling approaches, such as conveniencesampling or quota sampling, are employed Conveniencesamples involve the use of a self-selected sample thatis easily accessible (e.g., volunteers, college subjectpool participants, or examinees personally known to theexaminer). Quota samples involve the selection by a coor-dinator of a predetermined number of cases with specificcharacteristics. The probability of acquiring an unrep-resentative sample is high when using nonprobabilityprocedures. The weakness of all nonprobability-samplingmethods is that norms may not be applicable to thepopulation being served, statistical theory cannot beused to estimate sampling precision, the likelihood ofsampling bias is elevated, and accordingly samplingaccuracy can be evaluated only subjectively (e.g., Kalton,1983).
An example of best practice in sampling may befound in the approach used with the Achenbach Systemof Empirically Based Assessment (ASEBA; Achenbach& Rescorla, 2001), a family of scales that includes theChild Behavior Checklist (CBCL/6–18), a leading behav-ior rating scale for children and adolescents with behaviorproblems. A multistage national probability sample wascollected in the process of updating the norms for thesescales:
• One hundred primary sampling units were selectedby an institute of survey research to be collectivelyrepresentative of the U.S. population.
• Trained interviewers were assigned to householdsacross the various sampling units to visit homes todetermine the age and gender of residents eligiblefor participation (i.e., children and adolescents withno major physical or intellectual disability, with oneEnglish-speaking parent).
• Eligible residents were identified, and candidate par-ticipants were selected by stratified randomized proce-dures to match an overall target demographic specifi-cation, with no more than one candidate included fromeach household.
• Interviews with parents or youths were conducted tocomplete the rating scales.
• After receipt of completed scales, ASEBA staff tele-phoned respondents to verify that interviews actuallyhad been conducted.
A completion rate of 93.0% was reported for eligibleCBCL/6–18 participants, suggesting a low likelihood forsampling selection bias. Of the 2,029 children whoseparents completed the CBCL/6–18, 276 (13.6%) wereexcluded after data collection based on parent reports ofmental health, substance abuse, and special education ser-vices, yielding a final nonreferred normative sample ofN = 1,753. The systematic and random sampling tech-niques used to norm the ASEBA behavior rating scalesmay be contrasted with the less randomized samplingtechniques found with many other psychological tests andbehavior rating scales.
Adequately Sized Normative Samples
How large should a normative sample be? If populationparameters are to be estimated, effect sizes are to becalculated, or specific hypotheses are to be tested withnull hypothesis significance testing, minimal sample sizesmay be specified. The number of participants sampled at
Fundamental Psychometric Considerations in Assessment 55
any given stratification level needs to be sufficiently largeto provide acceptable sampling error with stable parameterestimations for the target populations. Depending on howthe data are to be used, the alpha level, effect size, andpower need to be specified in advance and can drivedetermination of minimal sample sizes necessary.
The minimum number of cases to be collected (or clus-ters to be sampled) also depends in part on the samplingprocedure used; Levy and Lemeshow (1999) providedformulas for a variety of sampling procedures. Up to apoint, the larger the sample the greater the reliability ofsampling accuracy and the more precise the parameterestimate. Estimates that are biased will generally becomeless biased as sample size increases (e.g., Kelley &Rausch, 2006). Cattell (1986) noted that eventuallydiminishing returns can be expected when sample sizesare increased beyond a reasonable level. Julious (2005)recommended the use of a cost–benefit analyses, wherethe point at which increased sample size yields diminishedeffect in estimating relevant population parameters.
The smallest acceptable number of cases in a sam-pling plan may also be driven by the particular statisticalanalyses to be conducted. Hertzog (2008) recommendedsamples of n = 25 to 40 for pilot studies during instru-ment development, n = 20 to 25 for intervention effi-cacy pilot studies (capable of detecting large effect sizes),and n = 30 to 40 per group for pilot studies compar-ing groups. In contrast, Zieky (1993) recommended that aminimum of 500 examinees be distributed across the twogroups compared in differential item function studies forgroup administered tests. For individually administeredtests, differential item function analyses require substan-tial oversampling of minorities. With regard to exploratoryfactor analyses, Riese, Waller, and Comrey (2000) havereviewed the psychometric literature and concluded thatmost rules of thumb pertaining to minimum sample sizeare not useful. They suggested that when communalitiesare high and factors are well defined, sample sizes of 100are often adequate, but when communalities are low, thenumber of factors is large, and the number of indicatorsper factor is small, even a sample size of 500 may beinadequate. As with statistical analyses in general, mini-mal acceptable sample sizes should be based on practicalconsiderations, including such considerations as desiredeffect size, power, and alpha level.
As rules of thumb, group-administered tests undergoingstandardization generally sample over 10,000 participantsper age or grade level, whereas individually administeredtests typically sample 100 to 200 participants per level(e.g., Robertson, 1992). In IRT, the minimum sample size
is related to the choice of calibration model used. Inan integrative review, Suen (1990) recommended that aminimum of 200 participants be examined for the one-parameter Rasch model, at least 500 examinees be exam-ined for the two-parameter model, and at least 1,000examinees be examined for the three-parameter model.Using the WISC-IV normative data set, Zhu and Chen(2011) reported that representative sample sizes as smallas N = 50 per age cohort were capable of yielding compa-rable (or even improved) norms relative to a substantiallylarger sample, based on results with an inferential normingmethod (Wilkins & Rolfhus, 2004).
Confidence in the use of smaller normative samplesmay soon be enabled by advances in data resamplingprocedures (with replacement), such as the bootstrap, thejackknife, and permutation methods, that have been shownto provide stable estimates of statistical parameters with-out requiring assumptions as to normality or homogeneityof variance. In particular, the bootstrap technique has beenutilized in two recent normative updates for the Cog-nitive Abilities Test (CogAT, Form 6; see Lohman &Lakin, 2009) and the Woodcock-Johnson III (WJ III; seeMcGrew, Dailey, & Schrank, 2007). Efron and Tibshirani(1993) described how the bootstrap might be used to con-struct a 95% confidence interval (CI) for the latent traitstatistical parameter θ:
1. Draw 1,000 bootstrap samples with replacement fromthe original sample, each time calculating an estimateof θ.
2. Use the results to generate a (simulated) distributionof θ, sorting these estimates in ascending order.
3. Calculate the 2.5th percentile (i.e., the average of the25th and 26th observations) and the 97.5th percentile(i.e., the average of the 975th and 976th observations)from the 1,000 simulated values.
4. The resulting values form the lower confidence limitand the upper confidence limit.
Mooney and Duval (1993) considered bootstrappedapproximations of parameter estimates and CIs to berelatively high quality “when n reaches the range of30–50, and when the sampling procedure is truly random”(p. 21).
Sampling Precision
As we have discussed, sampling error and bias is difficultto ascertain when probability sampling approaches are notused, and most educational and psychological tests do not
56 Assessment Issues
employ true probability sampling. Given this limitation,there are few objective standards for the sampling pre-cision of test norms. Angoff (1984) recommended as arule of thumb that the maximum tolerable sampling errorshould be no more than 14% of the standard error ofmeasurement. He declined, however, to provide furtherguidance in this area: “Beyond the general considerationthat norms should be as precise as their intended usedemands and the cost permits, there is very little else thatcan be said regarding minimum standards for norms relia-bility” (p. 79). For large-scale assessments normed throughtwo-stage cluster sampling, a conventional recommenda-tion has been that the magnitude of the 95% CI arounda mean score should be less than 10% of the score’s SD(e.g., Foy & Joncas, 2004; Wu, 2010). CIs that are greaterthan 10% of the SD may indicate problematic deviationsfrom random sampling, inadequate sample size, and insuf-ficient power. Wu (2010) noted that large sampling errorcan easily account for spuriously large differences in groupmean scores, such as those that might be expected betweenregions or over time as a product of instruction.
In the absence of formal estimates of sampling error,the accuracy of sampling strata may be most easily deter-mined by comparing stratification breakdowns againstthose available for the target population. As the samplemore closely matches population characteristics, the morerepresentative is a test’s normative sample. As best prac-tice, we recommend that test developers provide tablesshowing the composition of the standardization samplewithin and across all stratification criteria (e.g., Percent-ages of the Normative Sample according to combinedvariables, such as Age, by Race, or by Parent Education).This level of stringency and detail ensures that impor-tant demographic variables are distributed proportionatelyacross other stratifying variables according to populationproportions. The practice of reporting sampling accuracyfor single-stratification variables “on the margins” (i.e.,by one stratification variable at a time) tends to conceallapses in sampling accuracy. For example, if sample pro-portions of low SES are concentrated in minority groups(instead of being proportionately distributed across major-ity and minority groups), then the precision of the samplehas been compromised through the neglect of minoritygroups with high SES and majority groups with low SES.The more the sample deviates from population propor-tions on multiple stratifications, the greater the effect ofsampling error.
Manipulation of the sample composition to generatenorms is often accomplished through sample weighting(i.e., application of participant weights to obtain a
distribution of scores that is exactly proportioned to thetarget population representations). Weighting is usedmore frequently with group-administered educationaltests, because educational tests typically involve thecollection of thousands of cases. Weighting is used lessfrequently with psychological tests, and its use withthese smaller samples may significantly affect systematicsampling error because fewer cases are collected andtherefore weighting may differentially affect proportionsacross different stratification criteria, improving one atthe cost of another. Weighting is most likely to contributeto sampling error when a group has been inadequatelyrepresented with too few cases collected.
An illustration of problematic reporting of sampleweighting may be found in the Wechsler Memory Scale(WMS-III; Wechsler, 1997). While this test’s technicalmanual reports a standardization sample of 1,250 exami-nees (Tulsky, Zhu, & Ledbetter, 1997), subsequent inde-pendent reports indicated that this was a “weighted” Nand that 217 or 218 participants were exact duplicates ofparticipants in the “unweighted” N of 1,032 (see Tulsky,Chiaravallotti, Palmer, & Chelune, 2003; also Frisby &Kim, 2008). This approach to weighting a normative sam-ple is not clearly disclosed in test technical materials (see,e.g., Standards for Educational and Psychological Testing,1999) and does not meet accepted weighting procedures(e.g., Rust & Johnson, 1992).
Recency of Sampling
How old can norms be and still remain accurate? Evi-dence from the last two decades suggests that norms frommeasures of cognitive ability are susceptible to becom-ing “soft” or “stale” (i.e., test consumers should use oldernorms with caution). Use of outdated normative samplesintroduces systematic error into the diagnostic processand may negatively influence decision making, such asdenying services (for mentally handicapping conditions)to sizable numbers of children and adolescents who oth-erwise would have been identified as eligible to receiveservices (e.g., Reschly, Myers, & Hartel, 2002). Samplerecency is an ethical concern for all psychologists whotest or conduct assessments. The American Psychologi-cal Association’s (2002) Ethical Principles and Code ofConduct directs psychologists to avoid basing decisionsor recommendations on results that stem from obsolete oroutdated tests.
The problem of normative obsolescence has been mostrobustly demonstrated with intelligence tests. The termFlynn effect (Herrnstein & Murray, 1994) is used to
Fundamental Psychometric Considerations in Assessment 57
describe a consistent pattern of population intelligencetest score gains over time and across nations (Flynn,1984, 1987, 1994, 1999). For intelligence tests, the rate ofgain is about one-third of an IQ point per year (3 pointsper decade), which has been a roughly uniform find-ing over time and for all ages (Flynn, 1999). The Flynneffect appears to occur as early as infancy (Bayley, 1993;Campbell, Siegel, Parr, & Ramey, 1986) and continuesthrough the full range of adulthood (Tulsky & Ledbet-ter, 2000). The effect implies that older test norms mayyield inflated scores relative to current normative expec-tations. For example, the Wechsler Intelligence Scalefor Children—III (WISC-III; Wechsler, 1991) currentlyyields higher Full Scale IQs than the fourth edition of theWISC (Wechsler, 2003) by about 2.5 IQ points.
How often should tests be revised? There is noempirical basis for making a global recommendation,but it seems reasonable to conduct normative updates,restandardizations, or revisions at time intervals corre-sponding to the time expected to produce 1 standard errorof measurement (SEM ) of change. For example, given theFlynn effect and an overall average WISC-IV Full ScaleIQ SEM of 2.68, one could expect about 10 years to elapsebefore the test’s norms would “soften” to the magnitudeof 1 SEM . We note, however, that some evidence has sug-gested that the Flynn effect may have diminished or evenreversed in recent years (e.g., Teasdale & Owen, 2005).
CALIBRATION AND DERIVATIONOF REFERENCE NORMS
This section describes several psychometric characteristicsof test construction as they relate to building individualscales and developing appropriate norm-referenced scores.Calibration refers to the analysis of properties of grada-tion in a measure, defined in part by properties of testitems. Norming is the process of using scores obtainedby an appropriate sample to build quantitative referencesthat can be used effectively in the comparison and evalu-ation of individual performances relative to “typical” peerexpectations.
Calibration
The process of item and scale calibration dates back tothe earliest attempts to measure temperature. Early inthe 17th century, there was no method to quantify heatand cold except through subjective judgment. Galileo andothers experimented with devices that expanded air inglass as heat increased; use of liquid in glass to measure
temperature was developed in the 1630s. Some two dozentemperature scales were available for use in Europe inthe 17th century, and each scientist had his own scaleswith varying gradations and reference points. It was notuntil the early 18th century that more uniform scales weredeveloped by Fahrenheit, Celsius, and de Reaumur.
The process of calibration has similarly evolved inpsychological testing. In CTT, item difficulty is judgedby the p-value, or the proportion of people in the samplethat passes an item. During ability test development, itemsare typically ranked by p-value or the amount of the traitbeing measured. The use of regular, incremental increasesin item difficulties provides a methodology for buildingscale gradations. Item difficulty properties in CTT aredependent on the population sampled, so that a samplewith higher levels of the latent trait (e.g., older childrenon a set of vocabulary items) would show different itemproperties (e.g., higher p-values) than a sample with lowerlevels of the latent trait (e.g., younger children on the sameset of vocabulary items).
In contrast, IRT includes both item properties and lev-els of the latent trait in analyses, permitting item calibra-tion to be sample independent. The same item difficultyand discrimination values will be estimated regardlessof trait distribution. This process permits item calibra-tion to be sample free, according to Wright (1999), sothat the scale transcends the group measured. Embretson(1999) has described one of the new rules of measurement:“Unbiased estimates of item properties may be obtainedfrom unrepresentative samples” (p. 13).
IRT permits several item parameters to be estimatedin the process of item calibration. Among the indicescalculated in widely used Rasch model computer pro-grams (e.g., Linacre & Wright, 1999) are item fit-to-modelexpectations, item difficulty calibrations, item-total corre-lations, and item standard error. The conformity of anyitem to expectations from the Rasch model may be deter-mined by examining item fit. Items are said to have goodfits with typical item characteristic curves when they showexpected patterns near to and far from the latent trait levelfor which they are the best estimates. Measures of itemdifficulty adjusted for the influence of sample ability aretypically expressed in logits, permitting approximation ofequal difficulty intervals.
Item and Scale Gradients
The item gradient of a test refers to how steeply orgradually items are arranged by trait level and the resultinggaps that may ensue in standard scores. In order for a
58 Assessment Issues
test to have adequate sensitivity to differing degrees ofability or any trait being measured, it must have adequateitem density across the distribution of the latent trait. Thelarger the resulting standard score differences in relationto a change in a single raw score point, the less sensitive,discriminating, and effective a test is.
For example, on the Memory subtest of the Bat-telle Developmental Inventory (Newborg, Stock, Wnek,Guidubaldi, & Svinicki, 1984), a child who is 1 year 11months old who earned a raw score of 7 would have per-formance ranked at the first percentile for age, while araw score of 8 leaps to a percentile rank of 74. The steep-ness of this gradient in the distribution of scores suggeststhat this subtest is insensitive to even large gradations inability at this age.
A similar problem is evident on the Motor Qualityindex of the Bayley Scales of Infant Development Behav-ior Rating Scale (BSID-II; Bayley, 1993). A 36-month-oldchild with a raw score rating of 39 obtains a percentilerank of 66. The same child obtaining a raw score of 40 isranked at the 99th percentile.
As a recommended guideline, tests may be said tohave adequate item gradients and item density when thereare approximately three items per Rasch logit, or whenpassage of a single item results in a standard score changeof less than one third SD (0.33 SD) (Bracken, 1987). Itemsthat are not evenly distributed in terms of the latent traitmay yield steeper change gradients that will decrease thesensitivity of the instrument to finer gradations in ability.
Floor and Ceiling Effects
Do tests have adequate breadth, bottom and top? Manytests yield their most valuable clinical inferences whenscores are extreme (i.e., for scores that are very low orvery high). Accordingly, tests used for clinical purposesneed sufficient discriminating power in the extreme endsof the distributions.
The floor of a test represents the extent to which anindividual can earn appropriately low standard scores.A floor is usually considered the lowest, nonzero rawscore that may be earned for any instrument; zero rawscores have ambiguous meaning, because a wide arrayof construct-irrelevant explanations can account for zeroscores. An intelligence test intended for use in the iden-tification of individuals diagnosed with intellectual dis-abilities must, by definition, extend at least 2 SDs belownormative expectations (IQ < 70). In order to serve indi-viduals with severe to profound intellectual disability, testscores must extend even further to more than 4 SDs below
the normative mean (IQ < 40). Tests without a sufficientlylow floor may not be useful for decision making for moresevere forms of cognitive impairment.
A similar situation arises for test ceiling effects. Anintelligence test with a ceiling greater than 2 SDs abovethe mean (IQ > 130) can identify most candidates forintellectually gifted programs. To identify individualsas exceptionally gifted (i.e., IQ > 160), a test ceilingmust extend more than 4 SDs above normative expec-tations. There are several unique psychometric challengesto extending norms to these heights, but recently thepublisher of the leading school-age intelligence test, theWISC-IV, increased its highest global scores beyond150–160 to extended standard scores as high as 210 (Zhu,Cayton, Weiss, & Gabel, 2008). The Stanford-Binet, FifthEdition also offered an Extended IQ Score (EXIQ) thatextends up to 225 (Roid, 2003). These advances mayenable the identification of exceptionally gifted studentsat levels not previously possible.
As a rule of thumb, tests used for clinical decisionmaking should have floors and ceilings that differentiatethe extreme lowest and highest 2% of the populationfrom the middlemost 96% (Bracken, 1987, 1988). Testswith inadequate floors or ceilings are inappropriate forassessing children with known or suspected intellectualdisability, intellectual giftedness, severe psychopathology,or exceptional social and educational competencies.
Derivation of Norm-Referenced Scores
IRT yields several different kinds of interpretable scores(e.g., Woodcock, 1999), only some of which are norm-referenced standard scores. Because most test users aremost familiar with the use of standard scores, we focuson the process of arriving at this type of score. Transfor-mation of raw scores to standard scores involves a numberof decisions based on psychometric science and more thana little art.
The first decision involves the nature of raw scoretransformations, based on theoretical considerations (Is thetrait being measured thought to be normally distributed?)and examination of the cumulative frequency distributionsof raw scores within and across age groups (e.g., Daniel,2007). The objective of this transformation is to preservethe shape of the raw score frequency distribution, includ-ing mean, variance, kurtosis, and skewness. Linear trans-formations of raw scores are based solely on the meanand distribution of raw scores and are commonly usedwhen distributions are not normal; linear transformationassumes that the distances between scale points reflect true
Fundamental Psychometric Considerations in Assessment 59
differences in the degree of the measured trait present.Area transformations of raw score distributions convertthe shape of the frequency distribution into a specifiedtype of distribution. When the raw scores are normallydistributed, they may be transformed to fit a normal curve,with corresponding percentile ranks assigned in a way sothat the mean corresponds to the 50th percentile, −1 SDand +1 SD correspond to the 16th and 84th percentilesrespectively, and so forth. When the frequency distributionis not normal, it is possible to select from varying typesof nonnormal frequency curves (e.g., Johnson, 1949) as abasis for transformation of raw scores or to use polynomialcurve-fitting equations.
Following raw score transformations is the process ofsmoothing the curves. Data smoothing typically occurswithin and across groups to correct for minor irregulari-ties, presumably those irregularities that result from sam-pling fluctuations and error. Quality checking also occursto eliminate vertical reversals (such as those within anage group, from one raw score to the next) and hori-zontal reversals (such as those within a raw score series,from one age to the next). Smoothing and eliminationof reversals serve to ensure that raw score to standardscore transformations progress according to growth andmaturation expectations for the trait being measured.
Beyond computing norms one age group at a time, con-tinuous norming (Gorsuch, 1983b; Gorsuch & Zachary,1985) began as a way of using test scores across a largenumber of overlapping age groups to generate polyno-mial regression equations that could accurately capturethe developmental progression of test scores. Continuousnorming enabled improved estimation of raw to standardscore transformations and age-based percentile ranks whileminimizing the effects of sampling and artifactual irregu-larities. This approach has evolved into continuous param-eter estimation methods (Gorsuch, 2010; Roid, 2010) thatpermit computerized estimation of statistical parameterssuch as mean, SD, and skewness for different samples as afunction of salient population characteristics (e.g., gender,education, ethnicity, and age), thereby providing a contextfor transforming test raw scores to standard scores. Con-tinuous parameter estimation methods may also be used tocompute and model reliabilities, standard errors of mea-surement, and various forms of validity as a function ofother variables (Gorsuch, 2010; Roid, 2010).
TEST SCORE VALIDITY
Validity traditionally has been concerned with the meaningof test scores, or whether a test measures what it purports
to measure (e.g., Cronbach & Meehl, 1955; Kelley, 1927).In an influential definition that sought to unify all formsof test score validity under the umbrella of constructvalidity and extend its reach to encompass the applied useof test results and their interpretations, Messick (1989a)defined validity as “an integrated evaluative judgment ofthe degree to which empirical evidence and theoreticalrationales support the adequacy and appropriateness ofinferences and actions based on test scores or other modesof assessment” (p. 13; emphasis in original). From thismainstream perspective, validity involves the inferencesmade from test scores and is not inherent to the testitself (e.g., Cronbach, 1971; Sireci, 2009; Standards foreducational and psychological testing, 1999).
Yet Borsboom and his colleagues (Borsboom, Cramer,Kievit, Scholten, & Franic, 2009; Borsboom et al., 2004)argued that the traditional concept of validity was alwaysindefensible, if just because it focused on test scores andtheir interpretations, whether they made sense in terms ofpsychological theories, and even on the justifiability ofsocial actions based on test scores, rather than the mea-surement tools per se. Stripping excess requirements butcovering less ground, they proposed a narrower formula-tion: that “validity is a property of measurement instru-ments [that] codes whether these instruments are sensitiveto variation in a targeted attribute” (Borsboom et al., 2009,p. 135).
Lissitz (2009) provided an accessible compilation ofcontroversies in contemporary perspectives on test scorevalidity, from mainstream concepts of validity, to callsfor radical change, and to applications-oriented forms ofvalidity. In recent years, mainstream notions of test scorevalidity have increasingly relied on the ambiguous con-cept of construct validity, which has come to representsomething of a bottomless pit in terms of the ongoingaccumulation of evidence for the validity of a test. Con-sumers of psychological test results expect the tests tohave broad and diverse foundations and to be appliedinterpretatively in a manner supported by research. In atest-centered society, the narrow and more radical defini-tion of validity espoused by Borsboom and his colleagueshas a purist quality that appears inadequate, given theexpectations of test consumers. The applications-orientedperspective takes the very functional approach that theoptimal array of evidence necessary to support test validityvaries according to the nature and applications of the test.
From a mainstream perspective, evidence of test scorevalidity may take different forms, many of which aredetailed in this chapter, but ultimately they are all con-cerned with construct validity (Guion, 1977; Messick,
60 Assessment Issues
1995a, 1995b). Construct validity involves appraisal ofa body of evidence determining the degree to whichtest score inferences are accurate, adequate, and appro-priate indicators of the examinee’s standing on the traitor characteristic measured by the test. Excessive narrow-ness or broadness in the definition and measurement ofthe targeted construct can threaten construct validity. Theproblem of excessive narrowness, or construct underrep-resentation, refers to the extent to which test scores fail totap important facets of the construct being measured. Theproblem of excessive broadness, or construct irrelevance,refers to the extent to which test scores that are influencedby unintended factors, including irrelevant constructs andtest procedural biases.
Construct validity can be supported with two broadclasses of evidence: internal and external validation,which parallel the classes of threats to validity of researchdesigns (Campbell & Stanley, 1963; Cook & Campbell,1979). Internal evidence for validity includes informationintrinsic to the measure itself, including content, exam-inee response processes, and substantive and structuralvalidation. External evidence for test score validity maybe drawn from research involving independent, criterion-related data. External evidence includes convergent, dis-criminant, criterion-related, and consequential validation.This internal–external dichotomy with its constituent ele-ments represents a distillation of concepts described byAnastasi and Urbina (1997); Jackson (1971); Loevinger(1957); Messick (1995a, 1995b); Millon et al. (1997); andSlaney and Maraun (2008), among many others.
Internal Evidence of Validity
Internal sources of validity include the intrinsic char-acteristics of a test, especially its content, assessmentmethods, structure, and theoretical underpinnings. In thissection, several sources of evidence internal to tests aredescribed—including content validity, substantive valid-ity, and structural validity.
Content Validity
Content validity is the degree to which elements of a test,ranging from items to instructions, are relevant to andrepresentative of varying facets of the targeted construct(Haynes, Richard, & Kubany, 1995). Content validity istypically established through the use of expert judgeswho review test content, but other procedures may alsobe employed (Haynes et al., 1995; Vogt, King & King,2004). Hopkins and Antes (1978) recommended that testsinclude a table of content specifications, in which the
facets and dimensions of the construct are listed along-side the number and identity of items assessing each facet.More recently, Mislevy and his colleagues (e.g., Mislevy& Haertel, 2006) have proposed evidence-centered design(ECD), in which test developers use model-based rea-soning and data-based warrants to formulate evidentiaryarguments logically connecting test substance to meaning-ful claims about examinee performance and proficiency.Through this approach, for example, educational test itemsare written with the sole intent of eliciting explicitlydefined forms of evidence to support inferences of interest,such as student mastery of a specific academic curricu-lum. According to Brennan (2010a), the validity claims ofECD, including the implied assertion that ECD-developedtests have validity built into the test a priori, need to bemore rigorously substantiated.
Content differences across tests purporting to mea-sure the same construct can explain why similar testssometimes yield dissimilar results for the same examinee(Bracken, 1988). For example, the universe of mathemat-ical skills includes varying types of numbers (e.g., wholenumbers, decimals, fractions), number concepts (e.g., half,dozen, twice, more than), and basic operations (addition,subtraction, multiplication, division). The extent to whichtests differentially sample content can account for dif-ferences between tests that purport to measure the sameconstruct.
Tests should ideally include enough diverse contentto adequately sample the breadth of construct-relevantdomains, but content sampling should not be so diversethat scale coherence and uniformity is lost. Constructunderrepresentation, stemming from use of narrow andhomogeneous content sampling, tends to yield higher reli-abilities than tests with heterogeneous item content, at thepotential cost of generalizability and external validity. Incontrast, tests with more heterogeneous content may showhigher validity with the concomitant cost of scale reliabil-ity. Clinical inferences made from tests with excessivelynarrow breadth of content may be suspect, even whenother indices of validity are satisfactory (Haynes et al.,1995).
Content validity is particularly valued for educa-tional achievement testing, vocational testing, and someself-report measures of personality and psychopathol-ogy, because the congruence of test content with testinterpretation is quite linear. For state educational assess-ments, for example, Crocker (2003) observed that thematch between test content and curricular requirementsbuttresses the legal defensibility of standardized tests:“When scores are used for educational accountability, the
Fundamental Psychometric Considerations in Assessment 61
‘load-bearing wall’ of that [validity] argument is surelycontent representativeness” (p. 7).
In the field of personality assessment, the developmentof the Minnesota Multiphasic Personality Inventory, Sec-ond Edition (MMPI-2) Restructured Clinical Scales andthe subsequent publication of the MMPI-2 RestructuredForm (MMPI-2-RF; Ben-Porath & Tellegen, 2008; Tel-legen & Ben-Porath, 2008) has marked a shift towardimproved content validity in this most widely used per-sonality test, because empirically keyed “subtle” items anditems saturated with a primary “demoralization” factorhave been removed from the clinical scales, eliminatingsome 40% of MMPI-2 items to generate a new form,the MMPI-2-RF, in which item content is easily mappedonto the clinical dimension being measured. This was notalways true for previous editions of the MMPI, whichincluded items with unclear content relevance for person-ality and psychopathology:
• I used to like drop-the-handkerchief.• I liked Alice’s Adventures in Wonderland by Lewis
Carroll.
In a special journal issue dedicated to a possible paradigmshift away from MMPI and MMPI-2 empirically deriveditem traditions, Weed (2006) outlined the strengths,limitations, and controversies associated with the newMMPI-2-RF.
Examinee Response Processes
An examination of how individuals solve problems oranswer questions is potentially important in establishingthat a test measures what it purports to measure. The Stan-dards for Educational and Psychological Testing (1999)stated that evidence based on response processes concerns“the fit between the construct and the detailed nature ofperformance or response actually engaged in by exami-nees” (p. 12). For example, a test measuring mathematicalproficiency should not be difficult because its vocabularyis not understood; alternatively, a pictorial measure shouldnot appear difficult merely because the picture is con-fusing. While item-level statistical analyses will normallyidentify test items that do not perform adequately froma psychometric perspective, new qualitative methods arebeing developed to identify the mental processes by whichexaminees understand and respond to test items.
The most compelling of these methods are Ericssonand Simon’s (1980) “thinking aloud” procedures, whichinvolve focusing on a challenging task while concurrentlygiving verbal expression to thoughts entering attention.A meta-analysis has shown that the think-aloud method
shows no evidence of reactivity (or other influence on theaccuracy of performance) (Fox, Ericsson, & Best, 2011).A representative think-aloud procedure consists of thisdirective given to a test taker:
I would like you to start reading the questions aloud and tellme what you are thinking as you read the questions. Afteryou have read the question, interpret the question in yourown words. Think aloud and tell me what you are doing.What is the question asking you to do? What did you haveto do to answer the question? How did you come up withyour solution? Tell me everything you are thinking while youare doing the question. (Ercikan et al., 2011, p. 27)
For educational achievement testing, the think-aloud re-sponses are recorded and scored according to four themes:understanding of the item, difficulty of the item, aspectsof the item that are helpful in arriving at a solution,and aspects of the item that are confusing and difficultto understand (Ercikan, Arim, Law, Domene, Gagnon, &Lacroix, 2011).
Other methods to study examinee response processesinclude interviews of examinees, observation of test ses-sion behaviors, examination of item reaction times, eyemovement tracking, and even simultaneous functionalbrain mapping methodologies. For our narrow goal ofimproving test score validity, think aloud protocols rep-resent an economical way to ensure that test items areeliciting responses that tap the targeted construct and notconstruct-irrelevant responses.
Substantive Validity
The formulation of test items and procedures based onand consistent with a theory has been termed substantivevalidity (Loevinger, 1957). The presence of an underlyingtheory enhances a test’s construct validity by providingscaffolding between content and constructs, which logi-cally explains relations between elements, predicts unde-termined parameters, and explains findings that would beanomalous within another theory (e.g., Kuhn, 1970). AsCrocker and Algina (1986) suggested, “[P]sychologicalmeasurement, even though it is based on observableresponses, would have little meaning or usefulness unlessit could be interpreted in light of the underlying theoreticalconstruct” (p. 7).
Many major psychological tests remain psychometri-cally rigorous but impoverished in terms of theoreticalunderpinnings. For example, conspicuously little theoryis associated with most widely used measures of intel-ligence (e.g., the Wechsler scales), behavior problems(e.g., the Child Behavior Checklist), neuropsychological
62 Assessment Issues
functioning (e.g., the Halstead-Reitan NeuropsychologyBattery), and personality and psychopathology (theMMPI-2). It may well be that there are post hoc benefitsto tests developed without theories; as observed byNunnally and Bernstein (1994), “Virtually every measurethat became popular led to new unanticipated theories”(p. 107). Moreover, tests with well-articulated theoriesmay be easier to discredit than tests without accompany-ing theory—because falsifying the theory will underminethe substantive validity of the test.
Personality assessment has taken a leading role intheory-based test development, while only now, with therise of the Cattell-Horn-Carroll framework for understand-ing human abilities, is cognitive-intellectual assessmentincreasingly relying of theory. Describing best practicesfor the measurement of personality some three decadesago, Loevinger (1972) commented, “Theory has alwaysbeen the mark of a mature science. The time is overduefor psychology, in general, and personality measurement,in particular, to come of age” (p. 56).
Structural Validity
Structural validity relies mainly on factor-analytic tech-niques to identify a test’s underlying dimensions andthe variance associated with each dimension. Also calledfactorial validity (Guilford, 1950), this form of validitymay utilize other methodologies, such as multidimen-sional scaling, to help researchers understand a test’sstructure. Structural validity evidence is generally inter-nal to the test, based on the analysis of constituent sub-tests or scoring indices. Structural validation approachesmay also combine two or more instruments in cross-battery factor analyses to explore evidence of convergentvalidity.
The two leading factor analytic methodologies used toestablish structural validity are exploratory and confirma-tory factor analyses. Exploratory factor analyses (EFAs)allow for empirical derivation of the structure of an instru-ment, often without a priori expectations, and are bestinterpreted according to the “psychological meaningful-ness” of the dimensions or factors that emerge (e.g., Gor-such, 1983a). Confirmatory factor analyses (CFAs) helpresearchers evaluate the congruence of the test data witha specified model and measure the relative fit of compet-ing models. Confirmatory analyses explore the extent towhich the proposed factor structure of a test explains itsunderlying dimensions as compared to alternative theoret-ical explanations. Thompson (2004) asserted, “Both EFAand CFA remain useful today, and our selection betweenthe two classes of factor analysis generally depends on
whether we have specific theory regarding data structure”(p. 6).
As a recommended guideline, the underlying factorstructure of a test should be congruent with its com-posite indices (e.g., Floyd & Widaman, 1995), and theinterpretive structure of a test should be the best-fittingstructural model available. For example, the transforma-tion of the Wechsler intelligence scales from a histori-cally dichotomous interpretive structure (i.e., verbal andperformance IQ, subordinate to the Full Scale IQ) toa four-factor interpretive structure (i.e., the verbal com-prehension index, perceptual organization index, workingmemory index, and processing speed index, each con-tributing to the superordinate Full Scale IQ) reflects therelative importance of factor-analytic studies in drivingtest design and structure (Wechsler, 2003, 2008).
In the areas of personality and psychopathologyassessment, leading instruments have long been plaguedby inadequate structural validity. The MMPI and itsrestandardization, the MMPI-2, have received highlycritical reviews as being “suboptimal from the perspectiveof modern psychometric standards” (Helmes & Reddon,1993, p. 453), particularly for the mismatch betweentheir psychometric and interpretive structure (e.g., Horn,Wanberg, & Appel, 1973). Some improvement is reportedin the factorial support for the MMPI-2-RF RestructuredClinical scales, which extracted items tapping demor-alization content (that saturated the clinical scales) toan independent scale, thereby leaving the restructuredclinical scales more unidimensional with higher reliability(Hoelzle & Meyer, 2008; Tellegen, Ben-Porath, McNulty,Arbisi, Graham, & Kaemmer, 2003).
A different problem with structural validity has beenobserved with the widely recognized “Big Five” five-factor model of normal range personality, which hasbeen repeatedly supported with exploratory factor anal-yses and disconfirmed with confirmatory factor analyses(e.g., Gignac, Bates, & Jang, 2007; Vassend & Skrondal,2011). The five-factor model represents personality traitstructure in terms of five orthogonal factors—neuroticism,extraversion, openness to experience, agreeableness, andconscientiousness—and is most commonly assessed withthe NEO Personality Inventory (NEO-PI-3; Costa &McCrae, 2010). In response to consistent findings of poormodel fit via CFA, McCrae, Zonderman, Costa, Bond,and Paunonen (1996) have asserted that confirmatory fac-tor analysis is systematically flawed, capable of showingpoor fits for reliable structures, and they warn of “the dan-gers in an uncritical adoption and simplistic application ofCFA techniques” (p. 563).
Fundamental Psychometric Considerations in Assessment 63
The cases of the MMPI-2 and the NEO-PI-3 suggestthat a reasonable balance needs to be struck betweentheoretical underpinnings and structural validation; thatis, if factor-analytic techniques do not consistently sup-port a test’s underpinnings, further research is needed todetermine whether that is due to limitations of the the-ory, the factor-analytic methods, the nature of the test,or a combination of these factors. Carroll (1983), whosefactor-analytic work has been influential in contemporarycognitive assessment, cautioned against overreliance onfactor analysis as principal evidence of validity, encour-aging use of additional sources of validity evidence thatmove “beyond factor analysis” (p. 26).
External Evidence of Validity
Evidence of test score validity also includes the extentto which the test results predict meaningful and general-izable behaviors independent of actual test performance.Test results need to be validated for any intended appli-cation or decision-making process in which they playa part. This section describes external classes of evi-dence for test construct validity, including convergent,discriminant, criterion-related, and consequential valid-ity, as well as specialized forms of validity within thesecategories.
Convergent and Discriminant Validity
In a classic 1959 article, Campbell and Fiske describeda multitrait-multimethod methodology for investigatingconstruct validity. In brief, they suggested that a mea-sure is jointly defined by its methods of gathering data(e.g., self-report or parent report) and its trait-relatedcontent (e.g., anxiety or depression). They noted thattest scores should be related to (i.e., strongly correlatedwith) other measures of the same psychological construct(convergent evidence of validity) and comparatively unre-lated to (i.e., weakly correlated with) measures of dif-ferent psychological constructs (discriminant evidence ofvalidity). The multitrait-multimethod matrix allows forthe comparison of the relative strength of associationbetween two measures of the same trait using differ-ent methods (monotrait-heteromethod correlations), twomeasures with a common method but tapping differ-ent traits (heterotrait-monomethod correlations), and twomeasures tapping different traits using different methods(heterotrait-heteromethod correlations), all of which areexpected to yield lower values than internal consistencyreliability statistics using the same method to tap thesame trait.
The multitrait-multimethod matrix offers several advan-tages, such as the identification of problematic methodvariance. Method variance is a measurement artifact thatthreatens validity by producing spuriously high correla-tions between similar assessment methods of differenttraits. For example, high correlations between digit span,letter span, phoneme span, and word span procedures mightbe interpreted as stemming from the immediate memoryspan recall method common to all the procedures ratherthan any specific abilities being assessed. Method effectsmay be assessed by comparing the correlations of differenttraits measured with the same method (i.e., monomethodcorrelations) and the correlations among different traitsacross methods (i.e., heteromethod correlations). Methodvariance is said to be present if the heterotrait-monomethodcorrelations greatly exceed the heterotrait-heteromethodcorrelations in magnitude, assuming that convergent valid-ity has been demonstrated.
Fiske and Campbell (1992) subsequently recognizedshortcomings in their methodology: “We have yet tosee a really good matrix: one that is based on fairlysimilar concepts and plausibly independent methods andshows high convergent and discriminant validation by allstandards” (p. 394). At the same time, the methodologyhas provided a useful framework for establishing evidenceof validity.
Criterion-Related Validity
How well do test scores predict performance on indepen-dent criterion measures and differentiate criterion groups?The relationship of test scores to relevant external criteriaconstitutes evidence of criterion-related validity, whichmay take several different forms. Evidence of validitymay include criterion scores that are obtained at aboutthe same time (concurrent evidence of validity) or cri-terion scores that are obtained at some future date (pre-dictive evidence of validity). External criteria may alsoinclude functional, real-life variables (ecological validity),diagnostic or placement indices (diagnostic validity), andintervention-related approaches (instructional and treat-ment validity).
The emphasis on understanding the functional impli-cations of test findings describes ecological validity(Neisser, 1978). Banaji and Crowder (1989) suggested,“If research is scientifically sound it is better to use eco-logically lifelike rather than contrived methods” (p. 1188).In essence, ecological validation efforts relate test per-formance to various aspects of person–environmentfunctioning in everyday life, including identification ofboth competencies and deficits in social and educational
64 Assessment Issues
adjustment. Test developers should show the ecologicalrelevance of the constructs a test purports to measureas well as the utility of the test for predicting everydayfunctional limitations for remediation. In contrast, testsbased on laboratory-like procedures with little or nodiscernible relevance to real life may be said to havelittle ecological validity.
The capacity of a measure to produce relevant appliedgroup differences has been termed diagnostic validity(e.g., Ittenbach, Esters, & Wainer, 1997). When tests areintended for diagnostic or placement decisions, diagnosticvalidity refers to their utility in differentiating the groupsof concern. The process of arriving at diagnostic validitymay be informed by decision theory, which involvescalculations of decision-making accuracy in comparisonto the base rate occurrence of an event or diagnosis ina given population. Decision theory has been applied topsychological tests (Cronbach & Gleser, 1965) and otherhigh-stakes diagnostic tests (Swets, 1992) and is usefulfor identifying the extent to which tests improve clinicalor educational decision making.
Contrasted groups is a common methodology to dem-onstrate diagnostic validity. In this methodology, test per-formance of two samples that are known to be different onthe criterion of interest is compared. For example, a testintended to tap behavioral correlates of anxiety shouldshow differences between groups of “normal” individu-als and individuals diagnosed with anxiety disorders. Atest intended for differential diagnostic utility should beeffective in differentiating individuals with anxiety dis-orders from diagnoses that appear behaviorally similar.Decision-making classification accuracy may be deter-mined by developing cutoff scores or rules to differentiatethe groups, so long as the rules show adequate sensitiv-ity, specificity, positive predictive power, and negativepredictive power, as defined next.
• Sensitivity : The proportion of cases in which a clinicalcondition is detected when it is in fact present (truepositive)
• Specificity : The proportion of cases for which a diag-nosis is rejected when rejection is in fact warranted(true negative)
• Positive predictive power : The probability of havingthe diagnosis given that the score exceeds the cutoffscore
• Negative predictive power : The probability of not hav-ing the diagnosis given that the score does not exceedthe cutoff score
All of these indices of diagnostic accuracy are dependenton the prevalence of the disorder and the prevalence ofthe score on either side of the cut point.
Findings pertaining to decision making should be inter-preted conservatively and cross-validated on independentsamples because (a) classification decisions should inpractice be based on the results of multiple sources ofinformation rather than test results from a single mea-sure, and (b) the consequences of a classification decisionshould be considered in evaluating the impact of classifi-cation accuracy. A false negative classification, meaning achild is incorrectly classified as not needing special educa-tion services, could mean the denial of needed services toa student. Alternatively, a false positive classification, inwhich a typical child is recommended for special services,could result in a child being labeled unfairly.
Bayesian methods to calculate evidential probabilitieshold considerable promise in enhancing applied decisionmaking, by permitting prior probabilities to be specifiedand then updated with relevant data such as test results.For example, the Bayesian nomogram represents a simpleand practical strategy that is empirically derived, flexible,and easy to use as an aid to clinical decision making;it enables base rate information and test findings to beintegrated to arrive at the probability for any likely out-come (e.g., Bianchi, Alexander, & Cash, 2009; Jenkins,Youngstrom, Washburn, & Youngstrom, 2011).
Treatment validity refers to the value of an assessmentin selecting and implementing interventions and treat-ments that will benefit the examinee. “Assessment data aresaid to be treatment valid,” commented Barrios (1988), “ifthey expedite the orderly course of treatment or enhancethe outcome of treatment” (p. 34). Other terms used todescribe treatment validity are treatment utility (Hayes,Nelson, & Jarrett, 1987) and rehabilitation-referencedassessment (Heinrichs, 1990).
Whether the stated purpose of clinical assessment isdescription, diagnosis, intervention, prediction, tracking,or simply understanding, its ultimate raison d’etre is toselect and implement services in the best interests of theexaminee, that is to guide treatment. In 1957, Cronbachdescribed a rationale for linking assessment to treatment:“For any potential problem, there is some best groupof treatments to use and best allocation of persons totreatments” (p. 680).
The origins of treatment validity may be traced to theconcept of aptitude by treatment interactions (ATIs) origi-nally proposed by Cronbach (1957), who initiated decadesof research seeking to specify relationships between thetraits measured by tests and the intervention methodology
Fundamental Psychometric Considerations in Assessment 65
used to produce change. In clinical practice, promis-ing efforts to match client characteristics and clini-cal dimensions to preferred therapist characteristics andtreatment approaches have been made (e.g., Beutler &Clarkin, 1990; Beutler & Harwood, 2000; Lazarus, 1973;Maruish, 1994), but progress has been constrained inpart by difficulty in arriving at consensus for empiricallysupported treatments (e.g., Beutler, 1998). In psychoed-ucational settings, tests results have been shown to havelimited utility in predicting differential responses to variedforms of instruction (e.g., Reschly, 1997).
Turning the model that test results can predict effec-tive treatment upside-down, recent federal mandates in thereauthorized Individuals with Disabilities Education Act(IDEA) have led to the practice of identifying learning dis-orders by Response to Intervention (RTI). RTI addressesthe educational needs of at-risk students by delivering aseries of instructional interventions accompanied by fre-quent progress measurements; students who do not bene-fit are considered in need of special education and arereferred for further assessment and intervention. Morethan anything else, in RTI, it is the inadequate response tothe initial treatment (i.e., evidence-based forms of instruc-tion) that becomes diagnostic of a learning problem andpotentially qualifies a student for special education (e.g.,Vaughn & Fuchs, 2003).
Consequential Validity
The most recently proposed source of evidence for testscore validity is concerned with both the intended andthe unintended effects of test usage on individuals andgroups. Messick (1989a, 1989b, 1995b) argued that testdevelopers must understand the social values intrinsicto the purposes and application of psychological tests,especially those that may act as a trigger for socialand educational actions. In this context, consequentialvalidity refers to the appraisal of value implications andthe social and legal impact of score interpretation asa basis for action and labeling as well as the actualand potential consequences of test use (Messick, 1989a,1989b; Reckase, 1998).
Legal rulings and legislative actions have played a sub-stantial role in establishing consequential validity, whichwas addressed in the landmark legal case of Larry P . v .Riles (343 F. Supp. 306, 1972; 495 F. Supp. 926, 1979),in which the court wrote that the consequences of testusage must be aligned with valid interpretation about whatthe test purports to measure. More recently, the text ofthe federal No Child Left Behind Act of 2001 (NCLB,2002) legislation included a validity clause stating that
assessments must “be used for purposes for which suchassessments are valid and reliable, and be consistent withrelevant, nationally recognized professional and techni-cal standards” [20 U.S.C. § 6311(b)(3)(C)(iii)(2002)]. Forlarge-scale, high-stakes educational testing, this clause hasbeen interpreted as taking on meanings associated withsocial and racial equity:
Couched in this statutory framework, the exact meaning ofthe validity clause becomes extremely important. One possi-ble definition of the validity clause would ensure only thatNCLB tests have certain statistical relationships with behav-iors that students exhibit in a non-test environment. Otherpossible definitions of the validity clause would control thequality of testing practices to a much greater extent. Forexample, some meanings of the validity clause would man-date consideration of whether NCLB testing practices dispro-portionately affect students on the basis of race. Other notionsof the validity clause would go even further by consider-ing how well NCLB accountability measures achieve theirstatutory goal of boosting academic achievement. (Superfine,2004, p. 482)
The immediate effect of the validity clause appears to havebeen to codify requirements for proportionate classifica-tion of racial and ethnical minorities in special education,with applications to grade retention and promotion poli-cies and a wide array of other educational practices. Linn(1998) suggested that when governmental bodies establishpolicies that drive test development and implementation,the responsibility for the consequences of test usage mustalso be borne by the policy makers—and this form ofvalidity extends far beyond the ken of test developers.
Consequential validity represents an expansion of tradi-tional conceptualizations of test score validity. Lees-Haley(1996) urged caution about consequential validity, notingits potential for encouraging the encroachment of politicsinto science. The Standards for Educational and Psycho-logical Testing (1999) recognized but carefully circum-scribed consequential validity:
Evidence about consequences may be directly relevant tovalidity when it can be traced to a source of invaliditysuch as construct underrepresentation or construct-irrelevantcomponents. Evidence about consequences that cannotbe so traced—that in fact reflects valid differences inperformance—is crucial in informing policy decisions butfalls outside the technical purview of validity. (p. 16)
Evidence of consequential validity may be collected bytest developers during a period starting early in testdevelopment and extending through the life of the test
66 Assessment Issues
(Reckase, 1998). For educational tests, surveys and focusgroups have been described as two methodologies toexamine consequential aspects of validity (Chudowsky &Behuniak, 1998; Pomplun, 1997). The extent to whichtest results yield statistical evidence of disparate or dis-criminatory results on protected groups may also con-stitute compelling evidence of test score consequential(in)validity with legal implications (e.g., Superfine, 2004).As the social consequences of test use and interpreta-tion are ascertained, the development and determinantsof the consequences need to be explored. A measurewith unintended negative side effects calls for examinationof alternative measures and assessment counterproposals.Consequential validity is especially relevant to issues ofbias, fairness, and distributive justice.
After a comprehensive survey of validity research pub-lished or presented in the past decade, Cizek, Bowen,and Church (2010) reported that consequential validityresearch was “essentially nonexistent in the professionalliterature” (p. 732), leading them to call it “a flaw in mod-ern validity theory” (p. 739). They hypothesized that itis not possible to include consequences of test usage asa logical part of validation, in part because of the diffi-culty of synthesizing and integrating consequential valuejudgments with more traditional psychometric data perse. Moreover, they recommended differentiating the vali-dation of score inferences from justifications for test use.
Validity Generalization
The accumulation of external evidence of test validitybecomes most important when test results are generalizedacross contexts, situations, and populations and when theconsequences of testing reach beyond the test’s originalintent. According to Messick (1995b), “The issue of gen-eralizability of score inferences across tasks and contextsgoes to the very heart of score meaning. Indeed, settingthe boundaries of score meaning is precisely what gener-alizability evidence is meant to address” (p. 745).
Hunter and Schmidt (1990; Hunter, Schmidt, & Jack-son, 1982; Schmidt & Hunter, 1977) developed a method-ology of validity generalization, a form of meta-analysis,that analyzes the extent to which variation in test validityacross studies is due to sampling error or other sourcesof error such as imperfect reliability, imperfect constructvalidity, range restriction, or artificial dichotomization.Once incongruent or conflictual findings across studies canbe explained in terms of sources of error, meta-analysisenables theory to be tested, generalized, and quantitativelyextended.
TEST SCORE RELIABILITY
If measurement is to be trusted, then it must be reliable.It must be consistent, accurate, and uniform across test-ing occasions, across time, across observers, and acrosssamples—at least to the extent that the trait or constructbeing measured is stable. In psychometric terms, relia-bility refers to the extent to which measurement resultsare precise and accurate, reproducible, and free from ran-dom and unexplained error. Reliability has been describedas “fundamental to all of psychology” (Li, Rosenthal, &Rubin, 1996, p. 98), and its study dates back nearly acentury (Brown, 1910; Spearman, 1910). Reliability isthe ratio of true score variance to observed score vari-ance or, alternatively, the squared correlation betweentrue and observed scores (e.g., Lord & Novick, 1968).Although traditional statistics such as Cronbach’s coef-ficient alpha remain preeminent in published reliabilityresearch (Hogan, Benjamin, & Brezinski, 2000), some-what newer important concepts in reliability include gen-eralizability theory (albeit several decades “new”; Cron-bach, Gleser, Nanda, & Rajaratnam, 1972) and reliabilitygeneralization (Vacha-Haase, 1998), both of which haveimportant implications for how reliability is reported (e.g.,Fan & Thompson, 2001). In this section, reliability isdescribed according to CTT and IRT. Guidelines are pro-vided for the objective evaluation of reliability.
The idea that reliability is a fixed property of a testor scale has been described as the primary myth aboutreliability still ubiquitous in test manuals (e.g., Streiner,2003). As articulated by Wilkinson and the APA TaskForce on Statistical Inference (1999), “Reliability is aproperty of the scores on a test for a particular popula-tion of examinees” (p. 596). More specifically, reliabilityis dependent on total score variance, so factors such assample composition and test score variability will affectscore reliability. For a fixed error variance, reliabilitywill generally be large for a heterogeneous sample withlarge true score variance but small for a more homoge-neous sample with small true score variance (e.g., Meyer,2010).
Because any selected research sample may have testscore reliabilities that differ significantly from the scorereliabilities reported for normative standardization sam-ples in test manuals, psychometric authorities have rec-ommended that reliability indexes be calculated anewand reported as new samples are collected for research(Vacha-Haase, Kogan, & Thompson, 2000). Moreover, itis helpful for normative samples to report not only scorereliabilities for each age cohort and score but also for
Fundamental Psychometric Considerations in Assessment 67
any sample subgroups that may exhibit different levels ofheterogeneity.
Generalizability Theory
While CTT decomposes observed score variance into truescore variance and undifferentiated random error vari-ance, an extension of CTT termed generalizability theory(Cronbach et al., 1972) includes a family of statisticalprocedures that estimates and partitions multiple sourcesof measurement error variance (facets) and their interac-tions. Generalizability theory posits that a response scoreis defined by the specific conditions under which it isproduced, such as scorers, methods, settings, and times,and employs analysis of variance (ANOVA) methods tountangle the error associated with each of these condi-tions (e.g., Brennan, 2010b; Cone, 1978). Generalizabilitytheory provides two reliability indexes: a generalizabilitycoefficient (analogous to a reliability coefficient in CTT,estimating relative reliability for a wide range of scores),and a dependability coefficient (an estimate of absolutereliability in making criterion-referenced decisions, suchas the reliability of passing and failing an academic pro-ficiency exam with a cut score). Thompson (2003) notedthat generalizability theory has the advantages of simul-taneously enabling quantification of (a) multiple sourcesof measurement error variance, (b) interactions that cre-ate additional sources of measurement error variance, and(c) reliability for different types of decisions (i.e., rel-ative or absolute). In spite of the powerful techniquesfound in generalizability theory, its use appears conspicu-ously absent from mental measures created in recent years(Hogan et al., 2000).
Internal Consistency
Determination of a test’s internal consistency addressesthe degree of uniformity and coherence among its con-stituent parts. Tests that are more uniform and unidimen-sional tend to be more reliable. As a measure of internalconsistency, the reliability coefficient is the square of thecorrelation between obtained test scores and true scores;it will be high if there is relatively little error but lowwith a large amount of error. In CTT, reliability is basedon the assumption that measurement error is distributednormally and equally for all score levels. By contrast, IRTposits that reliability differs between persons with differ-ent response patterns and levels of ability but generalizesacross populations (Embretson & Hershberger, 1999).
Several statistics typically are used to calculate internalconsistency. The split-half method of estimating reliability
effectively splits test items in half (e.g., odd items andeven items) and correlates the score from each half ofthe test with the score from the other half. This techniquereduces the number of items in the test, thereby reducingthe magnitude of the reliability. Use of the Spearman-Brown prophecy formula permits extrapolation from theobtained reliability coefficient to original length of the test,typically raising the reliability of the test. By far the mostcommon statistical index of internal consistency is Cron-bach’s alpha, which provides a lower-bound estimate oftest score reliability equivalent to the average split-halfconsistency coefficient for all possible divisions of thetest into halves (Hogan et al., 2000).
Several recent studies serve to elucidate the limita-tions of Cronbach’s alpha, specifically that it is stronglyaffected by scale length, that a high score does not ensurescale unidimensionality, and that excessively high scores(>.90) on subtests or scales are potentially risky. Theeffects of scale length on alpha have been long known,but Cortina (1993) demonstrated that when item incor-relations are held constant, increasing the length of ascale will substantially (and spuriously) raise its coeffi-cient alpha—even when scales consist of two or threeuncorrelated subscales. Cortina concluded: “If a scale hasmore than 14 items, then it will have an α of .70 or bet-ter even if it consists of two orthogonal dimensions withmodest (i.e., .30) item intercorrelations. If the dimensionsare correlated with each other, as they usually are, then α
is even greater” (p. 102).Accordingly, alpha has limited value as a measure of
scale unidimensionality or homogeneity (Cortina, 1993;Streiner, 2003). As alpha rises above .90, it becomespossible that its capacity to estimate high internal con-sistency may instead signal item redundancy (essentiallythe same content expressed with different verbiage), lead-ing Streiner to caution against use of single scales andtests with an alpha great than .90. Clark and Watson(1995) concurred in principle, observing: “Maximizinginternal consistency almost invariably produces a scalethat is quite narrow in content; if the scale is narrowerthan the target construct, its validity is compromised”(pp. 316–317). Nunnally and Bernstein (1994, p. 265)stated more directly: “Never switch to a less valid mea-sure simply because it is more reliable.” Conversely,highly homogeneous item sets may evidence high reliabil-ity as a function of limited content or construct sampling.Table 3.1 provides practical guidelines for evaluating testreliability coefficients, with higher coefficients neededwhen high-stakes individual student decisions are tobe made.
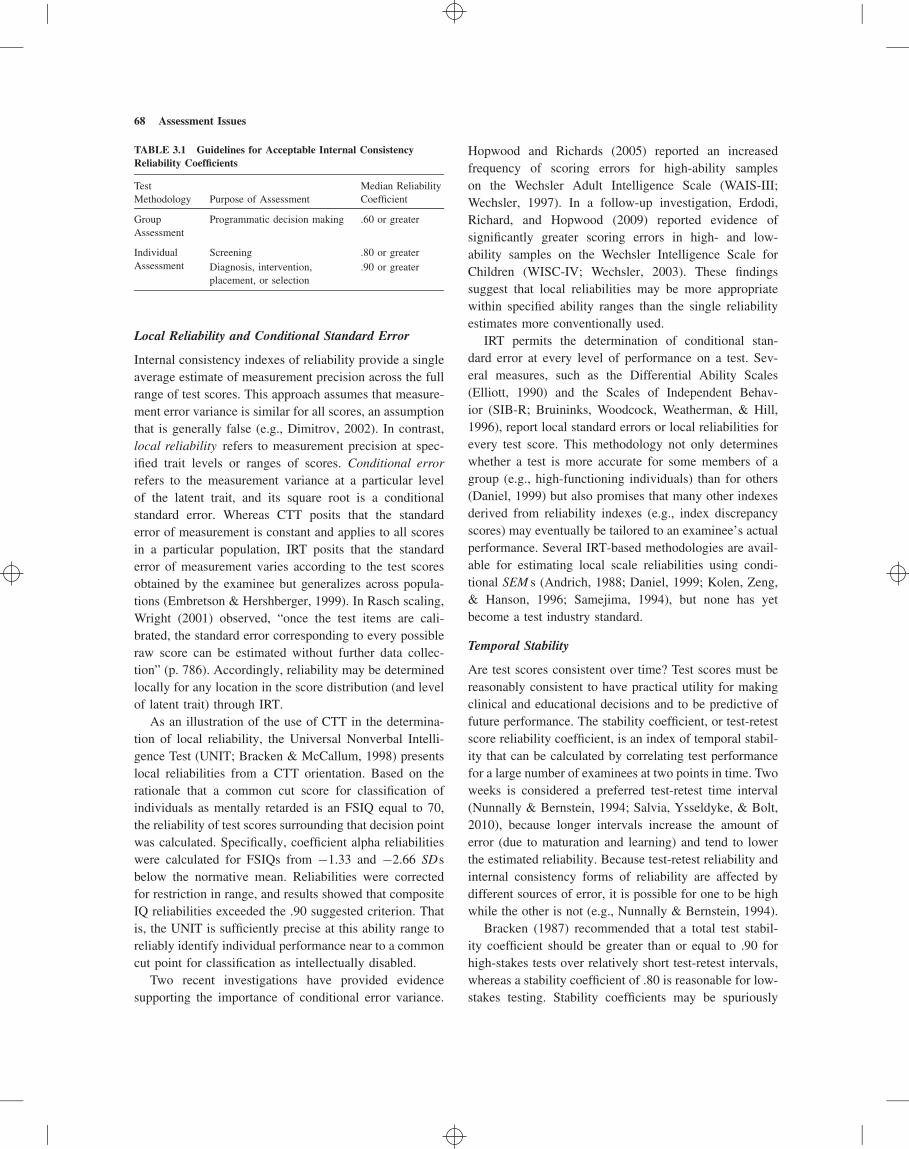
68 Assessment Issues
TABLE 3.1 Guidelines for Acceptable Internal ConsistencyReliability Coefficients
TestMethodology Purpose of Assessment
Median ReliabilityCoefficient
GroupAssessment
Programmatic decision making .60 or greater
IndividualAssessment
Screening .80 or greaterDiagnosis, intervention,placement, or selection
.90 or greater
Local Reliability and Conditional Standard Error
Internal consistency indexes of reliability provide a singleaverage estimate of measurement precision across the fullrange of test scores. This approach assumes that measure-ment error variance is similar for all scores, an assumptionthat is generally false (e.g., Dimitrov, 2002). In contrast,local reliability refers to measurement precision at spec-ified trait levels or ranges of scores. Conditional errorrefers to the measurement variance at a particular levelof the latent trait, and its square root is a conditionalstandard error. Whereas CTT posits that the standarderror of measurement is constant and applies to all scoresin a particular population, IRT posits that the standarderror of measurement varies according to the test scoresobtained by the examinee but generalizes across popula-tions (Embretson & Hershberger, 1999). In Rasch scaling,Wright (2001) observed, “once the test items are cali-brated, the standard error corresponding to every possibleraw score can be estimated without further data collec-tion” (p. 786). Accordingly, reliability may be determinedlocally for any location in the score distribution (and levelof latent trait) through IRT.
As an illustration of the use of CTT in the determina-tion of local reliability, the Universal Nonverbal Intelli-gence Test (UNIT; Bracken & McCallum, 1998) presentslocal reliabilities from a CTT orientation. Based on therationale that a common cut score for classification ofindividuals as mentally retarded is an FSIQ equal to 70,the reliability of test scores surrounding that decision pointwas calculated. Specifically, coefficient alpha reliabilitieswere calculated for FSIQs from −1.33 and −2.66 SDsbelow the normative mean. Reliabilities were correctedfor restriction in range, and results showed that compositeIQ reliabilities exceeded the .90 suggested criterion. Thatis, the UNIT is sufficiently precise at this ability range toreliably identify individual performance near to a commoncut point for classification as intellectually disabled.
Two recent investigations have provided evidencesupporting the importance of conditional error variance.
Hopwood and Richards (2005) reported an increasedfrequency of scoring errors for high-ability sampleson the Wechsler Adult Intelligence Scale (WAIS-III;Wechsler, 1997). In a follow-up investigation, Erdodi,Richard, and Hopwood (2009) reported evidence ofsignificantly greater scoring errors in high- and low-ability samples on the Wechsler Intelligence Scale forChildren (WISC-IV; Wechsler, 2003). These findingssuggest that local reliabilities may be more appropriatewithin specified ability ranges than the single reliabilityestimates more conventionally used.
IRT permits the determination of conditional stan-dard error at every level of performance on a test. Sev-eral measures, such as the Differential Ability Scales(Elliott, 1990) and the Scales of Independent Behav-ior (SIB-R; Bruininks, Woodcock, Weatherman, & Hill,1996), report local standard errors or local reliabilities forevery test score. This methodology not only determineswhether a test is more accurate for some members of agroup (e.g., high-functioning individuals) than for others(Daniel, 1999) but also promises that many other indexesderived from reliability indexes (e.g., index discrepancyscores) may eventually be tailored to an examinee’s actualperformance. Several IRT-based methodologies are avail-able for estimating local scale reliabilities using condi-tional SEM s (Andrich, 1988; Daniel, 1999; Kolen, Zeng,& Hanson, 1996; Samejima, 1994), but none has yetbecome a test industry standard.
Temporal Stability
Are test scores consistent over time? Test scores must bereasonably consistent to have practical utility for makingclinical and educational decisions and to be predictive offuture performance. The stability coefficient, or test-retestscore reliability coefficient, is an index of temporal stabil-ity that can be calculated by correlating test performancefor a large number of examinees at two points in time. Twoweeks is considered a preferred test-retest time interval(Nunnally & Bernstein, 1994; Salvia, Ysseldyke, & Bolt,2010), because longer intervals increase the amount oferror (due to maturation and learning) and tend to lowerthe estimated reliability. Because test-retest reliability andinternal consistency forms of reliability are affected bydifferent sources of error, it is possible for one to be highwhile the other is not (e.g., Nunnally & Bernstein, 1994).
Bracken (1987) recommended that a total test stabil-ity coefficient should be greater than or equal to .90 forhigh-stakes tests over relatively short test-retest intervals,whereas a stability coefficient of .80 is reasonable for low-stakes testing. Stability coefficients may be spuriously
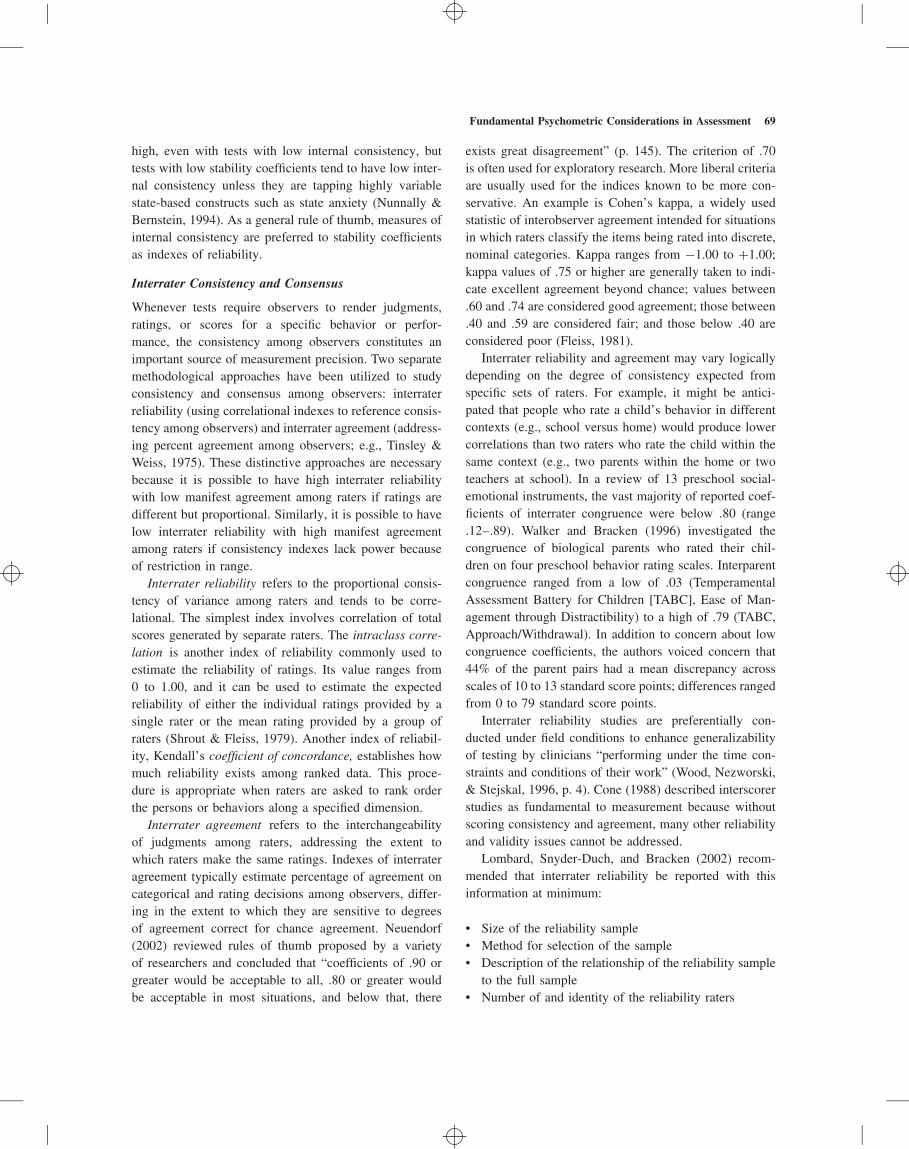
Fundamental Psychometric Considerations in Assessment 69
high, even with tests with low internal consistency, buttests with low stability coefficients tend to have low inter-nal consistency unless they are tapping highly variablestate-based constructs such as state anxiety (Nunnally &Bernstein, 1994). As a general rule of thumb, measures ofinternal consistency are preferred to stability coefficientsas indexes of reliability.
Interrater Consistency and Consensus
Whenever tests require observers to render judgments,ratings, or scores for a specific behavior or perfor-mance, the consistency among observers constitutes animportant source of measurement precision. Two separatemethodological approaches have been utilized to studyconsistency and consensus among observers: interraterreliability (using correlational indexes to reference consis-tency among observers) and interrater agreement (address-ing percent agreement among observers; e.g., Tinsley &Weiss, 1975). These distinctive approaches are necessarybecause it is possible to have high interrater reliabilitywith low manifest agreement among raters if ratings aredifferent but proportional. Similarly, it is possible to havelow interrater reliability with high manifest agreementamong raters if consistency indexes lack power becauseof restriction in range.
Interrater reliability refers to the proportional consis-tency of variance among raters and tends to be corre-lational. The simplest index involves correlation of totalscores generated by separate raters. The intraclass corre-lation is another index of reliability commonly used toestimate the reliability of ratings. Its value ranges from0 to 1.00, and it can be used to estimate the expectedreliability of either the individual ratings provided by asingle rater or the mean rating provided by a group ofraters (Shrout & Fleiss, 1979). Another index of reliabil-ity, Kendall’s coefficient of concordance, establishes howmuch reliability exists among ranked data. This proce-dure is appropriate when raters are asked to rank orderthe persons or behaviors along a specified dimension.
Interrater agreement refers to the interchangeabilityof judgments among raters, addressing the extent towhich raters make the same ratings. Indexes of interrateragreement typically estimate percentage of agreement oncategorical and rating decisions among observers, differ-ing in the extent to which they are sensitive to degreesof agreement correct for chance agreement. Neuendorf(2002) reviewed rules of thumb proposed by a varietyof researchers and concluded that “coefficients of .90 orgreater would be acceptable to all, .80 or greater wouldbe acceptable in most situations, and below that, there
exists great disagreement” (p. 145). The criterion of .70is often used for exploratory research. More liberal criteriaare usually used for the indices known to be more con-servative. An example is Cohen’s kappa, a widely usedstatistic of interobserver agreement intended for situationsin which raters classify the items being rated into discrete,nominal categories. Kappa ranges from −1.00 to +1.00;kappa values of .75 or higher are generally taken to indi-cate excellent agreement beyond chance; values between.60 and .74 are considered good agreement; those between.40 and .59 are considered fair; and those below .40 areconsidered poor (Fleiss, 1981).
Interrater reliability and agreement may vary logicallydepending on the degree of consistency expected fromspecific sets of raters. For example, it might be antici-pated that people who rate a child’s behavior in differentcontexts (e.g., school versus home) would produce lowercorrelations than two raters who rate the child within thesame context (e.g., two parents within the home or twoteachers at school). In a review of 13 preschool social-emotional instruments, the vast majority of reported coef-ficients of interrater congruence were below .80 (range.12–.89). Walker and Bracken (1996) investigated thecongruence of biological parents who rated their chil-dren on four preschool behavior rating scales. Interparentcongruence ranged from a low of .03 (TemperamentalAssessment Battery for Children [TABC], Ease of Man-agement through Distractibility) to a high of .79 (TABC,Approach/Withdrawal). In addition to concern about lowcongruence coefficients, the authors voiced concern that44% of the parent pairs had a mean discrepancy acrossscales of 10 to 13 standard score points; differences rangedfrom 0 to 79 standard score points.
Interrater reliability studies are preferentially con-ducted under field conditions to enhance generalizabilityof testing by clinicians “performing under the time con-straints and conditions of their work” (Wood, Nezworski,& Stejskal, 1996, p. 4). Cone (1988) described interscorerstudies as fundamental to measurement because withoutscoring consistency and agreement, many other reliabilityand validity issues cannot be addressed.
Lombard, Snyder-Duch, and Bracken (2002) recom-mended that interrater reliability be reported with thisinformation at minimum:
• Size of the reliability sample• Method for selection of the sample• Description of the relationship of the reliability sample
to the full sample• Number of and identity of the reliability raters
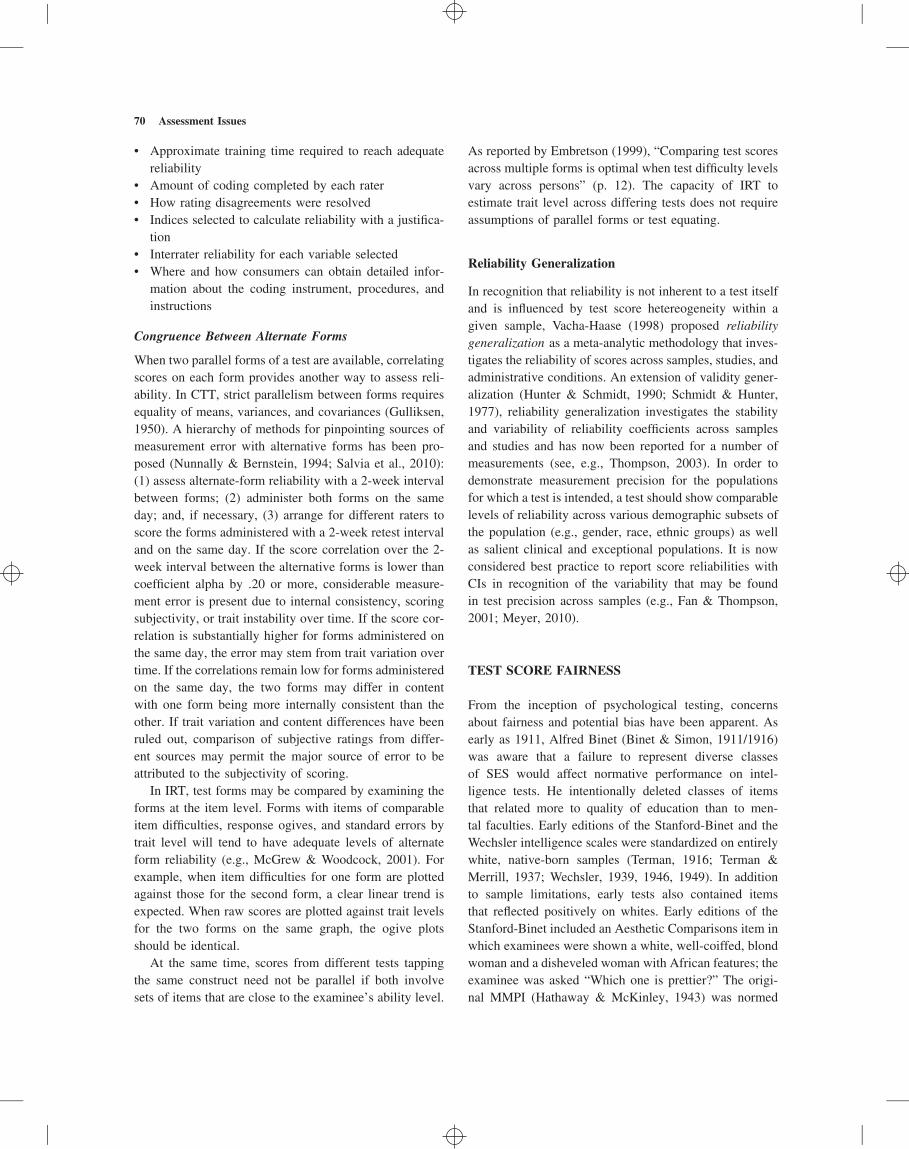
70 Assessment Issues
• Approximate training time required to reach adequatereliability
• Amount of coding completed by each rater• How rating disagreements were resolved• Indices selected to calculate reliability with a justifica-
tion• Interrater reliability for each variable selected• Where and how consumers can obtain detailed infor-
mation about the coding instrument, procedures, andinstructions
Congruence Between Alternate Forms
When two parallel forms of a test are available, correlatingscores on each form provides another way to assess reli-ability. In CTT, strict parallelism between forms requiresequality of means, variances, and covariances (Gulliksen,1950). A hierarchy of methods for pinpointing sources ofmeasurement error with alternative forms has been pro-posed (Nunnally & Bernstein, 1994; Salvia et al., 2010):(1) assess alternate-form reliability with a 2-week intervalbetween forms; (2) administer both forms on the sameday; and, if necessary, (3) arrange for different raters toscore the forms administered with a 2-week retest intervaland on the same day. If the score correlation over the 2-week interval between the alternative forms is lower thancoefficient alpha by .20 or more, considerable measure-ment error is present due to internal consistency, scoringsubjectivity, or trait instability over time. If the score cor-relation is substantially higher for forms administered onthe same day, the error may stem from trait variation overtime. If the correlations remain low for forms administeredon the same day, the two forms may differ in contentwith one form being more internally consistent than theother. If trait variation and content differences have beenruled out, comparison of subjective ratings from differ-ent sources may permit the major source of error to beattributed to the subjectivity of scoring.
In IRT, test forms may be compared by examining theforms at the item level. Forms with items of comparableitem difficulties, response ogives, and standard errors bytrait level will tend to have adequate levels of alternateform reliability (e.g., McGrew & Woodcock, 2001). Forexample, when item difficulties for one form are plottedagainst those for the second form, a clear linear trend isexpected. When raw scores are plotted against trait levelsfor the two forms on the same graph, the ogive plotsshould be identical.
At the same time, scores from different tests tappingthe same construct need not be parallel if both involvesets of items that are close to the examinee’s ability level.
As reported by Embretson (1999), “Comparing test scoresacross multiple forms is optimal when test difficulty levelsvary across persons” (p. 12). The capacity of IRT toestimate trait level across differing tests does not requireassumptions of parallel forms or test equating.
Reliability Generalization
In recognition that reliability is not inherent to a test itselfand is influenced by test score hetereogeneity within agiven sample, Vacha-Haase (1998) proposed reliabilitygeneralization as a meta-analytic methodology that inves-tigates the reliability of scores across samples, studies, andadministrative conditions. An extension of validity gener-alization (Hunter & Schmidt, 1990; Schmidt & Hunter,1977), reliability generalization investigates the stabilityand variability of reliability coefficients across samplesand studies and has now been reported for a number ofmeasurements (see, e.g., Thompson, 2003). In order todemonstrate measurement precision for the populationsfor which a test is intended, a test should show comparablelevels of reliability across various demographic subsets ofthe population (e.g., gender, race, ethnic groups) as wellas salient clinical and exceptional populations. It is nowconsidered best practice to report score reliabilities withCIs in recognition of the variability that may be foundin test precision across samples (e.g., Fan & Thompson,2001; Meyer, 2010).
TEST SCORE FAIRNESS
From the inception of psychological testing, concernsabout fairness and potential bias have been apparent. Asearly as 1911, Alfred Binet (Binet & Simon, 1911/1916)was aware that a failure to represent diverse classesof SES would affect normative performance on intel-ligence tests. He intentionally deleted classes of itemsthat related more to quality of education than to men-tal faculties. Early editions of the Stanford-Binet and theWechsler intelligence scales were standardized on entirelywhite, native-born samples (Terman, 1916; Terman &Merrill, 1937; Wechsler, 1939, 1946, 1949). In additionto sample limitations, early tests also contained itemsthat reflected positively on whites. Early editions of theStanford-Binet included an Aesthetic Comparisons item inwhich examinees were shown a white, well-coiffed, blondwoman and a disheveled woman with African features; theexaminee was asked “Which one is prettier?” The origi-nal MMPI (Hathaway & McKinley, 1943) was normed
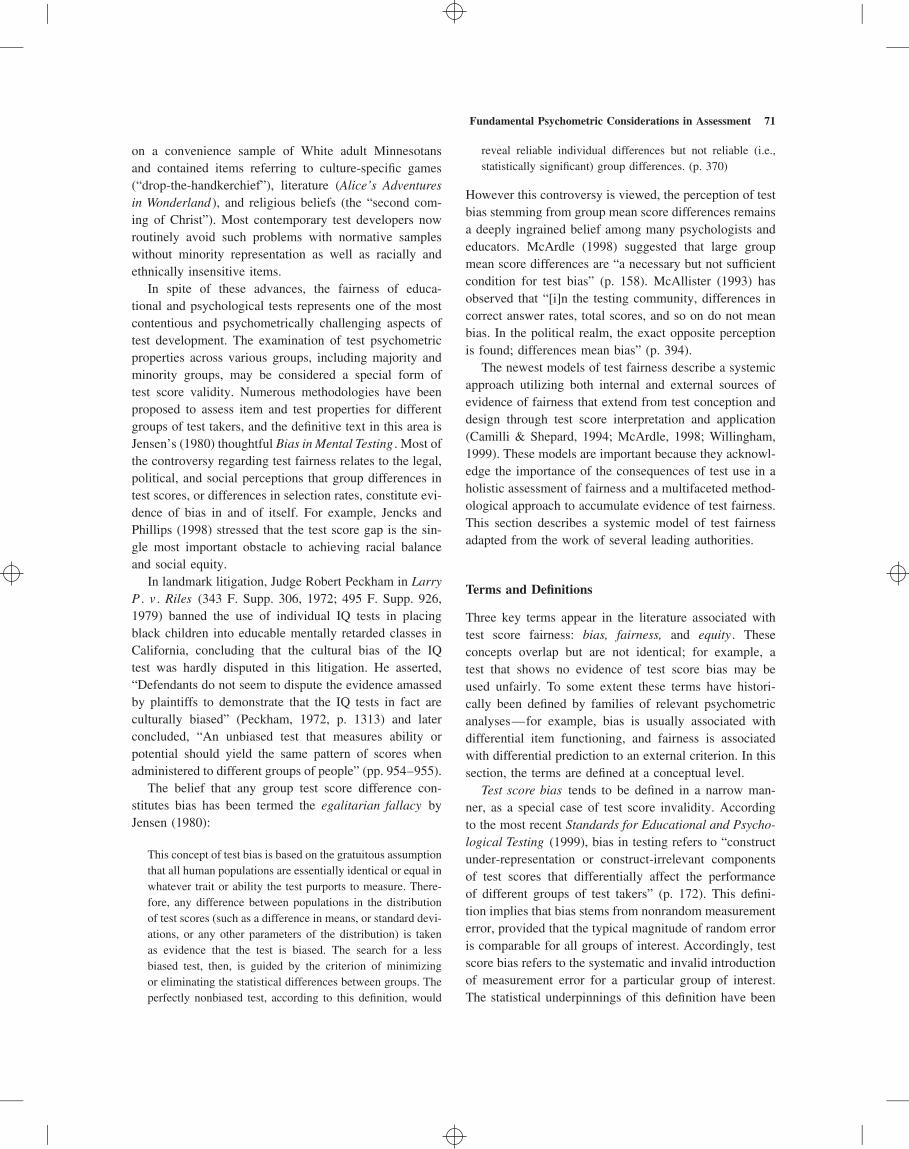
Fundamental Psychometric Considerations in Assessment 71
on a convenience sample of White adult Minnesotansand contained items referring to culture-specific games(“drop-the-handkerchief”), literature (Alice’s Adventuresin Wonderland ), and religious beliefs (the “second com-ing of Christ”). Most contemporary test developers nowroutinely avoid such problems with normative sampleswithout minority representation as well as racially andethnically insensitive items.
In spite of these advances, the fairness of educa-tional and psychological tests represents one of the mostcontentious and psychometrically challenging aspects oftest development. The examination of test psychometricproperties across various groups, including majority andminority groups, may be considered a special form oftest score validity. Numerous methodologies have beenproposed to assess item and test properties for differentgroups of test takers, and the definitive text in this area isJensen’s (1980) thoughtful Bias in Mental Testing . Most ofthe controversy regarding test fairness relates to the legal,political, and social perceptions that group differences intest scores, or differences in selection rates, constitute evi-dence of bias in and of itself. For example, Jencks andPhillips (1998) stressed that the test score gap is the sin-gle most important obstacle to achieving racial balanceand social equity.
In landmark litigation, Judge Robert Peckham in LarryP . v . Riles (343 F. Supp. 306, 1972; 495 F. Supp. 926,1979) banned the use of individual IQ tests in placingblack children into educable mentally retarded classes inCalifornia, concluding that the cultural bias of the IQtest was hardly disputed in this litigation. He asserted,“Defendants do not seem to dispute the evidence amassedby plaintiffs to demonstrate that the IQ tests in fact areculturally biased” (Peckham, 1972, p. 1313) and laterconcluded, “An unbiased test that measures ability orpotential should yield the same pattern of scores whenadministered to different groups of people” (pp. 954–955).
The belief that any group test score difference con-stitutes bias has been termed the egalitarian fallacy byJensen (1980):
This concept of test bias is based on the gratuitous assumptionthat all human populations are essentially identical or equal inwhatever trait or ability the test purports to measure. There-fore, any difference between populations in the distributionof test scores (such as a difference in means, or standard devi-ations, or any other parameters of the distribution) is takenas evidence that the test is biased. The search for a lessbiased test, then, is guided by the criterion of minimizingor eliminating the statistical differences between groups. Theperfectly nonbiased test, according to this definition, would
reveal reliable individual differences but not reliable (i.e.,statistically significant) group differences. (p. 370)
However this controversy is viewed, the perception of testbias stemming from group mean score differences remainsa deeply ingrained belief among many psychologists andeducators. McArdle (1998) suggested that large groupmean score differences are “a necessary but not sufficientcondition for test bias” (p. 158). McAllister (1993) hasobserved that “[i]n the testing community, differences incorrect answer rates, total scores, and so on do not meanbias. In the political realm, the exact opposite perceptionis found; differences mean bias” (p. 394).
The newest models of test fairness describe a systemicapproach utilizing both internal and external sources ofevidence of fairness that extend from test conception anddesign through test score interpretation and application(Camilli & Shepard, 1994; McArdle, 1998; Willingham,1999). These models are important because they acknowl-edge the importance of the consequences of test use in aholistic assessment of fairness and a multifaceted method-ological approach to accumulate evidence of test fairness.This section describes a systemic model of test fairnessadapted from the work of several leading authorities.
Terms and Definitions
Three key terms appear in the literature associated withtest score fairness: bias, fairness, and equity . Theseconcepts overlap but are not identical; for example, atest that shows no evidence of test score bias may beused unfairly. To some extent these terms have histori-cally been defined by families of relevant psychometricanalyses—for example, bias is usually associated withdifferential item functioning, and fairness is associatedwith differential prediction to an external criterion. In thissection, the terms are defined at a conceptual level.
Test score bias tends to be defined in a narrow man-ner, as a special case of test score invalidity. Accordingto the most recent Standards for Educational and Psycho-logical Testing (1999), bias in testing refers to “constructunder-representation or construct-irrelevant componentsof test scores that differentially affect the performanceof different groups of test takers” (p. 172). This defini-tion implies that bias stems from nonrandom measurementerror, provided that the typical magnitude of random erroris comparable for all groups of interest. Accordingly, testscore bias refers to the systematic and invalid introductionof measurement error for a particular group of interest.The statistical underpinnings of this definition have been
72 Assessment Issues
underscored by Jensen (1980), who asserted, “The assess-ment of bias is a purely objective, empirical, statisticaland quantitative matter entirely independent of subjectivevalue judgments and ethical issues concerning fairness orunfairness of tests and the uses to which they are put”(p. 375). Some scholars consider the characterization ofbias as objective and independent of the value judgmentsassociated with fair use of tests to be fundamentally incor-rect (e.g., Willingham, 1999).
Test score fairness refers to the ways in which testscores are utilized, most often for various forms of conse-quential decision making, such as selection or placement.Jensen (1980) suggested that the term refers “to the waysin which test scores (whether of biased or unbiased tests)are used in any selection situation” (p. 376), arguing thatfairness is a subjective policy decision based on philo-sophic, legal, or practical considerations rather than astatistical decision. Willingham (1999) described a testfairness manifold that extends throughout the entire pro-cess of test development including the consequences oftest usage. Embracing the idea that fairness is akin todemonstrating the generalizability of test validity acrosspopulation subgroups, Willingham noted that “the man-ifold of fairness issues is complex because validity iscomplex” (p. 223). Fairness is a concept that transcendsa narrow statistical and psychometric approach.
Finally, equity refers to a social value associated withthe intended and unintended consequences and impactof test score usage. Because of the importance of equalopportunity, equal protection, and equal treatment in men-tal health, education, and the workplace, Willingham(1999) recommended that psychometrics actively considerequity issues in test development. As Tiedeman (1978)noted, “Test equity seems to be emerging as a criterionfor test use on a par with the concepts of reliability andvalidity” (p. xxviii). However, the expectation that testscan correct long-standing problems of equity in societyhas never been grounded in psychometric science.
Internal Evidence of Fairness
The demonstration that a test has equal internal integrityacross racial and ethnic groups has been described as away to demonstrate test fairness (e.g., Mercer, 1984). Theinternal features of a test related to fairness generallyinclude the test’s theoretical underpinnings, item contentand format, differential item and test functioning, reliabil-ity generalization, and measurement invariance. The twobest-known procedures for evaluating test fairness includeexpert reviews of content bias and analysis of differential
item functioning. This section discusses these and severaladditional sources of evidence of test fairness.
Item Bias and Sensitivity Review
In efforts to enhance fairness, the content and format ofpsychological and educational tests commonly undergosubjective bias and sensitivity reviews one or more timesduring test development. In this review, independent rep-resentatives from diverse groups closely examine tests,identifying items and procedures that may yield differen-tial responses for one group relative to another. Contentmay be reviewed for cultural, disability, ethnic, racial, reli-gious, sex, and SES bias. For example, a reviewer maybe asked a series of questions, including “Does the con-tent, format, or structure of the test item present greaterproblems for students from some backgrounds than forothers?” A comprehensive item bias review is availablefrom Hambleton and Rodgers (1995), and useful guide-lines to reduce bias in language are available from theAmerican Psychological Association (1994).
Ideally there are two objectives in bias and sensitivityreviews: (1) eliminate biased material and (2) ensurebalanced and neutral representation of groups within thetest. Among the potentially biased elements of tests thatshould be avoided is
• material that is controversial, or emotionally charged,or inflammatory for any specific group;
• language, artwork, or material that is demeaning oroffensive to any specific group;
• content or situations with differential familiarity andrelevance for specific groups;
• language and instructions that have different or unfa-miliar meanings for specific groups;
• information and/or skills that may not be expected tobe within the educational background of all examinees;and
• format or structure of the item that presents differentialdifficulty for specific groups.
Among the prosocial elements that ideally should beincluded in tests are
• presentation of universal experiences in test material;• balanced distribution of people from diverse groups;• presentation of people in activities that do not reinforce
stereotypes;• item presentation in a sex-, culture-, age-, and race-
neutral manner; and• inclusion of individuals with disabilities or handicap-
ping conditions.
Fundamental Psychometric Considerations in Assessment 73
In general, the content of test materials should be rele-vant and accessible for the entire population of examineesfor whom the test is intended. For example, the experi-ences of snow and freezing winters are outside the rangeof knowledge of many Southern students, thereby intro-ducing a potential geographic regional bias. Use of uten-sils such as forks may be unfamiliar to Asian immigrantswho may instead use chopsticks. Use of coinage from theUnited States ensures that the test cannot be validly usedwith examinees from countries with different currency.
Tests should also be free of controversial, emotionallycharged, or value-laden content, such as violence or reli-gion. The presence of such material may prove distracting,offensive, or unsettling to examinees from some groups,detracting from test performance. For example, Licht-enberger and Kaufman (2009) documented the removalof emotionally evocative and clinically rich items fromthe Wechsler intelligence scales—for example, beer-wine from the Similarities subtest and knife and gamblefrom the Vocabulary subtest—because these items elicitedresponses that sometimes tapped psychological constructsirrelevant to intelligence per se.
Stereotyping refers to the portrayal of a group usingonly a limited number of attributes, characteristics, orroles. As a rule, stereotyping should be avoided in testdevelopment. Specific groups should be portrayed accu-rately and fairly, without reference to stereotypes ortraditional roles regarding sex, race, ethnicity, religion,physical ability, or geographic setting. Group membersshould be portrayed as exhibiting a full range of activities,behaviors, and roles.
Differential Item and Test Functioning
Are item and test statistical properties equivalent for indi-viduals of comparable ability, but from different groups?Differential test and item functioning (DTIF, or DTF andDIF) refers to a family of statistical procedures aimed atdetermining whether examinees of the same ability butfrom different groups have different probabilities of suc-cess on a test or an item. The most widely used of DIFprocedures is the Mantel-Haenszel technique (Holland &Thayer, 1988), which assesses similarities in item func-tioning across various demographic groups of comparableability. Items showing significant DIF are usually consid-ered for deletion from a test.
DIF has been extended by Shealy and Stout (1993) toa test score–based level of analysis known as differentialtest functioning, a multidimensional nonparametric IRTindex of test bias. Whereas DIF is expressed at the itemlevel, DTF represents a combination of two or more items
to produce DTF, with scores on a valid subtest used tomatch examinees according to ability level. Tests mayshow evidence of DIF on some items without evidenceof DTF, provided item bias statistics are offsetting andeliminate differential bias at the test score level.
Although psychometricians have embraced DIF as apreferred method for detecting potential item bias (McAl-lister, 1993), this methodology has been subjected toincreasing criticism because of its dependence on inter-nal test properties and its inherent circular reasoning. Hills(1999) noted that two decades of DIF research have failedto demonstrate that removing biased items affects test biasand narrows the gap in group mean scores. Furthermore,DIF rests on several assumptions including that items areunidimensional, that the latent trait is equivalently dis-tributed across groups, that the groups being compared(usually racial, sex, or ethnic groups) are homogeneous,and that the overall test is unbiased. Camilli and Shep-ard (1994) observed: “By definition, internal DIF methodsare incapable of detecting constant bias. Their aim, andcapability, is only to detect relative discrepancies” (p. 17).Hunter and Schmidt (2000) have criticized DIF methodol-ogy, finding that most evidence of DIF may be explainedby a failure to control for measurement error in ability esti-mates, violations of the DIF unidimensionality assump-tion, and/or reliance on spurious artifactual findings fromstatistical significance testing. Disparaging DIF method-ology, they wrote, “[W]e know that the literature on itembias is unsound from a technical standpoint” (p. 157).
Measurement Invariance
Measurement invariance in psychological measurementis concerned with systematic group consistency in theinformation provided by a test about the latent variableor variables to be measured. Although there are multiplepotential ways to demonstrate measurement invariance,the demonstration of factorial invariance across racialand ethnic groups via confirmatory factor analyses is oneway to provide evidence that a test’s internal structure isinvariant. Millsap (1997) observed, “When measurementbias is present, two individuals from different groups whoare identical on the latent variable(s) of interest would beexpected to score differently on the test” (p. 249).
A difference in the factor structure across groups pro-vides some evidence for bias even though factorial invari-ance does not necessarily signify fairness (e.g., Meredith,1993; Nunnally & Bernstein, 1994). Floyd and Widaman(1995) suggested that “[i]ncreasing recognition of cul-tural, developmental, and contextual influences on psy-chological constructs has raised interest in demonstrating
74 Assessment Issues
measurement invariance before assuming that measuresare equivalent across groups” (p. 296).
Reliability Generalization
Earlier we described the methodology of reliability gener-alization as a meta-analytic methodology that can inves-tigate test score reliability across samples (Vacha-Haase,1998). Reliability generalization also has the capacity toprovide evidence of test score fairness by demonstratingrelatively little change in score reliabilities across racial,ethnic, linguistic, and gender subsamples. Demonstrationof adequate measurement precision across groups suggeststhat a test has adequate accuracy for the populations inwhich it may be used. Geisinger (1998) noted that
subgroup-specific reliability analysis may be especiallyappropriate when the reliability of a test has been justifiedon the basis of internal consistency reliability procedures(e.g., coefficient alpha). Such analysis should be repeatedin the group of special test takers because the meaningand difficulty of some components of the test may changeover groups, especially over some cultural, linguistic, anddisability groups. (p. 25)
Differences in group reliabilities may be evident, however,when test items are substantially more difficult for onegroup than another or when ceiling or floor effects arepresent for only one group.
The temporal stability of test scores should also becompared across groups, using similar test-retest intervals,in order to ensure that test results are equally stable irre-spective of race and ethnicity. Jensen (1980) suggested:
If a test is unbiased, test-retest correlation, of course withthe same interval between testings for the major and minorgroups, should yield the same correlation for both groups.Significantly different test-retest correlations (taking properaccount of possibly unequal variances in the two groups) areindicative of a biased test. Failure to understand instructions,guessing, carelessness, marking answers haphazardly, and thelike, all tend to lower the test-retest correlation. If two groupsdiffer in test-retest correlation, it is clear that the test scoresare not equally accurate or stable measures of both groups.(p. 430)
External Evidence of Fairness
Beyond the concept of internal integrity, Mercer (1984)recommended that studies of test fairness include evi-dence of equal external relevance. In brief, this deter-mination requires the examination of relations betweenitem/test scores and independent external criteria. External
evidence of test score fairness has been accumulated inthe study of comparative prediction of future performance(e.g., use of the SAT across racial groups to predict a stu-dent’s ability to do college-level work). Fair predictionand fair selection are two objectives that are particularlyimportant as evidence of test fairness, in part because theyfigure prominently in legislation and court rulings.
Fair Prediction
Prediction bias can arise when a test differentially predictsfuture behaviors or performance across groups. Cleary(1968) introduced a methodology that evaluates com-parative predictive validity between two or more salientgroups. The Cleary rule states that a test may be con-sidered fair if it has the same approximate regressionequation (i.e., comparable slope and intercept) explainingthe relationship between the predictor test and an externalcriterion measure in the groups undergoing comparison. Aslope difference between the two groups conveys differ-ential validity and relates that one group’s performanceon the external criterion is predicted less well than theother’s performance. An intercept difference suggests adifference in the level of estimated performance betweenthe groups, even if the predictive validity is compara-ble. It is important to note that this methodology assumesadequate levels of reliability for both the predictor andcriterion variables. This procedure has several limita-tions that have been summarized by Camilli and Shepard(1994). The demonstration of equivalent predictive valid-ity across demographic groups constitutes an importantsource of fairness that is related to validity generalization.Millsap (1997) demonstrated, however, that measurementinvariance may be logically and statistically incompatiblewith invariant prediction, challenging the value of conven-tional approaches to prediction bias. Hunter and Schmidt(2000) went further in their appraisal of the fair predictionliterature:
For the past 30 years, civil rights lawyers, journalists, andothers . . . have argued that when test scores are equal, minori-ties have higher average levels of educational and workperformance, meaning that test scores underestimate thereal world performance of minorities. Thousands of testbias studies have been conducted, and these studies havedisconfirmed that hypothesis. The National Academy ofScience . . . concluded that professionally developed tests arenot predictively biased. (p. 151)
Based on these observations pertaining to predictive bias,Hunter and Schmidt concluded that “the issue of test biasis scientifically dead” (p. 151).
Fundamental Psychometric Considerations in Assessment 75
Fair Selection
The consequences of test score use for selection anddecision making in clinical, educational, and occupa-tional domains constitute a source of potential bias. Theissue of fair selection addresses the question: Do the useof test scores for selection decisions unfairly favor onegroup over another? Specifically, test scores that produceadverse, disparate, or disproportionate impact for variousracial or ethnic groups may be said to show evidence ofselection bias, even when that impact is construct rele-vant. Since enactment of the Civil Rights Act of 1964,demonstration of adverse impact has been treated in legalsettings as prima facie evidence of test bias. Adverseimpact occurs when there is a substantially different rateof selection based on test scores and other factors worksto the disadvantage of members of a race, sex, or ethnicgroup.
Federal mandates and court rulings often have indi-cated that adverse, disparate, or disproportionate impactin selection decisions based on test scores constitutesevidence of unlawful discrimination, and differential testselection rates among majority and minority groups havebeen considered a bottom line in federal mandates andcourt rulings. In its Uniform Guidelines on Employ-ment Selection Procedures (1978), the Equal EmploymentOpportunity Commission operationalized adverse impactaccording to the four-fifths rule, which states: “A selec-tion rate for any race, sex, or ethnic group which is lessthan four-fifths (4/5) (or eighty percent) of the rate for thegroup with the highest rate will generally be regarded bythe Federal enforcement agencies as evidence of adverseimpact” (p. 126). Adverse impact has been applied toeducational tests (e.g., the Texas Assessment of AcademicSkills) as well as tests used in personnel selection. TheU.S. Supreme Court held in 1988 that differential selec-tion ratios can constitute sufficient evidence of adverseimpact. The 1991 Civil Rights Act, Section 9, specifi-cally and explicitly prohibits any discriminatory use oftest scores for minority groups.
Since selection decisions involve the use of test cut-off scores, an analysis of costs and benefits according todecision theory provides a methodology for fully under-standing the consequences of test score usage. Cutoffscores may be varied to provide optimal fairness acrossgroups, or alternative cutoff scores may be utilized in cer-tain circumstances. McArdle (1998) observed, “As thecutoff scores become increasingly stringent, the numberof false negative mistakes (or costs) also increase, but thenumber of false positive mistakes (also a cost) decrease”(p. 174).
LIMITS OF PSYCHOMETRICS
Psychological assessment is ultimately about the exami-nee. A test is merely a tool to understand the examinee,and psychometrics are merely rules to build and evaluatethe tools. The tools themselves must be sufficiently sound(i.e., valid, reliable) and fair so that they introduce accept-able levels of error into the process of decision making.Some of the guidelines that have been described in thischapter for psychometrics of test construction and appli-cation help us not only to build better tools but to usethese tools as skilled craftspersons.
As an evolving field of study, psychometrics still hassome glaring shortcomings. A long-standing limitation ofpsychometrics is its systematic overreliance on internalsources of evidence for test validity and fairness. In brief,it is more expensive and more difficult to collect externalcriterion-based information, especially with special popu-lations; it is simpler and easier to base all analyses on theperformance of a normative standardization sample. Thisdependency on internal methods has been recognized andacknowledged by leading psychometricians. In discussingpsychometric methods for detecting test bias, for example,Camilli and Shepard (1994) cautioned about circular rea-soning: “Because DIF indices rely only on internal crite-ria, they are inherently circular” (p. 17). Similarly, psy-chometricians have been hesitant to consider attempts toextend the domain of validity into consequential aspects oftest usage (e.g., Borsboom 2006a; Lees-Haley, 1996). Wehave witnessed entire testing approaches based on inter-nal factor-analytic approaches and evaluation of contentvalidity (e.g., McGrew & Flanagan, 1998), with compar-atively little attention paid to the external validation ofthe factors against independent, ecologically valid crite-ria. This shortcoming constitutes a serious limitation ofpsychometrics, which we have attempted to address byencouraging use of both internal and external sources ofpsychometric evidence.
Another long-standing limitation is the tendency of testdevelopers to wait until the test is undergoing standard-ization to establish its validity through clinical studies. Atypical sequence of test development involves pilot stud-ies, a content tryout, and finally a national standardizationand supplementary studies (e.g., Robertson, 1992). In thestages of test development described by Loevinger (1957),the external criterion-based validation stage comes last inthe process—after the test has effectively been built. Alimitation in test development and psychometric practiceis that many tests validate their effectiveness for a statedpurpose only at the end of the process rather than at the
76 Assessment Issues
beginning, as MMPI developers did over a half centuryago by selecting items that discriminated between spe-cific diagnostic groups (Hathaway & McKinley, 1943).The utility of a test for its intended application shouldbe at least partially validated at the pilot study stage,prior to norming. Even better is an evidence-based valid-ity argument, such as proposed by Mislevy and Haertel(2006), to explicitly link test construction with its intendedapplication.
Finally, psychometrics has failed to directly addressmany of the applied questions of practitioners. Test resultsoften do not readily lend themselves to functional deci-sion making. For example, psychometricians have beenslow to develop consensually accepted ways of measur-ing growth and maturation, reliable change (as a resultof enrichment, intervention, or treatment), and atypicalresponse patterns suggestive of lack of effort or dissimi-lation. There is a strong need for more innovations like theBayesian nomogram, which readily lends itself to straight-forward clinical application (e.g., Bianchi, Alexander, &Cash, 2009; Jenkins et al., 2011). In general, the failureof treatment validity and assessment–treatment linkageundermines the central purpose of testing.
Looking to the future, the emergence of evidence-basedassessment (EBA) guidelines now appears inevitable, par-alleling the numerous evidence-based treatment, instruc-tion, and intervention effectiveness studies that have ledto professional practice guidelines. While EBA has takenmany different forms in the literature, Hunsley and Mash(2005) have anticipated that it will include standard psy-chometric indices of reliability and validity and alsoencompass treatment utility, diagnostic utility, and a rangeof additional factors, such as the economic and psycholog-ical costs associated with assessment error. Any forthcom-ing rules for EBA are likely to increase the accountabilityof test users (who will increasingly be required to useempirically supported measurements) and test developers(who will need to carefully determine the new mix ofpsychometric studies necessary to successfully meet pro-fessional needs). The powerful impact of a single psycho-metrically oriented review—Lilienfeld, Wood, and Garb’s(2000) critical assessment of projective tests—may pro-vide a hint of the magnitude of changes that may comewith EBA.
REFERENCES
Achenbach, T. M., & Rescorla, L. A. (2001). Manual for the ASEBAschool-age forms and profiles. Burlington: University of Vermont,Research Center for Children, Youth, & Families.
American Psychological Association. (1994). Publication manual ofthe American Psychological Association (4th ed.). Washington, DC:Author.
American Psychological Association. (2002). Ethical principles ofpsychologists and code of conduct. American Psychologist, 57,1060–1073.
Anastasi, A., & Urbina, S. (1997). Psychological testing (7th ed.). UpperSaddle River, NJ: Prentice-Hall.
Andrich, D. (1988). Rasch models for measurement. Thousand Oaks,CA: Sage.
Angoff, W. H. (1984). Scales, norms, and equivalent scores. Princeton,NJ: Educational Testing Service.
Banaji, M. R., & Crowder, R. C. (1989). The bankruptcy of everydaymemory. American Psychologist, 44, 1185–1193.
Barrios, B. A. (1988). On the changing nature of behavioral assessment.In A. S. Bellack & M. Hersen (Eds.), Behavioral assessment: Apractical handbook (3rd ed., pp. 3–41). New York, NY: PergamonPress.
Bayley, N. (1993). Bayley Scales of Infant Development, Second editionmanual. San Antonio, TX: Psychological Corporation.
Ben-Porath, Y. S., & Tellegen, A. (2008). MMPI-2-RF: Manual foradministration, scoring, and interpretation. Minneapolis: Universityof Minnesota Press.
Beutler, L. E. (1998). Identifying empirically supported treatments: Whatif we didn’t? Journal of Consulting & Clinical Psychology, 66,113–120.
Beutler, L. E., & Clarkin, J. F. (1990). Systematic treatment selec-tion: Toward targeted therapeutic interventions. Philadelphia, PA:Brunner/Mazel.
Beutler, L. E., & Harwood, T. M. (2000). Prescriptive psychotherapy:A practical guide to systematic treatment selection. New York, NY:Oxford University Press.
Bianchi, M. T., Alexander, B. M., & Cash, S. S. (2009). Incorporatinguncertainty into medical decision making: An approach to unex-pected test results. Medical Decision Making, 29, 116–124.
Binet, A., & Simon, T. (1911/1916). New investigation upon the mea-sure of the intellectual level among school children. L’Annee Psy-chologique, 17, 145–201. In E. S. Kite (Trans.), The developmentof intelligence in children (pp. 274–329). Baltimore, MD: Williams& Wilkins. (Original work published 1911)
Borsboom, D. (2006a). The attack of the psychometricians. Psychome-trika, 71, 425–440.
Borsboom, D. (2006b). Can we bring out a velvet revolution in psycho-logical measurement? A rejoinder to commentaries. Psychometrika,71, 463–467.
Borsboom, D., Cramer, A. O. J., Kievit, R. A., Scholten, A. Z., & Franic,S. (2009). The end of construct validity. In R. W. Lissitz (Ed.),The concept of validity: Revisions, new directions, and applications(pp. 135–170). Charlotte, NC: Information Age.
Borsboom, D., Mellenbergh, G. J., & Van Heerden, J. (2004). Theconcept of validity. Psychological Review, 111, 1061–1071.
Bracken, B. A. (1987). Limitations of preschool instruments and stan-dards for minimal levels of technical adequacy. Journal of Psychoe-ducational Assessment, 4, 313–326.
Bracken, B. A. (1988). Ten psychometric reasons why similar tests pro-duce dissimilar results. Journal of School Psychology, 26, 155–166.
Bracken, B. A., & McCallum, R. S. (1998). Universal NonverbalIntelligence Test examiner’s manual. Itasca, IL: Riverside.
Brennan, R. L. (2010a). Evidence-centered assessment design and theAdvanced Placement Program: A psychometrician’s perspective.Applied Measurement in Education, 23, 392–400.
Brennan, R. L. (2010b). Generalizability theory. New York, NY:Springer-Verlag.
Brown, W. (1910). Some experimental results in the correlation ofmental abilities. British Journal of Psychology, 3, 296–322.
Fundamental Psychometric Considerations in Assessment 77
Bruininks, R. H., Woodcock, R. W., Weatherman, R. F., & Hill, B. K.(1996). Scales of Independent Behavior —Revised comprehensivemanual. Itasca, IL: Riverside.
Camilli, G., & Shepard, L. A. (1994). Methods for identifying biased testitems (Vol. 4). Thousand Oaks, CA: Sage.
Campbell, D. T., & Fiske, D. W. (1959). Convergent and discriminantvalidation by the multitrait-multimethod matrix. Psychological Bul-letin, 56, 81–105.
Campbell, D. T., & Stanley, J. C. (1963). Experimental and quasi-experimental designs for research. Chicago, IL: Rand McNally.
Campbell, S. K., Siegel, E., Parr, C. A., & Ramey, C. T. (1986). Evidencefor the need to renorm the Bayley Scales of Infant Developmentbased on the performance of a population-based sample of 12-month-old infants. Topics in Early Childhood Special Education, 6, 83–96.
Carroll, J. B. (1983). Studying individual differences in cognitive abil-ities: Through and beyond factor analysis. In R. F. Dillon &R. R. Schmeck (Eds.), Individual differences in cognition (pp. 1–33).New York, NY: Academic Press.
Cattell, R. B. (1986). The psychometric properties of tests: Consis-tency, validity, and efficiency. In R. B. Cattell & R. C. Johnson(Eds.), Functional psychological testing: Principles and instruments(pp. 54–78). New York, NY: Brunner/Mazel.
Chudowsky, N., & Behuniak, P. (1998). Using focus groups to exam-ine the consequential aspect of validity. Educational Measurement:Issues & Practice, 17, 28–38.
Cizek, G. J., Bowen, D., & Church, K. (2010). Sources of validityevidence for educational and psychological tests: A follow-up study.Educational and Psychological Measurement, 70, 732–743.
Clark, L. A., & Watson, D. (1995). Constructing validity: Basic issues inobjective scale development. Psychological Assessment, 7, 309–319.
Cleary, T. A. (1968). Test bias: Prediction of grades for Negro and Whitestudents in integrated colleges. Journal of Educational Measurement,5, 115–124.
Cohen, J. (1992). A power primer. Psychological Bulletin, 112,155–159.
Cone, J. D. (1978). The behavioral assessment grid (BAG): A conceptualframework and a taxonomy. Behavior Therapy, 9, 882–888.
Cone, J. D. (1988). Psychometric considerations and the multiple modelsof behavioral assessment. In A. S. Bellack & M. Hersen (Eds.),Behavioral assessment: A practical handbook (3rd ed., pp. 42–66).New York, NY: Pergamon Press.
Cook, T. D., & Campbell, D. T. (1979). Quasi-experimentation: Designand analysis issues for field settings. Chicago, IL: Rand McNally.
Cortina, J. M. (1993). What is coefficient alpha? An examinationof theory and applications. Journal of Applied Psychology, 78,98–104.
Costa, P. T. Jr., & McCrae, R. R. (2010). NEO Inventories ProfessionalManual for NEO-PI-3, NEO FFI-3 & NEO PIR. Lutz, FL: Psycho-logical Assessment Resources.
Crocker, L. (2003). Teaching for the test: Validity, fairness, and moralaction. Educational Measurement: Issues and Practice, 22, 5–11.
Crocker, L., & Algina, J. (1986). Introduction to classical and moderntest theory. New York, NY: Holt, Rinehart.
Cronbach, L. J. (1957). The two disciplines of scientific psychology.American Psychologist, 12, 671–684.
Cronbach, L. J. (1971). Test validation. In R. L. Thorndike (Ed.),Educational measurement (2nd ed., pp. 443–507). Washington, DC:American Council on Education.
Cronbach, L. J., & Gleser, G. C. (1965). Psychological tests andpersonnel decisions. Urbana, IL: University of Illinois Press.
Cronbach, L. J., Gleser, G. C., Nanda, H., & Rajaratnam, N. (1972). Thedependability of behavioral measurements: Theory of generalizabilityscores and profiles. New York, NY: Wiley.
Cronbach, L. J., & Meehl, P. E. (1955). Construct validity in psycho-logical tests. Psychological Bulletin, 52, 281–302.
Daniel, M. H. (1999). Behind the scenes: Using new measurementmethods on the DAS and KAIT. In S. E. Embretson & S. L.Hershberger (Eds.), The new rules of measurement: What everypsychologist and educator should know (pp. 37–63). Mahwah, NJ:Erlbaum.
Daniel, M. H. (2007). Test norming. Retrieved from www.pearsonassessments.com/pai/ca/RelatedInfo/TestNorming.htm
Dimitrov, D. M. (2002). Reliability: Arguments for multiple perspectivesand potential problems with generalization across studies. Educa-tional and Psychological Measurement, 62, 783–801.
Efron, B., & Tibshirani, R. J. (1993). An introduction to the bootstrap.New York, NY: Chapman & Hall/CRC.
Elliott, C. D. (1990). Differential Ability Scales: Introductory and tech-nical handbook. San Antonio, TX: Psychological Corporation.
Embretson, S. E. (1995). The new rules of measurement. PsychologicalAssessment, 8, 341–349.
Embretson, S. E. (1999). Issues in the measurement of cognitive abilities.In S. E. Embretson & S. L. Hershberger (Eds.), The new rules ofmeasurement: What every psychologist and educator should know(pp. 1–15). Mahwah, NJ: Erlbaum.
Embretson, S. E. (2004). The second century of ability testing: Somepredictions and speculations. Measurement, 2, 1–32.
Embretson, S. E., & Hershberger, S. L. (Eds.). (1999). The new rulesof measurement: What every psychologist and educator should know.Mahwah, NJ: Erlbaum.
Ercikan, K., Arim, R., Law, D., Domene, J., Gagnon, F., & Lacroix,S. (2011). Application of Think Aloud Protocols for examiningand confirming sources of differential item functioning identifiedby expert reviews. Educational Measurement: Issues and Practice,29 (2), 24–35.
Erdodi, L. A., Richard, D. C. S., & Hopwood, C. (2009). The importanceof relying on the manual: Scoring error variance in the WISC-IVVocabulary subtest. Journal of Psychoeducational Assessment, 27,374–385.
Ericsson, K. A., & Simon, H. A. (1980). Verbal reports as data.Psychological Review, 87, 215–251.
Fan, X. (1998). Item response theory and classical test theory: Anempirical comparison of their item/person statistics. Educational andPsychological Measurement, 58, 357–381.
Fan, X., & Thompson, B. (2001). Confidence intervals about scorereliability coefficients, please: An EPM guidelines editorial. Editorialand Psychological Measurement, 61, 517–531.
Fiske, D. W., & Campbell, D. T. (1992). Citations do not solve problems.Psychological Bulletin, 112, 393–395.
Fleiss, J. L. (1981). Balanced incomplete block designs for inter-rater reliability studies. Applied Psychological Measurement, 5,105–112.
Floyd, F. J., & Widaman, K. F. (1995). Factor analysis in the develop-ment and refinement of clinical assessment instruments. Psycholog-ical Assessment, 7, 286–299.
Flynn, J. R. (1984). The mean IQ of Americans: Massive gains 1932 to1978. Psychological Bulletin, 95, 29–51.
Flynn, J. R. (1987). Massive IQ gains in 14 nations: What IQ tests reallymeasure. Psychological Bulletin, 101, 171–191.
Flynn, J. R. (1994). IQ gains over time. In R. J. Sternberg (Ed.), Theencyclopedia of human intelligence (pp. 617–623). New York, NY:Macmillan.
Flynn, J. R. (1999). Searching for justice: The discovery of IQ gainsover time. American Psychologist, 54, 5–20.
Fox, M. C., Ericsson, K. A., & Best, R. (2011). Do procedures forverbal reporting of thinking have to be reactive? A meta-analysis andrecommendations for best reporting methods. Psychological Bulletin,137, 316–344.
Foy, P., & Joncas, M. (2004). TIMSS 2003 sampling design. In M.O. Martin, I. V. S. Mullis, & S. J. Chrostowski (Eds.), Trends in
78 Assessment Issues
International Mathematics and Science Study (TIMSS) 2003 tech-nical report (pp. 109–122). Chestnut Hill, MA: TIMSS & PIRLSInternational Study Center, Boston College.
Frisby, C. L., & Kim, S. (2008). Using profile analysis via multidimen-sional scaling (PAMS) to identify core profiles from the WMS-III.Psychological Assessment, 20, 1–9.
Galton, F. (1879). Psychometric experiments. Brain: A Journal of Neu-rology, 2, 149–162.
Geisinger, K. F. (1998). Psychometric issues in test interpretation. InJ. Sandoval, C. L. Frisby, K. F. Geisinger, J. D. Scheuneman, & J. R.Grenier (Eds.) Test interpretation and diversity: Achieving equity inassessment (pp. 17–30). Washington, DC: American PsychologicalAssociation.
Gignac, G. E., Bates, T. C., & Jang, K. (2007). Implications relevantto CFA model misfit, reliability, and the five-factor model as mea-sured by the NEO FFI. Personality and Individual Differences, 43,1051–1062.
Gorsuch, R. L. (1983a). Factor analysis (2nd ed.). Hillsdale, NJ:Erlbaum.
Gorsuch, R. L. (1983b). The theory of continuous norming. In R.L. Gorsuch (Chair), Continuous norming: An alternative to tablednorms? Symposium conducted at the 91st Annual Convention of theAmerican Psychological Association, Anaheim, CA.
Gorsuch, R. L. (2010). Continuous parameter estimation model: Expand-ing our statistical paradigm. In G. H. Roid (Chair), Continuousparameter estimation and continuous norming methods. Symposiumconducted at the 118th annual convention of the American Psycho-logical Association, San Diego, CA.
Gorsuch, R. L., & Zachary, R. A. (1985). Continuous norming: Impli-cation for the WAIS-R. Journal of Clinical Psychology, 41, 86–94.
Guilford, J. P. (1950). Fundamental statistics in psychology and educa-tion (2nd ed.). New York, NY: McGraw-Hill.
Guion, R. M. (1977). Content validity—The source of my discontent.Applied Psychological Measurement, 1, 1–10.
Gulliksen, H. (1950). Theory of mental tests. New York, NY: McGraw-Hill.
Hambleton, R., & Rodgers, J. H. (1995). Item bias review. (ERICClearinghouse on Assessment and Evaluation, EDO-TM-95–9).Washington, DC: Catholic University of America Department ofEducation.
Hambleton, R. K., Swaminathan, H., & Rogers, H. J. (1991). Funda-mentals of item response theory. Newbury Park, CA: Sage.
Hathaway, S. R. & McKinley, J. C. (1943). Manual for the MinnesotaMultiphasic Personality Inventory. New York, NY: PsychologicalCorporation.
Hayes, S. C., Nelson, R. O., & Jarrett, R. B. (1987). The treatmentutility of assessment: A functional approach to evaluating assessmentquality. American Psychologist, 42, 963–974.
Haynes, S. N., Richard, D. C. S., & Kubany, E. S. (1995). Content valid-ity in psychological assessment: A functional approach to conceptsand methods. Psychological Assessment, 7, 238–247.
Heinrichs, R. W. (1990). Current and emergent applications of neuropsy-chological assessment problems of validity and utility. ProfessionalPsychology: Research and Practice, 21, 171–176.
Helmes, E., & Reddon, J. R. (1993). A perspective on developmentsin assessing psychopathology: A critical review of the MMPI andMMPI-2. Psychological Bulletin, 113, 453–471.
Herrnstein, R. J., & Murray, C. (1994). The bell curve: Intelligence andclass in American life. New York, NY: Free Press.
Hertzog, M. A. (2008). Considerations in determining sample size forpilot studies. Research in Nursing & Health, 31, 180–191.
Hills, J. (1999, May 14). Re: Construct validity. Educational Statis-tics Discussion List (EDSTAT-L). Available e-mail: [email protected]
Hoelzle, J. B., & Meyer, G. J. (2008). The factor structure of theMMPI–2 Restructured Clinical (RC) scales. Journal of PersonalityAssessment, 90, 443–455.
Hogan, T. P., Benjamin, A., & Brezinski, K. L. (2000). Reliability meth-ods: A note on the frequency of use of various types. Educationaland Psychological Measurement, 60, 523–531.
Holland, P. W., & Thayer, D. T. (1988). Differential item functioningand the Mantel-Haenszel procedure. In H. Wainer & H. I. Braun(Eds.), Test validity (pp. 129–145). Hillsdale, NJ: Erlbaum.
Horn, J. L., Wanberg, K. W., & Appel, M. (1973). On the internal struc-ture of the MMPI. Multivariate Behavioral Research, 8, 131–171.
Hopkins, C. D., & Antes, R. L. (1978). Classroom measurement andevaluation. Itasca, IL: F. E. Peacock.
Hopwood, C., & Richard, D. C. S. (2005). WAIS-III scoring accuracy isa function of scale IC and complexity of examiner tasks. Assessment,12, 445–454.
Hunsley, J., & Mash, E. J. (2005). Introduction to the special section ondeveloping guidelines for the evidence-based assessment (EBA) ofadult disorders. Psychological Assessment, 17, 251–255.
Hunter, J. E., & Schmidt, F. L. (1990). Methods of meta-analysis:Correcting error and bias in research findings. Newbury Park, CA:Sage.
Hunter, J. E., & Schmidt, F. L. (2000). Racial and gender bias in abilityand achievement tests: Resolving the apparent paradox. Psychology,Public Policy & Law, 6, 151–158.
Hunter, J. E., Schmidt, F. L., & Jackson, C. B. (1982). Advancedmeta-analysis: Quantitative methods of cumulating research findingsacross studies. San Francisco, CA: Sage.
Ittenbach, R. F., Esters, I. G., & Wainer, H. (1997). The history of testdevelopment. In D. P. Flanagan, J. L. Genshaft, & P. L. Harrison(Eds.), Contemporary intellectual assessment: Theories, tests, andissues (pp. 17–31). New York, NY: Guilford Press.
Jackson, D. N. (1971). A sequential system for personality scale devel-opment. In C. D. Spielberger (Ed.), Current topics in clinical andcommunity psychology (Vol. 2, pp. 61–92). New York, NY: Aca-demic Press.
Jencks, C., & Phillips, M. (Eds.). (1998). The Black-White test scoregap. Washington, DC: Brookings Institute.
Jenkins, M. A., Youngstrom, E. A., Washburn, J. J., & Youngstrom, J.K. (2011). Evidence-based strategies improve assessment of pediatricbipolar disorder by community practitioners. Professional Psychol-ogy: Research and Practice, 42, 121–129.
Jensen, A. R. (1980). Bias in mental testing. New York, NY: Free Press.Johnson, N. L. (1949). Systems of frequency curves generated by
methods of translation. Biometrika, 36, 149–176.Julious, S. A. (2005). Sample size of 12 per group rule of thumb for a
pilot study. Pharmaceutical Statistics, 4, 287–291.Kalton, G. (1983). Introduction to survey sampling. Beverly Hills, CA:
Sage.Kelley, K., & Rausch, J. R. (2006). Sample size planning for the
standardized mean difference: Accuracy in parameter estimation vianarrow confidence intervals. Psychological Methods, 11, 363–385.
Kelley, T. L. (1927). Interpretation of educational measurements. NewYork, NY: Macmillan.
Knowles, E. S., & Condon, C. A. (2000). Does the rose still smell assweet? Item variability across test forms and revisions. PsychologicalAssessment, 12, 245–252.
Kolen, M. J., Zeng, L., & Hanson, B. A. (1996). Conditional standarderrors of measurement for scale scores using IRT. Journal of Edu-cational Measurement, 33, 129–140.
Kuhn, T. (1970). The structure of scientific revolutions (2nd ed.).Chicago, IL: University of Chicago Press.
Lazarus, A. A. (1973). Multimodal behavior therapy: Treating theBASIC ID. Journal of Nervous and Mental Disease, 156, 404–411.
Fundamental Psychometric Considerations in Assessment 79
Lees-Haley, P. R. (1996). Alice in validityland, or the dangerous con-sequences of consequential validity. American Psychologist, 51,981–983.
Lehtonen, R., & Pahkinen, E. (2004). Practical methods for design andanalysis of complex surveys (2nd ed.). Hoboken, NJ: Wiley.
Levy, P. S., & Lemeshow, S. (1999). Sampling of populations: Methodsand applications. New York, NY: Wiley.
Li, H., Rosenthal, R., & Rubin, D. B. (1996). Reliability of measure-ment in psychology: From Spearman-Brown to maximal reliability.Psychological Methods, 1, 98–107.
Lichtenberger, E. O., & Kaufman, A. S. (2009). Essentials of WAIS-IVassessment. Hoboken, NJ: Wiley.
Lilienfeld, S. O., Wood, J. M., & Garb, H. N. (2000). The scientificstatus of projective techniques. Psychological Science in the PublicInterest, 1, 27–66.
Linacre, J. M., & Wright, B. D. (1999). A user’s guide to Win-steps/Ministep: Rasch-model computer programs. Chicago, IL:MESA Press.
Linn, R. L. (1998). Partitioning responsibility for the evaluation of theconsequences of assessment programs. Educational Measurement:Issues & Practice, 17, 28–30.
Lissitz, R. W. (Ed.) (2009). The concept of validity: Revisions, newdirections, and applications. Charlotte, NC: Information Age.
Loevinger, J. (1957). Objective tests as instruments of psychologicaltheory [Monograph]. Psychological Reports, 3, 635–694.
Loevinger, J. (1972). Some limitations of objective personality tests. InJ. N. Butcher (Ed.), Objective personality assessment (pp. 45–58).New York, NY: Academic Press.
Lohman, D. F., & Lakin, J. (2009). Consistencies in sex differ-ences on the Cognitive Abilities Test across countries, grades, testforms, and cohorts. British Journal of Educational Psychology, 79,389–407.
Loken, E., & Rulison, K. L. (2010). Estimation of a four-parameteritem response theory model. British Journal of Mathematical andStatistical Psychology, 63, 509–525.
Lombard, M., Snyder-Duch, J., & Bracken, C. C. (2002). Content anal-ysis in mass communication: Assessment and reporting of intercoderreliability. Human Communication Research, 28, 587–604.
Lord, F. N., & Novick, M. (1968). Statistical theories of mental tests.New York, NY: Addison-Wesley.
Maruish, M. E. (Ed.) (1994). The use of psychological testing fortreatment planning and outcome assessment. Hillsdale, NJ: Erlbaum.
McAllister, P. H. (1993). Testing, DIF, and public policy. In P. W. Hol-land & H. Wainer (Eds.), Differential item functioning (pp. 389–396).Hillsdale, NJ: Erlbaum.
McArdle, J. J. (1998). Contemporary statistical models for examiningtest-bias. In J. J. McArdle & R. W. Woodcock (Eds.), Humancognitive abilities in theory and practice (pp. 157–195). Mahwah,NJ: Erlbaum.
McCrae, R. R., Zonderman, A. B., Costa, P. T., Bond, M. H., &Paunonen, S. V. (1996). Evaluating replicability of factors in therevised NEO personality inventory: Confirmatory factor analysisversus Procrustes rotation. Journal of Personality and Social Psy-chology, 70, 552–566.
McGrew, K. S., Dailey, D. E. H., & Schrank, F. A. (2007). Woodcock-Johnson III/Woodcock-Johnson III Normative Update score differ-ences: What the user can expect and why (Woodcock-Johnson IIIAssessment Service Bulletin No. 9). Rolling Meadows, IL: Riverside.
McGrew, K. S., & Flanagan, D. P. (1998). The intelligence test deskreference (ITDR): Gf-Gc cross-battery assessment. Boston, MA:Allyn & Bacon.
McGrew, K. S., & Woodcock, R. W. (2001). Woodcock-Johnson IIItechnical manual. Itasca, IL: Riverside.
Mercer, J. R. (1984). What is a racially and culturally nondiscrim-inatory test? A sociological and pluralistic perspective. In C. R.
Reynolds & R. T. Brown (Eds.), Perspectives on bias in mentaltesting (pp. 293–356). New York, NY: Plenum Press.
Meredith, W. (1993). Measurement invariance, factor analysis and fac-torial invariance. Psychometrika, 58, 525–543.
Messick, S. (1989a). Meaning and values in test validation: The scienceand ethics of assessment. Educational Researcher, 18, 5–11.
Messick, S. (1989b). Validity. In R. L. Linn (Ed.), Educational measure-ment (3rd ed., pp. 13–103). Washington, DC: American Council onEducation and National Council on Measurement in Education.
Messick, S. (1995a). Standards of validity and the validity of standardsin performance assessment. Educational Measurement: Issues &Practice, 14, 5–8.
Messick, S. (1995b). Validity of psychological assessment: Valida-tion of inferences from persons’ reponses and performances asscientific inquiry into score meaning. American Psychologist, 50,741–749.
Meyer, P. (2010). Reliability. New York, NY: Oxford University Press.Millon, T., Davis, R., & Millon, C. (1997). MCMI-III: Millon Clin-
ical Multiaxial Inventory-III manual (3rd ed.). Minneapolis, MN:National Computer Systems.
Millsap, R. E. (1997). Invariance in measurement and prediction: Theirrelationship in the single-factor case. Psychological Methods, 2,248–260.
Mislevy, R. J., & Haertel, G. (2006). Implications for evidence-centereddesign for educational assessment. Educational Measurement: Issuesand Practice, 25, 6–20.
Mooney, C. Z., & Duval, R. D. (1993). Bootstrapping: A nonparametricapproach to statistical inference. Newbury Park, CA: Sage.
Neisser, U. (1978). Memory: What are the important questions? In M. M.Gruneberg, P. E. Morris, & R. N. Sykes (Eds.), Practical aspects ofmemory (pp. 3–24). London, UK: Academic Press.
Neuendorf, K. A. (2002). The content analysis guidebook. ThousandOaks, CA: Sage.
Newborg, J., Stock, J. R., Wnek, L., Guidubaldi, J., & Svinicki, J. (1984).Battelle Developmental Inventory. Itasca, IL: Riverside.
No Child Left Behind Act of 2001. Pub. L. No. 107–110, 20 U.S.C. §6301 et seq. (2002).
Nunnally, J. C., & Bernstein, I. H. (1994). Psychometric theory (3rd ed.).New York, NY: McGraw-Hill.
Oakes, J. M., & Rossi, P. H. (2003). The measurement of SES in healthresearch: current practice and steps toward a new approach. SocialScience & Medicine, 56, 769–784.
Pearson, K. (1924). The life, letters and labours of Francis Galton(Vol. 2). Researches of middle life. London, UK: Cambridge Uni-versity Press.
Peckham, R. F. (1972). Opinion, Larry P. v. Riles . Federal Supplement343, 1306–1315.
Peckham, R. F. (1979). Opinion, Larry P. v. Riles . Federal Supplement495, 926–992.
Pomplun, M. (1997). State assessment and instructional change: Apath model analysis. Applied Measurement in Education, 10,217–234.
Rasch, G. (1960). Probabilistic models for some intelligence and attain-ment tests. Copenhagen, Denmark: Danish Institute for EducationalResearch.
Reckase, M. D. (1998). Consequential validity from the test devel-oper’s perspective. Educational Measurement: Issues & Practice, 17,13–16.
Reschly, D. J. (1997). Utility of individual ability measures and publicpolicy choices for the 21st century. School Psychology Review, 26,234–241.
Reschly, D. J., Myers, T. G., & Hartel, C. R. (2002). Mental retardation:Determining eligibility for Social Security Benefits. Washington, DC:National Academies Press.
80 Assessment Issues
Riese, S. P., Waller, N. G., & Comrey, A. L. (2000). Factor analysis andscale revision. Psychological Assessment, 12, 287–297.
Robertson, G. J. (1992). Psychological tests: Development, publication,and distribution. In M. Zeidner & R. Most (Eds.), Psychologicaltesting: An inside view (pp. 159–214). Palo Alto, CA: ConsultingPsychologists Press.
Roid, G. (2003). Stanford-Binet Intelligence Scales (5th ed.). Interpretivemanual: Expanded guide to the interpretation of SB5 test results .Itasca, IL: Riverside.
Roid, G. H. (2010). Update and new evidence for continuous norming.In G. H. Roid (Chair), Continuous parameter estimation and contin-uous norming methods. Symposium conducted at the 118th annualconvention of the American Psychological Association, San Diego,CA.
Rust, K. F., & Johnson, E. G. (1992). Sampling and weighting inthe National Assessment. Journal of Educational Statistics, 17,111–129.
Salvia, J., Ysseldyke, J., & Bolt, S. (2010). Assessment in special andinclusive education (11th ed.). Belmont, CA: Wadsworth.
Samejima, F. (1994). Estimation of reliability coefficients using the testinformation function and its modifications. Applied PsychologicalMeasurement, 18, 229–244.
Schmidt, F. L., & Hunter, J. E. (1977). Development of a generalsolution to the problem of validity generalization. Journal of AppliedPsychology, 62, 529–540.
Shealy, R., & Stout, W. F. (1993). A model-based standardizationapproach that separates true bias/DIF from group differences anddetects test bias/DTF as well as item bias/DIF. Psychometrika, 58,159–194.
Shrout, P. E., & Fleiss, J. L. (1979). Intraclass correlations: Uses inassessing rater reliability. Psychological Bulletin, 86, 420–428.
Sireci, S. G. (2009). Packing and unpacking sources of validity evidence:History repeats itself again. In R. W. Lissitz (Ed.), The concept ofvalidity: Revisions, new directions, and applications (pp. 19–37).Charlotte, NC: Information Age.
Slaney, K. L., & Maraun, M. D. (2008). A proposed framework forconducting data-based test analysis. Psychological Methods, 13,376–390.
Spearman, C. (1910). Correlation calculated from faulty data. BritishJournal of Psychology, 3, 171–195.
Standards for educational and psychological testing. (1999). Washington,DC: American Educational Research Association.
Stigler, S. M. (1999). Statistics on the table: The history of statisticalconcepts and methods. Cambridge, MA: Harvard University Press.
Stigler, S. M. (2010). Darwin, Galton and the statistical enlightenment.Journal of the Royal Statistical Society: Series A (Statistics in Soci-ety), 173, 469–482.
Streiner, D. L. (2003). Starting at the beginning: An introduction tocoefficient alpha and internal consistency. Journal of PersonalityAssessment, 80, 99–103.
Suen, H. K. (1990). Principles of test theories. Hillsdale, NJ: Erlbaum.Superfine, B. M. (2004). At the intersection of law and psychometrics:
Explaining the validity clause of No Child Left Behind . Journal ofLaw and Education, 33, 475–514.
Swets, J. A. (1992). The science of choosing the right decision thresholdin high-stakes diagnostics. American Psychologist, 47, 522–532.
Teasdale, T. W., & Owen, D. R. (2005). A long-term rise and recentdecline in intelligence test performance: The Flynn effect in reverse.Personality and Individual Differences, 39, 837–843.
Tellegen, A., & Ben-Porath, Y. S. (2008). MMPI-2-RF (Minnesota Mul-tiphasic Personality Inventory-2): Technical manual. Minneapolis:University of Minnesota Press.
Tellegen, A., Ben-Porath, Y. S., McNulty, J. L., Arbisi, P. A., Graham,J. R., & Kaemmer, B. (2003). The MMPI-2 Restructured Clinical
(RC) scales: Development, validation, and interpretation. Minneapo-lis: University of Minnesota Press.
Terman, L. M. (1916). The measurement of intelligence: An explanationof and a complete guide for the use of the Stanford revision and exten-sion of the Binet Simon Intelligence Scale. Boston, MA: HoughtonMifflin.
Terman, L. M. & Merrill, M. A. (1937). Directions for administering:Forms L and M, Revision of the Stanford-Binet Tests of Intelligence.Boston, MA: Houghton Mifflin.
Thompson, B. (Ed.) (2003). Score reliability: Contemporary thinking onreliability issues. Thousand Oaks, CA: Sage.
Thompson, B. (2004). Exploratory and confirmatory factor analysis:Understanding concepts and applications. Washington, DC: Ameri-can Psychological Association.
Tiedeman, D. V. (1978). In O. K. Buros (Ed.), The eight mentalmeasurements yearbook. Highland Park: NJ: Gryphon Press.
Tinsley, H. E. A., & Weiss, D. J. (1975). Interrater reliability and agree-ment of subjective judgments. Journal of Counseling Psychology, 22,358–376.
Tulsky, D. S., Chiaravallotti, N. D., Palmer, B. W., & Chelune, G. J.(2003). The Wechsler Memory Scale (3rd ed.): A new perspective.In D. S. Tulsky et al. (Eds.), Clinical interpretation of the WAIS-IIIand WMS-III (pp. 93–139). New York, NY: Academic Press.
Tulsky, D. S., & Ledbetter, M. F. (2000). Updating to the WAIS-III and WMS-III: Considerations for research and clinical practice.Psychological Assessment, 12, 253–262.
Tulsky, D. [S.], Zhu, J., & Ledbetter, M. F. (1997). WAIS-III/WMS-IIItechnical manual. San Antonio, TX: Psychological Corporation.
Turkheimer, E., Haley, A., Waldron, M., D’Onofrio, B., & Gottesman,I. I. (2003). Socioeconomic status modifies heritability of IQ in youngchildren. Psychological Science, 14, 623–628.
Uniform guidelines on employee selection procedures. (1978). FederalRegister, 43, 38296–38309.
Urbina, S. (2004). Essentials of psychological testing. Hoboken, NJ:Wiley.
Vacha-Haase, T. (1998). Reliability generalization: Exploring variancein measurement error affecting score reliability across studies. Edu-cational & Psychological Measurement, 58, 6–20.
Vacha-Haase, T., Kogan, L. R., & Thompson, B. (2000). Sample com-positions and variabilities in published studies versus those in testmanuals: Validity of score reliability inductions. Educational andPsychological Measurement, 60, 509–522.
Vassend, O., & Skrondal, A. (2011). The NEO personality inventoryrevised (NEO-PI-R): Exploring the measurement structure and vari-ants of the five-factor model. Personality and Individual Differences,50, 1300–1304.
Vaughn, S., & Fuchs, L. S. (2003). Redefining learning disabilities asinadequate response to instruction: The promise and potential prob-lems. Learning Disabilities Research & Practice, 18 (3), 137–146.
Vogt, D. S., King, D. W., & King, L. A. (2004). Focus groups inpsychological assessment: Enhancing content validity by consultingmembers of the target population. Psychological Assessment, 16,231–243.
Wainer, H. (2010). 14 conversations about three things. Journal ofEducational and Behavioral Statistics, 35, 5–25.
Walker, K. C., & Bracken, B. A. (1996). Inter-parent agreement on fourpreschool behavior rating scales: Effects of parent and child gender.Psychology in the Schools, 33, 273–281.
Wechsler, D. (1939). The measurement of adult intelligence. Baltimore,MD: Williams & Wilkins.
Wechsler, D. (1946). The Wechsler-Bellevue intelligence scale: FormII. Manual for administering and scoring the test. New York, NY:Psychological Corporation.
Wechsler, D. (1949). Wechsler Intelligence Scale for Children manual.New York, NY: Psychological Corporation.
Fundamental Psychometric Considerations in Assessment 81
Wechsler, D. (1991). Wechsler Intelligence Scale for Children (3rd ed.).San Antonio, TX: Psychological Corporation.
Wechsler, D. (1997). Wechsler Memory Scale—Third Edition (WMS-III)administration and scoring manual. San Antonio, TX: PsychologicalCorporation.
Wechsler, D. (2003). WISC-IV technical and interpretive manual. SanAntonio, TX: Psychological Corporation.
Wechsler, D. (2008). WAIS-IV technical and interpretive manual. SanAntonio, TX: Pearson.
Weed, N. C. (2006). Syndrome complexity, paradigm shifts, and thefuture of validation research: Comments on Nichols and Rogers,Sewell, Harrison, and Jordan. Journal of Personality Assessment, 87,217–222.
Wilkins, C., & Rolfhus, E. (2004). A simulation study of the efficacyof inferential norming compared to traditional norming (AssessmentReport). San Antonio, TX: Harcourt.
Wilkinson, L., & APA Task Force on Statistical Inference. (1999). Statis-tical methods in psychology journals: Guidelines and explanations.American Psychologist, 54, 594–604.
Willingham, W. W. (1999). A systematic view of test fairness. InS. J. Messick (Ed.), Assessment in higher education: Issues of access,quality, student development, and public policy (pp. 213–242).Mahwah, NJ: Erlbaum.
Wood, J. M., Nezworski, M. T. & Stejskal, W. J. (1996). The Compre-hensive System for the Rorschach: A critical examination. Psycho-logical Science, 7, 3–10.
Woodcock, R. W. (1999). What can Rasch-based scores convey about aperson’s test performance? In S. E. Embretson & S. L. Hershberger(Eds.), The new rules of measurement: What every psychologist andeducator should know (pp. 105–127). Mahwah, NJ: Erlbaum.
Wright, B. D. (1999). Fundamental measurement for psychology. InS. E. Embretson & S. L. Hershberger (Eds.), The new rules ofmeasurement: What every psychologist and educator should know(pp. 65–104). Mahwah, NJ: Erlbaum.
Wright, B. D. (2001). Separation, reliability, and skewed distributions.Rasch Measurement Transactions, 14, 786.
Wu, M. (2010). Measurement, sampling, and equating errors in large-scale assessments. Educational Measurement: Issues and Practice,29 (4), 15–27.
Zhu, J., Cayton, T., Weiss, L., & Gabel, A. (2008). WISC-IV extendednorms (WISC-IV technical report #7). San Antonio, TX: Pear-son Education. Retrieved from www.pearsonassessments.com/NR/rdonlyres/C1C19227-BC79–46D9-B43C-8E4A114F7E1F/0/WISCIV_TechReport_7.pdf
Zhu, J., & Chen, H. (2011). Utility of inferential norming with smallersample sizes. Journal of Psychological Assessment, 29 (6), 570–580.
Zieky, M. (1993). Practical questions in the use of DIF statistics in testdevelopment. In P. W. Holland & H. Wainer (Eds.), Differential itemfunctioning (pp. 337–347). Hillsdale, NJ: Erlbaum.