Embed Size (px)
Citation preview

1
HANDBOOKIntegration of bicycles in the traffi c engineering of Latin-American
and European medium-sized cities. An interactive program for education and distribution of knowledge.

2 3
“There is a kind of syndrome of tragedy that poisons our thinking about the city. The problems are so great, people say no solution is possible. That’s the mentality of defeat, and excuse for doing nothing. The fundamental thing is to begin”
2 3
GEMEENTE UTRECHT
HANDBOOK
Integration of bicycles in the traffi c engineering of Latin-American and European medium-sized cities. An interactive program for education and distribution of knowledge.
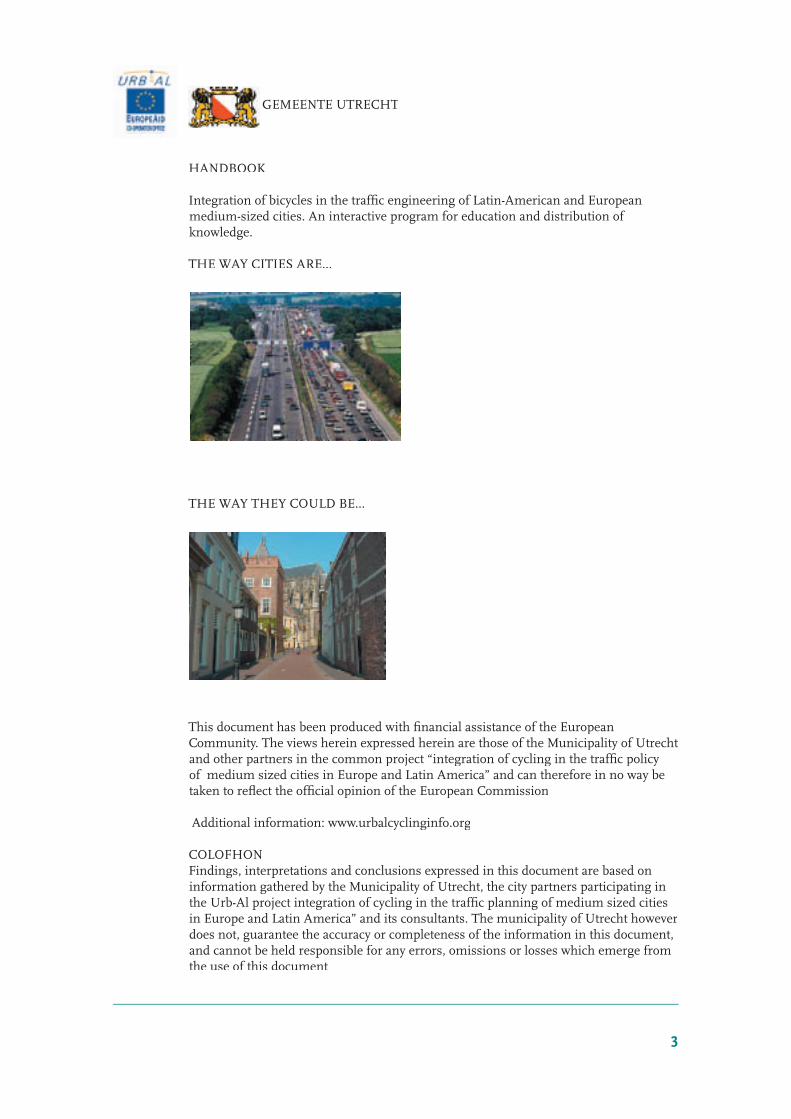
THE WAY CITIES ARE...
THE WAY THEY COULD BE...
This document has been produced with fi nancial assistance of the European Community. The views herein expressed herein are those of the Municipality of Utrecht and other partners in the common project “integration of cycling in the traffi c policy of medium sized cities in Europe and Latin America” and can therefore in no way be taken to refl ect the offi cial opinion of the European Commission
Additional information: www.urbalcyclinginfo.org
COLOFHONFindings, interpretations and conclusions expressed in this document are based on information gathered by the Municipality of Utrecht, the city partners participating in the Urb-Al project integration of cycling in the traffi c planning of medium sized cities in Europe and Latin America” and its consultants. The municipality of Utrecht however does not, guarantee the accuracy or completeness of the information in this document, and cannot be held responsible for any errors, omissions or losses which emerge from the use of this document


4 5
Acknowledgements
We would like to express our appreciation to the following participants in the project:
Ruud Ditewig Gemeente Utrecht, Vakgroep Verkeer
Ton Daggers IBC Utrecht the Netherlands
Carlos Cordero Velásquez Ciclored Peru
Cesar Luque Arrospide Arequipa Peru
Claudia Isabel Hernández Pasedes Alcaldía Municipal de Léon - Nicarágua
Maria Elsa Mena Maldonado
Claus Koehnlein Stadt Planungsamt Stuttgart - Germany
Marcelo Longás Uranga MINVU Santiago – Chile
Jeanne Marie Verdugo
Marta Carvalho Pressl Graz – Austria
Robert Pressl
Patrícia Castro Gómez Instituto Departamental de Transportes Y
Yuranny Rodriquez Transito del Atlántico - Colombia
Rodolfo Moreira Rio Claro, Brasil
Olga Lopes Salomão
Eneas Rente Ferreira
Vera Lúcia Gonçalves da Silva Florianópolis – Brasil
Ana Abreu
Zulema Jaramillo Salcedo Município de Loja – Ecuador
Jutta Deffner Uni Stuttgart, FOVUS Alemania
Walter Vogt
Stefan Alber
Roberto Ainbinder Instituto Pereira Passos Prefeitura Rio de Janeiro, Brasil
Claudia Monteiro Taveres
Jeroen Buis I-ce, the Netherlands
Jose Alberto Saltarén Alcaldia Valledupar
Pedro L. Emparanza IETB – Bilbao – Spain
Photo’s used in this document by: J.Buis, T.Daggers, J.Deffner, R.Ditewig, W.Mulder, W.Vogt
H.Schiffer (FGM-AMOR)
Author and editor Ton Daggers IBC the Netherlands (chapters 1,7,8,9,10)
Author Jeroen Buis I-ce (chapters 3,4)
Author Jutta Defner, Walter Vogt, Stefan Alber
FOVUS(chapter 2,5,6)
For information and comments:
7
Foreword
Cycles and the city
As a city’s population grows, its traffi c will inevitably become busier. And we should bear in mind that traffi c means the transportation of people - not vehicles. How can we best transport these people from point A to B? How do we keep traffi c as safe as possible? How can w limit traffi c’s negative effects on our health and environment? Which role can bicycles play in all of this?
This handbook is the offshoot of a project aimed at assessing the integration of bicycles into traffi c policy. It was written for politicians, policy-makers and engineers involved with city traffi c. The handbook’s central premise is the assumption that bicycles cannot provide us with a defi nitive answer to our city’s traffi c problems, but can and must be part of the solution.
The city of Utrecht has a longstanding tradition where it comes to bicycles and an integrated bicycle policy. We know how bicycles can contribute to a pleasant, sustainable city environment. If you have the opportunity to visit Utrecht, I would defi nitely recommend that you come and see for yourself. By bicycle, that goes without saying.
Mrs. A.H. Brouwer-Korf,Mayor of Utrecht
6

7
Content of the Handbook
1 Introduction 11
1.1 About this handbook1.2 URB-AL and the joint project1.3 Objectives of the HANDBOOK
2 Cycling situation in the member cities – some fact and fi gures 15
2.1 Overview on city morphology and natural situation2.2 Hard factors of cycling – part 1: modal split, plan work ,
structural problems, signifi cances2.3 Hard Factors of cycling – part 2: Organisational aspects (results 1st survey)
2.3.1 Topics of bicycle planning 2.3.2 Institutional organization 2.3.2 Cooperation and communication 2.3.4 Financing 2.3.5 Future topics
2.4 Soft factors of cycling – Perceptions on cycling in the cities (results 2nd survey) 2.4.1 Method 2.4.2 Socio-demographic settings 2.4.3 Average values of perceptions of soft factors 2.4.4 Evaluation of homogeneity of answers 2.4.5 Comparisons 2.4.6 Correlations
3 Planning for cyclist as part of an integrated urban transport policy 29
3.1 The role of planning in historic context3.2 Integrated Transport Policy: setting objectives and targets
3.2.1 An Integrated Urban Transport Policy 3.2.2 Vision Statement 3.2.3 Objectives and targets
3.3 Land use planning, urban planning and transport 3.4 Urban developments and planning in historic context
3.4.1 The Anglo-American model for urban planning 3.4.2 The French model for urban planning 3.4.3 Conclusion: The Anglo-American and French model compared 3.5 Contemporary urban planning in Europe and Latin America
3.6 An integrated transport policy that includes cycling 3.6.1 Introduction 3.6.2 Urban transport planning: reallocating urban space 3.6.3 Including cycling in an integrated urban transport policy
3.7 Best practices

8 9
4 Road safety and cycling 48 4.1.1 Vulnarable road users 4.1.2 More cycling – more accidents? 4.1.3 Road safety and cycling in Europe and Latin American citiesDesigning for safety 4.1.4 Conclusions 4.1.5 Plans and policies for road safety and safer cycling
4.2 Planning and designing for road safety for all modes 4.2.1 Plans and policies for safer road traffi c and safer cycling 4.2.2 Designing for road safety 4.2.3 Road safety and subjective safety 4.2.4 Conclusions and fi nal observations
4.3 Road safety education and progress concerning cycling 4.3.1 Introduction 4.3.2 Education in schools 4.3.3 Education apart from school 4.3.4 New ways of road safety education programs
5 Objectives Of Cycling Policies 61
5.1 Introduction and overview5.2 Increasing bicycle use5.3 Increase road safety (for cyclists)5.4 Increase social safety5.5 Reduce travel time5.6 Increase comfort5.7 Economical aspects
6 Different actor-related aspects of cycling policies 75
6.1 Actors involved6.2 Institutional aspects
6.2.1 commissioner for non-motorised transport 6.2.2 Sub-department 6.2.3 Working groups 6.2.4 Ombudsman/spokesman
6.3 Changing attitudes – how to implement strategies6.4 Training and knowledge transfer for experts / technicians

8 9
7 Infrastructure for cycling 90
7.1 Introduction7.2 How to start
7.2.1 The process 7.2.2 Quality requirements
7.3 Designs for cycle paths and junctions 7.3.1 segregation or integration? 7.3.2 Designs on junctions
7.4 Parking7.5 Maintenance
7.5.1 Pavement 7.5.2 Illumination 7.5.3 Road sign and markings 7.5.4 Traffi c lights 7.5.5 Side verges and greenery 7.5.6 Cleaning 7.6 Summary
8 Flanking policies: raising awareness about cycling and non motorized transport 100
8.1 Campaigns and the importance of public awareness Objectives8.2 The importance to launch campaigns on transport issues8.3 The media8.4 The role of politicians and other actors8.5 Alliances between city government, public transport enterprises, ngo’s and other
stakeholders
9 Economic and fi nancial aspects of cycling 111
9.1 Introduction9.2 Construction cost of cycling infrastructure 9.3 Internal and external cost9.4 Cost of travel time9.5 Accident cost 9.6 Economic benefi ts of cycling
10. What to do and where to start 117
Resources on the internet 120
List of footnotes

10 11Photo 1: Utrecht(H Schiffer, FGM-AMOR)

10 11
1 INTRODUCTION
By Ton Daggers IBC The Netherlands
1.1 About this Handbook
This Handbook for cities is meant for those who are interested in integrating cycling policies as a part of transport policies. Starting from the view that cycling as part of transport policies contributes to accessible and livable city development.
The content of this Handbook is the result of a process of collaboration between all kind of participants, varying from politicians from European or Latin American cities, technicians, engineers and planners and architects interested or working in the fi eld of transport as well as NGO’s operating in the fi eld of improving living conditions in cities by means of promoting cycling as one means of contributing to solving transport problems in cities.
Transport and development are closely related themes: without physical access to jobs, health and education, and other amenities, the quality of life suffers; without physical access to resources and markets, growth stagnates, and poverty reduction cannot be sustained.[1]
Control of urban mobility is essential as one of the tools of improving or maintaining quality of life of urban citizens. Ineffi ciency of transport systems, high economic cost of individual motorized transport, air pollution and the negative impact on historic city centers are worldwide phenomena.
Preoccupation about living conditions in cities though not new, is worldwide paid attention to by initiatives as Local Agenda 21, Car Free City initiatives, Climate conferences as held in Rio de Janeiro and Johannesburg. Apart from ecological related aspects of livability of cities also socio- economic aspects can be taken into account when considering the chances of the inhabitants of cities. In combating poverty it is acknowledged that access to effi cient transport systems is an essential part of participation in the economic process.
The irony is that despite their many problems, developing world cities have many characteristics Which reinforce sustainability, but which are being ignored or destroyed in the name of a misguided view of progress. In the particular context of transport, modal split is heavily weighted toward walking and non-motorized vehicles. These are the most sustainable transport modes being non-polluting, cheap and labor intensive. They are also the modes most vulnerable to large scale road building programs. Thereis now a growing recognition that these traditional means of transport can play a vital part in maintaining sustainable cities (Replogle 1992, 1993; United Nations 1987), a recognition that is being translated into reality in parts of the developed world but is being ignored in most of the developing world. Walking and cycling is healthy, non-polluting and available to everyone including the poor.[2]
Apart from access to the labor market, mobility is also an essential factor for participating in social, political and cultural life. Development of public mobility is an essential factor and duty towards inhabitants of town and cities.
12 13
There is a common perception that urban transport systems need to be improved. Congestion is a serious problem in many cities and set to get worse under current trends for growth in traffi c.This handbook is mostly directed to decision-makers on urban transport policy, urban planners, and managers of operating companies and last but not least to the citizens, who want to get insight in the process and possibilities of cycling in their cities.
How to read
As this handbook is the result of experiences of participants of 13 cities and regions in Latin America and Europe, variations can be found in looking for solutions in what is best for your city. Most of the chapters concern different themes related to aspects of traffi c and non-motorized transport.
In this context, this handbook aims, with the help of examples that illustrate typical situations in the urban areas, to help decision-makers in formulating and answering questions such as:
• Is there a vision on transport in my city and if yes what is it?• What are the targets and goals set to develop a transport policy?• How can a policy towards non motorized transport be a part of the overall transport
policy in the city?• To what extent can policy initiatives enhance managing the fi nancing of mobility?• To what extent can costs be managed through a coherent system design?
Chapter 2 gives an overview of hard and soft factors on cycling in the participating cities. Chapter 3 is dedicated most of all to the role of planning as a tool for control in mobility. Differences in planning concepts between Europe and Latin America are considered as well as the relation between urban planning and transport planning.
Safety being an important aspect for cyclists is reported on in chapter 4. Cycling together with walking is considered the most vulnerable modes of transport. In chapter 5 different aspects of cycling policies are taken into account.
As for chapter 6 the different actors involved in cycling policies are considered
Chapter 7 and 8 treat with respectively infrastructure aspects, fl anking policies as traffi c education and user orientated promotion campaigns, while in chapter 9 the economic and fi nancial effects of cycling are considered.
Combinations of measures were shown to have the greatest effect, and good practice guides have been provided on their implementation, to help cities learn from each other’s experiences.
1.2 URB-AL and the joint project.
The URB-AL program is a horizontal program of decentralized co-operation of the European Commission that brings together cities, agglomerations and regions in the European Union and Latin America. It deals in particular with increasing the transfers of knowledge, experiences and know how.

12 13
The project “Integration of cycling in urban planning and transport policies in middle sized cities in Europe and Latin America” is part of the theme “control of urban mobility” The project is a result of collaboration between different cities and other partners in Europe and Latin America who found each other in their shared interest to exchange experiences about this theme.
Financial contributions to execute the project were obtained for a mayor part from the European Commission (70%) as the other part was contributed by the project members (30%)themselves.
More information on the URB-AL program executed by the European Commission can be obtained at http://europa.eu.int/comm/europeaid/projects/urbal/index_en.htm
1.3 objectives of the Handbook
By at on hand describing the situation in cities participating in the project and using best practices on the other, we hope decision makers to be inspired to integrate the bicycle as a means of transport. Considering the fact that cycling cannot be seen as the solution but as a part of the solution in creating cities with a sustainable, rational and effective transport system.
The transport system to be offered in cities should be safe, effective and functioning in a sustainable way not only for the individual user but also offering a good quality for society as a whole
As it is impossible to describe all the cities experiences we also refer to the project website : www.urbalcyclinginfo.org
Guidelines and other information tools have been developed to help city authorities in giving greater priority to safe cycling and walking. These include a review of good practice in the design of infrastructure and guidance on the implementation of a wide range of measures.
Dissemination of material developed in the project period is also an objective. This information can be obtained at the website http://www.urbalcyclinginfo.org/
Reading this handbook should help to develop visions for city future development considering traffi c. It offers politicians, decision- makers and “technicians” the opportunities of integrating cycling in their urban traffi c systems.
Pho
to 2
: Vel
ocit
y 20
04(T
Dag
gers
)

14 15
P
hoto
4: R
io d
e Ja
neir
o 20
03 (
T D
agge
rs)
Pho
to 3
: G
raz
2003
(T
Dag
gers
)

14 15
2 Cycling situation in the member cities, some fact and fi gures
By: Jutta Defner, Walter Vogt, Stefan Alber
One of the main intentions of the URBAL common projects is exchange of experience and growth of consciousness concerning the different topics of the cities’ networks. In regard of the topic “Integration of bicycle planning in transport planning” the basis of exchange of knowledge and experiences was build on two conferences, the “city documents” of the participating cities and two surveys referring to institutional and soft factors of cycling. On this basis a fi rst brief description should introduce to the general situation of cyclists in the member cities.
Connecting experience and actual situation as well as a SWOT-analysis of the cities points to the objectives and strategies of cities to improve the situation for cyclists. The handbook should help to build visions for the local situation within the next fi ve to ten years.
‘Soft’ and ‘hard factors’ of cycling
This chapter is analysing factors that infl uence the cycling in a city. The so-called ‘hard factors’ include topics dealing with infrastructure, plans, and modal split.. Hard factors also include the natural given situation, urban and transport plans, supply of urban transport and other characteristics. Another part of ‘hard factors’ deals with organisational aspects of cycling policies in the cities. (Chapters 2.2 and 2.3)
Soft factors on cycling describe the “cycling climate’, meaning the perception on cycling by users as well as non cyclists. How politicians and decision- makers look at cycling and what they actually know about cycling is also part of the overall cycling climate. So-called ‘soft factors’ are interpreted within chapter 2.4.

16 17
2.1 Overview on city morphology and natural situation
A fi rst overview gives a standardised characterisation of the participating cities. Main characteristics are:
• city size, varying from 120.000 to 5,5 million inhabitants
• topography, varying from absolutely plain to hilly
• climate conditions , humid tropical to European temparate
• general description of city morphology. [3] varying from densely compact cities to urban areas including rural aereas
Table 1: Overview of member cities by morfology and natural situation
Cities vary in population from 120.00 to 5.400.000 inhabitants.
Member Inhabitants Area (km²) Topography Climate City Morphology Country
Arequipa 809.180 87 mainly hilly tropical hot, mainly dry square Peru
Dep. AtlanticoBaranquilla (city)
2.230.0001.300.000
3.350plain
humid, tropical hot, equatorial
department with 22 municipalities
Colombia
BizkaiaBilbao (city)
1.140.000367.000
2.22041
plain Mediterranean, Atlanticdistrict of 111 municipalities, Bilbao as medieval city 8 x 5 km
Spain
Florianópolis 360.000436 (city)
970 (island)plain with hilly bottlenecks
humid, Atlantic tropical54 x 18 km (island), colonial rectangular street shape
Brazil
Graz 240.000 127 plain European temperate12 x 10 km, medieval city centre
Austria
Léon 141.000 22 plain tropical hot, equatorial 4 x 5 km Nicaragua
Loja 120.000 48 plain tropical hot, mainly dry 12 x 4 km Ecuador
Rio Claro 170.000499 plain humid, Atlantic tropical 124 x 8 Brazil
Rio d. Janeiro 6.000.000 1.250 mainly plain humid, Atlantic tropical 70 x 21 Brazil
Santiago d. C. 5.400.000 3.000 plaintemperate tropical, mountainous, hot and dry
40 x 60 km Chile
StuttgartRegion
590.0002.500.000
207mainly hilly (city is on two levels)
European temperate 19 x 20 km Germany
UtrechtRegion
260.000500.000
155 plainEuropean temperate, humid
14 x 11 km Netherlands
Valledupar 350.000 4.493… … Tropical 32 C… Colombia
sou
rce:
pro
per
inve
stig
atio
n

16 17
2.2 Hard factors on cycling (part 1 modal split, user characteristics, type of cycling, cycling and other modes)
Factors infl uencing cycling conditions in a city can be divided in so called ‘hard’ and ‘soft’ factors. ‘Hard factors’ comprise besides the naturally given situation, urban planning and transport plans, current modal split, structural problems of transport planning, supply of public transport and other characteristics.
Modal split
Table 2: Modal split in member cities
As can be seen in the above table there is a lot of variety between the percentages of cycling in the participating cities
User characteristics
In many cities students and pupils belong to the main user group (Arequipa, Atlantico, Florianópolis, León, Rio Claro, Valledupar). This is important because they are
“constraint users”. And they have certain needs regarding road safety. But also they carry a big potential – if they learn that cycling is an attractive and smart way to move, it is possible that they make later their decision towards sustainable transport modes. So their needs have to be taken serious, for example safe, calm and social secure routes to their aims.
The use of bicycle is sometimes also dependent of socio-cultural groups, like in Rio Claro, where mainly European immigrants use bikes. The potential of such effects could be, that these groups could promoted and act as multipliers.
Type of use -leisure or every day use?
Another observation is that in many cities the bike is seen only as sport activity or toy for children (Bízkaia, Loja, partially Rio de Janeiro and Stuttgart). The bicycle promotion should probably follow other ways like in cities where every day use is common. One strategy could be that the situation of leisure bicycle infrastructure is improved I a way that users could imagine that this infrastructure and service offers make every day use attractive. That this strategy can be successful shows the development of Rios network in the last decade or the efforts taken in Santiago de Chile.the last decade or the efforts taken in Santiago de Chile.
Member Modal Split (in percent)
Car Public transport Public transp. (non mot.) Public transport (informal) Bike Pedestrian
Arequipa 16.5 77.8 0.3 - 0.2 4.2
Dep. Atlantico/Baranquilla … … … … … …
Bizkaia/Bilbao 25 25 - - 0.3 54.7
Florianópolis 73 14 - - 2 11
Graz 47 18 - - 14 21
Léon … … … … … …
Loja 30 40 - - 3 27
Rio Claro 28 14 - 14 17 27
Rio d. Janeiro 11.5 67 0.5 - 2.5 19.7
Santiago d. C. 39 52 - - 5 4
Stuttgart 44 22 - - 7 27
Utrecht 30 9 - - 33 25
Valledupar … … … … … …
sou
rce:
pro
per
inve
stig
atio
n

18 19
In some other cities the bike is especially a mode to go to work or to transport goods commercially, like in Arequipa, Atlantico, Utrecht or Rio de Janeiro. Here special needs of cycling commuters and people who work with their bikes have to be regarded. This means especially bicycling parking facilities, bike and ride, service structures and infrastructure that allows easy, fast and direct connections for cyclists, as well as motivating road safety education work.
Photo 5 and 6: Cycle parking in Rio de Janeiro (W.Vogt)
Cycling and other modes The role of public transport
In Latin American cities the share of public transport is in general higher than in Europe. This is not only positive. It has to be known, that the organisation of public transport in many of these cities is dominated by polluting bus traffi c, concurrence of lines, technical underdeveloped vehicles, crowds of mini-busses etc., informal services and problematic tariff structures.So the argument, that public transport is a way of sustainable transport could not be hold in any way and attempts to get people using the bicycle instead of public transport is worth thinking.Cities that could focus public transport and cycling could be: Arequipa, León, Baranquilla, and Rio de Janeiro
Another aspect is the quality of connections of public transports. In both continents exist problems with the integration of new housing quarters in the suburbs or hinterland with existing public transport lines, like in León or in Graz. Here the integration of public transport and cycling could be one objective to help solving this
“gaps”, like the efforts of Rio de Janeiro, Florianópolis or Utrecht show.
On the other hand there are some cities, which are developing a good public transport system, especially focussing the need of cyclists in combination with public transport (bike and ride facilities, bike in trains) urban quality and public transport stations. Examples are here Florianópolis, Graz, Rio de Janeiro, Stuttgart, and Utrecht.

18 19
Cycling and pedestrians
Some cities also have very high shares of pedestrian traffi c (Bilbao, Graz, Loja, Rio Claro, Stuttgart). This has to be mentioned, to show that efforts in bicycle promotion have to face motorised target groups and not already sustainable moving people. The promotion strategy has to encourage the walkers to walk further.
Another aspect is the acceptance of cyclists on roads when place is scarce. This seems to be a special topic in Florianópolis, León, Loja, and Rio de Janeiro. Here the promotion work could focus education and communication with car drivers.
Photo 7: Cycling education in Graz (T Daggers)
2.3 hard factors on cycling (part 2 organizational results)
Other aspects of the ‘hard factors’ of cycling are the organisation structures of bicycle promotion and cycling policies. Which structures exist and which administrative surroundings, administrational organisation, promotion campaigns working groups exist? Which problems exist especially in cooperation between actors like local decision makers, technicians, staff and other involved persons?
The questionnaires have been the topic of a small survey amongst the participants of the fi rst seminar of the common project (full version of the questionnaire see appendix). Aim of the survey was, to fi nd out
• How is administrative institutionalisation of planning for cyclists established,• How is planning organised,• How far is cycling policy anchored in municipalities?
Twelve members of the project took part at the survey. Their main occupation is employee/ technician/ planner at the local administration, one external consulter and one elected member of the city council.
20 21
2.3.1 Topics of bicycle planning
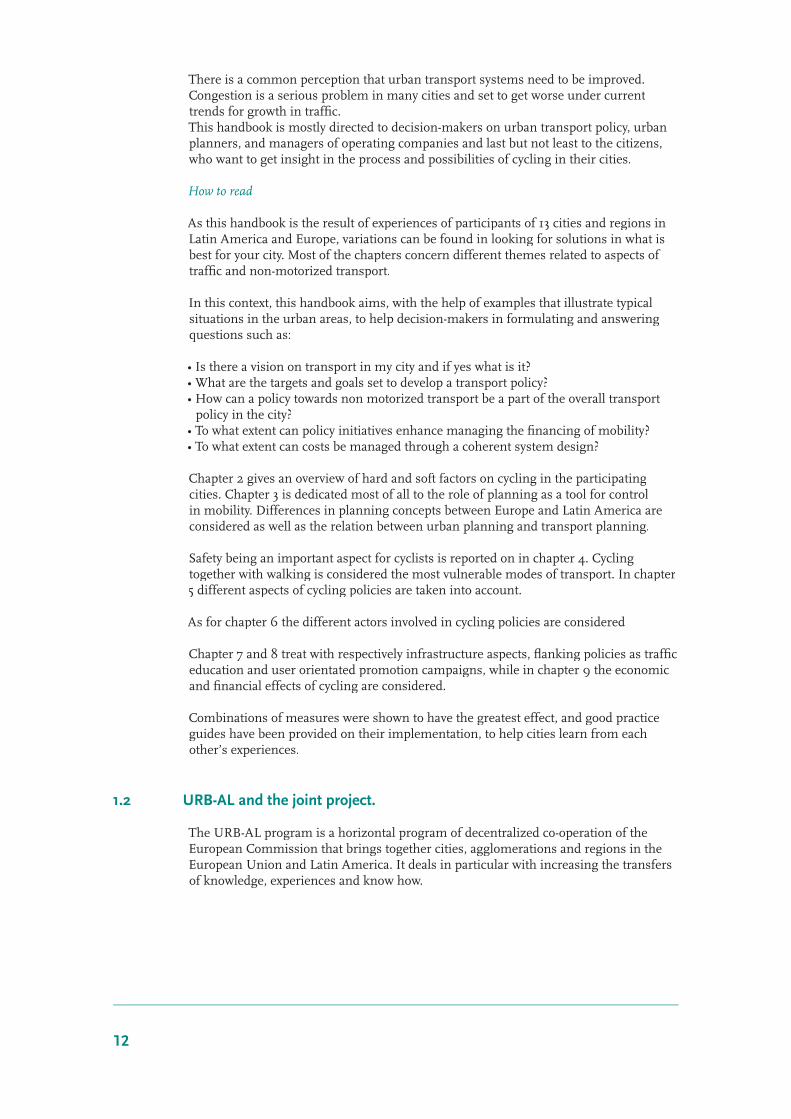
The cities representatives should rank a list of topics in bicycle planning whether they think these topics are important in their cities or not (graph 1). The ranking was from +2 (very important) to –2 (not important). In the graph are shown the averages (blue horizontal line) and the range of answers (grey, vertical lines). Most important and homogenous answered are the topics provide infrastructure and participate departments in the municipality. Also important, but not so homogenous answered, are the aspects provide service and participation of citizens.
Figure 1: Topics in bicycle planning
2.3.2 Institutional organisation
The existence of a bicycle commissioner or a sub-department for bicycle affairs is in many cases a fi rst step or issue to promote bicycle policy in a city. The commissioner or a contact person can be a institutional sign of the municipality. Arguments against a commissioner can be that all responsibilities about cycling affairs are given to this person, but on the other hand a contact person assumes special knowledge on cycling. The following list shows the situation in the member cities of the project.
• 1⁄4 of the cities have a sub-department for bicycle affairs (Loja, Rio, Stuttgart)• over 50% of the cities, which have no sub-department say that the topic is covered by another
department ‡ mainly by traffi c/transportation department (Bizkaja, Florianópolis, Loja, León, Santiago, Utrecht)
• 80% of the cities have a bicycle commissioner, who is (in different ways) responsible for the subject bicycle planning (2 cities have no commissioner/sub-dep. at all: Bizkaya & León)
• in one case the commissioner is only named for that task during the urb-al project (Arequipa)• in 20% the commissioner is a full time employee (Florípa, Stuttgart)• in 80% this task is only supplementary occupation one city had during the time of the survey an
external bicycle commissioner, but institutionalised that task now in the municipality (Graz)
If the work of the commissioner or sub-department could be successful, it is important to know, how the competencies are build. This was another question of the survey. Most of the asked stated that their competencies are small (5 votes), three of these said even, that their competencies should be bigger.
sou
rce:
pro
per
inve
stig
atio
n

20 21
Concerning the actual tasks of the commissioners could be worked out, that there exist 4 main fi elds:
• General Planning, Concepts• Planning practice and Construction planning• Communication, contact• Implementation of measures
Beside the position of the commissioner or sub-department, exist in many cases formal or informal working groups. They differ in several organisational elements and have a wide spread frame:
• Meeting of several departments inside the administration• Integration of external target groups (public transport, consulters, universities,
user groups, etc.)• The frequency of meetings• The estimated infl uence of these groups on the decision process• The actual status quo if such a working group seems to be effective.
Table 3: The importance of a cycling commisionar or working groups
Areq
.
Atl.
Biz.
Flo.
Gra
z
Leon
Loja
Rio
C.
Rio
J.
San.
Stgt
.
Utre
cht
Participation of diff. departments • • •Participation of external institutions • • • • • • •Regularity of meetings - - - - • - •Infl uence in decision process ** * * *** ** *
Ambitions to implement new working group N * Y Y N
• ExistingN no Y yes *** very high ** medium * low * not known - missing answer
Blank fi eld: no answer required
2.3.3 Cooperation and communication
In many cases the constitution of working groups is important and has effects on the planning process and should be a way to build consciousness amongst target groups.A key element of the success of the groups is how good communication and cooperation really are. Therefore the interviewees should assess two levels of cooperation: internal, within the local administration and external cooperation, such as with enterprises, public transport, schools, local retail traders etc. The graph shows the evaluations.
The next step was to collect differences of cooperation quality to get indicia for improvements for working groups in general or to articulate advices for new groups. The interviewees should state their personal view of the importance of good cooperation because it is supposed that not with every target group good cooperation is needed.
source: proper investigation

22 23
The results give the following picture (table):
Figure 2: Quality of internal/ extenal cooperation
Table 4: The importance of cooperation
good cooperation is important say … % the cooperation is good say … %
Technical staff 92 50
Administrative staff 75 42
External planners 75 42
Decision makers 84 25
Police 67 33
Press 67 50
source: proper investigation
Regarding the percentages it gets obvious, that the most contradicting situation exists within communication with decision makers. This emphasises the importance of adequate ways of promotion of bicycle use – not only on the user’s side but on the political level – and shows potentials of bicycle promotion.
2.3.4 Financing
Another important aspect was to investigate the situation of funding bicycle measures. Which basic funds exist, is there a stabile sum, which could be spend on measures etc. To get data was very diffi cult, only few cities were able to describe their fi nancial funds. General results were:
• The percentages of the whole traffi c budget compared to the total city budget are extremely different (0,03%-20%) (n=4)
• In all cities exist different sources to invest in bicycle measures, e.g. budgets for road construction and maintenance, infrastructure in general, resources for environmental planning and nature conservation funds (n=7)
• Only in two cities exist special bicycle budgets (Graz, Florianópolis)
sou
rce:
pro
per
inve
stig
atio
n
22 23
2.3.5 Future topics
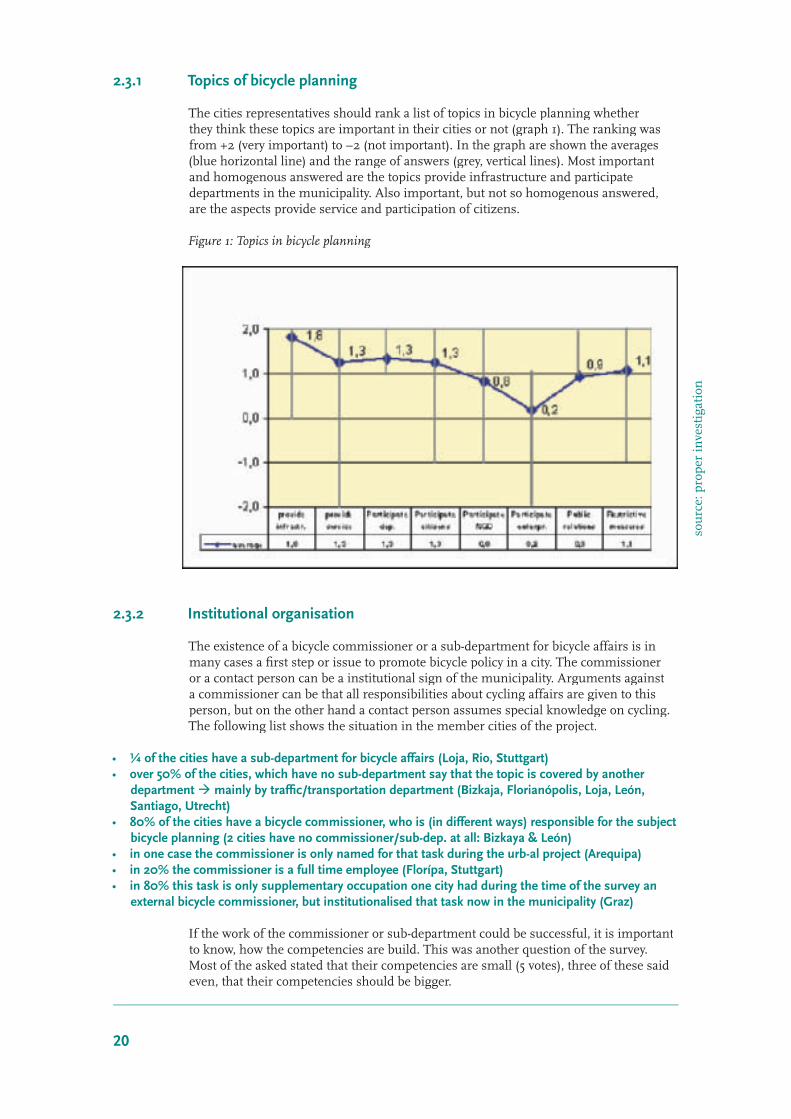
Final question was a resume of main defi cits in the cities, which was sorted to main topics. This gives a view on fi elds of action, which could be key issues of planned activities in the future.
Figure 3: Defi cits for cycling in cities
2.4 Soft factors of cycling – Perceptions on cycling in the cities (results 2nd survey)
Soft factors on cycling describe the cycling “climate” in the city, meaning the perception on cycling by users and non-users, politicians and decision makers and also the grade of knowledge about cycling among the different actors.
The situation for cycling is not only infl uenced by infrastructure measures and services. Another important role is played by a positive public opinion, which affects the traffi c codex but also the chances of communication and awareness within users, politicians, planners etc., here called ‘soft factors’. So a positive cycling climate is also an important factor considering possibilities for developing an effective cycle policy in cities.
2.4.1 Method
In matter of time and funds it was not possible to carry out a representative survey in the cities. To get fi rst insight in bicycle climate in the cities four target groups were focused, which the local contact persons of the project could easily and spontaneously reach. These four groups have been:• a local expert (working in the Urb-Al project)• a superior person as a decision maker• a friend or family member as non-expert• a student or pupil as young participant of traffi c
sou
rce:
pro
per
inve
stig
atio
n
24 25
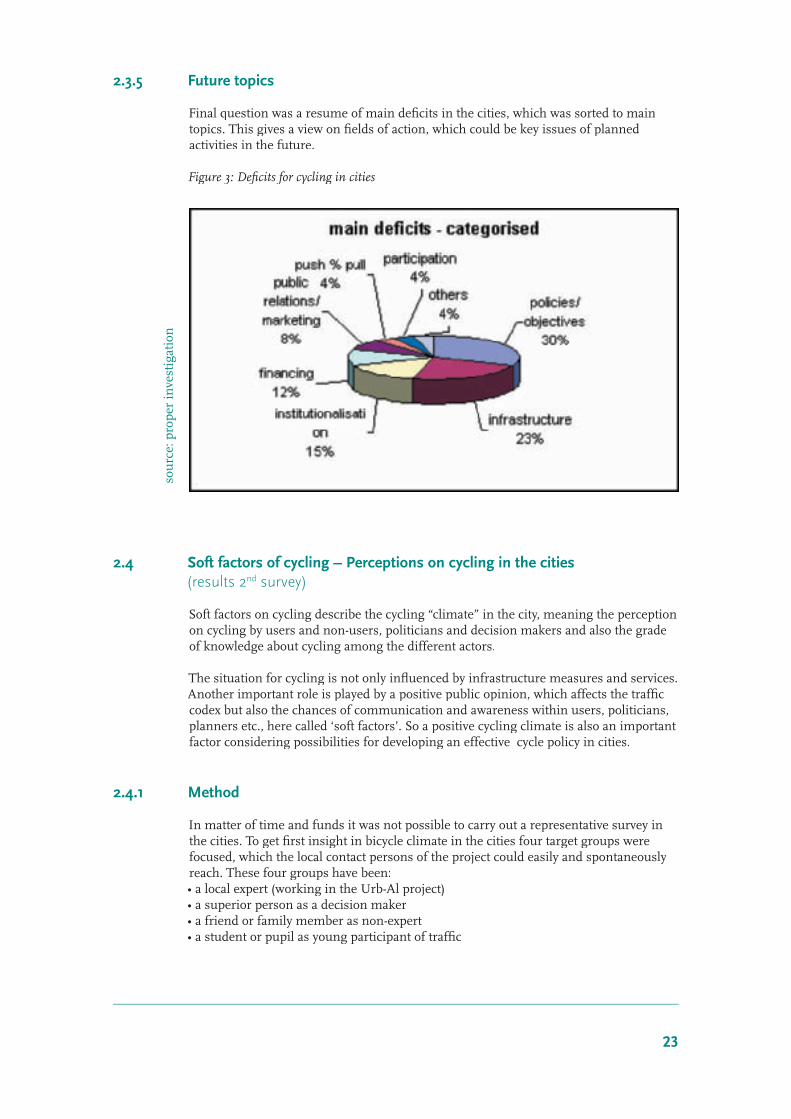
2.4.2 Socio-demographic settings
Gender of interviewees: 31% women; 69% menAverage age: 35Average travelling time from home to working place: 19 minutesModal Choice on the trip to work: See graph
Figure 4: Modal split
2.4.3 Average values of perceptions of soft factors
In which statements have been assessed mainly on the positive side, which manly on the negative side?
High agreements in positive statements (n=45)• Cycling is healthy and useful for fi tness. • It is normal to meet cyclists in public space in the city.• All people, independent of their social class, do cycling.• The distance to reach main places in the city centres / sub-centres are good for cycling.• Cycling is a means of transportation for every day utility.• Cyclists are taken serious.• Cyclists can handle traffi c rules a bit more freely.• Nearly everybody can afford a bicycle.• User needs are taken into consideration by local municipalities. (n=20, only experts)• Cyclists are well organised in user groups. (n=20, only experts)
High agreements in critical statements (n=45)• For cyclists the risk to have an accident is high.• Speed of cars is perceived as too high for cycling.• Bikes in public transport are not allowed.• Bikes are used mainly to transport one person.• Bicycle racks for bikes while going shopping are insuffi cient.• Parking bikes at public transport stops is complicated. • Persons of public life are rarely using bicycles• Enterprises only offer car parking/nothing. • Bikes are stolen or damaged very often. • Cooperation municipality and retail traders is mainly bad (n=20, only experts)
sou
rce:
pro
per
inve
stig
atio
n
24 25
Conclusion• In some fi elds the results appear like expected, like the assessment of risks of accidents or that
cycling is good for health.(Statements 1+2)• Other results are surprising, for example that cycling is strongly perceived as means of transport for
every day mobility or that cyclists enjoy already to be taken serious (statements 23+24).• Over all astonishing is, that the experts think that bike users are already good organized
(statement 41).• The unexpected assessments of the statements point out, that there could be a indifferent perception
of this topics and/or a not differentiated perception on special problems.
2.4.4 Evaluation of homogeneity of answers
In which points do the participants agree, that means, the deviation is low? Within this analysis was used average and standard deviation to show how diverging the perceptions have been. In most cases average and median differ not signifi cantly. Standard deviation shows in the graphs in which cases the answers differed not very much (smaller than 1.5) or in which cases the answers differed very much (>1.8)
Homogenous means that• the range in which the statements have been assessed is not wide (e.g. not from all 6
categories, but from 2 to 4• most answers have been given in the same category
Conclusions can be made to the following points (nr. in brakes = nr. in questionnaire):
• Homogenous and positive perception about healthiness of cycling (5) and state of control of cyclists (28 )• Homogenous and negative perception on: traffi c safety (2), speed of cars (12), cooperation with retail
traders (38) and theft and vandalism (• concise inhomogeneous ratings: A – velocity+directness while cycling (6), social safety (8), gender (9), social class of cyclists (10) B – possibilities to carry bikes in public transport (13) C – cyclists in pedestrian areas (17), open one way roads (18), infrastructure to main places (20) D – facilities at local employers (27), price for a bike (30) E – integration in planning (36), facilities offered by municipalities (40), user organisations (41)
2.4.5 Comparisons1. Comparison of views of different groups (bicycle users – non users; experts – non-
experts)2. Comparison of Latin American and European Cities
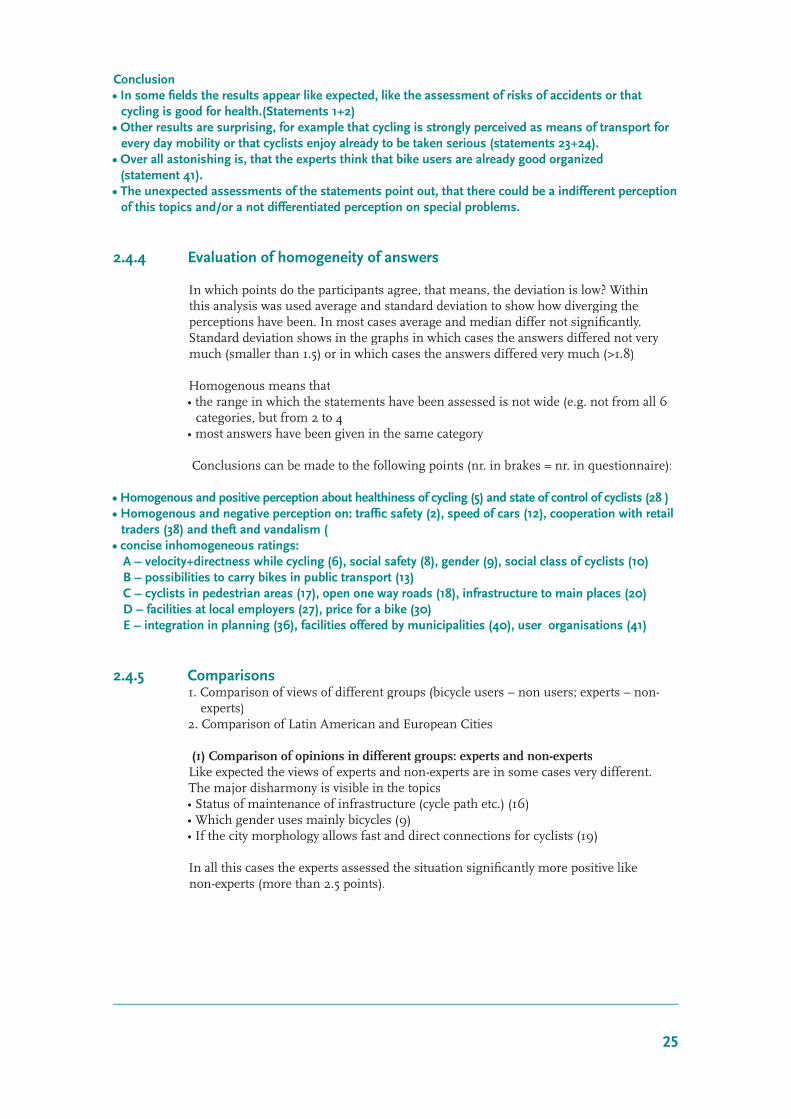
(1) Comparison of opinions in different groups: experts and non-expertsLike expected the views of experts and non-experts are in some cases very different. The major disharmony is visible in the topics• Status of maintenance of infrastructure (cycle path etc.) (16)• Which gender uses mainly bicycles (9)• If the city morphology allows fast and direct connections for cyclists (19)
In all this cases the experts assessed the situation signifi cantly more positive like non-experts (more than 2.5 points).
26 27
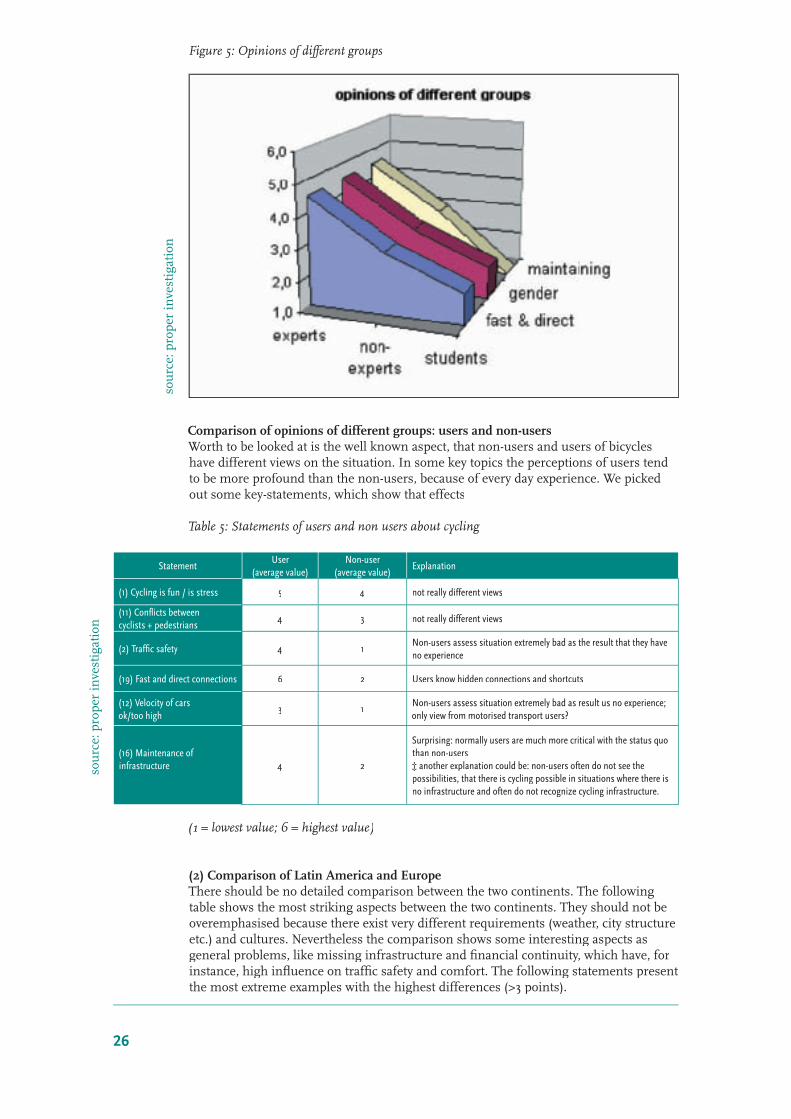
Comparison of opinions of different groups: users and non-usersWorth to be looked at is the well known aspect, that non-users and users of bicycles have different views on the situation. In some key topics the perceptions of users tend to be more profound than the non-users, because of every day experience. We picked out some key-statements, which show that effects
Table 5: Statements of users and non users about cycling
StatementUser
(average value)Non-user
(average value)Explanation
(1) Cycling is fun / is stress 5 4 not really different views
(11) Confl icts between cyclists + pedestrians
4 3 not really different views
(2) Traffi c safety 4 1Non-users assess situation extremely bad as the result that they have no experience
(19) Fast and direct connections 6 2 Users know hidden connections and shortcuts
(12) Velocity of cars ok/too high
3 1Non-users assess situation extremely bad as result us no experience; only view from motorised transport users?
(16) Maintenance of infrastructure 4 2
Surprising: normally users are much more critical with the status quo than non-users ‡ another explanation could be: non-users often do not see the possibilities, that there is cycling possible in situations where there is no infrastructure and often do not recognize cycling infrastructure.
(1 = lowest value; 6 = highest value)
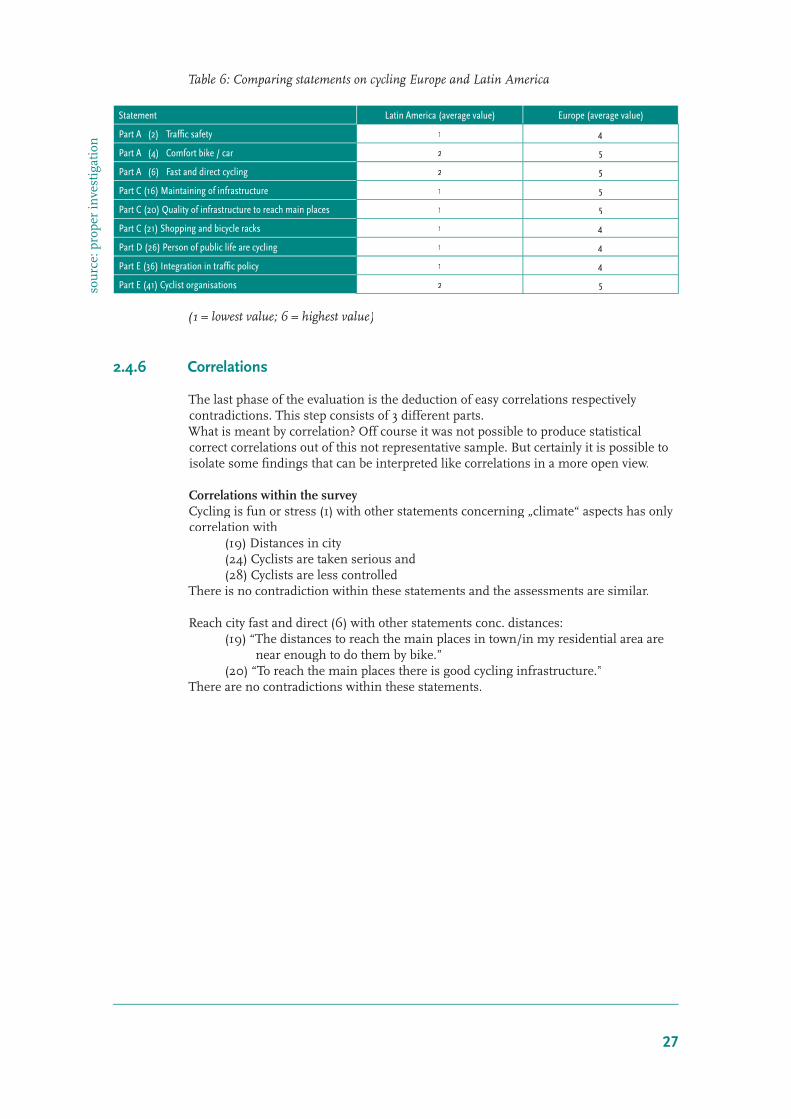
(2) Comparison of Latin America and EuropeThere should be no detailed comparison between the two continents. The following table shows the most striking aspects between the two continents. They should not be overemphasised because there exist very different requirements (weather, city structure etc.) and cultures. Nevertheless the comparison shows some interesting aspects as general problems, like missing infrastructure and fi nancial continuity, which have, for instance, high infl uence on traffi c safety and comfort. The following statements present the most extreme examples with the highest differences (>3 points).
sou
rce:
pro
per
inve
stig
atio
n
sou
rce:
pro
per
inve
stig
atio
n
Figure 5: Opinions of different groups
26 27
Table 6: Comparing statements on cycling Europe and Latin America
Statement Latin America (average value) Europe (average value)
Part A (2) Traffi c safety 1 4
Part A (4) Comfort bike / car 2 5
Part A (6) Fast and direct cycling 2 5
Part C (16) Maintaining of infrastructure 1 5
Part C (20) Quality of infrastructure to reach main places 1 5
Part C (21) Shopping and bicycle racks 1 4
Part D (26) Person of public life are cycling 1 4
Part E (36) Integration in traffi c policy 1 4
Part E (41) Cyclist organisations 2 5
(1 = lowest value; 6 = highest value)
2.4.6 Correlations
The last phase of the evaluation is the deduction of easy correlations respectively contradictions. This step consists of 3 different parts.What is meant by correlation? Off course it was not possible to produce statistical correct correlations out of this not representative sample. But certainly it is possible to isolate some fi ndings that can be interpreted like correlations in a more open view.
Correlations within the surveyCycling is fun or stress (1) with other statements concerning „climate“ aspects has only correlation with
(19) Distances in city(24) Cyclists are taken serious and(28) Cyclists are less controlled
There is no contradiction within these statements and the assessments are similar.
Reach city fast and direct (6) with other statements conc. distances:(19) “ The distances to reach the main places in town/in my residential area are
near enough to do them by bike.”(20) “To reach the main places there is good cycling infrastructure.”
There are no contradictions within these statements.
sou
rce:
pro
per
inve
stig
atio
n
28 29
Correlation with survey on institutional aspects
There have been regarded the groups, which appear when an overall „Cycling climate index“ of the survey is created (see graph below, left) and the opinions about question on „cycle friendliness“ of the fi rst survey. There also appear three groups. The
“members” of the different three groups refer to each other.
Connection with information of fi rst seminarThe opinions of the statements on traffi c plans, cycling plans and consequent realisation (33) have been set in interdependency with the presentations at the fi rst seminar. Result: no correlation, the answers are varying strongly and in most of the cases are existing plansInterpretation: shows that objectives of the plans are not (yet) implemented!
Statements on the situation of bicycle parking (21/22) were also set in correlation with the situation described during the fi rst seminar. Result: all cities with low average towards parking facilities have in fact (mainly) only insuffi cient equipment.
Conclusion
In most of the cities exist – concerning topography, distances and structures – good conditions to give bicycle traffi c an important role in urban traffi c. The results of the survey could be used in two directions:1. As barometer in each city how cyclists and non-cyclists perceive the bicycle situation. If the cities
are interested, it is possible to receive the detailed results by the authors of this handbook.2. As summary which topics and fi elds of measures have to get more attention in future concepts to
promote cycling. This concerns mainly the fi elds:
• traffi c safety and behaviour codex between motorised and non-motorised traffi c participants ‡ traffi c education, education of motorists
• intermodality especially connection between public transport and bike
• implement measures to decrease vandalism and bicycle theft as there are mainly offers of qualitative parking facilities
• efforts to strengthen cooperation with retail traders and local enterprises (mobility

28 29
3 Planning for cycling as part of an integrated urban transport policy: reallocating public space
By: Jeroen Buis I-ce, Interface for Cycling Expertise The Netherlands
3.1 Introduction
Particularly in the last decade many cities all over the world started to facilitate and promote cycling as a mode of urban transport. Few however succeeded to integrate cycling as a full-fl edged mode of transport in their urban transport systems. The emanating result often is that, despite bicycle tracks and lanes, cycling continues to be marginal or mainly for leisure and cycle tracks and lanes are little used or misused. In less fortunate cases, an increase in accidents involving cyclists will be the effect. For more about road safety see chapter 4.
Successful cycling policies are developed as a part of an integrated transport policy for all modes of transport and should be reinforced by other policies such as land-use policies, urban development policies and even socio-economic policies. The reason for this is that these policies infl uence each other. Constructing cycle tracks at one hand and building new high-speed routes for motorised traffi c at the other hand, for instance, will in most cases increase delays and decrease safety for cyclists and consequently lead to less cycling and more accidents. An integrated transport policy balances the different modes of transport and the space they use in the city by giving each mode its own function in the urban transport system. The result will be that travel times reduce for all road users, that the city becomes safer and the quality of life will increase for all citizens.
The fore lying chapter will discuss these issues and also elaborate on the differences between policy making, planning and designing and their respective roles in promoting urban cycling.
3.2 Integrated Transport Policy: setting objectives and targets
Although the fore lying handbook deals with cycling policy, it is essential to pay attention to the broader issue of urban transport policy, since an effective cycling policy cannot be pursued on its own. Any cycling policy should be developed as part of a broader urban transport policy and be fi rmly embedded therein.
3.2.1 An Integrated Urban Transport Policy
An integrated urban transport policy consists of a vision that envisages the desired future transport system for the concerning town or city, a set of objectives that need to be met and an overview of the measures, both physical (infrastructure) and non-physical (pricing, regulations, promotion, etc.), that should be implemented to meet

30 31
the objectives. For concrete long-term urban transport policies the term `strategy` is also used. Such a strategy should comprise at least the following (The Institution of Highways and Transportation, 1997).
An Integrated Urban Transport Strategy or Policy should include:
• Vision statement for the city and its urban transport system
• Objectives and targets for urban transport and the different modes
• A time-schedule when the targets need to be met
• An overview of both physical and non-physical measures to meet the objectives and targets
This can be visualised as follows:
A vision
Objectives à that deliver the vision
Targets to measure progress to meet the objectives
3.2.2 Vision Statement
A vision statement can be written for any policy fi eld, but in order to pursue an effective urban transport policy, setting up a vision statement for the whole city is recommended. In short a vision statement answers the question what kind of city you want, and thus guide policies for the city. The vision statement can include a wide variety of statements, but usually do include the following aspects:
Possible elements in Vision Statement:• Statements about the desired quality of life in the city: what should life be like in the city?• Statements about the economic fundaments of the city: how do we earn our money?• Statements about equity and equality: how should wealth and access to services be organized?• Statements about culture
Most of these elements have links with transport: Quality of life and economy in the fi rst place. But also equity and equality objectives are infl uenced by provisions for different modes of transport, since provisions for cyclists and bus transport will, particularly in Latin America, benefi t other segments of society than provisions for car traffi c.Next shows the vision as set out in the Dublin Transportation Initiative for the city of Dublin [Dublin Transportation Offi ce, November 2002]:
Objectives

30 31
The Vision for Dublin, Ireland The General Vision for the city: ‘…a civilised, vibrant city… a place where people live, work and relax and enjoy leisure time…accessible to all. This is still very general, but the vision was elaborated to a vision statement for the metropolitan area as follows:• A City and a Region which embraces the principles of sustainability;• A leading European City, proud of its heritage and looking to the future;• The National Capital, seat of government and national centres of excellence;• A strong, competitive, dynamic and sustainable Region;• A Living City and Region, on a human scale, accessible to all and providing a good quality of life for
its citizens.
Photo 8: Urban challenge

32 33
3.2.3 Objectives and targets
Objectives defi ne what is desired in wider terms. They determine the direction of a policy and have a very close relation with the vision statement, since both express higher-level goals. Targets, on the other hand, are concrete milestones, on the road to the desired city or transport system. The can both be intermediate and fi nal goals. As opposed to most objectives, targets can be measured and include a timetable. It is objectively possible to measure whether they are met or not.
So, an objective of a transport policy can be: a cleaner urban environment. Targets for the reduction of emissions can than be set in order to meet the objective set. Usually a whole series of targets need to be set to make sure that the, rather broad objective, can be met. A target could then be, for instance, to reduce the total transport-related emission of nitrogen-oxide (or fi ne dust, or carbon-monoxide, etc.) by 10% in 2005 compared to 2000 levels and by 30% in 2010.
Objectives and targets of transport policyIn the above the difference between the more general objectives and the more concrete and defi ned targets has been explained. Since setting useful targets is of no use without fi rst having a clear idea what higher-level objectives should be set for the transport or cycling policy, we’ll start off with defi ning objectives for urban policies and urban transport policies.
Why set objectives?The general objective of establishing objectives is that it forces you to think about what you want and when they are written down, they enable you to communicate your objectives with others, who you need to meet the objectives and accompanying targets.
Functions of objectives are:• They provide guidance for policy development and planning• They help to identify problems that need to be overcome• They enable communication with and provide information to those who play a role in
meeting the objectives and the general public• The provide the basis for appraisal of possible alternative solutions and measures• They make confl icts between different objectives become transparent, when
considering a certain solution or scheme• They make policy-makers and planners accountable for their policies and plans, since
those can be tested against the objectives established.
Objectives for urban and transport policies: the function of mobilityTraffi c and transport determine to a large extent what a city looks like, they are essential for the economy, but on the other hand, can have a very negative effect on the quality of life in a city because of problems of road safety, noise nuisance, pollution and in the case of car transport, even an increase of travel time as an effect of congestion. Cities have developed around transport systems, but simultaneously, transport systems and networks have adapted to cities (see section 2.4 and 2.5 about the history and function of urban planning). The huge role of transport in everyday city-life makes that transport-related objectives are often also important general objectives for a city.

32 33
Higher-level objectives for urban transport policy:
• Accessibility - mobility• Economic effi ciency and economic - economy and wealth regeneration • Environmental protection - ecology and health• Safety and security• Equity - distribution of wealth and access• Quality of life - well-being
In short, the overall objective of transport is accessibility, whereas economic objectives are derived from that. Quality of life, which includes environment, safety, security and equity, is the other main objective of urban (transport) policies, which in some cases can confl ict with economic or accessibility objectives. A balanced policy that takes all the above objectives into account is the main challenge for any transport policy.
Why set targets?Targets serve many of the same functions as objectives. The difference however is that they are better measurable and more clearly defi ned. They might be developed simultaneously with the policy that intends to meet those targets since starting off with targets, before any policy is in place at all, can be risky since it might well be impossible to determine what is achievable.
Possible functions of targets can be [Atkins, 1995]:• As policy-signals that indicate an intent and commitment for change• As measures of achievement• As means of management and control• As a lobbying device in order to gain greater interest in or resources for a particular issue.
Targets for urban transportBefore it is possible to set targets, the following needs to be done:1. The higher-level objectives need to be elaborated or split up into more defi ned
objectives2. Appropriate parameters need to be determined that indicate whether transport in
the city develops into the direction desired
Possible lower-level objectives for urban transport are: Lower-level objective Higher-level objective• Reduce average travel-time for commuters (trips to work) - Accessibility• Reduce the amount of annual traffi c fatalities - Road Safety• Decrease the share of the private car in modal split - several• Reduce emissions from road traffi c - Environment• Increase bicycle use - several
The next step after establishing the lower-level objectives is to set targets for parameters indicating the lower-level objectives.
Possible targets for urban transport policy:• 50% more commuter-trips by bicycle in 2010, compared to 2002.• A reduction of the share of local car-trips in the modal split from 50% in 2002, to 40% in 2010.
And so on. When a concrete policy and transport plan is developed more detailed and defi ned targets can be set. Be careful however not to include concrete solutions in the targets. Targets such as: a growth of the total amount of kilometres of cycle tracks and lanes, seems fi ne, but changes the focus from promoting cycling and making cycling safer, to concrete infrastructure solutions that not necessarily guarantee that the (lower- or higher-level) objectives will be met. So be very careful not to confuse objectives and targets with solutions or means to meet this objectives and targets.

34 35
Targets for Dublin (A Platform for Change)• Stabilise peak hour car traffi c to 1997 levels in 2016 (while overall peak-hour traffi c is projected to
grow with 95%)• Increase cycle use for trips up to 6 kilometre from 5% in 1997 to 30% in 2016.
3.3 Land use planning and urban planning: providing short trips for cyclists
Introduction and objectives of land-use planningLand use is the term used for the functions of land areas and the intensity of these functions. Functions can be residential, commercial, employment, recreation, nature, agriculture, etc. In cities the main functions are residential (where people live), employment (where people work) and commercial (where they do their shopping and go out). The intensity of the land-use can be defi ned as the amount of inhabitants or employees per hectare or square kilometre, or for commercial land-use: the amount of shops, restaurants, pubs, etc. per hectare, or the amount of visitors.
Land-use determines to a large extent traffi c and transport in a city, since people make trips to get to work, to visit friends or to go to a shop. The distance between these functions thus determine how far people have to travel and infl uence their mode choice. If your work is across the street you’ll walk to work, if it’s 5 km. away you might cycle, but if you have to cover 15 kilometers or more you’ll almost certainly decide to use your car or public transport.But this relation between land-use and mobility is a two-way relation, since most cities have been planned for the most common mode of transport at the time as will be elaborated upon in the next section.
The awareness that land-use planning can, and should play a mayor role in policies that aim to solve the urban traffi c problems and to promote walking, cycling and public transport is relatively new. A truly integrated transport policy cannot be pursued without paying due attention to land-use planning. The fi rst question to be asked is what the objectives of land-use planning should be. Underneath we sum up a list of possible objectives.
Transport-related objectives of land-use planning• Reduce traffi c by reducing trip lengths – bringing origins and destinations closer• Reduce motorized transport by increase walking and cycling by reducing trip lengths• Reduce traffi c by combining functions at one location• Providing an appropriate and attractive environment for cycling and walking• Increase the catchment-areas for public transport
How can these objectives be met? As function and intensity of land-use are the two parameters that determine land-use, these are also the buzzwords when developing a land-use plan.
About DensityAs will be described in section 2.4 in different countries and through different phases of history there are and have been different attitudes towards urban density. On a global scale very high densities of over 300 inhabitants per hectare can be found in Asian cities like Hong Kong whereas in North-American cities like Kansas-City for instance, densities can be as low as 10 or 15 inhabitants per hectare. Since low densities imply extensive land-use, low-density cities cover much bigger land areas than high-density cities and therefore are less suitable for cyclists and pedestrians. Since cars need a lot of space and public transport need a lot of people living or working near a station, cities with low densities have high car-use and low public transport use whereas high-density cities have lower car-use and higher public transport use. Newman and Kenworthy studied this phenomenon in their brilliant book Sustainability and Cities [Newman

34 35
and Kenworthy, 1999]. And found that the lower the density of the city, the higher the average annual distance travelled per capita, the higher the car use and the higher the energy used in transport per capita. Figure 1 illustrates that.
Figure 6: Urban Density and Fuel used for Private Transport
About Mixed UseThe physical separation between work and living that came up during the industrial revolution, but has been a tendency in most American and European cities throughout the 20th century resulted into ever increasing commuter distances (particularly in the low density American cities) and more and more car-traffi c. Providing mixed-use urban areas with residential, commercial and employment functions, particularly in city-centre areas and at public transport nodes will enable people to live close to work, to walk or cycle to the shop or to use public transport for commute or other trips.
Some general recommendations for urban land-use policy:• Plan in moderate to high densities in most of the city in order to preserve space for green areas
and keep the city compact, thereby keeping many urban trips short enough for cycling and walking.
• Plan in high or very densities around important nodes of urban transport like railway-stations, underground or light-rail stops or junctions of several public transport lines.
• Plan mixed-use, particular in city centres and around public transport nodes.

36 37
3.4 Urban development and planning in historic context
During the world history city and town planning have been subject to a variety of infl uences and philosophies. In this section we’ll make a swift journey through the history of city planning.The earliest cities have been built long before Christ in early civilizations in Mesopotamia, The Nile Valley and Greece. As centres for religion, trade and culture the roots of European civilization can be found in the cities of the Greek and Roman Empire.It were, however the cities of the Middle Ages and the renaissance that formed literally and metaphorically the foundations on which the modern cities have been built.
The pre-industrial city of the Middle Ages and renaissance was, a small city with mixed land-use and based upon travel by foot. With a city like Florence (Northern Italy) being one of the largest cities of the renaissance with no more than 50,000 inhabitants [Rudlin, David and Nicholas Falk, 1999]. Apart from a mixed land-use the, for modern standard extreme, high density was (and is) one of the most striking features of these cities.It has been suggested that these high densities were needed to enable travel by foot [Fishman, Robert, 1987], were a result of the physical restraint to expansion posed upon the medieval city by the city walls and were driven by the need to conserve surrounding agricultural land. Either of those arguments can partly explain the density of the medieval cities, but the densities of these cities were much higher than can be explained by these factors, since walking distance from the central market to the countryside was no more than 20 minutes and also non-walled cities were built in very high densities. Robert Fishman described in Burgeois Utopia [Fishman, Robert, 1987], that in the pre-industrial city, the city centre was the place to be and the centre of power and commerce. Therefore the rich and the powerful lived and worked in the centre of town whereas the poorest people were pushed to the edge of the town. This demand for the best location in the heart of the city would have increased land values and stimulated land-owners to develop sites to its maximum potential; thus leading to very high densities.
3.4.1 The Anglo-American model for urban planning
Whereas the pre-industrial city was the heart of power and commerce and seen as a desirable place to live and work, during the industrial revolution in Britain, this image changed as the small medieval British cities were extended with polluting industrial complexes and cheap housing for their employers. Cities like Manchester, Leeds, Liverpool and Manchester grew rapidly to a size that seemed diffi cult to control. Overcrowding, limited sanitation, danger, pollution, crime and congestion (not by cars but by carts) made these cities a less-than-desirable place to live. In the British and American minds the city became a place of evil and illness. While the wealthy medieval citizens jostled around a central spot in town, the well-to-do citizen of the industrial city fl ed the city to newly built suburbs, away from the fumes and overcrowding of the city. This development provided the foundations for attitudes towards cities and urban planning that shaped towns and cities ever since.
36 37
Rudlin and Falk [Rudlin, David and Nicholas Falk, 1999] summarize these attitudes as follows.
The (post-) industrial and post-industrial city and its affl uent suburbs:• Idea: The city is bad, the countryside or green suburb is good• Attitude: High density (associated with overcrowding) is bad, low density is good• Trend: Separation of home and to avoid living in the city• Result: The richer you are, the further you can afford to live from the city centre.
Effects on traffi c and transportThe above-mentioned attitudes and trends had a huge impact. Through separation of home and work, commuting was introduced with a subsequent increase in traffi c. In the industrial city of the 19th century and the fi rst half of the 20th century, the tram and train were the most important modes of transport for distances that were to far to walk or cycle. As most railways in the British industrial city were built between 1850 and the First World War (1914-18), this was by far the most important mode of transport in this period. The bicycle was introduced on a large scale in the beginning of the 20th century with its use peaking around 1940 at over 30% of all non-walking trips in post-industrial Manchester [Bruhèze, 1999]. So, as people travelled longer and further to get to work, the typical commute trip was one by train from a suburban settlement to the city and for those who couldn’t afford living in the suburbs a shorter trip within town on foot, by bike or by public transport as well. It was only after the Second World War that the private automobile started to play an important role in urban traffi c. While for pre WW-II suburban residents the radial railways to the city centre made the city centre one of the most accessible places and therefore a natural destination for work and shopping. The car, however, enabled easy travelling in all directions and caused more and more congestion in the central parts of the cities in the 50’s, 60’s and 70’s which resulted into employment and commercial activity leaving town, to more, car-accessible, locations. First, land-intensive and transport-dependent industry and warehousing left to new industrial estates and suburban distribution centres, they were, by the time most employees and customers, owned a car, followed by offi ces leaving for offi ce parks and retailers moving to suburban shopping centres.The effects of all this were, apart from longer trip distances and increasing car-dependence and car-traffi c, a decline of the inner-city areas. As the middle classes, businesses and investors left town, inner cities, became the home of those unable to fl ee the city. Poverty, unemployment and a range of other social problems concentrated in these areas. In most British cities the city centre itself kept a certain function for small-scale retail, entertainment and tourism and often kept its attraction due to a nice pre-industrial city centre. The result was cities with centres surrounded by poverty and decline and prosperous, relatively low-density, suburbs.
The American cityIn the above we discussed the British case, the American (USA) case is an extreme form of the British. As a British colony, the US range of ideas directly stemmed from the British. The difference however was that most American cities developed much later, thereby having no pre-industrial urban core. The most ancient US industrial cities, like Chicago, for instance had a centre dominated by factories that together with the surrounding inner city neighbourhoods underwent the same decline as its British counterparts. In many of these cases no lively city-centre remained, turning the heart of the city into ghetto’s and no go areas.As for the outer urban areas, as many American cities underwent the most signifi cant growth during the car-area, the major part of these cities developed as vast seas of low-density suburbs. Younger cities like Los Angeles, never even got a city centre at all, but are until today nothing more than one big suburb. While the British fought overcrowding by proclaiming an ideal suburban density of 12 houses to the acre (which is the equivalent of 27 houses per hectare) as suggested by Raymond Unwin, densities in suburban American cities are as low as 2 or 3 houses per acre (4 to 7 houses to the hectare).

38 39
The result of this is that many American cities, or at least their suburbs, are made up of endless urban sprawl covering vast areas of land. In these cities not only employment and shops are far away, even fellow-citizens in the same district can be miles away. As these cities have been modelled completely to facilitate the use of the car and fulfi l the suburban dream of a private plot with a detached house, the car is needed for everything. And, since densities are so low, there is no basis for public transport.
Photo 9: The car dependent, low-density, American city
Recent development and new attitudesThe long list of disadvantages and problems that accompany the Anglo-American city such as car-dependence, congestion, deprivation of certain districts, high infrastructure costs, lack of identity, etc, fueled an urban renaissance over the last 10-15 years in Britain and, to a lesser extent, the United States. Inner-city redevelopments like in Portland (USA) or Manchester (UK) or the Temple Bar in Dublin (Ireland; also Irish cities, like Australian largely developed according to the Anglo-American Model) resulted in high-density mixed-use areas with expensive apartments that oppose the classic Anglo-American ideal of the house with garden and car in front of the door. These kinds of homes, however, remained popular in most continental European cities as will be explained underneath.
3.4.2 The French model for urban planning
In mainland Europe, the industrial revolution led to similar problems and developments as in England. In Paris this led to suburban growth in the beginning of the 19th century. Probably, Paris would have followed the British experience if not Napoleon de Bonaparte had had other plans. He saw Paris as the capital of a great empire – like Rome was for the ancient Romans – and wanted the city to refl ect that. The urban planner Hausemann was charged with the implementation of Napoleon’s vision and cut great boulevards through the high-density medieval city with six fl oor (or more) buildings along them. Since the boulevards and the buildings along them were to refl ect the greatness of the Napoleonic Empire they needed to be of high quality. In order to fund these expensive buildings, they needed to be middle class housing. Obviously the development of such large amounts of middle-class housing was inconceivable if the French middle class continued to leave the city for the suburbs. The vision [Napoleon] and the urban plan [Hausemann] were therefore backed by a policy to keep the French middle class in town: tax-incentives where introduced that made it

38 39
very attractive to live in the boulevard-apartments. This was so effective that within a short period of time the French middle class did not aspire a suburban villa, like the English did, but a spacious urban apartment. Until now, it is quite normal for families with children to live in these apartments, where this would be considered eccentric in England. As for the suburbs, although also French cities do have affl uent suburbs, these are an exception. The French suburb, or ‘banlieu’, is more general a municipal housing estate for the poor working-class citizens who cannot afford to live in the city.The urban plan of Paris is so important because it served as a model for the replanning of Vienna in the second half of the 19th century. Paris and Vienna together provided a model for other continental European and also South American cities.
3.4.3 Conclusion: The Anglo-American and French model compared
It is very interesting to realise that a different attitude towards the city emanated in such completely different cities and plans. In all cases, the urban form of pre-industrial and medieval city, the Anglo-American and the continental-European city, were a result of a different perspective on status. Where the rich and powerful in the medieval city and the French city aspired living in the city, their British industrial-city counterparts choose to move to the suburbs. Both the French way to cope with the arising problems: redevelop the city centre by bringing space to the city through boulevards and squares, as well as the British response: move out of the city, seemed logic reactions. When talking about vision and planning, the pro-active Napoleonic approach, can be considered ‘superior’ to the reactive British approach.In any case, we can learn from this historic perspective, that there are different ways to cope with the same problems. It is important to remember this when dealing with today’s urban transport problems.
3.5 Contemporary urban planning in Europe and Latin America
Whereas the division into Anglo-American style cities and French-style cities was relatively clear until the Second World War, particularly in the 1960’s and 1970’s Anglo-American style developments took also place in many continental European cities.There are a number of reasons for this, but the most important is the fact that in the 50’s, 60’s and 70’s the private automobile became affordable for large parts of the European population. The automobile enabled people to travel rapidly to far more destinations than was possible before with public transport. As citizens wanted their car, politicians and planners made sure they had to roads to use it. The need to live or work close to a railway- or metro-station reduced and urban and transport planners focused designed their new suburban districts for cars, not for public transport. No later than the 1970’s mass-motorisation had caused such problems of congestion, noise and pollution in most cities that attitudes started to shift and policies to tackle these problems slowly, but certainly, developed. In section 2.6.4 we will describe two successful examples.
Mass-motorisation led to a similar development in most Latin-American cities, but not earlier than in the 1980’s and 1990’s. Although, with lower levels of car-ownership, most Latin-American cities are in a position to still avoid many of the mistakes made in Europe, it is not an easy battle since many cities have grown very rapidly to the size of Paris or London with very little planning. Together with a lack of fi nancial resources and visionary city management as well as a strong infl uence of the American range of ideas that values free-market capitalism over governmental policies and plans, there is still a long way to go for most cities.

40 41
3.6 An integrated transport policy that includes cycling
3.6.1 Introduction
Particularly during the last decade many cities all over the world started to facilitate and promote cycling as a mode of urban transport. Few however succeeded to integrate cycling as a full-fl edged mode of transport in their urban transport systems. Often, despite bicycle tracks and lanes, cycling continues to be marginal, mainly for leisure and cycle tracks and lanes are little used or misused.There are many possible explanations for this. Critics tend to mention the culture, the climate or the fact that the city is too hilly. Although this can be part of the explanation, more often than not, the projects, and the relative isolation in which they were developed, were to blame.A common view about promoting cycling, is that just adding some bicycle tracks to the urban transport system will do to make cycling succeed as a mode of urban transport. A few routes through some parks, along the beach or simply where space is available to build some tracks, however, will never make cycling big.
This section aims to explain how cycling should be looked upon and treated as part of an integrated transport policy and urban planning in order to create the basic conditions for cycling as a fully-fl edged mode of transport.
3.6.2 Urban transport planning: reallocating urban space
Urban and Transport PlanningUrban and transport planning is basically the design or redesign of urban space. An integrated urban transport policy should determine, how and when urban transport plans can be implemented. An urban transport plan thus is an outcome of an urban transport policy.As new cities or districts can be designed from scratch, leaving all options open, most contemporary urban planning and urban traffi c planning, needs to take the existing built environment as a starting point. This is a much harder task than starting off with a tabula rasa, since most urban space has already a function. So whether we want to provide facilities for cars, plan for better public transport or (better) facilitate walking and cycling, in most cases this means that urban space needs to be given a new function. Be it a green space converted into a road, a road or canal being replaced by a rail-line or car parking being replaced by a cycle track or footpath, in all these cases something must go. It is absolutely essential to be aware of this, since particularly in cycle planning, it can be tempting to see what space is ‘available’ for cycle facilities, implying that all ‘used’ space cannot be used to provide for cycling. An integrated approach to transport and cycle planning, anyhow, takes all modes of transport into account and does not allow for such a kind of isolated planning.
Towards an integrated urban transport policyAfter setting up a Vision Statement for the city and traffi c and transport in the city and determining objectives a policy can be developed to meet the objectives.
There is no doubt that vision statement and objective determine to a large extend what is regarded desirable and what undesirable. A city that has a vision statement saying that the main concern for the city is to maintain and enhance the strength and competitiveness of its port, will take different decisions and set different priorities regarding traffi c and transport infrastructure, than a town stating that enhancing its attractiveness as a historical and tourist town, is its main objective.
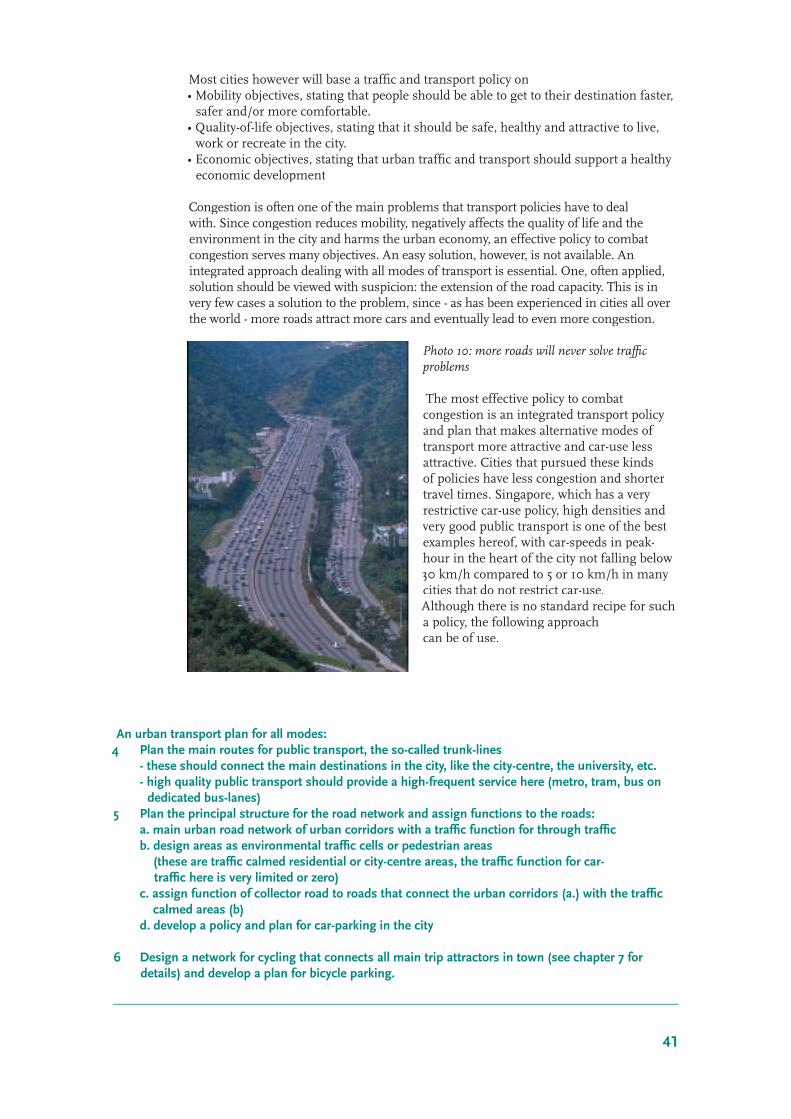
40 41
Most cities however will base a traffi c and transport policy on• Mobility objectives, stating that people should be able to get to their destination faster,
safer and/or more comfortable.• Quality-of-life objectives, stating that it should be safe, healthy and attractive to live,
work or recreate in the city.• Economic objectives, stating that urban traffi c and transport should support a healthy
economic development
Congestion is often one of the main problems that transport policies have to deal with. Since congestion reduces mobility, negatively affects the quality of life and the environment in the city and harms the urban economy, an effective policy to combat congestion serves many objectives. An easy solution, however, is not available. An integrated approach dealing with all modes of transport is essential. One, often applied, solution should be viewed with suspicion: the extension of the road capacity. This is in very few cases a solution to the problem, since - as has been experienced in cities all over the world - more roads attract more cars and eventually lead to even more congestion.
Photo 10: more roads will never solve traffi c problems
The most effective policy to combat congestion is an integrated transport policy and plan that makes alternative modes of transport more attractive and car-use less attractive. Cities that pursued these kinds of policies have less congestion and shorter travel times. Singapore, which has a very restrictive car-use policy, high densities and very good public transport is one of the best examples hereof, with car-speeds in peak-hour in the heart of the city not falling below 30 km/h compared to 5 or 10 km/h in many cities that do not restrict car-use.Although there is no standard recipe for such a policy, the following approach can be of use.
An urban transport plan for all modes:4 Plan the main routes for public transport, the so-called trunk-lines - these should connect the main destinations in the city, like the city-centre, the university, etc. - high quality public transport should provide a high-frequent service here (metro, tram, bus on
dedicated bus-lanes)5 Plan the principal structure for the road network and assign functions to the roads: a. main urban road network of urban corridors with a traffi c function for through traffi c b. design areas as environmental traffi c cells or pedestrian areas
(these are traffi c calmed residential or city-centre areas, the traffi c function for car- traffi c here is very limited or zero)
c. assign function of collector road to roads that connect the urban corridors (a.) with the traffi c calmed areas (b)
d. develop a policy and plan for car-parking in the city
6 Design a network for cycling that connects all main trip attractors in town (see chapter 7 for details) and develop a plan for bicycle parking.

42 43
3.6.3 Including cycling in an integrated urban transport policy
Since in most cities, non-proportional car-use caused the majority of the urban transport problems, a part of the solution for these problems can be found in taming the car. This does not mean that the car should be considered a ‘bad’ thing that should be challenged wherever possible, but rather implies that car-use should be discouraged when (time), where (space) and for which trips (trip purpose or distance) other modes are more appropriate or effi cient. This leaves road space for those car trips that cannot easily be substituted by other modes, due to a lack of feasible alternatives.
The above implies that in order to really promote cycling as a fully-fl edged mode of transport and realise a modal shift from motorised modes to cycling, more should be done than just facilitating cycling. A more integrated transport policy is needed that indeed does include planning for cycling, but only as a part of a broader strategy for all modes of transport. Such a strategy does not only intend to make cycling more attractive (pull-policy: the carrot), but also to make private motorised modes of transport less attractive (push-policy: the stick) and of course improve public transport and walking.In several European countries (Germany, Denmark, The Netherlands, Switzerland, France, amongst others) these kinds of policies are pursued in cities to discourage private car-use and make cycling, walking and public transport more attractive.The policy-instruments include a wide range of measures that can be subdivided in three categories:
Physical measures to discourage car-use and enhance alternatives, like:• New public transport lines to improve public transport services• Car-free streets or zones in city-centre areas• Traffi c calming in residential areas• City-wide cycle networks with cycle parking facilities
Economic measures like:• Signifi cant taxes on fuel and car-sales (e.g. Denmark)• Parking fees in the city-centre• Road pricing and tolling (e.g. Singapore, Oslo, London)• Subsidised public transport.
Legal and organisational measures like:• Time windows for trucks and delivery vans in city centre areas • Permission to take bicycles on trains, trams or busses• Reduced speed limits throughout the city (e.g. Graz)• Parking standards for different areas (residential, commercial, city-centre, etc.)• Mobility management plans for companies
Obviously, more often than not, policies and measures contain physical, economic, legal and organisational aspects.Finally the urban transport policy should be underpinned by land-use policies that reduce trip lengths and provide opportunities for public transport as has been discussed in section 2.3.
The effects on cycling of these non-cycling measures and policies can be signifi cant. In many cases, policies and plans, other than those including cycle facilities, have been more effective in shifting modal split towards cycling and improving the circumstances for cyclists than the provision of bicycle tracks and lanes alone.In Amsterdam, for instance, bicycle use increased in the city centre in the 90’s mainly due to car-restraining policies like a signifi cant rise of the parking fees. Research showed that the provision of new infrastructure for cyclists had only a small stake in the increase of bicycle use.
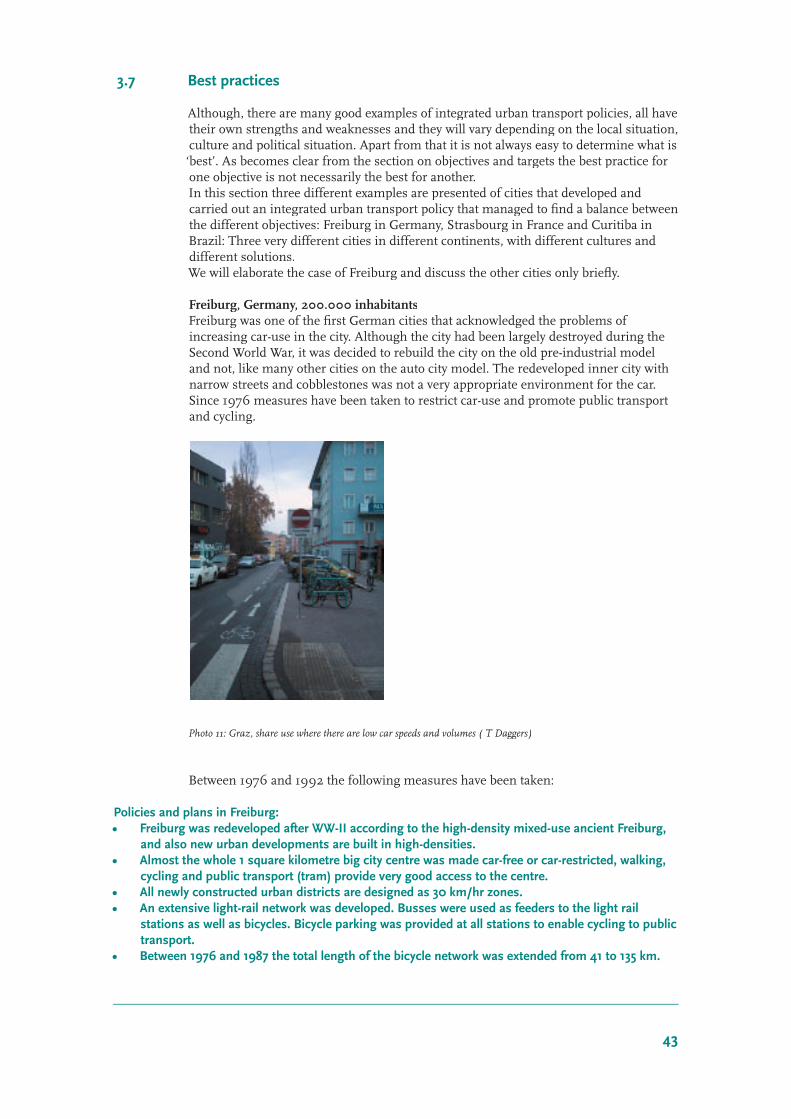
42 43
3.7 Best practices
Although, there are many good examples of integrated urban transport policies, all have their own strengths and weaknesses and they will vary depending on the local situation, culture and political situation. Apart from that it is not always easy to determine what is ‘best’. As becomes clear from the section on objectives and targets the best practice for one objective is not necessarily the best for another.In this section three different examples are presented of cities that developed and carried out an integrated urban transport policy that managed to fi nd a balance between the different objectives: Freiburg in Germany, Strasbourg in France and Curitiba in Brazil: Three very different cities in different continents, with different cultures and different solutions.We will elaborate the case of Freiburg and discuss the other cities only briefl y.
Freiburg, Germany, 200.000 inhabitantsFreiburg was one of the fi rst German cities that acknowledged the problems of increasing car-use in the city. Although the city had been largely destroyed during the Second World War, it was decided to rebuild the city on the old pre-industrial model and not, like many other cities on the auto city model. The redeveloped inner city with narrow streets and cobblestones was not a very appropriate environment for the car. Since 1976 measures have been taken to restrict car-use and promote public transport and cycling.
Photo 11: Graz, share use where there are low car speeds and volumes ( T Daggers)
Between 1976 and 1992 the following measures have been taken:
Policies and plans in Freiburg:• Freiburg was redeveloped after WW-II according to the high-density mixed-use ancient Freiburg,
and also new urban developments are built in high-densities.• Almost the whole 1 square kilometre big city centre was made car-free or car-restricted, walking,
cycling and public transport (tram) provide very good access to the centre.• All newly constructed urban districts are designed as 30 km/hr zones.• An extensive light-rail network was developed. Busses were used as feeders to the light rail
stations as well as bicycles. Bicycle parking was provided at all stations to enable cycling to public transport.
• Between 1976 and 1987 the total length of the bicycle network was extended from 41 to 135 km.
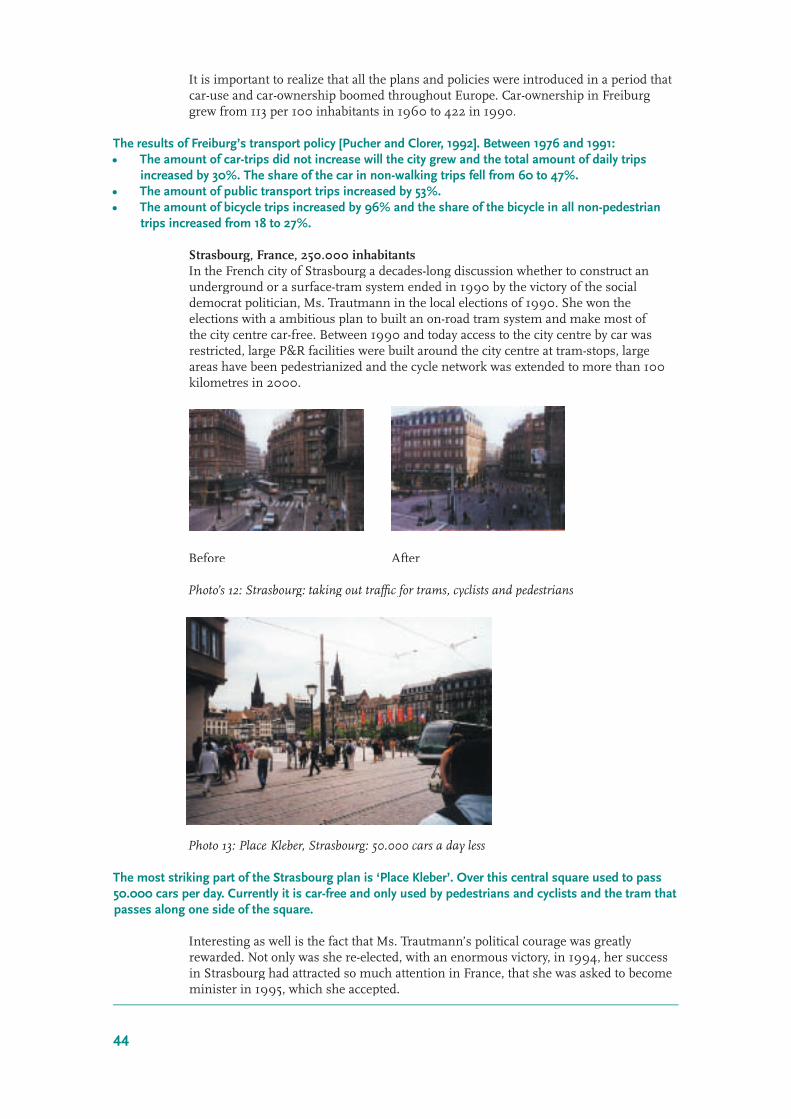
44 45
It is important to realize that all the plans and policies were introduced in a period that car-use and car-ownership boomed throughout Europe. Car-ownership in Freiburg grew from 113 per 100 inhabitants in 1960 to 422 in 1990.
The results of Freiburg’s transport policy [Pucher and Clorer, 1992]. Between 1976 and 1991:• The amount of car-trips did not increase will the city grew and the total amount of daily trips
increased by 30%. The share of the car in non-walking trips fell from 60 to 47%.• The amount of public transport trips increased by 53%.• The amount of bicycle trips increased by 96% and the share of the bicycle in all non-pedestrian
trips increased from 18 to 27%.
Strasbourg, France, 250.000 inhabitantsIn the French city of Strasbourg a decades-long discussion whether to construct an underground or a surface-tram system ended in 1990 by the victory of the social democrat politician, Ms. Trautmann in the local elections of 1990. She won the elections with a ambitious plan to built an on-road tram system and make most of the city centre car-free. Between 1990 and today access to the city centre by car was restricted, large P&R facilities were built around the city centre at tram-stops, large areas have been pedestrianized and the cycle network was extended to more than 100 kilometres in 2000.
Before After
Photo’s 12: Strasbourg: taking out traffi c for trams, cyclists and pedestrians
Photo 13: Place Kleber, Strasbourg: 50.000 cars a day less
The most striking part of the Strasbourg plan is ‘Place Kleber’. Over this central square used to pass 50.000 cars per day. Currently it is car-free and only used by pedestrians and cyclists and the tram that passes along one side of the square.
Interesting as well is the fact that Ms. Trautmann’s political courage was greatly rewarded. Not only was she re-elected, with an enormous victory, in 1994, her success in Strasbourg had attracted so much attention in France, that she was asked to become minister in 1995, which she accepted.

44 45
Curitiba, Brazil, 1.800.000 inhabitantsCuritiba is one of the most impressive examples of an integration of land-use and transport policies. Pedestrian streets in the city centre (established as early as the 1960’s) and 5 radial axis of public transport provide the masterplan for the city. On the structuring axis a high frequent bus-service on bus-only lanes provides high-quality public transport. The revolutionary land-use policy of Curitiba (see fi gure 7) only enabled high-rise, high-density buildings in the city-centre and on 4 of the axis. The result now is that 4 axis with 20+ story-high buildings mark the city’s skyline and formed a city in which a large part of the population lives and works literally on a public transport trunk-line, which resulted in high public-transport use and relatively low car-use.
Figure 6 : The land-use map of Curitiba and one of the strategic axes
The bus-system runs on a completely separate network, without any interference from car-traffi c. On the busiest axes, busses run every 90 seconds and in order to further increase the capacity, double-articulated busses are used that can carry as much as 270 passengers and special bus stations with an integrated ticketing system. Thy hyper modern Transmillenio bus system in Bogotá is based on the Curitiba system.
Apart from specifi c high-density and high-rise zones, also zones have been designated where building is strictly prohibited. This is along the rivers and in the many parks. These areas are used for recreation and have cycle tracks. The city is currently looking at connecting the different cycle routes to make an urban cycle network for daily use.

46 47
Like Catherine Trautmann in Strasbourg, Jaime Lerner, the visionary mayor of Curitiba was rewarded for his political courage. He was re-elected twice and became governor of the state of Paraná after that. Banning cars from city centre streets and establishing the fi rst pedestrian streets in Latin America and providing fi rst-class public transport (amongst other things) was very appreciated by the electorate.
3.8 Final remarks about cycling
The reader might comment that in the fore lying chapter there is little focus on cycling. This might seem the case, but what this chapter wants to stress more than anything else, is that a cycling policy can only be effective if it is integrated and supported by appropriate land use planning, urban planning and traffi c planning for other modes.
It is also important to understand that creating space for cycling goes at the expense of something else. In some cases this can be unused open space, but in most cases it is space allocated to pedestrians or motorised traffi c. Cities that have taken space from car traffi c rather than pedestrians or open space, are in general more successful with their cycling policy. Reallocating urban space from car-traffi c to cycling therefore is the most effective way to promote cycling.In the Urb-al project the city with the highest cycle use (33% of all trips), Utrecht, has, over the years, taken away signifi cant amounts of space from car traffi c and given it to pedestrians, cyclists and busses. There are large car-free areas and most roads in and around the city centre have only one or two lanes for car traffi c.Rio de Janeiro, another city in the Urb-al project, on the contrary, despite one of the most extensive bicycle networks in Latin America (183 kms), has only 2% of all trips by bicycle. The difference is that here, cycling is (up to now) not integrated in the traffi c planning, since it was the green department of the local authority that planned the cycle network, without help or involvement from the traffi c department. Here in general, cycle facilities were simply added to the urban space, leaving the infrastructure for car as was. Due to a lack of integration with planning for car traffi c, the bicycle infrastructure provided was not necessary where it was most needed, but often simply where space was available without interfering with car traffi c.The city of Bogotá showed that also in a large Latin American city, cycling policy can be effective, if a more integrated approach is taken. Here many cycle tracks were built by taking away car-parking space and included redesign of the whole road and adjacent public space. In less than 4 years cycling spiralled from just over 0.5% to 5% of all trips, with a bicycle track network that is about as long as the one in Rio de Janeiro.
Finally it is good to stress that in order to pursue an effective cycling policy, political courage is needed to take away space from the car. Caterine Trautmann in Strasbourg, Jaime Lerner in Curitiba, Enrique Peñalosa in Bogotá and many other mayors of local politicians all over the world had this courage and were, although all faced fi erce resistance in the beginning, highly rewarded by the electorate.
In many cities all over the world local politicians that had the courage to face initial resistance, take away car-space to give it to pedestrians, cyclists and public transport users, eventually have been greatly rewarded by the electorate for making their city a nicer place to live.
It is shown everywhere in the world that more roads only need to more cars and, eventually, yet more congestion. Cars are simply too ineffi cient with use of space to provide urban transport for more than just a limited part of urban trips.
Cycling is not THE solution, but can be an important part of the solution.

46 47
References
Bruhèze, A.A. de la, and Veraart, F.C.A., Stichting Historie der Techniek, Geschiedenis van fi etsgebruik en -beleid in Nederland (History of Bicycle Use and Bicycle Policy in the Netherlands), Dutch Ministry of Transport, -beleid in Nederland (History of Bicycle Use and Bicycle Policy in the Netherlands), Dutch Ministry of Transport, -beleid in NederlandThe Hague, 1999).
Dublin Transportation Offi ce, A Platform for Change, Strategy 2000-2016, Final Report, Dublin, November 2001.
The Institution of Highways and Transportation, Transport In The Urban Environment, Essex, 1997.
Newman, Peter and Jeffrey Kenworthy, Sustainability and Cities, Washington, D.C., 1999.
Pucher, J. and S. Clorer, Taming the Automobile in Germany. Transportation Quarterly 46 (3): 383-395,1992]Transportation Quarterly 46 (3): 383-395,1992]Transportation Quarterly 46
Rudlin, David and Nicholas Falk. Building the 21st Century Home, The Sustainable Urban Neighbourhood.
Architectural Press, Oxford, 1999.

48 49
4 Road safety and cycling
By: Jeroen Buis, I-ce, Interface For Cycling Expertise, The NetherlandsAuthors: J.Deffner, S.Alber, W.VogtNote: Parts of the forelying section are taken from or based upon a publication by Roelof Wittink, Managing Director of I-ce, Interface for Cycling Expertise, the Netherlands1, with reshuffl ing, editing and additional information by Jeroen Buis.
4.1.1 Vulnerable Road Users
Cyclists are vulnerable road users. Like pedestrians they are not protected by a steel body or safety belts. Therefore, when accidents occur, the outcome can be severe. It is therefore not surprising that the main reason that non-cyclists give for not cycling, is that they fi nd cycling too dangerous. Planning and designing for cycling in such a way that cycling becomes safer, is therefore one of the best ways to promote cycling. We will elaborate more on that later in this section, where we show that ‘planning for cyclists’ safety’ can only be successful if this is part of an integrated traffi c planning for all modes that emphasizes road safety. Unfortunately many local authorities try to reduce the number of accidents involving cyclists by restricting cycling on dangerous routes and roads without providing appropriate alternatives.
4.1.2 More Cycling, More Accidents?
Contrary to what is generally expected, more cycling in general goes together with a lower accident risk per kilometre cycled. The risk of being killed per kilometre of cycling per country is inversely proportional to the level of bicycle use, according to a European comparison in the WALCYNG-study between Great Britain, Italy, Austria, Norway, Switzerland, Finland, Germany, Sweden, Denmark and the Netherlands2.
Table 7 1
Kilometres cycled and cycle fatalities per kilometre cycled in European countries
Kilometres cycled per person per day Cycle fatalities per 100 million kilometres cycled
GREAT BRITAIN 0.1 6.0
ITALY 0.2 11.0
AUSTRIA 0.4 6.8
NORWAY 0.4 3.0
SWITZERLAND 0.5 3.7
FINLAND 0.7 5.0
GERMANY 0.8 3.6
SWEDEN 0.9 1.8
DENMARK 1.7 2.3
THE NETHERLANDS 3.0 1.6
Figure 1: Bicycle mileage per person per day and cyclists killed per kilometre in ten countries; Source: WALCYNG, Report 1. no.4, 1997, Lund University Sweden and Factum Austria

48 49
Data from different countries show that more cycling does not only correlate with fewer fatalities per kilometre cycled, but that an increase of cycling (in absolute numbers) over time can also coincide with a reduction of the total number of cyclist killed. This however is only possible when the increased bicycle use is part of an integrated strategy to make traffi c safer (see section 4.3).For example, the fi nal report of the Dutch Masterplan Bike[6] concludes that in 1998 the number of fatalities among cyclists was 54% lower than in 1980 in spite of an increase in both car use and bicycle use. In the concerned period the national car mileage increased by 50% and cycle mileage by 30%. The share of cycling as a percentage of all trips remained stable in this period at around 28% of all trips. Figure 2 shows
Figure 2: Development of Cycle Fatalities in the Netherlands (16 million inhabitants in 2003)Source: BIS-V (Policy Information System on Safety): AVV (Traffi c and Transport Centre of the Dutch Ministry of Traffi c and Waterways) – Verkeersongevallen (Traffi c accidents).
It is good to realise, that the total number of road fatalities also dropped signifi cantly between 1970 and 2000, from about 3000 in 1970 to just over a 1000 in 2000. This was largely due to focussed and successful road safety policies, with an emphasis on safe planning and road design. In Germany the total number of cyclist fatalities fell by 66% between 1975 and 1998 while the share of cycling in transport increased substantially from about 8% to12% of all trips[7].
Explanations
The fact that cycling is generally safer (per kilometre cycled) in countries and cities where more people cycle has two different explanations. The fi rst one is that ‘rare events are dangerous’. If there are very few cyclists, nobody expects cyclists, which makes it more dangerous to cycle. The second reason is that in countries (or cities) with high cycle usage, in general more has been done to make cycling safer and more comfortable.

50 51
That over the years the number of cycle trips can go up whilst accident numbers drop seems surprising. In most cases this is the effect of a dedicated policy and planning in which much attention is paid to cycling and road safety. In the Netherlands, for instance, transport and traffi c policy changed radically in the early 1970’s. Control of car use and promotion of public transport reached the national political agenda. Walking and cycling were subsequently valued more positively, car drivers have had to adapt their behaviour in residential areas and traffi c calming has spread. The planning and designs of the roads changed to an orientation towards a mix of traffi c modes. Policy started to include different modes of transport, motorised and non-motorised, in the planning system. Although policies were not yet very balanced, at least the sole focus on the needs of car traffi c disappeared.
4.1.3 Road safety and cycling in European and Latin American cities
There are enormous differences in the way cities in different parts of the world deal (or do not deal) with road safety. Some cities develop a separate road safety policy, with targets and statistics. In other cities there are hardly road accident data available.Also the approach can differ greatly. While some cities have a totally integrated road safety policy that focuses on all road users and the three groups of measured mentioned in section 4.1.2, other cities have some educational programs and police enforcement, but no policy, objectives or monitoring.
StatisticsIn order to develop an effective road safety policy with objectives and targets (see chapter 3), the availability of accident statistics is vital. If you don’t know how many accidents occur and where they occur, it is not possible to set up a focussed road safety policy and even less possible to determine whether it has been effective or not. Particularly in many Latin American cities there are few road accident data available, but even in many European cities road accident data are not detailed enough to establish and monitor an effective road safety policy. In the Urb-al project, several Latin-American cities had no road safety data at all and many cities (both in Latin-America and Europe) provided very general data only.Ideally, at least, the following statistics should be available:• The numbers of accidents with material damage only, the number of accidents with
injuries and the number of accidents with fatalities.• For each of the above three categories the number of car-users, cyclists, pedestrians
and public transport users involved. • The locations of each accident and the different road users involved in each accident.
Comparing road safety statisticsIt is, of course, diffi cult to compare the road safety records of different cities, if these cities don’t keep the same statistics. But even when statistics about, for instance, the number of cyclists killed per year are available, these can only be compared when the number of trips by bike (or the kilometres cycled by bicycle) per year are available. Because more kilometres cycled (e.g. in a bigger city) obviously increases the exposure to danger and the chance to get an accident.

50 51
Cyclists’ safety: a comparison Let’s compare two very different cities, in two different continents.
Amsterdam (Netherlands) Blumenau (Brazil)
Inhabitants 750.000 260.000
% of trips by bicycle 29% 3%
Cyclists killed per year 3-4 3-4
If we assume that that the total number of trips per person per day and the average lengths of trips in both cities are the same we can draw the conclusion that cycling is 30 times more dangerous than in Blumenau.Part of the explanation is that cycling is much better provided for in Amsterdam than in Blumenau, but a – probably even more important – reason is that Amsterdam is planned for low car speeds and Blumenau for high car speeds (see also table 10 in section 4.2.2).
4.1.4 Conclusions
In this section we showed that safer cycling and more cycling can go together very well. In cases where an integrated policy is developed and applied, in which not only facilities for cycling are provided, but where cycling and road safety are part of traffi c policies and planning that pay attention to all modes of transport, an increase in bicycle use can even coincide with an absolute drop in accident numbers. 4.2 Planning and designing for road safety for all modes

52 53
4.2 Planning and designing for road safety for all modes
4.2.1 Plans and policies for safer road traffi c and safer cycling
In section 4.1 we stated that it is possible to increase bicycle use and, at the same time, make cycling and traffi c in general safer. In this section we will explain, how this can be realised. The reader will appreciate that safer cycling can only be realised when the whole urban road and transport system is considered. This is often forgotten, though easy to understand: Cycling is not dangerous because people spontaneously fall off their bikes. Instead, cycling is dangerous because of confl icts with other road users, mainly motorised vehicles and sometimes other cyclists or pedestrians. So building cycle tracks will make some difference, but dealing with the interaction with cars will be even more important.
Before continuing, it is useful to introduce a framework to distinguish categorise the different measures to enhance road safety. The table underneath gives an overview[8]:
Category of measures Measures Examples of measures
Infrastructural measures
- Better road design - Construction of cycle tracks- etc.
- (see under ‘sustainable road safety’)
Legal and communicational measures
- Legislation- Regulation- Enforcement
- Education- Promotion
- Laws for drinking and driving- Speed limits- Police presence to enforce laws and regulations- For drivers or cyclists- Campaigns to raise awareness, e.g. to drive slower, use safety
belts, think about cyclists, etc.
Technological measures
- Vehicle improvements - Airbags, better brakes, better lighting, etc.
Table 9 provides a very useful framework to assess, and improve, road safety policies in cities.
One interesting observation can be made to start with: Different institutions and bodies are responsible for different part of the road safety policy. Legislation for instance is in general a national (and in the case of Europe also European) matter. Education and promotion can be done on a national and a local level. Vehicular improvements are a matter of the industry, but can be induced and enforced by (national) government. And fi nally physical measures are in general an issue dealt with by local government.This shows that an integrated road safety policy includes involvement of many different actors and stakeholders.
It is very important to realise that all three ‘approaches’ have their merits and are important. However, research and experiences in, among others, The Netherlands and Sweden have shown that in most cities, most is to be gained by physical measures and better transport planning and road design, particularly when the objective is to make walking and cycling safer.
Safer roads, not (just) more police
In many cases, particularly in developing countries, but also still in several European countries, the emphasis is on Legal and communicational measures and technological measures.

52 53
Here we are dealing with the somewhat naïve idea that more police or better education are all that is needed to make traffi c safer, whereas in most cases fl awed road design and a lack of understanding on how road design and road behaviour interact, are the real problems.
Many years of research on road safety, in among other countries Sweden and the Netherlands, have shown that road design in itself can infl uence the behaviour of road users, and consequently lead to more or less accidents, depending on the design. Enforcement of the speed limits, road safety campaigns and education are still considered important in these countries, now that technological improvements (safer cars, airbags, better brakes, etc.) have reached there limits and have proven to be of limited help to make traffi c safer for pedestrians and cyclists, the focus in these most advanced countries (considering road safety) is now on good road design. Underneath and in section 4.2.2 road safety policies that are derived from these new insights about road safety are explained.
New concepts in making roads and traffi c safer
When looking at the state of the art of road safety policies, there are two new concepts for improving road safety that are particularly interesting. The Dutch ‘Sustainable Road Safety’ and the Swedish ‘Zero Vision’ concept. Both concepts are part of national policies that aim to signifi cantly reduce the number of road accidents and road casualties. Where the Dutch aim to reduce the number of road fatalities by 50% and the number of hospitalised by 40% over a 25-year period (between 1986 and 2010), the fi nal objective over the Swedes is even more ambitious: No road fatalities and no-one seriously injured. These objectives are the more ambitious, since Holland and Sweden are among the top fi ve safest countries in the world in relation to traffi c exposure.
Even saferThe Netherlands and Sweden, two countries, that have road safety records that are among the best in the world and that have a high bicycle use (Netherlands: 27% of all trips, Sweden: 13% of all trips) have set targets for road safety to reduce the absolute number of traffi c fatalities by 50% or more.
The difference with more traditional approaches to road safety is that these concepts are based on prevention of accidents rather than the curative approach that is based on accident analysis. Prevention of accidents is possible by a focus on the cause of road safety problems. In both concepts a key element is to design a road structure and road infrastructure that is adapted to the limitations of human capacity and that provokes ‘safe’ behaviour. Streets and roads have a specifi c function and the design of the roads is adapted to this function so that improper use is prevented. The new road safety concepts distinguish three road categories according to their function to let traffi c fl ow or distribute or to fi nd access to destinations. Desirable behaviour will be evoked by a design in which potential confl icts fall within the expectations of the users. The design makes clear what behaviour is appropriate, which results in predictable behaviour. Speed and observation opportunities are the two key elements to keep behaviour under control.
In the next section, the concept of sustainable road safety is explained.
4.2.2 Designing for road safety
In section 4.2.1 we stated that there is strong relation between the Road safety considerations should be in the minds of designers and planners all the time when taking cyclists’ needs into account because:• Cyclists are vulnerable road users. Therefore fl awed road designs and facilities for
cyclists can have a particular serious effect on cyclists’ safety.

54 55
• Lack of (objective or perceived) road safety is the main deterrent for cycling in urban areas.[9]
• Road safety for cyclists cannot be created by just creating bicycle tracks and lanes, but is the outcome of the complete urban road transport system.
Sustainable road safety
In this section we will show how this can be translated into road (and cycle infrastructure) design that reduce the chance of accidents to a minimum: the above-mentioned sustainable road safety.
The task of the road designer and transportation planner is to plan and design the encounters between road users in such a way that the chance that these encounters result into accidents is as limited as possible.
The concept of ‘sustainable road safety’ can be translated into designing by applying the ‘three safety
principles’[10]:1. Functionality of the road network: Prevent unintended use of the infrastructure.2. Homogeneity of the traffi c fl ow: Avoid/reduce encounters with high speed and directional differences.3. Predictability of road user behaviour: Prevent uncertainty amongst road users.
Functionality of the network makes sure that the roads are used as intended by the road authorities. This relates to the kind of vehicles that use the same road and the kind of traffi c (through traffi c or local traffi c). This will make the traffi c situation easier to understand.
A homogeneous traffi c fl ow at sections and low speeds at junctions should be sought after so that speed differences will be reduced to a minimum. This reduces the chance that confl icts lead to accidents and makes possible accidents less severe.
Finally a predictable road layout will make it easier for road users to understand the traffi c situation, which increases the chance that confl icting road users can perform successful emergency manoeuvres.
The three concepts result into 12 requirements for a sustainable safe road network. For some requirements an example is provided:Requirements for a sustainable safe road network:
1. Build as big as possible environmental traffi c cells (low speed commercial or residential areas), with a design speed for cars of 30 kph. or less.
2. The part of trips over relatively unsafe roads should be as small as possible3. Make trips as short as possible ‡ Dismantle one-way systems and turning bans 4. The shortest route should be the safest route5. Make it easy for road users to fi nd their way, thus avoiding ‘searching’ behaviour ‡ Apply a clear structure and hierarchy of the road network ‡ Dismantle one-way systems and turning bans 6. Make road categories recognisable ‡ Design road network in such a way that through routes are easy to distinguish from local routes.7. Limit the amount of different road layouts and make them uniform8. Avoid/reduce confl icts with approaching traffi c ‡ Keep speeds low and physically separate fl ows on through roads 9. Avoid confl icts with crossing traffi c, particularly pedestrians and cyclists10. Separate different means of transport11. Reduce speeds at potential confl ict points12. Avoid obstacles along the carriageway.

54 55
From the above, there are a few measures that have a signifi cant positive effect on road safety for cycling. We will discuss three of those.
I. Reduce speeds, implement traffi c calming and environmental traffi c cells
Reducing speeds for motorised traffi c is the most effective way to make traffi c and cycling and walking safer. When speeds are low cycle lanes or tracks are not even needed. The table underneath shows how higher (car) speeds reduce the change for survival when a pedestrian is hit by a car. Although the statistics differ (it is not always easy to determine the speed at the time of the accident), the message is very clear: at speeds up to 30 km/h only a small percentage of accidents leads to fatalities, at 50 km/h half or less than half of all pedestrians survives. For cyclists very similar fi gures apply.
Speed
Metres needed to stop (reaction time + braking distance)
% pedestrians killed when hit with this speed
3VO – Save Traffi c, The Netherlands BIVV – Belgian Institute for Road Safety
30 km/h 15 m 10% 5%
50 km/h 33 m 75% 45%
65 km/h 53 m 85%
Lower speeds, less accidents: the case of GrazIn 1992 the Austrian City of Graz (240,000 inhabitants) wanted to promote walking and cycling and make traffi c safer, but didn’t have a budget for an extensive cycle track network and other physical measures to make the road network safer. Therefore the decision was made to implement a general speed limit of only 30 km/h for the whole city with the exception of the main through roads.The effect was a 23% reduction of traffi c accidents between 1192 and 1994. The number of accidents involving cyclists fell with 30% between 1992 and 1995 [Sammer, G., Universität für Bodenkultur, Velo-City Conference, Barcelona, 1997].
Photo 14: 30 km/h in Graz

56 57
Lower speed limits, shorter journey timesAn obvious objection against lower speed limits in urban areas (30 km/h or 40 km/h zones and roads) is the assumption that these will increase travel times by car signifi cantly. In our modern cities this is, however, hardly ever the case. In some cases lower speed limits will even increase the average speed and thus reduce average travel times. How can this be possible? There are two of reasons:1. Delays at traffi c lights and junctionsFor short journey times a high average speed is needed. The maximum speed attained during the journey is in general not important for the journey time. More important for the average speed is the time travelled at low speeds or queuing for traffi c lights. 2. CongestionMany cities are so congested that the legally allowed maximum speed can only be driven a very small part of the time. On top of this, the irregularities that acceleration and deceleration to 50 km/h give in the traffi c fl ow, reduces the capacity of the road, creates congestion and thus increases travel times.
II. Dismantle one-way road systems
One-way streets are unavoidable when there is only space for 1 traffi c lane. When 2 or more traffi c lanes are provided, however, there is no need to apply a one-way road. One-way systems and gyratory road systems, however have been very popular in the past, and unfortunately, are even implemented today. In the 1960’s many roads in European cities were (re)designed as one-way streets in order to make car-traffi c fl ow easier. This car-oriented road system has, over time proved to have many disadvantages, and very few advantages. For road safety, one-way road systems are disastrous. Therefore in many European countries cities dismantled most of their one-way systems in the 70’s, 80’s and 90’s. The main negative effects of multilane one-way road systems in cities are:1. They lead to detours for motorised traffi c and thus increase the traffi c and the
related air-pollution, as well as the exposure to traffi c, which increases the number of accidents (more kilometres)
2. They lead to detours for cyclists and thus provoke contra-fl ow-cycling (either on the road or on the footpath), which is very dangerous for cyclists and pedestrians.
3. More lanes in the same direction give a lower perception of speed. The effect is that speeds are (much) higher on multilane one-way streets, with a very negative effect on the road safety, particularly for cyclists and pedestrians.
4. One-way systems make the road system less predictable. For road users that cross a multilane one-way street at least some of the traffi c comes from the ‘wrong’ direction. The result is that ‘automatic’ behaviour is not functioning and can easily lead to accidents e.g. by looking in the wrong direction when crossing the road.

56 57
Photo 15: A 4-lane one-way road in the heart of the Brazilian city of Blumenau (260,000 inh.). High speeds and dangerous circumstances for cyclists are the obvious effect of such a road design. (J.Buis)
III. Make road categories recognisableThis is the basic principle of sustainable road safety. By implementing a clear road hierarchy with a design that makes it easy to understand on what kind of road you are driving or cycling, road users know what behaviour they can expect from other road users, and what kind of behaviour is expected from them. This makes the road safer. We will pay more attention to the interaction between road design and road behaviour in the next section.
Function, shape and useGood and safe road design, basically means that the road is designed in such a way that road users understand what behaviour is expected on a particular road, by just looking at the road layout. A wide road with many lanes, few side-roads and open surroundings, no pedestrian crossing facilities, etc. gives the user an impression that high speeds are allowed.
Photo 16: The wrong shape for the functionCity centre road in Dublin, Ireland, where 50 km/h is the speed limit. The form of the road however (a one-way road as well!!) provokes much higher speeds. (J.Buis)
58 59
On such a road, changing the layout is more effective to control speeds than sticking up 50 km/h signs. On the other end of the spectrum, on a very narrow road with chicanes, people will drive slower and also expect a lower speed limit.
Function, shape and use need to be balanced.
Function is the purpose of a road and the adjacent land use. Most roads have several functions. Function describes the purpose of an urban road or street. It defi nes whether a road/street is intended for “through” or “local” traffi c and if there is a need for car parking or for cycle facilities. The function of a street or road can only be determined when considering the whole urban road network, since diverting or taking out traffi c at one road will effect traffi c on other links in the urban road network. It is crucial not just to examine the existing function of a road or street, but particularly to plan and design the proposed future function for a road or street.
Possible functions of a road are:• Through route for car-traffi c• Access to shops, pubs, houses or companies• Main urban public transport route• Main cycle route• Leisure cycle route or walkway• Playground for children• Meeting place for people.• Shopping street• Etc.
The shape of a road or street is determined by the design of the infrastructure. It determines the physical allocation of space to different transport modes and deals with widths, curves and road layout. It also determines the allocation of priority (including traffi c signal control strategy). Shape includes:• Road width and the way road space is distributed between public transport, car
traffi c, cyclists and pedestrians,• The number of lanes of the road,• Horizontal and vertical alignment • Material use and colour (tarmac, concrete, pavement).
The use of the road is simply what road users use the road, how many busses, cars, cyclists, pedestrians use the road and how they use the road (at what speeds for instance). In other words use gives information about traffi c volumes, traffi c composition and road behaviour.
Function, Shape and Use of a road can directly be infl uenced as follows:
Change the function. For instance:• Provide other routes for transit or for public transport• Pedestrianize or make NMT-route only
Adjust the shape. For instance: • Reconstruct carriageway or reallocate the road space (e.g. narrow the lanes)• Build traffi c calming schemes• Construct cycle facilities or footpaths• Change curve radii

58 59
Infl uence the use. For instance:• Reduce speed limit and enforce it• Ban truck traffi c• Establish and enforce parking restrictions
Function > Shape > Use
In order to design the right shape and thus provoking desirable use it is important to determine the (desired) function(s) of a road fi rst. Therefore, for transport planners and traffi c engineers the natural order is:1. Determine the (desired) function(s) of all roads in the road network2. Then (re)design the roads according to their function3. And fi nally make sure that the roads or streets are used according to their function.
4.2.3 Road safety and subjective safety
When talking about road safety, it is important not just to mention actual road safety, based on accident fi gures, but also pay attention to subjective safety, because it is the sensation of (a lack of) road safety that infl uences cyclists’ behaviour, not the actual (lack of) road safety. This means that when designing for cycling we should not only design what has proven to be safe, but also what cyclists feel or think is safe.This is extremely important since the perceived lack of safety is the most important reason that people do not cycle. Ignoring what people think is safe means that many potential cyclists will not cycle even if objectively it is not dangerous to do so. This explains why cities with high levels of cycling either have a large network of segregated cycle tracks [11] or large car free areas [12] or low speed environments throughout large parts of the city [13].
The interesting thing is that subjective safety ultimately contributes to objective road safety because it will increase cycling and (when effective) reduce car-use. Higher levels of cycling make cyclists a more common mode of transport, and can make cycling safer as has been explained in section 4.1, where we explained that where there are many cyclists car drivers will be more aware of them. Road safety for cyclists should not be regarded on individual road links, but on the scale of a whole city and with a long-term vision.
4.2.4 Conclusions and fi nal observations
This section aimed to show that, to a large extent, road safety can be designed. Accidents do not just happen because of human errors by road users, but as much as that by the errors and mistakes (or lack of expertise) of road designers and planners. This section showed explained that, however complex road safety might be, there are three measures or approaches that always help to make traffi c and cycling safer.

60 61
4.3 Road safety education programs concerning cycling
4.3.1 Introduction
Road safety programs exist in various forms. They aim different target groups concerning age and the sort of being involved in road traffi c (pedestrians, cyclists, car drivers). The main target groups in road safety education and promotion are normally children and young people. They are – by the reason of their age, development and behaviour – the most endangered group in road traffi c. In the last years researchers and providers of education programs focused also older people as special target group as a result of demographic changes in Europe.
In general, intermodal training and specifi c education, focused on one certain way to move (e.g. how to cycle) supplement each other. The improvement of road safety of cyclists is highly connected with other traffi c modes like motorised transport. Road safety among bicycle users is not yet treated as independent task in training programs. In early years, children are taught about general risks and behaviour in road traffi c. Later are added bicycle training courses as specifi c element in road safety education. There exist on the one hand traffi c education programs taught in schools, on the other hand exist organisations which offer special courses and classes for road safety education. As a fl anking part the driving licence education can be mentioned.
4.3.2 Education in schools
In the following is described the German system. In many parts it refl ects the European system, especially concerning education in and before visiting school.
In kindergarten and in the fi rst two school years children learn fi rst basic knowledge how to act in road traffi c, which rules are dominant, which risks exist. The main topics are behaviour as pedestrian in road traffi c and safety on the way to school. In detail education includes
• Right behaviour at pedestrians crossings
• Crossing a road
• Behaviour of other participants (esp. car-drivers)
Important is also training of skills like attention, orientation, perception. It helps the children to reach a safe way of movements in traffi c. Additional exists the aim, to teach agility and activity in the early years that children are prepared to learn skills easily like cycling and other sportive ways of movement.
Although cycling is taught in most of the cases by the parents before children reach school-age, in Germany exist cycling lessons in school mainly in the third and fourth year of primary school (age 8-10). It is standard part of the children’s road safety education. In the federal states exist different detailed frameworks. The idea is to have already most of the children to be safe and common with the bike. The bicycle lessons exist of two parts
• Theoretical part: Teaching of the rules and regulations of the STVO (German traffi c regulations), meaning of traffi c signs and markings, right of way rules, usage of pavements etc. Further more is taught about road safety of the own bicycle, turn offs, passing etc.
• Practical part: Basic part is the secure handling of the bicycle in critical situations. Exercises on a traffi c exercise yard/school yard imitate real situations in daily traffi c.

60 61
The teachers of this youth traffi c schools are often policemen or private institutions (Verkehrswacht). The teaching yards are places where a parcour for exercises is offered, with traffi c signs, lights and markings.
These bicycle lessons conclude with an exam (theoretical and practical) in the forth class. This “exam” should rather be a prize for children for having taken part than a strict control of success. Some trainings fi nish with a ride in real traffi c accompanied by teachers, parents and policemen.
(Source: BMVBW, 1998; Heinrich, 1993)
A critical point is the fact that in the ongoing school years traffi c education especially in the fi eld of cycling is not continued, although in this age appear high accumulations in accidents (Source: Funk et al., 2002, S.27).
Partially exist cross thematic projects which are connected with the bicycle education. But in majority the real connection of the topics is very vague. In some federal states of the federal republic of Germany the bicycle education is continued in classes 5 to 7 (e.g. Hamburg) (Source: Heinrich, 1993, S. 176).
The traffi c education has developed from a specialised safety education in the seventies to a more comprehensive one in the nineties. Training children towards health prevention, social behaviour and protection of the environment are additional aspects. Nevertheless is to recognise that mobility education does not continue in youth age.
Campaigns for road safety can therefore as well be part of campaigns which have originally different goals e.g. health or environmental education (see below)
4.3.3 Education apart from school
The fi rst traffi c education a child gets is usually done by the parents. So it is as well the fi rst traffi c education apart from school. Therefore parents are trained in multiplier courses (see below). The teaching of cycling normally takes place in a protected area, e.g. near the own house where there is no or very little traffi c.
Programs outside school activities are offered and or initiated mainly by private associations (Deutsche Verkehrswacht, ADFC) and federal institutions (Ministries, Administrations, local authorities). The fi nancial funding is done by federal or private support.
It is very diffi cult to draw an exact border between education for children in schools and outside schools. On the one hand private associations organise their activities often nearby school festivals, on the other hand they often support offi cial school activities like the bicycle education.
(1) There exist some criteria to differentiate the issues of road traffi c education:
• Active and interactive measures (participants are active themselves)
• Passive education (through media)
• Education of multipliers, e.g. parents, which learn about to teach their kids the “correct” behaviour in traffi c
• Technical Measures (construction, traffi c planning)

62 63
Active measures are for instance bicycle tournaments, classes for bicycle safety, brake tests, interactive games (real and/or computer games).
Passive education takes place through books and other print material (Source: Funk et al., 2002). Most of the material is existing in forms like brochures or education books for children. Additional brochures are available in the internet. Films on television or for school education are a further medium to reach target groups. Other media, especially for smaller children, is any kind of theatre or role play. Another way of learning could be toys to learn about dangers and rules. Toys could be also a tool to motivate children to act and move which leads to a better control of the bicycle.
Training of multipliers can take place in direct contact (face-to-face) between teacher and a person who starts to become a multiplier. Often brochures, info material etc. are used to transfer knowledge. The aim of those programs is both: teaching how to teach and create a certain sensitivity of adults towards childrens’ behaviour. Adults are taught to show more responsibility for children and other ‘weak’ road users. Accepting speed limits, driving in a defensive and careful way or even being engaged for further traffi c calming could be some good results as far as the parents are concerned.
(2) Neumann-Opitz (1996) uses other criteria to differentiate education programs. He separates programs
• to learn the use of a transport mode
• with narrow connection to school
• for training of multipliers
• active programs and contests (festivals, safety days etc.)
Both criteria (1) and (2) contain similar aspects and could be used as a frame when campaigns or measures are planned.
Picture: from the “small book for cyclists”The pictures show an example of traffi c education work organised from the ADFC (main German cyclist user group). The small booklet with the title “Small Book for Cyclists” includes the explanation of traffi c rules, tips to maintain the bicycle and how to organise a cycle tour. The booklet is published since several years and focuses children in primary school.
62 63
4.3.4 New ways of road safety education programs
The list at the end of chapter 4.3.3 (how to segregate programs (1+2)) is possibly a help to adopt it for other target groups. In future it is necessary to focus other groups and to focus more directly bicycle users. Existing programmes for road safety with special focus on cycling aim mainly – also in the part outside schools – children as addressee. This is true again for training of multipliers, they also aim children.
Training for other target groups, like• seniors as cyclists,• adults in general,• car drivers in contact with cyclists etc.• immigrants
are not regularly offered. Only few programs focus cyclists in all ages.
Excurse – socio-ethnic groups
Immigrants should be another special target group. In Germany the percentage of casualties among that group (especially children) is higher than their percentage of the population. Problems with the language, socio-cultural hindrances and lower educational standards seem to be the main reasons. Immigrants (the parents and the children as well) cannot be reached that easily by the training courses usually offered. Here are needed solutions, that connect integration aims (not to exclude this target group explicitly) but to announce this target group in a special way to make sure that they (parents and children) can take part in traffi c education as well.(Source: Schnüll et al., 1999)
In general all cycling user groups, like the ADFC, offer trainings how to cycle in cities, how to use traffi c rules, how to repair and maintain bicycles. Workshops or tours are sometimes focused on children but also adults or special groups, like senior cyclists. This organisations take over an important role in road safety education. But often effectiveness and personal capacity is a problem, so they can not offer regular, exhaustive seminars or training programmes.
Nevertheless already exist some examples which show that partners (like health assurances or organisations for elderly people) can be won for new issues. One example for such courses is from Switzerland - presented here in short form.
The Mobility Seminars in Bern (CH) exist of three modules. They are not only focused on cycling but it is included in two of the modules. The subtitle is “be mobile, stay mobile – the use of modern transport modes” and aims to reach mainly older people:
Module 1: Mobility and Health
Objectives and contents: encourage mobility although novelties in transport systems sometimes reject initiative à use of ticket machines, touch screen displays, understanding of line maps of public transport, possibilities of cycling and walking and the connection with health aspects ( to move for health reasons).
Duration: 1 Day
Cooperation: ProSenectute, mobility consultancy
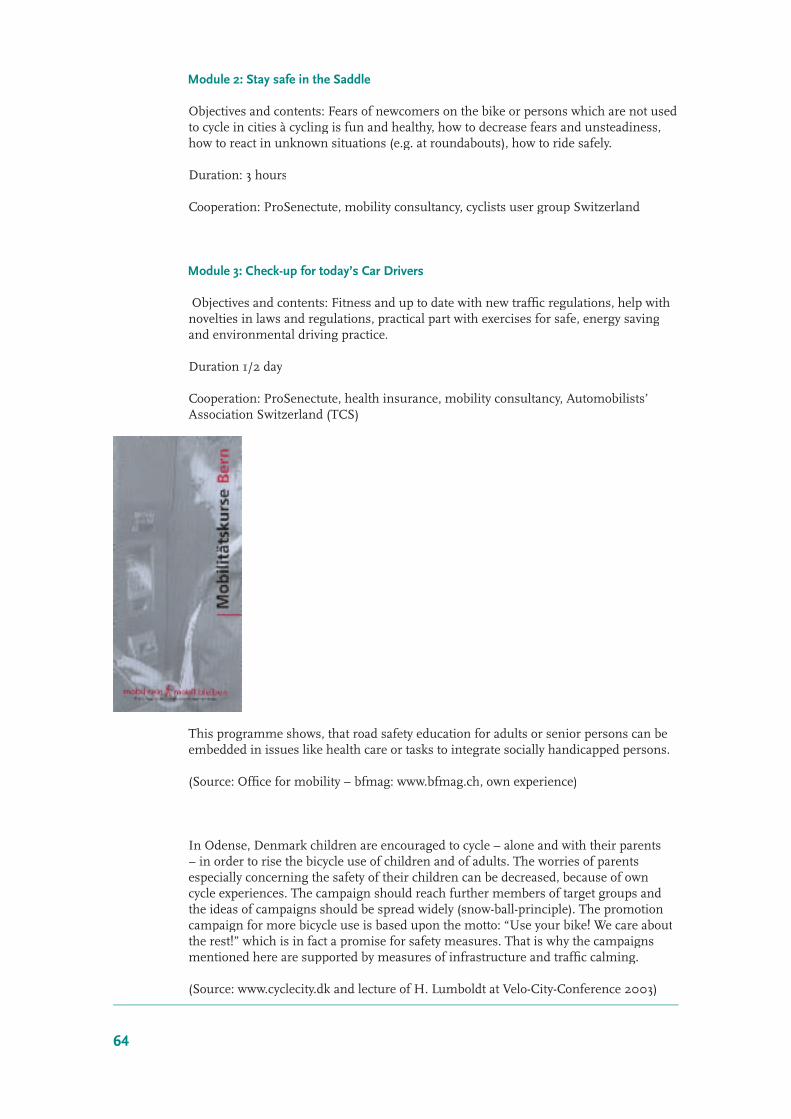
64 65
Module 2: Stay safe in the Saddle
Objectives and contents: Fears of newcomers on the bike or persons which are not used to cycle in cities à cycling is fun and healthy, how to decrease fears and unsteadiness, how to react in unknown situations (e.g. at roundabouts), how to ride safely.
Duration: 3 hours
Cooperation: ProSenectute, mobility consultancy, cyclists user group Switzerland
Module 3: Check-up for today’s Car Drivers
Objectives and contents: Fitness and up to date with new traffi c regulations, help with novelties in laws and regulations, practical part with exercises for safe, energy saving and environmental driving practice.
Duration 1/2 day
Cooperation: ProSenectute, health insurance, mobility consultancy, Automobilists’ Association Switzerland (TCS)
This programme shows, that road safety education for adults or senior persons can be embedded in issues like health care or tasks to integrate socially handicapped persons.
(Source: Offi ce for mobility – bfmag: www.bfmag.ch, own experience)
In Odense, Denmark children are encouraged to cycle – alone and with their parents – in order to rise the bicycle use of children and of adults. The worries of parents especially concerning the safety of their children can be decreased, because of own cycle experiences. The campaign should reach further members of target groups and the ideas of campaigns should be spread widely (snow-ball-principle). The promotion campaign for more bicycle use is based upon the motto: “Use your bike! We care about the rest!” which is in fact a promise for safety measures. That is why the campaigns mentioned here are supported by measures of infrastructure and traffi c calming.
(Source: www.cyclecity.dk and lecture of H. Lumboldt at Velo-City-Conference 2003)
64 65
Conclusions
School education concerning traffi c means has become more sophisticated over the years (like mentioned above). Themes like health, environment or social behaviour are also part of traffi c education.
That is why road safety can also be part of more general promotion programs. The aim to get more people cycling can be linked to road safety campaigns.
More examples, literature and selected web links in the Appendix “Education Programs”
General Sources:Schnüll, R.; Handke, N.; Mennicken, C.: Verbesserung der Verkehrssicherheit für Kinder in niedersächsischen Kommunen, Veröffentlichungen des Instituts für Verkehrswirtschaft, Straßenwesen und Städtebau Universität Hannover, Hannover, 1999

66 67
Photo 17: Polmira cycle campaign (T.Daggers)

66 67
5 Objectives of cycling policies
Authors: J.Deffner, S.Alber, W.Vogt
5.1 Introduction and overview
Turning advantages of cycling into strategies of cycling policiesPlanning without objectives does not exist. Planning is rather always upcoming because there is a insuffi cient status-quo (e.g. in urban traffi c: congestions, air pollution, noise). And this status-quo should be developed in a better debit status (better living quality, better mobility chances for inhabitants). Objectives and defi cits stipulate each other.
The defi nition of objectives has therefore a very important role:(1) Objectives give planning tasks structure. The give a frame to status-quo analysis
and are important for transparency of the planning process – for experts and laymen (which defi cit should be solved with which aim?)
(2) Objectives, strategies and measures (to reach the objectives) are directly connected as only measures make sense, which are conform to the objectives.
(3) Objectives are fundamental in terms of evaluation, because only defi ned objectives allow to evaluate the success of measures or to compare the advantages of different strategies.
(4) Objectives are fundamental as common base for planners, politicians and citizens.
Objectives for bicycle policies of a city only make sense, if they fi t – as well as the other transport modes – to a meta level of objectives of urban development, land use and transport planning. Specifi cally clear this gets in the (European) discussion of the city of short trips as an answer to the ineffi cient and not environmental friendly settlement and land use development of the last decades. Short trips promote the use of sustainable transport modes like walking and cycling. And short trips to stations of a high qualifi ed public transport system with comfortable services, moderate tariffs are a basis to use the bike in addition to public transport also for longer distances.
Overview on objectivesObjectives of bicycle promotion are focused on different scopes: Global or national objectives, regional and local. National objectives have been specifi ed in the last few years in the Netherlands (Masterplan Fiets), in Denmark, Great Britain (National cycling strategy) and in Germany (National bicycle plan, NRVP).
The example for an objective-strategy system in the following fi gure (superior part of the fi gure) was developed for a sustainable urban or regional transport development not only focussing bicycle policy (Source: Beckmann, K: Steps in transport planning, FGSV 2001). It shows the different levels of objectives and the important difference between objectives, strategies and measures, which has to be made. The bottom part of the fi gure shows examples of strategies and measures in terms of cycling, which can be allocated to the main objective “improve environmental quality” and the specifi ed main objective of “compatible (ecological) handling of traffi c”.
ExplanationsOn a general perspective all single objectives can be summarized in the motto “Improve living quality”The naming of such a general objective or vision infl uences the direction of main objectives, e.g. improving environmental quality or improving economical power. In the level of main objectives the general vision is divided in more specifi c objectives.

68 69
For more operationalization the specifi ed main objectives are needed. Here is already visible, that some objectives focus cycling promotion directly. Examples could be reducing air pollution or improve the cities’ accessibility. It is obvious, that promoting cycling does not only support the main objective of improving environmental quality, but improving economical power as well (e.g. “accessability”).The defi nition of main strategies concerns the division into different tasks. Strategies are bundles of measures to handle the objectives easily. In the example this is done by the division into ‘traffi c avoidance’ and ‘supporting ecological modes’ and ‘compatible handling’. In the level of specifi ed strategies, which are a step in between, the specifi c topics concerning cycling policies are subsumed. The list is not closed, it shows only examples (more examples in the following) and describes the level of specifi ed strategies by the example of cycling affairs. The last step is the description of measures.
Figure: Integration of bicycle objectives in an objective-strategies-system in sustainable urban or regional transport development
Environmentally focused and more tangible objectives could be:• Reduce climate relevant pollutants carbon dioxide, carbon, carbon monoxide,
nitrogen dioxide resulting from traffi c ( -xy %) in the next 10 years (e.g.)• Decrease pollution caused by motorized traffi c in general• Reduce traffi c noise• Reduce land-use and soil sealing caused by road construction• Reduce barrier effects of roads and railways• Decrease fuel consumption
Quantifi cation of objectivesSometimes it can be useful to formulate abstract objectives more tangible and to start special campaigns, e.g. to promote safety of cyclists (“minus 11% accidents with cyclists until 2011”) or to promote safety of special bicycle user groups like school children (“safer way to school”) or to promote higher bicycle use in a municipality (“doubling cyclists in mode share of the city until 2015”).The British National Cycling Strategy for
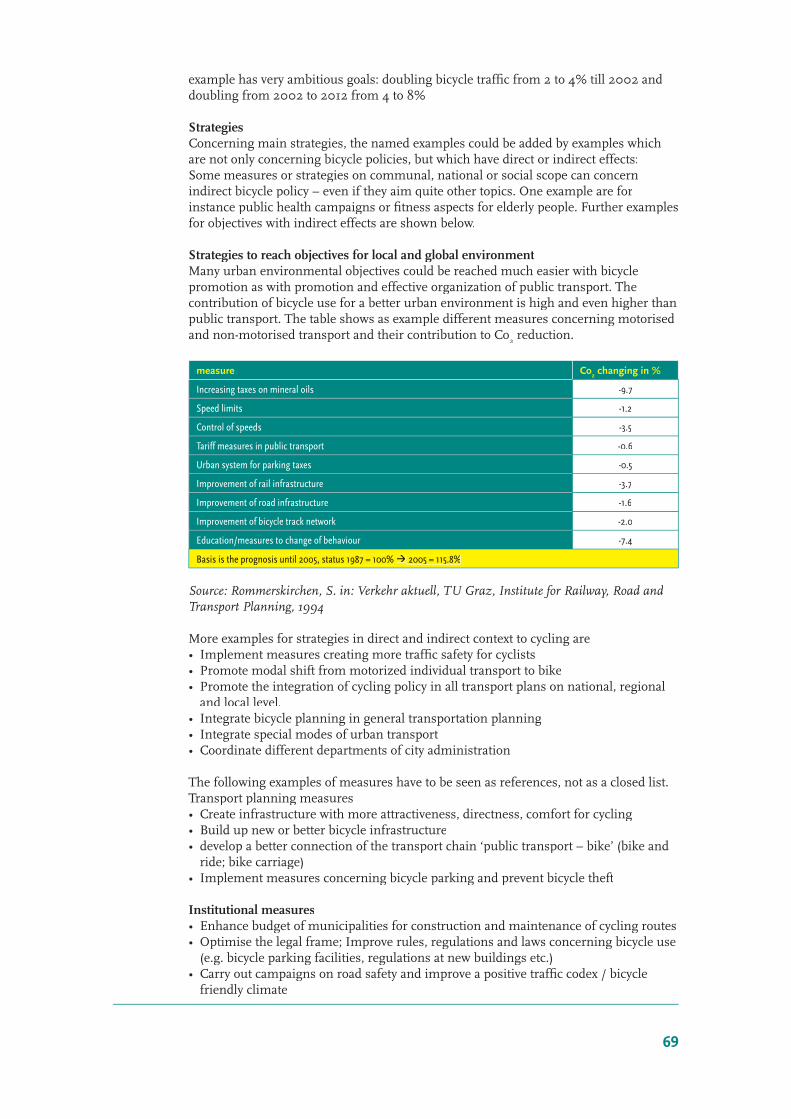
68 69
example has very ambitious goals: doubling bicycle traffi c from 2 to 4% till 2002 and doubling from 2002 to 2012 from 4 to 8%
StrategiesConcerning main strategies, the named examples could be added by examples which are not only concerning bicycle policies, but which have direct or indirect effects:Some measures or strategies on communal, national or social scope can concern indirect bicycle policy – even if they aim quite other topics. One example are for instance public health campaigns or fi tness aspects for elderly people. Further examples for objectives with indirect effects are shown below.
Strategies to reach objectives for local and global environmentMany urban environmental objectives could be reached much easier with bicycle promotion as with promotion and effective organization of public transport. The contribution of bicycle use for a better urban environment is high and even higher than public transport. The table shows as example different measures concerning motorised and non-motorised transport and their contribution to Co
2 reduction.
measure Co2 changing in %
Increasing taxes on mineral oils -9.7
Speed limits -1.2
Control of speeds -3.5
Tariff measures in public transport -0.6
Urban system for parking taxes -0.5
Improvement of rail infrastructure -3.7
Improvement of road infrastructure -1.6
Improvement of bicycle track network -2.0
Education/measures to change of behaviour -7.4
Basis is the prognosis until 2005, status 1987 = 100% ‡ 2005 = 115.8%
Source: Rommerskirchen, S. in: Verkehr aktuell, TU Graz, Institute for Railway, Road and Transport Planning, 1994
More examples for strategies in direct and indirect context to cycling are • Implement measures creating more traffi c safety for cyclists• Promote modal shift from motorized individual transport to bike• Promote the integration of cycling policy in all transport plans on national, regional
and local level.• Integrate bicycle planning in general transportation planning • Integrate special modes of urban transport• Coordinate different departments of city administration
The following examples of measures have to be seen as references, not as a closed list.Transport planning measures• Create infrastructure with more attractiveness, directness, comfort for cycling• Build up new or better bicycle infrastructure• develop a better connection of the transport chain ‘public transport – bike’ (bike and
ride; bike carriage)• Implement measures concerning bicycle parking and prevent bicycle theft
Institutional measures• Enhance budget of municipalities for construction and maintenance of cycling routes• Optimise the legal frame; Improve rules, regulations and laws concerning bicycle use
(e.g. bicycle parking facilities, regulations at new buildings etc.)• Carry out campaigns on road safety and improve a positive traffi c codex / bicycle
friendly climate

70 71
• Monitor realization of a bicycle plan and report progress of cycling promotion• Spend money economically effi cient. Basic improvements could often be realized
with cheap solutions• Implement studies and scientifi c projects, pilot projects.• Invent and describe state-of-the-art, national and international• Strengthen NGO institutionally• Create platform for communication and dialogue with citizens.
(Urban) planning measures• Coordinate strategies for the realization of a general bicycle plan within a working
group.• Improve knowledge base on cycling topic in administration and planning
departments• Promote short distances possible through mixed land use planning / urban zone
plans
Measures in a socio-cultural context• Increase mobility chances of all citizens and all social groups• Improve possibilities for all social groups for bicycle use in leisure and for sports• mprove quality of public space
Push- and Pull-measures – Confl icts in planning
Sometimes objectives contradict themselves and with other aspects of transportation or urban planning. Pushing bicycle use means in certain cases also to pull car use or motorised traffi c in general. Cities often try to follow a double strategy of objectives and measures. Promoting all modes of transport in every case, in all areas and during the same period is not possible and the aimed effects hardly can develop. So in general, one objective of pushing measures has to be the consciousness about how to reach the general objective most effi ciently.
Confl icts can not completely be avoided. Important is the combination of push and pull measures. The reason for that is often in the different emphasis decision makers put on objectives. An example for contradicting objectives could be: The federal tax system in Germany stipulated for many years, that only commuting by car could be reimbursed by a certain amount of money per kilometre. Cycling and commuting by public transport was not credited in this sense – low incentives to commute not by car.
A further example could be the problem of scarce place in inner cities. If political or technical priorities predict, that motorised traffi c has to get all lanes on a city road, it is clear, that perhaps the postulated objective to improve cycling in the city is a contradicting to that measure. The fi gure underneath shows the different needs of space of fi ve urban transport modes:
5.2 Increasing bicycle use
Daily use of the bicycle is good for health and physical development. It strengthens condition and motion. Most of the people in western countries move to few and suffer from backache and arthritis. Regular cycling can keep people of all ages in good shape. Cycling is a very dynamic sort of motion, approximately 1/6 to 2/6 of all muscles of the body are moved during cycling. Only a task of 3 km per day can prevent many diseases like cardiac insuffi ciency, overweight, arthritis etc. and strengthen the immune system. Other recommendations say, that a person should be active for at least 30 minutes on fi ve days a week. There exist already studies about the decreasing of absence days at enterprises which promote the use of bicycle for the way to work.
Especially for development of children and young people the bicycle has an important role. It is the fi rst individual transport mode. Besides learning physical motion cycling helps to strengthen independent experiences and the increasing of activity areas. Children learn for the fi rst time to act in road traffi c; they are told the regulations and rules in traffi c and they gain fi rst experiences in social competency. Within the speed rules in traffi c and they gain fi rst experiences in social competency. Within the speed

70 71
of cycling it is possible (for children and adults) to perceive the surrounding: people, animals, houses, forests, meadows … After all, the growing independency can help to avoid, that parents have to play taxi (soccer mum’s) for their children’s leisure activities even when they live in good social surroundings.
Cycling is - beside walking - the most environmental-friendly way to move. The supplement from car trips to cycling reduces air pollutants like ozone pre-cursors nitrogen-oxides and VOCs (votatile organic compounds). It also reduces particles and carbon dioxide (CO
2) and contributes to save oil wells. A global objective is the
reduction of greenhouse gases. An important factor is carbon dioxide. It is mainly polluted by motorised traffi c. The global reduction aims can only be realized by many small steps, for instance by a smaller part of motorised traffi c in towns.Especially in Latin America CO2 plays an important role: Many older cars without any emission cleaning and unfi ltered pollutants and heavy metals affect man and environment. For example if it would be possible to use the bike instead of the car for nearly half of the short trips done by car, the CO2 emissions could be reduced on the half of what would be possible through a speed limit from 120 km/h to 100 km/h on highways. The needed resources for bicycle production and disposal are also very low. Bicycle use can be seen as a circle with negligible negative effects.Noise pollution is not only an environmental problem but mainly a health problem. Inhabitants of cities are overstressed with noise. This is not only uncomfortable but unhealthy. Nerves, condition and ears suffer from permanent noise and lead to illnesses like stress illness, heart insuffi ciency, problems while sleeping. Noise has become a great problem of all cities over the world. High bicycle use could help to reduce noise from traffi c in housing and commercial areas. The development of more healthy living conditions is an objective. For example: Road noise is the main harassing noise for nearly 50% of the German inhabitants (more than 30% are living at places where >60 dB(A) are usual) These persons stay everyday in loud areas. 17% feel actually strongly harassed by road traffi c noise. In other western countries this numbers are similar.
Grade of harassing [in %]
Sound source Extremely harassed
and disturbed Strongly harassed
and disturbedMedium harassed
and disturbed Little harassed and
disturbed Not at all harassed
and disturbed
Road traffi c 5 12 20 28 35
Neighbours 2 4 11 23 60
Air traffi c 2 5 9 21 63
Industry and trade 1 3 8 15 73
Rail traffi c 1 4 7 11 77
Noise harassing of German inhabitants sorted in sound sources in 2002, Source: Umweltbundesamt, 2003: www.env-it.de/umweltdaten/)
Other positive effects of cycling are e.g. that cycling tracks nor divide cities neither landscape like wide highways or railways do. Bicycles need minimum space, compared with car, busses etc.
general sources: - European Commission: Vorwärts im Sattel, 1999- Kerrison, S. Macfarlane, A.: Offi cial health statistics: an unoffi cial guide, London, Arnold, 2000- Lawor, D.A., Ness, A. et al.: The challenges of evaluating environmental interventions to increase population
levels of physical activity: the case of the UK National cycle Network. J Epidemiol Community Health, 2003, 57, 96-101
- Rutten, A. et al.: self reported physical activity, public health, and perceived environment: results from a comparative European study. J Epidemiol Community Health, 2001; 55, 139-146
- Umweltbundesamt (German Offi ce for Environmental Affairs), www.uba.de
72 73
5.3 Increase road safety for cyclists
Besides pedestrians, cyclists are the most vulnerable participants in road traffi c. Special subgroups are endangered more than others, e.g. children, by chance drivers etc. Accidents with cyclists involved are a problem, because• Cyclists have no crumple zone but travel with relatively high speeds• Cyclists are sometimes not easy to see: they appear suddenly from places, where car
drivers do not expect them.• Some cyclists tend to behave undisciplined in road traffi c: e.g. do not consider traffi c
regulations, have no lights, react very spontaneously or are forced to do so, because in many cases do not exist adequate regulations, infrastructure etc.
The examples show, that road safety should have a special focus within a bicycle policy. Therefore it is necessary to have insight in statistics on accidents and injuries to recognise the importance of promotion in this fi eld.
Studies show that there is a connection between modal share of cyclists within all trips in a city and the number of accidents, expressed through the parameter ‘risks of accidents’ (injured persons/per 10.000 inhabitants/per year). Higher amounts in kilometres travelled by cyclists let rise the probability of accidents of cyclists and also the number of injured cyclists. Thus the share of cyclists in all injured persons in traffi c rises. This connections are clear in all studies about that topic (see sources to this chapter).If the results are analysed in detail it gets visible, that the individual risk of having an accident decreases when there is more bicycle traffi c. More bicycle traffi c means less risk for every single cyclist.Important is the fact that the total number of accidents is rising when kilometres travelled by cyclists rise. The absolute numbers (e.g. injured per year) and the related numbers (injured per 1 Mio. bicycle-kilometres) have to be looked at in a different way. In the second case an individual risk is expressed, which decreases when there is more bicycle traffi c. In the fi rst case the number of injured rises with rising bicycle traffi c. A rising absolute number of injured and deaths must be considered negative in an economic sense.Special infrastructure measures to improve road safety are not respected in this context. But in many cases the infrastructure is improved when the share of cyclists is rising. It could be possible that the individual risk decreases more, when accompanying measures are provided.
A study in the county of North-Rhine Westphalia (NRW), Germany analysed the development of accidents (injured/10.000 inhabitants/year) in general and especially in cities which are members of the project “bicycle friendly cities in NRW”. In general the number of accidents decreased in the period from 1986 to 1997. This is fi rstly infl uenced by the far reaching improvements for road safety for car drivers (airbag, construction of vehicles etc.) But there have been no such relevant improvements for cyclists and pedestrians. This trend is valid for the cities in the bicycle-promotion programme in NRW. In the beginning of the realisation of bicycle promotion measures the number of accidents increased but in the following years, the amount of accidents follows again the general development.

72 73
Schematic graph for the trend in amount of accidents in the period from 1986 to 1997Above line: all traffi c participants; underneath line: cyclists, left scale: amount of accidents (injured /1000 inhabitants per year)Source: underlying data: Ministerium für Verkehr NRW, 2000, presentation S. Alber
In addition it can be noticed, that increasing bicycle traffi c itself could be the reason for decreasing accidents (with cyclists). The reason may be that common events are more save than rare events. The probability to meet cyclists is a reason for car drivers to give them more attention, especially at crossings, or junctions. If cyclists are seen more often in road traffi c, they are taken into account seriously. Drivers of motorised vehicles feel sometimes surprised by cyclists, if they are not used to them, especially in critical situations. This “surprising moment” can be reduced. Possibly acceptance and fair coexistence on the roads can be promoted by higher bicycle traffi c.
Graph: connection between share of cyclists and amount of accidents (ref. kilometres travelled) Left: injured cyclists/1mio. Bicycle-km; right: share of cyclists (% of all trips) Source: Ministerium für Verkehr NRW, 2000, presentation S. Alber
74 75
Número de accidentes [Heridos/10000 habitantes y año]
05 10 15 20
The result indicates a higher share of cyclists mainly means an absolute increase of injured and deaths among cyclists in town but
• the individual risk (risk per km gone by bike) is decreasing with increasing share of cyclists
• the absolute numbers of accidents are not accelerating in the same dimension like the share of bicycle traffi c
• it is obligatory to watch parallel the general development of accidents in road traffi c• it is not possible to deduct a direct infl uence of quality of infrastructure on amount of
accidents because it is very complex to assess the infrastructure. Nevertheless exists an intuitive infl uence.
• Indirect effects of other traffi c policies can infl uence amounts of accidents: Measures like traffi c calming, zone 30 etc. can improve road safety in general and decrease the risks for cyclists in detail.
Other effects of bicycle promotion policy may concern the severity of injuries. Generally spoken the severity of a bicycle accident is not so hard than accidents of pedestrians. Bicycle promotion has the result to effect the severity of injuries: Especially the cases of strongly injured persons is decreasing. Not so obvious is this fact at accidents with low injured persons. (Source: Ministerium für Wirtschaft und Mittelstand, Energie und Verkehr NRW, 2000)In Germany the number of killed and seriously injured cyclists has decreased from 1991 to 2000 (-29%; -12%) although the general number of injured cyclists has increased. (Source: BMVBW: Nationaler Radverkehrsplan 2002-2012, 2002). This shows, that the improvement of cycling situation in general affects directly the sort of injuries of cyclists. But it has to be known, that the estimated number of unknown cases is very high, especially within smaller accidents with no injuries. This infl uences statistics signifi cantly.British studies point out, that the increasing number of accidents with growing share of cyclists is not at all dramatic, compared to the number of deaths or invalids caused by lack of motion (Source Brit. Medical Association, lecture of Nick Cavill on Velocity Conference 2003)
general sources:• Alrutz, 1989• Becker et al. 1992• Cerwenka et al., 1994• Ekman, L.: on the treatment of fl ow in traffi c safety analysis: nonparametric approach
applied to vulnerable road users. Dep. Of traffi c planning and engineering, University of Lund, Bulletin 136, Lund, Sweden, 1996
• Haas-Klau et al., 1992• Leden, L.; Garder, P.; Pulkkinen, U.: An expert judgement model applied to estimate
the safety effect of bicycle facility, in: accident analysis and prevention 2000, H. 32, S. 589-599
• Ministerium für Wirtschaft und Mittelstand, Energie und Verkehr NRW, 2000• Schnüll et al., 1992• Wardlaw, M.: Assessing the actual risks faced by cyclists, in: Traffi c engineering and
control, Nr. 11, 2002, S. 420-424
5.4 Increase social safety in urban areas
As long term development an increasing bicycle traffi c could have a positive effect on urban places. It can play a positive role to win back the multifunctional character of many urban streets. In city centres the streets and places have been redesigned in many cases in a more usable way for cars. They lost their urban functions. Destruction of public spaces led to low quality and the burden from noise and air pollution. Beside highways and great city corridors urban neighbourhoods have been divided or destructed and the possibilities for spontaneous and independent moving among this

74 75
networks is diffi cult und not attractive, especially as non-motorised participant. In detail are especially affected:• Places for recreation, street life, playgrounds and to have social community• Urban market places and streets in neighbourhoods• Bridges and underpasses for pedestrians and/or cyclists• Pavements• (historic) city centres, places and sub centres• places at railway and bus stations, where many people have to stay, wait, shop etc.
Recent studies show that natural, built and social environment plays an important role for cyclists in terms of choosing a route or not. A pleasant environment invites cyclists and increases social safety. (Source: Häberli, V.; Büro für Mobilität: Massnahmen zur Erhöhung der Akzeptanz längerer Fuss- und Velostrecken, 2002)
5.5 Reduce travel time
In most inner-city structures the possibility exists to reduce short car trips. In Germany e.g. 40% of all car trips are shorter than 5 km. Most of the trips in a city are relatively short: In Europe for example nearly the half of all trips ranges only about 3 kilometres. Nearly a quarter of all trips ends after 8 km.
Riding a bike within this distances is the most effective, and besides walking, the cheapest way. Bicycle users seldom know congestions and are reliable. In countries like the Netherlands or Denmark policy already took this into account. About 30% of all trips are covered by bike. An example which emphasises these facts, is the success story of commercial bicycle messenger services in cities. They can only exist and prosper if they are economically successful. (Source: European Commission: Vorwärts im Sattel, 1999)
By using the bicycle individuals can save time or could use time more effective. In comparison: for a distance of 5 km in the city cyclists need not more time from door to door than car drivers. In average for both it takes about 22 minutes. Walking this distance a person would need approximately 45 to 60 minutes. Regarding a walk not as a leisure activity many would not walk this distance daily. But also with bus (minimum 40 minutes) or city rail (minimum 30 minutes) the trips are not so fast because the stops for public transport are in the main cases not directly in front of your door – independent if there is an option for facultative stops. Car drivers or users of public transport loose time during congestions and while searching for a parking lot, by delays or overcrowding etc. Not mentioned is the increase of comfort by avoiding this situations.

76 77
Figure 11: Comparison of time to move 5 kilometres. The red line describes a cyclist in urban traffi c. It is visible that up to the distance of approximately 5 km cycling is faster than driving by car and all other transport modes. Between 5 km and 8 km the advantage is yet existing between public transport and bike. (Source: European Commission: Vorwärts im Sattel, 1999)
There is a link to the relevance of the bicycle for pre- and post-trips with public transport. The catchment’s area of public transport gets bigger by using the bike to reach public transport (Bike & Ride) and by the possibility to take bicycles in the metro and commuter railways. Bicycle transport in the pre- and post-use of public transport can increase the effi ciency of public transport.
The use of public transport for medium and long distances and the bicycle for short distances is supplementing and an alternative of car use.
Figure 12: The picture beneath shows the different catchments areas of cyclists and pedestrians to a public transport stop. Within 10 minutes walking a pedestrian can cover a distance of 800 m. In the same time a cyclist can go approximately 3 km. Thus the total area increases from 2 km2 (pedestrian) to about 30km2.(Source: European Commission: Vorwärts im Sattel, 1999)
Another aspect is, that trip chaining by bike is much easier and more time effective than by car or public transport. Places or activities which are on the way, for instance on the way to work or back to home, can aimed more fl exible. Examples could be to go shopping, to make a short stop to visit friends, to pick up children at the care centre etc. (without waiting times or searching a parking lot).

76 77
5.6 Increase comfort
In the cases that offered infrastructure should be used by cyclists it must fulfi l certain standards. Comfort is not seen as luxury but as requirement for attractiveness, acceptance and traffi c safety issues. Comfort is also not only defi ned by quantity aspects but further more by quality aspects of infrastructure and other elements. In the last 50 years in all western countries has been developed a high quality infrastructure network, a whole system for car use. Only with this systematic approach, a fl exible and comfortable car use is possible today. Good cycling infrastructure has also to be seen as a whole system. Today bicycle infrastructure mainly consists of single pieces which are not connected with each other. The nature of a cycling network is disperse, because of the reason that cycling is a fl exible way to move. Networks have to be disperse and should not bundle to strongly bicycle traffi c in special corridors. Bicycle systems should be planned not sectored but as a networks. Network has not only be understood in the sense of a physical network.
Comfort in the sense of living qualityCycling saves place nearly without emissions and noise. This fact makes the bicycle to an optimum transport mode in areas with high densities. Many people move as soon as they can afford it to - alleged - quiet and green housing areas in suburbs to escape from noise and pollution. Main roads, and many people live at such streets, loose constantly their living quality. Inner urban areas and city centres do not have enough space for streets and parking necessities as well as for the requirements serving their function as communication and supply centres. With higher modal share of cyclists (and pedestrians) in daily traffi c it is possible to re-calm the traffi c situation and to revitalise public places and green areas.
Comfort in the sense of driving and parkingDriving comfort: Objectives concerning travel quality while cycling include aspects like: design of routes and connections, surface quality and maintenance and cleaning of roads and cycle tracks, control of traffi c lights, bicycle racks in direct accessibility of working places, shops, homes etc., offers to keep altitudes or to avoid detours respectively to improve directness.
Photo’s 18 and 19: Comfort in moving through build-up areas – special traffi c signs in Naskov/Denmark and bicycle –wagon to keep strong altitudes with the cable car integrated in the light rail system of public transport in Stuttgart (Source: J. Deffner (left), Stadt Stuttgart (right)

78 79
Travel comfort in peak hours: The possibilities to relieve the traffi c network by higher use of bicycles for example when commuters turn from car to bicycle. This relief affects not only car and road traffi c. During the peak hours in mornings and evenings also public transport takes a profi t not to have overcrowded vehicles. This connection could help to reduce high investments in infrastructure supplementation and a bigger independency of individuals. In some cases, when even cycling infrastructure reaches its capacity exist approaches to offer special infrastructure (e.g. in the Netherlands). It is possible to separate long distance cyclists that commute to work daily from slower cyclists and to offer a cycling “highways” that are comfortable, direct and without junctions.
Mobility management in enterprises: Many big enterprises have already discovered the positive effects of a staff which uses the bike frequently. Besides physical and psychical fi tness bicycle users are more effective during their working time. This could be lead back on the positive feeling riding a bike and the good physical condition. More advantages are – as mentioned – less space for car parking facilities, no congestions before and after work, good image in the neighbourhoods of the enterprise and as well as less absences in cause of illness of the employees. Mobility management in enterprises includes not only offers like bicycle racks or incentives to buy a bicycle. Measures could be showers at the working place, company bicycles, contest or quizzes, traffi c safety courses, checkrooms for cycling wear etc.
5.7 Economical aspects
Costs for infrastructureInfrastructure for cycling and parking is cheap - compared with infrastructure for motorized traffi c and public transport. For every kilometre driven by bike the infrastructure costs only a few cents. Every kilometre with public transport costs app. the tenth of this amount. Bicycle riders need not much place – also for parking facilities. Regarding the high fi nancial costs for reproach and maintenance of parking space this could be a useful argument, important for retail trade. In Europe each big enterprise, shopping centre offers employees and customers a, in many cases, fee-free parking. High quality space is lost in this way for other use or is soil sealed. The household expenses of enterprises are stressed with several thousands of Euros, or in cases of car parks and underground parking with more ten thousand Euros for one parking place. Employees that often use the bicycle for the trip to work are healthier and need only cheap and place saving parking facilities for their vehicles. If it is possible to win customers and employees which live in the neighbourhood or could combine cycling and public transport to reach the working place by bike the scarce place for parking could be reserved for car drivers which have to reach from farer places.
Economic benefi ts for individuals Bicycle users save money because they have less costs for transit. The costs of a bicycle are not very high, compared with car ownership or daily commuting by public transport and cause low maintenance costs. Further there exist markets where used bike are offered. The mobility chances for persons with low incomes rise and so rise their chances for professional and private possibilities. People who can not afford a private car get possibilities to solve also greater distances to work in an acceptable time without high transport costs. Further they can transport also heavier loads. Cycling is a transport mode for all social classes and for all ages: it offers an independent mobility.

78 79
Economic benefi ts in generalNearly every one is a cyclist: kids and young people, men, women, wealthy and socially handicapped. This shows that nearly all parts of the population could be target groups for e.g. buying bicycles, using infrastructure and special products for bicycles and cycling and visit special shops or offers, events or other places. The fact, that cyclists are an important group for retail trade is much more obvious. In average they buy less per one shopping but they visit the shops more often and stay therefore more often in temptation. (Source: European Commission: Vorwärts im Sattel, 1999)With direct supply in short distances especially the retail trade sector has profi ts by a high part of cyclists in a town. These people buy not so much when they visit a shop because they can not transport for example a whole family shopping for the next two weeks by bike. Because of that it is necessary they come more often. Direct and near mobility in a ‘city of short distances’ need consequently cyclists. For example in Chambery (France) caddies were given for free to 400 families in order to make them buy their things in the inner city of Chambery instead at great mall which only could be reached by car. In fact about 60.000 trips per year have shifted from car to bicycle (Source: lecture of Philippe Vachette, velocity Conference, 2003)There is always one ever-present argument when discussions rank around possibilities of streets and quarters without car for example pedestrian zones: Shopping streets need car traffi c, they need the possibility for spontaneous parking. This argument is disproved: In most cases the trade sector has very positive experiences and results when the streets among their shops are turned into pedestrian zones or promenades. One explicit good example is the eastern French town Strasbourg.

80 81
Bicycle tourism has become a booming sector in Europe and in many other parts of the world (NZ, US, CAN). In Germany, where weather conditions and attractiveness are certainly not only the best, tourism has a profi t of estimated 5 billion Euros from bicycle tourism. In the year 2002 approximately 2 Million tourists made a more-day-trip. This is an increase of 13% from the year 2001. (Source: www.adfc.de)
Increasing bicycle use has also an important economical and industrial function: bicycle producing industry (production, import, export), bicycle racks and additional parts as well as service offers (trade, maintenance, rentals, messenger services and taxis).

80 81
6 Different actor related aspects of cycling policies
6.1 Actors involved
The common structures in most of the cities predict, that in reality there is a big ‘community’ which could be affected with the topic ‘bicycle planning and promotion’. But they do not understand themselves as a community. Therefore it is a special task to create sensibility about cycling in all these groups.
The fi gure below tries to classify actors and structures for acceptance and realization of sustainable transport concepts and strategies. It can be adopted to cycling policy as a part of sustainable transport concepts and show, in which fi elds cycling promotion can act and in which levels reactions and interactions take place. For instance a professional actor in politics could be a member of the city council who’s aim is to promote cycling in his/her city.
Figure 13
Professional actors in …
politics planning public transport enterprises investors
organizations(e.g. chamber of
commerce)
accept and/or react in contexts like:individual social ecological economical political
Structures/fi lters:Structures/fi lters:
traffi c infrastructure spatial structurespatial structurespatial structurespatial structurespatial structurespatial structurespatial structurespatial structure
Obj
ectiv
e st
ruct
ures
individual perception Subjective fi lters
organizational and conveyance spatial structure
organizational and conveyance spatial structure
fi ltersfi lters
experience/ socialisation pressmotivation/ aims/ ethics researchknowledge educational institutionsindividual advantages tariffs/ schedulesinstitutional advantages telematics/ guidance systems
amounts/ networks, capacities, service-quality, costs/ pricescosts/ pricescosts/ pricescosts/ pricescosts/ pricescosts/ prices
sites, areas/ using, availability/ site quality, costs/
pricespricespricesprices
individual social ecological economical politicalaccept and/or react in contexts like:
traffi c usertransport mode, need to travel, direction
travel time
traffi c affected
exposition against traffi c problems, e.g. at the housing area or working
placeIndividual actors in the context as …

82 83
Actors, structures and fi lters in sustainable transport strategies (according to www.akzeptanzprojekt.de/projekt.htm; Dep. of Psychology, University of Trier, 2002)
Actors Profession View
Technical staff/planners of cities administration and external planners
civil engineers, geographers, urban planners, architects
advise and execute decisions of local government and administration body, initiate measures to optimise situation, partly only technocratic understanding of bicycle planning
Administrative staff in fi nancial and legal departments
administration civil servants, lawyers, economists
mostly not concerned with transportation planning in general, bureaucratic understanding of planning and decision processes, focus on economics and profi ts, law-and-order
Decision makers in local authority: heads of departments, mayors, members of town council etc.
diverse
always in context with political objectives and majorities, often not concerned with transportation planning in general, focus on economic aspects/cost of measures, partly technocratic understanding of bicycle planning, infl uenced by political direction, dependent of objectives of own party programme.
NGO (non-governmental groups)/ Local Agenda 21
diverseengaged, often not concerned with transportation planning in general, low possibilities to infl uence decisions, sometimes advise of local administration, sometimes one-dimensional view; engaged citizens/electors, that are able to express their matters of concern.
Police civil servantsmostly not concerned with transportation planning in general, law-and-order understanding, partly technocratic understanding of bicycle planning, often involved in traffi c and safety education of children.
Press, Media journalists
“only bad news is good news”, events or ‘scandals’ in the city which are worth publishing and give a headline. Tendency on generalization and simplifi cation of facts, so that it could be understood by consumers. A problem could be to get in news about a good (bicycle) measure without publishing disadvantages for other road users caused by the measure.
Public transport enterprises
civil engineers, business economists etc.
sometimes see the bicycle as a rival, in recent years development of a better understanding towards cyclists, acceptance of cyclists as a partner, offers and infrastructure for cyclists e.g. bicycle stations or racks at stations, entrainment of cycles; often no common lobby, work for sustainable transport but sometimes not together with cycle and pedestrian lobby groups
Local stakeholdersenterprises, employers associations, chambers of commerce
Profession: diverse, self employed persons
especially shop keepers often critical towards restrictions for cars, afraid of losing customers, some enterprises support employees which commute by bik
Other bodies of public interest (churches, local associations, infrastructure companies etc.
Profession: diversedifferent, partially no specifi c interest in bicycle traffi c, but as well no opponents towards bicycle traffi c, may be won by promotion, may be infl uenced by only some (or even just one) objectives of bicycle traffi c e.g. health car
Schools and kinder gardens
teachers, pupils and parents
mainly safety aspects for children, events for traffi c safety, traffi c and safety education of children, indifferent opinions towards bicycle traffi c
Bodies of education and research
diverse
education as main exercise, different points of view towards bicycle traffi c, research work especially on bike traffi c can often be used by supporters of bike traffi c, also private trainings for civil engineers and decision makers in terms of cycle infrastructure, fundamentals of cycling and specifi c problems
Others: Health assurances, bicycle industry, sport clubs
very diversesupporters of bicycle traffi c because the growth of bicycle trafi c leads to a better realization of their own goals (health of the population, sale of bikes, gaining new members, keep the population in motion), may be partners in promoting cycling
Users of infrastructure, cyclists (not organised in groups/ organisations)
diversemay help fi nding optimal solutions, detecting weaknesses of the bicycle network or infrastructure, benchmarking
Population in general diversedifferent: supporters, opponents, indifferent people, leisure bikers, non-bikers, convinced car drivers; difference in knowledge about bike traffi c, interest in cycling, young people, older people, ...

82 83
It may be helpful to distinguish the professions of people concerned with cycling problems and to imagine possible views of these groups. Although some of them will not be conscious of their role in promoting cycle traffi c, it seems to be necessary to stimulate their awareness.
The different groups often speak their own language and have their own views on cycling problems. This has to be more respected when efforts are done to create a bicycle friendly climate in a city. The lack of objective information is perhaps one of the points, why it is often so hard to win decision makes in several positions for the topic. Experiences show, that
• the pro’s for cycling are intellectual known but not internalised in acting – from professional actors as well as by the public opinion
• cycling is often seen as a marginal topic of transportation planning: perhaps one of the reasons, why the needs of non-motorised transport are neglected, when scarce space in the streets has to be divided or in case of new buildings, when the needs of bicycle users are not considered,
• the behaviour of local politicians, directors, professors and professionals in general is often not seen as an multiplier effect for others (e.g. cycling to work)
• the costs for infrastructure move in foreground when measures have to be prioritised • the cooperation of the different actors involved is insuffi cient; very often there is lack
of coordination of different types of measures; some towns have given good examples to deal with coordination and cooperation,
• there is a lack of information in the public. The problem of desiderative public awareness and its importance for success is as well known from public transport systems
• psychological strategies which appeal to the bad conscience are not accepted.
6.2 Institutional aspects
Bicycle promotion (as well as promotion of pedestrian traffi c) can be introduced and institutionalised in different ways. In several countries exist already attempts to improve consciousness and technical knowledge. Depending on the local situation e.g.• how departments and sub departments work already together interdisciplinary• how they understand planning as an interactive process• if there exist options to introduce a new sub department, commissioner or• an external commissionerdifferent models are possible. For some cities the engagement of a commissioner etc. was an important part of a promotion strategy. Possible solutions are to install or to include
• Commissioner for pedestrian and bicycle affairs/commissioner for non-motorised transport
• Sub department• Formal or informal working group • Ombudsman/spokesman
6.2.1 commissioner for non-motorised transport
Commissioners are direct contact persons in the local administration as well as for the citizens and other organisations or institutions. They accumulate specifi c knowledge on bicycle planning and promotion. Besides the competence on cycling affairs they often are also responsible for pedestrian traffi c. The commissioners have coordinating function in the administration and hold a key position as internal and external contact person. This is especially important for the outer effectiveness of bicycle promotion.

84 85
Tasks and competencies of a commissioner can be described like the following: • Development of concepts, drafts for promotion strategies, PR, networking• Responsible of cycle audit, right to give veto • Coordination of concerned departments and actors involved, knowledge transfer• Access to own budget which could be spend for PR, building measures etc.
In smaller cities or cities in the beginning phase of promotion process it seems to be an alternative to put an external commissioner in charge. I most cases this can always only be an interim situation or the start of a bigger strategy. There are pros and cons concerning external commissioners:+ External commissioners can help to solve problems in situations when departments
of a city are hardly to get to one table and reach compromises (presenter function).+ An external commissioner can be an economic solution if the city is too small to have
a continuous demand of bicycle promotion tasks.– The external commissioner has a contract for a limited period and then the bicycle
promotion “falls asleep” again.
Tasks and competencies of external commissioners can be• Realisation of short term measures to make local administration sensitive to bicycle
affairs• Transfer of know-how• Advisory function• In contact with the client: implementation and managing of projects/measures• Creation of an working group with advisory function
6.2.2 Sub-department
To bundle competencies and to coordinate planning, realisation and legal aspects some cities have sub-departments for bicycle and pedestrian affairs (Examples: Zurich, Switzerland; Cologne, Germany).The communication with other departments and sub departments depends of the administrative hierarchies.
Tasks and competencies can be• Concepts and advices for promotion• Own budget• Cycle audit, right to give veto• Construction and maintenance of cycle infrastructure• Coordination of concerned departments• PR, contacts to externals (enterprises, institutions, experts, …)
6.2.3 Working groups
Working groups which include members of several departments are one possibility to implement more awareness on cycling affairs. The early information and communication of plans and projects in different departments can produce synergy effects in promotion of bicycle traffi c. Tasks are to discuss and to develop advices or specifi c solutions for problems. Working groups exist in several constellations and with different competencies.
Tasks of working groups can be• Coordination of plans and measures with affected departments• Advices for realisation of measures• Know-how transfer• eventually cycle audit, eventually right to give veto

84 85
Also it is possible to subdivide the working group in several task groups dealing with different aspects like infrastructure and network planning, promotion, safety, mode choice, user needs.
6.2.4 Ombudsman/spokesman
As contact person and alternative of a commissioner it is possible to introduce an ombudsman for bicycle affairs. The ombudsman does not belong to the local administration. He/she collects proposals and problems of the inhabitants and is responsible to forward that to concerned departments.The ombudsman should be equipped with an adequate communication utility. One way to manage this effectively is to offer a telephone and/or email hotline where problems of the users or, more general, the citizens, can be collected. Afterwards he/she takes a view of the situation (plus documentation) and a detailed description of the problem. Connected with his/her technical knowledge it is possible to evaluate the situation and if there are any possibilities to solve the problem. This documentation of the collected problems are given to the administration (the departments). Additional it is possible to organise regular meetings of the most concerned persons to discuss the requests.
The ombudsman is also be understand as a symbol that the administration is aware of the advices of the users as local experts. The Ombudsman connects the expert knowledge of the local administration with the expert knowledge of the users.

86 87
6.3 Changing attitudes – how to implement strategies
Promotion is an essential tool to strengthen cycling in every-day-use because it can affect psychological engagements. To institutionalise bicycle promotion for municipalities the following core questions are important.
• How could bicycle promotion be started? • Which aspects have to be taken into account?• Which institutions should be involved?• Which measures on an institutional level are adequate?
Strategic approaches which improve the perception about cycling in the city contains the following check list about cycling promotion. The strategic fi elds can be divided in:organisational implementation of cycling promotion,• budget, • infrastructure, • service measures,• bike and ride, cycling and public transport • public relations, bicycle friendly climate• cycling as traffi c system.
The fi elds of infrastructure, cycling and public transport and service measures are not core topic of institutional aspects and therefore excluded.
Organisational implementation of cycling promotion - Framework• Vision on transport policy• Basic approaches of the political parties• Vision on urban development• Transport Plan / concept• Bicycle plan / concept• Actual knowledge, state of the art
Organisational structuresß Bundling of competencies (administration, departments, …)ß Working group on bicycle and /or pedestrian traffi cß Commissioner for non motorised transportß Regional working group ß National or international working group, circle of experts• Hotline for inhabitants • Public transport enterprises• Further partners: user groups, local agenda 21 groups, schools, children and senior
associations
Tasks• Cycle Audit (external auditors)• Clear decision structures and distribution of tasks • Conceptual work, development of measures as a cooperative process of urban
planning, transport planning departments and the commissioner• Public relations on local activities • Coordination of tasks
BudgetWhich funds can be taped?• For cycling infrastructure• For other measures• For public relations• For service

86 87
Public relations / bicycle friendly climate• Development of a general concept for public relations, the concept should be
based upon positive messages about cycling, no warning fi nger or denunciation of motorized traffi c
• Project focussed PR work: Flyers, folders, information, maps, press work, internet, publicity campaigns (together with adequate sponsors)…
• Periodical PR: bicycle offi ce, information events, sport events, regular publications, exhibitions and fairs
Target groups• Users, specifi c groups: children, seniors, young people, adults, users of other
transport modes• Different types of bikers: Non-bikers, regular bikers, sportive bikers, every-day-bikers,
leisure bikers• Decision makers• Planners, technicians• Retail trade, local enterprises (employers and employees), local transport enterprises• Multipliers, people of public life(see fi gures below), schools, youth groups,
associations, churches • local retail trade associations, other lobby groups• PR for understanding and awareness in other groups, e.g. within car drivers, bus
drivers etc. • Campaigns can also be held more generally without focussing a special target group
Photo 19.1/19.2: On the pictures you can see two issues of the ADFC-Journal section Berlin/Brandenburg (bicycle user group in Germany). They show the front page of the journal with the head topics (2/2002; 1/2003).
The left picture shows the president of the German Parliament, Wolfgang Thierse, who lives (and cycles) in Berlin. He is not occupied with transport planning, but nevertheless engages himself for bicycle policy in Berlin and in Germany. On the photo he visits the main offi ce of ADFC.The right picture shows Federal Minister for Environment, Juergen Trittin, cycling in front of a mayor place in Berlin, the television tower. Certainly it is a part of his job to engage for sustainable transport, but nevertheless the picture makes visible, that there could be a real interest in the topic cycling and not only empty phrases.
Both cover pictures show the meaning of multipliers, if they could be won for cycling promotion.
88 89
Partners for cooperation• City management, city marketing, tourist information, tourism entreprises• Retail traders for bicycles• Police• Local industry• NGO• Multipliers (politicians etc.), people of public interest (politicians, fi lm stars, etc.)• Lobby groups• Schools (projects and multiplying)• Local public transport organisation (advertising on buses, trams etc.), partially
common PR
By working through this questions mainly all aspects are named, which actors and which structures can be involved in a successful promotion process. In fact, it is almost not possible to describe steps or a programme “How to implement a cycling strategy?”. The check list above shows possible activities which aspects should be taken into consideration.
6.4 Training and knowledge transfer for experts / technicians
Training and knowledge transfer are essential measures to strengthen the position of planners and technicians that are already occupied with bicycle promotion. Direct and ongoing contacts with other experts and their experiences can be an important support and serves as further education. This point is one core topic of the aspect that knowledge transfer is important to get good arguments for bicycle promotion. The main task of the planner in the local administration is to give advice to decision makers. And if this should be successful, knowledge and communication skills are indispensable.Besides “normal” congresses, like the VeloCity and VeloMondial conferences or several national congresses that take up the topic, there exist institutions or organisations which offer real professional training for experts in this fi eld. This offers often are popular only in a small, ‘inside community’.
Another approach to train technicians are knowledge exchange and training courses for planners and decision makers in order to inform them about problems and needs of cyclists. Therefore “fi eld courses” are offered. Planners can make their own experience as a cyclist in a town. This seems to be a good way to make them sensitive of specifi c problems and needs and thus realize the experience in every-day planning work.(e.g. Source: lecture of Warren Salomon on the Velo-City-Conference, 2003)Increasingly important are not only local levels of exchange of knowledge transfer and lobbying. In Germany and Switzerland for example local bicycle commissioners have institutionalised national groups. A vision could be an international cooperation of people working in bicycle promotion.
Best PracticesIn the following is presented a collection of national and international examples for expert trainings in (research) institutions, professional associations, from consultancies or user groups.(1) ADFC and SRL
In general the ADFC (Allgemeiner Deutscher Fahrrad Club = German Bicycle Association = user group) represents the interests and needs of bicycle users and is active in information and knowledge transfer concerning the topics• Events• Politics• Traffi c• Tourism• Technical questions (bicycle construction, repair)

88 89
• Different service offers (assurance, technical workshops etc.).
Since approximately 10 years the ADFC cooperates with different associations and institutions (e.g. SRL, more information below). ADFC organised since then several congresses and workshops with the focus on bicycle planning. An actual example is the congress “How to implement the National Bicycle Plan in Cities” which took place in spring 2003. It was held with cooperation of the SRL (Vereinigung der Stadt- und Regionalplaner = Association of Urban- and Regional Planners). Within this group exists a special group which is focussed on bicycle planning (see below). To show the spectrum of topics the program is shown:
1. For a bicycle friendly GermanyThe National Bicycle plan - implementation in the cityProblems of bicycle traffi c from the view of an independent planner and researcher
2. National Bicycle Plan from the view of local administration 3. 10 years of the Bicycle concept in Frankfurt / Main 4. Euro for the bike – funding the realisation of the national bicycle plan in the
strained relationship of national, federal states and local level 5. Relationship between spatial planning, sustainable urban development and
bicycle promotion 6. Local bicycle strategy of the city of Fritzlar – bicycle promotion within a frame
work? 7. Novelty of traffi c regulations and the national bicycle plan 8. Bicycle Traffi c in Hanover9. Demands and advices for implementation of the National Bicycle Plan (signed by
the participants of the conference)
Another fi eld where the ADFC plays an active role in capacity building is in the local fi eld. They engage and focus their work on information and education of planners in local administration on the topics of legal frames of bicycle planning or if there are novelties. Another part of their work is capacity building amongst local NGO like local Agenda-21-groups or grassroots groups.(Source: www.adfc.de; own experience)
The SRL as a professional association has several sub departments which work on different mobility topics. One of these groups is the forum “man and traffi c” Within this group several activities like seminars, conferences, excursions take place. Additional they work on general statements to actual questions in politics and legal affairs. Their aims are beneath the seminars and conferences publications and the exchange of experience of experts.
In the moment the main topics of the “bicycle group” are the national bicycle plan in Germany and the integration of the bicycle in the general transport system. In general the Forum “Man and Traffi c” works on the potentials of sustainable transport systems. (Source: www.srl-ev.de; own experience)
(2) Difu – German Institute for Urbanistics
In 1973 the German Institute of Urban Affairs (Difu) was founded by the Deutscher Städtetag (German Association of Towns and Cities) with the aim of identifying long-term prospects for urban development and providing expert advice to municipal authorities to help them solve their problems.An institution currently serving just about 130 towns, fi ve municipal organizations and one planning community, Difu consciously orientates its research activities towards the needs of towns and cities, offering them a broad spectrum of services. Studies, expert reports, further training seminars, information and documentation services, and regular publications promote the user-orientated dissemination of scientifi c fi ndings.

90 91
Difu provides a forum where local authorities can exchange ideas and experience and municipalities can gain advice on how to implement their planning objectives in administrative practice. Difu sees “urban affairs” principally as practice-related urban research.
Difu examines local government policies. It conducts interdisciplinary research on municipal problems and develops strategies to support towns and cities. Whenever it can, the Institute also provides services to towns and cities to help them tackle their problems in the following areas:
Tabel 14: capacity building on the local level
Urban DevelopmentUrban renewaland city planning
Transport planningUrban networks
Urban time policiesMunicipal housing policies
LegislationPlanning and buildinglegislation
Environmental legislation
Economic PoliciesStructural changesCommercial zonesand industrial estates
New technologiesInfrastructure policies
Innovation policiesTrends in retail trade
Municipal FinancesInvestment activitiesFees
Financial balance Local taxes
The EnvironmentEnvironmental protectionClimate protection
Urban ecologyNature conservation
Landscape andgreen zone planning
Social Policies Senior citizen policies Municipal policies for foreignersYouth welfareservices
Cultural Policies Cultural institutions Conservation of historic buildings Urban history
Municipal authorities
Difu runs approximately 20 seminars per year on topics of interest to municipal authorities. These in-service further training programmes are designed for executives, senior administrative personnel and members of various municipal interest groups. The further training and seminars include regularly special congresses on bicycle planning and affected topics.(Source: www.difu.de)
(3) FGSV – Association for research in road and transportation planning
The association for research in road and transportation planning (FGSV) in Germany is a (technical) association of public utility (non-profi t) with research tasks. It was funded in 1924. Main objective is the development of technical knowledge in the fi eld of road and transportation planning. Administrations, economy and research are working together. Each actor delegates assistants, in total 2.100, who are organised in several committees. The committees of the association work on nomination and up-dating of technical and planning regulations and guidelines in the fi elds of road building, traffi c technologies and transport planning. Therefore the newest state-of-the-art in research and praxis is taken into consideration. Some of the committees work together with the German institute for standardisation (DIN) to cooperate with the European Committee of Normalisation (Comité Européen de Normalisation (CEN)). The technical framework is published by the FGSV.Main tasks in the fi eld of research is to conceptualise and coordinate research programmes and the guidance and evaluation of research projects as well as publication and documentation of results. The main research programmes are:• Cooperation programme Ministry of transport, building and housing (BMVBW) and
FGSV• Research programme urban transport (FOPS)• Research programme of the ‘working group for industrial research cooperation’
The results of FGSV are published in two journals (Straßenverkehrstechnik;

90 91
Stadtverkehr), as loose-leaf-systems and in a data base.
The most important technical regulations and guidelines concerning bicycle traffi c are listed below as examples. Since 1952 the FGSV is publishing relevant guidelines for construction and planning of cycling infrastructure.• Guidelines for bicycle planning, 1989• Guidelines for bicycle parking, 1995• Guidelines for cycling infrastructure (ERA ‚95), 1995• Technical bulletin for sign-posting for bicycles, 1998• Guidelines for bicycle traffi c outside build-up areas (H RaS 02), 2002
Additional examples which are not exclusively concerning bicycle planning, but also affecting:• Advices for construction of (main-)roads (EAE ’85/95),(EAHV ‘93)• Technical bulletin for construction of roundabouts, 1998• Guidelines for design of traffi c space in build-up areas (ESG ‘96)• Handbook for construction of roads (HBS 2001)• Guidelines for traffi c light control (RiLSA)• Guidelines for marking on roads (RMS)(Source: www.fgsv.de)
(4) Velo:consult
Possibly an unique consultancy is velo:consult. The owner of this company collected long-term experiences in the fi eld of bicycle policy and promotion in an private consultancy. The special focus was the transfer of knowledge from the Netherlands to Germany in the 1990ies. Today the consultancy is situated in Switzerland with the aim, to professionalise know-how transfer and advice for planners and decision makers. An important part of the work is to make professional publications available in the mother tongues of the planners, which means in detail the translation of this publications. The countries of experience are Germany, Switzerland, Netherlands, France etc. The spectrum of the work is:• Consulting• Study tours• Research• Public Relations• Conferences• Workshops
(5) BYPAD – Quality management in bicycle promotion and the training of auditors
BYPAD stands for BicYcle Policy AuDit. It is an instrument enabling municipalities to evaluate the quality of their local cycling policy. BYPAD analyses the strengths and weaknesses in current policy and gives clear indications for future improvement. Measures and areas of action necessary to improve cycling policy can be derived directly from the audit results. Repeating the audit regularly (once every three or four years) will show progress in cycling policy. These improvements in local cycling policies have a positive long-term effect on cycle use and thus contribute to rational use of energy in transport. BYPAD can be used for inter-comparisons of several competing

92 93
municipalities, but its main objective is to offer a tool to those municipalities seeking a real improvement in their own cycling policy and wish therefore to submit it to severe scrutiny. One main principle of BYPAD is that the audit scheme is not a theoretical model, but one already applied in practice by several municipalities albeit in its development phase. Following the slogan ‘Learning by doing and developing’, the intention is to apply the audit scheme in different municipalities and cultures. During the development phase the audit scheme was validated and implemented in seven European municipalities. The instrument will grow further on the basis of new experiences in other municipalities. Cycling policy is a dynamic process. BYPAD as an instrument for quality management is equally dynamic. The novelty of the BYPAD method are the facts, that • it combines knowledge about and experience from cycling policy with current know-
how from the auditing fi eld. • BYPAD enables local authorities to evaluate their cycling policy themselves in a way
similar to that employed by companies in the framework of quality management. • cycling policy of a community is regarded as a dynamic process. BYPAD not only
investigates the results, but the complete process with all its elements. • cycling policy is audited not only by its makers - politicians and local offi cials -, but
also by its users, the local cyclists’ organisations.
Because the tendency for municipalities is inevitably to present themselves in the most positive light, the contribution from cyclists’ organizations can temper this by providing a more objective picture of local cycling policy.
To summarize the objectives and effects of the BYPAD project in the context of training and transfer of know-how, it can be concluded:• that the ByPad-process is for the local authorities itself a good experience where they
can see the improvements and the development of their efforts in bicycle promotion• that with the aim to apply the audit in different cultures and cities it is a method to
introduce training practice in this topic.(Source: http://www.bypad.org/neu/one_minute.html; Ursula Lehner-Lierz: …; own experience)

92 93
(6) City of Cambridge and Pedestrian and Bicycle Information Centre (PBIC)
The Pedestrian and Bicycle Information Center (PBIC) was established in 1999 with funding from the US Department of Transportation to connect communities with the information and resources they need to create safe places for walking and bicycling. The Center is a program of the University of North Carolina Highway Safety Research Center in cooperation with the Association of Pedestrian and Bicycle Professionals(apbp). This US national organization offers itself trainings of experts on actual topics, like novelties of technical rules and legal guidelines etc. For example they promote the actual “Updated AASHTO Guide, Other Critical Documents” Course with the following issues:
“Want to stay on top of changes to critical documents affecting the bicycling environment? If you are confused by the differences between TEA-21 and ISTEA (special regulation in road traffi c in US; note by the publisher), are wondering what the new AASHTO Guide or the Development of Bicycle Facilities is going to say, and need to know a little more about the Manual on Uniform Traffi c Control Devices and Uniform Vehicle Code - then there’s a one-day training course just for you.
Goals and objectives What does the course cover? Where and when can I attend a course?How much does the course cost? Who is teaching the course?Who developed the training course?”
(Source: http://www.apbp.org/)
The City of Cambridge, Community Development Department (Environmental & Transportation Planning Division) gives additional information. They offer a platform where institutions are named which held trainings for planners working in bicycle and pedestrian promotion. The following list will give a short overview:
• Federal Highway Administration (FHWA): Sets federal transportation policy, publishes documents, holds training courses (http://www.fhwa.dot.gov)
• Northwestern University Center for Public Safety: Holds training sessions around the country on bicycle planning (http://server.traffi c.northwestern.edu)
• AASHTO: American Association of State Highway Transportation Offi cials: hold trainings on legal novelties and guidelines (http://www.transportation.org/aashto/home.nsf/FrontPage)
(Source: http://www.cambridgema.gov/~CDD/envirotrans/bicycle/bikecontacts.html)

94 95
7 Infrastructure for cycling By Ton Daggers IBC The Netherlands 7.1 Introduction
Whether cycling is possible without (cycle) infrastructure or whether cycle infrastructure only should be implied after a certain level of cycling is established is a long discussion among transport planners. Agreed is nevertheless on the fact that there is a strong relationship between perception of safe and attractive cycling and a range of cycling facilities.
As is discussed in an earlier chapter (more cycling more accidents ?)cyclists and pedestrians are the most vulnerable road users.
This chapter shows some examples of infrastructure measures to increase safety. Measures not only by means of creating explicit infrastructure for cyclists but also by affecting the attitude of other road users by means of introducing traffi c calming designs for motorized transport.
7.2 How to start
7.2.1 The process
A fi rst step in the process of creating bicycle infrastructure is the defi nition of the structure of the bicycle network. In creating a system in which a cyclist can travel from A to B it is important to know the origin and destination of cyclist and potential cyclist. But fi rst off all the structure of the cycle network can be seen as the fi rst common agreement of all actors involved in the process of changing the road system and its use.
The plan for the cycle network is part of the basis of mutual understanding and cooperation of all stakeholders involved in the cycling promotion project.
The fi nal product of this phase of the process should be a visionary plan for the cycle network. A huge part of the fi nancial resources are not expected from special “bicycle funds”but have to be expected from projects such as road maintenance, reorganizing cables and sewage systems etc. Integration of the cycle infrastructure project with other projects is recommended as highly cost effective. (see also chapter 9)
7.2.2 Quality Requirements
By identifying a number of quality requirements the road administration can develop the physical cycle network. It depends of political input which room is given to cyclists and so what quality requirements can be included. Examples of quality requirements can be:• road safety• the wideness of the grid of the network• the level of social safety desired• the perception on comfort by for instance criteria on number of stops and time of
stops on junctions.

94 95
To defi ne a cycle network based on quality requirements also a basic knowledge is necessary on:• existing traffi c structure• destinations of all road users• traffi c fl ows• speeds of motor vehicles• parking facilities
If improving road safety is the main issue one of the possible angles to defi ne a starting point is to point out the black points considering cycling in the city area.Another value could be to identify most frequently used routes by existing and or potential routes in order to improve safety along those routes. Apart from safety directness is an important issue evaluating the cycling routes. Detour factors are a serious argument for potential cyclists not to use the bicycle.[11] In the Netherlands a detour factor of 1.4 for cycling is achieved due to the density of the cycling network
The detour factor brings us to the importance to defi ne a cycling network as a part of a bicycle master plan. The use of a creating a bicycle network is manifold:• Creating an structure which allows cyclist to move around in the city in a safe way• Standardizing the physical form of the cycling structure including pavement, junction
designs and horizontal and vertical signalization.• Minimizing detour for cyclists by defi ning a minimum grid for the main network .
A grid distance of 500 meters means a maximum detour for cyclists of 250 meters which is considered quite well in the primary network.
• Make cycling visible to other road users
A network is the result of the fact that the total is more than the sum of the parts involved.
Why a network? Function of a network
In defi ning the different levels in a network the following can be of help:
• What is the function of the cycle route? (Through, distributor or access route)• are alternative routes at short distances available?• are the cost reasonable compared to the alternative routes ?• is the designed network fulfi lling the aspects of attractiveness, coherency,
comfortableness, safety and directness (detour)
A cycling network functions as a planning concept for politicians, but most of all it is a recognizable result of an investment to improve cycling following criteria of safety, comfort, directness, attractiveness, and coherency

96 97
7.3 designs for cycle paths and junctions
7.3.1 segregation or integration?
Photo 20: Utrecht, segregated infrastructure (R Ditewig)
Cyclists feel unsafe in mixed traffi c with large volumes of high speed motorized traffi c. The level of safety depends mostly on factors as speed of traveling motorized traffi c, parking facilities, and the width of the road and the space reserved for cyclist on it. Normally it is recommended to only mix cyclists with other traffi c when there is little volume of motorized traffi c and speeds are low.
The separation of cars and bicycles cost normally more in construction and maintenance. However when looking on the saving aspects it can be concluded that benefi ts are gained by improving road safety and comfort aspects. If there are no circumstances to separate the different types of traffi c it should be recommended to reduce the speed of cars.
In different situations different solutions should be considered:
• At low car speeds and low volumes of motor vehicles separation not often gives safety benefi ts for cyclists. It can even be better not to segregate the different types of traffi c in order to avoid a wide road profi le. (mixed traffi c)
• When traffi c speed is up to 50 kph with moderate traffi c volumes (< 6000vehicles a day) cycle lanes can be considerate.
• In situations with limited car traffi c and few cyclists a broad paved shoulder could be a safe solution to segregate cyclists from motorized traffi c
• A cycle track with a dividing verge is recommended when a situation occurs with high speeds and volumes of motorized traffi c
In the debate about effectiveness of separate bicycle facilities many aspects are involved:Is there a critical mass of cyclists so other road users are aware of cyclists?If actual velocities of motorized traffi c are low because of congestion than separation might not be necessary although the design of the road should imply this.Simple low cost design often does more to alter motorized traffi c to lower their speed.

96 97
Photo 21: Integrated infrastructure (R Ditewig)
7.3.2 designs on junctions
Many experiences have shown that when designing cycle infrastructure problems do not occur on the kilometers of cycle lanes or cycle tracks but on the moment the motorized traffi c meets the cyclist: at the junctions.
It is on junctions that the risk of accidents is very high and therefore safe designs is of utmost importance. Depending on traffi c and design standards and culture some examples are given in this next paragraph.
Photo 22 and 23: Measures taken on junctions (R Ditewig)
To give visibility to all road users it is evident that parking should be avoided near crossings and junctions. A safe distance of some 20 meters is recommended.
Pedestrians and cyclists their safety will benefi t if the stop line for motor vehicles is drawn back some 5 meters in relation to the pedestrian crossing. This improves visibility and avoids confl icts in the fi rst moments of the green phase.
Stopping areas for cyclist in front of the vehicles is also a measure to avoid immediate confl icts on the moment the traffi c light gives green .
In the case of priority lanes traffi c humps for motorized traffi c turning right improves safety for cyclists.

98 99
Widening the distance between the cycle track and the edge of the motorized traffi c line also is a way of improving safety by giving more time to the traffi c types to see each other.
When introducing new design for cycling infrastructure these designs should be very clear. This means that no other than the desired use should be given to the new infrastructure. This means that new design should be presented with publicity campaigns as well as assistance from the traffi c police in explaining the proper use of the infrastructure. The campaigns should be addressed not only to cyclist but also to other road users as part of an overall traffi c education campaign
7.4 Parking
Parking with its aspects of safety and comfort is important in the overall package of cycle infrastructure. Theft is one of the main constraints on cycling. Investigation has learned that after safety, bicycle theft is the second important reason for not using the bicycle. [12]Parking facilities should be created near the main attractions in cities as public offi ces, theaters schools and universities but also near shopping centers.Different sort of parking facilities can be distinguished depending on scale and sort of use.Parking near train stations when the trip is part of the transport chain:
Figure 15: transport chain
Photo 24: Parking near train station Rio de Janeiro (photo W. Vogt)

98 99
Photo 25: parking facilities in the Netherlands (R. Ditewig)
Good bicycle parking facilities can clean up public and private spaces, prevent bicycle theft and promote cycling
7.5 Maintenance
The quality of maintenance of cycle infrastructure is an important factor in defi ning the status of cycling. Also it is a fact that poor pavement can distract one’s attention from other road users with sometimes fatal accidents as a result.
Inspection of the bicycle infrastructure and a monitoring system is the fi rst phase of a good maintenance plan.
The maintenance is focused on the following road elements:• pavement;• lights and level of illumination• road signing and road markings;• traffi c lights;• bridges/cantilevers;• side verges and greenery;• cleaning
7.5.1 Pavement
The condition of the pavement is of great importance to the comfort of the cycle track and the road safety of the cycle track. As is confi rmed by opinion polls users highly value the amount of comfort and the road safety of the cycle tracks.
The strength of the cycle tracks depend on the construction of the track. It is important to note that this construction should also be strong enough to carry heavy vehicles like cars or incidentally a lorry. This extra strength in the construction is needed because to carry out maintenance motorised vehicles can be used.
The following items are related to the quality of the pavement and are to be inspected regularly. Most of these items are related to long term maintenance. However it is important to inspect the tracks more often in the fi rst year of their completion.

100 101
Tears in the asfaltoTears in the asfalto are a danger for the stability of the cyclists. There are two kinds of tears, these are:• cross tears: tears in the width of the track;• tears in the length direction of the track.
Tears can be caused by:• illegal use of motorised vehicles;• bad foundation conditions;• roots of trees pushing up the asfalto;• more setting of the underground;• growth of weed.
Most of these reasons do cause cross tears. The seriousness of the tears is related to the width of a thin bicycle tire which is 22mm.
DrainageWater must quickly fl ush of the pavement. To achieve this the pavement has a light slope of 2 - 4 percent. Water pools on the track are not comfortable for the cyclists. At opinion polls cyclists have qualifi ed them as irritating. Nobody likes wet feet. Also people would like to see on what surface they are cycling. Besides the comfort aspect, water pools also have a negative effect on the breaking distances and the stability of cycling.
The condition of the drainage’s and the gratings is best inspected shortly after heavy rainfalls. Specifi c attention must be paid to the entrances of the gratings. If these are blocked with leaves or dirt then logically they cannot function properly. Dirt and leaves can quickly be removed to make the gratings function properly.
It is proposed when there are water pools on the track with a depth of more then 20 mm measurements are to be taken.
7.5.2 ILLUMINATION
The amount of light on the cycle track has a great impact on the road safety of the track and on the public safety. With road safety in this context it is meant that the tracks are light enough that at night time two cyclists who are approaching each other can see each other clearly and that they would collapse as a result of noticing each other too late. Also should al road furniture and road markings be lightened clearly. Public safety deals with the feelings of the people. Do they feel safe at night time. Dark stretches and dark corners must be avoided. The amount of street lights is attuned to this. From public inquiries in the Netherlands properly lightened cycle tracks are highly appreciated.
The conditions of the streets lights along the track are to be inspected every 4 months. Specifi c attention must be paid to:• are the lights working;• the condition of the lampposts: are they not hit by vehicles, or do they need painting It
is strongly recommended to regularly inspect the conditions of the street lights;• the conditions of the light posts besides the cycle tracks that are not directly part of the
cycle tracks.

100 101
7.5.3 Road signs and road markings
All road signs and road markings that are used to guide the traffi c, to warn the traffi c and to organise the traffi c should be clear for its users. It has a positive infl uence on the road safety as it also enhance the legal aspects of the traffi c law.
The inspection is done visually.
SignsThe posts of the road signs that should be checked if they are not been hit, pushed over by a heavy vehicle or if new young bushes do withdraw the signs from the view of the road users. Especially when the new road works are completed it happens often that road signs have been hit.Also the condition of the colours of the sign itself is to checked on brightness and colour.
Road signs that have been hit or bend down should be replaced immediately.
Photo 27: clear and clean road signs (W. Mulder)
Photo 26: Road design in Rio the Janeiro

102 103
MarkingsFor road markings it is important to check if the logos, words and linings are complete and if these are still clear enough. When a lot of traffi c is crossing and when the weather conditions are extreme the bright colour can fade away. In the long term road markings will always fade away. How fast this will happen depends on the quality of the road paint that is used. Basically once a year small maintenance on road markings is required. However this is to be judged by the inspector.
The road markings at junctions generally needs more maintenance that the markings at road sections and also have a higher priority.
7.5.4 Traffi c lights
The traffi c lights must always function properly. When one light is not working it can lead to dangerous situations. Especially when road users are expecting the lights to work.
Malfunctions to lamps are to repaired immediately.
Failures of the programming of the light sequences should be improved directly after the installation of the lights. These works are to be part of the contractor documents with the manufacturer of the lights and the programming.
Photo 28: traffi c lights must always work (W. Mulder)
7.5.5 Side verges / greenery
This only applies to unpaved side verges and to stretches where greenery is planted besides the cycle tracks. The condition of the unpaved side verges and the greenery can block the drainage of the track. High vegetation can visually narrow the track as overhanging branches can dangerously hinder cyclist. Also the view on the track can be blocked.
To avoided problems with drainage’s the level of the pavement should always be higher then the level the verge.

102 103
On a width of 1 m between the track the grass should be kept low. Other greenery may not overgrow the track or block the view on the track. A free width of 1 m here should also be maintained between the edge of the cycle track and the trees or branches of bushes.
Greenery like thorn hedges should be avoided. This will lead to a high number of fl at tires and requires a lot of maintenance to keep the track clean.
In Dutch conditions it is recommended to maintain the greenery twice a year. Does this also apply to the Colombian conditions?
7.6 Cleaning
Clean tracks are important for the road safety (stability of the cyclists and a optimum effect on the breaking distances).The most common types of dirt on the cycle tracks are:• leaves and branches of bushes and trees;• sharp materials like nails or glass caused by working activities besides the tracks.
Wasted glass is also often found near restaurants and bar locations;• paper or other waste materials;• sand of mud (after heavy rainfalls);• grease.
Except for leaves and branches it is hard to predict when the dirt gets on the cycle track. Therefore regular inspections are needed. It is best to count for a cleaning program where tracks are cleansed every week. With a possible higher frequency in autumn.
7.7 Summary
Table gives an overview of all the elements that are to be maintained, what is to be maintained and how often to be inspected.
Table 15: Elements of maintenence
Elements attention for freq.
Pavement:
cross tearstears in length directiondamage to edgesdrainage
2 times / year
Lights lamps and posts at night hours
Signing and Marking posts, brightness and quality of road paint 2 times / year
Traffi c Lights lamps and posts 2 times / year
Cantilevers construction, pavement and railings 2 times / year
Verges and Greenery grass and overhanging branches 2 times / year
Cleaning dirt of all sorts weekly
Source: Manual on Maintenance of Cycling Infrastructure in Bogotá, Mulder & Daggers I-ce IDU Bogota
• Cycling infrastructure should be part of an overall transport policy• By introducing traffi c calming measures not only cyclists but also pedestrians benefi t• By combining maintenance of roads with creating cycling infrastructure costs can be saved• Creating cycling infrastructure without fl anking policies has the risk of not being effective
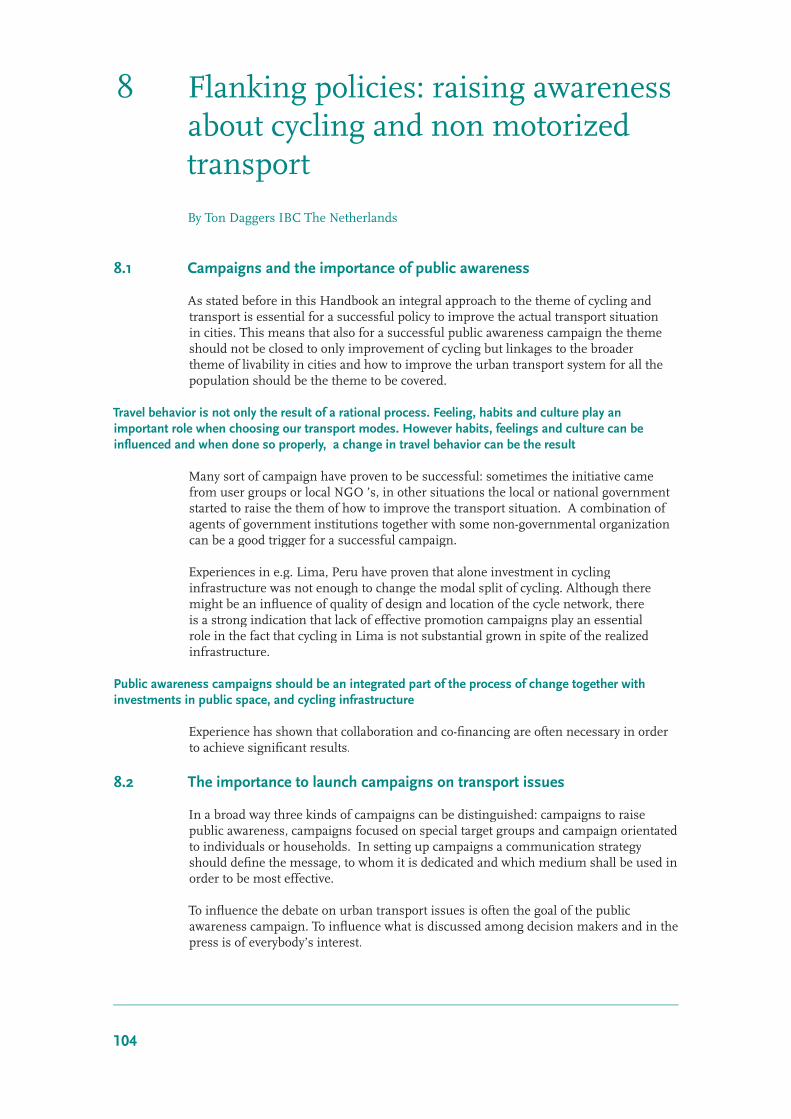
104 105
8 Flanking policies: raising awareness about cycling and non motorized transport
By Ton Daggers IBC The Netherlands
8.1 Campaigns and the importance of public awareness
As stated before in this Handbook an integral approach to the theme of cycling and transport is essential for a successful policy to improve the actual transport situation in cities. This means that also for a successful public awareness campaign the theme should not be closed to only improvement of cycling but linkages to the broader theme of livability in cities and how to improve the urban transport system for all the population should be the theme to be covered.
Travel behavior is not only the result of a rational process. Feeling, habits and culture play an important role when choosing our transport modes. However habits, feelings and culture can be infl uenced and when done so properly, a change in travel behavior can be the result
Many sort of campaign have proven to be successful: sometimes the initiative came from user groups or local NGO ’s, in other situations the local or national government started to raise the them of how to improve the transport situation. A combination of agents of government institutions together with some non-governmental organization can be a good trigger for a successful campaign.
Experiences in e.g. Lima, Peru have proven that alone investment in cycling infrastructure was not enough to change the modal split of cycling. Although there might be an infl uence of quality of design and location of the cycle network, there is a strong indication that lack of effective promotion campaigns play an essential role in the fact that cycling in Lima is not substantial grown in spite of the realized infrastructure.
Public awareness campaigns should be an integrated part of the process of change together with investments in public space, and cycling infrastructure
Experience has shown that collaboration and co-fi nancing are often necessary in order to achieve signifi cant results.
8.2 The importance to launch campaigns on transport issues
In a broad way three kinds of campaigns can be distinguished: campaigns to raise public awareness, campaigns focused on special target groups and campaign orientated to individuals or households. In setting up campaigns a communication strategy should defi ne the message, to whom it is dedicated and which medium shall be used in order to be most effective.
To infl uence the debate on urban transport issues is often the goal of the public awareness campaign. To infl uence what is discussed among decision makers and in the press is of everybody’s interest.
104 105
Photo 29: Paris 2003 ( T Daggers)
To launch an effective awareness campaign it is useful to have a basic knowledge on people’s attitudes and acceptance and restrictions on for instance car use and cycling in order to defi ne the message of the campaign.
Awareness campaigns are the most effective when using a number of media at the same time. Also using other related events in a more or less spontaneous way helps to spread the message in an inexpensive effective way.
Different aspects of a traffi c campaign are explained by the example of the introduction of a CONGESTION CHARGE SCHEME by the Mayor of London Ken Livingstone implemented since February 17, 2003. Motorists have to pay if they wish to drive into central London. In order to reduce traffi c volumes in the congested capital, Mayor Ken Livingstone decided to introduce congestion charging. From Monday to Friday from 7a.m. to 6.30 p.m. within a zone covering about 221 square kilometers, motorists have to pay a charge of around € 7.50 to enter. The revenue g3enerated for public funds is allocated to improving public transport, as well as to administering the charging system.
The examples proves in various ways that the effectiveness of a campaign depends not on a sole factor but on a combination of political support, fi nancial means, combination of traffi c measures and promotional campaigns, investigation and monitoring on the effects of measures and the covering of the media of the process.
The London example also shows that a certain risk cannot be avoided when taking more or less drastic measures. But it also shows that among the population there is much more willingness to accept measures, which in the end, prove to benefi t, living conditions for most of them.
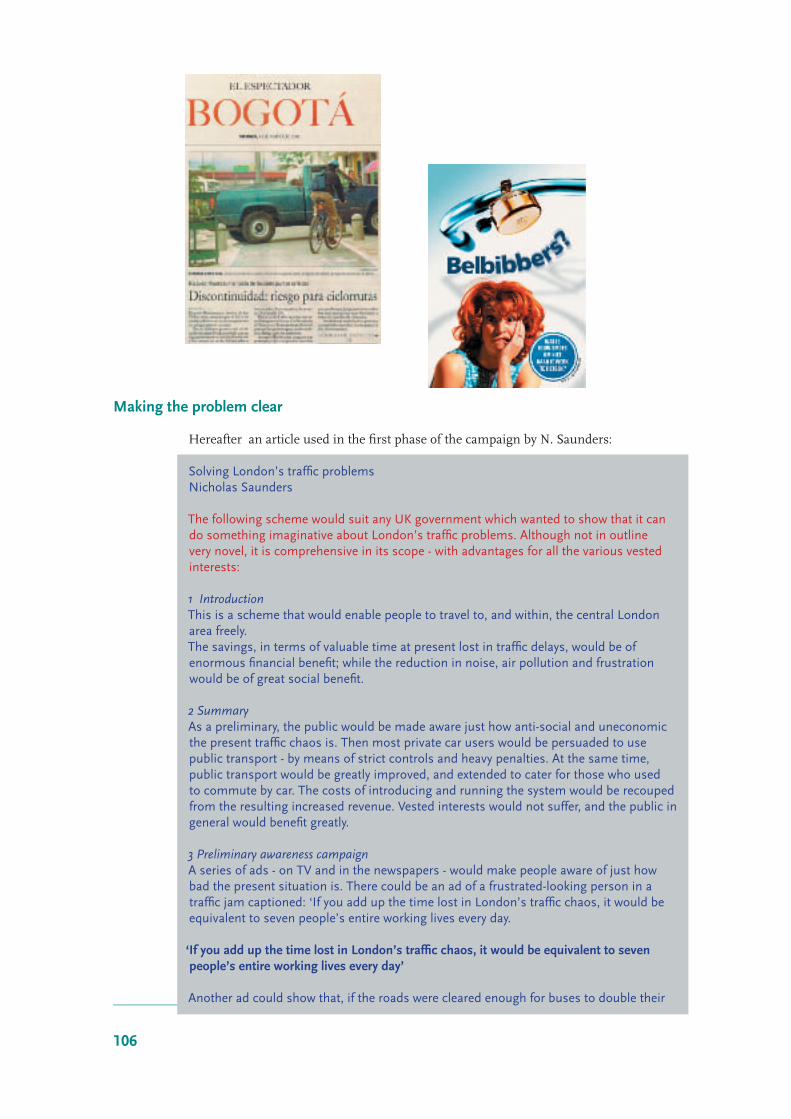
106 107
Making the problem clear
Hereafter an article used in the fi rst phase of the campaign by N. Saunders:
Solving London’s traffi c problemsNicholas Saunders
The following scheme would suit any UK government which wanted to show that it can do something imaginative about London’s traffi c problems. Although not in outline very novel, it is comprehensive in its scope - with advantages for all the various vested interests:
1 IntroductionThis is a scheme that would enable people to travel to, and within, the central London area freely. The savings, in terms of valuable time at present lost in traffi c delays, would be of enormous fi nancial benefi t; while the reduction in noise, air pollution and frustration would be of great social benefi t.
2 SummaryAs a preliminary, the public would be made aware just how anti-social and uneconomic the present traffi c chaos is. Then most private car users would be persuaded to use public transport - by means of strict controls and heavy penalties. At the same time, public transport would be greatly improved, and extended to cater for those who used to commute by car. The costs of introducing and running the system would be recouped from the resulting increased revenue. Vested interests would not suffer, and the public in general would benefi t greatly.
3 Preliminary awareness campaignA series of ads - on TV and in the newspapers - would make people aware of just how bad the present situation is. There could be an ad of a frustrated-looking person in a traffi c jam captioned: ‘If you add up the time lost in London’s traffi c chaos, it would be equivalent to seven people’s entire working lives every day.
‘If you add up the time lost in London’s traffi c chaos, it would be equivalent to seven people’s entire working lives every day’
Another ad could show that, if the roads were cleared enough for buses to double their

108 109
8.3 The Media
The role of the media is of utmost importance in having a succesfull campain. The way the edia cover the campaign can be infl uenced by the facts and fi gures which the campain crew deleiver them.O the reliability of information is essential.Form is which the media can be contacted:
Press releases.• Use interesting headlines• Use facts which are verifi ed about what is happening why is is important and what is
the vision, context of the happening related to effects• Use quotes and short sentences
Using facts and creative use of facts also is an important issue in successful campaigns.
Other important things in contact with the press are:• Be creative and credible• Timing of presenting information is important
examples of other cities with similar problems:
Some Congestion Pricing Around the WorldSINGAPORE
Key facts:• Population 3,665,920; city covers 647.5 sq km. • Total vehicles in city number approximately 707,000. • Charging area much smaller than London and divided into central business districts,
where scheme applies from 7.30am to 7.00pm, and expressways/outer ring roads, where scheme applies from 7.30am to 9.30am.
• ERP (Electronic Road Pricing) system introduced in 1998, though a manual road pricing system (with offi cers making visual checks at each entry point) introduced in 1975.
• CashCard can be bought/topped up at retail outlets, banks, petrol stations and automatic machines, fi xed to vehicle windscreen.
• Different charges for different roads at different times automatically deducted from CashCard as vehicle passes under gantries .
Benefi ts:• Immediate reduction of 24,700 cars during peak and rise of traffi c speed by 22%. • Total reduction of traffi c in zone during charging period by 13% from 270,000 to
235,100 . • Reduced number of solo drivers. • Vehicle trips shifted from peak to non-peak. • ERP system cut down on previously paper-heavy system .
More information: www.lta.gov.sg
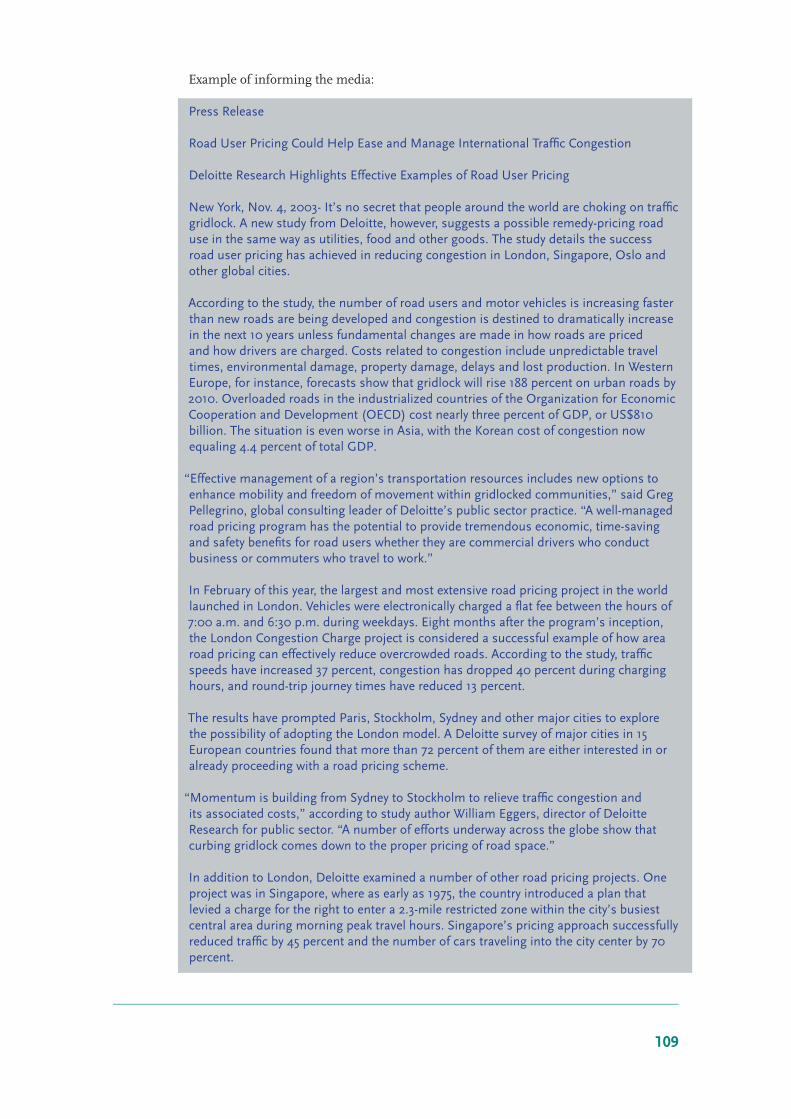
108 109
Example of informing the media:
Press Release
Road User Pricing Could Help Ease and Manage International Traffi c Congestion
Deloitte Research Highlights Effective Examples of Road User Pricing
New York, Nov. 4, 2003- It’s no secret that people around the world are choking on traffi c gridlock. A new study from Deloitte, however, suggests a possible remedy-pricing road use in the same way as utilities, food and other goods. The study details the success road user pricing has achieved in reducing congestion in London, Singapore, Oslo and other global cities.
According to the study, the number of road users and motor vehicles is increasing faster than new roads are being developed and congestion is destined to dramatically increase in the next 10 years unless fundamental changes are made in how roads are priced and how drivers are charged. Costs related to congestion include unpredictable travel times, environmental damage, property damage, delays and lost production. In Western Europe, for instance, forecasts show that gridlock will rise 188 percent on urban roads by 2010. Overloaded roads in the industrialized countries of the Organization for Economic Cooperation and Development (OECD) cost nearly three percent of GDP, or US$810 billion. The situation is even worse in Asia, with the Korean cost of congestion now equaling 4.4 percent of total GDP.
“Effective management of a region’s transportation resources includes new options to enhance mobility and freedom of movement within gridlocked communities,” said Greg Pellegrino, global consulting leader of Deloitte’s public sector practice. “A well-managed road pricing program has the potential to provide tremendous economic, time-saving and safety benefi ts for road users whether they are commercial drivers who conduct business or commuters who travel to work.”
In February of this year, the largest and most extensive road pricing project in the world launched in London. Vehicles were electronically charged a fl at fee between the hours of 7:00 a.m. and 6:30 p.m. during weekdays. Eight months after the program’s inception, the London Congestion Charge project is considered a successful example of how area road pricing can effectively reduce overcrowded roads. According to the study, traffi c speeds have increased 37 percent, congestion has dropped 40 percent during charging hours, and round-trip journey times have reduced 13 percent.
The results have prompted Paris, Stockholm, Sydney and other major cities to explore the possibility of adopting the London model. A Deloitte survey of major cities in 15 European countries found that more than 72 percent of them are either interested in or already proceeding with a road pricing scheme.
“Momentum is building from Sydney to Stockholm to relieve traffi c congestion and its associated costs,” according to study author William Eggers, director of Deloitte Research for public sector. “A number of efforts underway across the globe show that curbing gridlock comes down to the proper pricing of road space.”
In addition to London, Deloitte examined a number of other road pricing projects. One project was in Singapore, where as early as 1975, the country introduced a plan that levied a charge for the right to enter a 2.3-mile restricted zone within the city’s busiest central area during morning peak travel hours. Singapore’s pricing approach successfully reduced traffi c by 45 percent and the number of cars traveling into the city center by 70 percent.

110 111
Example of using facts:
Graham Goodwin Senior Press Ofi cer1 Congestion Charging - 6 Months OnThe congestion charging scheme directly tackles four key transport priorities for London: reducing congestion; improving bus services; improving journey time reliability for car users; and making the distribution of goods and services more reliable, sustainable and effi cient. It has also raised signifi cant funds to improve London’s transport system. Transport for London’s congestion monitoring report, Congestion Charging: Six Months On, provides the latest information on the operation and enforcement of the scheme and its effects on traffi c levels, congestion, public transport and people coming to central London.
Key FindingsThe report concludes that:• congestion in the zone has dropped by around 30% - at the high end of TfL’s expectations;
congestion is now lower than at any stage since the mid-1980’s• the number of motor vehicles entering the zone during charging hours has dropped by 16%• car journeys to and from the charging zone are quicker and more reliable - car journey times have
decreased by an average 14% and reliability has improved by an average of 30%• public transport is coping well with the increased number of ex-car users• bus services are benefi ting from the reduced congestion • no signifi cant traffi c displacement around the zone has been observed• provisional data suggest a 20% reduction in the number of accidents within the zone• driver responses to charging appear to have settled• the various payment systems are working satisfactorily
• call centre enquiries have fallen from an average of 167,000 calls per week to 70,000• since the start of charging, penalty charge notices (PCNs) have been issued at an average rate of
106,200 per month• payment rates for PCNs have steadily increased. 61% of those issued in August were paid by the
end of September• the percentage of representations received in response to PCNs have fallen from 62% to 16%• although the net revenues from the scheme are less than anticipated, over £68million in
net revenues will be raised in 2003/04 and £80million to £100million in future years for reinvestment in further transport improvements
• the public remain supportive of the scheme
Reduced Traffi c Levels and Congestion Six months on, TfL’s surveys show 50,000 fewer cars per day are being driven in the charging zone, with the majority switching to public transport or other modes of transport such as bicycles, scooters and car sharing; or diverting around the zone, resulting in only 4,000 fewer people coming to the charging zone.Traffi c delays have been reduced and the increased public transport capacity is successfully accommodating new bus passengers.More than 50% of London residents support or tend to support the scheme, compared to around 30% who oppose or tend to oppose it.Congestion levels within the charging zone are now lower than at any stage since the mid-1980s, and the number of four-wheeled vehicles entering the zone, the main cause of congestion, has dropped by 16%. This has cut the amount of time drivers spend in queues; cut journey times; increased average speed; and may have cut the number of reported accidents.The cut in congestion could now save an average of ten minutes on an 80-minute round-trip to the zone. TfL’s target of reducing traffi c delays in the zone by 20-30% has been achieved with a fall of around 30%. Public transport is coping well with the increased number of ex-car users. TfL increased bus capacity to accommodate the 15,000 extra bus passengers travelling to the congestion charging zone during the morning peak period. Further bus operations are more reliable than before, with excess waiting time at bus stops reduced by a third, and lost kilometres due to traffi c delays cut by 60%.A reduction of 30% in car movements to the zone slightly exceeds TfL’s original expectations. Taxi movements have increased by 20%, more than TfL expected; van and lorry movements have decreased by 10%, slightly more than expected; and cycling has increased by 30%, although the favourable spring and summer weather may also be a factor.

110 111
Small changes of between -7% and 7% in orbital traffi c levels outside the charging zone have been measured. However, no signifi cant traffi c displacement to local roads around the zone has been observed. Provisional data for reported accidents inside the charging zone during charging hours suggest an approximate 20% reduction compared to the same period in 2002. Concerns raised about potential increases in two-wheeled vehicle accidents (particularly motorbikes) seem to be unfounded. However, TfL will be closely monitoring the situation to assess whether these early indications are sustained.
Economic Impact Concerns over the detrimental impact of charging on economic activity appear to have been misplaced. Fewer people are now coming into central London for a variety of reasons. The ‘Footfall Index’, a measure of people visiting retail centres, indicates a 7 percent year-on-year decline within the charging zone, and that retail activity in central London during the fi rst half of 2003 was notably lower than the equivalent period in 2002.Approximately 70,000 fewer people are coming into the zone by all forms of transport compared to Spring 2002, when an estimated 1.6million people made journeys into the charging zone. Since 85-90% of people coming into central London travel by public transport, the relative impact of reduced car users is minimal. It is estimated that the congestion charging scheme is only responsible for around 5-7% of the overall reduction in people coming into the charging zone.Furthermore, reduced traffi c delays, improved journey time reliability, reduced waiting time at bus stops, and lower fuel consumption resulting from congestion charging all have economic benefi ts which should assist business. Transport for London will continue to develop its assessment of the economic impacts of the scheme through the ongoing monitoring programme. The main monitoring work with businesses is programmed for this autumn, corresponding to surveys undertaken at the same time during 2002, to allow a comparative analysis. The Second Annual Monitoring Report will include an update on the initial assessment provided in this report.


112 113
8.4 The role of politicians and other actors
Though it should not be overestimated the role politicians can play in a campaign the London example shows that it can be very important. Examples not only in London but also in other cities like Bogotá have shown that politicians are willing to risk their future for the success or failure of transport policies. As transport is an item which is of interest to the entire population, success is a benefi t for everyone and so politicians are estimated for their actions. So if possible invite them to activities related to the campaign.
Also politicians make use of campaigns themselves and therefore are often most willing to lent their profi le to certain campaigns.
Bicycle advocacy groups or user groups are very important in the launching as well as in participation in campaigns. User groups encourage local governments to create better cycling facilities, parents ask city governments for safe cycling for school children etc.
The challenge is not technology, the challenge is to build public awareness and political will(Unita Narain CSE India, on the IEA Clean city Vehicles Workshop, Paris 24 sept 2002)
Key to success is organization when launching campaigns: professional campaigns as well as user group campaigns should combine their forces to arrive to the changes they stand for.
,
Photo 30: Palmira, Colombia ( T Daggers)
114 115
8.5 Alliances between city government, public transport enterprises, ngo’s and other stakeholders.
Local authorities and city governments are normally responsible for traffi c planning, traffi c management and traffi c infrastructure and therefore have mayor infl uence on bicycle policies and /or the provision of cycling infrastructure.From the point of view of politicians as well as advocacy groups for cycling working relations are crucial. Strong argument for this statement lies in the fact that both actors depend on the other for the success of their campaign.
In reality this means that politicians and or decision makers who are aware of this often subsidize user groups to make them more professional. Obtaining information of organized cyclists is more effi cient than hire consultants or engineers for evaluating the problems in for instance a cycle network.
Examples of actions to be undertaken are:
• Invite the mayor on a cycling trip• Undertake small studies• Organize campaigns on schools• Organize campaign on safe cycling• Write letters to newspapers• Organize CAR FREE DAYS• Discuss free public transport for special groups or days
Experiments as CAR FREE DAYS or free public transport days can show people how life can be without their car. Refl ect on benefi ts by showing the other side of reality can be valuable.Discussion of the results makes room for changing attitudes.

114 115
chapter 9 Economic aspects of cycling
By Ton Daggers IBC The Netherlands
9.1 Introduction
When talking about measures to improve cycling, the aspect of cost is always very important. Even when politicians are convinced of the importance of cycling in cities, the fi nancial aspects of cycling measurements are crucial for the implementing of cycling infrastructure. In this chapter some insight is given in different cost aspects regarding cycling and transport in general.The general idea is that every mode of transport has it’s own characteristics and also costs effects are different for every transport mode.
Comparing costs of different modes makes it possible to make a cost benefi t analyses so a rational decision can be made to plan transport and traffi c in our cities.
In including not only the user cost but also cost for society as a whole a more balanced decision can be made when considering reallocation of space and fi nancial inputs in different traffi c modes.
Also the time aspects of traveling are considered. An effort is being made in some economic transport studies to give a value to travel time in order to rationalize the different modes according speed and time spend on daily commuting.
As safety is one of the most important aspects in traffi c, a try is given to differentiate it for different modes. The risk of accidents is related to traffi c mode used. Benefi ts from safe infrastructure designs can give fewer accidents, which therefore can be quantifi ed, and have sometimes a positive effect on cost benefi t ratios.
Data are shown of costs of different types of measures that can be taken to improve cycling. It has to be emphasized that fi gures used in this are rough estimates and further depend on local conditions as labor and material cost. However we hope that the fi gures presented give some help in developing plans.
When considering a cycling promotion program a preliminary insight in cost and benefi ts to be expected seems no more than logic. By showing some facts this chapter hopes to give some insight. A economical justifi cation can be one of the fundaments on which the promotion campaigns (see chapter 8) can be based.
The purpose of a Justifi cation Report on cycling can be defi ned as follows[13]:
This study aims to give insight in the costs and benefi ts of an integral coherent bicycle policy. Some of the benefi ts will be underlined with statistical facts other benefi ts will be described.This study will make a contribution to develop a coherent and good bicycle policy and to give politicians valid arguments for decision making ,therefore it is necessary to take into account costs and benefi ts of different transport modes. An integral approach of different modes gives insight in the fact that there are high costs involved to make the growth of car use possible. Many of those costs are not made transparent. As a consequence civil society is normally paying those costs.

116 117
Photo 31: Economic use of the bicycle (T Daggers)
9.2 construction cost of cycling infrastructure
It is very diffi cult to give a reliable comparison of construction cost of cycling infrastructure in various countries. Most of all there exist not many fi gures about investments in cycling infrastructure. In cycling countries like the Netherlands investments in cycling infrastructure are normally included when realizing or reorganizing road infrastructure, so no explicit data are available.In Latin American countries en general investments in cycling infrastructure are relatively new and therefore sometimes higher because of the not known cost when estimating the construction cost.As can be seen in the table below there is considerable differences between cities regarding cycling infrastructure. Apart from reasons mentioned before explanation of differences can also be explained by the fact that in some cities the cost for upgrading urban (green) areas, cost of land acquisition all has been included. Also cost nay vary because of not including illumination, traffi c signals and other provisions. Nevertheless the table gives some insight in construction costs of cycling infrastructure.
Tabel 16: Construction cost of cycle infrastructure: in US$ and €
Total cost kilometers constructed km cost
Rio de Janerio 8.5400000 150 US$ 70.000
Santa Fe de Bogota 108.462.424 250 US$ 433.850
Leon Nicaragua 26113 4.3 € 6072
Denmark € 650000
source: Proper investigation
Photo 32: Dutch postman uses tricycle ( T Daggers)
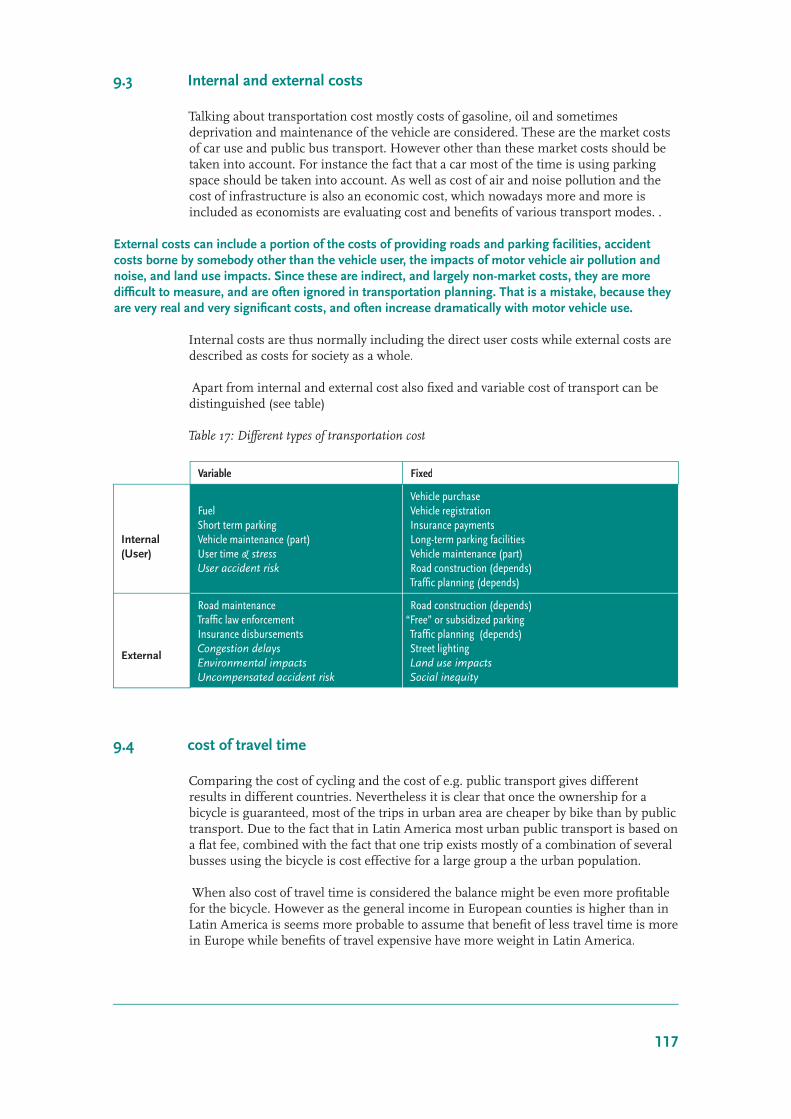
116 117
9.3 Internal and external costs
Talking about transportation cost mostly costs of gasoline, oil and sometimes deprivation and maintenance of the vehicle are considered. These are the market costs of car use and public bus transport. However other than these market costs should be taken into account. For instance the fact that a car most of the time is using parking space should be taken into account. As well as cost of air and noise pollution and the cost of infrastructure is also an economic cost, which nowadays more and more is included as economists are evaluating cost and benefi ts of various transport modes. .
External costs can include a portion of the costs of providing roads and parking facilities, accident costs borne by somebody other than the vehicle user, the impacts of motor vehicle air pollution and noise, and land use impacts. Since these are indirect, and largely non-market costs, they are more diffi cult to measure, and are often ignored in transportation planning. That is a mistake, because they are very real and very signifi cant costs, and often increase dramatically with motor vehicle use.
Internal costs are thus normally including the direct user costs while external costs are described as costs for society as a whole.
Apart from internal and external cost also fi xed and variable cost of transport can be distinguished (see table)
Table 17: Different types of transportation cost
Variable Fixed
Internal(User)
FuelShort term parking Vehicle maintenance (part)User time & stressUser accident risk
Vehicle purchase Vehicle registration Insurance payments Long-term parking facilitiesVehicle maintenance (part)Road construction (depends)Traffi c planning (depends)
External
Road maintenanceTraffi c law enforcement Insurance disbursementsCongestion delays Environmental impacts Uncompensated accident risk
Road construction (depends)“Free” or subsidized parking Traffi c planning (depends)Street lighting Land use impacts Social inequity
9.4 cost of travel time
Comparing the cost of cycling and the cost of e.g. public transport gives different results in different countries. Nevertheless it is clear that once the ownership for a bicycle is guaranteed, most of the trips in urban area are cheaper by bike than by public transport. Due to the fact that in Latin America most urban public transport is based on a fl at fee, combined with the fact that one trip exists mostly of a combination of several busses using the bicycle is cost effective for a large group a the urban population.
When also cost of travel time is considered the balance might be even more profi table for the bicycle. However as the general income in European counties is higher than in Latin America is seems more probable to assume that benefi t of less travel time is more in Europe while benefi ts of travel expensive have more weight in Latin America.

118 119
Table Estimated Travel [14]
Tabel 17: Time Cost by Mode in Santiago
Mode $/Trip $/PKM
Auto 0.58 0.05
Pickups 0.58 0.05
Bus 1.00 0.09
Taxi 0.49 0.05
Colectivo 0.63 0.06
Motorcycle 0.48 0.05
Metro 0.64 0.07
Walk 0.76 0.53
Bicycle 1.38 0.17
Door-to-door travel time
Door-to-door travel times in urban networks depend strongly on:• Intersection effi ciency and delays;• The directness of the connection (particularly for pedestrians and cycle trips);• The number of interchanges between buses/metro lines;• Walking distances to/from parking points and public transport stops;• Traffi c jams.
The incidental top speed that the vehicle in use (car, bus taxi or metro) can reach during the trip at a certain section of the network is almost irrelevant to the overall average speed that is achieved.
In urban transport the common sense notion that walking is slow, cycling is a bit faster but also slow, a bus is in-between, and metro and car are fast, does not apply! For the vehicles themselves it is true, but for their operation in urban transport systems it is not true. There, the network dictates the performance, not the vehicle.
Tabel 18: An overview of the average urban travel door to door speeds.
Modes of transport Operating speed Average (km/hr) Door to door speed Average (km/hr)
Individual modes:
Walking 4 4
Cycling in mixed traffi c 10 - 12 10
Cycling on cycle track network 10 - 18 13
Moped/scooter 15 - 30 20
Private car 15 - 30 15
Collective modes
Shared taxi 12 - 20 10
Stage bus 12 - 20 8
Stage bus on bus lane network 30 12
Urban light rail 35 12
Replogle (1992) and de Langen (1993).[15]

118 119
From the table is becomes clear that:• The operating speed and the door to door speed of cycling do differ much less then it
does for other transport modes (except for pedestrians);• door to door speed of the bicycle is only 2 km/hour less then the door to door speed of
the private car;• the bicycle can compete with door to door travel time with almost all other transport
modes.
9.5 accident cost
A survey of accident studies in various European countries showed wide ranging costs per passenger kilometer travelled. Some 2% of the national income worldwide is spent on the consequences of traffi c accidents. In the opinion of the European Union prevented fatal accident with a cost maximum of € 1.000.000 is economical cost effective, not including the prevention of (emotional) suffering.[16] A study in the United States in 1988 estimated the cost of 14.8 million highway accidents to be $358 billion (in 1988 dollars), a major component of which was pain, suffering, and lost quality of life.[17]
Table 19: Accident Costs by Travel Mode in Some European Countries (U.S.$)[18]
Study Location Passengers (passenger-km)
Car Bus Rail
Planco, 1990 FRG 0.020 0.004 0.003
Tefra, 1985 France
Tefra, 1985 Belgium
EcoPlan, 1991 Switzerland 0.030 0.007 0.004
Hansson, 1987 Sweden, Urban 0.050 0.013 0.001
Hansson, 1987 Sweden, Rural 0.088 0.001
En general investigations show that promotion of cycling and improving safety go hand in hand. As a result there are fi gures of cost benefi t ratios of 9:1 considering traffi c calming measures in urban areas as well as the introduction of separated cycle paths.
International studies indicate that walking and bicycling incur a higher injury rate per unit of travel than driving, although the exact value is diffi cult to determine because total pedestrian and bicycle travel and accidents are not measured.[19] Since bicyclists tend to travel shorter distances than drivers,[20] the relative accident risk per trip is lower than per mile. If accident risk is defi ned in terms of total health risk, the aerobic benefi ts of walking and bicycling compensate for accidents.[21] One estimate concludes that the aerobic exercise of bicycling outweighs incremental accident risk by 20 to 1 in average life expectancy.[22]
9.6 Benefi ts of cycling
Although is may seem logical and reasonable to argue that cycling benefi ts to the urban transport system it is of utmost importance to quantify in economical terms the contribution of cycling as part of an urban transport system. As mentioned earlier in this chapter argument building for politicians and other interested actors in the fi eld of urban development and urban transport is very important. (see also the chapter 8)

120 121
Photo 33: Taxi in Paris (Photo T. Daggers)
In analyzing cost and benefi ts of cycling the argument in calculation in the bicycle project in Bogotá has been to show what happens in different scenarios in which cycling has a different percentage of the overall modal split. Based on this different scenarios an estimation on which part of motorized traffi c would be substituted by cyclist was calculated. Based on the fi gures mentioned in the earlier paragraphs it was possible to calculate the benefi ts of less motorized traffi c by individual car drivers, and replacement of bus passengers. Figures were available of car and bus occupancy rates to calculate what would be the consequences of a modal split of cycling of 1%, 3%, 5% and 10 % of the overall modal split in a 5 to 10 year period.
The results were remarkable because of the fact that even in the less positive scenario the Cost/ Benefi t ratio was positive. Calculations on Internal rate of Return (IRR) of the investment showed fi gures varying between 8 till 136 % fi gures which would make every banker and private investor jealous!!
Cost benefi t rate and Internal Rate of Return in different scenarios en Bogotá
source IBC may 2000 T. Daggers
C/B Rate and IRR
In different scenarios benefi ts
cost 2000 2001 2002 2003 2004 2005 2006 2007 2008 2009
1% -177871636 23821673 24417215 25027646 25653337 26294670 26952037 27625838 28316484 29024396 29750006
IRR 8%
C/B 1,5
3% -177871636 71465020 73251646 75082937 76960010 78884011 80856111 82877514 84949452 87073188 89250017
IRR 41%
C/B 4,5
5% -177871636 119108367 122086076 125138228 128266684 131473351 134760185 138129189 141582419 145121980 148750029
IRR 69%
C/B 7,5
10% -177871636 238216734 244172153 250276456 256533368 262946702 269520370 276258379 283164868 290243959 297500058
IRR 136%
C/B
Conclusion: from an economic point of view investments in cycling infrastructure and cycling promotion campaigns can be highly profi table

120 121
10 synthesis: what to do and where to start?
By Ton Daggers IBC The Netherlands
Cycling is a growing phenomena all over the world. Improving cycling in cities in Latin America and Europe is not an easy and short-term process, neither can it be isolated from traffi c and transport planning processes en general. Even if cycling promotion with all its aspects is integrated in the cities traffi c and transport planning, a long breath is necessary to improve the conditions of cyclists.
As cycling conditions are a result of cycling climate where hard and soft factors can be distinguished, the essential question is:” how can the cycling climate be infl uenced? “Generally the vision on how the city government looks at development is essential for the opportunities and conditions in which cycling can be stimulated.The cities that participated in this URB-AL project vary according to cultural, economical and social aspects of their inhabitants.
Working together, the different actors, and stake holders as politicians, decision makers, advocacy groups and technicians combined with consultants and other experts, have to share a vision in what direction they want to develop their city. Without a vision all the forces have free play and the rapid growth of motorized traffi c in most of the cities worldwide, show the negative impacts on health, environment, congestion and livability in our urban centers.As said in a Handbook from the European Commission:”Cycling a way ahead of cities”:
” It is in this context that I have decided to take the unusual step of approaching you directly as elected decision-makers for towns and cities of the European Union. The handbook Cycling: the way ahead for towns and cities stems from the idea “that the worst enemies of the bicycle in urban areas are not cars, but long held prejudices”.Ritt BJERREGAARD European Commissioner [23]
The contributors of this handbook are not by any means convinced that the bicycle can be THE SOLUTION FOR THE TRANSPORT AND TRAFFIC PROBLEMS IN THE CITIES, however that improving conditions for cycling can and has proven to have in itself and multiplier effect on the city as a whole can be seen in many examples described in this handbook.
If a pro-cycling policy interests you, you are not alone. When town centers have been remodeled for pedestrians, cyclists often fi nd their place in them quite naturally.Wherever cars are no longer taking up all the space, bicycles pop up. But if decisions have to be taken between making room for car traffi c and for cyclists, the choices made are sometimes draconian. How is one to choose between the demand for cycling facilities on the one hand and the ‘requirements’ of car traffi c on the other? What limitations can we allow to be imposed on one mode of transport in order to give the other its chance?
Where to start a process of improving cycling conditions depends much of the local situation. Is cycling a part of the actual transport system, is cycling declining or is it
“hot”, in how far social and or traffi c safety is an issue are all factors which infl uence the point where to start. As can be read in chapter 2 of these handbook 14 cities participated in this Phase A URB-AL project, all cities with different characteristics and starting points. Nevertheless it was remarkable that the participating cities on the 2 continents had more in common analyzing their problems and possible solutions than to expect on the fi rst sight.

122 123
An important statement is that cycling is not the solution but can be an important part of the solution when integrated in a consistent traffi c policy. A combination of public transport facilities together with safe cycling circumstances can reckon on lot of public support.Turning the advantages of cycling into policies makes it necessary to fi rst defi ne objectives of cycling strategy. Objectives give structure and transparency to the planning process. They are fundamental in the implementation process. When a set of clear objectives is defi ned, strategies and measures will become transparent and a common base for action for planners as well as for politicians and other stakeholders.
Possible objectives should not be limited to cyclists only. Increasing safety, improving health conditions, introducing traffi c calming measures can all be objectives combined with a cycling promoting strategy.
In the process of implementing a coherent cycling strategy, all kind of stake holders are involved: politicians, urban planners, civil engineers, but also marketing specialists, ngo’s and professional activists are part in the process of creating a cycling promotion strategy. To coordinate between all type of actors and to coordinate the different actions, in many cities a commissioner for non motorized transport is in function. Task and competency depend on local situations but by creating such a task offi cer is one of the fi rst steps in institutionalizing a local cycling policy.
Creating infrastructure for cyclists is often seen as a fi rst step towards creating a safer cycling environment. Where to start, how to defi ne a network, segregation of cycle tracks or the opposite is often the beginning of a process with many questions and no clear answers. The vision on cycling, should be the leading concept to answer questions on the general level. Balances between motorized and non-motorized transport have to be redefi ned.
On a more basic level, designs can be made on the hierarchical concept of form, function and use of cycle infrastructure. Defi ning a cycling network is an essential tool not only to defi ne the hierarchy in primary, secondary and residential cycle roads. Once the cycle network is defi ned, it allows to combine road maintenance and creating cycle infrastructure at low cost.
Considering cycling infrastructure, safety aspects mostly are the most important to be considered in the moment road designs are developed. Especially at junctions the confl icts between “slow” and “fast” traffi c modes ask for special solutions. More and more technical handbooks exist to assist in the search for solutions. Stil a lot can be learned from other experiences and it should be clear that European and Latin American cities, although many experiences can be exchanged should look for own designs and solutions adapted to their local circumstances.
Without cyclists not any cycling strategy will be effective. Although some large investments have been done in some metropolitan areas, not all of them have led to an increase in cyclists. Key factor for success in a cycling promotion policy seems to be found in the combination of creating cycle infrastructure together with a successful public awareness campaign. Several examples, for instance the campaign launched in London on road pricing and the Bogotá campaign on Car Free Days show how publicity campaigns combined with traffi c measures can have excellent results. A good balance between objectives, measures and effects can give good results. The role of the media should not be underestimated. Also good alliances between stakeholders identifi ed are crucial for positive results.

122 123
From the economic point of view investments in cycling have proven to be highly cost effective. Surveys show that cost benefi t ratios on cycling investment programs in different cities all over the world are mostly positive.Benefi ts for cities as a whole can be found in more fl uent traffi c fl ows, more effi cient public transport, healthier living conditions , but also lesser accident risks and less pollution can be benefi ts of rationalizing the traffi c conditions by among others improving cycling conditions. Also on the personal level economic benefi ts can be expected as travel expenses are saved for the urban poor, the bicycle being a cheaper alternative for public transport.
Learning from each others experiences, for better or worse, respecting differences and checking applicability of other cities policies, makes this HANDBOOK a useful tool to develop all kinds of policies regarding cycling as a part of traffi c and transportpolicies . It should be obvious however that cycling can represent only part of the solution. Combining objectives of cycling policies with environmental, sustainable or other campaigns strengthens the effect of overall traffi c campaigns.
As this handbook is only the result of a fi rst phase of the URBAL project “ Integration of cycling in cities in Europe and Latin America”, most of the items are not complete. More information can be obtained on the website of the project www.urbalcyclinginfo.org and at the resources listed at the end of this document.

124 125
Sources on the internet to be consulted
AcknowledgementsPart of this list of internet resources draws from resource lists of among others: the Victorian Transportation Policy Institute, SUSTRAN, GTZ SUTP-Asia and others
http://socrates.berkeley.edu:7001/Events/spring2002/04-08-penalosa Center for Latin American Studies, University ofCalifornia, BerkeleyA presentation by former Mayor of Bogotá, Enrique Penalosa, in which he outlines a vision for developing cities.http://www.cfi t.gov.uk Commission for Integrated TransportWide range of resources on transport (UK, European focus).http://www.civitas-initiative.org Civitas InitiativeCo-fi nanced by the EU, promoting sustainable transport pilot projects in 19 European cities.http://www.cstctd.org The Centre for Sustainable TransportationPromoting sustainable transport (based in Canada).http://www.gtz.de Deutsche Gesellschaft für TechnischeZusammenarbeit (GTZ) GmbHGerman Technical Cooperation.http://www.itdp.org Institute for Transportation and Development PolicyAn international NGO, based in New York and active in Latin America, Asia and Africa.http://www.movingtheeconomy.ca/home.html Mobility in the Developing WorldCase studies of sustainable transport successes in developing cities.http://www.oecd.org/env Organisation for Economic Cooperation andDevelopmentEnvironment Directorate resources include the Environmentally Sustainable Transport (EST) program.http://www.polis-online.org Polis: Cities and Regions Networking for InnovativeTransport SolutionsEuropean integrated approaches to urban mobility in a wide range of policy areas.http://www.sustainable.doe.gov Smart Communities Network - Energy SmartCommunitiesCenter of Excellence for Sustainable Development is a US Dept. of Energy program. Links to mobility management resources and others.http://www.sustainablemobility.org World Business Council for SustainableDevelopmentWBCSD Sustainable Mobility program, includes e-bulletins, workshops and consultations, with presentations and reports available fordownload.http://www.sutp.org/themes/1-policy/1a-policy.aspx SUTP-AsiaUrban Transport Sourcebook module and related resources.http://www.sutp-asia.org GTZ’s Sustainable Urban Transport Project in AsiaCapacity-building in urban transport in Asia, working with selected city governments.http://www.tellus-cities.net TELLUS - Bringing CIVITAS Onto the RoadA transport project in 5 European cities promoting integrated policy measures (PT, NMT, TDM, awareness, institutional coordination,safety, PSP).http://www.umwelt-verkehr.de/bfi vs Büro für integrierte Verkehrsplanung undStadtentwicklungOffi ce for Integrated Traffi c Planning and Urban Development (German language).

124 125
Urban transport institutionshttp://europa.eu.int/comm/transport/index_en.html EUROPA - TransportThematic ‘transport’ site of the European Commission. Information on EC activities and programs, White / Green Papers, all modes.http://www.bma.go.th Bangkok Metropolitan Administration (BMA)An overview of traffi c and transport projects which fall under the authority of the BMA.http://www.curitiba.pr.gov.br/pmc Prefeitura Municipal de CuritibaThe municipality of Curitiba, Brazil (mostly in Portuguese).GTZ SUTP-Asia recommended web links 07-Nov-03http://www.delhitraffi cpolice.nic.in Delhi Traffi c Police, IndiaDelhi traffi c police site, stressing safety issues.http://www.globalideasbank.org The Global Ideas BankIncludes resources on Curitiba’s success.http://www.gtz.de/urbanet URBANET - Network for Decentralization andMunicipal DevelopmentNetwork for GTZ staff, associated professionals and researchers in the fi eld of decentralization and municipal and urban development.http://www.gtzsfdm.or.id GTZ decentralisation program in IndonesiaDecentralisation and institutional capacity in Indonesia.http://www.info.gov.hk/tb Hong Kong SAR GovernmentIncludes links to transport and environment sites and information about institutional arrangements and bus service franchising.http://www.ippuc.pr.gov.br IPPUC, Curitiba Urban Research and PlanningInstituteExplains how the Curitiba success story emerged.http://www.lta.gov.sg Land Transport AuthorityTransport authority in Singapore. Information on MRT, licensing, road construction and details of pricing schemes.http://www.sutp.org/themes/1-policy/1b-institutions.aspx SUTP-AsiaUrban Transport Sourcebook module and related resources.http://www.transmilenio.gov.co Transmilenio S.A.World class BRT system in Bogotá, Colombia.http://www.unhabitat.org United Nations Human Settlements Programme (UNHABITAT)Promotes sustainable urbanization through monitoring, policy formulation, institutional reform, capacity-building, technical cooperationand advocacy.
Public awareness campaignshttp://www.bikewalk.org NCBW Resource CenterThe National Center for Bicycling & Walking is working for more bicycle-friendly and walkable communities.http://www.earthday.net Earth Day NetworkAn alliance of 5,000 groups in 184 countries working to promote sustainability.http://www.ecoplan.org/children Children on the Move!Deals with children’s mobility interests.http://www.eta.co.uk Environmental Transport AssociationProviding breakdown and insurance service, whilst campaigning for greener transport (UK).http://www.foe.org.uk/campaigns Friends of the Earth CampaignsA UK-based organisation with a project on sustainable traffi c.http://www.goforgreen.ca Go for GreenCanadian campaign including safe routes to school and active transportation.GTZ SUTP-Asia recommended web links 07-Nov-03http://www.hangin.org Clean Air CoalitionA high profi le public awareness campaign focusing on clean air in Metro Manila, funded by the ADB.http://www.learntoletgo.org.uk Learn to let go!Apart from being an aggressive campaign, this site has a good list of links and news to other events.

126 127
http://www.levego.hu The Clean Air Action GroupThe CAAG is an environmental NGO in Hungary.http://www.pedestrians.org.uk Living StreetsA site promoting pedestrian’s interests (UK).http://www.qccqld.org.au/smogbusters Smogbusters QueenslandAdvocacy and resources for clean air and sustainable transport.http://www.saferoutestoschools.org.uk Safe Routes to SchoolsWalking to school, cycling to school, road safety, traffi c safety, healthy travel.http://www.straphangers.org The Straphangers CampaignThe Straphangers Campaign is a voice for New York’s nearly 7 million daily subway and bus riders.http://www.sustainable-cities.org Welcome to Campaign InteractiveProvides a forum for cities to engage in information exchange about the Agenda 21 processes, particularly in EU cities.http://www.sutp.org GTZ’s Sustainable Urban Transport Project inSurabayaSUTP worked in several policy areas. Many reports available for download, in Indonesian and English languages.http://www.transport.qld.gov.au/cycling Queensland Transport: CyclingBrisbane City, Australia, promotes cycling, walking, and buses, with regular events announced at this site.http://www.tstc.org Tri-State Transportation CampaignAn alliance of public interest, transit advocacy, planning and environmental organisations working to reverse car dependency and sprawlin New York region.http://www.vcd.org Verkehrsclub Deutschland e.V.Environmental Transport Association: Campaigning for greener transport (German language).http://www.waytogo.icbc.bc.ca Way to Go! School ProgramA RoadSense project that fosters safer, healthier travel alternatives for elementary and middle school students.http://www3.cleartheair.org.hk Clear The Air - Hong KongA public awareness campaign promoting measures to reduce air pollution in Hong Kong.Car free zones / dayshttp://www.autofrei.de Autofrei leben! E.V.A German organisation promoting car-free development (German language).http://www.carfre.org Fremantle Car Free DaysCar Free Day in Freemantle, Australia, that took place on May 9, 2002. Other CFD resources.http://www.carfree.com Carfree CitiesAs well as car-free resources, materials on a range of TDM topics.http://www.earthday.net Earth Day NetworkAn alliance of 5,000 groups in 184 countries working to promote sustainability.http://www.ecoplan.org/carfreeday World Car Free Days CollaborativeWorld Car Free Days collaborative.http://www.eta.co.uk Environmental Transport AssociationProviding breakdown and insurance service, whilst campaigning for greener transport (UK).http://www.lesstraffi c.com Less Traffi cResources on traffi c reduction and street reclaiming.http://www.transalt.org Transportation Alternatives in New York CityA member-supported New York City-area citizens’ group working for better bicycling, walking and public transit, and fewer cars.GTZ SUTP-Asia recommended web links 07-Nov-03http://www.uncfd.org United Nations Car Free DaysUN Department for Economic and Social Affairs has started the UNCFD as a way to promote and encourage the use of ground level,citizen based approaches to sustainability.

126 127
Transport and povertyhttp://www.geocities.com/transport_research Transport and Society ResearchDeals with the two main topics of social exclusion & transport, and gender & transport.http://www.transport-links.org/rcs DFID Transport Resource CentreThe TRCS is a world-wide consortium of groups and individuals with specialist knowledge in the fi eld of transport research. Site includesthe Rural Transport Knowledge Base.http://www.worldbank.org/html/fpd/privatesector World Bank Private Sector DevelopmentAims to assist the poor through market-friendly growth, and to provide better services delivery and smart subsidies.http://www.worldbank.org/transport/forum2003/agenda.htm World Bank Transport Forum 2003: emergingpriorities for transportLarge range of papers, most available for download, rich in international experience.http://www.xaccess.org Xaccess - The XtraCycle Access FoundationXaccess aims to make load-carrying bicycles available to the poor.Transport and genderhttp://www.cityshelter.org/13_mobil/start-mobil.htm Mainstreaming du Genre et MobilitéMany resources, including a section on gender issues and transport mobility.http://www.geocities.com/transport_and_society/genderedjourneys/ Gendered journeys: equity, effi ciency and women’stransport patternsOnline resources on gender and transport.http://www.geocities.com/transport_and_society/ruralinclusion.html Gender, social inclusion and rural infrastructureservicesPrepared for the world bank, with links to other resources on the topic.http://www.geocities.com/transport_research Transport and Society ResearchDeals with the two main topics of social exclusion & transport, and gender & transport.http://www.worldbank.org/gender/transport/ World Bank Gender and TransportIncludes various studies, tools and resources.
Transport and global warminghttp://www.cnt.org Center for Neighborhood TechnologyContains a number of sub-web sites on various transport topics, including location effi cient mortgages.http://www.doc.mmu.ac.uk/aric/arichome.html ARICARIC provides research & education in atmospheric & sustainability issues.http://www.ec.gc.ca/emission/toce.html Exhaustion: A Guide to Transportation EmissionsEasy-to-read fact sheets mainly on fuel-related topics, with a Canadian focus.http://www.environmentaldefense.org Environmental DefenseUS non-profi t organization representing more than 300,000 members.http://www.epa.gov U.S. Environmental Protection AgencyMany resources, particularly strong on AQM. Also advocacy, fuels, TDM, and global warming resources.http://www.gefweb.org Global Environment FacilityGEF helps developing countries fund projects that protect the global environment. Site provides a list of projects worldwide, informationand application forms.http://www.gtz.de/climate/english GTZ Climate Protection ProgramGTZ Climate Protection Program.http://www.helio-international.org HELIO InternationalHELIO’s goals are to assess, monitor and publicise the contribution of energy systems to sustainable development. Links to individualcountry reports.GTZ SUTP-Asia recommended web links 07-Nov-03http://www.iclei.org International Council for Local EnvironmentalInitiatives

128 129
ICLEI is an international association of local governments implementing sustainable development.http://www.iea.org International Energy AgencyMultinational agency dealing with energy issues.http://www.ipcc.ch Intergovernmental Panel on Climate Change (IPCC)An intergovernmental body that provides scientifi c, technical and socio-economic advice to the world community.http://www.oecd.org/env Organisation for Economic Cooperation andDevelopmentEnvironment Directorate resources include the Environmentally Sustainable Transport (EST) program.http://www.pewclimate.org/projects/transportation_overview.cfm Pew Center on Globlal Climate ChangeTransportation in Developing Countries: An Overview of Greenhouse Gas Reduction Strategies.http://www.sierraclub.org Sierra Club Home Page: Explore, Enjoy and Protectthe PlanetCampaigns include sprawl and global warming.http://www.wuppertal-institut.de Wuppertal InstituteThe work of the Wuppertal Institute is interdisciplinary and oriented to solving problems in the area of applied sustainability research.
An independent research organisation working on a wide range of sustainable transportation issues, based in Canada.Mobility managementhttp://adb.org/Documents/Events/2002/RETA5937/Manila/ Transport Planning, Demand Management, and AirQualityDocumentation and presentations from the ADB workshop in Manila, Feb. 2002.http://minaret.lincoln.ac.nz/rideshare The Lincoln Connection - RideshareRideshare program of the Lincoln University (New Zealand).http://pti.nw.dc.us/task_forces/transportation/docs/trafcalm PTI: Slow Down, you’re going too fast!Community guide to traffi c calming.http://tmi.cob.fsu.edu/act/act.htm Association for Commuter TransportationTDM materials (US focus).http://wbln0018.worldbank.org/transport/utsr.nsf World Bank Urban Transport Strategy ReviewIncludes contributing reports, notably on TDM (Cracknell), mass transit options (Allport), and NMT (I-CE).GTZ SUTP-Asia recommended web links 07-Nov-03http://worldcarshare.com The World Carshare ConsortiumCarshare platform from The Commons.http://www.best.bc.ca Better Environmentally Sound TransportationPromoting sustainable transportation alternatives (Canadian focus).http://www.carfree.com Carfree CitiesAs well as car-free resources, materials on a range of TDM topics.http://www.carsharing.de BCS - Bundesverband CarSharingThe head organisation of carsharing in Germany (German language).http://www.carsharing.org European CarSharingA European carsharing site (German and English languages).http://www.civitas-initiative.org Civitas InitiativeCo-fi nanced by the EU, promoting sustainable transport pilot projects in 19 European cities.http://www.cnt.org Center for Neighborhood TechnologyContains a number of sub-web sites on various transport topics, including location effi cient mortgages.http://www.commuterchallenge.org Commuter Challenge--Moving Business ForwardInformation on employer commuting programs for businesses in King County, Washington.http://www.commutercheck.com Commuter CheckA USA transport demand management program.http://www.commuterchoice.gov Commuter Choice Leadership Initiative (CCLI)Information for employers and commuters (US program).

128 129
http://www.cordis.lu/cost-transport/src/cost-342.htm Parking Policy Measures, and Effects on Mobilityand EconomyProject on parking policy ending Sept. 2002, Europe-wide orientation. Several country studies.http://www.dpi.wa.gov.au/travelsmart Dept. for Planning and Infrastructure, TravelSmartA successful Western Australian community-based program that encourages alternatives to car use.http://www.elsevier.com/gej-ng/29/29/konsult Knowledgebase on Sustainable Urban Land Useand TransportInformation on the performance of a wide range of urban transport policy instruments.http://www.epa.gov U.S. Environmental Protection AgencyMany resources, particularly strong on AQM. Also advocacy, fuels, TDM, and global warming resources.http://www.epa.gov/oms/traq EPA - Offi ce of Transportation and Air QualityProvides regulators with information on transport incentive-based programs, partnership opportunities, grant sources, technicalassistance (US focus).http://www.epommweb.org European Platform on Mobility ManagementMany mobility management resources, including training courses.http://www.iiec.org The International Institute for Energy ConservationIncludes documents on transport issues in Asia, Latin America, and Europe.http://www.mzm-online.de Förderkreis für Mobilitätszentralen undMobilitätsmanagementAn organisation for mobility management (German language). Extensive links.http://www.sustainable.doe.gov Smart Communities Network - Energy SmartCommunitiesCenter of Excellence for Sustainable Development is a US Dept. of Energy program. Links to mobility management resources and others.http://www.sutp.org/themes/2-tdm/2b-tdm.aspx SUTP-AsiaUrban Transport Sourcebook module and related resources.http://www.traffi ccalming.org Traffi c Calming GuideTraffi c calming and neighbourhood traffi c management, including impacts, drawbacks and past experiences.http://www.transport2000.org.uk/campaigns/TourismWithoutTraffi c.htm Tourism without traffi cUK-oriented movement involving 17 local councilshttp://www.verkehrsplanung.com Gesellschaft für fahrgastorientierte VerkehrsplanungAssociation for traffi c planning (in German language).GTZ SUTP-Asia recommended web links 07-Nov-03http://www.vtpi.org Victoria Transport Policy InstituteAn independent research organisation working on a wide range of sustainable transportation issues, based in Canada.http://www.wsdot.wa.gov/mobility/TDM/TDMhome.html WSDOT - Transportation Demand ManagementCenterResources on transport demand management from Washington State DOT.http://yosemite.epa.gov/aa/tcmsitei.nsf TCM Site information exchangeA US EPA searchable database of TDM program case studies.
Non-motorised transport - generalhttp://europa.eu.int/comm/environment/cycling/ European Commission non motorised transport siteCycling good practices guide, including greenways reports.GTZ SUTP-Asia recommended web links 07-Nov-03http://ntl.bts.gov The National Transportation LibraryLarge range of transport resources, from US Dept. of Transport.http://www.best.bc.ca Better Environmentally Sound TransportationPromoting sustainable transportation alternatives (Canadian focus).http://www.bikewalk.org NCBW Resource CenterThe National Center for Bicycling & Walking is working for more bicycle-friendly and walkable

130 131
communities.http://www.californiabike.com California BikeAn initiative of ITDP providing a high quality mobility tool for reducing transport costs in Africa.http://www.clf.org/transportation Conservation Law Foundation TransportationAdvocacyA resource for people working to create more livable communities by improving transportation.http://www.ecf.com EFC European Cyclists’ FederationA portal for European cyclist associations.http://www.ibike.org International Bicycle FundA comprehensive index of worldwide resources and links on bicycling. Includes regional indexes.http://www.ihpva.org International Human Powered Vehicle Association(IHPVA)An association of national associations and organisations promoting design and development of human-powered vehicles.http://www.itdp.org Institute for Transportation and Development PolicyAn international NGO, based in New York and active in Latin America, Asia and Africa.http://www.umkehr.de Umkehr e.V.An organization promoting alternative transportation (German language).http://www.urbalcyclinginfo.org/pages/frameenglish.html URB-AL Cycling InfoPhotos and city presentations, including on “integration of bicycles in the traffi c engineering of Latin American and European mediumsized cities”
NMT planning and regulationhttp://wbln0018.worldbank.org/transport/utsr.nsf World Bank Urban Transport Strategy ReviewIncludes contributing reports, notably on TDM (Cracknell), mass transit options (Allport), and NMT (I-CE).http://www.aashto.org AASHTO: Transportation Center of ExcellenceAmerican Association of State Highway and Transportation Offi cials. Several sub-sites on various topics.http://www.fhwa.dot.gov/environment Planning, Environment, & Realty (HEP)The US Federal Highway Administration planning and environment section.http://www.roads.dtlr.gov.uk/roadnetwork/ditm/tal/cycle Cycle Facilities IndexPart of the DTLR (UK) Traffi c Advisory Leafl et series. A list of links to best practices in bicycle regulation.http://www.sutp.org GTZ’s Sustainable Urban Transport Project inSurabayaSUTP worked in several policy areas. Many reports available for download, in Indonesian and English languages.http://www.sutp.org/themes/3-transit/3d-nmt.aspx SUTP-AsiaUrban Transport Sourcebook module and related resources.http://www.transalt.org Transportation Alternatives in New York CityA member-supported New York City-area citizens’ group working for better bicycling, walking and public transit, and fewer cars.
Bicycle infrastructurehttp://bikesbelong.org Bikes Belong CoalitionBicycle advocacy group founded by bicycle industry leaders (US-based).http://cycling.org Cyber Cyclery - Internet Bicycling HubAn information centre on cycling-related topics.http://probicycle.com ProBicycle: “Advocacy by Cyclists For Cyclists”News and articles related to bicycle traffi c. Based in the US but with international news stories.GTZ SUTP-Asia recommended web links 07-Nov-03http://www.adfc.de Allgemeiner Deutscher Fahrrad Club e.V.The German bicycle association (German language).http://www.afribike.org Welcome to AfribikePromoting urban bicycle traffi c in Africa.http://www.bicyclinginfo.org Pedestrian and Bicycle Information Center

130 131
Resources promoting safe places for walking and cycling.http://www.cyclingpromotion.com Cycling Promotion FundThe ACPF promotes cycling in Australia by building partnerships and supporting campaigns.http://www.dpi.wa.gov.au/metro/gettingthere/cycling Department of Planning and Infrastructure, WesternAustraliaReports on bicycle use and advocacy, including the Bicycle User Group manual.http://www.muenster.de/stadt Stadt MünsterThe City of Münster, a leader in bicycle facilities and bicycle-oriented traffi c management (German language). A highlight is the
“Radstation”.http://www.re-cycle.org Relieving Poverty by taking Used Bikes To NewTerritoriesRe-Cycle’s mission is to collect and ship second hand bicycles and parts to developing countries.http://www.roads.dtlr.gov.uk/roadnetwork/ditm/tal/cycle Cycle Facilities IndexPart of the DTLR (UK) Traffi c Advisory Leafl et series. A list of links to best practices in bicycle regulation.http://www.transport.qld.gov.au/cycling Queensland Transport: CyclingBrisbane City, Australia, promotes cycling, walking, and buses, with regular events announced at this site.http://www.web.net/~detour Intersection online - A Car-Free WebsiteCBN is a community-based bicycle organisation promoting sustainable transportation initiatives within the City of Toronto.http://www.ziv-zweirad.de Zweirad Industrie VerbandThe association of the German bicycle manufacturers (German language).
Urban road safetyhttp://europa.eu.int/comm/transport/index_en.html EUROPA - TransportThematic ‘transport’ site of the European Commission. Information on EC activities and programs, White / Green Papers, all modes.http://nsc.org/issues/drivsafe.htm Driver Safety (National Safety Council)Road safety issues focusing on drivers, US-oriented.http://ntl.bts.gov The National Transportation LibraryLarge range of transport resources, from US Dept. of Transport.http://pti.nw.dc.us/task_forces/transportation/docs/trafcalm PTI: Slow Down, you’re going too fast!Community guide to traffi c calming.http://www.delhitraffi cpolice.nic.in Delhi Traffi c Police, IndiaDelhi traffi c police site, stressing safety issues.http://www.dvr.de DVR - Deutscher VerkehrssicherheitsratGerman Road Safety Council (material in German and English).http://www.etsc.be The European Transport Safety Council (ETSC)An international non-governmental organisation working on road safety in Europe.http://www.fhwa.dot.gov/environment Planning, Environment, & Realty (HEP)The US Federal Highway Administration planning and environment section.GTZ SUTP-Asia recommended web links 07-Nov-03http://www.grsproadsafety.org Global Road Safety Partnership (GRSP)A global partnership between business, civil society and governmental organizations collaborating to improve road safety conditions.http://www.hwysafety.org IIHS/HLDI: Crash Testing & Highway SafetyInsurance Institute for Highway Safety. Research focuses on countermeasures aimed factors in motor vehicle crashes (human, vehicular,and environmental).http://www.lapri.org Prevention Routière InternationalNGO promoting road safety. Many countries involved.http://www.nhtsa.dot.gov NHTSA - National Highway Traffi c SafetyAdministrationComprehensive highway traffi c safety resources.
132 133
http://www.oecd.org/env Organisation for Economic Cooperation andDevelopmentEnvironment Directorate resources include the Environmentally Sustainable Transport (EST) program.http://www.roadpeace.org RoadPeaceBritain’s charity for road traffi c victims.http://www.roads.dft.gov.uk UK DOT - Roads, Vehicles and Road SafetyReports on road transport related topics.http://www.rospa.co.uk/cms RoSPA : Royal Society for the Prevention ofAccidentsProviding information, advice, resources and training.http://www.spokes.org.uk/isitsaf.htm Road Danger Reduction ForumIs It Safe? - A guide to road danger reduction.http://www.sutp.org/themes/5-impacts/5b-safety.aspx SUTP-AsiaUrban Transport Sourcebook module and related resources.http://www.transact.org The Surface Transportation Policy ProjectSTPP areas of activity include health & safety, social equity & liveability, economy, and energy use & environmental protection. US-based.http://www.trl.co.uk Transport Research LaboratoryThe TRL focuses on land transport issues. Most reports are only available on a subscription basis.http://www.unescap.org United Nations Economic and Social Commissionfor Asia and the Pacifi c (ESCAP)A major focus is inter-urban roads in Asia, also work on safety and participatory transport planning in Bangkok.
Resource materials
Internet resource centreshttp://cutr.eng.usf.edu Center for Urban Transportation ResearchA major research centre on many urban transport topics, including transit, safety, fuels, TDM, etc. (US-oriented).http://newmobility.org The New Mobility AgendaPromotes new ways of thinking about mobility in cities. From The Commons.http://ntl.bts.gov The National Transportation LibraryLarge range of transport resources, from US Dept. of Transport.http://ntl.bts.gov/tldir Directory of Transportation Libraries andInformation CentersComprehensive list of links to transportation libraries and information centres worldwide.http://ntl.bts.gov/tris TRIS OnlineA bibliographic database of transport resources.http://sd-online.ewindows.eu.org Sustainable Development OnlineLinks to wide range of sustainable development topics.http://transweb.sjsu.edu/links.htm Mineta Transportation Institute (US)A comprehensive and well-organised list of links to transport topics.http://www.aashto.org AASHTO: Transportation Center of ExcellenceAmerican Association of State Highway and Transportation Offi cials. Several sub-sites on various topics.http://www.bestpractices.org UN-HABITAT Best Practices DatabaseA database with over 1600 best practice entries on urban issues. Over 140 countries.http://www.bremen.de/gcd Global Cities DialogueA network of sustainable cities (German language). Part of the global cities dialogue.http://www.bts.gov Bureau of Transportation StatisticsProvides transportation information and statistics (US).http://www.clip.gov.uk/groups/transport/sub_transport.htm CLIP - Sub-groups - TransportTransport statistics (UK).http://www.cordis.lu/transport Transport RTD Research (European Commission)Includes a variety of research projects and resources.http://www.eltis.org European Local Transport Information Service

132 133
Europe’s portal for local transport news and events, transport transport measures, policies and practices.http://www.europa.eu.int/comm/eurostat EurostatEurostat - statistical offi ce of the European Commission.http://www.fgm-amor.at Forschungsgesellschaft MobilitätAn Austrian site researching mobility, with links to various European initiatives.http://www.fta.dot.gov Federal Transit AdministrationA variety of resources for transit planning. Includes the National Transit Library and databases.http://www.geocities.com/sustrannet Sustainable Transport Action Network for Asia andthe Pacifi cSo far the main activity of the SUSTRAN network has been information-sharing.http://www.gn.apc.org/ifrtd International Forum for Rural Transport andDevelopmentIFRTD is a network aiming to improve rural accessibility and mobility.http://www.ibike.org International Bicycle FundA comprehensive index of worldwide resources and links on bicycling. Includes regional indexes.http://www.metropolis.org MetropolisThe Metropolis Association is represented by 77 member cities.http://www.movingtheeconomy.ca/home.html Mobility in the Developing WorldCase studies of sustainable transport successes in developing cities.GTZ SUTP-Asia recommended web links 07-Nov-03http://www.nationalacademies.org/trb/tris.nsf Transportation Research Information Services(TRIS)A bibliographic resource on transportation information.http://www.nottingham.ac.uk/sbe/planbiblios/bibs/sustrav/refs/ Sustainable Urban Travel: Index to comprehensivebibliographyAn large index with of links to bibliographies dealing with sustainable transport.http://www.organizenow.net/odb/odb.php The Organizer’s Database: ODBA membership database program tailored to the needs of small non-profi t and grassroots organizing campaigns.http://www.partnerships.stockholm.se Stockholm Partnerships for Sustainable CitiesA platform for Sustainable Cities to present themselves, with news, projects, events and features.http://www.people.hofstra.edu/geotrans/index.html Transport Geography on the WebOn-line training resources on transport geography.http://www.skat.ch/ti/netw/transweb/tw_sitemap.html TransWebSwiss Agency for Devt. and Cooperation. TransWeb is a guide to global transportation resources.http://www.sutp.org/links.aspx SUTP-AsiaUrban Transport Sourcebook module and related resources.http://www.sutp-asia.org GTZ’s Sustainable Urban Transport Project in AsiaCapacity-building in urban transport in Asia, working with selected city governments.http://www.traffi clinq.com Traffi c Engineering and Transportation EngineeringSearch DirectoryWell organised, regularly updated list of transport links.http://www.transport2000.org.uk Transport 2000 WebsiteTransport 2000 is a UK body concerned with sustainable transport.http://www.transportroundtable.com.au Transport Roundtable AustralasiaConferences to promote research and capacity building in transport strategy, policy, management and operations.http://www.transportweb.com The Transport WebLinks to transport information and services.http://www.trb.org Transportation Research BoardOnline resources from the TRB.http://www.un.org/esa/sustdev/csd.htm United Nations Sustainable DevelopmentLinks to all fi elds of sustainability.http://www.vtpi.org Victoria Transport Policy InstituteAn independent research organisation working on a wide range of sustainable transportation issues, based in Canada.

134 135
http://www.worldbank.org/transport The Worldbank Group - TransportLinks, reports on and resources on a wide range of urban transport issues.http://www.worldbank.org/wbi/cleanair/caiasia Clean Air Initiative for Asian Cities (CAI-Asia)CAI-Asia promotes ways to improve the air quality of Asian cities, focusing on mobile sources.http://www.worldbank.org/wbi/cleanair/cailac/infopool/ Clean Technologies Information PoolFocus on technologies for cleaner buses, trucks, and fuels. Part of CAI - Latin America.
Audio-visual resourceshttp://www.cnu.org Congress for the New UrbanismA professional organization and information resource for New Urbanism community planning.http://www.detourpublications.com Detour Publications - Books on SustainableTransportationSustainable transport and urban ecology titles - books, magazines, videos and CDs.http://www.pedbikeimages.org Pedestrian and Bicycle Info Center Image LibraryPictures and images of walking and cycling.http://www.pedestrians.org Perils for PedestriansA monthly television series promoting awareness of issues affecting the safety of pedestrians.GTZ SUTP-Asia recommended web links 07-Nov-03http://www.valuepricing.org Value PricingInformation on congestion pricing. Videos on Trondheim toll ring and other [email protected] GTZ Urban Transport Photo CDA double CD of transport-related photos from cities around the world, organised according to city.
Transport research (general)http://ntl.bts.gov The National Transportation LibraryLarge range of transport resources, from US Dept. of Transport.http://www.bast.de Die BASt - Bundesanstalt für Strassenwesen(Federal Highway Research Institute)Research on maintainance, improvement and management of road traffi c (mainly in German language).http://www.cordis.lu/transport Transport RTD Research (European Commission)Includes a variety of research projects and resources.http://www.istp.murdoch.edu.au Institute for Sustainability and Technology PolicyA research institute; part of Murdoch University in Perth, Australia.http://www.ite.org Institute of Transportation Engineers (ITE)An international individual member educational and scientifi c association (US focus).http://www.research.dtlr.gov.uk/transport/04.htm Department for Transport,Local Government and the Regions DTLR TransportResearchExtensive resources on transportation and land use planning, travel demand management, and traffi c calming.http://www.spur.org The San Francisco Planning and Urban ResearchAssociationA public policy think tank.http://www.staffs.ac.uk/schools/sciences/geography/cast CAST - The Centre for Alternative and SustainableTransportCAST is a research and consultancy centre. Staffordshire University, UK.http://www.trl.co.uk Transport Research LaboratoryThe TRL focuses on land transport issues. Most reports are only available on a subscription basis.http://www.ucl.ac.uk/transport-studies Centre for Transport Studies LondonUniversity College London and associated research institutions.http://www.uctc.net The University of California Transportation CenterA range of research reports.http://www.wuppertal-institut.de Wuppertal InstituteThe work of the Wuppertal Institute is interdisciplinary and oriented to solving problems in the area of applied sustainability research.http://www.ziv.de Institute for Integrated Traffi c and Transport
134 135
SystemsApplied research in traffi c and transport (German and English).
Mailing lists & discussion forumshttp://afdcweb.nrel.gov/documents/altfuelnews Alternative Fuel NewsThe Alternative Fuels Data Center is a US-focused resource centre of more than 3000 documents, newsletters, etc.http://cutr.eng.usf.edu Center for Urban Transportation ResearchA major research centre on many urban transport topics, including transit, safety, fuels, TDM, etc. (US-oriented).http://cycling.org Cyber Cyclery - Internet Bicycling HubAn information centre on cycling-related topics.http://groups.yahoo.com/group/sustran-discuss/ Sustran-discussThe Sustran discussion forum.http://www.fl ora.org/alt-transp Alternative Transportation ListDiscussion list on alternative transportation.http://www.fl ora.org/pednet PEDNET mailing listPedestrian issues discussion list.http://www.iangv.org International Association for Natural Gas VehiclesResources on natural gas vehicles.http://www.kopke.net/page5.html Transit Email ListsTransit-prof discussion forum.http://www.robinwood.de Robin Wood e.V.An environment protection organisation.http://www.verkehrsforum.de Das Deutsche Verkehrsforum e.V.A mobility forum (in German language).http://www.worldbank.org/cleanair Clean Air Initiative (CAI) for Cities Around the WorldThe CAI advances ways to improve air quality through partnerships and by sharing knowledge and experiences.

136 137
Handbook notes
Hfst 1
1 Development in practice, sustainable transport Worlbank2 Non-motorized Transport and Sustainable Development: Evidence from CalcuttaJohn Whitelegg1 and Nick Williams2
Hfst 2
3 In some cases the city shape (urban areas) and the whole area of the municipality is very different so that the area describes the city not in the same way like the morphology. This concerns the two regions (Gobernacion Atlantico and Bizkaia) and the cities Florianopolis, Rio Claro, Rio de Janeiro and Santiago de Chile.
Hfst 4
4 Planning for cycling supports road safety, in: Sustainable Transport, Planning for Walking and Cycling, in: Urban Environments. Edited by Rodney Tolley. Woodhead Publishing in Environmental Management, Cambridge, 2003. Chapter 13, page 172-188.
5 WALCYNG, How to enhance WALking and CyclING instead of shorter car trips and to make these modes safer; C. Hydén and A. Nilsson, Lund University Sweden; R.Risser, Factum Austria, 1998
6 The Dutch Bicycle Master Plan, description and evaluation in an historical context, Min. of Transport, 1999
7 Pucher, J. (1997), “Bicycle Boom in Germany: A Revival Engineered by Public Policy” in: ‘Transportation Quarterly 51 (4) and Pucher J. (2001), “The role of public policies in promoting the safety, convenience & popularity of bicycling”, in ‘World Transport Policy & Practice, Volume 7, (4), 2001
8 Buis, Jeroen, Sustainable Transport, Towards Integrated Policies and Planning for Sustainable Transport (in Dutch), Delft, 2000. In: Workbook for the course in Integrated Design (Integraal Ontwerpen), D14, Delft University of Technology, Faculty of Architecture, Delft.
9 Experiences and research from all over the world show that mass-motorisation and the accompanying decreased road safety for cycling is the single most important reason of the decline of bicycle use.
10 CROW, Handboek Categoriseren wegen op duurzaam veilige basis. Deel I (Voorlopige) Functionele en operationele eisen (Handbook Categorising roads on a sustainable safe basis. Part I (Preliminary) Functional and operational requirements), Ede, April 1997

136 137
hfst 7
11 detour factors in a one way system W.Hook Preserving and Expanding the Role of Non –Motorized Transport 2002
12 Rijnsburger and Daggers” Prevention of bicycle theft in the Netherlands and developing countries 1995”
hfst 9
13 justifi cation report cycling project Santa Fe de Bogotá, W. .Mulder and T. Daggers 199914 Zegras and Littman IIEC-LA 199715 Note: the average travel speed is from where the vehicle starts to where it stops again;
the door-to-door average includes the access to the vehicle and reaching the fi nal trip destination after leaving the vehicle. Door to door speed is calculated for an average trip length of 7 km. For longer distances the average speed of car and bus goes up gradually, while other modes remain constant. The data are derived from Replogle (1992) and de Langen (1993).
16 The economic signifi cance of cycling. VNG-I-ce 200017 Ted Miller, The Costs of Highway Crashes, FHWA (Washington DC), pub. No. FHWA-RD-
055, 1991.18 Émile Quinet, “The Social Costs of Transport: Evaluation and Links With Internalization
Policies,” in Internalising the Social Costs of Transport, OECD (Paris), 1994, p.38.19 Charles Komanoff and Cora Roelofs, The Environmental Benefi ts of Bicycling and Walking,
FHWA National Bicycling and Walking Study Case Study #15 (Washington DC), January 1993.
20 For example, drivers frequently travel several miles to regional shopping centers while pedestrians and bicyclists use local shops and services.
21 Benefi ts of Bicycling and Walking to Health, National Bicycling and Walking Study #14, USDOT, FHWA (Washington DC), 1992.
22 Dr. Mayer Hillman, “Reconciling Transport and Environmental Policy,” Public Administration, Vol. 70, Summer 1992, pp. 225-234.
Hfst 1023 Cycling the way ahead for town and cities , European Communities 1999