Embed Size (px)
Citation preview
Handling Multiple Points of View in a MultimediaData Warehouse
ANNE-MURIEL ARIGON
Laboratoire de Biometrie et Biologie Evolutive, LBBE UMR CNRS 5558, UCBL
and
ANNE TCHOUNIKINE and MARYVONNE MIQUEL
Laboratoire d’InfoRmatique en Images et Systemes d’information, LIRIS UMR CNRS 5205 INSA
Data warehouses are dedicated to collecting heterogeneous and distributed data in order to perform decision analysis. Based on
multidimensional model, OLAP commercial environments such as they are currently designed in traditional applications are
used to provide means for the analysis of facts that are depicted by numeric data (e.g., sales depicted by amount or quantity sold).
However, in numerous fields, like in medical or bioinformatics, multimedia data are used as valuable information in the decisional
process. One of the problems when integrating multimedia data as facts in a multidimensional model is to deal with dimensions
built on descriptors that can be obtained by various computation modes on raw multimedia data. Taking into account these
computation modes makes possible the characterization of the data by various points of view depending on the user’s profile, his
best-practices, his level of expertise, and so on. We propose a new multidimensional model that integrates functional dimension
versions allowing the descriptors of the multidimensional data to be computed by different functions. With this approach, the user
is able to obtain and choose multiple points of view on the data he analyses. This model is used to develop an OLAP application
for navigation into a hypercube integrating various functional dimension versions for the calculus of descriptors in a medical use
case.
Categories and Subject Descriptors: H.1.0 [Models and Principles]: General
General Terms: Design
Additional Key Words and Phrases: Data warehouse, OLAP, multimedia, functional version, descriptor
1. INTRODUCTION
The most cited definition for a data warehouse is Inmon’s [1996]: a data warehouse is a “subject-oriented,integrated, nonvolatile and time-variant collection of data in support of management’s decisions.” Datawarehousing projects intend to select and extract relevant data from various production databasesand to organize it so as to improve decision making. The modeling paradigm for a data warehousemust comply with requirements that are profoundly different from the data models in OLTP (On-LineTransactional Processing) environments [Kimball 1996]. The models must be easy for the end-user to
Authors’ addresses: A.-M. Arigon, Laboratoire de Biometrie et Biologie Evolutive, LBBE UMR CNRS 5558, UCBL, 43 Boulevard
du 11 novembre 1918, 69622 Villeurbanne Cedex, France; email: [email protected]; A. Tchounikine and M. Miquel,
Laboratoire d’InfoRmatique en Images et Systemes d’information, LIRIS UMR CNRS 5205 INSA, 7 avenue Capelle, 69621
Villeurbanne Cedex, France; email: {anne.tchounikine, maryvonne.miquel}@insa-lyon.fr.
Permission to make digital or hard copies of part or all of this work for personal or classroom use is granted without fee provided
that copies are not made or distributed for profit or direct commercial advantage and that copies show this notice on the first
page or initial screen of a display along with the full citation. Copyrights for components of this work owned by others than ACM
must be honored. Abstracting with credit is permitted. To copy otherwise, to republish, to post on servers, to redistribute to lists,
or to use any component of this work in other works requires prior specific permission and/or a fee. Permissions may be requested
from Publications Dept., ACM, Inc., 1515 Broadway, New York, NY 10036 USA, fax: +1 (212) 869-0481, or [email protected].
c© 2006 ACM 1551-6857/06/0800-0199 $5.00
ACM Transactions on Multimedia Computing, Communications and Applications, Vol. 2, No. 3, August 2006, Pages 199–218.
200 • A.-M. Arigon et al.
understand and write queries, and must maximize the efficiency of queries. Data warehouse modelsare called multidimensional models. The decisional analyses are based on OLAP processes (On-LineAnalytical Processing) as defined in Chaudhuri and Dayal [1997] and Vassiliadis and Sellis [1999],which refer to analysis functionalities used to explore data.
Data warehouse has become a leading topic in the commercial world as well as in the research com-munity. Until now, data warehouse technology has been mainly used in the business world, in retail orfinance areas, for example. The leading motivation is then to take benefits from the enormous amountof data that relies in operational databases. Data warehouses are generally used to provide meansfor the analysis of facts that are depicted by numeric data (e.g. sales depicted by amount or quan-tity sold). However, in numerous fields, like in medical or bioinformatics, multimedia data is used asvaluable information in the decision-making process. The use of multimedia data as facts in a ware-house raises numerous problems. Among these are storage of voluminous data, design of a suitablenavigation interface, complex ad hoc aggregation functions and so on. Another important problem thatis barely addressed relates to the semantics of multimedia data, and to the way specialists deal withit. Indeed, scientists often have to develop efficient algorithms (e.g. based on signal or image process-ing, pattern recognition, statistical methodologies . . . ) in order to transform the initial raw data (e.g.an electrocardiogram, an X-ray . . . ) into relevant information (data descriptors, risk factors, diagnosisclass . . . ). Beyond the difficulties encountered in extracting and modeling multimedia data, lies thedifficulty in manipulating, interpreting the data and the need for transforming raw data into usefulinformation. This expertise, which is user-dependent as well as analysis-dependent, is fully part of thedecisional process.
This article is organized as follows. In Section 2 we provide some definitions for OLAP and multidi-mensional models, and for multimedia data warehouses. With motivating examples, we highlight theneeds for integrating multiple points of view in multidimensional models, and give an outline of ourcontribution and related work. Section 3 details our multiversion model. The prototype, and an exampleof a data warehouse built for a medical study are presented in Section 4. Section 5 concludes.
2. MULTIDIMENSIONAL MODEL FOR MULMEDIA DATA
2.1 OLAP and Multidimensional Models
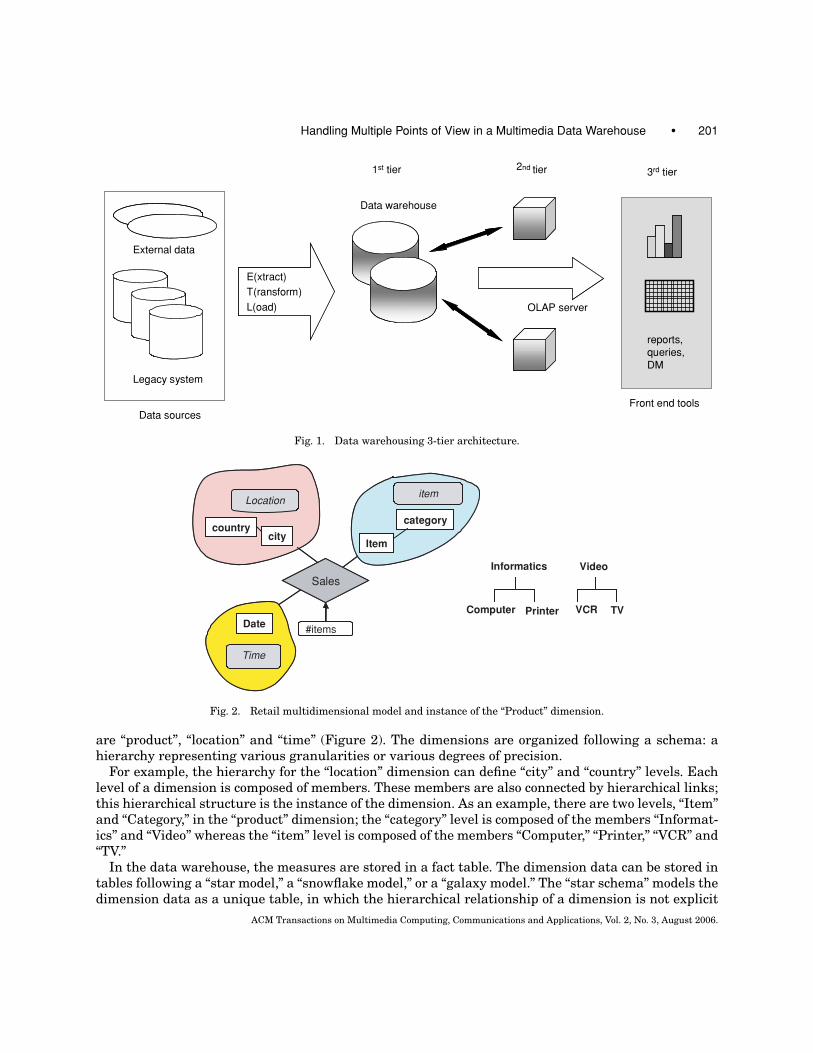
Data warehousing solutions are usually built following a multitier architecture (Figure 1). The first tieris a warehouse server, classically a relational DBMS. Data of interest must be extracted from operationallegacy databases, cleaned and transformed by an ETL tool (extraction, transformation, and loading)before being stored in the warehouse. The purpose is to consolidate the heterogeneous schemas, to dotime stamping, and to reduce the data in order to make it conform to the warehouse model. Aggregationand/or discretization functions for example, may be used to achieve reduction. This step guaranties thatthe warehouse contains high quality, historical, and homogeneous data. The OLAP server composes thesecond tier. The OLAP server models the data in a multidimensional way and precalculates aggregatesin order to optimize queries. The third tier is an OLAP front-end client that provides operators tointeractively explore the multidimensional data, supporting in the meantime the iterative nature ofthe analysis process, and allowing the decision makers to navigate across data at different levels ofdetail.
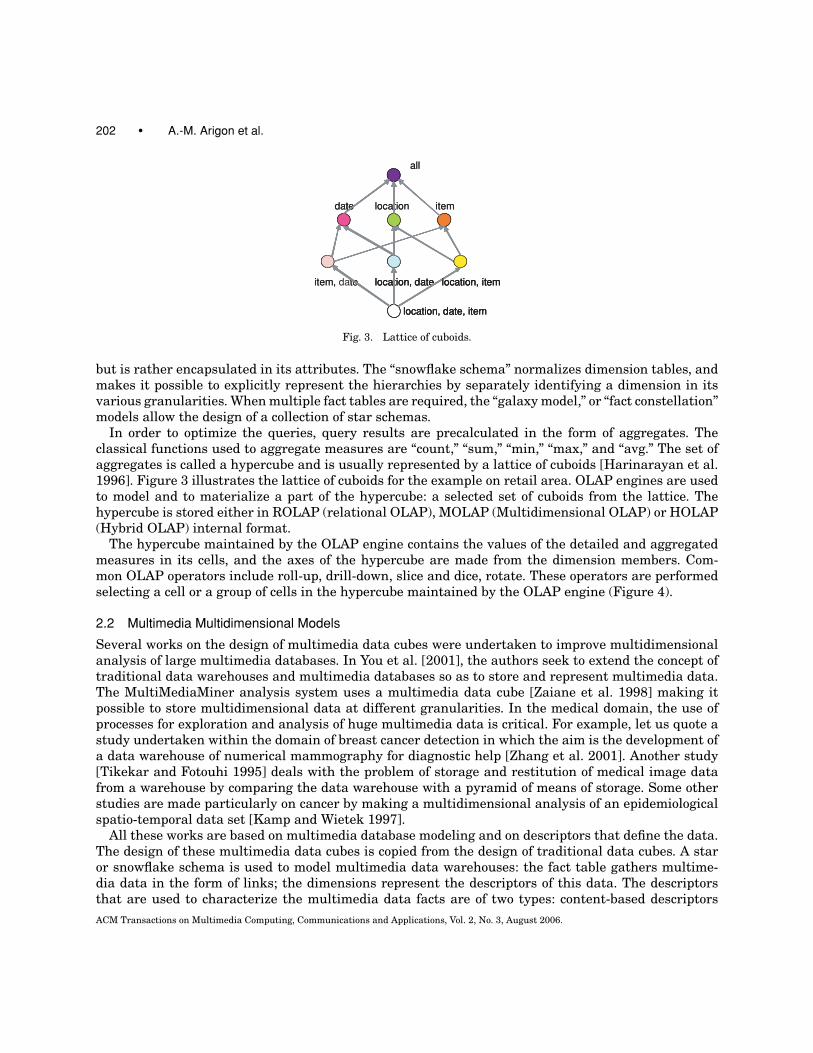
OLAP multidimensional models, or data cubes, have been formalized by several authors [Agrawalet al. 1995; Cabibbo and Torlone 1998; Gyssens and Lakshmanan 1997; Lehner 1998; Li and SeanWang 1996; Vassiliadis and Sellis 1999]. They are designed to represent the analyzed fact depicted bymeasures, and the various dimensions that characterize the fact. As an example in a retail area, typicalfacts are “sales” depicted by measures such as “number of sold items” or “amount”; typical dimensions
ACM Transactions on Multimedia Computing, Communications and Applications, Vol. 2, No. 3, August 2006.
Handling Multiple Points of View in a Multimedia Data Warehouse • 201
1st tier 2nd tier 3rd tier
External data
Legacy system
Data sources
E(xtract)
T(ransform)
L(oad)
Data warehouse
OLAP server
reports, queries, DM
Front end tools
E(xtract)
T(ransform)
L(oad)
reports, queries, DM
Fig. 1. Data warehousing 3-tier architecture.
itemLocation
#items
Sales
Time
cityItem
Date
countrycategory
Informatics Video
Computer TVPrinter VCR
itemLocation
#items
Sales
Time
cityItem
Date
countrycategory
Fig. 2. Retail multidimensional model and instance of the “Product” dimension.
are “product”, “location” and “time” (Figure 2). The dimensions are organized following a schema: ahierarchy representing various granularities or various degrees of precision.
For example, the hierarchy for the “location” dimension can define “city” and “country” levels. Eachlevel of a dimension is composed of members. These members are also connected by hierarchical links;this hierarchical structure is the instance of the dimension. As an example, there are two levels, “Item”and “Category,” in the “product” dimension; the “category” level is composed of the members “Informat-ics” and “Video” whereas the “item” level is composed of the members “Computer,” “Printer,” “VCR” and“TV.”
In the data warehouse, the measures are stored in a fact table. The dimension data can be stored intables following a “star model,” a “snowflake model,” or a “galaxy model.” The “star schema” models thedimension data as a unique table, in which the hierarchical relationship of a dimension is not explicit
ACM Transactions on Multimedia Computing, Communications and Applications, Vol. 2, No. 3, August 2006.
202 • A.-M. Arigon et al.
location, date, item
item, date location, date
date location item
location, item
all
location, date, itemlocation, date, item
item, te location, datelocation, date
datet locationt item
location, itemlocation, item
all
Fig. 3. Lattice of cuboids.
but is rather encapsulated in its attributes. The “snowflake schema” normalizes dimension tables, andmakes it possible to explicitly represent the hierarchies by separately identifying a dimension in itsvarious granularities. When multiple fact tables are required, the “galaxy model,” or “fact constellation”models allow the design of a collection of star schemas.
In order to optimize the queries, query results are precalculated in the form of aggregates. Theclassical functions used to aggregate measures are “count,” “sum,” “min,” “max,” and “avg.” The set ofaggregates is called a hypercube and is usually represented by a lattice of cuboids [Harinarayan et al.1996]. Figure 3 illustrates the lattice of cuboids for the example on retail area. OLAP engines are usedto model and to materialize a part of the hypercube: a selected set of cuboids from the lattice. Thehypercube is stored either in ROLAP (relational OLAP), MOLAP (Multidimensional OLAP) or HOLAP(Hybrid OLAP) internal format.
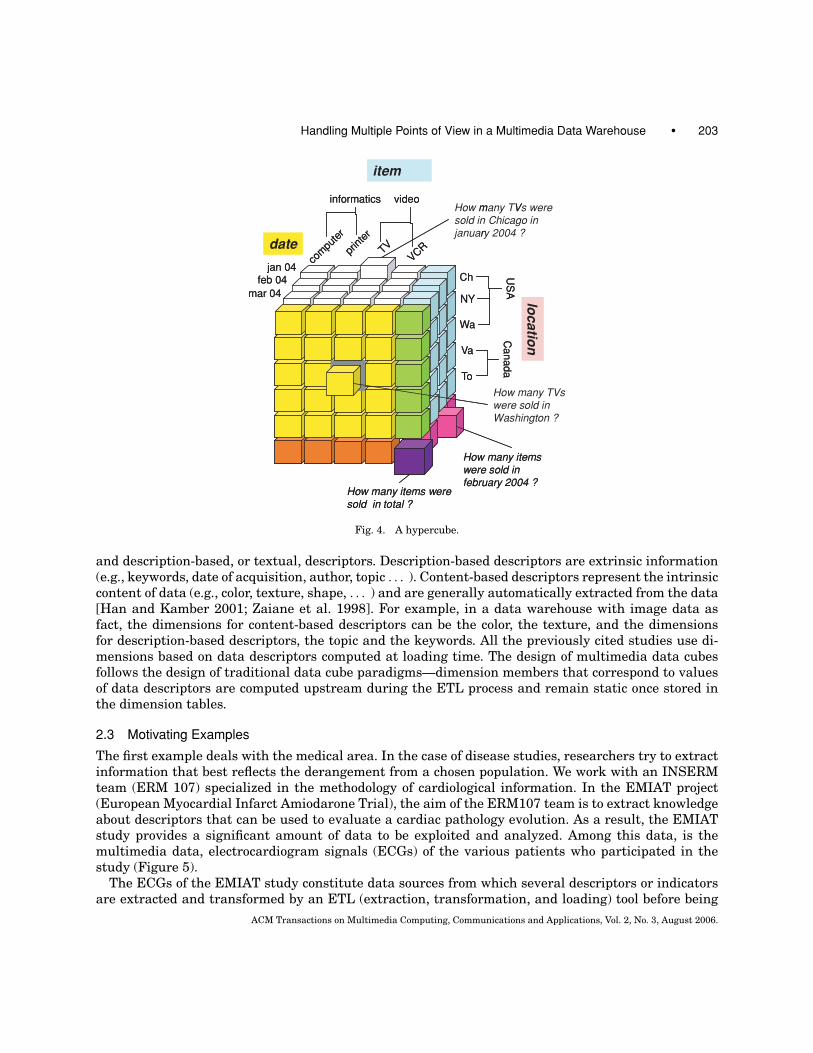
The hypercube maintained by the OLAP engine contains the values of the detailed and aggregatedmeasures in its cells, and the axes of the hypercube are made from the dimension members. Com-mon OLAP operators include roll-up, drill-down, slice and dice, rotate. These operators are performedselecting a cell or a group of cells in the hypercube maintained by the OLAP engine (Figure 4).
2.2 Multimedia Multidimensional Models
Several works on the design of multimedia data cubes were undertaken to improve multidimensionalanalysis of large multimedia databases. In You et al. [2001], the authors seek to extend the concept oftraditional data warehouses and multimedia databases so as to store and represent multimedia data.The MultiMediaMiner analysis system uses a multimedia data cube [Zaiane et al. 1998] making itpossible to store multidimensional data at different granularities. In the medical domain, the use ofprocesses for exploration and analysis of huge multimedia data is critical. For example, let us quote astudy undertaken within the domain of breast cancer detection in which the aim is the development ofa data warehouse of numerical mammography for diagnostic help [Zhang et al. 2001]. Another study[Tikekar and Fotouhi 1995] deals with the problem of storage and restitution of medical image datafrom a warehouse by comparing the data warehouse with a pyramid of means of storage. Some otherstudies are made particularly on cancer by making a multidimensional analysis of an epidemiologicalspatio-temporal data set [Kamp and Wietek 1997].
All these works are based on multimedia database modeling and on descriptors that define the data.The design of these multimedia data cubes is copied from the design of traditional data cubes. A staror snowflake schema is used to model multimedia data warehouses: the fact table gathers multime-dia data in the form of links; the dimensions represent the descriptors of this data. The descriptorsthat are used to characterize the multimedia data facts are of two types: content-based descriptors
ACM Transactions on Multimedia Computing, Communications and Applications, Vol. 2, No. 3, August 2006.
Handling Multiple Points of View in a Multimedia Data Warehouse • 203
mar 04 locatio
n
date
item
Wa
Va
NY
To
com
pute
r
er
VCRTV
feb 04jan 04
How many TV sold in Chicago in january 2004 ?
How many TV were sold in Washington ?
How many items were sold in february 2004 ?
How many items weresold in total ?
Ch US
AC
an
ad
a
informatics video
mar 04 locatio
n
date
item
Wa
Va
NY
To
com
pute
r
er
VCRTV
feb 04jan 04
m Vs were
r
s
How many items were sold in february 2004 ?
How many items weresold in total ?
Ch US
AC
an
ad
a
informatics video
Fig. 4. A hypercube.
and description-based, or textual, descriptors. Description-based descriptors are extrinsic information(e.g., keywords, date of acquisition, author, topic . . . ). Content-based descriptors represent the intrinsiccontent of data (e.g., color, texture, shape, . . . ) and are generally automatically extracted from the data[Han and Kamber 2001; Zaiane et al. 1998]. For example, in a data warehouse with image data asfact, the dimensions for content-based descriptors can be the color, the texture, and the dimensionsfor description-based descriptors, the topic and the keywords. All the previously cited studies use di-mensions based on data descriptors computed at loading time. The design of multimedia data cubesfollows the design of traditional data cube paradigms—dimension members that correspond to valuesof data descriptors are computed upstream during the ETL process and remain static once stored inthe dimension tables.
2.3 Motivating Examples
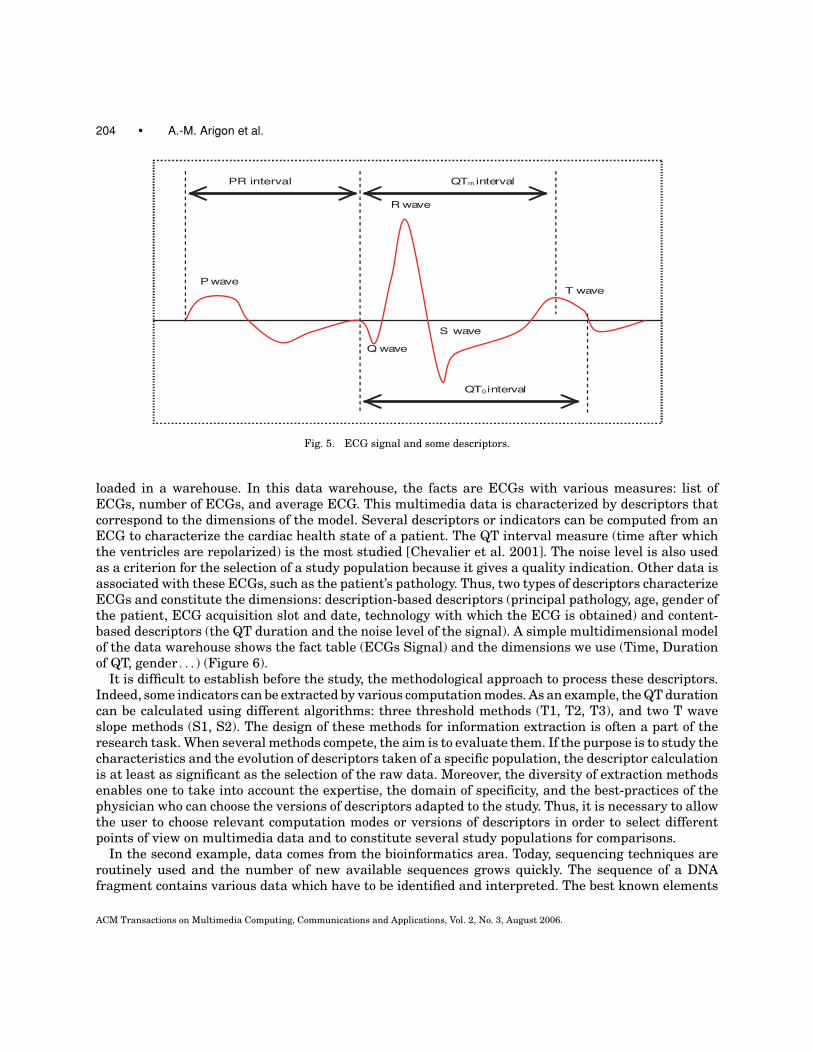
The first example deals with the medical area. In the case of disease studies, researchers try to extractinformation that best reflects the derangement from a chosen population. We work with an INSERMteam (ERM 107) specialized in the methodology of cardiological information. In the EMIAT project(European Myocardial Infarct Amiodarone Trial), the aim of the ERM107 team is to extract knowledgeabout descriptors that can be used to evaluate a cardiac pathology evolution. As a result, the EMIATstudy provides a significant amount of data to be exploited and analyzed. Among this data, is themultimedia data, electrocardiogram signals (ECGs) of the various patients who participated in thestudy (Figure 5).
The ECGs of the EMIAT study constitute data sources from which several descriptors or indicatorsare extracted and transformed by an ETL (extraction, transformation, and loading) tool before being
ACM Transactions on Multimedia Computing, Communications and Applications, Vol. 2, No. 3, August 2006.
204 • A.-M. Arigon et al.
P wave
Q wave
R wave
S wave
T wave
PR interval QTm interval
QT0interval
Fig. 5. ECG signal and some descriptors.
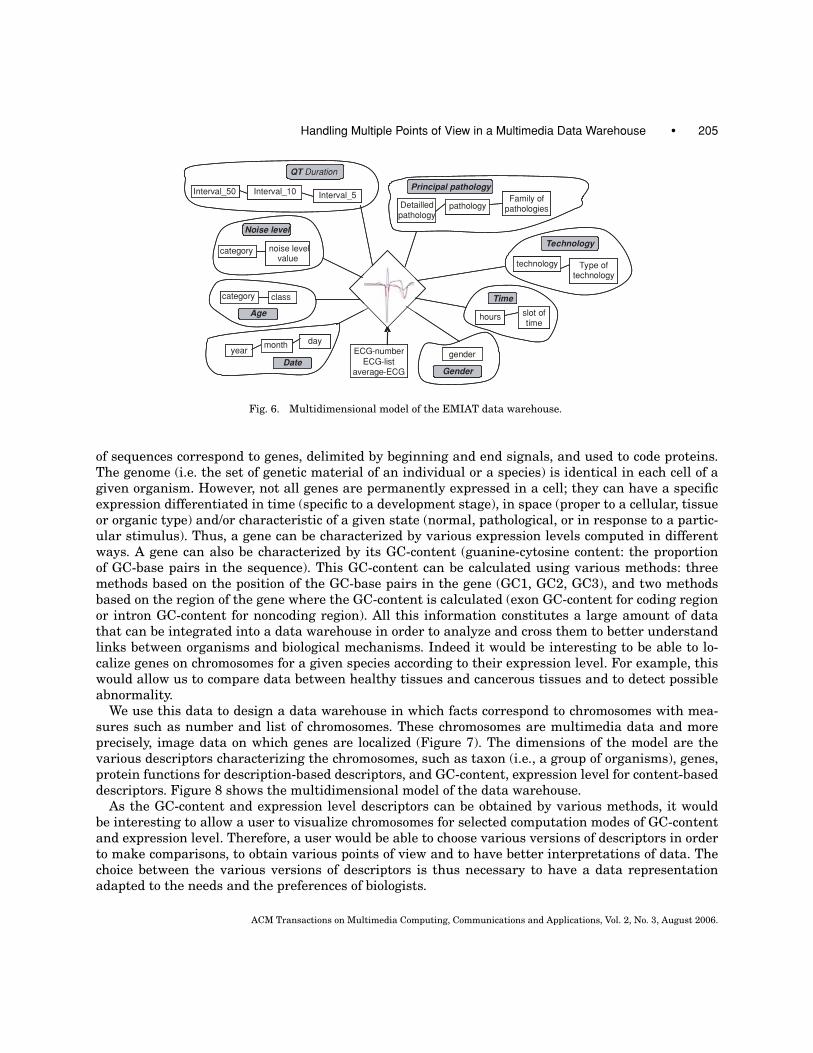
loaded in a warehouse. In this data warehouse, the facts are ECGs with various measures: list ofECGs, number of ECGs, and average ECG. This multimedia data is characterized by descriptors thatcorrespond to the dimensions of the model. Several descriptors or indicators can be computed from anECG to characterize the cardiac health state of a patient. The QT interval measure (time after whichthe ventricles are repolarized) is the most studied [Chevalier et al. 2001]. The noise level is also usedas a criterion for the selection of a study population because it gives a quality indication. Other data isassociated with these ECGs, such as the patient’s pathology. Thus, two types of descriptors characterizeECGs and constitute the dimensions: description-based descriptors (principal pathology, age, gender ofthe patient, ECG acquisition slot and date, technology with which the ECG is obtained) and content-based descriptors (the QT duration and the noise level of the signal). A simple multidimensional modelof the data warehouse shows the fact table (ECGs Signal) and the dimensions we use (Time, Durationof QT, gender . . . ) (Figure 6).
It is difficult to establish before the study, the methodological approach to process these descriptors.Indeed, some indicators can be extracted by various computation modes. As an example, the QT durationcan be calculated using different algorithms: three threshold methods (T1, T2, T3), and two T waveslope methods (S1, S2). The design of these methods for information extraction is often a part of theresearch task. When several methods compete, the aim is to evaluate them. If the purpose is to study thecharacteristics and the evolution of descriptors taken of a specific population, the descriptor calculationis at least as significant as the selection of the raw data. Moreover, the diversity of extraction methodsenables one to take into account the expertise, the domain of specificity, and the best-practices of thephysician who can choose the versions of descriptors adapted to the study. Thus, it is necessary to allowthe user to choose relevant computation modes or versions of descriptors in order to select differentpoints of view on multimedia data and to constitute several study populations for comparisons.
In the second example, data comes from the bioinformatics area. Today, sequencing techniques areroutinely used and the number of new available sequences grows quickly. The sequence of a DNAfragment contains various data which have to be identified and interpreted. The best known elements
ACM Transactions on Multimedia Computing, Communications and Applications, Vol. 2, No. 3, August 2006.
Handling Multiple Points of View in a Multimedia Data Warehouse • 205
DategenderECG-number
ECG-listaverage-ECG
dayyear
Age
month
classcategory
Gender
Time
hours slot oftime
Detailledpathology
Family ofpathologiespathology
technology Type oftechnology
Noise level
Technology
Principal pathology
QT Duration
noise levelvalue
category
Interval_50 Interval_5Interval_10
DategenderECG-number
ECG-listaverage-ECG
dayyear
Age
month
classcategory
Gender
Time
hours slot oftime
Detailledpathology
Family ofpathologiespathology
technology Type oftechnology
Noise level
Technology
Principal pathology
QT Duration
noise levelvalue
category
Interval_50 Interval_5Interval_10
Fig. 6. Multidimensional model of the EMIAT data warehouse.
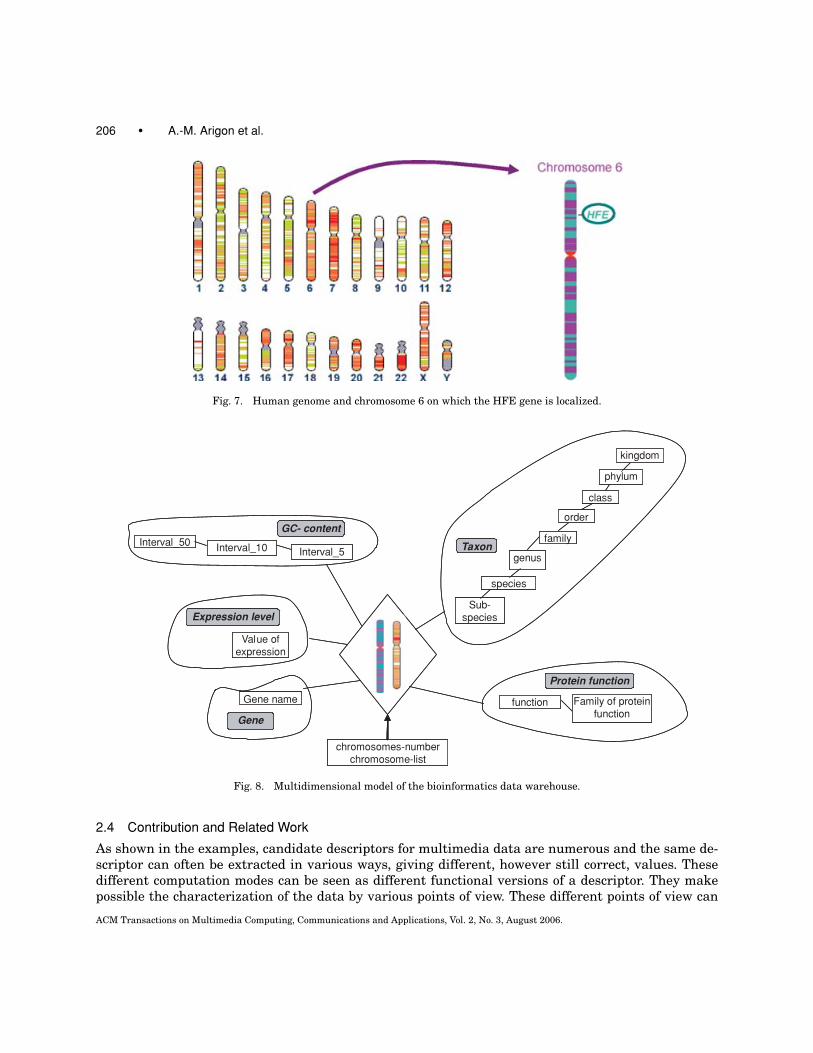
of sequences correspond to genes, delimited by beginning and end signals, and used to code proteins.The genome (i.e. the set of genetic material of an individual or a species) is identical in each cell of agiven organism. However, not all genes are permanently expressed in a cell; they can have a specificexpression differentiated in time (specific to a development stage), in space (proper to a cellular, tissueor organic type) and/or characteristic of a given state (normal, pathological, or in response to a partic-ular stimulus). Thus, a gene can be characterized by various expression levels computed in differentways. A gene can also be characterized by its GC-content (guanine-cytosine content: the proportionof GC-base pairs in the sequence). This GC-content can be calculated using various methods: threemethods based on the position of the GC-base pairs in the gene (GC1, GC2, GC3), and two methodsbased on the region of the gene where the GC-content is calculated (exon GC-content for coding regionor intron GC-content for noncoding region). All this information constitutes a large amount of datathat can be integrated into a data warehouse in order to analyze and cross them to better understandlinks between organisms and biological mechanisms. Indeed it would be interesting to be able to lo-calize genes on chromosomes for a given species according to their expression level. For example, thiswould allow us to compare data between healthy tissues and cancerous tissues and to detect possibleabnormality.
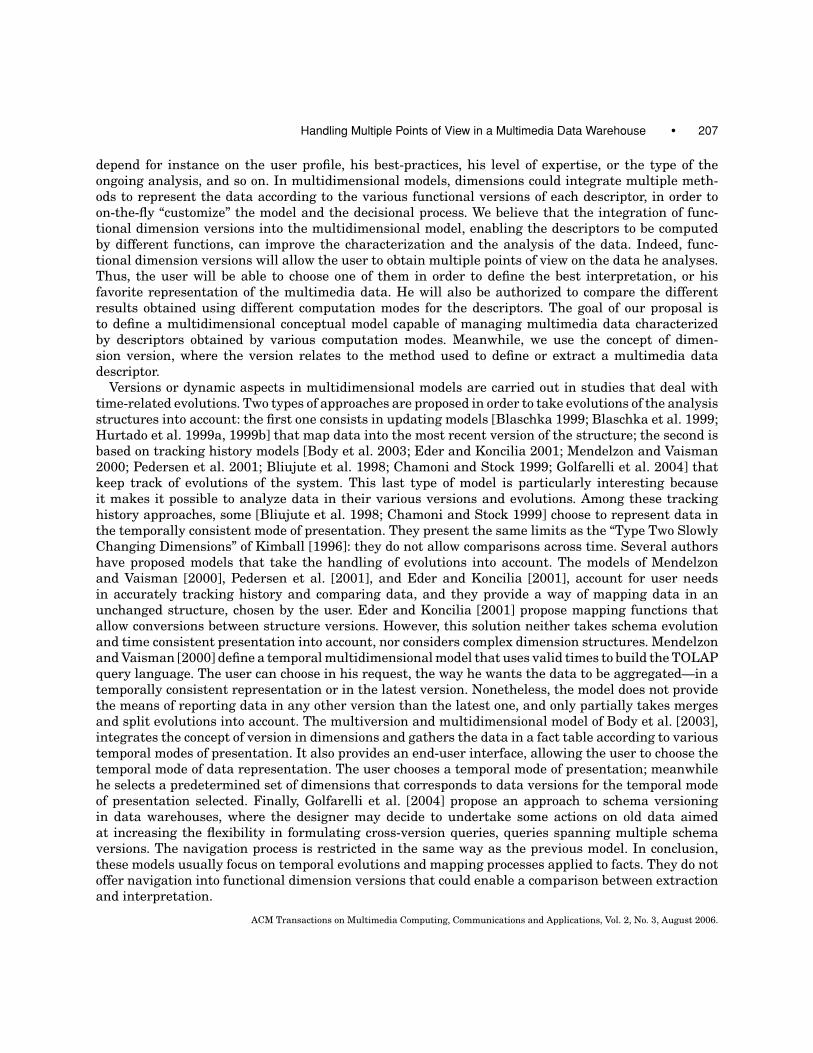
We use this data to design a data warehouse in which facts correspond to chromosomes with mea-sures such as number and list of chromosomes. These chromosomes are multimedia data and moreprecisely, image data on which genes are localized (Figure 7). The dimensions of the model are thevarious descriptors characterizing the chromosomes, such as taxon (i.e., a group of organisms), genes,protein functions for description-based descriptors, and GC-content, expression level for content-baseddescriptors. Figure 8 shows the multidimensional model of the data warehouse.
As the GC-content and expression level descriptors can be obtained by various methods, it wouldbe interesting to allow a user to visualize chromosomes for selected computation modes of GC-contentand expression level. Therefore, a user would be able to choose various versions of descriptors in orderto make comparisons, to obtain various points of view and to have better interpretations of data. Thechoice between the various versions of descriptors is thus necessary to have a data representationadapted to the needs and the preferences of biologists.
ACM Transactions on Multimedia Computing, Communications and Applications, Vol. 2, No. 3, August 2006.
206 • A.-M. Arigon et al.
Fig. 7. Human genome and chromosome 6 on which the HFE gene is localized.
Gene name
chromosomes-numberchromosome-list
Gene
Sub-species
genus
species
family
function Family of proteinfunction
Expression level
Protein function
GC- content
Taxon
Value ofexpression
Interval_50Interval_5Interval_10
order
class
phylum
kingdom
Gene name
chromosomes-numberchromosome-list
Gene
Sub-species
genus
species
family
function Family of proteinfunction
Expression level
Protein function
GC- content
Taxon
Value ofexpression
Interval_50Interval_5Interval_10
order
class
phylum
kingdom
Fig. 8. Multidimensional model of the bioinformatics data warehouse.
2.4 Contribution and Related Work
As shown in the examples, candidate descriptors for multimedia data are numerous and the same de-scriptor can often be extracted in various ways, giving different, however still correct, values. Thesedifferent computation modes can be seen as different functional versions of a descriptor. They makepossible the characterization of the data by various points of view. These different points of view can
ACM Transactions on Multimedia Computing, Communications and Applications, Vol. 2, No. 3, August 2006.
Handling Multiple Points of View in a Multimedia Data Warehouse • 207
depend for instance on the user profile, his best-practices, his level of expertise, or the type of theongoing analysis, and so on. In multidimensional models, dimensions could integrate multiple meth-ods to represent the data according to the various functional versions of each descriptor, in order toon-the-fly “customize” the model and the decisional process. We believe that the integration of func-tional dimension versions into the multidimensional model, enabling the descriptors to be computedby different functions, can improve the characterization and the analysis of the data. Indeed, func-tional dimension versions will allow the user to obtain multiple points of view on the data he analyses.Thus, the user will be able to choose one of them in order to define the best interpretation, or hisfavorite representation of the multimedia data. He will also be authorized to compare the differentresults obtained using different computation modes for the descriptors. The goal of our proposal isto define a multidimensional conceptual model capable of managing multimedia data characterizedby descriptors obtained by various computation modes. Meanwhile, we use the concept of dimen-sion version, where the version relates to the method used to define or extract a multimedia datadescriptor.
Versions or dynamic aspects in multidimensional models are carried out in studies that deal withtime-related evolutions. Two types of approaches are proposed in order to take evolutions of the analysisstructures into account: the first one consists in updating models [Blaschka 1999; Blaschka et al. 1999;Hurtado et al. 1999a, 1999b] that map data into the most recent version of the structure; the second isbased on tracking history models [Body et al. 2003; Eder and Koncilia 2001; Mendelzon and Vaisman2000; Pedersen et al. 2001; Bliujute et al. 1998; Chamoni and Stock 1999; Golfarelli et al. 2004] thatkeep track of evolutions of the system. This last type of model is particularly interesting becauseit makes it possible to analyze data in their various versions and evolutions. Among these trackinghistory approaches, some [Bliujute et al. 1998; Chamoni and Stock 1999] choose to represent data inthe temporally consistent mode of presentation. They present the same limits as the “Type Two SlowlyChanging Dimensions” of Kimball [1996]: they do not allow comparisons across time. Several authorshave proposed models that take the handling of evolutions into account. The models of Mendelzonand Vaisman [2000], Pedersen et al. [2001], and Eder and Koncilia [2001], account for user needsin accurately tracking history and comparing data, and they provide a way of mapping data in anunchanged structure, chosen by the user. Eder and Koncilia [2001] propose mapping functions thatallow conversions between structure versions. However, this solution neither takes schema evolutionand time consistent presentation into account, nor considers complex dimension structures. Mendelzonand Vaisman [2000] define a temporal multidimensional model that uses valid times to build the TOLAPquery language. The user can choose in his request, the way he wants the data to be aggregated—in atemporally consistent representation or in the latest version. Nonetheless, the model does not providethe means of reporting data in any other version than the latest one, and only partially takes mergesand split evolutions into account. The multiversion and multidimensional model of Body et al. [2003],integrates the concept of version in dimensions and gathers the data in a fact table according to varioustemporal modes of presentation. It also provides an end-user interface, allowing the user to choose thetemporal mode of data representation. The user chooses a temporal mode of presentation; meanwhilehe selects a predetermined set of dimensions that corresponds to data versions for the temporal modeof presentation selected. Finally, Golfarelli et al. [2004] propose an approach to schema versioningin data warehouses, where the designer may decide to undertake some actions on old data aimedat increasing the flexibility in formulating cross-version queries, queries spanning multiple schemaversions. The navigation process is restricted in the same way as the previous model. In conclusion,these models usually focus on temporal evolutions and mapping processes applied to facts. They do notoffer navigation into functional dimension versions that could enable a comparison between extractionand interpretation.
ACM Transactions on Multimedia Computing, Communications and Applications, Vol. 2, No. 3, August 2006.
208 • A.-M. Arigon et al.
3. THE MULTIVERSION MODEL
3.1 General Principle of Our Approach
Our approach is based on a fact table that contains the set of measures representing the data toanalyze (references on multimedia data) and dimensions representing the descriptors of this multimediadata. Taking into account the problem of functional multiversion, we redefine the multidimensionalstructure, adding the concept of functional version. Therefore, we introduce the concept of dimensionversion, multiversion dimension, functional multiversion fact table, and dimension version function.A multiversion dimension is composed of several versions of a dimension, each one being a dimensionfor a given version with its own schema and its own instance. The functional multiversion fact tablegathers all data, combining the various dimension versions of a dimension with the others. Finally,the associated function of a dimension version corresponds to the computation modes used to get themembers of this version. The schemas of various dimensions are described using the hierarchical levelsand the links that bind them. We also describe the instances of these dimensions with the set ofmembers belonging to a hierarchical level and their parent-child relationships. Thus, our approachallows having explicit dimensions since the schemas of dimension are explicitly defined. Our modelalso supports complex hierarchies (multiple, non-onto, non-strict and non-covering hierarchies) sincethe dimension instances are defined from the members and the hierarchical links.
3.2 Concept Definitions
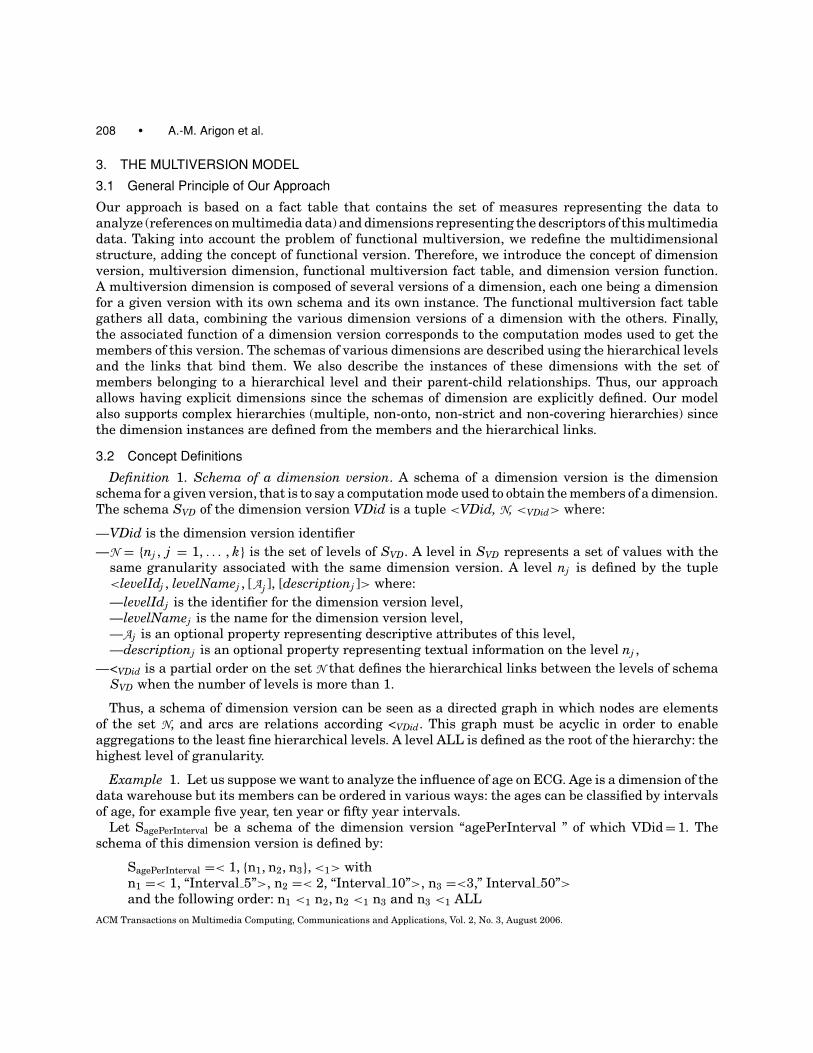
Definition 1. Schema of a dimension version. A schema of a dimension version is the dimensionschema for a given version, that is to say a computation mode used to obtain the members of a dimension.The schema SVD of the dimension version VDid is a tuple <VDid, N, <VDid> where:
—VDid is the dimension version identifier
—N = {nj , j = 1, . . . , k} is the set of levels of SVD. A level in SVD represents a set of values with thesame granularity associated with the same dimension version. A level nj is defined by the tuple<levelIdj , levelNamej , [Aj ], [descriptionj ]> where:
—levelIdj is the identifier for the dimension version level,—levelNamej is the name for the dimension version level,—Aj is an optional property representing descriptive attributes of this level,—descriptionj is an optional property representing textual information on the level nj ,
—<VDid is a partial order on the set N that defines the hierarchical links between the levels of schemaSVD when the number of levels is more than 1.
Thus, a schema of dimension version can be seen as a directed graph in which nodes are elementsof the set N, and arcs are relations according <VDid. This graph must be acyclic in order to enableaggregations to the least fine hierarchical levels. A level ALL is defined as the root of the hierarchy: thehighest level of granularity.
Example 1. Let us suppose we want to analyze the influence of age on ECG. Age is a dimension of thedata warehouse but its members can be ordered in various ways: the ages can be classified by intervalsof age, for example five year, ten year or fifty year intervals.
Let SagePerInterval be a schema of the dimension version “agePerInterval ” of which VDid = 1. Theschema of this dimension version is defined by:
SagePerInterval =< 1, {n1, n2, n3}, <1> withn1 =< 1, “Interval 5”>, n2 =< 2, “Interval 10”>, n3 =<3,” Interval 50”>and the following order: n1 <1 n2, n2 <1 n3 and n3 <1 ALL
ACM Transactions on Multimedia Computing, Communications and Applications, Vol. 2, No. 3, August 2006.
Handling Multiple Points of View in a Multimedia Data Warehouse • 209
Category
Classe
ALL
Interval_10
Interval_5
Interval_50
ALL
SagePerInterval
SagePerClass (b)
(a)
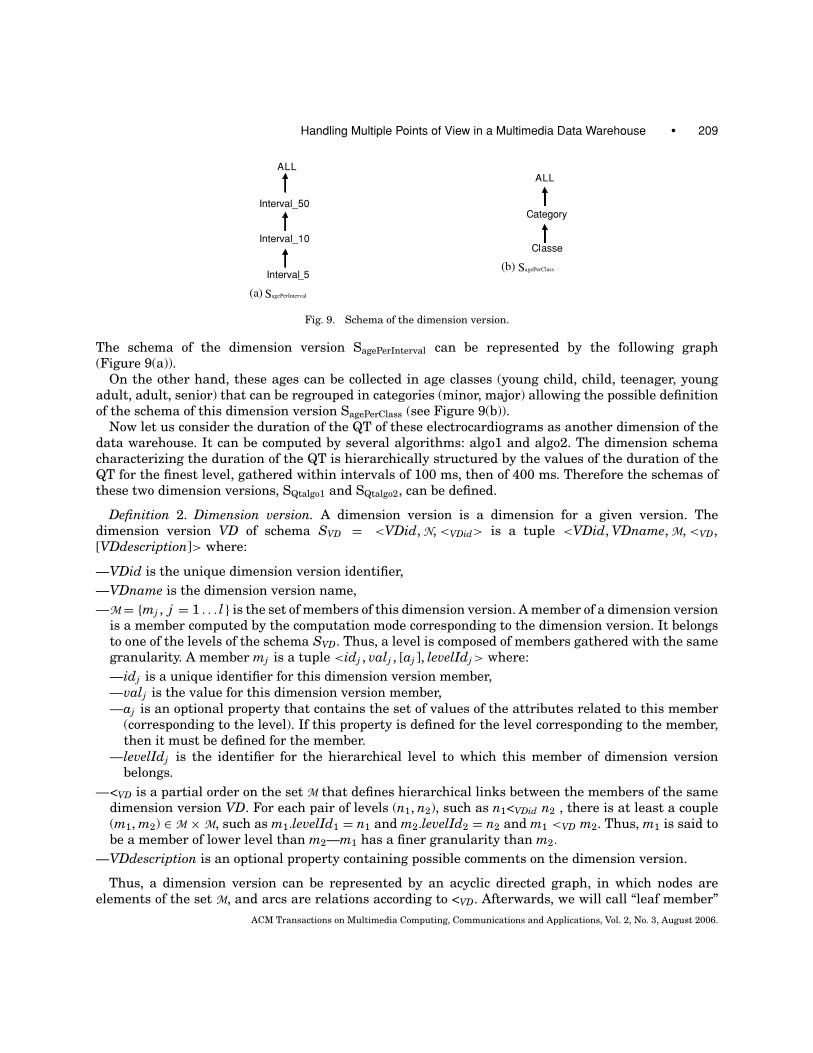
Fig. 9. Schema of the dimension version.
The schema of the dimension version SagePerInterval can be represented by the following graph(Figure 9(a)).
On the other hand, these ages can be collected in age classes (young child, child, teenager, youngadult, adult, senior) that can be regrouped in categories (minor, major) allowing the possible definitionof the schema of this dimension version SagePerClass (see Figure 9(b)).
Now let us consider the duration of the QT of these electrocardiograms as another dimension of thedata warehouse. It can be computed by several algorithms: algo1 and algo2. The dimension schemacharacterizing the duration of the QT is hierarchically structured by the values of the duration of theQT for the finest level, gathered within intervals of 100 ms, then of 400 ms. Therefore the schemas ofthese two dimension versions, SQtalgo1 and SQtalgo2, can be defined.
Definition 2. Dimension version. A dimension version is a dimension for a given version. Thedimension version VD of schema SVD = <VDid, N, <VDid> is a tuple <VDid, VDname, M, <VD,[VDdescription]> where:
—VDid is the unique dimension version identifier,
—VDname is the dimension version name,
—M = {mj , j = 1 . . . l } is the set of members of this dimension version. A member of a dimension versionis a member computed by the computation mode corresponding to the dimension version. It belongsto one of the levels of the schema SVD. Thus, a level is composed of members gathered with the samegranularity. A member mj is a tuple <idj , valj , [aj ], levelIdj > where:
—idj is a unique identifier for this dimension version member,
—valj is the value for this dimension version member,
—aj is an optional property that contains the set of values of the attributes related to this member(corresponding to the level). If this property is defined for the level corresponding to the member,then it must be defined for the member.
—levelIdj is the identifier for the hierarchical level to which this member of dimension versionbelongs.
—<VD is a partial order on the set M that defines hierarchical links between the members of the samedimension version VD. For each pair of levels (n1, n2), such as n1<VDid n2 , there is at least a couple(m1, m2) ∈ M × M, such as m1.levelId1 = n1 and m2.levelId2 = n2 and m1 <VD m2. Thus, m1 is said tobe a member of lower level than m2—m1 has a finer granularity than m2.
—VDdescription is an optional property containing possible comments on the dimension version.
Thus, a dimension version can be represented by an acyclic directed graph, in which nodes areelements of the set M, and arcs are relations according to <VD. Afterwards, we will call “leaf member”
ACM Transactions on Multimedia Computing, Communications and Applications, Vol. 2, No. 3, August 2006.
210 • A.-M. Arigon et al.
all
0-50
0-10 11-20
0-5 6-10 11-15 16-20
all
0-50
0-10 11-20
0-5 6-10 11-15 16-20
Fig. 10. Instance of the dimension version “agePerInterval.”
of a dimension version, a member of a dimension version that has no child. Moreover, the member “all”is defined as the unique member contained in level “ALL.” One notes LMVD the set of leaf members ofthe dimension version VD. This set is defined as follows:
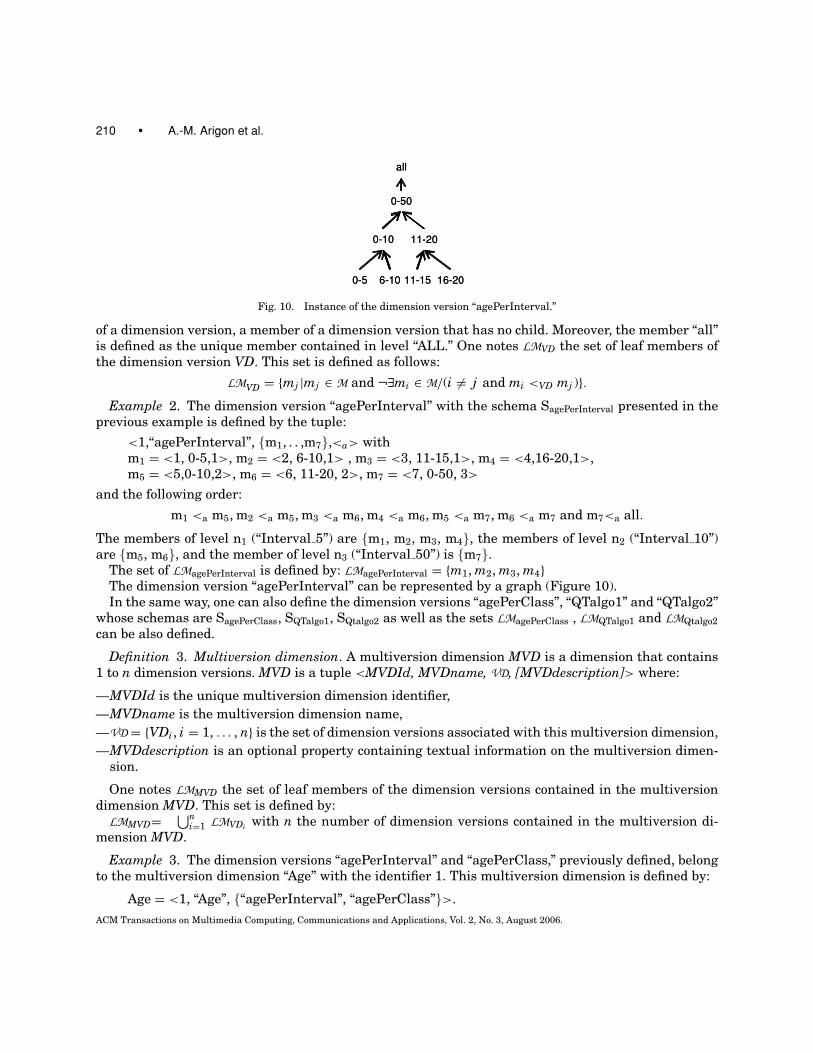
LMVD = {mj |mj ∈ M and ¬∃mi ∈ M/(i �= j and mi <VD mj )}.Example 2. The dimension version “agePerInterval” with the schema SagePerInterval presented in the
previous example is defined by the tuple:
<1,“agePerInterval”, {m1, . . ,m7},<a> withm1 = <1, 0-5,1>, m2 = <2, 6-10,1> , m3 = <3, 11-15,1>, m4 = <4,16-20,1>,m5 = <5,0-10,2>, m6 = <6, 11-20, 2>, m7 = <7, 0-50, 3>
and the following order:
m1 <a m5, m2 <a m5, m3 <a m6, m4 <a m6, m5 <a m7, m6 <a m7 and m7<a all.
The members of level n1 (“Interval 5”) are {m1, m2, m3, m4}, the members of level n2 (“Interval 10”)are {m5, m6}, and the member of level n3 (“Interval 50”) is {m7}.
The set of LMagePerInterval is defined by: LMagePerInterval = {m1, m2, m3, m4}The dimension version “agePerInterval” can be represented by a graph (Figure 10).In the same way, one can also define the dimension versions “agePerClass”, “QTalgo1” and “QTalgo2”
whose schemas are SagePerClass, SQTalgo1, SQtalgo2 as well as the sets LMagePerClass , LMQTalgo1 and LMQtalgo2
can be also defined.
Definition 3. Multiversion dimension. A multiversion dimension MVD is a dimension that contains1 to n dimension versions. MVD is a tuple <MVDId, MVDname, VD, [MVDdescription]> where:
—MVDId is the unique multiversion dimension identifier,
—MVDname is the multiversion dimension name,
—VD = {VDi, i = 1, . . . , n} is the set of dimension versions associated with this multiversion dimension,
—MVDdescription is an optional property containing textual information on the multiversion dimen-sion.
One notes LMMVD the set of leaf members of the dimension versions contained in the multiversiondimension MVD. This set is defined by:
LMMVD= ⋃ni=1 LMVDi with n the number of dimension versions contained in the multiversion di-
mension MVD.
Example 3. The dimension versions “agePerInterval” and “agePerClass,” previously defined, belongto the multiversion dimension “Age” with the identifier 1. This multiversion dimension is defined by:
Age = <1, “Age”, {“agePerInterval”, “agePerClass”}>.
ACM Transactions on Multimedia Computing, Communications and Applications, Vol. 2, No. 3, August 2006.
Handling Multiple Points of View in a Multimedia Data Warehouse • 211
In the following, the names of the members of dimension versions are used in order to identify them.One defines the set LMAge by: LMAge = {0–5, 6–10, 11–15, 16–20, young child, child, teenager, youngadult, adult, senior}.
The dimension versions “QTalgo1” and “QTalgo2” belong to multiversion dimension “DurationQT”with the identifier 2. This multiversion dimension is defined by: Duration QT = <2, QT, {QTalgo1,QTalgo2}>.
The set LMDurationQT is defined the same way.
Definition 4. Functional multiversion fact table. A functional multiversion fact table provides themeasures according to various dimension versions. Let {μi, i = 1, . . . , m} be the set of measurements,a functional multiversion fact table ft is defined by a function such as:
ft : MVD1 × MVD2 × · · · × MVDn → dom(μ1) × · · · × dom(μm)
m1, m2, . . . , mn �→ v1, . . . , vm
where:
—n is the number of multiversion dimensions of the data warehouse, mi ∈ LMMVDiwith i = 1, . . . , n
—dom(μk) is the range for the measure μk .
This function associates the values vk of measures μk with the leaf members of the dimension versionsof each multiversion dimension.
Definition 5. Function of dimension version. The functions of dimension version are the computationmodes that enable calculating the members of a dimension version VD from the data of the produc-tion database. A function of dimension version fVD is a tuple <functionIdVD, VDid, functionNameVD,functionDefinitionVD> where:
—functionIdVD is the identifier for the function of dimension version VD,
—VDid is the identifier for the dimension version VD whose members are computed using this functionof dimension version,
—functionNameVD is the name for the function of dimension version,
—functionDefinitionVD is the definition for the function of dimension version.
These functions can be formulized as in the following:
fVD : DB f → LMVD
d �→ m
where DB f is the set of data of the production database restricted to fVD—used to compute the mem-bers of VD. fVD associates a value of the production database and a leaf member of the version ofcorresponding VD.
Example 4. Let the function fagePerClass be defined for the dimension version “agePerClass” and thedefined function fagePerInterval for the dimension version “agePerInterval ”. For a 12-year-old patient, themembers of the dimension versions are respectively:
fagePerClass(12) = “young” and fagePerInterval(12) = “11–15”
Let the function fQtalgo1 be defined for the dimension version “Qtalgo1” and the defined function fQtalgo2 forthe dimension version “Qtalgo2”. Then for an electrocardiogram “ECG5,” the members of the dimensionversions are respectively:
fQtalgo1 (ECG5) = 100 and fQtalgo2 (ECG5) = 110.
ACM Transactions on Multimedia Computing, Communications and Applications, Vol. 2, No. 3, August 2006.
212 • A.-M. Arigon et al.
Definition 6. Functional multiversion multidimensional structure. A functional multiversion multi-dimensional structure F2M is a tuple <MVD, ft, F> where:
—MVD = ⋃si=1 MVDi is the set of all the multiversion dimensions,
—ft is the functional multiversion fact table,
—F = ⋃rj=1 fVD j
is the set of all the functions of the dimension versions.
Definition 7. Aggregation of data. Aggregation of data can be computed from the multiversion facttable and the schema of the dimension versions. Let an aggregation function φk be defined for eachmeasure μk , m a non-leaf member of the dimension version VD of the multiversion dimension MVD1
and m11, m1
2, . . . , m1J its leaf members such as:(
m11, m1
2, . . . , m1J
) ∈ LMVD × . . . × LMVD.
For each leaf member m1p and the other leaf members m2, . . . , mn of the relying dimensions the ft
function gives the value of the measures: ∀p ∈ [1, J ], ft(m1p, m2, . . . , mn) = vp
1 , . . . , vpm with n being the
number of multiversion dimensions of the data warehouse.Thus, the aggregated values for m are obtained by:
ft(m, m2, . . . , mn) = φJ1p=1
vp1 , . . . , φJ
mp=1vp
m,
applying the associated aggregation function on each measure.The aggregation function can be a classic function of OLAP technology (sum, min, max, avg) for nu-
meric measures or a more specific function (statistic average . . . ) for signal or image typemeasures.
4. DESCRIPTION OF THE IMPLEMENTED PROTOTYPE
Our prototype has been implemented following a three tier architecture:
1. a functional multiversion multimedia data warehouse in which the multiversion dimensions andthe functional multiversion fact table are stored,
2. an OLAP cube built from the functional multiversion multimedia data warehouse, using aggrega-tions, which enables requests against the functional dimension versions,
3. a tool for data navigation and visualization.
The prototype is easy to use by the clinical physicians because it doesn’t need any knowledge of querylanguage nor database management system. We use Microsoft SQL Server and Analysis Services toimplement the prototype. The aggregation functions are implemented in Visual Basic; an interfaceusing Proclarity 4.0 is built for navigation (Figure 11 and detailed further). The data is loaded from theproduction database to the functional multiversion multimedia data warehouse using the functions ofdimension versions.
The data of the EMIAT study has been integrated in the prototype. The multiversion dimensiontables and functional multiversion fact tables are populated with an ETL (Extraction, Transformation,Loading) tool. The data warehouse contains a functional multiversion fact table and eight multiversiondimensions. The facts are ECG signals from the EMIAT study. Multiversion dimensions represent thedescription-based descriptors and the content-based descriptors of these ECGs. Among the multiversiondimensions, three dimensions are related to the patient (principal pathology, age, and gender), two toECG acquisition (time, technology, and date) and two to the content of the ECGs (the duration of theQT, the noise level). Aggregations of data are computed from the functional multiversion fact tableand the hierarchical links between the members of the dimension versions. The aggregation functions
ACM Transactions on Multimedia Computing, Communications and Applications, Vol. 2, No. 3, August 2006.
Handling Multiple Points of View in a Multimedia Data Warehouse • 213
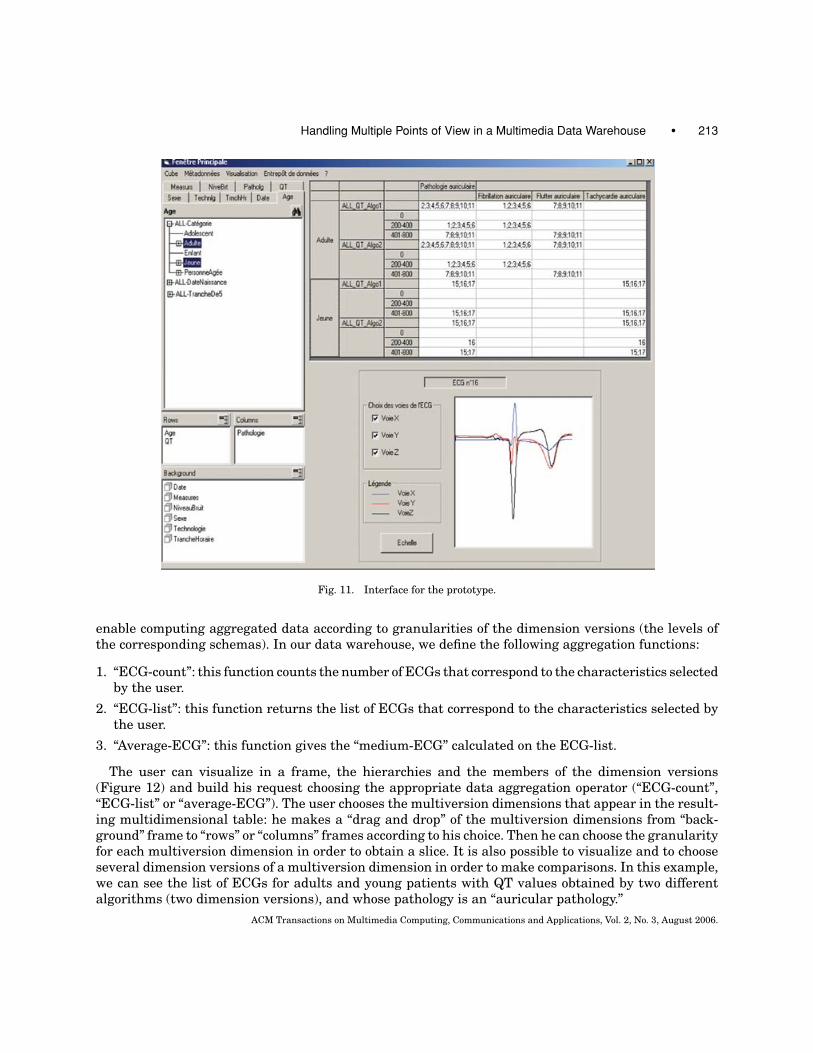
Fig. 11. Interface for the prototype.
enable computing aggregated data according to granularities of the dimension versions (the levels ofthe corresponding schemas). In our data warehouse, we define the following aggregation functions:
1. “ECG-count”: this function counts the number of ECGs that correspond to the characteristics selectedby the user.
2. “ECG-list”: this function returns the list of ECGs that correspond to the characteristics selected bythe user.
3. “Average-ECG”: this function gives the “medium-ECG” calculated on the ECG-list.
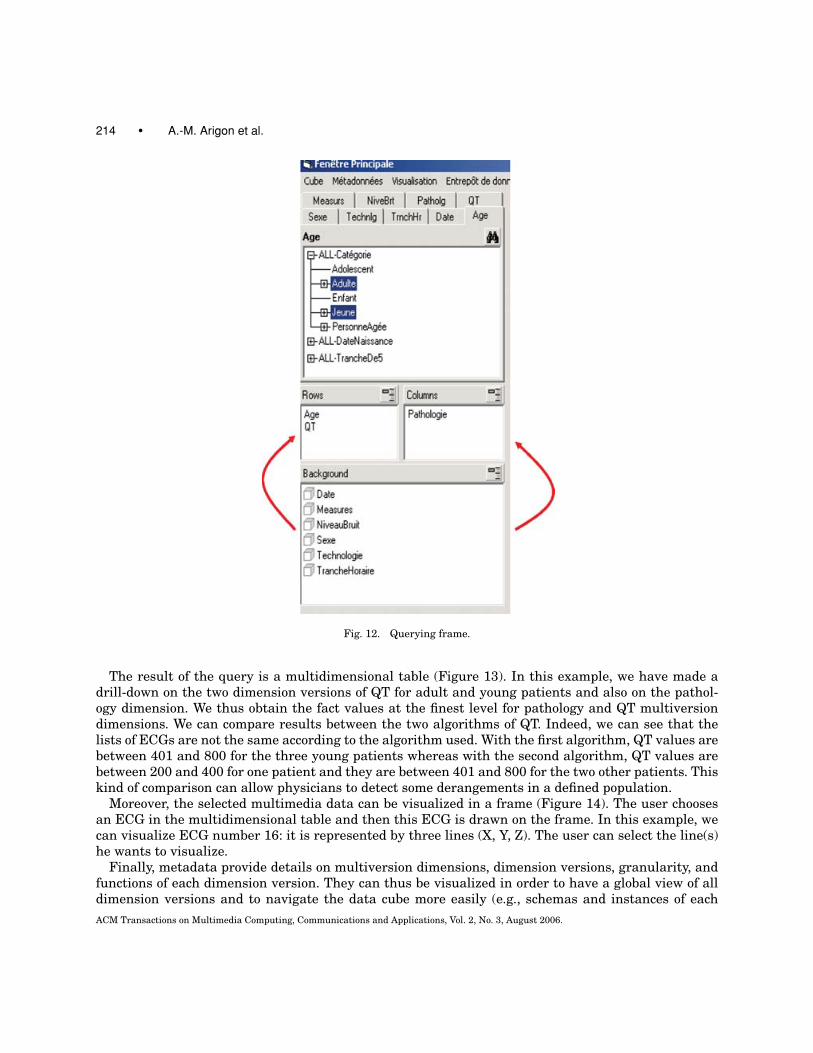
The user can visualize in a frame, the hierarchies and the members of the dimension versions(Figure 12) and build his request choosing the appropriate data aggregation operator (“ECG-count”,“ECG-list” or “average-ECG”). The user chooses the multiversion dimensions that appear in the result-ing multidimensional table: he makes a “drag and drop” of the multiversion dimensions from “back-ground” frame to “rows” or “columns” frames according to his choice. Then he can choose the granularityfor each multiversion dimension in order to obtain a slice. It is also possible to visualize and to chooseseveral dimension versions of a multiversion dimension in order to make comparisons. In this example,we can see the list of ECGs for adults and young patients with QT values obtained by two differentalgorithms (two dimension versions), and whose pathology is an “auricular pathology.”
ACM Transactions on Multimedia Computing, Communications and Applications, Vol. 2, No. 3, August 2006.
214 • A.-M. Arigon et al.
Fig. 12. Querying frame.
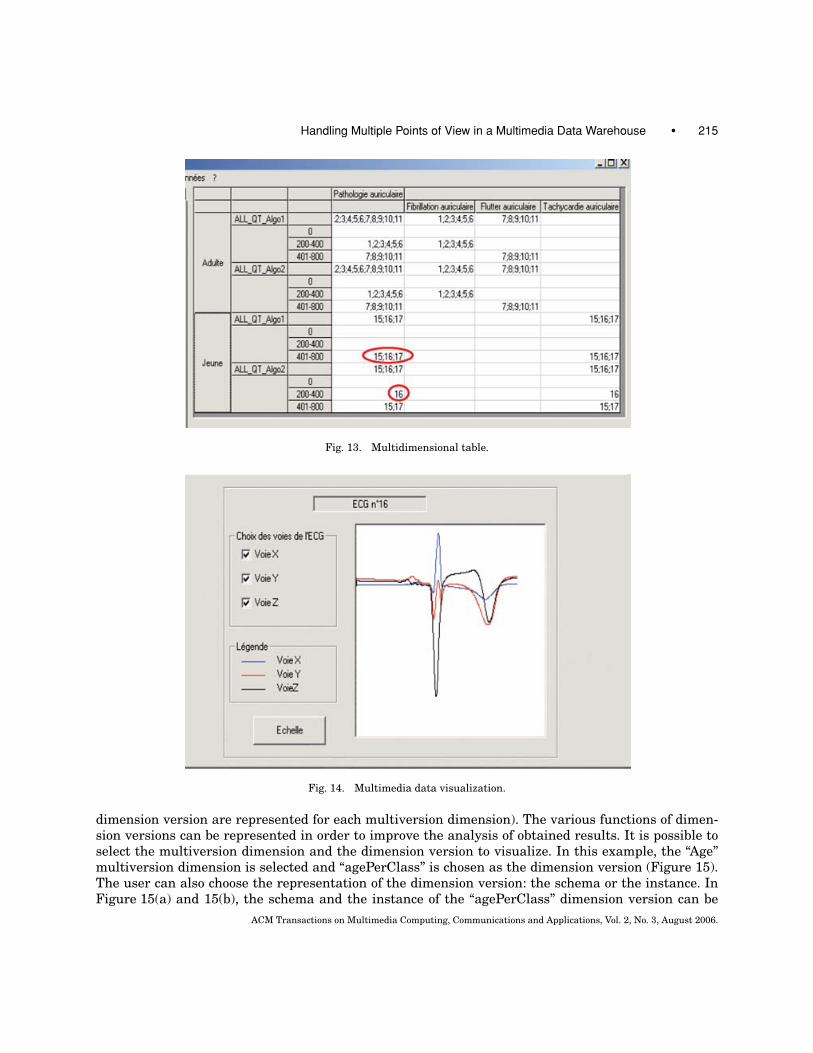
The result of the query is a multidimensional table (Figure 13). In this example, we have made adrill-down on the two dimension versions of QT for adult and young patients and also on the pathol-ogy dimension. We thus obtain the fact values at the finest level for pathology and QT multiversiondimensions. We can compare results between the two algorithms of QT. Indeed, we can see that thelists of ECGs are not the same according to the algorithm used. With the first algorithm, QT values arebetween 401 and 800 for the three young patients whereas with the second algorithm, QT values arebetween 200 and 400 for one patient and they are between 401 and 800 for the two other patients. Thiskind of comparison can allow physicians to detect some derangements in a defined population.
Moreover, the selected multimedia data can be visualized in a frame (Figure 14). The user choosesan ECG in the multidimensional table and then this ECG is drawn on the frame. In this example, wecan visualize ECG number 16: it is represented by three lines (X, Y, Z). The user can select the line(s)he wants to visualize.
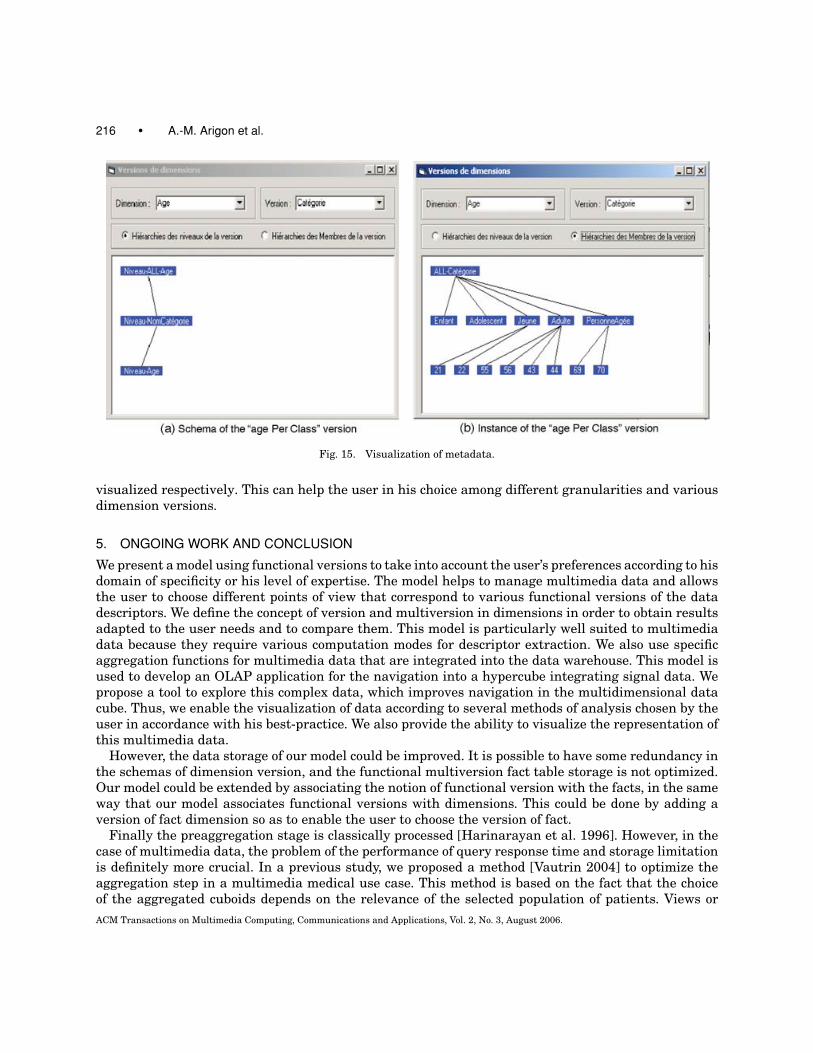
Finally, metadata provide details on multiversion dimensions, dimension versions, granularity, andfunctions of each dimension version. They can thus be visualized in order to have a global view of alldimension versions and to navigate the data cube more easily (e.g., schemas and instances of each
ACM Transactions on Multimedia Computing, Communications and Applications, Vol. 2, No. 3, August 2006.
Handling Multiple Points of View in a Multimedia Data Warehouse • 215
Fig. 13. Multidimensional table.
Fig. 14. Multimedia data visualization.
dimension version are represented for each multiversion dimension). The various functions of dimen-sion versions can be represented in order to improve the analysis of obtained results. It is possible toselect the multiversion dimension and the dimension version to visualize. In this example, the “Age”multiversion dimension is selected and “agePerClass” is chosen as the dimension version (Figure 15).The user can also choose the representation of the dimension version: the schema or the instance. InFigure 15(a) and 15(b), the schema and the instance of the “agePerClass” dimension version can be
ACM Transactions on Multimedia Computing, Communications and Applications, Vol. 2, No. 3, August 2006.
216 • A.-M. Arigon et al.
Fig. 15. Visualization of metadata.
visualized respectively. This can help the user in his choice among different granularities and variousdimension versions.
5. ONGOING WORK AND CONCLUSION
We present a model using functional versions to take into account the user’s preferences according to hisdomain of specificity or his level of expertise. The model helps to manage multimedia data and allowsthe user to choose different points of view that correspond to various functional versions of the datadescriptors. We define the concept of version and multiversion in dimensions in order to obtain resultsadapted to the user needs and to compare them. This model is particularly well suited to multimediadata because they require various computation modes for descriptor extraction. We also use specificaggregation functions for multimedia data that are integrated into the data warehouse. This model isused to develop an OLAP application for the navigation into a hypercube integrating signal data. Wepropose a tool to explore this complex data, which improves navigation in the multidimensional datacube. Thus, we enable the visualization of data according to several methods of analysis chosen by theuser in accordance with his best-practice. We also provide the ability to visualize the representation ofthis multimedia data.
However, the data storage of our model could be improved. It is possible to have some redundancy inthe schemas of dimension version, and the functional multiversion fact table storage is not optimized.Our model could be extended by associating the notion of functional version with the facts, in the sameway that our model associates functional versions with dimensions. This could be done by adding aversion of fact dimension so as to enable the user to choose the version of fact.
Finally the preaggregation stage is classically processed [Harinarayan et al. 1996]. However, in thecase of multimedia data, the problem of the performance of query response time and storage limitationis definitely more crucial. In a previous study, we proposed a method [Vautrin 2004] to optimize theaggregation step in a multimedia medical use case. This method is based on the fact that the choiceof the aggregated cuboids depends on the relevance of the selected population of patients. Views or
ACM Transactions on Multimedia Computing, Communications and Applications, Vol. 2, No. 3, August 2006.
Handling Multiple Points of View in a Multimedia Data Warehouse • 217
parts of views thus do not represent useful data for the user. In this case, these views should not bematerialized so as to allow materialization of more useful views.
REFERENCES
AGRAWAL, R., GUPTA, A., AND SARAWAGI, S. 1995. Modeling Multidimensional Databases. IBM Research Report, IBM Almaden
Research Center, September p. 25.
BLASCHKA, M. 1999. FIESTA: A framework for schema evolution in multidimensional information systems. In Proceedings of6th Doctoral Consortium. Heidelberg, Germany, June.
BLASCHKA, M., SAPIA, C., AND HOFLING, G. 1999. On schema wvolution in multidimensional databases. In Proceedings of DataWarehousing and Knowledge Discovery, First International Conference. Florence, Italy, August 30–September 1, 1999, Lecture
Notes in Computer Science 1676 Springer ISBN 3-540-66458-0.
BLIUJUTE, R., SALTENIS, S., SLIVINSKAS, G., AND JENSEN, C. S. 1998. Systematic change managment in dimensional data ware-
housing. In Proceedings of the 3rd International Baltic Workshop on DB and IS, pp. 27–41.
CHAMONI, P. AND STOCK, S. 1999. Temporal structures in data warehousing. In Proceedings of Data Warehousing and KnowledgeDiscovery, First International Conference, Florence, Italy, August 30–September 1, 1999.
BODY, M., MIQUEL, M., BEDARD, Y., AND TCHOUNIKINE, A. 2003. Handling Evolutions in Multidimensional structures. In Proceed-ings of the 19th International Conference on Data Engineering, March 5–8, 2003, Bangalore, India, IEEE Computer Society.
ISBN 0-7803-7665-X.
CABIBBO, L. AND TORLONE, R. 1998. A logical approach to multidimensional databases. In Proceedings of Advances in DatabaseTechnology—EDBT, 6th International Conference on Extending Database Technology. Valencia, Spain, March 23–27, 1998,
Lecture Notes in Computer Science 1377 Springer ISBN 3-540-64264-1.
CHAUDHURI, S. AND DAYAL, U. 1997. An overview of data warehousing and olap technology. SIGMOD Record 26, 1, (Mar.), 65–74.
CHEVALIER, P., RODRIGUEZ, C., BONTEMPS, L., MIQUEL, M., KIRKORIAN, G., ROUSSON, R., POTET, F., SCHOTT, J. J., BANO, I., AND TOUBOUL, P.
2001. Noninvasive testing of acquired long QT syndrome: Evidence for multiple arrhythmogenic substrates. CardiovascularResearch. 50, 2 (May). 386–398.
EDER, J. AND KONCILIA, C. 2001. Evolution of dimension data in temporal data warehouses. In Proceedings of the Data Ware-housing and Knowledge Discovery, Third International Conference, Munich, Germany, September 5–7, 2001, Lecture Notes in
Computer Science 2114 Springer, ISBN 3-540-42553.
GOLFARELLI, M., LECHTENBORGER, J., RIZZI, S., AND VOSSEN, G. 2004. Schema versioning in data warehouses. ER (Workshops),415–428.
GYSSENS M. AND LAKSHMANAN, L. V. S. 1997. A Foundation for Multi-Dimensional Databases. In Proceedings of the 23rd Inter-national Conference on Very Large Data Bases. Athens, Greece August 25–29, 1997, Morgan Kaufmann, ISBN 1-55860-470-7.
HAN, J. AND KAMBER, M. 2001. Data mining, concepts and techniques. Morgan Kaufmann.
HARINARAYAN, V., RAJARAMAN, A., AND ULLMAN, J. D. 1996. Implementing data cubes efficiently. In Proceedings of the ACMSIGMOD Conference of Management of Data. pp. 205–216, Montreal, Quebec, June 1996.
HURTADO, C., MENDELZON, A. O., AND VAISMAN, A. 1999a. Maintaining data cubes under dimension updates. In Proceedings ofthe 15th International Conference on Data Engineering. Sydney, Australia, 23–26 March 1999, IEEE Computer Society Press.
HURTADO, C., MENDELZON, A. O., AND VAISMAN, A. 1999b. Updating OLAP dimensions. In Proceedings of the ACM Second Inter-national Workshop on Data Warehousing and OLAP, ACM. Kansas City, Missouri, USA, November 6, 1999.
INMON, W. H. 1996. Building the Data Warehouse. 3rd Edition, Wiley and Sons.
KAMP, V. AND WIETEK, F. 1997. Database system for multidimensional data analysis. In Proceedings of the InternationalDatabase Engineering and Application Symposium (IDEAS). Concordia University, Montreal, Candada, August 25–27, 1997.
KIMBALL, R. 1996. The Data Warehouse Toolkit. J. Wiley and Sons, Inc.
Lehner, W. 1998. Modeling large OLAP scenarios. In Proceedings of the International Conference on Extending DatabaseTechnology. Valencia, Spain.
LI, C. AND SEAN WANG, X. 1996. A data model for supporting on-line analytical processing. In Proceedings of the Fifth Interna-tional Conference on Information and Knowledge Management, ACM. Rockville, Maryland, USA, November 12–16, 1996.
MENDELZON, A. O., AND VAISMAN, A. 2000. Temporal queries in OLAP. In Proceedings of 26th International Conference on VeryLarge Data Bases. Cairo, Egypt, September 10–14, 2000.
PEDERSEN, T. B., JENSEN, C., AND DYRESON, C. 2001. a foundation for capturing and querying complex multidimensional data.
Information Systems (special issue on data warehousing), 26, 5 (July), 383–423.
TIKEKAR, R. V. AND FOTOUHI, F. 1995. Storage and retrieval of medical images from data warehouses. Digital Image Storageand Archiving Systems.
ACM Transactions on Multimedia Computing, Communications and Applications, Vol. 2, No. 3, August 2006.
218 • A.-M. Arigon et al.
VASSILIADIS, P. AND SELLIS, T. 1999. A survey of logical models for OLAP databases. SIGMOD Record 28, 4 (Dec.), 64–69.
VAUTRIN, J. S. 2004. Entrepot de donnees multimedia. master report.
YOU, J., DILLON, T., LIU, J., AND PISSALOUX, E. 2001. On hierarchical multimedia information retrieval. In Proceedings of theInternational Conference on Image Processing. Thessaloniki, Greece, October 7–10, 2001.
ZAIANE, O. R., HAN, J., LI, Z. H., AND HOU, J. 1998. Mining multimEdia data. In Proceedings of CASCON, Meeting of Minds, pp
83–96, Toronto, Canada, November 1998.
ZHANG, H., CAO, X., WONG, S. T., LOU, A. S., AND SICKLES, E. A. 2001. Developing a digital mammography data warehouse.
In Proceedings of SPIE, Vol. 4323, pp. 308–315, Medical Imaging 2001: PACS and Integrated Medical Information Systems:
Design and Evaluation, Eliot L. Siegel, H. K. Huang, Eds.
Received May 2006; accepted May 2006
ACM Transactions on Multimedia Computing, Communications and Applications, Vol. 2, No. 3, August 2006.