Embed Size (px)
Citation preview
MASTER’S THESIS AUGUST 2012
Harboe Brewery A/S A Strategic Analysis and Valuation of the Company
Paw Oskar Gottenborg Bruun
Supervisor: Morten Høgh-Petersen MSc. line: Applied Economics and Finance
Number of figures: 181402 < max of 182000

1
Executive Summary
The purpose of this thesis is to assess the value of Harboe Brewery A/S (hereafter Harboe). Harboe’s main
activity is the production of beer and soda for the discount off-trade sector in Denmark, Germany, Sweden,
Norway, Poland, and the Baltic countries. Harboe is the third largest brewer in Denmark (following
Carlsberg and Royal Unibrew), in addition the company has a subsidiary, Harboe Farm A/S, which is
involved in the manufacturing of meat products.
As part of an established industry which creates products that are characterized as non-cyclical short-term
consumer goods (food and beverages), the demand for Harboe’s products would be expected to be quite
stable with relatively low exposure to the cyclical changes of the economy. However, an overall decrease in
demand for beer in western economies during the past decade, combined with increased cost of
production and intensifying competition has challenged the industry.
The valuation of the company is based on a strategic and financial analysis, where Harboe’s capability to
adopt its business model to the challenging circumstances of the external environment is evaluated. Based
on the analyzed data, some of the main challenges identified in the strategic analysis are: rising raw
material prices, intensified competition and a current risk of new taxes, combined with diluted profit
margins due to the high bargaining power of customers, and the shifting preferences of consumers.
However, the analysis also show that Harboe does have some success in focusing on high volume low cost
production facilitated by its maintained, effective, and flexible production facilities. Based on the annual
accounts, the financial analysis in general shows a low but stable profitability on the main financial value
drivers of the company. The information from the strategic and financial analysis is used to budget the
expected future development of the company’s free cash flow. These cash flows are then discounted back
to their present value by the weighted average cost of capital using the discount cash flow model.
Based on the above the share price is estimated at DKK 100.2 on the 29. June 2011, which is 12.87% lower
compared to the actual quoted price of DKK 115 on that date. In evaluating whether Harboe is in fact
overestimated the calculations were checked through Multiple Analysis and subjected to a sensitivity
analysis, which supported the findings. Therefore the main conclusion of the analysis is that Harboe will
not be able to generate enough value to satisfy the required rate of return of shareholders. A conclusion
that indicates a challenging future for Harboe!

2
Table of Contents Executive Summary ............................................................................................................................................ 1
1.0 Introduction ................................................................................................................................................. 5
1.1 Problem Formulation ............................................................................................................................... 6
1.2 The Structure of the Thesis ...................................................................................................................... 8
1.3 Thesis Methodology ................................................................................................................................. 8
1.3.1 Valuation Models .............................................................................................................................. 9
1.3.2 Criticism of Applied Model ............................................................................................................. 11
1.3.3 Reliability and Validity of the Data ................................................................................................. 12
1.4 Delimitations .......................................................................................................................................... 13
2.0 Presentation of Harboe and its Markets .................................................................................................... 14
2.1 History and Organization ....................................................................................................................... 14
2.2 Ownership Structure .............................................................................................................................. 15
2.3 Corporate Governance........................................................................................................................... 16
2.4 Markets .................................................................................................................................................. 17
2.4.1 Structure, Trends and Developments in the Danish Market .......................................................... 18
2.4.2 Structure, Trends and Developments in the German Market ........................................................ 20
2.4.3 Structure, Trends and Developments within Other Markets ......................................................... 21
2.5 Strategy, Competencies and Product Portfolio ..................................................................................... 23
3.0 Strategic Analysis ....................................................................................................................................... 26
3.1 Analyzing the Environmental Factors at Society Level using the PEST Model ...................................... 26
3.1.1 Political ............................................................................................................................................ 26
3.1.2 Economical ...................................................................................................................................... 28
3.1.3 Sociocultural ................................................................................................................................... 29
3.1.4 Technology ...................................................................................................................................... 30
3.1.5 Summarizing the PEST-Analysis ...................................................................................................... 31
3.2 Analyzing the Environment Factors at Industry Level using Porters Five Forces .................................. 32
3.2.1 Barriers to Entry .............................................................................................................................. 32
3.2.2 Suppliers' Bargaining Power ........................................................................................................... 33
3.2.3 Customer Bargaining Power ........................................................................................................... 33
3.2.4 Substituting Products ...................................................................................................................... 34
3.2.5 Rivalry in the industry ..................................................................................................................... 35
3.2.6 Summarizing Porter’s Five Forces ................................................................................................... 37

3
3.3 Internal Analysis of Resources and Competencies ................................................................................ 38
3.4 Summarizing the Strategic Analysis ....................................................................................................... 40
4.0 Financial analysis ........................................................................................................................................ 41
4.1 Reformulation – the Theoretical Approach ........................................................................................... 41
4.1.1 Reformulation of the Balance Sheet ............................................................................................... 42
4.1.2 Reformulation of the Income Statement ........................................................................................ 42
4.1.3 Reformulation of the Equity Statement ......................................................................................... 43
4.2 Reformulation – the Practical Approach................................................................................................ 43
4.3 The Analysis of Profitability ................................................................................................................... 44
4.3.1 Breakdown of Financial Value Drivers ............................................................................................ 46
4.3.2 Return on Net Operating Assets ..................................................................................................... 47
4.3.3 Breakdown of RNOA ....................................................................................................................... 47
4.3.4 Breakdown of ATO .......................................................................................................................... 48
4.3.5 Breakdown of PM ........................................................................................................................... 49
4.3.6 ROCE and the Breakdown of Financial Leverage ............................................................................ 50
4.4 Risk Analysis ........................................................................................................................................... 51
4.4.1 Operational Risk .............................................................................................................................. 51
4.4.2 Financial Risk ................................................................................................................................... 52
4.4.3 Liquidity Analysis ............................................................................................................................. 52
4.4.4 Financial Condition ......................................................................................................................... 54
5.0 Budgeting ................................................................................................................................................... 55
5.1 Net Sales ................................................................................................................................................ 57
5.2 Profit Margin .......................................................................................................................................... 58
5.3 Net Operating Assets - ATO ................................................................................................................... 58
5.4 Tax rate .................................................................................................................................................. 59
5.5 The Budget ............................................................................................................................................. 60
6.0 Valuation .................................................................................................................................................... 60
6.1 The WACC .............................................................................................................................................. 61
6.1.1 Long Term Capital Structure ........................................................................................................... 61
6.1.2 Estimating the Cost of Debt ............................................................................................................ 62
6.1.3 Estimating the Cost of Equity .......................................................................................................... 64
6.2 Calculating Company Value ................................................................................................................... 69
6.2.1 Control of the DCF-Model ............................................................................................................... 69

4
6.2.2 Valuing Harboe Farm using the P/E Multiple.................................................................................. 70
6.2.3 Benchmarking Against Actual Share Price ...................................................................................... 71
6.2.4 Multiple Analysis of Harboe ............................................................................................................ 72
6.2.5 Sensitivity Analysis .......................................................................................................................... 73
6.3 Summarizing the Valuation .................................................................................................................... 73
7.0 Conclusion .................................................................................................................................................. 74
8.0 Perspective ................................................................................................................................................. 77
9.0 Bibliography ............................................................................................................................................... 78
Appendix 1: Structure of Assignment ...................................................................................................... 81
Appendix 2: Corporate Structure .............................................................................................................. 82
Appendix 3 - Reformulated Financial Statements and Associated Notes. ........................................ 83
Appendix 4: Breakdown of Financial Value Drivers ............................................................................. 93
Appendix 5: Danish Government Bond with 10 Years to Maturity .................................................... 95
Appendix 6: Datastream (Raw Beta) and Reuters (Adjusted Beta) Estimation of Harboe Beta .. 96
Appendix 7: Calculating the Value of Equity using the Residual Earnings Model ........................... 97

5
1.0 Introduction The purpose of this thesis is to conduct a strategic analysis and valuation of Harboe. Topic selection is
based on the prospect of working with a problem that is comprehensive in relation to the area of study of
my Master’s degree (Applied Economics and Finance). The aspiration is to be able, in practice, to apply the
theories and models, central to the curriculum, to a real case scenario.
The brewing industry in Denmark is interesting in that it has a long history and because of its strong
position internationally, despite its relatively small national market. Additionally, the brewing sector
provides substantial benefits to national governments in fiscal terms through value-added products, VAT,
tariffs and taxes, and via employments. However, during the past 10 years total sales of beer have been
declining in Western European markets1, and since the end of 2007 the Western economies have
experienced a housing and financial crisis, which has caused serious recession in many countries and
challenged the profitability of most industries.
In general, the markets for beer consumption in Western Europe are characterized as mature with strong
players within the different segments, and the downward tendency of consumption in these markets,
combined with increasing costs of raw materials has toughened the competitive situation2. The changing
market conditions have motivated consolidation within the industry on a national and international scale as
a way of improving efficiency and achieving greater sales. Furthermore brewing companies are trying to
increase sales by entering new emerging markets, illustrated by an increasing degree of internationalization
(export share of national production)3.
Harboe is among the biggest breweries in Denmark but a small player on the global scene. Still, one of
Harboe’s main efforts is growth through new markets, and the company therefore produces both for local
consumption and for export. The primary strategic focus of the company is to produce low end products at
low costs, hence using price as the competitive advantage. Changing consumer preferences have however
forced Harboe to look for other ways to improve profit and consequently Harboe is beginning to put more
emphasis on product development and marketing in an effort to differentiate its products towards markets
with higher profit margins.
1 Bryggeriforeningen.dk; ”tal fra bryggeriforeningen øl 2011”, page 7 2 Harboe annual report 2010/11, page 19 3 Bryggeriforeningen.dk; ”tal fra bryggeriforeningen øl 2011”, page 9

6
1.1 Problem Formulation Given the context described above, it is interesting to assess Harboe’s capability to adapt to the challenging
market conditions. Is the company using its strengths to exploit the opportunities available in the markets,
or is the company leaving itself too exposed to operational and financial risks? As a way of assessing this,
this thesis will work through a valuation of the company. At its end, this means that the company’s share
price is calculated and benchmarked against the actual share price on the given date. By, benchmarking the
estimated theoretical share price against the actual share price the ambition is to evaluate the
attractiveness of the share from the perspective of the investor.
Based on the above, the research question of this thesis is:
- What is the theoretically correct value of a share in Harboe4 per 29 of June 2011?
The latest available annual report is the 2010/2011 report published on 28.06.2011. In this, the company's
financial statements are prepared per 30.04.2011. Working with the hypothesis of semi-strong markets,
the available information is expected to be reflected in the share price immediately after it is published5.
This is why the estimated share price is benchmarked against the actual share price on the 29.06.2011 and
also why this is the cut-off date after which no new information is included in the valuation.
At the core of the valuation process lies the budget period which forecast the future development of
company value drivers, but a prerequisite to this projection is the strategic analysis and the financial
analysis. The purpose of the strategic analysis is to identify and evaluate the non-financial value driver,
which will influence the value creation of Harboe going forward, while the aim of the financial analysis is to
establish a level and trend of the financial value drivers by looking at the historical performance of the
company. The strategic analysis thus, works as an intermediate connection between the past and the
future, incorporating the required changes in the estimates of the financial value drivers when moving from
the historical performance to forecasting future performance.
When the forecast of the budgeting period is attained, the data is used in the DCF valuation model to arrive
at a value estimate. This estimate is hereafter subject to multiple analysis and sensitivity analysis with the
purpose of making a reality check of the estimate and deciding how susceptible this estimate is to changes
in underlying determinants.
4 Where the object subjected to valuation, is the company at group level and the value is estimated based on the “fair market value” perspective of trading in the open market. 5 http://en.wikipedia.org/wiki/Efficient-market_hypothesis

7
To facilitate the above process and answer the research, the following subsections will be described and
analyzed:
The strategic analysis
- Perform an environment analysis of non-financial value drivers on a society level and on an industry
level.
- Perform an internal analysis of non-financial value drivers, including an analysis of the resources
and core competencies of the company.
- Perform a SWOT6 analysis.
The purpose of the above is to explain how the company’s current and future earnings are affected by
factors at society level, on industry level, and by the company’s business model. Thus, the analysis aims at
evaluating whether the company utilizes the possibilities within its surroundings efficiently. The SWOT
analysis is used to divide the non-financial value drivers, from the analysis of the company’s surroundings,
into possibilities and threats, and the non-financial value drivers, from the internal analysis, into strengths
and weaknesses.
The financial analysis
- Conduct a reformulation of the financial statements of the historical annual reports, arriving at an
outline of the development in the central financial value drivers during the chosen period.
- Asses the company’s financial condition.
Here the focus is on highlighting trends within the company’s accomplished results. The historical
performance is then used to make a projection of the financial value drivers going forward. The published
statements are primarily used by the firm to document the periodic results and are not intended for use in
the valuation. The analyst therefore, has to reformulate the financial statements with a view on valuation.
Additionally, the company’s financial condition is assessed to evaluate the financial health of the company
and the degree of risk with which the company is operating.
The budgeting and valuation
- Clarify the assumptions behind the forecasted budget.
- Complete a forecast of the development in relevant financial value drivers within the budget period
and of the expected growth rate used for calculating the terminal value.
6 SWOT stands for: Strengths, Weaknesses, Opportunities and Threats

8
- Estimate the weighted average cost of capital.
- Estimate the value of a share in Harboe using the discounted cash flow model.
- Show how sensitive the estimated value is to changes in some of the underlying factors.
The final part of the thesis will introduce a budget procedure that makes use of key figures in order to
express the expectations about the company's ability to create value in the future within the various areas
of the company's business. Hereafter, the challenge is to estimate the correct weighted average cost of
capital (WACC) and discount the future free cash flows using the DCF-model7. Finally, the reliability of the
estimate is assessed through multiple analyses and by testing the sensitivity of the estimates.
1.2 The Structure of the Thesis The valuation is divided into several phases, which together leads to the actual valuation. The chart
attached in appendix 1 show how the thesis is structured in a number of main sections. Firstly, the
introduction presents the reader to the thesis and contains the problem formulation, this section on
structure of the thesis, a section on methodology and the delimitations of the thesis. Hereafter, the
presentation of Harboe and its markets will account for the history and organization of the company, its
markets, its ownership structure and corporate governance, and the strategy, competencies and product
portfolio of the company. Afterward, the strategic analysis will apply a number of models in order to
highlight the most essential factors of Harboe’s surroundings and its internal capabilities. Then, the
financial analysis will reformulate the annual accounts of the company in order to prepare them for
analysis of profitability. The financial analysis will also include a section on risk analysis. Next, the budgeting
will forecast the company’s future performance. This forecast will be based on the underlying non-financial
value drivers identified in the strategic analysis and on main financial value drivers from the reformulated
income statements and balance sheets. Subsequently, the valuation will estimate the WACC and calculate
and comment on the actual share price. To test the estimates, a sensitivity analysis is carried out showing
the effect of a modification in key figures. The thesis is finalized with a conclusion and a perspective.
1.3 Thesis Methodology In order to be able to work in-depth with the main research question the structure of the thesis will use an
application-oriented approach and theoretical descriptions of the applied models is therefore limited to
include only the most basic.
7 Arguments for applying the discount cash flow model can be found in section 1.3.1 Valuation Models

9
1.3.1 Valuation Models8 The chosen valuation model is important in that it outlines the further course of the thesis by highlighting
what factors to focus on in the strategic and financial analysis and what ratios to specify when budgeting.
Common to all valuation models is that they are based on the same budget and from a theoretical point of
view, should give the same result, but in reality they often produce different results. Distinction is made
between two types of valuation models: the direct models, where the equity is valuated and the indirect
models, which instead focus on valuating the company.
The direct models can be applied in three different ways, and common to all of them is that they calculate
the value of the company's equity and are discounted by the cost of equity. For listed companies the value
is based on the purchases and sales of shares in the market. The equity value of the company is therefore
determined at market value based on the cumulative market prices of all the company’s shares.
The three different models used are;
1. The dividend model: where the cash flow paid to shareholders in the form of dividends is
discounted.
2. The cash flow model (equity value): where the maximum possible payout dividend to owners is
calculated. This ratio is calculated using cash flows from operating activities minus cash flows from
investing activities and net cash flows to lenders.
3. Residual income model: this model is based on the book value of equity and the company’s total
income minus the cost of equity discounted. The model thus incorporates the opportunity cost of
capital, such that surplus arises only if the net income is above the required rate of return, which is
based on alternative investing options with the same risk.
Unlike the direct models, the indirect models measure the value of the company operations independent of
how the company is financed. Creditors are therefore both lenders and shareholders and the discount
factor is the weighted average cost of capital for financial obligations and the equity. The weight of financial
obligations and equity, respectively, is determined by the long-term capital structure of the company.
Distinction is made between two different models;
1. The cash flow model (company value): where the free cash flow is discounted in the same way as in
the direct method, but before deduction of net cash flows to lenders.
8 This section builds on Elling & Sørensen, 2005, p 32 - 49

10
2. The residual income model: where the residual income is defined as the company’s operating profit
from total income with deduction for the cost of capital of net assets.
Of the mentioned models, the indirect models are the ones most widely used, because they focus on
operating activities as a value driver and thus ignores financing activities. Value that comes as a result of
financial transactions is therefore disregarded.
I have chosen to focus mainly on the indirect model in the form of the DCF model (FCF-model). This model
is the one most often used in practice9, which is partly due to the view that this model is independent of
applied accounting policies since the financial statement are reformulated10. As opposed to the dividend
model, the information necessary for the DCF-model is not immediately available and the application of
this model therefore requires a thorough knowledge of the company. Thus, my motivation for choosing this
model is that the DCF model's adopts an information perspective on the annual report which requires the
external analyst to acquire an in depth knowledge of company operations and only use the annual reports
as raw data. Following this model, the valuation is based on value creation from operating activities and not
the financing activities. The FCF is therefore calculated on the basis of cash flows from operating activities
minus cash flows put into investing activities (to ensure the company’s continued operation and possible
growth). Since the free cash flow is defined as the cash flow that is to be shared between lenders and
owners, the free cash flow has to be discounted at a required rate of return that reflects both the lenders
and owners expected return.
The formula for the discounted FCF model is:
����� �� ��� �� ���
�
���� ���� � ��� � �� � � �� ��� � ������
In principle, the budgeting continues indefinitely (going concern), and it is therefore necessary to fix a
terminal period where the expected growth of the company reaches a steady state going forward. The
budget period should therefore continue until the time where the analyst can no longer prepare a better
forecast than assuming, that all the items in the budget follow a constant growth rate, g12.
9 Problemer ved bestemmelse af terminalværdi – og anden kritik af DCF-modellen. Rune Møller, 2006. p. 4 10 Værdiansættelse – Et overblik over modeller til værdiansættelse. Petersen & Plenborg 2003, p. 27 11 The present value of the terminal period is calculated by discounting the cash flow in the first year after the budget period (year 6) by 5 years. The reason why the discount factor is five (and not 6) years is, that the calculation of a perpetuity in itself causes, that the cash flow is discounted by one period. 12 Elling & Sørensen, 2005, p 35

11
1.3.2 Criticism of Applied Model The available models for determining the terminal value are often based on crude assumptions about
future cash flows and are sensitive to even small changes in underlying assumptions. When applying the
DCF model, the terminal value is often the most dominant component and on average, 60-70% of company
value is derived from this terminal period13. Since the future is associated with great uncertainty, it would
ideally be best if the budget period continued for so many years that the terminal period would be of little
significance. But for the sake of time and because of the increasing uncertainty of the future, the length of
the budget period has to be limited.
Most available formulas for valuing the terminal period allow companies to generate an above normal
return forever. However, theoretically the company should not be able to maintain an above normal return
over the long term due to competition from other providers, who will push the return down over time
towards the average for other companies' return on invested capital. This is supported by findings that
show that, for a selected sample, the abnormal return converges toward zero after approximately five
years14.
The terminal value is based on Gordon's growth formula which assumes that the company can continue to
generate a positive cash flow that continues to grow at a constant rate. Here it is important that this
growth rate is not greater than the economy's long-term nominal growth rate, as the company in that case
would be the "whole economy".
If the theoretical assumptions are met, valuation using the Residual Income (RI) model will always be
equivalent to that of the dividend model or DCF model. But, this is based on the conjecture that one is
somehow able to forecast dividends and cash flow for long (infinite) budget horizons, or in some way find
the correct growth rate for each of the models15. If this is the case, the RI model and the DCF model will
give the same results, but the RI model gives somewhat different information about the company's
development than the DCF model. The main feature of the RI model is that it can illustrate if a company
creates or destroys value in a given period. On the other hand, the model provides no information on the
company's liquidity situation16. The key argument, put forward for the use of the RI model is that it is based
on the measurement of the value of assets and liabilities on the balance sheet (and subject to audit
procedures), which is assumed to have a higher degree of reliability, compared to solely relaying on the
valuation by market participants. In addition, the interim financial statements help by advancing
recognition of the value and reducing the mismatching, and by making it possible for management to
13 Problemer ved bestemmelse af terminalværdi – og anden kritik af DCF-modellen. Rune Møller, 2006. p. 1 14 Ibid. 15 Værdiansættelse i teori og praksis – håndtering af vækst. Ole Sørensen 2008. p. 3 16 Ibid., p. 4

12
reflect inside information and capitalize on the opportunity that competencies to value the company's
assets and liabilities may be better inside the company than among market participants17.
In any case a valuation is a subjective discipline and largely based on estimates and assumptions about the
company's future earnings. It is therefore advised to always use more than one method. Detailed budgeting
will therefore not secure that the uncertainty about the company's future development will be less, but
simply that the user has a greater insight into the factors, which have an impact. This is also the reason why
the DCF model in this thesis is attempted supplemented with multiple-(P/E)18 and sensitivity analysis.
1.3.3 Reliability and Validity of the Data The primary sources used for the analysis are Harboe’s annual reports, Harboe.dk, Bryggeriforeningen.dk,
and brewersofeurope.org – all publicly available. The theory and tools used for working with the acquired
information draw on national and international literature written by leading researchers within the field of
corporate finance and valuation19. The thesis is primarily founded on processed quantitative secondary20
data and the data base is therefore grounded primarily on published and publicly accessible accounts,
statistics, stock announcements, newspaper articles, academic texts and other media publications.
The consolidated financial statements used for analyzing have been prepared in accordance with
International Financial Reporting Standards as adopted by the EU and additional Danish disclosure
requirements for listed companies21. This means that management responsibilities include the preparation
and presentation of consolidated financial statements, which give a true and fair view of company records.
However, in preparing the annual report, management can make a number of assessments and has some
degree of freedom with respect to the treatment of certain items. Consequently, management has some
possibility of influencing the stated accounts. The auditing company Deloitte has been responsible for
reviewing the financial statements and has not found reason for reservations. The conclusion here is that
the financial statements give a true picture of the company’s assets, liabilities and financial position.
Moreover, no grounds for remarks regarding the management report22 were found.
The information that is applied is approached with a critical sense and the data is sought verified, but still it
is important to be aware that applied statistics or accounts may be advocated or incomplete.
17 Ibid., p. 5 18 A description of the multiple analysis approach is found under the section where the multiple analysis is carried out 19 See bibliography 20 Ib Andersen, 3. udgave 2005: p. 151 21 Harboe annual report 2010/11, p. 30 22 Ibid., p. 30

13
1.4 Delimitations The gathering of information is limited to publicly available information and because of this, I am aware
that some of the analysis can be limited by lack of inside data and that the content of the thesis, in some
parts, is based on a subjective assessment of what to include.
The annual report for Harboe published on the 28.06.2011, constitutes the essential part of the information
base for the strategic analysis and includes the most recent financial statements that are reformulated. The
cut-off date for the valuation is therefore this date and any information published thereafter is not included
in the analysis.
The strategic analysis will mainly focus on the beer segment and on Harboe’s main markets around
Østersøen23. This limitation is made in order to facilitate a more in depth exploration of the product and
markets that represent the dominating part of Harboe’s business. Besides, the markets for beer and soft
drinks will not be explicitly separated since they have many of the same characteristics. The food
component (Harboe Farm A/S) is in liquidation24, and is therefore be removed from accounts so that it does
not have influence on the strategic analysis or the accounting figures of the company’s core activity. To
estimate if the food component of the company still has any value, this part of the business is valuated
separately using multiple analysis.
Regarding the competitor analysis, only the most significant competitors are included. The peer group on
the Danish market is assessed to be Carlsberg and Royal Unibrew and outside competitors include
Heineken, SABMiller and Anheuser-Busch InBev.
The thesis will include a time line of five years before the cut-off date and use a forecaster of five years for
the budgeting. In connection with the external analysis and valuation, the time line can in some places be
extended.
Given the chosen valuation model the focus will be on uncovering the factors that affect sales, profit
margin, and the asset turnover rate, since these ratios form the basis of the budget.
Harboe were contacted with the purpose of gaining access to more data, but this attempt was without
success. Information relating to the strategic analysis as well as information in the financial statements is
therefore only evaluated on a subjective basis.
23 Harboe annual report 2010/11, p. 16 24 Harboe annual report 2010/11, page 5

14
2.0 Presentation of Harboe and its Markets Below the following will be presented: the company’s history and organization, company ownership
structure and corporate governance, Harboe’s primary markets and its strategy, and the competencies and
product portfolio of the company. The purpose is to identify the most important tangible, intangible and
human resources of relevance to the value driver analysis
2.1 History and Organization Harboe Brewery was founded by three businessmen residing in Skælskør: distillery and ship owner George
Harboe, timber merchant Adolph Harboe and merchant Joergen Lotz. The brewery's first name was Harboe
& Lotz. The first master brewer at Harboe Brewery was Gunner Harboe, who was the son of one of the
founders, and he was sent to Germany to learn how to brew beer. The first beer he brewed was sold on 2nd
of august 1883 and the beer was packed in wooden barrels and was run out by horse and wagon. In 1890
the company began to produce using bottles. It was a slow process, where bottles had to be purified by
hand using a bottle brush, and the bottles were then put on their heads to dry. The maximum number of
bottles that could be filled at once was seven bottles at a small bottling plant. Pasteurization was done by
sealing the bottles and putting them into wire baskets, dipping them in a tub with warm water. After
cooling and drying, the labels were glued on by hand and the beer bottles placed in boxes.
Gunnar Harboe later became owner of the brewery, which was named “Sydvestsjællands Bryggeri” in
189025. In 1910 he transferred the company to his son Frederick Harboe (1880-1966) who undertook
extensive investments in modern technology. Among other things, modern refrigeration systems for
replacement of natural ice were introduced and aluminum tanks replaced open vats for brewing.
In 1946 Gunner Harboe (son of Frederick Harboe) became part owner of the company and in 1949
company changed its name to Harboe Brewery. In 1957, Gunnar Harboe became director, and his father
Frederick Harboe became chairman of the board. In April the same year the brewery was converted into a
limited company with the Harboe family as the sole shareholder.
In 1973 Bernd Griese was hired as a technical assistant at Harboe Brewery. Bernd Griese, who was
educated in electrical engineering, was married to daughter of Gunnar Harboe, Kirsten Gunnersen Harboe
in 1971. Bernd Griese was appointed Managing Director in 1984. In 1989, Harboe Brewery listed on the
stock exchange.
Today the company still has its headquarters in Skælskør and is the third biggest brewerie in Denmark. In
2008 the company was appointed as Purveyor to the Royal Danish Court26. The brewery is best known for
its discount beer, but it also produces soft drinks, mineral water, and juices - all with retail trade as the
25 http://www.harboes.dk/en/About 26 http://www.harboes.dk/en/About

15
primary market segment locally and internationally. The listed Harboe Brewery A / S is the parent of
Harboe Group which includes three breweries; the domestic (Danish) Skælskør Bryghus A/S (including
GourmetBryggeriet A/S) and two foreign breweries, i.e. Darguner Brauerei in Germany and Viru Õlu in
Estonia. Moreover, the parent company has almost 100% interest in three sales subsidiaries. These are
Harboe Norway A/S, Harboe Sweden AB, and Harboe Poland Sp. Z.O.O. 27. In appendix 2 an overview of the
corporate structure can be found.
The breweries in Denmark, Germany and Estonia are all major producers in their area and Harboe Brewery
is experiencing continued growth because of a broad and attractive product portfolio of beer and soft
drinks. In recent years there has been made significant investments, particularly in soft drink production,
which has meant a significant expansion in capacity, ensuring that the company can meet the expected
growing demand.
Last accounting year the brewing activity amounted to 87.5% of total revenue and the food company
accounted for the remaining 12.5% of revenue. However, because the food business is subject to intense
competition and strong price pressures the company has only ever produced a marginal profit. For that
reason the decision to liquidate this part of the business was taken recenrly, and Harboe now focuses solely
on the main activity of producing and selling beer, soft drinks, malt beverages and extract28.
2.2 Ownership Structure The Company has two share classes, A- and B shares, with each A-share carrying 10 votes and each B-share
carrying one vote. This dual class share structure means that Kirsten and Bernhard Griese with a
shareholding of 13.1% have the controlling stake of votes of 52.1%. Other large block holders are
“Lønmodtagernes Dyrtidsfond” with a shareholding of 20% and 10.2% of the votes, and J.P. Morgan Chase
Bank with a shareholding of 6.13% and 3.1% of the votes. At the end of the financial year 2010/11 Harboe
had 5,256 listed shareholders, which together represented 91.3% of the total share capital.
The share capital amounts to DKK 60,000,000, corresponding to 6,000,000 shares of DKK 10. The shares are
distributed as 640,000 A-shares and 5,360,000 B-shares, but it is only the company's B shares that are
quoted on NASDAQ OMX Copenhagen (Small Cap segment)29.
The disproportional ownership caused by dual class shares can have a negative impact on company value. A
family controlled company might induce a static strategy and scare away potential investors who have no
27 http://www.harboe.com/da/About 28 Harboe annual report 2010/11, page 30 29 Ibid., p. 39-40

16
chance of influencing the composition of the board of directors or the company strategy. Thus, the
company’s strategy of maintaining a high economic contingency that allows for investment in the
continued organic growth and value creation of the firm, could suffer from lack of investors. However,
Harboe has cash resources primarily in the form of bonds and repurchased own shares which can be
liquidated if the company needs cash30. Besides, a controlling block holder also motivates active
monitoring of management and involvement of the board in company activities and this can mitigate
potential principal-agent problems.
2.3 Corporate Governance Harboe is a listed company and therefore has to comply with several corporate governance regulations.
The stock exchange in Denmark “NASDAQ OMX Copenhagen A/S” has formed both a set of corporate
governance rules and recommendations for good practice. The recommendations are on a “comply or
explain” basis and Harboe complies with most of them31. Places where Harboe deviates from “best
practice” are listed and explained in the financial report according to recommendations.
The company has a two-tier board of directors which is composed of professional competencies within
strategic management, product development and sales, and balanced in relation to experience, age and
gender. More than half the board is independent and there can be up to three employee representatives.
The board has not introduced stock-related incentive programs, but key leaders are included in a result
oriented bonus program. Moreover, the company offers a range of perks and all employees are covered by
a company pension scheme. Notable deviations from guiding recommendations appear since Harboe has
no nomination or remuneration committees. Additionally, the period for which the board members are
elected is set to be four years, instead of the recommended one year. In the financial report it is explained
that a nomination and remuneration committee is under consideration and that the elective period of four
years is to secure the continuity of the business.
According to the annual report the company goal is to create value for its shareholders, employees and
customers, and as mentioned there can be up to three employee representatives on the board of directors.
The company’s relationship with stakeholders is not only governed by contracts but also based on dialog,
respect and professionalism. Given its long history the company is strongly rooted in the community and
engaged in local activities32.
30 Ibid., p. 12 31 See: Harboe annual report 2010/11, page 35 for specification of exceptions 32 Ibid., p. 27

17
The company seems to adopt a stakeholder value approach to operations. This is probably due to Harboe’s
limited size in terms of negotiating power over suppliers and customers and because the company's
primary market segments are under such intense competition. Harboe’s continued operation is therefore
very dependent on its relation to its stakeholders.
2.4 Markets Beer production has been decreasing since 2008 and consumption of beer in the European Union
decreased from 374 million hectoliters in 2008 to 343 million hectoliters in 2010. Since 2008 beer sales in
the hospitality sector (bars, restaurants, events, etc.) declined by 15% and in off-trade (retail outlets) sales
fell by 4%. The decrease in consumption has been high in countries like Poland, Germany, and Denmark
which has displayed a decrease of close to and more than 10% compared to 200833.
Nevertheless, the EU remains one of the major beer producing territories in the world with a total of 3,638
breweries and a production of 383 million hectoliters of beer in 201034, only surpassed by China in millions
of hectoliters produced. European beer brands are sold worldwide. These are either brewed in Europe and
exported, or produced abroad mainly by subsidiaries of larger European brewing companies or under
license by other brewers in those countries. A significant number of independent small- and medium sized
brewing companies and microbreweries contribute to a wide variety of beer brands available to consumers
worldwide. Despite the decrease in production, the total number of breweries has increased since 2008
due to the increasing number of microbreweries. In the European Union, Germany has the largest number
of breweries followed by United Kingdom, Italy, Austria, the Czech Republic, Belgium, Denmark and Poland
ranging from 1,325 to 103 breweries in 201035. Contrary to the beer market, the market for soft drinks
generally continues to grow due to continued product innovation within this segment36.
Harboe's core business is manufacturing and marketing of beer and soft drinks in selected key markets in
northern Europe, including Denmark, Norway, Sweden, the Baltics and Germany. The company's strategy is
to maintain a high volume of its core products and to ensure its well established position in the existing
main markets for these products. Harboe aims at developing these markets by providing customers with
high quality, flexibility and security of supply as well as an attractive and contemporary product range.
Harboe’s core products are directed at the discount and private label segment37 and sold to the retail
sector where products are marketed at discount prices. Competition is fierce and Harboe’s products and
33 http://www.brewersofeurope.org/docs/flipping_books/contribution_report_2011/index.html#/16 34 http://www.brewersofeurope.org/docs/flipping_books/contribution_report_2011/index.html#/12 35 http://www.brewersofeurope.org/docs/flipping_books/contribution_report_2011/index.html#/12 36 Bryggeriforeningen.dk: ”tal fra bryggeriforeningen øl 2009”, page 13 and Harboe annual report 2010/11, page 19 37 Private Label: Products marketed under individual brands tailored to the specific supermarket chain

18
private label sales are continually challenged by branded products sold at campaign price38. As a
supplement to the private label segment, Harboe is marketing a number of specialty products from
Skælskør Bryghus and GourmetBryggeriet39. Harboe’s Danish brewery primarily produces for the Danish
and the Nordic markets, the German brewery produces for the German market, and the Estonian produce
for the Baltic countries and Poland. These trades are supplemented by small but increasing exports to other
parts of Europe, the Middle East, Africa, the United States, and Asia40.
Figure 2.1: The distribution of Harboe’s revenue according to the different markets. Source: Harboe annual report
2010/2011, page 18
Below, the different market segments are described according to the classification of the figure 2.1. This
means that Denmark is classified as one separate market, Germany as the other separate market, and
Sweden, Norway, Poland, the Baltic countries and other exports as the primary components of the third
market.
2.4.1 Structure, Trends and Developments in the Danish Market The total volume of beer bought in Denmark is declining, following the general trend in Western Europe.
Figure 2.2: Danish beer market sales 2000 – 2010 in mill. l. Source: Tal fra Bryggeriforeningen øl2011, p. 10
38 Harboe annual report 2010/11, p 19 39 Ibid. 40 Ibid., p 29
Denmark42%
Germany35%
Other23%
Revanues 2010/11

19
Figure 2.2 shows that total domestic sales, including border trade (the light green part) and illegal trade
(the white part), have been decreasing since 2000. From 645.2 million liters a year in 2000, the volume in
2010 was down to 457 million liters – a decline of 29.2%41.
The Danish market is dominated by pale lager, with more than 95% of total sales, but stout and other dark
beers are increasing in popularity, a trend driven by the market growth of premium-priced beers. The local
microbreweries are strong innovators and produce a wide variety of beer, and the fast expansion of the
micro-brewing sector has given Denmark a large number of breweries compared to its population (120
breweries in 201042). In 2003 sales from micro-breweries and foreign brands amounted to 1.7% of total
sales, and this figure has been increasing since to 7.7% of total sales in 201043. Extracted, the sales figures
for foreign brands have increased from 1.2% in 2003 to 4.1% in 2010. This indicates the fact that Danish
consumer’s preference for domestic beers is shrinking and that foreign brands are capturing a larger share
of the Danish market.
Figure 2.3: Danish soft drink sales 2000 – 2010 in million litres. Source: Tal fra Bryggeriforeningen læskedrikke 2011,
page 6
The development within the market for soft drinks is less clear. Total sales including border trade (the
white part) and illegal trade (the light green part) amounted to 550.8 million liters in 2007, up from 493.6
million liters in 2001, but since then sales have declined to 507.2 million liters in 201044. However, there is
an unambiguously positive development in certain areas. The sale of sugar-free light soft drinks for
example has experienced steady growth since 2000 and has gone from a sales share of 13% to 33% in
201045. Additionally, the sale of water on bottles has grown considerably.
41 http://ipaper.ipapercms.dk/Bryggerigruppen/TalfraBF/TalfraBF2011L/, p. 10 42 Ibid., p. 11 43 Ibid., p. 10 44 http://ipaper.ipapercms.dk/Bryggerigruppen/TalfraBF/TalfraBF2011Lsk/, p. 6 45 Ibid., p. 7

20
Figure 2.4: Consumption of soft drinks and bottled water in Denmark 2000 – 2010 in million litres. Source: Tal fra
Bryggeriforeningen læskedrikke 2011, page 10
The green, dark blue and light blue lines show the development for respectively: sugar-sweetened soft
drinks, sugar-free light soft drinks and bottled water (with and without taste). What seems to be the case is
that the progress in the two segments of light and bottled water comes at the expense of the traditional
sugar-sweetened soft drinks.
Around 77% of total beer consumption in Denmark is beer sold by supermarkets and other retail outlets.
The remaining 23% are sold through the hospitality sector46. Harboe is only selling to the retail sector and
its main customers are Dansk Supermarked, COOP Danmark, and Dagrofa47 who cover most of the market.
2.4.2 Structure, Trends and Developments in the German Market Germany is the number-one beer producing country in Europe, but demographic influence of the ageing
population is having a significant effect48. Older people tend to drink less alcohol and the middle-aged
segment of traditional beer drinkers is diminishing. There is an on-going public discussion on beer and
health, youth drinking and public drinking that seems to be changing the taste preferences among
consumers. Growth rates in beer mainly come from younger and increasingly female consumers and these
young consumer groups gradually turn away from the traditional beer styles, such as Pilsner (which
accounts for 55% of volume sold in Germany). The general trend for the recent years has been declining
consumption with the exception of the FIFA Football World Cup in 2006, where consumption increased. At
the moment around 75% of beer is consumed off-trade while 25% is sold on-trade in bars and restaurants,
and the development towards further off-trade is continuing49. The economic downturn in Germany is one
of the reasons for this change, as people have less money to spend. Furthermore, in 2010 more than 50%
46 http://www.brewersofeurope.org/docs/flipping_books/contribution_report_2011/index.html#/89 47 An umbrella organization with several hundred stores 48 Euromonitor International “Beer in Germany”, February 2008 49 Deutscher Brauer-Bund, 2011

21
of beer from the leading brands has been sold with special offer prices in the retail sector, which has
resulted in a reduction in beer prices50.
Harboe’s sale of soft drinks is increasing and the German market for soft drinks has continued to grow due
to innovation and new products. The focus on new product areas and new trends spurred Harboe’s
investment in a new factory unit for the production of aseptic products like juices, smoothies and milk-
based products51.
Harboe’s main distribution is through the retail sector which in recent years has been characterized by a
significant consolidation. This has increased the bargaining power of Harboe’s customers and the
competitive position of traditional Harboe products is very intensive and price sensitive. Additionally, the
reduced availability of barley has increased the production costs in Germany. However, as established, the
discount segment continues to grow, and it is a major strategic focus of Harboe to maintain its position in
this market.
2.4.3 Structure, Trends and Developments within Other Markets Sweden has one of the highest tax and excise rates for beer in Europe but charges vary according to
percentage of alcohol (three classes). Because of the high taxation level, beer prices in Sweden are fairly
high compared with neighboring countries and Swedish citizens thus import beer from countries such as
Denmark and Estonia. Stronger beers are only available in pubs, restaurants and through Systembolaget,
which is a state-owned retail for alcohol sales, where alcohol can only be bought by those aged 20 and
above. The Swedish market has seen a decline in the sale of beer and soft drinks52. The consumption of
beer in Sweden remained stable until 2008 but since then it has been declining. Beer is mainly consumed at
home and obtained in the off-trade sector, where sales amounted to 81% of total sales in 2010. Current
challenges facing the brewing sector are: an announced increase of tax of 13% on beer in 2012, increased
cross-border trade, changing drinking habits among young target groups, and less beer consumption53.
Due to a high rate of beer taxation in Norway the price of beer is high compared to other countries.
Norwegians are very proud of their local products, so consumer preferences make it difficult for
international beer companies to compete with local products. Beer consumption is also decreasing in
Norway where sales declined from 2.56 million hectoliters in 2008 to 2.43 million hectoliters in 201054. The
50 http://www.brewersofeurope.org/docs/flipping_books/contribution_report_2011/index.html#/113 51 http://www.harboes.dk/da/B2B/Samarbejde 52 Ibid. 53 http://www.brewersofeurope.org/docs/flipping_books/contribution_report_2011/index.html#/231 54 http://www.brewersofeurope.org/docs/flipping_books/contribution_report_2011/index.html#/177

22
beer market is losing market share to wine and alcopops55. The majority of beer consumed is purchased in
the retail sector.
Estonia is one of the few countries in which beer production and consumption has increased from 2008 to
2011. Compared to 2008, total production increased by 12% and consumption by 8%. In 2011 the Estonian
beer market had a high proportion of off-trade sales (91%)56, compared to beer sold on-trade. The
Mainstream and Economy segments boost market share by volume and beer sold under private label (store
chains' own registered products that often are cheaper and less branded) is increasing, thereby forcing the
average price per liter to decrease. The average off-trade price per liter has decreased by 6% from 2008 to
2011. The Estonian brewing sector is highly concentrated, with 95% of total domestic consumption
produced by three breweries. The largest is Saku brewery owned by Carlsberg, followed by a brewery
owned by Finnish independent Olvi and the third largest brewery is Viru Ölu owned Harboe57.
In Poland the majority of beer consumed is purchased in the retail sector where off-trade sales amounted
to 85% in 201058. Overall consumption has decreased, but the market segment for discount beer is growing
in sales volume. Beer prices are the key factor in purchasing decisions, leading to a marked increase of beer
sales in discounted outlets such as Aldi, Lidl, and Netto.
Due to the economic situation, including the decrease in salaries for the past couple of years, Latvians
prefer to drink off-trade because it is cheaper, and the choice of brand is primarily price driven. In Lithuania
imported beer is gaining in popularity and constitutes approximately 10% of total consumption. Around
91% of beer sales is in the off-trade retail sector59. It is expected that stricter legislation concerning
consumption and advertisement of beer soon will be impose.
Overall there is a tendency towards more consumption through the retail sector. In Sweden, Norway, and
Poland consumption is declining while it seems stable or increasing in the Baltic countries. In the Baltic
countries and Poland, price is the most important parameter for purchasing decisions and the proportion of
off-trade relative on-trade is increasing. The markets are characterized by high concentration and the
private label segment is increasing, pushing average price per liter down. Increasing duty tax on alcoholic
beverages and stricter legislation on consumption and advertisement is a threatening development within
the industry.
55 Flavored alcoholic beverages 56 http://www.brewersofeurope.org/docs/flipping_books/contribution_report_2011/index.html#/95 57 http://www.europeanbeerguide.net/estobrew.htm 58 http://www.brewersofeurope.org/docs/flipping_books/contribution_report_2011/index.html#/185 59 Ibid., p. 151

23
2.5 Strategy, Competencies and Product Portfolio Harboe’s overall strategy is cost minimization with most of its products linked to the discount market and
private label segment. Distribution is characterized by high volume supply to business-to-business
customers within retail for sale in existing core markets. Following the generic strategy, the company is
focused on maintaining efficient and flexible production facilities, keeping costs down and using price as
the main competitive parameter. A consequence of this strategy is that marketing efforts generally have
been very limited, and thus the product portfolio of Harboe has a relatively low brand value compared to
its competitors. To illustrate Harboe’s competitive focus, figure 2.5 below compares the cost of production
for Harboe and its biggest competitor Carlsberg.
Figure 2.5: A comparative cost analysis of Harboe and Carlsberg. Source: Harboe Annual Report and Carlsberg
Annual report.
The comparative analysis supports the assumption that Harboe has a lower turnover per unit sold, but a
competitive advantage on low cost production and distribution. For the selected items Harboe’s costs are
significantly lower per unit sold, but this of course is only a superficial analysis, as an in-depth cost analysis
is limited because the company is hiding competition sensitive information.
In 2010/11 Harboe’s three breweries produced a total of 5.94 million hectoliters of beer, soft drinks and
malt extract products, which represented an increase of 4.6% compared to the previous year60. Harboe
continually invests in new production facilities and in improving the efficiency of existing facilities. Harboe's
total capacity by non-stop production constitute 9.8 million hl.61 and the company thus has some excess
capacity. Excess capacity results in higher costs of production per quantity of output, but it also provides
some flexibility in production. The demand for Harboe’s products in retail stores is very seasonal, and the
retail stores are therefore requesting some flexibility in production and delivery from Harboe. A certain
degree of excess capacity helps Harboe meet this request.
Besides, Harboe seeks to optimize the utilization of the Group's production capacity through strategic
60 Harboe annual report 2010/11, p. 22 61 http://www.harboe.com/da
Comparative cost analysis2011 DKK 1000 Harboe Brewery Carlsberg A/S Harboe relativ to CarlsbergNet sales 1,320,653 63,561,000 2.08%Production costs 895,011 31,788,000 2.82%Distribution costs 175,442 18,483,000 0.95%Administration costs 46,631 3,903,000 1.19%
Mill. sold hl. 5.94 162 3.67%
Net sales / mill. sold hl. 222,332 392,352 56.67%Produc. costs / mill. sold hl. 150,675 196,222 76.79%Distribut. costs / mill. sold hl. 29,535 114,093 25.89%Administ. costs / mill. sold hl. 7,850 24,093 32.58%

24
corporation with other beverage manufactures, regarding contract manufacturing and packaging and
product development within segments that do not cannibalize on Harboe's own business62.
Traditionally, the company's business concept has been based on cost minimization, and historically the
company has developed its business through organic growth within existing products and markets.
Increased input prices, intensive competition, and continued consolidation within the company’s core
markets has, however, forced Harboe to search for new sources of earnings. Harboe has during the past
five years invested DKK 678 million in the expansion and reinforcement of production facilities. This was
done in order to improve the competitiveness of the company through higher production volume, and as
part of the ongoing innovation within strategic development areas63. Harboe has developed its own new
product categories, and in 2007/2008 the company bought the custom manufacturer GourmetBryggeriet
A/S in order to penetrate the niche market for specialty beers. Going forward, Harboe expects to realize a
great potential through increased internationalization and innovation within product development64.
Unlike the more established and mature markets of Western economies, export markets in Africa, Asia,
Middle East and South America are characterized by an increasing demand for beer and soft drinks. The
different segments have different characteristics and Harboe seeks to penetrate these markets through a
targeted regional product and distribution strategy. Harboe’s growth strategy abroad is first and foremost
driven by target sales of products within own brands, and is, in some segments, supplemented by private
labels. Within the beer category it is particularly Bear Beer, Darguner, and Harboe that is marketed, while
malt beverages are promoted under Harboe's brands Hypermalt and Cheers. Energy drinks are particularly
promoted under the trademarks X-ray and Hustler. Harboe’s own brands also include a number of sodas, a
ginger drink and other soft-drinks65.
Harboe applies a penetration strategy that combines export through sales subsidiaries and direct
investment by production companies with cooperation and partnership models. Collaborative agreements
include major clients within retail, while the partnership model includes major beverage manufacturers. In
this way Harboe aims at building strong networks, used to set strategic goals for sales, marketing and
systemic follow-up. Harboe seeks to cement its market position by entering into long term contracts with
its customers in order to ensure exclusive access to the distribution network66.
62 Harboe annual report 2010/11, p. 16 63 Ibid., p. 22 64 Ibid., p .19 65 Ibid., p. 20 66 Ibid.
25
Harboe has for a long time produced and sold traditional malt extract as an ingredient for the food
industry. Malt extract has an attractive product profile because it contains natural color, sweet substances,
and nutritional and quality characteristics. The company’s competencies within the field combined with the
potential for greater sales, has motivated Harboe to focus more on investment and innovation within this
product category. Among other things, this effort has led to the development of a clear malt extract, which
can be used within the production of beverages. Compared to the traditional products, the clear malt
extract is attractive because it is further processed, stable and easily soluble in water. This means that it can
be used directly and more efficiently in the production of a variety of beverages, including beverages where
the dark color of traditional extract is not wanted. Harboe has achieved international pre-approval of the
patenting of the product and is now in the process of obtaining local patent approval in each of the
markets. Besides the clear malt extract, Harboe is engaged in further development of new variants in the
area of traditional malt extract and with other new developments such as sweet malt extract67.
For more than 125 years, the organizational foundation of Harboe has been core values regarding
responsibility, cooperation, quality, and results. Management's philosophy is to ensure continued efficient
production and innovation by recruiting motivated and highly qualified staff within all areas of the
company. In order to attract and retain employees, emphasis is on providing competitive salary,
employment benefits, ongoing training and continuous upgrading of staff qualifications. Specific attention
is put on improving the company’s competencies within the development activities of malt extract and
within international oriented activities. Consequently, Harboe Business Academy collaborates with
academics and technicians from universities and food institutions in Denmark and Germany to enhance the
corporate governance of the company. This effort is supplemented with operational team leadership
training, specialized courses and skills development programs, all in order to improve the quality and
efficiency of production. To follow up on this effort there are ongoing employee interviews, in which goals
and results, as well as employee satisfaction, is evaluated. Through this effort Harboe is not only upgrading
the skills of its workforce and improving efficiency, but also achieving a low employee turnover rate and a
relatively low number of employees on sick leave68.To complement the efforts in relation to the company’s
human resources, the company will during the coming year implement an Enterprise Resource Planning
(ERP) system in all its manufacturing units. The system will become essential in monitoring the quality, yield
rates, energy consumption, etc. across the business units. Thus it is expected that ERP will become be the
67 Ibid., p. 22 68 Harboe annual report 2010/11, page 25

26
future main source for improved reporting, optimization of production and implementation of new
concrete targets69.
3.0 Strategic Analysis In relation to the valuation, the strategic analysis seeks to identify the non-financial value drivers that
underlie the applied budget assumptions and furthermore to critically assess the actions that the company
implements when striving to achieve a competitive advantage and create economic value. Thus, the
strategic analysis aims at identifying the non-financial value drivers affected by external environmental
factors at society level, at industry level, as well as internal factors related to resource and competencies
and competition and growth strategies70. This “top-down approach” is applied to assess the strengths and
weaknesses as well as opportunities and threats of the company.
3.1 Analyzing the Environmental Factors at Society Level using the PEST Model The purpose of applying the PEST model is identifying the external factors that affect the company, but
which the company itself has little influence on. Thus, the PEST analysis groups external factors into
political, economic, sociocultural, and technological factors. Below are listed the factors expected to have
the greatest impact on the earnings of Harboe.
3.1.1 Political The brewing industry is subject to national and international laws regulating thing such as the environment,
competition and advertisement. Besides, society's general perception of the consumption of beer and soft
drinks in relation to public health can have a great impact on sales.
Products of the brewing industry often get negative publicity in the media as beer and soft drinks are
mentioned in relation to issues like drunken driving, violence and obesity. A populist, but politically strong,
message is to announce the will to improve these issues by changing the age limit for buying alcohol, by
tightening the issuance alcohol licenses and/or by making it more expensive to purchase unhealthy goods.
As can be seen from Harboe’s statement of financial highlights, beer and water charges can be significant
and amounted to 14.5% of gross revenue in 2010/1171, which is a fee level that has been more or less
conatnt for the past five years.
The tax on a beer depends on the percentage of alcohol it contains. This means that the charge increases
with increasing alcohol content on a sliding scale. Besides the tax on alcohol the product is also imposed a
packaging fee, and finally the product is charged with a VAT when sold.
69 Ibid. 70 Elling og Sørensen 2005: 69 71 Harboe annual report 2010/11, p 8

27
Figure 3.1: VAT and beer excise share of retail prices in the Nordic countries and Germany 2009. Source: Tal fra
Bryggeriforeningen øl 2011, page 13
From figure 3.1 it is clear that beer excise and VAT accounts for a large part of the price the consumer pays
for his beer72. Within the European Union, in 15 Member States, the excise duty rate on beer has increased
in the period between 2008 and July 2011. Only in Ireland the duty rate decreased73.
European countries differ in their levels of taxation, so a change in European policy will affect some
countries more than others. If the European Commission decided to raise their minimum excise rate on
beer, breweries, for example in Germany, would face higher excise rates. On the other hand Nordic
countries for example already face higher excise rates than those laid down by the European Commission.
Consequently, changes in tax policy can have serious consequences for the brewing sector74. Furthermore,
there are large differences in taxation between different kinds of alcoholic beverages. For example, beer is
much stronger taxed than wine and since demand for beer is price elastic this encourages consumers to
substitute beer with wine. The potential excise revenues and the prospect of regulating “bad” consumer
behavior through increased taxes, seems also to have inspired the latest Danish governments, which have
increased tax on beer and soft drinks written into its government declaration75.This increased cost of
production affects the whole industry, but Harboe’s advantage is that its primary market is the retail sector.
In the retail sector the passing on is lower compared to the hospitality sector, which means that the same
percentage increase in price leads to a greater fall in consumption within the hospitality sector than the
retail sector76.Another law concerning health that has had a secondary effect on beer consumption in some
of Harboe’s markets is the smoking ban law which has led to a significant drop in sales of beer in on-trade77.
However, because Harboe is almost exclusively distributing its products to the retail sector, this change
might even have a positive effect on the company’s sales, because consumers substitute from on-trade to
off-trade.
Despite the economic crisis, the political and economic agenda is to continue to strengthen the internal
market by removing restrictions on free trade. The globalization and liberalization of national markets could
72 Charges are also high for soft drinks: Tal fra Bryggeriforeningen læskedrikke 2011, p. 12 73 http://www.brewersofeurope.org/docs/flipping_books/contribution_report_2011/index.html#/23 74 Increasing the Excise Duty on Beer. Penny Wise, Pound Foolish’, Ernst & Young and Regioplan, Amsterdam (2008) 75 http://ipaper.ipapercms.dk/Bryggerigruppen/NytfraBF/NytfraBFoktober2011/ 76 http://www.brewersofeurope.org/docs/flipping_books/contribution_report_2011/index.html#/24 77 http://www.brewersofeurope.org/docs/flipping_books/contribution_report_2011/index.html#/15

28
therefore be expected to lead to further consolidation and increased competition within the industry. Due
to Harboe’s low profit margin, increased competition and increasing cost of taxes can be devastating to
revenues. To avoid the increasing price pressure from competition and the dilution of profit margins by
rising costs, Harboe is increasing its focus on product innovation and brand positioning.
3.1.2 Economical Harboe is exposed to local and global economic cycles, which can influence the demand for its products and
the financial risk of the business. Low growth, rising unemployment and small wage increases are some of
the economic effects of the housing and financial crisis and the resulting recession. Financial strains in the
European zone have eased since the beginning of the year following the injection of nearly half a trillion
euros into regional lenders by the European Central Bank (ECB). The ECB's loans have relieved funding
pressures for banks and lowered sovereign bond yields, with less chance of a financial market shock. The
ECB’s action, along with better economic data from Germany and the US economy shows encouraging signs
of improvement, but still, weak income growth and expected rise in oil prices remain among the
discouraging factors. States' debt problems and the large uncertainty regarding the gravity of the crisis
means that the prospect of an economic recovery may still be distant78.
Decline in disposable income as a result of the global economic crisis can be expected, especially for lower
income groups, to have some correlation with lower demand. Luckily for the brewing industry, beer and
soda are short-lived consumer goods and are therefore not affected as much by the economic crisis as
other consumer durables. Yet, consumers are becoming more price-conscious, emphasizing the more
tangible advantages of the product instead of image and “nice to have” attributes79. Thus, of the four P’s in
the marketing mix – product, price, promotion and place80, price benefits take on greater importance for
the customer. Being a low cost producer, Harboe can try to take advantage of this development by
committing to its core strategy.
Because of unfavorable weather conditions in the previous years the production volume of barley has not
been sufficient to meet the demand of the brewing industry. Additionally, increasing consumer power of
developing countries and the advance of bio-fuel81 has amplified the shortages on the global market.
Disappointing barley production volumes82 combined with increasing demand thus resulted in higher hops
prices. Besides the increase in hops prices, breweries in Eastern and Central European countries have been
78 http://gfs.eiu.com/Article.aspx?articleType=gef&articleId=1508814335 79 http://www.wbiconpro.com/06-Priya.pdf, p. 2 80 Søndersted-Olsen, 2007: p. 66 81 http://www.brewersofeurope.org/docs/flipping_books/contribution_report_2011/index.html#/47 82 Barth-Haas group, The Barth Report (2007/2008)

29
faced with significant increases in labour costs. On average gross earnings increased in 13 of the monitored
Eastern and Central European countries, by 8 to 24% per year83. Increased income means higher
consumption power, but also increased the cost of production which in most cases has led to an increase in
beer prices. Because of the small profit margin on beer, the increased input prices have to be pushed on to
consumers84 and higher price affect the demand for beer and could subsequently lead to lower
consumption.
According to Harboe’s annual report85, the company is also experiencing increased prices on important
inputs for production. Because of the intensive competition in the industry the company is not able to
transfer the increased prices to consumers, and due to the relatively small size of the company there is
little chance of negotiating better input prices from its suppliers86. The low profit margin of the company
and the increased cost of production can have a big impact on the profitability of the business. So, in order
to reduce this risk the company tries to negotiate long term contracts with subcontractors87. To further
limit the inherent risk Harboe could consider hedging via futures contracts.
Another risk is the exchange rate risk. This seems, however, to be a minor risk to Harboe since the main
markets that the company operates within trades in Euros, which the Danish currency is linked to88.
3.1.3 Sociocultural Changes in consumption habits, lifestyle, fashion, etc. are important factors for the company and consumer
behavior and socio-cultural trends are influenced by media coverage and publicity. As mentioned in the
section about markets, especially Germany, which is Harboe’s second biggest market, is experiencing a
demographic change due to an ageing population. This means that the middle-aged segment of traditional
beer drinkers is diminishing and consumption is therefore declining. Also, in the last decade, there has been
an increasing interest in a healthier lifestyle in Western Economies, a development that has been
supported by rising incomes and better education.
Beverages are often enjoyed in a social context and the desire of image has helped stimulate a more
differentiated demand where consumers wish to identify with the product and its characteristics. This
development has forced many industries to rethink their focus, and branding has become a very central
part of the business model. For the brewing industry this meant, that for a period the cheaper beverages
83 Database Central Europe, Rapid increase in labour costs in Central and Eastern Europe in 2008, 19 January 2009 84 Cortissoz, A., With fewer hops, prices jump, The Boston Globe, 9 January 2008 85 Harboe annual report 2010/11, page 15 86 Commodity prices are set on the world market for spot and futures 87 Harboe annual report 2010/11, page 36 88 Ibid., p. 37

30
were substituted with the better branded expensive products89. However, since the financial crisis with
increasing unemployment and lower wages, there has been a movement towards lower priced substitutes,
so the development is not unilateral90.
From having constituted 13% of the market in 2000, the proportion of diet soda increased up through the
latest decade to 33% in 2010. Increasing focus on particularly children's sugar intake has sparked
innovation and product development for producers, who now offer consumers a wealth of alternatives in
the form of light and zero products, sugar-reduced drinks and water with and without flavor91.
On long-term the shift in focus is considered important for Harboe’s future growth opportunities. The
strategic focus of Harboe should not only to compete by producing efficiently at low unit costs and selling
products at a low price, but also to attempt to develop a product portfolio of stronger brands. This must be
achieved in order for the company to move away from segments with low profit margins and differentiate
its products better in relation to competitors.
3.1.4 Technology The polluter pay principle92 dictates that the contaminating company must pay accordingly. Companies are
now responsible for developing a strategy that also takes into account environmental consequences of its
business. Companies the size of Harboe must follow the Financial Statements Act § 99a, which states that
the company must voluntarily integrate areas into their business strategy such as human rights, social
conditions, environmental and climatic conditions as well as fighting corruption.
Harboe is aware of its corporate social responsibility (CSR) which is reflected in the management report
within the annual report93. Here four areas are mentioned: climate and environment, employees and work
environment, quality and health, and relations to the outside world. Through investments in modern,
efficient and flexible production facilities the company’s goal is to minimize resources used in production
relative to production volume and thus, reduce the environmental impact of its business operations. All
company units are certified according to international quality and environmental standards and the
company is expecting to fully implement the Enterprise Resource Planning (ERP) system this year. The
purpose of the ERP system is to monitor the quality, utilization rates, energy consumption, etc. in order to
further optimize the production. Besides, the ambition is to have all units of the company work-
89 http://borsen.dk/nyheder/sundhed/artikel/1/115151/billige_bajere_taber_til_dyre_draaber.html 90http://borsen.dk/nyheder/privatoekonomi/artikel/1/163536/bryggerier_maerker_jagten_paa_en_billig_brandert.html 91 http://ipaper.ipapercms.dk/Bryggerigruppen/Foreningen/NytfraBryggeriforeningen/NytfraBFjuli2011/ 92 Elling og Sørensen 2005: 72 93 Harboe annual report 2010/11, page 25

31
environment certified. Thus, the central elements in the company’s strategy of sustainable growth are
based on efficient use of company resources to optimize value creation.
As a result of continuous investments, the company's production facilities are maintained and
technologically up to date. Product innovation and branding has, however, not been prioritized up until
2007/08, which means that this area is underdeveloped compared to the company’s competitors. Yet, as
shown in the management report, this is something the company is aware of, and thus, it has become one
of its main strategic development areas.
3.1.5 Summarizing the PEST-Analysis Overall, the main developments on the market level were found to be: decreasing beer consumption,
changing patterns of beer consumption, higher prices of agricultural products, increasing labor costs and an
increasing tax burden.
Consumption of beer per capita is decreasing. The decrease in consumption is a Europe-wide phenomenon
and for some regions it started several years ago. The decline is most well-established and steepest in
Western Europe94.
One of the main trends is that consumers drink more beer at home rather than in the hospitality sector.
The change is due not only to the economic situation and the lower prices of the retail sector, but also to
interventions by authorities. For example, the smoking bans on bars have had a significant impact in on-
trade consumption within recent years95. The switch to off-trade consumption has further been increased
because of a downward pressure on average price of branded beers and because of private labeling96.
However, innovation and changing consumer preferences have led to growth of new products within RTD-
and the soft drink segment, which has been welcomed by consumers.
The higher prices of agricultural material, needed for beer production, are mainly due to the fact that
worldwide production of hops and malting has decreased as a result of poor harvests. But, these higher
prices are also a result of growing worldwide demand of agricultural land for the production of crops for
bio-fuel and for consumption. Besides, high and increased wages have made it even more expensive to
produce. The increased prices of agricultural and labor inputs are reflected in the final price of the product
and thus have an effect on consumption.
Regulation, government duties and VAT poses some challenges. In recent years the tax burden on beer has
grown, largely due to changes in excise and VAT rates in many countries. This effort is driven by an attempt
94 http://www.brewersofeurope.org/docs/flipping_books/contribution_report_2011/index.html#/46 95 http://www.brewersofeurope.org/docs/flipping_books/contribution_report_2011/index.html#/47 96 http://www.brewersofeurope.org/docs/flipping_books/contribution_report_2011/index.html#/47

32
to raise revenues to help meet large government deficits. Such fiscal constraints are expected to continue
going forward, because of the economic conditions affecting public finances.
The increased focus on CSR enhances some cost items, but also leads to more streamlined production
facilities that use fewer resources in production.
3.2 Analyzing the Environment Factors at Industry Level using Porters Five Forces In addition to the outside factors affecting Harboe, the company’s capability of creating value also depends
on industry specific characteristics. According to Porter’s Five Forces there are five market forces that
determine the potential of the company to create value within an industry. These are: the rivalry between
existing competitors, the threat of new intruders, the threat of substituting products, and the bargaining
power of suppliers and customers. The weaker the effects of these five forces, the easier it is for the
company to create abnormal return97.
3.2.1 Barriers to Entry Because of significant economies of scale in everything from purchasing to production and administration
and marketing the industry has undergone significant consolidation in Denmark and internationally, and is
now characterized by oligopolistic competition with a few large breweries and many microbreweries98.
Microbreweries produce for the super-premium segment where the price and margins are higher and
volume is of less importance. To follow such a niche strategy does not require too much capital and
marketing effort.
Establishment amongst the large manufacturers, however, requires large sunk investments in tangible and
intangible assets to achieve the volume needed to obtain cost synergies and the awareness of the
consumers. The distribution network (i.e. customers) has become concentrated in fewer, but much larger,
stores and most major stores participate in chain collaborations. These stores are looking to maintain a
high turnover rate for all goods, which means that they only sell fast moving products. Many chains are
therefore looking to limit the number of brands in different product groups, making it difficult for smaller
or new products to come inside the store99. Additionally, the industry is characterized by long-term
contracts between existing breweries and retail trade, and this also limits the access to the necessary
distribution network for new entrants. At industry level, these barriers help reduce the threat from new
entrants to mainly small local niche breweries. But on the market level, economies of scale in production,
procurement, marketing, sales and distribution motivate entry from the global brewing companies and this
poses a threat.
97 Elling & Sørensen 2005: 73 98 See the section 2.0 on “Markets” 99 http://www.scribd.com/doc/18709189/Environmental-Scan-The-Global-Beer-Industry

33
The “few” large incumbent international competitors are sophisticated and financially strong breweries
that are able to engage in tough marketing and price competition. Capyuring market shares from these
breweries can therefore prove very difficult. For example in Denmark and Norway consumers have a very
strong preference for domestic beer and this constitutes a barrier to entry for new brewers who want to
establish themselves on the Danish market, since there are large marketing costs associated with changing
consumer preferences100. In the lower price segment of the industry, where margins are low and the cost
structure is an essential parameter for competition, it is also expected that entrance will prove difficult.
3.2.2 Suppliers' Bargaining Power Harboe primarily uses standardized commodities for production such as water, hops, yeast and barley malt,
and materials for packaging such as glass, aluminum and plastic.
Agricultural products and elements used for packaging are traded on the global market and priced
according to supply and demand. A single company, therefore, has no influence on the spot price of these
commodities and both parties (suppliers and breweries) are bound by these market conditions. As
discussed in the earlier section about markets, the brewing industry has experienced a rise in prices due to
falling production and rising demand and this can only be hedged through futures contracts at a cost.
Harboe is just a small player in the global industry and is therefore expected to have little to no negotiation
power regarding prices from suppliers. But, looking at the balance sheet of Harboe, the item “suppliers of
goods and services” under operating liabilities seems to stay at a steady level. This indicates that Harboe is
still capable of negotiating some operating liability leverage (i.e. leaning on trade).
3.2.3 Customer Bargaining Power Today, it is to a far degree the supermarket chains that have the power. Producers do not have direct
access to customers and are subordinated to the demands of convenience stores regarding delivery, quality
and price.
Harboe’s distribution is B2B, and the company only sells its products in the off-trade sector, which is
characterized by increasing market concentration and relatively few large national chains101. The major
supermarket chains demand large purchasing volumes and therefore have considerable bargaining power
regarding price and payment terms. Besides, the introduction of private labels has benefitted these
customers because by using private labels they can replace a producer relatively costless, since the actual
100 http://www.kfst.dk/en/service-menu/publications/publication-file/publikationer-2001/priser-og-avancer-i-graensehandelen-med-oel-og-sodavand/17-saerlige-forhold-paa-oelmarkedet/ 101 http://www.kfst.dk/service-menu/publikationer/publikationer-2011/ & Coop and Danish Supermarket in Denmark, Wal-Mart in USA, Tesco in UK etc.

34
product label design, logo, etc. is not owned by the producers. Thus, these can be transferred to a new
manufacturer, without affecting consumer-awareness of the product.
The lack of negotiation power can be seen by looking at the balance sheet item “trade receivables” under
operating liabilities. The item is increasing over time, indicating that the company is not able to negotiate
better terms of payment from its customers, increasing the proportion of funds tied up. However, Harboe’s
focus on a strong and close collaboration with its customers is also one of the company’s advantages and
improving customer relationship by extending credit may be strategically smart.
Regarding the end consumers (buyers) Harboe’s mainstream low-end products are quite uniformed and
therefore relatively price sensitive, since the customer has little preference concerning the different labels
except for price. Moreover, due to Harboe's lack of advertising and positioning of its products, consumer
loyalty is expected to be low making it difficult to maintain a customer base.
3.2.4 Substituting Products There are some autonomous effects leading to lower beer consumption in Europe. In many countries
consumers have changed their drinking habits over the last 15 years, and new generations of young people
seem to have shifted their preferences in favor of pre-mixed drinks and spirits at the cost of beer102. One of
the most pronounced trends in the market is the development of “healthy products”, or drinks with
functional benefits. These are mixes of alcohol and health-related ingredients. Related to this is the
continued search for new flavors and category blurring103. The category of alcoholic sodas (RTDs) is
interesting, particularly in markets within Europe, like e.g. in Germany, where the product category is
expected to continue its growth. This category has a big role in terms of innovation and segmentation and
because of the controversies surrounding drinking and young people104. As discussed under “markets”,
there also seems to be a tendency of female consumers substituting beer with other types of beverages.
Competition amongst the different substitutes is enlarged due to the fact that switching-costs for the
consumer, choosing between the different categories, are so low.
Wine producers are still far behind in terms of modern marketing, branding and company centralization,
but change may be underway. Wine is increasingly seen as less elitist and some parties within wine trade
are attempting to create a simpler labeling system in order to not scare off new consumers105.
102 http://www.brewersofeurope.org/docs/publications/economy_of_beer/a_market_under_pressure.pdf 103 Alcohol trends – markets and innovations 104 Ibid. 105 Ibid.

35
Figure 3.2: Consumption per capita from age 14: beer (dark green), wine (light green) and liquor (white) 2000-2010
(ltr. alcohol). Source: Tal fra Bryggeriforeningen øl 2011, page 12
As illustrated in the figure above, Danish people are now getting a larger proportion of alcohol from wine
(light green part) than from beer (dark green part), while the liquor proportion is slightly decreasing (white
part). One of the explanations for this may be found in the asymmetry in charges. Danes pay 78 cents per
unit beer standard lager 4.6% alcohol, while a unit of wine, with an alcohol content of 14%, “only” is
charged with 67 cents106. In Germany the trend of substituting beer for wine is driven by the changing
demography of the population.
3.2.5 Rivalry in the industry A few global “beverage giants” produce a variety of products that can be grouped into two main categories:
alcoholic and non-alcoholic. The beer industry has experienced market saturation in much of the developed
world, which has limited the industry’s growth potential and forced many companies to focus on emerging
markets. With fewer options for growth, competitive pressure has forced consolidation through mergers
and acquisitions. Most beer markets are therefore characterized as oligopolistic with high market
concentration. The fewer number of national competitors indicate that the intensity of competition will
decrease, but at the same time, the internationalization of the sector is creating increased competition
between global players.
Carlsberg operates 77 breweries and sells beer through exporting and licensing agreements, led by their
Export License and Duty Free division, with sales in around 100 countries that do not have breweries
themselves. Besides focusing on the commercial aspects of beer, Carlsberg also researches new methods
for breeding of barley and yeast in 'The Carlsberg Research Laboratory ".
A substantial portion of Carlsberg’s revenue comes from the Northern and Western European beer
markets, but beer sales fell in these markets as a result of the economic crisis, and its impact on consumers'
purchasing power. A temporary shift in consumer preferences towards premium beer in the Eastern
106 http://ipaper.ipapercms.dk/Bryggerigruppen/test/NytfraBFjuli2010/
36
European markets, further positively affected by increased disposable incomes up to 2008, has motivated
Carlsberg to invest further in this region107.
Royal Unibrew’s main activities are production, distribution and sale of branded beer and soft drinks in
primarily Eastern and Western Europe, but the company also has respectable market share in the
Caribbean, North America and Africa. In Denmark, the company is a leading supplier of beer and soft drinks
with a number of strong brands and in both Latvia and Lithuania the company is among the two leading
beverage companies, with significant market positions within beer and soft drinks. On the global market for
malt beverages Royal Unibrew estimates that their Vitamalt possesses the third largest premium brand108.
Heineken produces and distributes more than 200 international premiums, regional, local and specialty
beers and ciders, and in addition the company operates in markets for non-alcoholic drinks like soft drinks
and mineral water. Heineken is established in more than 70 countries covering America, Europe, Africa,
Middle East and Asia-Pacific region, which is done through a network of distributors who handle its 125
breweries109.
SABMiller is a global brewer with a broad product portfolio that consists of more than 200 international
and regional brands and the company operates 131 breweries that are spread out over the world.
Company activity is spread across 75 countries on six continents, including both markets such as the U.S.
and Europe, but also emerging markets like China and India. SABMiller also operates bottling plants for
Coca-Cola products. SABMiller puts great emphasis on expanding its business on the African beer market by
developing a robust portfolio of local brands. The African market is experiencing a solid development with
higher growth in demand compared to the global beer industry110.
With AB InBev’s acquisition of Anheuser-Busch in November 2008, the company achieved a dominant
position in the global beer market with a strong foothold in the American, Chinese and Russian markets. AB
InBev is now the world's largest beer producer of both beer and nonalcoholic beverages. Its product
portfolio includes 300 brands and AB InBev's brewing facilities include 151 breweries, which operate in 30
countries across America, Europe, Latin America, Asia and the Pacific111.
Compared to major breweries like AB InBev, SAB-Miller, Heineken and Carlsberg, Harboe’s geographical
markets are very limited. On the Danish market, Carlsberg is the biggest beer company followed by Royal
107 www.carlsberg.com 108 www.royalunibrew.com 109 www.heineken.com 110 www.sabmiller.com 111 www.ab-inbev.com
37
Unibrew and Harboe is the third largest brewery, but significantly smaller than the two others. The
undisputed market leader in Northern Europe is Carlsberg with No. 1 positions in Denmark, Sweden,
Norway, Finland and the three Baltic States. Carlsberg is therefore both locally and globally the biggest
competitor to Harboe112. Royal Unibrew is also present in Germany, Poland and the Baltic countries, and
with a market share of around 20% for beer and 25% for soft drinks in Denmark. The company is the main
domestic challenger to Carlsberg and a close competitor to Harboe113. Carlsberg and Royal Unibrew
primarily follow a strategy of differentiation whereas Harboe’s main strategic focus is cost minimization.
As mentioned earlier, Harboe has a brewery in Germany which is its second biggest market after Denmark.
In Germany the largest international competitors are Carlsberg and SABMiller. Harboe’s third brewery is in
Estonia and this brewery is the platform for distribution in the Baltic countries. Here as well, the market is
highly concentrated with 95% of total domestic consumption produced by three breweries. Where the
largest producer is Saku brewery owned by Carlsberg, the second largest producer is Olvi owned by Finnish
independent and the third largest brewery is Viru Ölu owned Harboe.
3.2.6 Summarizing Porter’s Five Forces Establishment as a big player in the industry requires significant investment in product facilities and access
to a distribution network. On most markets competition is sharp and dominating companies are capable
competitors. A surge in input costs has inflated the cost of brewing and increased the need for operational
efficiency and execution. Besides, private labeling and consolidation amongst retail trade has enlarged the
bargaining power of customers regarding price and payment terms.
Tastes are shifting and RTD products and wine is gaining in popularity, and the low switching costs for
consumers is amplifying this development. Varied consumer taste requires companies to carry a more
diversified portfolio of products and to use branding and marketing as important variables to facilitate
brand loyalty and develop a customer base. However, at the same time consumption is shifting towards
discount off-trade and low prices are becoming more important to consumers.
Thus, overall competition can be characterized as an oligopoly with few large breweries and many micro-
breweries. The threat of new entrants on a larger scale is relatively limited due to the high cost barriers of
the industry and the limited access to distribution (customers). Still competition is tough and profit margins
are under pressure, due to increasing input prices, low negotiation power over customers and the shifting
taste of consumers.
112 http://www.carlsberggroup.com/MARKETS/NWE/Pages/default.aspx 113 http://www.royalunibrew.com/Default.aspx?ID=67

38
3.3 Internal Analysis of Resources and Competencies So far the strategic analysis has looked at external factors influencing the brewing industry at society level
and at industry level. The following section analyzes the internal resources and competencies of Harboe in
order to assess how well the company is adapting to the challenges of its surroundings. The section will to
some extent build upon information from the earlier section114, describing Harboe and its markets.
Harboe's core business involves the production and sale of discount beer and soft drinks to retail stores.
The retail stores demand for beverages is seasonal and Harboe’s customers are therefore requesting
flexibility in deliverance. To manage this challenge Harboe has some excess capacity embedded in the
production system that provides the necessary degree of freedom. The company follows a generic strategy
of cost minimization and generates its revenue by producing and selling large quantities at a low cost. Sales
are facilitated through a solid relationship to customers (such as Netto) building upon long-term
distribution contract, which provides a strong platform for expanding and selling the company’s products.
Compared to the largest competitor, Carlsberg, Harboe’s investments in branding and product
development is very limited and Harboe is primarily competing on price. Because of Harboe’s limited
marketing effort, the end consumer has a low brand awareness and thus low customer loyalty towards the
company’s products. Competing on price also means that the profit margin per unit sold is low and the
increasing costs of input, like commodities and labor, therefore cuts earnings substantially. Besides, the
company’s products are continually challenged by the branded products of its competitors sold at discount
prices, and by private labels pushing down prices. In order to penetrate the less price sensitive market
segment, Harboe finalized the acquisition of GourmetBryggeriet A/S (GB) in April 2010, where the company
bought the remaining, approximately, 8% of the shares, making it a 100% owned subsidiary. The purpose of
the acquisition was to maintain and expand GB position within the HORECA-segment115, which opens up a
new market segment to Harboe and presents further business possibilities116.
The beer segment within Harboe’s primary markets seems to be saturated, while the soft drink segment
still offers some potential. Consolidation combined with intense competition and the low profit margin
within Harboe’s market segments, has caused the company to concentrate more on developing other
sources of earnings. As a consequence, the company has put greater effort into the growth of new products
and the penetration of new markets. Penetration has been achieved via direct exports through sales
subsidiaries, direct investment in manufacturing companies and through joint ventures with local business
114 Section 2: Presentation of Harboe and its markets 115 HORECA = Hotel, Hospitality and Catering 116 http://files.shareholder.com/downloads/ABEA-4B4UY1/1704520733x0x487802/7daadb1f-528e-45bc-a25d-fe79cd0daba1/Danske%20Markets%2013%2009%202010.pdf (slide 12)

39
partners. Innovation has primarily been within the development of malt extract and product development
has focused on marketing and packaging within categories promoted as separate brands. The primary areas
of focus are malt beverages in the form of rye extract for kvass production, clear malt extract for malt
beverages and non-alcoholic beer, and malt extract with varying sweetness117. Harboe’s product
development is sought to address the trend apparent within many industries, where natural ingredients
(clean label) and fermented products based on things like cereals, vegetables, milk or tea, are replacing
synthetic ingredients to a greater and greater degree. The development of malt extract thus opens new
market opportunities within business areas (B2B) such as the baking industry (rye bread, bread and bread
mixes), the beverage industry (non-alcoholic soft drinks / beer), the breakfast industry (corn flakes and
muesli), the confectionery and chocolate industry (topping, sweets and ice), baby food and the pharmacy
industry118. The increasing focus concerning the development of new products is facilitated through
collaboration with customers, investment in new production equipment, and through innovation teams
consisting of the company’s own engineers and in collaboration with international research groups.
Besides, Harboe is aware of the importance of securing a good organizational structure with satisfied and
knowledgeable employees, and to continue to collect information seeking to improve production
processes. The company is therefore very focused on attracting, educating and retaining a skilled workforce
and human resources are complemented by the quantitative evaluation system ERP. This is done to secure
a high knowledge base and to improve the efficiency of the company.
Overall, the company's strategic focus is maintaining its solid position in the retail sector, including the
private label segment, and maintaining a high volume of its core products. Harboe's continued growth is
expected primarily to come from targeted product development, intensive focus on innovation and
investment in long-term value creation119. Regarding its financial goals, the objective is to maintain a high
economic preparedness and ultimately to achieve an annual net revenue growth of 5%, a long-term profit
margin of 6-8% and a return on invested capital of 8-10%120. The primary risk lies in the sensitivity to
fluctuations in the prices of raw materials and other supplies. However, regardless of Harboe’s efforts
within innovation and product development, the company’s primary strength is still assessed to be its
maintained, efficient, and flexible production facilities producing high volumes at low costs. The market
development of increasing demand for low priced beers sold in the retail sector (off-trade) thus could be to
some advantage given Harboe’s business model.
117 Ibid., slide 14 118 Ibid., slide 15 119 www.Harboes.dk 120 http://files.shareholder.com/downloads/ABEA-4B4UY1/1704520733x0x487802/7daadb1f-528e-45bc-a25d-fe79cd0daba1/Danske%20Markets%2013%2009%202010.pdf (slide 13)

3.4 Summarizing the Strategic ABased on the external and internal analysis of the non
strategic position is now evaluated. This is done by listing the opportunities and threats of
found in the external analysis, and the strengths and weaknesses of the company
analysis. The purpose is to assess if the
accomplish its goals.
Figure 3.3 SWOT model summarizing strengths, weaknesses, opportunities and threats. Source: own creation.
The economic cycle has in previous years undergone significant
world have changed accordingly. Harboe's primary markets show a trend of declining consumption, more
focus on price (and less on brand) and increasing off
systematically on maintaining the strong position
on following its niche strategy, exploiting its core competencies
effective, and flexible production. Harboe is prese
local production facilities, sales subsidiaries and partnership contracts. At the same time
enhance its exposure to growth markets through an innovative and targeted product range
marketed in less price-sensitive segments
organization is assessed capable of supporting this process which could lead to company growth and
increased value creation.
Strengths•Low cost production•Effective distribution•Flexibility•Experience & know
how•Innovation•Financial resources
Opportunities•Increasing off
and price as decisive parameter for customers
•Changing preferences•New markets and new
market segments
Analysis Based on the external and internal analysis of the non-financial value drivers of the company
evaluated. This is done by listing the opportunities and threats of
found in the external analysis, and the strengths and weaknesses of the company
he purpose is to assess if the company has the necessary strategic fit
SWOT model summarizing strengths, weaknesses, opportunities and threats. Source: own creation.
The economic cycle has in previous years undergone significant highs and lows and circumstances of the
accordingly. Harboe's primary markets show a trend of declining consumption, more
focus on price (and less on brand) and increasing off-trade in relation to on-trade.
lly on maintaining the strong position, it has established in the Northern European market, and
exploiting its core competencies of low cost production through maintained,
Harboe is present and has good access to its primary markets through
local production facilities, sales subsidiaries and partnership contracts. At the same time
its exposure to growth markets through an innovative and targeted product range
sensitive segments. The company’s strong capital resour
organization is assessed capable of supporting this process which could lead to company growth and
StrengthsLow cost productionEffective distributionFlexibilityExperience & know-
InnovationFinancial resources
Weaknesses•Low profit margin•Low brand value•Limited size•Lack of focus
OpportunitiesIncreasing off-trade and price as decisive parameter for customersChanging preferencesNew markets and new market segments
Threats•Increasing cost of
production•Decreasing selling price•Customers barganing
power and substituting products
•Regulation, and excise and VAT charges
40
of the company, Harboe’s
evaluated. This is done by listing the opportunities and threats of its surroundings,
found in the external analysis, and the strengths and weaknesses of the company, found in the internal
company has the necessary strategic fit needed in order to
SWOT model summarizing strengths, weaknesses, opportunities and threats. Source: own creation.
and circumstances of the
accordingly. Harboe's primary markets show a trend of declining consumption, more
trade. Harboe should work
it has established in the Northern European market, and
of low cost production through maintained,
good access to its primary markets through
local production facilities, sales subsidiaries and partnership contracts. At the same time Harboe can
its exposure to growth markets through an innovative and targeted product range that can be
strong capital resources and competent
organization is assessed capable of supporting this process which could lead to company growth and

41
However, the general economic development, rising raw material prices and intense competition combined
with a current risk of new taxes, are challenges that continue to put company earnings under pressure.
Selling margins are diluted because of the high bargaining power of customers and shifting preferences of
consumers toward substituting products like wine. Due to Harboe’s low brand value, consumer loyalty is
low and the company’s budget products are continually challenged by branded products sold at discount
prices and by private labels.
4.0 Financial analysis Traditional financial statements – the income statement and the balance sheet – are not organized for
robust assessment of operating performance and value. The balance sheet mixes operating assets,
nonoperating assets, and sources of financing. The income statement likewise combines operating profits
with costs of financing, such as interest expense.
To prepare the financial statements for analysis of economic performance, one will need to reorganize the
items on the balance sheet and income statement into three categories: operating, nonoperating, and
sources of financing. Additionally, items have to be classified as permanent or transitory, in order to
determine if they have an ongoing effect on key figures. The crucial thing to consider is whether or not the
item is part of the company’s primary operations and of a notable size. Due to lack of disclosure by
companies, not all items can be identified according to the notes and some must be allocated based on a
subjective assessment121.
The analysis of the historical performance of Harboe is used to project the company’s financial growth
drivers. The decomposition and analysis of earlier year’s accounts provides a historic level and illustrates
development tendencies of principal financial value drivers. Combined with the strategic analysis of the
non-financial growth drivers, the financial analysis constitutes the foundation upon which the budget of the
company is forecasted. The financial analysis will be based on the historical consolidated financial
statements for Harboe in the period 2007-2011.
4.1 Reformulation – the Theoretical Approach The purpose of reformulating the balance sheet and income statements is to discover the drivers of ROCE
(return on common equity), growth and risk in preparation for forecasting and valuation. This discovery is
made through ratio analysis, combined with a good knowledge of the business.
121 Elling & Sørensen 2005: 121

42
4.1.1 Reformulation of the Balance Sheet The typical balance sheet divides assets and liabilities into current and long-term categories. For assets, this
division is based on liquidity, and for liabilities, it is based on maturity. This is done in order to indicate the
company’s ability to meet creditors’ claims. Yet as discussed, this classification will not work when
analyzing the company’s ability to generate profit. The analysis of the company's value-creating ability of
the operating side involves a reclassification of the balance sheet by splitting it up into operating assets and
liabilities, and financial assets and liabilities (interest bearing). Operating assets and operating liabilities are
records relating to production and sales of goods and services. Financial assets and financial liabilities are
items that help to raise the capital needed for operations.
Through the reformulation of the balance sheet one arrives at the summery number invested capital. This
number represents the total investor capital required to fund operations, and is expressed by the following
equation:
Operating Assets – Operating Liabilities = Invested Capital = Debt + Equity
Invested capital sums operating working capital (current operating assets minus current operating
liabilities); fixed assets (e.g., net property, plant, and equipment); intangible assets (e.g., goodwill); and
other long-term operating assets (net of long-term operating liabilities).
4.1.2 Reformulation of the Income Statement The income statement reports the profits and losses that the net operating assets and net financial assets
(obligations) have produced. To determine a company’s after-tax operating profit, one must compute net
operating profit less adjusted taxes (NOPLAT). NOPLAT is the after-tax profit generated from core
operations, excluding any gains from nonoperating assets or financing expenses, such as interest. Whereas
net profit is the profit available to equity holders only, NOPLAT is the profit available to all investors,
including providers of debt, equity, and any other types of financing.
To calculate NOPLAT, the income statement has to be reformulated in three ways. First, interest is not
subtracted from operating profit, because interest is considered a payment to the company’s financial
investors, not an operating expense. NOPLAT should therefore be independent of the company’s capital
structure. Second, when calculating after-tax operating profit, any nonoperating income generated from
assets that were excluded from invested capital must also be excluded here122. Finally, since reported taxes
are calculated after interest and nonoperating income, they are a function of nonoperating items and
capital structure. NOPLAT should only be a result of operations and this requires that the effects of interest
122 There must be consistency between the definition of NOPLAT and Invested Capital.

43
expense and nonoperating income also be removed from taxes. Without the tax benefit of debt, reported
taxes on operating income would be higher, so the amount of the benefit that reduces the net interest
expense is allocated to operating income. Thus, tax allocation works by deducting both the total tax (tax as
reported) and the tax benefit (tax shield) from operating income, in order to capture what the operating
income would have been, after tax, had there been no financing activities. Interest is tax deductible and
leverage has value, so to include this, all financing costs are accounted for in the cost of capital. Similarly,
taxes on nonoperating income can be accounted for by netting it directly against nonoperating income,
since they are not included as part of NOPLAT.
4.1.3 Reformulation of the Equity Statement There are regulatory requirements for how the various items are recognized in the annual report. Typically,
all income and expenses need to be included in the income statement, with the exception of a number of
items which are recognized directly in equity statement as to avoid dividend being paid of these amounts
(hidden dirty surplus items)123. This could include the revaluation of tangible fixed assets, changes in
accounting policies or correction of significant errors. The items in the equity statement should therefore
be subdivided into transactions with owners, such as purchase and sale of treasury shares, and records
relating to comprehensive income of the period. If the equity statement does not contain any other surplus
components than the net profit, it can be said to be a clean surplus account.
4.2 Reformulation – the Practical Approach The thesis is subject to the conditions described in the section about delimitations and due to lack of
information, some subjective assumptions will be imposed on the data processing. The following section
summarizes the criticisms of the reformulation and some areas of uncertainty are highlighted. For a more
detailed review of considerations concerning the reformulation the reader is referred to appendix 3, where
the core reformulation and related notes can be found.
In general it should be mentioned that the value of debt financing from banks and the value of tangible and
intangible assets are based on book values. The reason why the market values are not used is the fact that
this information is not given and furthermore that the calculations of these would be subject to a high
degree of uncertainty.
Additionally, the distinction between operating and financing activities will partly be subjective due to a
lack of information in the notes. Specifically mentioned are the following items:
123 Elling & Sørensen, 2005: p. 19

44
In the notes of the annual report (note 8), the balance sheet item “other debt” consists of four different
items. One of the items is specified "other payables" and amounts to over 50% of the whole record but this
is not further elaborated. There is therefore uncertainty to whether this item, as chosen, is properly
classified as part of operating liabilities.
In the income statement the entries “other operating income” and “other operating costs” are found.
Referring to the notes (note 17 & 18), “other operating income” relate to government grants and rental
income, while “other operating costs” not are specified. The consideration is whether these items are
related to operations or not. Given the specifications, it is estimated that this is the case and that the
records are permanent. Records are therefore maintained as part of the primary operation.
The elimination of Harboe Farm is associated with some uncertainty due to the fact that the consolidated
financial statements are adjusted for internal transactions which the subsidiary accounts are not. This
elimination, therefore, leads to a double elimination of intercompany transactions between Food Company
and the group. However, the method is still considered useful because transactions between the parties
are considered to be limited due to the very different activity of the companies and additionally because
the subsidiary only amounts to about 9% of the group.
When eliminating the subsidiary Harboe Farm A / S, another problem arises in connection with tax, since
the firms are co-taxed. There is not enough information in the annual report to come up with a realistic
estimate of the direct elimination of taxes on food subsidiary. Thus, the derived differences between assets
and liabilities, in the reformulated accounts, are grouped under the heading ”Derivative disagreements”,
but represent a minimal correction and the item will therefore not have much impact on the valuation.
Regarding the reformulated equity statements, dirty surplus items account for a small correction. The
difference in the comprehensive income of the income statement, compared to that of the reformulated
equity statement, is assessed mostly to be due to the assumptions affecting the applied tax rate. The
figures for comprehensive income, calculated in the reformulated income statement, will be the ones used
going forward.
4.3 The Analysis of Profitability A financial analysis, as directed by the DuPont model124, can be broken down into different levels. This is
done in order to be able to examine the reasons for a particular development. As part of a valuation of a
company, it is necessary to consider financial value drivers such as the growth rate of sales, the profit
124 The model Is explained under section 4.3.1 Breakdown of Financial Value Drivers

45
margin, and the asset turnover rate. It is the development in these ratios, which helps to form the basis for
developing the pro-forma budget used in estimating shareholder value.
The financial value drivers are shown in the historical financial statements. They measure the value that has
been realized in the period, but they do not create value. The value is created through the interaction
between the underlying non-financial value drivers i.e. the company's internal resources, competencies,
and strategies and the external environmental factors at society and industry level. To arrive at an informed
estimate of future developments, it is therefore essential to complements the historical financial analysis
with an analysis of the non-financial value drivers.
The following summary of the reformulated financial statements are used as a reference to work from. The
fully reformulated statements can be found in appendix 3 and the techniques used for calculating the
different ratios are available in appendix 4.
Figure 4.1: Summary balance sheet statement. Source: Own creation
Reformulated Balance Sheets
2010/11 2009/10 2008/09 2007/08 2006/07
Operating Assets adjusted 1,197,310 1,162,846 1,086,536 1,025,053 1,005,850 Operating Liabilities adjusted 432,291 407,144 429,719 368,505 375,261
NOA adjusted
765,019 755,702 656,817 656,548 630,589 NFO
131,171 141,617 108,640 72,985 57,760
MI 209 191 190 242 414
CSE 633,639 613,894 547,987 583,321 572,415
Figure 4.2: Summary income statement. Source: Appendix 3
Reformulated Income Statement
2010/11 2009/10 2008/09 2007/08 2006/07 Net Sales
1,320,653 1,283,633 1,319,439 1,137,328 1,189,235
Operating income from sales, before tax 82,009 58,250 36,117 20,591 88,440 Operating income from sales, after tax 60,067 42,284 24,784 14,242 58,825 Dirty surplus
4,347 2,082 (23,505) -55 -487
Total operating income 64,414 44,366 1,279 14,187 58,338 Total finacial expense
4,328 2,045 5,378 4,871 2,293
Minority interest
18 1 -52 -45 -8 Comprehensive income to common 60,068 42,320 (4,047) 9,361 56,045

46
4.3.1 Breakdown of Financial Value Drivers As mentioned the structure of the profitability analysis follow the DuPont model. The model is shown
below.
Figure 4.3: Structure of the profitability analysis and the valuation. Sourced: Own creation. Regnskabsanalyse for beslutningstagere page 150.
At the start of the pyramid lies return on equity which is founded upon a number of underlying financial
value drivers. The structure divides the value drivers into several levels, where analysis at a lower level is
closely linked with the level above125.
To explain the figure, the return on equity depends mainly of two things. The first part shows the
development of RNOA, which measures how effectively the company uses the resources at its disposal,
while the second part shows the development in the financial activity’s value drivers which constitute the
WACC. Improvements in RNOA can be achieved on the basis of two underlying value drivers. That is, either
by improving the operating margin (PM) or by increasing the net operating asset turnover rate (ATO). Both
of these factors are in turn dependent on a number of underlying value drivers related directly to
operations. The profit margin (PM) expresses the earnings capacity of the company through the
125 Elling & Sørensen. 2005: p. 173-174

47
cost/earnings distribution, while the asset turnover rate explains the level of tied up capital and the
company’s capability of adjustment. Regarding the WACC, these costs are based on a number of underlying
requirements to the yield on the financial obligations as well as equity, which is also be described in the
following sections.
4.3.2 Return on Net Operating Assets RNOA is the overall profitability measure of operations, expressing the percentage of return through the
ratio NOPLAT, divided by invested capital. The level and development of RNOA is important in setting the
basis for forecasting future value creation.
Figure 4.4: Development in RNOA. Source: Calculations based on equations from appendix 4
2010/11 2009/10 2008/09 2007/08 2006/07
RNOA 7.90% 5.99% 3.77% 2.21% 9.33%
Looking at the numbers one can see that the variation in RNOA over the period is quite significant.
Especially the years 2007/08 and 2008/09 yielded a low return, and this development seems to be a result
of the deteriorating market conditions of that period, cf. the external analysis. As depicted in the
reformulated income statement, year 2007/08 showed low sales and relatively high production costs,
which also was the case for year 2008/09. The relatively higher production costs in this period compared to
other years were due to increased input prices of that period. However, from a low of 2.21% the company
has increased its return during the past four years, yielding a return on net operating assets of close to 8%
2010/11. So, even though the level still is not impressive, the development indicates that Harboe is on the
right track.
4.3.3 Breakdown of RNOA The breakdown of RNOA is done in order to achieve a better understanding of what factors influence the
ratio. The ratio is broken down into PM and ATO.
Figure 4.5: Break down of RNOA. Source: Calculations based on equations from appendix 4
Breakdown RNOA 2010/11 2009/10 2008/09 2007/08 2006/07 PM
4.55% 3.29% 1.88% 1.25% 4.95%
ATO
1.73 1.82 2 1.77 1.88
Cf. the external analysis; the industry is coping with rising raw material prices, tough competition,
substituting products, high bargaining power of customers (B2B) and a high and increasing tax burden.
These are all factors which put a downward pressure on the PM, holding it at a low level. The development
in the ratio follows the same pattern of that of the RNOA with 2007/08 and 2008/09 being the worst years.

48
Nevertheless, Harboe’s PM has increased evenly since 2007/08 and the company’s focus on maintaining
effective production facilities and producing at low costs has kept the ATO relatively high at an average of
1.81. In general, if a company has a low PM, ATO has to be higher in order to secure a reasonable return
and given the business model of Harboe this is the company’s primary strategy.
4.3.4 Breakdown of ATO ATO is a function of sales revenue and invested capital. It is thus a financial ratio that measures the
efficiency of a company’s use of its assets in its effort of generating sales income to the company – the
higher the number the better126. To obtain a better understanding of the company's value drivers it is
necessary to decompose this relationship.
Figure 4.6: Breakdown of ATO. Source. Calculations based on equations from appendix 4
Breakdown of ATO value drivers 2010/11 2009/10 2008/09 2007/08 2006/07 Accounts receivable turnover
4.38 4.22 4.93 4.79 5.43
Ave days funds tied up receivables 83 86 74 76 67
Accounts payable from sales turnover 2.97 2.98 3.63 3.5 3.79 Ave days funds tied up payables 88 76 75 81 94
Inventories turnover
6.47 7.41 8.2 7.24 8.13 Ave day’s funds tied up inventory 56 49 45 50 45
Approximate conversion period: 139 135 119 126 112 (days tied up inventory + receivables)
Average net trade cycle: (# of days) 51 59 44 45 18 (conversion per. - day payables)
The development in “accounts receivable turnover” shows that the general tendency is that Harboe is
slower in collecting its money from debtors. This tendency is also evident from the item “average days
funds tied up receivables”, which has increased from 67 to 83 days over the period. The consequence of
this is that the company has more money tied up and a lower liquidity. Cf. the industry analysis, the
development is a result of the increasing bargaining power of customers.
The development tendency is the same for “inventory turnover rate” (which is a measure of the number of
times inventory is sold during a year) and “average day’s funds tied up inventory”. This is a result of
relatively low increase in turnover, compared to the increase in inventories and in invested capital over the
period. The overall assets are increasing because the company is investing in expansion and improvements
126 The amount of sales generated (DKK) for every DKK worth of assets

49
of its production facilities. The development indicates that the company has not been able to adjust its
production level to the changing demand, meaning that the company has to finance more money tied up in
production.
Regarding “accounts payable from sales turnover”, this item is decreasing over the period, indicating a
more positive development while “average day’s funds tied up payables” shows more variation from year
to year. However, the development in “average day’s funds tied up payables” since 2008/09 indicates that
Harboe is somewhat successful in leaning on trade, exploiting the operating liability leverage (saving
interests on supplier credit). Yet, the trend is not very clear and using operating liability leverage may
expose the company to higher general prices or the risk of missing out on cash discounts from suppliers.
As shown, the context of the external analysis has meant that the number of days in which cash is tied up in
inventory and as receivables (conversion period) has increased and is up from 112 days to 139 days. So,
even though the relationship to suppliers has improved over the last years (increase in average days funds
tied up payables), the “average net trade cycle” (meaning the number of day’s money is tied up in
production) has increased from 18 days to 51 days, influencing the liquidity and solvency of the company.
4.3.5 Breakdown of PM Profit margin is calculated as earnings (sales minus cost of sales) divided by sales. But NOPLAT in the
reformulated income statement also includes other elements that are not directly derived from sales. The
items “other operating income” and “other operating costs” are not necessarily part of the primary ongoing
operation, so as for reservations these components are separated and named PM other items.
Figure 4.7: Break down of PM. Source: Calculations based on equations from appendix 4
Breakdown PM value drivers PM sales
2010/11 2009/10 2008/09 2007/08 2006/07
Gross profit/Net sales
32.23% 29.41% 26.40% 27% 30.25% Less Distribution costs/Net sales 13.28% 12.76% 12.78% 13.27% 12.39% Less Administration costs/Net sales 3.53% 3.21% 2.89% 3.01% 2.84% Less Dep. and Amor./Net sales 9.86% 9.79% 8.96% 9.59% 8.50% Less Tax operating income/Net sales 1.66% 1.24% 0.86% 0.56% 2.49% Total PM sales 3.90% 2.41% 0.91% 0.57% 4.03%
PM other items Other operating income/Net sales 1.38% 1.43% 1.47% 1.30% 1.52%
Less Other operating costs/Net sales 0.73% 0.55% 0.50% 0.62% 0.60% Total PM other items 0.65% 0.88% 0.97% 0.68% 0.92%
Total PM 4.55% 2.29% 1.88% 1.25% 4.95%

50
The table above illustrates the breakdown of the PM given by the following function:
PM = PM sales + PM other items
PM sales constitute the primary value driver while PM other items only represent a small portion. Total PM sales
have increased since 2007/08 and are close to the level from 2006/07 and again we see that the two worst
years are 2007/08 and 2008/09. The increases in PM sales is mostly due to a better margin on gross profit
and cf. the market analysis, this is mainly because the prices of raw materials have decreased a bit since the
peak in 2007/08. This supports the notion that high raw material prices are the primary challenge for
Harboe. However, some of the explanation could also be due to the fact that Harboe has improved its
efficiency in production, which is of great importance, since this is a parameter within the control of the
company and a source of competitive advantage. The other ratios depict a stable development with no
notable deviations.
4.3.6 ROCE and the Breakdown of Financial Leverage The equation for calculating ROCE indicates that there is a benefit to financial leverage:
ROCE = RNOA + [FLEV x SPREAD]
Where the SPREAD = RNOA – NBC. Following this equation, if a company adds financing leverage (FLEV), it
increases its return to common shareholders, ROCE. But, this of course is dependent on that RNOA is higher
than the net borrowing cost (NBC) on the net financial obligations. That is, the SPREAD must be positive.
However, there can never be additional return without additional risk. The risk is that with increased
leverage (or because of other circumstances) the SPREAD turns negative and ROCE becomes less than
RNOA (the leverage is unfavorable). Thus, financial leverage can increase ROCE, but it also increases the risk
and thus, the required rate of return of debt and equity holders. In the extreme, if the leverage becomes
too unfavorable, shareholders might lose the company to debtholders (in bankruptcy).
So, the expression for ROCE expresses that the ROCE can be broken down into three drivers:
1. RNOA = OI/NOA
2. FLEV = NFO/CSE
3. SPREAD = RNOA – NBC, where NBC = NFE/NFO

51
Figure 4.8: Break down of ROCE. Source: Calculations based on equations from appendix 4
Breakdown of ROCE
2010/11 2009/10 2008/09 2007/08 2006/07 RNOA 7.90% 5.99% 3.77% 2.21% 9.33% FLEV
21.09% 24.52% 19.37% 12.77% 10.28%
SPREAD
4.60% 4.55% -1.18% -4.45% 5.36% NBC127
3.30% 1.44% 4.95% 6.67% 3.97%
ROCE 8.87% 7.11% 3.54% 1.64% 9.98%
From a low of 1.64% in 2007/08 the ROCE has increased to 8.87% in 2010/11. The development tendency
of ROCE is similar to that of the RNOA following the level of the FLEV. FLEV, which is the nonoperating
component of ROCE, indicates how much leverage the company has relative to its equity. In this context, it
is relevant to note that the years 2007/08 and 2008/09 again are the most challenging years, where NBC
are high and the SPREAD is negative. Cf. the strategic analysis, this is assumed to be due to the critical
situation on the market on top of the financial crisis and the subsequent credit crunch, which rapidly and
dramatically limited access to liquidity and forced interest rates up in that period.
As illustrated, ROCE is highly dependent on the degree of FLEV and the SPREAD being positive.
Consequently in the years 2006/07, 2009/10 and 2010/11 where the FLEV was relatively high, NBC was low,
and the SPREAD was positive and as a result, Harboe yielded a solid return.
4.4 Risk Analysis The close relationship between risk and return is further supported by the Capital Asset Pricing Model
(CAPM)128. The company’s exposure to risk is therefore central to the value creation and something Harboe
should focus on controlling. In general, risk can be divided into either operational risk or financial risk, and
this approach is applied in the following. The risk elements are also central to the estimation of the WACC
cf. the valuation section found later in this thesis.
4.4.1 Operational Risk When estimating the company's operations-related risk the focus is on issues that affect the primary
operating earnings. The operational risk relates to the strategic and operational issues that were analyzed
in the external analysis and in the analysis of the company’s business model. The operational risk is
therefore only summarized in the figure below. For a more detailed description and reasoning of each item,
the reader is referred to the strategic analysis.
127 It is emphasized that NBC does not precisely correspond to the company's borrowing rate, as NBC is made up of both financial items (exchange rate gains and losses on securities) and the difference between deposit and lending interest rates. Additionally, the historic NBC does not necessarily have anything to say about what the current or future rate the company could borrow to would be. 128 Koller, Goedhart and Wessels:2010: p 235.

52
Figure 4.9: The operational risk of Harboe. Source: Based on the strategic analysis
Types of operational risk
Assessment of risk level
Company capability to handle the risk
Society risks: Inadequate Cyclical changes Medium Harboe is benefiting from price awareness of consumers, but high
uncertainty and decline in disposable income keeps private consumption at a low
Duties High High and increasing duties which narrows the PM Consumption patterns
Medium More off-trade consumption which benefits Harboe, but also changing preferences towards substitutes
Commodity prices
High Fluctuating and expected to increase. Can not affect the overall level which dilutes the company’s PM
Industry risks: Challenging Competition intensity
Medium - High High barriers to entry, but large competitors and increasing competition from brands sold at discount prices and from private labeling
Customer power Medium Large retail chains with large bargaining power, but Harboe has long and “good” cooperation with important distribution chains
Company risks: Sufficient Production facilities
Low Maintained, efficient and flexible
Capital structure Low Relatively low debt to equity ratio with capability to invest Organization Low - Medium Experienced management and accumulated know-how.
Maintenance of strategic focus, but also development of new business areas. Low brand value and low customer loyalty.
Overall, the company appears to be stressed by external factors, while the internal risk seems limited. The
overall strategy, in terms of maintaining market share through high volume production for the discount
segment, seems sensible in the given context, combined with a prospective understanding of the need to
get into less price-sensitive segments. But, much depends on competitors' behavior and the development
in the cost of production on which the company has little to no influence. The assessment of operational
risk is an important parameter in estimating the WACC.
4.4.2 Financial Risk The financial risk is divided into liquidity- and financing conditions. The analysis is based primarily on
financial ratios that show different aspects of the short-term and long-term liquidity risk and the financial
flexibility. The following ratios are key elements, which owners and lenders take into account when
estimating their yields.
4.4.3 Liquidity Analysis Management of liquidity is central to Harboe as inability to meet its obligations may result in suspension of
payments and bankruptcy. Moreover, the company should have some liquidity reserve if it wants to be able

53
to complete attractive investments. Liquidity analysis is divided into a short-term and long-term part. The
short-term liquidity risk refers to the level and changes in business opportunities, to repay obligations
within one year, while the solvency analysis uncovers the long term risk.
4.4.3.1 Short-term Liquidity Analysis Below are figures for the short-term liquidity risk.
Figure 4.10: Key figures for short-term liquidity analysis. Source: Calculations based on equations from appendix 4
Key figures for short-term liquidity analysis 2010/11 2009/10 2008/09 2007/08 2006/07 Current ratio
0.86 0.92 0.96 0.99 0.92
Cash to current liabilities
0.56 0.63 0.68 0.04 0.08 Acid-Test (Quick) Ratio
1.13 1.21 1.35 0.64 0.62
The “current ratio” is never higher than one and has actually been declining since 2007/08. This means that
short term liabilities are greater than short term assets, which again means declining working capital. “Cash
to current liabilities” has improved since 2007/08 where it was at a very low point of 0.04. Additionally, the
“acid-test (quick) ratio” has risen from 0.62 in 2006/07 to 1.13 in 2010/11. These two ratios are
conservative measurements of the liquidity of the company because they only take into account quick
marketable current assets. The difference between the two is that “trade receivables” is included in the
“acid test ratio”. The large change in the two ratios going from 2007/08 to 2008/09 is due to a significant
increase in financial assets available for sale.
4.4.3.2 Long-term Liquidity Analysis An indicator of the company's solvency is the interest coverage ratios and financial leverage. The
development in the ratios is shown below.
Figure 4.11: Key figures for long term liquidity analysis. Source: Calculations based on equations from appendix 4
2010/11 2009/10 2008/09 2007/08 2006/07
Financial gearing (all debt)129
140.64% 143.06% 162.21% 78.55% 81.27% Financial gearing (int. bearing debt)130 20.69% 23.06% 19.82% 12.51% 10.08% Interest coverage degree
14.02 21.07 5 3.13 28.54
The “interest coverage degree” specifies how many times operating earnings cover net financing costs and
a higher “interest coverage degree” thus means a lower long-term liquidity risk. The ratio has varied
significantly over the period, but seems to reach a more comfortable level in the years 2009/10 and
2010/11.
129 (Total operating liabilities + total financial obligations) / Total Equity 130 NFO / Total Equity

54
The “financial gearing” measured on the two other parameters have an increasing tendency. The” financial
gearing including non-interest bearing debt” increased significantly from 2007/08 to 2008/09 where
collective debt became larger than equity. Also, the “financial gearing only including interest bearing debt”
has increased by almost factor two from 2006/07 to 2010/11. This ratio, however, is still at a safe level,
limiting the overall long-term liquidity risk. The main explanation for the increased financial gearing is a rise
in long-term mortgage debt by a factor of 13.73 from 2007/08 to 2008/09 and prospectively, but at the
same time the item “financial assets available for sale” rose by a factor of 117.34 (however from a very low
level)131. Looking further into the notes of the annual report for 2008/09 the following explanation is given:
“In the annual report for 2008/09 there are particularly assumptions and uncertainties
associated with accounting estimates on impairment test on tangible and financial assets, statement of
repurchase obligation on returnable packaging, assessment of the value of the assets acquired and liabilities
in connection with acquisition and assessment of contingent liabilities which are important to note, since
they have had a significant impact on the in the annual reports recognized assets and liabilities and may
require corrections in subsequent periods if the assumed events does not develop as expected.”132
The mentioned acquisition in the above relates to the purchase of GourmetBryggeriet A/S in 2009, which
accounts for the greatest part of the increased debt. The important thing to note from the key figures is
that leverage increased significantly in the period, which ceteris paribus increased the long-term liquidity
risk. However, a significant part of the total debt is non-interest (operating liabilities), which once again
underlines Harboe’s uses of leaning on trade133.
4.4.4 Financial Condition The financial risk is structured through the company’s loan characteristics. Loans can be in either fixed rate
or floating rate; they can be with a short or long horizon, and in home or foreign currency. In general, short
term floating rate loans in foreign currency carries the greatest risk.
It is Harboe’s policy not to engage in speculation in financial risks. Harboe’s financial management focuses
solely on managing and reducing the financial risks that are a direct result of the Group's operating,
investing and financing activities.
131 Harboe annual report 2008/09, page 79 132 Ibid., page 59 133 The use of OLLEV in production

55
Harboe’s sales and purchases in foreign currency are made primarily in EUR and for a very small part in SEK,
USD, NOK and PLN. Harboe has not entered into any forward exchange contracts because management
believes that the Group's currency risk is limited134.
Because of Harboe Group's capital structure, the risk related to fluctuations in market interest rates is low.
The Group has an interest-bearing debt per. 30.04.2011 at 140.6 million DKK (2010: 149.4 million). The debt
is all floating rate135 and so far the financial crisis has resulted in low interest rates in countries like
Denmark and Germany, which has benefitted Harboe.
The primary credit risk for Harboe is related to receivables for sales that are not prepaid. However,
Harboe’s customers are mostly large retail chains in Scandinavia, Germany and Estonia, and there is no
significant credit risk relating to a single customer or business partner. Risks related to sales to customers
outside of these countries are being addressed through guaranteeing debt in the form of letters of credit,
bank guarantees and the like136.
To summarize – Harboe’s interest bearing debt has increased, but as Figure 4.11 illustrates, the company’s
capital structure still has a high degree of equity financing. Besides, it is interesting to note how much the
company is leaning on trade. The increasing financial gearing could influence the company’s aim of
ensuring a capital structure that continuously maintains a high level of economic reserve, which allows for
the flexibility to invest in continued organic growth and value creation through acquisitions. On the other
hand, increasing interest bearing debt could be desirable when the SPREAD is positive and due to the tax
shield. However, the change in interest bearing debt does not seem to be motivated by such
considerations. Rather, it seems to be a result of the company’s expansion and improvement of its
production facilities, as well at the acquisition of Gourmet Bryggeriet A/S in 2009. Based on the latest three
years, the increase in mortgage debt and in financial assets is assessed to be an ongoing item. Overall,
however, it is the assessment that the company is not threaten by the development in the capital structure,
due to relatively high equity stake compared to the net interest bearing debt. The biggest challenge is the
fact that suppliers’ willingness to provide credit as well as customers' willingness to pay in advance is
decreasing, cf. the analysis of ATO.
5.0 Budgeting This section builds upon the non-financial value drivers from the strategic analysis combined with the
financial value drivers from the financial analysis. Together, these value drivers constitute the company's
134 Harboe annual report 2010/11, page 97 135 Ibid., p 98 136 Ibid., p. 99

56
operating performance, and the historic level of these key ratios is used to project the future development
when forecasting the budget period.
As discussed under the section about valuation models, the explicit forecast period must be long enough
for the company to reach a steady state where: the company grows at a constant rate and reinvests a
constant proportion of its operating profit into the business each year, the company earns a constant rate
of return on new capital invested, and the company earns a constant return on its base level of invested
capital137. Following this, the free cash flow (FCF) will grow at a constant rate. The theory suggests an
explicit forecast period of as much as 15 years, because it is important that the explicit period includes a
whole business cycle of highs and lows138. But given the fact that Harboe is in an industry that produces
resilient products (short-lived consumer goods) and therefore is a non-cyclic company, other factors are
considered more important.
The chosen explicit budget period is carried out over a five year period with a subsequent terminal period.
The time interval of five years is chosen based on an assessment of Harboe market conditions, which
indicates that following this period the company will reach a steady state with a constant growth rate139.
Moreover, the emphasis is on selecting a time period that is not so long that the forecast value becomes
untrustworthy, but still long enough that the terminal period will not constitute the whole value of the
company. Finally, as discussed under the section on valuation models, Penman (1991), among others,
shows that for a randomly selected sample the abnormal returns converges towards zero after
approximately five years.
Cf. the strategic analysis, especially the development in net sales (volume) and production costs (efficient
production) are assessed to be important to the value creation of Harboe, because this is where the main
sustainable competitive advantage of the company lies. So, given the selected valuation model and the
focus of the profitability analysis, the value drivers listed below are the ones that will be budgeted:
1. Net sales 2. Profit margin (PM) 3. Asset turnover (ATO) 4. Tax rate
Each of the projected value drivers is supported by a discussion founded upon the essentials of the
strategic and financial analysis.
137 Værdiansættelse af virksomheder. Mette Hartzberg 2008: p. 13 138 Koller et al “Valuation”, 2010 p. 258 139 Further explanation is to be found under the discussion of the projected value drivers on the next pages

57
5.1 Net Sales As there is a general decline in beer consumption in Harboe's primary markets, and additionally, the
company is pressured by large competitors that sell their branded products at low prices. But at the same
time, the financial crisis has also led to a shift in consumption patterns towards more off-trade low priced
products, which has been to Harboe’s advantage. By focusing on its core competencies within high volume
low cost production Harboe can consolidate its position in the competitive industry.
In the five years in study, Harboe’s net sale has experienced a varying but positive development with an
average of 2.21% increase. Looking at the last year we see the following improvement:
Figure 5.1: Development in net sales. Source: Harboe annual report 2010/11
Net sales Annual report 2010/11 1,320,653 Annual report 2009/10 1,283,633 Difference 37,020 (+2.89%)
Cf. the internal analysis of resources and competencies, the company goal is to achieve an annual net
revenue growth of 5%, and given Harboe’s acquisition of GB and the potential in the increased demand for
off-trade discount beer the company could actually beat this target in the next couple of years. But due to
challenging market conditions (i.e. a saturated market and high competition), the expected future
development on medium- and long term is that the growth in net sales will decline towards the historic
average and settle at 2% in the terminal period. The expectation of a 2% growth is also founded upon an
average growth rate in GDP over 12 years (1993-2005) of 2.5%140 calculated for Denmark, Germany,
Sweden, and Norway141. A steeper growth than 2.5% in the long run would be unrealistic in that the
company would become the whole economy.
Based on the above considerations the following development in net sales is expected:
Figure 5.2: Forecasted development in sales. Source: Own creation
Period 1 2 3 4 5 Terminal Year 2011/12E 2012/13E 2013/14E 2014/15 2015/16E 2016/17+ Increase in net sales 8% 6% 4% 3% 2% 2%
140 In the article ”Værdiansættelse i teori og praksis – håndtering af vækst” by Ole Sørensen 2008 on page 3 an average GDP growth of 2.5% for the world economy is calculated for the period 2000-2004. 141 Christian Ølgaard. Relevansen af BNP-vækstrater, 2006 (nationalbanken.dk)

58
5.2 Profit Margin In the profitability analysis we saw the following historical development:
2010/11 2009/10 2008/09 2007/08 2006/07
PM 4.55% 3.29% 1.88% 1.25% 4.95%
From the historical development it can be seen that PM has been increasing over the past three years, and
cf. the strategic analysis, Harboe is focusing on innovative R&D, aiming at entering market segments with
higher profit margins. In the most recent company announcement the development is described as positive
in terms of revenue growth and increasing volumes, however, the profit margin it is under pressure, mainly
because of rising raw material prices and high duties that cannot be transferred to the sales price142. Cf. the
analysis of company resources and competencies, Harboe aims at a long-term profit margin of 6-8%, but
due to Harboe’s relatively low brand value, the increasing costs of production, high bargaining power of
customers (B2B – large chains with private labels), and substituting products available to consumers the
selling price is kept at a low. Thus, it is the expectation that, in spite of efforts to avoid this (i.e. investments
in R&D and acquisitions), Harboe’s business will be subject to a low PM going forward. A 5% profit margin is
assessed to be a likely long-term scenario:
Figure 5.3: Forecasted development in PM. Source: Own creation.
Period 1 2 3 4 5 Terminal Year 2011/12E 2012/13E 2013/14E 2014/15 2015/16E 2016/17+ Profit Margin 5% 5% 5% 5% 5% 5%
5.3 Net Operating Assets - ATO The profitability analysis shows that ATO has gone through the following development:
2010/11 2009/10 2008/09 2007/08 2006/07 Net sales 1,320,653 1,283,633 1,319,439 1,137,328 1,189,235 NOA 765,019 755,702 656,817 656,548 630,589 ATO 1.73 1.82 2 1.77 1.88 1/ATO 0.58 0.55 0.5 0.56 0.53
The conclusion from the strategic analysis was that Harboe’s main competitive strategy is high volume
production at low cost, using price as the competitive parameter. This is also the strategy that management
is primarily focused on going forward143.
142 https://newsclient.omxgroup.com/cdsPublic/viewDisclosure.action?disclosureId=497768&messageId=610321 143 Harboe annual report 2010/11, p. 16

59
The numbers show a slight decrease in ATO during the period and from the breakdown of ATO we found
that even though Harboe is strong in its relationship to suppliers, the company is suffering from the high
bargaining power of customers and a limited flexibility in production in relation to fluctuating demand. The
overall impact of these conditions has been an increase in average net trade cycle, which has increased
from 18 to 51 days, influencing the liquidity and solvency of the company.
However, consumption patterns are changing with higher demand for off-trade discount products. This
should be an advantage for Harboe because of its maintained, efficient, and low cost production facilities
and its widespread access to distribution in this segment through local production facilities, sales
subsidiaries and partnership contracts. It is not expected that the company’s market shares will increase
significantly due to the tough competition, but the company may be able to consolidate its position in the
Nordic region and increase sales slightly in Germany and the Eastern European countries. The described
development will create a solid underlying demand for Harboe’s products and help to reduce the risk of
large fluctuations in sales and thus inventories, which ceteris paribus will help management streamline the
company. Given the above, an ATO ratio of two is assessed to be a realistic level going forward.
Figure 5.4: Forecasted development in ATO. Source: Own creation.
Period 1 2 3 4 5 Terminal Year 2011/12E 2012/13E 2013/14E 2014/15 2015/16E 2016/17+ AT0 2 2 2 2 2 2 1/ATO 0.5 0.5 0.5 0.5 0.5 0.5
5.4 Tax rate For an explanation of the chosen tax rate the reader is referred to the section about the WACC and note 19 in appendix 3.
Figure 5.5: Forecasted development in tax rate. Source: Own creation.
Period 1 2 3 4 5 Terminal Year 2011/12E 2012/13E 2013/14E 2014/15 2015/16E 2016/17+ Tax rate 26% 26% 26% 26% 26% 26%

60
5.5 The Budget Based on the forecasted value drivers above the budget is presented in the following figure:
Figure 5.6: Forecasted budget. Source: Own creation.
Budget
Period
0 1 2 3 4 5 Terminal 2010/11 2011/12E 2012/13E 2013/14E 2014/15E 2015/16E 2016/17E+ Growth in net sales
8.00% 6.00% 4.00% 3.00% 2.00% 2.00%
PM before tax
5.00% 5.00% 5.00% 5.00% 5.00% 5.00% Tax rate
26.00% 26.00% 26.00% 26.00% 26.00% 26.00%
Net sales
1,320,653 1,426,305 1,511,883 1,572,358 1,619,529 1,651,920 1,684,958
NOPLAT
60,067 52,773 55,939 58,177 59,922 61,121 62,343
AOH
2 2 2 2 2 2 2 1/AOH
0.5 0.5 0.5 0.5 0.5 0.5 0.5
NOA
765,019 713,153 755,942 786,179 809,765 825,960 842,479 Change i NOA
(51,866) 42,789 30,237 23,586 16.195 16,519
Forecast Net sale = Net sales * growth in net sales Forecast NOPLAT = Net sales * (PM before tax * (1-T))
Forecast NOA = Sales(t+1) / AOH (t)
6.0 Valuation In this section the Discount Cash Flow model is used to value the company. For a closer description of this
model and its applied assumptions, the reader is referred to section 1.3.1 Valuation Models and section 5.0
Budgeting.
As already shown the formula for the free cash flow model is:
����� �� ��� �� ����
�
���� ���� � ��� � �� � � �� ���� � ������
The budget period is discounted at the WACC and the terminal period is discounted at the WACC minus the
expected growth rate (g). Thus, the terminal value is calculated as to perpetuity.
The Free Cash Flow (FCF) can be calculated using the following equation:

61
FCF = C – I
Where C is cash flow from operating activities and I is cash flow in investing activities.
As mentioned, this model is an indirect model, where the value of the company firstly is estimated and
then the value of net financial obligations is subtracted, thereby arriving at the value of the equity. In this
way one can get an idea of the value of the company’s operational activity.
6.1 The WACC
To begin the valuation the WACC, which is a weighted average of the required return on the equity and
debt, is calculated. For Harboe, the capital structure is almost solely constituted by the owners and debt
holders, since minority interests are almost none existing and furthermore because the company does not
use other types of mixed forms of financing.
The WACC is estimated using the following formula144:
� � �� � � � �� �
�� � � � ���
Where
rd = required rate of return (cost) on debt after tax145
re = the owners' required rate of return (on equity)
D = debt share (net financial obligations)
E = equity shar
6.1.1 Long Term Capital Structure
The capital structure shows the ratio of equity to debt measured at market value. Net financial obligations
are measured at fair value, which is used as a best estimate of the market value of debt. The market value
of equity is a more correct measurement of company value compared to the book value, because the
market value contains expectations about the future development. However, using market value presents a
paradox, since the purpose of the whole valuation is to estimate the market value of the equity146.
One way to estimate the long-term capital structure is to base it on the median of comparable companies.
But, since Harboe historically has used a high degree of equity financing, this approach is not considered
optimal.
144 Brealey, Myers and Allen, 2088: p. 242 145 Interests on debt are tax deductible 146 Brealey, Myers and Allen, 2088: p. 245

62
As was shown under the section ‘Risk Analysis’ the financial gearing has increased over the period from
10.08% in 2006/07 to 20.69% in 2010/2011, a development that is due to a period of low profitability. But,
even though debt is rising, the company is still focused on preserving its financial flexibility and the amount
of equity financing is high. Based on this, a target capital structure of 70% equity financing is used.
6.1.2 Estimating the Cost of Debt
The cost of debt is the return debtholders require in order to provide capital. The cost of debt is computed
by taking the rate on a risk free bond (10 year government bond) and then adding a default premium. This
default premium will depend on the overall operational and financial risk of the company, which was
analyzed in the section 4.4 “Risk Analysis”. The after tax cost of debt is calculated using the following
equation:
�� �� � ! �� "� � � � �"�
Where
rd = the after tax cost of debt
Rf = risk free interest rate
Rc = company specific risk premium
Tc = corporate tax rate
6.1.2.1 The Risk Free Interest Rate Theoretically, the risk-free interest rate is equal to the yield on zero-coupon bonds with no liquidation or
reinvestment risk and with maturities that match the time horizon of each of the cash flows to be
discounted147. Since valuation in this thesis assumes that the company continues in the infinite, it would
require an overwhelming quantity of estimates, which would, at best, only increase the accuracy
marginally. An alternative way to measure the risk-free interest rate in Denmark, is the interest rate on a
government bond where the credit risk is little to none. Thus, investors commonly use the rate on a
government bond with 10 years to maturity as the benchmark for the risk free interest rate.
The risk free interest rate is therefore calculated as the return on a government bond with 10 years to
maturity and in April 2011 this rate was equal to 3.27%148.
147 Elling and Sørensen, 2005: p. 51 148 See appendix 5.

63
6.1.2.2 The Company Specific Risk Premium Harboe is a listed company, but it is does not have official credit ratings. Thus, the assessment of the
company specific risk will be grounded on a collective risk assessment based on section 4.4 “Risk Analysis”.
For a closer description of the operational and financial risk, the reader is referred to this section.
As stated, Harboe has a relatively low financial gearing, but as the analysis also shows, financial gearing has
been increasing over the past years. Harboe is in an industry which sells defensive consumer products that
are not too sensitive to high and lows of the economy. However, the company is also subject to high fixed
costs of production and distribution149, and the company’s variable costs are high and increasing due to the
increase in the cost of raw materials and the high and increasing VAT and other duties. So, the overall
decreasing demand combined with the competitiveness of the industry and the high cost of productions
leave only a relatively low PM. Additionally, the financial crisis has influenced the risk appetite of
debtholders leading to more conservative ratings and less liquidity in the market.
Figure 6.1: Overview of rating and risk premium. Source: Petersen et al. “regnskabsanalyse for beslutningstagere”
page 246
AAA AA A BBB BB B
10 years 0.45% 0.54% 0.63% 1.44% 2.55% 3.76%
Based on a common sense observation Harboe is assessed to be at a rating of B in Standard & Poor’s rating
score corresponding to a risk premium of 3.76%150. A B rating is in the upper end of the category “low
credit-quality”, and the company is primarily assessed to be in this lower category due to the special
circumstances of the financial markets and the difficulties in gaining access to liquidity.
The cost of debt has to be adjusted for the tax shield. The corporate tax in Denmark is 25% (2010)151. But
since Harboe has operations in both the Danish market and in foreign markets, the effective tax rate has to
take different rates into account. According to Harboe’s own records, it had the following effective tax
rates:
Figure 6.2: Effective tax rate. Source: Appendix 3 note 19
2010/11 2009/10 2008/09 Average
Effective tax rate 25.20% 26.00% 26.90% 26.00%
149 Heavy industrial production 150 the current rate the company is paying on its debt: NBC = NFE/NFO for year 2010/2011 = 5848/131171 = 4.46% 151 http://www.dr.dk/P1/Detektor/Udsendelser/2011/03/30094037.htm

64
Thus, for further reference a tax rate of 26% is used, and the cost of debt is calculated as:
�� = (3.27% + 3.76%) * (1-0.26) = 5.20%.
Although many of the factors that are used to assess the costs of foreign capital and the required return for
the owners are the same, the risk level for the two types of investors is different. Shareholders have a
higher risk because they have a lower priority on repayment of invested funds in case of bankruptcy.
However, the applied risk-free rate is the same for the calculation of the foreign capital costs and the
required return to owners.
6.1.3 Estimating the Cost of Equity
The cost of equity is regarded as an opportunity cost of capital equal to the return that the owners could
expect to gain from alternative investment opportunities with the same risk.
Often, the CAPM (Capital Asset Pricing Model) is used to estimate the cost of equity. The model looks like
this:
�� � ! � ��#� � � $ �� !� + Premium on non-liquid share
Where
�� = required return on equity
! = risk free interest rate
β = beta, a measurement for the systematic risk of the equity
$= return on the market portfolio
The model is based on different assumptions and one crucial prerequisite for CAPM is that investors are
assumed to have "homogeneous" expectations. This means that investors have the same view regarding
future corporate earnings, growth opportunities, etc. which is not realistic. Despite some of the theoretical
weaknesses of CAPM, it is a widely appreciated tool for estimating the risk-adjusted capitalization rate in
terms of cost of equity.
As can be seen from the equation above, two variables, besides the risk free interest rate, which has
already been calculated, has to be calculated before the required return on equity can be estimated using
the CAPM. These are return on the market portfolio and the beta.

65
6.1.3.1 Market Risk Premium The risk premium is the additional amount required by investors for investing in stocks over risk-free assets
(government bonds). The risk premium is therefore the excess return that investors expect to receive
compared to the risk-free rate. In the above section the risk-free rate is estimated, so here the market risk
premium will be calculated.
According to Elling and Sørensen152 there are three methods to calculate the risk premium:
1. The first approach is to ask a number of investors about their assessment of the risk premium.
According to PriceWaterhouseCoopers (PWC) there has been a more or less constant risk premium
of 4% from 1998 to 2002153. Today PWC uses a risk premium of 5% based ongoing yearly surveys
and analysis154.
Elling and Sørensen argue that this method is the most direct and correct method to attain an estimate of
the risk premium.
2. The second approach is to estimate the risk premium based on historical data. This method
assumes that the expected risk premium is the same as the historical risk premium.
The historic risk premium is thus equal to the average excess return received from investing in stocks
compared to investing in the “risk free” government bond over a given period. The problem with this
approach is that the estimate risk premium will depend on the chosen period and that there is little reason
to believe that history will repeat itself. Besides, in reality the risk free interest rate is not totally risk free,
among other reasons because investors cannot be sure that they can reinvest the ongoing return to the
same rate155.
3. The third approach is to calculate the implicit risk premium based on current rates and
expectations about the future, using for example the residual income model.
The advantage of this method, over the historical approach, is that it provides an estimate of the current
expectations of the risk premium in the market. The disadvantage is that it requires accurate estimates of
market expectations about the expected future cash flows, which is very difficult to estimate.
152 Elling and Sørensen, 2005: p. 52 153 Ebid. 154 http://www.pwc.dk/da/nyt/finance/regnskab/assets/tema-nedskrivning-aarl-dec-2010.pdf 155 http://nationalbanken.dk/C1256BE2005737D3/side/Risikopraemien_paa_aktier/$file/2003_kvo1_ris73.pdf

66
Assessing pros and cons, the first approach is chosen, using the consensus method to determine the
market's risk premium, as it believed to provide the most accurate picture. The risk premium is therefore
presumed to be 5% per annum, so the market's return requirement is Rm = Rf + risk premium = 3.27% + 5%
= 8.27%.
6.1.3.2 Estimating the Beta – Systematic Risk Harboe's systematic risk, the beta-value, expresses the company's specific risk relative to the risk in the
market as a whole. The average market risk of the stock market is therefore adjusted with β to reflect the
company's operational and financial risks. The β-value is a relative risk measure whose interpretation is
shown in the figure below156.
Figure 6.3: Interpreting the β. Source: Elling and Sørensen, 2005: page 53
β = 0 Risk free investment 0 < β < 1 Lower risk than the market portfolio β = 1 Same risk as the market portfolio Β > 1 Higher risk than the market portfolio Beta cannot be observed directly and therefore has to be estimated. There are a number of different ways
in which the company bet can be calculated:
1. By regressing historical data on company return and market yield over a given period157, beta
can be estimated by looking at the covariation of the returns. The problem is that historical
data is used, which means that the analysis will describe past but not necessary future events.
Besides, it is a problem if the company stock is illiquid rendering the analysis imprecise.
2. Another possibility is to make a common sense analysis, where the risk of the company is
assessed and a beta value is deducted.
3. Or, one can use an average of consensus estimates analysis of financials from established
companies such as Reuters, McKenzie, and others.
The first approach and following the guidelines of Koller et al.158 the regression of the data is subject to the
guidelines below:
156 Elling and Sørensen, 2005: p. 53 157 There are no universal rule regarding the length of the measurement period or the frequency of observations (days, weeks, months) 158 Koller, Goedhart, and Wessels, 2010: p. 246-249

67
- The measurement period includes 60 (actually 59 – one was an outlier) data points. The regression
is based on monthly returns (five years), because using more frequent return periods (weekly or
daily) leads to systematic biases.
- The calculation is based on the historic covariation of the company’s return with the market return.
The return is calculated based on the "Total Return Index", which unlike regular price series,
includes reinvestment of dividends and therefore gives a more accurate picture of the real return
of the share- and marked portfolio.
- As market portfolio, the OMX CPH 20 INDEX is used. It could, however, be argued that the Danish
index is biased toward the pharmaceutical industry thus not yielding a measurement of market-
wide systematic risk. But, as seen below the regression output is supported by other estimates and
adjusted for industry specific characteristics. The Danish index is therefore assessed to be a
sufficient explanatory variable.
To regress the statistics the data service provider Bloomberg is used yielding the following output:
Figure 6.4: calculating the β value for Harboe. Source: cbs.libcal.com/booking/thebloombergroom
The correlation coefficient R2 shows that 27.5% of the variation in the return of Harboe is explained by the
variation in the return of OMX CPH 20 INDEX and the t-Test shows that the result (explanatory power) of

68
the regression is significant. However, an explanation degree of 27.5% is not too high, which indeed
indicates that other factors than the movement in the market, has an influence on the company’s risk.
As can be seen, the raw beta is estimated to be 0.679. The level of the raw beta is further supported by
calculations conducted in Datastream, which can be seen in appendix 6. The Bloomberg estimate is
improved by using industry comparables and smoothing techniques, yielding an adjusted beta of 0,786, a
value that is also supported by company and industry beta published by Reuters, which can also be found in
appendix 5. Thus, this will be the beta value used going forward.
6.1.3.3 Estimating the Premium on Non-liquid Share The company is considered to be illiquid based on its relative limited circulation and depth of stock trading
on the Small Cap index, compared to the most liquid shares in the C20 index159. It can thus be difficult and
expensive for shareholders to sell large quantities of shares without losing money due to the decline in
price, which results from an increase in supply relative to demand. Further, as discussed in section 2.2
“Ownership Structure” and the share split in to A- and B shares induces asymmetry in the control structure.
As a consequence the investors who do not have an influence on the decision process might want to be
compensated through a higher return on investment.
In practice, the estimated compensation is based on a subjective assessment and is therefore subject to
significant uncertainty. Several studies show that when transferring a non-controlling interest the
deduction is often in the range of 15% -40% of the calculated value of equity160, and a survey by PwC
(2001)161 estimates that the premium should be between a half and five percent. Based on the above, a
premium on non-liquid share of 2% is added to the cost of equity.
Using the CAPM, the required return on equity is calculated as:
�� � %&'()� ���&(*+� � �*&'()� �%&'()� � ') = 9.2%
159 http://www.nasdaqomxnordic.com/aktier/shareinformation?Instrument=CSE3351 and http://www.nasdaqomxnordic.com/index/index_info?Instrument=DX0000001376 160 Værdiansættelse af virksomheder. Mette Hartzberg 2008: p. 15 161 Værdiansættelse – Et overblik over modeller til værdiansættelse. Petersen & Plenborg 2003: Page 33

69
6.2 Calculating Company Value Now that we have all the necessary information the WACC is calculated using the formula:
� � %��� � ,&')� (�
�� � -&') � *)
And this is the rate that is used in DCF calculations below:
Figure 6.5: Calculating the value of company equity using the Discounted Cash Flow Model
Discounted Cash Flow Model162 Period
0 1 2 3 4 5 Terminal
DKK 1000 2010/11 2011/12E
2012/13E
2013/14E
2014/15E
2015/16E
2016/17E+
NOPLAT
52,773 55,939 58,177 59,922 61,121 62,343 NOA
713,153 755,942 786,179 809,765 825,960 842,479
Change in NOA
(51,866) 42,789 30,237 23,586 16.195 16,519 FCF
104,639 13,150 27,940 36,336 44,926 45,824
PV budget period 187,626 PV terminal value 519,784 Company value 707,410 Value NFO
(131,171)
Value equity 576,239 Number of shares 6000 Share price on
the 30-04-2011 96
FCF = NOPLAT- Change in NOA
6.2.1 Control of the DCF-Model In order to ensure that the correct figures are used in the DCF-model, the company is also valued using the
Residual Earnings Model, which can be found in appendix 7. Like the DCF model, this model calculates the
value of the equity and if the theoretical assumptions are fulfilled, the two models will give the same result.
We see that this in fact is the case, which supports the assumption that there have been no technical
mistakes in implementing the DCF model.
However, the residual earnings model is anchored in the book value of NOA adjusted for the discounted
value of expected future residual earning, where residual earnings are earnings above the required rate of
return. The information output of this model is therefore different, in that it illustrates if the company is
162 Figures below have been rounded up

70
creating or destroying value for its shareholders within a given period. Conversely, the model does not
provide any information about the company’s liquidity situation163. Looking in appendix 7 we see that the
company is actually destroying value in the budget- and terminal period, which is also evident from the fact
that the company value is smaller than NOA/Invested Capital.
6.2.2 Valuing Harboe Farm using the P/E Multiple So far the subsidiary Harboe Farm has been removed from the analysis because this is a company that is in
liquidation. On page 5 of management report in Harboe’s annual report 2010/2011 it is stated that:
“At Harboe we have continuously assessed the strategic potential in the food business, which
has been subject to intense competition and high price pressures. Based on this assessment, we made the
final decision to close down activities. We have rented out the production facilities, so this part of the
business will henceforth be considered a rental business. Now, we will focus all our attention on the
continued development of the brewing company.”
But the subsidiary might still be of some value to Harboe and in order to evaluate this, a brief analysis of
the subsidiary is conducted below:
P/E expresses the price an investor would pay for one crown of profit after tax (net result) of company
activities and a low P/E ratio therefore means a cheaper company share. Using the price/earnings (P/E)
ratio is widely recognized as a “quick and dirty” way of valuating a company by comparing it to its peer
group. A key assumption following the use of the P/E ratio is, however, that the companies that are
compared have the same characteristics regarding financial and operational risks, same expected growth,
and same accounting policies164. In reality, however, it is close to impossible to find two companies that
have exactly the same characteristics and this is therefore a source of bias.
The valuation of Harboe Farm A/S will be based on an average calculated P/E value of three competitors:
Läntmänn Danpo A/S, Hanegal A/S, and Danish Crown. These companies are selected based on the
subjective assessment, that they are the most relevant and most comparable competitors, even though
they vary to some degree in size and core activities. Because of Harboe Farm's very limited impact on the
Group’s performance165 a detailed analysis and description of competitors is not carried out. For more
information about the competitors the reader is referred to the annual reports from the different
companies.
163 Problemer med bestemmelse af terminalværdi – og anden kritik af DCF-modellen. Rune Møller 2006: p. 4 164 Køb og slag af virksomheder (article collection), 2011: p. 307 165 Looking in note 3 of the annual reports from 2008/09, 2009/10, and 2010/11we see that net profit equals respectively DKK (thousands) 3902, 149, and 3155. These amounts constitute a very small part of the Groups result.

71
Since the peer group companies are not listed, the book value of equity in the year 2010166 is used as a best
estimate of the market value of the company. The estimated value of the equity of Harboe Farm is
obtained by multiplying the competitors' average P/E value with the food company's profit after tax in the
accounting year 2010/11.
Figure 6.6: P/E Multiple of Peer Group. Source: Own creation
Company Danpo167 Hanegal168 Danish C.169 Average Harboe Farm
Equity (P) 10422 mill 4.016 mill 3940 mill
NOPLAT (E) 725 mill 0.667 mill 1164 mill 3.155 mill
P/E 14.3 6.0 3.4 7.9
So the estimated value of Harboe Farm’s equity is:
%&,, � (&- � '.&-'�/011023��44
Given that the value of Harboe was calculated to be 576.239 millions it is obvious that the subsidiary only
constitutes a very small part of Harboe’s value.
6.2.3 Benchmarking Against Actual Share Price Through the strategic and financial analysis and valuation a share price of DKK 96 for Harboe on the
29.06.2011 is calculated. Adding the estimated value of the subsidiary Harboe Farm, the share price is
estimated at DKK 100.2. The actual closing price on the 29.06.2011 was 115 DKK170 and thus, the estimated
theoretical price is 12.87% lower.
The Residual Earnings calculation supported the DCF calculation and further indicated that the company is
in fact destroying value for its shareholders. The key issue seems to be the return on equity, which
constitutes a substantial part of the WACC, where the company is unable to yield a high enough ROIC to
match the required rate of return.
Of course the low estimation could also be due to a too pessimistic forecast of the value drivers, deducted
from the strategic analysis and the financial valuation. Miscalculation could occur due to lack of disclosure
from the company or lack of overview by the one analyzing the company. So, as an extra way of checking
166 The three companies annual accounting follow the calendar year unlike Harboe 167http://lantmannen.com/Global/lantmannen_com/Dokument/ekonomiska%20publikationer/English/LM_bokslut_2010_ENG.PDF 168 http://www.proff.dk/regnskab/hanegal-as/silkeborg/-/1009858160/ 169 http://avis2010.danishcrown.dk/page24040.aspx 170 http://investor.harboes.dk/stocklookup.cfm

72
the “sanity” of the estimated value, multiple analysis of the whole company will be conducted in the
following.
6.2.4 Multiple Analysis of Harboe The purpose here is to use the relative valuation method to ensure that the estimated value, using the
capital-based valuation models, does not differ significantly from comparable companies. The basic idea is
the same as described above in the multiple analysis of the subsidiary Harboe Farm and again, despite the
problems associated with finding exactly comparable companies, it is chosen not to correct peer group
trading multiples in relation to company-specific differences. This is decided because the multiple analysis
is used only to verify the value estimate from the more detailed DCF model.
The selected peer group for Harboe consists of listed companies on which financial ratios are easily
available in for example Børsen171. By assuming that the multiple for Harboe should be on the same level as
competitors', a rough estimate of the value can be obtained by multiplying the average P/E ratio for
competitors with Harboe's budgeted profit for the year ahead.
Figure 6.7: P/E Multiple of Peer Group. Source: Own creation
Carlsberg Royal U Heineken Average
P/E 11.98 10.1 12.66 11.58
Now, to estimate the value, the average P/E ratio of Peer Group is then multiplied by the budgeted NOPLAT
for Harboe in 2011/12:
�� � &,* � �,'&((%�/011 � +&�/011023
As discussed, there may be many reasons why Harboe should not be traded at the same multiple as its peer
group. In particular, two of the three comparable companies (Heineken and Carlsberg) are significantly
larger global companies that have a greater exposure to emerging markets and potentially more synergies
yet unrealized. Furthermore, there is a tendency among investors to pay a premium for size because of
diversification effect and the like.
However, through the DCF calculation the value of the equity was estimated at 576.239 million and the
multiple analysis thus yielded a result that is “only” 6.05% higher. The result of the multiple analysis
therefore supports the reliability of the DCF analysis.
171http://borsen.dk/kurser/virksomhedsside (Year 2011)
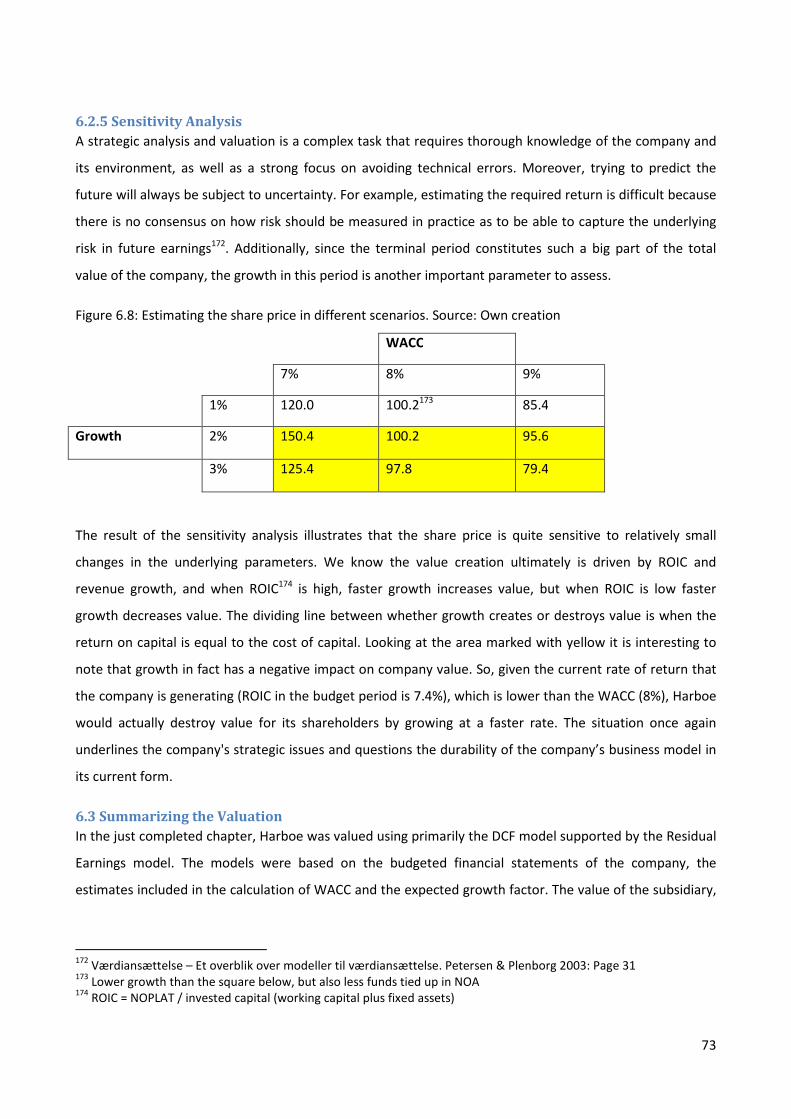
73
6.2.5 Sensitivity Analysis A strategic analysis and valuation is a complex task that requires thorough knowledge of the company and
its environment, as well as a strong focus on avoiding technical errors. Moreover, trying to predict the
future will always be subject to uncertainty. For example, estimating the required return is difficult because
there is no consensus on how risk should be measured in practice as to be able to capture the underlying
risk in future earnings172. Additionally, since the terminal period constitutes such a big part of the total
value of the company, the growth in this period is another important parameter to assess.
Figure 6.8: Estimating the share price in different scenarios. Source: Own creation
WACC
7% 8% 9%
1% 120.0 100.2173 85.4
Growth 2% 150.4 100.2 95.6
3% 125.4 97.8 79.4
The result of the sensitivity analysis illustrates that the share price is quite sensitive to relatively small
changes in the underlying parameters. We know the value creation ultimately is driven by ROIC and
revenue growth, and when ROIC174 is high, faster growth increases value, but when ROIC is low faster
growth decreases value. The dividing line between whether growth creates or destroys value is when the
return on capital is equal to the cost of capital. Looking at the area marked with yellow it is interesting to
note that growth in fact has a negative impact on company value. So, given the current rate of return that
the company is generating (ROIC in the budget period is 7.4%), which is lower than the WACC (8%), Harboe
would actually destroy value for its shareholders by growing at a faster rate. The situation once again
underlines the company's strategic issues and questions the durability of the company’s business model in
its current form.
6.3 Summarizing the Valuation In the just completed chapter, Harboe was valued using primarily the DCF model supported by the Residual
Earnings model. The models were based on the budgeted financial statements of the company, the
estimates included in the calculation of WACC and the expected growth factor. The value of the subsidiary,
172 Værdiansættelse – Et overblik over modeller til værdiansættelse. Petersen & Plenborg 2003: Page 31 173 Lower growth than the square below, but also less funds tied up in NOA 174 ROIC = NOPLAT / invested capital (working capital plus fixed assets)

74
Harboe Farm, was calculated using P/E Multiple analysis and the value was added to the capital based
valuation model.
Using both models the price of Harboe’s share was estimated at DKK 100.2, which support the assumption
that no technical errors were made in estimating the value. As a further “sanity check” of the estimates,
Harboe was valued by comparing it to its peer group using multiple analysis. The value estimated was
“only” 6.05% higher again supporting the strength of the analysis. However, the calculated value of DKK
100.2 was 12.87% lower than the actual value on the 29.06.2011 demonstrating the fact that Harboe is
overvalued. The findings were supported by the Residual Earnings model, which showed that the company
was actually destroying value at its current cost of capital.
By changing the underlying parameters, the WACC and the growth in the terminal period, the model's
sensitivity was tested. The results showed clearly that the value of the company’s share is largely
dependent on developments within these parameters. In addition, the findings also stressed the fact that
at the current ROIC the company would destroy value for its shareholders by growing at a faster rate.
7.0 Conclusion The aim of this thesis was to estimate the value Harboe Brewery A/S from the perspective of the investor.
Specifically this was done by valuing the company's equity per 29.06.2011 and in doing so, the challenge
was to clarify the company’s strategic and financial situation as to be able to forecast the future
development in operations.
The strategic analysis was done in order to understand the company’s surroundings on society- and
industry level, as well as the internal business model of the company. Summarizing the essentials of the
strategic analysis the findings were as follows:
On society level the company is challenged by an overall decrease in beer consumption, changing patterns
of beer consumption, higher prices of agricultural products, and increasing labor costs and tax burden.
Most of these factors are deemed bad news for the company, but change in consumption from on-trade to
off-trade and from premium labels to discount labels also constituted some potential for the company.
On Industry level the analysis showed the advantage of high cost barriers of entry for new competitors, but
that existing competition is though, with large dominating participants on all markets. Also, increasing input
costs and high bargaining power of customers and consumers has inflated the cost of brewing and
increased the need for operational efficiency and execution.

75
Looking at the company, Harboe's core business involves the production and sale of discount beer and soft
drinks to retail trade. The company follows a generic strategy of cost minimization and generates its
revenue by producing and selling large quantities at a low cost. Compared to the largest competitors,
Harboe’s investments in branding and product development is very limited and Harboe is primarily
competing on price. So, using price as the competitive parameter means that Harboe has a low profit
margin per unit sold, and this makes the company’s return on investment highly dependent on keeping
costs of production down. Thus, the primary risk lies in the sensitivity in relation to the fluctuations in the
prices of raw materials and other inputs. To increase its sales and improve the PM, thereby limiting its
dependency on input prices, the company has increased its exposure to growth markets and focused more
on R&D and branding. But, this development is still in its early stages and constitutes only a small part of
the company’s business.
The financial analysis was done in order to highlight trends within the company’s accomplished results. The
findings of the financial analysis were the following:
Over the analyzed period the company’s RNOA was showed to be quite variable. From a very low in
2007/08 it improved during the period, however, without ending up at an impressive level. As one of the
explanatory variables constituting the RNOA, the PM showed a similar tendency by increasing over the
period, but still settling at a low level. Looking further into the factors determining the PM, the increase in
PM sales was mostly due to a better margin on gross profit because prices of raw materials were
decreasing slightly after the peak in 2007/08. This further supported the postulation that high raw material
prices is the primary challenge for Harboe.
Constituting the other part of RNOA, ATO showed a more stable, yet, still relatively low level. From the
breakdown of ATO it was apparent that, even though Harboe is strong in its relationship to suppliers, the
company is suffering from high bargaining power of customers and limited flexibility in production in
relation to fluctuating demand. The overall impact of these conditions has been an increase in average net
trade cycle, influencing the liquidity and solvency of the company. Additionaly, by including the financial
leverage of the company the ROCE was estimated. Here we saw a vast improvement over the three last
years, from a very low return in 2007/08 to a solid return in 2010/11. The source of improvement came
from the SPREAD, which went from negative to positive. This was assessed to be due to the improved
conditions of the financial markets over the period.
To further strengthen the analysis, the company’s financial condition was looked at in order to evaluate the
financial health of the company and the degree of risk with which it is operating. The analysis showed that

76
the company has a solid capital structure and a low exchange rate risk, and that management is solely
focused on managing and reducing the risks that are a result of company operations.
Overall, the analysis of the financial drivers supported the conclusion from the strategic analysis,
exemplifying a company with low financial risk, which manages efficient low cost production and a solid
distribution network. Thus, the company has a streamlined activity and a solid position in its mature core
markets. However, as the analysis also showed, the company is subject to difficult market conditions and
therefore having a hard time creating value.
Combined, the conclusions of the strategic- and financial analyses were used to establish a budget and a
terminal period forecasting the future development in key items. Given the described circumstances, the
budget turned out to be a quite reservedly forecast regarding the expected future value creation of the
company. Using the forecasted budget and terminal period the valuation was conducted by discounting
future free cash flows by the WACC for the company and as a control for technical deficiencies the
calculations were checked using the residual earnings model. The value of the subsidiary Harboe Farm,
which is in liquidation and therefore was removed from the analysis, was then calculated using the P/E
multiple approach and added to the value of Harboe. As a “sanity check” the company value was also
calculated by comparing it to its peer group using multiple analysis and the result supported the result of
the capital based model.
The valuation returned a theoretical share price that was 26.75% lower than the actual price on the given
date thus postulating that the share is overvalued. The result was exemplified by the residual earnings
model which yielded a negative return over the whole budget period, meaning that the company’s return
on invested capital is lower than the required return on capital. To test the sensitivity of the estimate the
WACC and terminal growth was adjusted to different scenarios. The results again underlined that the
company, at its current condition, is destroying value since higher projected growth lead to an even larger
decrease in share value. Consequently, the Harboe´s overall strategy of cost minimization no longer seems
to represent any sustainable competitive advantage. The fierce price competition from competitors' brands
combined with the high cost of production and distribution is diluting earnings and has motivated the
company to try and move into the less price-sensitive segment of branded products. However, the
company is far behind in these segments and the competition is tough. The development has increased the
operational risk of Harboe and the debts proportion of the capital structure is increasing.
In summary, Harboe appears to have a strong position in its core area where it can supply a basic demand
going forward. The company’s business model, however, does not hold great potential for growth and
abnormal value creation and at the current outlook Harboe is overestimated.

77
8.0 Perspective Finally, this section is used to highlight minor deficiencies and possible sources of improvement within the
thesis.
Since the valuation basically is based on a prediction of the future, inherently, the conclusions are subject
to a degree of uncertainty. The uncertainty has been attempted reduced through a thorough collection of
the information available in the market, but this effort will to some degree be limited by the complexity of
the task and the asymmetric characteristics of the information flow175 .
A condition that could potentially have limited the asymmetric information further would have been access
to internal sensitive information from the company regarding quantitative market data and internal
company operations. Moreover, it could have been interesting to interview selected industry analysts on
elements such as the estimated budget assumptions (projected development in value drivers), the
company specific risk premium, the beta, and the estimation of the value of the subsidiary Harboe Farm.
Harboe’s human resources department was contacted with the request of gaining access to additional
information, but this effort unfortunately proved unsuccessful.
The valuation of Harboe Brewery A/S was made as per 29.06.2011 and thus new information after this date
was not included in the estimation. Subsequently, the annual report for the year 2011/12 has been
published and this has not changed the basic prerequisites of the assignment. Looking at the actual
subsequent development in the company's share price, this development supports the project conclusion:
namely that the company was overvalued at the given date.
175 Depending on one’s stakeholder interest one can have more or less access to essential information

78
9.0 Bibliography
Books:
Jens O. Elling, Ole Sørensen
Regnskabsanalyse og værdiansættelse – en praktisk tilgang, 2. udgave
Gjellerup
Ib Andersen
Den skindbarlige virkelighed – vidensproduktion indenfor samfundvidenskaberne, 3. udgave
Forlaget Samfundslitteratur (2006)
Koller, Goedhart, Wessels (KGW)
Valuation, measuring and managing the value of companies, 5. edition
John Wiley & Sons, INC,
Wild John, Subramanyam K.R. Halsey Robert
Financial Statement Analysis
McGrawHill
Petersen Christian V., Plenborg Thomas
Regnskabsanalyse for beslutningstagere, 1. udgave (2005)
Forlaget Thomson
Brealey, Myers, Allen
Principles of Corporate Finance, 9. edition
McGrawHill
Ross, Westerfield, Jordan
Corporate Finance Fundamentals, 7. edition
MCGrawHill
Hans-Henrik, Søndersted-Olsen
Marketing Håndbogen – fra strategi til kampagne, 2. udgave
Forlaget Samfundslitteratur

79
Salvatore
Managerial Economics – in a Global Economy, 5 edition
Thomson South-Western
Articles:
Værdiansættelse – Et overblik over modeller til værdiansættelse. Petersen & Plenborg 2003
Problemer ved bestemmelse af terminalværdi – og anden kritik af DCF-modellen. Rune Møller, 2006
Værdiansættelse i teori og praksis – håndtering af vækst. Ole Sørensen 2008
Værdiansættelse af virksomheder. Mette Hartzberg 2008
Increasing the Excise Duty on Beer. Penny Wise, Pound Foolish’, Ernst & Young and Regioplan, Amsterdam (2008)
Cortissoz, A., With fewer hops, prices jump, The Boston Globe, 9 January 2008
Christian Ølgaard. Relevansen af BNP-vækstrater, 2006
Euromonitor International “Beer in Germany”, February 2008
Barth-Haas group, The Barth Report (2007/2008)
Database Central Europe, Rapid increase in labour costs in Central and Eastern Europe in 2008, 19 January 2009
Articles from Børsen
- http://borsen.dk/nyheder/sundhed/artikel/1/115151/billige_bajere_taber_til_dyre_draaber.html
- http://borsen.dk/nyheder/privatoekonomi/artikel/1/163536/bryggerier_maerker_jagten_paa_en_billig_brandert.html
Internet:
www.harboes.dk
www.bryggeriforeningen.dk
www.brewersofeurope.org
www.carlsberg.dk
www.royalunibrew.dk
www.ab-inbev.com
www.nasdaqomxnordic.com

80
www.sabmiller.com
www.statistikbanken.dk
www.netto.dk
www.reuters.com
www.bloomberg.com
www.proinvestor.com
www.Hanegal.dk
www.Danishcrown.dk
www.Lantmannen.dk
Annual reports from:
Harboe Bryggeri Harboe Farm Carlsberg Anheuser-Buschs Royal Unibrew
Sabmillers Hanegal Danishcrown Lantmannen Data from: Datastream Bloomberg Euroinvestor Reuters

81
Appendix 1: Structure of Assignment
Introduction, Problem Formulation, Assignment
Structure, Methodology, and Delimitations
Presentation of Harboe and its Markets
Strategic Analysis
Budget Period
Valuation
Conclusion
Perspective
Finacial Analysis
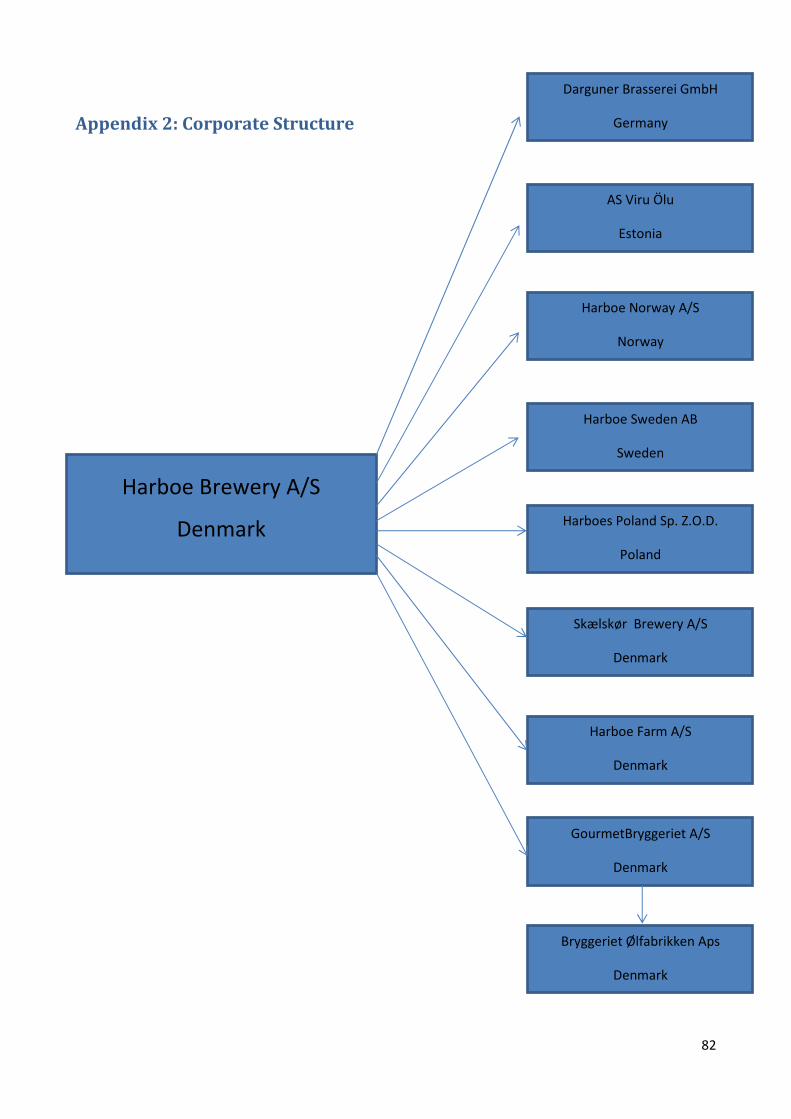
82
Appendix 2: Corporate Structure
Harboe Brewery A/S
Denmark
Darguner Brasserei GmbH
Germany
AS Viru Ölu
Estonia
Harboe Norway A/S
Norway
Harboe Farm A/S
Denmark
Harboe Sweden AB
Sweden
Harboes Poland Sp. Z.O.D.
Poland
Skælskør Brewery A/S
Denmark
Bryggeriet Ølfabrikken Aps
Denmark
GourmetBryggeriet A/S
Denmark

83
Appendix 3 - Reformulated Financial Statements and Associated Notes.
Reformulated balance sheet for Harboe 2006/07 - 2010/11
DKK 1000
2010/11 2009/10 2008/09 2007/08 2006/07 Notes
Operating Assets Goodwill
3,573 3,573 0 0 0
Development projects
433 1,572 2,274 0 0 Rights
5,719 5,707 5,712 5,723 0
Software
7,920 4,881 1,332 320 0 Intangible assets under
construction 5,764 688 2,068 289 0 Intangible assets 23,409 16,421 11,386 6,332 0
Land and buildings
337,159 331,848 319,406 329,773 301,666 Plant and machinery
456,073 447,406 405,989 401,417 360,277
Other plants, tools and equipment 38,665 41,206 36,246 44,096 45,375
Spare parts for own machinery 3,993 3,887 4,210 4,707 5,298 Tangible assets under
construction 36,083 33,247 35,338 13,216 122,381 Investments in associates
0 0 0 0 0 1
Tangible assets 871,973 857,594 801,189 798,209 834,997 2 Deferred tax assets
886 1,299 1,575 2,093 0 3
Inventories
138,250 122,211 118,468 114,645 102,023 Trade receivables
301,676 304,155 267,427 237,393 218,858 4
Other receivables
10,306 3,964 43,929 10,853 19,604 5 Accruals
7,977 7,219 8,393 9,274 3,104
Assets held for sale
0 0 0 0 0 6
Total operating assets 1,354,477 1,312,863 1,240,981 1,172,467 1,178,586 Total operating assets adjusted 1,197,310 1,162,846 1,086,536 1,025,053 1,005,850 13
Operating liabilities Deferred tax liabilities
37,861 33,555 39,580 37,776 51,081 3
Accruals (long and short)
64,411 69,367 72,281 54,401 47,247 7 Suppliers of goods and services 216,388 187,556 200,136 186,087 213,100
Repurchase obligation, returnable pac. 27,958 33,350 35,673 36,298 31,489
Other debt
102,641 100,526 105,678 71,913 61,674 8 Company tax
20,609 16,372 14,530 17,060 30,416
Liabilities rel. to assets held for sale 0 0 0 0 0 6

84
Total operating liabilities 469,868 440,726 467,878 403,535 435,007 Total operating liabilities adjusted 432,291 407,144 429,719 368,505 375,261 13
Net operating assets (invested capital) 884,609 872,137 773,103 768,932 743,579 NOA adjusted (invested capital) 765,019 755,702 656,817 656,548 630,589 13
DKK 1000
2010/11
2009/10
2008/09
2007/08
2006/07 Notes
Equity Equity of parent company shareholders 633,639 613,894 547,987 583,321 572,415 13
Equity attributable to minority interests 209 191 190 242 414 12 Total Equity 633,848 614,085 548,177 583,563 572,829
Financial obligations Mortgage debt - long
253,402 290,920 317,441 23,112 25,501 Mortgage debt - short
36,656 26,377 5,682 5,559 9,061
Credit institutions, other - long 0 0 1,185 3,439 9,173 11 Credit institutions, other - short 169,124 154,340 135,436 60,196 29,722 11 Debt to associates
0 0 0 0 0 1
Derivative deviations
-26 -548 -527 -4804 33,646 14 Total financial obligations 459,169 471,363 459,503 89,904 90,280
Fiancial assets Financial assets available for sale 285,782 283,738 288,768 2,461 3,047 9
Deposits, leases
2,303 2,234 2,186 2,148 2,113 9 Receivables from associates
0 0 0 0 0 1
Liquid holdings
39,913 43,774 59,864 12,310 27,360 10 Total financial assets 327,998 329,746 350,818 16,919 32,520
Net financial obligations 131,171 141,617 108,640 72,985 57,760
Invested capital (Equity + NFO) 765,019 755,702 656,817 656,548 630,589

85
Reformulated income statement for Harboe 2006/07 - 2010/11
DKK 1000 2010/11 2009/10 2008/09 2007/08 2006/07 Notes
Net sales 1,320,653 1,283,633 1,319,439 1,137,328 1,189,235 15Production costs (895,011) (906,081) (971,121) (830,230) (829,496) 16 & 17Gross profit 425,642 377,552 348,318 307,098 359,739Distribution costs (175,442) (163,766) (168,578) (150,910) (147,375) 17Administration costs (46,631) (41,155) (38,183) (34,218) (33,733) 17Other operating income 18,281 18,343 19,403 14,768 18,120 17 & 18Other operating costs (9,653) (7,005) (6,662) (7,045) (7,167) 17 & 18Income from investments in associ. 0 0 0 0 0 1Operating income from sales (EBITDA) 212,197 183,969 154,298 129,693 189,584Depreciation and amortization (130,188) (125,719) (118,181) (109,102) (101,144) 17Operating income (EBIT) 82,009 58,250 36,117 20,591 88,440Tax on operating income (21,942) (15,966) (11,333) (6,349) (29,615) 19Operating income after tax (NOPLAT) 60,067 42,284 24,784 14,242 58,825Income from investments in assoc. 0 0 0 0 0 1Dirty surplus 4,347 2,082 (23,505) -55 -487 20Adjusted tax from previous years 0 0 0 0 0 19Total operating income 64,414 44,366 1,279 14,187 58,338Financial income 4,981 11,180 18,285 861 865Financial expenses (10,829) (13,944) (25,553) (7,444) (3,964)Tax shield from net financial items 1,520 719 1,890 1,712 806 19Total financial expense 4,328 2,045 5,378 4,871 2,293Comprehensive income (all) 60,086 42,321 (4,099) 9,316 56,045Minority interest 18 1 -52 -45 -8Comprehensive income (to common) 60,068 42,320 (4,047) 9,361 56,037

86
Items that are not referred to in the notes, has not been reformulated and the value of these
items has therefore not changed. Notes used for reformulating the financial statements are just
named “note” followed by associated number. Other references to notes in the official annual
reports are named “note R” followed by the correct number.
Balance sheet:
1. Investments in associates
Based on the Annual Report 2010/11 note R1 “accounting policies”, it is estimated that
equity investments are investments in operations of other companies, and so they are
classified as operating assets. However, associates are only affiliated to Harboe Farm A / S,
which has been eliminated in the reformulated accounts.
Receivables from associates
Reformulated equity statement for Harboe 2006/07 - 2010/11
DKK 1000 2010/11 2009/10 2008/09 2007/08 2006/07 Notes
Equity beginning 730,250 664,463 696,947 685,819 677,403Equity end 753,438 730,250 664,463 696,947 685,819Increase in Equity 23,188 65,787 (32,484) 11,128 8,416
Explanation
Dividends (9,000) (9,000) (9,000) -9000 (48,000)Yield of treasury shares 526 160 75 75 400Stock repurchased (33,338) 0 (25,675) 0 0Stock issue 0 29,516 0 0 0Transaction with shareholders (TwS) (41,812) 20,676 (34,600) (8,925) (47,600)
Net income incl. MI 60,653 43,029 25,621 20,108 56,503Dirty surplus 4,347 2,082 (23,505) -55 -487 20Comprehensive income (CI) 65,000 45,111 2,116 20,053 56,016 21
Equity end (Eq. Beg. - TwS + CI) 753,438 730,250 664,463 696,947 685,819
Equity beginning adjusted for Harboe Farm 610,451 544,664 577,148 566,020 557,604 13Equity end adjusted for Harboe Farm 633,639 610,451 544,664 577,148 566,020 13

87
It is not clear from records whether the item is operational or financial nature. This item is
not significant and is assessed to be financial asset, but removed from the reformulated
balance sheet.
Debt to associates
This is a financial obligation, but also referring to Harboe Farm A/S and therefore removed
from the reformulated balance sheet.
Income from investments in associates
Found in the income statement, referring to Harboe Farm A/S and thus removed in the
reformulated income statement.
2. Tangible assets
Cf. note R16, tangible assets are adjusted for depreciation and amortization.
3. Deferred tax assets and liabilities
These items arise from accounting differences in calculating the operating income
component of taxable income and reported book income. They are classified under
operating assets and liabilities.
4. Trade receivables
Referring to note R19 it is not indicated whether this item is financial or operational. The
item is assessed to be trade notes bearing no interest, and is therefore classified as an
operational asset.
5. Other receivables
Cf. note R20 and note R19 these are also categorized as operational assets.
6. Assets held for sale and liabilities related to assets held for sale

88
Cf. noteR21 assets and liabilities for this item is related to operation and therefore
classified as operating assets and liabilities. However the two entries almost cancel each
other, and are assessed to be transitory. The items are therefore eliminated from the
reformulated balance sheet.
7. Accruals
This item consists of a long-term component and a short term component. No information
is given in the notes and these two line items are therefore summarized to one item under
operating liabilities.
8. Other debt
Referring to note R31, this item consists of owed pay, vacation pay, income tax, social
contributions, owed VAT and excise and other owed costs. This item is classified as an
operating liability even though other owed costs, which represent more than 50% of the
cost, are not specified and therefore not identifiable.
9. Financial assets available for sale and Deposits, leases
Financial assets are classified in note R1 as: Financial income includes interest income and
expenses, realized and unrealized gains and losses on securities, debt obligations and
transactions in foreign currencies, amortization / deductions for mortgages, etc., and
surcharges and refunds under the tax regime.
Financial assets available for sale consist of listed shares, listed bonds and unlisted shares.
Deposits, leases are not specified in the notes but this item is of an insignificant size.
This is interest-bearing accounts that are not a part of the primary operations, and
therefore categorized under financial assets.
2010/11 2009/10 2008/09 2007/08 2006/07
Accruals - long 54,832 61,088 63,627 44,335 38,275Accruals - short 9,579 8,279 8,654 10,066 8,972Accruals - total 64,411 69,367 72,281 54,401 47,247
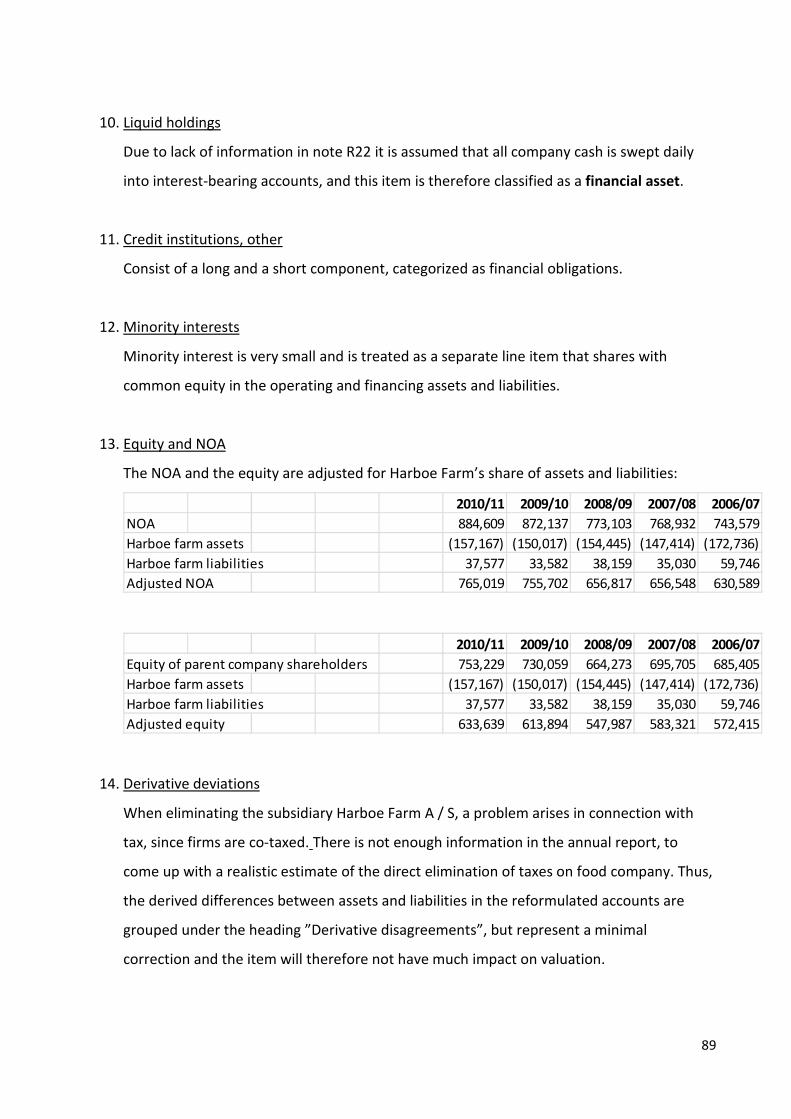
89
10. Liquid holdings
Due to lack of information in note R22 it is assumed that all company cash is swept daily
into interest-bearing accounts, and this item is therefore classified as a financial asset.
11. Credit institutions, other
Consist of a long and a short component, categorized as financial obligations.
12. Minority interests
Minority interest is very small and is treated as a separate line item that shares with
common equity in the operating and financing assets and liabilities.
13. Equity and NOA
The NOA and the equity are adjusted for Harboe Farm’s share of assets and liabilities:
14. Derivative deviations
When eliminating the subsidiary Harboe Farm A / S, a problem arises in connection with
tax, since firms are co-taxed. There is not enough information in the annual report, to
come up with a realistic estimate of the direct elimination of taxes on food company. Thus,
the derived differences between assets and liabilities in the reformulated accounts are
grouped under the heading ”Derivative disagreements”, but represent a minimal
correction and the item will therefore not have much impact on valuation.
2010/11 2009/10 2008/09 2007/08 2006/07NOA 884,609 872,137 773,103 768,932 743,579Harboe farm assets (157,167) (150,017) (154,445) (147,414) (172,736)Harboe farm liabilities 37,577 33,582 38,159 35,030 59,746Adjusted NOA 765,019 755,702 656,817 656,548 630,589
2010/11 2009/10 2008/09 2007/08 2006/07Equity of parent company shareholders 753,229 730,059 664,273 695,705 685,405Harboe farm assets (157,167) (150,017) (154,445) (147,414) (172,736)Harboe farm liabilities 37,577 33,582 38,159 35,030 59,746Adjusted equity 633,639 613,894 547,987 583,321 572,415

90
15. Net turnover
Cf. note R3 of the annual statements the item is adjusted for Harboe Farm’s share of
revenue.
16. Production costs (cost of merchandise sold)
Cf. note R3 of the annual statements the item is adjusted for Harboe Farm’s share of all
costs (including distribution and administrative costs). Harboe Farm’s share of costs is
calculated as the difference between its revenue and its EBIT, and this amount is then
subtracted from the total production costs:
17. Depreciation and amortization
Cf. note R7, depreciation and amortization of intangible and tangible assets are distributed
as follows:
18. Other operating income and operating costs
In the income statement the entries other operating income and other operating costs are
found. Referring to the notes176, other operating revenues relate to government subsidies,
rental income, and gains and losses from sale material assets. The consideration is whether
these two items are related to the operations or not. It is estimated that the items are
176 Other operating costs not are specified
2010/11 2009/10 2008/09 2007/08 2006/07Revenue 237,121 241,094 225,167 233,570 193,697Ebit 4,950 6,092 4,787 1,004 -122Difference 232,171 235,002 220,380 232,566 193,819
2010/11 2009/10 2008/09 2007/08 2006/07Production costs 113,882 106,368 107,642 96,360 91,714Distribution costs 7,917 11,256 4,877 4,479 3,527Administration costs 4,941 4,882 4,658 3,841 1,660Other operating income 0 -51 (2,966) 0 0Other operating costs 3,448 3,264 3,970 4,422 4,243Total depriciation 130,188 125,719 118,181 109,102 101,144

91
related to operations and that that the records are ongoing. The items are therefore
maintained as part of the primary operation.
19. Tax on operating profit
Cf. note R12 (note R11 in earlier years financial statements) the effective statutory tax rate
(including adjustment for foreign tax rates, regulations etc.) varies between approximately
25% and 34% during the years. A tax rate of 26% is applied;
The item "adjusted tax from previous years" are not included in the reformulated income
statement, as the impact from this item on the effective tax rate is minimal and only
creates noise in the year 2007/08, due to changes in corporate taxes.
20. Dirty surplus
Cf. the equity balances’, dirty surplus consist of following line transactions that are
recognized directly in equity statement: Currency regulation of foreign subsidiaries, the fair
value adjustment of financial assets available for sale, reserve for net revaluation under the
equity method, reserve for cash flow hedges and taxes on hedging instruments. These
amounts included in the comprehensive net income is specified, to see a cleaner net
income statement, and understand the applicable net income the company earned over
the reporting period.
21. Net income adjusted
2010/11 2009/10 2008/09 AverageEffective tax rate 25.20% 26.00% 26.90% 26.00%
2010/11 2009/10 2008/09 2007/08 2006/07Tax as reported 20,413 15,247 9,443 4,637 28,809Tax benefit from net financial expenses 1,529 719 1,890 1,712 806Total tax on operating income 21,942 15,966 11,333 6,349 29,615
Tax shield = Net interest expense * statutory tax rate
Net interest expense (5,848) (2,764) (7,268) (6,583) (3,099)

92
Deviation in the value of comprehensive income in the reformulated income statement
compared to that of the reformulated equity statement is mostly due to the assumptions
affecting the applied tax rate. To account for this difference net income in the equity
statement should be adjusted as to reflect the changes in the reformulated income
statement.
22. Operating lease commitments
From note R32 it can be seen that Harboe’s operating lease commitments is related to
production, distribution, administration and other operational costs. Thus, these are assets
related to the operational activities and this supports a reclassification of operating leasing
commitments as financial leasing commitments.
For operating leases annual lease payment are recognized in full as an operating expense,
and the leased assets are not a part of the balance.
When reclassifying it as financial leases the leased assets are recognizes in the balance
sheet and lease payments attributed respectively to the amortization of the leased asset
and interest expense associated with leasing arrangement that is classified as a financial
expense in the income statement.
In relation to the financial analysis, a reclassification of operating leases as finance leases,
increase investment, reduce operating costs and increase the financial costs. A
reclassification will therefore affect the calculated profitability ratios.
In 2011 the total cost of leasing was 32,775 million, while tangible assets amounted to
871,973 million and total assets to 1685,467 million. Cost of leasing amounts to
approximately 1.9% of total assets (32,775/1685,467) and it is therefore assessed not to be
notable177. Based on this assessment and due to the uncertainty of the depreciation
horizon of the assets and the correct leasing rate, the item is not reclassified as a financial
leasing.
177 Close to this level for the past five years

93
Appendix 4: Breakdown of Financial Value Drivers Since profit is measured over an entire year, whereas balance sheet items is measured only at one
point in time, an average of starting and ending values is used. This is done to account for the
development in invested capital over the period178.
1. Profitability analysis RNOA:
- RNOA = NOPLAT/ Ave Invested capital (i.e. OI/NOA)
2. FLEV drivers
- NBC = NFE/NFO
- SPREAD = RNOA - NBC
- FLEV = NFO/CSE
3. The breakdown of RNOA into profit margin (PM) and asset turnover (ATO) =
- RNOA = PM * ATO = OI/Net Sales * Net Sales/average NOA
- ROOA = Adjusted OI/OA (the difference between RNOA and ROOA is the OLLEV)
- DuPont = PM * ATO
4. The breakdown of ATO
- Accounts receivable turnover = net turnover/ave trade receivables
- Inventories turnover = production costs/ave inventories
- Tangible assets turnover = net turnover/ ave tangible assets
- Accounts payable from sales turnover = production costs/ave trade receivables
- Ave. days funds tied up receivables = accounts receivables (i.e. extended credit)/(net
turnover/365 days)
- Ave days funds tied up payables = accounts payable (i.e. supplier debt)/(production
costs/365 days)
- Ave days funds tied up inventory = inventory/(production costs/365 days)
178 A challenge when analyzing the financial statements is that the balance sheet only depicts how
the company looks at a specific date. This means that there is no information about from when
any newly acquired assets have been generating returns for the company. So, to handle this
situation average value for “invested capital” has been used.

94
- Approximate conversion period = (days in: inventory + receivables)
- Average net trade cycle: (# of days) = conversion period – accounts payable
5. The breakdown of PM
- Calculations are shown in the thesis under the breakdown of PM
6. Ratios of short-term liquidity risk
- Current ratio = average current assets/average current liabilities
- Cash to current Liabilities Ratio = (financial assets available for sale + deposits + receivables
from associates + liquid holdings)/average current liabilities
- Acid-test (quick) Ratio = (Financial assets (i.e. liquid holdings and marketable securities) +
trade receivables)/average current liabilities
7. Long-term liquidity analysis
- Financial gearing = interest bearing debt/equity or debt/equity
- Interest coverage degree = EBIT/NBC

95
Appendix 5: Danish Government Bond with 10 Years to Maturity Source: http://www.statistikbanken.dk/statbank5a/default.asp?w=1280

96
Appendix 6: Datastream (Raw Beta) and Reuters (Adjusted Beta) Estimation of Harboe Beta

97
Appendix 7: Calculating the Value of Equity using the Residual Earnings Model The formula used in the valuation looks like this:
����� � �� ��� � �� �� �� ��
�� �� �5��& & 6 7
Residual Income Model179 Period
0 1 2 3 4 5 Terminal
2010/11 2011/12E 2012/13E 2013/14E 2014/15E 2015/16E 2016/17E+ NOPLAT
52,773 55,939 58,177 59,922 61,121 62,343
NOA
765,019 713,153 755,942 786,179 809,765 825,960 842,479 RE
-8,429 -1,113 -2,298 -2,972 -3,660 -3,734
Terminal value
-62,233
PV budget period -15259 PV terminal value -42,355 NOA(0)
765,019
Company value 707,405 Value NFO
(131,171)
Value Equity 576,234 Number of shares 6000 Share price on
the 30-04-2011 96
RE = NOPLATt-(WACC*NOAt-1)
179 Figures below have been rounded up