Embed Size (px)
Citation preview


Hard Skills, Soft Skills: The Relative Roles of Cognitive and Non-cognitive
Skills in Intergenerational Social Mobility
Amy Hsin Queens College-City University of New York
Yu Xie
University of Michigan
Population Studies Center Research Report February 2012
Direct all correspondence to Amy Hsin, Department of Sociology, Queens College-City University of New York, Powdermaker Hall 252S, 65-30 Kissena Blvd., Flushing, New York 11367; email: [email protected]. Financial support for this research was provided by the Research Enhancement Fund of Queens College to Amy Hsin and the University of Michigan to Yu Xie. A version of this paper was presented at the CIQLE seminar at Yale University, the “Topics in Labor Economics” workshop at the Institute for Economic Research at Kyoto University in Japan, and at the 2011 International Sociological Association Research Committee 28 on Social Stratification and Mobility spring meeting in Essex, England. The ideas expressed herein are those of the authors.
Cognitive and Non-cognitive Skills in Intergenerational Social Mobility 2
ABSTRACT
In this article, we adopt a two-step strategy to assess the relative roles of cognitive and non-cognitive skills in mediating the relationship between family SES and children’s academic achievement using data from the Early Childhood Longitudinal Study-Kindergarten Cohort. First, we decompose the total effects of family background on children’s achievement into: (1) direct effects of family background, and (2) indirect effects via cognitive and non-cognitive skills. We estimate this model using skills alternatively measured at four points in time between kindergarten and the 5th grade. Second, we use growth curve and fixed effect models to study the changing relationship between family background and skill formation over time. Overall, we find that cognitive skills are stronger mediators of family SES than non-cognitive skills. This is both because non-cognitive skills are less predictive of later achievement and because they are less affected by family SES. However, the mediating role of non-cognitive skills grows over time because the effect of family SES on non-cognitive skills significantly increases over a child’s life-course. Our findings raise important questions regarding the role of non-cognitive skills in intergenerational social mobility.

Cognitive and Non-cognitive Skills in Intergenerational Social Mobility 3
INTRODUCTION
It is well understood that family background exerts strong influences on children’s
educational outcomes, with children from higher-SES families academically outperforming those
from lower-SES families (Becker 1993; Blau and Duncan 1967; Bourdieu 1977; Duncan and
Brooks-Gunn 1997; Hauser, Tsai, and Sewell 1983; McLanahan and Sandefur 1994; Sewell,
Haller, and Portes 1969). However, the question of how family SES actually affects children’s
educational outcomes is still subject to debate. Broadly speaking, three categories of causal
mechanisms have been considered: direct effects of hard resources, indirect effects through
cognitive skills or “hard” skills measured by test scores, and indirect effects through non-
cognitive skills or personality traits which include a range of “soft” skills such as motivation,
social skills and work habits.
The first two causal mechanisms—the direct effect of family resources on achievement
(Becker 1993; Mincer 1974; Kaushal, Magnuson, and Waldfogel 2011) and the indirect effect
via cognitive skills (Griliches and Mason 1972; Jencks et al. 1979; Hauser, Tsai, and Sewell
1983; Sewell, Haller, and Portes 1969)—are well established. The role of non-cognitive skills in
status attainment also has a long tradition in stratification research dating back to the Wisconsin
socio-psychological model of status attainment (Hauser, Tsai and Sewell 1983; Sewell, Haller
and Portes 1969). In recent years, however, their role has gained renewed interest. A growing
body of research suggests that non-cognitive skills may be as important as cognitive skills in
predicting a variety of outcomes, ranging from educational attainment (Duncan and Magnuson
2011; Lleras 2008; Rosenbaum 2001) to income and labor market performance (Cunha and
Heckman 2009; Hall and Farkas 2011; Jackson 2006) to incarceration and teenage childbearing
(Heckman, Stixrud and Urzua 2006). Moreover, sociological theories have long speculated that
the family is instrumental in shaping critical non-cognitive skills that are important for future
success, such as motivation, aspirations and self-discipline (Boudon 1974; Bourdieu 1977;
Heckman 2006, 2011; Lareau 2003; Kao and Tienda 1995; Kim 2011; Goyette and Xie 1999).
Yet to date, important questions remain about the role of non-cognitive skills in status
attainment. While it is commonly accepted that non-cognitive skills, like cognitive skills,
mediate the intergenerational transmission of family advantages or disadvantages, it is far from
clear, a priori, that non-cognitive skills mediate the effects of family SES in the same manner as
cognitive skills. Our current understanding is limited in at least two important ways. First, we do

Cognitive and Non-cognitive Skills in Intergenerational Social Mobility 4
not know the relative importance of cognitive versus non-cognitive skills as mediators of family
origin. For skills to mediate the effects of family SES on achievement outcomes, two conditions
must hold: (1) they must affect achievement outcomes, and (2) family SES must affect them. To
date, neither of these two relationships has been well established for non-cognitive skills.
Second, most prior studies have taken a static conceptualization of skill formation by using
single-point-in-time measures of skills (Duncan et al. 2007; Lleras 2008; Hauser, Tsai, and
Sewell 1983; Jencks et al. 1979; Mood, Jonsson and Bihagen forthcoming; Sewell, Haller and
Portes 1969). Growing evidence, however, suggests that the developmental trajectories of
cognitive skills differ from those of non-cognitive skills. We do not know how these potential
differences in the evolution of cognitive versus non-cognitive skills over the life-course might
shape the ways in which they mediate family SES effects in different ways.
To address these gaps in our understanding, we employ a two-step strategy. First, we
decompose the impact of family background on children’s academic achievement into: (1) direct
effects of family background and (2) indirect effects via cognitive and non-cognitive skills. We
estimate these models alternatively using skills measured at kindergarten to 5th grade. This
approach allows us to evaluate the relative importance of cognitive versus non-cognitive skills as
mediators of family SES effects and to determine whether the mediating roles of these two types
of skills change over time. Second, we use a variety of statistical techniques—including growth
curve and fixed effect models—to explicitly determine the dynamic effects of family SES on
trajectories of cognitive as well as non-cognitive skills. Doing so allows us to examine a
potential reason why the mediating roles of cognitive and non-cognitive skills might change over
time. Overall, we find that cognitive skills are stronger mediators of family SES than non-
cognitive skills. This is both because non-cognitive skills are less predictive of later achievement
and because they are less affected by family SES. The later findings are particularly relevant
because they suggest that the role of the family in shaping personality traits is weaker than
previously theorized. When we take a developmental perspective and examine these
relationships as they change over a child’s life course, we find that the mediating role of non-
cognitive skills increases over time, although they remain weaker mediators than cognitive skills.
Moreover, the increase in the role that non-cognitive skills play over time can be attributed
mainly to the increasing influence of family SES on non-cognitive skills. In other words,
children’s non-cognitive skills are more sensitive to family environment at later ages.

Cognitive and Non-cognitive Skills in Intergenerational Social Mobility 5
THEORETICAL AND METHODOLOGICAL ISSUES
In Figure 1, we present a stylized conceptual model of status attainment. We revive the
classical Wisconsin socio-psychological model as a starting point for understanding the causal
pathways through which family SES influences children’s achievement outcomes (Hauser, Tsai,
and Sewell 1983; Sewell, Haller and Portes 1969). In its original formulation, the Wisconsin
model conjectures that the influence of family background on children’s status attainment is
entirely mediated through children’s social-psychological traits defined as educational and
occupational aspirations. We deviate from this position to include both a direct effect of family
SES on children’s achievement outcomes and an indirect effect via children’s cognitive skills. In
the following sections, we briefly review the literature pertaining to each of the three causal
mechanisms linking family SES and children’s achievement (i.e., direct effects, indirect effect
via cognitive skills and indirect effects via non-cognitive skills) and highlight the gaps in our
knowledge.
Figure 1: Stylized Model of Status Attainment
Note. NC = Non-cognitive skills, SES = Mothers’ education and permanent family income
Direct Effects of Family SES
Family SES may exert direct effects on children’s educational outcomes because a higher
family SES means more potential resources that could be expended to promote children’s
education. The resource explanation has been popular in economics. According to this

Cognitive and Non-cognitive Skills in Intergenerational Social Mobility 6
explanation, parents have an intrinsic “altruistic interest” in their children’s socioeconomic
wellbeing and purposely invest in their children (Becker 1993; Mincer 1974). Parental
investment in children may take a variety of forms, such as purchased goods and services (e.g.,
quality child care, school supplies and books, recreation and entertainment activities, and private
lessons) and time spent on children (e.g., help with homework and attendance at school events)
(Kaushal, Magnuson, and Waldfogel 2011). Note that these examples of parental investment are
all about resources, in the sense that they are subject to firm budget constraints, and parents
could divert their uses towards other uses (including other children) if withholding them from a
particular child.
Indirect Effects through Cognitive Skills
Another main causal pathway through which family SES affects children’s educational
outcomes is via cognitive abilities, also called “hard skills.” We do not yet know the true extent
to which cognitive abilities are determined by nature (i.e. genetics) versus nurture (i.e.
environment), but it is safe to say that the two forces interact in certain ways that shape one’s
cognitive abilities (e.g., Nisbett 2009; Plomin, Defries, and Loehlin 1977). Studies show that the
most important period for cognitive skill development is early to middle childhood (Cunha and
Heckman 2008; Guo and Harris 2000; Keane and Wolpin 1997). During this period, high-SES
families enhance children’s math and verbal development by offering greater material resources
(Klebanov et al. 1998; Korenman, Miller, and Sjaastad 1995) and more stimulating home
environments (Bronte-Tinkewet al. 2008; Parcel and Dufur 2001) than low-SES families. These
“hard” skills, in turn, go on to positively influence a variety of achievement outcomes, including
children’s educational attainment (Farkas and Vicknair 1996; Griliches and Mason, 1972;
Warren, Hauser and Sheridan 2002).
Indirect Effects through Non-cognitive Skills
Non-cognitive skills, or personality traits, have recently resurfaced as another important
causal mechanism through which family SES background affects children’s academic
achievement. These skills are multidimensional in nature and encompass a broad class of
individual attitudes, behaviors and habits that are correlated with but distinct from cognitive
traits (for a detailed review see Borghans et al. 2008). By non-cognitive skills, researchers have
meant a variety of characteristics distinct from purely cognitive abilities, ranging from leadership

Cognitive and Non-cognitive Skills in Intergenerational Social Mobility 7
and perseverance (Jencks 1979) to self-esteem and locus of control (Heckman, Stixrud and
Urzua 2006), aspirations and expectations (Sewell, Haller and Portes 1969), and school-related
attitudes and behaviors (Rosenbaum 2001; Lleras 2008; Clasessen, Duncan and Engel 2008;
Duncan and Magnuson 2011).1
For non-cognitive skills to mediate family SES effects on children’s achievement, they
must (1) influence achievement outcomes and (2) be influenced by family SES. While consensus
exists that traits, such as self-control, social skills, and attention-related capacities, positively
predict children’s academic outcomes, there is intense disagreement among policy-makers and
academics as to their importance relative to cognitive abilities. The “Neurons to Neighborhoods”
report of the National Research Council and Institute on Medicine argues that early intervention
programs should devote equal attention to enhancing children’s socio-emotional development
and their cognitive development (Shonkoff and Philips 2000). On the other hand, reports from
the National Research Council’s Committee on the Prevention of Reading Difficulties in Young
Children (Snow, Burns, & Griffin 1998) and the National Association for the Education of
Young Children (NAEYC) argue for the primacy of “hard” skills such as literacy and math
competence for success in schools.2
The academic literature is also mixed. Some studies demonstrate that traits such as self-
control explain much more of the variation in children’s academic performance than cognitive
abilities (Duckworth and Seligman 2005; Wolfe and Johnson 1995). Still others argue that non-
cognitive skills have far more persistent effects on children’s later academic achievement than
cognitive skills (Chetty et al. 2010; Heckman et al. 2007). In contrast, other studies show that
“hard” skills trump “soft” skills as determinants of academic success. Based on analyses of data
from six longitudinal studies, Duncan et al. (2007) find that early math and reading skills are
stronger predictors of later achievement than non-cognitive traits, such as attention-related
capacities, social strengths and behavioral deficits. Lleras (2008) reports similar results from a
study analyzing data from the National Educational Longitudinal Study, as do Claessens, Duncan
and Engel (2009) based on data from the Early Childhood Longitudinal Study.
1 In referring to such a variety of personality and psychological traits, non-cognitive skills in the social science literature do not conform to the conventional notion of “skills,” a term that normally applies only to abilities or facilities acquired through learning or training. 2 http://www.naeyc.org/about/positions/pdf/psmath.pdf

Cognitive and Non-cognitive Skills in Intergenerational Social Mobility 8
The second condition that must be fulfilled for non-cognitive skills to mediate family
SES effects is that family SES must influence them. Longstanding sociological theories postulate
that families play an instrumental role in shaping children’s non-cognitive skills. Sociologists
have long argued that attainment of higher education is a cultural expectation specifically valued
by the middle class but not shared by the lower class (Boudon 1974; Bourdieu 1977; Brand and
Xie 2010; Jencks et al. 1972; Goyette and Xie 1999; Smith and Powell 1990). For example, in a
study of middle and working class families, Lareau (2003) documents disparities in the types of
skills that are promoted, consciously or unconsciously, by parents. In contrast to poor and
working class parents, middle-class parents are more likely to “cultivate” children’s cognitive
and non-cognitive traits along specific dimensions that foster academic achievement.
However, the relationship between family SES and non-cognitive factors may be weaker
than what some scholars would expect. For example, comparison of monozygotic and dizygotic
twins typically shows that only 25% of total variation in non-cognitive traits is due to shared
family traits (i.e. both genetic and environmental) (Floderus-Myrhed, Pedersen, and Rasmuson
1980; Rowe and Plomin 1981). In contrast, approximately 40% of total variation in adult IQ, a
cognitive trait, is due to shared family traits. Using the National Longitudinal Study of Youth
(NLSY), Duncan and colleagues (2005) find that family SES is a surprisingly weak predictor of
social-psychological indicators such as shyness, self-esteem and depression.
A recent study by Mood, Jonsson and Bihagen (forthcoming) attempts to directly address
the question of how family SES effects on children’s educational outcomes are mediated by
cognitive versus non-cognitive skills, using Swedish registry data on approximately 180,000
fathers and sons. Their measures of cognitive and non-cognitive skills (i.e. social maturity,
emotional capacity and leadership skills) are assessed when sons are age 18. The study finds that
the intergenerational correlation of educational attainment is mainly mediated by children’s
cognitive skills and only weakly mediated by non-cognitive traits. Unfortunately, the study does
not inform us why the mediating effects for non-cognitive skills are weak. Is it because non-
cognitive skills are poor predictors of later educational outcomes, or is it because father’s
education is a poor predictor of non-cognitive skills?
Another factor to consider is the potentially evolving role of cognitive and non-cognitive
skills over one’s life course. This point is critical because mounting evidence demonstrates that
there are important differences between the developmental trajectories of cognitive and those of

Cognitive and Non-cognitive Skills in Intergenerational Social Mobility 9
non-cognitive skills (see Borghans et al. 2008 for a detailed review). Specifically, cognitive skills
undergo the greatest amount of change in early childhood and stabilize by adolescence. Non-
cognitive skills, on the other hand, continue to undergo changes throughout childhood and into
young adulthood. We call this conjecture the “sensitive period hypothesis,” or the proposition
that there are sensitive periods in the life course when skills are more or less malleable to
environmental influences (Borghans et al. 2008; Cunha and Heckman 2008; Guo and Harris
2000). Emerging evidence supports this hypothesis. For example, Cunha and Heckman (2008)
find that parental investments, such as the number of books at home and frequency of trips to
museums, have strong effects on cognitive skills at earlier ages and have strong effects on non-
cognitive skill formation at later ages.
Static conceptualizations of skills cannot capture important dynamics in skill formation,
nor can they capture the changing roles of cognitive and non-cognitive skills as mediators of
family SES over the life course. For example, if the effects of family SES on non-cognitive skills
grow with time, then a static measure of non-cognitive skills would lead to an underestimation or
overestimation of the mediating role of non-cognitive skills, depending on the time at which non-
cognitive skills are measured. Therefore, a developmental perspective that explicitly considers
changes in skill formation over time allows us to identify potential sensitive periods in the
relationship between family origin and skill development and to address questions regarding
whether the mediating role of cognitive and non-cognitive skills changes over the life course.
DATA AND MEASURES
We use panel data from the Early Childhood Longitudinal Study, Kindergarten Class
(ECLS-K). The ECLS-K is a national cohort-study of kindergarteners followed from
kindergarten entry to 8th grade between 1998 and 1999 (Tourangeau et al. 2006). We chose the
ECLS-K for several reasons. First, it offers repeated measures of children’s cognitive skills and
personality traits, which allows us to observe how both these traits evolve over an important
period in childhood. Second, the data offer multiple indicators of children’s personality traits so
as to allow us to reduce measurement error through factor analysis. Third, the data cover a
critical period during which skills were not only acquired and shaped but also affect subsequent
academic performance.

Cognitive and Non-cognitive Skills in Intergenerational Social Mobility 10
Baseline interviews were conducted during the fall of kindergarten entry for over 20,000 children. Follow-up interviews were conducted in the spring of kindergarten, fall and spring of
1st grade, spring of 3rd grade, spring of 5th grade and spring of 8th grade. We omit interviews conducted during the fall of 1st grade because only a subsample of children (approximately 30%) were interviewed. By 8th grade, 9,725 children remained. The only exclusion restrictions placed
in selecting the final analytical sample are that children have non-missing values for sampling weights (70 cases dropped) and teachers (638 cases dropped), which are used to adjust for clustering of students by schools. This leaves us with a final analytical sample of 9,017 students.
Missing data on any other variables does not result in a student being excluded from the analysis.3 Instead, we use Full Information Maximum Likelihood (FIML) imputation to account for missing data, allowing us to include all available data in our analysis. FIML has been shown
to outperform listwise deletion under the assumption that data are missing at random given observed covariates (Little and Rubin 1987). To account for the hierarchical nature of the data and the fact that multiple children were sampled within schools and classrooms, we adjust
standard errors in model estimation by clustering the data by teacher. To account for attrition across waves and to make our estimates more nationally representative, all analyses are conducted with sampling weights.
Measures Academic Achievement. The Academic Ratings Scale (ARS) captures verbal
achievement in language/literacy. These measures are derived from teachers’ daily observations of student performance regarding verbal skills. Teachers rated children’s skills, knowledge and
behaviors on a 5-point scale from “Not Yet” to “Proficient.” In this sense, ARS scores can be interpreted as teacher evaluations of competency or grades. We use verbal achievement measured in 8th grade and transform them into percentile scores to ease interpretation.4
3 All models were also estimated using listwise deletion (i.e. dropping observations with at least one missing variable on all variables in the analysis). The results using listwise deletion do not differ substantively from results using FIML. Listwise deletions reduce the sample to 6,640 observations. The majority of missing data are due to missing cognitive test scores and teacher reports of children’s non-cognitive traits. 4 Assessments of cognitive math ability (IRT scores) and math achievement (ARS scores) were also administered at all waves. However, math achievement scores were only collected for about half of the sample of children (N=4,450). In addition to the findings for verbal assessments that are presented in the paper, all models were also estimated using ARS scores for math achievement and IRT math scores for math ability. In all cases, the findings are consistent with the results for verbal assessments that are presented in the paper.

Cognitive and Non-cognitive Skills in Intergenerational Social Mobility 11
Cognitive Skills and Personality Traits. Reading Item Response Theory
(IRT) scores are used to capture cognitive skills. IRT uses patterns of response to estimate the
probability of correct answers if children were given all assessment questions at each wave of the
survey. At each wave of the survey, we transform IRT scores to percentiles scores to facilitate
interpretation, as percentile scores are normed with respect to the sample at each point in time.
Children’s personality traits are based on the Social Ratings Scale (SRS), which asked
teachers to report on the frequency students exhibited certain skills and behaviors (i.e. 4-point
scale ranging from “Never” to “Very often”). The SRS asked teachers to rate students along the
following dimensions: approaches to learning, self-control, interpersonal skills, externalizing
problem behaviors, and internalizing problem behavior. The first three indicators capture
positive aspects of non-cognitive traits whereas the last two represent problem behaviors.
Approaches to Learning. We measures children’s attentiveness, task
persistence, eagerness to learn, learning independence, and organization. Self-Control measures child’s ability to control behavior by respecting the property of others, controlling temper,
accepting peer ideas, and responding appropriately to peer pressure. Interpersonal Skills captures ability to form and maintain friendships, getting along with others, comforting and helping other children, expressing feelings in positive ways, and showing sensitivity to others’ feelings.
Externalizing Problem Behaviors measures the frequency with which the child argues, fights, gets angry, acts impulsively, and disturbs ongoing activities. Finally, Internalizing Problem Behavior measures the presence of anxiety, loneliness, low self-esteem, and sadness.
We conducted factor analysis to estimate a single latent factor underlying these five indicators of personality traits at each of the five waves. We then combined the items (with equal
loadings that sum to one) into a composite scale (Cronbach’s alpha at each point in time ranged from 0.85-0.87) at each wave (Cawley et al. 1997). As with cognitive skills, we transformed the composite variable into percentile scores to ease interpretation and to make personality measures
comparable with cognitive measures. This approach also norms personality measures so that all scores are relative to other students in the sample.
While cognitive measures were collected through 8th grade, personality measures were
only collected through 5th grade. Therefore, we focus our analysis on time periods where we have both cognitive and personality measures (i.e. fall and spring of kindergarten, spring of 1st grade, spring of 3rd grade and spring of 5th grade).

Cognitive and Non-cognitive Skills in Intergenerational Social Mobility 12
Family Socioeconomic Status (SES). We use permanent household income
and maternal education to measure family socioeconomic status. Permanent income is measured
as the log average household income between kindergarten and 5th grade. We use permanent income rather than single-year measures of income because multiyear measures better capture family income variability and are more reliable measures of socioeconomic status (Solon 1999).
Exact income was not collected. Instead, total household income was placed into one of 13 income categories. We use the midpoint of each income range to calculate the permanent (average) income level from kindergarten to 8th grade. Maternal education is measured in levels
ranging from 1 to 9 (i.e. 1 = 8th grade or below and 9 = doctorate).5
Parental Investments. Parental investments in children, in the form of the
amount of cognitive stimulation parents provide at home (Bradley, Caldwell, and Rock 1988;
Brooks-Gunn, Klebanov, and Duncan, 1996; Kaushal, Magnuson, and Waldfogel 2011) and
parental expectations for children’s future academic attainment (Goyette and Xie 1999; Kao and
Tienda 1995) are another means by which parents can influence children’s skill development and
academic performance. The ECLS-K asked parents to report on a variety of measures aimed at
assessing the educational quality of children’s home environments. We used confirmatory factor
analysis to construct a single latent factor underlying our 11 measures of parental investment:
parental expectations for children’s future attainment, number of children’s books, and parental
involvement in a variety of educationally oriented activities (reading, playing, singing songs,
sports, etc.). Cronbach’s alpha is 0.76, which suggests a high level of reliability.
Statistical Strategy
We adopt a two-step analytical approach. In the first step, we use structural equation
modeling to decompose the total effects of family SES on children’s academic performance into
a direct component and two indirect components via cognitive versus non-cognitive traits and
compare the relative importance of the two pathways. We estimate these models alternatively
using skills measured at kindergarten (fall entry), 1st, 3rd, and 5th grade to explore how the
relationships change over time. The baseline model with skills measured in kindergarten
ascertains the influence of family origin on children’s academic performance through affecting
5 We use mothers’ education and not fathers’ education because we wanted to minimize missing values due to lack of information on fathers. In robustness checks, we use average of fathers’ and/or mothers’ education and all results were consistent with the results presented in the paper.

Cognitive and Non-cognitive Skills in Intergenerational Social Mobility 13
their skills early in life. Alternatively estimating models with later measures of skills allows us to
assess the potential variation of family’s influence on the development of cognitive and non-
cognitive skills over the life course and how potential differences in these developmental
trajectories affect how skills mediate the total effects of family origin on academic achievement
over time.
In the second step, we leave behind the decomposition framework in order to focus on the
changing relationship between family origin and skill formation. To do this, we employ growth
curve analysis and fixed effect models, recognizing that both methods have their advantages and
limitations. The main advantage of growth curve models (GCM) is that this method allows
researchers to obtain estimates of both within- and between-person differences in growth
trajectories (Muthen 1997). For example, it allows us to determine how family background might
explain differences in growth trajectories between individual children as well as how family
origin might explain differences in the way skills evolve over time within a child’s life-course.
The main limitation of this method, however, is that it cannot address potential bias due to
unobserved heterogeneity. We thus turn to fixed effect analysis to account for this potential
source of bias and to estimate how changes in family SES relate to changes in skill formations
over time. The drawback to this latter approach, however, is that we lose the ability to learn how
variation in key variables of interest, such as family SES, might cause variation in skill formation
across children. In the following sections, we describe each of these statistical approaches in
detail.
Decomposing Family SES Effects
We use structural equation modeling (SEM) to decompose the total effects of family SES
on children’s later academic achievement into the following components: (1) the direct effect, (2)
the indirect effect through cognitive abilities, and (3) the indirect effect through non-cognitive
skills. Figure 2 presents our conceptual framework. We measure family SES by permanent
family income and mothers’ education. Note that we treat income, education, cognitive skills,
and academic achievement as observed variables. We use factor analysis to uncover the latent
structure underlying our five measures of non-cognitive skills and create a single factor-based
scale of non-cognitive skills.

Cognitive and Non-cognitive Skills in Intergenerational Social Mobility 14
Figure 2: Structural Model with Covariates
Note. NC = Non-cognitive skills, SES = Mother’s education and permanent family income. Covariates include latent variable describing parental involvement, child’s race, child’s sex, marital status, and mother’s age at first birth.
We also include a common set of family background characteristics that have been
shown to influence children’s skill formation and academic performance. These covariates
include child’s race, child’s sex, marital status, and mother’s age at first birth, as well as a latent
variable capturing parental investments. We allow these covariates to have direct effects on
achievement outcomes and indirect effects via pathways through cognitive and non-cognitive
skills. All covariates are allowed to freely correlate with both family income and education. We
allow all background variables, these covariates, and family income and mother’s education, to
correlate freely among themselves.
Following notations in the structural equations tradition (Bollen 1989), we can express
the structural model depicted in Figure 2 mathematically as
η = Bη + Γχ + ζ, (1)

Cognitive and Non-cognitive Skills in Intergenerational Social Mobility 15
where stands for our three endogenous variables: academic achievement, cognitive
skills, and non-cognitive skills, with the last assumed to be a latent variable composed from
multiple indicators. represents exogenous variables: family income, mothers’ education,
and all other covariates (including the latent variable for parental investments). and
are their respective parameter vectors, often referred to as “structural parameters.” is a
vector of error terms. We estimate a standard recursive model that assumes that the
is zero and is uncorrelated with .
For latent variables, either endogenous or exogenous, we specify a measurement model
for the relationship between them and their observed indicator variables. Let Y be indicators of
endogenous variables η, and X be indicators of exogenous variables ξ. We have:
Y = Λy η + ε (2)
X = Λx ξ + δ, (3)
where and are matrices of parameters, commonly referred to as “measurement
parameters.” Again, we assume independence of errors so that cov(ε, )=cov(ε, )=cov(δ, )
=cov(δ, )=cov(ε,δ)=0. Under these assumptions, we simultaneously estimate the structural
and measurement parameters in our model.6 We rely on three standard indicators of
model fit that are commonly used with large samples (N>200): the root mean square error
of approximation (RMSEA), the Tucker Lewis Index (TLI), and the Comparative Fit Index
(CFI). The convention recommends that RMSEA be below .05 and TLI and CFI close to 1.0
(Bollen and Curran 2006).
Family Origin Effects on Skill Formation over Time
In the second part of our empirical work, we turn to estimating growth curve
models and fixed effect models in order to identify trajectories in skill formation over the
life course and to determine whether these trajectories differ for cognitive and non-
cognitive skills. We first estimate random coefficient models or growth curve models
(GCM). GCM are hierarchical models with the first level modeling individuals'
developmental trajectories and the second level modeling between-person variations in
6 We use Mplus, Version 6 (Muthen and Muthen 2010).
η
χ
B
Γ
ζ
E(ζ)
ζ
χ
Λy
Λx
η
ζ
η
ζ

Cognitive and Non-cognitive Skills in Intergenerational Social Mobility 16
these trajectories (Bollen and Brand 2010). We model cognitive and non-cognitive skill
formation as parallel processes. Doing so allows us to compare directly how the same set of
predictors may affect the growths of two sets of skills differently.
Figure 3 conceptually illustrates the growth curve model that we estimate. Both
types of skills are assessed at 5 different points in time between kindergarten entry and 5th
grade. The figure shows that the growth trajectories of cognitive and non-cognitive skills
are attributed to two types of growth factors: (1) initial differences in skill levels, referred
to as random intercepts, and (2) individual differences in growth rates, referred to as
random slopes.
Figure 3. Growth Curve Analysis of Cognitive and Non-cognitive Skills
Note. NC = non-cognitive traits, Cog = cognitive skills

Cognitive and Non-cognitive Skills in Intergenerational Social Mobility 17
Our model allows the intercept and slope of cognitive skills to freely correlate with
each other at the individual level; similarly, the intercept and slope of non-cognitive skills
are also allowed to correlate. Moreover, both the intercept and slope of cognitive skills are
allowed to correlate with the intercept and slope of non-cognitive skills. For simplicity,
growth in cognitive and non-cognitive skills is modeled as linear functions over time.7
Our model of parallel processes can be formally described below. The level-1
equation describes within-individual (i) change over time (t) in skill formation:
(5)
. (6)
Both cognitive ( ) and non-cognitive ( ) skill trajectories are characterized by an
intercept, or , and a slope, or , respectively.
The following set of equations describes level-2 relationships or variation in trajectories
for cognitive and non-cognitive skills that can be attributed to differences across individuals:
(7)
βi = β0 + β1xi1 + ...+ βk xik + µi (8)
(9)
(10)
These equations state that the intercepts and slopes associated with cognitive and non-cognitive
skill trajectories are a function of person-level independent variables ( ) that do not vary across
time. In our study, the variables include child and family characteristics. The model basically
states that the intercepts and slopes for cognitive and non-cognitive skills, respectively, depend
on a set of child and family characteristics. As mentioned above, we model growth in cognitive
and non-cognitive skills as parallel processes which allow the intercept, , and slope, , of
cognitive skills and the intercept, , and slope, , of non-cognitive skills to freely correlate.8
7 In analysis not shown here, we estimated growth models for cognitive and personality skills separately without covariates to determine the shape of each growth curve. We found that linear growth best fit the data and therefore proceeded to model parallel processes with linear growth. 8 We estimate these models in Mplus.
Cogit = α i + βit +ε it
NCit = γ i +ηit + uit
Cogit
NCit
α i
γ i
βi
ηi
α i = α0 + α1xi1 + ...+ αk xik +υi
γ i = γ 0 +γ1xi1 + ...+γ k xik +ω i
ηi = η0 +η1xi1 + ...+ηk xik +δ i
xk
α i
βi
γ i
ηi

Cognitive and Non-cognitive Skills in Intergenerational Social Mobility 18
While GCM provides a powerful way of describing growth trajectories, it may suffer from biases due to unobserved heterogeneity. For example, the effects of family SES on the growth trajectories of cognitive and non-cognitive skills as estimated by GCM may not be causal, but attributable to unmeasured factors, such as parents’ own cognitive and non-cognitive skills, that affect both family SES and the growth trajectories of the skills. To overcome this methodological difficulty, we resort to fixed effect analysis, which controls for bias due to time-invariant unmeasured characteristics (Allison 1994). The fixed effect model is shown in the equation below:
. (11)
Cognitive and non-cognitive skills are represented by for child i at time t, where t represents
different grades with t=0 indicating the lowest grade. The equation states that skills are a linear function of time-varying characteristics ( ). In our study, this includes family income and
parents’ marital status. represents all time-invariant unobserved characteristics that might also
influence children’s skill formation, such as parents’ genetic makeup, parents' cognitive skills, and parents' non-cognitive skills. represents a stochastic error term.9
Within a fixed-effect framework, bias due to time-invariant heterogeneity, , is
eliminated because all time-invariant observed and unobserved characteristics are purged from fixed-effect estimates. For example, parents’ own cognitive and non-cognitive skills are likely to be positively correlated with their own socioeconomic status and with their children’s cognitive and non-cognitive skills. To the extent that parental skills are constant across time, the fixed-effect model eliminates this potential source of bias.
Despite its advantages, fixed-effect analysis is also limited in two important ways. First, the influences of time-invariant factors that affect skill formation cannot be estimated. So while we gain in eliminating fixed unobserved measures that may introduce bias, we lose the ability to detect the effect of key time-invariant factors, such as mothers’ education, on skill formation. Second, fixed-effect estimates for our two time-varying predictors—family income and marital status—are derived from variation within individuals across time, although we interpret them as if they are applicable for all persons. With the understanding of the advantages and disadvantages associated with our various statistical approaches, we move on to discussing our results in the next section.
9 We estimate fixed effect models in Stata.
Sit = β0 + β1Xit + γ i +ε it
Sit
Xit
γ i
ε it
γ i
Cognitive and Non-cognitive Skills in Intergenerational Social Mobility 19
RESULTS
Descriptive Statistics
Table A1 in the Appendix presents the weighted descriptive statistics for the sample.
Table A2 in the Appendix shows the correlation matrix of the study variables. Not surprisingly,
Table A2 shows that both family income and mothers’ education are positively correlated to
children’s cognitive skills, measured from kindergarten to 5th grade. Interestingly, the table also
shows that while the correlations between family SES and children’s non-cognitive skills are
positive, they are smaller in magnitude than the correlations between family SES and cognitive
skills at each point in time. Both cognitive and non-cognitive skills are positively correlated with
children’s later verbal achievement. Once again, however, we see that the correlations with
cognitive skills are larger in magnitude than those with non-cognitive skills. Taken together, the
statistics suggest that the mediating effect of non-cognitive skills may be weaker than the
mediating effect of cognitive skills.
Decomposition of Family SES Effects
Our first statistical approach is to use structural equation modeling to decompose the
effect of family SES on children’s academic achievement into three components: (1) direct
effect, (2) indirect effect via cognitive skills and (3) indirect effect via non-cognitive skills. In
order to understand the variation in the mediating role of children’s skills over the life course, we
estimate the relationships illustrated in Figure 2 five times, alternatively using skills measured at
(1) fall of kindergarten entry, (2) 1st grade, (3) 3rd grade, and (4) 5th grade.10 The results from
these decomposition models are presented in Table A3 and A4 in the Appendix. In Table A3, we
present the estimated effects of our covariates on 8th grade verbal achievement across these five
models. For example, column 1 shows the effects of child and family characteristics, including
children’s cognitive and non-cognitive skills, on 8th grade verbal achievement, using measures
of children’s skills assessed at kindergarten entry. Column 4 shows the estimated effects with
skills measured at 5th grade. In the same manner in Table A4, we present the estimated effects of
child and family characteristics on children’s cognitive and non-cognitive skills from models
where skills are alternatively measured from fall of kindergarten entry to 5th grade. 10 Tests were also administered in the spring of kindergarten but we only present results using tests administered in the fall of kindergarten for parsimony. The spring kindergarten results in all cases are consistent with the fall kindergarten results.

Cognitive and Non-cognitive Skills in Intergenerational Social Mobility 20
The results in Table A3 show that family SES (i.e. permanent income and mothers’
education), children’s skills, and our control variables all predict 8th grade verbal achievement in
the expected directions. The results show that cognitive and non-cognitive skills measured as
early as the fall of kindergarten entry affect later achievement. We also see that the effect of
cognitive skills is larger than the effect of non-cognitive skills, about three times as large at each
point in time. These findings are consistent with studies of Lleras (2008) and Clasessen, Duncan
and Engel (2008), who also find that “hard” skills are more predictive of later achievement than
“soft” skills.
Turning to the predictors of cognitive skills from our five models that alternatively use
skills measured at different points in time in Table A4, we see that (1) permanent income and
mothers’ education have sizable effects on cognitive skills measured at all four time-points, (2)
the effect of permanent income remains relatively constant across time, and (3) the effect of
mothers’ education on cognitive skills slightly increases across time. Comparing these results to
those for non-cognitive skills, we observe some interesting differences. First, permanent income
and mothers’ education are both poorly predictive of early measures of children’s non-cognitive
skills. Permanent income does not have a significant effect on non-cognitive skills measured in
the fall of kindergarten. Neither does mothers’ education at baseline or in 1st grade. Second,
whereas the effects of family SES on cognitive skills remain relatively stable across time, the
effects of family SES on non-cognitive skills significantly increase over time. By 3rd grade, the
effects of both income and mothers’ education on non-cognitive skills become significant and
sizable. Third, despite the growing effect of family SES on non-cognitive skills, cognitive skills
remain more sensitive to family income and mothers’ education than non-cognitive skills. For
example, the effects of income and mothers’ education on 5th grade measures of cognitive skills
are 7.501 and 3.219, respectively. In contrast, the effects of income and mothers’ education on
5th grade measures of non-cognitive skills are 3.208 and 1.053, respectively.
Table 1 summarizes the results from Tables A3 and A4 by presenting the total, direct and
indirect effects of family SES on achievement across time. This table highlights two key points.
First, it shows that while the direct effects of permanent income and mother’s education on
children’s 8th grade verbal achievement decline over time, the indirect effects via cognitive and
non-cognitive skills increase with time for both income and mother’s education. For example,
the direct effect of income is 1.93 when skills are measured at kindergarten but reduces to 0.29

Cognitive and Non-cognitive Skills in Intergenerational Social Mobility 21
when skills are measured at 5th grade. On the other hand, the indirect effect via cognitive skills
on 8th grade achievement increases from 2.55, when measured at baseline, to 3.53, when
measured in 5th grade. Likewise, the indirect effect via non-cognitive skills also increases from
0.14 to 0.53 when we move from baseline measures of non-cognitive skills to 5th grade
measures. The second key point is that, relative to cognitive skills, non-cognitive skills mediate
an increasingly greater proportion of the indirect effects of family SES over time. For example,
only 5% of the indirect effect of permanent income that is mediated by skills could be attributed
to non-cognitive skills at baseline. By 5th grade, that percentage increased to 13%. In contrast,
the relative importance of cognitive skills as a mediating factor declines over time. At baseline,
95% of the indirect effect of permanent income via skills could be attributed to cognitive skills.
That percentage drops to 87% by 5th grade.
Table 1. Total, Direct and Indirect Effects of Income and Education on Children’s 8th grade Verbal Achievement from Models using Skills Alternatively Measured at Kindergarten, 1st Grade, 3rd Grade and 5th Grade K 1st grade 3rd grade 5th grade Permanent income Total effect 4.62 4.58 4.56 4.36
Direct effect 1.93 2.01 0.57 0.29 Indirect effect via cognitive skills 2.55 2.32 3.60 3.53
Indirect effect via non-cognitive skills 0.14 0.25 0.40 0.53
% of indirect effects mediated by Cognitive skills 95 90 90 87
Non-cognitive skills 5 10 10 13 Mother's education Total effect 2.73 2.70 2.71 2.78
Direct effect 1.99 1.69 1.15 1.09 Indirect effect via cognitive skills 0.72 0.91 1.46 1.52
Indirect effect via non-cognitive skills 0.02 0.09 0.11 0.18
% of indirect effects mediated by Cognitive skills 98 91 93 89
Non-cognitive skills 2 9 7 11 Notes: The total, direct and indirect effects presented in this table were calculated from structural equation modeling estimates presented in Appendix Tables A3 and A4.

Cognitive and Non-cognitive Skills in Intergenerational Social Mobility 22
In sum, the results highlight a few important differences in the way cognitive and non-cognitive skills mediate the relationship between family SES and later achievement. First, while both cognitive and non-cognitive skills are significant determinants of children’s academic achievement, we find that “hard” skills are stronger predictors of school performance than “soft” skills. Second, cognitive skills are more dependent on family origin than non-cognitive skills. In fact, income and mothers’ education have no effect on early measures of non-cognitive skills, especially at young ages. Third, non-cognitive skills developed later in life are more malleable to family SES than non-cognitive skills developed earlier in life. In contrast, family SES has a consistently strong effect on cognitive skills, no matter when it is measured. Finally, the mediating role of non-cognitive skills increases over time whereas the mediating role of cognitive skills declines with time.
Effect of Family Background on Skill Trajectories In the second part of our analysis, we use growth curve models and fixed-effect analysis
to better understand the changing relationship between family environment and skill formation. In particular, we are interested in detecting whether there are sensitive periods when skills are more or less malleable to family environment and whether this period occurs later for non-cognitive skills than for cognitive skills. The sensitive period hypothesis states that cognitive skills are entirely determined in early childhood and non-cognitive skills are gradually determined in later childhood (Borghans et al. 2008; Cunha and Heckman 2008; Guo and Harris 2000). If this were the case, then one would expect to see family SES strongly affecting the initial conditions of cognitive skills but having no effect on the initial conditions of non-cognitive skills. At the same time, family SES would have a strong effect on the growth trajectory of non-cognitive skills, which are posited to only undergo changes later in life, but family SES would have no effect on the growth trajectories of cognitive skills, which are posited to be fully determined by early childhood. This hypothesis would also be consistent with a finding from a fixed-effect analysis that changes in family income and parental marital status over time have no effect on changes in cognitive skills but have significant effect on changes in non-cognitive skills. Of course, the actual trajectories of cognitive and non-cognitive skills can be more complicated than this stylized hypothesis. For example, cognitive skills may be primarily determined early in life but continue to be affected by family SES even in later childhood. Nevertheless, we use this stylized hypothesis as a useful background for interpreting the results in Tables 3 and 4.

Cognitive and Non-cognitive Skills in Intergenerational Social Mobility 23
Table 2 presents the results from growth curve analysis predicting the developmental
trajectories of cognitive and non-cognitive skill formation over time. For each covariate, we
obtain estimates of its effect on initial inter-personal differences in skills (intercepts) and on
growth rates of skills over time (slopes).
Table 2. Linear Growth Models of Cognitive and Non-cognitive Skills Trajectories (N=9,017)
Cognitive Skills Non-cognitive skills
Intercept Slope Intercept Slope
Permanent Income 6.818 *** 0.133 1.912 * 0.370 * Education 2.159 *** 0.203 ** 0.256 0.199 * Black -0.331 -1.76 *** -6.794 *** 0.276 Asian 6.613 ** -0.999 * 3.39 1.716 ** Hispanic -3.252 * -0.019 1.678 0.643 Male -6.453 *** 0.348 * -11.732 *** -0.854 ** Parental Investment 19.035 *** -1.278 14.162 ** -2.864 ** Single mother -2.735 * 0.087 -4.143 ** -0.159 Mother's age at first birth 0.5 *** 0.01 0.127 0.014
Intercept -42.476 *** -1.175 30.840 ** -4.833 * Residual variance 0.712 0.954 0.816 0.920 Model fit χ2(df) RMSEA CFI TLI 3989.89*** (407) 0.032 0.832 0.806
Note: All other covariates are measured at baseline. Both cognitive and non-cognitive skills are measured at percentile scores, normed with respect to the sample at each wave. All models account for stratification by schools by clustering according to teachers' id. Correlation between the slope of cognitive skills and the slope of non-cognitive skills is 1.614. *** p<0.001, ** p <0.01, * p<0.05, † p<0.10 (two-tailed test)
Both permanent income and mother's education are strong predictors of initial differences
in cognitive skills, with intercept coefficients estimated at 6.818 and 2.159, respectively. On the
other hand, there is no effect of mother's education on initial difference in children’s non-
cognitive skills, and the effect of income on non-cognitive skills is 1.912, approximately one-

Cognitive and Non-cognitive Skills in Intergenerational Social Mobility 24
quarter of the size of the effect of income on cognitive skills. In contrast, family SES seems to
have a slightly stronger effect on the slope of non-cognitive skills than on the slope of cognitive
skills. Both income and mother's education are significantly associated with the growth rate of
non-cognitive skills. On the other hand, income has no significant effect on the growth rate for
cognitive skills while mother's education has a positive effect. Mother's education seems to
equally affect the growth rate for both types of skills.
Overall, the results offer support for the sensitive period hypothesis: (1) there is a larger
early gradient by family SES in cognitive skills than in non-cognitive skills and (2) the growth
trajectories of non-cognitive skills are more sensitive to family SES than the growth trajectories
of cognitive skills. However, while family SES has comparatively weaker effects on growth in
cognitive skills over time, we note that mother's education has an enduring effect on cognitive
skill development even in later childhood.
Table 3 presents the results from fixed-effect analysis, which estimates the effect of time-
varying covariates on changes in cognitive and non-cognitive skills between kindergarten and 5th
grade. Overall, fixed-effect results corroborate the main finding earlier drawn from the growth
curve analysis. Specifically, the results show that changes in children’s cognitive skills are not
significantly associated with changes in family income or marital status. This finding is
consistent with the claim that cognitive skills develop early and become less malleable to social
environment over time. In contrast, changes in non-cognitive skills are more significantly
associated with changes in family income and marital status. Non-cognitive skills are negatively
associated with changes in marital status (i.e. moving from a two-parent to a one-parent
household negatively affects non-cognitive skills) and positively associated with changes in
family income, although this association is only marginally significant. The results from the
fixed-effect analysis thus lend support to the sensitive period hypothesis, which predicts that
non-cognitive skills, postulated to develop later in life, should be more sensitive to changes in
family environment over time. Kim’s (2011) recent study reports results similar to ours.11
11 Although Kim (2011) reports, in parallel, the negative effects of parental divorces on children cognitive and non-cognitive outcomes, his results for non-cognitive outcomes are much stronger and more consistent than those for cognitive outcomes.

Cognitive and Non-cognitive Skills in Intergenerational Social Mobility 25
Table 3. Fixed Effect Estimates of Changes in Cognitive and Non-cognitive Skills from Fall of Kindergarten to 5th Grade
Cognitive Skills Non-cognitive Skills
Income 0.281 0.984† Single parent 0.803 -3.366 * Constant 48.160 *** 43.090 *** Number of cases 26,119 22,406 Number of clusters 6,838 6,352 R-squared 0.111 0.022 Notes: Models account for stratification by schools by clustering analysis according to teacher id. *** p<0.001, ** p <0.01, * p<0.05, † p<0.10 (two-tailed test)
DISCUSSION AND CONCLUSIONS
In this paper, we evaluate the relative roles of cognitive versus non-cognitive traits in
mediating the effects of family socioeconomic status (SES) on children's academic achievement.
Moreover, in contrast to prior studies that have examined these relationships at a single point in
time, we explicitly consider the differences between the developmental trajectories of cognitive
and non-cognitive skills and the implications of these differences for their respective roles in
mediating the relationship between family SES background and children’s academic
achievement.
We first use structural equation models to decompose total effect of family SES on
children’s academic performance into, net of a direct component, two indirect components via
cognitive versus personality traits and compare the relative importance of the two pathways. We
estimate a baseline model which examines how baseline measures of family SES and children’s
skills relate to 8th grade measures of academic achievement. Next, to better capture dynamics in
skill development, we re-estimate these models alternatively using skills measures at
kindergarten (spring), 1st grade, 3rd grade and 5th grade. Our results from this first set of
analyses show that there are important differences in the ways in which cognitive and non-
cognitive skills mediate the effects of family SES on academic achievement over the life course.
To better identify the dynamic process in skill acquisition, we use growth-curve and fixed-effect
models in our second-stage of analyses to determine how family SES affect the evolution of
cognitive and non-cognitive skills over time.

Cognitive and Non-cognitive Skills in Intergenerational Social Mobility 26
Overall, we find that non-cognitive skills are weaker mediators of family SES effects
than cognitive traits for two reasons: 1) non-cognitive skills are less predictive of achievement
outcomes than cognitive skills and 2) non-cognitive skills are also less affected by family SES
than are cognitive skills. First, while both types of skills positively affect later achievement, the
effects of non-cognitive skills are about one third the size of the effects of cognitive skills on
later achievement. These findings are relevant to ongoing debates among academics and policy-
makers regarding the relative importance of “soft” versus “hard” skills for children’s school
success. While many argue that “soft” skills are as important, if not more important, than “hard”
skills as determinants of future success in schools, our results offer support to the findings of
Duncan and colleagues (Duncan et al. 2007; Claessens, Duncan and Engel, 2009; Duncan and
Magnuson 2011), who find the opposite to be true.
The second reason why non-cognitive skills are weaker mediators than cognitive skills is
that they are less influenced by family SES. In fact, there are no significant effects of mothers’
education or permanent family income on children’s non-cognitive skills in kindergarten and 1st
grade. In contrast, family income and mothers’ education have sizable effects on children’s
cognitive skills throughout time. That non-cognitive skills are only weakly predicted by family
SES is striking because so many social science theories postulate the opposite (Boudon 1974;
Bourdieu 1977; Lareau 2003; Kao and Tienda 1995; Goyette and Xie 1999; Nisbett 2009).
Nevertheless, our results echo the results in Mood, Jonsson and Bihagen (forthcoming) who find
similar results using Swedish registry data.
Finally, our findings highlight the importance of taking a dynamic view of skill
formation. Static approaches fail to capture differences in the developmental trajectories of
cognitive and non-cognitive skills that are crucial to our understanding of how skills mediate
family SES effects over time. Specifically, our findings largely confirm the sensitive period
hypothesis of skill acquisition, which argues that there are periods during which skills are more
or less malleable to social environment and that the sensitive period for non-cognitive skills
occurs later than the sensitive period for cognitive skills. Our findings show that family SES is
(1) more likely to affect initial differences in cognitive skills than non-cognitive skills but (2)
more likely to affect changes in non-cognitive skills over time. In other words, because cognitive
skills develop earlier in the life-course, they are less vulnerable to changes in family SES over
time. In contrast, because non-cognitive skills develop later in life, they are more sensitive to

Cognitive and Non-cognitive Skills in Intergenerational Social Mobility 27
family SES throughout the life-course. As a result, while the mediating effects of non-cognitive
skills start off extremely weak, their roles as mediators do increase over the life-course.
Of course, this study is not without its caveats. Measurement error in our indicators of
non-cognitive traits poses a potential problem. Cognitive traits are likely to be more precisely
measured than non-cognitive traits, both because the method of assessing non-cognitive traits is
cruder and because non-cognitive traits are more multi-dimensional in nature. One may argue
that the weak correlations we find for non-cognitive traits are due to larger measurement error in
measuring them rather than their truly smaller “effects.” It is unlikely however that all our
findings are attributable to measurement error. First, to some degree, we address these concerns
through our use of factor analysis to capture the latent structure that underlies our five indicators
of non-cognitive skills. This method allows us to reduce measurement error and increase the
reliability of our measures. Second, while measurement error may, in part, account for why we
find weak estimated effects of family SES on early measures of non-cognitive skills, it cannot
explain why the pattern of the observed effects increases with time. If measurement error is
present in early measures, it should also be presented in later measures, and yet family SES
becomes significantly predictive of later measures of non-cognitive skills.
Our study faces the same problems of unobserved heterogeneity as all studies analyzing
observational data. In this particular case, our main concern is that we cannot observe parents’
own skills, neither their cognitive nor their non-cognitive skills. The omission of parental skills is
likely to positively bias any estimates of family SES effects on children’s skills, as parents'
cognitive and non-cognitive skills are likely to positively correlate with their income and
education. For two reasons, however, we are doubtful that the main conclusions of our study are
all driven by unobservable parental skills. First, concerns due to time-invariant unobserved
heterogeneity are, at least in part, addressed by our fixed-effect estimates, which largely confirm
findings from our decomposition models and growth curve analysis. Second, better controlling
for unobserved parental skills would only further reduce the already weak associations between
family SES and early measures of children’s non-cognitive skills. Such a result would further
support our main argument that non-cognitive traits developed early in life are largely
uncorrelated with family SES. Moreover, unobserved parental skills cannot easily explain why
the relationship between family SES and children’s non-cognitive traits increases over time.
Cognitive and Non-cognitive Skills in Intergenerational Social Mobility 28
Ideally, we would like to observe children as they transition into young adulthood, a
period where non-cognitive skills are presumed to undergo further changes. Unfortunately, we
are constrained by the data and do not observe the children in study beyond 8th grade. In future
analysis, we will replicate our analysis using other data on adolescents and young adults in order
to determine if our results hold when we focus on educational achievement outcomes measure
later in the life-course. Future work will also examine the relative roles of cognitive and non-
cognitive skills in mediating the effect of family SES on attainment outcomes such as labor
market performance. In examining their relative effects on educational achievement, we find that
“hard” skills play a greater mediating role than “soft” skills. Results may be quiet different when
considering how these skills mediate the relationship between family SES and labor market
performance. We will explore these questions in future work.
In recent years, there has been renewed interest in the role that non-cognitive skills play
in the intergenerational transmission of advantage and disadvantage. To date, we know much
more about how non-cognitive skills affect attainment outcomes than we do about their social
origins. Taken as a whole, the results of this research have important implications for research on
intergeneration social mobility. Our results show that while non-cognitive traits are predictive of
academic success, they are only weakly correlated with commonly understood dimensions of
vertical social hierarchy. This finding presents a puzzle because it sits in contrast with much of
what we believe to be true regarding the role of the family in skill formation. In this sense, the
paper raises important and largely unanswered questions. For example, are non-cognitive skills,
in contrast to cognitive skills, more uniquely individual determinants of status attainment? How
might other aspects of the family, such as cultural norms, shape children’s non-cognitive
development? Because non-cognitive skills develop later in life, might factors such as peer
groups, neighborhoods and schools play a greater role in shaping children’s non-cognitive skills
than the family? While we are unable to directly answer these questions, we have produced
important empirical findings that raise critical questions and offer new avenues for future
research.

Cognitive and Non-cognitive Skills in Intergenerational Social Mobility 29
REFERENCES
Allison, Paul D. 1994. “Using Panel Data to Estimate the Effects of Events.” Sociological Methods and Research 23:179-199. Becker, Gary Stanley. 1993. Human Capital: A Theoretical and Empirical Analysis, with Special
Reference to Education. Chicago: The University of Chicago Press. Blau, Peter and Otis Dudley Duncan. 1967. The American Occupational Structure. New York: John
Wiley & Sons. Bollen, Kenneth. A. 1989. Structural Equations with Latent Variables. Wiley Series in Probability and
Mathematical Statistics. New York: Wiley. Bollen, Kenneth and Jennie E. Brand. 2010. “A General Panel Model with Random and Fixed Effects: A
Structural Equations Approach.” Social Forces 89(1):1-34. Bollen, Kenneth A. and Patrick J. Curran. 2006. Latent Curve Models: A Structural Equation Perspective.
Hoboken, NJ: John Wiley & Sons. Borghans, Lex, Angela Lee Duckworth, James J. Heckman, and Bas ter Weel. 2008. “The Economics and
Psychology of Personality Traits.” Working Paper No. 13810, National Bureau of Economic Research, Cambridge, MA.
Boudon, Raymond. 1974. Education, Opportunity and Social Inequality. New York: John Wiley & Sons. Bourdieu, Pierre. 1977. “Cultural Reproduction and Social Reproduction.” Pp. 487-510 in Power and
Ideology in Education, edited by J. Karabel and A. H. Halsey. New York: Oxford University Press. Bradley, Robert H., Bettye M. Caldwell and Stephen L. Rock. 1988. “Home Environment and School
Performance: A Ten-Year Follow-Up and Examination of Three Models of Environmental Action.” Child Development 59(4): 852-867.
Brand, Jennie, and Yu Xie. 2010. “Who Benefits Most from College? Evidence for Negative Selection in Heterogeneous Economic Returns to Higher Education.” American Sociological Review 75:273-302.
Brooks-Gunn, Jeanne, Pamela Klebanov, and Greg J. . 1996. “Ethnic Differences in Children's Intelligence Test Scores: Role of Economic Deprivation, Home Environment, and Maternal Characteristics.” Child Development 67:396-408.
Bronte-Tinkew, J., J. Carrano, A. Horowitz, and A. Kinukawa. 2008. “Involvement among Resident Fathers and Links to Infant Cognitive Outcomes.” Journal of Family Issues 29:1211-1244.
Chetty, Raj, John N. Friedman, Nathaniel Hilger, Emmanuel Saez, Diane Whitmore Schanzenbach and Danny Yagan. 2010. “How Does your Kindergarten Classroom Affect Your Earnings? Evidence from Project Star.” Working Paper No. 16381, National Bureau of Economic Research, Cambridge, MA. (http://www.nber.org/papers/w16381).
Claessens, Amy, Greg Duncan, and Mimi Engel. 2009. “Kindergarten Skills and Fifth-grade Achievement: Evidence from the ECLS-K,” Economics of Education Review 28(4): 415-427.
Cunha, Flavio and James Heckman. 2009. “The Economics and Psychology of Inequality and Human Development.” Journal of the European Economic Association 7:320-364.
Duckworth, Angela L. and Martin E.P. Seligman. 2005. “Self-Discipline Outdoes IQ in Predicting Academic Performance of Adolescents.” Psychological Science 16: 939-944.
Duncan, Greg J. and Katherine Magnuson. 2011. “The Nature and Impact of Early Achievement Skills, Attention Skills, and Behavior Problems.” Pp.48-69 in Wither Opportunity? Rising Inequality, Schools, and Children’s Life Chances, edited by G. J. Duncan and R. J. Murnane. New York: Russell Sage Foundation.

Cognitive and Non-cognitive Skills in Intergenerational Social Mobility 30
Duncan, Greg, Kalil, Ariel, Mayer, Susan E., Tepper, Robin, and Payne, Monique R. 2005. “The Apple Does not Fall Far from the Tree,” Unequal Chances: Family Background and Economic Success, edited by Samuel Bowles, Herbert Gintis, and Melissa Osborne Groves. Princeton: Princeton University Press.
Duncan, Greg J.and Jeanne Brooks-Gunn. 1997. “Income Effects Across the Life Span: Integration and Interpretation.” Pp. 596-610 in Consequences of Growing Up Poor, edited by G. J. Duncan & J. Brooks-Gunn. New York: Russell Sage Foundation.
Duncan, GregJ., Chantelle J. Dowsett, Amy Claessens., Katherine Magnuson., Aletha C. Huston,, Pamela Klebanov, Linda S. Pagani, Leon Feinstein, Mimi Engel, Jeanne Brooks-Gunn, Holly Sexton, Kathryn Duckworth, and Crista Japel. 2007. “School Readiness and Later Achievement.” Developmental Psychology, 43(6): 428-46.
Farkas, George and Keven Vicknair. 1996. “Appropriate Tests of Racial Wage Discrimination Require Controls for Cognitive Skill: Comment on Cancio, Evans, and Maume.” American Sociological Review, 61(4): 557-560.
Floderus-Myrhed, Birgitta , Nancy Pedersen and Ingrid Rasmuson. 1980. “Assessment of Heritability for Personality, Based on a Short-form of the Eysenck Personality Inventory: A Study of 12,898 Twin Pairs.” Behavioral Genetics. 10 (2):153-162.
Goyette, Kimberly and Yu Xie. 1999. “Educational Expectations of Asian American Youths: Determinants and Ethnic Differences.” Sociology of Education, 72: 22-36.
Griliches, Zvi and William M. Mason. 1972. “Education, Income, and Ability.” Journal of Political Economy 80(3): S74-S103.
Guo, Guang and Kathleen. M. Harris. 2000. “The Mechanisms Mediating the Effects of Poverty on Children's Intellectual Development.” Demography 37:431-447.
Hall, Matthew and George Farkas. 2011. “Adolescent Cognitive Skills, Attitudinal/Behavioral Traits and Career Wages.” Social Forces 89(4): 1261-1285.
Hauser, Robert M., Shu-Ling Tsai, and William H. Sewell. 1983. “A Model of Stratification with Response Error in Social and Psychological Variables.” Sociology of Education 56:20-46.
Heckman, James J. 2006. “Skill Formation and the Economics of Investing in Disadvantaged Children,” Science 312: 1900-1902.
Heckman, James J. 2011. “The American Family in Black & White: A Post-Racial Strategy for Improving Skills to Promote Equality.” Daedalus 140: 70-89.
Heckman, James J., Seong H. Moon, Rodrigo R. Pinto, Peter Savelyev, Lawrence Schweinhart, Azeem Shaikh, and Adam M. Yavitz. 2007. “The Perry Preschool Project: A Reanalysis.” Department of
Economics, University of Chicago, Chicago, IL. Unpublished manuscript. Heckman, James J., Jora Stixrud and Sergio Urzua. 2006. “The Effects Of Cognitive and Noncognitive
Abilities On Labor Market Outcomes and Social Behavior.” Journal of Labor Economics, 24:411-482.
Jackson, Michelle. 2006. “Personality Traits and Occupational Attainment,” European Sociological Review 22 (2):187-199.
Jencks, Christopher, Susan Bartlett, Mary Corcoran, James Crouse, David Eaglesfield, Gregory Jackson, Kent, McClelland, Peter Mueser, Michael Olneck, Joseph Schwartz, Sherry Ward, and Jill
Williams. 1979. Who Gets Ahead? The Determinants of Economic Success in America. New York: Basic Books.
Cognitive and Non-cognitive Skills in Intergenerational Social Mobility 31
Jencks, Christopher, Marshall Smith, Henry Acland, Mary Jo Bane, David Cohen, Herbert Gintis, Barbara Heyns, and Stephan Michelson. 1972. Inequality: A Reassessment of the Effect of Family and Schooling in America. New York: Basic Books.
Kao, Grace and Marta Tienda. 1995. “Optimism and Achievement: The Educational Performance of Immigrant Youth.” Social Science Quarterly 76:1-19.
Kaushal, Neeraj, Katherine Magnuson, and Jane Waldfogel. 2011. “How is Family Income Related to Investments in Children’s Learning?” Pp.187-205 in Wither Opportunity? Rising Inequality, Schools, and Children’s Life Chances, edited by G. J. Duncan and R. J. Murnane. New York: Russell Sage Foundation.
Keane, Michael, and Kenneth Wolpin. 1997. The Career Decisions of Young Men. Journal of Political Economy 105(3): 473-522.
Kim, Hyun Sik. 2011. “Consequences of Parental Divorce for Child Development.” American Sociological Review 76: 487-511.
Klebanov, Pamela, Jeanne Brooks-Gunn, Cecelia McCarton, and Marie C. McCormick. 1998. “The Contribution of Neighborhood and Family Income to Developmental Test Scores over the First Three Years of Life.” Child Development 69:1420-1436.
Korenman, Sanders, Joanne Miller, and J. E. Sjaastad. 1995. “Long-term Poverty and Child-Development in the United-States: Results from the NLSY.” Children and Youth Services Review 17:127-155.
Lareau, Annette. 2003. Uneqal Childhoods: Class, race, and Family Life. Berkeley and Los Angeles, California: University of California Press.
Little, Roderick and Donald Rubin. 1987. Statistical Analysis with Missing Data. New York: John Wiley. Lleras, Christy. 2008. “Do Skills and Behaviors in High School Matter? The Contribution of
Noncognitive Factors in Explaining Differences in Educational Attainment and Earnings.” Social Science Research 37 (3): 888-902.
McLanahan, Sara.S. and Gary Sandefur. 1994. Growing up with a Single Parent. Cambridge, MA: Harvard University Press.
Mincer, Jacob. 1974. Schooling, Experience and, Earnings. New York: Columbia University Press. Mood, Carina, Jan O. Jonsson, and Erik Bihagen. Forthcoming. “Socioeconomic persistence across
generations: The role of cognitive and non-cognitive processes.” in From Parents to Children. The Intergenerational Transmission of Advantage, edited by John Ermisch, Markus Jäntti, and Timothy Smeeding. New York: Russell Sage Foundation.
Muthén, Bengt. 1997. “Latent Variable Modeling of Longitudinal and Multilevel Data.” Pp.453-480 in Sociological Methodology 1997, edited by A. Raferty. Washington DC: American Sociological Association.
Muthén, Linda K. and Bengt O. Muthén. 1998-2010. Mplus User’s Guide. 6th Ed. Los Angeles, CA. Nisbett, Richard E. 2009. Intelligence and How to Get It. New York: Norton. Parcel, Tobey L. and Mikaela J. Dufur. 2001. “Capital at Home and at School: Effects on Student
Achievement.” Social Forces 79:881-911. Plomin, Rorbert, J. C. Defries, and John C. Loehlin. 1977. “Genotype-Environment Interaction and
Correlation in Analysis of Human Behavior.” Psychological Bulletin 84(2): 309-322. Rosenbaum, James. 2001. Beyond College for All: Career Paths for the Forgotten Half. New York:
Russell Sage Foundation. Rowe, David C. and Robert Plomin. 1981. “The Importance of Nonshared Environmental Influences in
Behavioral Development.” Developmental Psychology 17(5): 517-531.

Cognitive and Non-cognitive Skills in Intergenerational Social Mobility 32
Sewell, William H., Archibald O. Haller, and Alejandro Portes. 1969. The Educational and Early Occupational Attainment Process.” American Sociological Review 34:82-92.
Shonkoff, Jack and Deborah Phillips, eds. 2000. From Neurons to Neighborhoods:The Science of Early Childhood Development. Washington, DC: National Academy Press.
Smith, Herbert L. and Brian Powell. 1990. “Great Expectations: Variations in Income Expectations among College Seniors.” Sociology of Education 63:194-207.
Snow, Catherine E., M. Susan Burns, and Peg Griffin, eds. 1998. Preventing Reading Difficultiesin Young Children. Washington, DC: National Research Council, National Academy Press.
Solon, Gary. 1999. “Intergenerational Mobility in the Labor Market.” In Handbook of Labor Economics, Volume 3, edited by O. Ashenfelter and D. Card. Amsterdam: Elsevier Science.
Tourangeau, Karen, Christine Nord, Thanh Leˆ, Judith M. Pollack, and Sally Atkins-Burnett. 2006. Early Childhood Longitudinal Study, Kindergarten Class of 1998-99 (ECLS-K), Combined User’s Manual for the ECLS-K Fifth-Grade Data Files and Electronic Codebooks (NCES 2006-032). U.S. Department of Education. Washington, DC: National Center for Education Statistics.
Warren, John Robert, Jennifer T. Sheridan and Robert M. Hauser. 2002. “Occupational Stratification across the Life Course: Evidence from the Wisconsin Longitudinal Study.” American Sociological Review. 67(3): 432-455.
Wolfe, Raymond N. and Scott D. Johnson. 1995. “Personality as a Predictor of College Performance Educational and Psychological Measurement.” 55: 177-185.

Cognitive and Non-cognitive Skills in Intergenerational Social Mobility 33
APPENDIX Table A1. Weighted Means and Standard Deviations
Variables Means S.D. Verbal Achievement 51.85 29 Cognitive Skills
Fall Kindergarten 52.54 28.43 1st grade 53.55 27.44 3rd grade 54.01 27.71 5th grade 54.67 27.49
Non-cognitive Skills Fall Kindergarten 51.82 28.78 1st grade 51.62 29.38 3rd grade 49.39 28.86 5th grade 50.43 29.06
Family SES (Log) Permanent Income 10.89 0.77 Mothers' Education (Range: 1-9) 4.65 1.7
Parental Investments Log Number of Books 4.15 0.89 Years of Educ. Parents Expect Child to Complete 4.10 1.04 Freq. of Activity (1 = “Not at all”, 4 = “everyday”)
Read Books 3.34 0.73 Tell Stories 2.75 0.89 Sing Songs 3.15 0.9 Arts and Craft 2.66 0.84 Chores 3.31 0.83 Play Games 2.8 0.79 Nature Activities 2.27 0.86 Play Build 2.37 0.91 Play Sports 2.67 0.88
Single-parent Household 0.18 0.38 White (Omitted Variable) 0.68 0.47 Black 0.13 0.34 Asian 0.03 0.16 Hispanic 0.12 0.32 Male 0.48 0.5 Mother’s Age at First Birth (Range: 12-46) 24.88 5.3
Notes: Children’s verbal achievement is based on subjective teacher assessments of children’s reading proficiency. Cognitive skills are IRT reading scores. Children’s non-cognitive scores are based off of teachers’ subjective assessments. Verbal achievement, cognitive skills and non-cognitive scores have been transformed into percentile scores and normed with respect to the sample at each point in time. In all cases, sample weights provided by the ECLS-K are used to calculate descriptive statistics.

Cognitive and Non-cognitive Skills in Intergenerational Social Mobility 34
Table A2. Zero Order Correlations of Main Study Variables
1 2 3 4 5 6 7 8 9 10 11 12 13 14 15 16 17 18 19 20 21
1 1.00
2 .43 1.00
3 .45 .76 1.00
4 .48 .64 .74 1.00
5 .56 .57 .62 .69 1.00
6 .56 .53 .58 .65 .82 1.00
7 .24 .24 .23 .22 .23 .21 1.00
8 .25 .22 .23 .24 .24 .21 .68 1.00
9 .28 .21 .22 .23 .25 .23 .43 .46 1.00
10 .30 .21 .22 .24 .28 .25 .39 .43 .48 1.00
11 .33 .18 .20 .21 .26 .26 .33 .37 .42 .47 1.00
12 .30 .37 .32 .31 .37 .37 .13 .14 .15 .18 .20 1.00
13 .29 .32 .28 .26 .33 .34 .06 .07 .10 .12 .12 .53 1.00
14 -.16 -.17 -.17 -.18 -.20 -.20 -.12 -.12 -.11 -.14 -.13 -.44 -.19 1.00
15 .11 .16 .11 .11 .21 .20 .08 .08 .08 .07 .06 .27 .15 -.25 1.00
16 -.14 -.13 -.13 -.13 -.22 -.23 -.10 -.11 -.09 -.13 -.12 -.31 -.13 .36 -.51 1.00
17 .07 .05 .07 .08 .03 .05 .03 .03 .04 .06 .08 .03 .05 -.03 -.32 -.06 1.00
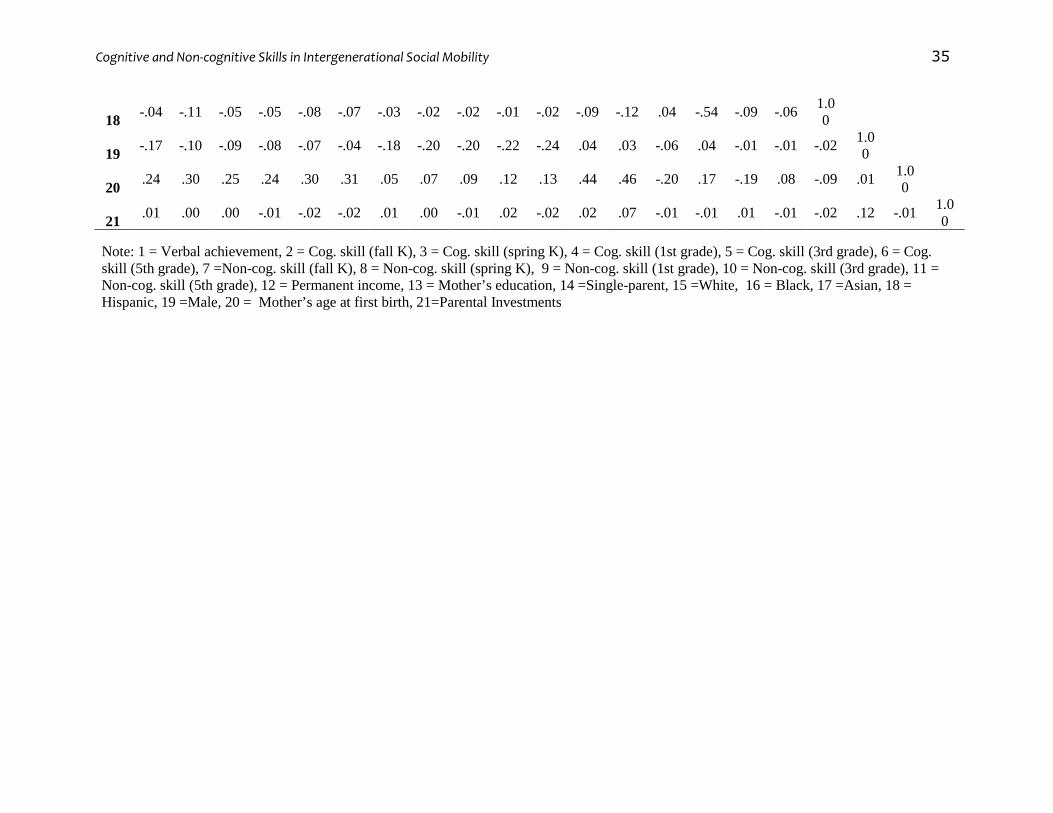
Cognitive and Non-cognitive Skills in Intergenerational Social Mobility 35
18 -.04 -.11 -.05 -.05 -.08 -.07 -.03 -.02 -.02 -.01 -.02 -.09 -.12 .04 -.54 -.09 -.06 1.00
19 -.17 -.10 -.09 -.08 -.07 -.04 -.18 -.20 -.20 -.22 -.24 .04 .03 -.06 .04 -.01 -.01 -.02 1.00
20 .24 .30 .25 .24 .30 .31 .05 .07 .09 .12 .13 .44 .46 -.20 .17 -.19 .08 -.09 .01 1.00
21 .01 .00 .00 -.01 -.02 -.02 .01 .00 -.01 .02 -.02 .02 .07 -.01 -.01 .01 -.01 -.02 .12 -.01 1.00
Note: 1 = Verbal achievement, 2 = Cog. skill (fall K), 3 = Cog. skill (spring K), 4 = Cog. skill (1st grade), 5 = Cog. skill (3rd grade), 6 = Cog. skill (5th grade), 7 =Non-cog. skill (fall K), 8 = Non-cog. skill (spring K), 9 = Non-cog. skill (1st grade), 10 = Non-cog. skill (3rd grade), 11 = Non-cog. skill (5th grade), 12 = Permanent income, 13 = Mother’s education, 14 =Single-parent, 15 =White, 16 = Black, 17 =Asian, 18 = Hispanic, 19 =Male, 20 = Mother’s age at first birth, 21=Parental Investments

Cognitive and Non-cognitive Skills in Intergenerational Social Mobility 36
Table A3. Direct Effect of Family SES, Skills and Covariates on Children’s Academic Achievement with Skills Alternatively Measured at Kindergarten, 1st Grade, 3rd Grade, and 5th Grade (N=9,017) Cognitive and Non-cognitive Skills Measured at
Fall Ka 1st gradeb 3rd gradec 5th graded
(1) (2) (3) (4) Permanent Income 1.926 * 2.007 * 0.57 0.294 Education 1.987 *** 1.692 *** 1.147 ** 1.085 *** Cognitive Skills 0.32 *** 0.369 *** 0.461 *** 0.471 *** Non-cognitive Skills 0.098 *** 0.12 *** 0.116 *** 0.165 *** Black -5.488 ** -5.194 ** -2.492 -0.026 Asian 2.305 0.614 3.533 1.965 Hispanic 3.031 * 1.364 2.635 * 2.634 * Male -8.384 *** -7.242 *** -6.747 *** -6.474 Parental Investments 2.946 4.861 6.419 ** 8.14 ** Single Parent -4.887 *** -4.084 ** -4.548 *** -4.366 *** Mother's age at first birth 0.196 0.208 * 0.123 0.083
Residual Variance 0.698 0.659 0.613 0.593
Note: Unstandardized estimates are presented. The dependent variable in columns 1 to 4 is 8th grade verbal achievement for all models. Cognitive and non-cognitive skills are measured alternatively from baseline to 5th grade. Verbal achievement, cognitive skills and non-cognitive skills are all measured as percentile scores, normed with respect to the sample at each wave. All other covariates are measured at baseline. All models account for stratification by schools by clustering according to teachers' id. a Model Fit Statistics: Chi-square (df)=2469.405(271); RMSEA=0.032; CFI=0.715, TFI=0.649. b Model Fit Statistics: Chi-square (df)=2544.257(271); RMSEA=0.032; CFI=0.717, TFI=0.651. c Model fit statistics: Chi-square (df)=81917.247(271); RMSEA=0.032; CFI=0.729, TFI=0.666. d Model fit statistic: Chi-square (df)=2585.006(271); RMSEA=0.032; CFI=0.734, TFI=0.673. *** p<0.001, ** p <0.01, * p<0.05, † p<0.10 (two-tailed test).

Cognitive and Non-cognitive Skills in Intergenerational Social Mobility 37
Table A4. Determinants of Cognitive and Non-cognitive Skills with Skills Alternatively Measured at Fall Kindergarten, Spring Kindergarten, 1st, 3rd and 5th Grade (N=9,017) Cognitive skills Non-cognitive skills
(1) (2) (3) (4) (5) (6) (7) (8)
Fall K 1st grade 3rd grade 5th grade Fall K 1st grade 3rd grade 5th grade
Permanent Income 7.974*** 6.289*** 7.802*** 7.501*** 1.413 2.09 3.433 ** 3.208 **
Education 2.265*** 2.474*** 3.156*** 3.219*** 0.172 0.764 0.929 * 1.053 *
Black 0.294 -1.812 -6.031** -9.44*** -6.631** -5.144* -6.287 ** -6.005 **
Asian 4.526* 8.268*** 0.162 1.052 4.264 4.718 6.924 ** 12.194 ***
Hispanic -5.684*** -1.407 -4.112** -4.368** 1.771*** 3.496* 3.684 * 3.487 *
Male -6.34*** -7.271*** -6.32*** -5.005*** -11.807 -13.046*** -13.685 *** -16.966 ***
Parental Investments 17.942*** 11.429** 9.187** 5.799 15.992*** 13.711** 4.707 -2.603
Single Parent -1.791 -3.76 * -2.842 -2.517 -6.266** -3.799* -3.256 -5.343 ** Mother’s age at first birth 0.609 *** 0.466*** 0.529*** 0.589 *** 0.045 0.092 0.15 0.276*
Residual Variance 0.742 0.801 0.722 0.716 0.907 0.901 0.883 0.848 Note: Unstandardized estimates are presented. The dependent variable in columns 1 to 4 is cognitive skills. The dependent variable in column 5 to 8 is non-cognitive skills. Both cognitive and non-cognitive skills are measured as percentile scores, normed with respect to the sample at each wave. Cognitive and non-cognitive skills are alternatively measured from baseline to 5th grade. All other variables are measured at baseline. All models account for stratification by schools by clustering according to teachers' id. *** p<0.001, ** p <0.01, * p<0.05, † p<0.10 (two-tailed test).