Embed Size (px)
Citation preview

Hard to say goodbye to yesterday: war memories, patriotism, and individual
investors’ investment preferences
Bin Ke, Yupeng Lin, Hong Tu, Weibiao Xu
May 9, 2019
Abstract
_____________________________________________________________________
We examine whether memories of interstate wars that occurred long ago, transmitted
across generations, affect the stock investment decisions of individuals who never
experienced the wars themselves. Using the Second Sino-Japanese War over
1931-1945 as a setting, we find that war memories have a significant impact on
individual investors’ investment preferences today. Individual investors more affected
by the war memories show a stronger preference for Chinese military stocks. The
effects are stronger for individual investors residing in cities that experienced more
intensive military battles in the War, for older investors who are affected by the war
memories to a greater extent, and for those residing in cities with more media
exposure about the war memories. Our study contributes to the literature on the role
of nonpecuniary preferences, shaped by intergenerational effects, on individual
investors’ economic decisions.
_____________________________________________________________________
____________________________
Bin Ke, (email: [email protected]) School of Business, National University of Singapore; Yupeng Lin
(email: [email protected]) School of Business, National University of Singapore; Hong Tu (email:
[email protected]) School of Finance, Nankai University, China; Weibiao Xu (email:
[email protected]) School of Finance, Nankai University, China.

2
1. Introduction
Individuals’ preferences are important in shaping economic exchanges, political
institutions and policy choices (see Bowles 1998, and Guiso, Sapienza, and Zingales,
2006 for excellent overviews). While economists often focus on pecuniary preferences
in analyzing individuals’ decision choices, the role of non-pecuniary preferences from
psychology has received increased attention (e.g., Corneo and Gruner 2002;
Malmendier and Nagel 2011; Bernile, Bhagwat, and Rau, 2017; He, Kothari, Xiao, and
Zuo, 2018). People’s nonpecuniary preferences could be shaped by a variety of sources:
they could arise from an individual’s personal experiences such as childhood hardship
(the direct sources), but they can also be transmitted from others (the indirect sources),
such as school education and the official media (the formal channels) or family and
social interactions such as parents to children or peer to peer (the informal channels).
The existing economics and finance literature has shown that personal memory (the
direct sources) can have a significant effect on individuals’ preferences and hence
economic decisions (e.g., Malmendier and Nagel 2011; Bernile, Bhagwat, and Rau,
2017; He, Kothari, Xiao, and Zuo, 2018). However, much less is known on the impact
of intergenerational transmission of memory, on individuals’ economic decisions
(Becker, 1996; Guiso, Sapienza, and Zingales, 2006).1 The effect of collective memory
on people’s decisions could be more important than the effect of individual memory
since collective memory provides a sense of identity, unifies a group of members, and
can be used to sustain hegemonic power (e.g., Halbwachs, 1925; Loewen, 1999; Fanta,
Salek, and Sklenicka, 2019).
The objective of this study is to examine whether the collective memory of
large-scale interstate wars that occurred long ago, transmitted across generations, is a
1 There is a related literature on the impact of indirect sources of preferences on non-economic decisions
(e.g., DellaVigna and Kaplan 2007 on political preferences, Alesina and Fuchs-Schündeln 2007 on social
policy preferences).

3
potential indirect source of nonpecuniary preferences that affects the stock investment
decisions of individual investors who never experienced the wars themselves. The
interstate war we focus on is the Second Sino-Japanese War of 1931-1945, one of the
largest interstate war conflicts in the world (hereafter referred to as the War).2 We
analyze Chinese individual investors’ stock investment decisions during the period
2010-2015. To identify the effect of the war memories on individuals’ preferences, we
compare the stock investment decisions for individual investors who reside in the
Chinese cities that experienced at least one major military battle during the War (the
treatment cities) versus individual investors who reside in the other Chinese cities (the
control cities).
We argue that the effect of the collective war memories, transmitted across
generations, on individuals’ preferences should be stronger for those who reside in the
treatment cities. First, the treatment cities should have more residents who directly
suffered during the War than the control cities. These individuals can transmit their
painful war memories to their younger-generation family members and neighbors via
vivid story-telling (i.e. the informal channel) (Auerhahn and Laub. 1998; and Felsen,
1998). Second, the local media of the treatment cities (the formal channel) could
provide more coverage of the War than those of the control cities, especially during the
memorial days. As a result, the residents of the treatment cities who had never
personally experienced the War should have a strong personal feeling about the
atrocities of the War.3,4
. On the other hand, the younger generation residents of the
2 The Mukden incident in September 1931 is widely regarded as the prelude of Japan’s invasion of China.
The full scale invasion started from 1937. In this paper, we incorporate all major battles during
1931-1945. According to the official PRC statistics, China's civilian and military casualties in the Second
Sino-Japanese War were 20 million dead and 15 million wounded ("Remember role in ending fascist
war". Chinadaily.com.cn. 2005-08-15. Retrieved 2010-12-02)). 3 There could be many reasons for the greater local media bias of the treatment cities (Fitch, 2005;
Neiger, Meyers, Zandberg, 2011). For example, in our context, reporters of the local media in the
treatment cities could have experienced the War directly or the reporters’ older-generation family
members lived through the War.

4
control cities are less likely to have such salient memories because fewer individuals in
the control cities had the first-hand experience of the War. In addition, due to the
physical distance between the treatment cities and control cities, the residents of the
treatment cities should find it more difficult to transmit their personal memories or
stories of others’ experiences to the residents of the control cities (e.g., Park, 1915;
Meier, Pierce, Vaccaro, and La Cara, 2016). China’s strict household registration
system, which restricts the free movement of residents across cities, should further limit
the inter-city transmission of such war memories via the indirect sources.
Sociologists have long articulated that collective memories play an important role
in human decision making since such memories pass down information and knowledge
from generation to generation and thus help avoid the adverse effects of negative events
(e.g., Pfister, 2009; Fanta, Salek, and Sklenicka, 2019). Following this theory, we argue
that the residents of the treatment cities should have a stronger preference for Chinese
military stocks than the residents of the control cities. This is because the defeat of the
Chinese armies in the early stage of the War is often attributed to the ill-equipped and
poorly trained Chinese military forces.5 There have also been frequent calls for
modernizing China’s military forces to avoid similar humiliations in the future.6 One
way for ordinary Chinese people to support such a cause is to hold stocks of publicly
listed Chinese companies in the military industry. Therefore, individual Chinese
investors may exhibit a strong preference for holding publicly traded Chinese military
4 There is a literature on the impact of media bias on political views (e.g., DellaVigna and Kaplan 2007;
Gentzkow and Shapiro 2006; Martin and Yurukoglu, 2016). However, few studies have examined the
effect of media bias on economic decisions. 5 The huge gap in military capabilities between Japan and China during the War is better illustrated by
the following statistics: Japan produced 1,580 planes, 744 large-caliber artilleries, 330 tanks, 9,500
trucks, and a battleship tonnage of 52,422 annually. In contrast, China had no capacity for producing any
of these modern weapons during the first phase of the War In his book Kazutaka Kikuchi (2011) wrote
that “at the beginning of the full scale war, the technological supremacy of the Japanese armies was
striking … take [the] fighter plane as an example, Japan had 2700 fighter planes but China had only 314.
The Japanese army fully controlled the air.” 6 E.g., see http://mil.huanqiu.com/strategysituation/2017-03/10289142.html and
http://news.xinhuanet.com/mil/2015-12/24/c_128562623.htm.

5
stocks as a way to show their patriotism and support for the modernization of China’s
military forces. Because the residents of the treatment cities have stronger and more
vivid memories about the atrocities of the War, they should be more likely to own
Chinese military stocks than the residents of the control cities.
There is no doubt that the Second Sino-Japanese War has left permanent scars on
the Chinese people who experienced the War first hand. However, it is far from clear
whether the War that occurred more than 60 years ago would change the attitudes and
preferences of the Chinese people today and whether such altered attitudes and
preferences would influence individual investors’ actual stock investment decisions,
one of their most important economic decisions. First, most of the investors in our
sample are born after 1980, long after the end of the Second Sino-Japanese War. Hence,
the memories of the War dated more than 60 years ago are fairly remote and hence may
have little impact on their stock investment decisions today. Second, our sample
individuals’ stock investment records are not publicly disclosed and therefore there is
little public pressure for individual investors to purchase and hold Chinese military
stocks as a show of patriotism.
Our sample includes the stock trading records for a large sample of randomly
selected individual brokerage accounts from a major brokerage house over the period
2010-2015. We eliminate the investors born before 1945 in order to make sure none of
the individual investors in our sample had direct personal experiences about the War.
Consistent with our prediction, we find that individual investors from the treatment
cities hold a significantly higher proportion of military stocks in their investment
portfolios than individual investors from the control cities. In terms of economic
magnitude, the percentage of military stocks in an individual investor’s total equity
investment portfolio is 9-10% higher for investors in the treatment cities than for

6
investors in the control cities. To control for potential endogeneity of the treatment
cities, we also use both 2SLS approach and the propensity score matching approach and
find similar inferences.
One could argue that the difference in individual investors’ holdings of military
stocks for the treatment and the control cities represents the private information
advantage of the investors in the treatment cities. To test the validity of this alternative
explanation, each month we sort the individual investors in the treatment cities into 10
deciles based on each investor’s month-end military stock holding as a fraction of the
investor’s entire investment portfolio. Then, we compute the abnormal return over the
subsequent one-month and three-month periods for the investors in the top decile. We
find no evidence that the higher ownership of military stocks by investors in the
treatment cities is due to these investors’ superior private information advantage.
We conduct three cross-sectional analyses to further demonstrate the effects of war
memories. First, if individual investors’ higher military stock ownership for the
treatment cities is driven by war memories, we should expect the results to be stronger
for the treatment cities where the Chinese armies suffered the most casualties. We find
evidence consistent with this prediction.
Second, if individual investors’ higher military stock ownership for the treatment
cities is driven by the inter-generation transmission of painful war memories via vivid
story-telling (informal channel), we should expect the results for the treatment cities to
be weaker for younger-generation investors due to the decay of war memories.
Consistent with this prediction, we find that the difference in the results between the
treatment cities and the control cities increases with an individual investor’s age. Our
results suggest an economically significant intergenerational effect that will take more
than 59 years to eliminate.

7
Third, if individual investors’ higher military stock ownership for the treatment
cities is partially influenced by the local media (the formal channel), we should expect
the results for the treatment cities to be stronger for the treatment cities with higher
local media coverage of the War. We find evidence consistent with this prediction.
Rather than using a cross-sectional comparison between the treatment cities and
the control cities, we also use an event study approach to identify the effect of war
memories. The event is the Diayu Islands (Senkaku in Japanese) incident that occurred
during April 2012-September 2012. During this event period, the Japanese government
announced several actions that intended to nationalize the Diaoyu Islands. Such actions
resulted in a sharp increase in hostility between China and Japan. We conjecture that the
nationalization of the Diaoyu Islands should have amplified the difference in the
Chinese people’s war memories for the treatment cities versus the control cities.
Consistent with this conjecture, we find that the proportion of military-stocks in an
investor’s portfolio increases significantly for the investors residing in the treatment
cities relative to those residing in the control cities over the event period relative to the
pre-event period or post-event period.
Our paper is related to several streams of literature. First, our paper is related to
the growing economics literature that examines the determinants and consequences of
individuals’ nonpecuniary preferences (Bowles 1998; Guiso, Sapienza, and Zingales,
2006). With regards to determinants of nonpecuniary preferences, many studies in this
literature focus on the influences of people’s personal experiences (direct sources) on
preferences (Malmendier and Nagel 2011; Bernile, Bhagwat, and Rau, 2017). With
regard to the indirect sources of nonpecuniary preferences, prior studies have shown the
effect of school education and media on people’s social policy or political preferences
(e.g., DellaVigna and Kaplan 2007; Gentzkow and Shapiro 2006; Alesina and

8
Fuchs-Schündeln 2007; Martin and Yurukoglu, 2016; Cantoni et al. 2017). In contrast,
we examine the impact of the indirect sources of nonpecuniary preferences on
individuals’ investment decisions.
There is a growing literature on the relation between early-life experiences and
individuals’ investment decisions. Kaustia and Knupfer (2008) and Chiang, Hirshleifer,
Qian, and Sherman (2011) investigate the effect of prior investment experiences on
Initial Public Offering subscriptions. Carroll et al. (2009) seek to link personal
experiences to retirement saving behaviors. Relying on the information on households’
asset allocations, Malmendier, and Nagel (2011) and Knupfer, Rantapuska, and
Sarvimaki (2017) examine how individual experiences of macroeconomic shocks
affect financial risk taking. Like these studies, we study individuals’ investment
decisions. But we differ from these studies in one important aspect: rather than studying
the effect of individuals’ personal experiences (direct sources of nonpecuniary
preferences), we examine the effects of collective memories, an indirect source of
individuals’ nonpecuniary preferences.
Finally, our work is related to the recent literature on hostility among countries.
Prior studies mainly focus on cross-border economic activities. For example, Gupta and
Yu (2009) examine the effect of bilateral political relations on trade flows. Guiso,
Sapienza, and Zingales (2009) explore the effect of culture aversion. Hwang (2011)
studies country-specific sentiment. Fishman, Hamao, and Wang (2014) examine the
impact of hostility between China and Japan due to two events in 2005 and 2010 on the
stock prices of Japanese companies with high China exposure. Their findings suggest
the role of countries’ economic and political institutions in mediating the impact of
interstate frictions on firm-level outcomes. Our study differs from these studies because
we focus on the impact of inter-state hostility on individuals’ domestic stock market

9
investment decisions rather than cross-border economic activities. In addition, we study
the importance of war memories transmitted across generations rather than the role of
formal economic and political institutions.
The rest of the paper is organized as follows. Section 2 introduces the institutional
background of the Second Sino-Japanese War. Section 3 explains the data sources and
sample selection procedures. Section 4 examines the effect of war memories on
individual investors’ military stock ownership. Section 5 analyzes the cross-sectional
effects of war memories. Section 6 shows an event study based on the nationalization of
the Diaoyu Islands. Section 7 concludes.
2. Institutional background
We provide a brief overview of the Second Sino-Japanese War 1931-1945. The
Mukden Incident of September 18, 1931, which led to the Japanese army’s occupation
of Manchuria (i.e., Northeastern China), is widely recognized as the prelude of the
full-scale military invasion by Japan. However, during the years 1931-1936, due to the
concern over the rise of the Chinese Communist Party (CCP), the Chinese Nationalist
Party (Kuomintang, or KMT), the party in control of China, adopted a policy of
nonresistance against the Japanese invasion and predominantly focused on the civil war
with the CCP. Therefore, there were few major military battles between China and
Japan during this period. The full-scale war between China and Japan began in July
1937 after the end of the famous Xi’An Incident that united the KMT and the CCP in
the anti-Japanese War.
By 1940 the Japanese army had controlled the entire northeastern coast of China
and the areas up to 400 miles inland. Japan’s attack on the Pearl Harbor in December
1941 by the Japanese army drew the United States into the World War II. The United

10
States sent military officers to China and assisted with training and equipping the
Chinese armies. The assistance from the United States helped narrow the gap in
military-capability between China and Japan. The Second Sino-Japanese War came to
an end in August 1945, after the United States dropped two nuclear bombs over
Hiroshima and Nagasaki.
Throughout the Second Sino-Japanese War, the Chinese armies engaged with the
Japanese army in many military battles on Chinese soil. Following Guo (2005) and
Zhang (2007), we identify 34 major battles during the War between September 1931
and August 1945. Appendix A shows the basic information about each battle and the
corresponding officially reported mortality numbers on both sides. Appendix B also
plots the geographic locations of these battles on the map. It is clear that the 34 major
battles scattered across many parts of China.
The human casualties from the Second Sino-Japanese War were very high. As
noted above, many Chinese soldiers lost their lives in the military battles. Even more
Chinese civilians were killed or injured during the War (see footnote 2). The War also
left significant and long lasting psychological scars among the living Chinese people
who personally experienced the atrocities of the War. In addition, the War caused
substantial damages to many Chinese cities and regions. Prime farming areas were
ravaged in the battle fighting. Millions of people were rendered homeless by the
destruction of towns and cities all over China.
3. Data sources and sample selection procedures
We obtain the raw data on individual investors’ brokerage accounts from one of
the largest nationwide brokerage houses in China under the condition of anonymity.
The raw data contain an investor’s demographic information (age, gender, residential

11
address at the city level, and the name of the brokerage branch where an investor
opens the account), the brokerage account ID, an individual stock’s trading date,
trading type (open market buy or sell), security type (A or B share), the quantity of a
trade, the dollar value of a trade, and trading commission. Our research question
requires the monthly balance of each individual stock held by each individual investor
account. Unfortunately, such data are not directly available from the raw data. Instead,
we have to reconstruct individual stocks’ monthly balances using each account’s stock
transaction records from the opening of the brokerage account.
To reduce data collection costs, we start with 216,732 unique brokerage
accounts opened between January 1, 2010, and April 30, 2012. From these brokerage
accounts we select a random sample of 75,045 (about one third) unique brokerage
accounts and obtain all the stock transaction records of the selected accounts from the
beginning of each account up to December 31, 2015. Hence, the maximum sample
period for our brokerage accounts covers January 1, 2010, to December 31, 2015.
Table 1 reports our sample selection procedures for the individual brokerage
accounts starting from the raw data provided by the brokerage house. We impose
several important sample selection restrictions. First, we drop the dormant accounts
that never traded over the period from the account opening to December 31, 2015 (29%
of the 75,045 selected accounts). Second, we drop the institutional accounts (0.1% of
the 75,045 selected accounts) because our focus is individual investors. Third, we
drop the brokerage accounts if an investor lives in city A but opens the account in a
different city B, even though the brokerage house has a branch in city A at the time of
the investor’s account opening (3.8% of the 75,045 selected accounts). There are
many possible reasons for why this occurs, including the possibility that the investor
has moved, or the investor’s account has been lent to someone else for illegal trading.
12
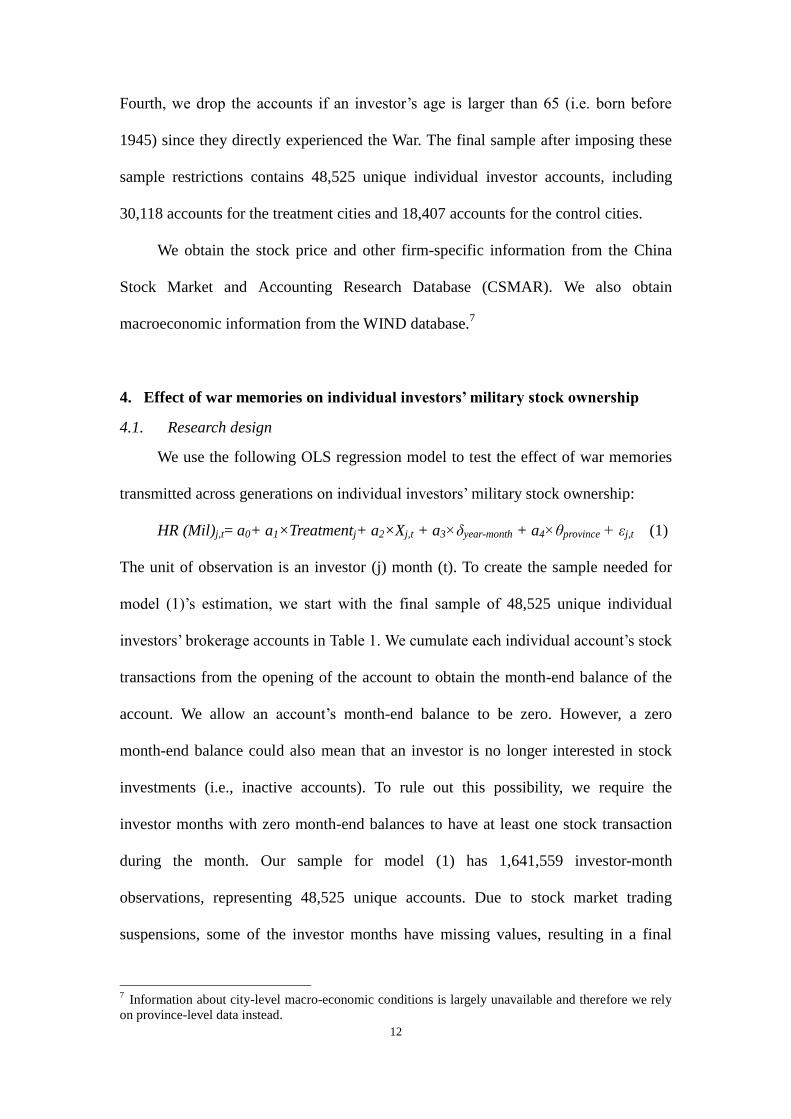
Fourth, we drop the accounts if an investor’s age is larger than 65 (i.e. born before
1945) since they directly experienced the War. The final sample after imposing these
sample restrictions contains 48,525 unique individual investor accounts, including
30,118 accounts for the treatment cities and 18,407 accounts for the control cities.
We obtain the stock price and other firm-specific information from the China
Stock Market and Accounting Research Database (CSMAR). We also obtain
macroeconomic information from the WIND database.7
4. Effect of war memories on individual investors’ military stock ownership
4.1. Research design
We use the following OLS regression model to test the effect of war memories
transmitted across generations on individual investors’ military stock ownership:
HR (Mil)j,t= a0+ a1×Treatmentj+ a2×Xj,t + a3×δyear-month + a4×θprovince + εj,t (1)
The unit of observation is an investor (j) month (t). To create the sample needed for
model (1)’s estimation, we start with the final sample of 48,525 unique individual
investors’ brokerage accounts in Table 1. We cumulate each individual account’s stock
transactions from the opening of the account to obtain the month-end balance of the
account. We allow an account’s month-end balance to be zero. However, a zero
month-end balance could also mean that an investor is no longer interested in stock
investments (i.e., inactive accounts). To rule out this possibility, we require the
investor months with zero month-end balances to have at least one stock transaction
during the month. Our sample for model (1) has 1,641,559 investor-month
observations, representing 48,525 unique accounts. Due to stock market trading
suspensions, some of the investor months have missing values, resulting in a final
7 Information about city-level macro-economic conditions is largely unavailable and therefore we rely
on province-level data instead.

13
usable sample of 1,619,630 investor-months for 48,516 unique accounts.
HR(Mil)jt is the monthly balance of investor j’s military-stock holding as a
fraction of the investor’s entire stock portfolio at the end of month t. Treatment is a
dummy variable that equals one if an investor lives in a city that once experienced one
of the major military battles during the Second Sino-Japanese War 1931-1945, and
zero otherwise. The coefficient on Treatment captures the effect of war memories
transmitted across generations on individual investors’ preference for military stocks.
Prior research (e.g., Barber and Odean, 2001; Goyal, 2004; Feng and Seasholes,
2005, 2008) find that investors’ personal characteristics affect their investment
decisions. Hence, to rule out potential alternative explanations, we include a set of
such control variables (𝑋𝑗,𝑡 ), including individual investor j’s age, gender, risk
preference, trading frequency, and trading experience. All investors’ personal
characteristics are provided by the brokerage house based on each investor’s supplied
information at the account opening or trading behavior since the account opening. In
addition, we also control for region-level control variables, including province
quarterly GDP and province yearly unemployment rate. We also include year-month
and province fixed effects to control for time fixed effects and province-level fixed
effects.
4.2. Descriptive statistics and regression results
Panel A of Table 2 reports the distributions of the demographic variables for the
treatment and control cities. The treatment and control samples are significantly
different from each other on all dimensions, suggesting that it is important to control
for these variables in regression model (1). Panel A of Table 3 reports the summary
statistics for the full sample. The average holding ratio of military stocks is 3.91% for

14
the full sample. Note that the standard deviation of the holding ratio of military stocks
is 16.62%, implying a large variation in investors’ preferences for these stocks. The
age of an average sample is around 38, indicating that the majority of investors in our
sample belongs to the post-war generation one or two.
The first column of Table 4 shows the OLS regression results of model (1) using
the full sample of 48,516 unique individual investor accounts. Standard errors are
clustered by city and year-month. Consistent with our prediction, the estimated
coefficient on Treatment is positive and significant (0.345, t = 6.91), suggesting that
investors from the treatment cities allocate a disproportionally large percentage of
their portfolios to military stocks. Many of the control variables are significant.
4.3. Instrumental variable regression approach
One potential concern about model (1) is that Treatment could be correlated with
omitted variables. To address this endogeneity concern, we adopt two complementary
approaches: (i) an instrumental variable approach in this section; and (ii) a propensity
score matching approach in the next section.
We use the geographic proximity between a city and the nearest major iron ore
mine found before the Second Sino-Japanese War as an instrumental variable
(denoted as Distance). As one important strategic goal of the Japanese army in the
War was to control the mineral resources in China (Yukio, 1995), the cities closer to
the major iron ore mines were more likely to experience military conflicts during the
War. Therefore, Distance should be negatively correlated with Treatment (the
relevance condition of a valid instrument). In addition, we argue that Distance should
satisfy the exclusion condition of a valid instrument because there is no reason to
expect Distance to be correlated with the omitted determinants of HR (Mil) contained

15
in model (1)’s error term.
Columns (2) and (3) of Table 4 show the 2SLS regression results of model (1). As
predicted, the coefficient on Distance is significantly negative in the first stage
regression. More importantly, the coefficient on Treatment continues to be
significantly positive in the second stage regression.
4.4. Propensity-score matching approach
To better match the investors in the treatment cities with the investors in the
control cities on investor characteristics, we also adopt a propensity score matching
(PSM) approach. Specifically, we use the following logit model to compute the
propensity scores:
Logit(Treatment=1)j = a0+ a1×Malej+ a2×Risk dummyj + a3×Agej + a4×High
trading dummyj + a5×Account Open monthj + ε (2)
The unit of observation is an investor j. The matching variables are the five individual
investor demographic characteristics included in model (1) except that we use
Account Open month instead of Experience.
We match each investor in a treatment city with the investors in the control cities
without replacement as long as the difference in the propensity scores between a
treatment observation and control observation is smaller than 0.001. The propensity
score matched sample contains 30,410 unique brokerage accounts (1,033,702
investor-months), including 15,211 accounts for the treatment cities and 15,199
accounts for the control cities.
Panel B of Table 2 reports the distributions of the demographic variables for the
treatment and control cities after the match. While the treatment and control samples
are significantly different from each other on all dimensions in Panel A of Table 2, the

16
differences are insignificant after the match in Panel B. We further plot the Kernel
density for the two continuous demographic characteristics: Age and Experience in
Figure 1. It shows that the treatment and control groups have close density
distribution in terms of the two continuous matching variables, age, and experience,
after the match. Panel B of Table 3 reports the summary statistics of the regression
variables of model (1) for the matched sample.
Column (4) of Table 4 shows the regression results of model (1) using the
propensity score matched sample. The coefficient on Treatment is still significantly
positive. The magnitude of the coefficient suggests that investors in the treatment
cities hold around 10%(=0.378/3.92)) more military-stocks than investors in the
control cities. Since the inferences reported in Table 4 before versus after the
propensity score matching are similar, we will use the smaller but better matched
sample of treatment and control cities in the following analyses.
The propensity score matching approach is based on investors’ demographic
characteristics. As a further refinement of our matching approach, we employ an
adjacent city matching method. In particular, we require the matched pairs of the
treatment cities and control cities in the propensity score matched sample to satisfy
the following conditions: (i) the treatment and the control cities are located in the
same province; (ii) the economic distance (measured using the GDP in 2009, one year
before the beginning of our sample period) between the treatment and control cities is
the closest; and (iii) the physical distance between the treatment and control cities is
the closest. These three additional matching criteria ensure that the investors in the
treatment cities and control cities are much more comparable in not only personal
characteristics but also social and economic environments.
We are not able to find control cities for three treatment cities, Beijing, Shanghai,

17
and Tianjin since they are municipalities directly under the Central Government’s
control. Thus, the investors in these treatment cities are excluded from this analysis.
Our final sample contains 23 pairs of treatment and control cities, representing 9,736
unique investors for the PSM sample. We control for the treatment-control pair fixed
effects to eliminate cross-pair variations.
The regression results are reported in the last column of Table 4. We find that the
coefficient on Treatment is significantly positive (0.759, t = 8.93), consistent with the
PSM regression results in column (4) of Table 4.
4.5. Informed trading as an alternative explanation
One potential alternative explanation for the regression results in Table 4 is that
the higher military stock ownership in the portfolios of investors in the treatment
cities reflects these investors’ private information about the military stocks. To check
the validity of this alternative explanation, we examine the future abnormal return
performance of the military stock ownership for the investors in the treatment cities.
To do so, each month we sort all investors in the treatment cities into 10 deciles based
on their month-end HR (Mil)jt. Then, we estimate the size-adjusted buy-and-hold
abnormal portfolio return of the military stock holdings for the top decile investors in
the next one month and three months. We find that the military stock ownership for an
investor in the top decile can be still small. To increase the test power, we also
compute the abnormal portfolio return of the military stock holdings for the top decile
investors whose HR (Mil)jt is at least 1% or 10%.
The results are reported in Table 5. We find that the signs of the abnormal
returns are negative for both the investors in the top decile and the investors in the top

18
decile with material military stock ownership in their portfolios.8 Overall, we find no
evidence consistent with the alternative explanation.
5. Cross-sectional analysis of individual investors’ military stock ownership
To further demonstrate the impact of war memories on individual investors’
military stock ownership, we perform three cross-sectional regression analyses in this
section: (i) military battle intensity in section 5.1; (ii) age effect in section 5.2; and (iii)
local media effect in section 5.3.
5.1. The intensity of the war memories
As shown in Appendix B, the intensity of the battles included in the treatment
cities varies significantly across cities. In this section, we examine whether the
documented treatment effect in model (1) is stronger for the treatment cities with
more Chinese military casualties. We argue that the more intensive a battle is in terms
of casualties, the more likely that the atrocities of the war memories will be
transmitted to the younger generations via both formal and informal channels.
Column (1) of Panel A in Table 6 shows the regression results of this hypothesis
test, using the investor months for the treatment cities only. Because each battle has
both Chinese and Japanese casualties, we include both in the same regression. In
addition, we scale the casualties by the size of the battlefield because of the
significant variation in the scale of each battle. Our hypothesis would predict the
coefficient on Chinese army mortality/km2 to be significantly positive. However, we
do not make a prediction on the coefficient on Japanese army mortality/km2 because
the death of Japanese soldiers is unlikely to arouse sad feelings and emotions among
8 The significance levels of the 3-month abnormal returns should be interpreted with caution because we
have not adjusted for potential dependence of the returns across the overlapping months. But this fact
should not affect our inference because the mean abnormal returns are all negative.

19
Chinese investors. Consistent with our prediction, the coefficient on Chinese army
mortality/km2 is significantly positive. We find that the coefficient on Japanese army
mortality/km2 is negative but insignificant. In column 2, we exclude the variable of
Japanese army mortality/km2 from the specification and find a qualitatively similar
result.
5.2. The age effect
One important element in the process of shaping collective memories is the
story-telling through which information and knowledge are passed down by older
generations. However, such an inter-generational transmission of war trauma
inevitably fades as time goes by (Ebbinghaus, 1913; Auerhahn and Laub. 1998; and
Felsen, 1998). Hence, we expect the effect of the collective war memories to become
weaker over each successive generations. In other words, we predict the effect of
Treatment for model (1) to increase with an investor’s age.
Panel B of Table 6 shows the regression results of this prediction. Because of the
introduction of the interaction effect Treatment × Age, we an afford to include the city
fixed effects rather than the coaser province fixed effects. Consistent with our
prediction, the coefficient on Treatment × Age is positive and significant (0.013, t =
7.8). Since the coefficient on Treatment is insignificantly different from zero, the
results suggest that, under the strict assumption of linearity, it takes around 59 years
((2010-1945)-0.081/0.013) for the difference between the treatment cities and control
cities to disappear completely, suggesting an economically significant
intergenerational effect.9 In the second column, we further separate the sample into
two groups based on whether an individual is the first post-war generation (i.e. born
9 2010 is the starting year of our sample. 1945 is the end of the Second Sino-Japanese War.

20
between 1945-1970) or the second post-war generation (i.e., born after 1970). We find
that, for individuals residing in treatment cities, the first post-war generation holds 9.2%
more military-stocks than the second post-war generation.
5.3. The local media effect
The prior literature shows that media has a distinctive role in shaping collective
memories (e.g., Neiger, Meyers, Zandberg, 2011). Hence, we examine the role of
media in reviving the collective war memories and its resultant effect on individuals’
investment decisions. Since the national media affects all Chinese investors, we focus
on the role of local media on individual investors’ military ownership decisions.
We define the local media’s coverage of the war memories (denoted as High
Media) using the following steps. First, for each city included in our sample, we
identify the most widely circulated local party newspaper and local non-party
newspaper from a popular newspaper database, WISENEWS.10
Second, we identify
all the articles whose titles contain any of the following keywords: anti-Japanese,
patriotic, anti-war, Second World War, Sino-Japanese. Third, we manually read the
identified articles and exclude irrelevant articles (e.g., those articles may be related to
economics, culture, sanitation, sports, etc.). Finally, we compute the total number of
war memory related articles reported by the two local newspapers for each city-year
and use it as for the proxy for local residents’ exposure to the propaganda aimed at
reviving the war memories. High Media is one if the total number of war memory
related articles in the past three years is above the sample median in a year and zero
otherwise.11
10
12% of the cities are not covered by WISENEWS. For these cities, we use the provincial newspapers
instead. 11
To verify the accuracy of our selection procedures, we manually read all the news articles over a
randomly selected 7-day period and count the total number of war-relevant articles. We compare the

21
Panel C of Table 6 presents the yearly average number of war memory related
news by the local media for both treatment and control cities. Consistent with the
notion of local media bias (Kitch, 2005; Neiger, Meyers, Zandberg, 2011), we find
that local media in treatment cities report 21.31 more war-relevant articles per year
than those in the control cities. This finding suggests that local media is an important
force reflecting and shaping the local collective war memories.
Panel D in Table 6 presents the regression result. Consistent with our expectation,
the coefficient on High Media×Treatment is significantly positive, suggesting that
individual investors residing in treatment cities with more frequent local media
coverage of the war memories exhibit a stronger preference for military stocks.
Panel E of Table 6 combines both interaction effects in Panels B and D into one
single model. Again, the coefficients on the interaction terms, Age×Treatment,
Treatment×First post-war generation, and High Media×Treatment continue to be
significantly positive.
6. Event study based on the nationalization of the Diaoyu Islands
Our basic regression model (1) is cross-sectional in nature. Hence, readers could
be still concerned that our previous results are due to correlated omitted factors. To
more directly show the causal relationship between the war memories transmitted
across generations and individual investors’ preference for military stocks, we explore
Japan’s nationalization of the Diaoyu Islands in 2012 as an exogenous shock.
The Diaoyu Islands is a focal point in the China-Japan relationship. China claims
the discovery and ownership of the islands, whereas Japan regards the islands as part of
the city of Ishigaki. Although the Japanese government has not allowed the Ishigaki
result with that based our filtering scheme. The comparison shows that our filtering scheme can
effectively identify more than 95% of all relevant articles.
22
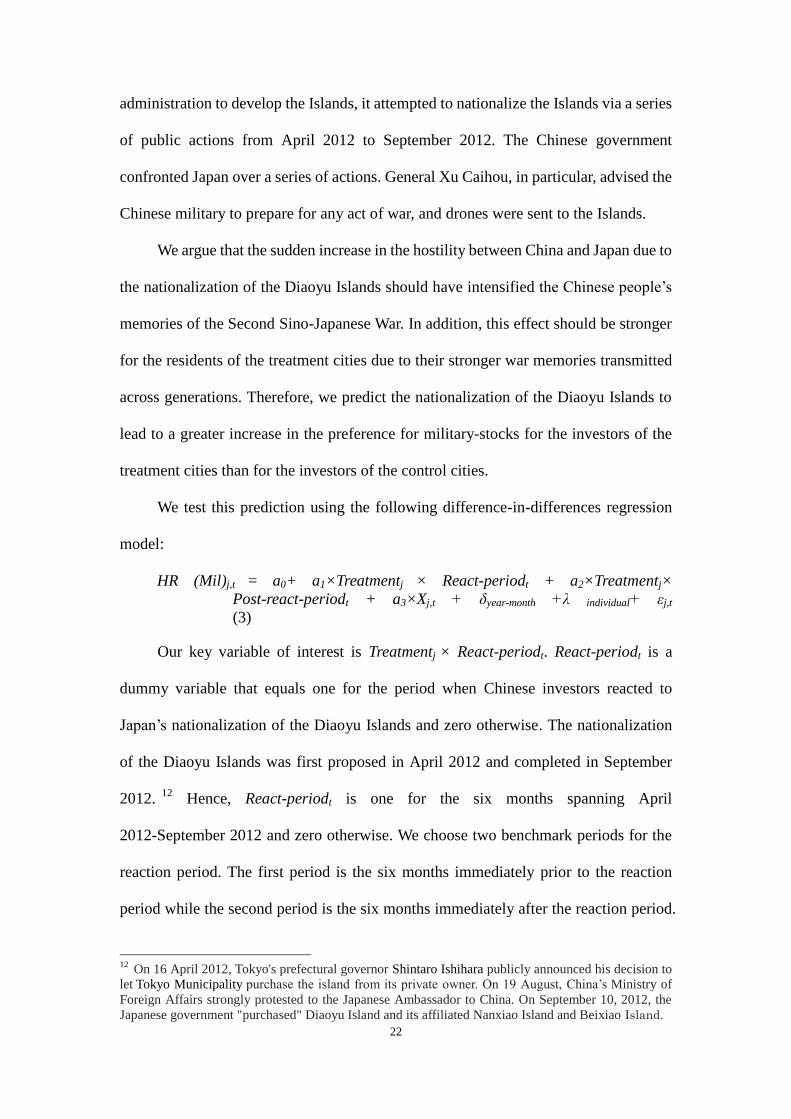
administration to develop the Islands, it attempted to nationalize the Islands via a series
of public actions from April 2012 to September 2012. The Chinese government
confronted Japan over a series of actions. General Xu Caihou, in particular, advised the
Chinese military to prepare for any act of war, and drones were sent to the Islands.
We argue that the sudden increase in the hostility between China and Japan due to
the nationalization of the Diaoyu Islands should have intensified the Chinese people’s
memories of the Second Sino-Japanese War. In addition, this effect should be stronger
for the residents of the treatment cities due to their stronger war memories transmitted
across generations. Therefore, we predict the nationalization of the Diaoyu Islands to
lead to a greater increase in the preference for military-stocks for the investors of the
treatment cities than for the investors of the control cities.
We test this prediction using the following difference-in-differences regression
model:
HR (Mil)j,t = a0+ a1×Treatmentj × React-periodt + a2×Treatmentj×
Post-react-periodt + a3×Xj,t + δyear-month +λ individual+ εj,t
(3)
Our key variable of interest is Treatmentj × React-periodt. React-periodt is a
dummy variable that equals one for the period when Chinese investors reacted to
Japan’s nationalization of the Diaoyu Islands and zero otherwise. The nationalization
of the Diaoyu Islands was first proposed in April 2012 and completed in September
2012.12
Hence, React-periodt is one for the six months spanning April
2012-September 2012 and zero otherwise. We choose two benchmark periods for the
reaction period. The first period is the six months immediately prior to the reaction
period while the second period is the six months immediately after the reaction period.
12
On 16 April 2012, Tokyo's prefectural governor Shintaro Ishihara publicly announced his decision to
let Tokyo Municipality purchase the island from its private owner. On 19 August, China’s Ministry of
Foreign Affairs strongly protested to the Japanese Ambassador to China. On September 10, 2012, the
Japanese government "purchased" Diaoyu Island and its affiliated Nanxiao Island and Beixiao Island.
23
Post-react-periodt is a dummy variable that equals one for the six months following
the reaction period and zero otherwise.
We control for individual investor fixed effects and time (year-month) fixed
effects in the model (3). X is the same as in model (1). Due to including investor fixed
effects, investors’ demographic characteristics are redundant in the model (3).
The results are reported in Panel A of Table 7. Standard errors are clustered by
city and year-month. Consistent with our prediction, the coefficient on Treatmentj ×
React-periodt is positive and significant, suggesting that investors in the treatment
cities purchased significantly more military stocks during the Diaoyu Islands dispute
period (0.185, t = 2.27). Interestingly, the coefficient on Treatmentj ×
Post-React-periodt is insignificant, suggesting that the increase in the ownership of
military stocks by the investors of the treatment cities is transitory. In Panel B, we
mirror the tests in Table 5 and examine whether the increase in holdings of
military-stocks is driven by private information. We find an insignificant effect.
Overall, our results in Table 7 provide further evidence supporting our
hypothesis that the war memories transmitted across generations induce investors in
the treatment cities to show a stronger preference for military stocks.
7. Conclusion
The economics literature has shown a growing interest in understanding the role
of nonpecuniary preferences from psychology in individual investors’ economic
decisions. People’s nonpecuniary preferences could be affected by a variety of sources.
They could arise from an individual’s personal experiences (the direct sources), but
they can also be transmitted from others (the indirect sources), such as the official
media (the formal channels) or family and social interactions such as parents to

24
children or peer to peer (the informal channels). Prior research has shown the
importance of direct sources of nonpecuniary preferences on individuals’ economic
decisions. The objective of this study is to contribute to this literature by showing one
important indirect source of nonpecuniary preferences, war memories transmitted
across generations.
We use the Second Sino-Japanese War 1931-1945 as our proxy for the war
memories and examine whether such war memories transmitted across generations
affect the investment decisions during the period 2010-2015 for individual investors
who never personally experienced the War. To identify the effect of the war memories
on individuals’ preferences, we compare the stock investment decisions for individual
investors who reside in the Chinese cities that experienced at least one major battle
during the War (the treatment cities) versus individual investors who reside in the
other Chinese cities (the control cities).
Our results show that individual investors in the treatment cities exhibit a
stronger preference for owning Chinese military stocks than investors in the control
cities. This effect is more pronounced for the treatment cities that saw higher Chinese
military casualties during the Second Sino-Japanese War, older investors who are
likely to have stronger memories about the War, and for cities where the local media
have more discussions on the Sino-Japan war conflicts. We use Japan’s attempted
nationalization of the Diaoyu Islands in 2012 as an exogenous event to further
identify the effect of the collective war memories on treatment city investors’
preference for military stocks. Overall, these results suggest that the collective
memories of wars that occurred long ago, transmitted across generations, can have a
significant and long lasting impact on the investment decisions of individual investors
today.

25
References
Alesina A., and Fuchs-Schündeln N., 2007, Good-Bye Lenin (or Not?): The Effect of
Communism on People's Preferences. American Economic Review, 97(4),
1507–1528.
Auerhahn NC, and Laub D. 1998, Intergenerational memory of the holocaust. In:
Danieli Y, editor. International Handbook of Multigenerational Legacies of
Trauma. Plenum Press; New York: 21–41.
Barber B. M., Lee Y., Liu Y., and Odean T., 2009, Just How Much Do Individual
Investor Lose By Trading? Review of Financial Studies, 610-632.
Barber B., and Odean, T., 2001, Boys will be Boys: gender, overconfidence, and
common stock investment. Quarterly Journal of Economics, 116 (1), 261–292.
Bernile G., Bhagwat V., Rau P. R., 2017, What Doesn't Kill You Will Only Make You
More Risk-Loving: Early-Life Disasters and CEO Behavior. Journal of Finance,
167–206.
Becker G.,1996, Preferences and Values, Accounting for Taste, Harvard University
Press: Cambridge.
Bouwman C. H. S., and Malmendier U., 2015, Does a Bank’s History Affect Its
Risk-Taking? American Economic Review: Papers & Proceedings, 105(5):
321–325
Burke K., 1942, War and Cultural Life. American Journal of Sociology, 48(3),
404-410.
Bowles, S., 1998, Endogenous Preferences: The Cultural Consequences of Markets
and Other Economic Institutions. Journal of Economic Literature, 36(1),
75-111.
Cantoni D., Chen Y. , Yang D. Y. , Yuchtman N., and Zhang Y. J.,2017, Curriculum
and ideology. Journal of Political Economy, 125(2), 338-392.
Chiang Y., Hirshleifer D., Qian Y., Sherman A. E., 2011, Do Investors Learn from
Experience? Evidence from Frequent IPO Investors, The Review of Financial
Studies, Vol 24 (5), 1560–1589.
Chapin F., 1934, Latent Culture Patterns of the Unseen World of Social
Reality. American Journal of Sociology, 40(1), 61-68.
Carroll, G. D., Choi J. J., Laibson D., Madrian B. C., and Metrick A., 2009, Optimal
Defaults and Active Decisions. Quarterly Journal of Economics 124(4),
1639-1674.
Cohen L, Gurun U. G., and Malloy C., 2017, Resident Networks and Corporate
Connections: Evidence from World War II Internment Camps. Journal of
Finance, 207-248.
Corneo G., and Gruner H. P., 2002. Individual preferences for political
redistribution. Journal of Public Economics, 83(1), 83-107.
DellaVigna S., and Kaplan E., 2007, The Fox News Effect: Media Bias and Voting,
Quarterly Journal of Economics, 122 (3), 1187–1234.
Ebbinghaus H., 2013, Memory: A Contribution to Experimental Psychology, Annals
of Neurosciences, 20(4), 155–156.

26
Fanta V., Šálek M., and Sklenicka P., 2019, How Long do Floods throughout the
Millennium Remain in the Collective Memory? Nature Communications, 10(1),
1105.
Felsen I. 1998, Transgenerational transmission of the effects of the holocaust: The
North American research perspective. In: Danieli Y, editor. International
Handbook of Multigenerational Legacies of Trauma. Plenum Press; New York:
119–124
Feng L., and Seasholes M. S., 2005, Do Investor Sophistication and Trading
Experience Eliminate Behavioral Biases in Financial Markets? Review of
Finance, 9, 305–351.
Feng L., and Seasholes M. S., 2008, Individual Investors and Gender Similarities in
An Emerging Stock Market. Pacific-Basin Finance Journal, 16, 44–60.
Fisman R., Hamao Y., and Wang Y., 2014, Nationalism and Economic Exchange:
Evidence from Shocks to Sino-Japanese Relations. Review of Financial Studies,
27 (9): 2626–2660.
Gentzkow M., and Shapiro. J. M., 2006, Media Bias and Reputation, Journal of
Political Economy, 114(2), 280-316.
Goyal A., 2004, Demographics, Stock Market Flows, and Stock Returns. Journal of
Financial and Qualitative Analysis, 39(1), 115–142.
Greenwood R., and Nagel S., 2009, Inexperienced Investors and Bubbles. Journal of
Financial Economics, 93, 239–258
Grinblatt M., and Keloharju M., 2001, What makes investor trade? Journal of
Finance 56(2), 589–616.
Guiso, Luigi, Sapienza Paola, and Zingales Luigi, 2006, Does Culture Affect
Economic Outcomes? Journal of Economic Perspectives, 20 (2): 23-48.
Guiso L., Sapienza P., and ZingalesZ L., 2009, Cultural Biases in Economic
Exchange?, Quarterly Journal of Economics, 124(3), 1095–1131.
Guo R., 2005, Record of Sino-Japanese Battle Fileds. Jiangsu People Press.
Gupta N., and Yu X., 2009, Does Money Follow the Flag?, Working paper.
Haigh M., and List J., 2005, Do Professional Traders Exhibit Myopic Loss Aversion?
An Experimental Analysis. Journal of Finance, 60(1), 523–534.
Handman M., 1939, War, Economic Motives, and Economic Symbols. American
Journal of Sociology, 44(5), 629–648.
He X., Kothari S. P., Xiao T., and Zuo L., 2018, Long-Term Impact of Economic
Conditions on Auditors' Judgment. The Accounting Review, 93 (6), 203-229.
Hwang B., 2011, Country-specific sentiment and security prices, Journal of Financial
Economics, 100(2), 382-40.
Halbwachs M., 1992, On Collective Memory (L.A. Coser, Edited. & Translated., with
an introduction by L.A. Coser) Chicago:University of Chicago Press.( Oringial
work published in 1925)
Kaustia M. and Knüpfer S., 2008, Do Investors Overweight Personal Experience?
Evidence from IPO Subscriptions. Journal of Finance, 63, 2679-2702.
Kitch,C., 2005, Pages from the Past: History and Memory in American Magazine.
Chapel Hill, NC: University of North Carolina Press.

27
Knupfer S., Rantapuska E., and Sarvimaki M., 2017, Formative Experiences and
Portfolio Choice: Evidence from the Finnish Great Depression. Journal of
Finance 72, 133–166.
Kikuchi K., 2011, China’s Anti-Japanese Military History: 1937-1945. Social
Sciences Academic Press (China).
Kumar A., and Lee C. M. C., 2006, Retail Investor Sentiment and Return
Comovements. Journal of Finance, 61(5), 2451–2486.
Loewen, J. W, 1999. Lies across America: What our historic sites get wrong. New
York. NY: The New Press.
Li Y., and Yang L., 2013, Prospect Theory, The Disposition Effect, and Asset Prices.
Journal of Financial Economics, 107(3), 715–739.
Malmendier U., and Nagel S., 2011, Depression Babies: Do Macroeconomic
Experiences Affect Risk Taking? Quarterly Journal of Economics, 236(1), 373–
415.
Martin G.J., and Yurukoglu A., 2017. Bias in Cable News: Persuasion and
Polarization, American Economic Review, 107(9), 2565-2599
Meier S., Pierce L., Vaccaro A., and Cara B. L., 2016, Trust and in-group favoritism
in a culture of crime, Journal of Economic Behavior & Organization, 132,
78-92.
Meyer J., 1951, The Stranger and The City. American Journal of Sociology, 56(5),
476–483.
Neiger M., Meyers O., Zandberg E., 2011, On Media Memory: Editors’ Introduction.
In: Neiger M., Meyers O., Zandberg E. (eds) On Media Memory. Palgrave
Macmillan Memory Studies. Palgrave Macmillan, LondonOdean T., 1999, Do
Investors Trade Too Much? American Economic Review, 89(5), 1279–1298.
Park R., 1915, The City: Suggestions for the Investigation of Human Behavior in the
City Environment. American Journal of Sociology, 20(5), 577–612.
Pfister, C. 2009., The “Disater Gap” of the 20th
Century and the Loss of Traditional
Disaster Memory. GAIA 18, 239-246.
Shefrin H., and Statman M., 1985, The Disposition to Sell Winners Too Early and
Ride Losers Too Long: Theory and Evidence. Journal of Finance, 40(3), 777–
790.
Yukio, Noguchi., 1995, 1940 Nen Taisei: Saraba Senji Keizai (The 1940 Regime:
Goodbye to the War Economy). Toyo Keizai Shimposha.
Weng Wenhao, 1919, Chinese Minerals, Bureau of Geographical Investigation Press.
Zhang H., 2007, Memorial record: Nationalist Party’s war of resistance against
Japanese aggression, Unite Press.

28
Figure 1 Kernel density of demographics in the matched sample
This figure shows the kernel density of the distributions of demographics in the matched
sample. Treatment refers to the account holders whose resident city suffered battles during the
China-Japan War. Control refers to the account holders whose resident city did not have
historically widespread battles during the China-Japan War. Average Age is the mean value of
age range that the account holder ticks when opening the account. Average Experience is the
average value of the account holder’s trading experience in our sample period from 2010 to
2015.

29
Table 1: Sample Selection Procedures
Sample Selection Procedures # of individual investors
Total # of account opened between January 2010 and
April 2012 216,732
Randomly draw around 1/3 sample to obtain trading
information 75,045
we drop the dormant accounts that never traded over the
period from the account opening to December 31, 2015 -22,392
Drop the institutional accounts -77
Drop the accounts if an investor resides in city A but
opens the account in a different city B, even though the
brokerage house has a branch in city A at the time of the
investor’s account opening
-2,848
Drop if investor’s age>65 (i.e. born after 1945) -1,203
Final sample 48,525
Final sample after propensity score matching 30,410

30
Table 2: Individual characteristics
This table presents the individual characteristics for treatment and control individuals (unit: a person), respectively. The sample is based on individual investors that opened a
trading account during 2010.1 to 2012.4. In panel A, we present the comparison based on the full sample. Panel B presents the comparison based on one-to-one propensity
score matched sample. Our matching algorithm is based on gender, risk preference, average age, trading frequency dummy and account opening month between treatment
and control groups. See Appendix A for definitions of the variables.
Panel A. Comparison of demographics in the full sample
Control Treatment
Mean std.dev Mean std.dev Diff T-value
Full sample Male 0.547 0.498 0.532 0.499 0.015*** 3.306
Risk dummy 0.010 0.099 0.020 0.140 -0.010*** -9.470
Avg(Age) 36.116 12.318 38.591 13.718 -2.475*** -20.840
High trading dummy 0.608 0.488 0.553 0.497 0.055*** 12.058
Avg(Experience) 1.933 1.542 2.185 1.525 -0.252*** -17.815
# of Obs 30118 18407
Panel B. Comparison of demographics in propensity score matched sample
Control Treatment
Mean std.dev Mean std.dev Diff T-value
Matched Sample Male 0.543 0.498 0.538 0.499 0.005 0.821
Risk dummy 0.006 0.077 0.006 0.076 0.000 0.297
Avg(Age) 36.756 12.318 36.763 12.481 -0.007 -0.050
High trading dummy 0.580 0.494 0.582 0.493 -0.002 -0.392
Avg(Experience) 2.071 1.529 2.052 1.525 0.020 1.132
# of Obs 15119 15211

31
Table 3: Summary statistics
This table shows the summary statistics of the full regression sample (unit: person-month) and the regression sample based on propensity score matching, respectively. See
Appendix A for definitions of the variables
.
Panel A. Summary statistics of full regression sample
Obs Mean Std.dev Min P50 Max
Mil holding ratio (%) 1619630 3.96 16.62 0 0 100
JP holding ratio (%) 1619630 7.17 22.14 0 0 100
Treatment 1619630 0.42 0.49 0 0 1
Risk dummy 1619630 0.02 0.12 0 0 1
Age 1619630 38.17 11.96 18 34 65
High trading dummy 1619630 0.61 0.49 0 1 1
Male 1619630 0.52 0.50 0 1 1
Experience 1619630 2.41 1.55 0 2 5
Province yearly unemployment rate 1619630 3.10 0.83 1.21 3.17 4.47
Province quarterly GDP (Unit:1T) 1619630 1.73 1.37 0.03 1.37 7.28

32
Panel B. Summary statistics of propensity score matched sample
Obs Mean Std.dev Min P50 Max
Mil holding ratio (%) 1033702 3.92 16.47 0 0 100
JP holding ratio (%) 1033702 7.72 23.06 0 0 100
Treatment 1033702 0.53 0.50 0 1 1
Risk dummy 1033702 0.01 0.08 0 0 1
Age 1033702 37.82 11.66 18 34 65
High trading dummy 1033702 0.61 0.49 0 1 1
Male 1033702 0.52 0.50 0 1 1
Experience 1033702 2.40 1.55 0 2 5
Province yearly unemployment rate 1033702 3.05 0.88 1.21 3.13 4.47
Province quarterly GDP (Unit:1T) 1033702 1.72 1.36 0.03 1.37 7.28

33
Table 4: Collective war memories and military stock holdings This table shows the effect of collective war memories on military-related stock holdings. The sample period is from 2010.1-2015.12. We conduct the analyses on the
individual-month level. Column (1) shows the baseline regression result. Columns (2)-(3) show the 2SLS test using the geographic distance between a city and the closest
iron ore mine before the war as IV. Column (4) shows the result based on the propensity score matched sample. Column 5 shows the result based on the adjacent city matched
sample. Province and year-month fixed effects are included. Standard errors are clustered by city and year-month and clustering-corrected t-statistics are reported in
parentheses. We use ***
, **
,* to indicate significance at 1%, 5%, 10% level respectively. See Appendix A for definitions of the variables.
(1) (2) (3) (4) (5)
Full sample First stage Second stage Propensity score
matched sample
Pair-city matched
sample
VARIABLES Mil holding ratio (%) Treatment Mil holding ratio (%) Mil holding ratio (%) Mil holding ratio (%)
Treatment 0.345*** 0.378*** 0.502***
(6.32) (5.59) (9.06)
Distance -0.001***
(-15.49)
Fitted(Treatment) 3.130***
(12.75)
Age 0.007*** 0.001*** 0.005*** 0.004*** 0.015***
(5.71) (19.59) (3.89) (2.93) (6.81)
Risk dummy -0.223** 0.016*** -0.265*** 1.411*** -0.982***
(-2.39) (9.52) (-2.85) (6.86) (-6.04)
High trading dummy -0.293*** -0.003*** -0.285*** -0.119*** -0.473***
(-9.77) (-7.81) (-9.47) (-3.27) (-9.14)
Male -0.031 -0.006*** -0.014 -0.021 0.106**
(-1.14) (-13.08) (-0.52) (-0.55) (2.48)
Experience -0.160*** 0.019*** -0.190*** -0.158*** -0.023
(-5.41) (5.11) (-6.41) (-3.95) (-0.43)
Log(Province quarterly GDP) 0.981*** 0.017 0.925*** 1.586*** 2.098***
(3.47) (0.40) (3.28) (4.60) (3.40)
Province unemployment rate 0.022 -0.006 0.040 0.108 1.033***
(0.34) (-0.54) (0.62) (1.61) (10.29)

34
Constant 5.084*** 0.150** 8.790*** 5.598*** -2.081**
(18.75) (2.17) (9.79) (18.85) (-2.46)
Fixed Effects Province, year-month Province, year-month Province, year-month Province, year-month Province, year-month
Observations 1,619,630 1,619,630 1,619,630 1,033,702 411,168
R-squared 0.002 0.828 0.002 0.002 0.002

35
Table 5: Military stock holdings and abnormal returns This table shows the military stock portfolio return for the treatment group with the highest level of military stock holding. For each month, we divided the treatment sample
into 10 deciles according to their military stocks’ holding, where 10th
decile is the sample with the highest level of military stocks’ holding. We use ***
, **
,* to indicate
significance at 1%, 5%, 10% level respectively. See Appendix A for definitions of the variables.
Mil holding ratio in 10
th
decile
Mil holding ratio(%)>1% & in 10th
decile
Mil holding ratio(%)>10% & in 10th
decile
Mean T-value Mean T-value Mean T-value
Next 1 month weighted average BHAR (Mil
Portfolio) -0.002*** -4.029 -0.002*** -4.482 -0.002*** -4.158
Next 3 month weighed average BHAR (Mil
Portfolio) -0.001 -0.839 -0.001 -1.332 -0.001 -1.496

36
Table 6: Cross-sectional analyses of individual investors’ military stock
ownership
Panel A shows the effect of military casualty intensity on military stock holdings. Panel B shows the
effect of an investor’s age on military stock ownership. Panel C shows the degree of local media bias.
Panel D shows the effect of local media coverage of the War on military stock holdings. The sample
period is from 2010.1-2015.12 Province and year-month fixed effects are included in Panel A. City and
year-month fixed effects are included in Panels B and D. Standard errors are clustered by city and
year-month and clustering-corrected t-statistics are reported in parentheses. We use ***
, **
,* to indicate
significance at 1%, 5%, 10% level respectively. See Appendix A for definitions of the variables.
Panel A. Effect of military casualty intensity
(1) (2)
VARIABLES Mil holding ratio (%) Mil holding ratio (%)
Chinese army mortality/ km2 0.014* 0.012***
(1.93) (4.94)
Japanese army mortality/km2 -0.014
(-0.28)
Other Controls Yes Yes
Fixed Effects
Military Capital,
Province, year-month
Military Capital,
Province, year-month
Observations 543,402 543,402
R-squared 0.001 0.001
Panel B. Age effect
(1) (2)
VARIABLES Mil holding ratio (%) Mil holding ratio (%)
Age×Treatment 0.012***
(4.59)
Age -0.003
(-1.22)
First post-war generation × Treatment 0.380***
(5.93)
First post-war generation -0.080
(-1.62)
Other Controls Yes Yes
Fixed Effects City, year-month City, year-month
Observations 1,033,702 1,033,702
R-squared 0.004 0.004

37
Panel C. Local media bias
N (unique city) Mean Std Min p25 p50 p75 Max
Yearly average # of war related news articles in all cities 345 26.27 24.86 0 12 20 34 263
Yearly average # of war related news articles in treatment cities 72 43.13 40.56 0 20 31.75 49 263
Yearly average # of war related news articles in control cities 273 21.82 16.04 0 11 18 30 116
Diff (Treatment-Control) 21.31***

38
Panel D. Local media effect
(1)
VARIABLES Mil holding ratio (%)
Highmedia dummy×Treatment 0.417***
(3.39)
Highmedia dummy 0.052
(0.61)
Other Control Yes
Fixed Effects City, year-month
Observations 944,065
R-squared 0.003
Panel E. Local media effect and age effect in one model
(1) (2)
VARIABLES Mil holding ratio
(%)
Mil holding ratio
(%)
Treatment×Highmedia dummy 0.408*** 0.403***
(3.32) (3.28)
Treatment×Age 0.015***
(5.12)
Treatment×First post-war generation 0.398***
(5.78)
Highmedia dummy 0.063 0.058
(0.73) (0.67)
Age -0.006**
(-2.37)
First post-war generation -0.113**
(-2.04)
Other Control Yes Yes
Fixed Effects City, year-month City, year-month
Observations 944,065 944,065
R-squared 0.003 0.003

39
Table 7 Effects of Diaoyu Island Dispute
This table shows the effects of Diaoyu Island dispute on military stock holding. Panel A presents a difference-in-difference analysis based on the event window. Panel B
presents the performance of military stock holding. Diaoyu Island dispute is first announced in 2012.4 and is further processed in 2012.9. The Pre-react-period is defined as
from 2011.10-2012.3; React-period is defined as from 2012.4-2012.9; Post-react-period is defined as from 2012.10-2013.3. Individual and year fixed effects are included.
Standard errors are clustered by city and year-month and clustering-corrected t-statistics are reported in parentheses. We use ***
, **
,* to indicate significance at 1%, 5%, 10%
level respectively. See Appendix A for definitions of the variables.
Panel A. Effect of Diaoyu Island Dispute on military stock holdings
VARIABLES Mil holding ratio (%)
Treatment×React-period 0.200**
(2.28)
Treatment×Post-react-period -0.021
(-0.25)
Log(Province quarterly GDP) -1.140***
(-2.65)
Province unemployment rate 0.249***
(2.84)
Constant 4.215***
(11.27)
Fixed Effects Individual, year-month
Observations 312,289
R-squared 0.702

40
Panel B. Performance of military stock holding
VARIABLES Next 1 month weighted average BHAR (Mil
Portfolio)
Next 3 month weighted average BHAR (Mil
Portfolio)
Treatment×React-period -0.002 -0.003
(-0.51) (-0.51)
Treatment×Post-react-period -0.002 -0.002
(-0.64) (-0.26)
Log(Province quarterly GDP) 0.014 0.020
(0.80) (0.67)
Province unemployment rate 0.004 0.006
(1.24) (1.11)
Constant -0.055*** -0.071***
(-4.12) (-2.88)
Fixed Effects Individual, year-month Individual, year-month
Observations 25,654 25,654
R-squared 0.265 0.346

41
A. Variables and Definitions
Mil holding ratio Military stocks holding ratio is computed as the total market value of
military stocks held by the individual at the end of the month and divided
by total market value of all the stocks held at the end of the month.
Market value is computed as month-end stock price multiplied by the
number of shares.
Chinese (Japanese) army
mortality per km2
The total number of the Chinese (Japanese) army death divided by the
area of city (unit: km2).
Male Dummy variable equals 1 if the account holder is a male and 0 otherwise.
Age The age of the account holders.
Risk dummy Dummy variable equals 1 if the account holder is classified as a risk lover
according to the mandatory risk assessment.
High trading dummy Information provided by the brokage firm
Experience The number of years of trading since the date of account opening.
Province yearly
unemployment rate
Yearly unemployment rate at the province level.
Province quarterly GDP Quarterly GDP for each province.
CSI300 market index Highly cited market index for A-share market in China
Market-adjusted abnormal
return
It is computed as the difference between the daily stock return and CSI
300 index market return
Next 1-month BHAR for
individual Mil stock
The buy and hold abnormal return of Mil stock over next 1 month. The
buy and hold abnormal return is computed as the buy-and-hold return of
the stock minus same size portfolio's equal-weighted buy and hold return.
The size portfolio is constructed according to market capitalization in
previous month (all the stocks are divided into 10 quantiles).
Next 3-month BHAR for
individual Mil stock
The buy and hold abnormal return of Mil stock over next 3 month. The
buy and hold abnormal return is computed as the buy-and-hold return of
the stock minus same size portfolio's equal-weighted buy and hold return.
The size portfolio is constructed according to market capitalization in
previous month (all the stocks are divided into 10 quantiles).
Next 1-month BHAR (Mil
Portfolio)
For each account at month t, we take the next 1 month (i.e. month t+1)
BHAR for the military portfolios held by each account, where the BHAR
is the buy and hold investment return for the firm minus the buy and hold
investment return for control portfolio. The control portfolio is
constructed according to same market capitalization decile in previous
month
Next 3-month BHAR (Mil
Portfolio)
For each account at month t, we take the next 3 month (i.e. month
t+1;t+2;t+3) BHAR for the military portfolios held by each account,
where the BHAR is the buy and hold investment return for the firm minus
the buy and hold investment return for control portfolio. The control
portfolio is constructed according to same market capitalization decile in
previous month.
Next 1 month weighted For each account at month t, we take weighted average of next 1 month

42
average BHAR (Mil
Portfolio)
(i.e. month t+1) BHAR for the military portfolios held by each account,
with weight of dollar holding value of each military stock (holding
shares*month end price), where the BHAR is the buy and hold
investment return for the firm minus the buy and hold investment return
for control portfolio. The control portfolio is constructed according to
same market capitalization decile in previous month.
Next 3 month weighted
average BHAR (Mil
Portfolio)
For each account at month t, we take weighted average of next 3 month
(i.e. month t+1;t+2;t+3) BHAR for the military portfolios held by each
account, with weight of dollar holding value of each military stock
(holding shares*month end price), where the BHAR is the buy and hold
investment return for the firm minus the buy and hold investment return
for control portfolio. The control portfolio is constructed according to
same market capitalization decile in previous month.
First post-war generation Dummy variable equals to 1 if age of the investor is between 40 and 65
(i.e. born between 1945-1970) and 0 otherwise;
High Media A dummy variable that equals 1 if the total number of war memory
related articles in the local media in the past 3 years is above the median
of all the cities in a year and 0 otherwise.
Distance It is the minimum distance between the city and 16 major iron ore mines
(>5 million tons) found before the Second Sino-Japanese War. Our iron
ore mine data is collected from Weng (1919).

43
Appendix B. The list of battle-suffered cities
This table shows detailed information for the Chinese historic battles this paper covers during the China-Japan War. Historic Battles is the name of the battle. Japanese
Mortality is the officially reported mortality of Japanese side for the battle. Chinese Mortality is the officially reported mortality in a battle.13
Historic Battles Japanese Mortality Chinese Mortality City Province Begin End
Changheng 19380 17000 Changsha; Hengyang Hunan 1944/5/27 1944/9/7
Changde 10000 60000 Changde Hunan 1943/11/1 1944/1/6
Changsha1 20000 42000 Changsha Hunan 1939/9/14 1939/10/15
Changsha2 7000 54000 Changsha Hunan 1941/9/7 1941/10/9
Changsha3 56000 28612 Changsha Hunan 1941/12/24 1942/1/16
Guangzhou 1923 2954 Guangzhou Guangdong 1938/10/9 1938/10/29
Guiliu 13400 25665 Liuzhou; Guilin Guangxi 1944/9/10 1944/12/1
Kunlunguan 5000 27014 Nanning Guangxi 1939/12/18 1939/12/31
Lanfeng 6000 Unknown Kaifeng Henan 1938/5/21 1938/6/17
Longlin 13200 29803 Baoshan Yunnan 1944/6/4 1944/7/9
Nankou 10000 29376 Beijing Beijing 1937/8/7 1937/8/27
Nanchang 24000 52000 Nanchang Jiangxi 1939/3/17 1939/5/9
Nanjing 12000 50000 Nanjing Jiangsu 1937/12/5 1937/12/13
Pingjin 127 5000 Tianjin; Beijing Tianjin; Beijing 1937/7/7 1937/7/30
Pingxinguan 1000 900 Xinzhou Shanxi 1937/9/25 1937/9/25
Shanggao 15792 20533 Yichun Jiangxi 1941/3/14 1941/4/9
Songhu 40000 333500 Shanghai Shanghai 1937/8/13 1937/11/12
Songshan 1250 7763 Baoshan Yunnan 1944/5/1 1944/9/30
Suizao 13000 20000 Suizhou; Zaoyang Hubei 1939/5/1 1939/5/23
Taierzhuang 11974 20000 Zaozhuang Shandong 1938/3/23 1938/4/7
13 We only have the information on the mortality of soldiers.

44
Taiyuan 30000 100000 Taiyuan Shanxi1 1937/7/1 1937/9/30
Tengchong 6100 18309 Baoshan Yunnan 1944/5/11 1944/9/14
Wuhan 257000 400000 Wuhan Hubei 1938/6/18 1938/10/25
Xinkou 20000 100000 Xinzhou Shanxi1 1937/10/13 1937/11/2
Xuzhou 32000 100000 Xuzhou Jiangsu 1938/1/1 1938/5/31
Zaoyi 7000 36983 Yichang; Zaoyang Hubei 1940/5/1 1940/6/24
Zhongtiao shan 673 42000 Yuncheng; Jincheng; Linfen Shanxi1 1941/5/7 1941/5/31
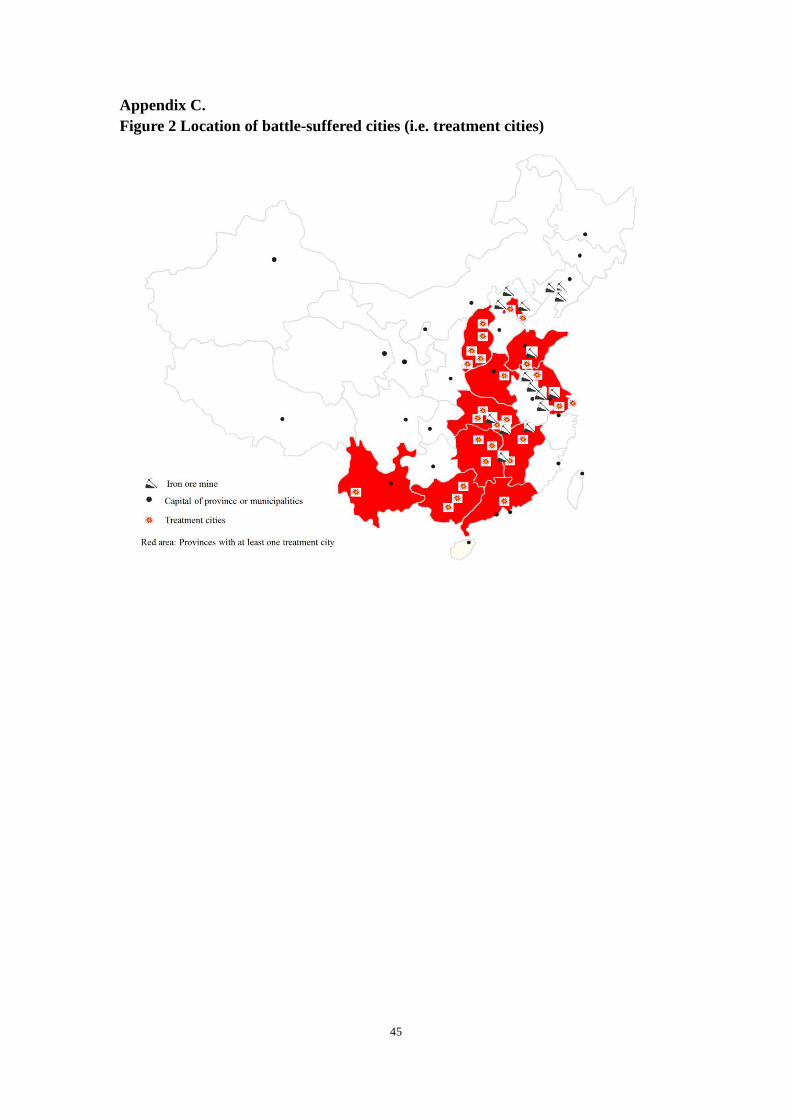
45
Appendix C.
Figure 2 Location of battle-suffered cities (i.e. treatment cities)