Embed Size (px)
Citation preview

Our Vision
Our Mission
To enhance our heritagebrand status and serve the nation
To provide the public with a variety of high quality foods and soaps
01
Notice of Meeting 2
Corporate Information 3
Chairman's Review 4
Managing Director's Report 5
Corporate Governance 8
Risk Management 13
Remuneration Committee Report 14
Audit Committee Report 15
Board of Directors 17
Annual Report of the Board of Directors
- on the Affairs of the Company 18
Statement of Directors' Responsibility for
- Financial Reporting 24
Independent Auditors' Report 25
Income Statement 26
Statement of Profit or Loss and Other
- Comprehensive Income 27
Statement of Financial Position 28
Statement of Changes in Equity 29
Statement of 31
Notes to the Financial Statements 32
Statement of Value Added 57
Ten Years Statistical Summary 58
Investor Information 59
Form of Proxy 61
Cash Flows
Annual Report 2015-2016

NOTICE OF MEETING
02
Annual Report 2015-2016
Legal Form
A public Company with limited liability incorporated in Sri
Lanka, whose shares are listed in the Colombo Stock
Exchange.
Company Registration Number
PQ. 225
Date of Incorporationth9 January, 1953
Registered Office
No. 11, C.A. Harischandra Mawatha, Matara.
Secretaries
Corporate Services (Private) Limited,
216, De Saram Place,
Colombo 10.
Auditors
KPMG
Chartered Accountants
32A, Sir Mohamed Macan Marker Mawatha,
Colombo 3.
Internal Auditors
Ernst & Young,
Chartered Accountants
201, De Saram Place,
Colombo 10.
Legal Advisors
F J & G De Saram
Attorneys - at - Law
216, De Saram Place,
Colombo 10.
Bankers
Sampath Bank PLC
Commercial Bank of Ceylon PLC
Hatton National Bank PLC
Nations Trust Bank PLC
NDB Bank PLC
DFCC Bank PLC
CORPORATE INFORMATION
Subsidiary Company
Harischandra Mills (Distributors) Limited (wholly owned)
incorporated in Sri Lanka.
Board of Directors
Bastiansz M.A.
(Chairman)
Samarasinghe S.N.
(Managing Director)
De Silva G.S.V.
De Silva M.P. (Mrs.)
Bandaranayake T.K.
Jayasundara S.A.S.
Samarasinghe R.K. (Mrs.)
Executive Management
Gajanayake C.T.
(Chief Financial Officer)
Nanayakkara S.N.K.
(Sales Manager)
Gamini Lokuralage D.S.
(Commercial Manager)
Kodithuwakku A.P.R.
(Human Resources Manager)
Ranasinghe N.P.
(Production Engineer)
Sanjeewa H.M.R.S.
(Chief Accountant)
03
Annual Report 2015-2016
04
CHAIRMAN'S REVIEW
thThis is the 64 Annual General Meeting of Harischandra Mills PLC.
It gives me great pleasure to welcome and present to you, on behalf of the Board of Directors, the Annual Report and Audited stAccounts of the Company for the financial year ended 31 March 2016.
Overall this was a year of mixed results. Although there was an increase in sales in the food sector, operating profits declined due to
higher input costs. On the other hand, despite a decline in sales, lower input costs contributed to an operating profit of 54% in the
soap sector. The Company's gross profit increased by 6% over the previous year, but the profit after tax declined by 8%.
The Company has paid an interim dividend of Rs. 40 per share. The directors have now proposed the payment of a final dividend of
Rs. 45 per share bringing the total dividend for the year 2015/2016 to Rs. 85 per share.
I am happy to state that, as in the past, the Company has been actively engaged in promoting community relations, and has made a
significant contribution towards improving health and education facilities in the region.
On behalf of the Board of Directors, I would like to thank the management and all members of the staff for their dedicated and loyal
service to the Company.
Maxwell A. Bastiansz
Chairman
12 August 2016
Annual Report 2015-2016
05
MANAGING DIRECTOR'S REPORT
During the year under review sales of food products increased by 9% compared to the previous year and operating profit of the
segment has decreased by 4% due to the higher input costs.
operating profit of soap improved by 54% compared to the previous year due to the lower input cost whereas sales declined by 8%.
Fuel and Lubricant segment reported a decline in sales by 2% compared to the previous year. However, upward price revisions by
the Ceylon Petroleum Corporation has resulted in increased profits by 23%.
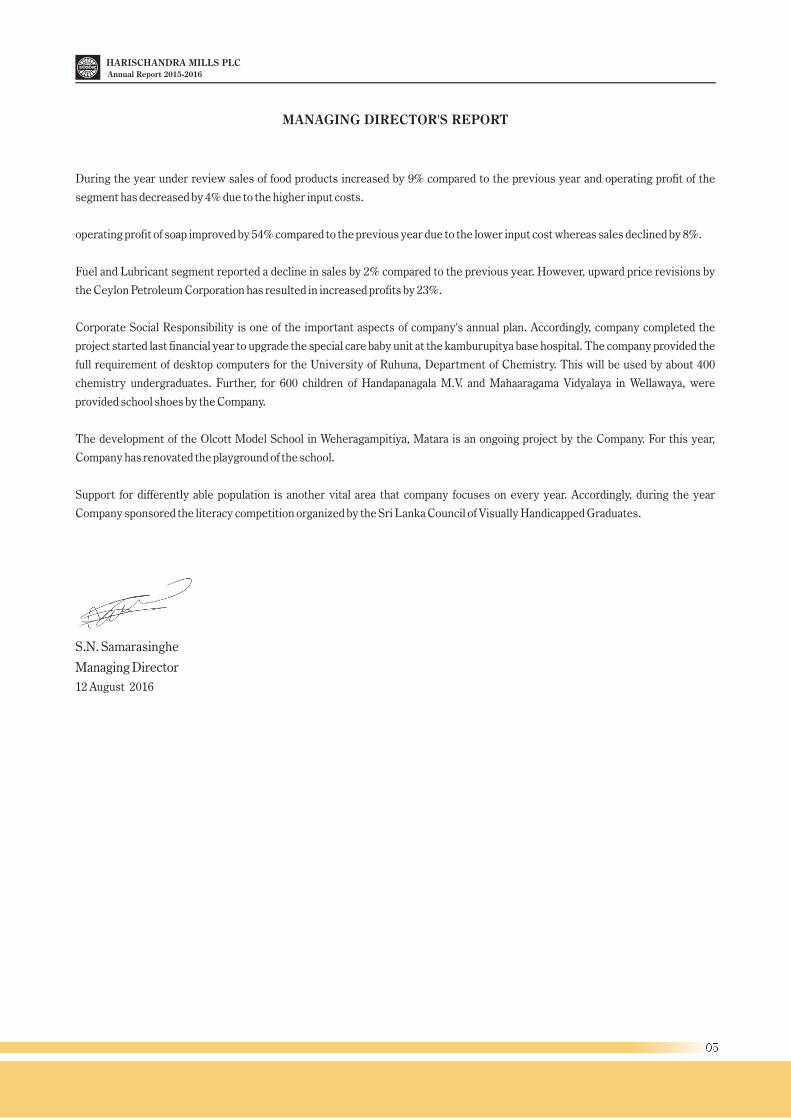
Corporate Social Responsibility is one of the important aspects of company's annual plan. Accordingly, company completed the
project started last financial year to upgrade the special care baby unit at the kamburupitya base hospital. The company provided the
full requirement of desktop computers for the University of Ruhuna, Department of Chemistry. This will be used by about 400
chemistry undergraduates. Further, for 600 children of Handapanagala M.V. and Mahaaragama Vidyalaya in Wellawaya, were
provided school shoes by the Company.
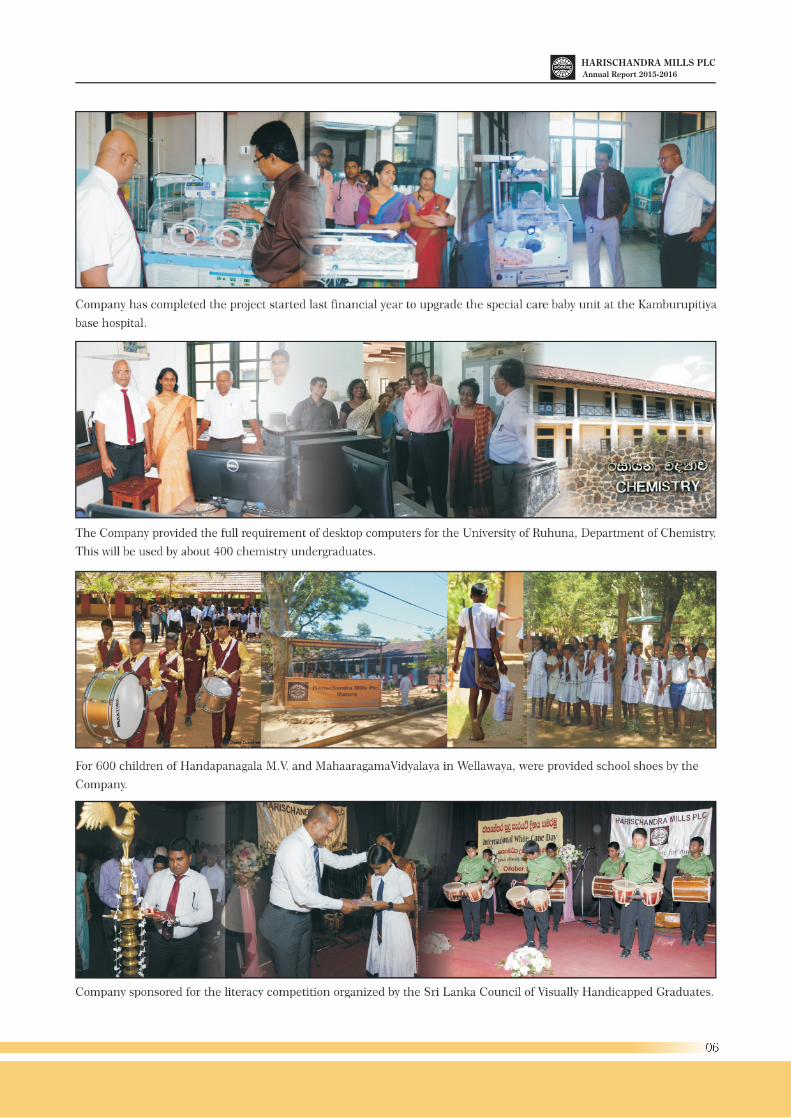
The development of the Olcott Model School in Weheragampitiya, Matara is an ongoing project by the Company. For this year,
Company has renovated the playground of the school.
Support for differently able population is another vital area that company focuses on every year. Accordingly, during the year
Company sponsored the literacy competition organized by the Sri Lanka Council of Visually Handicapped Graduates.
S.N. Samarasinghe
Managing Director
12 August 2016
Annual Report 2015-2016
06
Annual Report 2015-2016
07
Annual Report 2015-2016
CORPORATE GOVERNANCE
"Corporate Governance" is a generic term that describes the ways in which rights and responsibilities are distributed among the
various corporate bodies according to the rules, processes or laws to which they are subject. In practice, corporate governance
defines the decision-making systems and structure through which owners directly or indirectly control a company. The Board of
Directors of Harischandra Mills PLC is committed to ensuring business integrity and professionalism in all its activities. As a part of
this commitment, the Board of Directors has proactively encouraged good corporate governance practice within the Company
based on a generally accepted policy framework, which emphasizes transparency, control and accountability.
Board of Directors and its Role
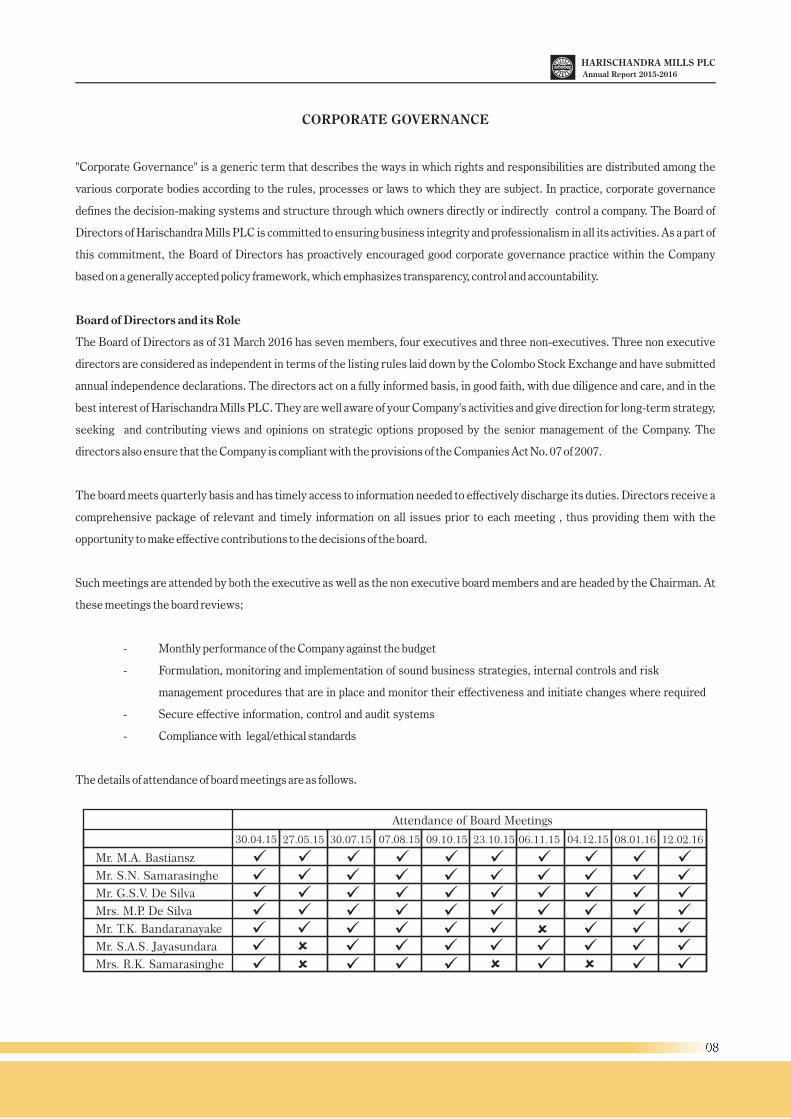
The Board of Directors as of 31 March 2016 has seven members, four executives and three non-executives. Three non executive
directors are considered as independent in terms of the listing rules laid down by the Colombo Stock Exchange and have submitted
annual independence declarations. The directors act on a fully informed basis, in good faith, with due diligence and care, and in the
best interest of Harischandra Mills PLC. They are well aware of your Company's activities and give direction for long-term strategy,
seeking and contributing views and opinions on strategic options proposed by the senior management of the Company. The
directors also ensure that the Company is compliant with the provisions of the Companies Act No. 07 of 2007.
The board meets quarterly basis and has timely access to information needed to effectively discharge its duties. Directors receive a
comprehensive package of relevant and timely information on all issues prior to each meeting , thus providing them with the
opportunity to make effective contributions to the decisions of the board.
Such meetings are attended by both the executive as well as the non executive board members and are headed by the Chairman. At
these meetings the board reviews;
- Monthly performance of the Company against the budget
- Formulation, monitoring and implementation of sound business strategies, internal
- Secure effective information, control and audit systems
- Compliance with legal/ethical standards
The details of attendance of board meetings are as follows.
controls and risk
management procedures that are in place and monitor their effectiveness and initiate changes where required
Mr. M.A. Bastiansz
Mr. S.N. Samarasinghe
Mr. G.S.V. De Silva
Mrs. M.P. De Silva
Mr. T.K. Bandaranayake
Mr. S.A.S. Jayasundara
Mrs. R.K. Samarasinghe
Attendance of Board Meetings
30.04.15 07.08.15 04.12.1527.05.15 09.10.15 08.01.1630.07.15 06.11.1523.10.15 12.02.16
üü üüüüü üüüüü üüüüü üüüüü üüüüü üüüüü üüüüü üüüüü üüüüü üüüû üüüüü üüüüû üüüüü üû û
û
08
Annual Report 2015-2016
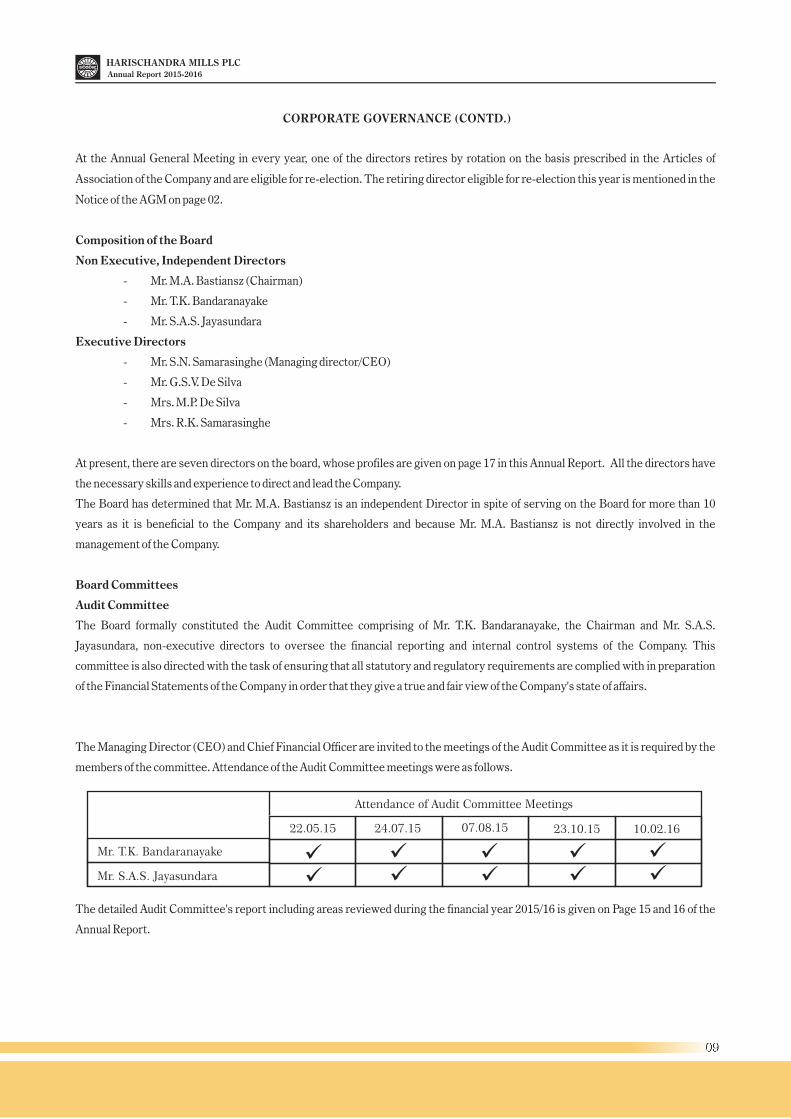
At the Annual General Meeting in every year, one of the directors retires by rotation on the basis prescribed in the Articles of
Association of the Company and are eligible for re-election. The retiring director eligible for re-election this year is mentioned in the
Notice of the AGM on page 02.
Composition of the Board
Non Executive, Independent Directors
- Mr. M.A. Bastiansz (Chairman)
- Mr. T.K. Bandaranayake
- Mr. S.A.S. Jayasundara
Executive Directors
- Mr. S.N. Samarasinghe (Managing director/CEO)
- Mr. G.S.V. De Silva
- Mrs. M.P. De Silva
- Mrs. R.K. Samarasinghe
At present, there are seven directors on the board, whose profiles are given on page 17 in this Annual Report. All the directors have
the necessary skills and experience to direct and lead the Company.
The Board has determined that Mr. M.A. Bastiansz is an independent Director in spite of serving on the Board for more than 10
years as it is beneficial to the Company and its shareholders and because Mr. M.A. Bastiansz is not directly involved in the
management of the Company.
Board Committees
Audit Committee
The Board formally constituted the Audit Committee comprising of Mr. T.K. Bandaranayake, the Chairman and Mr. S.A.S.
Jayasundara, non-executive directors to oversee the financial reporting and internal control systems of the Company. This
committee is also directed with the task of ensuring that all statutory and regulatory requirements are complied with in preparation
of the Financial Statements of the Company in order that they give a true and fair view of the Company's state of affairs.
CORPORATE GOVERNANCE (CONTD.)
The Managing Director (CEO) and Chief Financial Officer are invited to the meetings of the Audit Committee as it is required by the
members of the committee. Attendance of the Audit Committee meetings were as follows.
The detailed Audit Committee's report including areas reviewed during the financial year 2015/16 is given on Page 15 and 16 of the
Annual Report.
Mr. T.K. Bandaranayake
Mr. S.A.S. Jayasundara
Attendance of Audit Committee Meetings
22.05.15 24.07.15 07.08.15 23.10.15 10.02.16
ü üü üüü üü üü
09
Annual Report 2015-2016
CORPORATE GOVERNANCE (CONTD.)
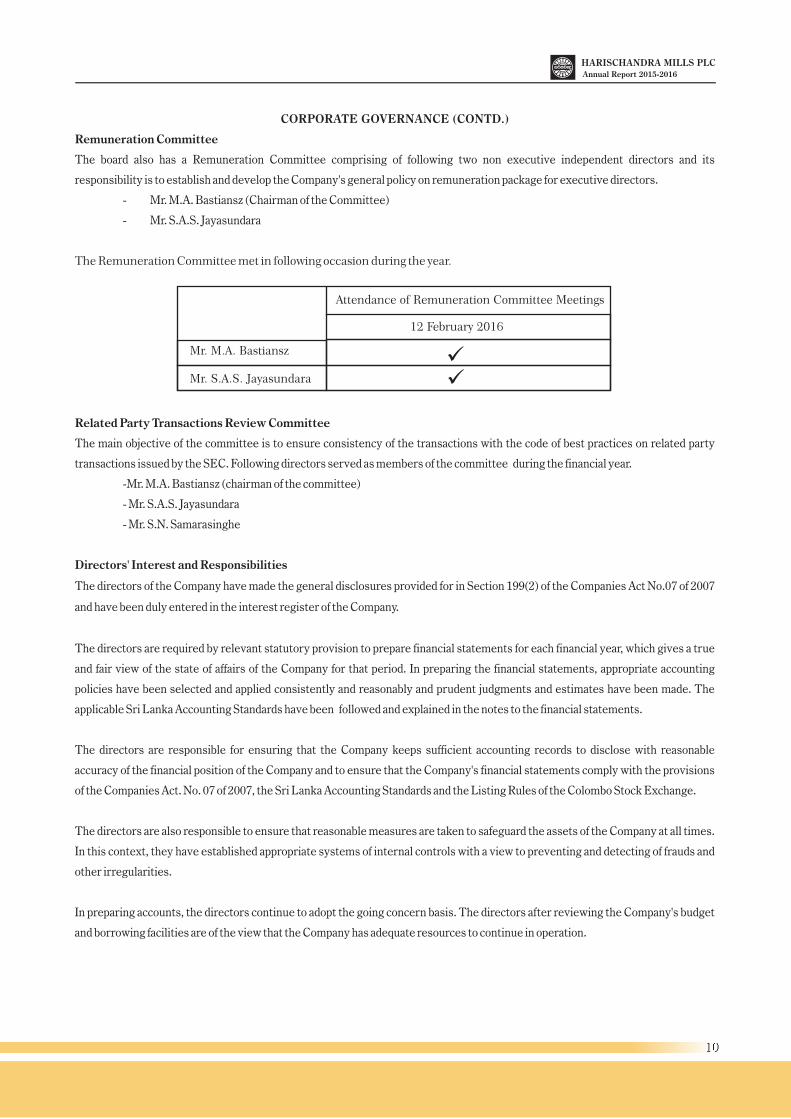
The Remuneration Committee met in following occasion during the year.
Remuneration Committee
The board also has a Remuneration Committee comprising of following two non executive independent directors and its
responsibility is to establish and develop the Company's general policy on remuneration package for executive directors.
- Mr. M.A. Bastiansz (Chairman of the Committee)
- Mr. S.A.S. Jayasundara
Related Party Transactions Review Committee
The main objective of the committee is to ensure consistency of the transactions with the code of best practices on related party
transactions issued by the SEC. Following directors served as members of the committee during the financial year.
-Mr. M.A. Bastiansz (chairman of the committee)
- Mr. S.A.S. Jayasundara
- Mr. S.N. Samarasinghe
Directors' Interest and Responsibilities
The directors of the Company have made the general disclosures provided for in Section 199(2) of the Companies Act No.07 of 2007
and have been duly entered in the interest register of the Company.
The directors are required by relevant statutory provision to prepare financial statements for each financial year, which gives a true
and fair view of the state of affairs of the Company for that period. In preparing the financial statements, appropriate accounting
policies have been selected and applied consistently and reasonably and prudent judgments and estimates have been made. The
applicable Sri Lanka Accounting Standards have been followed and explained in the notes to the financial statements.
The directors are responsible for ensuring that the Company keeps sufficient accounting records to disclose with reasonable
accuracy of the financial position of the Company and to ensure that the Company's financial statements comply with the provisions
of the Companies Act. No. 07 of 2007, the Sri Lanka Accounting Standards and the Listing Rules of the Colombo Stock Exchange.
The directors are also responsible to ensure that reasonable measures are taken to safeguard the assets of the Company at all times.
In this context, they have established appropriate systems of internal controls with a view to preventing and detecting of frauds and
other irregularities.
In preparing accounts, the directors continue to adopt the going concern basis. The directors after reviewing the Company's budget
and borrowing facilities are of the view that the Company has adequate resources to continue in operation.
Attendance of Remuneration Committee Meetings
12 February 2016
Mr. M.A. Bastiansz
Mr. S.A.S. Jayasundara
üü
10
Annual Report 2015-2016
CORPORATE GOVERNANCE (CONTD.)
Compliance with Legal Requirements
The board is conscious of its responsibilities to the shareholders, the government and the society in which it operates and is
unequivocally committed to upholding ethical behavior in conducting its business. The Board of Directors requires that Financial
Statements are prepared in accordance with the Sri Lanka Accounting Standards and the requirements of the Colombo Stock
Exchange.
Relationship with Shareholders
Harischandra Mills PLC aims to ensure that shareholders have access to relevant, up-to-date and consistent financial and non-
financial information pertaining to the Company. The Annual Report and quarterly Financial Statements provide the shareholders as
well as prospective investors with the required information to assess the Company's past performance and analyse its future
prospects.
Corporate Governance Requirements under the Listing Rules of Colombo Stock Exchange
Section 7 of the Listing Rules of the Colombo Stock Exchange requires all Listed Companies to include in their Annual Reports an
affirmative statement relating to compliance with the Corporate Governance Rules specified in that section. The table in page 12
contains the required affirmative statement in that regards.
Company Secretary
The Company secretary is qualified to act in this role as per the provisions of the Companies Act No. 07 of 2007
Internal and External Auditors
The Company's Internal Audit function has been outsourced and quarterly reports are submitted by the Internal Auditor. The
management decides on the areas that need to be audited by the Internal Auditor for a given quarter.
The External Auditors are appointed by the shareholders at the Annual General Meeting and are responsible to give their opinion on
the Financial Statements prepared by the Company.
rdAt the 63 Annual General Meeting of Harischandra Mills PLC held on 12 September 2015, the shareholders reappointed the
Auditors M/s. KPMG and authorised the directors to fix their remuneration. The independent auditors conduct the annual audit in
order to provide an external and objective assurance on the way in which the Financial Statements have been prepared and
presented.
The Company believes that the real value of corporate governance lies not in blindly satisfying a code of best practice
principle but rather in actually securing the confidence of the investors and thereby achieving a lower cost of equity by
conducting its affairs with utmost integrity & fairness to all stakeholders.
11
Annual Report 2015-2016
CORPORATE GOVERNANCE (CONTD.)
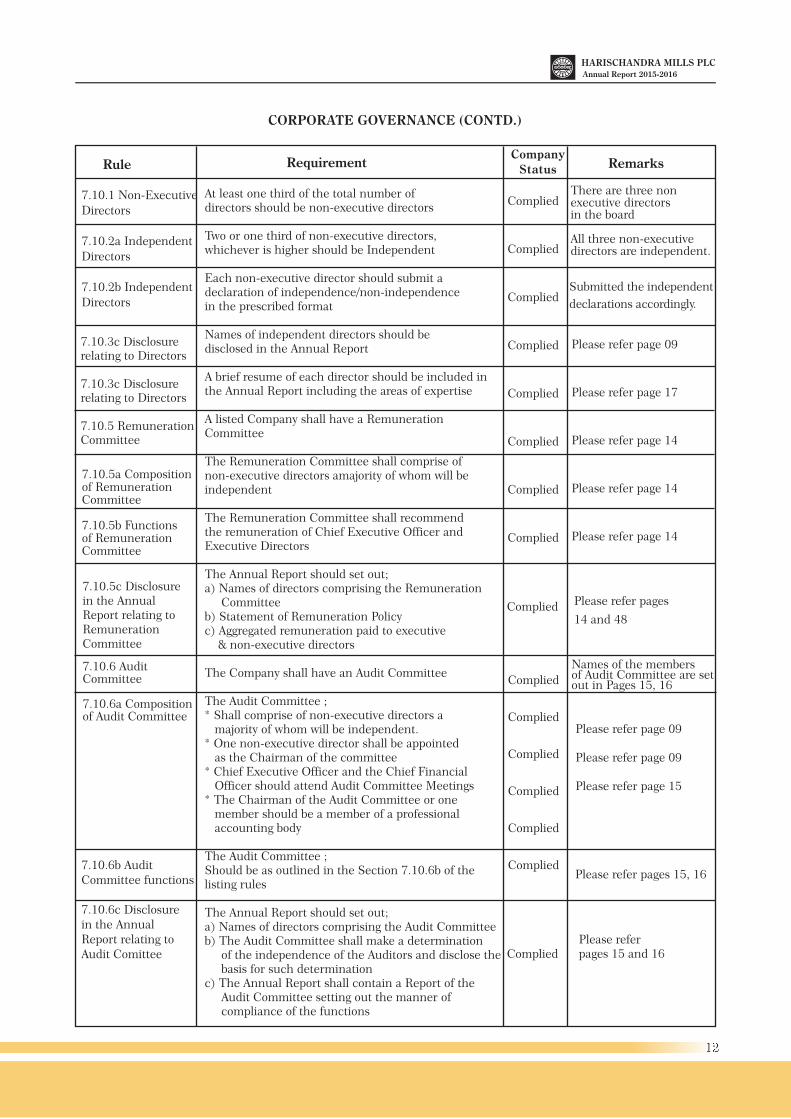
7.10.5c Disclosurein the Annual Report relating to RemunerationCommittee
7.10.1 Non-Executive
Directors
7.10.2a Independent
Directors
7.10.2b Independent
Directors
7.10.6 Audit Committee
7.10.6a Compositionof Audit Committee
7.10.6b AuditCommittee functions
7.10.6c Disclosurein the AnnualReport relating to Audit Comittee
At least one third of the total number of directors should be non-executive directors
Two or one third of non-executive directors,whichever is higher should be Independent
Each non-executive director should submit a declaration of independence/non-independencein the prescribed format
Names of independent directors should bedisclosed in the Annual Report
A brief resume of each director should be included inthe Annual Report including the areas of expertise
A listed Company shall have a RemunerationCommittee
shall comprise of non-executive directors amajority of whom will be independent
The Remuneration Committee shall recommend the remuneration of Chief Executive Officer andExecutive Directors
The Annual Report should set out;a) Names of directors comprising the Remuneration Committeeb) Statement of Remuneration Policyc) Aggregated remuneration paid to executive & non-executive directors
The Company shall have an Audit Committee
* Shall comprise of non-executive directors a majority of whom will be independent.* One non-executive director shall be appointed as the Chairman of the committee* Chief Executive Officer and the Chief Financial Officer should attend Audit Committee Meetings* The Chairman of the Audit Committee or one member should be a member of a professional accounting body
Should be as outlined in the Section 7.10.6b of thelisting rules
a) Names of directors comprising the Audit Committeeb) The Audit Committee shall make a determination of the independence of the Auditors and disclose the basis for such determinationc) The Annual Report shall contain a Report of the Audit Committee setting out the manner of compliance of the functions
The Remuneration Committee
The Audit Committee ;
The Audit Committee ;
The Annual Report should set out;
Complied
Complied
Complied
Complied
Complied
Complied
Complied
Complied
There are three nonexecutive directors in the board
All three non-executivedirectors are independent.
7.10.3c Disclosurerelating to Directors
7.10.3c Disclosurerelating to Directors
7.10.5 Remuneration Committee
7.10.5a Compositionof RemunerationCommittee
7.10.5b Functionsof Remuneration Committee
Complied
Complied
Complied
Complied
Complied
Complied
Complied
Complied
Submitted the independent
declarations accordingly.
Please refer page 09
Please refer page 17
Please refer page 14
Please refer page 14
Please refer page 14
Please refer pages
14 and 48
Names of the members of Audit Committee are setout in Pages 15, 16
Please refer page 09
Please refer page 09
Please refer page 15
Please refer pages 15, 16
Please refer pages 15 and 16
Rule RequirementCompany
Status Remarks
12
Annual Report 2015-2016
Risk management
Risk Management process is implemented in order to
understand, evaluate and address the inherited risks for the
Company to maximize the chance of objectives being achieved
while ensuring its sustainability. As it is impossible to mitigate
these risks completely, an effective process of this
management is required to exploit the opportunities bring and
allow Company to be aware of possibilities. Hence the
following identified risks are major to Company's performance
and position and are included in the risk management
procedure.
Supply Chain Management
Constant supply of high quality materials, efficient and
effective manufacturing and the timely distribution of products
is a must for the success of the Company.
Further the cost of raw materials represents the largest
portion of manufacturing cost of the Company's product; hence
the quality of the product is of paramount importance. The
Company is inevitably exposed to the risk of contaminated
raw materials accidently or maliciously throughout the supply
chain or product defects which occur due to human error or an
equipment failure.
In order to mitigate and minimize these problems, the
Company has developed contingency plans of having strong
relationship with its key suppliers to control quality by
periodical reviews to ensure that they meet rigorous testing
and acceptance procedure.
Market Risk
Loss of market share or market leadership in relevant
segments due to intense competition, new entrants, changes
in customer attitude and economic conditions are treated as
identifiable market risk.
Successful customer relationships are vital to our business and
continual growth. Maintaining a strong relationship with our
customers is necessary for our brand to be well presented and
available for purchase all time. Further, great customer
satisfaction and the confidence in our products lead to building
brand loyalty.
A Well maintained quality assurance department always works
according to the procedures and standards to deliver the best to
the customer, it will also ensure continuous focus on
innovation, regular monitoring of consumer trends, enhance
productivity or efficiency to improve price competitiveness,
Also Monitor market data, the competitor prices and always
strive to give the best price to our customers and strengthen
the market position of our brand. Combination of these
strategies minimizes the market risk to a considerable level.
RISK MANAGEMENT
Regulatory and Legal Risks
Potential losses arising due to violation of or non-
conformance with laws, rules, regulation, prescribed
practices, internal policies and procedures or ethical
standards are included as regulatory and legal risks. The
company is governed by Various laws and regulations
including Companies Act, Inland Revenue Act, SEC
regulations, and CSE rules.
Failure to comply with laws and regulations could expose
Company to civil criminal action leading to damages, fines and
criminal sanctions against our employees with possible
consequences to our reputation. And also changes to laws and
regulations could have a material impact on the cost of doing
business.
Therefore we have implemented strong risk management
processes to monitor and comply with all laws and regulations
applicable to the company. Management of the Company
always coordinates with Company lawyers and secretaries to
ensure compliance.
Internal audits also carried out every quarter to mitigate the
possible risks of not complying with relevant standards.
Financial and Liquidity Risks
The responsibility of the management of the financial risks
through continuous monitoring along with financial risk has
reduced exposure to credit risk and external financing is very
low. Also the liquidity risks, the risk of being unable to fund
the business by maintaining adequate cash flows. Cash flows
are reviewed continuously and strong relationship are being
maintained with financial institutions. The financial
indicators and the regular items on the board agenda and
emerging trends of both local and global are also taken as
ways of managing financial risk.
Human Resources
The Company places strong emphasis on retaining key talent
through its employee engagements and talent management
strategies including performance evaluation, career
guidance, training and development. The Company is aware
that the lack of skills and competence in staff could result in
the ability of the Company to grow and sustain its
performance in the face competition in the market and may
also lead to lower productivity and increased costs. The
structured and relevant training and development programs
are designed to mitigate all risks related to Human
Resources.
13
Annual Report 2015-2016
REMUNERATION COMMITTEE REPORT
The Remuneration Committee consists of two non executive directors, Mr. M.A. Bastiansz (Chairman of the committee) and Mr.
S.A.S. Jayasundara.
The role of the Remuneration Committee includes review and recommends to the board total remuneration for executive and non
executive directors for the year. The committee evaluates the remuneration by considering the existing market rates and
compensation packages offered by other similar companies.
Apart from recommending remuneration of executive directors, the committee reviews the remuneration policy of the Company.
The remuneration policy of the Company, takes into account market rates, experience and skill of the employees, employee grade
and performance when determining the remuneration package of employees. This will help not only to retain the existing staff but
also to attract high calibre employees.
Aggregate remuneration paid to executive directors and non executive directors are disclosed at page 48.
M.A. Bastiansz
Chairman - Remuneration Committee
12 August 2016
14
Annual Report 2015-2016
AUDIT COMMITTEE REPORT
Role of the Committee
The board has delegated to the committee responsibility for overseeing the financial reporting and internal control of the company
as well as the internal audit process and the external audit. The main role of the Committee is to encourage and safeguard the
highest standards of integrity, financial reporting, risk management and internal control. In doing this the principal responsibilities
of the committee include:
- Reviewing the form and content and monitoring the integrity of the Company's and the Group's
Financial Statements
- Monitoring and reviewing the arrangements for ensuring the objectivity and effectiveness of the external and
internal audit functions and in particular, the independence of the External Auditors.
- Recommending to the Board, the appointment, re-appointment or removal of the External Auditors and the fees
payable to them.
- Reviewing the adequacy and effectiveness of the Company's internal controls and risk -
Reviewing and monitoring the Company's ethical standards, procedures for ensuring compliance with statutory and
regulatory requirements and its relationship with the relevant regulatory authorities.
Composition
The Audit Committee consists of independent non-executive directors and presently comprises, Mr. T.K. Bandaranayake
(Chairman) and Mr. S.A.S. Jayasundara.
Meetings of the Committee
The Audit committee met five times in the financial year. The Managing Director (Chief Executive Officer) and Chief Financial
Officer attended by invitation and briefed the committee on specific issues. The external and internal auditors were also required to
attend meetings where considered necessary.
Activities
During the year under review the committee has carried out the following activities.
Financial Reporting ;
During the year, the committee reviewed financial reporting and related matters including the quarterly and annual Financial
Statements, other related annual report information, and announcements prior to submission to the board. The committee focused
in particular on key accounting policies and practices adopted by the Company and any significant areas of judgment that materially
impacted on reported results.
Internal Audit and Control Issues ;
At its meetings during the year, the committee reviewed the results of the audits undertaken by the Internal Auditors, Messrs,
Ernst & Young, and considered the adequacy of management's response to the matters raised, including the implementation of
recommendations made by the auditors. It reviewed and approved the internal audit plan for the coming year and the level of
resources allocated to the internal audit function.
management systems; and
15
Annual Report 2015-2016
AUDIT COMMITTEE REPORT (CONTD.)
External Audit;
The committee met with the External Auditors, Messrs KPMG prior to commencement of the annual audit and approved the audit
plan presented by them. At the conclusion of the annual audit, the committee met the auditors to discuss the findings of the audit.
Non-executive directors had separate meetings with auditors to discuss any sensitive issues and ensure they had no cause to
compromise on their independence. Auditors' Management Letter together with the Management's response thereto and the
Audited Financial Statements were reviewed with the auditors. The Audit Committee has recommended to the Board of Directors
that Messrs. KPMG be reappointed as Auditors for the financial year ending 31st March 2017 subject to the approval of shareholders
at the next Annual General Meeting at a fee to be determined by the Board.
Conclusion
The other members of the Board of Directors, through the annual evaluation conducted, has assessed effectiveness of the
committee as satisfactory.
T.K. Bandaranayake
Chairman - Audit Committee
12 August 2016
16
Annual Report 2015-2016
Mr. M.A. Bastiansz
Independent Non Executive Chairman
Mr. Bastiansz was appointed to the Board as the Chairman of
Harischandra Mills PLC in November 2005. He is the
Chairman of the Remuneration Committee of the Board. He
holds a LLB Degree from the University of Ceylon and is an
Attorney-at-Law by profession.
Mr. S.N. Samarasinghe
Managing Director / Executive Director
Mr. Samarasinghe joined the Company in 1990 as Commercial
Manager and was appointed to the Board of Directors in 1993.
In October 2000 he was appointed as the Managing Director.
He has overall responsibility for the production, finance,
marketing and human resource functions of the Company.
He has a BSc.(Hons) from the University of Leeds UK, Post
Graduate Diploma in Business and Financial Administration
awarded by the Institute of Chartered Accountants of Sri
Lanka and a Post Graduate Certificate in Corporate Business
Finance from the Post Graduate Institute of Management,
University of Sri Jayawardenapura.
Mr. G.S.V. De Silva
Executive Director
Mr. De Silva joined Harischandra Mills PLC as an Non
executive director in July 1978. He has gained wide and varied
experience in all aspects of the Company. Prior to joining
Harischandra Mills PLC he worked as an Accountant at Sri
Lanka Transport Board.
Mrs. M.P. De Silva
Executive Director
Mrs. De Silva joined Harischandra Mills PLC as a Non
executive director in January 1993, and was appointed as an
executive director in February 1999. She currently heads the
bakery division of the Company. She has been responsible for
the innovation of a wide range of bottled and packeted Food
Products which are made under her supervision.
Mr. Tissa K. Bandaranayake
Independent Non Executive Director
A Fellow member of the Institute of Chartered Accountants of
Sri Lanka. Holds a BSc. degree from the University of Ceylon.
Retired from Ernst & Young as a senior partner in 2009 after
27 year of service.
BOARD OF DIRECTORS
A former Chairman of the Audit Faculty and the current
Chairman of the Quality Assurance Board of Sri Lanka
established by the Institute of Chartered Accountants of Sri
Lanka comprising senior professional representatives from
both the private sector and state regulatory bodies.
Serves as an independent director of Overseas Realty
(Ceylon) PLC, Nawaloka Hospitals PLC, Samson
International PLC, Laugfs Gas PLC, Renuka Foods PLC,
Renuka Holdings PLC, Micro Holdings Ltd and Brown &
Company PLC.
Also serves as a consultant to the Board of Noritake Lanka
Porcelain (Pvt) Ltd.
Mr. S.A.S. Jayasundara
Independent Non Executive Director
Mr. Jayasundara joined the Board in June 2007. He holds a
LLB degree from the University of Colombo and is an
Attorney-at-Law by profession. He is a member of both Audit
and Remuneration Committee of the Board.
He is a Non Executive Director of Bogawanthalawa Tea
Estates PLC, Metropolitan Resource Holdings PLC, Bimputh
Finance PLC and Sithara Limited.
Mrs. R.K. Samarasinghe
Executive Director
Holds Master of Arts from University of Sussex and Master of
Social Science from University of Birmingham, and a Post
Graduate Diploma in Counselling Psychotherapy. Served as a
Counsellor at the University of Fine Arts, Colombo and
MIND, Enfield, London.
Mrs. Samarasinghe also served as a lecturer in Social Science
Sutton Coldfield College of Further Education, Birmingham
England and Kingsway College, London.
17
Annual Report 2015-2016
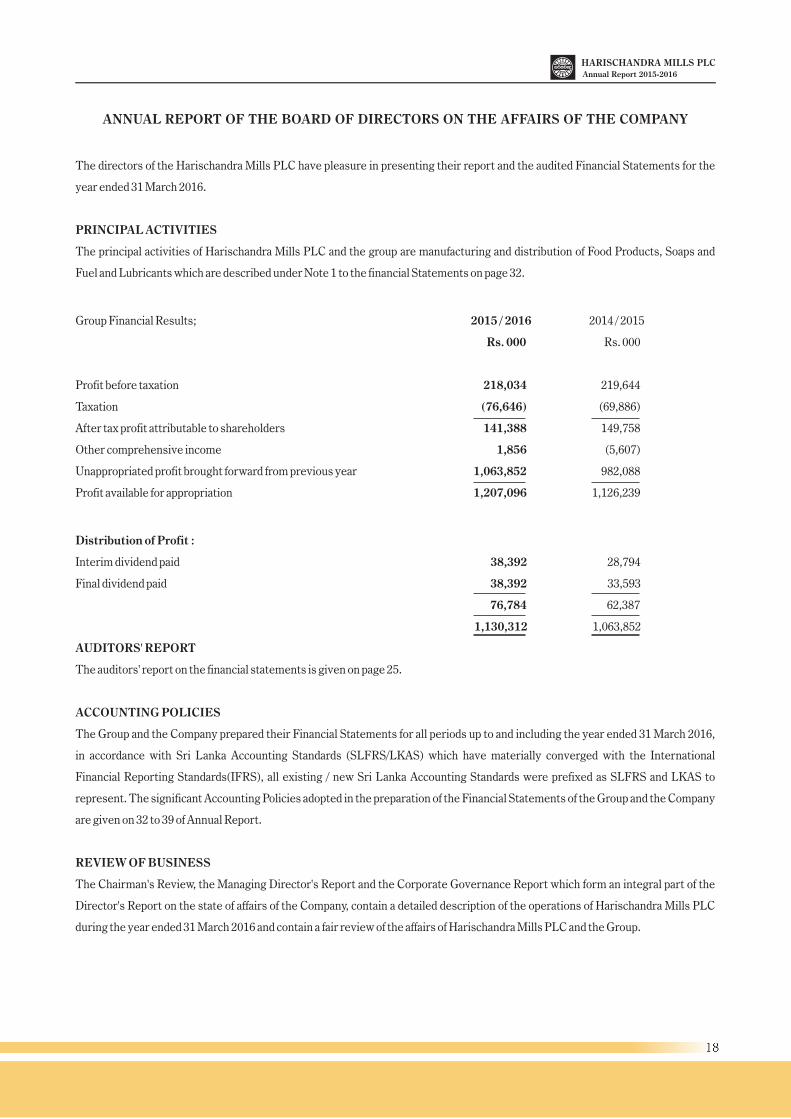
ANNUAL REPORT OF THE BOARD OF DIRECTORS ON THE AFFAIRS OF THE COMPANY
The directors of the Harischandra Mills PLC have pleasure in presenting their report and the audited Financial Statements for the
year ended 31 March 2016.
PRINCIPAL ACTIVITIES
The principal activities of Harischandra Mills PLC and the group are manufacturing and distribution of Food Products, Soaps and
Fuel and Lubricants which are described under Note 1 to the financial Statements on page 32.
Group Financial Results; 2015 / 2016 2014 / 2015
Rs. 000 Rs. 000
Profit before taxation 218,034 219,644
Taxation (76,646) (69,886)
After tax profit attributable to shareholders 141,388 149,758
Other comprehensive income 1,856 (5,607)
Unappropriated profit brought forward from previous year 1,063,852 982,088
Profit available for appropriation 1,207,096 1,126,239
Distribution of Profit :
Interim dividend paid 38,392 28,794
Final dividend paid 38,392 33,593
76,784 62,387
1,130,312 1,063,852
AUDITORS' REPORT
The auditors' report on the financial statements is given on page 25.
ACCOUNTING POLICIES
The Group and the Company prepared their Financial Statements for all periods up to and including the year ended 31 March 2016,
in accordance with Sri Lanka Accounting Standards (SLFRS/LKAS) which have materially converged with the International
Financial Reporting Standards(IFRS), all existing / new Sri Lanka Accounting Standards were prefixed as SLFRS and LKAS to
represent. The significant Accounting Policies adopted in the preparation of the Financial Statements of the Group and the Company
are given on 32 to 39 of Annual Report.
REVIEW OF BUSINESS
The Chairman's Review, the Managing Director's Report and the Corporate Governance Report which form an integral part of the
Director's Report on the state of affairs of the Company, contain a detailed description of the operations of Harischandra Mills PLC
during the year ended 31 March 2016 and contain a fair review of the affairs of Harischandra Mills PLC and the Group.
18
Annual Report 2015-2016
ANNUAL REPORT OF THE BOARD OF DIRECTORS ON THE AFFAIRS OF THE COMPANY
(CONTD.)
DIRECTORS' RESPONSIBILITY FOR FINANCIAL REPORTING
The directors are responsible for the preparation of the Financial statements of Harischandra Mills PLC to reflect a true and fair
view of the state of its affairs. The directors confirmed that these Financial Statements have been prepared in conformity with the
requirements of the Sri Lanka Accounting Standards, the Companies Act No. 7 of 2007 and the Listing Rules of the Colombo Stock
Exchange.
The directors are satisfied that Financial Statements give a true and fair view of the state of affairs of Harischandra Mills PLC and the
Group as at 31 March 2016 as well as the profit for the year then ended.
The directors consider that, in preparing these Financial Statements, appropriate accounting policies have been used which are
applied consistently and that all applicable accounting standards have been followed. The Financial Statements are prepared on a
going concern basis.
CORPORATE GOVERNANCE
Detail report on corporate governance practices and principles of the Company are set out on pages 08 to 12 of this report. The
directors are responsible for the governance of Harischandra Mills PLC including the establishment and maintenance of the
systems of internal financial control of the Company.
The directors are satisfied that a strong control environment is established within Harischandra Mills PLC and those internal
control systems are operating effectively.
CORPORATE SOCIAL RESPONSIBILITY
Details of social work carried out are included in the Managing Director's report set out on Page 05.
DONATIONS
Donations were Rs. 3,631,414/- compared to Rs. 3,523,816/- donated in the last year. No donations to political organizations were
made by the group during the year.
GROUP TURNOVER
The turnover of the Company and its subsidiary together with the segmental performance are set out on the ''Notes to the Financial
Statements''.
FINAL DIVIDEND
thThe directors paid an interim dividend of Rs. 40/- per share on 12 May 2016, and propose a final dividend of Rs.40/- per share, to be
paid out of the profits of Harischandra Mills PLC and dividend received for the financial year ended 2015/2016. Harischandra Mills
PLC paid a dividend for the previous year of Rs. 80/- per share. In recommending the payment of this dividend, the directors
unanimously declare that, in their opinion, the Company will satisfy the solvency test stipulated in section 57 of the Companies Act
No. 07 of 2007 immediately after the distribution is made and have obtained a certificate of solvency from the Auditors to this effect.
19
Annual Report 2015-2016
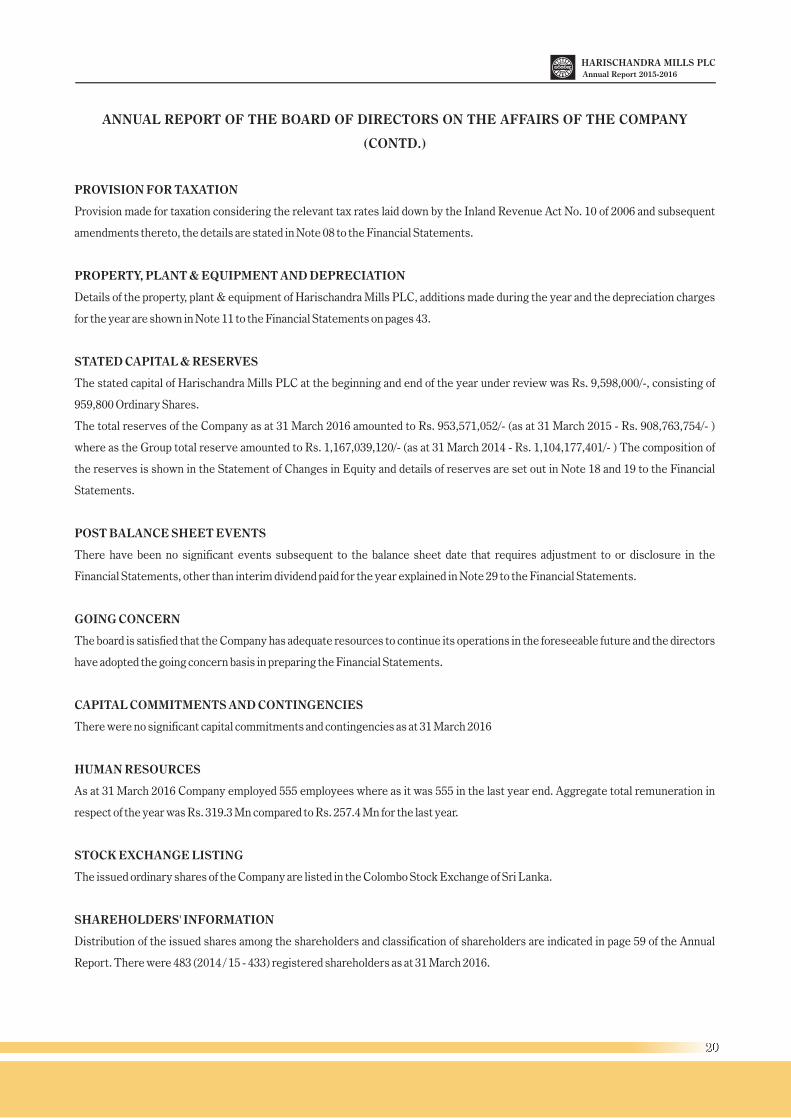
ANNUAL REPORT OF THE BOARD OF DIRECTORS ON THE AFFAIRS OF THE COMPANY
(CONTD.)
PROVISION FOR TAXATION
Provision made for taxation considering the relevant tax rates laid down by the Inland Revenue Act No. 10 of 2006 and subsequent
amendments thereto, the details are stated in Note 08 to the Financial Statements.
PROPERTY, PLANT & EQUIPMENT AND DEPRECIATION
Details of the property, plant & equipment of Harischandra Mills PLC, additions made during the year and the depreciation charges
for the year are shown in Note 11 to the Financial Statements on pages 43.
STATED CAPITAL & RESERVES
The stated capital of Harischandra Mills PLC at the beginning and end of the year under review was Rs. 9,598,000/-, consisting of
959,800 Ordinary Shares.
The total reserves of the Company as at 31 March 2016 amounted to Rs. 953,571,052/- (as at 31 March 2015 - Rs. 908,763,754/- )
where as the Group total reserve amounted to Rs. 1,167,039,120/- (as at 31 March 2014 - Rs. 1,104,177,401/- ) The composition of
the reserves is shown in the Statement of Changes in Equity and details of reserves are set out in Note 18 and 19 to the Financial
Statements.
POST BALANCE SHEET EVENTS
There have been no significant events subsequent to the balance sheet date that requires adjustment to or disclosure in the
Financial Statements, other than interim dividend paid for the year explained in Note 29 to the Financial Statements.
GOING CONCERN
The board is satisfied that the Company has adequate resources to continue its operations in the foreseeable future and the directors
have adopted the going concern basis in preparing the Financial Statements.
CAPITAL COMMITMENTS AND CONTINGENCIES
There were no significant capital commitments and contingencies as at 31 March 2016
HUMAN RESOURCES
As at 31 March 2016 Company employed 555 employees where as it was 555 in the last year end. Aggregate total remuneration in
respect of the year was Rs. 319.3 Mn compared to Rs. 257.4 Mn for the last year.
STOCK EXCHANGE LISTING
The issued ordinary shares of the Company are listed in the Colombo Stock Exchange of Sri Lanka.
SHAREHOLDERS' INFORMATION
Distribution of the issued shares among the shareholders and classification of shareholders are indicated in page 59 of the Annual
Report. There were 483 (2014 / 15 - 433) registered shareholders as at 31 March 2016.
20
Annual Report 2015-2016
ANNUAL REPORT OF THE BOARD OF DIRECTORS ON THE AFFAIRS OF THE COMPANY
(CONTD.)
Mr. M.A. Bastiansz (Chairman)
Mr. S.A.S. Jayasundara
Mr. S.N. Samarasinghe
DIRECTORATE
The directors of Harischandra Mills PLC during the year ended 31.03.2016 are as follows.
Mr. M.A. Bastiansz (Chairman) - Non Executive, Independent Director
Mr. S.N. Samarasinghe (Managing Director) - Executive, Non Independent Director
Mr. G.S.V. De Silva - Executive, Non Independent Director
Mrs. M.P. De Silva - Executive, Non Independent Director
Mrs. R.K.Samarasinghe - Executive, Non Independent Director
Mr. T.K. Bandaranayake - Non Executive, Independent Director
Mr. S.A.S. Jayasundara - Non Executive, Independent Director
Directors profiles are set out on page 17 in the Annual Report.
MAJOR SHAREHOLDERS
The 20 largest shareholders of Harischandra Mills PLC as at 31 March 2016 are given on page 59 together with an analysis of the
shareholdings. As at that date Harischandra Mills PLC had 483 shareholders.
SUB-COMITTEES OF THE BOARD
There are three permanent sub-committees of the Board which are as follows:
1. Audit Committee : Mr. T.K. Bandaranayake (Chairman)
Mr. S.A.S. Jayasundara
2. Remuneration Committee : Mr. M.A. Bastiansz (Chairman)
Mr. S.A.S. Jayasundara
3. Related Party Transactions
Review Committee :
INTEREST REGISTER
The Company has maintained interest register as required by Companies Act No. 07 of 2007.
All directors have made declarations as provided for in section 192 (2) of the Companies Act aforesaid. The related entries were
made in the interest register during the year under review.
DIRECTORS' INTEREST IN CONTRACTS
Details of directors' interests in contracts of the Company are disclosed below and provided in note 26 of the Financial Statements.
The directors have no direct or indirect interest or proposed contract other than those disclosed.
Following directors of the Company are also directors of the Harischandra Mills (Distributors) Limited, which is a fully owned
subsidiary.
21
Annual Report 2015-2016
ANNUAL REPORT OF THE BOARD OF DIRECTORS ON THE AFFAIRS OF THE COMPANY
(CONTD.)
Name of Director Position Shareholding
Mr. M.A. Bastiansz Director (Non - Executive) Non
Mr. S.N. Samarasinghe Managing Director 1 Share
Mr. G.S.V. De Silva Director (Executive) 1 Share
Mrs. M.P. De Silva Director (Executive) 1 Share
DIRECTORS' REMUNERATION
The aggregate remuneration paid to executive and non executive directors in respect of the Group and the Company for the financial
year ended 31 March 2016 were recorded as Rs. 31,977,998 (2014 / 2015 -Rs. 26,960,800/-).
DIRECTORS SHAREHOLDING
Name of Director 31 March 2016 01 April 2015
No of Shares % No. of Shares %
Mrs. R.K. Samarasinghe 135,060 14.07 135,060 14.07
Mr. S.N. Samarasinghe 38,335 3.99 38,335 3.99
Mr. G.S.V. De Silva 1,000 0.10 1,000 0.10
Mrs. M.P. De Silva 2,500 0.26 2,500 0.26
Mr. M.A. Bastiansz - - - -
Mr. T.K. Bandaranayake - - - -
Mr. S.A.S. Jayasundara - - - -
Total 176,895 18.42 176,895 18.42
APPLICATION OF THE CORPORATE GOVERNANCE RULES OF THE COLOMBO STOCK EXCHANGE
As per the section 7 of the Listing Rules of the Colombo Stock Exchange on Corporate Governance, the details on compliance are
set out on page 12 in this annual report.
AUDITORS
The Financial Statements for the year ended 31 March 2016 have been audited by M/s. KPMG Chartered Accountants. The auditors
do not have any relationship with or any interest in the Company or its subsidiary other than auditors.
Fees to Auditors
The fees of the Auditors during the year were Rs. 1,000,000/- (2014 / 15 - Rs.- 1,000,000/-) for audit work, Rs.483,000/- (2014 / 15 -
Rs. 394,000/-) for audit related services.
Re-Appointment of Auditors
The Auditors have indicated their willingness to offer themselves for re-appointment. A resolution appointing M/s. KPMG as
Auditors and authorizing the directors to fix their remuneration will be proposed at the Annual General Meeting.
22
Annual Report 2015-2016
ANNUAL GENERAL MEETING
The sixty fourth Annual General Meeting of the Company will be held at the registered office of the Company, No. 11, C.A.
Harischandra Mawatha, Matara., on the September 2016 at 11.00 a.m. The Notice of the sixty third Annual General Meeting is on
page 2 of the Annual Report.
For and on behalf of the Board
Harischandra Mills PLC
S. N. Samarasinghe - Managing Director G. S. V. De Silva - Director
Corporate Services (Private) Limited
Secretaries
12 August 2016
23
Annual Report 2015-2016
STATEMENT OF DIRECTORS' RESPONSIBILITY FOR FINANCIAL REPORTING
The directors are responsible, Under the Companies Act. No. 07 of 2007, to ensure compliance with the requirements set out
therein to prepare Financial Statements for each financial year giving a true and fair view of the state of affairs of the Company and
the Group as at the end of the financial year and of the profit or loss of the Company and the Group for the financial year. The directors
are also responsible for ensuring that proper accounting records are kept to disclose, with reasonable accuracy, the financial position
and to enable the preparation of the Financial Statements.
The directors confirm that they have complied with these requirements.
The Board accepts responsibility for the integrity and objectivity of the Financial Statements presented. The directors also confirm
that in preparing the Financial Statements, appropriate accounting policies have been selected and applied consistently and
reasonable and prudent judgments have been made so that the form and substance of transactions are properly reflected.
They also confirm that the Financial Statements have been prepared and presented in accordance with the Sri Lanka Accounting
Standards. The Financial Statements provide the information required by the Companies Act, the Listing Rules of the Colombo
Stock Exchange and the Sri Lanka Accounting Standards.
The directors have taken reasonable measures to safeguard the assets of the Group and, in that context, have instituted appropriate
systems of internal control with a view to prevent and detect fraud and other irregularities.
The External Auditors, Messrs KPMG appointed in accordance with the resolution passed at the last Annual General Meeting were
provided with every opportunity to undertake whatever inspections they consider appropriate to enable them to form their opinion
on the Financial Statements. The report of the Auditors, shown on page 25 sets out their responsibilities in relation to the Financial
Statements.
By order of the Board
Corporate Services (Private) Limited
Secretaries
12 August 2016
24
Annual Report 2015-2016

25
Annual Report 2015-2016
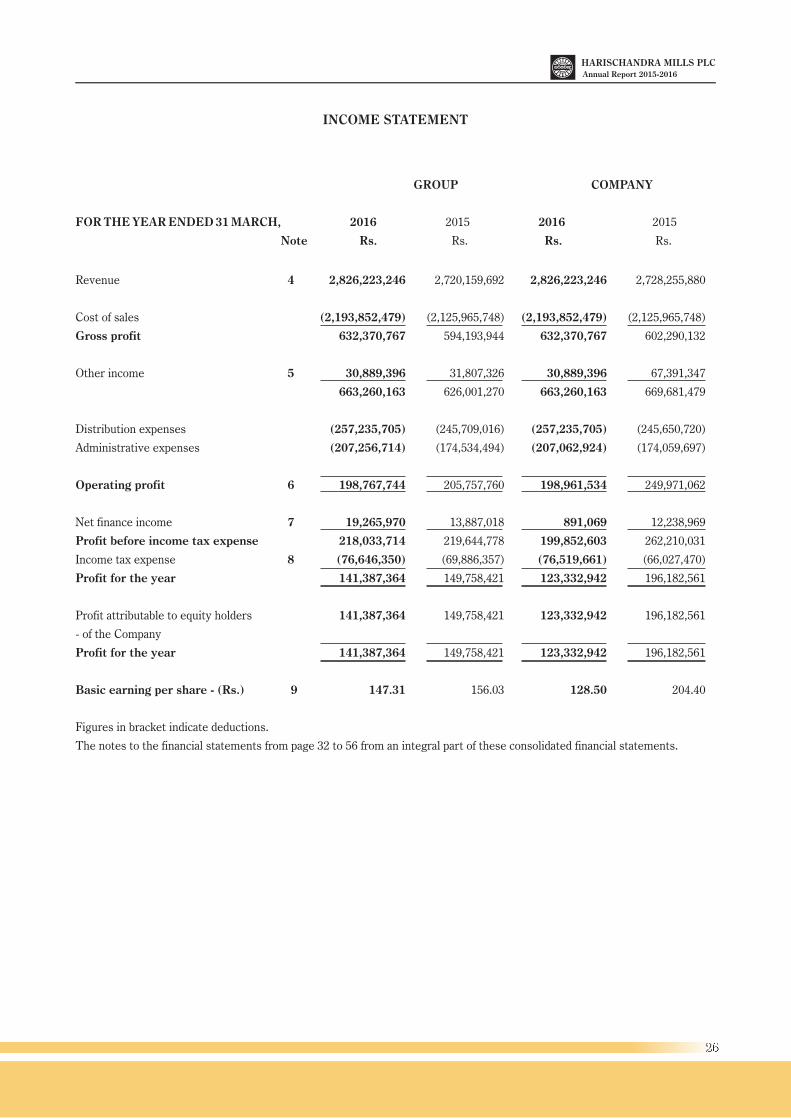
INCOME STATEMENT
GROUP COMPANY
FOR THE YEAR ENDED 31 MARCH, 2016 2015 2016 2015
Note Rs. Rs. Rs. Rs.
Revenue 4 2,826,223,246 2,720,159,692 2,826,223,246 2,728,255,880
Cost of sales (2,193,852,479) (2,125,965,748) (2,193,852,479) (2,125,965,748)
Gross profit 632,370,767 594,193,944 632,370,767 602,290,132
Other income 5 30,889,396 31,807,326 30,889,396 67,391,347
663,260,163 626,001,270 663,260,163 669,681,479
Distribution expenses (257,235,705) (245,709,016) (257,235,705) (245,650,720)
Administrative expenses (207,256,714) (174,534,494) (207,062,924) (174,059,697)
Operating profit 6 198,767,744 205,757,760 198,961,534 249,971,062
Net finance income 7 19,265,970 13,887,018 891,069 12,238,969
Profit before income tax expense 218,033,714 219,644,778 199,852,603 262,210,031
Income tax expense 8 (76,646,350) (69,886,357) (76,519,661) (66,027,470)
Profit for the year 141,387,364 149,758,421 123,332,942 196,182,561
Profit attributable to equity holders 141,387,364 149,758,421 123,332,942 196,182,561
- of the Company
Profit for the year 141,387,364 149,758,421 123,332,942 196,182,561
Basic earning per share - (Rs.) 9 147.31 156.03 128.50 204.40
Figures in bracket indicate deductions.
The notes to the financial statements from page 32 to 56 from an integral part of these consolidated financial statements.
26
Annual Report 2015-2016
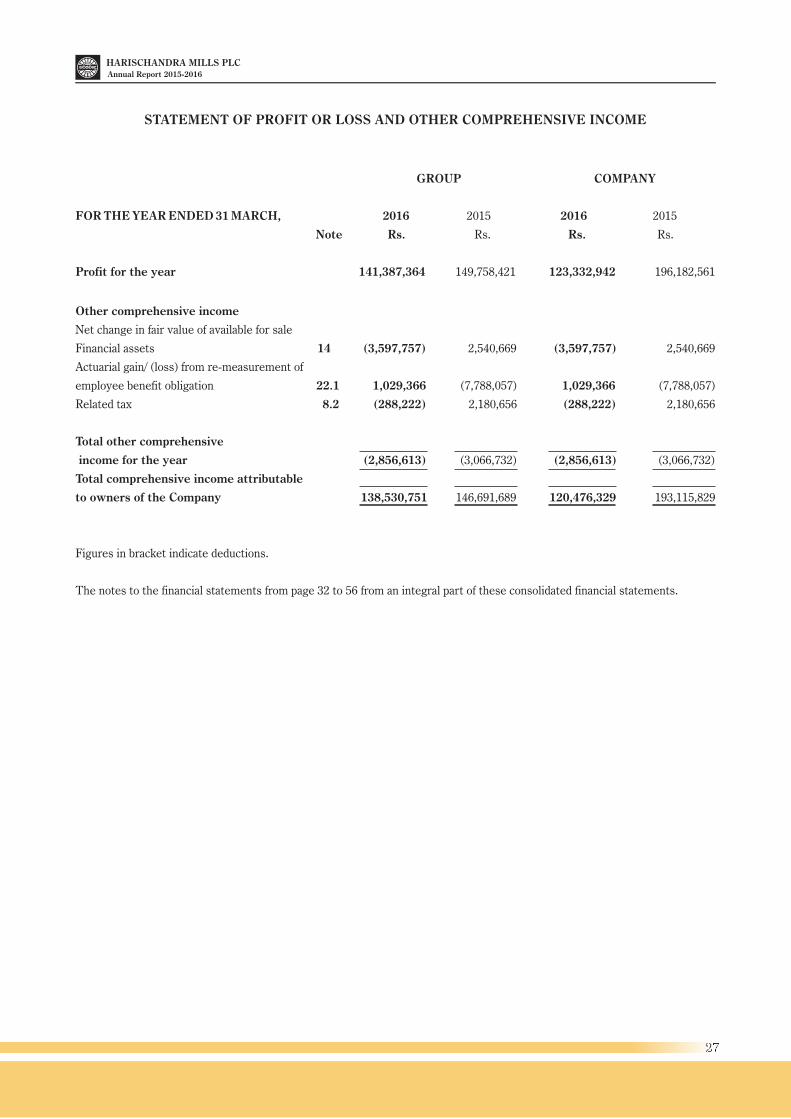
STATEMENT OF PROFIT OR LOSS AND OTHER COMPREHENSIVE INCOME
GROUP COMPANY
FOR THE YEAR ENDED 31 MARCH, 2016 2015 2016 2015
Note Rs. Rs. Rs. Rs.
Profit for the year 141,387,364 149,758,421 123,332,942 196,182,561
Other comprehensive income
Net change in fair value of available for sale
Financial assets 14 (3,597,757) 2,540,669 (3,597,757) 2,540,669
Actuarial gain/ (loss) from re-measurement of
employee benefit obligation 22.1 1,029,366 (7,788,057) 1,029,366 (7,788,057)
Related tax 8.2 (288,222) 2,180,656 (288,222) 2,180,656
Total other comprehensive
income for the year (2,856,613) (3,066,732) (2,856,613) (3,066,732)
Total comprehensive income attributable
to owners of the Company 138,530,751 146,691,689 120,476,329 193,115,829
Figures in bracket indicate deductions.
The notes to the financial statements from page 32 to 56 from an integral part of these consolidated financial statements.
27
Annual Report 2015-2016
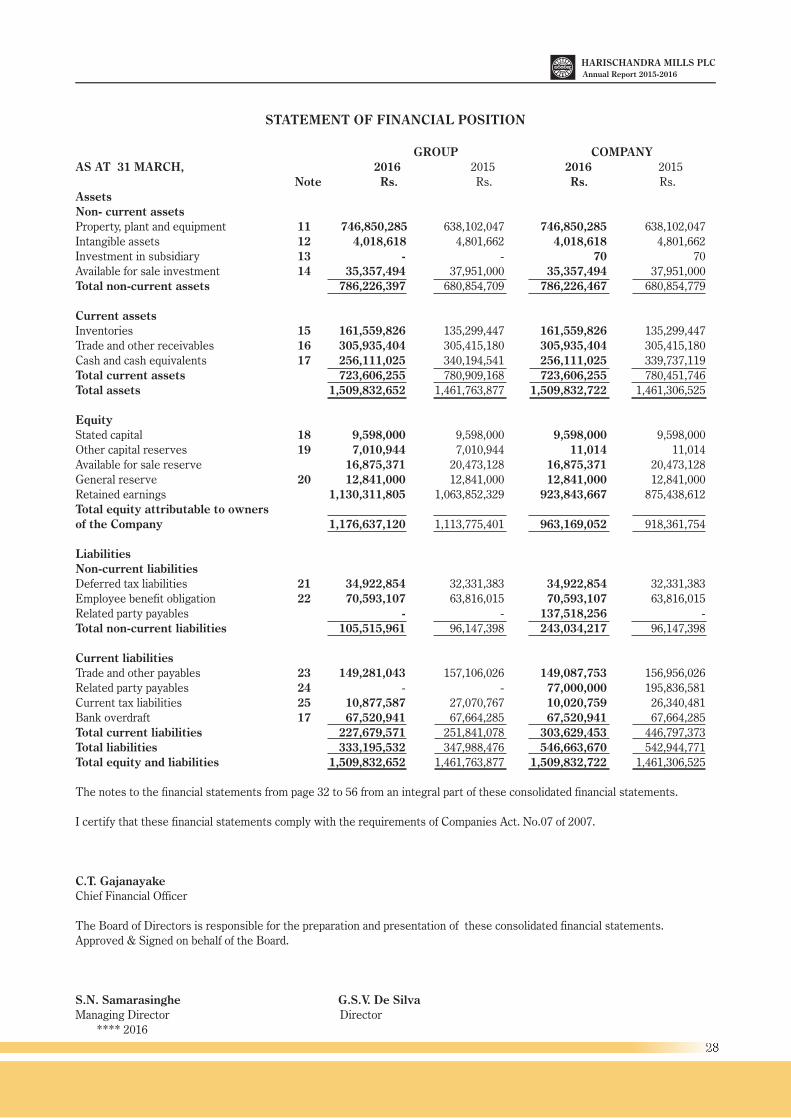
STATEMENT OF FINANCIAL POSITION
GROUP COMPANYAS AT 31 MARCH, 2016 2015 2016 2015 Note Rs. Rs. Rs. Rs.AssetsNon- current assets Property, plant and equipment 11 746,850,285 638,102,047 746,850,285 638,102,047Intangible assets 12 4,018,618 4,801,662 4,018,618 4,801,662Investment in subsidiary 13 - - 70 70Available for sale investment 14 35,357,494 37,951,000 35,357,494 37,951,000Total non-current assets 786,226,397 680,854,709 786,226,467 680,854,779
Current assets Inventories 15 161,559,826 135,299,447 161,559,826 135,299,447Trade and other receivables 16 305,935,404 305,415,180 305,935,404 305,415,180Cash and cash equivalents 17 256,111,025 340,194,541 256,111,025 339,737,119Total current assets 723,606,255 780,909,168 723,606,255 780,451,746Total assets 1,509,832,652 1,461,763,877 1,509,832,722 1,461,306,525
Equity Stated capital 18 9,598,000 9,598,000 9,598,000 9,598,000Other capital reserves 19 7,010,944 7,010,944 11,014 11,014Available for sale reserve 16,875,371 20,473,128 16,875,371 20,473,128General reserve 20 12,841,000 12,841,000 12,841,000 12,841,000Retained earnings 1,130,311,805 1,063,852,329 923,843,667 875,438,612Total equity attributable to ownersof the Company 1,176,637,120 1,113,775,401 963,169,052 918,361,754
LiabilitiesNon-current liabilitiesDeferred tax liabilities 21 34,922,854 32,331,383 34,922,854 32,331,383Employee benefit obligation 22 70,593,107 63,816,015 70,593,107 63,816,015Related party payables - - 137,518,256 -Total non-current liabilities 105,515,961 96,147,398 243,034,217 96,147,398
Current liabilitiesTrade and other payables 23 149,281,043 157,106,026 149,087,753 156,956,026Related party payables 24 - - 77,000,000 195,836,581Current tax liabilities 25 10,877,587 27,070,767 10,020,759 26,340,481Bank overdraft 17 67,520,941 67,664,285 67,520,941 67,664,285Total current liabilities 227,679,571 251,841,078 303,629,453 446,797,373Total liabilities 333,195,532 347,988,476 546,663,670 542,944,771Total equity and liabilities 1,509,832,652 1,461,763,877 1,509,832,722 1,461,306,525
The notes to the financial statements from page 32 to 56 from an integral part of these consolidated financial statements.
I certify that these financial statements comply with the requirements of Companies Act. No.07 of 2007.
C.T. GajanayakeChief Financial Officer
The Board of Directors is responsible for the preparation and presentation of these consolidated financial statements.Approved & Signed on behalf of the Board.
S.N. Samarasinghe G.S.V. De SilvaManaging Director Director **** 2016
28
Annual Report 2015-2016
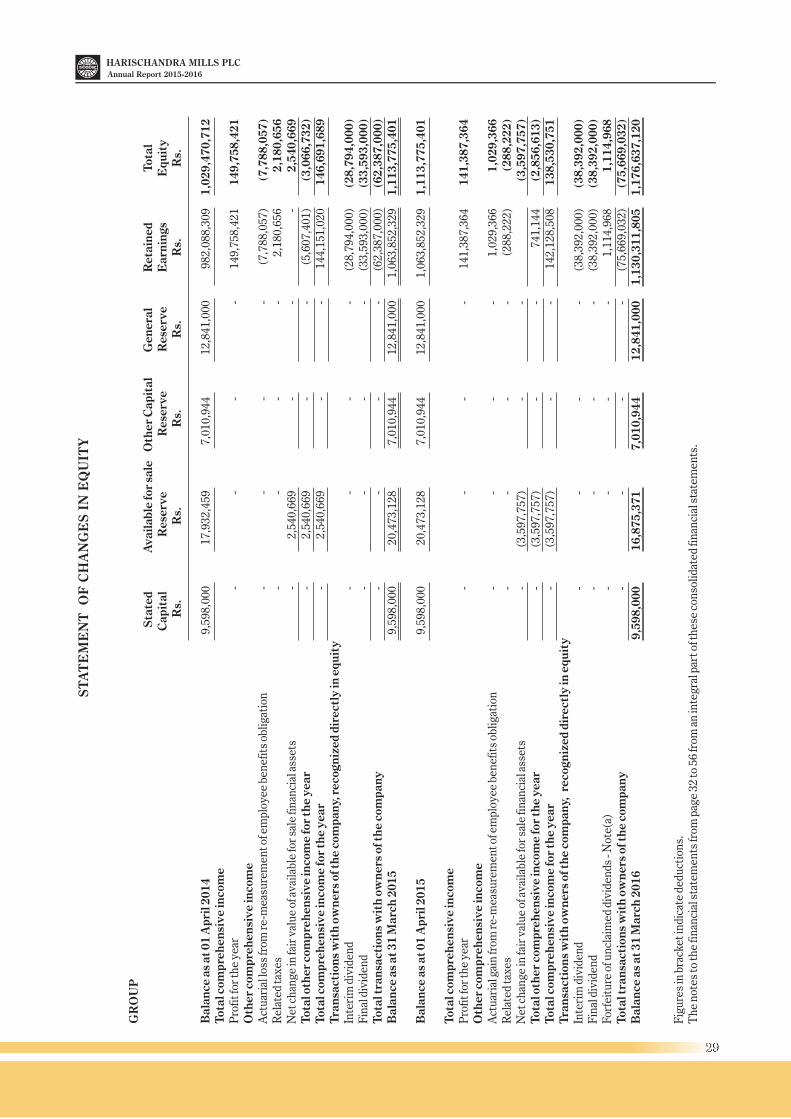
ST
AT
EM
EN
T O
F C
HA
NG
ES
IN
EQ
UIT
Y
GR
OU
P S
tate
d A
vail
able
for
sale
O
ther
Cap
ital
G
en
era
l R
eta
ined
Tota
l C
ap
ital
R
ese
rve R
ese
rve
R
ese
rve
Earn
ings
Eq
uit
y R
s. R
s. R
s. R
s. R
s.R
s.
Bala
nce
as
at 0
1 A
pri
l 20
14
9,5
98
,00
01
7,9
32
,45
97
,01
0,9
44
12
,84
1,0
00
98
2,0
88
,30
91
,02
9,4
70
,71
2Tota
l com
pre
hen
siv
e in
com
e
Pro
fit f
or th
e ye
ar-
--
-1
49
,75
8,4
21
14
9,7
58
,42
1O
ther
com
pre
hen
siv
e in
com
eA
ctu
aria
l los
s fr
om r
e-m
easu
rem
ent o
f em
plo
yee
ben
efit
s ob
liga
tion
--
--
(7,7
88
,05
7)
(7,7
88
,05
7)
Rel
ated
taxe
s-
--
-2
,18
0,6
56
2,1
80
,65
6N
et c
han
ge in
fair
val
ue
of a
vail
able
for
sale
fin
anci
al a
sset
s-
2,5
40
,66
9-
--
2,5
40
,66
9Tota
l oth
er
com
pre
hen
siv
e in
com
e fo
r th
e y
ear
-2
,54
0,6
69
--
(5,6
07
,40
1)
(3,0
66
,73
2)
Tota
l com
pre
hen
siv
e in
com
e fo
r th
e y
ear
-2
,54
0,6
69
--
14
4,1
51
,02
01
46
,69
1,6
89
Tra
nsa
ctio
ns
wit
h o
wn
ers
of t
he c
om
pan
y, r
eco
gn
ized
dir
ect
ly in
eq
uit
yIn
teri
m d
ivid
end
--
--
(28
,79
4,0
00
)(2
8,7
94
,00
0)
Fin
al d
ivid
end
--
--
(33
,59
3,0
00
)(3
3,5
93
,00
0)
Tota
l tra
nsa
ctio
ns
wit
h o
wn
ers
of t
he c
om
pan
y-
--
-(6
2,3
87
,00
0)
(62
,38
7,0
00
)B
ala
nce
as
at 3
1 M
arc
h 2
01
59
,59
8,0
00
20
,47
3,1
28
7,0
10
,94
41
2,8
41
,00
01
,06
3,8
52
,32
91
,11
3,7
75
,40
1
Bala
nce
as
at 0
1 A
pri
l 20
15
9,5
98
,00
02
0,4
73
,12
87
,01
0,9
44
12
,84
1,0
00
1,0
63
,85
2,3
29
1,1
13
,77
5,4
01
Tota
l com
pre
hen
siv
e in
com
eP
rofi
t for
the
year
--
--
14
1,3
87
,36
41
41
,38
7,3
64
Oth
er
com
pre
hen
siv
e in
com
eA
ctu
aria
l gai
n fr
om r
e-m
easu
rem
ent o
f em
plo
yee
ben
efit
s ob
liga
tion
--
--
1,0
29
,36
61
,02
9,3
66
Rel
ated
taxe
s-
--
-(2
88
,22
2)
(28
8,2
22
)N
et c
han
ge in
fair
val
ue
of a
vail
able
for
sale
fin
anci
al a
sset
s-
(3,5
97
,75
7)
--
(3,5
97
,75
7)
Tota
l oth
er
com
pre
hen
siv
e in
com
e fo
r th
e y
ear
-(3
,59
7,7
57
)-
-7
41
,14
4(2
,85
6,6
13
)Tota
l com
pre
hen
siv
e in
com
e fo
r th
e y
ear
-(3
,59
7,7
57
)-
-1
42
,12
8,5
08
13
8,5
30
,75
1T
ran
sact
ion
s w
ith
ow
ners
of t
he c
om
pan
y, r
eco
gn
ized
dir
ect
ly in
eq
uit
yIn
teri
m d
ivid
end
--
--
(38
,39
2,0
00
)(3
8,3
92
,00
0)
Fin
al d
ivid
end
--
--
(38
,39
2,0
00
)(3
8,3
92
,00
0)
For
feit
ure
of u
ncl
aim
ed d
ivid
ends
- N
ote(
a)
--
--
1,1
14
,96
81
,11
4,9
68
Tota
l tra
nsa
ctio
ns
wit
h o
wn
ers
of t
he c
om
pan
y-
--
-(7
5,6
69
,03
2)
(75
,66
9,0
32
)B
ala
nce
as
at 3
1 M
arc
h 2
01
69
,59
8,0
00
16
,87
5,3
71
7,0
10
,94
41
2,8
41
,00
01
,13
0,3
11
,80
51
,17
6,6
37
,12
0
Fig
ure
s in
bra
cket
indi
cate
ded
uct
ion
s.T
he
not
es to
the
fin
anci
al s
tate
men
ts fr
om p
age
32
to 5
6 fr
om a
n in
tegr
al p
art o
f th
ese
con
soli
date
d fi
nan
cial
sta
tem
ents
.
29
Annual Report 2015-2016
ST
AT
EM
EN
T O
F C
HA
NG
ES
IN
EQ
UIT
Y (
CO
NT
D.)
CO
MP
AN
Y S
tate
d A
vail
able
for
sale
O
ther
Cap
ital
G
en
era
l R
eta
ined
Tota
l C
ap
ital
R
ese
rve R
ese
rve
R
ese
rve
E
arn
ings
Eq
uit
y R
s. R
s. R
s. R
s. R
s.R
s.
Bala
nce
as
at 0
1 A
pri
l 20
14
9,5
98
,00
01
7,9
32
,45
91
1,0
14
12
,84
1,0
00
74
7,2
50
,45
27
87
,63
2,9
25
Tota
l com
pre
hen
siv
e in
com
e
Pro
fit f
or th
e ye
ar-
--
-1
96
,18
2,5
61
19
6,1
82
,56
1O
ther
com
pre
hen
siv
e in
com
e
Act
uar
ial l
oss
from
re-
mea
sure
men
t of e
mplo
yee
ben
efit
s ob
liga
tion
--
--
(7,7
88
,05
7)
(7,7
88
,05
7)
Rel
ated
taxe
s-
--
-2
,18
0,6
56
2,1
80
,65
6
Net
ch
ange
in fa
ir v
alu
e of
ava
ilab
le fo
r sa
le fi
nan
cial
ass
ets
-2
,54
0,6
69
--
-2
,54
0,6
69
Tota
l oth
er
com
pre
hen
siv
e in
com
e fo
r th
e y
ear
-2
,54
0,6
69
--
(5,6
07
,40
1)
(3,0
66
,73
2)
Tota
l com
pre
hen
siv
e in
com
e fo
r th
e y
ear
-2
,54
0,6
69
--
19
0,5
75
,16
01
93
,11
5,8
29
Tra
nsa
ctio
ns
wit
h o
wn
ers
of t
he c
om
pan
y, r
eco
gn
ized
dir
ect
ly in
eq
uit
yIn
teri
m d
ivid
end
--
--
(28
,79
4,0
00
)(2
8,7
94
,00
0)
Fin
al d
ivid
end
--
--
(33
,59
3,0
00
)(3
3,5
93
,00
0)
Tota
l tra
nsa
ctio
ns
wit
h o
wn
ers
of t
he c
om
pan
y-
--
-(6
2,3
87
,00
0)
(62
,38
7,0
00
)B
ala
nce
as
at 3
1 M
arc
h 2
01
59
,59
8,0
00
20
,47
3,1
28
11
,01
41
2,8
41
,00
08
75
,43
8,6
12
91
8,3
61
,75
4
Bala
nce
as
at 0
1 A
pri
l 20
15
9,5
98
,00
02
0,4
73
,12
81
1,0
14
12
,84
1,0
00
87
5,4
38
,61
29
18
,36
1,7
54
Tota
l com
pre
hen
siv
e in
com
eP
rofi
t for
the
year
--
--
12
3,3
32
,94
21
23
,33
2,9
42
Oth
er
com
pre
hen
siv
e in
com
eA
ctu
aria
l gai
n fr
om r
e-m
easu
rem
ent o
f em
plo
yee
ben
efit
s ob
liga
tion
--
--
1,0
29
,36
61
,02
9,3
66
Rel
ated
taxe
s-
--
-(2
88
,22
2)
(28
8,2
22
)N
et c
han
ge in
fair
val
ue
of a
vail
able
for
sale
fin
anci
al a
sset
s-
(3,5
97
,75
7)
--
-(3
,59
7,7
57
)Tota
l oth
er
com
pre
hen
siv
e in
com
e fo
r th
e y
ear
-(3
,59
7,7
57
)-
-7
41
,14
4(2
,85
6,6
13
)Tota
l com
pre
hen
siv
e in
com
e fo
r th
e y
ear
-(3
,59
7,7
57
)-
-1
24
,07
4,0
87
12
0,4
76
,32
9T
ran
sact
ion
s w
ith
ow
ners
of t
he c
om
pan
y, r
eco
gn
ized
dir
ect
ly in
eq
uit
yIn
teri
m d
ivid
end
--
--
(38
,39
2,0
00
)(3
8,3
92
,00
0)
Fin
al d
ivid
end
--
--
(38
,39
2,0
00
)(3
8,3
92
,00
0)
For
feit
ure
of u
ncl
aim
ed d
ivid
ends
- N
ote(
a)-
--
-1
,11
4,9
68
1,1
14
,96
8Tota
l tra
nsa
ctio
ns
wit
h o
wn
ers
of t
he c
om
pan
y-
--
-(7
5,6
69
,03
2)
(75
,66
9,0
32
)B
ala
nce
as
at 3
1 M
arc
h 2
01
69
,59
8,0
00
16
,87
5,3
71
11
,01
41
2,8
41
,00
09
23
,84
3,6
67
96
3,1
69
,05
2
Not
e(a)
- T
he
Com
pan
y pol
icy
is t
o fo
rfei
t th
e di
vide
nds
wh
ich
are
ou
tsta
ndi
ng
for
mor
e th
an fi
ve y
ears
from
th
e ye
ar in
wh
ich
th
e di
vide
nds
hav
e be
en in
itia
lly
decl
ared
. Du
rin
g th
e ye
ar,
Gro
up/C
ompan
y h
as fo
rfei
ted
such
div
iden
ds a
mou
nti
ng
to R
s. 1
,11
4,9
68
/- a
fter
obt
ain
ing
appro
val o
f th
e B
oard
of d
irec
tors
.
Fig
ure
s in
bra
cket
indi
cate
ded
uct
ion
s.T
he
not
es to
the
fin
anci
al s
tate
men
ts fr
om p
age
32
to 5
6 fr
om a
n in
tegr
al p
art o
f th
ese
fin
anci
al s
tate
men
ts.
30
Annual Report 2015-2016
STATEMENT OF CASH FLOWS
GROUP COMPANY
FOR THE YEAR ENDED 31 MARCH, 2016 2015 2016 2015
Note Rs. Rs. Rs. Rs.
Cash flows from operating activities
Profit before income tax expense 218,033,714 219,644,778 199,852,603 262,210,031
Adjustment for
Provision for employee benefit 22 11,988,934 10,911,945 11,988,934 10,911,945
Depreciation/amortization 11,12 74,988,689 68,352,138 74,988,689 68,352,138
Interest expenses 7 173,752 79,153 18,547,190 79,153
Provision of slow moving inventories 15 3,000,047 - 3,000,047 -
Profit on disposal of property, plant & equipment (16,839,034) (17,965,669) (16,839,034) (17,965,669)
Dividend income (1,379,251) (1,891,334) (1,379,251) (37,927,077)
Interest income 7 (15,694,865) (12,769,676) (15,693,402) (11,121,627)
Operating profit before working capital changes 274,271,986 266,361,335 274,465,776 274,538,894
Change in inventories (29,260,427) 13,754,290 (29,260,427) 13,754,290
Change in trade and other receivables 4,152,882 14,272,514 4,152,882 3,759,267
Change in related party payables - - 308,238 18,919,918
Change in trade and other payables (6,710,016) 3,504,107 (6,753,305) 6,546,304
Cash generated from operations 242,454,425 297,892,246 242,913,164 317,518,673
Gratuity paid 22 (4,182,476) (4,863,505) (4,182,476) (4,863,505)
Interest paid (173,752) (79,153) (173,752) (79,153)
Income tax paid 25 (90,536,281) (56,232,177) (90,536,134) (52,059,000)
Net cash flows generated from operating activities 147,561,916 236,717,411 148,020,802 260,517,015
Cash flows from investing activities
Interest received 11,021,760 10,319,508 11,020,296 8,671,459
Dividends received 1,379,251 1,891,334 1,379,251 37,927,077
Proceeds from disposal of property,
plant and equipment 16,918,901 18,061,814 16,918,901 18,061,814
Acquisition of property, plant and equipment (183,033,749) (58,819,265) (183,033,749) (58,819,265)
Investment in units (1,004,251) (1,441,335) (1,004,251) (1,441,335)
Cash flows from/ (used in) investing activities (154,718,088) (29,987,944) (154,719,552) 4,399,750
Cash flows from financing activities
Dividends paid (76,784,000) (62,387,000) (76,784,000) (62,387,000)
Cash flows used in financing activities (76,784,000) (62,387,000) (76,784,000) (62,387,000)
Net change in cash and cash equivalents (83,940,172) 144,342,467 (83,482,750) 202,529,765
Cash and cash equivalents at the beginning 272,530,256 128,187,789 272,072,834 69,543,069
Cash and cash equivalents at the end (Note 17) 188,590,084 272,530,256 188,590,084 272,072,834
figures in bracket indicate deductions.
The notes to the financial statements from page 33 to 56 from an integral part of these consolidated financial statements.
Independent Auditors' Report is provided on page 26.
31
Annual Report 2015-2016
NOTES TO THE FINANCIAL STATEMENTS
1. REPORTING ENTITY
Harischandra Mills PLC (the" Company") is a public quoted
Company incorporated and domiciled in Sri Lanka since 14th
December 1959 with limited liability. The Registered Office
and the principal place of business of the Company are located
at No.11, C. A. Harischandra Mawatha, Matara.
The consolidated Financial Statements of the Group as at and
for year ended 31 March, 2016 comprise the financial
information of the Company and its subsidiary, Harischandra
Mills (Distributors) Limited (together referred to as the
"Group" and individually as "Group entities").
The Company does not have any identifiable parent of its own.
The principal activities of the Company and the Group are
manufacturing and distributing of food, soap items and sales
of fuel and lubricants.
There were no significant changes in the nature of principal
activities of the Company and the Group during the financial
year under review.
In the year 2014 directors of the Company decided to transfer
the distributorship of Harischandra Mills (Distributors)
Limited to Harischandra Mills PLC. Accordingly, the Principal
commercial operation of Harischandra Mills (Distributors)
Limited is now been transferred to the parent Company.
The Financial Statements of both companies in the Group are
prepared to a common financial year, which is ended on 31
March.
Both Company and the Group had 555 (2014/15-555)
employees at the end of the financial year.
2. BASIS OF PREPARATION
2.1 Statement of Compliance
The Statement of Financial Position, Income Statement,
Statement of Profit or Loss and Other Comprehensive Income,
Changes in Equity and Statement of Cash Flows together with
the notes, (the "Financial Statements") of the Company and the
Group as at 31 March 2016 and for the period then ended have
been prepared in accordance with Sri Lanka Accounting
Standards (SLAS) prefixed both SLFRS (corresponding to
IFRS) and LKAS (corresponding to IAS), promulgated by the
Institute of Chartered Accountants of Sri Lanka and complies
with requirements of the Companies Act No 07 of 2007.
2.2 Basis of Measurement
The Financial Statements have been prepared on historical cost
basis except for following items, which are measured on
alternative basis on each reporting date.
- Actuarial valuation method has been adopted to estimate
defined benefit liability.
- Financial assets classified as Available for sale are
measured at fair value.
2.3 Functional & Presentation Currency
The Financial Statements of the Company and the Group are
presented in Sri Lankan Rupees, which is the Company's
functional currency.
2.4 Use of Estimates & Judgments
In preparing Financial Statements, management has made
judgments, estimates and assumptions that affect the
application of accounting policies and the reported amounts of
assets, liabilities, income and expenses. Actual results may
differ from these estimates.
Estimates and underlying assumptions are reviewed on an
ongoing basis. Revisions to accounting estimates are
recognized prospectively.
In particular information about significant areas of estimates
and uncertainty and critical judgment in applying accounting
polices that have the most significant effect on the amounts
recognized in Financial Statements are described in following
note.
Note 22 -Employee benefit obligation – Key actuarial
assumptions
2.5 Measurement of Fair value
A number of the Group's accounting policies and disclosures
require the measurement of fair values for both financial and
non - financial assets and liabilities. The management has
overall responsibility for overseeing all Significant fair value
measurement including level 3 fair value.
32
Annual Report 2015-2016
The management team regularly reviews significant
unobservable inputs and valuation adjustments. If third party
information is used to measure fair value the management
assess the evidence obtained from the third party to support
the conclusion that such valuations meet the requirements of
SLFRS, including the level in the fair value hierarchy in which
such valuations should be classified. Significant valuation
issues are reported to the Audit Committee. When measuring
the fair value of an asset or a liability, the Group uses observable
market data as far as possible. Fair values are categorized into
different levels in a fair value hierarchy based on the inputs
used in the valuation techniques as follows.
Level 1: Quoted prices (unadjusted) in active markets for
identical assets or liabilities.
Level 2: Inputs other than quoted prices included in Level 1
that are observable for the asset or liability, either directly (i.e.
as prices) or indirectly (i.e. derived from prices.)
Level 3: Inputs for the asset or liability that are not based on
observable market data (unobservable inputs)
If the inputs used to measure the fair value of an asset or a
liability fall into different levels of the fair value hierarchy, then
the fair value measurement is categorized in its entirety in the
same level of the fair value hierarchy as the lowest level input
that is significant to the entire measurement.
The Group recognizes transfers between levels of the fair
value hierarchy at the end of the reporting period during which
the change has occurred.
3. SIGNIFICANT ACCOUNTING POLICIES
The group consistently applied the following accounting
policies for all periods presented in these financial Statements.
3.1 Basis of Consolidation
3.1.1 Business Combinations
The Group accounts for business combinations using the
acquisition method when control is transferred to the Group.
The consideration transferred in the acquisition is generally
measured at fair value, as are the identifiable net assets
acquired. Any goodwill that arises is tested annually for
impairment. Any gain on a bargain purchase is recognized in
profit or loss immediately. Transaction costs are expensed as
incurred, except if related to the issue of debt or equity
securities. The consideration transferred does not include
amounts related to the settlement of Pre- Existing relationship.
Such amounts generally recognized in profit or loss.
3.2.2 Subsidiary
Subsidiary an entity controlled by the Group. The Group
controls an entity when it is exposed to, or has right to, variable
returns from its involvement with the entity and has the ability
to affect those returns through its power over the entity. The
Financial Statements of subsidiary is included in the
consolidated financial statements from date on which control
commences until the date on which control ceases.
3.2.3 Non - Controlling Interests
Non-controlling interest is the equity in a subsidiary not
attributable, directly or indirectly, to a parent. The Company
does not have any non controlling interest as of the reporting
date.
3.2.4 Transactions Eliminated on Consolidation
Intra-group balances & transactions and any unrealized income
and expenses arising from intra- group transactions are
eliminated. Unrealized losses are eliminated in the same way as
unrealized gains, but only to the extent that there is no evidence
of impairment.
3.3 Foreign Currency Transactions
Transactions in foreign currencies are translated into functional
currency at the exchange rate prevailing at the date of the
transaction. Monetary assets and liabilities denominated in
foreign currencies are translated into functional currencies at
the exchange rate at the reporting date.
Non-monetary assets and liabilities denominated in foreign
currencies that are stated at historical cost at the reporting
date are translated into functional currency Lankan Rupees at
the foreign exchange rate ruling at the date of initial transaction.
Non-monetary assets & liabilities that are measured at fair
value, denominated in foreign currencies are translated into
functional currency at the exchange rate when the fair value
were determined. Foreign exchange differences arising on
transactions are recognized in the income statement.
NOTES TO THE FINANCIAL STATEMENTS
33
Annual Report 2015-2016
3.4. Property, Plant & Equipment
3.4.1 Basis of Recognition
Items of property, plant and equipment are measured at cost
less accumulated depreciation and accumulated impairment
losses.
Cost includes expenditures that are directly attributable to the
acquisition of the assets. The cost of self constructed asset
includes the cost of materials and direct labour, the initial
estimate , when relevant of the cost of the dismantling and
removing the items and restoring the site on which they are
located and an appropriate proportion of overheads.
The cost of acquisition includes purchase cost together with
any incidental expenses incurred in bringing the assets to
working condition for the intended use.
When parts of an item of property, plant & equipment have
different useful lives, they are accounted for as separate items
(major components) of property, plant & equipment.
3.4.1.2 Subsequent Cost
Subsequent expenditure is capitalized only when it is probable
that the future economic benefits associated with the
expenditure will flow to the Group.
3.4.1.3 De-recognition
Any gain or loss on disposal of an item of property, plant and
equipment is recognized in Income Statement when the item is
derecognized.
3.4.1.4 Depreciation
Depreciation is recognized in the Income Statement on
straight-line basis over the estimated useful lives of each part
of an item of Property, Plant and Equipment. Freehold land is
not depreciated. The estimated useful lives for the current and
comparative periods are as follows.
Buildings 50 years
Plant & machinery 13.3 years
Office, factory &
Laboratory equipments 10 years
Furniture & fittings 20 years
Motor vehicles 4 years
Depreciation methods, useful lives and residual values are
reviewed at each reporting date.
3.4.1.5 Capital Work- In - Progress
Capital expenses incurred during the year which are not
completed as at the reporting date are shown as Capital Workin-
Progress, whilst the capital assets which have been completed
during the year and put to use have been transferred to
property, plant & equipment.
3.4.2 Intangible Assets
3.4.2.1 Basis of Recognition
An Intangible asset is recognized if it is probable that future
economic benefits that are attributable to the assets will flow to
the entity and the cost of the asset can be measured reliably in
accordance with the Sri Lanka Accounting Standards - LKAS
38 " Intangible Assets."
3.4.2 Subsequent Expenditure
Subsequent expenditure is capitalized only when it is increased
the future economic benefits embodied in the specific asset to
which it relates. All other expenditure is recognized in the
Income Statement when it is incurred.
3.4.3 Useful Economic Life and Amortization
Amortization is based on the cost of an asset less its residual
value. Amortization is recognized in the Income Statement on a
straight-line basis over the estimated useful lives of intangible
assets, from the date that they are available for use. The
intangible assets included in the financial statements represent
cost of computer software and the amortization rate is as
follows.
Computer Software - 5 years
Above rate is consistent with the rate in the previous years.
Amortization methods, useful lives and residual values are
reviewed at each reporting date and adjusted if appropriate.
NOTES TO THE FINANCIAL STATEMENTS
34
Annual Report 2015-2016
3.5 Financial Instruments
3.5.1 Non - derivative Financial Assets
The group classifies non – derivative financial assets into
following categories. Financial assets at fair value through
profit or loss, held to maturity financial assets, loan and
receivable and available for sale financial assets.
As of reporting date, the group has available for sale financial
assets, loans and receivables.
3.5.1.1 Initial Recognition and Measurement
The group initially recognizes loans and receivables on the date
when they are originated. All other financial Assets are
recognized when and only when the Group becomes a party to
the contractual provisions of the financial instruments.
3.5.1.2 Loans and Receivables
Loans and receivables are financial assets with fixed or
determinable payments that are not quoted in an actual market.
Such assets are recognized initially at fair value plus any
directly attributable transaction costs. Subsequent to initial
recognition loans and receivables are measured at amortized
cost using the effective interest method. Loans and receivables
comprise trade and other receivables and cash and cash
equivalents.
3.5.1.3 Financial Assets Available-for-Sale (AFS)
These assets are initially measured at fair value plus any
directly attributable transaction cost.
Subsequent to initial recognition they are measured at fair
value and the changes there, in other than impairment losses
are recognized in other Comprehensive income and
accumulated fair value reserve. When these assets are
derecognized, the gain or loss accumulated in equity is
reclassified to profit or loss.
Available for sale assets comprise of investment in unit trusts.
3.5.1.4 Derecognition
The Group derecognizes a financial asset when the contractual
rights to the cash flows from the asset expire, or it transfers the
right to receive the contractual cash flows on the financial asset
in a transaction in which substantially all the risks and rewards
of ownership of the financial asset are transferred.
Any interest in transferred financial assets that is created or
retained by the Group is recognized as a separate assets or
liability.
Financial assets and liabilities are offset and the net amount
presented in the statement of financial position when the Group
has a legal right to offset the amounts and intends either to
settle on a net basis or to realise the asset and settle the liability
simultaneously.
3.5.2 Non-Derivative Financial Liabilities
3.5.2.1 Initial Recognition and Measurement
Financial liabilities are initially recognized on the trade date
when the Group becomes a party to the contractual provisions
of the instrument.
Financial Liabilities are recognized initially at fair value less
directly attributable transaction costs.
The group classifies non – derivative financial liabilities into
other financial liabilities comprise of Trade and other payable,
Related Party Payables and bank overdrafts.
3.5.2.2 Subsequent Measurement
Subsequent to initial recognition, these financial liabilities are
measured at amortized cost using the effective interest
method.
3.5.2.3 Derecognition
The group derecognizes a financial liability when its contractual
obligations are discharged or cancelled or expire.
3.6 Impairment
3.6.1 Non Derivative financial assets
Financial assets not classified as fair value through profit or loss
is assessed at each reporting date to determine whether there
is objective evidence that it is impaired. Objective evidence that
financial assets are impaired includes;
NOTES TO THE FINANCIAL STATEMENTS
35
Annual Report 2015-2016
- Default by debtor
- Indication that debtor will enter bankruptcy
3.6.2 Financial Assets measured at amortized cost;
The Group considers evidence of impairment for receivables at
specific asset level. All receivables are assessed for specific
impairment.
An impairment loss in respect of a financial asset measured at
amortized cost is calculated as the difference between its
carrying amount and the present value of the estimated future
cash flows discounted at the asset's original effective interest
rate. Losses are recognized in profit or loss and reflected in an
allowance account against receivables. When a subsequent
event causes the amount of impairment loss to decrease, the
decrease in impairment loss is reversed through profit or loss.
3.6.3 Available for sale financial assets:
Impairment losses on AFS financial assets are recognized by
reclassifying the losses accumulated in fair value reserve to
profit or loss, the amount reclassified is the difference between
the acquisition cost and the current fair value less any
impairment loss previously recognized in profit or loss.
3.6.4 Non Financial Assets
The carrying amount of the Group's non-financial assets other
than, inventories and deferred tax assets are reviewed at each
reporting date to determine whether there is any indication of
the impairment. If any such indication exists, then the asset's
recoverable amount is estimated. An impairment loss is
recognized if the carrying amount of an asset or Cash
Generating Unit (CGU) exceeds its recoverable amount.
The recoverable amount of an asset or cash generating unit is
the greater of it's value in use and it's fair value less cost to sell.
In assessing value in use, the estimated future cash flows are
discounted to their present value using a pre-tax discount rate
that reflects the current market assessments of the time value
of money and the risks specific to the asset or CGU. For the
purpose of impairment testing, assets that cannot be tested
individually are grouped together into the smallest group of
assets that generates cash inflows from continuing use that are
largely independent of the cash inflows of other assets or CGU.
An impairment losses recognized in prior periods are assessed
at each reporting date for any indications that the loss has
decreased or no longer exists. An impairment loss is reversed if
there has been a change in the estimates used to determine the
recoverable amount. An impairment loss is reversed only to the
extent that the asset's carrying amount does not exceed the
carrying amount that would have been determined, net of
depreciation or amortization , if no impairment loss had been
recognized.
3.7 Share Capital
3.7.1 Ordinary shares
Ordinary shares are classified as equity, incremental cost
directly attributable to the issue of ordinary shares and share
options are recognized as a deduction from equity, net of any tax
effects.
3.8 Inventory
Inventories are measured at the lower of cost and net realizable
value. The cost of inventories is based on the Weighted Average
principle, and includes expenditure incurred in acquiring the
inventories, production or conversion cost and other cost
incurred in bringing them to their existing location and
condition. In relation to Work In Progress, cost includes an
appropriate share of production overheads based on normal
operating capacity.
Net realizable value is the estimated selling price in the
ordinary course of business, less the estimated cost of
completion and selling expenses.
3.9 Liabilities and Provisions
3.9.1 Liabilities
Liabilities classified as current liabilities on the Statement of
Financial Position are those , which fall due for payment on
demand or within one year from the reporting date.
Non - current liabilities are those balances that fall due for
payment after one year from the reporting date.
NOTES TO THE FINANCIAL STATEMENTS
36
Annual Report 2015-2016
3.9.2 Provisions
A provision is recognized in the Statement of Financial Position
when the Group has a legal or constructive obligation as a
result of the past event and it is probable that an outflow of
economic benefits will be required to settle the obligation.
Provisions are determined by discounting the expected future
cash flows at present rate that reflects current market
assessments of time value of money and risks specific to the
liability.
3.9.3 Employee Benefits
3.9.3.1 Defined Contribution Plans
A defined contribution plan is a post employment plan under
which an entity pays fixed contribution into a separate entity
and will have no legal or constructive obligation to pay a further
amount. Obligations for contributions to defined contribution
plans are recognized as expense in the Income Statement in the
periods during which services are rendered by employees.
Employees' Provident Fund - Managed by Central Bank
of Sri Lanka
The Company and employees who are paid on daily rate (Check
roll Employees), contribute 12% & 8% respectively on the
salary of each employee to the Approved Provident Fund.
Employees Provident Fund - Managed by Harischandra
Mills PLC Provident Fund Association
Both the Company and employees who are paid on monthly pay
basis (Payroll Employees),contribute 15% on the salary of each
employee to the Approved Private Provident Fund.
Employees Trust Fund
The Group/Company contributes 3% of the salary of each
employee to the employees' Trust Fund. Contributions to
defined contribution plans are recognized as an expense in the
income statement as it is incurred.
3.9.4 Retiring Gratuity
A defined benefit plan is a post employment benefit plan other
than a defined contribution plan.
In accordance with the Gratuity Act No. 12 of 1963, a liability
arises for a defined benefit obligation to employees. Such
defined benefit obligation is a post-employment benefit
obligation falling within the scope of Sri Lanka Accounting
Standard LKAS 19-'Employee Benefits.'
The calculation is performed annually by a qualified actuary
using the projected until credit method (PUC). The Group
recognizes all actuarial gains or losses arising from defined
benefit obligation immediately in other comprehensive income.
3.9.5 Capital Commitments & Contingencies
Contingent liabilities are possible obligation whose existence
will be confirmed only by uncertain future events or present
obligations where the transfer of economic benefits is not
probable or cannot be reliably measured.
Capital commitment and contingent liabilities of the Group are
disclosed in the respective notes to the financial statements.
3.9.6 Events Subsequent to Reporting Period
The materiality of the events after the reporting date has been
considered and appropriate adjustments and provisions have
been made in the Financial Statement wherever necessary.
3.10 Statement of Profit or Loss and Other
Comprehensive Income
3.10.1 Revenue Recognition
Revenue is recognized to the extent that it is probable that the
economic benefit will flow to the Group, and the associated
costs incurred or to be incurred can be reliably measured.
Revenue is measured at the fair value of the consideration
received or receivable, net of trade discounts and revenue
related taxes, and after eliminating sales within the Group.
Revenue from the sale of goods is recognized in the Income
Statement when the significant risks and rewards of ownership
have been transferred to the buyer.
3.10.2 Profit on Disposal of Property, Plants & Equipment
Profits or losses resulting from disposal of property, plants &
equipment have been accounted in the Income Statement.
NOTES TO THE FINANCIAL STATEMENTS
37
Annual Report 2015-2016
3.10.3 Rental Income
Rental income is recognized on an accrual basis.
3.10.4 Dividend Income
Dividend income is recognized in profit or loss on the date that
the Group's right to receive payment is established.
3.10.5 Expenditure
All expenditure incurred in running of the business and
maintaining the property, plant & equipment in a state of
efficiency has been charged to revenue in arriving at the profit
for the year. For the purpose of presentation of income
statement, the Directors are of the opinion that function of
expense present fairly the elements of the enterprise's
performance, hence such presentation method is adopted.
Expenditure incurred for the purpose of acquiring, expanding
or improving assets of a permanent nature by means of which to
carry on the business or for the purpose of increasing the
earning capacity of the business has been treated as capital
expenditure.
Repairs and renewals are charged to revenue in the year in
which the expenditure is incurred.
The profit earned by the Group before taxation as shown in the
income statement is after making provision for all known
liabilities and for the depreciation of property, plants &
equipments.
3.10.6 Net Finance Expense
Finance expense comprises interest payable on borrowing and
foreign exchange losses.
Finance income comprises interest received on funds invested
and foreign exchange gains. Interest income and expenses are
recognized on an accrual basis.
3.10.7 Income Tax
Income tax expenses comprise current and deferred tax.
Income tax expenses are recognized directly in income
statement expect to the extent that if relates to items
recognized directly in other comprehensive income.
3.10.7.1 Current Tax
Current tax comprises the expected tax payable on the taxable
income for the year and adjustment to tax payable in respect of
previous year. The amount of tax payable is the best estimate of
the tax amount expected to be paid that reflects uncertainty
related to income taxes if any. It is measured using tax rates
enacted or substantially enacted at the reporting date.
3.10.7.2 Deferred Tax
Deferred tax is recognized in respect of temporary differences
between the carrying amounts of assets and liabilities for
financial reporting purpose and the amounts used for taxation
purpose.
The amount of deferred tax provided is based on the expected
manner of realization or settlement of the carrying amount of
assets and liabilities. Deferred tax is measured at the tax rates
that are expected to be applied to the temporary differences
when they reverse, based on the laws that have been enacted or
substantively enacted by the reporting date.
Deferred tax assets are reviewed at each reporting date are
reduced to the extent that it is no longer probable that the
related tax benefit will be realized. Deferred tax assets and
liabilities are offset only if a certain criteria are met.
3.10.7.3 Withholding tax on Dividends
Dividend distributed out of taxable profit of the subsidiary
attracts a 10% deduction at source and is not available for set off
against the tax liability of the Company. Thus the withholding
tax deducted at the source is added to the tax expense of the
subsidiary in the consolidated financial statement as a
consolidation adjustment.
3.11 Statement of Cash Flows
The Statement of Cash Flows has been prepared using the
"indirect method." Interest paid are classified as operating cash
flows, interest and dividend received are classified as investing
cash flows while dividends paid are classified as financing cash
flows for the purpose of presenting of Statement of Cash Flows.
NOTES TO THE FINANCIAL STATEMENTS
38
Annual Report 2015-2016
3.12 Segment Reporting
A segment is a distinguishable component of the Group that is
engaged either in providing products or service (business
segment) , or in providing products or service with in a
particular economic environment (geographical segment),
which is subject to risks and rewards that are different from
those of other segments.
Segmentation has been determined based on the Group's
management and internal reporting structure. Segment
information is based on the primary format representing the
industry segments of the Group. Which is provided in note 32
to the Financial Statements.
Based on the nature of the Group, segment information has not
been provided on a secondary format representing the
geographical area. Inter segment pricing is determined on an
arm's length basis.
Segment results, assets and liabilities include items directly
attributable to a segment as well as those that can be allocated
on a reasonable basis.
3.13 Comparative Information
Previous year figures and phrases have been rearranged and
reclassified wherever necessary to conform to the current
year's presentation.
3.14 New Accounting Standard Not Effective at the
Reporting Date.
The following SLFRS have been issued by the institute of
Chartered Accountants of Sri Lanka (CA Sri Lanka) that have
an effective date in the future and have not been applied in
preparing these Financial Statements. Those SLFRSs will
have an effect on the accounting policies currently adopted by
the Group and may have an impact on the future Financial
Statements.
3.14.1 Standards issued but not yet adopted which may
have significant impact.
Sri Lanka Accounting Standard - SLFRS 9 "Financial
Instruments Classification and Measurement".
The objective of SLFRS is to establish principles for the
financial reporting of financial assets and financial liabilities that
will present relevant and useful information to users of
Financial Statements for their assessment of the amounts,
timing and uncertainty of an entity's future cash flows.
An entity shall apply this SLFRS to all items within the scope of
LKAS 39 Financial Instrument Recognition and Measurement.
SLFRS 9 is effective for annual period beginning on or after 1st
January 2018 with early adoption permitted.
The Group is assessing the potential impact on its Financial
Statement resulting from the application of SLFRS 9.
Sri Lanka Accounting Standard - SLFRS 15 ''Revenue
from Contracts with Customers''
SLFRS 15 establishes a comprehensive framework for
determining whether, how much and when revenue is
recognised. It replaces existing revenue recognition guidance,
including LKAS 18 Revenue, LKAS 11 Construction Contracts
and IFRIC 13 Customer Loyalty Programmes. SLFRS 15 is
effective for annual reporting periods beginning on or after 1
January 2018, with early adoption permitted. The Group is
assessing the potential impact on its Consolidated Financial
Statements resulting from the application of SLFRS 15.
NOTES TO THE FINANCIAL STATEMENTS
39
Annual Report 2015-2016
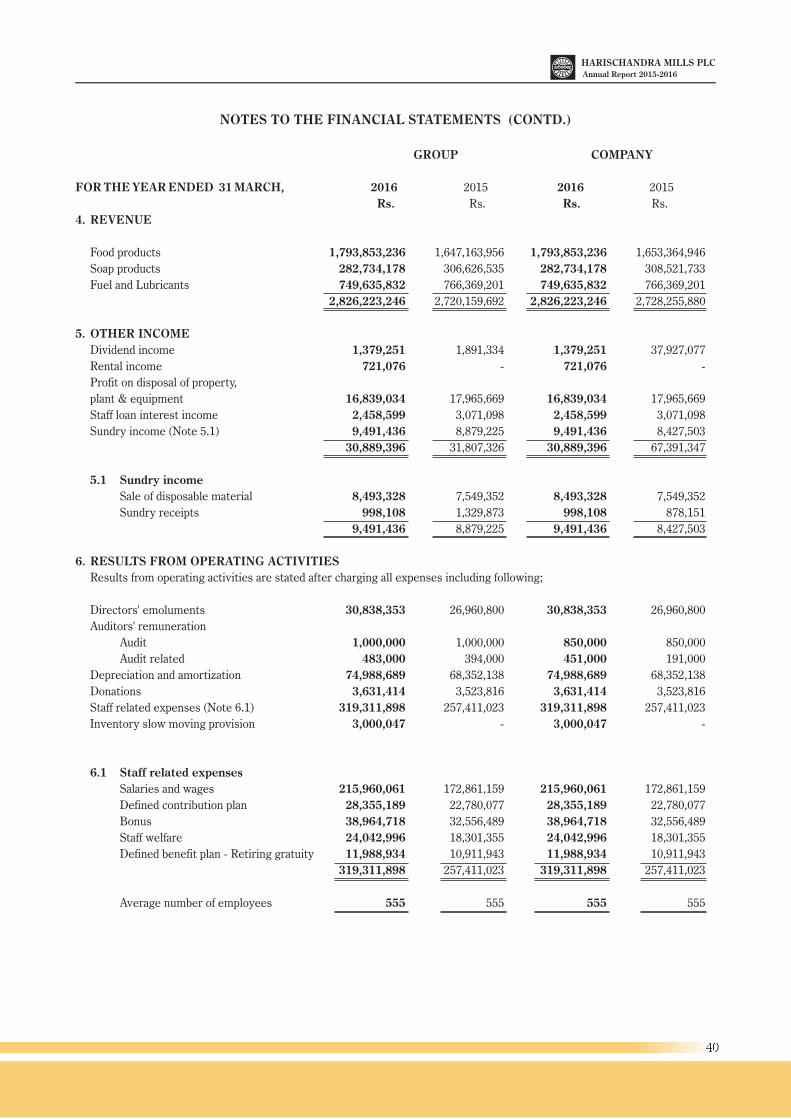
NOTES TO THE FINANCIAL STATEMENTS (CONTD.)
GROUP COMPANY
FOR THE YEAR ENDED 31 MARCH, 2016 2015 2016 2015
Rs. Rs. Rs. Rs.
4. REVENUE
Food products 1,793,853,236 1,647,163,956 1,793,853,236 1,653,364,946
Soap products 282,734,178 306,626,535 282,734,178 308,521,733
Fuel and Lubricants 749,635,832 766,369,201 749,635,832 766,369,201
2,826,223,246 2,720,159,692 2,826,223,246 2,728,255,880
5. OTHER INCOME
Dividend income 1,379,251 1,891,334 1,379,251 37,927,077
Rental income 721,076 - 721,076 -
Profit on disposal of property,
plant & equipment 16,839,034 17,965,669 16,839,034 17,965,669
Staff loan interest income 2,458,599 3,071,098 2,458,599 3,071,098
Sundry income (Note 5.1) 9,491,436 8,879,225 9,491,436 8,427,503
30,889,396 31,807,326 30,889,396 67,391,347
5.1 Sundry income
Sale of disposable material 8,493,328 7,549,352 8,493,328 7,549,352
Sundry receipts 998,108 1,329,873 998,108 878,151
9,491,436 8,879,225 9,491,436 8,427,503
6. RESULTS FROM OPERATING ACTIVITIES
Results from operating activities are stated after charging all expenses including following;
Directors' emoluments 30,838,353 26,960,800 30,838,353 26,960,800
Auditors' remuneration
Audit 1,000,000 1,000,000 850,000 850,000
Audit related 483,000 394,000 451,000 191,000
Depreciation and amortization 74,988,689 68,352,138 74,988,689 68,352,138
Donations 3,631,414 3,523,816 3,631,414 3,523,816
Staff related expenses (Note 6.1) 319,311,898 257,411,023 319,311,898 257,411,023
Inventory slow moving provision 3,000,047 - 3,000,047 -
6.1 Staff related expenses
Salaries and wages 215,960,061 172,861,159 215,960,061 172,861,159
Defined contribution plan 28,355,189 22,780,077 28,355,189 22,780,077
Bonus 38,964,718 32,556,489 38,964,718 32,556,489
Staff welfare 24,042,996 18,301,355 24,042,996 18,301,355
Defined benefit plan - Retiring gratuity 11,988,934 10,911,943 11,988,934 10,911,943
319,311,898 257,411,023 319,311,898 257,411,023
Average number of employees 555 555 555 555
40
Annual Report 2015-2016
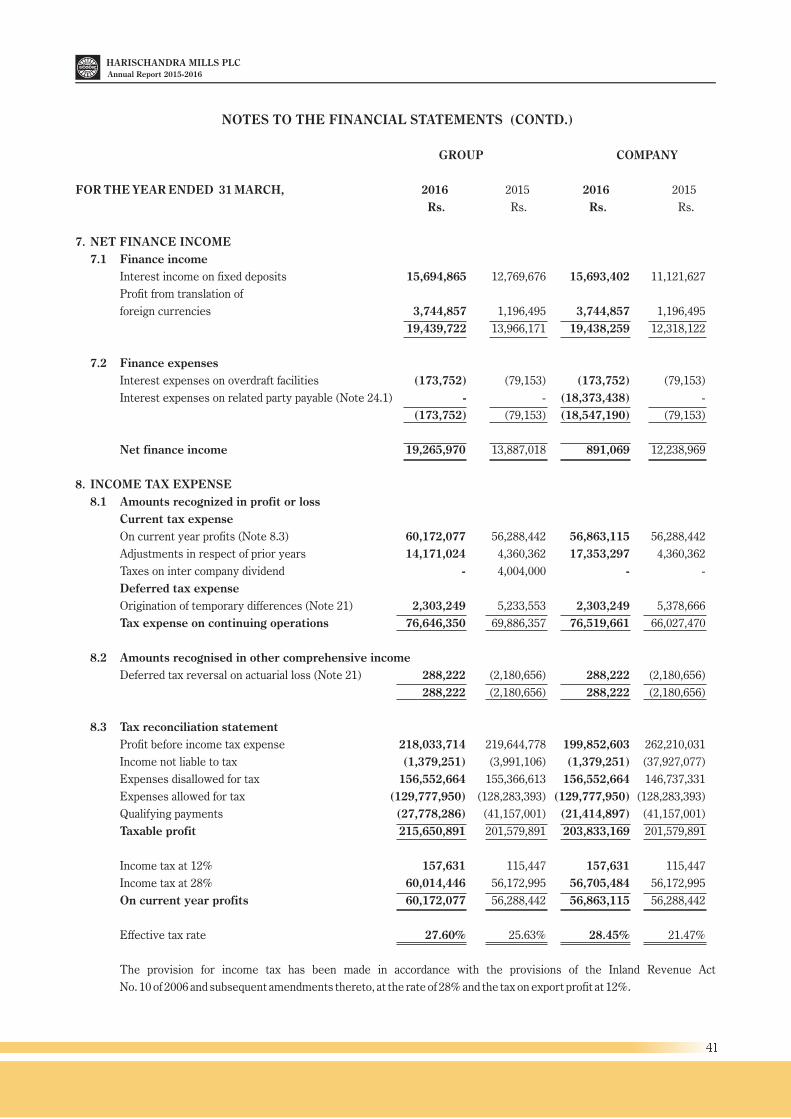
NOTES TO THE FINANCIAL STATEMENTS (CONTD.)
GROUP COMPANY
FOR THE YEAR ENDED 31 MARCH, 2016 2015 2016 2015
Rs. Rs. Rs. Rs.
7. NET FINANCE INCOME
7.1 Finance income
Interest income on fixed deposits 15,694,865 12,769,676 15,693,402 11,121,627
Profit from translation of
foreign currencies 3,744,857 1,196,495 3,744,857 1,196,495
19,439,722 13,966,171 19,438,259 12,318,122
7.2 Finance expenses
Interest expenses on overdraft facilities (173,752) (79,153) (173,752) (79,153)
Interest expenses on related party payable (Note 24.1) - - (18,373,438) -
(173,752) (79,153) (18,547,190) (79,153)
Net finance income 19,265,970 13,887,018 891,069 12,238,969
8. INCOME TAX EXPENSE
8.1 Amounts recognized in profit or loss
Current tax expense
On current year profits (Note 8.3) 60,172,077 56,288,442 56,863,115 56,288,442
Adjustments in respect of prior years 14,171,024 4,360,362 17,353,297 4,360,362
Taxes on inter company dividend - 4,004,000 - -
Deferred tax expense
Origination of temporary differences (Note 21) 2,303,249 5,233,553 2,303,249 5,378,666
Tax expense on continuing operations 76,646,350 69,886,357 76,519,661 66,027,470
8.2 Amounts recognised in other comprehensive income
Deferred tax reversal on actuarial loss (Note 21) 288,222 (2,180,656) 288,222 (2,180,656)
288,222 (2,180,656) 288,222 (2,180,656)
8.3 Tax reconciliation statement
Profit before income tax expense 218,033,714 219,644,778 199,852,603 262,210,031
Income not liable to tax (1,379,251) (3,991,106) (1,379,251) (37,927,077)
Expenses disallowed for tax 156,552,664 155,366,613 156,552,664 146,737,331
Expenses allowed for tax (129,777,950) (128,283,393) (129,777,950) (128,283,393)
Qualifying payments (27,778,286) (41,157,001) (21,414,897) (41,157,001)
Taxable profit 215,650,891 201,579,891 203,833,169 201,579,891
Income tax at 12% 157,631 115,447 157,631 115,447
Income tax at 28% 60,014,446 56,172,995 56,705,484 56,172,995
On current year profits 60,172,077 56,288,442 56,863,115 56,288,442
Effective tax rate 27.60% 25.63% 28.45% 21.47%
The provision for income tax has been made in accordance with the provisions of the Inland Revenue Act
No. 10 of 2006 and subsequent amendments thereto, at the rate of 28% and the tax on export profit at 12%.
41
Annual Report 2015-2016
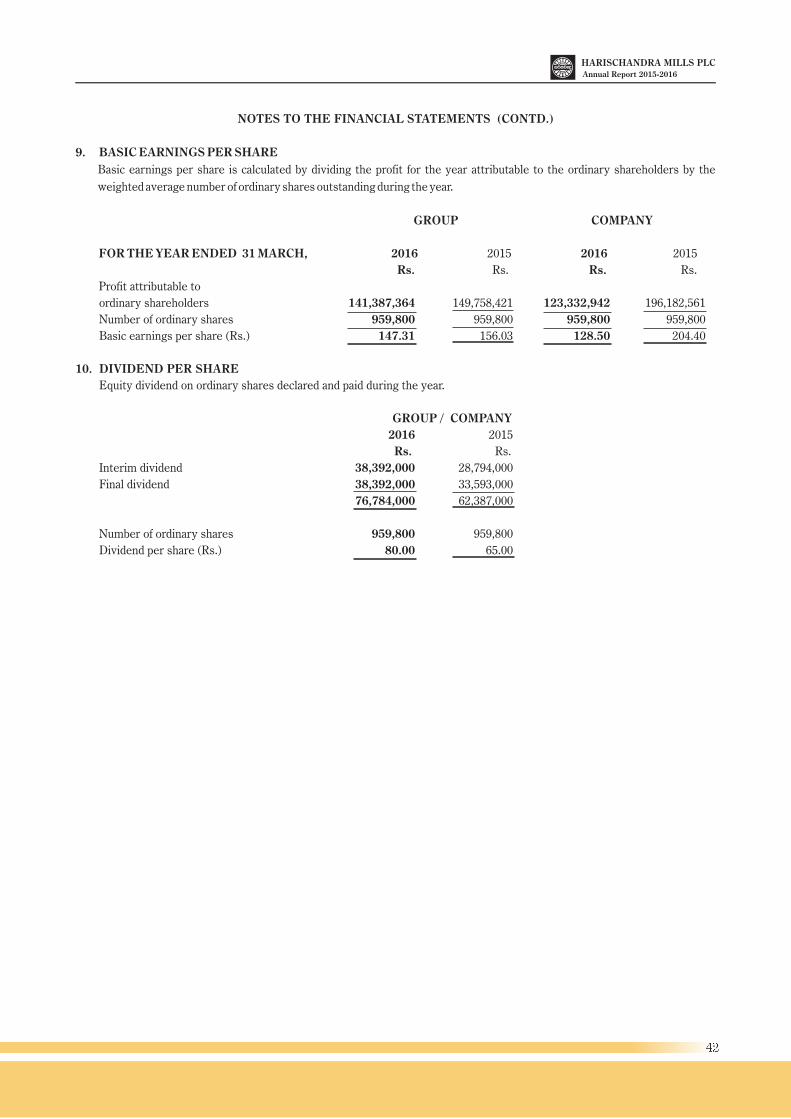
NOTES TO THE FINANCIAL STATEMENTS (CONTD.)
9. BASIC EARNINGS PER SHARE
Basic earnings per share is calculated by dividing the profit for the year attributable to the ordinary shareholders by the
weighted average number of ordinary shares outstanding during the year.
GROUP COMPANY
FOR THE YEAR ENDED 31 MARCH, 2016 2015 2016 2015
Rs. Rs. Rs. Rs.
Profit attributable to
ordinary shareholders 141,387,364 149,758,421 123,332,942 196,182,561
Number of ordinary shares 959,800 959,800 959,800 959,800
Basic earnings per share (Rs.) 147.31 156.03 128.50 204.40
10. DIVIDEND PER SHARE
Equity dividend on ordinary shares declared and paid during the year.
GROUP / COMPANY
2016 2015
Rs. Rs.
Interim dividend 38,392,000 28,794,000
Final dividend 38,392,000 33,593,000
76,784,000 62,387,000
Number of ordinary shares 959,800 959,800
Dividend per share (Rs.) 80.00 65.00
42
Annual Report 2015-2016
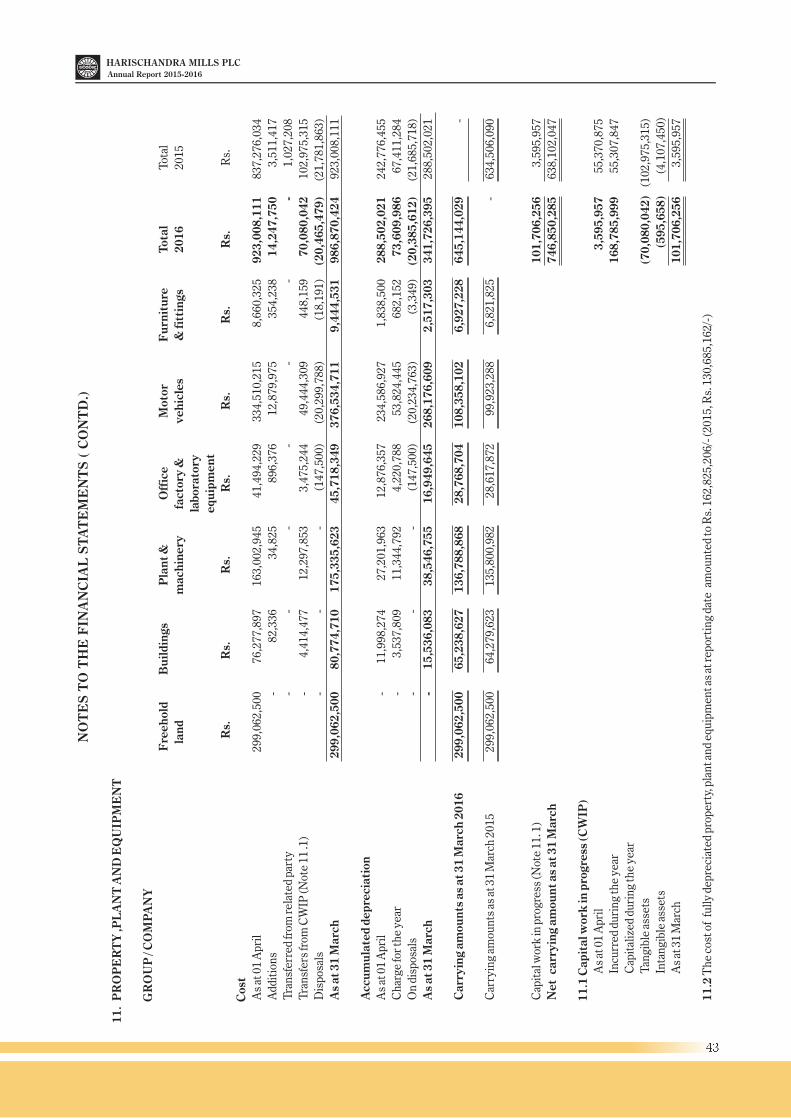
43
Annual Report 2015-2016N
OT
ES
TO
TH
E F
INA
NC
IAL
ST
AT
EM
EN
TS
( C
ON
TD
.)
11
. P
RO
PE
RT
Y ,P
LA
NT
AN
D E
QU
IPM
EN
T
G
RO
UP
/ C
OM
PA
NY
F
reeh
old
Bu
ild
ings
Pla
nt &
Off
ice
Moto
rF
urn
itu
reTota
lT
otal
l
an
dm
ach
inery
fact
ory
&v
eh
icle
s&
fitt
ings
20
16
20
15
labora
tory
eq
uip
men
t
Rs.
Rs.
Rs.
Rs.
Rs.
Rs.
Rs.
Rs.
Cost
As
at 0
1 A
pri
l2
99
,06
2,5
00
76
,27
7,8
97
16
3,0
02
,94
54
1,4
94
,22
93
34
,51
0,2
15
8,6
60
,32
59
23
,00
8,1
11
83
7,2
76
,03
4
Add
itio
ns
-8
2,3
36
34
,82
58
96
,37
61
2,8
79
,97
53
54
,23
81
4,2
47
,75
03
,51
1,4
17
Tra
nsf
erre
d fr
om r
elat
ed p
arty
--
--
--
-1
,02
7,2
08
Tra
nsf
ers
from
CW
IP (N
ote
11
.1)
-4
,41
4,4
77
12
,29
7,8
53
3,4
75
,24
44
9,4
44
,30
94
48
,15
97
0,0
80
,04
21
02
,97
5,3
15
Dis
pos
als
--
-(1
47
,50
0)
(20
,29
9,7
88
)(1
8,1
91
) (2
0,4
65
,47
9)
(21
,78
1,8
63
)
As
at 3
1 M
arc
h2
99
,06
2,5
00
80
,77
4,7
10
17
5,3
35
,62
34
5,7
18
,34
93
76
,53
4,7
11
9,4
44
,53
19
86
,87
0,4
24
92
3,0
08
,11
1
Acc
um
ula
ted
dep
reci
ati
on
As
at 0
1 A
pri
l-
11
,99
8,2
74
27
,20
1,9
63
12
,87
6,3
57
23
4,5
86
,92
71
,83
8,5
00
28
8,5
02
,02
12
42
,77
6,4
55
Ch
arge
for
the
year
-3
,53
7,8
09
11
,34
4,7
92
4,2
20
,78
85
3,8
24
,44
56
82
,15
27
3,6
09
,98
66
7,4
11
,28
4
On
dis
pos
als
--
-(1
47
,50
0)
(20
,23
4,7
63
)(3
,34
9)
(20
,38
5,6
12
)(2
1,6
85
,71
8)
As
at 3
1 M
arc
h-
15
,53
6,0
83
38
,54
6,7
55
16
,94
9,6
45
26
8,1
76
,60
92
,51
7,3
03
34
1,7
26
,39
52
88
,50
2,0
21
Carr
yin
g a
mou
nts
as
at 3
1 M
arc
h 2
01
62
99
,06
2,5
00
65
,23
8,6
27
13
6,7
88
,86
82
8,7
68
,70
41
08
,35
8,1
02
6,9
27
,22
86
45
,14
4,0
29
-
Car
ryin
g am
oun
ts a
s at
31
Mar
ch 2
01
52
99
,06
2,5
00
64
,27
9,6
23
13
5,8
00
,98
22
8,6
17
,87
29
9,9
23
,28
86
,82
1,8
25
-6
34
,50
6,0
90
Cap
ital
wor
k in
pro
gres
s (N
ote
11
. 1)
10
1,7
06
,25
63
,59
5,9
57
Net
carr
yin
g a
mou
nt as
at 3
1 M
arc
h
74
6,8
50
,28
56
38
,10
2,0
47
11
.1 C
ap
ital w
ork
in p
rogre
ss (C
WIP
)
As
at 0
1 A
pri
l3
,59
5,9
57
55
,37
0,8
75
Incu
rred
du
rin
g th
e ye
ar1
68
,78
5,9
99
55
,30
7,8
47
Cap
ital
ized
du
rin
g th
e ye
ar
Tan
gibl
e as
sets
(7
0,0
80
,04
2)
(1
02
,97
5,3
15
)
Inta
ngi
ble
asse
ts
(5
95
,65
8)
(
4,1
07
,45
0)
As
at 3
1 M
arch
1
01
,70
6,2
56
3,5
95
,95
7
11
.2 T
he
cost
of
full
y de
pre
ciat
ed p
roper
ty, p
lan
t an
d eq
uip
men
t as
at r
epor
tin
g da
te a
mou
nte
d to
Rs.
16
2,8
25
,20
6/-
(20
15
, Rs.
13
0,6
85
,16
2/-
)
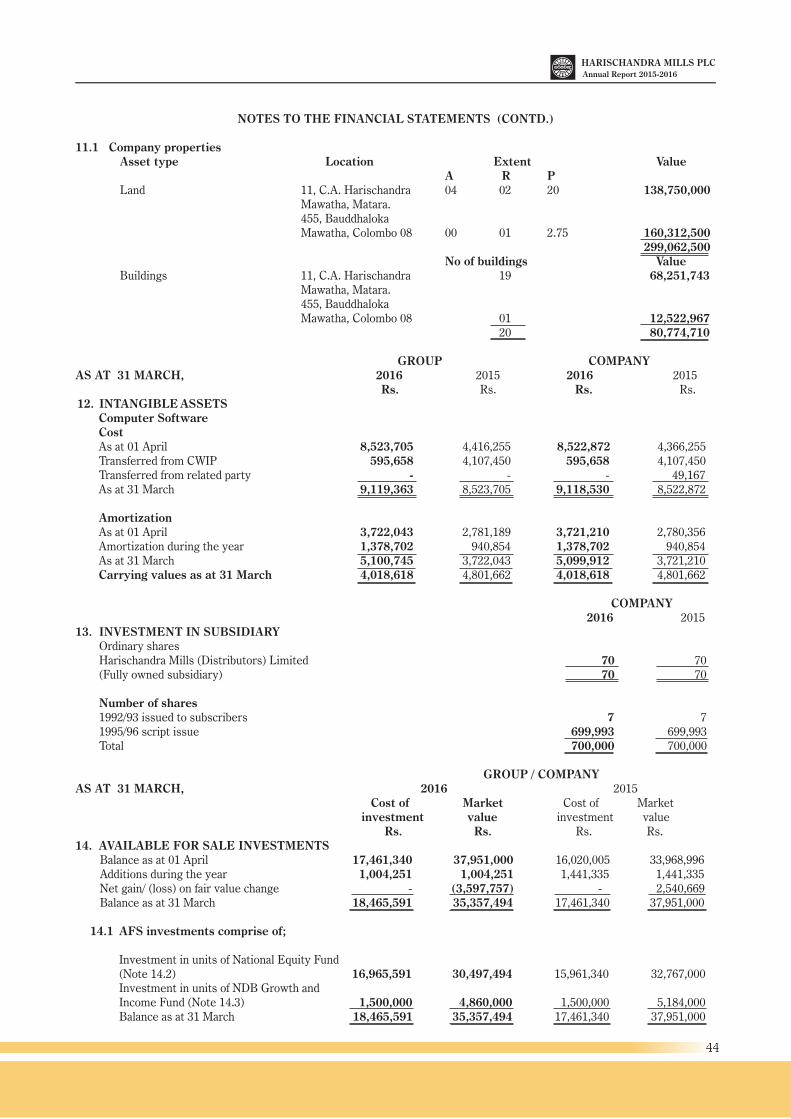
NOTES TO THE FINANCIAL STATEMENTS (CONTD.)
11.1 Company properties Asset type Location Extent Value
A R PLand 11, C.A. Harischandra 04 02 20 138,750,000
Mawatha, Matara.455, Bauddhaloka Mawatha, Colombo 08 00 01 2.75 160,312,500
299,062,500No of buildings Value
Buildings 11, C.A. Harischandra 19 68,251,743Mawatha, Matara.455, Bauddhaloka Mawatha, Colombo 08 01 12,522,967
20 80,774,710
GROUP COMPANYAS AT 31 MARCH, 2016 2015 2016 2015
Rs. Rs. Rs. Rs. 12. INTANGIBLE ASSETS
Computer SoftwareCostAs at 01 April 8,523,705 4,416,255 8,522,872 4,366,255Transferred from CWIP 595,658 4,107,450 595,658 4,107,450Transferred from related party - - - 49,167As at 31 March 9,119,363 8,523,705 9,118,530 8,522,872
AmortizationAs at 01 April 3,722,043 2,781,189 3,721,210 2,780,356Amortization during the year 1,378,702 940,854 1,378,702 940,854As at 31 March 5,100,745 3,722,043 5,099,912 3,721,210Carrying values as at 31 March 4,018,618 4,801,662 4,018,618 4,801,662
COMPANY 2016 2015 13. INVESTMENT IN SUBSIDIARY
Ordinary sharesHarischandra Mills (Distributors) Limited 70 70(Fully owned subsidiary) 70 70
Number of shares1992/93 issued to subscribers 7 71995/96 script issue 699,993 699,993Total 700,000 700,000
GROUP / COMPANY AS AT 31 MARCH, 2016 2015
Cost of Market Cost of Market investment value investment value
Rs. Rs. Rs. Rs.14. AVAILABLE FOR SALE INVESTMENTS
Balance as at 01 April 17,461,340 37,951,000 16,020,005 33,968,996Additions during the year 1,004,251 1,004,251 1,441,335 1,441,335Net gain/ (loss) on fair value change - (3,597,757) - 2,540,669Balance as at 31 March 18,465,591 35,357,494 17,461,340 37,951,000
14.1 AFS investments comprise of;
Investment in units of National Equity Fund (Note 14.2) 16,965,591 30,497,494 15,961,340 32,767,000Investment in units of NDB Growth and Income Fund (Note 14.3) 1,500,000 4,860,000 1,500,000 5,184,000Balance as at 31 March 18,465,591 35,357,494 17,461,340 37,951,000
44
Annual Report 2015-2016
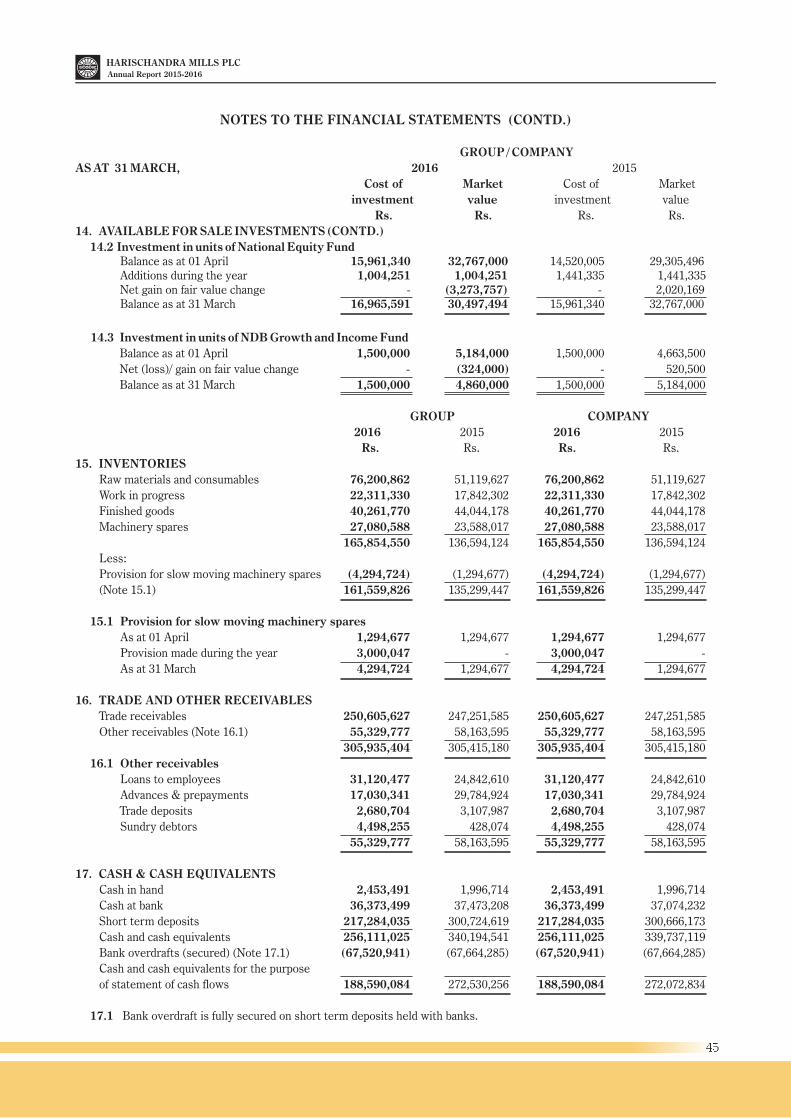
NOTES TO THE FINANCIAL STATEMENTS (CONTD.)
GROUP / COMPANY
AS AT 31 MARCH, 2016 2015
Cost of Market Cost of Market
investment value investment value
Rs. Rs. Rs. Rs.
14. AVAILABLE FOR SALE INVESTMENTS (CONTD.)
14.2 Investment in units of National Equity Fund Balance as at 01 April 15,961,340 32,767,000 14,520,005 29,305,496 Additions during the year 1,004,251 1,004,251 1,441,335 1,441,335 Net gain on fair value change - (3,273,757) - 2,020,169 Balance as at 31 March 16,965,591 30,497,494 15,961,340 32,767,000
14.3 Investment in units of NDB Growth and Income Fund
Balance as at 01 April 1,500,000 5,184,000 1,500,000 4,663,500
Net (loss)/ gain on fair value change - (324,000) - 520,500
Balance as at 31 March 1,500,000 4,860,000 1,500,000 5,184,000
GROUP COMPANY
2016 2015 2016 2015
Rs. Rs. Rs. Rs.
15. INVENTORIES
Raw materials and consumables 76,200,862 51,119,627 76,200,862 51,119,627
Work in progress 22,311,330 17,842,302 22,311,330 17,842,302
Finished goods 40,261,770 44,044,178 40,261,770 44,044,178
Machinery spares 27,080,588 23,588,017 27,080,588 23,588,017
165,854,550 136,594,124 165,854,550 136,594,124
Less:
Provision for slow moving machinery spares (4,294,724) (1,294,677) (4,294,724) (1,294,677)
(Note 15.1) 161,559,826 135,299,447 161,559,826 135,299,447
15.1 Provision for slow moving machinery spares
As at 01 April 1,294,677 1,294,677 1,294,677 1,294,677
Provision made during the year 3,000,047 - 3,000,047 -
As at 31 March 4,294,724 1,294,677 4,294,724 1,294,677
16. TRADE AND OTHER RECEIVABLES
Trade receivables 250,605,627 247,251,585 250,605,627 247,251,585
Other receivables (Note 16.1) 55,329,777 58,163,595 55,329,777 58,163,595
305,935,404 305,415,180 305,935,404 305,415,180
16.1 Other receivables
Loans to employees 31,120,477 24,842,610 31,120,477 24,842,610
Advances & prepayments 17,030,341 29,784,924 17,030,341 29,784,924
Trade deposits 2,680,704 3,107,987 2,680,704 3,107,987
Sundry debtors 4,498,255 428,074 4,498,255 428,074
55,329,777 58,163,595 55,329,777 58,163,595
17. CASH & CASH EQUIVALENTS
Cash in hand 2,453,491 1,996,714 2,453,491 1,996,714
Cash at bank 36,373,499 37,473,208 36,373,499 37,074,232
Short term deposits 217,284,035 300,724,619 217,284,035 300,666,173
Cash and cash equivalents 256,111,025 340,194,541 256,111,025 339,737,119
Bank overdrafts (secured) (Note 17.1) (67,520,941) (67,664,285) (67,520,941) (67,664,285)
Cash and cash equivalents for the purpose
of statement of cash flows 188,590,084 272,530,256 188,590,084 272,072,834
17.1 Bank overdraft is fully secured on short term deposits held with banks.
45
Annual Report 2015-2016
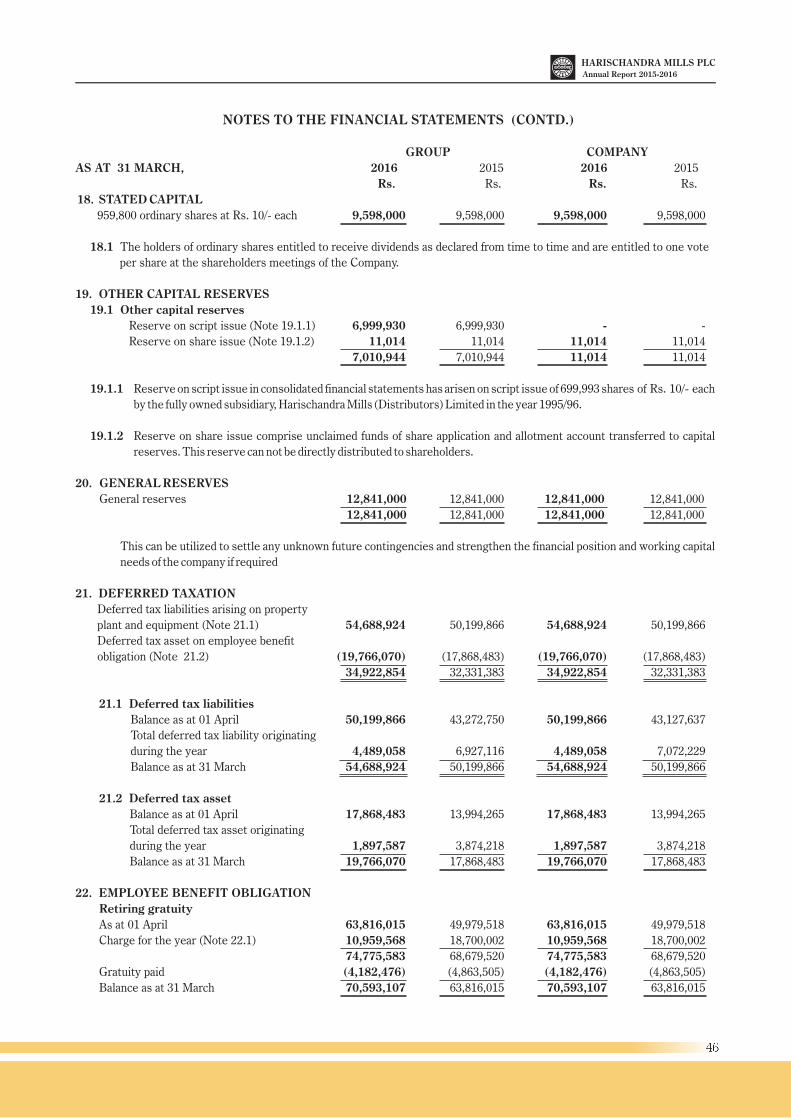
NOTES TO THE FINANCIAL STATEMENTS (CONTD.)
GROUP COMPANY
AS AT 31 MARCH, 2016 2015 2016 2015
Rs. Rs. Rs. Rs.
18. STATED CAPITAL
959,800 ordinary shares at Rs. 10/- each 9,598,000 9,598,000 9,598,000 9,598,000
18.1 The holders of ordinary shares entitled to receive dividends as declared from time to time and are entitled to one vote
per share at the shareholders meetings of the Company.
19. OTHER CAPITAL RESERVES
19.1 Other capital reserves
Reserve on script issue (Note 19.1.1) 6,999,930 6,999,930 - -
Reserve on share issue (Note 19.1.2) 11,014 11,014 11,014 11,014
7,010,944 7,010,944 11,014 11,014
19.1.1 Reserve on script issue in consolidated financial statements has arisen on script issue of 699,993 shares of Rs. 10/- each
by the fully owned subsidiary, Harischandra Mills (Distributors) Limited in the year 1995/96.
19.1.2 Reserve on share issue comprise unclaimed funds of share application and allotment account transferred to capital
reserves. This reserve can not be directly distributed to shareholders.
20. GENERAL RESERVES
General reserves 12,841,000 12,841,000 12,841,000 12,841,000
12,841,000 12,841,000 12,841,000 12,841,000
This can be utilized to settle any unknown future contingencies and strengthen the financial position and working capital
needs of the company if required
21. DEFERRED TAXATION
Deferred tax liabilities arising on property
plant and equipment (Note 21.1) 54,688,924 50,199,866 54,688,924 50,199,866
Deferred tax asset on employee benefit
obligation (Note 21.2) (19,766,070) (17,868,483) (19,766,070) (17,868,483)
34,922,854 32,331,383 34,922,854 32,331,383
21.1 Deferred tax liabilities
Balance as at 01 April 50,199,866 43,272,750 50,199,866 43,127,637
Total deferred tax liability originating
during the year 4,489,058 6,927,116 4,489,058 7,072,229
Balance as at 31 March 54,688,924 50,199,866 54,688,924 50,199,866
21.2 Deferred tax asset
Balance as at 01 April 17,868,483 13,994,265 17,868,483 13,994,265
Total deferred tax asset originating
during the year 1,897,587 3,874,218 1,897,587 3,874,218
Balance as at 31 March 19,766,070 17,868,483 19,766,070 17,868,483
22. EMPLOYEE BENEFIT OBLIGATION
Retiring gratuity
As at 01 April 63,816,015 49,979,518 63,816,015 49,979,518
Charge for the year (Note 22.1) 10,959,568 18,700,002 10,959,568 18,700,002
74,775,583 68,679,520 74,775,583 68,679,520
Gratuity paid (4,182,476) (4,863,505) (4,182,476) (4,863,505)
Balance as at 31 March 70,593,107 63,816,015 70,593,107 63,816,015
46
Annual Report 2015-2016
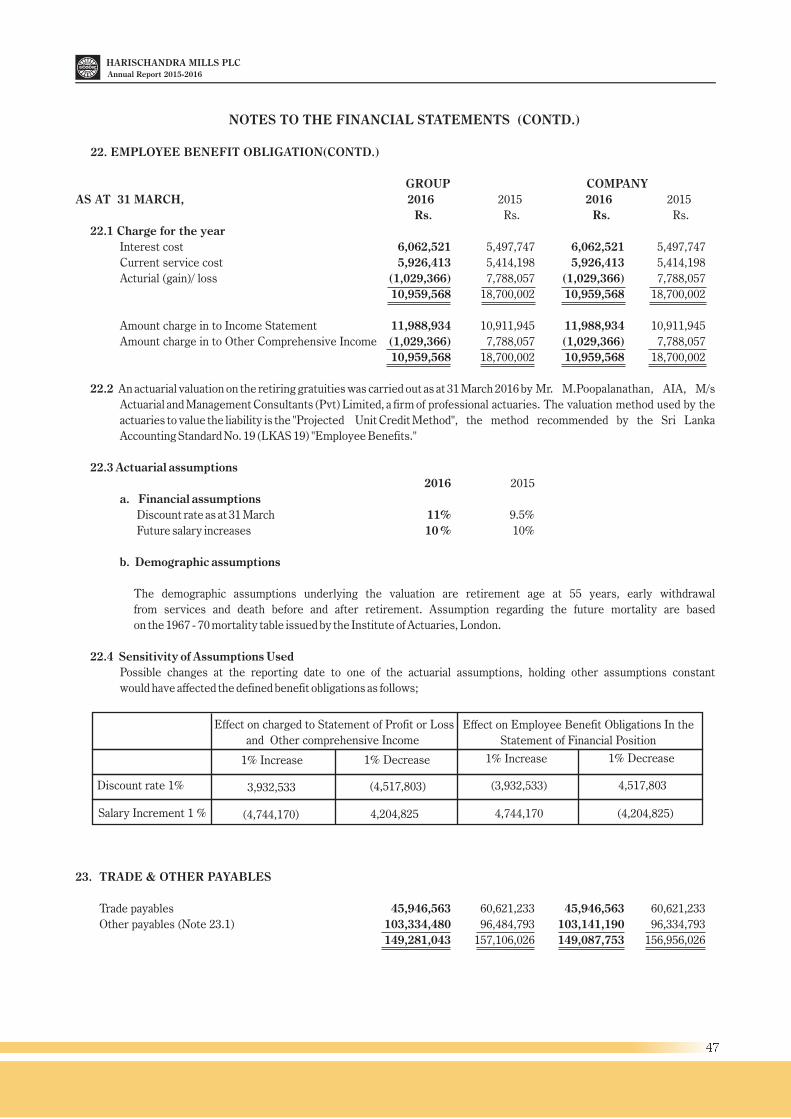
NOTES TO THE FINANCIAL STATEMENTS (CONTD.)
22. EMPLOYEE BENEFIT OBLIGATION(CONTD.)
GROUP COMPANY
AS AT 31 MARCH, 2016 2015 2016 2015
Rs. Rs. Rs. Rs.
22.1 Charge for the year
Interest cost 6,062,521 5,497,747 6,062,521 5,497,747
Current service cost 5,926,413 5,414,198 5,926,413 5,414,198
Acturial (gain)/ loss (1,029,366) 7,788,057 (1,029,366) 7,788,057
10,959,568 18,700,002 10,959,568 18,700,002
Amount charge in to Income Statement 11,988,934 10,911,945 11,988,934 10,911,945
Amount charge in to Other Comprehensive Income (1,029,366) 7,788,057 (1,029,366) 7,788,057
10,959,568 18,700,002 10,959,568 18,700,002
22.2 An actuarial valuation on the retiring gratuities was carried out as at 31 March 2016 by Mr. M.Poopalanathan, AIA, M/s
Actuarial and Management Consultants (Pvt) Limited, a firm of professional actuaries. The valuation method used by the
actuaries to value the liability is the "Projected Unit Credit Method", the method recommended by the Sri Lanka
Accounting Standard No. 19 (LKAS 19) "Employee Benefits."
22.3 Actuarial assumptions
2016 2015
a. Financial assumptions
Discount rate as at 31 March 11% 9.5%
Future salary increases 10 % 10%
b. Demographic assumptions
The demographic assumptions underlying the valuation are retirement age at 55 years, early withdrawal
from services and death before and after retirement. Assumption regarding the future mortality are based
on the 1967 - 70 mortality table issued by the Institute of Actuaries, London.
22.4 Sensitivity of Assumptions Used
Possible changes at the reporting date to one of the actuarial assumptions, holding other assumptions constant
would have affected the defined benefit obligations as follows;
23. TRADE & OTHER PAYABLES
Trade payables 45,946,563 60,621,233 45,946,563 60,621,233
Other payables (Note 23.1) 103,334,480 96,484,793 103,141,190 96,334,793
149,281,043 157,106,026 149,087,753 156,956,026
Discount rate 1%
1% Increase
3,932,533 (3,932,533)(4,517,803) 4,517,803
1% Decrease
Effect on charged to Statement of Profit or Loss
and Other comprehensive Income
Effect on Employee Benefit Obligations In the
Statement of Financial Position
Salary Increment 1 %
1% Increase 1% Decrease
(4,744,170) 4,744,1704,204,825 (4,204,825)
47
Annual Report 2015-2016
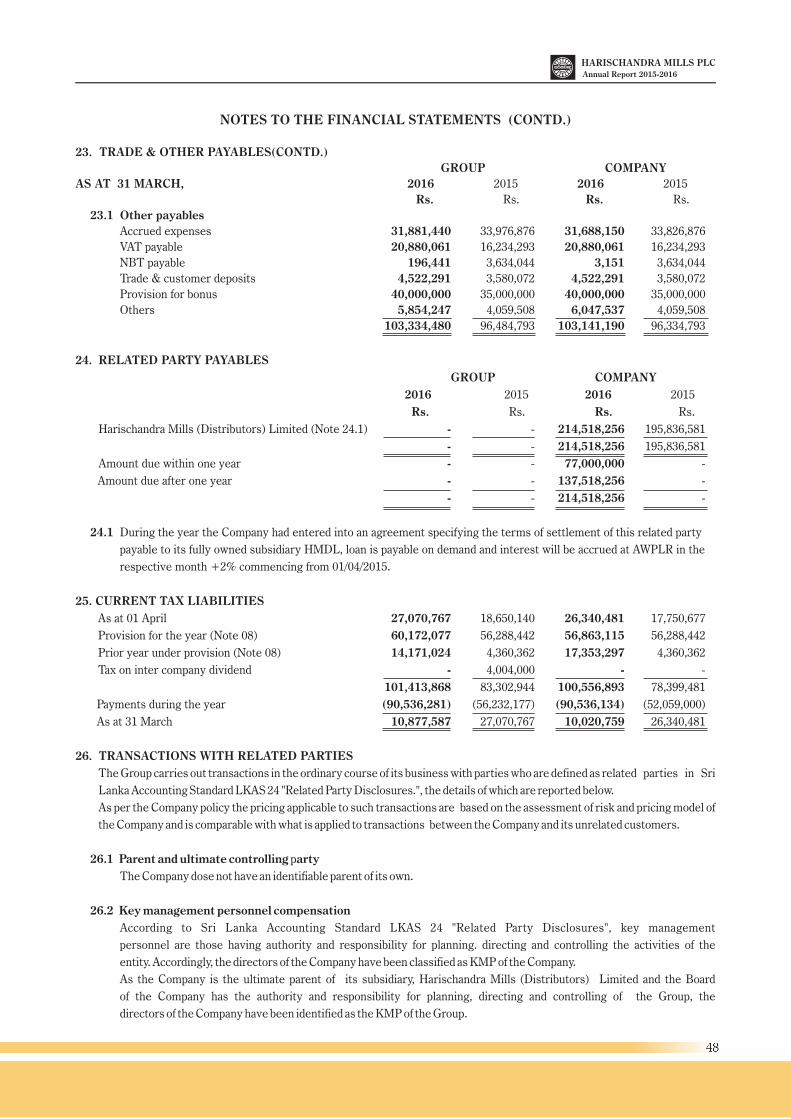
NOTES TO THE FINANCIAL STATEMENTS (CONTD.)
23. TRADE & OTHER PAYABLES(CONTD.)
GROUP COMPANY
2016 2015 2016 2015
Rs. Rs. Rs. Rs.
23.1 Other payables
Accrued expenses 31,881,440 33,976,876 31,688,150 33,826,876
VAT payable 20,880,061 16,234,293 20,880,061 16,234,293
NBT payable 196,441 3,634,044 3,151 3,634,044
Trade & customer deposits 4,522,291 3,580,072 4,522,291 3,580,072
Provision for bonus 40,000,000 35,000,000 40,000,000 35,000,000
Others 5,854,247 4,059,508 6,047,537 4,059,508
103,334,480 96,484,793 103,141,190 96,334,793
24. RELATED PARTY PAYABLES
GROUP COMPANY
2016 2015 2016 2015
Rs. Rs. Rs. Rs.
Harischandra Mills (Distributors) Limited (Note 24.1) - - 214,518,256 195,836,581
- - 214,518,256 195,836,581
Amount due within one year - - 77,000,000 -
Amount due after one year - - 137,518,256 -
- - 214,518,256 -
24.1 During the year the Company had entered into an agreement specifying the terms of settlement of this related party
payable to its fully owned subsidiary HMDL, loan is payable on demand and interest will be accrued at AWPLR in the
respective month +2% commencing from 01/04/2015.
25. CURRENT TAX LIABILITIES
As at 01 April 27,070,767 18,650,140 26,340,481 17,750,677
Provision for the year (Note 08) 60,172,077 56,288,442 56,863,115 56,288,442
Prior year under provision (Note 08) 14,171,024 4,360,362 17,353,297 4,360,362
Tax on inter company dividend - 4,004,000 - -
101,413,868 83,302,944 100,556,893 78,399,481
Payments during the year (90,536,281) (56,232,177) (90,536,134) (52,059,000)
As at 31 March 10,877,587 27,070,767 10,020,759 26,340,481
26. TRANSACTIONS WITH RELATED PARTIES
The Group carries out transactions in the ordinary course of its business with parties who are defined as related parties in Sri
Lanka Accounting Standard LKAS 24 "Related Party Disclosures.", the details of which are reported below.
As per the Company policy the pricing applicable to such transactions are based on the assessment of risk and pricing model of
the Company and is comparable with what is applied to transactions between the Company and its unrelated customers.
26.1 Parent and ultimate controlling party
The Company dose not have an identifiable parent of its own.
26.2 Key management personnel compensation
According to Sri Lanka Accounting Standard LKAS 24 "Related Party Disclosures", key management
personnel are those having authority and responsibility for planning. directing and controlling the activities of the
entity. Accordingly, the directors of the Company have been classified as KMP of the Company.
As the Company is the ultimate parent of its subsidiary, Harischandra Mills (Distributors) Limited and the Board
of the Company has the authority and responsibility for planning, directing and controlling of the Group, the
directors of the Company have been identified as the KMP of the Group.
AS AT 31 MARCH,
48
Annual Report 2015-2016
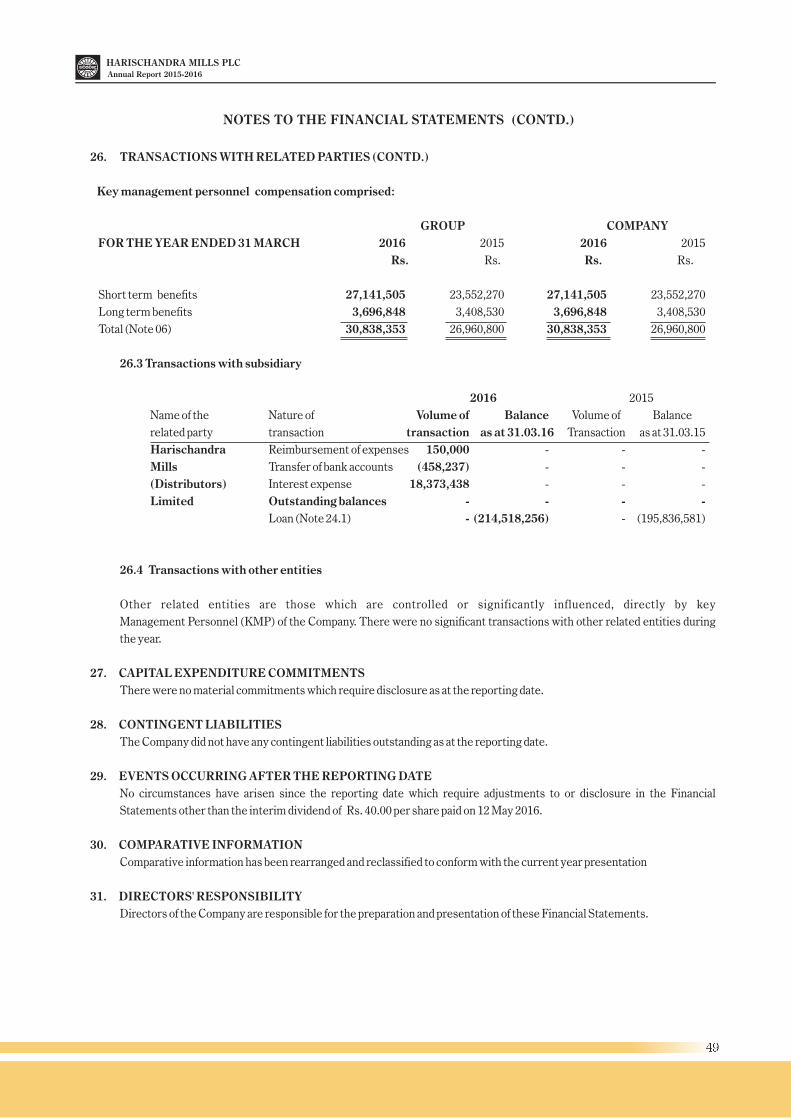
NOTES TO THE FINANCIAL STATEMENTS (CONTD.)
26. TRANSACTIONS WITH RELATED PARTIES (CONTD.)
Key management personnel compensation comprised:
GROUP COMPANY
FOR THE YEAR ENDED 31 MARCH 2016 2015 2016 2015
Rs. Rs. Rs. Rs.
Short term benefits 27,141,505 23,552,270 27,141,505 23,552,270
Long term benefits 3,696,848 3,408,530 3,696,848 3,408,530
Total (Note 06) 30,838,353 26,960,800 30,838,353 26,960,800
26.3 Transactions with subsidiary
2016 2015
Name of the Nature of Volume of Balance Volume of Balance
related party transaction transaction as at 31.03.16 Transaction as at 31.03.15
Harischandra Reimbursement of expenses 150,000 - - -
Mills Transfer of bank accounts (458,237) - - -
(Distributors) Interest expense 18,373,438 - - -
Limited Outstanding balances - - - -
Loan (Note 24.1) - (214,518,256) - (195,836,581)
26.4 Transactions with other entities
Other related entities are those which are controlled or significantly influenced, directly by key
Management Personnel (KMP) of the Company. There were no significant transactions with other related entities during
the year.
27. CAPITAL EXPENDITURE COMMITMENTS
There were no material commitments which require disclosure as at the reporting date.
28. CONTINGENT LIABILITIES
The Company did not have any contingent liabilities outstanding as at the reporting date.
29. EVENTS OCCURRING AFTER THE REPORTING DATE
No circumstances have arisen since the reporting date which require adjustments to or disclosure in the Financial
Statements other than the interim dividend of Rs. 40.00 per share paid on 12 May 2016.
30. COMPARATIVE INFORMATION
Comparative information has been rearranged and reclassified to conform with the current year presentation
31. DIRECTORS' RESPONSIBILITY
Directors of the Company are responsible for the preparation and presentation of these Financial Statements.
49
Annual Report 2015-2016
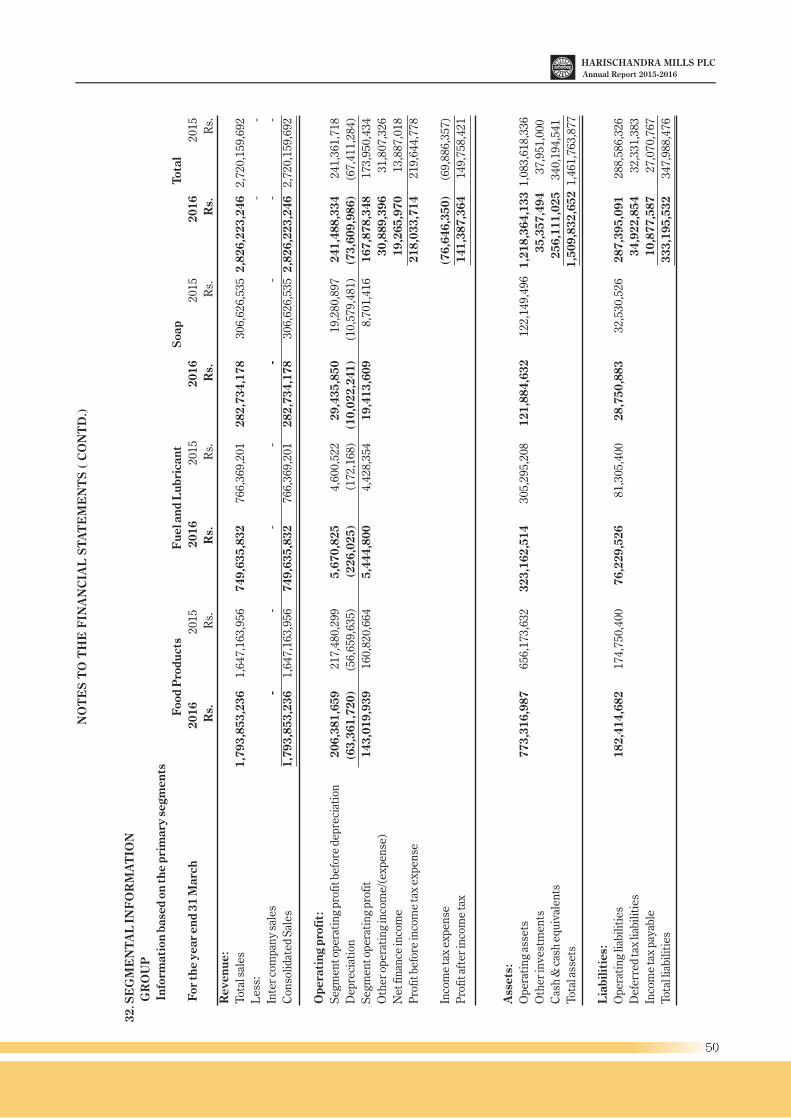
NO
TE
S T
O T
HE
FIN
AN
CIA
L S
TA
TE
ME
NT
S (
CO
NT
D.)
32
. SE
GM
EN
TA
L I
NF
OR
MA
TIO
N
GR
OU
P
Info
rmati
on
base
d o
n th
e p
rim
ary
segm
en
ts
F
ood
Pro
du
cts
F
uel a
nd
Lu
bri
can
t S
oap
T
ota
l
For
the y
ear
en
d 3
1 M
arc
h 2
01
6 2
01
5 2
01
6
20
15
20
16
20
15
20
16
20
15
R
s.
R
s. R
s.
R
s.
R
s.
R
s. R
s.
R
s.
Rev
en
ue:
Tot
al s
ales
1,7
93
,85
3,2
36
1,6
47
,16
3,9
56
74
9,6
35
,83
27
66
,36
9,2
01
28
2,7
34
,17
83
06
,62
6,5
35
2,8
26
,22
3,2
46
2,7
20
,15
9,6
92
Les
s:-
-
Inte
r co
mpan
y sa
les
--
--
--
--
Con
soli
date
d S
ales
1,7
93
,85
3,2
36
1,6
47
,16
3,9
56
74
9,6
35
,83
27
66
,36
9,2
01
28
2,7
34
,17
83
06
,62
6,5
35
2,8
26
,22
3,2
46
2,7
20
,15
9,6
92
Op
era
tin
g p
rofi
t:
Seg
men
t oper
atin
g pro
fit b
efor
e de
pre
ciat
ion
20
6,3
81
,65
92
17
,48
0,2
99
5,6
70
,82
54
,60
0,5
22
29
,43
5,8
50
19
,28
0,8
97
24
1,4
88
,33
42
41
,36
1,7
18
Dep
reci
atio
n(6
3,3
61
,72
0)
(56
,65
9,6
35
)(2
26
,02
5)
(17
2,1
68
)(1
0,0
22
,24
1)
(10
,57
9,4
81
)(7
3,6
09
,98
6)
(67
,41
1,2
84
)
Seg
men
t oper
atin
g pro
fit
14
3,0
19
,93
91
60
,82
0,6
64
5,4
44
,80
04
,42
8,3
54
19
,41
3,6
09
8,7
01
,41
61
67
,87
8,3
48
17
3,9
50
,43
4
Oth
er o
per
atin
g in
com
e/(e
xpen
se)
30
,88
9,3
96
31
,80
7,3
26
Net
fin
ance
inco
me
19
,26
5,9
70
13
,88
7,0
18
Pro
fit b
efor
e in
com
e ta
x ex
pen
se2
18
,03
3,7
14
21
9,6
44
,77
8
Inco
me
tax
expen
se(7
6,6
46
,35
0)
(69
,88
6,3
57
)
Pro
fit a
fter
inco
me
tax
14
1,3
87
,36
41
49
,75
8,4
21
Ass
ets
:
Oper
atin
g as
sets
77
3,3
16
,98
76
56
,17
3,6
32
32
3,1
62
,51
43
05
,29
5,2
08
1
21
,88
4,6
32
1
22
,14
9,4
96
1
,21
8,3
64
,13
3 1
,08
3,6
18
,33
6
Oth
er in
vest
men
ts
3
5,3
57
,49
4 3
7,9
51
,00
0
Cas
h &
cas
h e
quiv
alen
ts
2
56
,11
1,0
25
3
40
,19
4,5
41
Tot
al a
sset
s
1,5
09
,83
2,6
52
1,4
61
,76
3,8
77
Lia
bil
itie
s:
Oper
atin
g li
abil
itie
s1
82
,41
4,6
82
17
4,7
50
,40
07
6,2
29
,52
68
1,3
05
,40
02
8,7
50
,88
33
2,5
30
,52
62
87
,39
5,0
91
28
8,5
86
,32
6
Def
erre
d ta
x li
abil
itie
s3
4,9
22
,85
43
2,3
31
,38
3
Inco
me
tax
pay
able
10
,87
7,5
87
27
,07
0,7
67
Tot
al li
abil
itie
s3
33
,19
5,5
32
34
7,9
88
,47
6
50
Annual Report 2015-2016
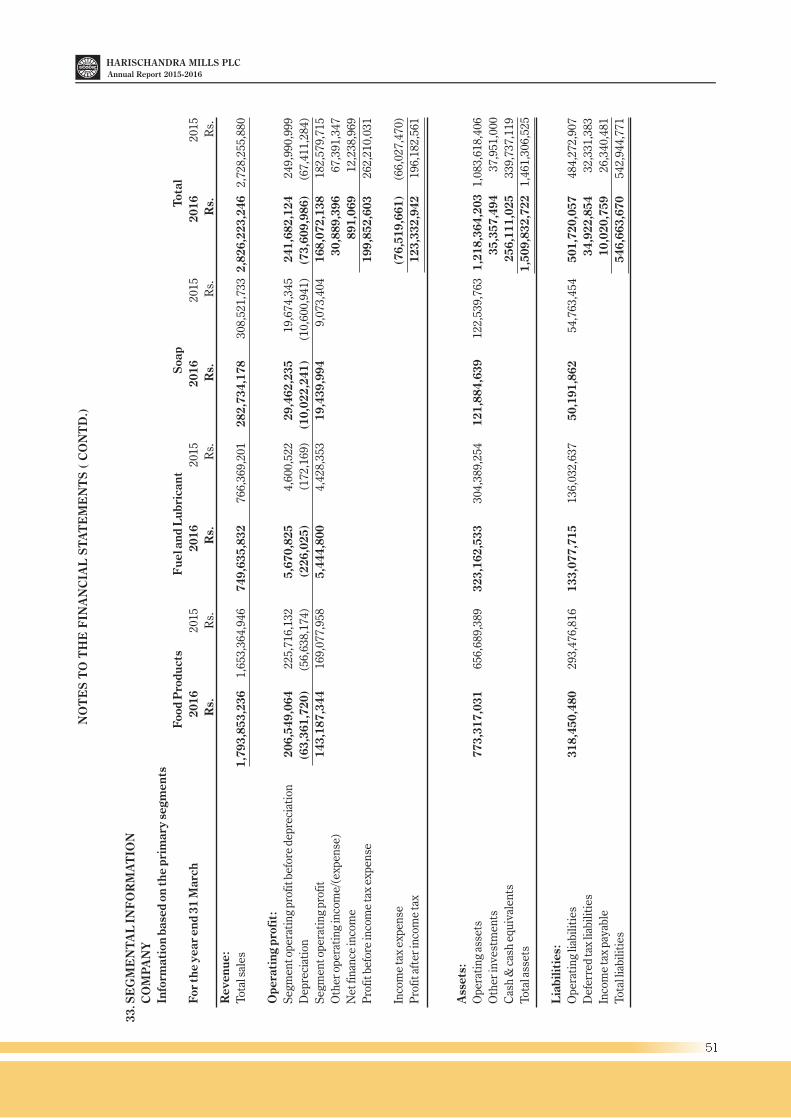
NO
TE
S T
O T
HE
FIN
AN
CIA
L S
TA
TE
ME
NT
S (
CO
NT
D.)
33
. SE
GM
EN
TA
L I
NF
OR
MA
TIO
N
CO
MP
AN
Y
Info
rmati
on
base
d o
n th
e p
rim
ary
segm
en
ts
Food
Pro
du
cts
Fu
el a
nd
Lu
bri
can
tS
oap
Tota
l
For
the y
ear
en
d 3
1 M
arc
h2
01
62
01
52
01
62
01
52
01
62
01
52
01
62
01
5
R
s.
Rs.
R
s.
R
s. R
s.
R
s.
R
s.
Rs.
Rev
en
ue:
Tot
al s
ales
1,7
93
,85
3,2
36
1,6
53
,36
4,9
46
74
9,6
35
,83
27
66
,36
9,2
01
28
2,7
34
,17
83
08
,52
1,7
33
2,8
26
,22
3,2
46
2,7
28
,25
5,8
80
Op
era
tin
g p
rofi
t:
Seg
men
t oper
atin
g pro
fit b
efor
e de
pre
ciat
ion
20
6,5
49
,06
42
25
,71
6,1
32
5,6
70
,82
54
,60
0,5
22
29
,46
2,2
35
19
,67
4,3
45
24
1,6
82
,12
42
49
,99
0,9
99
Dep
reci
atio
n(6
3,3
61
,72
0)
(56
,63
8,1
74
)(2
26
,02
5)
(17
2,1
69
)(1
0,0
22
,24
1)
(10
,60
0,9
41
)(7
3,6
09
,98
6)
(67
,41
1,2
84
)
Seg
men
t oper
atin
g pro
fit
14
3,1
87
,34
41
69
,07
7,9
58
5,4
44
,80
04
,42
8,3
53
19
,43
9,9
94
9,0
73
,40
41
68
,07
2,1
38
18
2,5
79
,71
5
Oth
er o
per
atin
g in
com
e/(e
xpen
se)
30
,88
9,3
96
67
,39
1,3
47
Net
fin
ance
inco
me
89
1,0
69
12
,23
8,9
69
Pro
fit b
efor
e in
com
e ta
x ex
pen
se1
99
,85
2,6
03
26
2,2
10
,03
1
Inco
me
tax
expen
se(7
6,5
19
,66
1)
(66
,02
7,4
70
)
Pro
fit a
fter
inco
me
tax
12
3,3
32
,94
21
96
,18
2,5
61
Ass
ets
:
Oper
atin
g as
sets
77
3,3
17
,03
16
56
,68
9,3
89
32
3,1
62
,53
33
04
,38
9,2
54
1
21
,88
4,6
39
12
2,5
39
,76
3
1,2
18
,36
4,2
03
1
,08
3,6
18
,40
6
Oth
er in
vest
men
ts
3
5,3
57
,49
4 3
7,9
51
,00
0
Cas
h &
cas
h e
quiv
alen
ts 2
56
,11
1,0
25
3
39
,73
7,1
19
Tot
al a
sset
s
1,5
09
,83
2,7
22
1
,46
1,3
06
,52
5
Lia
bil
itie
s:
Oper
atin
g li
abil
itie
s3
18
,45
0,4
80
29
3,4
76
,81
61
33
,07
7,7
15
13
6,0
32
,63
75
0,1
91
,86
2
5
4,7
63
,45
45
01
,72
0,0
57
48
4,2
72
,90
7
Def
erre
d ta
x li
abil
itie
s3
4,9
22
,85
43
2,3
31
,38
3
Inco
me
tax
pay
able
10
,02
0,7
59
26
,34
0,4
81
Tot
al li
abil
itie
s5
46
,66
3,6
70
54
2,9
44
,77
1
51
Annual Report 2015-2016
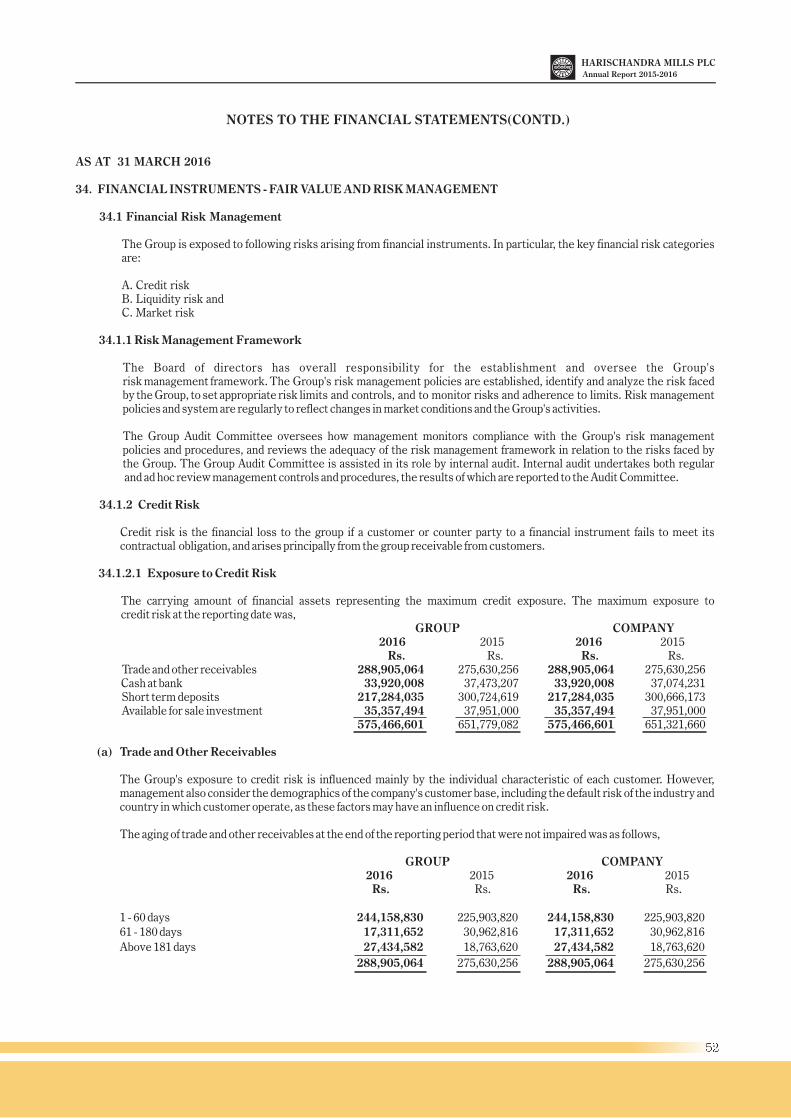
NOTES TO THE FINANCIAL STATEMENTS(CONTD.)
AS AT 31 MARCH 2016
34. FINANCIAL INSTRUMENTS - FAIR VALUE AND RISK MANAGEMENT
34.1 Financial Risk Management
The Group is exposed to following risks arising from financial instruments. In particular, the key financial risk categories are:
A. Credit risk B. Liquidity risk andC. Market risk
34.1.1 Risk Management Framework
The Board of directors has overall responsibility for the establishment and oversee the Group's risk management framework. The Group's risk management policies are established, identify and analyze the risk faced by the Group, to set appropriate risk limits and controls, and to monitor risks and adherence to limits. Risk management policies and system are regularly to reflect changes in market conditions and the Group's activities.
The Group Audit Committee oversees how management monitors compliance with the Group's risk management policies and procedures, and reviews the adequacy of the risk management framework in relation to the risks faced by the Group. The Group Audit Committee is assisted in its role by internal audit. Internal audit undertakes both regular and ad hoc review management controls and procedures, the results of which are reported to the Audit Committee.
34.1.2 Credit Risk
Credit risk is the financial loss to the group if a customer or counter party to a financial instrument fails to meet its contractual obligation, and arises principally from the group receivable from customers.
34.1.2.1 Exposure to Credit Risk
The carrying amount of financial assets representing the maximum credit exposure. The maximum exposure to credit risk at the reporting date was, GROUP COMPANY
2016 2015 2016 2015 Rs. Rs. Rs. Rs.Trade and other receivables 288,905,064 275,630,256 288,905,064 275,630,256Cash at bank 33,920,008 37,473,207 33,920,008 37,074,231Short term deposits 217,284,035 300,724,619 217,284,035 300,666,173Available for sale investment 35,357,494 37,951,000 35,357,494 37,951,000
575,466,601 651,779,082 575,466,601 651,321,660
(a) Trade and Other Receivables
The Group's exposure to credit risk is influenced mainly by the individual characteristic of each customer. However, management also consider the demographics of the company's customer base, including the default risk of the industry and country in which customer operate, as these factors may have an influence on credit risk.
The aging of trade and other receivables at the end of the reporting period that were not impaired was as follows,
GROUP COMPANY 2016 2015 2016 2015 Rs. Rs. Rs. Rs.
1 - 60 days 244,158,830 225,903,820 244,158,830 225,903,82061 - 180 days 17,311,652 30,962,816 17,311,652 30,962,816
Above 181 days 27,434,582 18,763,620 27,434,582 18,763,620
288,905,064 275,630,256 288,905,064 275,630,256
52
Annual Report 2015-2016
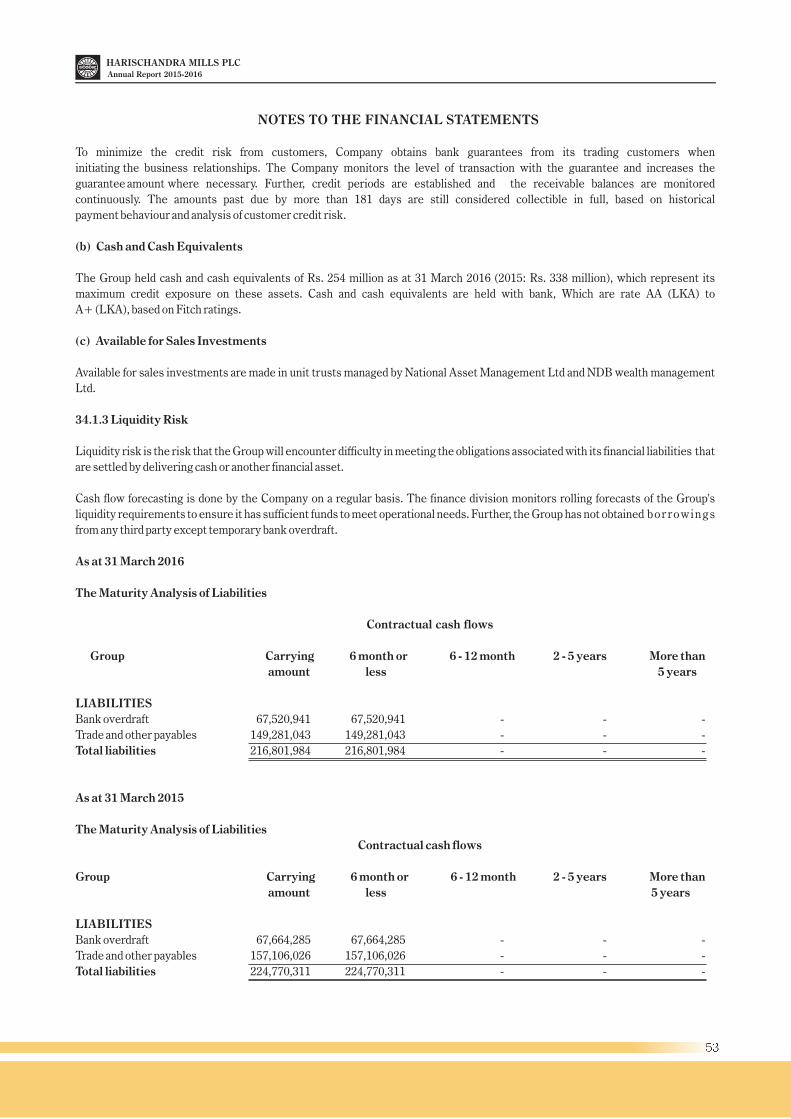
NOTES TO THE FINANCIAL STATEMENTS
To minimize the credit risk from customers, Company obtains bank guarantees from its trading customers when
initiating the business relationships. The Company monitors the level of transaction with the guarantee and increases the
guarantee amount where necessary. Further, credit periods are established and the receivable balances are monitored
continuously. The amounts past due by more than 181 days are still considered collectible in full, based on historical
payment behaviour and analysis of customer credit risk.
(b) Cash and Cash Equivalents
The Group held cash and cash equivalents of Rs. 254 million as at 31 March 2016 (2015: Rs. 338 million), which represent its
maximum credit exposure on these assets. Cash and cash equivalents are held with bank, Which are rate AA (LKA) to
A+ (LKA), based on Fitch ratings.
(c) Available for Sales Investments
Available for sales investments are made in unit trusts managed by National Asset Management Ltd and NDB wealth management
Ltd.
34.1.3 Liquidity Risk
Liquidity risk is the risk that the Group will encounter difficulty in meeting the obligations associated with its financial liabilities that
are settled by delivering cash or another financial asset.
Cash flow forecasting is done by the Company on a regular basis. The finance division monitors rolling forecasts of the Group's
liquidity requirements to ensure it has sufficient funds to meet operational needs. Further, the Group has not obtained bor rowings
from any third party except temporary bank overdraft.
As at 31 March 2016
The Maturity Analysis of Liabilities
Contractual cash flows
Group Carrying 6 month or 6 - 12 month 2 - 5 years More than
amount less 5 years
LIABILITIES
Bank overdraft 67,520,941 67,520,941 - - -
Trade and other payables 149,281,043 149,281,043 - - -
Total liabilities 216,801,984 216,801,984 - - -
As at 31 March 2015
The Maturity Analysis of Liabilities
Contractual cash flows
Group Carrying 6 month or 6 - 12 month 2 - 5 years More than
amount less 5 years
LIABILITIES
Bank overdraft 67,664,285 67,664,285 - - -
Trade and other payables 157,106,026 157,106,026 - - -
Total liabilities 224,770,311 224,770,311 - - -
53
Annual Report 2015-2016
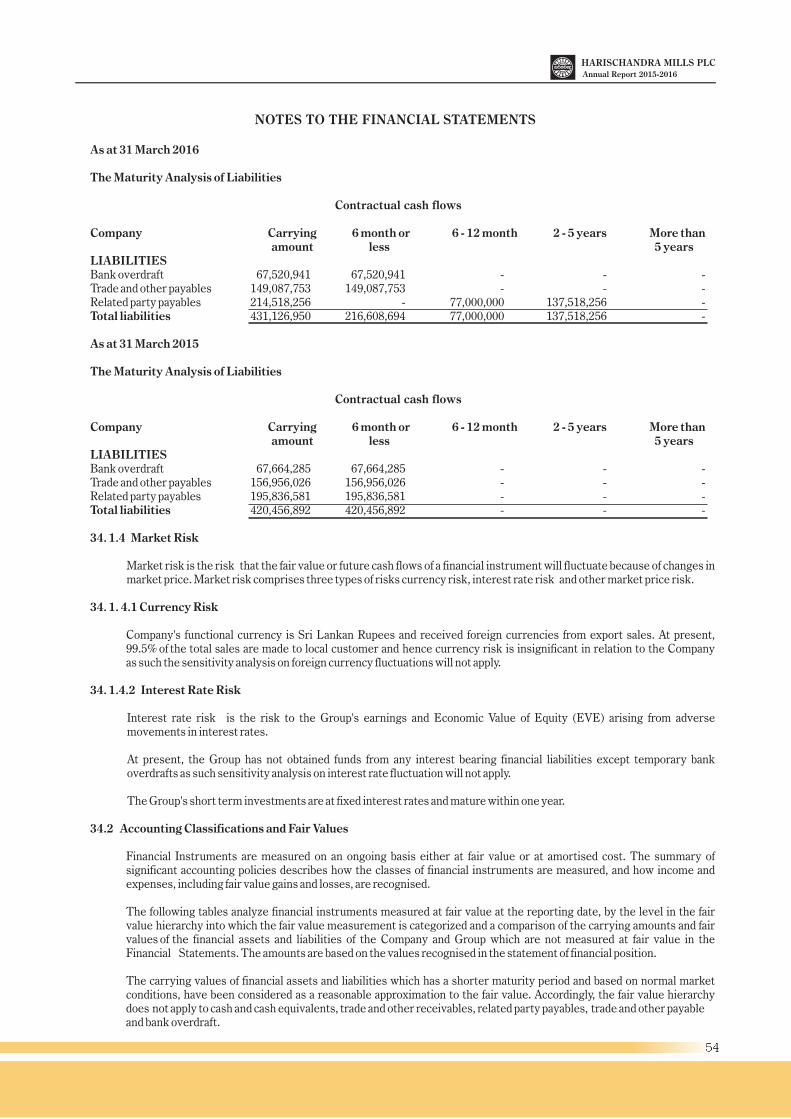
NOTES TO THE FINANCIAL STATEMENTS
As at 31 March 2016
The Maturity Analysis of Liabilities
Contractual cash flows
Company Carrying 6 month or 6 - 12 month 2 - 5 years More than amount less 5 years
LIABILITIESBank overdraft 67,520,941 67,520,941 - - -Trade and other payables 149,087,753 149,087,753 - - -Related party payables 214,518,256 - 77,000,000 137,518,256 -Total liabilities 431,126,950 216,608,694 77,000,000 137,518,256 -
As at 31 March 2015
The Maturity Analysis of Liabilities
Contractual cash flows
Company Carrying 6 month or 6 - 12 month 2 - 5 years More than amount less 5 years
LIABILITIESBank overdraft 67,664,285 67,664,285 - - -Trade and other payables 156,956,026 156,956,026 - - -Related party payables 195,836,581 195,836,581 - - -Total liabilities 420,456,892 420,456,892 - - -
34. 1.4 Market Risk
Market risk is the risk that the fair value or future cash flows of a financial instrument will fluctuate because of changes in market price. Market risk comprises three types of risks currency risk, interest rate risk and other market price risk.
34. 1. 4.1 Currency Risk
Company's functional currency is Sri Lankan Rupees and received foreign currencies from export sales. At present, 99.5% of the total sales are made to local customer and hence currency risk is insignificant in relation to the Company as such the sensitivity analysis on foreign currency fluctuations will not apply.
34. 1.4.2 Interest Rate Risk
Interest rate risk is the risk to the Group's earnings and Economic Value of Equity (EVE) arising from adverse movements in interest rates.
At present, the Group has not obtained funds from any interest bearing financial liabilities except temporary bank overdrafts as such sensitivity analysis on interest rate fluctuation will not apply.
The Group's short term investments are at fixed interest rates and mature within one year.
34.2 Accounting Classifications and Fair Values
Financial Instruments are measured on an ongoing basis either at fair value or at amortised cost. The summary of significant accounting policies describes how the classes of financial instruments are measured, and how income and expenses, including fair value gains and losses, are recognised.
The following tables analyze financial instruments measured at fair value at the reporting date, by the level in the fair value hierarchy into which the fair value measurement is categorized and a comparison of the carrying amounts and fair values of the financial assets and liabilities of the Company and Group which are not measured at fair value in the Financial Statements. The amounts are based on the values recognised in the statement of financial position.
The carrying values of financial assets and liabilities which has a shorter maturity period and based on normal market conditions, have been considered as a reasonable approximation to the fair value. Accordingly, the fair value hierarchy does not apply to cash and cash equivalents, trade and other receivables, related party payables, trade and other payableand bank overdraft.
54
Annual Report 2015-2016
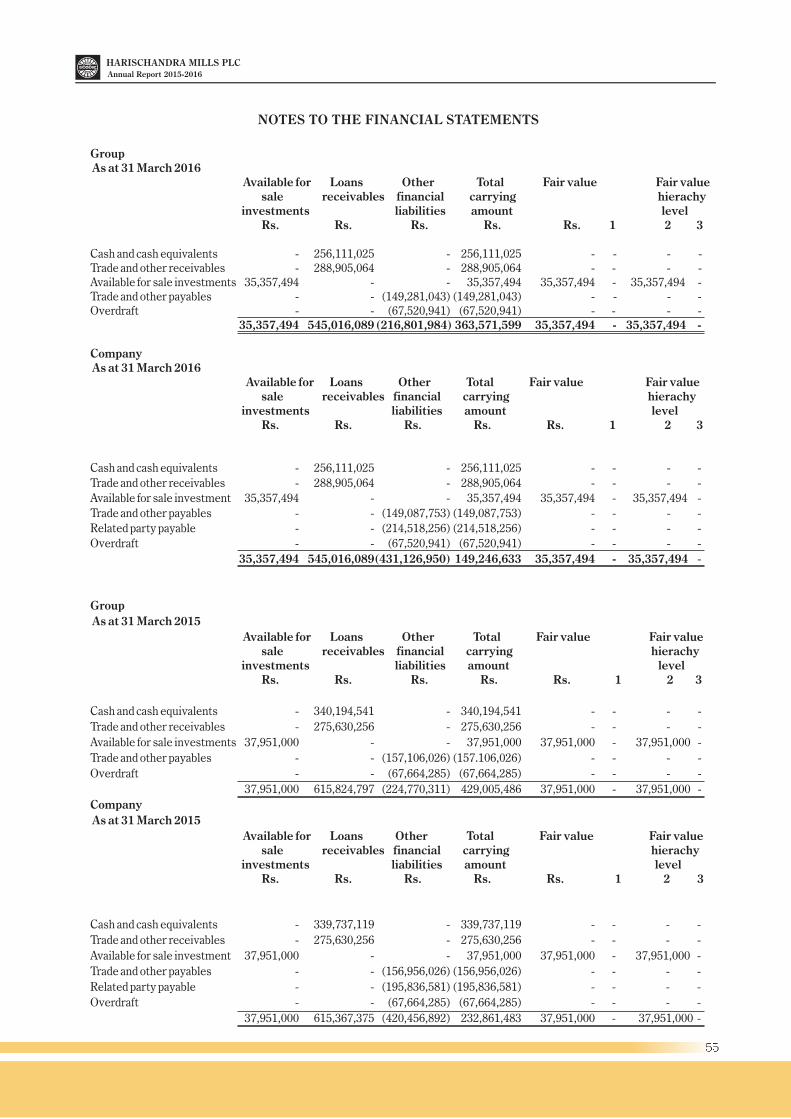
NOTES TO THE FINANCIAL STATEMENTS
Group As at 31 March 2016 Available for Loans Other Total Fair value Fair value
sale receivables financial carrying hierachy investments liabilities amount level Rs. Rs. Rs. Rs. Rs. 1 2 3
Cash and cash equivalents - 256,111,025 - 256,111,025 - - - -Trade and other receivables - 288,905,064 - 288,905,064 - - - -Available for sale investments 35,357,494 - - 35,357,494 35,357,494 - 35,357,494 -Trade and other payables - - (149,281,043) (149,281,043) - - - -Overdraft - - (67,520,941) (67,520,941) - - - -
35,357,494 545,016,089 (216,801,984) 363,571,599 35,357,494 - 35,357,494 -
Company As at 31 March 2016 Available for Loans Other Total Fair value Fair value
sale receivables financial carrying hierachy investments liabilities amount level Rs. Rs. Rs. Rs. Rs. 1 2 3
Cash and cash equivalents - 256,111,025 - 256,111,025 - - - -
Trade and other receivables - 288,905,064 - 288,905,064 - - - -
Available for sale investment 35,357,494 - - 35,357,494 35,357,494 - 35,357,494 -
Trade and other payables - - (149,087,753) (149,087,753) - - - -
Related party payable - - (214,518,256) (214,518,256) - - - -
Overdraft - - (67,520,941) (67,520,941) - - - -
35,357,494 545,016,089(431,126,950) 149,246,633 35,357,494 - 35,357,494 -
Group
As at 31 March 2015
Available for Loans Other Total Fair value Fair value sale receivables financial carrying hierachy investments liabilities amount level Rs. Rs. Rs. Rs. Rs. 1 2 3
Cash and cash equivalents - 340,194,541 - 340,194,541 - - - -
Trade and other receivables - 275,630,256 - 275,630,256 - - - -
Available for sale investments 37,951,000 - - 37,951,000 37,951,000 - 37,951,000 -
Trade and other payables - - (157,106,026) (157.106,026) - - - -
Overdraft - - (67,664,285) (67,664,285) - - - -
37,951,000 615,824,797 (224,770,311) 429,005,486 37,951,000 - 37,951,000 -
Company
As at 31 March 2015
Available for Loans Other Total Fair value Fair value sale receivables financial carrying hierachy investments liabilities amount level Rs. Rs. Rs. Rs. Rs. 1 2 3
Cash and cash equivalents - 339,737,119 - 339,737,119 - - - -
Trade and other receivables - 275,630,256 - 275,630,256 - - - -
Available for sale investment 37,951,000 - - 37,951,000 37,951,000 - 37,951,000 -
Trade and other payables - - (156,956,026) (156,956,026) - - - -
Related party payable - - (195,836,581) (195,836,581) - - - -
Overdraft - - (67,664,285) (67,664,285) - - - -
37,951,000 615,367,375 (420,456,892) 232,861,483 37,951,000 - 37,951,000 -
55
Annual Report 2015-2016
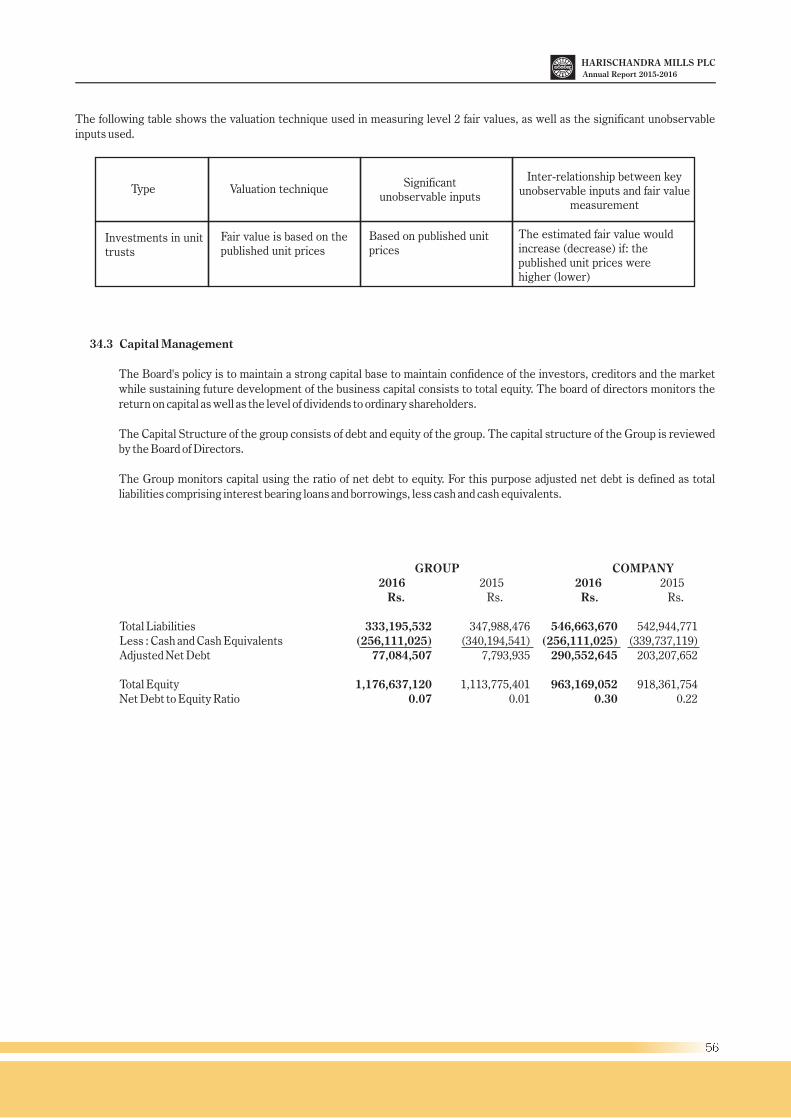
The following table shows the valuation technique used in measuring level 2 fair values, as well as the significant unobservable
inputs used.
34.3 Capital Management
The Board's policy is to maintain a strong capital base to maintain confidence of the investors, creditors and the market
while sustaining future development of the business capital consists to total equity. The board of directors monitors the
return on capital as well as the level of dividends to ordinary shareholders.
The Capital Structure of the group consists of debt and equity of the group. The capital structure of the Group is reviewed
by the Board of Directors.
The Group monitors capital using the ratio of net debt to equity. For this purpose adjusted net debt is defined as total
liabilities comprising interest bearing loans and borrowings, less cash and cash equivalents.
GROUP COMPANY2016 2015 2016 2015
Rs. Rs. Rs. Rs.
Total Liabilities 333,195,532 347,988,476 546,663,670 542,944,771Less : Cash and Cash Equivalents (256,111,025) (340,194,541) (256,111,025) (339,737,119)Adjusted Net Debt 77,084,507 7,793,935 290,552,645 203,207,652
Total Equity 1,176,637,120 1,113,775,401 963,169,052 918,361,754Net Debt to Equity Ratio 0.07 0.01 0.30 0.22
The estimated fair value would increase (decrease) if: the published unit prices were higher (lower)
Type Valuation technique Significant
unobservable inputs
Inter-relationship between key unobservable inputs and fair value
measurement
Investments in unit trusts
Fair value is based on the published unit prices
Based on published unit prices
56
Annual Report 2015-2016
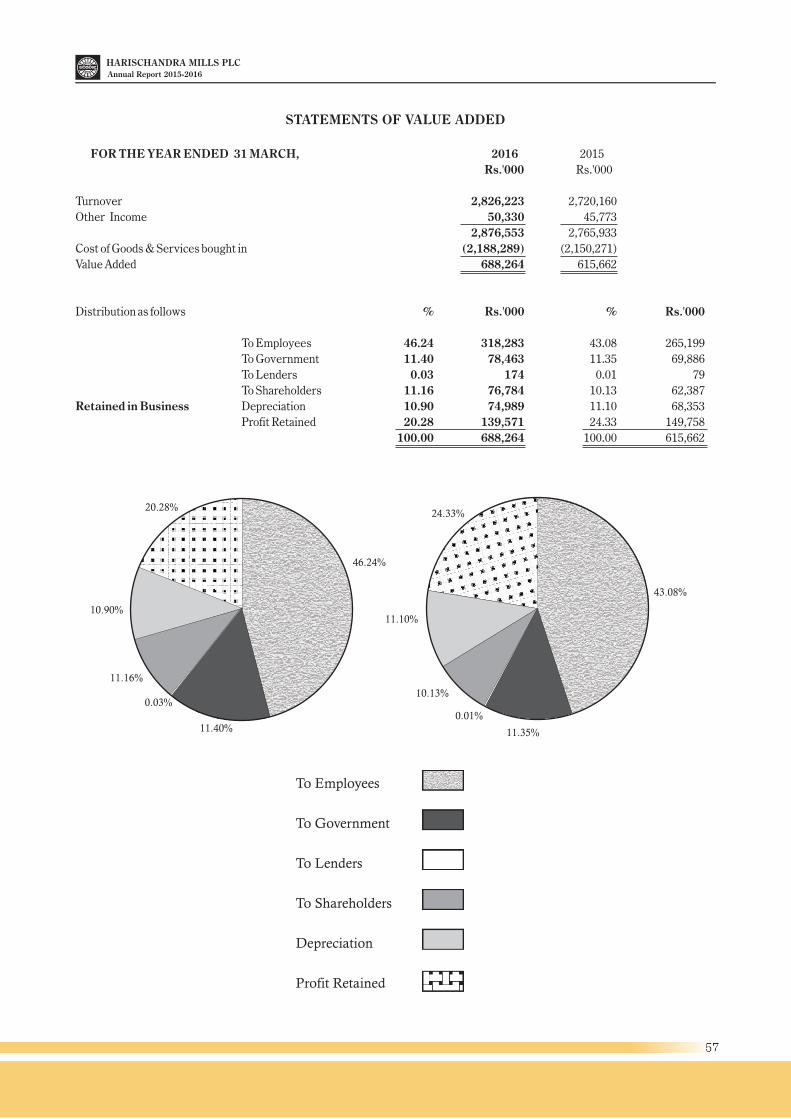
STATEMENTS OF VALUE ADDED
FOR THE YEAR ENDED 31 MARCH, 2016 2015
Rs.'000 Rs.'000
Turnover 2,826,223 2,720,160
Other Income 50,330 45,773
2,876,553 2,765,933
Cost of Goods & Services bought in (2,188,289) (2,150,271)
Value Added 688,264 615,662
Distribution as follows % Rs.'000 % Rs.'000
To Employees 46.24 318,283 43.08 265,199
To Government 11.40 78,463 11.35 69,886
To Lenders 0.03 174 0.01 79
To Shareholders 11.16 76,784 10.13 62,387
Retained in Business Depreciation 10.90 74,989 11.10 68,353
Profit Retained 20.28 139,571 24.33 149,758
100.00 688,264 100.00 615,662
To Employees
To Government
To Lenders
To Shareholders
Depreciation
Profit Retained
57
Annual Report 2015-2016
46.24%
20.28%
10.90%
11.16%
0.03%
11.40%
43.08%
24.33%
11.10%
10.13%
0.01%
11.35%
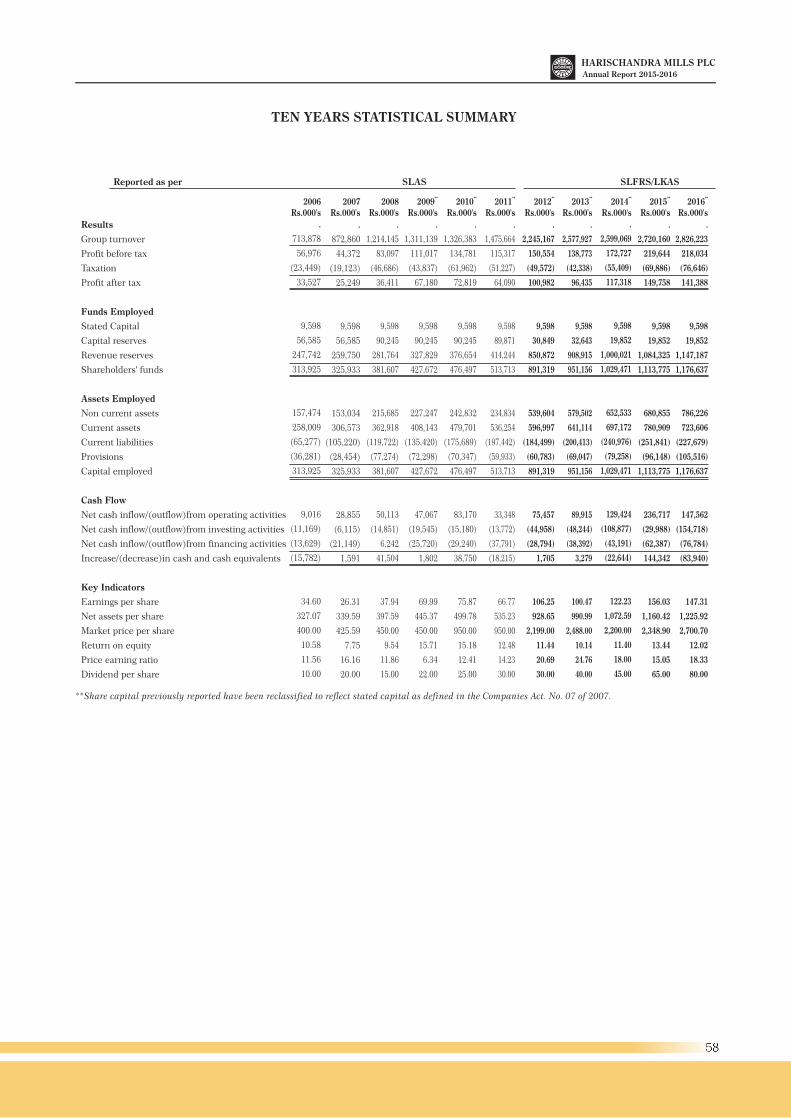
58
TEN YEARS STATISTICAL SUMMARY
Results
Group turnover
Profit before tax
Taxation
Profit after tax
Funds Employed
Stated Capital
Capital reserves
Revenue reserves
Shareholders' funds
Assets Employed
Non current assets
Current assets
Current liabilities
Provisions
Capital employed
Cash Flow
Net cash inflow/(outflow)from operating activities
Net cash inflow/(outflow)from investing activities
Net cash inflow/(outflow)from financing activities
Increase/(decrease)in cash and cash equivalents
Key Indicators
Earnings per share
Net assets per share
Market price per share
Return on equity
Price earning ratio
Dividend per share
.
,
713,878
56,976
(23 449)
33,527
9,598
56,585
247,742
313,925
157,474
258,009
(65,277)
(36,281)
313,925
9,016
(11,169)
(13,629)
(15,782)
34.60
327.07
400.00
10.58
11.56
10.00
.
872,860
44,372
(19,123)
25,249
9,598
56,585
259,750
325,933
153,034
306,573
(105,220)
(28,454)
325,933
28,855
(6,115)
(21,149)
1,591
26.31
339.59
425.59
7.75
16.16
20.00
.
1,214,145
83,097
(46,686)
36,411
9,598
90,245
281,764
381,607
215,685
362,918
(119,722)
(77,274)
381,607
50,113
(14,851)
6,242
41,504
37.94
397.59
450.00
9.54
11.86
15.00
.
1,311,139
111,017
(43,837)
67,180
9,598
90,245
327,829
427,672
227,247
408,143
(135,420)
(72,298)
427,672
47,067
(19,545)
(25,720)
1,802
69.99
445.37
450.00
15.71
6.34
22.00
.
1,326,383
134,781
(61,962)
72,819
9,598
90,245
376,654
476,497
242,832
479,701
(175,689)
(70,347)
476,497
83,170
(15,180)
(29,240)
38,750
75.87
499.78
950.00
15.18
12.41
25.00
.
1,475,664
115,317
(51,227)
64,090
9,598
89,871
414,244
513,713
234,834
536,254
(197,442)
(59,933)
513,713
33,348
(13,772)
(37,791)
(18,215)
66.77
535.23
950.00
12.48
14.23
30.00
.
2,245,167
150,554
(49,572)
100,982
9,598
30,849
850,872
891,319
539,604
596,997
(184,499)
(60,783)
891,319
75,457
(44,958)
(28,794)
1,705
106.25
928.65
2,199.00
11.44
20.69
30.00
.
2,577,927
138,773
(42,338)
96,435
9,598
32,643
908,915
951,156
579,502
641,114
(200,413)
(69,047)
951,156
89,915
(48,244)
(38,392)
3,279
100.47
990.99
2,488.00
10.14
24.76
40.00
.
2,720,160
219,644
(69,886)
149,758
9,598
19,852
1,084,325
1,113,775
680,855
780,909
(251,841)
(96,148)
1,113,775
236,717
(29,988)
(62,387)
144,342
156.03
1,160.42
2,348.90
13.44
15.05
65.00
.
2,826,223
218,034
(76,646)
141,388
9,598
19,852
1,147,187
1,176,637
786,226
723,606
(227,679)
(105,516)
1,176,637
147,562
(154,718)
(76,784)
(83,940)
147.31
1,225.92
2,700.70
12.02
18.33
80.00
.
2,599,069
172,727
(55,409)
117,318
9,598
19,852
1,000,021
1,029,471
652,533
697,172
(240,976)
(79,258)
1,029,471
129,424
(108,877)
(43,191)
(22,644)
122.23
1,072.59
2,200.00
11.40
18.00
45.00
2007Rs.000's
**2009Rs.000's
**2011Rs.000's
**2013Rs.000's
**2015Rs.000's
**2016Rs.000's
**2014Rs.000's
**2012Rs.000's
**2010Rs.000's
2008Rs.000's
2006Rs.000's
Reported as per SLAS SLFRS/LKAS
**Share capital previously reported have been reclassified to reflect stated capital as defined in the Companies Act. No. 07 of 2007.
Annual Report 2015-2016
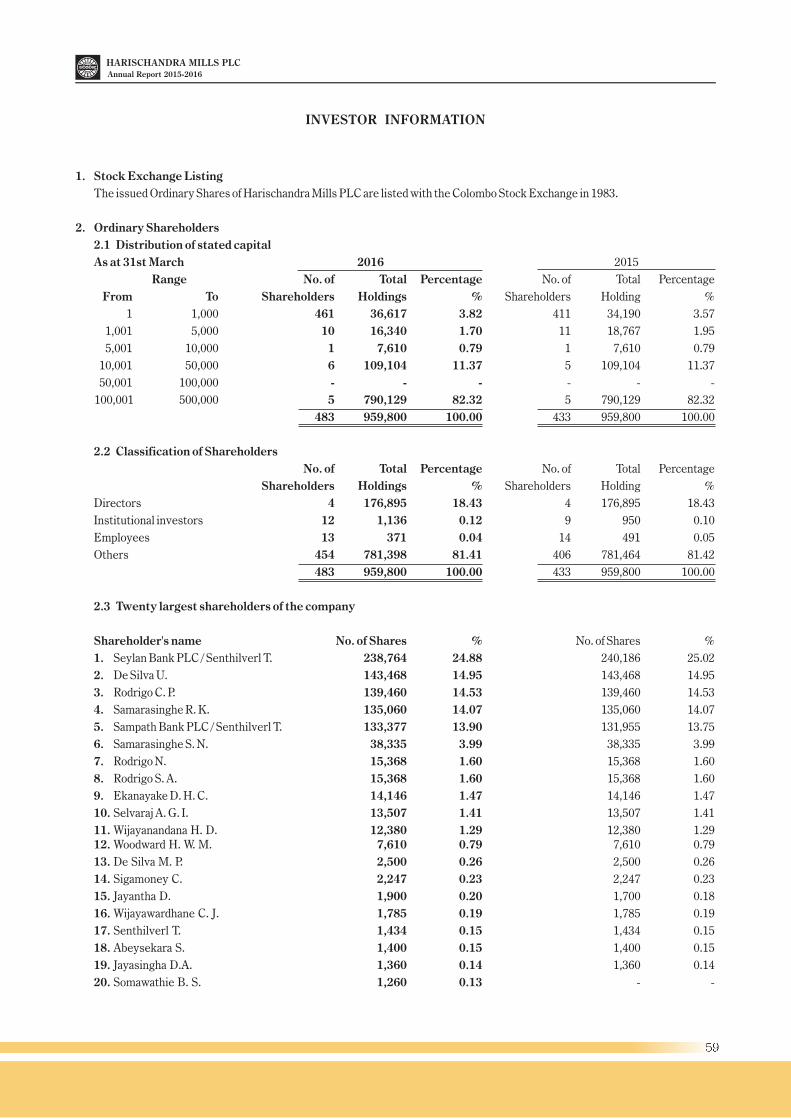
INVESTOR INFORMATION
1. Stock Exchange Listing
The issued Ordinary Shares of Harischandra Mills PLC are listed with the Colombo Stock Exchange in 1983.
2. Ordinary Shareholders
2.1 Distribution of stated capital
As at 31st March 2016 2015
Range No. of Total Percentage No. of Total Percentage
From To Shareholders Holdings % Shareholders Holding %
1 1,000 461 36,617 3.82 411 34,190 3.57
1,001 5,000 10 16,340 1.70 11 18,767 1.95
5,001 10,000 1 7,610 0.79 1 7,610 0.79
10,001 50,000 6 109,104 11.37 5 109,104 11.37
50,001 100,000 - - - - - -
100,001 500,000 5 790,129 82.32 5 790,129 82.32
483 959,800 100.00 433 959,800 100.00
2.2 Classification of Shareholders
No. of Total Percentage No. of Total Percentage
Shareholders Holdings % Shareholders Holding %
Directors 4 176,895 18.43 4 176,895 18.43
Institutional investors 12 1,136 0.12 9 950 0.10
Employees 13 371 0.04 14 491 0.05
Others 454 781,398 81.41 406 781,464 81.42
483 959,800 100.00 433 959,800 100.00
2.3 Twenty largest shareholders of the company
Shareholder's name No. of Shares % No. of Shares %
1. Seylan Bank PLC / Senthilverl T. 238,764 24.88 240,186 25.02
2. De Silva U. 143,468 14.95 143,468 14.95
3. Rodrigo C. P. 139,460 14.53 139,460 14.53
4. Samarasinghe R. K. 135,060 14.07 135,060 14.07
5. Sampath Bank PLC / Senthilverl T. 133,377 13.90 131,955 13.75
6. Samarasinghe S. N. 38,335 3.99 38,335 3.99
7. Rodrigo N. 15,368 1.60 15,368 1.60
8. Rodrigo S. A. 15,368 1.60 15,368 1.60
9. Ekanayake D. H. C. 14,146 1.47 14,146 1.47
10. Selvaraj A. G. I. 13,507 1.41 13,507 1.41
11. Wijayanandana H. D. 12,380 1.29 12,380 1.29 12. Woodward H. W. M. 7,610 0.79 7,610 0.79
13. De Silva M. P. 2,500 0.26 2,500 0.26
14. Sigamoney C. 2,247 0.23 2,247 0.23
15. Jayantha D. 1,900 0.20 1,700 0.18
16. Wijayawardhane C. J. 1,785 0.19 1,785 0.19
17. Senthilverl T. 1,434 0.15 1,434 0.15
18. Abeysekara S. 1,400 0.15 1,400 0.15
19. Jayasingha D.A. 1,360 0.14 1,360 0.14
20. Somawathie B. S. 1,260 0.13 - -
59
Annual Report 2015-2016
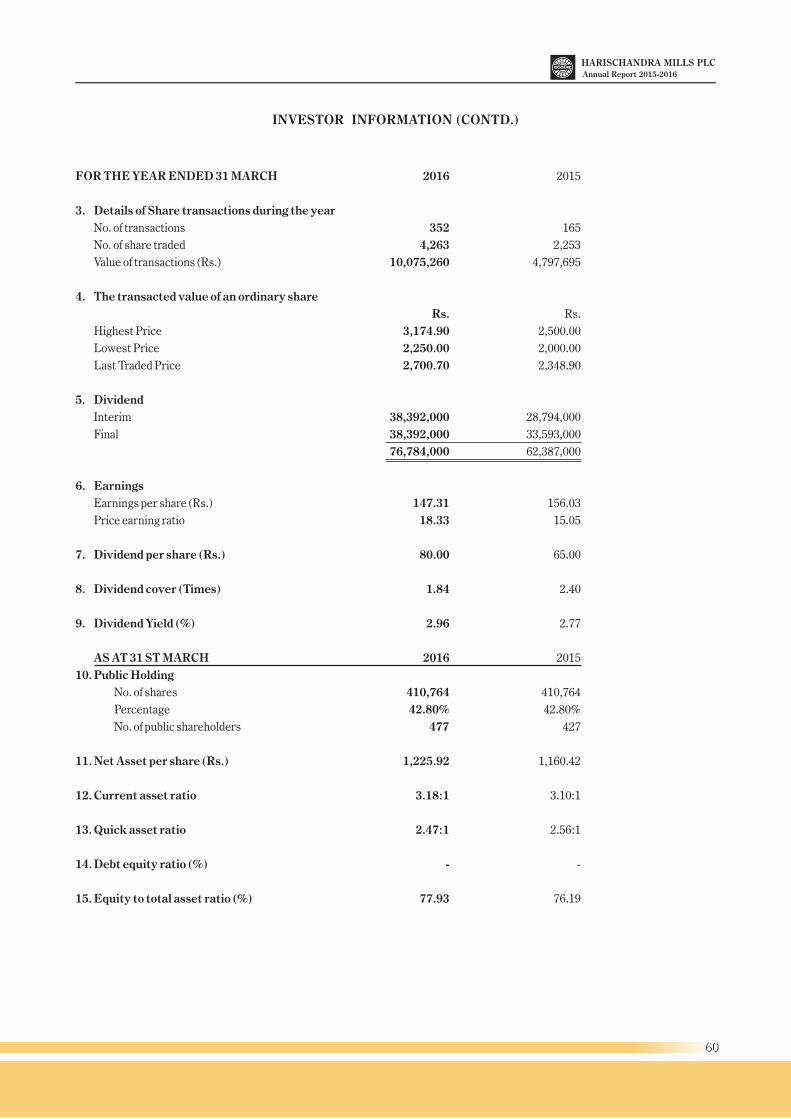
INVESTOR INFORMATION (CONTD.)
FOR THE YEAR ENDED 31 MARCH 2016 2015
3. Details of Share transactions during the year
No. of transactions 352 165
No. of share traded 4,263 2,253
Value of transactions (Rs.) 10,075,260 4,797,695
4. The transacted value of an ordinary share
Rs. Rs.
Highest Price 3,174.90 2,500.00
Lowest Price 2,250.00 2,000.00
Last Traded Price 2,700.70 2,348.90
5. Dividend
Interim 38,392,000 28,794,000
Final 38,392,000 33,593,000
76,784,000 62,387,000
6. Earnings
Earnings per share (Rs.) 147.31 156.03
Price earning ratio 18.33 15.05
7. Dividend per share (Rs.) 80.00 65.00
8. Dividend cover (Times) 1.84 2.40
9. Dividend Yield (%) 2.96 2.77
AS AT 31 ST MARCH 2016 2015
10. Public Holding
No. of shares 410,764 410,764
Percentage 42.80% 42.80%
No. of public shareholders 477 427
11. Net Asset per share (Rs.) 1,225.92 1,160.42
12. Current asset ratio 3.18:1 3.10:1
13. Quick asset ratio 2.47:1 2.56:1
14. Debt equity ratio (%) - -
15. Equity to total asset ratio (%) 77.93 76.19
60
Annual Report 2015-2016


![Manasata Damu Wilangu Galawima - මනසට දැමූ විලංගු ගැලවීම - Harischandra Wijethunga - [ මහාකළුසිංහලයෝ ]](https://img.pdfslide.net/doc/110x75/557213ad497959fc0b92c86f/manasata-damu-wilangu-galawima-.jpg)