Embed Size (px)
Citation preview
Andre de Mezerville
Craig Domagala
Sonya Frederick
Eddie Stanislawski
Darrick Wesson
James Wood
GROUP TWO
Corporate History
Strategic Overview
Internal Analysis
External Analysis
Strategic Recommendations
Sustainable Competitive Advantage
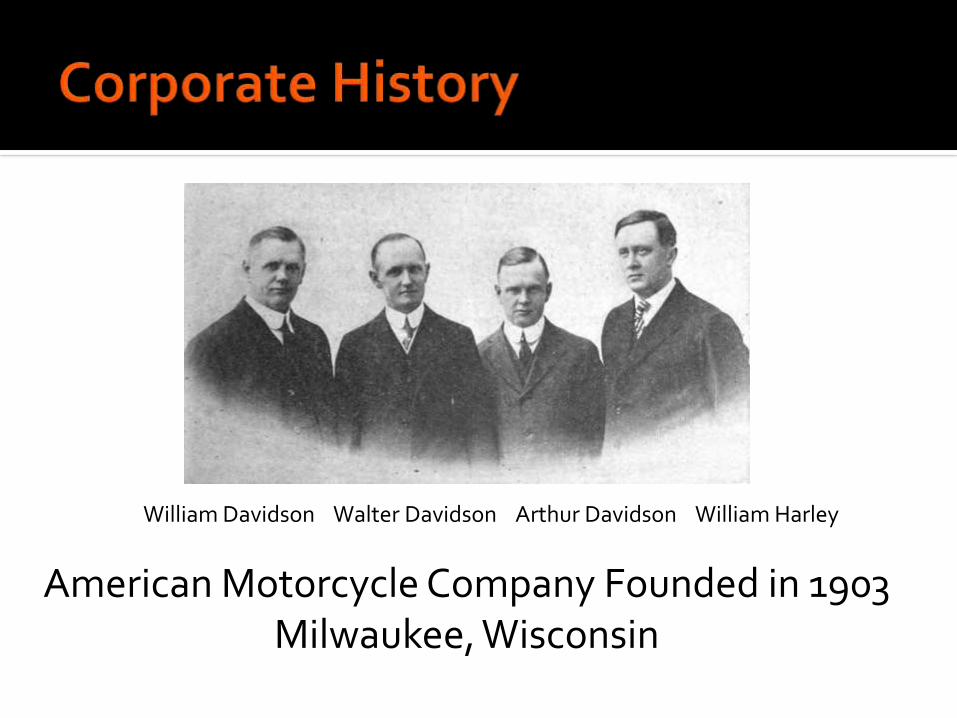
William Davidson Walter Davidson Arthur Davidson William Harley
American Motorcycle Company Founded in 1903Milwaukee, Wisconsin
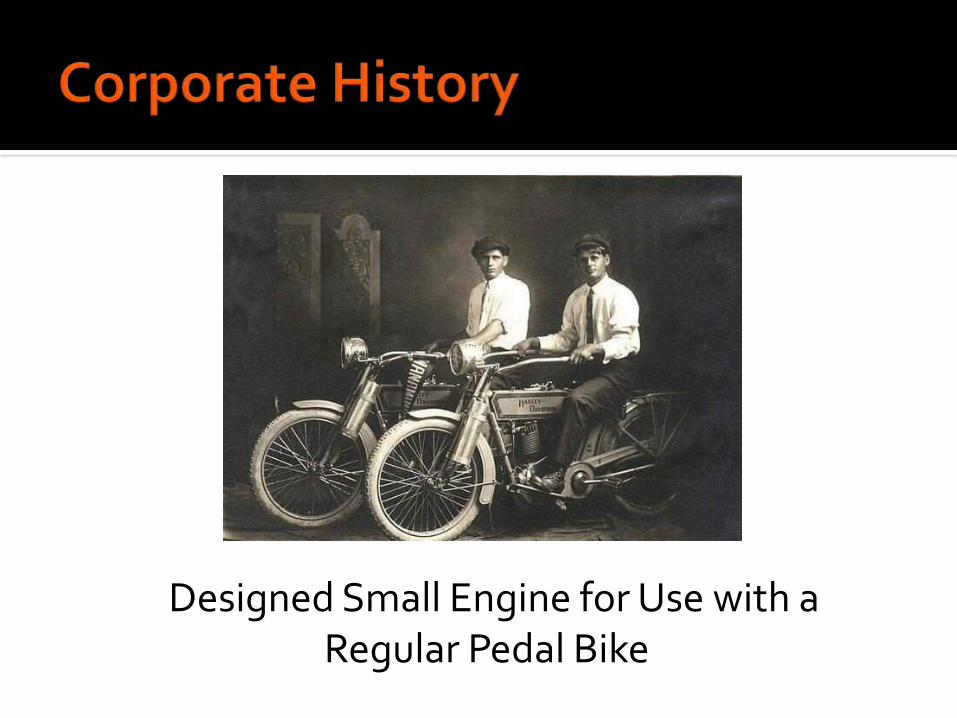
Designed Small Engine for Use with a Regular Pedal Bike
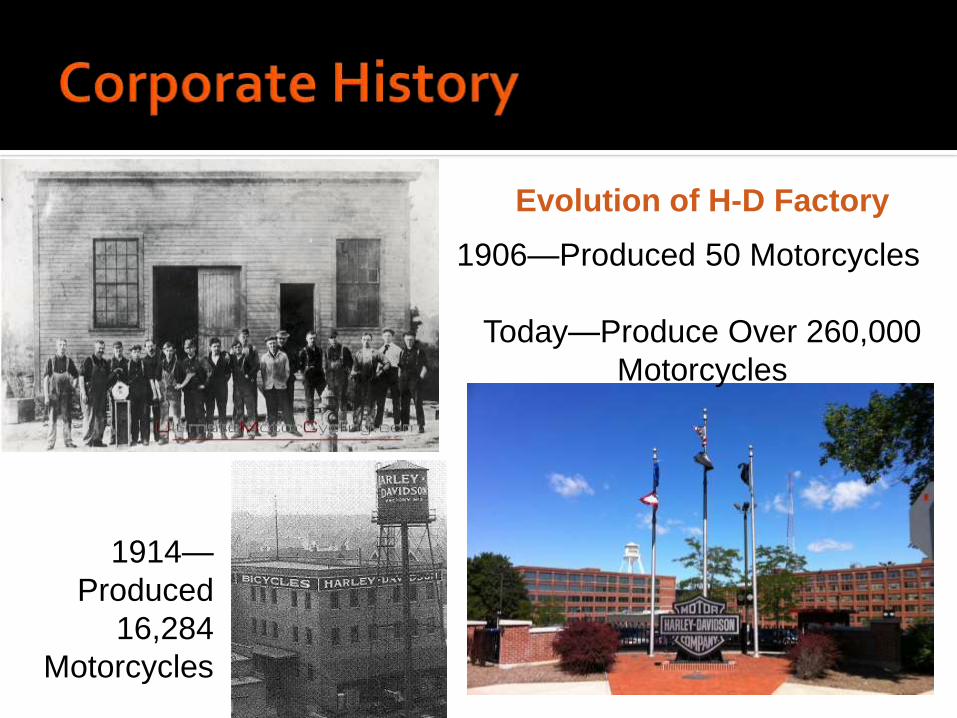
Evolution of H-D Factory
1906—Produced 50 Motorcycles
Today—Produce Over 260,000
Motorcycles
1914—
Produced
16,284
Motorcycles
1907
The Harley-Davidson Motor Company Incorporated
1909
Developed First V-Twin Powered Motorcycle
1910
Introduced Bar & Shield Logo
Dealer Network of 200+ in United States
1920’s
Officially Largest Motorcycle Manufacturer in World
2,000 Dealers in 67 Countries
1953
H-D Sole American Manufacturer of Heavyweight Motorcycles When Indian Motorcycle Company Went out of Business
Late 1950’s
Japanese Motorcycle Manufacturers Entered US Market
Late 1960’s
Japanese Motorcycles Grew to 85% of Market Share
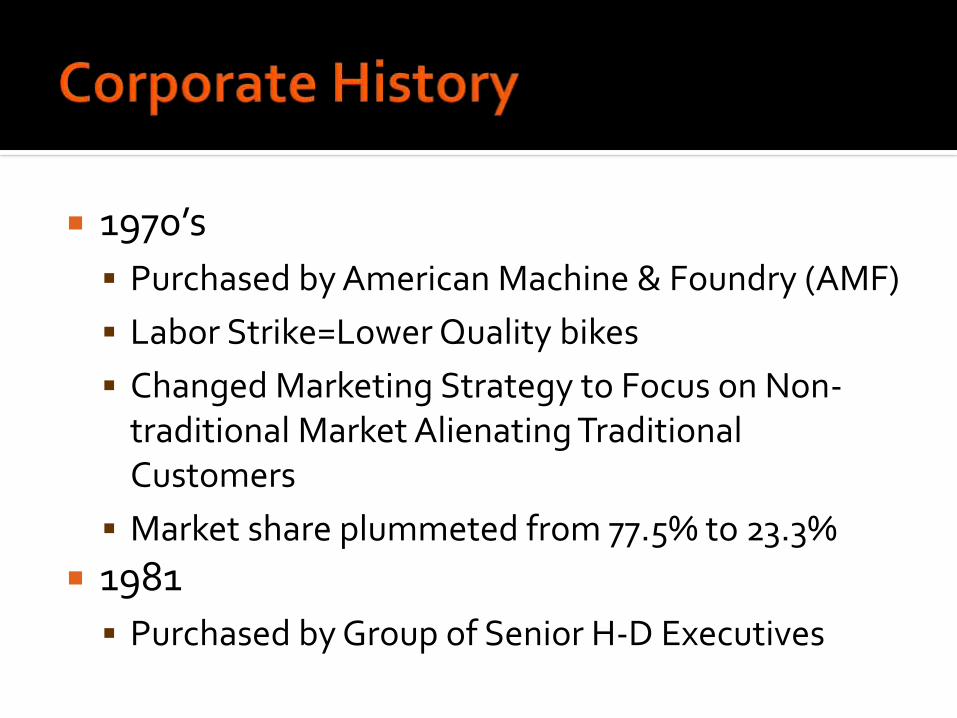
1970’s
Purchased by American Machine & Foundry (AMF)
Labor Strike=Lower Quality bikes
Changed Marketing Strategy to Focus on Non-traditional Market Alienating Traditional Customers
Market share plummeted from 77.5% to 23.3%
1981
Purchased by Group of Senior H-D Executives
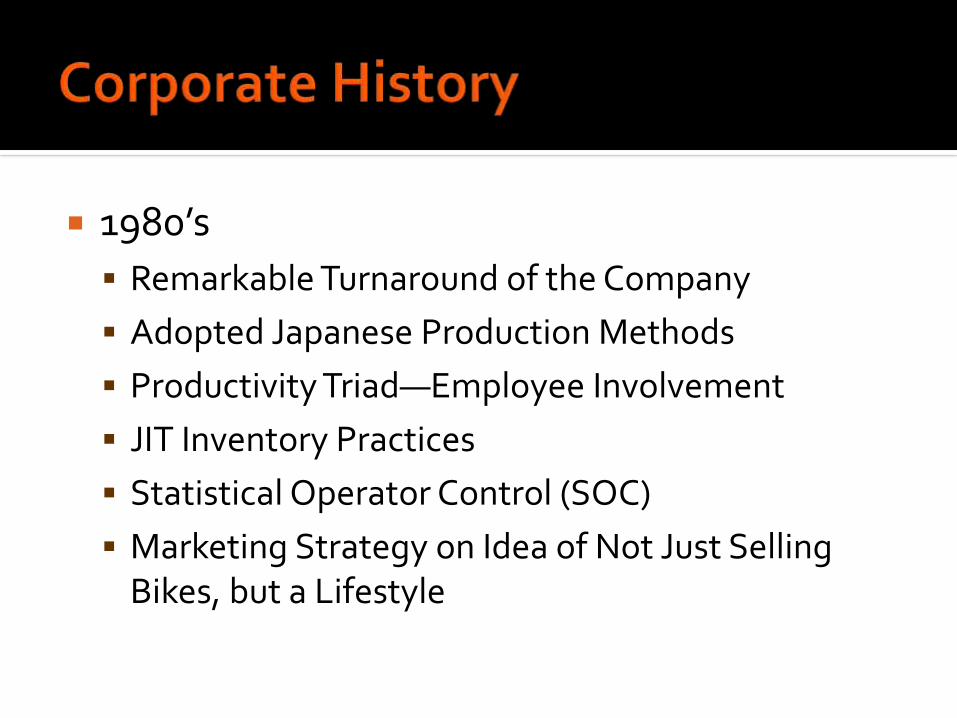
1980’s
Remarkable Turnaround of the Company
Adopted Japanese Production Methods
Productivity Triad—Employee Involvement
JIT Inventory Practices
Statistical Operator Control (SOC)
Marketing Strategy on Idea of Not Just Selling Bikes, but a Lifestyle
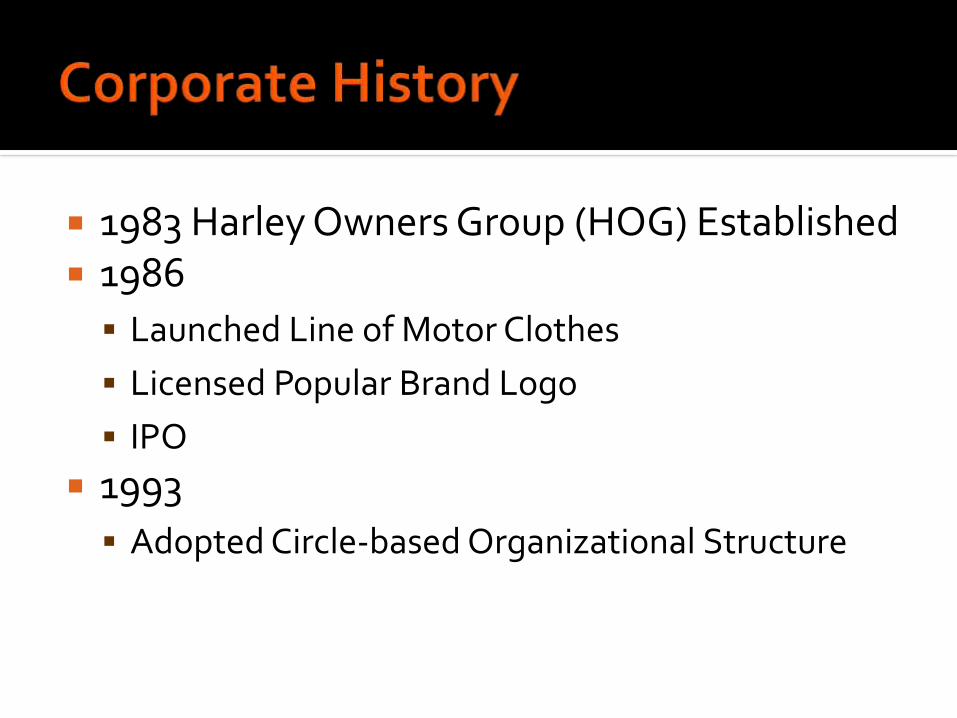
1983 Harley Owners Group (HOG) Established 1986
Launched Line of Motor Clothes
Licensed Popular Brand Logo
IPO
1993
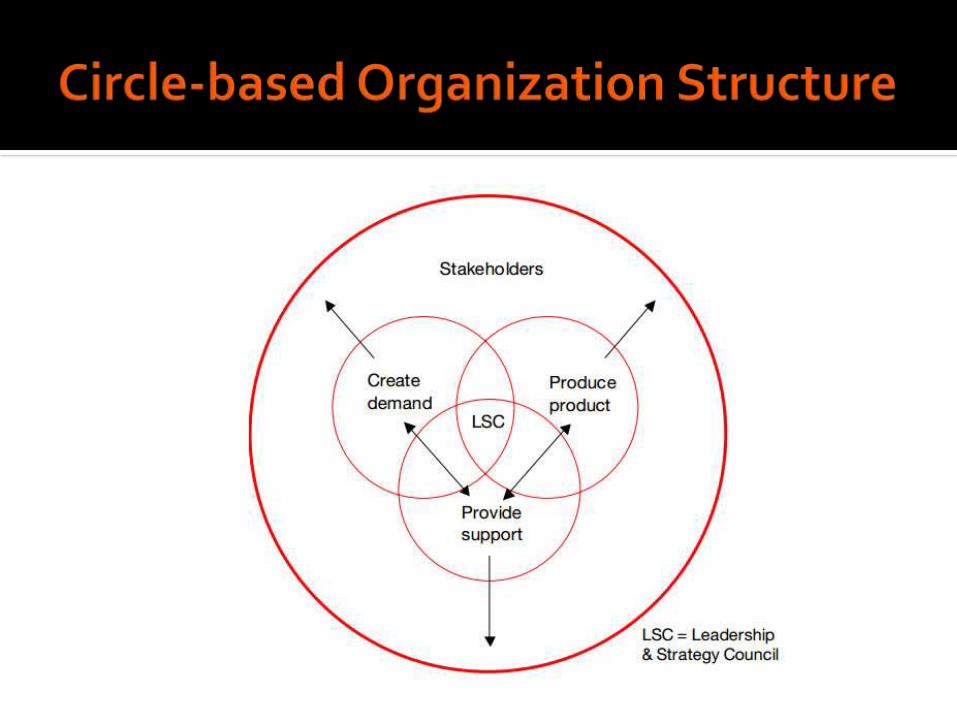
Adopted Circle-based Organizational Structure
1988-1995
Annual Shipments More Than Doubled
1993
Purchased 40% Interest in Buell Motorcycle Co.
1998 Purchased Remaining Interest in Buell 2003 100 Year Anniversary 2008 Purchased MV Agusta Group
Italian Motorcycle Company to Expand Presence in Europe
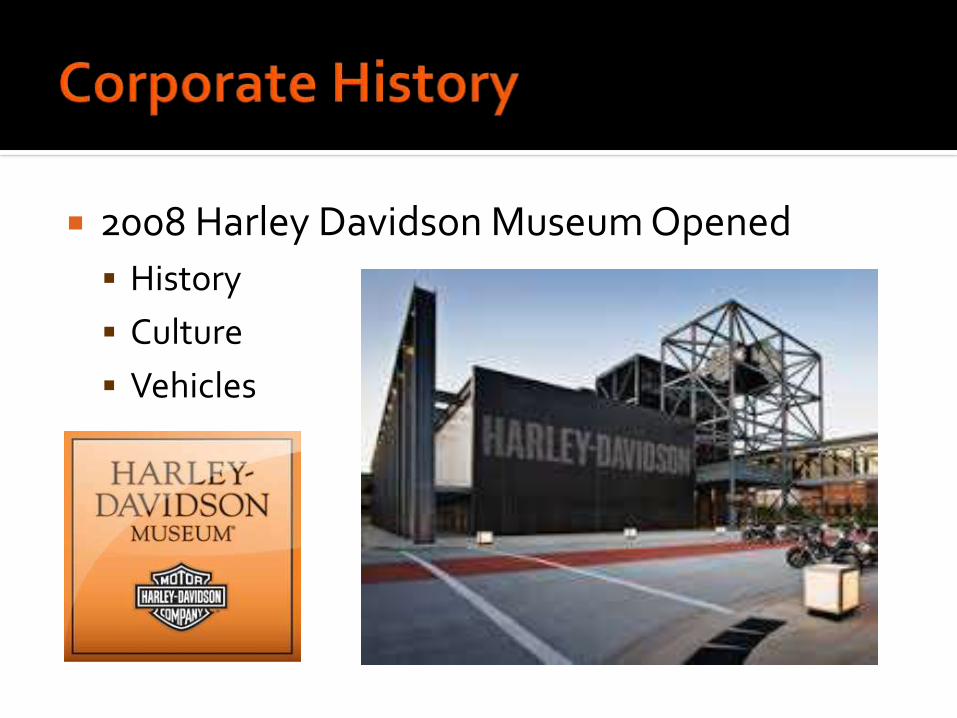
2008 Harley Davidson Museum Opened
History
Culture
Vehicles
2009 {Financial Crisis}
Current CEO Keith Wandell Hired
Introduced “Delivering Results Through Focus” Long-term Business Strategy
▪ Improve Manufacturing, Product Development, Business Operations
Discontinued Buell
2010
Divested MV Agusta
Entered India Market
2013
110th Anniversary Celebration
Biggest Launch of New Motorcycle Models in H-D History
260,839 Motorcycles Sold
Revenue $5.9 Billion ($5.6 Billion 2012)
2014
Stock Price (NYSE: HOG) $69.21 ($10.10 in 2009)
Market Share 54.9%
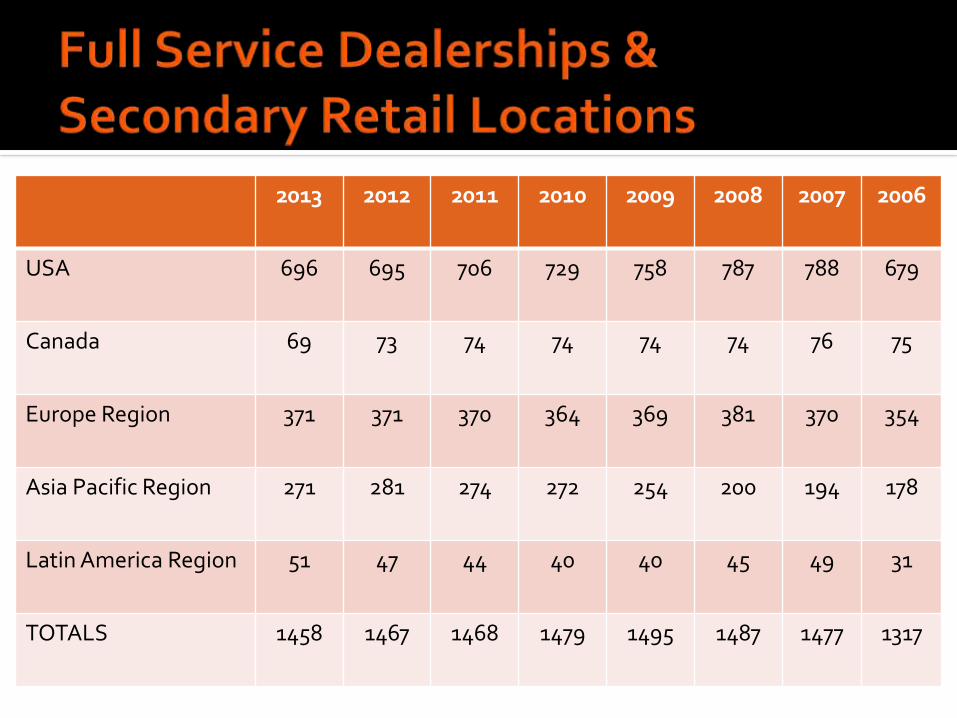
2013 2012 2011 2010 2009 2008 2007 2006
USA 696 695 706 729 758 787 788 679
Canada 69 73 74 74 74 74 76 75
Europe Region 371 371 370 364 369 381 370 354
Asia Pacific Region 271 281 274 272 254 200 194 178
Latin America Region 51 47 44 40 40 45 49 31
TOTALS 1458 1467 1468 1479 1495 1487 1477 1317
Defining Harley Davidson
Corporate MissionTodayFuture
Corporate Culture
Key Result Objectives
Strategic Issues
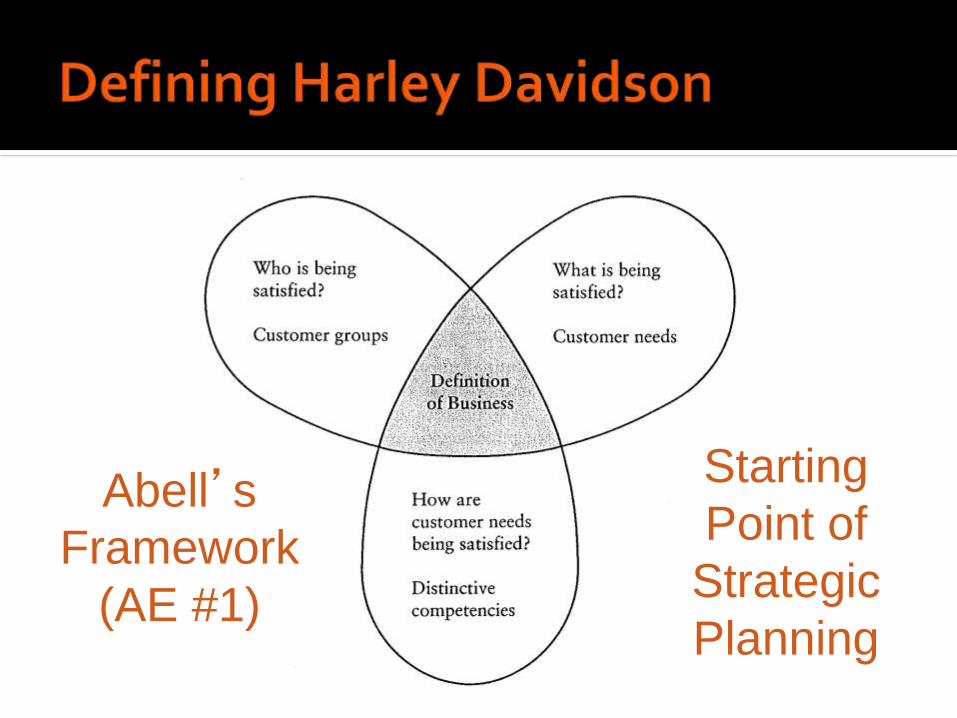
Abell’s
Framework
(AE #1)
Starting
Point of
Strategic
Planning
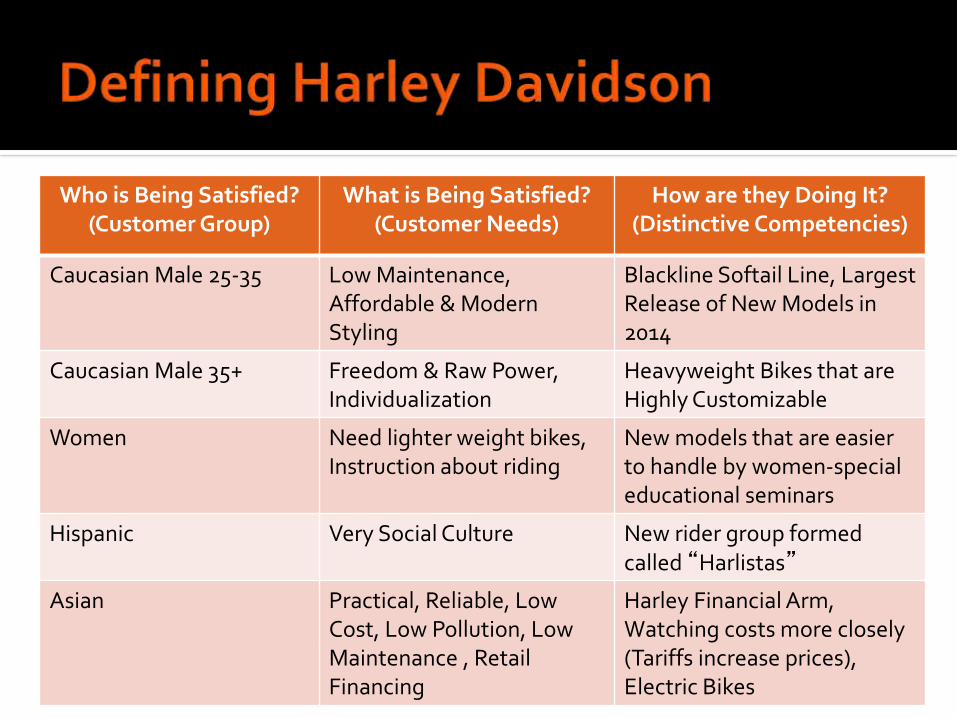
Who is Being Satisfied? (Customer Group)
What is Being Satisfied?(Customer Needs)
How are they Doing It?(Distinctive Competencies)
Caucasian Male 25-35 Low Maintenance, Affordable & Modern Styling
Blackline Softail Line, Largest Release of New Models in 2014
Caucasian Male 35+ Freedom & Raw Power, Individualization
Heavyweight Bikes that are Highly Customizable
Women Need lighter weight bikes, Instruction about riding
New models that are easier to handle by women-special educational seminars
Hispanic Very Social Culture New rider group formed called “Harlistas”
Asian Practical, Reliable, Low Cost, Low Pollution, Low Maintenance , Retail Financing
Harley Financial Arm, Watching costs more closely (Tariffs increase prices), Electric Bikes
Fulfilling dreams of personal freedom is more than a phrase. It’s our purpose and our
passion. We bring a commitment of exceptional customer experiences to
everything we do—from the innovation of our products to the precision of our
manufacturing—culminating with our strong supplier and dealer networks.
We are Harley Davidson.
At Harley Davidson, we strive to create the most comprehensive line of motorcycles that appeal to all motorcycle enthusiasts, positioning our products as the first choice of every motorcycle buyer regardless of gender, nationality or age to help us become the best motorcycle company in the world and allow us to maintain the largest global market share.
Org
an
izati
on
al V
alu
es/N
orm
s
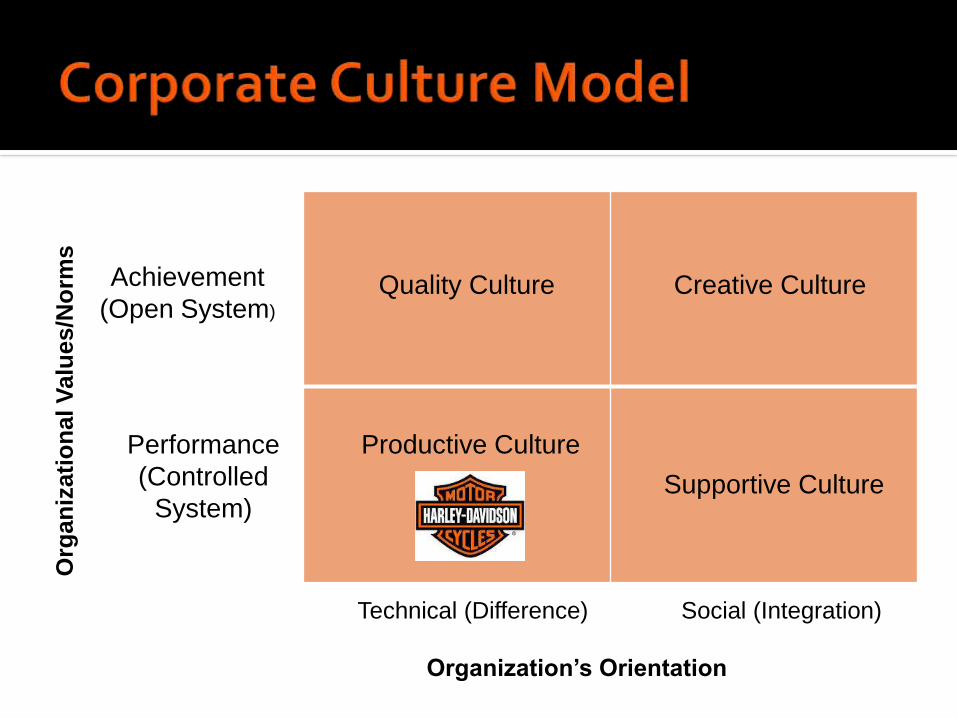
Technical (Difference) Social (Integration)
Organization’s Orientation
Achievement
(Open System)
Performance
(Controlled
System)
Quality Culture Creative Culture
Supportive Culture
Productive Culture
The Harley-Davidson culture reflects the bold, rebellious attitude of our products while providing opportunities for professional growth and leadership development. We demonstrate behaviors throughout our organization that exemplify integrity, accountability, diversity, teamwork and creativity. We also recognize that great companies require great leaders to ensure a sustainable future and strive to build leadership at every level of the company.
Our culture includes a strong customer influence, reminding us that our work is informed by our loyal customers throughout the world – fulfilling their dreams of personal freedom every minute of every day.
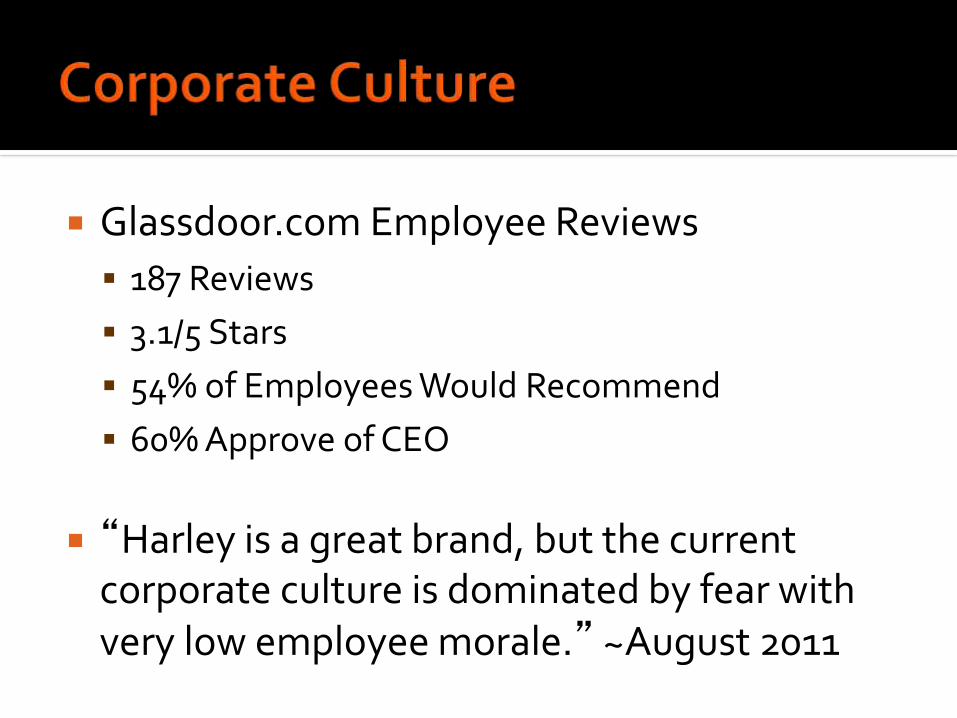
Glassdoor.com Employee Reviews
187 Reviews
3.1/5 Stars
54% of Employees Would Recommend
60% Approve of CEO
“Harley is a great brand, but the current corporate culture is dominated by fear with very low employee morale.” ~August 2011
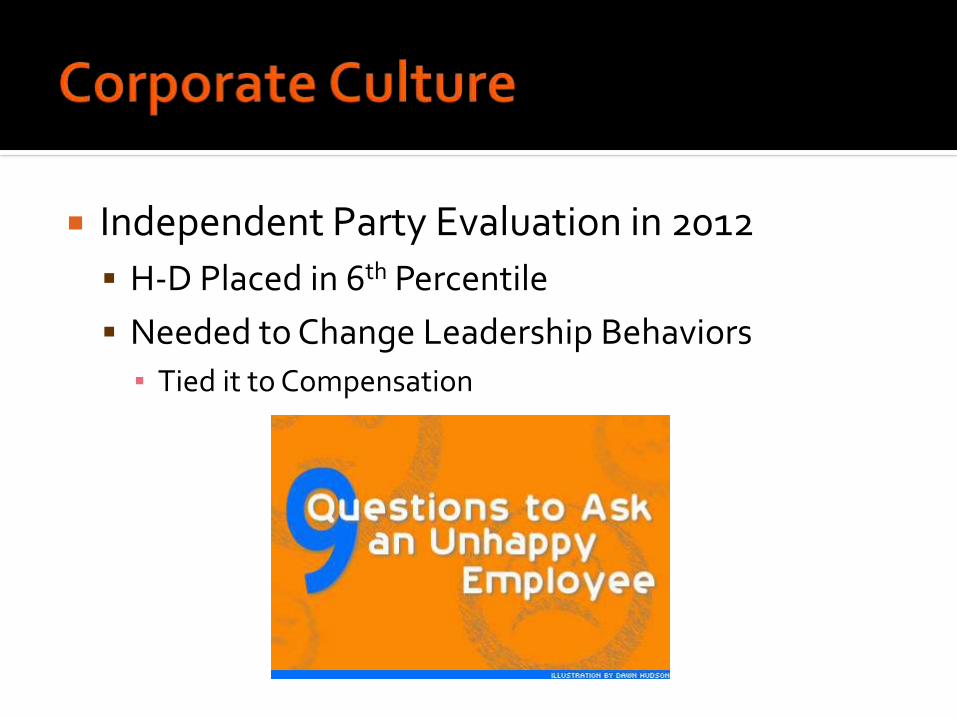
Independent Party Evaluation in 2012
H-D Placed in 6th Percentile
Needed to Change Leadership Behaviors
▪ Tied it to Compensation
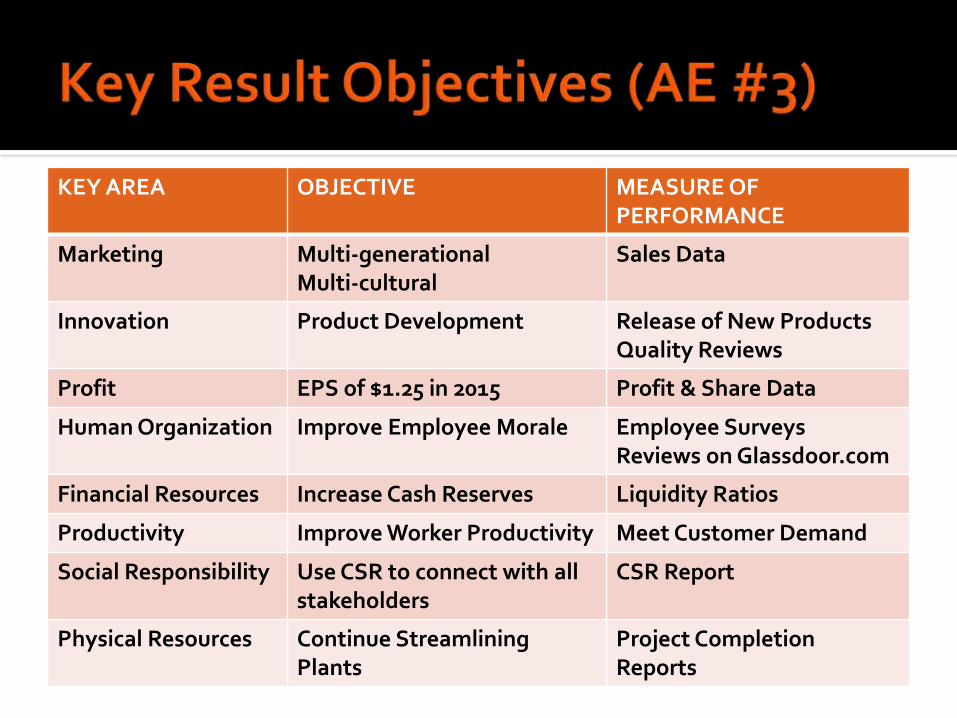
KEY AREA OBJECTIVE MEASURE OF PERFORMANCE
Marketing Multi-generationalMulti-cultural
Sales Data
Innovation Product Development Release of New ProductsQuality Reviews
Profit EPS of $1.25 in 2015 Profit & Share Data
Human Organization Improve Employee Morale Employee SurveysReviews on Glassdoor.com
Financial Resources Increase Cash Reserves Liquidity Ratios
Productivity Improve Worker Productivity Meet Customer Demand
Social Responsibility Use CSR to connect with all stakeholders
CSR Report
Physical Resources Continue Streamlining Plants
Project Completion Reports
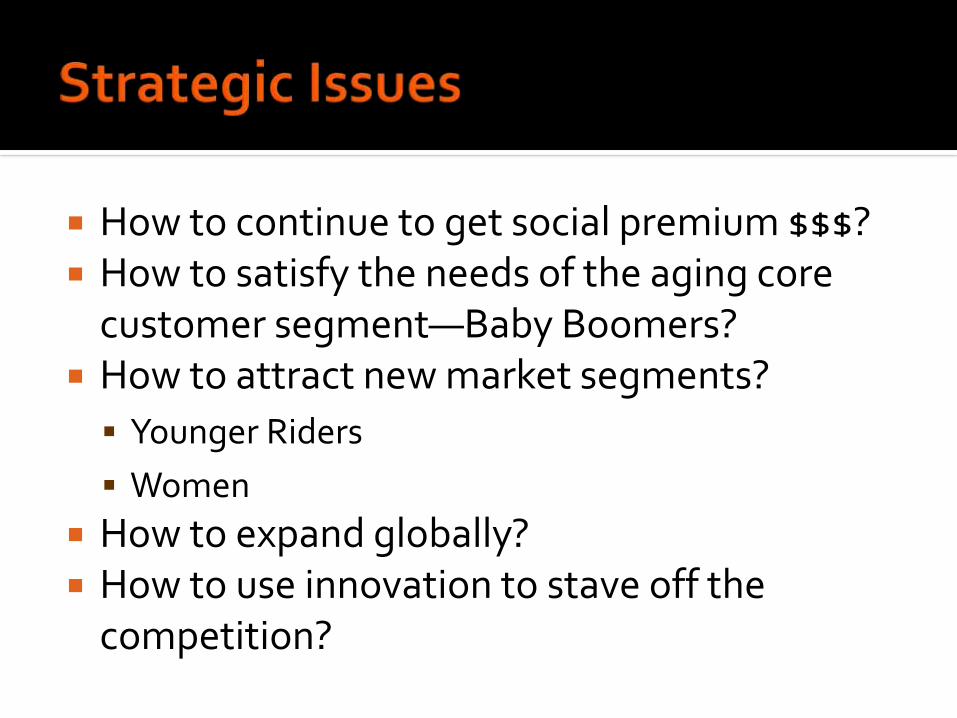
How to continue to get social premium $$$? How to satisfy the needs of the aging core
customer segment—Baby Boomers? How to attract new market segments?
Younger Riders
Women
How to expand globally? How to use innovation to stave off the
competition?
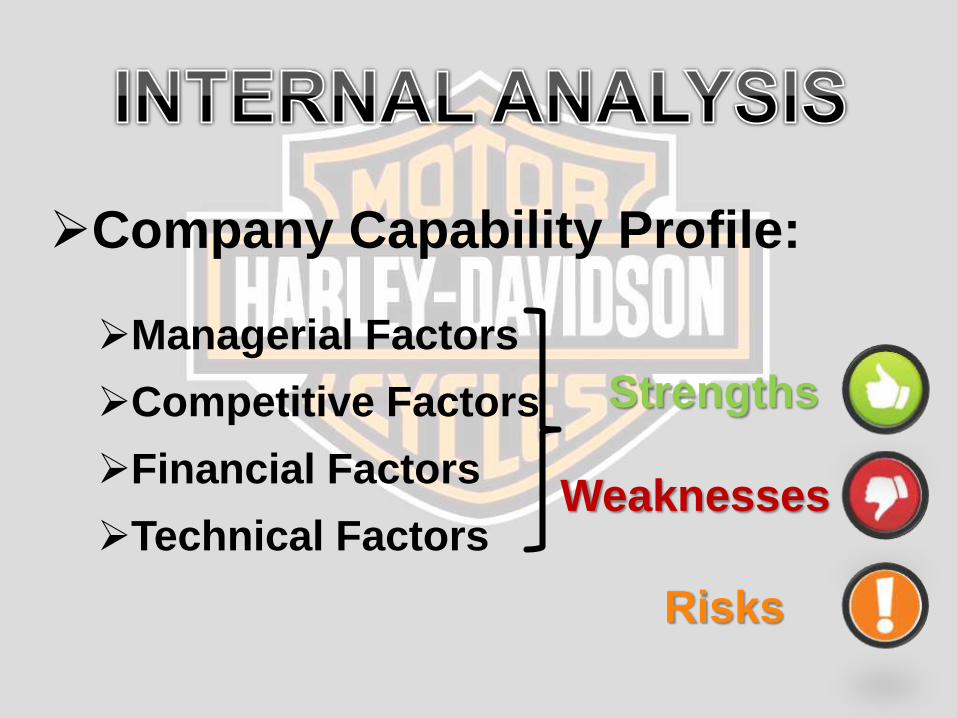
Company Capability Profile:
Managerial Factors
Competitive Factors
Financial Factors
Technical Factors
Strengths
Weaknesses
Risks
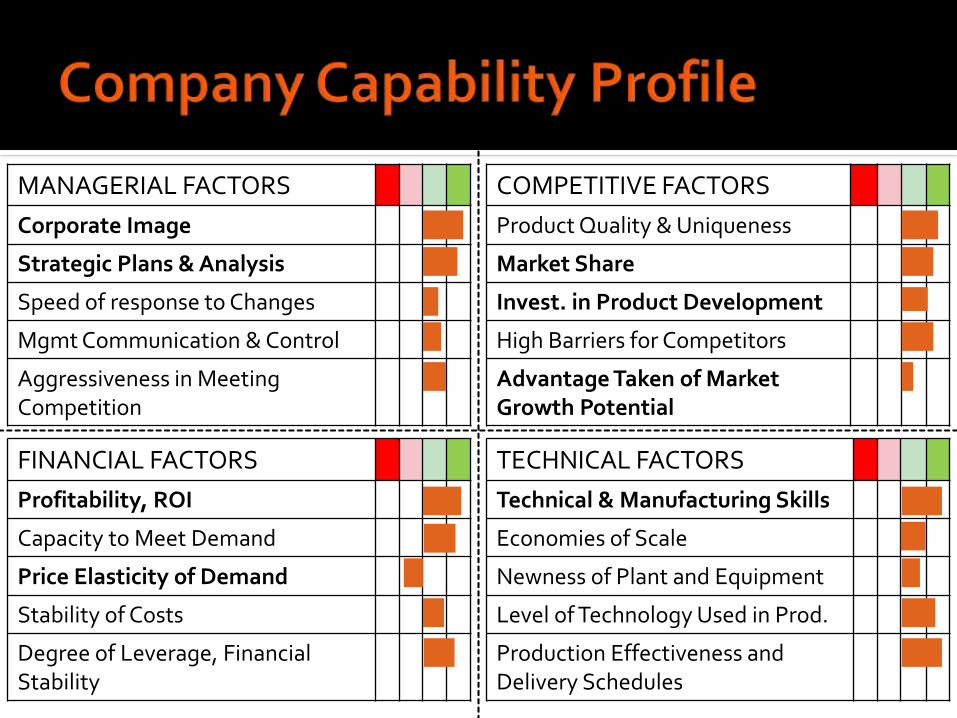
MANAGERIAL FACTORS
Corporate Image
Strategic Plans & Analysis
Speed of response to Changes
Mgmt Communication & Control
Aggressiveness in Meeting Competition
COMPETITIVE FACTORS
Product Quality & Uniqueness
Market Share
Invest. in Product Development
High Barriers for Competitors
Advantage Taken of Market Growth Potential
FINANCIAL FACTORS
Profitability, ROI
Capacity to Meet Demand
Price Elasticity of Demand
Stability of Costs
Degree of Leverage, Financial Stability
TECHNICAL FACTORS
Technical & Manufacturing Skills
Economies of Scale
Newness of Plant and Equipment
Level of Technology Used in Prod.
Production Effectiveness and Delivery Schedules
Corporate Image Cult status▪ Adventure, tradition and power
American Icon▪ Symbol of free-spiritedness and a verve for living life
intensely.
High Quality▪ Responsibility of upholding the qualities that customers
identify as the essence of Harley
Social responsibility▪ Focused on reducing energy use and associated
greenhouse gas emissions in its plants
Use of Strategic Plans and Strategic Analysis Business strategy was focus on:▪ New product development
▪ Global expansion
▪ Demographic outreach
▪ Commitment to core customers
Basic pillars: ▪ growth, continuous improvement, leadership development
and sustainability
Objetive:▪ Increase sales and expand the company's strength as one of
the most customer-centered brands in the world.
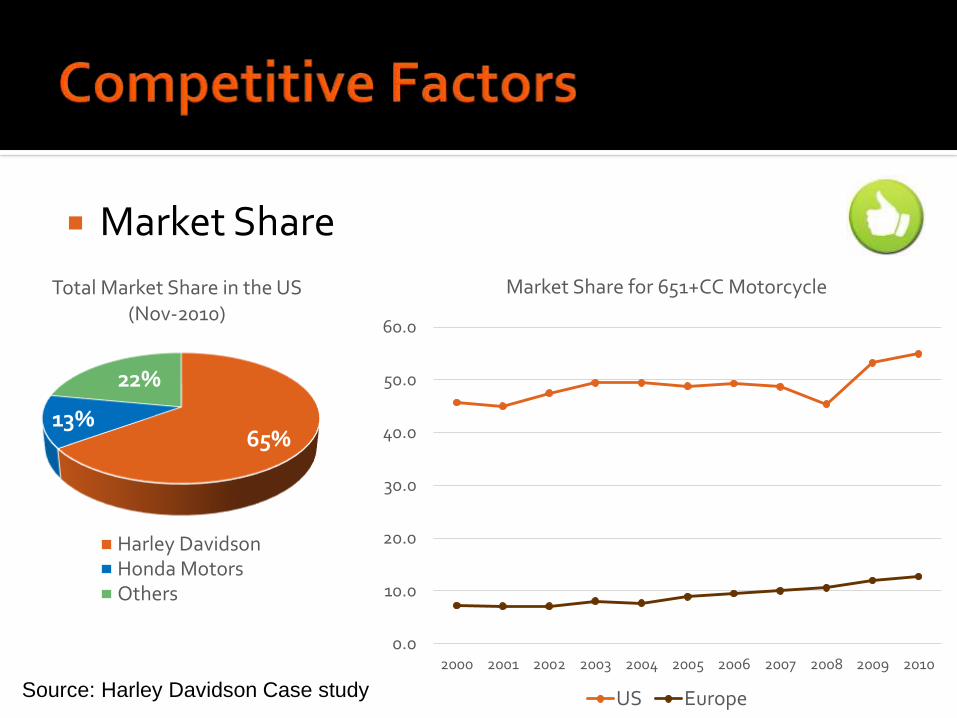
65%13%
22%
Total Market Share in the US (Nov-2010)
Harley DavidsonHonda MotorsOthers
Market Share
0.0
10.0
20.0
30.0
40.0
50.0
60.0
2000 2001 2002 2003 2004 2005 2006 2007 2008 2009 2010
Market Share for 651+CC Motorcycle
US EuropeSource: Harley Davidson Case study
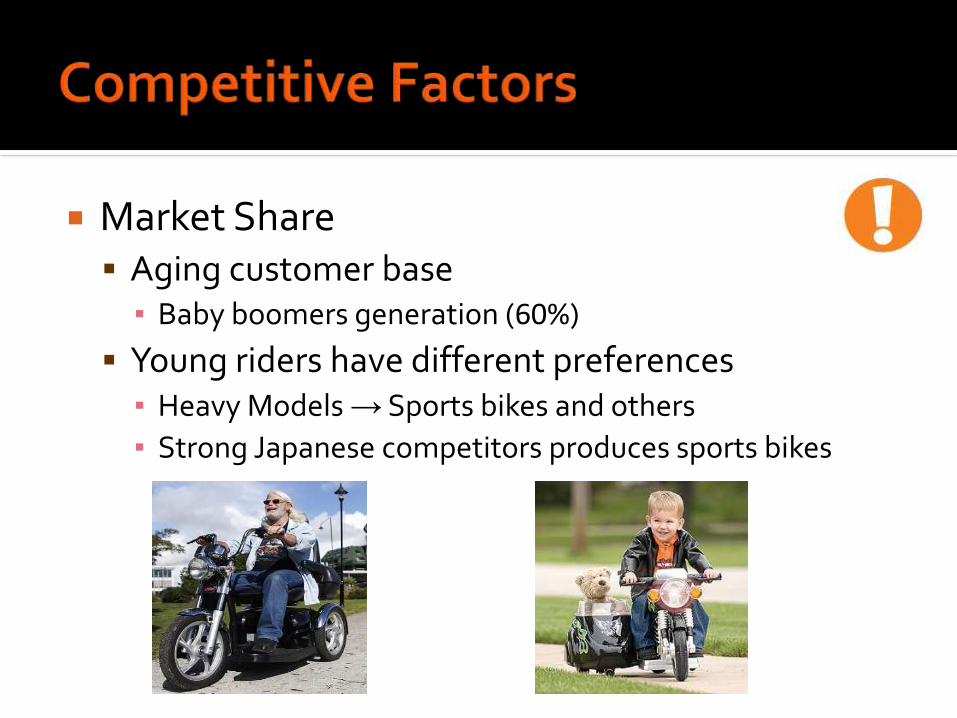
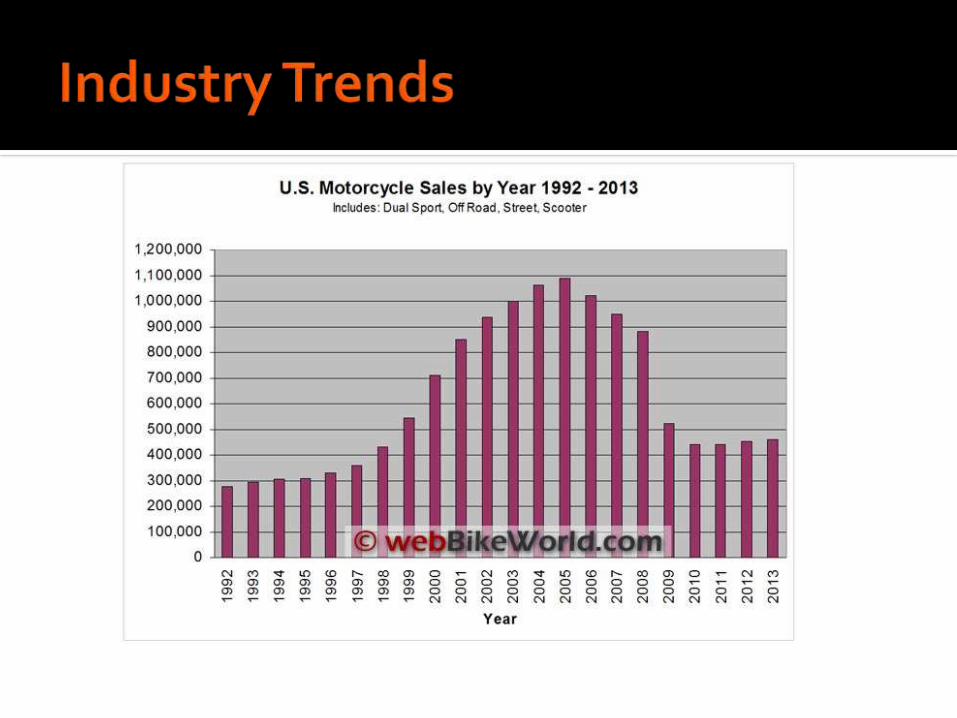
Market Share Aging customer base ▪ Baby boomers generation (60%)
Young riders have different preferences ▪ Heavy Models → Sports bikes and others
▪ Strong Japanese competitors produces sports bikes
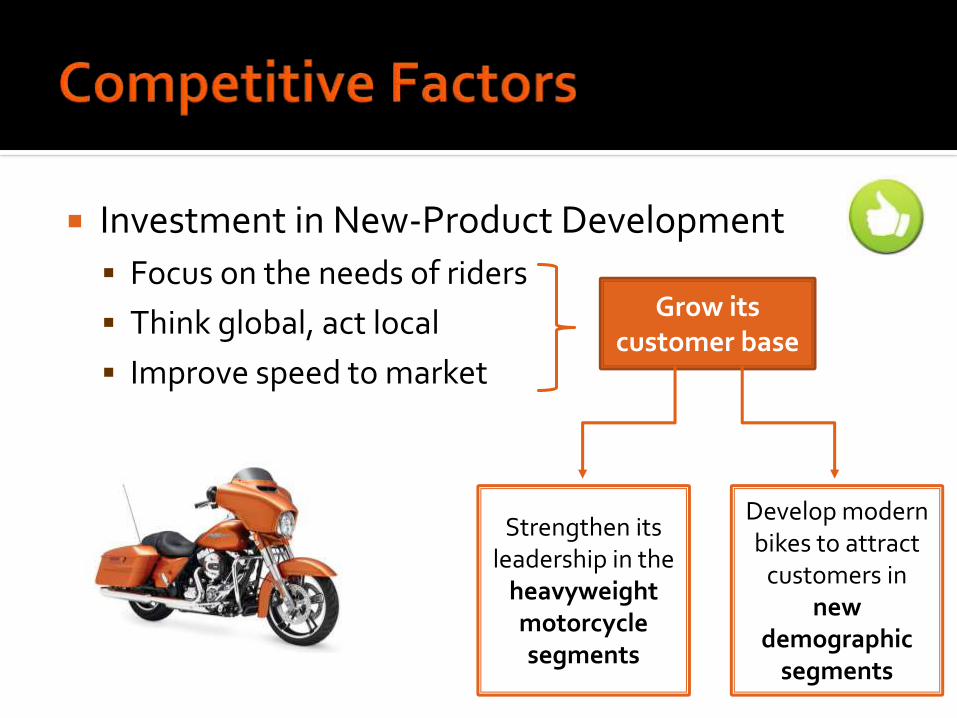
Investment in New-Product Development
Focus on the needs of riders
Think global, act local
Improve speed to market
Grow its customer base
Strengthen its leadership in the
heavyweight motorcycle segments
Develop modern bikes to attract
customers in new
demographic segments
Advantage Taken of Market Growth Potential
Expand its presence in the international markets
▪ Europe, Latin America, Japan, China and India
▪ Markets which with rapid growth in disposable incomes and increase in demand for luxury and foreign brands
Strengthen its worldwide dealer network
▪ Improve communication with retail customers
▪ Provide a premium retail experience
▪ Strengthen dealer profitability
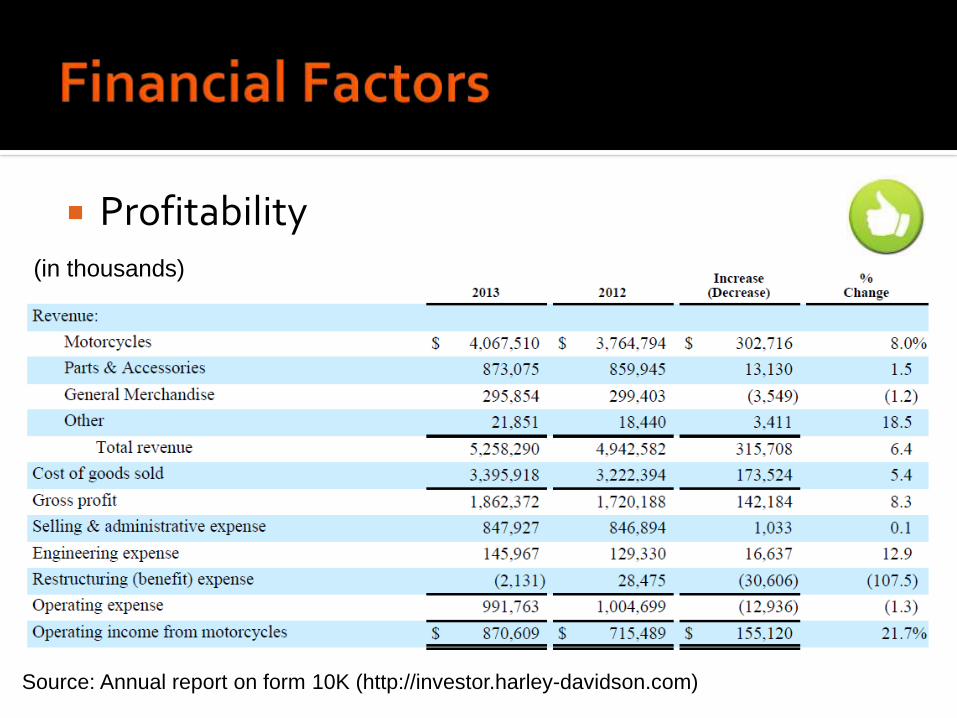
Profitability(in thousands)
Source: Annual report on form 10K (http://investor.harley-davidson.com)
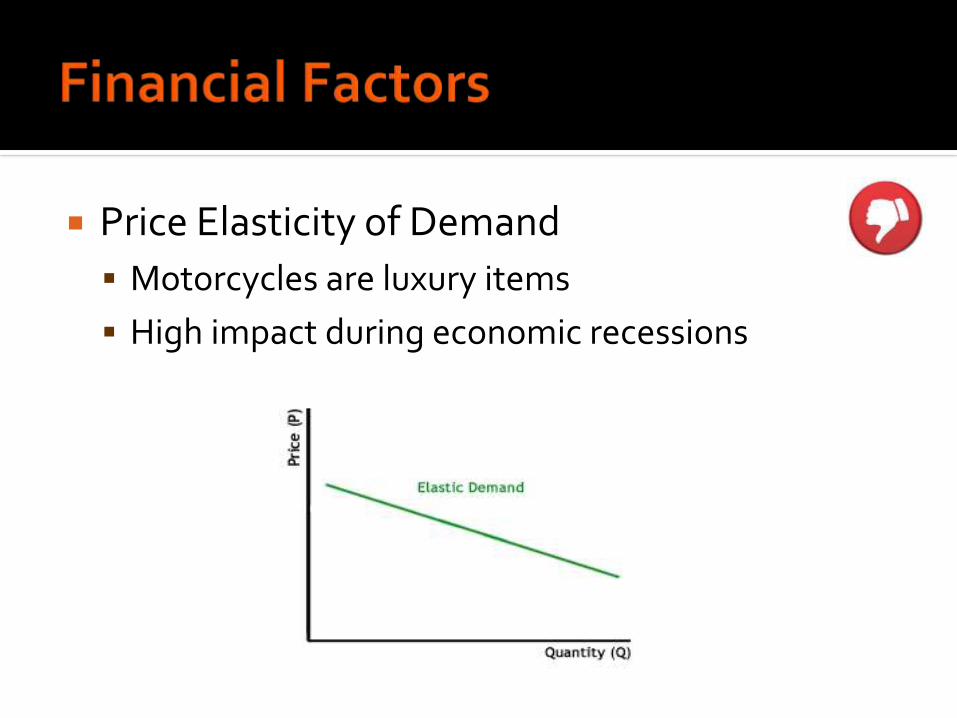
Price Elasticity of Demand
Motorcycles are luxury items
High impact during economic recessions
Technical and Manufacturing Skills
Implemented common standards through “Best Practice Circles”
Cost savings
Flexibility (customer led)
Fluent communication between R&D and Production
ETOP Chart
Industry Trends
Environment
Government
External Threats
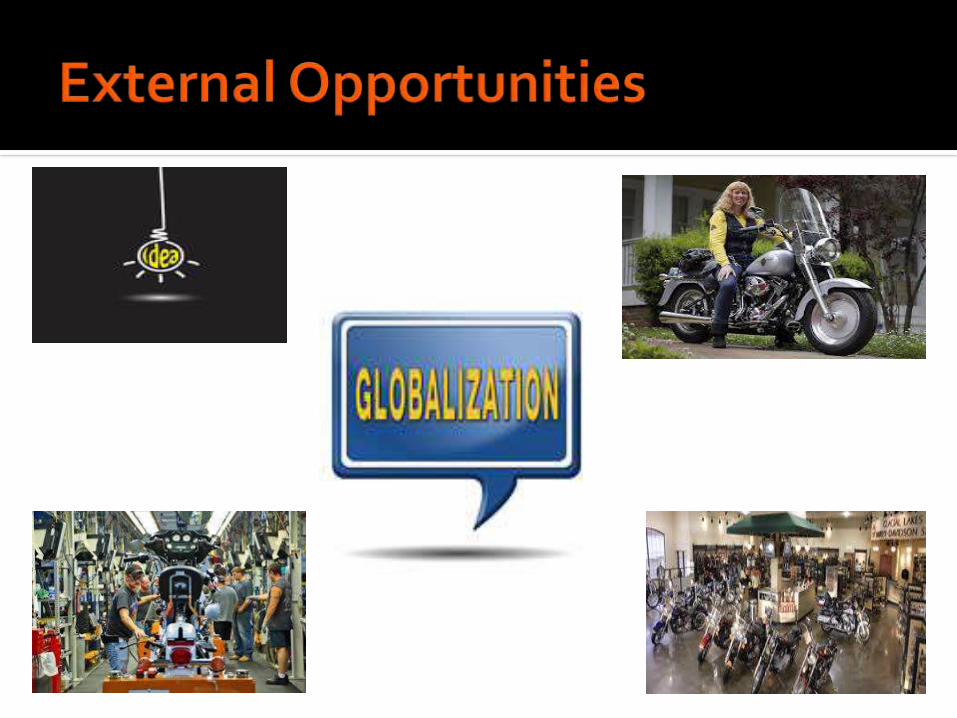
External Opportunities
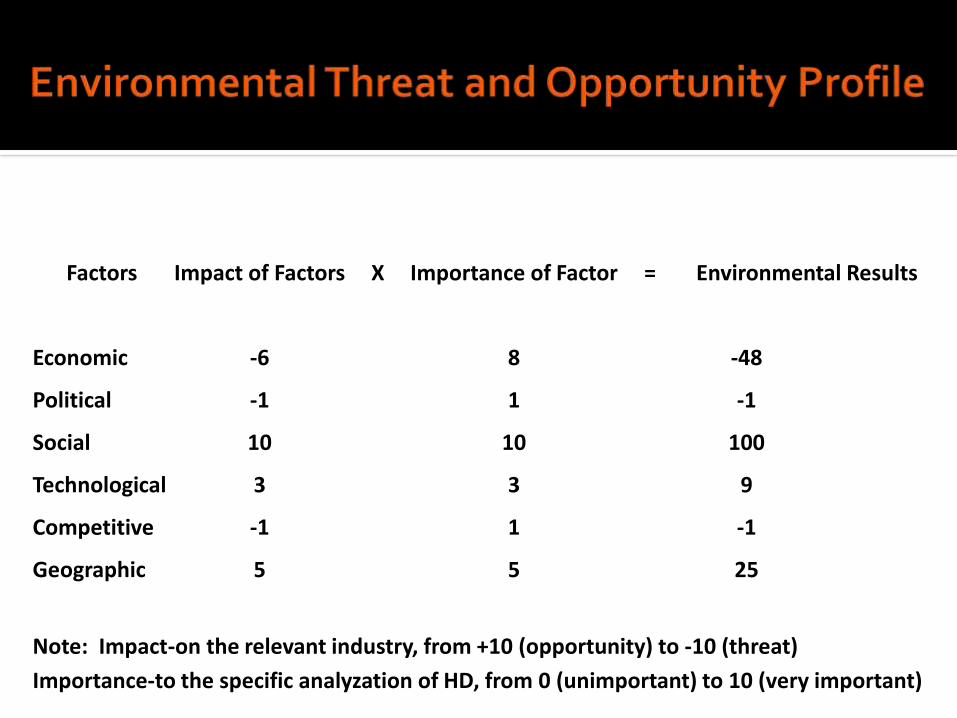
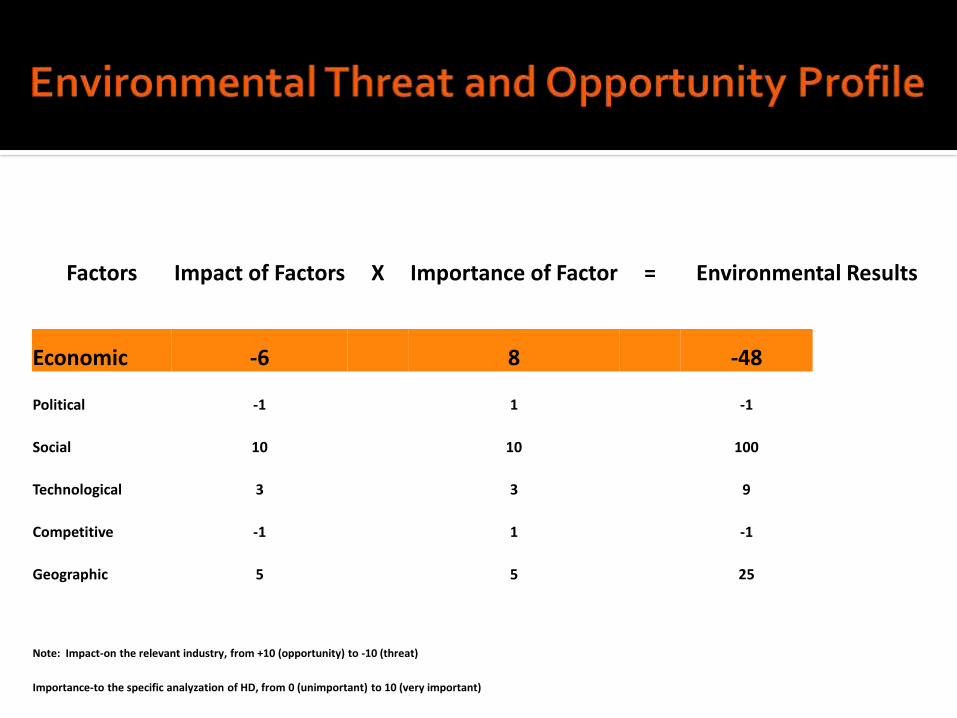
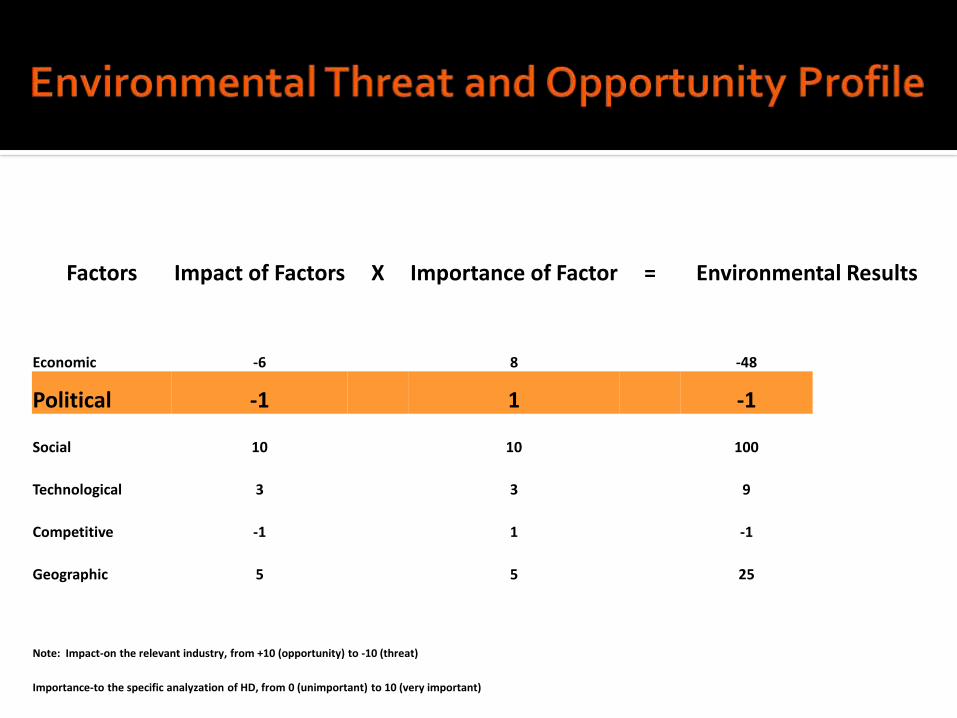
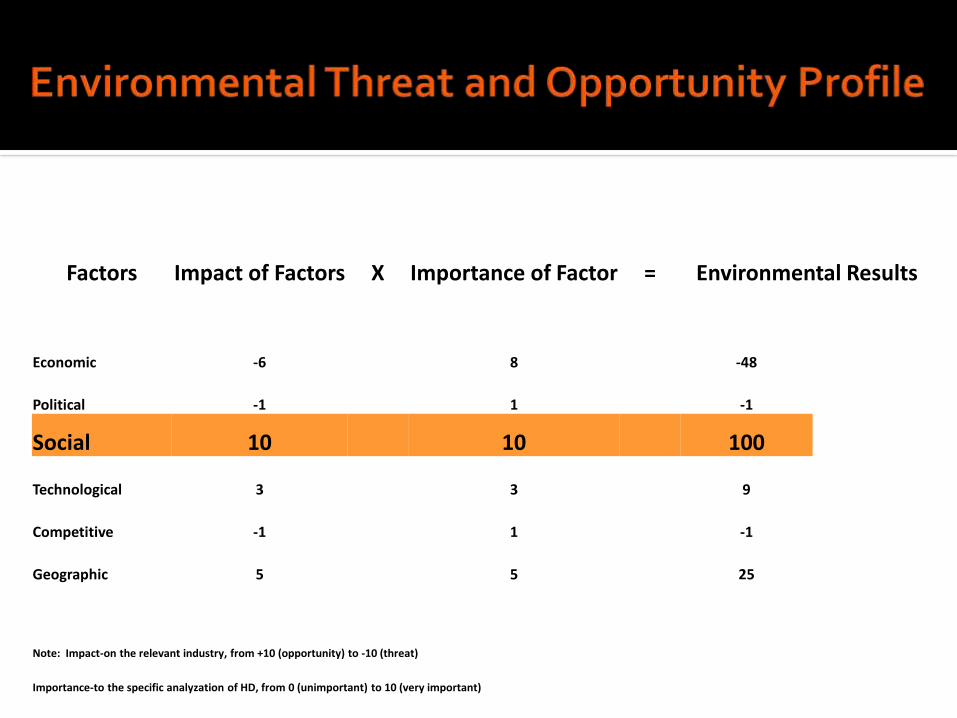
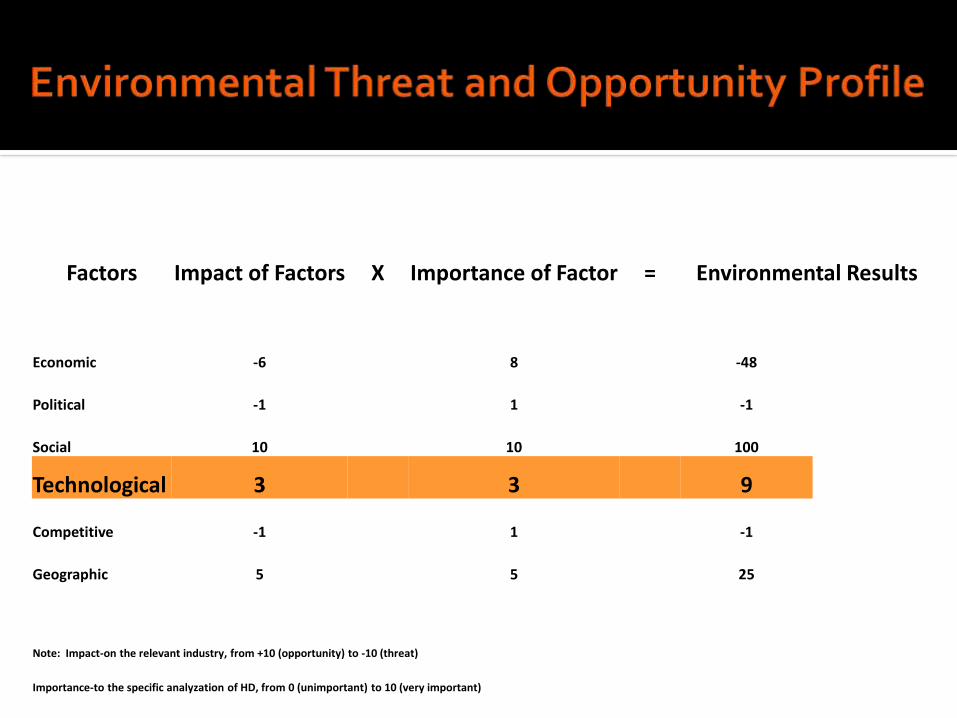
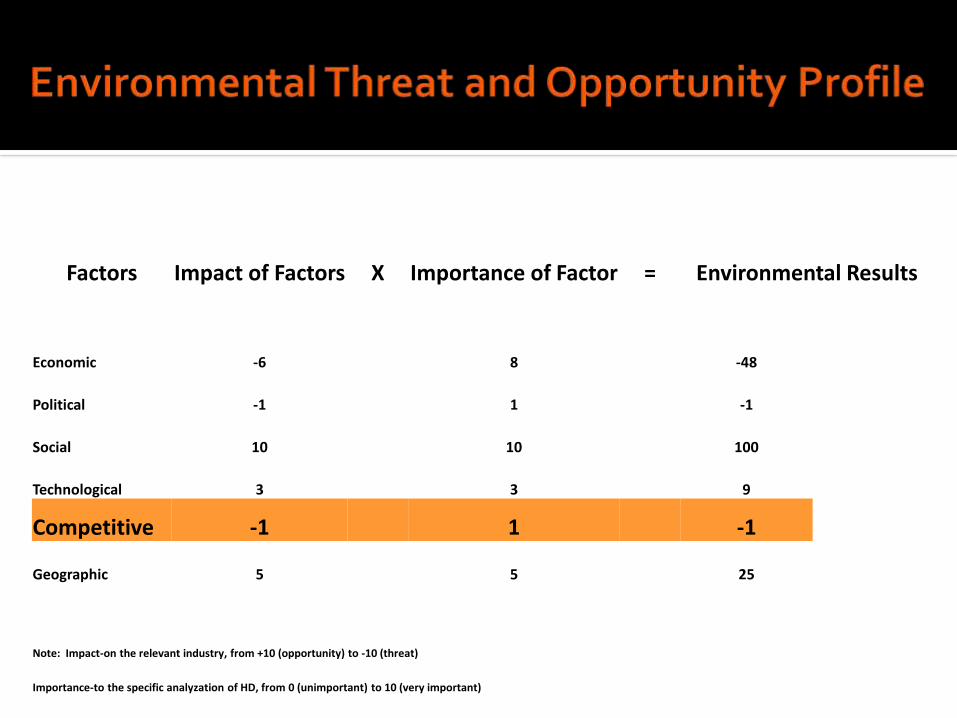
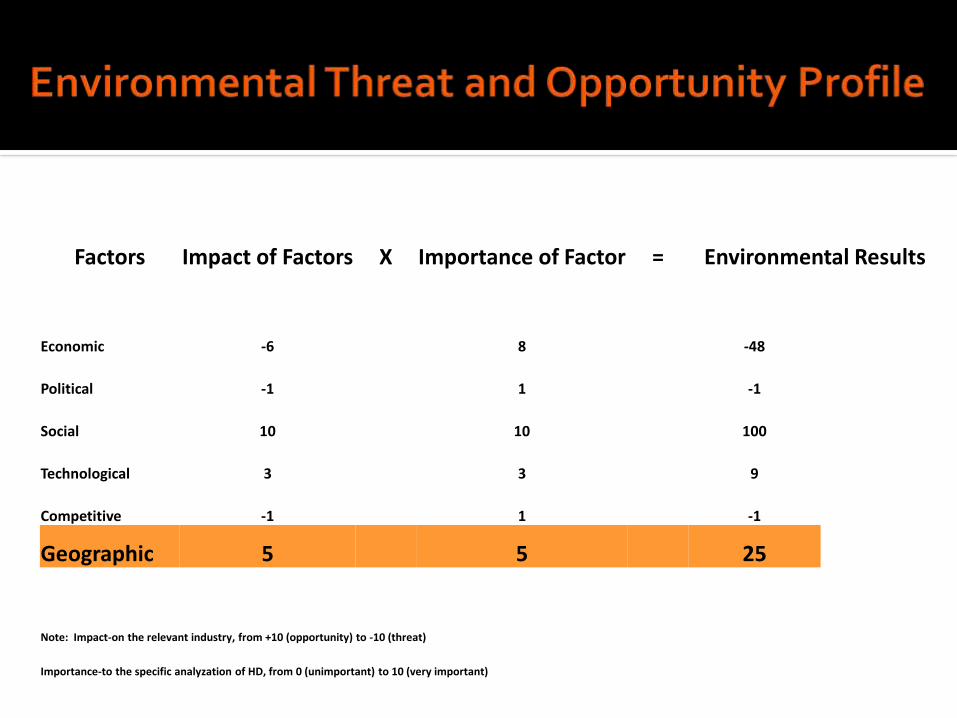
Factors Impact of Factors X Importance of Factor = Environmental Results
Economic -6 8 -48
Political -1 1 -1
Social 10 10 100
Technological 3 3 9
Competitive -1 1 -1
Geographic 5 5 25
Note: Impact-on the relevant industry, from +10 (opportunity) to -10 (threat)
Importance-to the specific analyzation of HD, from 0 (unimportant) to 10 (very important)
Growing International Markets
Electric motorcycle
Global Marketing
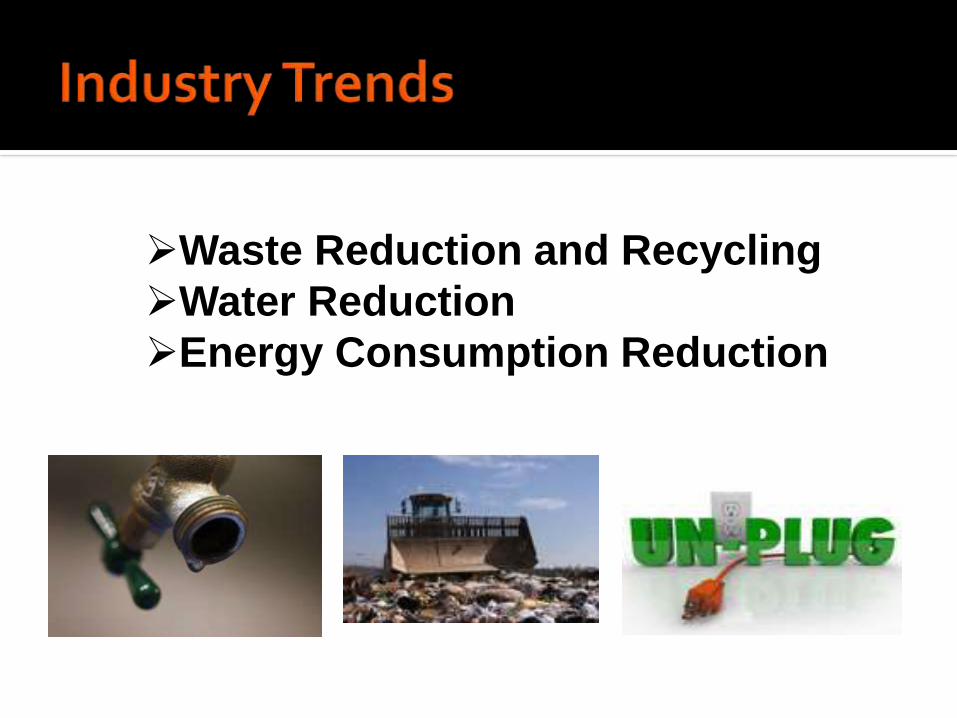
Waste Reduction and Recycling
Water Reduction
Energy Consumption Reduction
Competition
External Changes (government, taxes)
International tariffs and duties
Lower cost competitors or imports
Product substitution
Porter Analysis & Business
Strategy
Miles and Snow
International Strategies
Growth Vector Analysis
Differentiation of product/service
High quality
High customization
▪ Unique product
Brand loyalty
▪ Harley lifestyle
High demand
Focus of market/product
Narrow, well-defined market
Market expansion
Expansion through acquisition
Expansion of product line
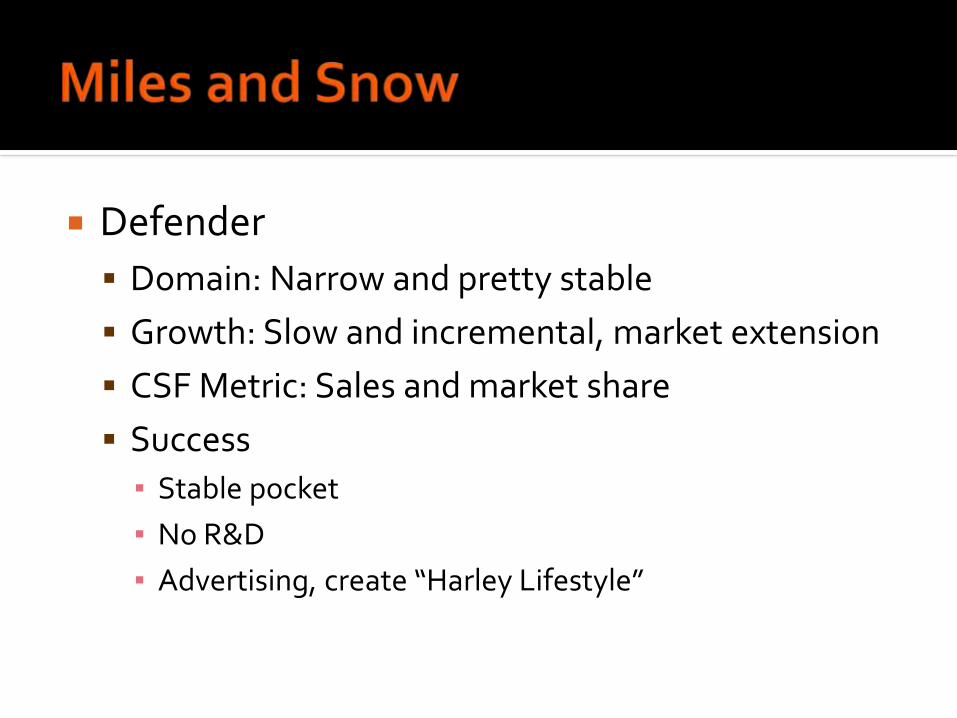
Defender
Domain: Narrow and pretty stable
Growth: Slow and incremental, market extension
CSF Metric: Sales and market share
Success
▪ Stable pocket
▪ No R&D
▪ Advertising, create “Harley Lifestyle”
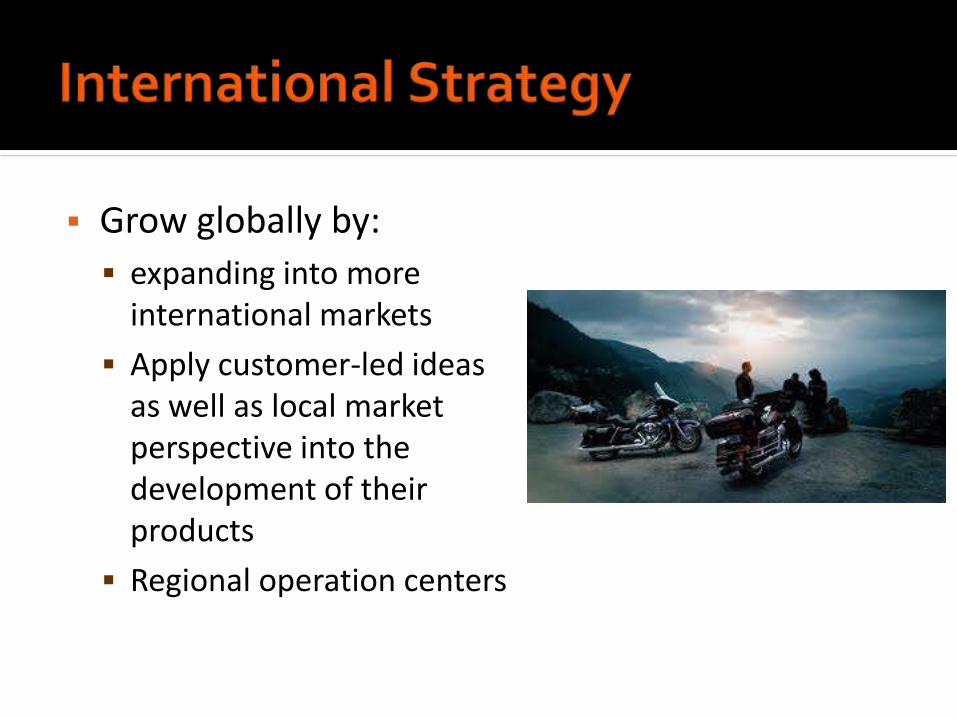
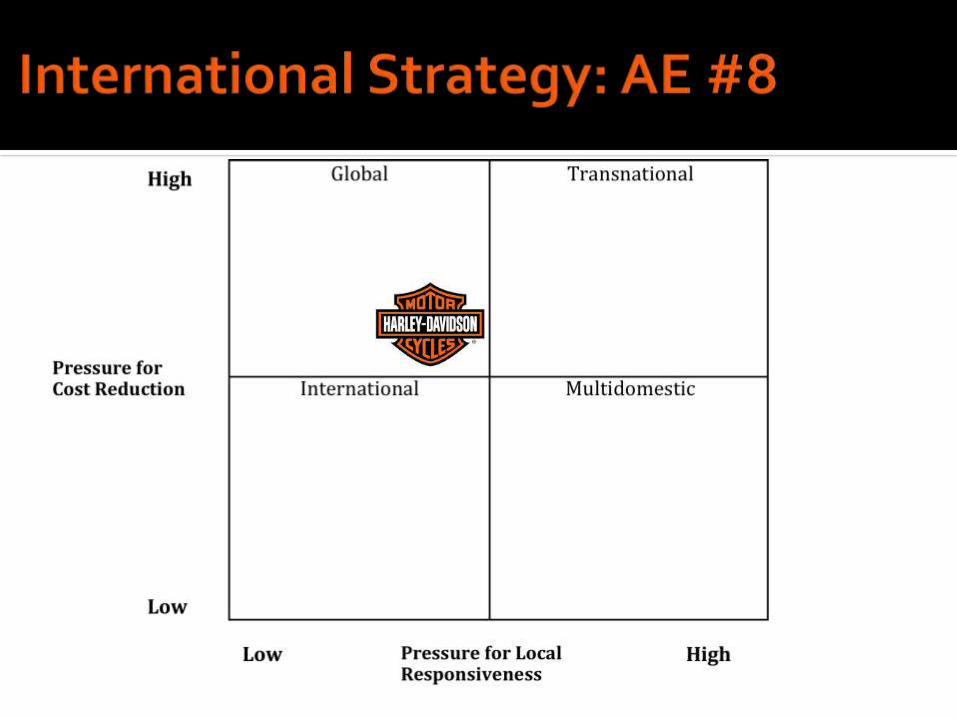
Grow globally by:
expanding into more international markets
Apply customer-led ideas as well as local market perspective into the development of their products
Regional operation centers
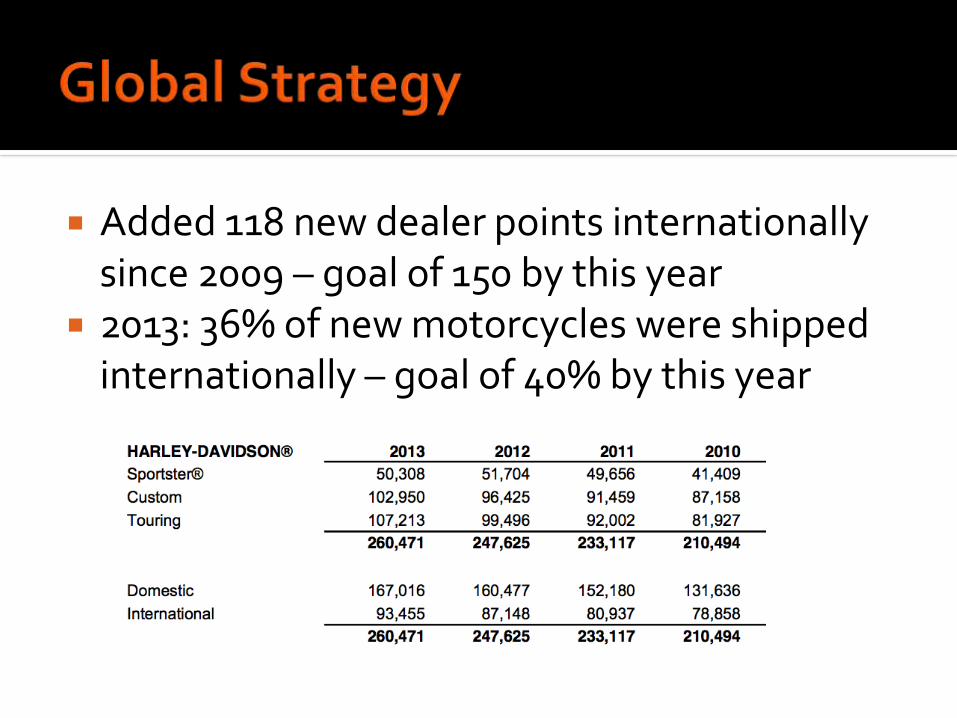
Added 118 new dealer points internationally since 2009 – goal of 150 by this year
2013: 36% of new motorcycles were shipped internationally – goal of 40% by this year
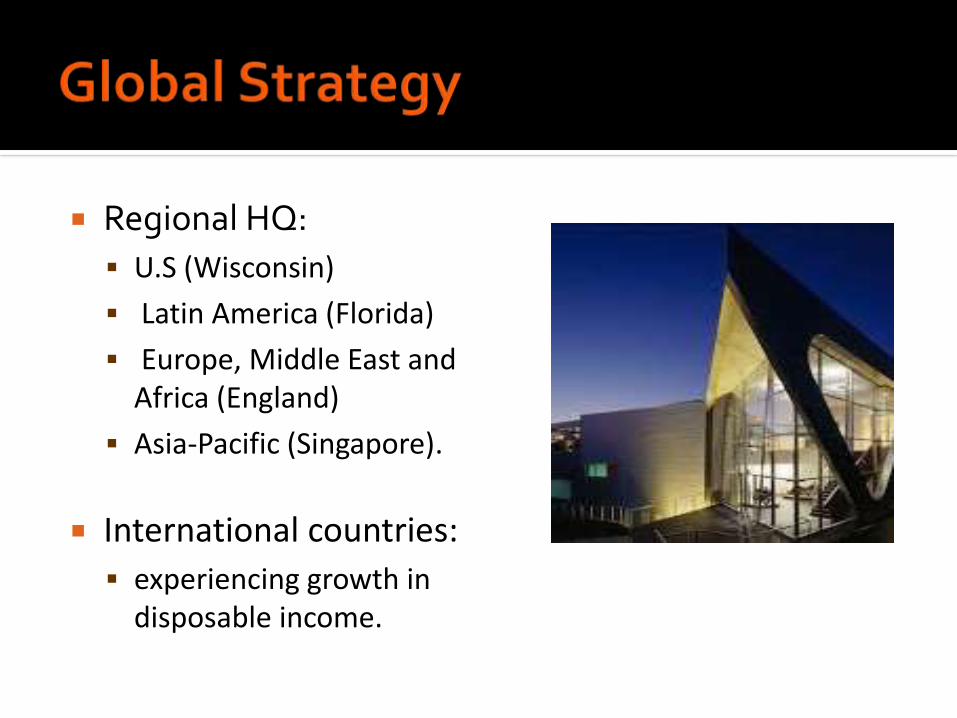
Regional HQ:
U.S (Wisconsin)
Latin America (Florida)
Europe, Middle East and Africa (England)
Asia-Pacific (Singapore).
International countries:
experiencing growth in disposable income.
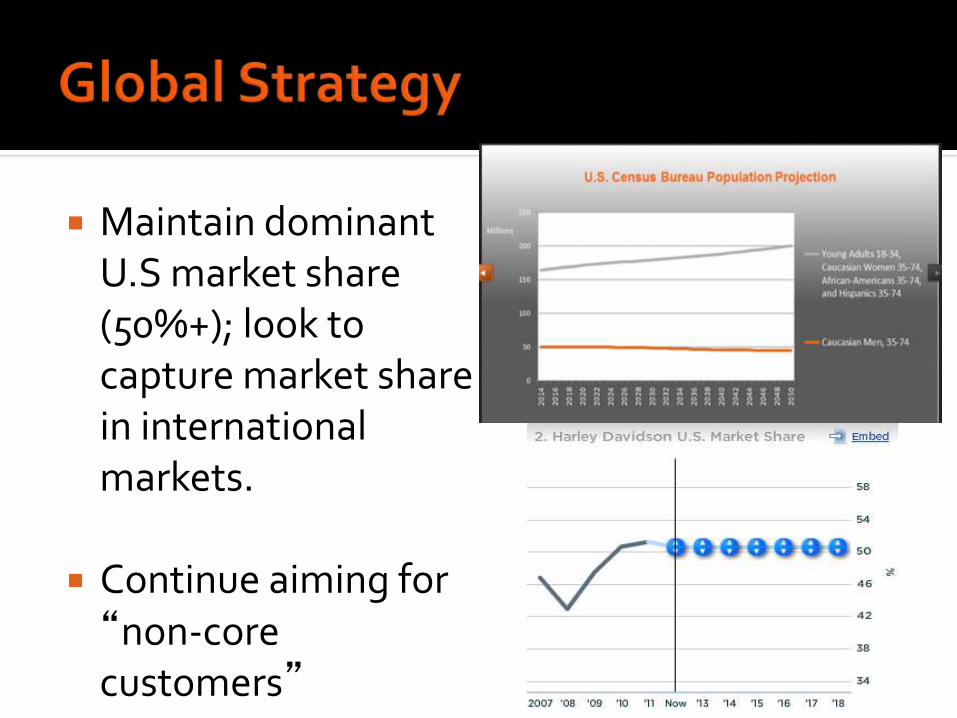
Maintain dominant U.S market share (50%+); look to capture market share in international markets.
Continue aiming for “non-core customers”
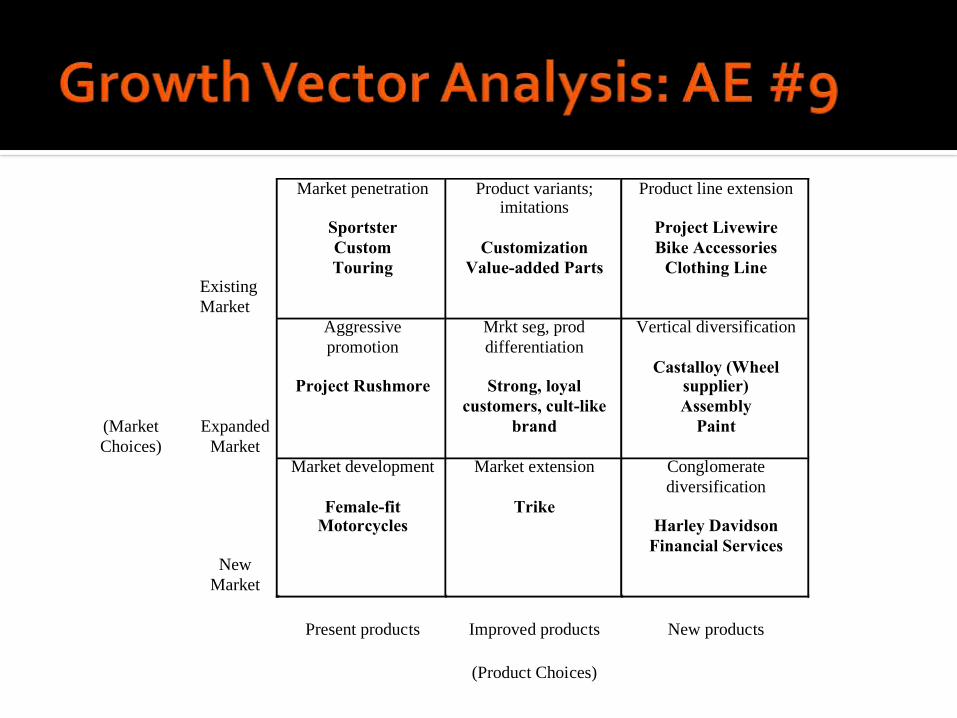
Existing
Market
Market penetration
Sportster
Custom
Touring
Product variants; imitations
Customization
Value-added Parts
Product line extension
Project Livewire
Bike Accessories
Clothing Line
(Market
Choices)
Expanded
Market
Aggressive
promotion
Project Rushmore
Mrkt seg, prod
differentiation
Strong, loyal
customers, cult-like
brand
Vertical diversification
Castalloy (Wheel supplier)
Assembly
Paint
New
Market
Market development
Female-fit Motorcycles
Market extension
Trike
Conglomerate
diversification
Harley Davidson
Financial Services
Present products Improved products New products
(Product Choices)
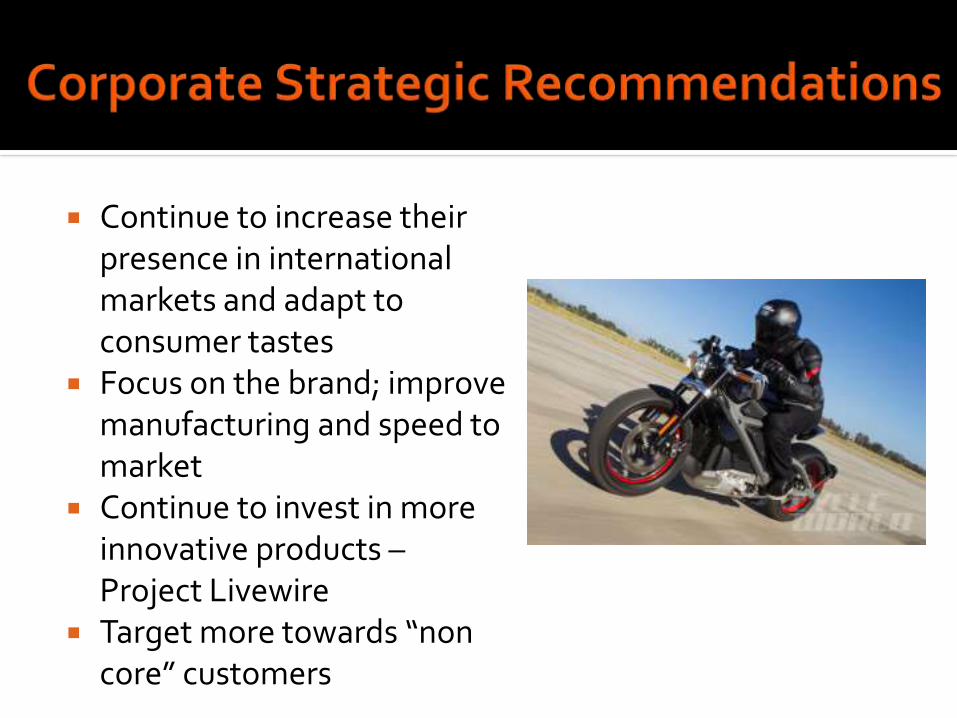
Continue to increase their presence in international markets and adapt to consumer tastes
Focus on the brand; improve manufacturing and speed to market
Continue to invest in more innovative products –Project Livewire
Target more towards “non core” customers
Resource/Capabilities-Based Model Perspective
VRIO Framework
▪ Value
▪ Rarity
▪ Imitation
▪ Organization
Resources
Market Share
Brand
Dealer network
Capabilities
Technological advancements
New Market penetration
Multiple Models to reach specific buyers Customization
High level of Interaction between buyer and seller
Leader in Technology Large national and international bike events
dominated by Harley Davidson
Strength
“Cult status”
Weakness
Outsourcing parts to reduce cost
Reemergence of Indian Motorcycles
Strength
Buyer experience
Brand recognition
Weakness
Manufacturing capabilities and parts are readily available
Similar styling
Strength
Managements interactions with customers
Employee dedication
QUESTIONS?