Embed Size (px)
Citation preview
REPORT SNO 4836-2004
Harmful algal blooms: implications for human health and economic valuation Literature review
Harmful algal blooms in Ugandan Lakes: Ecological, social and economic impacts and management
Harmful algal blooms: implications for human health and economic valuation
Literature review
NIVA 4836 -2004
Preface
The present literature review is a part of the NORAD financed project: “Harmful algal blooms in Ugandan Lakes: Ecological, social and economic impacts and management”. The literature review is one of the initial activities of the Work Package 2 : “Social and economic impacts”. The review’s primary aim is to improve the availability of international published literature on the subject to Ugandan counterparts in the project who do not have ease of access to public library sources. The literature review was conducted during a six week period April-May 2004 using public library search engines for scientific journals and the internet. Keywords used for the searches appear in the appendix. Each chapter contains a list of selected studies which appear in the annotated bibliography, while all cited references and the annotated bibliography itself appear at the end of the report. The literature review was conducted and written by Silje H. Færøy. David N. Barton has edited the report.
Oslo, May 2004
David N. Barton
Contents
Summary - 5 -
1. Introduction - man-made and natural causes for cyanobacterial blooms - 6 -
2. WHO-guidelines - 7 - 2.1 Recreational water - 7 - 2.2 Drinking water - 9 -
3. Economic consequences of cyanobacteria blooms - 11 - 3.1 Health effects - 11 - 3.1.1 Recreational water - 12 - 3.1.2 Drinking water - 12 - 3.1.3 Accidental: haemodialysis - 13 - 3.2 Impacts on livestock and fisheries - 14 - 3.3 Microcystis in dietary supplements - 16 - 3.4 Methods for cyanotoxin water treatment - 16 - 3.5 Human defensive and avertive behaviour - 17 -
4. Valuing the economic impacts of cyanobacteria - 18 - 4.1 Epidemiology - 20 - 4.2 Valuation of illness symptoms - 21 - 4.2.1 Valuing symptoms - 22 - 4.2.2 Using behaviour as a measure of willingness to pay - 23 - 4.2.3 On the limitations of economic valuation of algal toxins - 23 -
5. Cited references - 27 -
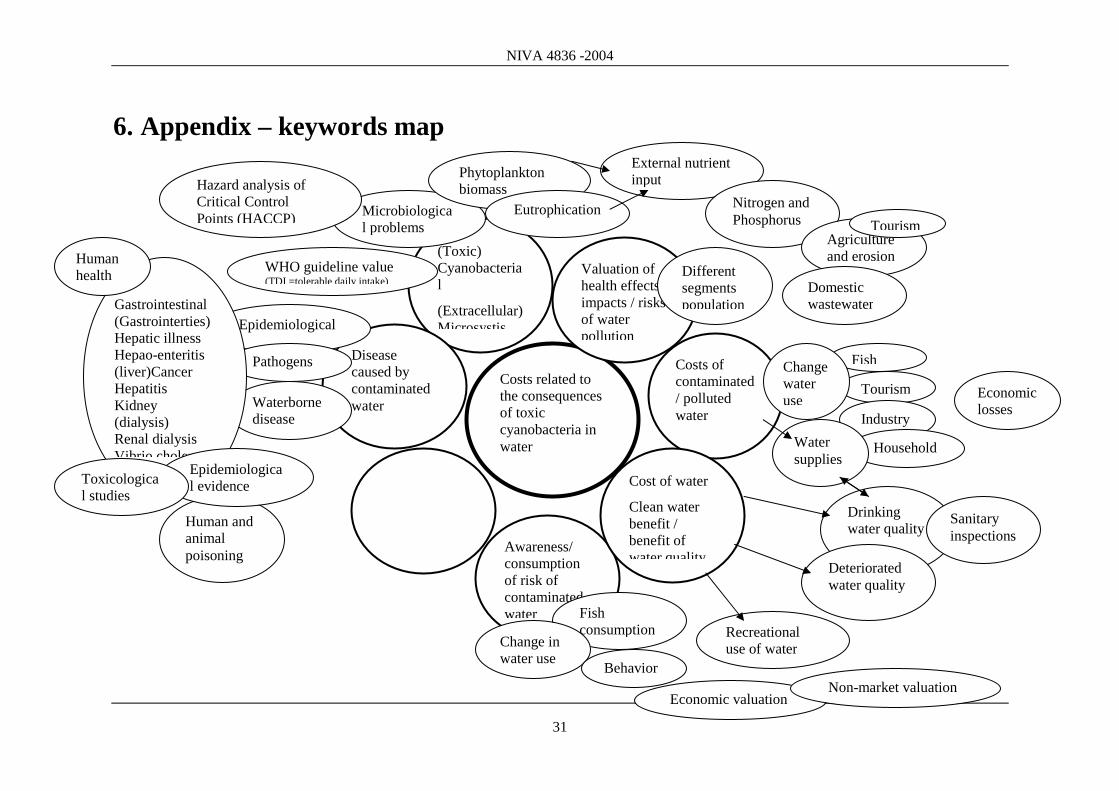
6. Appendix – keywords map 31
7. Annotated bibliography 32
NIVA 4836 -2004
- 5 -
Summary
Title: Harmful algal blooms: implications for human health and economic valuation Year: 2004 Author: Silje Helen Færøy and David N. Barton (ed.) Source: Norwegian Institute for Water Research, ISBN No.: 82-577-4518-9 Harmful algal blooms of cyanobacteria are a result of eutrophication. The World Health Organisation has proposed guideline values for cyanobacteria in recreational waters. The guideline values are defined according to the probability of negative health impacts, measured as the number of cyanobacteria cells/ml, µg chlorophyl-a/litre or according to visual criteria (e.g. foaming). WHO guidelines for potable water are set at 1.0 µg/l microcystines. More than 50 species of cyanobacteria have been identified as being capable of producing toxins. The toxins can be divided in three groups: hepatotoxins, neurotoxins and dermatotoxins. Studies have shown a correlation between the concentration of cyanobacteria in recreational waters and frequency of symptoms. The symptoms observed in humans through recreational exposure to water with high concentrations of cyanobacteria include diarrhoea, vomiting, allergies, headaches, sore throat and muscle pains. Symptoms observed in humans exposed to cyanobacteria through drinking water include gastroenteritis, hepatitis and chronic liver problems. Fish and crustaceans can accumulate toxins in tissue. Cyanobacteria blooms have a history of being associated to fish kills and cattle deaths. Benefit-cost analysis (BCA) is a tool used by economists to evaluate alternative investment alternatives, eg. in pollution abatement measures. In principle BCA should include all quantifiable costs and impacts, which poses a particular challenge for health related impacts. The challenges include identification and measurement problems regarding epidemiology, as well as methodological and ethical issues in economic valuation of observable symptoms. These issues are more important for chronic than acute illness symptoms. In epidemioligal terms, symptoms associated with cyanobacteria can be caused by a number of other factors related to a persons life history and lifestyle. In order to value health effects economic valuation methods take two basic approaches; data on observed behaviour or perception of symptoms. The contingent valuation method (CVM) belongs to the latter category where surveyed respondents/households are their asked willingness to pay to avoid well specified illness symptoms. CVM can include epidemiological questions where necessary. Mitigation costs and preventive expenditures belong to a second group of methods based on observed behaviour of costs incurred by households in preventing, mitigating or avoiding illness symptoms.
NIVA 4836 -2004
- 6 -
1. Introduction - man-made and natural causes for cyanobacterial blooms
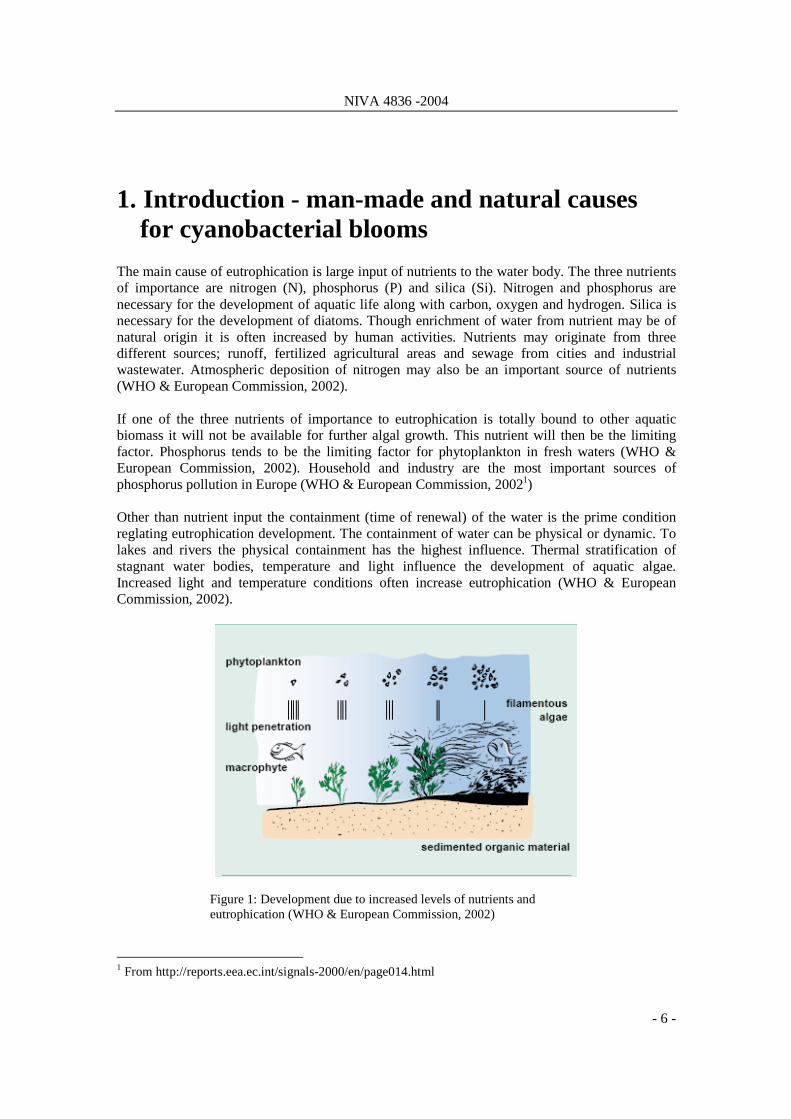
The main cause of eutrophication is large input of nutrients to the water body. The three nutrients of importance are nitrogen (N), phosphorus (P) and silica (Si). Nitrogen and phosphorus are necessary for the development of aquatic life along with carbon, oxygen and hydrogen. Silica is necessary for the development of diatoms. Though enrichment of water from nutrient may be of natural origin it is often increased by human activities. Nutrients may originate from three different sources; runoff, fertilized agricultural areas and sewage from cities and industrial wastewater. Atmospheric deposition of nitrogen may also be an important source of nutrients (WHO & European Commission, 2002). If one of the three nutrients of importance to eutrophication is totally bound to other aquatic biomass it will not be available for further algal growth. This nutrient will then be the limiting factor. Phosphorus tends to be the limiting factor for phytoplankton in fresh waters (WHO & European Commission, 2002). Household and industry are the most important sources of phosphorus pollution in Europe (WHO & European Commission, 20021) Other than nutrient input the containment (time of renewal) of the water is the prime condition reglating eutrophication development. The containment of water can be physical or dynamic. To lakes and rivers the physical containment has the highest influence. Thermal stratification of stagnant water bodies, temperature and light influence the development of aquatic algae. Increased light and temperature conditions often increase eutrophication (WHO & European Commission, 2002).
Figure 1: Development due to increased levels of nutrients and eutrophication (WHO & European Commission, 2002)
1 From http://reports.eea.ec.int/signals-2000/en/page014.html
NIVA 4836 -2004
- 7 -
Excessive levels of nutrients in the water body can create imbalances in the food web. The result is high levels of phyto plankton in stratified water bodies. When the amount of nutrient increases short living macrophytes will grow faster and larger than under normal conditions. In addition new species that are likely to outcompete those already present will develop. This may again lead to an excess of oxygen consumption near the bottom of the water body (WHO & European Commission, 2002). This development of macrophytes and phytoplankton will prevent a large proportion of the light from reaching the bottom. And as the amount of organic sediment increases, so does the demand for oxygen. Though plants produce oxygen in daylight all plants and animals, as well as aerobic microorganisms and decomposing dead organisms, respire or consume oxygen at some point of the day. Also, for plants to produce oxygen through photosynthesis they depend on light. The state of eutrophication affects light conditions in the water body and reduces photosynthesis in deep water layers affecting the development of aquatic grass and weeds. Ultimately only those species that require very little oxygen will survive (WHO & European Commission, 2002). The smell of rotten eggs that may appear at such sites originates from the fact that even the oxygen contained in sulphates (SO4
2-) will be used. Consequently sulphide (S2-) is released. The sulphide will capture free oxygen still present in the upper layers. Thus, even more oxygen is lost. During eutrophication cyanobacteria will experience excessive growth e.g. through cyanobacterial blooms. WHO & European Commission, 2002. Eutrophication and health. Office for Official Publications of the European Communities, Luxembourg.
2. WHO-guidelines The WHO has made guideline values for the concentration of cyanotoxins in both recreational and drinking water. If the cell density of cyanobacteria per litre water is known in addition to the toxic content per cell the toxic concentration per litre can be calculated. Toxin concentration can also be measured directly using ELISA-kits or chemical analytical methods.
2.1 Recreational water Because it is yet unclear whether all cyanotoxins have been identified and because of the potential hazard of liver damage from microcystins, the WHO (2003) recommends that recreational water safety should address the occurrence of cyanobacterias as such. Further, approaches should include addressing the capacity of the water body to sustain large cyanobacterial populations. This is with respect to the difficulties of representative sampling due to the heterogeneous distribution of cyanobacteria in time and space (WHO, 2003). There should also be a differentiation between irritating symptoms and more severe symptoms caused by cyanobacteria. The WHO (2003) will therefore not recommend a single guideline, but have developed a series of guideline values listed in Table 1.
NIVA 4836 -2004
- 8 -
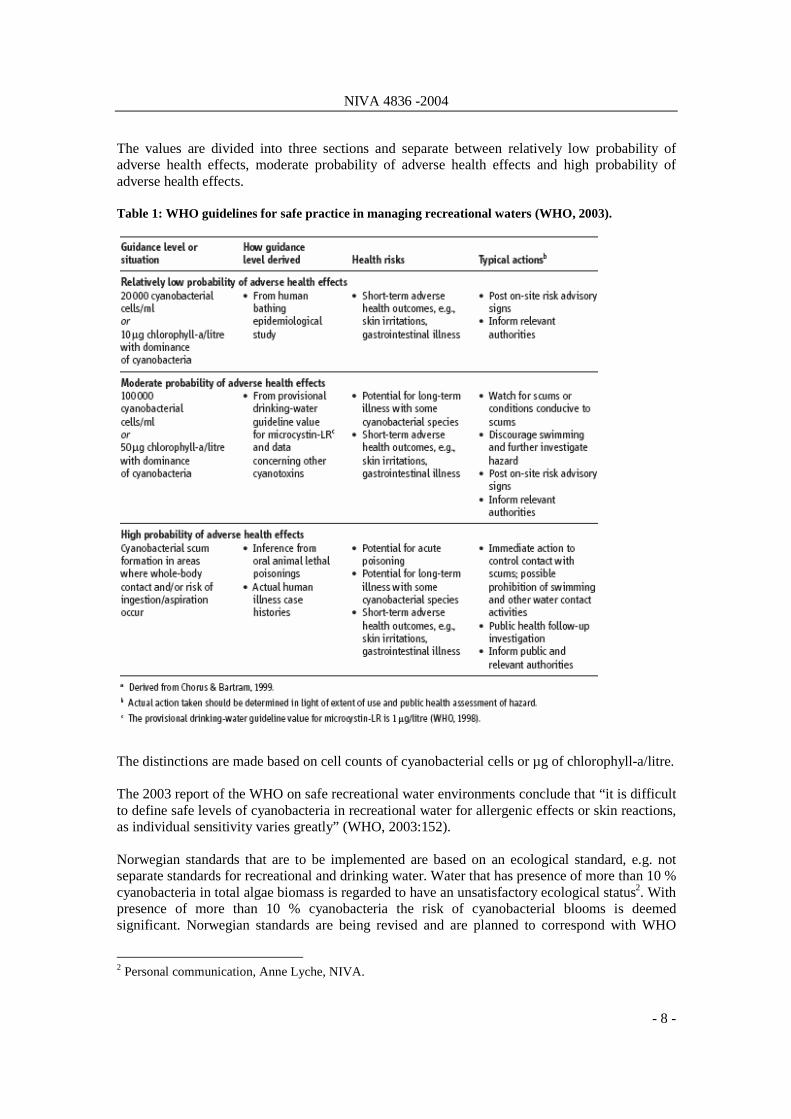
The values are divided into three sections and separate between relatively low probability of adverse health effects, moderate probability of adverse health effects and high probability of adverse health effects. Table 1: WHO guidelines for safe practice in managing recreational waters (WHO, 2003).
The distinctions are made based on cell counts of cyanobacterial cells or µg of chlorophyll-a/litre. The 2003 report of the WHO on safe recreational water environments conclude that “it is difficult to define safe levels of cyanobacteria in recreational water for allergenic effects or skin reactions, as individual sensitivity varies greatly” (WHO, 2003:152). Norwegian standards that are to be implemented are based on an ecological standard, e.g. not separate standards for recreational and drinking water. Water that has presence of more than 10 % cyanobacteria in total algae biomass is regarded to have an unsatisfactory ecological status2. With presence of more than 10 % cyanobacteria the risk of cyanobacterial blooms is deemed significant. Norwegian standards are being revised and are planned to correspond with WHO
2 Personal communication, Anne Lyche, NIVA.
NIVA 4836 -2004
- 9 -
standards, setting guidelines at 10 µg chlorophyll-a/litre in lime-rich water with high calcium levels (>4 mg Ca/l) and at 6 µg chlorophyll-a/litre in water with low calcium levels (< 4 mg Ca/l)3.
2.2 Drinking water A provisional value of Tolerable Daily Intake (TDI) of microcystis-LR has been derived for drinking water. This value has been set at a level of intake that is expected to have no adverse health effects when exposed daily over a life time. The guideline value is derived from an international scientific consensus in the WHO and is supposed to be used as guidance to monitoring and management aspects (Falconer et. al., 1999). The guideline value is based on a tolerable daily intake value of microcystin derived from two animal studies (Hitzfeld et. al., 2000). The no-observable adverse effect level (NOAEL) was determined at 40 µg / kg / day, based on a typical daily intake of water of 2 litres (l), an average body weight of 60 kg (bw), a proportion of daily intake of contaminant ingested through drinking water of 0.8 (P) and an uncertainty factor of 1000 (UF). This was all added to a formula (Falconer et. al., 1999);
NOAEL x bw x P / l x UF = (40 µg / kg / day x 60 kg x 0.8) / 1000 x 2 l / day = 0.96 µg / l
Derived from this formula the WHO has adopted a provisional guideline value of 1.0 µg / l (rounded up from 0.96) for microcystin-LR. At the time there was not enough information available to derive guideline values for cyanotoxins other than microcystin-LR. Exceeding this guideline value can be tolerable if the exposure is not expected to be continuous (Falconer et. al., 1999). Fitzgerald et. al. (1999) have developed guidelines for health alert values regarding risks of acute health effects. Their calculations are based on in the same model as that for the WHO guidelines. Fitzgerald et. al. (1999) have applied an average weight of 70 kg and UF of 100. The reason for the lowered uncertainty factor is the fact that this health alert only relates to potential acute or short-term health effects. These figures gave a health alert value of 11 µg / L, i.e. a considerable higher figure than the value recommended for life long consumption (Fitzgerald et. al., 1999). It is important to keep in mind that these guidelines are in fact only valid for microcystin-LR. In situations where other cyanotoxins are more dominant the situation and the question of which quantitative measurements to apply becomes even more complicated (Hitzfeld et. al., 2000). For such purposes guidelines have been generated for cyanobacterial cell numbers. WHO recommends a comprehensive framework for alert levels based on the Australian approach (Fitzgerald, 2001). In Australia an acceptable cell concentration has been set at 2000 cyanobacterial cells m/l (or 0.2mm3 / l biovolume or 1 µg / l chlorophyll-a). This guideline is primarily based on taste and odour perceptions.
3 Personal communication, Anne Lyche, NIVA
NIVA 4836 -2004
- 10 -
Selected studies: WHO, 2003. Guidelines for Safe Recreational Water Environments Volume 1: Coastal and Fresh Waters. World Health Organization, Water Sanitation and Health. Fitzgerald, D.J., D.A. Cunliffe and M.D. Burch, 1999. Development of health alerts for cyanobacteria and related toxins in drinking water in South Australia. Environmental Toxicology, 14 (1): 203-209. Fromme, H., A. Kohler, R. Krause and D. Fuhrling, 2000. Occurrence of cyanobacterial toxins - Microcystis and anatoxin-a - in Berlin water bodies with implications to human health and regualtions. Environmental Toxicology, 15 (2): 120-130. Haider, S., V. Naithani, P.N. Viswanathan and P. Kakkar, 2003. Cyanobacterial toxins: a growing environmental concern. Chemosphere 52 (1): 1-21. Humpage, A.R. and I.R. Falconer, 2003. Oral Toxicity of the cyanobacterial toxin cylindrospermopsin in male Swiss albino mice: Determination of no observed adverse levels for deriving water guideline value. Environmental Toxicology, 18 (2): 94-103. Humpage, A.R., J. Rositano, A.H. Bretag, R. Brown, P.D. Baker, B.C. Nicholson and D.A. Steffensen, 1994. Paralytic Shellfish Poisons from Australian Cyanobacterial Blooms. Australian Journal of Marine and Freshwater Research, 45 (5): 761-771.
NIVA 4836 -2004
- 11 -
3. Economic consequences of cyanobacteria blooms
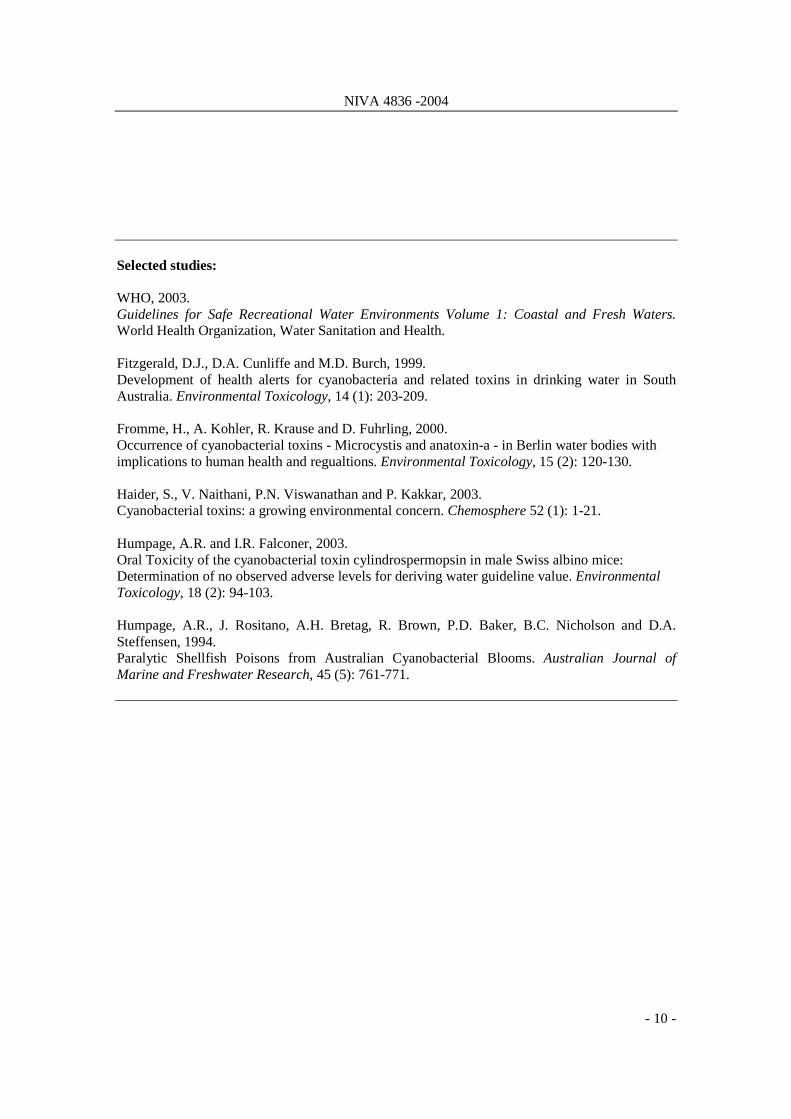
More than 50 species of cyanobacteria capable of producing toxins have been identified. The cyanotoxins that have been identified can be classified into three groups after their different implications to human health as shown in table 2.
Table 2. Cyanotoxins and implications Cyanotoxins Facts Cyanobacteria Hepatotoxins
The most frequently observed cyanotoxin. Cause liver injury and death from liver haemorrhage and cardiac failure in mice at acute doses. Chronic exposure induces liver injury and promotes growth of tumours (WHO & European Commission, 2002).
Microcystis, Planktothrix, Oscillatoria, Nostoc, Anabaena, Anabaenopsis, Hapalosiphon
Neurotoxins
Generally less common than hepatoxins. Act on the nervous system. Found to cause rapid death by respiration arrest in aquatic birds and mice (WHO & European Commission, 2002).
Anabaena, Oscillatoria, Aphanizomenon, Cylindrospermum, Lyngbya, Cylindrospermopsis raciborskii
Dermatotoxins
Found to induce irritant and allergenic responses in tissue by simple contact (WHO & European Commission, 2002).
3.1 Health effects Cyanobacteria have caused severe consequences to both animal and human health. An incident of death to livestock was first documented in the 1800s (WHO, 2003). As early as in 1884 mass mortalities of fish, birds and farm animals, and human skin irritations were attributed to exposure to scum containing potentially toxic cyanobacteria in Lake Barlewice, Poland (Codd et. al., 2004). Since then recorded cases have included sheep, cattle, horses, pigs, dogs, fish, rodents, amphibians, waterfowl, bats, zebra and rhinoceros (WHO, 2003). When discussing human health it is instructive to divide the adverse health effects from cyanobacterial toxins into three areas of impact; recreation, drinking water and accidental.
NIVA 4836 -2004
- 12 -
3.1.1 Recreational water Different human reactions to exposure to cyanobacteria in recreational water have been observed. Some of the observed reactions are skin irritation, allergenic reactions, gastroenteritis, headache, nausea, vomiting, sore throats and muscular pains (WHO, 2003). Unfortunately, in temperate climates, cyanobacterial blooms have a tendency to occur in the same season as the recreational bathing in freshwater. In Australia a relationship between symptoms of diarrhoea, vomiting, hay fever and eye irritation within 7 days after bathing in freshwater containing cyanobacterial blooms has been studied. Along with the toxic content, the number of cyanobacteria and the time spent in the water, was examined. After 7 days a significant correlation between the symptoms mentioned earlier, the number of cyanobacteria and the time spent in the water was found. Those who had been exposed to more than 5000 cells per ml for more than one hour had significantly higher symptom rate than those who were not exposed (Pilotto et. al., 1997). According to the WHO guidelines for recreational waters 20 000 cells / ml cyanobacterial cells are associated with a relatively low probability of adverse health effects (WHO, 2003). Several studies have shown that there is no correlation between the toxicity and the allergenic effects of cyanobacteria. The allergenic reactions are more likely to be caused by other substances in the cyanobacteria, such as lipopolysaccharides of contaminated bacterial flora, rather than the toxins (Torokne et. al., 2001).
3.1.2 Drinking water It is not likely that lethal poisoning would occur following the consumption of drinking water contaminated by cyanobacterial toxins. However, the presence of cyanobacteria in drinking water does pose a serious problem. The risks associated with low-level chronic exposure have not been adequately addressed (Hitzfeld et. al., 2000). Observed reactions from humans who have been exposed to cyanobacteria through drinking water are several cases of gastroenteritis, hepatitis and liver failure (WHO, 2003). The first time that human poisoning as a result of cyanotoxins was reported was in 1979 in Palm Island, Australia. More than 100 children of Aboriginal families were admitted to hospital with various symptoms of gastroenteritis. The medical doctors had no appropriate single explanation to the phenomena and named it “Palm Island Mystery Disease”, although noting that only few days before the outbreak the major water supply of the island had been treated with copper sulphate to control a dense algal bloom. A linkage between water supply and the outbreak was later confirmed (Griffiths & Saker, 2003). China has a very high incidence of primary liver cancer (PLC). An epidemiological survey was performed in Haimen and Fusui to demonstrate the possible correlation between levels of Microcystis (MC) in drinking water and the incidence of PLC. A dose relationship exists between a high incidence of PLC and the intake of pond/ditch water as a drinking source. Both in Haimen and Fusui drinking water samples showed that MC was present in pond/ditch water and to a certain extent in river and shallow well water. No MC was detected in deep well water. This suggests that the presence of MC in drinking water is one of the risk factors for the high incidence of PLC in China (Ueno et. al, 1996).
NIVA 4836 -2004
- 13 -
In September 1994, 121 persons in three southern Swedish villages fell ill with gastroenteritis. The outbreak coincided with a contamination of the municipal drinking water of untreated raw water from the outlet river of the eutrophic Lake Vombsjön. Analysis from Lake Vombsjön 6 days before and 2 weeks after the outbreak showed the presence of Microcystis in algal and water samples. Several additional factors, such as the lack of secondary cases, that pet animals got sick, that no pathogenic bacteria were found and that some people fell sick from having drunk only boiled water and not tap water, suggested that the outbreak was caused by cyanobacterial toxins rather than a bacterial or virus infection (Annadotter et. al, 2001)
3.1.3 Accidental: haemodialysis Reported human deaths from exposure to cyanobacteria are limited to a case of renal dialysis in Caruaru, Brazil. It is believed that 52 deaths from liver failure were caused by Microcystis present in the water used for haemodialysis (Carmichael et. al, 2001) Selected studies: Carmichael, W.W., S.M.F.O. Azevedo, J.S. An, R.J.R. Molica, E.M. Jochimsen, S. Lau, K.L. Rinehart, G.R. Shaw and G.K. Eaglesham, 2001. Human Fatalities from Cyanobacteria: Chemical and Biological Evidence for Cyanotoxins. Environmental Health Perspective, 109: 663-668. Codd, G.A., A. Oberemm and M. Tarczynska, 2004. Recognition and awareness-raising of toxic cyanobacterial blooms and associated poisonings at Lake Barlewice, Poland, in 1884 and recent cyanobacterial toxic analyses. Ecohydrology & Hydrobiology 4 (1): 3-6. Elsaadi, O., A.J. Esterman, S. Cameron and D.M. Roder, 1995. Murray River Water, Raised Cyanobacterial Cell Counts, and Gastrointestinal and Dermatological Symptoms. Medical Journal of Australia 162 (3): 122-125. Esrey, S.A., 1996. Water, waste, and well-being: A multicountry study. American Journal of Epidemiology, 143 (6): 608-623. Esrey, S.A., J.B. Potash, L. Roberts and C. Shiff, 1991. Effects of improved water-supply and sanitation on Ascariasis, Diarrhea, Dracunculiasis, Hookworm Infections, Schistosomiasis, and Trachoma. Bulletin of the World Health Organization, 69 (5): 609-621. Fleming, L.E., J. Easom, D. Baden, A. Rowan and B. Levin, 1999. Emerging Harmful Algal Blooms and Human Health: Pfiesteria and related organisms. Toxicologic Pathology, 27 (5): 573-581. Gracey, M., 1994. Gastrointestinal Infections in Children. Current Opinion in Gastroenterology, 10 (1): 88-97. Pilotto, L.S., R.M. Douglas, M.D. Burch, S. Cameron, M. Beers, G.J. Rouch, P. Robinson, M. Kirk, C.T. Cowie, S. Hardiman, C. Moore and R.G. Attewell, 1997.
NIVA 4836 -2004
- 14 -
Health effects of exposure to cyanobacteria (blue-green algae) during recreational water-related activities. Australia and New Zealand Journal of Public Health, 21 (6): 562-566. Torokne, A., A. Palovics and M. Bankine, 2001. Allergenic (Sensitization, Skin and Eye irritation) Effects of Freshwater Cyanobacteria – Experimental Evidence. Environmental Toxicology, 16 (6): 512-516. Ueno, Y., S. Nagata, T. Tsutsumi, A. Hasegawa, M.F. Watanabe, H.D. Park, G.C. Chen and S.Z. Yu, 1996. Detection of microcystins, a blue-green algal hepatoxin, in drinking water sampled in Haimen and Fusui, endemic areas of primary liver in China, by highly sensitive immunoassay. Carcinogenesis, 17 (6): 1317-1321. Chorus, I., I.R. Falconer, H.J. Salas and J. Bartram, 2000. Health risks caused by freshwater cyanobacteria in recreational waters. Journal of Toxicology and Environmental Health - Part B-Critical Reviews, 3 (4): 323-347.
3.2 Impacts on livestock and fisheries Fish kills have been reported in association with cyanobacterial blooms. This has often resulted in significant economic losses (Humpage et. al., 1994, Rodger et. al., 1994 and Penezola et. al., 1990). A study performed in the Jacarepaguá Lagoon in Brazil showed that the concentration contained in the tissue of fish was either close to or above the recommended limit for human consumption, even in periods when no blooms were detected (Magalhães et. al., 2000). In the Gippsland Lakes (Australia) cell counts of cyanobacteria were recorded to 15 000-35 000 cells/ml by the end of February and increasing in early March. However, scaly fish were found to be poor at accumulating toxins in flesh or viscera at these levels. The levels at which toxins are accumulated within tissue, the levels for safe intake of respective toxins given by the WHO and national figures of average intake of the food in question were used to derive information on whether fishing should be restricted. Authorities did not find it necessary to implement restrictions on fishing at the levels indicated. Mussels exposed to toxin-producing blooms on the order of 20 000 cells / ml were found likely to accumulate sufficient toxins to be unsafe for consumption. Because of a reduced amount of prawn in the diet compared to mussels a restriction on the use of prawns was not found necessary until cell counts were above 60 000 cells/ml or in case that blooms were of significant duration (Buynder et. al., 2001). Because the toxins are tasteless, odourless and heat and acid stable, normal screening and food preparation will not prevent intoxication if contaminated shellfish is consumed (Fleming et. al., 1999). Livestock deaths were first registered during the 1800’s. The most common description is of farm animals which have died from drinking scum from ponds that have been contaminated with cyanobacteria. Also pet animals have been poisoned after swimming in or eating the scum. The reported deaths in animals range from ducks to rhinoceros. Some of the animals can also have been poisoned from eating other food, such as mussels, that had accumulated toxins (Kuiper-Goodman et. al., 1999).
NIVA 4836 -2004
- 15 -
Selected studies: de Magalhães, V.F., R.M. Soares and S.M.F.O. Azevedo, 2000. Microcystin contamination of fish from the Jacarepaguá Lagoon (Rio de Janeiro, Brazil): ecological implication and human health risk. Toxicon, 39:1077-1085. Frazier, K., B. Colvin, E. Styer and G. Hullinger, 1998. Microcystis Toxicosis in Cattle Due to Overgrowth of Blue-Green Algae. Vet Human Toxicol 40 (1): 23-24. Orr, P.T., G.J. Jones, R.A. Hunter and K. Berger, 2003. Exposure of beef cattle to sub-clinical doses of Microcystis aeruginosa: toxin bioaccumulation, physiological effects and human health risk assessment. Toxicon, 41 (5): 613-620. Penaloza, R., M. Rojas, I. Vila and F. Zambrano, 1990. Toxicity of a Soluble Peptide from Microcystis SP to Zooplankton and Fish. Freshwater Biology, 24 (2): 233-240. Rodger, H.D., T. Turnbull, C. Edwards and G.A. Codd, 1994. Cyanobacterial (blue-green-algal) Bloom associated Pathology in Brown Trout, Salmo-trutta, in Loch Leven, Scotland. Journal of Fish Disease, 17 (2): 177-181. Van Buynder, P.G., T. Oughtred, B. Kirkby, S. Phillips, G. Eaglesham, K. Thomas and M. Burch, 2001. Nodularin Uptake by Seafood During a Cyanobacterial Bloom. Environmental Toxicology, 16 (6):468-471. Vasconcelos, V.M., 1999. Cyanobacterial toxins in Portugal: effects on aquatic animal and risk for human health. Brazilian Journal of Medical and Biological Research, 32 (2): 249-254.
NIVA 4836 -2004
- 16 -
3.3 Microcystis in dietary supplements Gilroy et. al. (2000) have found that dietary supplements can be contaminated by microcystins. In tests preformed by the Oregon Health Division and the Oregon Department of Agriculture it was found that microcystins were present in 85 out of 87 samples. Sixty three samples contained concentrations higher than the guidance level of 1µg/g set by the Oregon Health Division (Gilroy et. al., 2000). Selected studies: Gilroy D.J., K.W. Kauffman, R.A. Hall, X. Huang and F.S. Chu, 2000. Assessing Potential Health Risk from Microcystin Toxins in Blue-Green Algae Dietary Supplements. Environmental Health Perspective, 108:435-439.
3.4 Methods for cyanotoxin water treatment The elimination of cyanobacterial toxins is complex (WHO & European Commission, 2002). This is due to the fact that as cyanobacteria age and die they release toxins into the water. Water treatment should not be an option until other techniques, such as selection of intake depth and use of barriers to restrict scum movement, have been used (Haider et al, 2003). The best option when faced with eutrophication in a drinking water reservoir is to depend on another source for water production. If this is not possible information to the affected parties is vital. Bottled drinking water may be an option (Falconer et. al., 1999). Falconer et. al. (1999) point out that with use of groundwater the risk of cyanobacteria contamination is almost negligable. Many cases of human injury from cyanotoxins have involved inappropriate treatment of water supplies, whereof treatment using copper sulphate is the most common. Toxins are released when cyanobacteria die and / or decay. While cells are young it is estimated that 70 to 90 % of the toxins are cell bound. As cells age free toxins can reach 70 % of the total. It is found to be easier to remove cell bound toxins than free toxins (WHO & European Commission, 2002). It is therefore preferable to remove cyanobacterial cells whilst still intact. The low-cost method of sand filtration might have some effect on the problem of cyanobacteria. This is due partly to the mechanical removal of particles and partly to heterotrophic activity of micro organisms and other consumers in the upper layers of the sand bed. This method is not efficient in removing dissolved toxins (Griffiths & Saker, 2003). Lam et. al. (1995) found that both alum and lime treatment of raw water for drinking water caused immediate removal of the floating cyanobacterial layer. Whereas treatment with alum can lead to a slight increase of microcystin-LR (hepatotoxin) in the water, lime treatment does not seem to lead to an increase of microcystins-LR of any significance. There was no regrowth of the cyanobacterial layer within the experimental period of 49 days. Both alum and lime treatment can also reduce phytoplankton bloom intensity the following year. For these reasons, lime seems to be
NIVA 4836 -2004
- 17 -
an effective chemical for the removal of cyanobacterial blooms from raw water lakes used for drinking water (Lam et. al., 1995). Selected studies: Griffiths, D.J. & M.L. Saker, 2003. The palm island mystery disease 20 years on: A review on the cyanotoxin cylindrospermopsin. Environmental Toxicology, 18 (2): 78-93. Hitzfeld, B.C., S.J. Höger and D.R. Dietrich, 2000. Cyanobacterial Toxins: Removal during Drinking Water Treatment, and Human Risk Assessment. Environmental Health Perspective, 108 (1): 113-122. Hoeger, S.J., D.R. Dietrich and B.C. Hitzfeld, 2002. Effects of Ozonation on the Removal of Cyanobacterial Toxins during Drinking Water Treatment. Environmental Health Perspective, 110 (11) 1127-1132. Howard, A., A.T. McDonald, P.E. Kneale and P.G. Whitehead, 1996. Cyanobacterial (blue-green algal) blooms in the UK: A review of the current situation and potential management options. Progress in Physical Geography, 20 (1): 53-61. Lam A.K.-Y, E.E. Prepas, D. Spink and S.E. Erudey, 1995. Chemical Control of Hepatotoxic Phytoplankton blooms: Implications for human health. Water Resource 29 (8): 1845-1854. Environment Canada, 2004. Canadian Guidance Framework for the Management of Phosphorus in Freshwater Systems. National Guidelines and Standards Office and Water and Coordination Directorate, Environment Canada, Ottawa.
3.5 Human defensive and avertive behaviour Buynder et. al. (2001) found that derived health alert levels seemed to protect the public during the Gippsland Lakes blooms. However it is found that prawn intake by locals far outweighs National survey estimates. Acute illness had been observed among some of the locals. In cases where drinking water is contaminated by cyanotoxins bottled water or different sources of water are possible alternatives. This means time, energy and possibly money spent on obtaining water. In some cases people might have to walk over long distances to obtain acceptable water, spending time and energy that may have been used for other purposes. This is especially relevant for rural and poor areas.
NIVA 4836 -2004
- 18 -
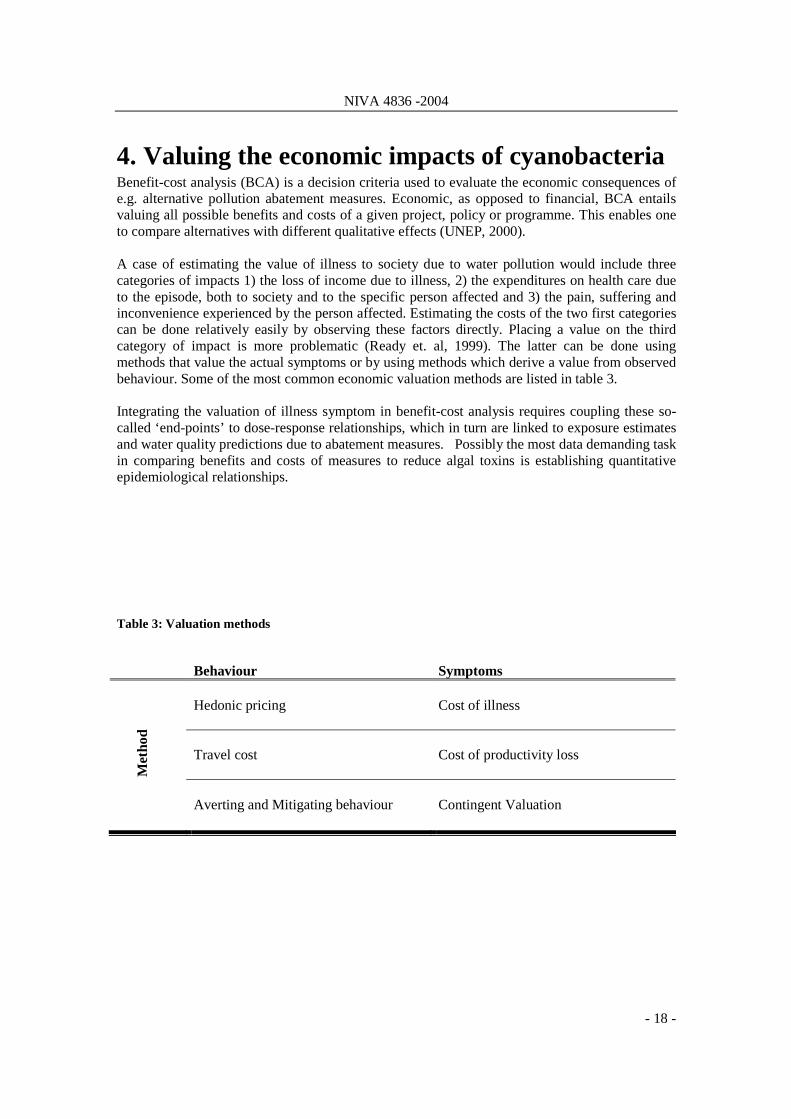
4. Valuing the economic impacts of cyanobacteria Benefit-cost analysis (BCA) is a decision criteria used to evaluate the economic consequences of e.g. alternative pollution abatement measures. Economic, as opposed to financial, BCA entails valuing all possible benefits and costs of a given project, policy or programme. This enables one to compare alternatives with different qualitative effects (UNEP, 2000). A case of estimating the value of illness to society due to water pollution would include three categories of impacts 1) the loss of income due to illness, 2) the expenditures on health care due to the episode, both to society and to the specific person affected and 3) the pain, suffering and inconvenience experienced by the person affected. Estimating the costs of the two first categories can be done relatively easily by observing these factors directly. Placing a value on the third category of impact is more problematic (Ready et. al, 1999). The latter can be done using methods that value the actual symptoms or by using methods which derive a value from observed behaviour. Some of the most common economic valuation methods are listed in table 3. Integrating the valuation of illness symptom in benefit-cost analysis requires coupling these so-called ‘end-points’ to dose-response relationships, which in turn are linked to exposure estimates and water quality predictions due to abatement measures. Possibly the most data demanding task in comparing benefits and costs of measures to reduce algal toxins is establishing quantitative epidemiological relationships. Table 3: Valuation methods
Behaviour
Symptoms
Hedonic pricing
Cost of illness
Travel cost
Cost of productivity loss
Met
hod
Averting and Mitigating behaviour
Contingent Valuation
NIVA 4836 -2004
- 19 -
Selected studies: Brookshire, D.S. & D. Whittington, 1993. Water Resource Issues in the Developing Countries. Water Resource Research 29 (7): 1883-1888. Davis, J. and D. Whittington, 1998. "Participatory" research for development projects: a comparison of the community meeting and household survey techniques. Economic Development and Cultural Change, 47 (1) 73-94. enHealth, 2003. Guidelines for Economic Evaluation of Environmental Health Planning and Assessment. Department of Health and Ageing and enHealth Council, Commonwealth of Australia. Freeman, A.M. and W.D. Shipman, 2000. The Valuation of Environmental Health Damages in Developing Countries: Some Observations. Economy and Environment Program of South East Asia, Special Paper. Freeman, A.M., 1991. Indirect methods for valuing changes in environmental risks with nonexpected utility preferences. Journal of Risk and Uncertainty, 4 (2): 153-165. Hutton, G., 2000. Considerations in evaluating the cost-effectiveness of environmental health interventions. Protection of Human Environment, Geneva. Hutton, G., 2002. Evaluation of the global non-health costs and benefits of water and sanitation interventions. Effectiveness, Quality and Cost Unit (EQC), Global Programme on Evidence (GPE), Evidence and Information for Policy (EIP), World Health Organization. Rozan, A, 2000. Health benefits induced by environmental quality: Are private costs negligible? Revue Economique, 51 (3) 595-608. UNEP, 2000. Planning and management of lakes and reservoirs: an integrated approach to eutrophication: a student guide. United Nation Environmental Program: International Environmental Technology Centre, Osaka/Shiga. Whittington, D., 1996. Administering Contingent Valuation Surveys in Developing Countries. Economy and Environment Program for South East Asia. Whittington, D., 2002. Improving the performance of contingent valuation studies in developing countries. Environmental and Resouce Economics, 22 (1-2): 323-367. World Bank, 1998. The Effects of Pollution on Health: The Economic Toll. In Pollution Prevention Handbook, Toward Cleaner Production. World Bank Group, Washington D.C.
NIVA 4836 -2004
- 20 -
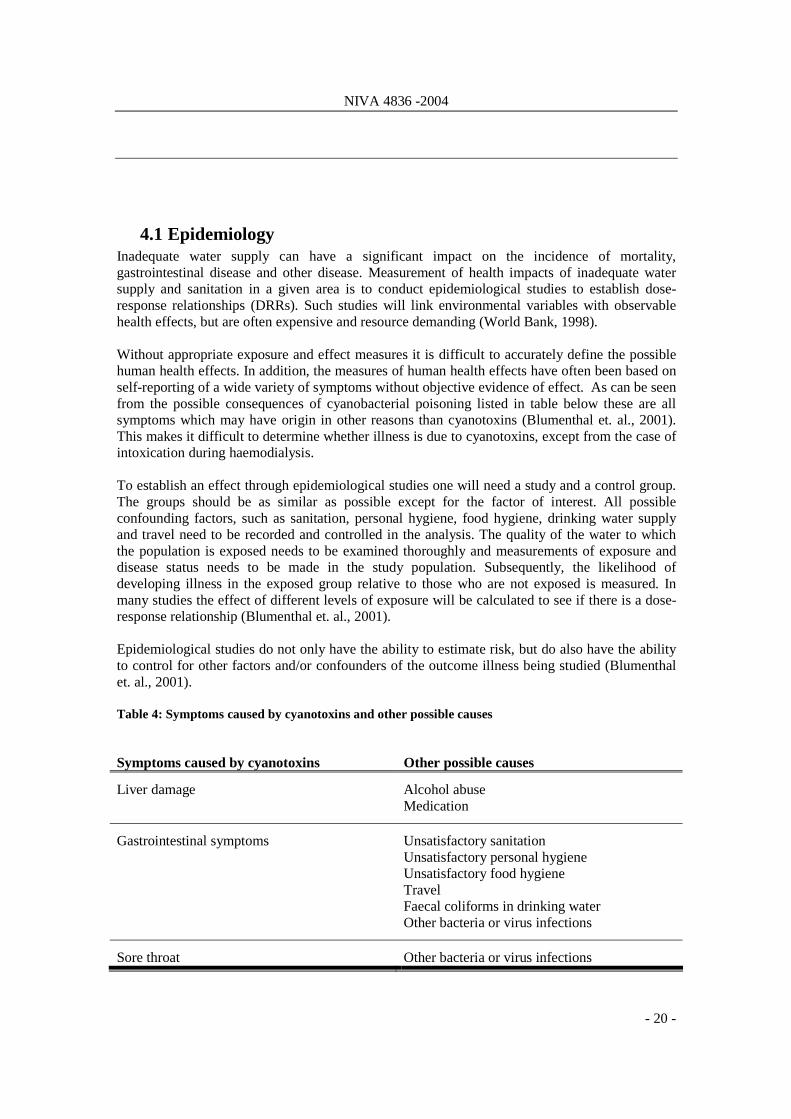
4.1 Epidemiology Inadequate water supply can have a significant impact on the incidence of mortality, gastrointestinal disease and other disease. Measurement of health impacts of inadequate water supply and sanitation in a given area is to conduct epidemiological studies to establish dose-response relationships (DRRs). Such studies will link environmental variables with observable health effects, but are often expensive and resource demanding (World Bank, 1998). Without appropriate exposure and effect measures it is difficult to accurately define the possible human health effects. In addition, the measures of human health effects have often been based on self-reporting of a wide variety of symptoms without objective evidence of effect. As can be seen from the possible consequences of cyanobacterial poisoning listed in table below these are all symptoms which may have origin in other reasons than cyanotoxins (Blumenthal et. al., 2001). This makes it difficult to determine whether illness is due to cyanotoxins, except from the case of intoxication during haemodialysis. To establish an effect through epidemiological studies one will need a study and a control group. The groups should be as similar as possible except for the factor of interest. All possible confounding factors, such as sanitation, personal hygiene, food hygiene, drinking water supply and travel need to be recorded and controlled in the analysis. The quality of the water to which the population is exposed needs to be examined thoroughly and measurements of exposure and disease status needs to be made in the study population. Subsequently, the likelihood of developing illness in the exposed group relative to those who are not exposed is measured. In many studies the effect of different levels of exposure will be calculated to see if there is a dose-response relationship (Blumenthal et. al., 2001). Epidemiological studies do not only have the ability to estimate risk, but do also have the ability to control for other factors and/or confounders of the outcome illness being studied (Blumenthal et. al., 2001). Table 4: Symptoms caused by cyanotoxins and other possible causes Symptoms caused by cyanotoxins
Other possible causes
Liver damage
Alcohol abuse Medication
Gastrointestinal symptoms
Unsatisfactory sanitation Unsatisfactory personal hygiene Unsatisfactory food hygiene Travel Faecal coliforms in drinking water Other bacteria or virus infections
Sore throat
Other bacteria or virus infections
NIVA 4836 -2004
- 21 -
It is difficult to quantify the health risk posed by cyanotoxins since the actual exposure and resulting effects have not been conclusively determined. This is especially true for the human situation (Blumenthal et. al, 2001). It is generally easier to determine whether symptoms have origin in cyanobacterial intoxication in cases of acute poisoning, compared to cases where victims have been exposed to smaller amounts of the toxins over longer periods of time. In cases of acute poisoning that health personnel will often be more alert in trying to determine reasons for illness, possible investigating alternative sources of contamination etc. This was shown in the so-called “mystery disease” case from Palm Island, Australia, where more than 100 children were emitted to hospital (Griffiths and Saker, 2003). It is also harder to determine whether illness originates from cyanobacterial intoxication in areas where symptoms related to cyanotoxins are relatively common. Diarrhoea among infants is a widespread problem in low-income countries (Esray et. al., 1991). Sanitation may also be unsatisfactory. In such cases it is not likely that a thorough investigation into the reason behind such symptoms is conducted, unless one is dealing with an incident involving mass poisoning. In addition to cyanobacterial toxins damages to the liver among adults can be attributed to alcohol abuse or to the use of certain medication over longer periods of time. The use of medication in a population may be possible to map, but determining the alcohol abuse is far more complicated due to social taboos. To determine whether liver damages among a population is due cyanobacterial intoxication one depends on being able to determine which sources of drinking water are contaminated, who drinks it and whether this part of the population have a higher risk of liver disease than those who have different sources of drinking water. Ideally, to prove that human poisoning originates in cyanobacteria, the toxic organism or toxins need to be identified in the body of the victim together with evidence of access to toxic material (Kuiper-Goodman et. al., 1999). The limitation of epidemiological studies is the need for large sample sizes to uncover very small increases in risk, and in the costs incurred and the expertise needed to produce a good study (Blumenthal et. al., 2001). In one of the few published epidemiological studies on algal toxins found in this review, researchers spent two years and collected 1135 interviews to perform epidemiological studies in China to establish the correlation between drinking water source and primary liver cancer (Ueno et. al, 1996).
4.2 Valuation of illness symptoms The problems of valuing health impacts from water pollution as such can be divided into two groups. First there is the difficulty of the actual identification and measurement of health impacts. Secondly there is the problem of putting actual values to the associated illness and possible death (World Bank, 1998). As we have seen in table 3 the valuation methods that can be used to value health impacts can be conceptually differentiated based on whether they value behaviour or symptoms associated with illness.
NIVA 4836 -2004
- 22 -
4.2.1 Valuing symptoms The costs of illness method is generally based on costs incurred at the household level. These costs can be divided into two categories;
1. Medical expenses to treat illness 2. Lost wages because of days spent at home due to illness (World Bank, 1998).
The cost of productivity loss method is evaluated at firm level, calculating lost net income due to worker illness. Where the firm and household overlap as production units care must be taken to avoid double counting of impacts. Both the cost of illness method and the cost of productivity loss method are relatively easy to apply since both medical expenses, lost wages can production levels can be relatively easily observed. The methods leave out the actual pain, suffering and inconvenience experienced by the person that is affected. Methods based on stated, rather than observed or revealed, preferences of households are designed to put a value on pain and suffering. The contingent valuation method estimates values through the use of survey information to determine what people are prepared to pay for reduced likelihood of morbidity or mortality (World Bank, 1998). This is a method of stated preference and differs from the other methods listed, which are all methods based on observed behvaiour. Contingent valuation studies can include epidemiological questions since the sample sizes are normally relatively large, though they are not as large and not cover the same time span as many epidemiological surveys. The epidemiological questions asked in contingent valuation studies are case-control questions. Case-control studies are not regarded to be useful in epidemiological studies when the objective is to map disease status. This is due to recall bias in the measurement of exposure to disease. Recall bias occurs when the reporting of disease status is different depending on the exposure status (Blumenthal et. al., 2001). Despite all this, the contingent valuation method (CVM) is the only method for valuing benefits of improved water quality due to pain and suffering. Survey respondents are asked to imagine a situation where it is possible to trade money for better health. How the respondents answer reveal information on the value the respondent place on the alternative health outcome (Ready et. al, 1999). Surveys used for purposes like this typically include a variety of questions and are often presented to the head of the household. The survey starts with general questions such as gender and age and moves via more specific questions on water supply and how much the respondent is willing to pay to have tapped and cleaned water for different purposes. If it is of relevance one can also include questions on sewage. At the end questions such as family income, education and health are asked. The values that are derived give an average of what people are willing to pay for better water supply. The surveys are also designed to give information on which other variables willingness to
NIVA 4836 -2004
- 23 -
pay correlates with. For example, whether there is any statistical significant relationship between level of income, education or how often the respondent is ill and their willingness to pay. As a survey based method at household level epidemiological type questions may be included in CVM if no such information is previously available in the study. However, it is important to stress that establishing a relationship between willingness to pay to avoid symptoms and household descriptors such as income, is statistically less demanding than identifying the cause of symptoms while controlling for confounding factors of household lifestyles. There are few examples of such epidemiological studies for algal toxins, meaning that benefit-cost analysis must be based on assumptions of a dose-response relationship.
4.2.2 Using behaviour as a measure of willingness to pay Averting and mitigating behaviour estimates a value by calculating what people spend to avoid a particular happening. For example: to avoid becoming ill from drinking tap water people buy bottled water, i.e. an alternative good. The method based on averting and mitigating behaviour derives estimates based on defensive expenditures, that is, money paid for marked goods thought to reduce the chances of illness (Ready et. al, 1999). Valuation measures like this provide a theoretically acceptable and practicable alternative to the contingent valuation method (Dasgupta, 2004). Hedonic pricing estimates the value of property based on observed property characteristics, including environmental quality. When real estate information is available covering properties facing different environmental quality - e.g. distance to drinking water of acceptable quality, or sanitation – it is sometimes possible to identify the marginal value of improvement in the environmental factor while controlling for other property characteristics (size, no of rooms, etc.) The travel cost method estimates the value of recreational locations by calculating the money that people spend travelling different distances to experience a particular location. Travel expenditures are used to estimate demand curves for specific locations, which in turn are used to determine how people may be willing to pay above and beyond what they actually spent (also called ‘consumer surplus’). When multiple destinations with varying e.g. water quality are available it is sometimes possible to observe how much of the additional travel expenditure is due to choosing a cleaner location. If the nearest beach is polluted people will spend money to go to another beach that is further away and less polluted. Problems in all valuation studies of observed behaviour are that some factors are unobservable or complicated by other positive or negative side effects from the use of the market good. People may pay for bottled water not only because they do not want to risk becoming ill, but perhaps also because they prefer the taste. If other non-environmental factors explaining choice are not controlled for, the value of avoiding illness can not be identified (Ready, et. al, 1999).
4.2.3 On the limitations of economic valuation of algal toxins Clean water and a safe water supply are seen as necessities to everyone. An ethical argument may be that investments in cleaner water are a human right and that the use of CBAs is unnecessary. However, as long as investment funds are limited one should try to allocate investments to projects where net benefits are largest. Water treatment projects require that
NIVA 4836 -2004
- 24 -
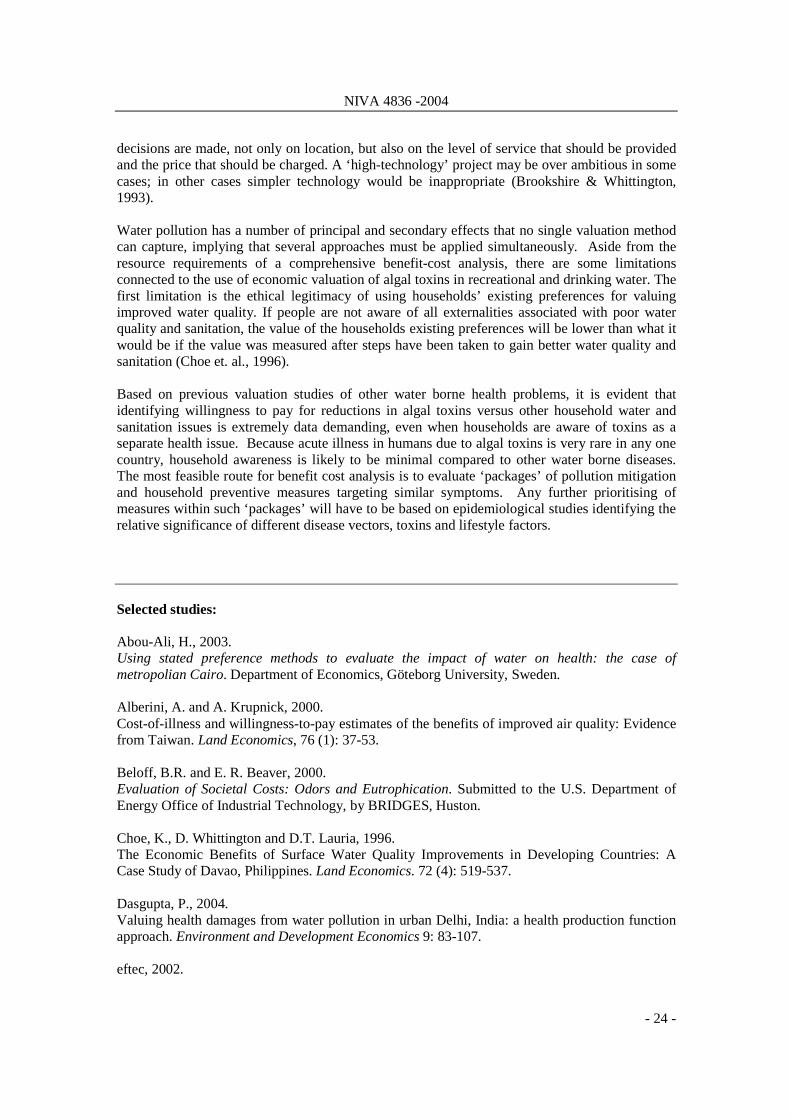
decisions are made, not only on location, but also on the level of service that should be provided and the price that should be charged. A ‘high-technology’ project may be over ambitious in some cases; in other cases simpler technology would be inappropriate (Brookshire & Whittington, 1993). Water pollution has a number of principal and secondary effects that no single valuation method can capture, implying that several approaches must be applied simultaneously. Aside from the resource requirements of a comprehensive benefit-cost analysis, there are some limitations connected to the use of economic valuation of algal toxins in recreational and drinking water. The first limitation is the ethical legitimacy of using households’ existing preferences for valuing improved water quality. If people are not aware of all externalities associated with poor water quality and sanitation, the value of the households existing preferences will be lower than what it would be if the value was measured after steps have been taken to gain better water quality and sanitation (Choe et. al., 1996). Based on previous valuation studies of other water borne health problems, it is evident that identifying willingness to pay for reductions in algal toxins versus other household water and sanitation issues is extremely data demanding, even when households are aware of toxins as a separate health issue. Because acute illness in humans due to algal toxins is very rare in any one country, household awareness is likely to be minimal compared to other water borne diseases. The most feasible route for benefit cost analysis is to evaluate ‘packages’ of pollution mitigation and household preventive measures targeting similar symptoms. Any further prioritising of measures within such ‘packages’ will have to be based on epidemiological studies identifying the relative significance of different disease vectors, toxins and lifestyle factors. Selected studies: Abou-Ali, H., 2003. Using stated preference methods to evaluate the impact of water on health: the case of metropolian Cairo. Department of Economics, Göteborg University, Sweden. Alberini, A. and A. Krupnick, 2000. Cost-of-illness and willingness-to-pay estimates of the benefits of improved air quality: Evidence from Taiwan. Land Economics, 76 (1): 37-53. Beloff, B.R. and E. R. Beaver, 2000. Evaluation of Societal Costs: Odors and Eutrophication. Submitted to the U.S. Department of Energy Office of Industrial Technology, by BRIDGES, Huston. Choe, K., D. Whittington and D.T. Lauria, 1996. The Economic Benefits of Surface Water Quality Improvements in Developing Countries: A Case Study of Davao, Philippines. Land Economics. 72 (4): 519-537. Dasgupta, P., 2004. Valuing health damages from water pollution in urban Delhi, India: a health production function approach. Environment and Development Economics 9: 83-107. eftec, 2002.
NIVA 4836 -2004
- 25 -
Valuation of Benefits to England and Wales of a Revised Bathing Water Quality Directive and Other Beach Characteristics Using the Choice Experiment Methodology. Submitted to Department of Environment, Food and Rural Affairs by Economics for the Environment Consultancy Ltd, London. Gnedenko, E., Z. Gorbunova and G. Safonov, 1998. Contingent Valuation of drinking water quality in Samara city. Moscow State University, Moscow. Griffin, C.C., J. Briscoe, B. Singh, R. Ramasubban and R. Bhatia, 1995. Contingent Valuation and Actual Behaviour - Predicting Connections to New Water-System in the State of Kerala, India. World Bank Economic Review, 9 (3): 373-395. Henson, S., 1996. Consumer willingness to pay for reductions in risk of food poisoning in the UK. Journal of Agriculture Economics, 47 (3): 403-420. Hökby, S., 2000. Demand for a Reduced Eutrophication in the Baltic Sea - is a Reduced Nitrogen Load to the Baltic Sea a Luxury Good? Master Thesis, Department of Economics. Stockholm. Kontogianni, A., I.H. Langford, A. Papandreou and M.S. Skourtos, 2003. Social preferences for improving water quality: An economic analysis from wastewater treatment. Water Resource Management, 17 (5): 317-336. Machado, F.S. and S. Mourato, 2002. Evaluating the multiple benefits of marine water quality improvements: how important are health risk reductions? Journal of Environmental Management, 65 (3): 239-250 McConnel, K.E. and M.A. Rosado, 2000. Valuing discrete improvments in drinking water quality through revealed preferences. Water Resource Research, 36 (6): 1575-1582. Mohany, J.C., T.E. Ford, J.J. Harrington and V. Lakshmipathy, 2002. A cross-sectional study of enteric disease risks associated with water quality and sanitation in Hyderabad City. Journal of Water Supply Research and Technology-Aqua, 51 (5): 239-251. Pearson, M.J., I.J. Bateman and G.A. Codd, 2001. Measuring the Recreational and Amenity Values affected by Toxic Cyanobacteria: a Contingent Valuation Study of Rutland Water, Leichestershire. In: Turner, E.K., I.J. Bateman and W.N. Adger. Economics of Costal and Water Resources: Valuing Environmental Functions. Kluwer, Dordrecht, The Netherlands, pp. 67-89. Ready, R.C. S. Navrud, B. Day, R. Dubourg, F. Machado, S. Mourato, F. Spanninks and M.X.V. Rodriquez, 1999. Benefit Transfer in Europe. Are Values Consistent Across Countries? Paper presented at the EVE Workshop on Benefit Transfer (EU Concerted Action: Environmental Valuation in Europe (EVE)), Lillehammer, October 14-16 1999. Accepted for publication in "Environmental and Resource Economic" 2004.
NIVA 4836 -2004
- 26 -
Subramanian, L., 2003. A simple cost-benefit analysis of prevention of fresh water eutrophication through a contingent valuation survey. MSc Thesis, University of East Anglia, Norwich. Ukoli-Onodipe, G., 2003. Designing optimal water supply systems for developing countries. Dissertation, The Ohio State University, Ohio. UPDATE Project Team, 2002. Final Report. Urban Poor Data Acquisition and Technical Evaluation: Update Project. United States Asia Environmental Partnership (USAEP), FORKAMI, and Research Triangle Institute. Younes M. and J. Bartram, 2001. Waterborne health risks and the WHO perspective. International Journal of Hygiene and Environmental Health, 204 (4): 255-263.
NIVA 4836 -2004
- 27 -
5. Cited references
Annadotter, H., G. Cronberg, L. Lawton, H.B. Hansson, U. Göthe, O. Skulberg, 2001. An Extensive Ourbreake of Gastroenteritis Associated with the Toxic Cyanobacterium Planktothrix agardhii (Oscillatoriales, Cyanophyceae) in Scania, Sweden. In Chorus, I, ed, 2001. Cyanotoxins, occurrence, causes, consequences. Springer Heidelberg, Berlin, pp. 200-208.
Blumenthal, U.J., J.M. Fleisher, S.A. Esrey and A. Peasey, 2001. Epidemiology: a tool for the assessment of risk. In Fewtrell, L., & J. Bartram ed, 1999. Water Quality: Guidelines, Standards and Health, IWA Publishing, London.
Brookshire, D.S. & D. Whittington, 1993. Water Resource Issues in the Developing Countries. Water Resource Research 29 (7): 1883-1888.
Carmichael, W.W., S.M.F.O. Azevedo, J.S. An, R.J.R. Molica, E.M. Jochimsen, S. Lau, K.L. Rinehart, G.R. Shaw and G.K. Eaglesham, 2001. Human Fatalities from Cyanobacteria: Chemical and Biological Evidence for Cyanotoxins. Environmental Health Perspective, 109: 663-668
Choe, K., D. Whittington and D.T. Lauria, 1996. The Economic Benefits of Surface Water Quality Improvements in Developing Countries: A Case Study of Davao, Philippines. Land Economics. 72 (4): 519-537.
Codd, G.A., A. Oberemm and M. Tarczynska, 2004. Recognition and awareness-raising of toxic cyanobacterial blooms and associated poisonings at Lake Barlewice, Poland, in 1884 and recent cyanobacterial toxic analyses. Ecohydrology & Hydrobiology 4 (1): 3-6.
Dasgupta, P., 2004. Valuing health damages from water pollution in urban Delhi, India: a health production function approach. Environment and Development Economics 9: 83-107.
Falconer, I., J. Bartram, I. Chorus, T. Kuiper-Goodman, H. Utkilen, M. Burch, and G.A. Codd, 1999. Safe levels and Safe Practices. In Chorus I. and J. Bartram, 1999. Toxic cyanobacteria in water. A guide to their public health consequences, monitoring and management. Published by E & FN Spon on behalf of the World Health Organization.
NIVA 4836 -2004
- 28 -
Fitzgerald, D.J., D.A. Cunliffe and M.D. Burch, 1999. Development of health alerts for cyanobacteria and related toxins in drinking water in South Australia. Environmental Toxicology, 14 (1): 203-209.
Fitzgerald, J., 2001. Cyanotoxins and Human Health – Overview. In Chorus, I, ed, 2001. Cyanotoxins, occurrence, causes, consequences. Springer Heidelberg, Berlin, pp. 179-190.
Gilroy D.J., K.W. Kauffman, R.A. Hall, X. Huang and F.S. Chu, 2000. Assessing Potential Health Risk from Microcystin Toxins in Blue-Green Algae Dietary Supplements. Environmental Health Perspective, 108:435-439.
Griffiths, D.J. & M.L. Saker, 2003. The palm island mystery disease 20 years on: A review on the cyanotoxin cylindrospermopsin. Environmental Toxicology, 18 (2): 78-93.
Haider, S., V. Naithani, P.N. Viswanathan and P. Kakkar, 2003. Cyanobacterial toxins: a growing environmental concern. Chemosphere 52 (1): 1-21.
Hitzfeld, B.C., S.J. Höger and D.R. Dietrich, 2000. Cyanobacterial Toxins: Removal during Drinking Water Treatment, and Human Risk Assessment. Environmental Health Perspective, 108 (1): 113-122.
Humpage, A.R., J. Rositano, A.H. Bretag, R. Brown, P.D. Baker, B.C. Nicholson and D.A. Steffensen, 1994. Paralytic Shellfish Poisons from Australian Cyanobacterial Blooms. Australian Journal of Marine and Freshwater Research, 45 (5): 761-771.
Kuiper-Goodman, T., I. Falconer and J. Fitzgerald, 1999. Human Health Aspects. In Chorus I. and J. Bartram, 1999. Toxic cyanobacteria in water. A guide to their public health consequences, monitoring and management. Published by E & FN Spon on behalf of the World Health Organization.
Lam A.K.-Y, E.E. Prepas, D. Spink and S.E. Erudey, 1995. Chemical Control of Hepatotoxic Phytoplankton blooms: Implications for human health. Water Resource 29 (8): 1845-1854.
NIVA 4836 -2004
- 29 -
Magalhães, V.F., R.M. Soares and S.M.F.O. Azevedo, 2000. Microcystin contamination of fish from the Jacarepaguá Lagoon (Rio de Janeiro, Brazil): ecological implication and human health risk. Toxicon, 39:1077-1085.
Penaloza, R., M. Rojas, I. Vila and F. Zambrano, 1990. Toxicity of a Soluble Peptide from Microcystis SP to Zooplankton and Fish. Freshwater Biology, 24 (2): 233-240.
Pilotto, L.S., R.M. Douglas, M.D. Burch, S. Cameron, M. Beers, G.J. Rouch, P. Robinson, M. Kirk, C.T. Cowie, S. Hardiman, C. Moore and R.G. Attewell. Health effects of exposure to cyanobacteria (blue-green algae) during recreational water-related activities. Australia and New Zealand Journal of Public Health, 21 (6): 562-566.
Ready, R., S. Navrud, B. Day, R. Dubourg, F. Machado, S. Mourato, F. Spanninks and M.X.V. Rodriquez, .Contingent Valuation of Ill Health Caused by Pollution: Testing for Context and Ordering Effects . http://www.personal.psu.edu/faculty/r/c/rcr10/context.pdf.
Rodger, H.D., T. Turnbull, C. Edwards and G.A. Codd, 1994. Cyanobacterial (blue-green-algal) Bloom associated Pathology in Brown Trout, Salmo-trutta, in Loch Leven, Scotland. Journal of Fish Disease, 17 (2): 177-181.
Torokne, A., A. Palovics and M. Bankine, 2001. Allergenic (Sensitization, Skin and Eye irritation) Effects of Freshwater Cyanobacteria – Experimental Evidence. Environmental Toxicology, 16 (6): 512-516.
Ueno, Y., S. Nagata, T. Tsutsumi, A. Hasegawa, M.F. Watanabe, H.D. Park, G.C. Chen and S.Z. Yu, 1996. Detection of microcystins, a blue-green algal hepatoxin, in drinking water sampled in Haimen and Fusui, endemic areas of primary liver in China, by highly sensitive immunoassay. Carcinogenesis, 17 (6): 1317-1321.
UNEP, 2000. Planning and management of lakes and reservoirs: an integrated approach to eutrophication : a students guide. United Nation Environmental Program: International Environmental Technology Centre, Osaka/Shiga.
Van Buynder, P.G., T. Oughtred, B. Kirkby, S. Phillips, G. Eaglesham, K. Thomas and M. Burch, 2001. Nodularin Uptake by Seafood During a Cyanobacterial Bloom. Environmental Toxicology,16 (6):468-471.
NIVA 4836 -2004
- 30 -
WHO & European Commission, 2002. Eutrophication and health. Office for Official Publications of the European Communities, Luxembourg.
WHO, 2003. Guidelines for Safe Recreational Water Environments Volume 1: Coastal and Fresh Waters. World Health Organization, Water Sanitation and Health
World Bank, 1998. The Effects of Pollution on Health: The Economic Toll. In Pollution Prevention Handbook, Toward Cleaner Production. World Bank Group, Washington D.C.
NIVA 4836 -2004
31
6. Appendix – keywords map
Costs related to the consequences of toxic cyanobacteria in water
Awareness/ consumption of risk of contaminated water
Costs of contaminated / polluted water
Valuation of health effects / impacts / risks of water pollution
Cost of water
Clean water benefit / benefit of water quality
(Toxic) Cyanobacterial
(Extracellular) Microsystis
Disease caused by contaminated water
Drinking water quality Deteriorated
water quality
Sanitary inspections
Fish
Tourism
Industry
Household
Epidemiological
Pathogens
Waterborne disease
Gastrointestinal (Gastrointerties) Hepatic illness Hepao-enteritis (liver)Cancer Hepatitis Kidney (dialysis) Renal dialysis Vibrio cholerae
Microbiological problems
Phytoplankton biomass
Eutrophication
Hazard analysis of Critical Control Points (HACCP)
External nutrient input
Nitrogen and Phosphorus
Agriculture and erosion
Water supplies
Domestic wastewater
Tourism
Human and animal poisoning
Epidemiological evidence Toxicologica
l studies
Recreational use of water
Human health
Change water use
WHO guideline value (TDI =tolerable daily intake)
Different segments population
Fish consumption
Change in water use
Behavior
Economic valuation Non-market valuation
Economic losses
NIVA 4836 -2004
32
7. Annotated bibliography 1.1. General 1.2. Health
1.2.1. National and international reports and guidelines 1.2.2. Human exposure 1.2.3. Experiments and development of guideline values 1.2.4. Animal and fish exposure 1.2.5. Dietary supplements 1.2.6. Cyanobacteria control
1.3. Economy 1.3.1. Water quality 1.3.2. Contingent valuation studies 1.3.3. Valuation studies 1.3.4. Outline / discussion; valuation methods 1.3.5. Further use of contingent valuation studies
NIVA 4836 -2004
33
1.1 General Chorus, I, ed., 2001. Cyanotoxin,, occurrence, causes, consequences. Springer Heidelberg, Berlin. The book consists of chapters written by different scientists in the cyanobacteria field. Provides a thorough investigation in several of the important fields that concerns cyanobacteria, such as; occurrence in freshwater with examples from different countries, factors controlling cellular microcystis content, factor affecting cyanotoxins concentrations in natural populations, human exposure, effects on freshwater organisms, toxic effects and substances of cyanobacteria other than microcystis, anatoxin-a and saxitoxins, contributions to toxicity testing and toxic analysis, and routine analytic methods applied in the German Cyanotox Project.
Chourus, I and J. Bartram, ed, 1999. Toxic Cyanobacteria in Water: A guide to health consequences, monitoring and management. WHO, London. Describes the present state of knowledge regarding the impact of cyanobacteria on health through the use of water. It considers aspects of risk management and outlines the information needed to protect drinking water sources and recreational waters from health hazards caused by cyanobacteria and their toxins. It also outlines the state of knowledge considering the design of programmes, studies for monitoring water resources and supplies and the approaches and procedures used.
1.2 Health
1.2.1 National and international reports and guidelines
Chorus, I., I.R. Falconer, H.J. Salas and J. Bartram, 2000. Health risks caused by freshwater cyanobacteria in recreational waters. Journal of Toxicology and Environmental Health - Part B-Critical Reviews, 3 (4): 323-347. Presents an overview of the current knowledge on cyanotoxins and of documented cases of human illness that can be contributed to cyanotoxins. The WHO guidelines for recreational waters are presented. Also provides proposals for management of risks caused by cyanotoxins. A brief overview over most sides of cyanobacterias in freshwater and the health risks that they cause.
NIVA 4836 -2004
34
Environment Canada, 2004. Canadian Guidance Framework for the Management of Phosphorus in Freshwater Systems. National Guidelines and Standards Office and Water and Coordination Directorate, Environment Canada, Ottawa. Provides a framework for the management of phosphorus in freshwater systems. The Guideline Framework is intended to deal specifically with toxic substances and focuses on the possible adverse effects of abundance levels of phosphorus. The Guideline Framework offers a tiered approach (i) phosphorus concentrations should not exceed predefined ‘trigger ranges’ and (ii) phosphorus concentrations should not increase more than 50% over baseline levels.
WHO & European Commission, 2002. Eutrophication and health. Office for Official Publications of the European Communities, Luxembourg. The booklet describes the causes of eutrophication, the environmental effects, the associated nuisances and health risks as well as the preventive and mitigating measures in a simple way. Provides a good overview of different toxic substances found in cyanobacterias and which problems they cause as well as reported cases of toxic cyanobacterial blooms.
WHO, 2003. Guidelines for Safe Recreational Water Environments Volume 1: Coastal and Fresh Waters. World Health Organization, Water Sanitation and Health Discusses briefly most aspects of cyanobacterial toxins and cyanobacterial blooms. Focus on the adverse effects in recreational waters. Gives an insight to the occurrence and formation of cyanobacterial blooms and gives an overview to the different toxins that they might contain. Discusses evidence of both human and animal poisonings from cyanobacterial toxins. Gives guideline values for recreational waters with relatively thorough discussions. Also discusses briefly management options.
NIVA 4836 -2004
35
1.2.2 Human exposure
Carmichael, W.W., S.M.F.O. Azevedo, J.S. An, R.J.R. Molica, E.M. Jochimsen, S. Lau, K.L. Rinehart, G.R. Shaw and G.K. Eaglesham, 2001. Human Fatalities from Cyanobacteria: Chemical and Biological Evidence for Cyanotoxins. Environmental Health Perspective, 109: 663-668. In Caruaru, Brazil, 76 patients died after routine hemodialysis treatment. Of a total of 131 patients, 116 experienced visual disturbance, nausea and vomiting. 100 of these developed liver failure and 76 died. After having examined the clinic’s water treatment system, the clinic’s water source and liver tissues of clinic patients one identified two groups of cyanobacterial toxins. Comparison of the victim’s symptoms and pathology with results from animal studies led to the conclusion that microcystins was a major contributor to the deaths of these patients.
Codd, G.A., A. Oberemm and M. Tarczynska, 2004. Recognition and awareness-raising of toxic cyanobacterial blooms and associated poisonings at Lake Barlewice, Poland, in 1884 and recent cyanobacterial toxic analyses. Ecohydrology & Hydrobiology 4 (1): 3-6. In 1884 mass mortalities of fish, birds and farm animals and human skin irritations were contributed to exposure to scum containing potentially toxic cyanobacteria by Berthold Benecke. Benecke took steps to obtain further information on the cyanobacterial toxins and to raise awareness on the health hazards of these toxins. 122 years later scum samples from this sight contained both hepatoxins and neurotoxins. Beneckes actions are discussed in relation to modern reqirements.
Elsaadi, O., A.J. Esterman, S. Cameron and D.M. Roder, 1995. Murray River Water, Raised Cyanobacterial Cell Counts, and Gastrointestinal and Dermatological Symptoms. Medical Journal of Australia 162 (3): 122-125. The objective of this study is to determine whether exposure to Murray River during a period of cyanobacterial blooms have resulted in gastrointestinal and dermatological symptoms. Further it is studied whether these symptoms were related to cyanobacterial cell counts for samples drawn from the river close to the intake points of town water supplies. Although there is some consistence between the results the evidence for adverse health effects caused by cyanotoxins is only suggestive.
NIVA 4836 -2004
36
Esrey, S.A., 1996. Water, waste, and well-being: A multicountry study. American Journal of Epidemiology, 143 (6): 608-623. A multi-country epidemiological study of the role of improved water supply and sanitation to health. Anthropometric measures and diarrhoea prevalence in children were analysed. A large study with a total of 16880 individuals involved. Found that improvements in sanitation had health impacts for diarrhoea and anthropometric factors even when water was unimproved. Improvement in water did not result in health impacts if sanitation remained unimproved. Improvements in water and sanitation together created larger impacts than any one alone.
Esrey, S.A., J.B. Potash, L. Roberts and C. Shiff, 1991. Effects of improved water-supply and sanitation on Ascariasis, Diarrhea, Dracunculiasis, Hookworm Infections, Schistosomiasis, and Trachoma. Bulletin of the World Health Organization, 69 (5): 609-621. Discusses the role of water supply / quality and sanitation in reducing incidences of various gastrointestinal diseases, as well as child mortality. The diseases chosen are all widespread in developing countries. The diseases also show the variety of mechanisms through which improved water and sanitation can promote health. Considers sanitation, water quality, personal hygiene and domestic hygiene. Briefly discusses how improved water supply and sanitation can be expected to improve other aspects of health, and how the benefit of improvements in water supply and sanitation is often underestimated.
Fleming, L.E., J. Easom, D. Baden, A. Rowan and B. Levin, 1999. Emerging Harmful Algal Blooms and Human Health: Pfiesteria and related organisms. Toxicologic Pathology, 27 (5): 573-581. The study discusses Pfiesteria piscicida and Pfiesteria-like organisms and evaluates the existing literature on these organisms. The focus is on public health effects. Gives an overview of the nature of harmful algal blooms with special attention to Pfiesteria piscicida and its effects on the surrounding environment. The study also gives a presentation of epidemiological studies that have been preformed in association with Pfiesteria piscicida.
NIVA 4836 -2004
37
Gracey, M., 1994. Gastrointestinal Infections in Children. Current Opinion in Gastroenterology, 10 (1): 88-97. Describes a cyanobacterium-like body found in patients with prolonged diarrhoea along with other reports on micro organisms that seem to be of importance to gastrointestinal infections in children. Discusses the various risk factors of acute diarrhoea, such as; malnutrition, unhygienic conditions, low family income and exposure to day care centres.
Pilotto, L.S., R.M. Douglas, M.D. Burch, S. Cameron, M. Beers, G.J. Rouch, P. Robinson, M. Kirk, C.T. Cowie, S. Hardiman, C. Moore and R.G. Attewell, 1997. Health effects of exposure to cyanobacteria (blue-green algae) during recreational water-related activities. Australia and New Zealand Journal of Public Health, 21 (6): 562-566. The study aims to investigate effects on health of exposure to cyanobacteria as a result to recreational activities. Participants were first interviewed at the beach and then followed up by phone calls. After 7 days there was a significant trend to increasing symptom occurrence with increase in cell counts. Participants exposed to more than 5000 cells per mi, for more than 1 hour had significantly higher symptom occurrence than the unexposed. Suggests that the current safety guidelines of 20 000 cells per mi may be too high.
Torokne, A., A. Palovics and M. Bankine, 2001. Allergenic (Sensitization, Skin and Eye irritation) Effects of Freshwater Cyanobacteria – Experimental Evidence. Environmental Toxicology, 16 (6): 512-516. Discusses an experiment done on guinea pigs and albino rats on the allergic reactions of diverse cyanobacterias in relation to their toxic content. Also lists some of the reports that have been on human allergic reactions to cyanobacteria. Concludes that there is no correlation between the level of toxins in the cyanobacteria and allergic reactions. Contributes the allergic reactions to lipopolysaccharides of contaminated bacterial flora. Encourages that both the toxic content and biomass of the water should be determined as well as the allergic reactions during cyanobacterial blooms and scums.
NIVA 4836 -2004
38
Ueno, Y., S. Nagata, T. Tsutsumi, A. Hasegawa, M.F. Watanabe, H.D. Park, G.C. Chen and S.Z. Yu, 1996. Detection of microcystins, a blue-green algal hepatoxin, in drinking water sampled in Haimen and Fusui, endemic areas of primary liver in China, by highly sensitive immunoassay. Carcinogenesis, 17 (6): 1317-1321. An epidemiological survey for the cause of a high incidence of primary liver cancer (PLC) in certain areas of China. A close correlation was found between the drinking of pond and ditch water and the incidence of PLC. Three trials, with a total of 1135 samples, were carried out in 1993-1994 to survey the drinking water. A high frequency of microcysits was detected in the water ponds / ditches and rivers, but not in shallow and deep wells. This supports the suspicion that the presence of microcystis in the drinking water is some of the reason for the high incidence of PLC in China. An advisory level of below 0.01 mµ g/l is proposed to microcystis in drinking water.
1.2.3 Experiments and development of guideline values
Fitzgerald, D.J., D.A. Cunliffe and M.D. Burch, 1999. Development of health alerts for cyanobacteria and related toxins in drinking water in South Australia. Environmental Toxicology, 14 (1): 203-209. Fitzgerald et. al. have derived health alert values for short time acute exposure to cyanotoxins through drinking water. These calculations are based on the same model as the provisional WHO guidelines, but another level of non-observable adverse health effects and uncertainty factor have been applied. This has given a considerable higher health alert level the WHO guidelines for lifelong consumption.
Fromme, H., A. Kohler, R. Krause and D. Fuhrling, 2000. Occurrence of cyanobacterial toxins - Microcystis and anatoxin-a - in Berlin water bodies with implications to human health and regualtions. Environmental Toxicology, 15 (2): 120-130. The aim of this study is to provide exposure data for cyanobacterial toxins in Berlin lakes and to establish a quick and valid screening method to monitor these substances in environmental water samples. Health implications for people using the lakes for swimming and recreation were assessed. The study analyses concentrations of microcystin (MC), anatoxin-a, chlorophyll-a and cyanobacterial biomass in surface water. Estimates that for children, a single intake of 25 µg MC-LR has no adverse effects and under conservative uptake assumptions for contaminated water a concentration of 100 µg MC/L in surface water is safe. Regulations to health and water authorities are proposed on this basis.
NIVA 4836 -2004
39
Haider, S., V. Naithani, P.N. Viswanathan and P. Kakkar, 2003. Cyanobacterial toxins: a growing environmental concern. Chemosphere 52 (1): 1-21. This article provides an overview of the morphology and taxonomy of three toxic blue-green algae; Anabaena, Microcystis and Nodularin, their possible sources of contamination and their potential to cause hepatotoxicity and neurotoxicity. The article also includes a detailed description of different cyanotoxins and how they act. Presents reports of acute and chronic exposure to cyanotoxins and their effects on human health along with a critical evaluation of the efficiency of water treatment procedures.
Humpage, A.R. and I.R. Falconer, 2003. Oral Toxicity of the cyanobacterial toxin cylindrospermopsin in male Swiss albino mice: Determination of no observed adverse levels for deriving water guideline value. Environmental Toxicology, 18 (2): 94-103. Presents the results of a series of experiments that have contributed to derive guidelines for safe drinking water levels of cylindrospermopsin (CYN), a cyanobacterial toxin. The experiments were used to derive a no-observed-adverse-effects level (NOAEL). Body and organ weights were recorded; urine, serum and hematology analyses were preformed and histopathological examination of tissues were carried out. Found that the toxin affected all parameters. Provides a proposed guideline safety value of 1 µg/L in drinking water.
Humpage, A.R., J. Rositano, A.H. Bretag, R. Brown, P.D. Baker, B.C. Nicholson and D.A. Steffensen, 1994. Paralytic Shellfish Poisons from Australian Cyanobacterial Blooms. Australian Journal of Marine and Freshwater Research, 45 (5): 761-771. The study reports the identification of paralytic shellfish poisons (PSP) in A. circinslis bloom and culture samples. The results presented in this study are the first identification of neurotoxins from Australian cyanobacteria. The results of this study suggest a much wider range of occurrences of PSP’s than was earlier believed. PSP’s accumulate in shellfish consumed by humans and is therefore of special importance to the marine situation.
NIVA 4836 -2004
40
1.2.4 Animal and fish exposure
de Magalhães, V.F., R.M. Soares and S.M.F.O. Azevedo, 2000. Microcystin contamination of fish from the Jacarepaguá Lagoon (Rio de Janeiro, Brazil): ecological implication and human health risk. Toxicon, 39:1077-1085. Presents the result of a three year study on bioaccumulation of microcystis of fish and how this can possible lead to microcystis ingestion by humans. Microcystis was analyzed in phytoplankton, fish liver, viscera and muscle tissue. Findings indicate that microcystin can accumulate in fish tissue that is used for human consumption. Rates of consumption exceed the TDI rates set by the WHO for drinking water.
Frazier, K., B. Colvin, E. Styer and G. Hullinger, 1998. Microcystis Toxicosis in Cattle Due to Overgrowth of Blue-Green Algae. Vet Human Toxicol 40 (1): 23-24. Gives a thorough review of the deaths of two adult cattle in southern Georgia during November. Whereas most intoxication involving algal blooms occur during summer or spring, when weather is warm and sunshine abundant, these deaths occurred after a period of unusually cold weather. Microcystis was located in a pond where the cows had been drinking and discussions with the farmer later revealed that a pasture near the pond where had been fertilized with a nitrogen compound two weeks before the deaths.
Orr, P.T., G.J. Jones, R.A. Hunter and K. Berger, 2003. Exposure of beef cattle to sub-clinical doses of Microcystis aeruginosa: toxin bioaccumulation, physiological effects and human health risk assessment. Toxicon, 41 (5): 613-620. Discusses whether an accumulation of microcystis in beef cattle that have been exposed to this in their drinking water represents any danger to humans. An experiment has been conducted reaching over 4 weeks. It is concluded that beef cattle water containing M. aeruginosa cell concentrations up to 1 x 10⁵ cells ml-1 for 4 weeks would not produce concentrations of microcystin within the blood or liver plasma that would present an unacceptable risk to human health.
NIVA 4836 -2004
41
Penaloza, R., M. Rojas, I. Vila and F. Zambrano, 1990. Toxicity of a Soluble Peptide from Microcystis SP to Zooplankton and Fish. Freshwater Biology, 24 (2): 233-240. The composition of phytoplankton and its toxin content were analyzed monthly during a period of blue-green bloom in an attempt to explain the frequent death of fish reported in eutrophic Aculeo Lake. In addition the lethal action of a component purified from natural phytoplankton was tested on fish. The results suggest that release of toxic peptides from microcystis sp. may be the cause of fish kills in the Aculeo Lake.
Rodger, H.D., T. Turnbull, C. Edwards and G.A. Codd, 1994. Cyanobacterial (blue-green-algal) Bloom associated Pathology in Brown Trout, Salmo-trutta, in Loch Leven, Scotland. Journal of Fish Disease, 17 (2): 177-181. The study examines causes of fish deaths after a cyanobacterial bloom in Loch Leven during June 1992. During 2 days about 1000 dead or dying brown trout were found. Fish deaths have been associated with toxic algal blooms, but it is difficult to prove the exact cause of death. Hepatic pathology was indicative of toxic damage, but the cause could have been irritation due to the high pH levels or physical irritation due to the density of the cyanobacteria as well. Toxic damage may have resulted through direct ingestion or absorption of toxins, or secondarily following gill damage and a consequent increase in epithelial permeability allowing invasion of the fish by the toxin.
Van Buynder, P.G., T. Oughtred, B. Kirkby, S. Phillips, G. Eaglesham, K. Thomas and M. Burch, 2001. Nodularin Uptake by Seafood During a Cyanobacterial Bloom. Environmental Toxicology, 16 (6):468-471. Discusses the health alert levels for fish and other seafood caught in the Victorian waterways during cyanobacterial blooms. Toxic levels which produce no adverse health effects were used to derive safe daily intake levels and were again altered to give values for only short term, not chronic, exposure to poison. National food surveys were applied and the standard intake values of different seafood were combined with the safe daily intake levels to derive health alert levels for seafood. This meant that some seafood harvesting was restricted while other was not, and that the population could still eat seafood as long as the kept within safe levels.
NIVA 4836 -2004
42
Vasconcelos, V.M., 1999. Cyanobacterial toxins in Portugal: effects on aquatic animal and risk for human health. Brazilian Journal of Medical and Biological Research, 32 (2): 249-254. Focus on how aquatic animals can accumulate microcystins and transfer the toxin along the food chain and on its effects on the animals. Discusses especially those species that are used for human consumption and its risks. The occurrences of microcystins in tap water in Portugal are also reported.
1.2.5 Dietary supplements
Gilroy D.J., K.W. Kauffman, R.A. Hall, X. Huang and F.S. Chu, 2000. Assessing Potential Health Risk from Microcystin Toxins in Blue-Green Algae Dietary Supplements. Environmental Health Perspective, 108:435-439. Discusses the potential risk from exposure to health food products that contain blue-green algae (BGA). Many of these products are harvested in Upper Klamath Lake (UKL) in southern Oregon. In 1996 the UKL experienced an extensive cyanobacterial bloom and the Oregon Health Division recommended against water contact. After having received concerned calls from consumers the Oregon Health Division and the Oregon Department of Agriculture tested BGA products for the presence of microcystins. 63 of a total of 87 sampled tests contained concentrations above the regulatory limit set at 1 µg/g. 85 of the samples contained microcystins.
NIVA 4836 -2004
43
1.2.6 Cyanobacteria control
Griffiths, D.J. & M.L. Saker, 2003. The palm island mystery disease 20 years on: A review on the cyanotoxin cylindrospermopsin. Environmental Toxicology, 18 (2): 78-93. Reviews the information available to us on cyanobacteria toxins in light of the first reported human poisoning from cyanobacteria. This was in 1979, in Palm Island, Australia. More than 100 children from Aboriginal families were admitted to hospital showing gastrointestinal syndromes. It was noted that the island water reservoir had been treated with copper sulfate a few days before the outbreak. A linkage between the water supply and the outbreake was later confirmed. The occurrence of cyanobacterial toxins and the management strategies used to minimize their harmful effects are outlined. Some health effects are summarized along with risk factors and guidance values.
Hitzfeld, B.C., S.J. Höger and D.R. Dietrich, 2000. Cyanobacterial Toxins: Removal during Drinking Water Treatment, and Human Risk Assessment. Environmental Health Perspective, 108 (1): 113-122. Provides a good overview of the different toxins found in cyanobacterias and the consequences they have on human (both acute and chronic exposure) and animal health. Discusses the efficiency of different treatment procedures, such as chlorination, micro-/ultra filtration, rapid filtration and slow sand filtration and ozonation in light of the WHO guideline value of 1.0µg/L microcystis-LR in drinking water. A explanation to the WHO guideline and to risk assessments on risks posed by exposure to cyanotoxins through drinking water is provided.
Hoeger, S.J., D.R. Dietrich and B.C. Hitzfeld, 2002. Effects of Ozonation on the Removal of Cyanobacterial Toxins during Drinking Water Treatment. Environmental Health Perspective, 110 (11) 1127-1132. Investigates the efficiency of ozonation coupled with various filtration steps for removal of cyanobacteria under different bloom condition. It was found that if the total of organic carbon in the raw water is high the efficiency of free toxin ozonation and destruction is reduced. The ozonation of raw water containing high concentrations of cyanobacteria will also result in the liberation of cyanotoxins. To ensure safe drinking water thorough monitoring of several organic and carbon variables along with residual O3
concentration as well as efficient filtration is advised.
NIVA 4836 -2004
44
Lam A.K.-Y, E.E. Prepas, D. Spink and S.E. Erudey, 1995. Chemical Control of Hepatotoxic Phytoplankton blooms: Implications for human health. Water Resource 29 (8): 1845-1854. Presents a test of the hypothesis that chemicals used to control phytoplankton blooms induce the release of phytotoxins. Six chemical treatments were tested on the release of the cyanobacterial toxin, microcystis-LR (MCLR). It was found that chemical controls which control blooms through inhibition of cell functions increases the dissolved concentrations of MCLR in the surrounding water. Lime and alum treatment control cyanobacterial blooms without any (lime) or little (alum) increase in dissolve MCLR in surrounding water. Lime (and alum) appears to be more suitable to control cyanobacterial blooms in drinking water than either algicides or chlorine.
NIVA 4836 -2004
45
1.3 Economy
1.3.1 Water quality
Brookshire, D.S. & D. Whittington, 1993. Water Resource Issues in the Developing Countries. Water Resource Research 29 (7): 1883-1888. Discusses the validity of the ‘conventional wisdom’ that everybody needs clean water and that consequently any water project is justifiable and no mistakes can be made in selecting sites for new water supply projects. Points out that such views neglects certain facts; Investment funds are limited, investment projects require that decisions be made not only to location, but also to the level of service to be provided and on the prices to be charged, and that failure to account for intangible benefits associated with water supply improvements may lead to underestimation of returns to investment and therefore to economically inefficient investments.
Choe, K., D. Whittington and D.T. Lauria, 1996. The Economic Benefits of Surface Water Quality Improvements in Developing Countries: A Case Study of Davao, Philippines. Land Economics. 72 (4): 519-537. Two non-market valuation techniques, contingent valuation (CV) and travel cost (TC), are used to estimate the economic value that people in Davao, Philippines, place on improving water quality in their community. Both methods’ estimates of willingness-to-pay (WTP) were quite low. This indicates that water quality improvements do not have that high a priority for the citizens in Davao.
Howard, A., A.T. McDonald, P.E. Kneale and P.G. Whitehead, 1996. Cyanobacterial (blue-green algal) blooms in the UK: A review of the current situation and potential management options. Progress in Physical Geography, 20 (1): 53-61. Provides a review of the characteristics of cyanobacteria and different available management strategies. The UK water authorities have been separated and privatized and are being faced with new demands of economic control. The article discusses future investments in non-mandatory environmental projects after this process. Recommends models for cyanobacterial blooms in lakes to be used for predictive purposes to assess bloom movement, location and site. This will allow operational managers to select optimal locations for water removal and restrict access for recreational activity. As long as one is doing little to prevent bloom formation such strategies are more economical than the installation of water-mixing and nutrient-stripping devices.
NIVA 4836 -2004
46
Younes M. and J. Bartram, 2001. Waterborne health risks and the WHO perspective. International Journal of Hygiene and Environmental Health, 204 (4): 255-263. Gives a brief insight to the world wide water situation and a historical review of the changed perception of importance of water quality and which problems one is faced with. Goes into the economical feasibility of clean water for all of the words population and which technical and environmental challenges one is faced with. Discusses how the demand for pure water should be met and which approaches and tools are available, particularly risk-management. The article also discusses the WHO’s role in providing safe water supply for all.
1.3.2 Contingent valuation studies
Abou-Ali, H., 2003. Using stated preference methods to evaluate the impact of water on health: the case of metropolian Cairo. Department of Economics, Göteborg University, Sweden. The study analysis the impact of better water quality on health improvements using the choice experiments (CE) method and the contingent valuation (CV) method. No considerable difference is found between the estimated values of change in health risk. The households in Metropolitan Cairo have a positive willingness-to-pay (WTP) for reducing health risks owning to water quality. The WTP is about 1 % of mean income. This is a very little value. Concludes that the specific survey design may be of more importance to the outcome of the valuations than which method is being used. Alberini, A. and A. Krupnick, 2000. Cost-of-illness and willingness-to-pay estimates of the benefits of improved air quality: Evidence from Taiwan. Land Economics, 76 (1): 37-53. The study compares cost-of-illness (COI) and willingness-to-pay (WTP) estimates of the damages from minor respiratory symptoms associated with air pollution for residents of the Republic of China (Taiwan). The estimates are based on the data from a combined epidemiological/economic study. The economic study is a contingent valuation (CV) study. The WTP were found to be grater than the COI, which is consistent with economic theory. The WTP/COI ratios for Taiwan are in line with similar studies in the United States.
NIVA 4836 -2004
47
Gnedenko, E., Z. Gorbunova and G. Safonov, 1998. Contingent Valuation of drinking water quality in Samara city. Moscow State University, Moscow. A valuation study of improvements in the drinking water quality based on the household’s perception of the tap-water quality and relevant health risk avoidance behaviour. The study sets forward to compare the estimates of willingness-to-pay (WTP) obtained by two different methods: contingent valuation (CV) and avoidance expenditures (AE). The results of the comparison of the two WTP-estimates show that the estimated WTP by the AE-approach was no lower than that of the AE-approach. .
Griffin, C.C., J. Briscoe, B. Singh, R. Ramasubban and R. Bhatia, 1995. Contingent Valuation and Actual Behaviour - Predicting Connections to New Water-System in the State of Kerala, India. World Bank Economic Review, 9 (3): 373-395. Presents a study from Kerala, India, where households were asked about their willingness to pay for connection to piped water supply in 1988. In 1991 the community was surveyed again and their actual decisions recorded. The article sets out to find if the households had acted as they said they would and if the people at one site had acted as they were predicted to on the basis of findings from another site.
Henson, S., 1996. Consumer willingness to pay for reductions in risk of food poisoning in the UK. Journal of Agriculture Economics, 47 (3): 403-420. The contingent valuation method has been employed to estimate UK consumer’s willingness to pay for reduced risk of food poisoning. The article gives a rather thorough insight to the whole process of both conducting the survey and deriving the final results. It accounts for a range of adverse health effects resulting from food poisoning. Demographics, personal experience of food poisoning and beliefs and attitudes about food-borne risks are some of the factors that are included when it is assessed which factors influence ‘willingness to pay’ for safer food.
NIVA 4836 -2004
48
Kontogianni, A., I.H. Langford, A. Papandreou and M.S. Skourtos, 2003. Social preferences for improving water quality: An economic analysis from wastewater treatment. Water Resource Management, 17 (5): 317-336. The study examines the case of a waste-water treatment (WWTP) plant in Greece which is only partially operational because of the lack of funds. Contingent valuation (CV) is applied to examine individual’s willingness to pay to ensure full operation of the WWTP. The motivations of those willing to pay were found to be a complex combination of consumer and citizen modes of cognition, self-identity and pride in the city and moral ethical concerns.
Machado, F.S. and S. Mourato, 2002. Evaluating the multiple benefits of marine water quality improvements: how important are health risk reductions? Journal of Environmental Management, 65 (3): 239-250. Uses stated preference methods to evaluate in economic terms the multiple benefits, for local beach users, of improving the quality of recreational marine waters in Lisbon. Health related benefits and amenity/recreational benefits are both incorporated and distinguished by linking a simple economic model to available epidemiological evidence. A direct estimate of the health benefits of reduced pollution is estimated using the contingent valuation method. A total value of a beach to users is estimated using the contingent ranking method. The results of the study indicate that health benefits are only a small fraction of the total benefits of water quality improvements. Pearson, M.J., I.J. Bateman and G.A. Codd, 2001. Measuring the Recreational and Amenity Values affected by Toxic Cyanobacteria: a Contingent Valuation Study of Rutland Water, Leichestershire. In: Turner, E.K., I.J. Bateman and W.N. Adger. Economics of Costal and Water Resources: Valuing Environmental Functions. Kluwer, Dordrecht, The Netherlands, pp. 67-89. Discusses a contingent valuation (CV) study preformed to estimate recreational and amenity values affected by toxic cyanobacteria in Rutland Water. Gives a thorough introduction to the Rutland case in specific and does also include an introduction to the problems caused by cyanobacteria. 641 visitors were interviewed and approximately 67 % of the sample indicated that they would pay additional taxes to fund remedial water quality work. A simple cost-benefit analysis of the results indicates that the benefits substantially exceed costs and work of the National Rivers Authority dealing with cyanobacterial blooms and scum.
NIVA 4836 -2004
49
Ready, R.C. S. Navrud, B. Day, R. Dubourg, F. Machado, S. Mourato, F. Spanninks and M.X.V. Rodriquez, 1999. Benefit Transfer in Europe. Are Values Consistent Across Countries? Paper presented at the EVE Workshop on Benefit Transfer (EU Concerted Action: Environmental Valuation in Europe (EVE)), Lillehammer, October 14-16 1999. Accepted for publication in "Environmental and Resource Economic" 2004. This study tests whether episode valuation responses are sensitive to either the ordering of episodes within the survey or mention of the cause of the episode. Similar contingent valuation studies were conducted in 5 European countries simultaniously. The results show that neither of the objects influenced stated willingness to pay to avoid specific ill health episodes.
Subramanian, L., 2003. A simple cost-benefit analysis of prevention of fresh water eutrophication through a contingent valuation survey. MSc Thesis, University of East Anglia, Norwich. The study is a simple cost benefit analysis of prevention of fresh water eutrophication in East Anglia region. A contingent valuation study is used to find benefit estimates for prevention of eutrophication through a phosphate removal scheme. The elicitation method used was the one-and-one-half bound elicitation. The results of this study were compared to the costs of eutrophication treatment which were estimated by another study. The study concludes that the benefits outweigh the costs. UPDATE Project Team, 2002. Final Report. Urban Poor Data Acquisition and Technical Evaluation: Update Project. United States Asia Environmental Partnership (USAEP), FORKAMI, and Research Triangle Institute. The report presents analysis of the data obtained from the UPDATE surveys conducted in Kotamadya Semarang, Kabupaten Tangerang and Kabupaten Indramayu. Several characteristics and tendencies of the water sector environment currently faced by the urban poor are observed from the data and their analysis. Several conclusions related to the prospects about the urban poor and the water utilities that serve them are drawn.
NIVA 4836 -2004
50
1.3.3 Valuation studies
Beloff, B.R. and E. R. Beaver, 2000. Evaluation of Societal Costs: Odors and Eutrophication. Submitted to the U.S. Department of Energy Office of Industrial Technology, by BRIDGES, Huston. Presents a cost effective methodology for decision-making and a set of data to support those cost assessments. The study utilizes two topics, ‘harmless’ odours and eutrophication as topics to develop methodology, which are then used for other intangible costs. The costs to society of these topics are real and will eventually lead to internal costs for companies contributing to the odours and eutrophication. It is easier to obtain social costs than it is to estimate the internal costs of companies. The investigations determined that using teams of faculty and students is a cost-effective way of developing methodology for obtaining intangible cost information, which is suitable for use with total cost assessment tools.
Dasgupta, P., 2004. Valuing health damages from water pollution in urban Delhi, India: a health production function approach. Environment and Development Economics 9: 83-107. The study conducts an objective assessment of the damages incurred by urban households by adopting a health production function approach. Uses the monetisation of health losses borne by households reporting diarrhoeal illness as the minimum willingness-to-accept for avoiding damages from contaminated water. Focus attention on the changes in individual behaviour stemming from the perceived adverse effects on the individual’s utility. The result points towards the importance of overall infrastructural variables, such as garbage removal facilities, water sources and interruption in water supply. These are variables that may not always be in the control of the individual household.
eftec, 2002. Valuation of Benefits to England and Wales of a Revised Bathing Water Quality Directive and Other Beach Characteristics Using the Choice Experiment Methodology. Submitted to Department of Environment, Food and Rural Affairs by Economics for the Environment Consultancy Ltd, London. The objective of this study was to find people’s willingness to pay for changes in water quality and other beach attributes. The valuation technique used in the study is the choice experiment methodology. Respondents showed a positive willingness to pay for both reduction in risk of stomach upset, an advisory note system, for avoidance of litter and dog mess and for improving the standard of amenities and safety.
NIVA 4836 -2004
51
McConnel, K.E. and M.A. Rosado, 2000. Valuing discrete improvments in drinking water quality through revealed preferences. Water Resource Research, 36 (6): 1575-1582. The paper entails to document the willingness-to-pay (WTP) for potable water in a large urban area in the state of Espirito Santo in Brazil. The WTP for access to boiling drinking water is used to infer the WTP for potable water. The fact that boiled water is characterised by safety and poor taste (among others) leads to the conclusion that the WTP for access to boiled water is in the lower bound estimate of the WTP for potable water.
Mohany, J.C., T.E. Ford, J.J. Harrington and V. Lakshmipathy, 2002. A cross-sectional study of enteric disease risks associated with water quality and sanitation in Hyderabad City. Journal of Water Supply Research and Technology-Aqua, 51 (5): 239-251. The paper presents a cross-sectional questionnaire-based study designed to 1) estimate the level of enteric disease risk posed by poor drinking water quality and sanitation in and 2) explore the relationship between the levels of health risks and both indicators of water quality and socio-economic variables. Found that as many use other health services than the public hospital and policy decisions are based on public hospital surveillance data these decisions may dramatically underestimate the importance of water and sanitation. Also showed a relationship between rate of sewage overflow, % of cast iron pipe and % samples without residual chlorine and health. Suggests that improvement in sewage collection systems and repair of water distribution system leakage should result in significant reduction in enteric diseases.
NIVA 4836 -2004
52
1.3.4 Outline / discussion; valuation methods Davis, J. and D. Whittington, 1998. "Participatory" research for development projects: a comparison of the community meeting and household survey techniques. Economic Development and Cultural Change, 47 (1) 73-94. The focus in this article is the techniques used by donor agencies to collect information about project beneficiaries’ preferences. Seek to contribute experimental evidence to the debate on whether local participation in development projects will result in improved project performance by comparing two research methods; community meetings and household surveys. Both approaches were used simultaneously in Lugazi, Uganda, in an attempt to assess household demand for water and sanitation services. The differences in the findings would not have resulted in significantly different policy recommendations. However, the sampling strategies for each methodology produced groups with different socioeconomic characteristics.
enHealth, 2003. Guidelines for Economic Evaluation of Environmental Health Planning and Assessment. Department of Health and Ageing and enHealth Council, Commonwealth of Australia. This is guidelines for environmental health economic evaluation. The guidelines describe methods for economic evaluation and their application to environmental heath policy issues. Major principles and practises of economic evaluation are described along with practical examples of environmental health issues. Four studies are described to illustrate the application of economic evaluation methods to environmental health issues.
Freeman, A.M. and W.D. Shipman, 2000. The Valuation of Environmental Health Damages in Developing Countries: Some Observations. Economy and Environment Program of South East Asia, Special Paper. The objective of this paper is to identify the most serious gaps and the conceptual issues surrounding the economic valuation of environmental health damages in developing countries. Focus on disease associated with anthropogenic environmental degradation. 10 observations about environmental health with supporting detail and discussion; which environmental health problems that should be of most concern to policy makers in developing countries, information of special value to policy makers, the problems concerned with using benefit transfer, dose-response transfer, using values of statistical life, the concept of ‘collateral benefits’, using the willingness to pay approach, benefits of reducing childhood exposure to lead, environmentally transmitted diarrhoeal disease and pesticide exposure to farm workers.
NIVA 4836 -2004
53
Freeman, A.M., 1991. Indirect methods for valuing changes in environmental risks with nonexpected utility preferences. Journal of Risk and Uncertainty, 4 (2): 153-165. Provides a systematic development of models based on averting behaviour, hedonic pricing or weak complementarity for the valuation of changes in risk when preferences take the expected utility form. The purpose is to make clear the basic logic of these methods and to establish the conditions under which they can be used to measure values. Also shows that alternative representations of preferences add no additional complications to empirical measurements.
Hutton, G., 2000. Considerations in evaluating the cost-effectiveness of environmental health interventions. Protection of Human Environment, Geneva. The document provides an overview of currently used methods for economic valuation and discusses implications of using these methods for evaluating environmental health interventions. The document discusses the development of guidelines for evaluation of cost-effectiveness in the framework of WHO’s initiatives in particular. Focuses on what is particular for to environmental health interventions and how economic valuation there fore may need to be different for these interventions than for other. Also raises the question of how discounting for long-term health effects can be compatible with the concepts of prevention and sustainability.
Hutton, G., 2002. Evaluation of the global non-health costs and benefits of water and sanitation interventions. Effectiveness, Quality and Cost Unit (EQC), Global Programme on Evidence (GPE), Evidence and Information for Policy (EIP), World Health Organization. The aim of the study is to estimate non-health sector costs and benefits of a range of selected interventions to improve water and sanitation services. Results are presented for each of the 17 WHO sub-regions. Diarrhoea is the single health outcome. All water and sanitation improvements were found to be cost-beneficial for all world regions in the base case analysis. The main contributor to benefit in developing regions were the time savings associated with better access to water and sanitation services. When different cost and benefit assumptions were used, the cost-benefit ratios changed considerably. Results show that there are many determinants of the cost-benefit of different water and sanitation improvements, and that the cost-benefit ratio depends heavily on the input data chosen, assumptions used and benefits included.
NIVA 4836 -2004
54
Rozan, A, 2000. Health benefits induced by environmental quality: Are private costs negligible? Revue Economique, 51 (3) 595-608. The paper pleads in favour of using the cost of illness method (COI) and the contingent valuation method (CVM) when estimating the morbidity effects associated with environmental damages. For cases of light symptoms induced by air pollution, this study shows that private costs are at least as important as social costs. Neglecting the private costs leads to an underestimation of health costs. Such underestimation could lead to the opposite public decision. Only available in French UNEP, 2000. Planning and management of lakes and reservoirs: an integrated approach to eutrophication: a student guide. United Nation Environmental Program: International Environmental Technology Centre, Osaka/Shiga. The document as a whole provides a rather thorough investigation of all aspects of eutrophication. Chapter 5 focuses on the economic aspects of eutrophication. In this chapter one has dealt with private and social interests in the allocation of water supplies and eutrophication, the problems one is faced with concerning water scarcity and institutional constraints along with the economic factors of eutrophication. The economic sources and impacts of eutrophication are also discussed along with economic mechanisms for prevention and control of eutrophication. Economic methods for the evaluation of eutrophication have also been included. Available at : http://www.unep.or.jp/ietc/Publications/TechPublications/TechPub-12/index.asp
Whittington, D., 1996. Administering Contingent Valuation Surveys in Developing Countries. Economy and Environment Program for South East Asia. The paper discusses some of the issues that have risen and some of the lessons learned about administering contingent valuation (CV) studies in developing countries. The discussion is organized around 5 issues; 1) ethical problems in conducting CV studies 2) explaining what a CV study is all about 3) interpreting answers to CV questions 4) setting referendum prices and 5) constructing joint public-private CV scenarios.
NIVA 4836 -2004
55
Whittington, D., 2002. Improving the performance of contingent valuation studies in developing countries. Environmental and Resouce Economics, 22 (1-2): 323-367. This study reviews three concerns that needs to be improved to make contingent valuation (CV) in developing countries more reliable; poor survey implementation, poorly crafted CV scenarios and failure to test for the effects of variation in survey design on the results of CV studies. The study concludes that solutions to these problems will require that CV researchers spend more time and money on their work and that CV studies preformed in developing countries often concern matters of such importance that one should always push for excellence when performing CV studies. This is especially relevant because policy mistakes can be tragic. World Bank, 1998. The Effects of Pollution on Health: The Economic Toll. In Pollution Prevention Handbook, Toward Cleaner Production. World Bank Group, Washington D.C. A summary of the latest findings in measuring and valuing the health impacts of pollution and an outline of some basic approaches that can be applied in the economic analysis of Bank projects and sector studies. With special emphasis on air and water pollution. Lists and explains some of the valuation methods for the health effects of pollution and puts special emphasis on the use of these in developing countries.
NIVA 4836 -2004
56
1.3.5 Further use of contingent valuation studies; -META analysis & elasticity estimation
Hökby, S., 2000. Demand for a Reduced Eutrophication in the Baltic Sea - is a Reduced Nitrogen Load to the Baltic Sea a Luxury Good? Master Thesis, Department of Economics. Stockholm. Focuses on the demand for reduced nitrogen load and examines how demand is affected by changes in income and price. The data from 5 Swedish contingent valuation studies is used is linked together to obtain estimates for the elasticities of demand. Concludes that a reduced nitrogen load to the Baltic Sea is a luxury good with elastic demand concerning both changes in income and price.
Ukoli-Onodipe, G., 2003. Designing optimal water supply systems for developing countries. Dissertation, The Ohio State University, Ohio. This study reports a meta-analysis of more than 20 studies estimating household willingness to pay (WTP) for various improvements in water services in low-income countries using the contingent valuation method. Along with WTP measurements, cost estimates for construction and maintenance of groundwater schemes for public standpipes and sanitation facilities were applied. The study shows that providing a range of service levels for water systems can be beneficial compared to ‘one size fits all’ solutions.