Embed Size (px)
Citation preview

Contract Report 521
Harmonic Mean Flows for Illinois Streams
by Krishan P. Singh and Ganapathi S. Ramamurthy Office of Surface Water Resources & Systems Analysis
Prepared for the Illinois Environmental Protection Agency
December 1991
Illinois State Water Survey Hydrology Division Champaign, Illinois
A Division of the Illinois Department of Energy and Natural Resources
Harmonic Mean Flows for Illinois Streams
by Krishan P. Singh, Director, Surface Water Resources and Systems Analysis
and Ganapathi S. Ramamurthy, Associate Professional Scientist
Prepared for the Illinois Environmental Protection Agency
Illinois State Water Survey
2204 Griffith Drive Champaign, Illinois 61820-7495
December 1991

ISSN 0733-3927
The body of this report was printed on recycled and recyclable paper

TABLE OF CONTENTS
1 INTRODUCTION 1 1.1 Need for Calculating the Harmonic Mean Flows (QHM )................................................................... 1
1.1.1 Flow Ratios for Selected Illinois Streams 2 1.2 Acknowledgments 3
2 METHODOLOGY 4 2.1 Development of Hydrologically Homogeneous Regions 4 2.2 QHM at Streamgaging Stations 6 2.3 QHM along the Streams 7
2.3.1 QHM versus Area Curves 7 2.3.2 Wastewater Treatment Plant Effluents 7 2.3.3 Water Withdrawals for Municipal and Industrial Uses 7 2.3.4 Timing of Flows in Two Major Branches 7 2.3.5 Modification of QHM Because of Lakes and Pools 9 2.3.6 Flow Regulation for Navigation 9 2.3.7 Ground-Water Accretion to Flow 9 2.3.8 Flow Data from Gaging Stations in Adjoining States 9
3 DEVELOPMENT OF REGIONAL HARMONIC MEAN FLOW M A P S 10 3.1 MAP 1 — ROCK RIVER REGION 10
3.1.1 QHM at Gaging Stations 10 3.1.2 Wastewater Treatment Plants and Effluents 10 3.1.3 Illinois and Mississippi Canal 10 3.1.4 Determination of Q H M : An Example 12
3.2 MAP 2 — NORTHEASTERN ILLINOIS REGION 12 3.2.1 QHM at Gaging Stations 12 3.2.2 Wastewater Treatment Plants and Effluents 12 3.2.3 Fox Chain-of-Lakes 12 3.2.4 Flow Regulation for Navigation 12 3.2.5 Streams in Urbanizing Basins 14 3.2.6 Metropolitan Water Reclamation District of Greater Chicago Waterways . . . . 16 3.2.7 Illinois River 16
3.3 MAP 3 — KANKAKEE REGION 18 3.3.1 QHM at Gaging Stations 18 3.3.2 Wastewater Treatment Plants and Effluents 18 3.3.3 Determination of Q H M : An Example 20
3.4 MAP 4 — SPOON RIVER REGION 20 3.4.1 QHM at Gaging Stations 20 3.4.2 Wastewater Treatment Plants and Effluents 20 3.4.3 Illinois and Mississippi Canal 20
3.5 MAP 5 — SANGAMON REGION . . . 22 3.5.1 QHM at Gaging Stations 22 3.5.2 Lake Springfield 22 3.5.3 Lake Decatur 22 3.5.4 Clinton Lake 22
3.6 MAP 6 — LA MOINE RIVER REGION 24 3.6.1 QHM at Gaging Stations 24 3.6.2 Wastewater Treatment Plants and Effluents 24
iii
3.7 MAP 7 — KASKASKIA REGION 24 3.7.1 QHM at Gaging Stations 24 3.7.2 Wastewater Treatment Plants and Effluents 25 3.7.3 Carlyle Lake 25 3.7.4 Lake Shelbyville 25 3.7.5 U.S. Industrial Chemical Company 27 3.7.6 Kaskaskia Navigation Canal 27 3.7.7 Horseshoe Lake 27 3.7.8 Baldwin Lake 27 3.7.9 Chain of Rocks Canal 27 3.7.10 Small Lakes 27
3.8 MAP 8 — EMBARRAS REGION 27 3.8.1 QHM at Gaging Stations 28 3.8.2 Wastewater Treatment Plants and Effluents 28 3.8.3 Wabash River 28 3.8.4 Lake Vermilion 28
3.9 MAP 9 — LITTLE WABASH REGION 30 3.9.1 QHM at Gaging Stations 30
3.10 MAP 10 — SOUTHERN REGION 30 3.10.1 QHM at Gaging Stations 31 3.10.2 Wastewater Treatment Plants and Effluents 31 3.10.3 Rend Lake 33 3.10.4 Crab Orchard Lake 33 3.10.5 Lake Egypt 33
REFERENCES 34
Harmonic Mean Flow Maps (in folder)
iv
LIST OF TABLES
1.1 Mean Flow, Harmonic Mean Flow, and 7-Day, 10-Year Low Flow Statistics for Selected Gaging Stations in Illinois 2
3.1 Map 1 - Gaging Stations and Harmonic Mean Flows 11 3.2 Map 2 - Gaging Stations and Harmonic Mean Flows 13 3.3 Map 3 - Gaging Stations and Harmonic Mean Flows 19 3.4 Map 4 - Gaging Stations and Harmonic Mean Flows 21 3.5 Map 5 - Gaging Stations and Harmonic Mean Flows 23 3.6 Map 6 - Gaging Stations and Harmonic Mean Flows . 25 3.7 Map 7 - Gaging Stations and Harmonic Mean Flows 26 3.8 Map 8 - Gaging Stations and Harmonic Mean Flows 29 3.9 Map 9 - Gaging Stations and Harmonic Mean Flows 30 3.10 Map 10 - Gaging Stations and Harmonic Mean Flows 32
v
LIST OF FIGURES
2.1 Locations of hydrologically homogeneous regions for the development of Harmonic Mean Flow maps 5
2.2 Adjustment of trends in determining QHM- Sangamon River at Monticello 8
3.1 Harmonic Mean Flow trends: Salt Creek at Western Springs 15 3.2 Bed profile and water surface elevations in the various pools of the Illinois River 17
vi
1 INTRODUCTION
State and federal agencies that regulate stream pollution have based their stream water quality standards on a flow condition in a stream specified as the 7-day, 10-year low flow ( Q 7 , 1 0 ) . This is defined as the lowest average flow that occurs for a consecutive 7-day period at an average recurrence interval of 10 years. The Q7,10 maps for all streams in Illinois and the interstate rivers were first developed by Singh and Stall (1973). The Q7,10 values for the Northeastern Illinois region were updated for 1980 conditions by Singh (1984). The Q7,10 values for the rest of Illinois were updated for 1984 conditions by Singh et al. (1988a; 1988b).
In calculating dilution flows for substances causing carcinogenic effects in humans, it has been suggested that a low-flow value parameter such as (Q7,10) is far too conservative for determining wasteload allocations. The criteria for the carcinogenic substances appearing on the priority pollutant list were derived by the U.S. Environmental Protection Agency (USEPA). The calculations assumed lifetime exposure to the target substances as equivalent to ingesting 2 liters (1) of water and 20 grams (g) of fish each day for 70 years (IEPA, 1990, sec 302.648). The USEPA has suggested using the harmonic mean flow (QHM) as a design streamflow for wasteload allocations, based on protection of human health from lifetime exposures to carcinogens (IEPA, 1990, sec 302.658). The basic reason for this suggestion is that the average concentration of a carcinogen over a lifetime is a function of the QHM of the stream. Although QHM is not a conventionally used flow parameter, it is the most appropriate flow parameter for human health criteria dilution flows from theoretical and practical considerations.
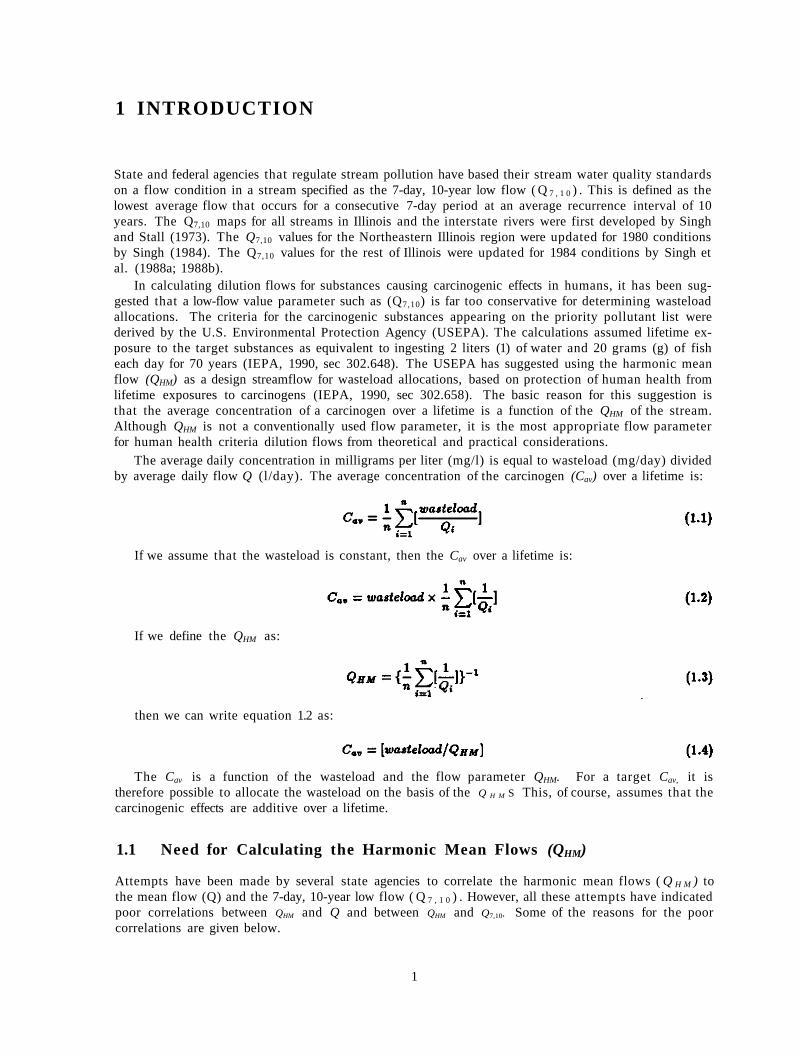
The average daily concentration in milligrams per liter (mg/l) is equal to wasteload (mg/day) divided by average daily flow Q (l/day). The average concentration of the carcinogen (Cav) over a lifetime is:
If we assume that the wasteload is constant, then the Cav over a lifetime is:
If we define the QHM as:
then we can write equation 1.2 as:
The Cav is a function of the wasteload and the flow parameter QHM. For a target Cav, it is therefore possible to allocate the wasteload on the basis of the Q H M S This, of course, assumes that the carcinogenic effects are additive over a lifetime.
1.1 Need for Calculating the Harmonic Mean Flows (QHM)
Attempts have been made by several state agencies to correlate the harmonic mean flows ( Q H M ) to the mean flow (Q) and the 7-day, 10-year low flow ( Q 7 , 1 0 ) . However, all these attempts have indicated poor correlations between QHM and Q and between QHM and Q7,10. Some of the reasons for the poor correlations are given below.
1
1. The Q7,10 is affected by the quantity of effluents discharged upstream of the point of interest along the stream.
2. The Q7,10 is a very low flow. Low flows vary greatly from north to south in Illinois, mostly because of physiography, stream entrenchment, and soil type. The Q7,10 may be zero for a drainage area from 5 to 10 square miles (mi2) in the northern area of the Rock River basin, whereas it may be zero for areas from 200 to 500 mi2 in southern Illinois.
3. Although the low flows and Q7,10 increase as the drainage area increases, the rate of increase of low flows is usually higher than the rate of increase of drainage area. There are two basic explanations for this phenomenon: a) as the drainage area gets larger, the probability of having partial-area storms increases, and b) stream entrenchment increases and results in higher groundwater contribution to the stream.
4. The ratio of QHM to Q7,10 (as well as of to QHM) is a function of physiography, drainage area, basin soils, stream entrenchment, ground-water aquifers, wastewater effluent discharges, and land use. An acceptable range for these ratios will be impractical.
5. Many small to medium-sized streams have zero daily flows (Q). For such flows, the inverse of Q is indeterminate. A decision will have to be made whether to neglect such days, to replace zero flow with the minimum nonzero reported flow, or to consider QHM as zero.
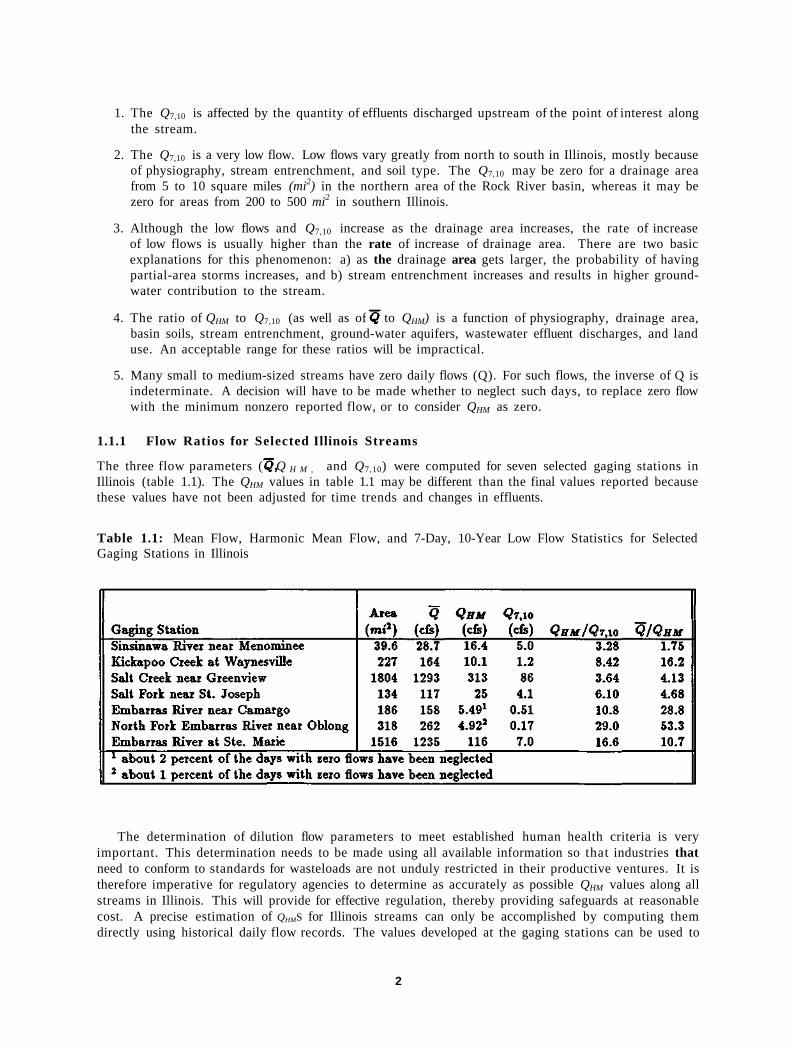
1.1.1 Flow Ratios for Selected Illinois Streams
The three flow parameters ( Q H M , and Q7,10) were computed for seven selected gaging stations in Illinois (table 1.1). The QHM values in table 1.1 may be different than the final values reported because these values have not been adjusted for time trends and changes in effluents.
Table 1.1: Mean Flow, Harmonic Mean Flow, and 7-Day, 10-Year Low Flow Statistics for Selected Gaging Stations in Illinois
The determination of dilution flow parameters to meet established human health criteria is very important. This determination needs to be made using all available information so that industries that need to conform to standards for wasteloads are not unduly restricted in their productive ventures. It is therefore imperative for regulatory agencies to determine as accurately as possible QHM values along all streams in Illinois. This will provide for effective regulation, thereby providing safeguards at reasonable cost. A precise estimation of QHMS for Illinois streams can only be accomplished by computing them directly using historical daily flow records. The values developed at the gaging stations can be used to
2
develop regional regression equations. The QHM values at intermediate points can be determined using the regional regression equations.
1.2 Acknowledgments
The study was jointly supported by the Illinois Environmental Protection Agency (IEPA) and the State Water Survey Division of the Illinois Department of Energy and Natural Resources. Toby Frevert and Robert Mosher of the IEPA served in a liaison capacity during the course of this study. Ali Durgunoğlu, Professional Scientist, helped in the earlier stages of the study and provided useful suggestions. Olga Fishman, graduate research assistant, provided technical assistance in the preparation of graphs. John Brother, Linda Hascall, and David Cox helped prepare the maps, and Eva Kingston edited the report.
3

2 METHODOLOGY
The objective of this study was to develop the QHM maps for streams in Illinois for the 1990 condi-tions of effluent discharges, water withdrawals, and flow regulation. The general procedures used are described briefly. Any special features applicable to a particular region are noted under the relevant map description.
2.1 Development of Hydrologically Homogeneous Regions
Development of hydrologically homogeneous regions for QHM maps was based on the procedure outlined in Singh and Stall (1973). The following steps are used in preparing a QHM map for a river basin or region:
1. The drainage area associated with the streams or river system in a particular region is marked on the 2-degree maps of the U.S. Geological Survey (USGS). The maps have a scale of 1 to 250,000 or about 1 inch = 4 miles. Where the elevation contours are not defined well enough to draw the drainage boundary accurately, 15-minute and 7-1/2-minute USGS quadrangle maps are used that have a scale of 1 to 62,500 and 1 to 24,000, respectively. A base map is then prepared showing the drainage boundary, the stream network, all towns that have wastewater treatment plants (WTPs) and lagoons, and county lines. The USGS streamgaging stations on Illinois streams and any bordering rivers are located on the base map from the detailed descriptions of their locations published in USGS Supply Papers and Water Resources Data for Illinois.
2. The locations of the municipal and industrial WTPs are not shown on the maps to reduce clutter. However, whenever significant flows from large treatment plants are present, the QHM values upstream and downstream of the discharge point are provided.
3. Dams, regulating structures, and lakes (those large enough to be accurately represented on the map) are also located on the base map. Dams and in-channel impoundments for municipal water supply systems are located on various streams from the available information in USGS maps, county plat books, river basin reports, and similar references. All large and medium lakes, and some small ones (natural or man-made) are shown on the maps because of their significant effect on the QHMS.
4. Streams with zero QHM are defined first. From the natural (excluding the effect of effluents and regulation) low flow versus drainage area graphs, the streams with zero QHM are determined and shown as dotted-dashed lines on the map. Any WTP effluents entering these intermittent-flow streams are then considered. If the effluent is lost in the dry streambed before reaching the perennial stream, the zero QHM stream remains as such. But if the effluent is not lost, the stream starts with a QHM at the outfall equal to the magnitude of the effluent, and this flow is reduced downstream to the point where the natural QHM flow begins. Downstream, the QHM equals the reduced effluent flow plus the natural flow.
5. Streams with nonzero QHMS are mapped next. To natural low flows along such streams are added the effluents from WTPs and lagoons to obtain the QHM for 1990 conditions. Any withdrawal of water from a stream for a municipal supply or industrial use is shown by a decrease in the QHM value.
The state was divided into ten regions as shown in figure 2.1 (Singh and Stall, 1973). A QHM map for 1990 conditions was prepared for each region. Descriptions of these ten maps are given below.
4
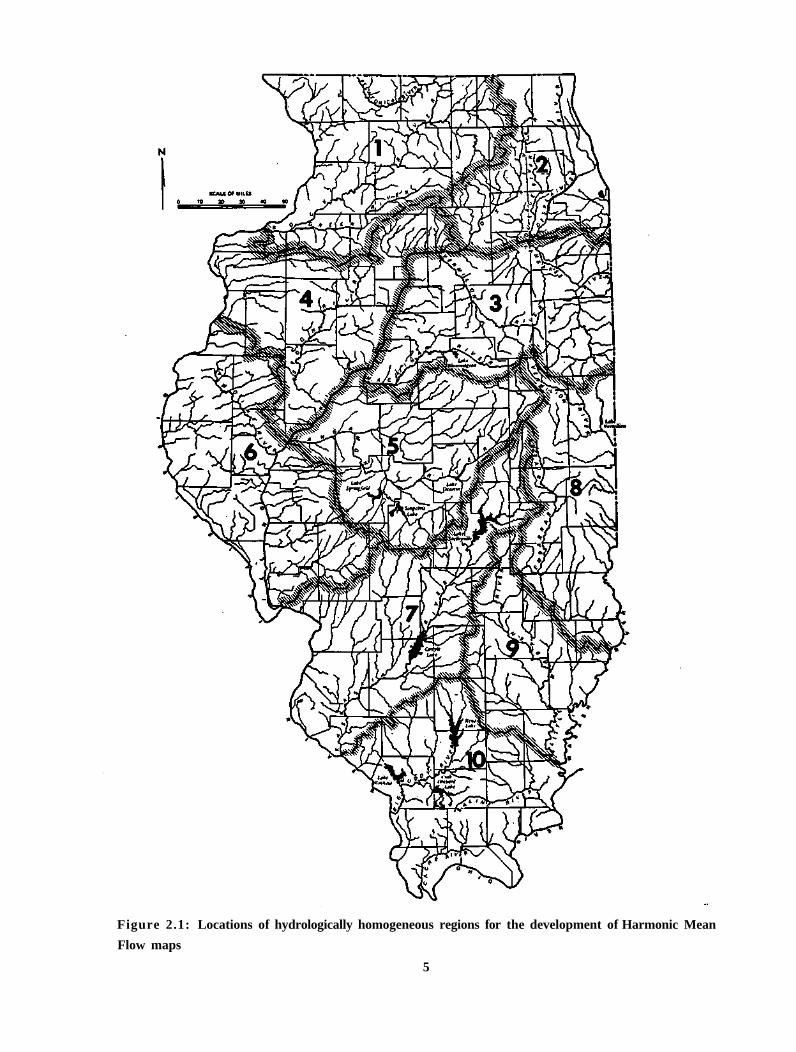
Figure 2.1: Locations of hydrologically homogeneous regions for the development of Harmonic Mean Flow maps
5

M a p 1 Rock River Region: Rock River and Mississippi River drainage upstream of Rock Island
M a p 2 Northeastern Illinois Region: Chicago Sanitary and Ship Canal and Chicago, Des Plaines, DuPage, and Fox Rivers
M a p 3 Kankakee Region: Kankakee, Mazon, Vermilion, and Mackinaw Rivers, and Illinois River drainage from the east upstream of the Sangamon River
M a p 4 Spoon River Region: Bureau Creek, Spoon River, and Mississippi River drainage north of Henderson Creek
M a p 5 Sangamon Region: Sangamon River with Salt Creek and other tributaries
M a p 6 La Moine River Region: La Moine River, Macoupin Creek, and Mississippi River drainage upstream of the mouth of the Illinois River
M a p 7 Kaskaskia Region: Kaskaskia River and Mississippi River drainage between the Illinois and Kaskaskia Rivers
M a p 8 Embarras Region: Vermilion and Embarras Rivers, and Wabash River drainage above the Embarras River
M a p 9 Little Wabash Region: Little Wabash River and Wabash River drainage between the Embarras and Little Wabash Rivers
M a p 10 Southern Region: Saline, Big Muddy, and Cache Rivers, plus direct drainage into the Wabash, Ohio, and Mississippi Rivers
2.2 QHM at Streamgaging Stations
The primary data used in this study are the daily flow records at the USGS gaging stations on streams in Illinois and the border rivers. These stations are shown on the QHM maps. Daily-flow data for the period of record up to Water Year 1990 were used for this study. The following procedure was used to compute the QHM at the gaging stations.
1. Daily-flow data at all gaging stations in Illinois and selected stations in the bordering states of Wisconsin, Iowa, Missouri, Kentucky, and Indiana were obtained from the USGS and stored on the Sun SPARCstation computer disk.
2. A computer program was developed to read the daily flow data for each station and compute the QHM for each year of record and also for the complete record. Since the QHM is indeterminate when flow is zero, the the annual QHM series is computed by neglecting all zero-flow values. The number of zero-flow days in each year is computed at each gaging station and the percentage of zero-flow days for the period of record is determined.
3. The QHM at a gaging station that has zero-flow days greater than 1 percent was considered to be equal to zero. The 1 percent target for zero flows was based on a comparative analysis of the unadjusted values of QHM and Q 7 , 1 0 for a sample of gaging stations in Illinois. Gaging stations with zero-flow days very close to 1 percent were checked for any problems with the data or the presence of zero-flow days in recent years. This information was used to decide if the QHM was zero or nonzero.
4. A five-year moving average series was generated using the annual QHM for each station. This series was plotted on graph paper to determine any trend in the data. The QHM value was then adjusted, if necessary.
6
Out of about 200 streamgaging stations analyzed, about 50 have undergone changes in streamflow regimen because of considerable wastewater effluent flows, diversions, and stream regulation. The Q H M s at these stations were adjusted to conform to the present conditions. A plot of the five-year moving average of the annual QHM is shown in figure 2.2. The QHM for the period of record is 32 cubic feet per second (cfs). The adjusted QHM is 38 cfs.
2.3 QHM along the Streams
The QHMs at the gaging stations serve as benchmarks for estimating the QHM values along the streams and tributaries. Other pertinent information is the location of WTP effluents entering the stream and their effluents during the months in which low flows may occur in the receiving stream. For maximum utility, QHM values need to be estimated at locations near towns, at junctions with medium and major tributaries, at sizable inflows from WTPs, and at regulation or control works. The QHM values were estimated at these various points along the streams, but not all of them are shown on the low-flow maps to avoid clutter. The QHMS along the streams (every 3 to 5 miles) were derived with the use of the following tools, individually or in combination, as dictated by the prevailing conditions in each general area.
2.3.1 QHM versus Area Curves
The curve for natural QHM versus drainage area, applicable to the region under consideration, indicates the drainage area (Ao) for which the natural QHM is zero. The creeks, streams, and tributaries with drainage area less than AQ are shown by dotted-dashed lines on the low-flow maps. When the drainage area equals Ao, the low-flow value is shown as 0.0 and the stream is drawn as a solid line downstream, which means it is then a perennial-flow stream.
The state was divided into hydrologically homogeneous regions to develop significant correlations between QHM and basin factors (such as drainage area, length, and slope of stream), as well as between QHM and mean flow. The regional regression equations that were developed were used to calculate QHM values at various points in the stream system in a hydrologically homogeneous region.
2.3.2 Wastewater T r ea tmen t Plant Effluents
The WTP effluents entering the streams pose some problems in estimations of Q H M . If these effluents enter streams that have drainage area less than Ao, an estimate has to be made of the losses occurring in the intermittent streams to determine whether these effluents would be absorbed before reaching the natural perennial-flow stream. If the effluent additions are small and enter the stream in the upper reach, generally they are lost in the dry streambed. However, if the effluent additions are considerable, they may contribute to some flow at the stream point with drainage area AQ. The larger the effluent is and the closer it is to the point of entrance to the AQ point, the larger the flow contribution will be. Once the stream has nonzero natural QHM, any effluent additions simply increase the QHM by the amount of effluent addition.
2.3.3 Water Withdrawals for Municipal and Industrial Uses
Generally, any town or industry pumping water from a stream returns it to the stream after use in the form of effluents from its WTP. Such use does cause a reduction in the QHM because the amount of water returned to the stream is always less, though the deficit varies. Adjustments in QHM values are made for these losses where necessary.
2.3.4 Timing of Flows in Two Major Branches
When two major branches drain sufficiently large areas before joining together, the curves for QHM
versus area that are applicable to these branches may be quite different because of hydrologic, geologic,
7

Figure 2.2: Adjustment of trends in determining Q H M : Sangamon River at Monticello
and soil factors. Further, similar flows may not occur during the same month in the two branches. Under such conditions, the QHM below the junction will be higher than a simple addition of the Q H M s in the two branches.
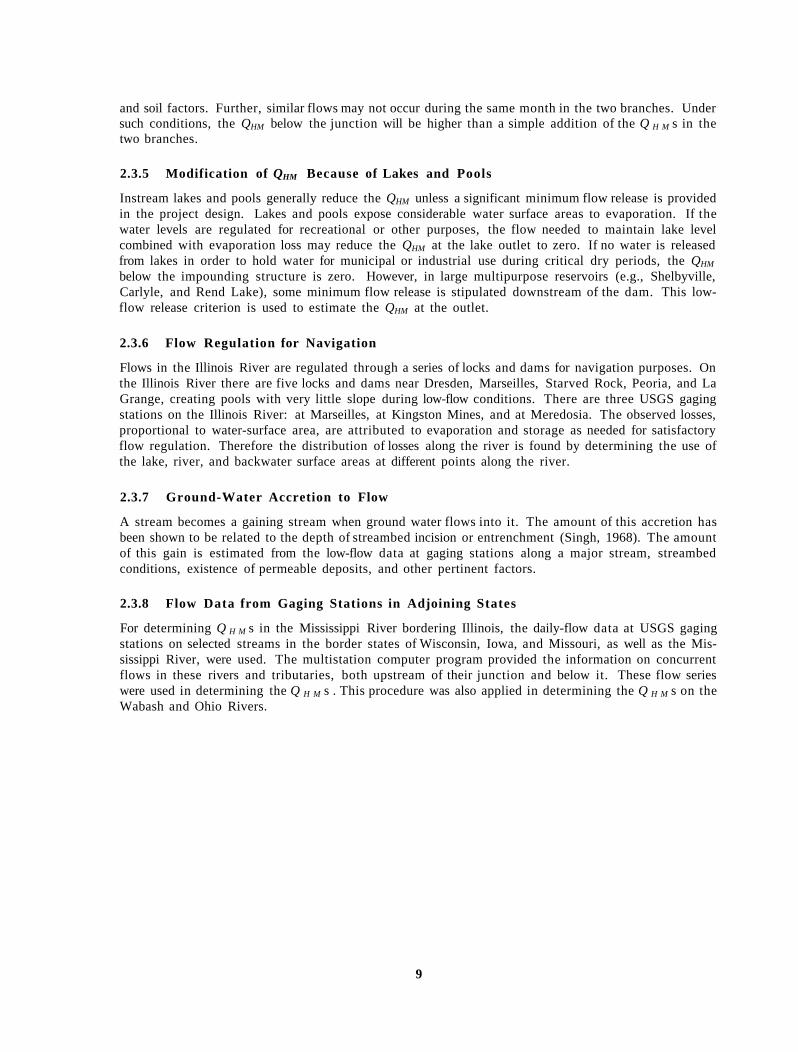
2.3.5 Modification of QHM Because of Lakes and Pools
Instream lakes and pools generally reduce the QHM unless a significant minimum flow release is provided in the project design. Lakes and pools expose considerable water surface areas to evaporation. If the water levels are regulated for recreational or other purposes, the flow needed to maintain lake level combined with evaporation loss may reduce the QHM at the lake outlet to zero. If no water is released from lakes in order to hold water for municipal or industrial use during critical dry periods, the QHM below the impounding structure is zero. However, in large multipurpose reservoirs (e.g., Shelbyville, Carlyle, and Rend Lake), some minimum flow release is stipulated downstream of the dam. This low-flow release criterion is used to estimate the QHM at the outlet.
2.3.6 Flow Regulation for Navigation
Flows in the Illinois River are regulated through a series of locks and dams for navigation purposes. On the Illinois River there are five locks and dams near Dresden, Marseilles, Starved Rock, Peoria, and La Grange, creating pools with very little slope during low-flow conditions. There are three USGS gaging stations on the Illinois River: at Marseilles, at Kingston Mines, and at Meredosia. The observed losses, proportional to water-surface area, are attributed to evaporation and storage as needed for satisfactory flow regulation. Therefore the distribution of losses along the river is found by determining the use of the lake, river, and backwater surface areas at different points along the river.
2.3.7 Ground-Water Accretion to Flow
A stream becomes a gaining stream when ground water flows into it. The amount of this accretion has been shown to be related to the depth of streambed incision or entrenchment (Singh, 1968). The amount of this gain is estimated from the low-flow data at gaging stations along a major stream, streambed conditions, existence of permeable deposits, and other pertinent factors.
2.3.8 Flow Data from Gaging Stations in Adjoining States
For determining Q H M s in the Mississippi River bordering Illinois, the daily-flow data at USGS gaging stations on selected streams in the border states of Wisconsin, Iowa, and Missouri, as well as the Mississippi River, were used. The multistation computer program provided the information on concurrent flows in these rivers and tributaries, both upstream of their junction and below it. These flow series were used in determining the Q H M s . This procedure was also applied in determining the Q H M s on the Wabash and Ohio Rivers.
9

3 DEVELOPMENT OP REGIONAL HARMONIC MEAN FLOW MAPS
3.1 MAP 1 — ROCK RIVER REGION The Rock River region includes the Rock River basin in Illinois and areas drained by streams directly entering the Mississippi River upstream of Rock Island. The major tributaries to the Rock River are the Pecatonica, Kishwaukee, and Green Rivers. The Sinsinawa, Galena, Apple, and Plum Rivers drain directly to the Mississippi River. The entire region, with the exception of JoDaviess County and the northwest corner of Carroll County, is covered with Illinoian glacial drift. Streams in the northern part of the region have much more flow during low-flow conditions than do streams in the southern part. The Rock River is navigable for a distance of 15 miles upstream of its confluence with the Mississippi River. There are seven dams on the Rock River, and the average head lies between 7 and 11 feet. These dams (ISPC, 1938a) are: Milan (Sears plant), Sterling (lower plant), Sterling (government dam), Dixon, Oregon, Rockford, and Rockton.
3.1.1 QHM at Gaging Stations
USGS daily-flow records for 28 gaging stations were analyzed to determine the QHM values for each year of record at these stations. The QHM values at each station were determined by following the procedures outlined in chapter 2. The USGS number, stream and gaging station, drainage area, period of record, percent of zero-flow days, and the QHM are given in table 3.1. The QHM values at the gaging stations serve as benchmarks for estimating the QHM values along the streams and tributaries.
3.1.2 Wastewater Treatment Plants and Effluents
The locations of municipal and industrial WTPs and their monthly average effluent discharges for 1987-1990 were compiled from the discharge monitoring reports available from the regional offices of the IEPA. The magnitude of the QHM from the effluent discharge was estimated by using the ratio of the Q7,10 to current mean monthly effluents. Information obtained from telephone conversations with the WTP managers was used in some cases to make an accurate determination of the QHM for present conditions. Some small towns with lagoon systems have practically no effluent discharge during dry weather conditions. Industrial plants with effluent flows less than 0.1 cfs were not considered. The locations of the municipal and industrial WTPs are not shown on the QHM map. The Commonwealth Edison Byron Station in Ogle County withdraws water from the Rock River for cooling purposes and returns it after use. In this exchange, a loss of 50 cfs occurs as per communication from Commonwealth Edison.
3.1.3 Illinois and Mississippi Canal
When completed in 1907, the canal was 52 feet wide at its bottom, 80 feet wide at the water line, and had a water depth of 7 feet (Yeater, 1978). It was operated by the U.S. Army Corps of Engineers as a navigable waterway from 1907 to 1951. The navigation was discontinued because of excessive maintenance costs. The State of Illinois assumed full ownership in 1970, and the Illinois Department of Conservation is operating a recreation corridor along the canal, affording a variety of water- and trail-related outdoor recreational opportunities.
A feeder canal diverts water from the Rock River near Sterling in Whiteside County. It flows south about 29 miles where it bifurcates into two branches. The west branch runs about 47 miles to the navigable Rock and Mississippi Rivers, and the east branch travels 28 miles to the Illinois River near the town of Hennepin. At present, about 50 cfs is diverted from the Rock River, and this amount is divided nearly equally between the two branches below the point of bifurcation.
10
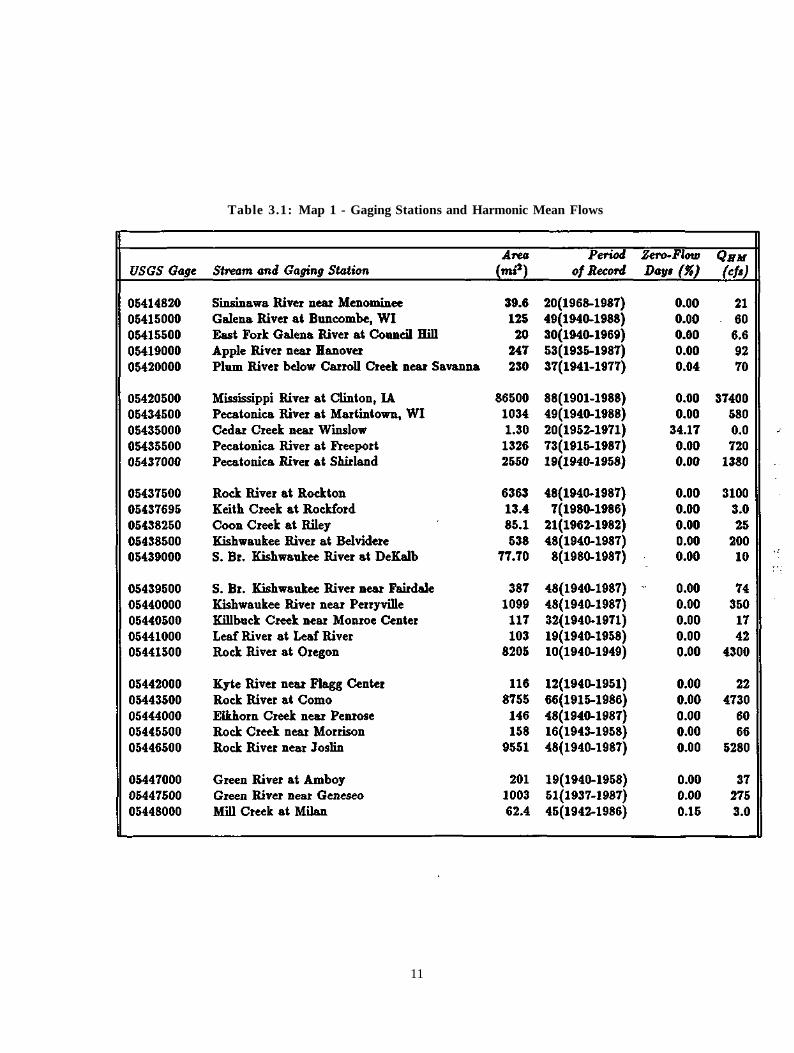
Table 3.1: Map 1 - Gaging Stations and Harmonic Mean Flows
11
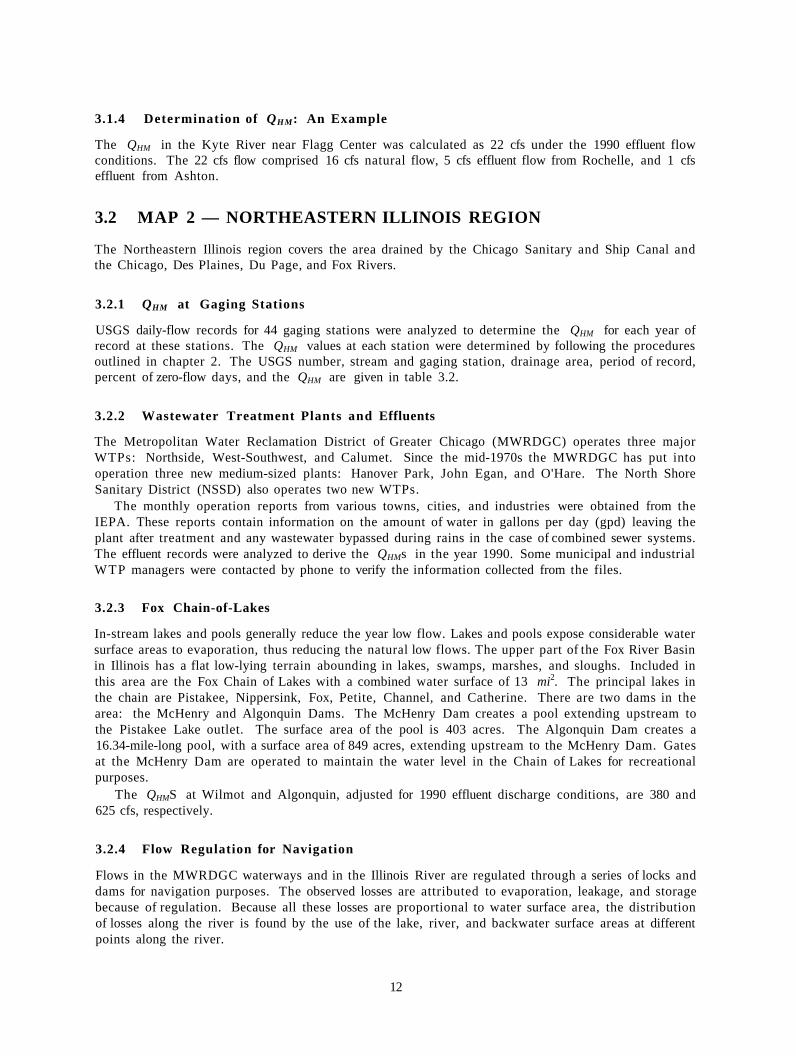
3.1.4 Determination of QHM: An Example
The QHM in the Kyte River near Flagg Center was calculated as 22 cfs under the 1990 effluent flow conditions. The 22 cfs flow comprised 16 cfs natural flow, 5 cfs effluent flow from Rochelle, and 1 cfs effluent from Ashton.
3.2 MAP 2 — NORTHEASTERN ILLINOIS REGION
The Northeastern Illinois region covers the area drained by the Chicago Sanitary and Ship Canal and the Chicago, Des Plaines, Du Page, and Fox Rivers.
3.2.1 QHM at Gaging Stations
USGS daily-flow records for 44 gaging stations were analyzed to determine the QHM for each year of record at these stations. The QHM values at each station were determined by following the procedures outlined in chapter 2. The USGS number, stream and gaging station, drainage area, period of record, percent of zero-flow days, and the QHM are given in table 3.2.
3.2.2 Wastewater Treatment Plants and Effluents
The Metropolitan Water Reclamation District of Greater Chicago (MWRDGC) operates three major WTPs: Northside, West-Southwest, and Calumet. Since the mid-1970s the MWRDGC has put into operation three new medium-sized plants: Hanover Park, John Egan, and O'Hare. The North Shore Sanitary District (NSSD) also operates two new WTPs.
The monthly operation reports from various towns, cities, and industries were obtained from the IEPA. These reports contain information on the amount of water in gallons per day (gpd) leaving the plant after treatment and any wastewater bypassed during rains in the case of combined sewer systems. The effluent records were analyzed to derive the QHMs in the year 1990. Some municipal and industrial WTP managers were contacted by phone to verify the information collected from the files.
3.2.3 Fox Chain-of-Lakes
In-stream lakes and pools generally reduce the year low flow. Lakes and pools expose considerable water surface areas to evaporation, thus reducing the natural low flows. The upper part of the Fox River Basin in Illinois has a flat low-lying terrain abounding in lakes, swamps, marshes, and sloughs. Included in this area are the Fox Chain of Lakes with a combined water surface of 13 mi2. The principal lakes in the chain are Pistakee, Nippersink, Fox, Petite, Channel, and Catherine. There are two dams in the area: the McHenry and Algonquin Dams. The McHenry Dam creates a pool extending upstream to the Pistakee Lake outlet. The surface area of the pool is 403 acres. The Algonquin Dam creates a 16.34-mile-long pool, with a surface area of 849 acres, extending upstream to the McHenry Dam. Gates at the McHenry Dam are operated to maintain the water level in the Chain of Lakes for recreational purposes.
The QHMS at Wilmot and Algonquin, adjusted for 1990 effluent discharge conditions, are 380 and 625 cfs, respectively.
3.2.4 Flow Regulation for Navigation
Flows in the MWRDGC waterways and in the Illinois River are regulated through a series of locks and dams for navigation purposes. The observed losses are attributed to evaporation, leakage, and storage because of regulation. Because all these losses are proportional to water surface area, the distribution of losses along the river is found by the use of the lake, river, and backwater surface areas at different points along the river.
12
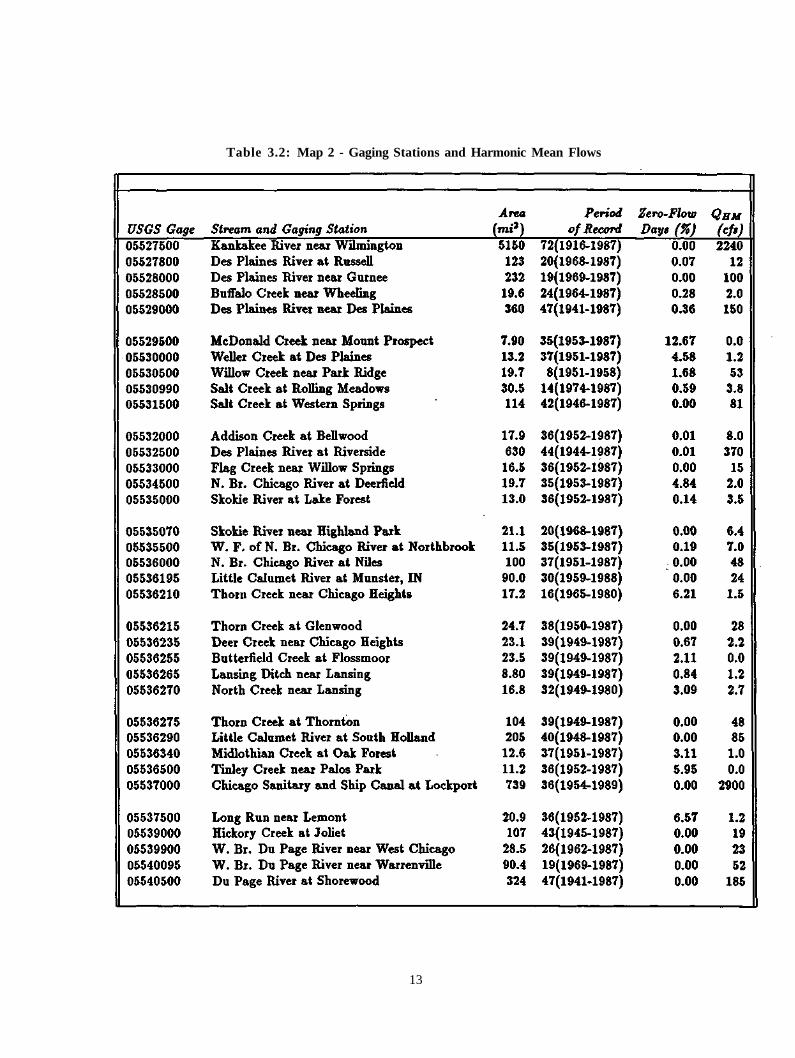
Table 3.2: Map 2 - Gaging Stations and Harmonic Mean Flows
13
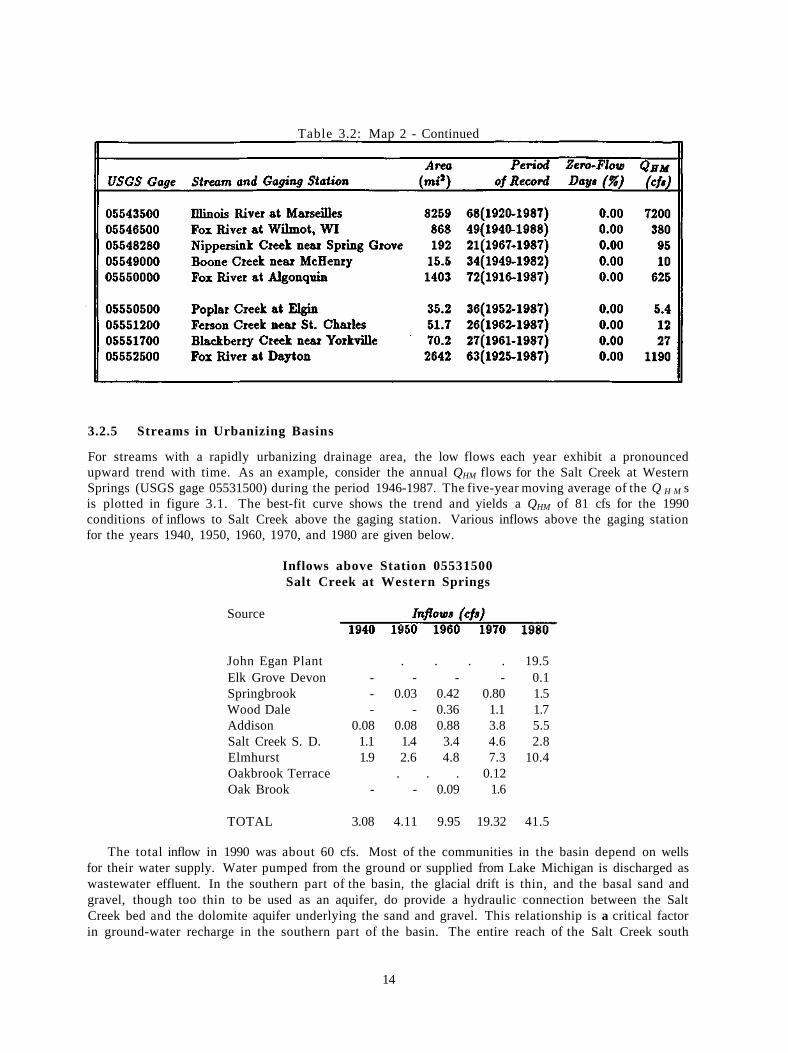
Table 3.2: Map 2 - Continued
3.2.5 Streams in Urbanizing Basins
For streams with a rapidly urbanizing drainage area, the low flows each year exhibit a pronounced upward trend with time. As an example, consider the annual QHM flows for the Salt Creek at Western Springs (USGS gage 05531500) during the period 1946-1987. The five-year moving average of the Q H M s is plotted in figure 3.1. The best-fit curve shows the trend and yields a QHM of 81 cfs for the 1990 conditions of inflows to Salt Creek above the gaging station. Various inflows above the gaging station for the years 1940, 1950, 1960, 1970, and 1980 are given below.
Inflows above Station 05531500 Salt Creek at Western Springs
Source
John Egan Plant . . . . 19.5 Elk Grove Devon - - - - 0.1 Springbrook - 0.03 0.42 0.80 1.5 Wood Dale - - 0.36 1.1 1.7 Addison 0.08 0.08 0.88 3.8 5.5 Salt Creek S. D. 1.1 1.4 3.4 4.6 2.8 Elmhurst 1.9 2.6 4.8 7.3 10.4 Oakbrook Terrace . . . 0.12 Oak Brook - - 0.09 1.6
TOTAL 3.08 4.11 9.95 19.32 41.5
The total inflow in 1990 was about 60 cfs. Most of the communities in the basin depend on wells for their water supply. Water pumped from the ground or supplied from Lake Michigan is discharged as wastewater effluent. In the southern part of the basin, the glacial drift is thin, and the basal sand and gravel, though too thin to be used as an aquifer, do provide a hydraulic connection between the Salt Creek bed and the dolomite aquifer underlying the sand and gravel. This relationship is a critical factor in ground-water recharge in the southern part of the basin. The entire reach of the Salt Creek south
14
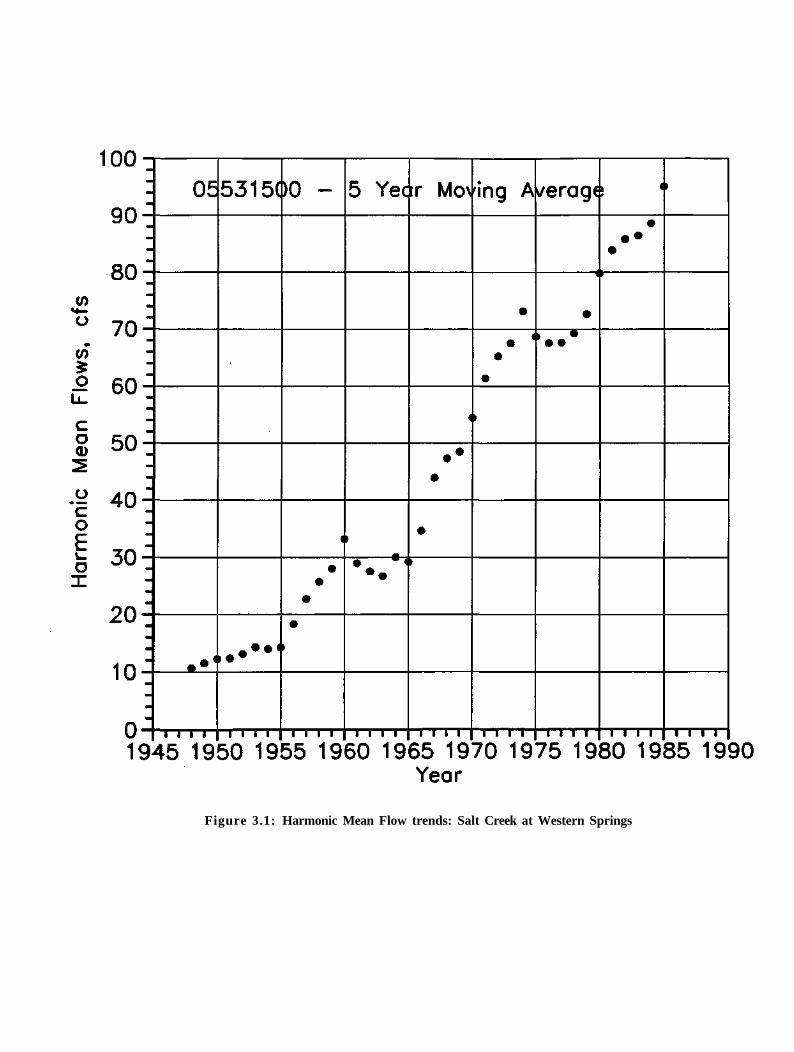
Figure 3.1: Harmonic Mean Flow trends: Salt Creek at Western Springs
and east of Elmhurst is regarded as an area of potential recharge to the shallow aquifers. Favorable conditions for induced recharge exist in the general area near gaging station 05531500 because of an extensive cone of depression caused by ground-water pumping. Induced recharge from the streambed reduces streamflow; this effect will be more pronounced at low flow than at high flow. These losses were used in determining the QHM flows upstream of the gaging station.
3.2.6 Metropolitan Water Reclamation District of Greater Chicago Waterways
The MWRDGC has three major sewage treatment works (Northside, West-Southwest, and Calumet), which discharge to the North Shore Channel, Chicago Sanitary and Ship Canal, and Calumet-Sag Chan-nel, respectively, of the MWRDGC waterways. These waterways serve a dual purpose. They provide open drainage for effluents from WTPs serving Greater Chicago, and navigation facilities both ways for shipping from Lake Michigan to the Mississippi River via the Illinois River. The water levels in these waterways are controlled primarily for navigation that requires wide and deep waterways.
In the past about 1700 cfs of Lake Michigan water was used by municipalities for water supply. After deductions for storm runoff, pumpage, and lockage and leakage, the remainder allowable diversion or discretionary diversion has been used by the MWRDGC to dilute WTP effluents in the waterways during certain periods.
The northside WTP discharges its effluent to the North Shore Channel, which joins the North Branch Chicago River about 3 miles downstream. The North Branch Chicago River meets the Chicago River, which carries Lake Michigan water coming through the lock facilities at Chicago Harbor. From this junction to Damen Avenue, the channel is known as the South Branch Chicago River. Downstream from Damen Avenue to Lockport, it is the Chicago Sanitary and Ship Canal. The largest MWRDGC WTP, West-Southwest, discharges its effluent to this waterway. The canal is joined by the Calumet-Sag Channel from the east, which carries Lake Michigan water passing through the Calumet River and the O'Brien Lock and Dam, water from the Grand Calumet and Little Calumet Rivers, and the effluent from the Calumet WTP, the MWRDGC's third major WTP. Downstream of the Lockport Lock and Dam, the Chicago Sanitary and Ship Canal joins the Des Plaines River, which later combines with the Kankakee River to form the Illinois River.
3.2.7 Illinois River
The Illinois River basin covers 28,906 miles in northern and central Illinois. The flow in the Illinois River is regulated through a series of locks and dams for navigation purposes. The bed profile, the longitudinal water surface profile during low flows, the five locks and dams (Dresden, Marseilles, Starved Rock, Peoria, and La Grange) and the five pools they create, and the three USGS gaging stations are shown in figure 3.2. The pools have very little surface slope during low-flow conditions. The three gaging stations on the Illinois River and the QHMS at these locations are:
• 05543500 Illinois River at Marseilles: 7200 cfs
• 05568500 Illinois River at Kingston Mines: 10,900 cfs
• 05585500 Illinois River at Meredosia: 14,490 cfs
The first, second, and third gaging stations are shown in maps 2 and 3, 3-5, and 6 and 7, respectively. The QHM at the confluence of the Des Plaines and Kankakee Rivers (the start of the Illinois River) was estimated at 7200 cfs from a study of concurrent flows at the following gaging stations:
• 05527500: Kankakee River near Wilmington
• 05532500: Des Plaines River at Riverside
• 05537000: Chicago Sanitary and Ship Canal
• 05539000: Hickory Creek at Joliet
16
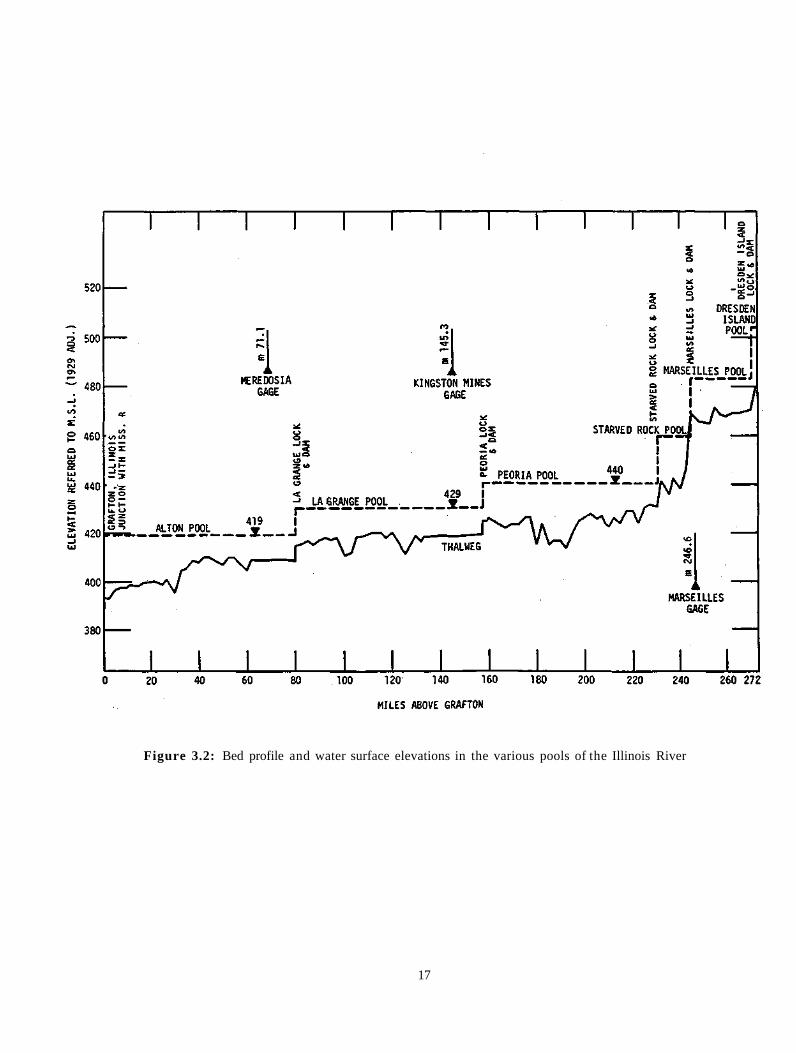
Figure 3.2: Bed profile and water surface elevations in the various pools of the Illinois River
17
• 05540500: DuPage River at Shorewood
• 05542000: Mazon River near Coal City
• 05543500: Illinois River at Marseilles
3.3 MAP 3 — KANKAKEE REGION
The Kankakee region includes the Kankakee, Mazon, Vermilion, and Mackinaw Rivers, and the areas drained by streams directly entering the Illinois River from the east, upstream of the Sangamon River.
The Kankakee River flows westward from Indiana into Illinois. The headwaters are near South Bend, IN, and the mouth is at the confluence of the Kankakee and the Des Plaines River where they combine to become the Illinois River. Of the 5165 mi2 in the Kankakee River drainage basin, 2169 mi2 are in Illinois. The river has a total length of about 150 miles, with 57 miles in Illinois. There is a very small dam at Momence, a larger dam at Kankakee, and an overflow dam at Wilmington, but most of the river remains a natural, meandering stream. A major tributary to the Kankakee River is the Iroquois River, which joins the Kankakee just below Aroma Park. About one-third of the Iroquois drainage basin lies in Indiana. Singleton Ditch, a channelized tributary with most of its drainage area in Indiana, joins the Kankakee about 6 miles downstream of the Illinois-Indiana border.
The Kankakee River basin is covered with a mantle of glacial deposits (from Kansan, Hlinoian, and Wisconsinan glaciations) overlying Paleozoic bedrock. In Illinois most of the bedrock in the basin is Silurian dolomite; in Indiana much of the bedrock is Devonian shale. The surficial deposits in the Kankakee basin belong to the Wisconsinan glaciation. The morphology of the present-day Kankakee River basin in Indiana is due to channelization (completed in 1918) and dredging over its entire length from South Bend, IN, to the Indiana-Illinois state line. In Illinois the Kankakee River flows as a natural, meandering stream. Between the state line and Momence lies an area commonly called the Momence Wetlands, in which the Kankakee River flows over thick sand deposits. Between Momence and Kankakee, the Kankakee River, for the most part, flows on bedrock.
The Mackinaw River begins in northwestern Ford County and flows in a generally westward course, entering the Illinois River below Pekin in Tazewell County. Two man-made reservoirs, Lake Bloom-ington on Money Creek and Evergreen Lake on Six Mile Creek, collectively drain an area of 100 mi2. Physiographically, most of the Mackinaw River basin is located within the Bloomington Ridged Plain except the area near the confluence with the Illinois River, which is located within the Springfield Plain (Leighton et al., 1948).
The Vermilion River is 115 miles long with a drainage area of 1331 mi2. The river basin is located within the Bloomington Ridged Plain (Leighton et al., 1948) except for the headwaters of the North Fork Vermilion River in northwestern Ford County. The Bloomington Ridged Plain is characterized by low, broad morainic ridges with intervening wide stretches of relatively flat or gently undulatory ground moraine. The glacial deposits are relatively thick throughout the basin. Illinoian and older drift are present below the Wisconsinan in most places. Basin soils mainly comprise soils developed primarily from loess and glacial drift (Fenrenbacher et al., 1967).
3.3.1 QHM at Gaging Stations
USGS daily-flow records for 27 gaging stations were analyzed to determine the QHM values at each gaging station by following the procedures outlined in chapter 2. The USGS number, stream and gaging station, drainage area, period of record, percent of zero-flow days, and the QHM are given in table 3.3.
3.3.2 Wastewater Treatment Plants and Effluents
The Commonwealth Edison Dresden and Powerton plants withdraw water from the Illinois River (the Braidwood plant is not in operation at present) for cooling purposes and return it after use. Water loss occurs in this exchange. Net losses also occur in the Kankakee River near Kankakee and the Vermilion
18
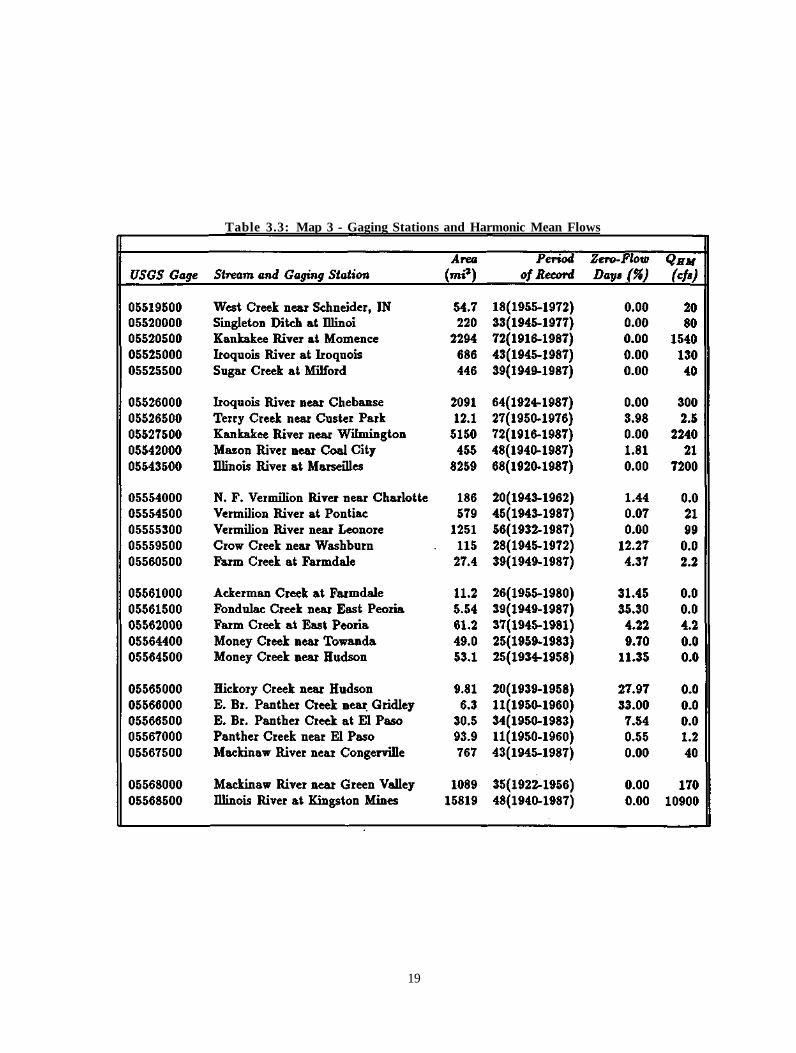
Table 3.3: Map 3 - Gaging Stations and Harmonic Mean Flows
19
River near Pontiac and Streator because of water withdrawal for water supply and reduced return flow from the municipal WTPs.
3.3.3 Determination of Q H M : An Example
The QHM in the Vermilion River at Pontiac was calculated as 21 cfs under the 1990 effluent flow conditions. The 21 cfs flow comprised 24 cfs natural flow minus 3 cfs water withdrawal for Pontiac.
3.4 M A P 4 — SPOON RIVER REGION
The Spoon River region includes the areas drained by the Spoon River, Big Bureau Creek, Edwards River, Pope Creek, and Henderson Creek. Also included are the areas drained by small- to medium-sized streams entering the Illinois River from the west between Ottawa and Beardstown and by streams entering the Mississippi River directly from the east between Rock Island and Lock and Dam No. 18.
The Spoon River, located in west-central Illinois, is 164 miles long and has a drainage area of 1855 mi2. The river flows in a southwesterly direction up to London Mills, then south up to Seville, and turns southeast thereafter to join the Illinois River near Havana. Except near its confluence with the Illinois River, the river bottom consists mainly of sand and gravel (Evans and Schnepper, 1977).
Physiographically, this river basin is located within the Galesburg Plain (Leighton et al., 1948). It includes the western segment of the Illinoian drift sheet. The plain is level to undulatory with a few morainic ridges and is in a late youthful stage of erosion. The larger valleys are steep-walled, alluviated, and terraced.
Big Bureau Creek, located in the northeast portion of the region, is 75 miles long and has a drainage area of 486 mi2. The river flows in a southeasterly direction to join the Illinois River near Bureau Junction.
The Edwards River enters the Mississippi River near New Boston. It has a drainage area of 451 mi2
and is 75 miles long. Pope Creek is an elongated stream 59 miles long, with a drainage area of 200 mi2. It flows in an
almost westerly direction to enter the Mississippi River near Keithsburg. Henderson Creek flows in a generally southwesterly direction to join the Mississippi River near Glad
stone. It is 68 miles long and has a drainage area of 604 mi2.
3.4.1 QHM at Gaging Stations
USGS daily-flow records for 23 gaging stations were analyzed to determine the QHM values at each station by following the procedure outlined in chapter 2. The USGS number, stream and gaging station, drainage area, period of record, percent of zero-flow days, and the QHM are given in table 3.4.
3.4.2 Wastewater Treatment Plants and Effluents
Mobil Chemical Corp. in Bureau County, Libbey Owens Ford Co. in La Salle County, and Illinois Power Company in Putnam County withdraw water from the Illinois River and return it after use. In this exchange, some losses occur.
3.4.3 Illinois and Mississippi Canal
The region includes some portion of the east branch of the Illinois and Mississippi Canal in Bureau County. At the present time, 25 cfs flows in this branch from the point of bifurcation to a lock upstream of the junction with Bureau Creek. The canal reach from the lock to the confluence with the Illinois River is not in use. Construction in progress will connect the canal directly to the Illinois River.
20

Table 3.4: Map 4 - Gaging Stations and Harmonic Mean Flows
21
3.5 MAP 5 — SANGAMON REGION
The Sangamon region includes the Sangamon River and areas drained by small streams directly entering the Illinois River (between miles 147 and 96) from the east. The Sangamon River drains an area of 5419 mi2 and is 241 miles long. Its major tributaries are the South Fork Sangamon River and Salt Creek, which drain 885 and 1868 mi2, respectively. The river rises in McLean and Ford Counties and flows southwest for about 110 miles to Lake Decatur Dam. This man-made lake is created by a dam across the river in Decatur for municipal water supply. From Decatur, the Sangamon continues west about 33 miles to a point about 13 miles southeast of Springfield, where it takes a northwesterly course for some 62 miles until joined by Salt Creek about 10 miles north of Petersburg. The river course is marked by flat valleys, which vary in width according to the resistance of the drift to erosion. From its confluence with Salt Creek, the river flows westerly about 35 miles, through straightened channels, and then empties into the Illinois River above Beardstown.
The South Fork drains 885 mi2. It originates in southwestern Macon and northwestern Shelby Counties. It flows southwest up to 5 miles beyond Taylorville and then bends around to flow northwest. It is 88 miles long and joins the Sangamon 2 miles upstream of River ton. Salt Creek rises in the southeast quarter of McLean County and flows southwest about 35 miles through rolling country. It turns west near Lane and continues through typical prairie to its confluence with the Sangamon, some 8 miles southwest of Mason City. For about 5 miles before joining the Sangamon, it flows through straightened channels. Salt Creek is 118 miles long and drains 1868 mi2.
3.5.1 QHM at Gaging Stations
USGS daily-flow records for 24 gaging stations were analyzed to determine the QHM values at each gaging station by following the procedures outlined in chapter 2. The USGS number, stream and gaging station, drainage area, period of record, percent of zero-flow days, and the QHM are given in table 3.5.
3.5.2 Lake Springfield
Lake Springfield was completed in 1935 by the construction of Spaulding Dam across the valley of Sugar Creek. The dam is 1900 feet long and has a spillway elevation of 560 feet mean sea level (ft msl). The reservoir is approximately 12 miles long, extending south and west from the dam. Its present storage capacity is about 52,000 acre-feet (ac-ft), and its surface area is about 4000 acres. The reservoir is used for the City of Springfield's water supply and also for boiler and cooling water for the city's coal-fired power plant. The city's water treatment and power plants are located along the lakeshore south of the dam. There is no mandatory low-flow release.
3.5.3 Lake Decatur
Lake Decatur was created by a 1900-foot-long dam, built in 1922 across the Sangamon River near Decatur. The pool level is normally maintained at 613.5 ft msl. The lake's present storage capacity is about 19,000 ac-ft and its surface area is about 3000 acres. It is used for the Decatur public water supply and for recreation purposes. There is no mandatory low-flow release.
3.5.4 Clinton Lake
The dam across Salt Creek, about 5 miles east of Clinton, was built in 1977 by the Illinois Power Company to create Clinton Lake. The lake has a storage capacity of about 73,000 ac-ft and its surface area is 5000 acres. The total shoreline is estimated as 130 miles. The lake is used primarily for cooling purposes for the nuclear power plant, and for recreation. The mandatory low-flow release is 5.0 cfs.
22
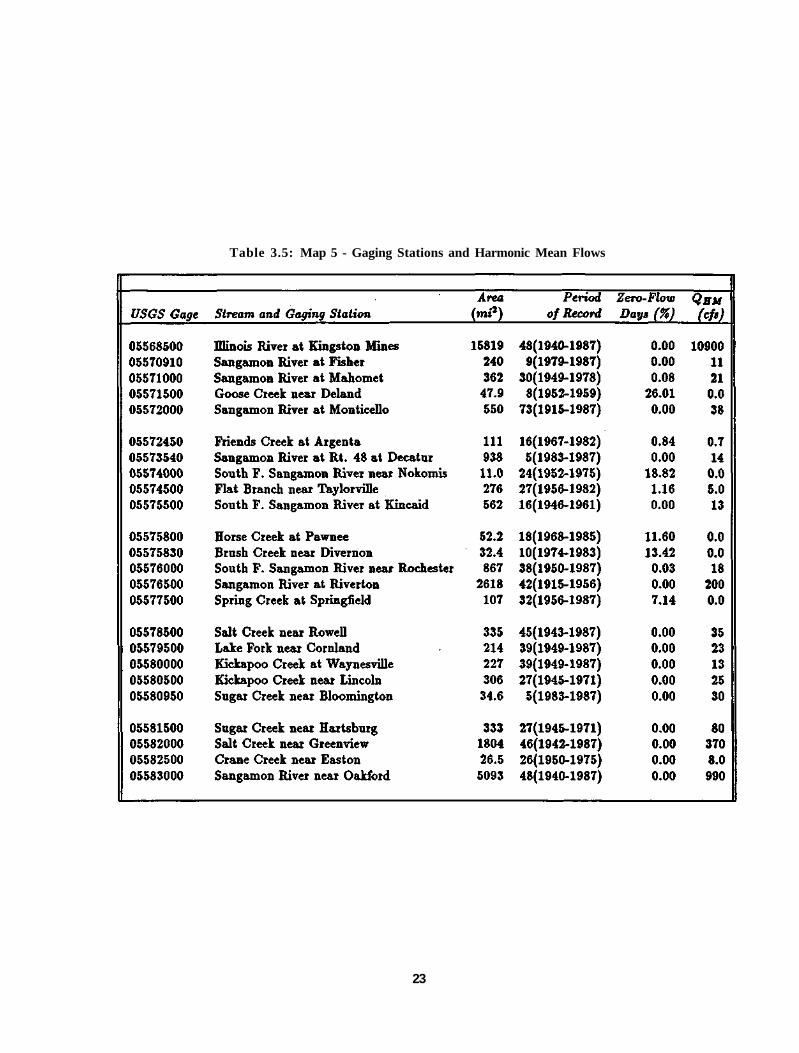
Table 3.5: Map 5 - Gaging Stations and Harmonic Mean Flows
23
3.6 MAP 6 — LA MOINE RIVER REGION
The La Moine River region includes the La Moine River, Macoupin Creek, the area drained by streams directly entering the Mississippi River between Lock and Dam No. 18 and the confluence with the Illinois River, and the area drained by streams directly entering the Illinois River between Beardstown and Grafton.
The La Moine River basin is located in western Illinois. The river drains a total area of 1350 mi2 that includes nearly all of McDonough County, approximately the western half of Schuyler County, northern Brown County, eastern Hancock County, and small portions of Henderson, Warren, and Adams Counties. The river flows southeasterly along a meandering course approximately 100 miles long, starting from the extreme southeast corner of Henderson County and joining the Illinois River about 5 miles below Beardstown. The average slope of the La Moine is slightly more than 3 feet per mile, but some reaches along the channel have slopes as low as 1 to 1.5 feet per mile. Channel widths are about 100 feet along the middle course of the river and as much as 250 feet near the mouth.
The uppermost surface deposits consist of a layer of Wisconsinan loess ranging from 5 to 20 feet in thickness. The loess is underlain by Hlinoian drift, which in turn overlies Kansan drift or, more commonly, the bedrock.
Macoupin Creek flows in a generally southwest direction to enter the Illinois River near East Hardin. It is 99 miles long and has a drainage area of 961 mi7.
3.6.1 QHM at Gaging Stations
USGS daily-flow records for 14 gaging stations were analyzed to determine the QHM for each year of record at each of the stations. The QHM values at each station were determined by following the procedure outlined in chapter 2. The USGS number, stream and gaging station, drainage area, period of record, percent of zero-flow days, and the QHM are given in table 3.6.
3.6.2 Wastewater Treatment Plants and Effluents
The Central Illinois Public Service Company in Morgan County and the Western Illinois Power Company in Pike County withdraw water from the Illinois River for cooling and return it after use. In this exchange, some losses occur.
3.7 MAP 7 — KASKASKIA REGION
The Kaskaskia region includes the Kaskaskia River and the areas drained by other streams directly entering the Mississippi River between its confluences with the Illinois and the Kaskaskia Rivers.
The Kaskaskia River starts from west Champaign, flows in a generally southwesterly direction, and joins the Mississippi River about 8 miles upstream of Chester. Its length is 295 miles, and its total drainage area is 5801 mi2. This area is rough and hilly in the southwest, but the northeastern part is comparatively level and exceptionally well suited for agriculture.
The 295-mile course of the Kaskaskia is extremely winding and irregular, and the river has a total fall of only about 390 feet. The land on both sides of the river is generally very flat. The soils are deep gray loam, though sandy soils are not uncommon. Of its numerous tributaries, the principal ones are the West Okaw River, East Fork Kaskaskia River, Crooked Creek, Hurricane Creek, Shoal Creek, Sugar Creek, Silver Creek, and Richland Creek. These streams are fairly evenly distributed throughout the basin.
3.7.1 QHM at Gaging Stations
USGS daily-flow records for 34 gaging stations were analyzed to determine the QHM values at each station by following the procedure outlined in chapter 2. The USGS number, stream and gaging station, drainage area, period of record, percent of zero-flow days, and the QHM are given in table 3.7.
24

Table 3.6: Map 6 - Gaging Stations and Harmonic Mean Flows
3.7.2 Wastewater Treatment Plants and Effluents
The Illinois Power Company in Randolph County and the U.S. Industrial Chemical Company in Douglas County withdraw water from the Kaskaskia River for cooling purposes and return it after use. Water loss occurs in this exchange. There is also a net loss in the Shoal Creek near Breese because of water withdrawal for water supply.
3.7.3 Carlyle Lake
This multipurpose reservoir was completed by the U.S. Army Corps of Engineers in 1967 by construction of a dam across the Kaskaskia River at mile 94.2 upstream of its confluence with the Mississippi River. Its gross storage at normal pool level is 283,000 ac-ft, and its surface area is 24,600 acres. The reservoir serves many purposes such as flood control, water supply, navigation, and recreation. The mandatory low-flow release is 50 cfs, and the QHM downstream of the lake is 195 cfs.
3.7.4 Lake Shelbyville
Lake Shelbyville was completed in 1969 by construction of a dam at river mile 197.9. The Shelbyville Dam is located at the edge of the Shelbyville Moraine, which forms the southern boundary of the most recent Wisconsinan glaciation. The valleys are deep, narrow, and steep-sided where the river cuts through the moraine. Thus, Lake Shelbyville is a fairly deep lake in a region where topographic relief is generally small. Its gross storage at normal pool is 210,000 ac-ft, and its surface area is 11,100 acres. This is also a multipurpose reservoir, serving flood control, water supply, navigation, and recreation. A low-flow release of 10 cfs, is mandated, and the QHM downstream of the lake is 40 cfs.
25
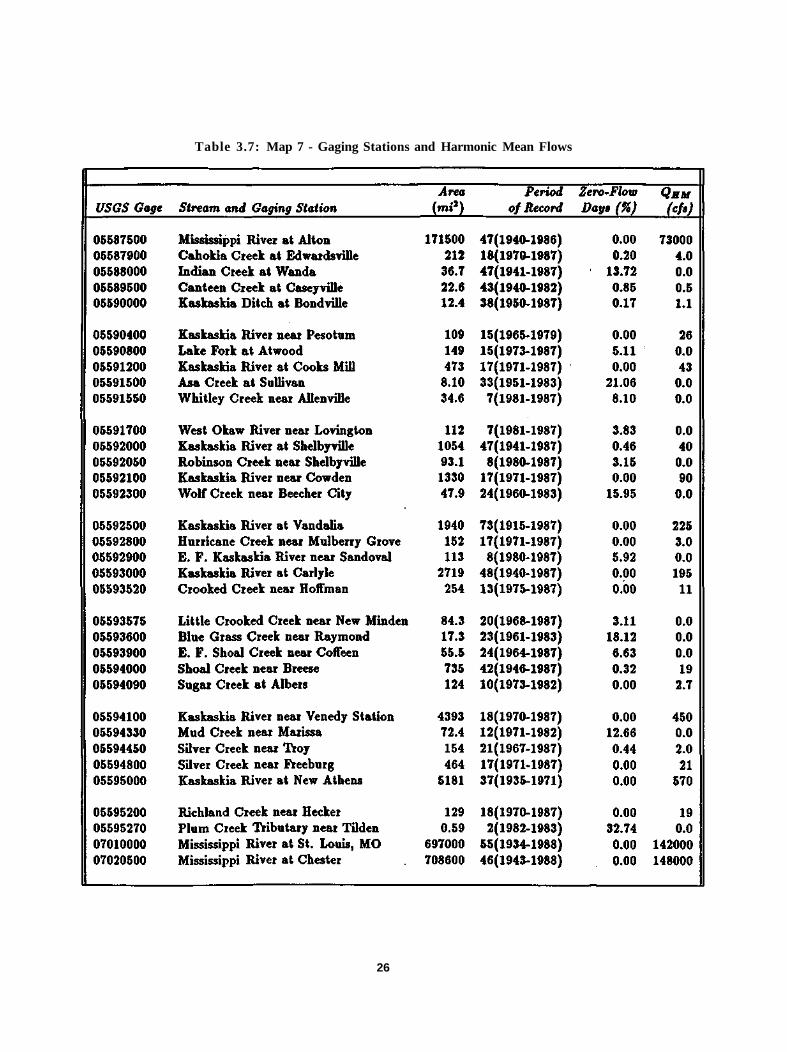
Table 3.7: Map 7 - Gaging Stations and Harmonic Mean Flows
26
3.7.5 U.S. Industrial Chemical Company
Water is pumped from four wells near Bondville (where the high-yield Mahomet aquifer is located) into the Kaskaskia River. It is later withdrawn from the river about 20 miles downstream for cooling and other purposes. Water is returned to the river after use; the return flow is 3 cfs less than the flow withdrawn. The river channel is used to provide an economical means of transporting ground water to the plant site.
3.7.6 Kaskaskia Navigation Canal
The Kaskaskia Navigation Canal was authorized by the River and Harbor Act of 1962, Public Law 87-874. In 1965, the Illinois Department of Transportation was authorized to provide nonfederal sponsorship requirements for the navigation project, restrict water withdrawals, and sell water from the system. The navigation project provides a channel 225 feet wide for barges loaded to a 9-foot draft from the Mississippi River to Fayetteville, 36.2 miles upstream. Traffic in 1984 consisted of 3.2 million tons of coal shipped in 560 tows averaging 4.7 barges per tow. The 84 by 600 foot lock can accommodate six barges in a single lockage or ten barges in a double lockage.
3.7.7 Horseshoe Lake
Granite City Steel Company has reduced its discharge to Horseshoe Lake by recycling its cooling water. The annual average discharge is 20 to 22 million gallons per day (mgd). The treatment plant is shut down twice a year for cleanup and repairs. Each shutdown lasts a week during which no discharge is made to Horseshoe Lake.
Horseshoe Lake is managed by the Metro East Sanitary and Levee District. During high-flow stages in the Mississippi River, the water flows up the Cahokia Canal and enters the lake. There is a low weir to manage flows from the lake to the Cahokia Canal during dry weather conditions. There are periods during which no flow is released from the lake. The QHM outflow from the lake is considered to be zero.
3.7.8 Baldwin Lake
Illinois Power Company owns Baldwin Lake. Water is pumped into the lake from the Kaskaskia Navigational Canal for cooling and other purposes. The average withdrawal is about 30 mgd in September and October, the low-flow period in the Kaskaskia Navigation Canal. The amount of water returned to the canal is about 6.6 mgd. The loss is determined to be about 50 cfs to the Q H M .
3.7.9 Chain of Rocks Canal
Shipping goes through the Chain of Rocks Canal to avoid dangerous conditions in the portion of the Mississippi River from river mile 184.2 to 194.2 (with zero river mile at the confluence of the Mississippi and Ohio Rivers near Cairo, IL). Lock 27 in this canal has two locks: the 1200 by 110 foot main lock, and the 600 by 110 foot auxiliary lock.
3.7.10 Small Lakes
Lake Lou Yaeger, Coffeen Lake, Raccoon Lake, and other small lakes are used primarily for water supply purposes. There are no mandatory low-flow releases from these small lakes during dry periods.
3.8 MAP 8 — EMBARRAS REGION
The Embarras region includes the Vermilion and Embarras Rivers and the areas drained by streams directly entering the Wabash River from the west, upstream of the Embarras River. The Vermilion River drains an area of 1434 mi2 and is 106 miles long. Major tributaries are the North Fork, Middle Fork, and Salt Fork. The topography of the Vermilion River basin (Barker et al., 1967) varies from
27
flat throughout most of the area to gently rolling along the morainal ridges. Steep slopes are confined to the valley walls of the larger streams and their tributaries, particularly in the southeastern or lower end of the basin. The parent materials of the Vermilion River basin soils are almost entirely of glacial origin. These materials usually consist of loess on till, outwash, or lakebed deposits. The only soils of postglacial origin are the alluvial, silt loams in the bottomlands of the river.
The Embarras River drains an area of 2440 mi7 and is 194 miles long. The headwater of the basin is in Champaign County, and the river joins the Wabash River at mile 122 in Lawrence County. At the northern end of the basin, the land is rough and hilly and tributary streams have steep gradients, while at the southern end of the basin lands are generally flatter, and the stream and tributary gradients are quite mild. For a distance of 5 miles upstream of Lawrenceville, the streamflows are affected by backwater from the Wabash River.
The present topography of the entire basin is the result of recent modification of glacial activity during the Wisconsinan and Dlinoian glacial periods. The northern part of the basin lies in the Bloomington Ridged Plain physiographic division (Leighton et al., 1948), which exhibits low and broad morainic ridges of Tazewell age, with intervening wide areas of flat or gently undulatory ground moraines. The central portion of the basin is within the Springfield Plain, which was not subjected to the more recent Wisconsinan glacial activity. The lower portion is within the Mt. Vernon Hill Country physiographic province, where the Dlinoian glacial drift exhibits mature topography with low relief and rather restricted areas of upland between the developed paths of drainage.
3.8.1 QHM at Gaging Stations
USGS daily-flow records for 25 gaging stations were analyzed to determine the QHM values at each gaging station by following the procedures outlined in chapter 2. The USGS number, stream and gaging station, drainage area, period of record, percent of zero-flow days, and the QHM are given in table 3.8.
3.8.2 Wastewater Treatment Plants and Effluents
The Central Illinois Public Service Company in Crawford County and Central Foundry in Vermilion County withdraw water from the river and return it after use. In this exchange, net losses occur.
3.8.3 Wabash River
The Wabash River rises near Celina, OH, flows northwesterly for 67 miles to Huntington, IN; then generally west and southwest 312 miles to its confluence with the White River (its major tributary); and then southwesterly 96 miles to join the Ohio River. The overall length of the Wabash River is about 475 miles and its total drainage area is 33,100 mi2, of which 319 mi3 lie in Ohio, 24,218 in Indiana, and 8563 in eastern Illinois (U.S. Army Corps of Engineers, 1967). From Clark County south to a point 10 miles north of Shawneetown, where the river joins the Ohio River, its winding course forms the boundary between Illinois and Indiana. The portion of the Wabash River from river miles 272 to 122 is included in this region.
3.8.4 Lake Vermilion
Lake Vermilion is located northwest of the city of Danville in Vermilion County. The reservoir is owned and operated by Interstate Water Company as a water source for the city. The dam, a 525-foot-long earthfill and concrete structure, was completed in 1925. As of 1976, its surface area at spillway level, 567 ft msl, was 608 acres, and its storage capacity was 4641 ac-ft. There is no mandatory low-flow release during dry conditions.
28
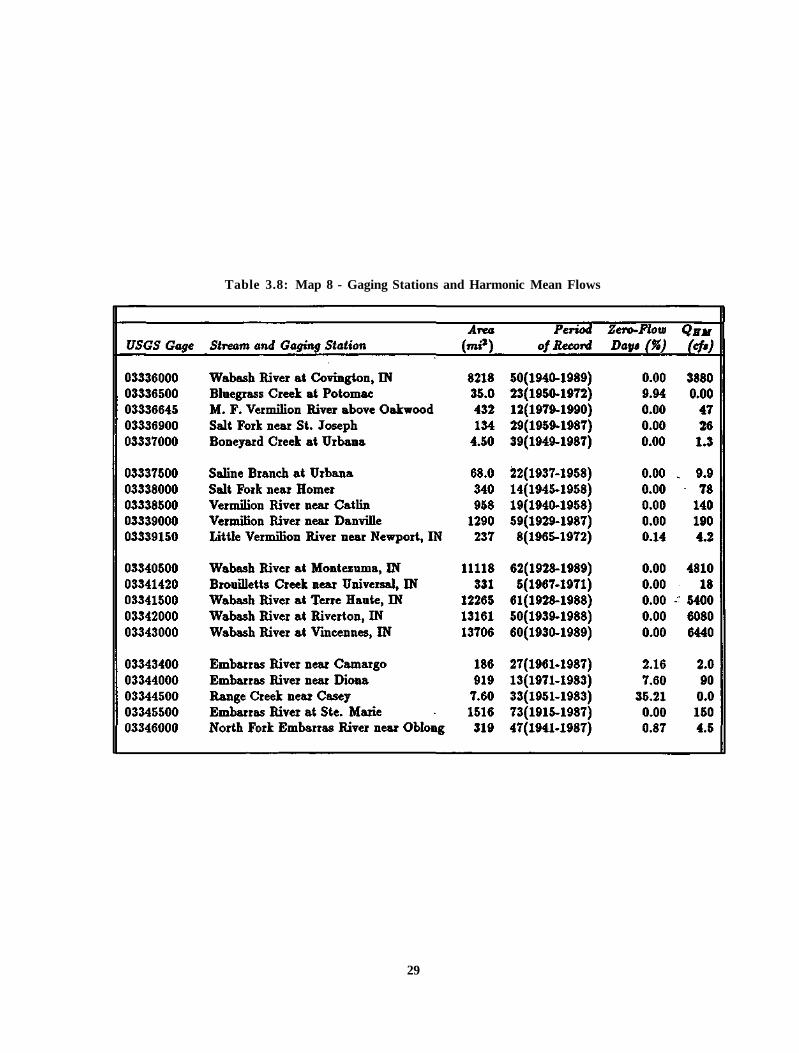
Table 3.8: Map 8 - Gaging Stations and Harmonic Mean Flows
29

Table 3.9: Map 9 - Gaging Stations and Harmonic Mean Flows
3.9 MAP 9 — LITTLE WABASH REGION
The Little Wabash region includes the Little Wabash River and areas drained by small streams directly entering the Wabash River between its confluences with the Embarras and the Little Wabash Rivers.
The Little Wabash River, which starts south of Mattoon, drains about 3203 mi2, is 237 miles long, and flows in a generally southerly direction to join the Wabash River near New Haven. The river is located within the Glacial Plain Region; the northern portion lies in the Springfield Plain and the central and southern portions in Mt. Vernon Hill Country. It flows in a fairly narrow valley and is generally a meandering stream. The average fall of the river below Carmi is about 0.6 feet per mile. The soil in the basin of the Little Wabash is almost entirely gray with a moisture-resisting, noncalcareous subsoil (Illinois State Planning Commission, 1938b). Backwater from both the Ohio and Wabash Rivers affects the lower reaches of the Little Wabash River during high-flow and flood stages. The Skillet Fork, the largest tributary of the Little Wabash River, drains an area of about 1061 mi2 and is 102 miles long. It joins the Little Wabash River about 39 miles above its confluence with the Wabash River. The topography in the extreme upper reaches is slightly rolling, but it is comparatively flat in most of the remaining area.
3.9.1 QHM at Gaging Stations
USGS daily-flow records for 11 gaging stations were analyzed to determine the QHM values at each gaging station by following the procedure outlined in chapter 2. The USGS number, stream and gaging station, drainage area, period of record, percent of zero-flow days, and the QHM are given in table 3.9.
3.10 MAP 10 — SOUTHERN REGION
The Southern region includes the Saline, Big Muddy, and Cache Rivers, and areas drained by small streams directly entering the Ohio and Mississippi Rivers. The region lies just outside the southern limit of glacial drift in Illinois; the underlying rock strata vary a great deal over the region. The general topography is hilly. A range of hills and high tablelands extends from east to west, separating the valleys
30
of the Cache River and Big Bay Creek from the valley of the Saline River. The area north of the Saline River is comparatively flat, and the valley of the river itself broadens to several miles in width where it joins the valley of the Ohio River.
The Ohio River forms the Illinois-Kentucky boundary line in this region. It flows into the Mississippi River at Cairo. About 10 miles above Cairo, the valleys of the Ohio and the Mississippi Rivers merge to form a flat, wide delta. This area is periodically flooded by both rivers.
The Saline River is 84 miles long and drains 1177 mi2. Three major tributaries are the North Fork, Middle Fork, and South Fork Saline River. The North Fork rises in central Hamilton County and flows south through a fiat plain, emptying into the Saline River about 1 mile east of Equality. Rising in the northeast quarter of Williamson County, the Middle Fork flows southeast through a wide, flat valley and joins the Saline about 5 miles below the gaging station near Harrisburg. The South Fork originates in the northern part of Johnson County and flows eastward through the southern portions of Williamson and Saline Counties to its confluence with the Middle Fork. Below the confluence of the Middle Fork and South Fork, the Saline River flows east to a point near Equality, where the North Fork joins, and then turns southeast, emptying into the Ohio River about 10 miles south of Shawneetown. The southern part of the basin is very hilly, but the northern part is generally flat.
The Big Muddy River rises in the northwestern part of Jefferson County, flows southward to the Franklin/Williamson county line, then southwesterly to a point about 5 miles west of Murphysboro, and then southward to its junction with the Mississippi River about 4 miles south of Grand Tower. It is 154 miles long and has a total drainage area of 2387 mi2. This basin lies mostly in Mt. Vernon Hill Country (Leighton et al., 1948), which is characterized by mature topography of low relief. The present land surface is primarily a bedrock surface of low relief, and it is only slightly modified by a thin mantle of Illinoian drift.
In the Cache River basin, three physiographic provinces (coastal plain, interior low plateaus, and Ozark plateaus) meet and provide the basin with unique, varying physiography (Leighton et al., 1948). The bed of the Cache River upstream of the Post Creek Cutoff is gradually eroding and lowering because of the Cutoff's steep gradient. The flow at the USGS gaging station at Forman has not been affected significantly by the Post Creek Cutoff, about 4 miles downstream.
3.10.1 QHM at Gaging Stations
USGS daily-flow records for 24 gaging stations were analyzed to determine the QHM values at each gaging station by following the procedure outlined in chapter 2. The USGS number, stream and gaging station, drainage area, period of record, percent of zero-flow days, and the QHM are given in table 3.10. Daily-flow data at six special-purpose gaging stations in the Cache River basin were collected by the State Water Survey during the period 1986-1990 (Demissie et al. 1990). The period of record and the estimated QHM at these stations are given below.
Gaging Station Record QHM
Big Creek at Perks Road 5(1986-1990) 3.2 Cypress Creek at Dongola Road 4(1987-1990) 0.0 Main Ditch at Route 45 3(1986-1988) 1.0 Cache River at Route 46 5(1986-1990) 6.4 Indian Camp Creek at Ulin 2(1987-1988) 6.5 Cache River at Route 51 4(1987-1990) 5.1
The QHM at these sites were used to update the values for regional analysis.
3.10.2 Wastewater Treatment Plants and Effluents
The Central Illinois Public Service Company in Jackson County and Electric Energy, Inc. in Massac County withdraw water from the river and return it after use. In this exchange, net losses occur.
31
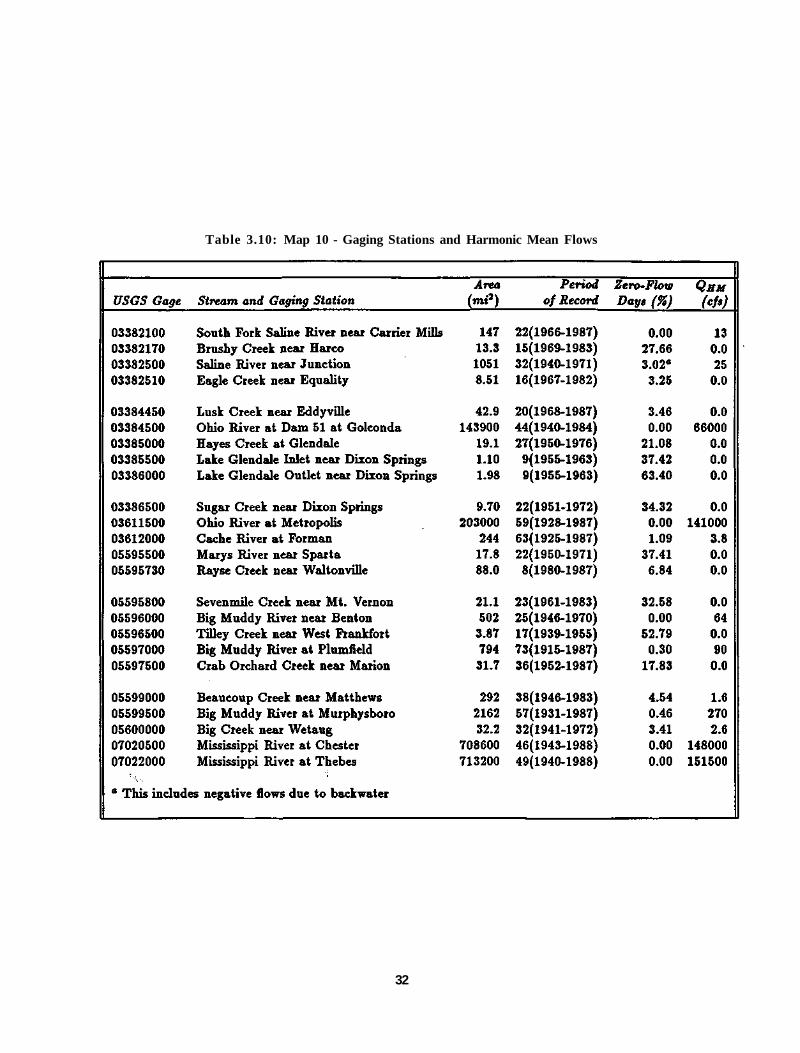
Table 3.10: Map 10 - Gaging Stations and Harmonic Mean Flows
32
3.10.3 Rend Lake
Rend Lake, situated in Jefferson and Franklin Counties, was created in 1970 by damming the Big Muddy River. The lake is managed by the U.S. Army Corps of Engineers. Its normal pool elevation is 405 ft msl, its storage capacity is 185,000 ac-ft, and its surface area is 18,900 acres. The lake is used for flood control and water supply as well as for recreational activities. It also serves as a source of public water supply for about 55 communities under the Rend Lake Conservancy District (Illinois State Water Survey, 1978). The mandatory low-flow release during dry conditions is 30 cfs. The QHM downstream of the lake is equal to 60 cfs.
3.10.4 Crab Orchard Lake
Crab Orchard Lake was completed in 1940. Its original storage capacity was 74,400 ac-ft, and its surface area is 6965 acres. The lake is used for recreational purposes; for conservation of water, soil, and forests; and as a migratory waterfowl refuge. There is no mandatory low-flow release during dry weather.
3.10.5 Lake Egypt
Lake Egypt was completed in 1962 by impoundment of the South Fork of the Saline River. Its storage capacity is 42,550 ac-ft, and its surface area is 2300 acres. The lake, owned by the Southern Illinois Power Cooperative, Marion, IL, is used as a cooling reservoir for the coal-fired power generating station located at the west end of the dam.
33
REFERENCES
[1] Barker, B., J.B. Carlisle, and R. Nyberg. 1967. Vermilion River Basin Study. Illinois Department of Public Works and Buildings, Springfield.
[2] Demissie, M., T.W. Soong, R. Allgire, L. Keefer, and P. Makowski. 1990. Cache River Basin: Hydrology, Hydraulics, and Sediment Transport - Volume 1: Background, Data Collection, and Analysis. Illinois State Water Survey Contract Report 484.
[3] Evans, R.L., and D.H. Schnepper. 1977. Sources of Suspended Sediment: Spoon River, Illinois. Illinois State Water Survey, Peoria.
[4] Fenrenbacher, J.B., G.O. Walker, and H.L. Wascher. 1967. Soils of Illinois. University of Illinois Agricultural Experiment Station Bulletin 725.
[5] IEPA (Illinois Environmental Protection Agency). 1990. Title 35: Environmental Protection, Subtitle C: Water Pollution, Chapter I: Pollution Control Board Springfield, Illinois.
[6] ISPC (Illinois State Planning Commission). 1938a. Report on the Rock River Basin in Illinois. Chicago, Illinois.
[7] ISPC (Illinois State Planning Commission). 1938b. Report on the Wabash River Basin in Illinois. Chicago, Illinois.
[8] Illinois State Water Survey. 1978. Water Quality Assessment of Rend Lake and Its Tributaries. Prepared for Greater Egypt Region Planning and Development Commission.
[9] Leighton, M.M., G.E. Ekblaw, and L. Horberg. 1948. Physiographic Divisions of Illinois. Illinois State Geological Survey Report of Investigation 129.
[10] Singh, K.P. 1968. "Some Factors Affecting Baseflow." Water Resources Research, Vol. 4, No. 5. October.
[11] Singh, K.P. 1984. 7-Day 10-Year Low Flows of Streams in Northeastern Illinois. Illinois State Water Survey Contract Report 307.
[12] Singh, K.P., G.S. Ramamurthy, and I.W. Seo. 1988a. 7-Day 10-Year Low Flows of Streams in the Rock, Spoon, La Moine, and Kaskaskia River Basins. Illinois State Water Survey Contract Report 440.
[13] Singh, K.P., G.S. Ramamurthy, and I.W. Seo. 1988b. 7-Day 10-Year Low Flows of Streams in the Kankakee, Sangamon, Embarras, Little Wabash, and Southern Regions. Illinois State Water Survey Contract Report 441.
[14] Singh, K.P., and J.B. Stall. 1973. The 7-Day 10-Year Low Flows of Illinois Streams. Illinois State Water Survey Bulletin 57.
[15] U.S. Army Corps of Engineers. 1967. Wabash River Basin Comprehensive Study, Indiana, Illinois, and Ohio. Louisville, Kentucky.
[16] Yeater, M.M. 1978. "The Hennepin Canal." American Canals, Bulletin of the American Canal Society.
34