Embed Size (px)
Citation preview
Harmonics Workshop
for TSO and DSO customers
21st November 2013 Alexander Hotel, Fenian St, Dublin 2

Session 1 10:00
•Introduction(Yvonne Coughlan)
10:10
•Background Theory and Grid Code (John Ging)
10:40
•International Standards and Practice (Zia Emin)
11:05
•Tea Break
11:15
•TSO Policy & Proposed Methodology for limit calculation (Mark Norton)
12:00
•DSO Policy & Proposed Methodology for limit calculation (Ivan Codd) 12:30
•Q+A
Session 2 13:45
•Mitigation strategies (Marta Val Escudero)
14:05
•Power Quality monitoring (Ray Doyle)
14:15
•Charging (Marie Hayden) 14:40
•TSO Study Roadmap and Action Plan (Brendan Kelly)
15:10
•Q+A
15:25
•Closing Remarks (Michael Walsh)
Agenda for Harmonics Workshop
Session 1
Harmonic Theory Dr. John Ging
EirGrid
What are Harmonics?
Defn:
Any overtone accompanying a fundamental
tone at a fixed interval
– Characteristic depends on system – guitar violin sound
– “Artificial” but are always present in reality
– Pleasing to the ear but NOT for Power Systems
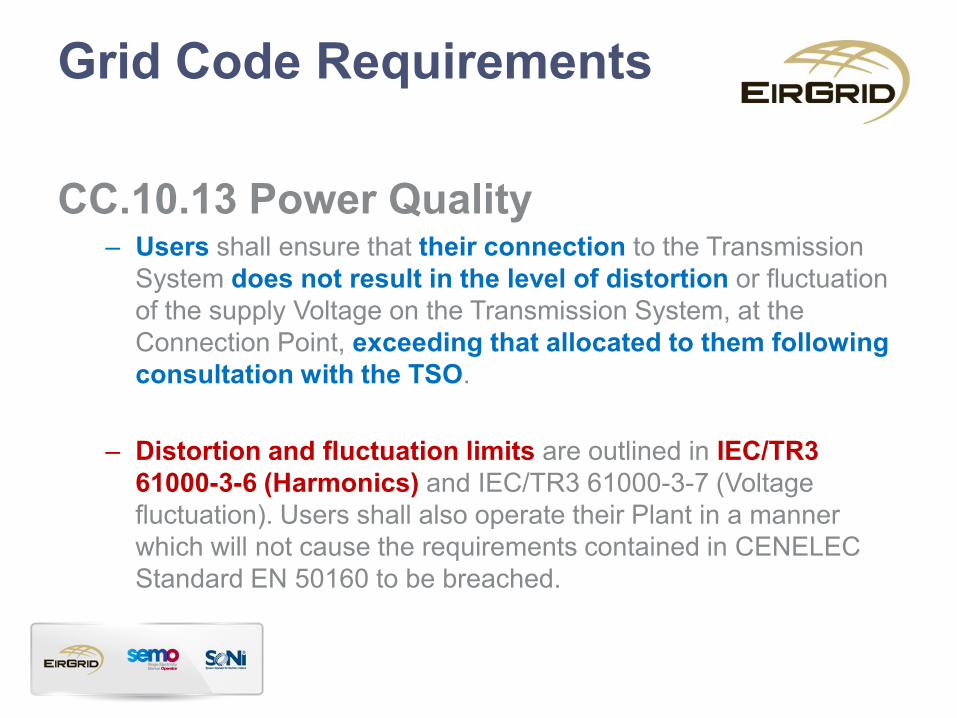
Grid Code Requirements
CC.10.13 Power Quality – Users shall ensure that their connection to the Transmission
System does not result in the level of distortion or fluctuation
of the supply Voltage on the Transmission System, at the
Connection Point, exceeding that allocated to them following
consultation with the TSO.
– Distortion and fluctuation limits are outlined in IEC/TR3
61000-3-6 (Harmonics) and IEC/TR3 61000-3-7 (Voltage
fluctuation). Users shall also operate their Plant in a manner
which will not cause the requirements contained in CENELEC
Standard EN 50160 to be breached.
0 pi/2 5pi/6 pi 7pi/6 3pi/2 2pi-1
0
1
radians
3 Phase Supply
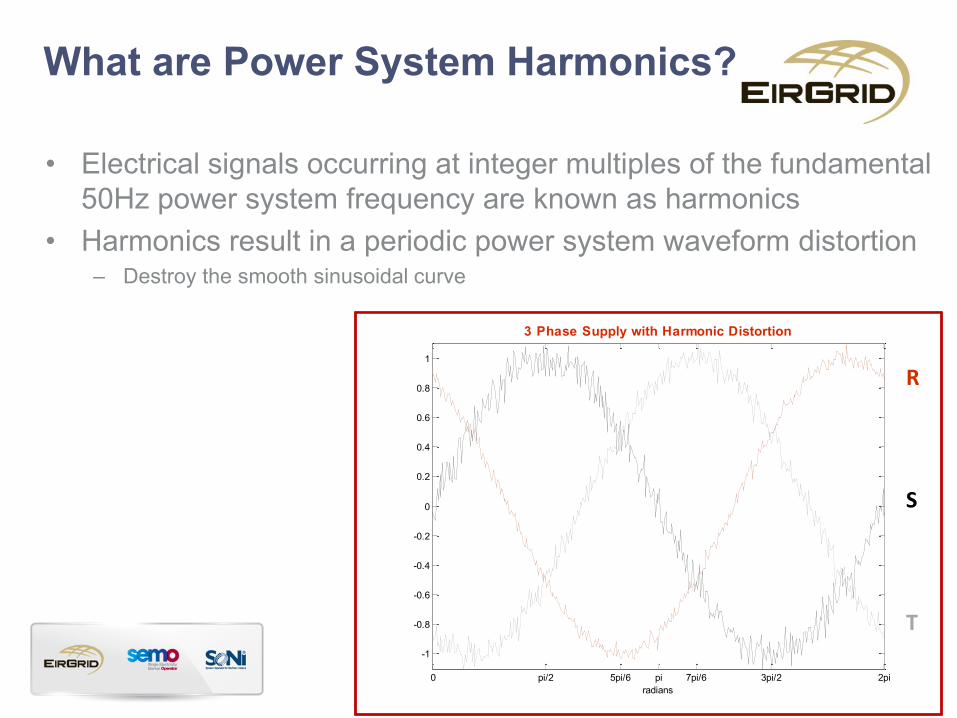
What are Power System Harmonics?
• Electrical signals occurring at integer multiples of the fundamental
50Hz power system frequency are known as harmonics
• Harmonics result in a periodic power system waveform distortion – Destroy the smooth sinusoidal curve
0 pi/2 5pi/6 pi 7pi/6 3pi/2 2pi
-1
-0.8
-0.6
-0.4
-0.2
0
0.2
0.4
0.6
0.8
1
radians
3 Phase Supply with Harmonic Distortion
R
S
T
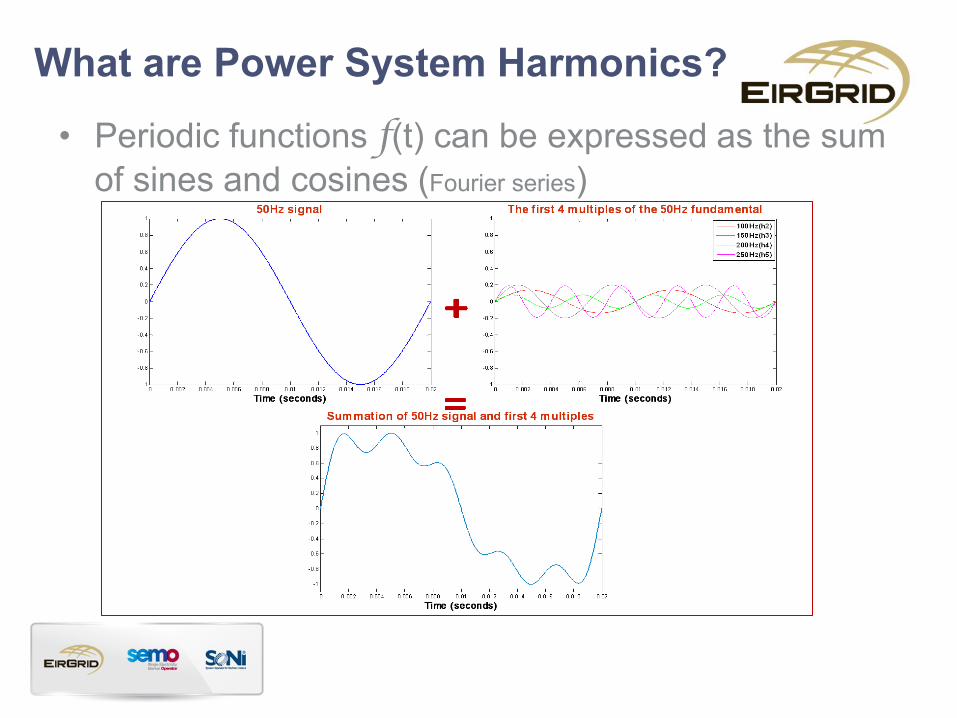
What are Power System Harmonics?
• Periodic functions f(t) can be expressed as the sum
of sines and cosines (Fourier series)
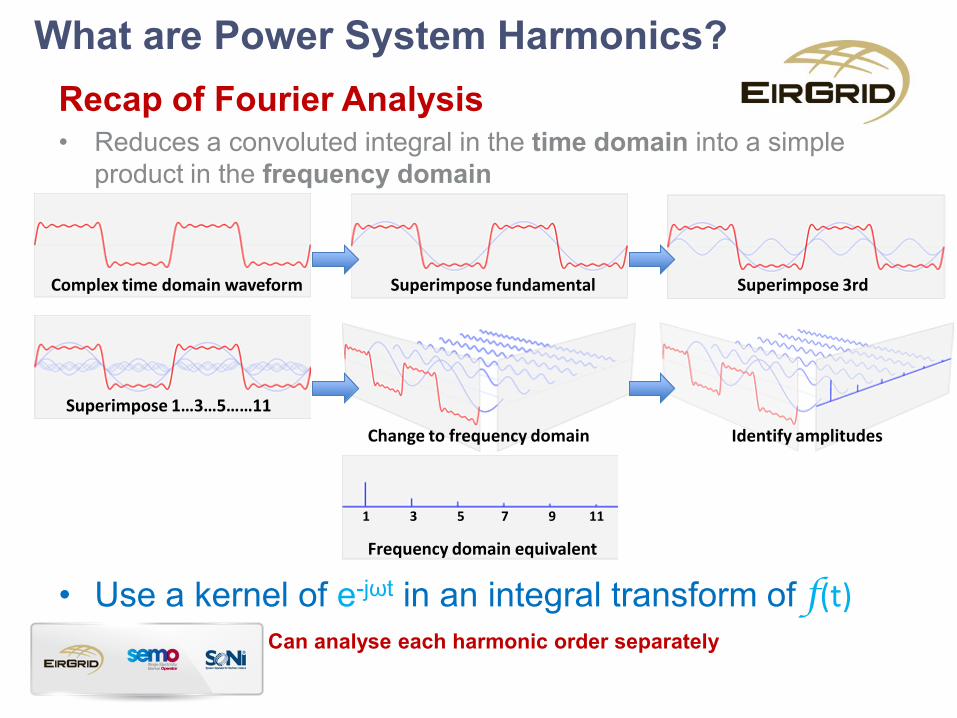
What are Power System Harmonics?
Recap of Fourier Analysis • Reduces a convoluted integral in the time domain into a simple
product in the frequency domain
• Use a kernel of e-jωt in an integral transform of f(t)
Can analyse each harmonic order separately
Complex time domain waveform Superimpose fundamental Superimpose 3rd
Superimpose 1…3…5……11
Change to frequency domain Identify amplitudes
Frequency domain equivalent
1 3 5 7 9 11
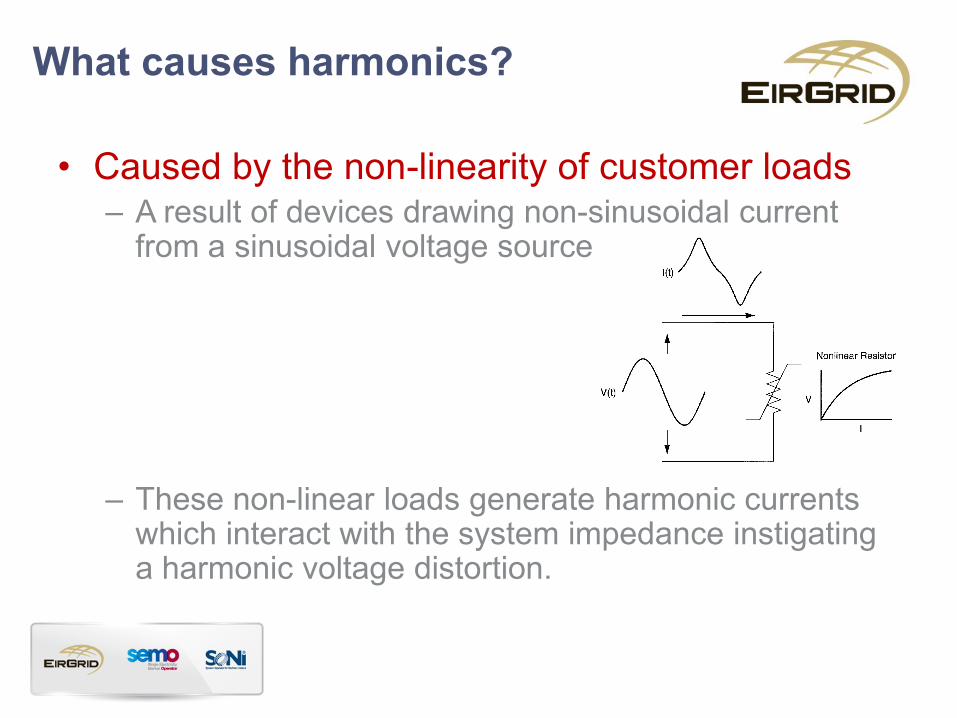
What causes harmonics?
• Caused by the non-linearity of customer loads – A result of devices drawing non-sinusoidal current
from a sinusoidal voltage source
– These non-linear loads generate harmonic currents which interact with the system impedance instigating a harmonic voltage distortion.
Power System Harmonic distortion
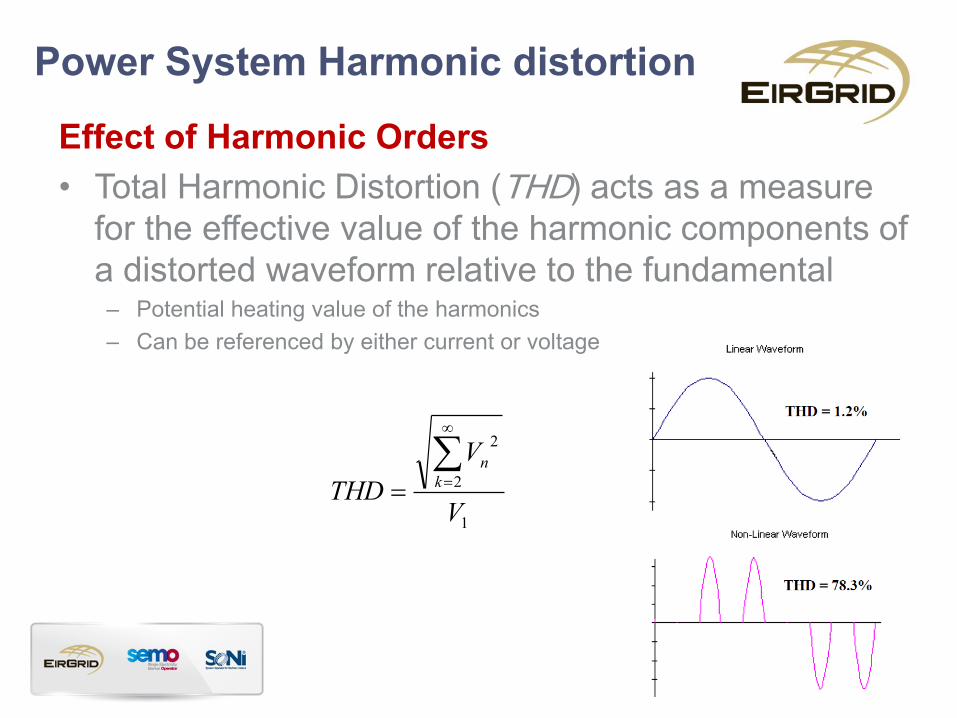
Effect of Harmonic Orders
• Total Harmonic Distortion (THD) acts as a measure
for the effective value of the harmonic components of
a distorted waveform relative to the fundamental – Potential heating value of the harmonics
– Can be referenced by either current or voltage
1
2
2
V
V
THDk
n
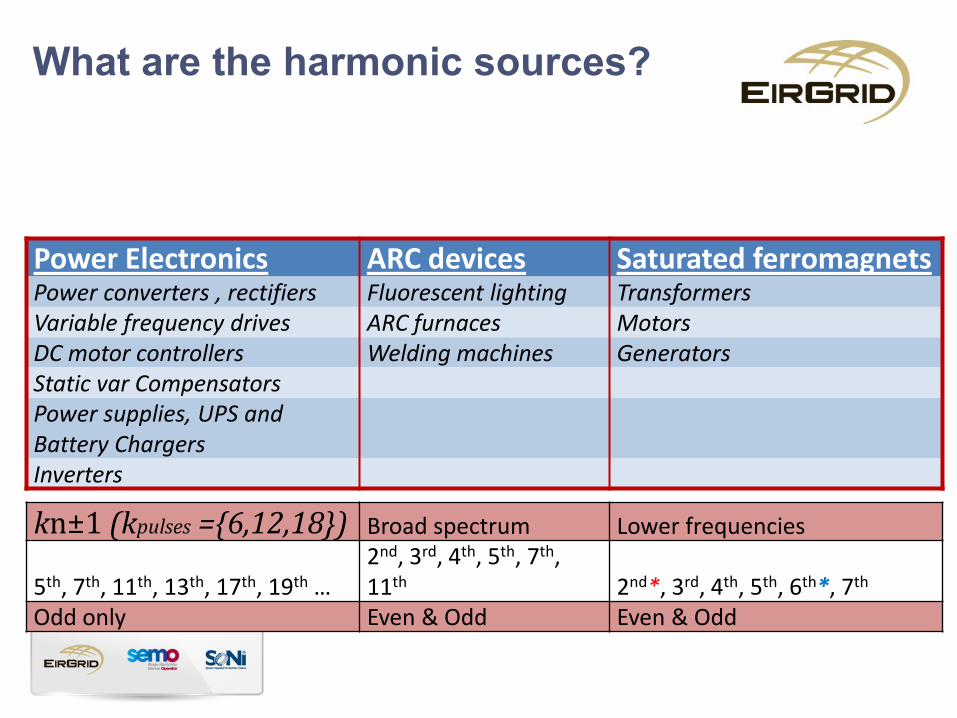
What are the harmonic sources?
Power Electronics ARC devices Saturated ferromagnets Power converters , rectifiers Fluorescent lighting Transformers Variable frequency drives ARC furnaces Motors DC motor controllers Welding machines Generators Static var Compensators Power supplies, UPS and Battery Chargers Inverters
kn±1 (kpulses =6,12,18) Broad spectrum Lower frequencies
5th, 7th, 11th, 13th, 17th, 19th …
2nd, 3rd, 4th, 5th, 7th, 11th 2nd*, 3rd, 4th, 5th, 6th*, 7th
Odd only Even & Odd Even & Odd
Why are Harmonic problems
becoming an increasing concern?
• Increasing use of power electronics and converters
(particularly for wind turbines) are injecting more
harmonic currents onto the system
• The nature of the system is changing → system strength
• The influx of more cables onto the network exacerbate
the problem by changing the network impedance
• Cables amplify any harmonic injections present
What does this mean?
Harmonic related distortions can result in the failure or mal-operation of end-use equipment – Increases the current in the system (i.e. higher losses)
– Overheating in transformers, motors and neutral wires
– Can resonate with system Capacitor Banks
– Shaft torsion and shaft currents if un-insulated bearings
– Telecommunications interference
– Misfiring from incorrect triggering at “zero-crossings” • i.e. multiple crossings of the x-axis can wreak havoc on the
timing signals used for Digital Circuits; Rectifiers, Thyristors and Inverters
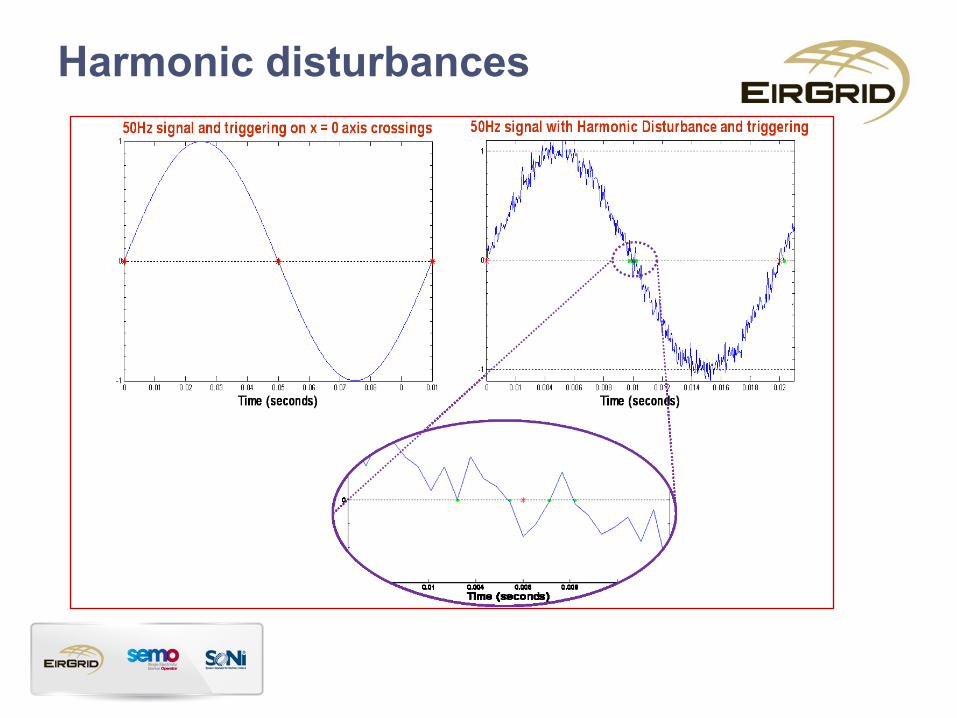
Harmonic disturbances
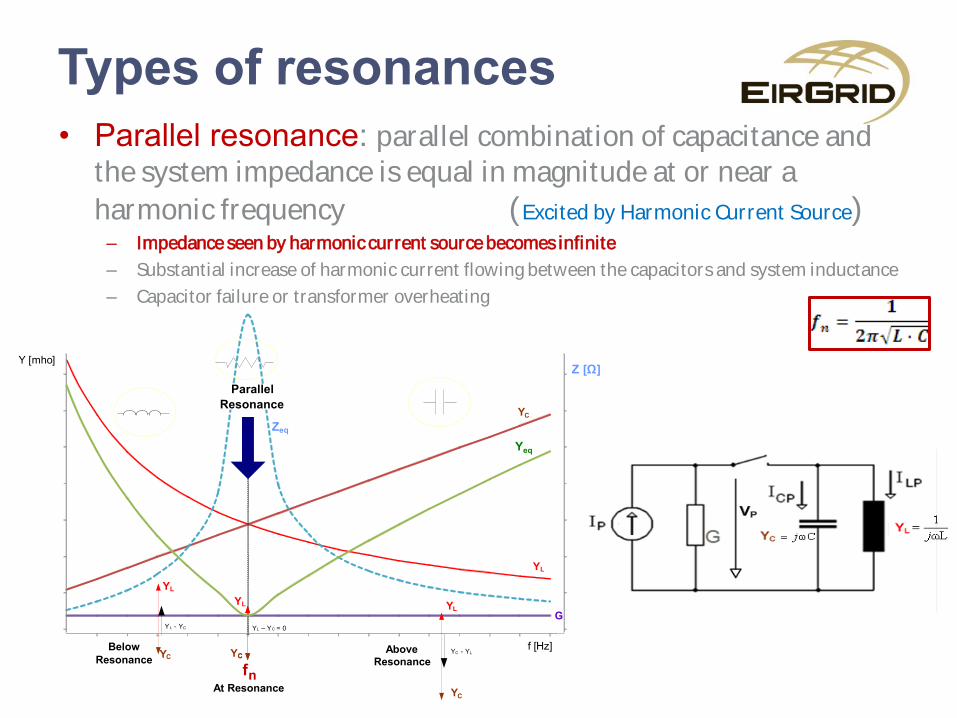
Types of resonances
• Parallel resonance: parallel combination of capacitance and the system impedance is equal in magnitude at or near a
harmonic frequency (Excited by Harmonic Current Source) – Impedance seen by harmonic current source becomes infinite
– Substantial increase of harmonic current flowing between the capacitors and system inductance
– Capacitor failure or transformer overheating
G
Y L
Y C
0.2
0.4
0.6
0.8
1
1.2
0
Z eq
15 16 17
Y L
Y C
Y C - Y L Above Resonance
5 6 7 Below
Resonance
Y L
Y C
Y L - Y C
9 10 11
Parallel
Resonance
f n
Y C
Y L – Y C = 0
At Resonance
Y L
C
Y eq
12
0
1
2
3
4
5
6
7
8 13 14 18 19 20
Y [ mho ]
f [ Hz ]
1.4
[ 1.6
Z Ω ]
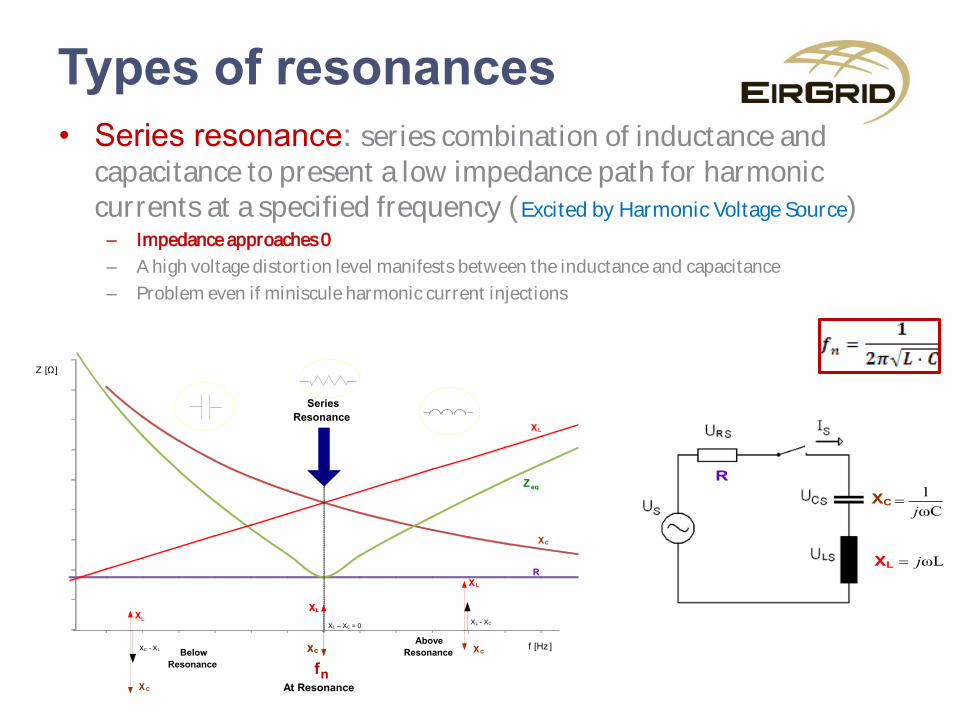
Types of resonances
• Series resonance: series combination of inductance and capacitance to present a low impedance path for harmonic currents at a specified frequency (Excited by Harmonic Voltage Source)
– Impedance approaches 0
– A high voltage distortion level manifests between the inductance and capacitance
– Problem even if miniscule harmonic current injections
a) Series b) Parallel
R
XL ωLj
XCωC
1
j
R
X C
20
5
10
15
20
25
30
35
40
45
50
8 12
Z [ Ω ]
f [ Hz ]
Z eq
9 10 11
Below
Resonance
X L
X C
X C - X L
16 17 18 19 Above
Resonance
X L
X C
X L - X C
X L
13
Series
Resonance
14 15
X L
X C
X L – X C = 0
X L
X C
f n At Resonance
SS HV LV/MV XX AA
HV PCCPCC HV
HV
SS
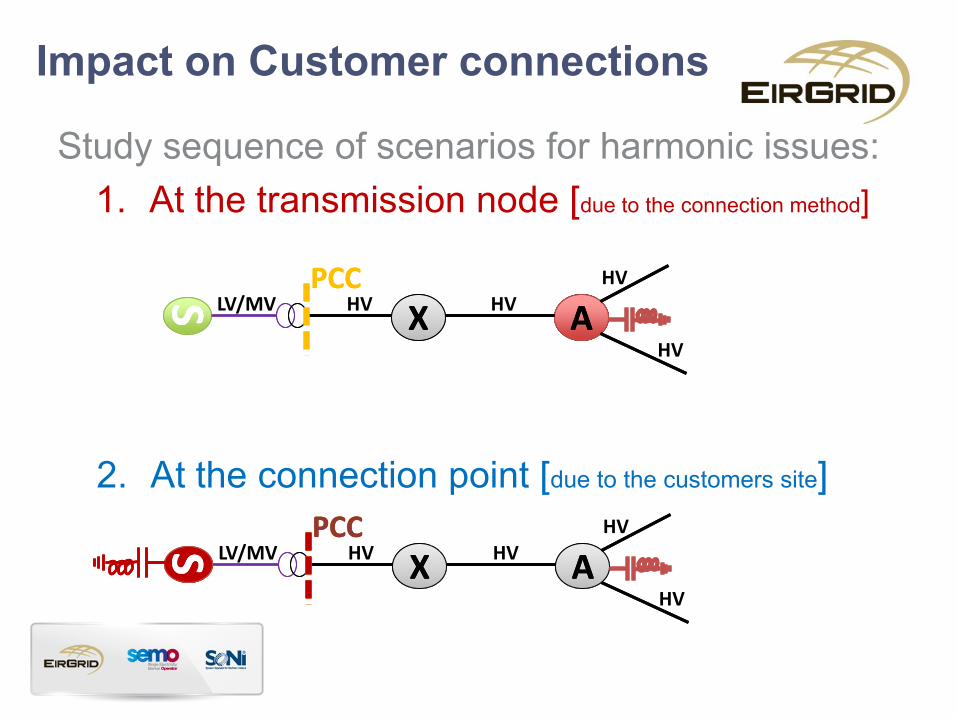
Impact on Customer connections
Study sequence of scenarios for harmonic issues:
1. At the transmission node [due to the connection method]
2. At the connection point [due to the customers site]
HV LV/MV XX AA
HV PCCPCC HV
HV
SS
PCCPCC

SS
SS
SS HV LV/MV XX AA
HV PCCPCC HV
HV HV
YY HV
PCCPCC LV/MV
PCCPCC
LV/MV
SS
SS
SS SS
SS SS
Impact on Cluster connections
Study sequence of scenarios for harmonic issues:
1. At the transmission node [due to the connection method(s)]
2. At the connection point [due to the customers site]
HV LV/MV XX AA
HV PCCPCC HV
HV HV
LV/MV YY
HV
PCCPCC LV/MV
PCCPCC
SS
SS SS PCCPCC
PCCPCC
Details can also be found in the
Harmonics Information notes:
http://www.eirgrid.com/customers/gridconnections/harmonics/
Harmonics in Power Systems
Zia Emin PhD, CEng, FIET, SMIEEE
Chief Engineer, Power Systems
21 Harmonics Workshop - EirGrid - © Zia Emin – 21 November 2013
22
Structure of Presentation
Why are we bothered about harmonics?
EMC concept and standards
What can we do about harmonics?
ER G5/4-1 Stage 3 Assessment
Specifying emission limits to customers
Higher frequencies?
Harmonics Workshop - EirGrid - © Zia Emin – 21 November 2013
23
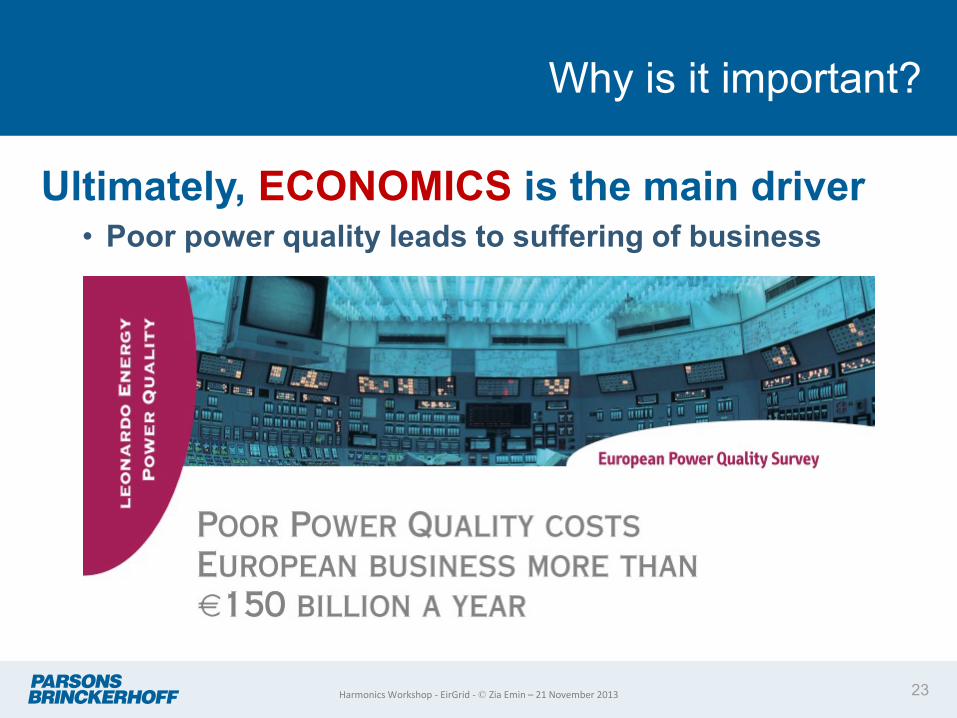
Why is it important?
Ultimately, ECONOMICS is the main driver • Poor power quality leads to suffering of business
Harmonics Workshop - EirGrid - © Zia Emin – 21 November 2013

24
Some historical economic data
T. Andersson and D. Nilsson "Test and evaluation of voltage dip
immunity," STRI AB and Vatenfall AB, 2002
0.8 0.3
5.7
12.7
5.6
23.5
0
5
10
15
20
25
30
35
Digital Economy Continuous Process Manufacturing
Fabrication & Essential Services
Co
st
in $
Billio
ns
Aggregate annual cost of outages and PQ problems
Other
PQ related
D Lineweber and S R McNulty “The cost of Power Disturbances to
Industrial & Digital Economy Companies”. Primen report for EPRI's
(CEIDS), 2000
Harmonics Workshop - EirGrid - © Zia Emin – 21 November 2013
25
What can we do about them?
• Standards and/or recommendations exists to make
sure equipment connected to electricity supply system
operate under a coordinated electromagnetic
compatibility (EMC) criteria.
• Such standards and recommendations usually provide
a set of planning and/or compatibility levels to be
applied by system planners/operators.
Harmonics Workshop - EirGrid - © Zia Emin – 21 November 2013
Why Standardize?
To make sure that equipment connected to electricity
supply system operate under a coordinated
electromagnetic compatibility (EMC) criteria.
Such standards and recommendations usually provide
a set of planning and/or compatibility levels to be
applied by system planners/operators.
26 Harmonics Workshop - EirGrid - © Zia Emin – 21 November 2013
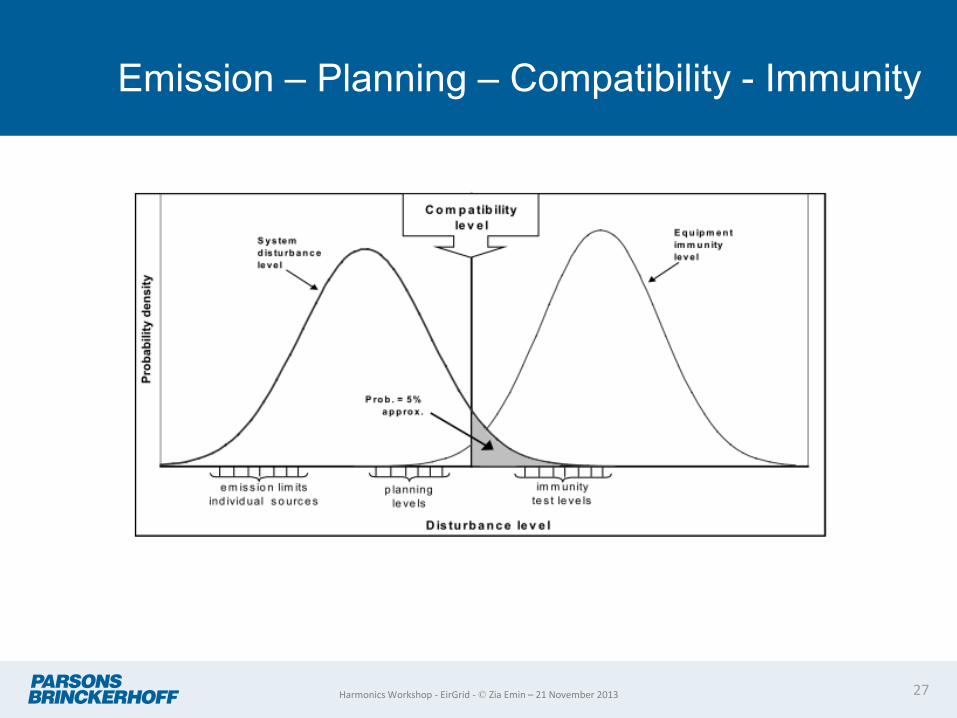
Emission – Planning – Compatibility - Immunity
27 Harmonics Workshop - EirGrid - © Zia Emin – 21 November 2013
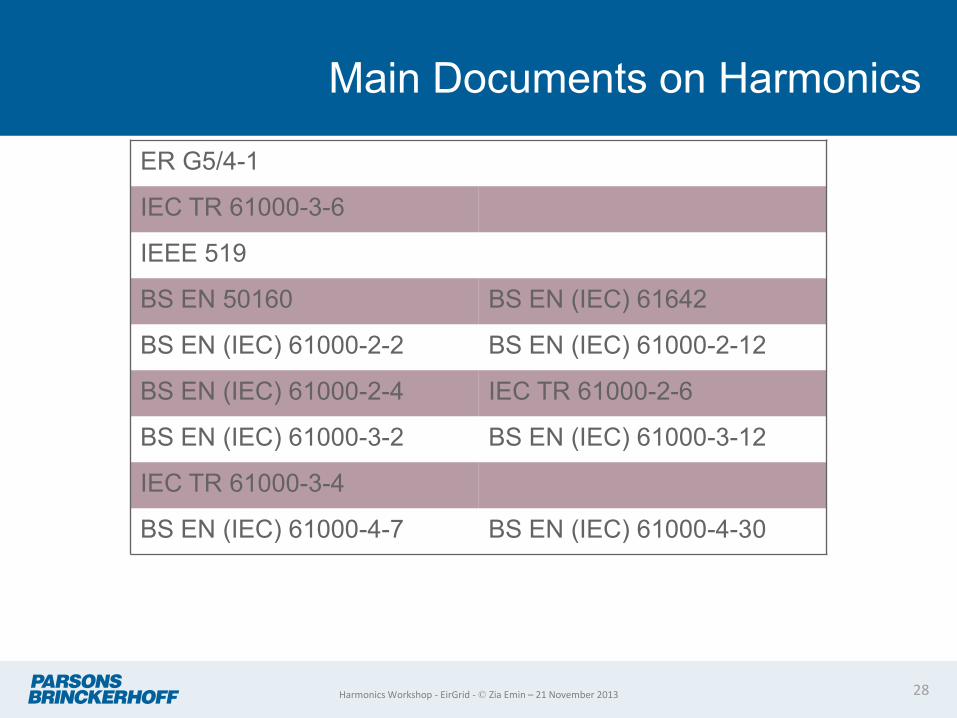
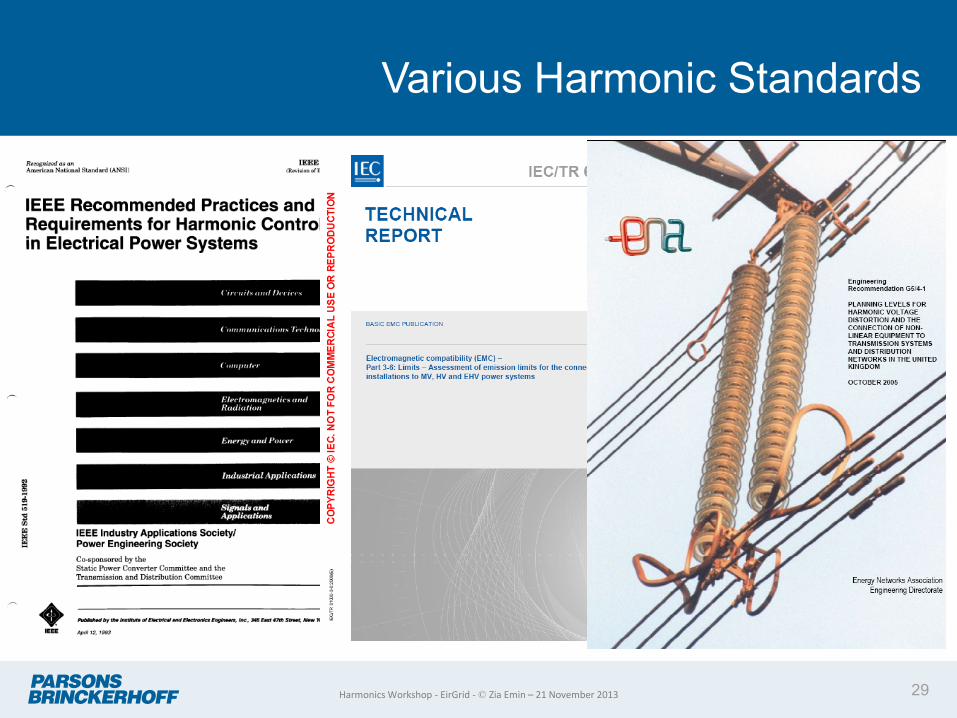
Main Documents on Harmonics
28
ER G5/4-1
IEC TR 61000-3-6
IEEE 519
BS EN 50160 BS EN (IEC) 61642
BS EN (IEC) 61000-2-2 BS EN (IEC) 61000-2-12
BS EN (IEC) 61000-2-4 IEC TR 61000-2-6
BS EN (IEC) 61000-3-2 BS EN (IEC) 61000-3-12
IEC TR 61000-3-4
BS EN (IEC) 61000-4-7 BS EN (IEC) 61000-4-30
Harmonics Workshop - EirGrid - © Zia Emin – 21 November 2013
29
Various Harmonic Standards
Harmonics Workshop - EirGrid - © Zia Emin – 21 November 2013
.....a word of caution
30
Recommendations , Technical Reports and Standards.
Harmonics Workshop - EirGrid - © Zia Emin – 21 November 2013
ER G5/4-1
Not a STANDARD – it is, as name suggests, a
RECOMMENDATION
Sets the planning levels with respect to harmonic voltage
distortion compatibility levels to be used in the process
for the connection of non-linear equipment for systems
above 36.5kV. For systems less than 36.5kV the
compatibility levels are set by International Standards.
It’s application is referred to in Grid Code CC.6.1.5(a) and
Distribution Code DPC4.2.3.2
Operates under the “first come first served” philosophy.
31 Harmonics Workshop - EirGrid - © Zia Emin – 21 November 2013
IEC TR 61000-3-6
Not a STANDARD – it is, a Technical Report.
Limits – Assessment of emission limits for the connection of distorting installations to MV, HV and EHV power systems
Informative in its nature but provides guidance on principles which can be used as the basis for determining the requirements for the connection of distorting installations to MV, HV and EHV public power systems. MV is 1 kV < Un ≤ 35 kV
HV is 35 kV < Un ≤ 230 kV
EHV is Un >230 kV (UHVAC, referring to 1000 kV UHVDC, referring to +/-800 kV)
Sets indicative planning levels for harmonic voltages in MV, HV and EHV power systems. No compatibility in IEC for HV and EHV.
Operates under the proportional allocation philosophy.
32 Harmonics Workshop - EirGrid - © Zia Emin – 21 November 2013
IEEE 519
A STANDARD – it is recognised as such by ANSI.
IEEE Recommended Practices and Requirements for
Harmonic Control in Electrical Power Systems
Based on developed current limits starting from LV all the
way up. It also includes voltage limits applicable to all
voltage levels. One limit level for all individual harmonics
plus a separate one for THD.
Perhaps a bit outdated (1992) compared to ER G5/4-1 and
IEC 61000-3-6 but still heavily used.
33 Harmonics Workshop - EirGrid - © Zia Emin – 21 November 2013
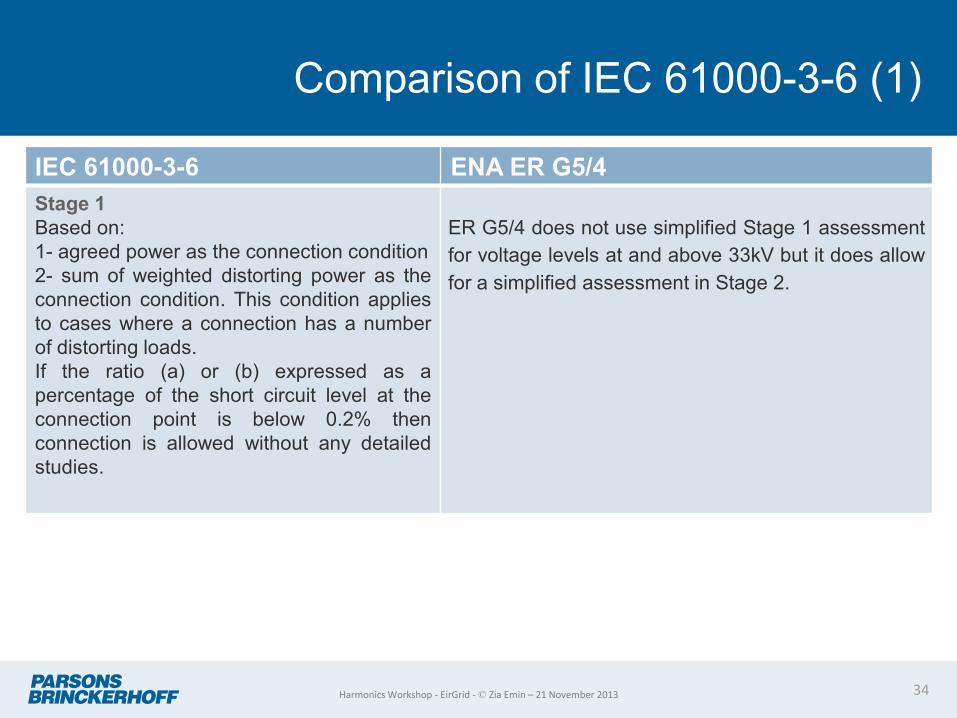
Comparison of IEC 61000-3-6 (1)
34
IEC 61000-3-6 ENA ER G5/4
Stage 1
Based on:
1- agreed power as the connection condition
2- sum of weighted distorting power as the
connection condition. This condition applies
to cases where a connection has a number
of distorting loads.
If the ratio (a) or (b) expressed as a
percentage of the short circuit level at the
connection point is below 0.2% then
connection is allowed without any detailed
studies.
ER G5/4 does not use simplified Stage 1 assessment
for voltage levels at and above 33kV but it does allow
for a simplified assessment in Stage 2.
Harmonics Workshop - EirGrid - © Zia Emin – 21 November 2013
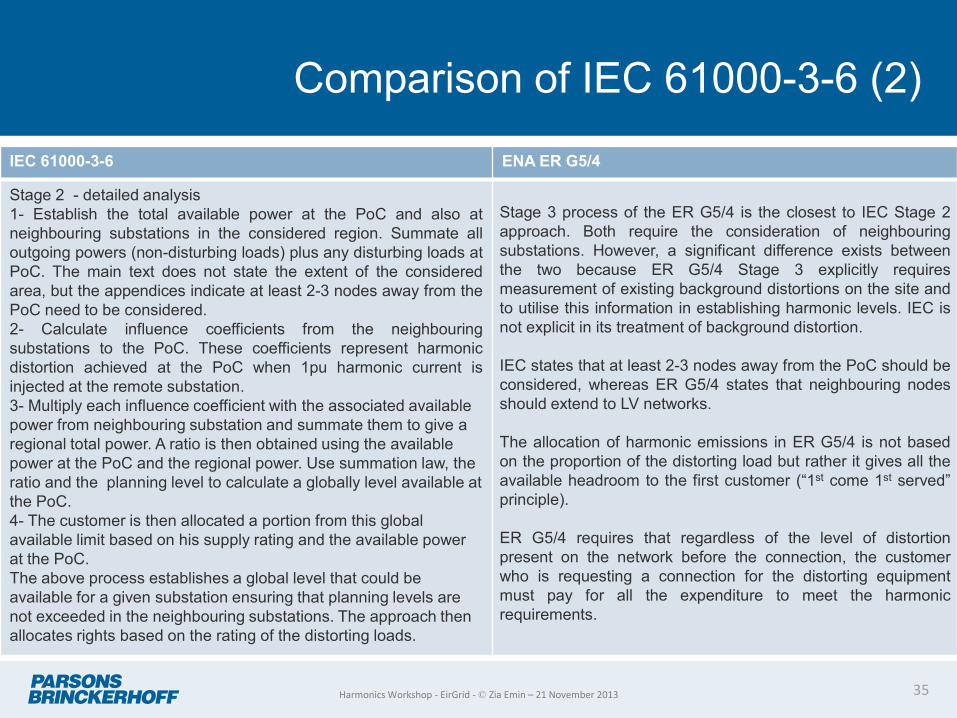
Comparison of IEC 61000-3-6 (2)
35
IEC 61000-3-6 ENA ER G5/4
Stage 2 - detailed analysis
1- Establish the total available power at the PoC and also at
neighbouring substations in the considered region. Summate all
outgoing powers (non-disturbing loads) plus any disturbing loads at
PoC. The main text does not state the extent of the considered
area, but the appendices indicate at least 2-3 nodes away from the
PoC need to be considered.
2- Calculate influence coefficients from the neighbouring
substations to the PoC. These coefficients represent harmonic
distortion achieved at the PoC when 1pu harmonic current is
injected at the remote substation.
3- Multiply each influence coefficient with the associated available
power from neighbouring substation and summate them to give a
regional total power. A ratio is then obtained using the available
power at the PoC and the regional power. Use summation law, the
ratio and the planning level to calculate a globally level available at
the PoC.
4- The customer is then allocated a portion from this global
available limit based on his supply rating and the available power
at the PoC.
The above process establishes a global level that could be
available for a given substation ensuring that planning levels are
not exceeded in the neighbouring substations. The approach then
allocates rights based on the rating of the distorting loads.
Stage 3 process of the ER G5/4 is the closest to IEC Stage 2
approach. Both require the consideration of neighbouring
substations. However, a significant difference exists between
the two because ER G5/4 Stage 3 explicitly requires
measurement of existing background distortions on the site and
to utilise this information in establishing harmonic levels. IEC is
not explicit in its treatment of background distortion.
IEC states that at least 2-3 nodes away from the PoC should be
considered, whereas ER G5/4 states that neighbouring nodes
should extend to LV networks.
The allocation of harmonic emissions in ER G5/4 is not based
on the proportion of the distorting load but rather it gives all the
available headroom to the first customer (“1st come 1st served”
principle).
ER G5/4 requires that regardless of the level of distortion
present on the network before the connection, the customer
who is requesting a connection for the distorting equipment
must pay for all the expenditure to meet the harmonic
requirements.
Harmonics Workshop - EirGrid - © Zia Emin – 21 November 2013
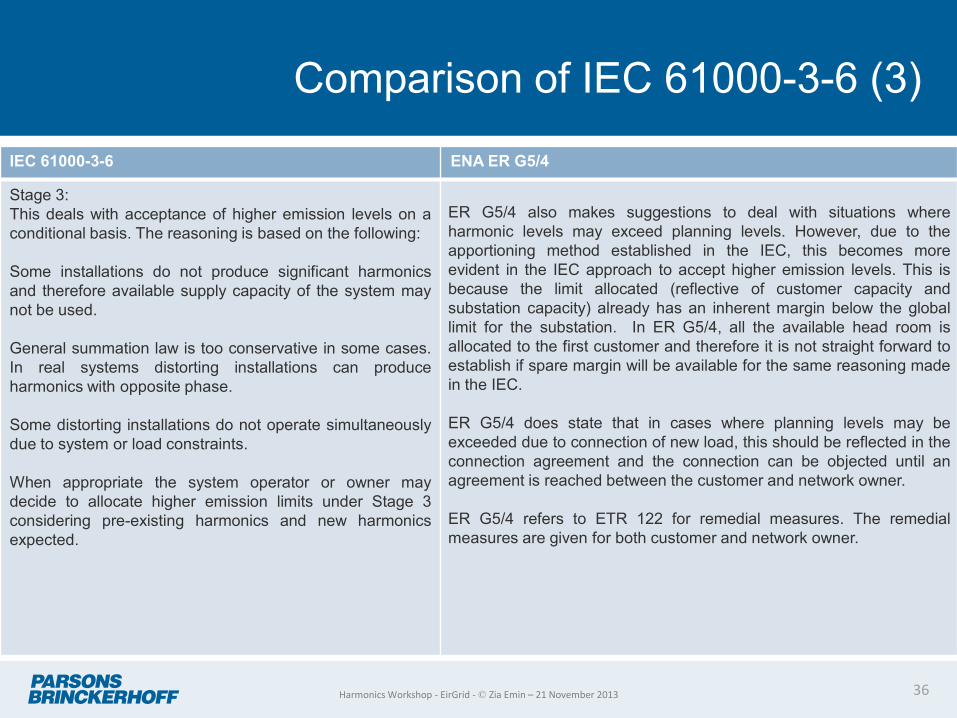
Comparison of IEC 61000-3-6 (3)
36
IEC 61000-3-6 ENA ER G5/4
Stage 3:
This deals with acceptance of higher emission levels on a
conditional basis. The reasoning is based on the following:
Some installations do not produce significant harmonics
and therefore available supply capacity of the system may
not be used.
General summation law is too conservative in some cases.
In real systems distorting installations can produce
harmonics with opposite phase.
Some distorting installations do not operate simultaneously
due to system or load constraints.
When appropriate the system operator or owner may
decide to allocate higher emission limits under Stage 3
considering pre-existing harmonics and new harmonics
expected.
ER G5/4 also makes suggestions to deal with situations where
harmonic levels may exceed planning levels. However, due to the
apportioning method established in the IEC, this becomes more
evident in the IEC approach to accept higher emission levels. This is
because the limit allocated (reflective of customer capacity and
substation capacity) already has an inherent margin below the global
limit for the substation. In ER G5/4, all the available head room is
allocated to the first customer and therefore it is not straight forward to
establish if spare margin will be available for the same reasoning made
in the IEC.
ER G5/4 does state that in cases where planning levels may be
exceeded due to connection of new load, this should be reflected in the
connection agreement and the connection can be objected until an
agreement is reached between the customer and network owner.
ER G5/4 refers to ETR 122 for remedial measures. The remedial
measures are given for both customer and network owner.
Harmonics Workshop - EirGrid - © Zia Emin – 21 November 2013
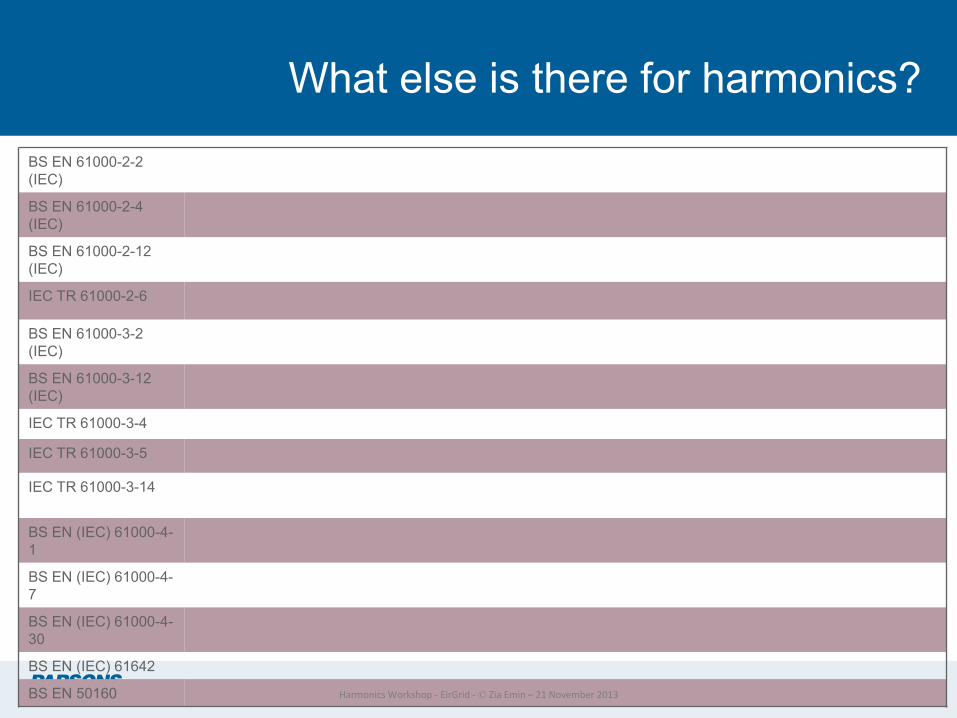
What else is there for harmonics?
37
BS EN 61000-2-2
(IEC)
BS EN 61000-2-4
(IEC)
BS EN 61000-2-12
(IEC)
IEC TR 61000-2-6
BS EN 61000-3-2
(IEC)
BS EN 61000-3-12
(IEC)
IEC TR 61000-3-4
IEC TR 61000-3-5
IEC TR 61000-3-14
BS EN (IEC) 61000-4-
1
BS EN (IEC) 61000-4-
7
BS EN (IEC) 61000-4-
30
BS EN (IEC) 61642
BS EN 50160 Harmonics Workshop - EirGrid - © Zia Emin – 21 November 2013
38
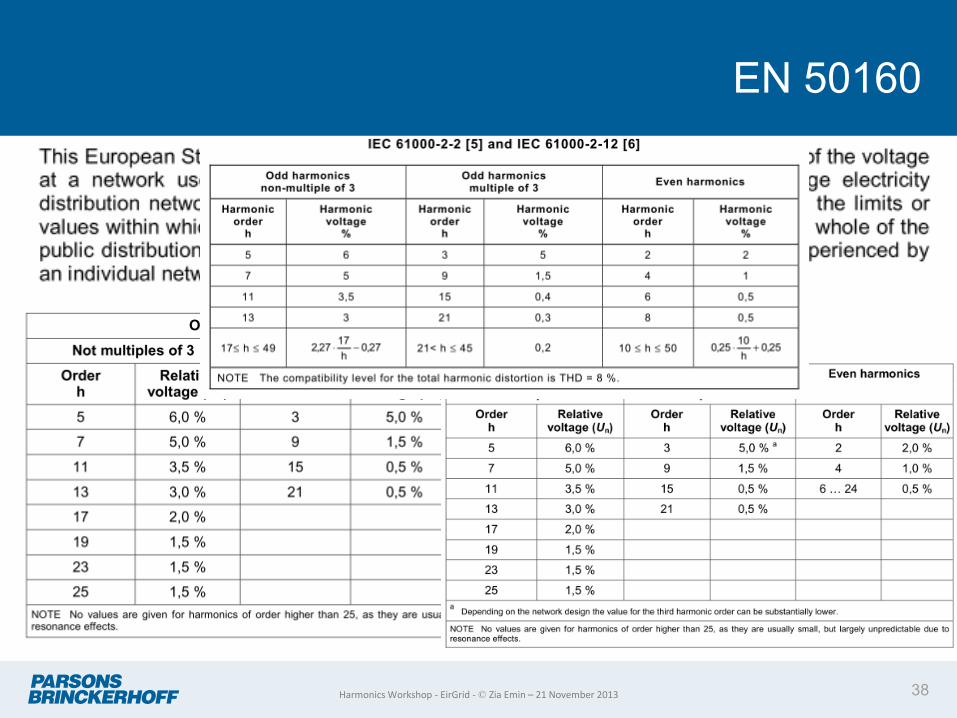
EN 50160
Harmonics Workshop - EirGrid - © Zia Emin – 21 November 2013

39
Which one applies to UK?
Grid Code CC 6.1.5: • The Electromagnetic Compatibility Levels for harmonic distortion on the Onshore Transmission
System from all sources under both Planned Outage and fault outage conditions, (unless abnormal conditions prevail) shall comply with the levels shown in the tables of Appendix A of Engineering Recommendation G5/4-1. The Electromagnetic Compatibility Levels for harmonic distortion on an Offshore Transmission System will be defined in relevant Bilateral Agreements.
• Engineering Recommendation G5/4-1 contains planning criteria which NGET will apply to the connection of non-linear Load to the National Electricity Transmission System, which may result in harmonic emission limits being specified for these Loads in the relevant Bilateral Agreement. The application of the planning criteria will take into account the position of existing and prospective Users’ Plant and Apparatus in relation to harmonic emissions. Users must ensure that connection of distorting loads to their User Systems do not cause any harmonic emission limits specified in the Bilateral Agreement, or where no such limits are specified, the relevant planning levels specified in Engineering Recommendation G5/4 to be exceeded.
Distribution Code DPC4.2.3 .2(b) • The harmonic content of a load shall comply with the limits set out in Distribution Glossary and
Definitions Annex 1, Item 1 Engineering Recommendation G5/4-1, “Planning levels for harmonic voltage distortion and the connection of non-linear equipment to transmission and distribution systems in the United Kingdom.”
Harmonics Workshop - EirGrid - © Zia Emin – 21 November 2013
40
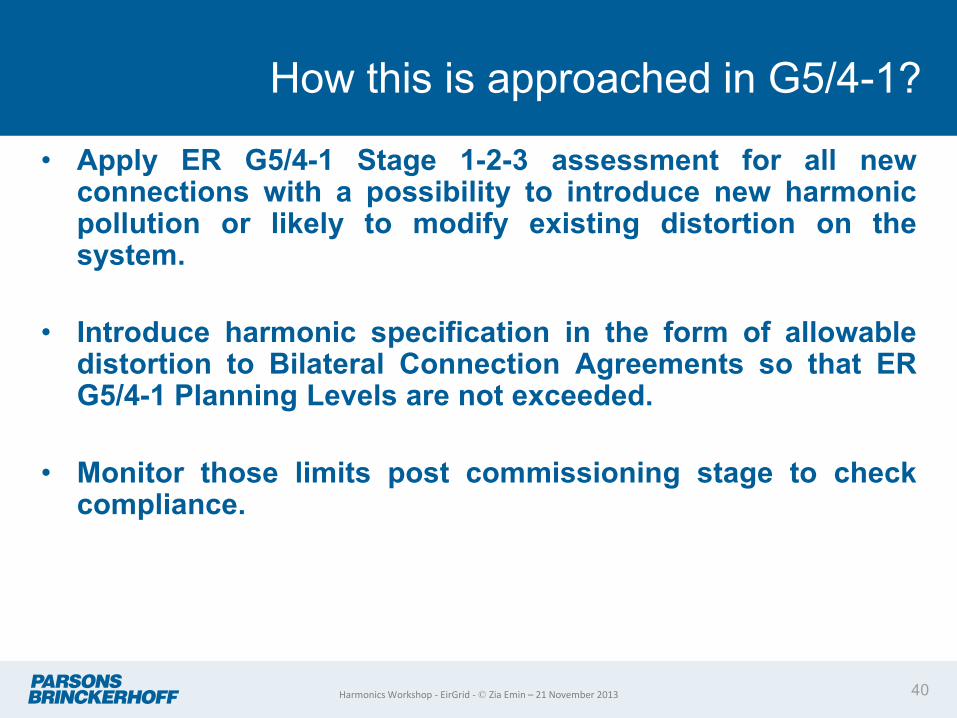
How this is approached in G5/4-1?
• Apply ER G5/4-1 Stage 1-2-3 assessment for all new connections with a possibility to introduce new harmonic pollution or likely to modify existing distortion on the system.
• Introduce harmonic specification in the form of allowable distortion to Bilateral Connection Agreements so that ER G5/4-1 Planning Levels are not exceeded.
• Monitor those limits post commissioning stage to check compliance.
Harmonics Workshop - EirGrid - © Zia Emin – 21 November 2013
41
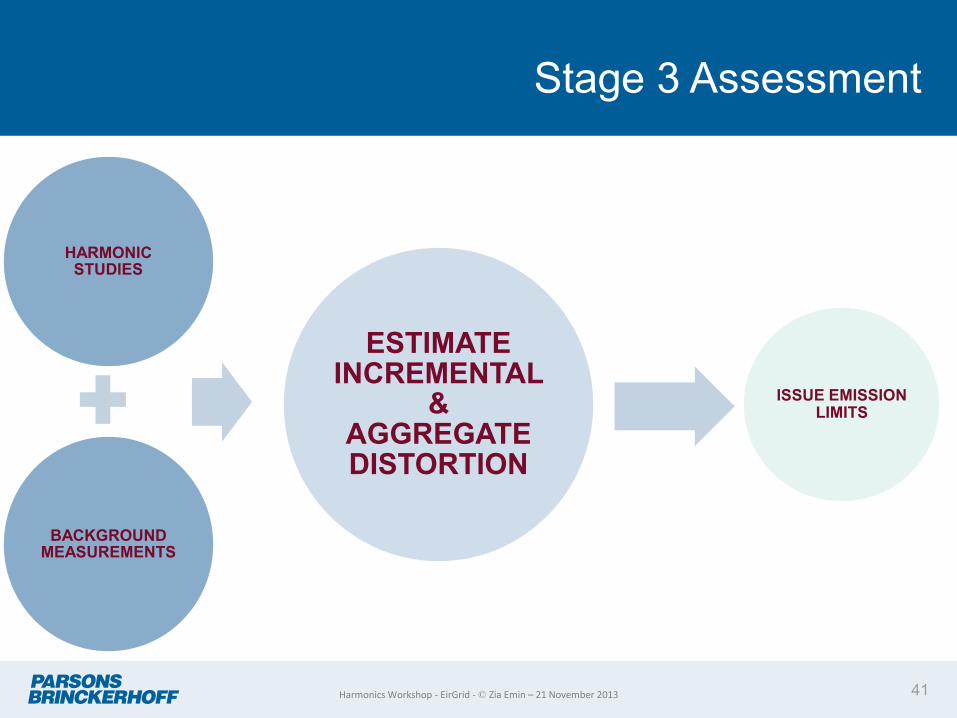
Stage 3 Assessment
HARMONIC STUDIES
BACKGROUND MEASUREMENTS
ESTIMATE INCREMENTAL
& AGGREGATE DISTORTION
ISSUE EMISSION LIMITS
Harmonics Workshop - EirGrid - © Zia Emin – 21 November 2013
42
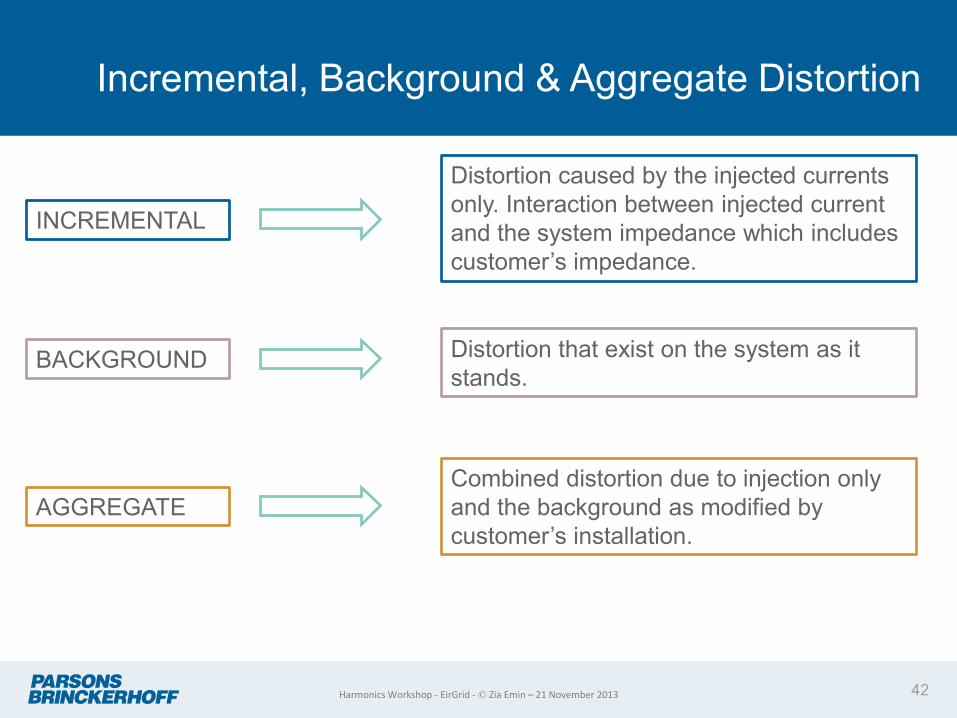
Incremental, Background & Aggregate Distortion
INCREMENTAL
AGGREGATE
BACKGROUND
Distortion caused by the injected currents
only. Interaction between injected current
and the system impedance which includes
customer’s impedance.
Distortion that exist on the system as it
stands.
Combined distortion due to injection only
and the background as modified by
customer’s installation.
Harmonics Workshop - EirGrid - © Zia Emin – 21 November 2013
43
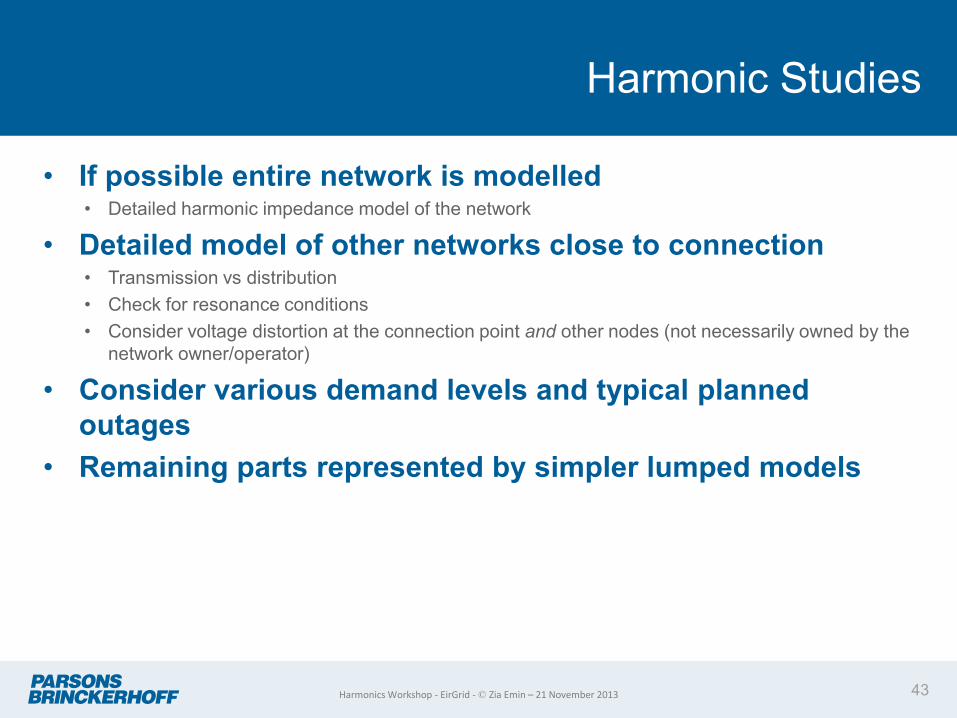
Harmonic Studies
• If possible entire network is modelled • Detailed harmonic impedance model of the network
• Detailed model of other networks close to connection • Transmission vs distribution
• Check for resonance conditions
• Consider voltage distortion at the connection point and other nodes (not necessarily owned by the
network owner/operator)
• Consider various demand levels and typical planned
outages
• Remaining parts represented by simpler lumped models
Harmonics Workshop - EirGrid - © Zia Emin – 21 November 2013
44
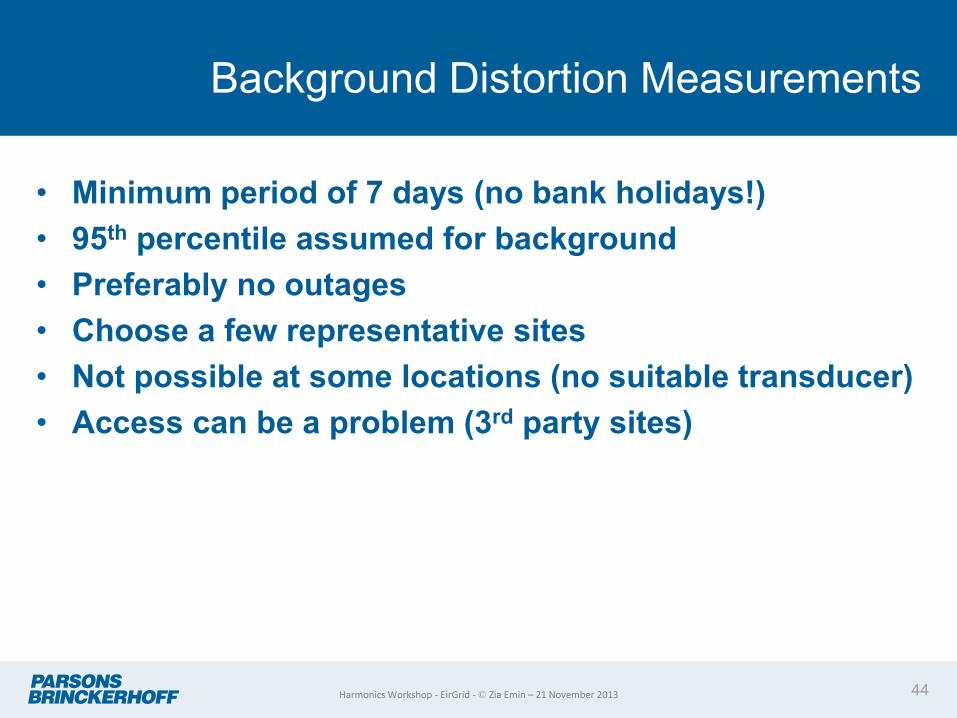
Background Distortion Measurements
• Minimum period of 7 days (no bank holidays!)
• 95th percentile assumed for background
• Preferably no outages
• Choose a few representative sites
• Not possible at some locations (no suitable transducer)
• Access can be a problem (3rd party sites)
Harmonics Workshop - EirGrid - © Zia Emin – 21 November 2013
45
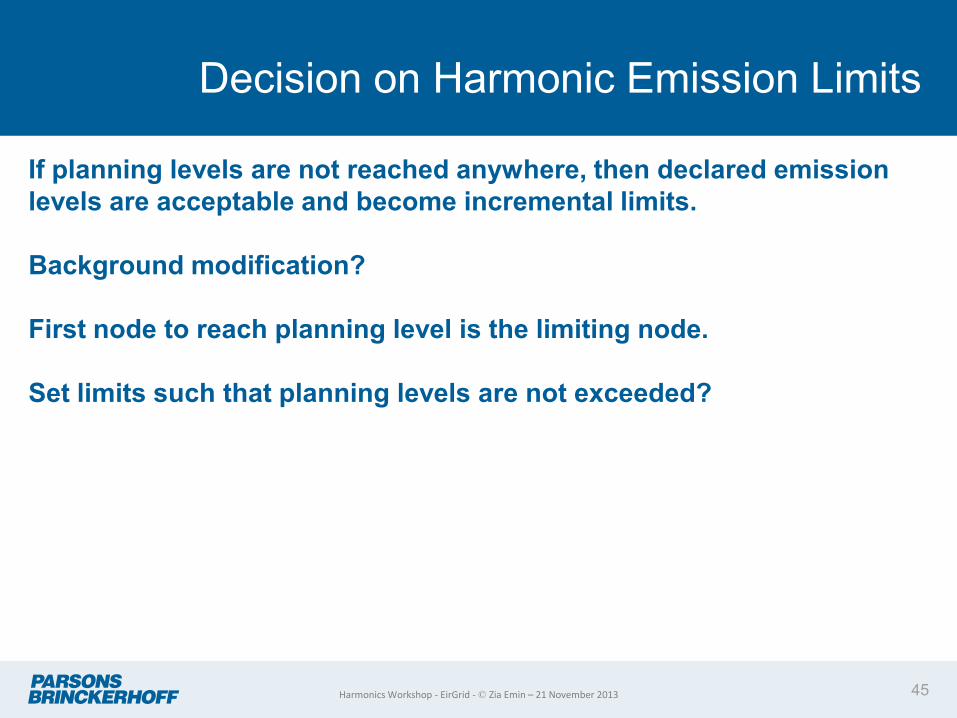
Decision on Harmonic Emission Limits
If planning levels are not reached anywhere, then declared emission
levels are acceptable and become incremental limits.
Background modification?
First node to reach planning level is the limiting node.
Set limits such that planning levels are not exceeded?
Harmonics Workshop - EirGrid - © Zia Emin – 21 November 2013
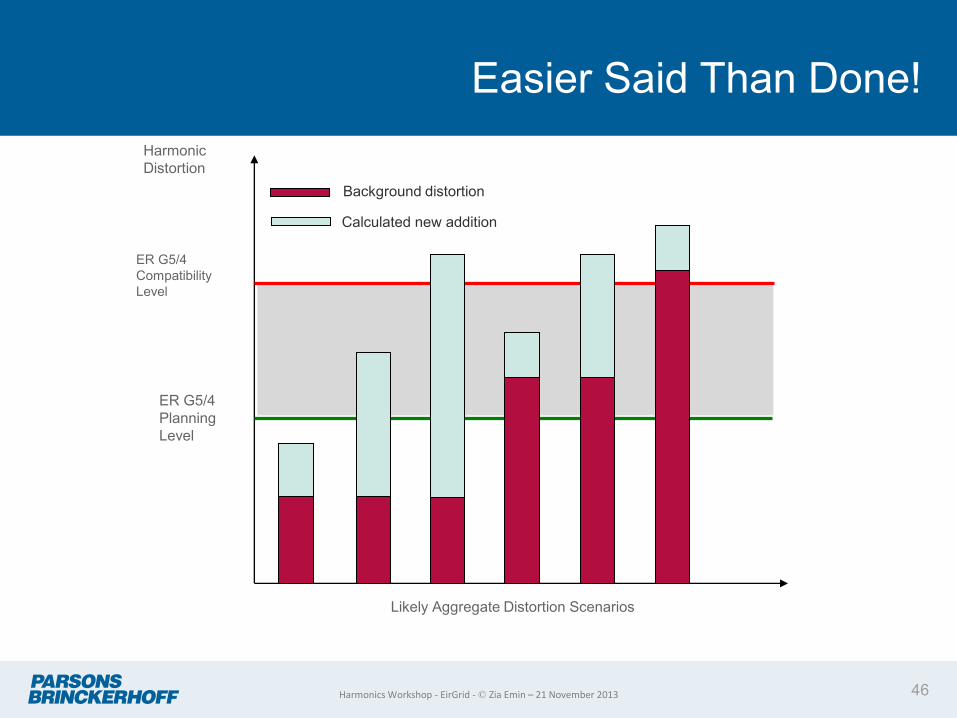
Easier Said Than Done!
46
Harmonic
Distortion
ER G5/4
Planning
Level
ER G5/4
Compatibility
Level
Likely Aggregate Distortion Scenarios
Background distortion
Calculated new addition
Harmonics Workshop - EirGrid - © Zia Emin – 21 November 2013
47
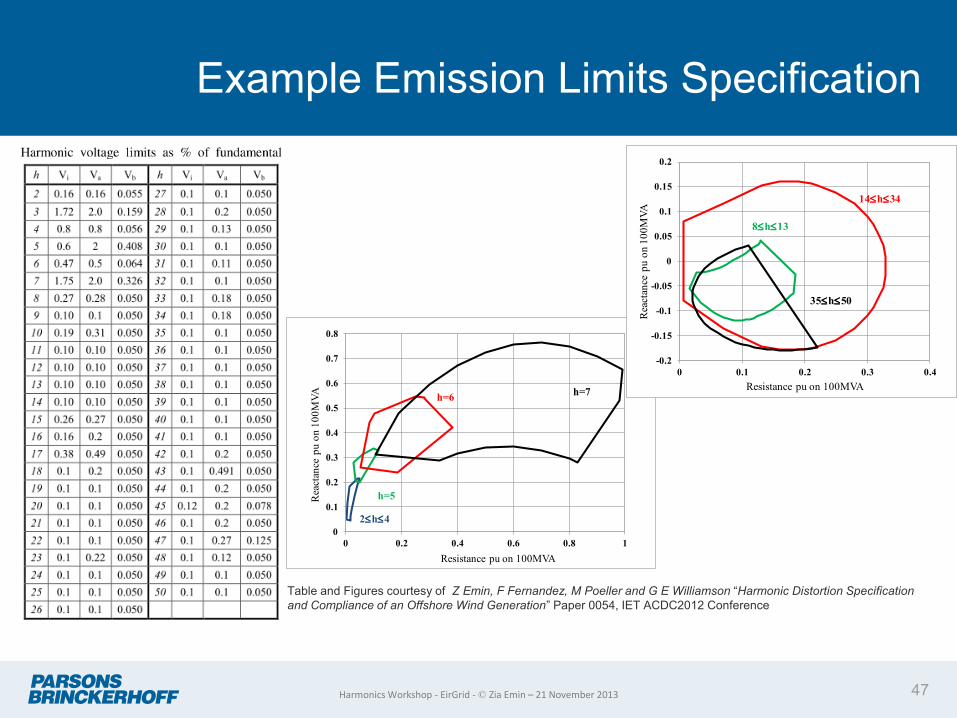
Example Emission Limits Specification
0
0.1
0.2
0.3
0.4
0.5
0.6
0.7
0.8
0 0.2 0.4 0.6 0.8 1
Rea
ctan
ce p
u o
n 1
00
MV
A
Resistance pu on 100MVA
h=7h=6
h=5
2h4
-0.2
-0.15
-0.1
-0.05
0
0.05
0.1
0.15
0.2
0 0.1 0.2 0.3 0.4
Rea
ctan
ce p
u o
n 1
00
MV
A
Resistance pu on 100MVA
14h34
35h50
8h13
Table and Figures courtesy of Z Emin, F Fernandez, M Poeller and G E Williamson “Harmonic Distortion Specification
and Compliance of an Offshore Wind Generation” Paper 0054, IET ACDC2012 Conference
Harmonics Workshop - EirGrid - © Zia Emin – 21 November 2013
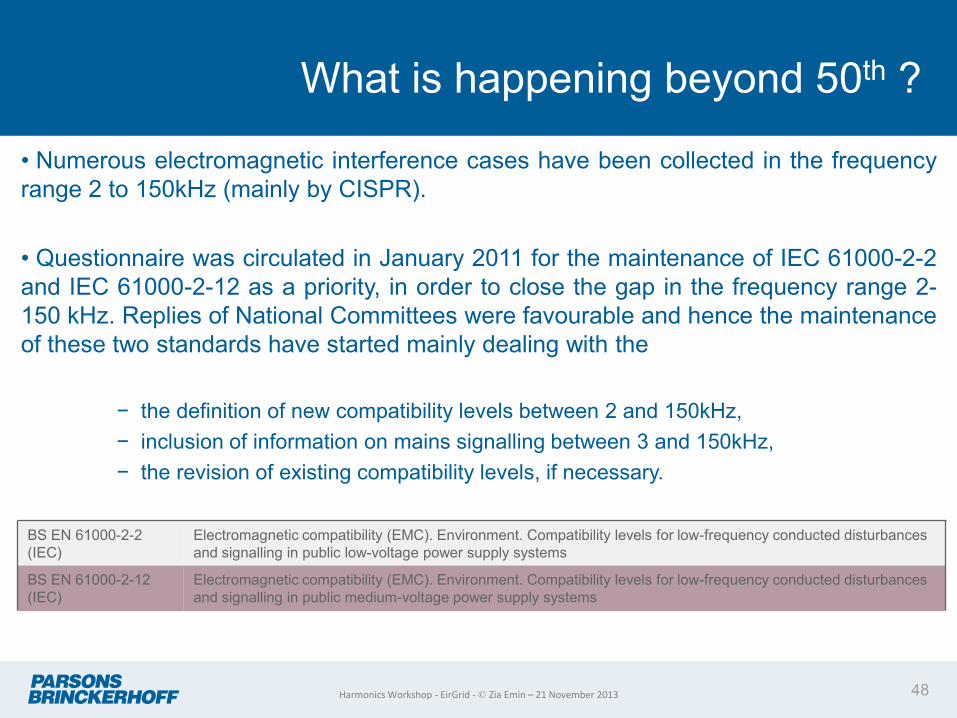
What is happening beyond 50th ?
• Numerous electromagnetic interference cases have been collected in the frequency
range 2 to 150kHz (mainly by CISPR).
• Questionnaire was circulated in January 2011 for the maintenance of IEC 61000-2-2
and IEC 61000-2-12 as a priority, in order to close the gap in the frequency range 2-
150 kHz. Replies of National Committees were favourable and hence the maintenance
of these two standards have started mainly dealing with the
− the definition of new compatibility levels between 2 and 150kHz,
− inclusion of information on mains signalling between 3 and 150kHz,
− the revision of existing compatibility levels, if necessary.
BS EN 61000-2-2
(IEC)
Electromagnetic compatibility (EMC). Environment. Compatibility levels for low-frequency conducted disturbances
and signalling in public low-voltage power supply systems
BS EN 61000-2-12
(IEC)
Electromagnetic compatibility (EMC). Environment. Compatibility levels for low-frequency conducted disturbances
and signalling in public medium-voltage power supply systems
48 Harmonics Workshop - EirGrid - © Zia Emin – 21 November 2013
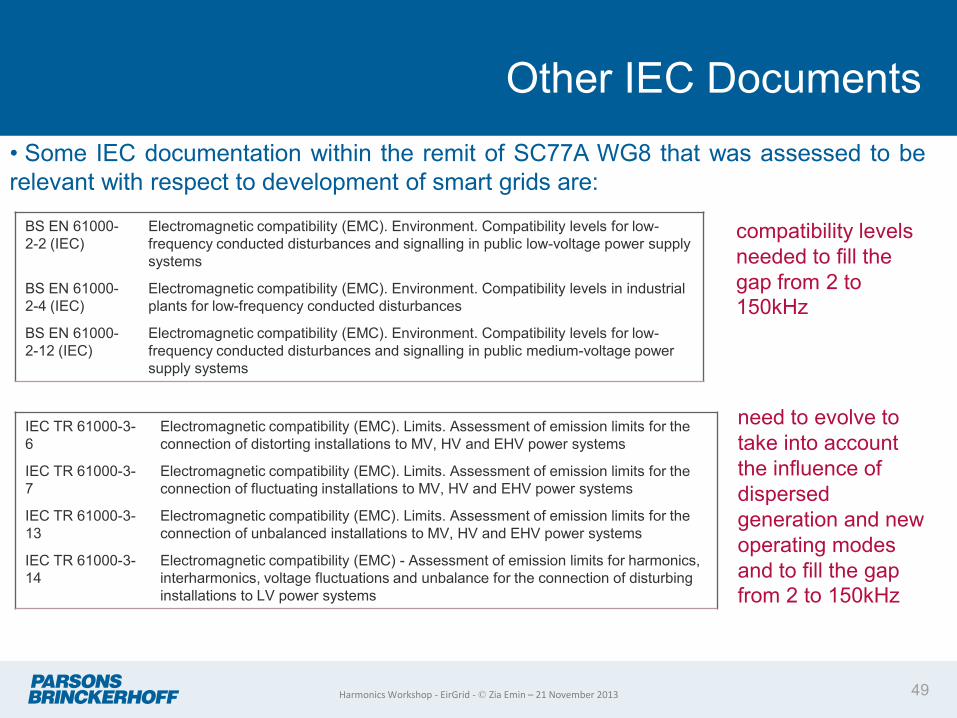
Other IEC Documents
• Some IEC documentation within the remit of SC77A WG8 that was assessed to be
relevant with respect to development of smart grids are:
BS EN 61000-
2-2 (IEC)
Electromagnetic compatibility (EMC). Environment. Compatibility levels for low-
frequency conducted disturbances and signalling in public low-voltage power supply
systems
BS EN 61000-
2-4 (IEC)
Electromagnetic compatibility (EMC). Environment. Compatibility levels in industrial
plants for low-frequency conducted disturbances
BS EN 61000-
2-12 (IEC)
Electromagnetic compatibility (EMC). Environment. Compatibility levels for low-
frequency conducted disturbances and signalling in public medium-voltage power
supply systems
IEC TR 61000-3-
6
Electromagnetic compatibility (EMC). Limits. Assessment of emission limits for the
connection of distorting installations to MV, HV and EHV power systems
IEC TR 61000-3-
7
Electromagnetic compatibility (EMC). Limits. Assessment of emission limits for the
connection of fluctuating installations to MV, HV and EHV power systems
IEC TR 61000-3-
13
Electromagnetic compatibility (EMC). Limits. Assessment of emission limits for the
connection of unbalanced installations to MV, HV and EHV power systems
IEC TR 61000-3-
14
Electromagnetic compatibility (EMC) - Assessment of emission limits for harmonics,
interharmonics, voltage fluctuations and unbalance for the connection of disturbing
installations to LV power systems
compatibility levels
needed to fill the
gap from 2 to
150kHz
need to evolve to
take into account
the influence of
dispersed
generation and new
operating modes
and to fill the gap
from 2 to 150kHz
49 Harmonics Workshop - EirGrid - © Zia Emin – 21 November 2013
TSO Policy & Proposed Methodology for limit calculation
Mark Norton
Technology and Innovation
Agenda
High level Facts
Policy breakdown – Planning levels
Policy Breakdown – Planning Margin
Policy breakdown – Allocated distortion limits
Policy Breakdown – Background levels
Policy Breakdown – Method of calculating limits
Summary
Agenda
High level Facts
Policy breakdown – Planning Levels
Policy Breakdown – Planning Margin
Policy breakdown – Allocated distortion limits
Policy Breakdown – Background levels
Policy Breakdown – Method of calculating limits
Summary
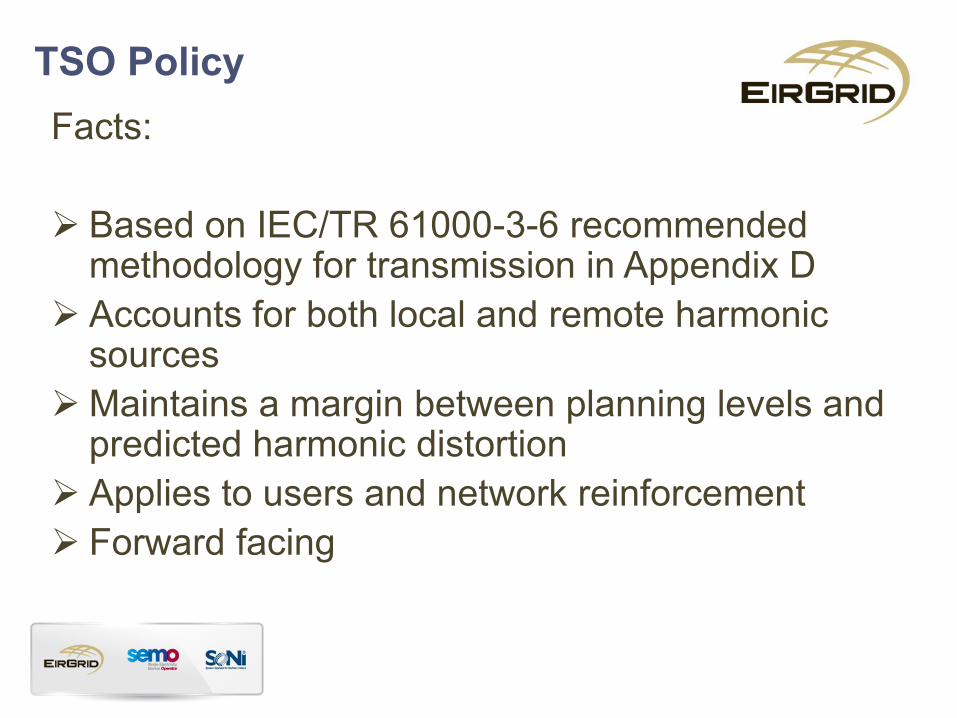
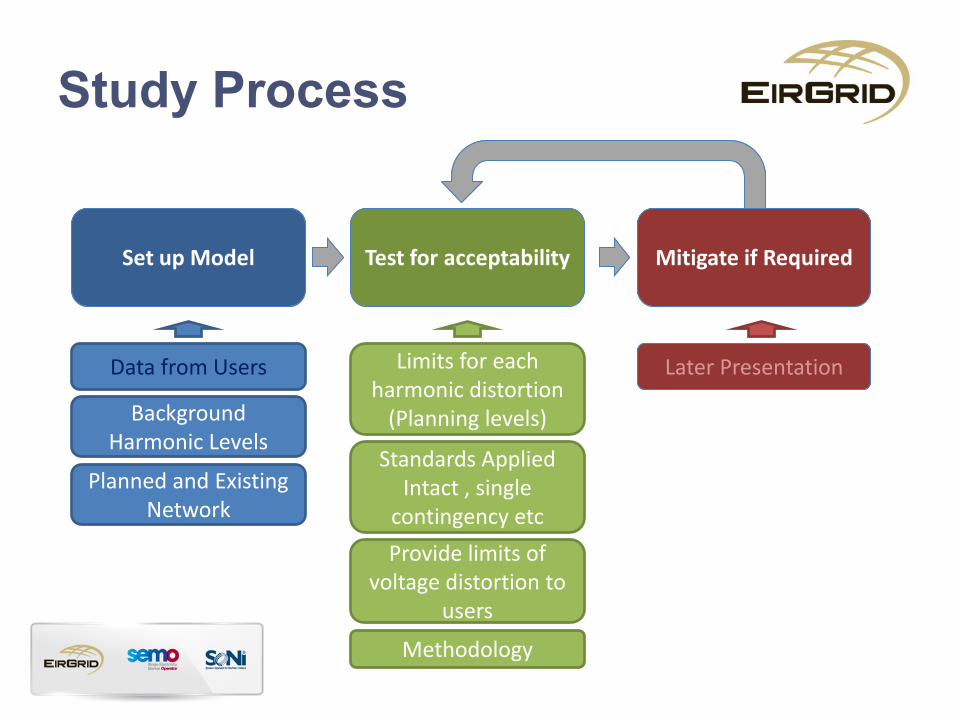
TSO Policy
Facts:
Based on IEC/TR 61000-3-6 recommended methodology for transmission in Appendix D
Accounts for both local and remote harmonic sources
Maintains a margin between planning levels and predicted harmonic distortion
Applies to users and network reinforcement
Forward facing
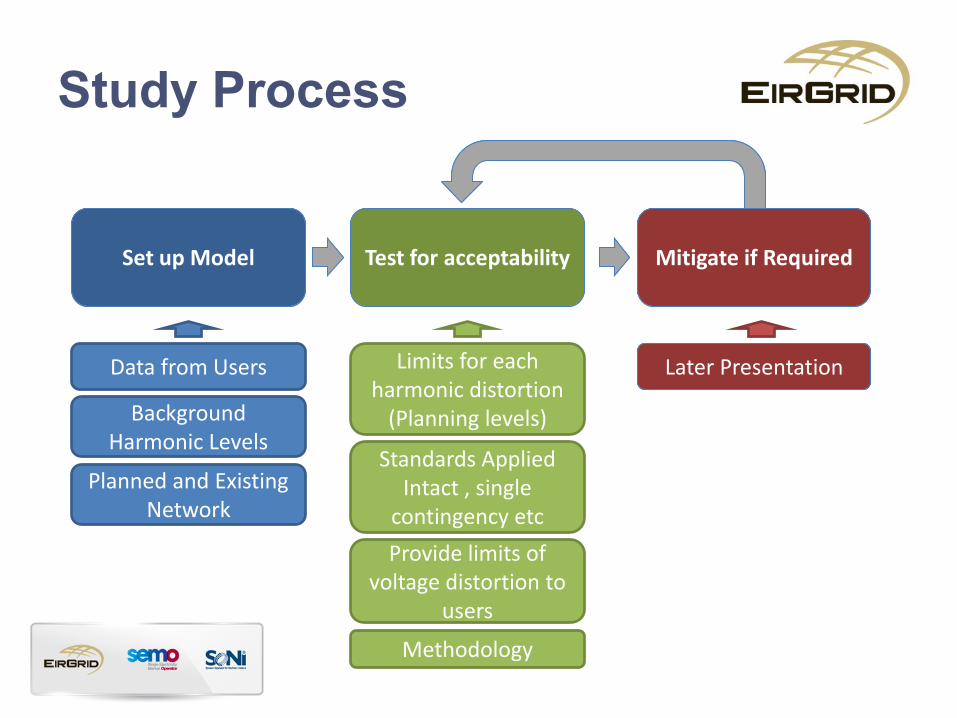
Study Process
Set up Model Test for acceptability Test for acceptability Mitigate if Required Mitigate if Required
Data from Users
Background Harmonic Levels
Planned and Existing Network
Limits for each harmonic distortion
(Planning levels)
Standards Applied Intact , single
contingency etc
Provide limits of voltage distortion to
users
Later Presentation
Methodology
Agenda
High level Facts
Policy breakdown – Planning levels
Policy Breakdown – Planning Margin
Policy breakdown – Allocated distortion limits
Policy Breakdown – Method of calculating limits
Policy Breakdown – Background levels
Summary

TSO Planning levels
Policy:
IEC/TR61000-3-6 planning levels in Table 2 will be maintained
Planning levels apply to intact and single contingency cases (N-1)
Engineering Recommendation G5/4 used by NIE
Rationale:
IEC International best practice
Consistent with TPC other power quality requirements
Duration and predictability of single contingency
N-1 recommended in the IEC
Agenda
High level Facts
Policy breakdown – Planning levels
Policy Breakdown – Planning Margin
Policy breakdown – Allocated distortion limits
Policy Breakdown – Background levels
Policy Breakdown – Method of calculating limits
Summary
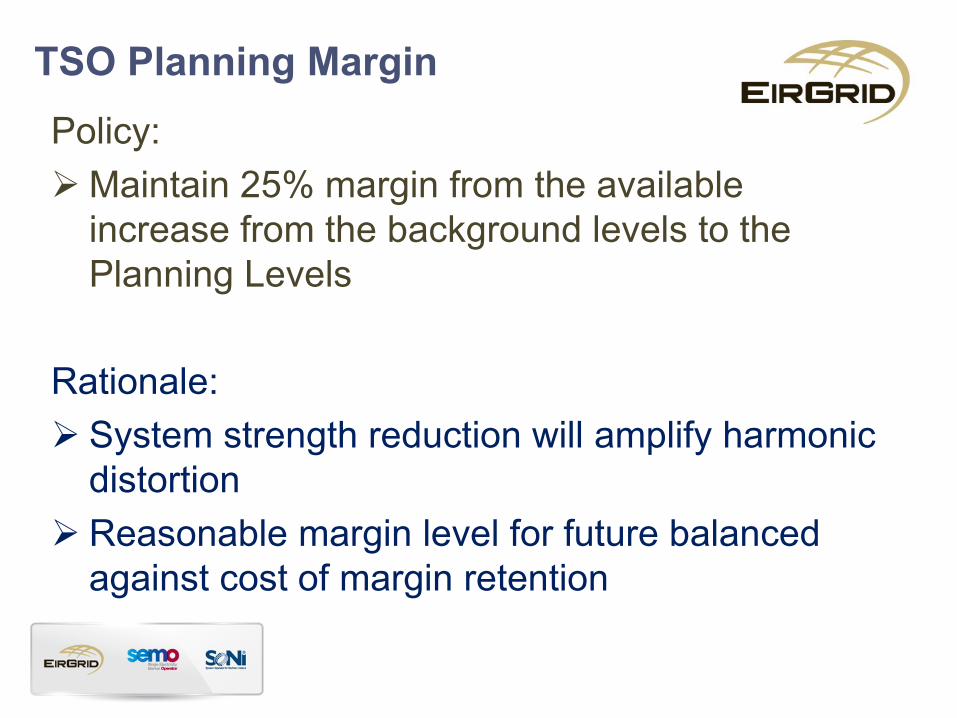
TSO Planning Margin
Policy:
Maintain 25% margin from the available
increase from the background levels to the
Planning Levels
Rationale:
System strength reduction will amplify harmonic
distortion
Reasonable margin level for future balanced
against cost of margin retention
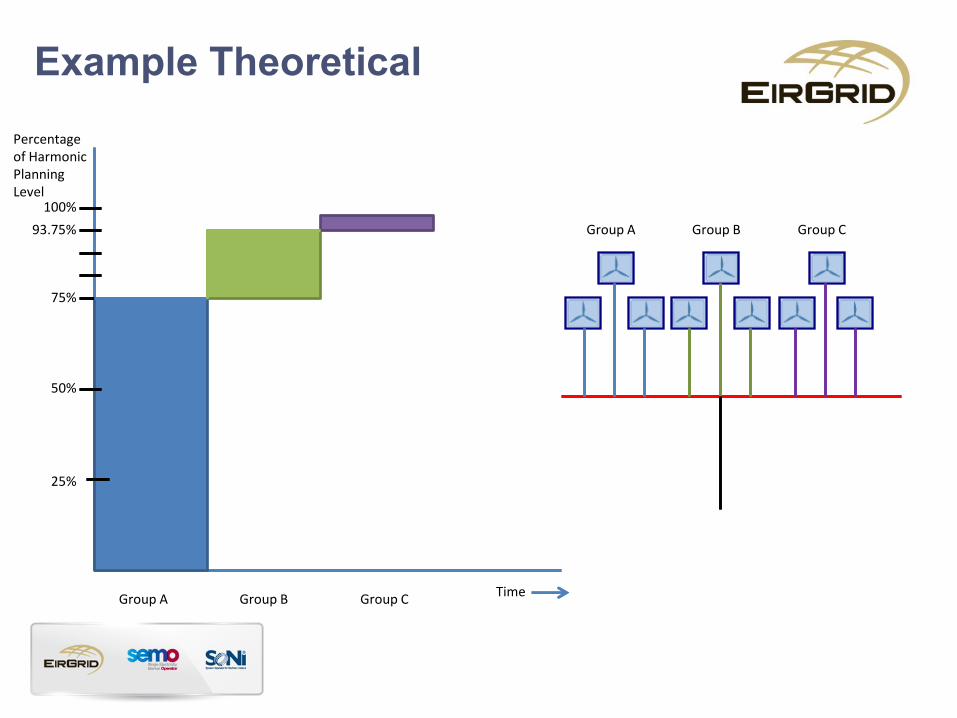
Example Theoretical
Group A Group B Group C
100%
75%
50%
25%
Group A Group B Group C Time
93.75%
Percentage of Harmonic Planning Level
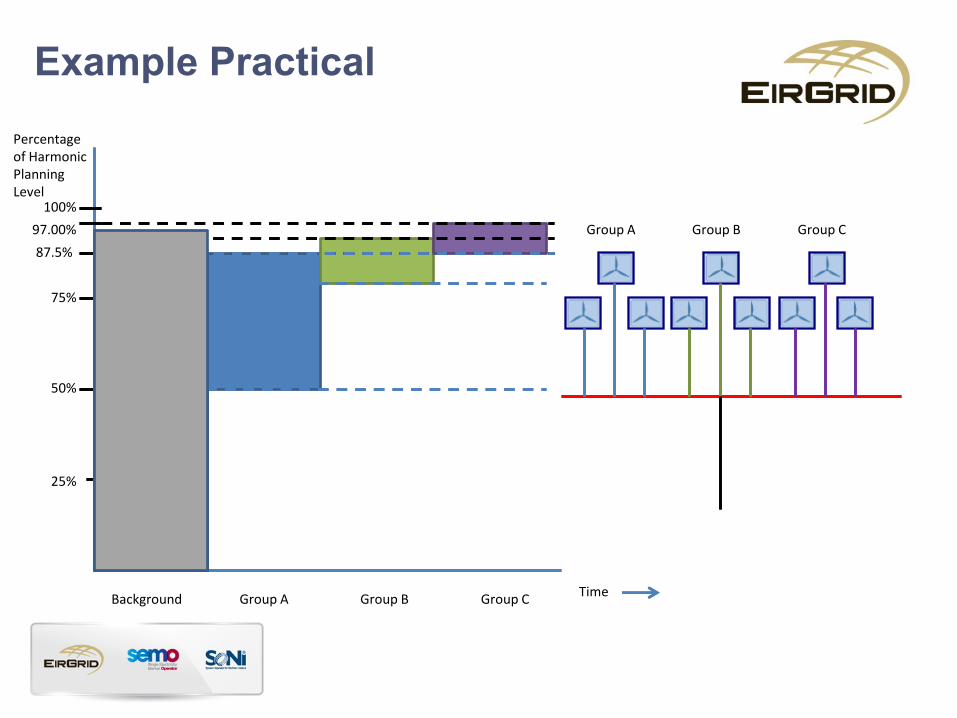
Example Practical
Group A Group B Group C
100%
75%
50%
25%
Group A Group B Group C Time
97.00%
Percentage of Harmonic Planning Level
Background
87.5%
Agenda
High level Facts
Policy breakdown – Planning levels
Policy Breakdown – Planning Margin
Policy breakdown – Allocated distortion limits
Policy Breakdown – Background levels
Policy Breakdown – Method of calculating limits
Summary
TSO Allocated Distortion Limits
Policy:
Limits referenced to connection point
MW pro-rated to connecting parties at each node
Background readings incorporated (next section)
Calculated for existing and planned network
Calculated for intact and single contingency
Rationale:
IEC International best practice
N-1 and future proofed networks recommended in the IEC
Connection point is current contractual point and either side is within User and TSO control
Connection point will be reflective of future configuration
MW pro-rata is a fair average portioning of available distortion capacity (User defines their own internal equipment)
Agenda
High level Facts
Policy breakdown – Planning levels
Policy Breakdown – Planning Margin
Policy breakdown – Allocated distortion limits
Policy Breakdown – Background levels
Policy Breakdown – Method of calculating limits
Summary

TSO Background levels
Policy:
Utilise background readings to tune model
Use approach in IEC 61000-4-30 and associated 61000-4-7
10 minute readings over 1 Week minimum
Readings from each busbar user or reinforcement is connecting to
New nodes reading taken electrically as close as possible
Rationale:
IEC International best practice
Maximum single point harmonic level to onerous
Annual time period impact on harmonic levels
1 week recommended as minimum in IEC
Actual rather than modelled harmonics in model
Best method of tuning for new nodes
Agenda
High level Facts
Policy breakdown – Planning levels
Policy Breakdown – Planning Margin
Policy breakdown – Allocated distortion limits
Policy Breakdown – Background levels
Policy Breakdown – Method of calculating limits
Summary
TSO Method
Policy:
Calculation method based on IEC Appendix D method
Suitable for Transmission meshed systems
Utilises standard method tools to ensure non-discriminatory process
Rationale:
IEC International best practice
Accounts for other generation impact on buses in area
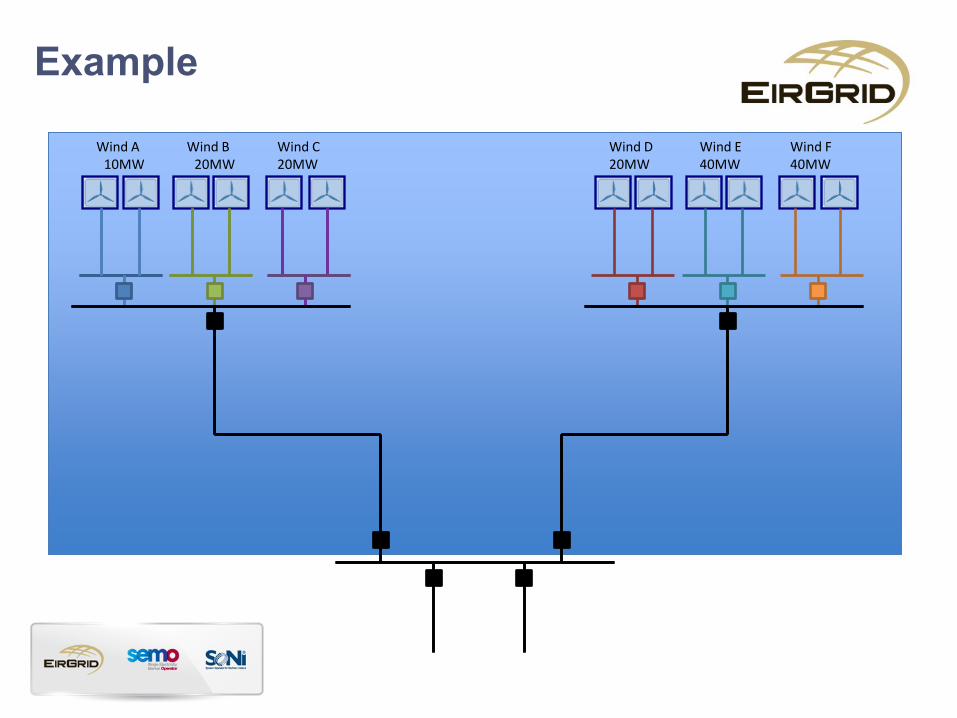
Example
Wind A 10MW
Wind B 20MW
Wind C 20MW
Wind D 20MW
Wind E 40MW
Wind F 40MW
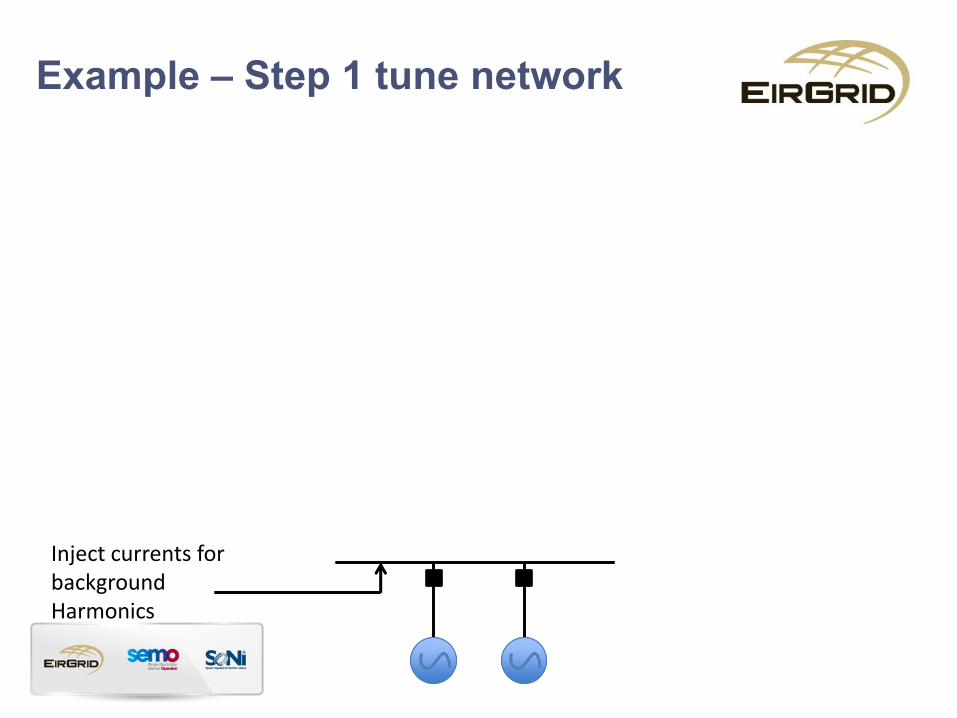
Example – Step 1 tune network
Inject currents for background Harmonics
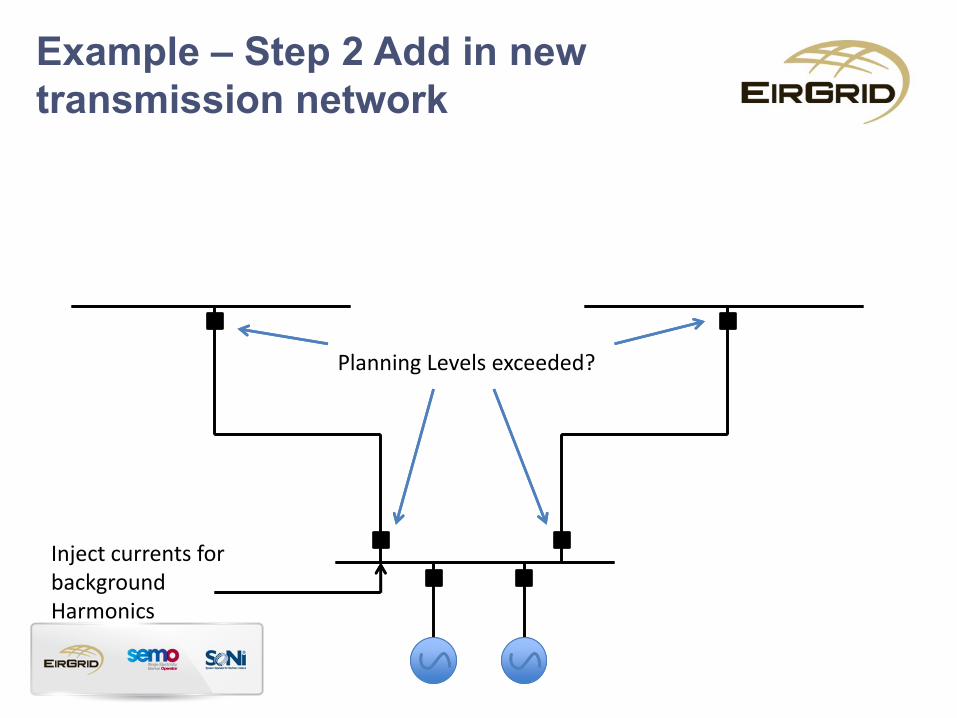
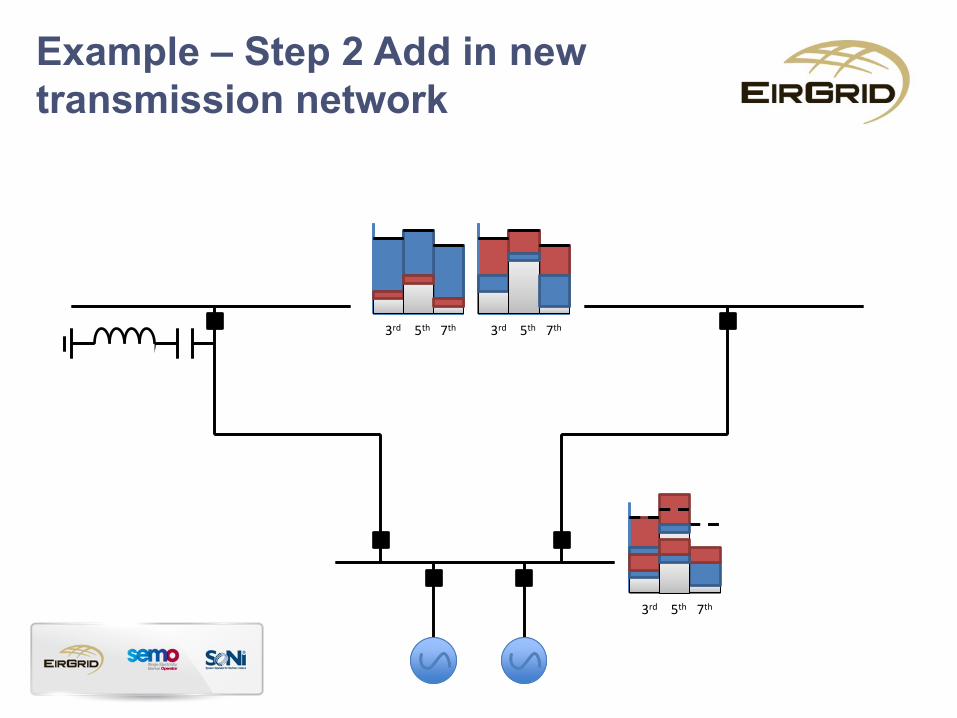
Example – Step 2 Add in new
transmission network
Inject currents for background Harmonics
Planning Levels exceeded?
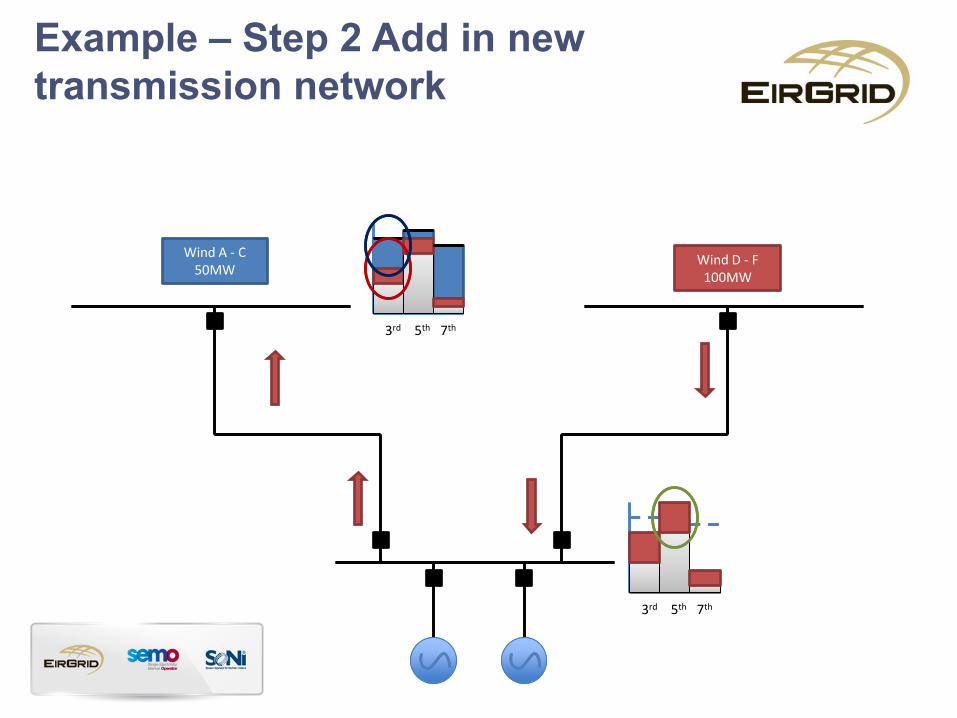
Example – Step 2 Add in new
transmission network
3rd 5th 7th
3rd 5th 7th
Wind A - C 50MW
Wind D - F 100MW

Example – Step 2 Add in new
transmission network
3rd 5th 7th
3rd 5th 7th
Wind A - C 50MW
Wind D - F 100MW
Example – Step 2 Add in new
transmission network
3rd 5th 7th 3rd 5th 7th
3rd 5th 7th

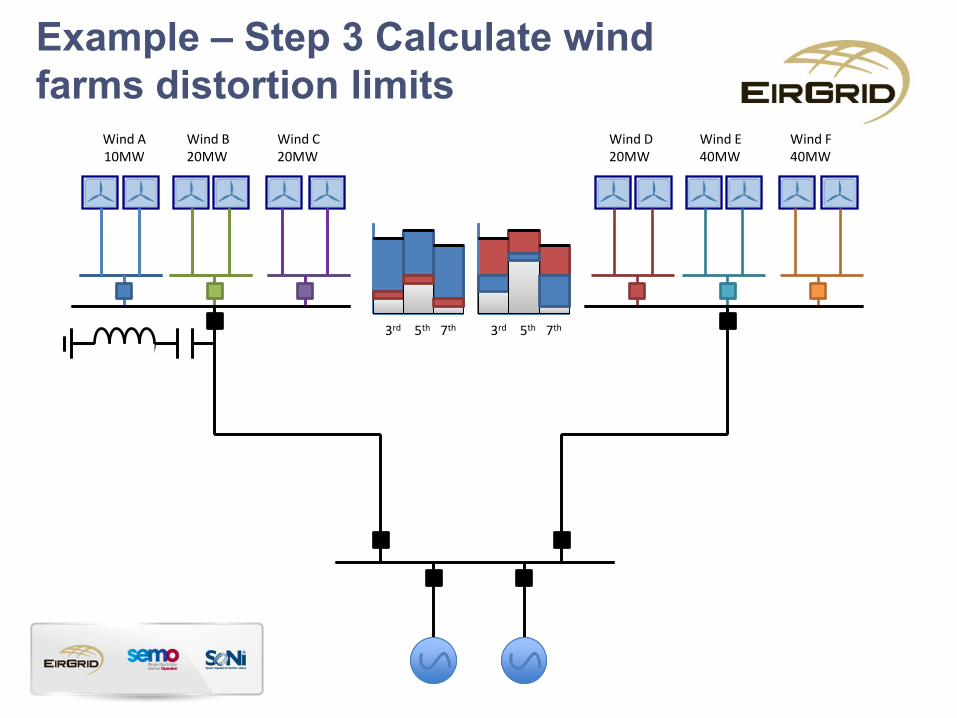
Example – Step 3 Calculate wind
farms distortion limits Wind A 10MW
Wind B 20MW
Wind C 20MW
Wind D 20MW
Wind E 40MW
Wind F 40MW
3rd 5th 7th 3rd 5th 7th
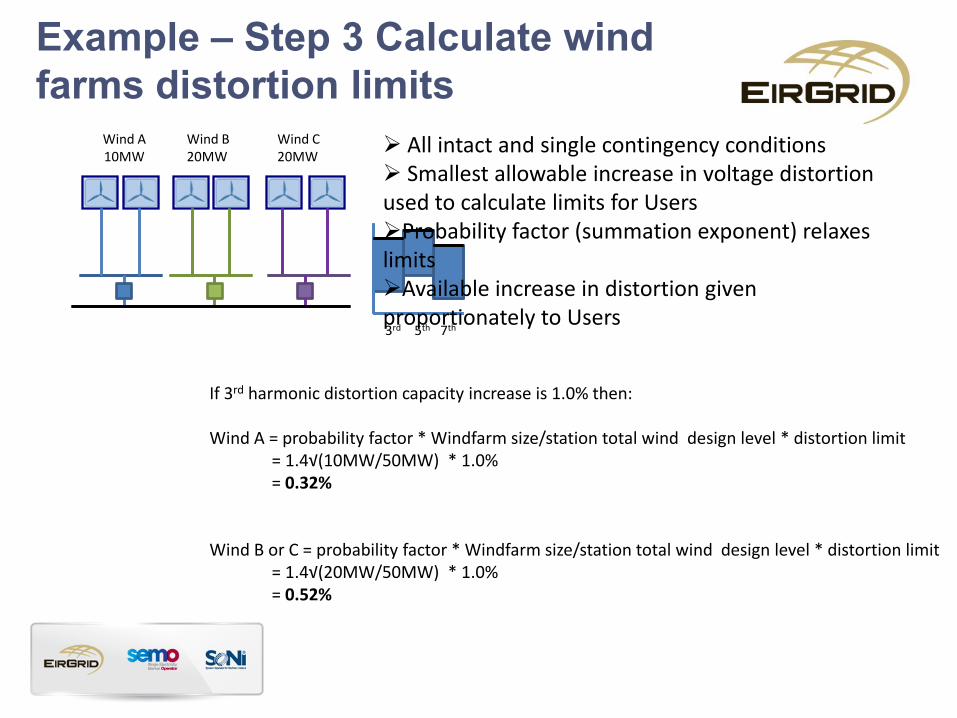
Example – Step 3 Calculate wind
farms distortion limits Wind A 10MW
Wind B 20MW
Wind C 20MW
3rd 5th 7th
All intact and single contingency conditions Smallest allowable increase in voltage distortion used to calculate limits for Users Probability factor (summation exponent) relaxes limits Available increase in distortion given proportionately to Users
If 3rd harmonic distortion capacity increase is 1.0% then: Wind A = probability factor * Windfarm size/station total wind design level * distortion limit = 1.4√(10MW/50MW) * 1.0% = 0.32% Wind B or C = probability factor * Windfarm size/station total wind design level * distortion limit = 1.4√(20MW/50MW) * 1.0% = 0.52%
Example – Step 3 Calculate wind
farms distortion limits Wind A 10MW
Wind B 20MW
Wind C 20MW
Wind D 20MW
Wind E 40MW
Wind F 40MW
3rd 5th 7th 3rd 5th 7th

Example – Step 3 Calculate wind
farms distortion limits Wind D 20MW
Wind E 40MW
Wind F 40MW
3rd 5th 7th
If 3rd harmonic distortion capacity increase is 0.5% then: Wind D = probability factor * Windfarm size/station total wind design level * distortion limit = 1.4√(20MW/100MW) * 0.5% = 0.16% Wind E or F = probability factor * Windfarm size/station total wind design level * distortion limit = 1.4√(40MW/100MW) * 0.5% = 0.26%
Agenda
High level Facts
Policy breakdown – Planning levels
Policy Breakdown – Planning Margin
Policy breakdown – Allocated distortion limits
Policy Breakdown – Background levels
Policy Breakdown – Method of calculating limits
Summary
Summary
Based on International Best Practice
Consistent with equipment manufacturer
Proportionate and equitable
Transparent
Mitigates short and long term issues
Policy requirements defined and will be provided
to Users
21st November 2013
DSO Policy & Proposed Methodology
for Limit Calculations
Ivan Codd
Renewable Planning Manager,
Asset Management, ESB Networks
esbnetworks.ie
BACKGROUND
• The DSO is defined in the Grid Code as a User of the transmission
system at each TSO/DSO interface – ie generally each 110kV node
(220kV nodes in Greater Dublin)
• Harmonic voltage distortion limits will be supplied by Eirgrid for each
TSO/DSO interface point
• DSO is required to ensure the harmonic distortion at all customer
connection points is within limits specified in EN 50160
• IEC/TR 61000-3-6 provides guidance to SOs on how to determine
emission limits for individual customers
esbnetworks.ie
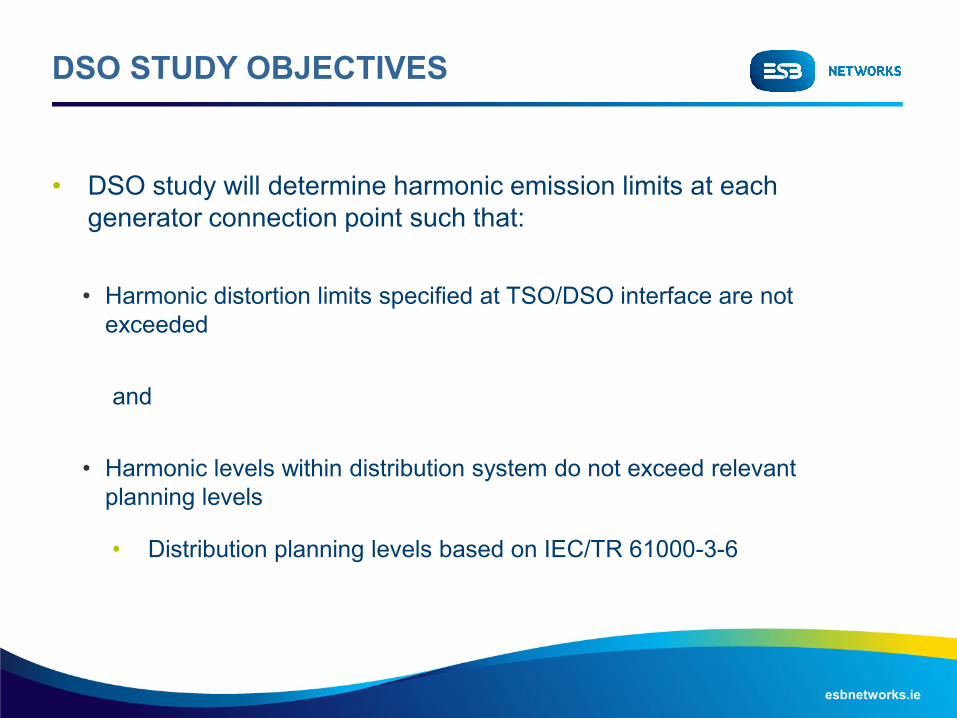
• DSO study will determine harmonic emission limits at each
generator connection point such that:
• Harmonic distortion limits specified at TSO/DSO interface are not
exceeded
and
• Harmonic levels within distribution system do not exceed relevant
planning levels
• Distribution planning levels based on IEC/TR 61000-3-6
DSO STUDY OBJECTIVES
esbnetworks.ie
STUDIES TO BE CARRIED OUT
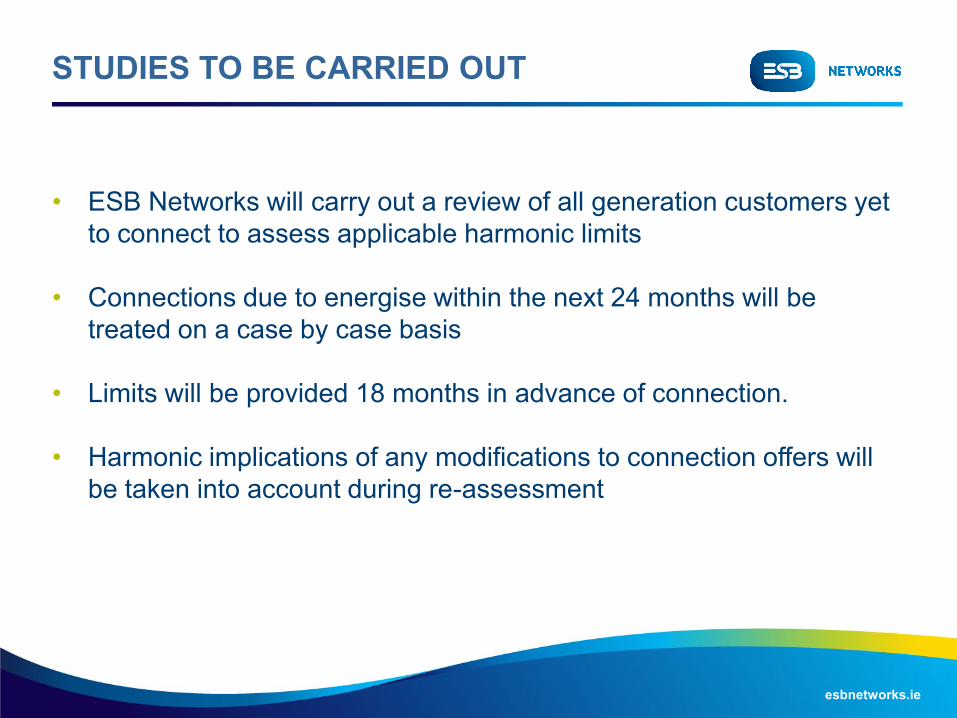
• ESB Networks will carry out a review of all generation customers yet
to connect to assess applicable harmonic limits
• Connections due to energise within the next 24 months will be
treated on a case by case basis
• Limits will be provided 18 months in advance of connection.
• Harmonic implications of any modifications to connection offers will
be taken into account during re-assessment
esbnetworks.ie
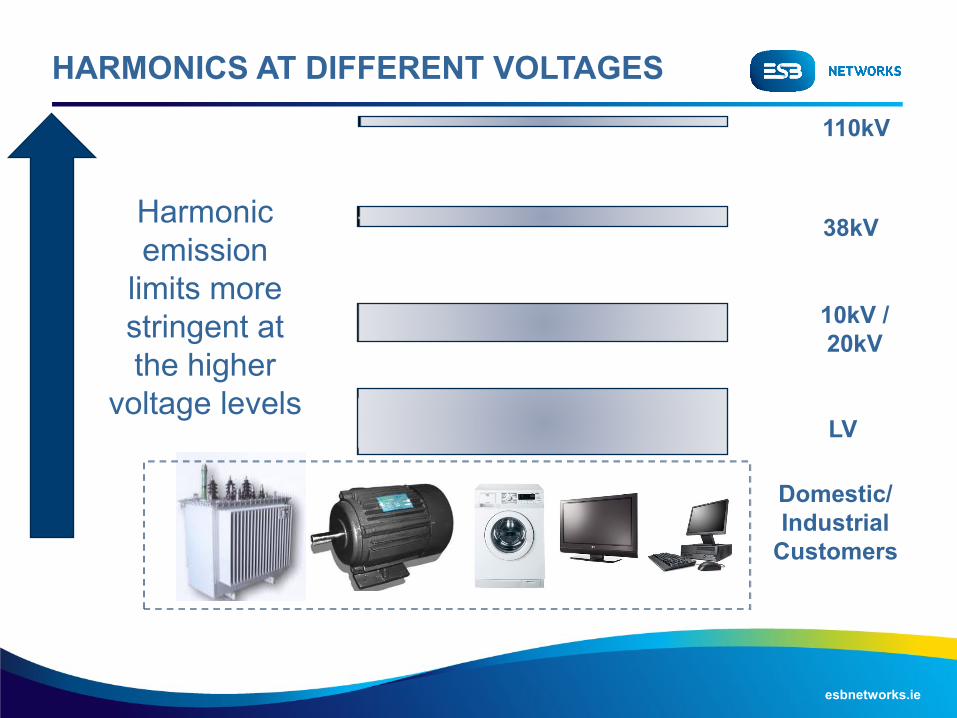
HARMONICS AT DIFFERENT VOLTAGES
LV
10kV /
20kV
38kV
110kV
Domestic/
Industrial
Customers
Harmonic
emission
limits more
stringent at
the higher
voltage levels
esbnetworks.ie
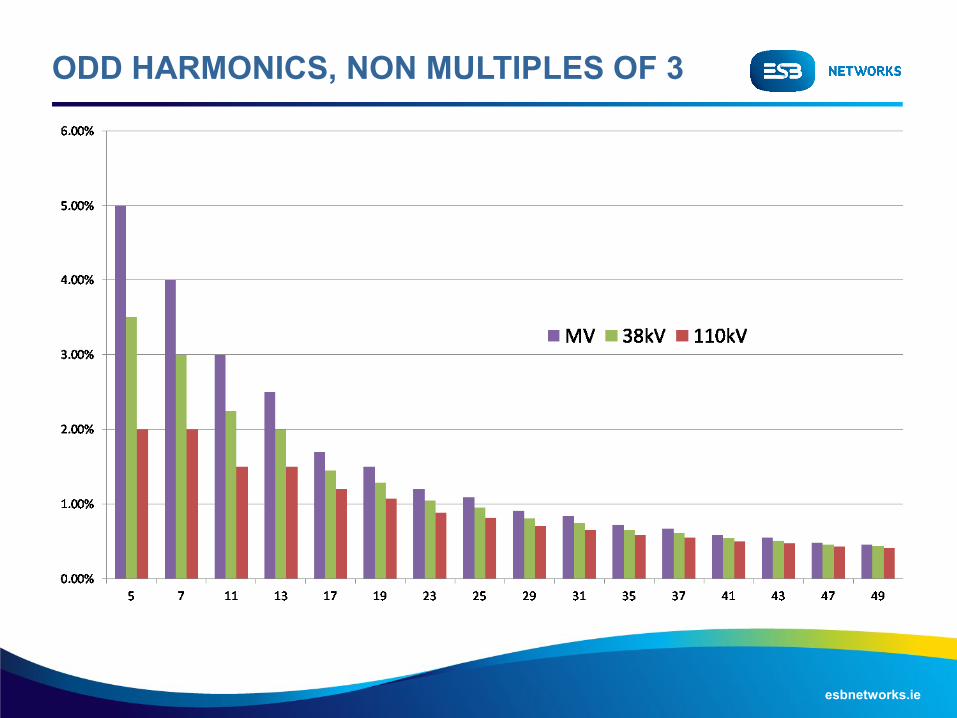
ODD HARMONICS, NON MULTIPLES OF 3
(6N +/- 1)
esbnetworks.ie
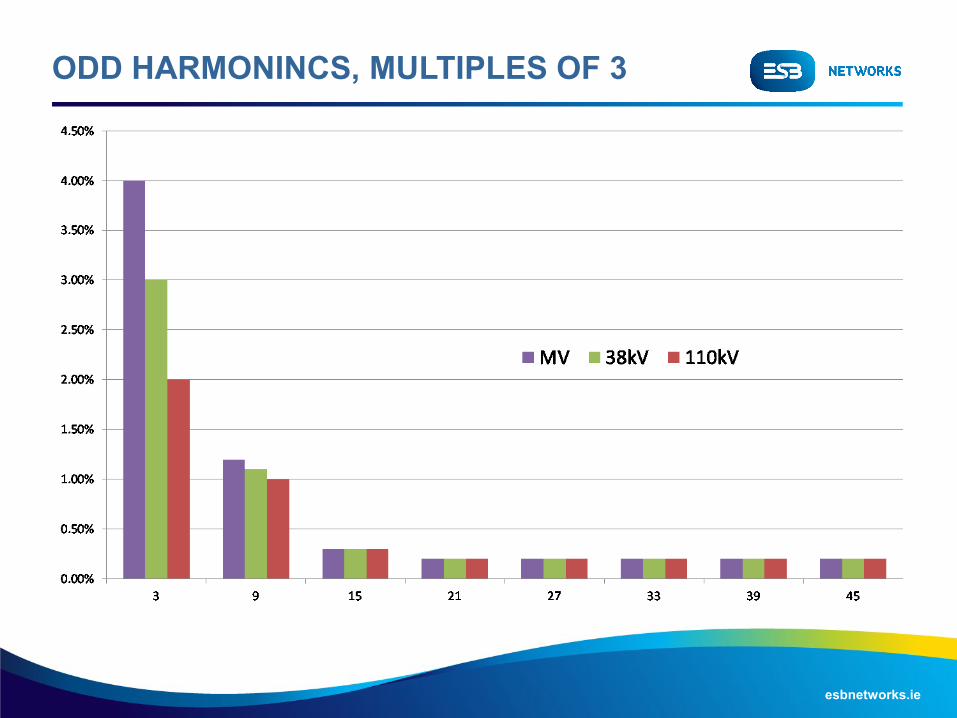
ODD HARMONINCS, MULTIPLES OF 3
esbnetworks.ie
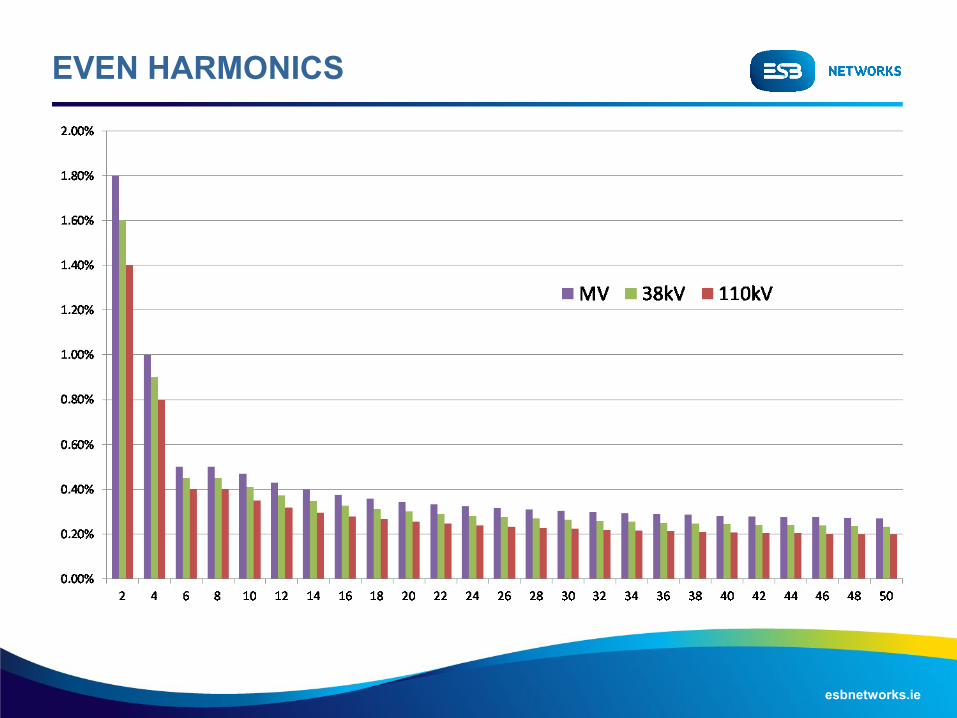
EVEN HARMONICS
esbnetworks.ie
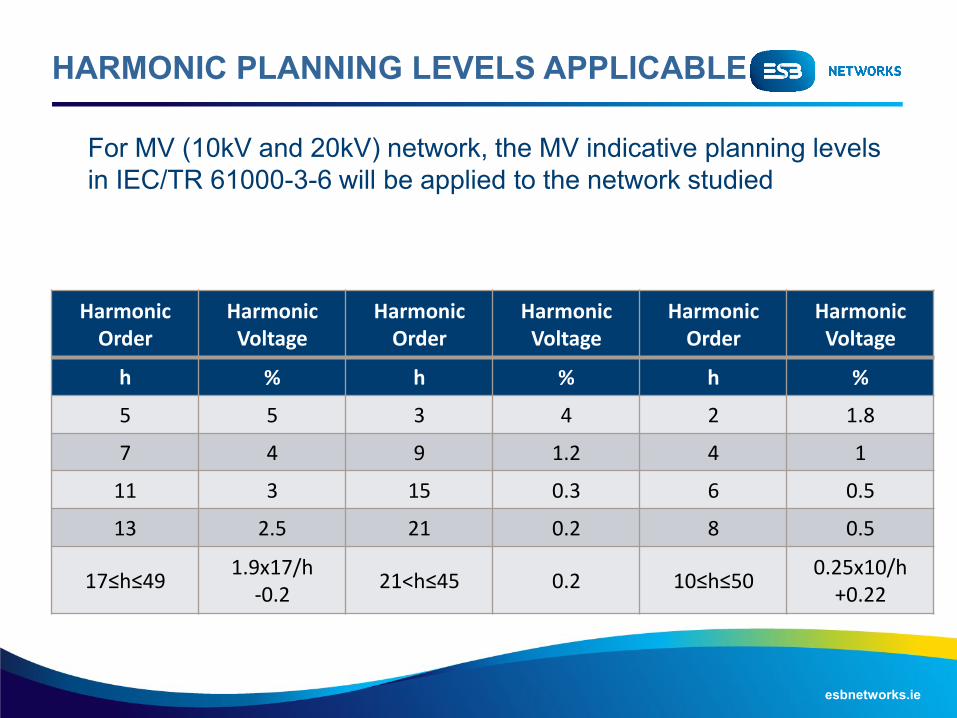
HARMONIC PLANNING LEVELS APPLICABLE
For MV (10kV and 20kV) network, the MV indicative planning levels
in IEC/TR 61000-3-6 will be applied to the network studied
Harmonic Order
Harmonic Voltage
Harmonic Order
Harmonic Voltage
Harmonic Order
Harmonic Voltage
h % h % h %
5 5 3 4 2 1.8
7 4 9 1.2 4 1
11 3 15 0.3 6 0.5
13 2.5 21 0.2 8 0.5
17≤h≤49 1.9x17/h
-0.2 21<h≤45 0.2 10≤h≤50
0.25x10/h +0.22

esbnetworks.ie
HARMONIC PLANNING LEVELS APPLICABLE
For 38kV network, intermediate values between the MV and HV-
EHV indicative planning levels in IEC/TR 61000-3-6 will be applied to the network studied.
Harmonic Order
Harmonic Voltage
Harmonic Order
Harmonic Voltage
Harmonic Order
Harmonic Voltage
h % h % h %
5 3.5 3 3 2 1.6
7 3 9 1.2 4 0.9
11 2.75 15 0.3 6 0.45
13 2 21 0.2 8 0.45
All other harmonic orders ≤ 50: (MV Planning Level + HV-EHV Planning Level) / 2
esbnetworks.ie
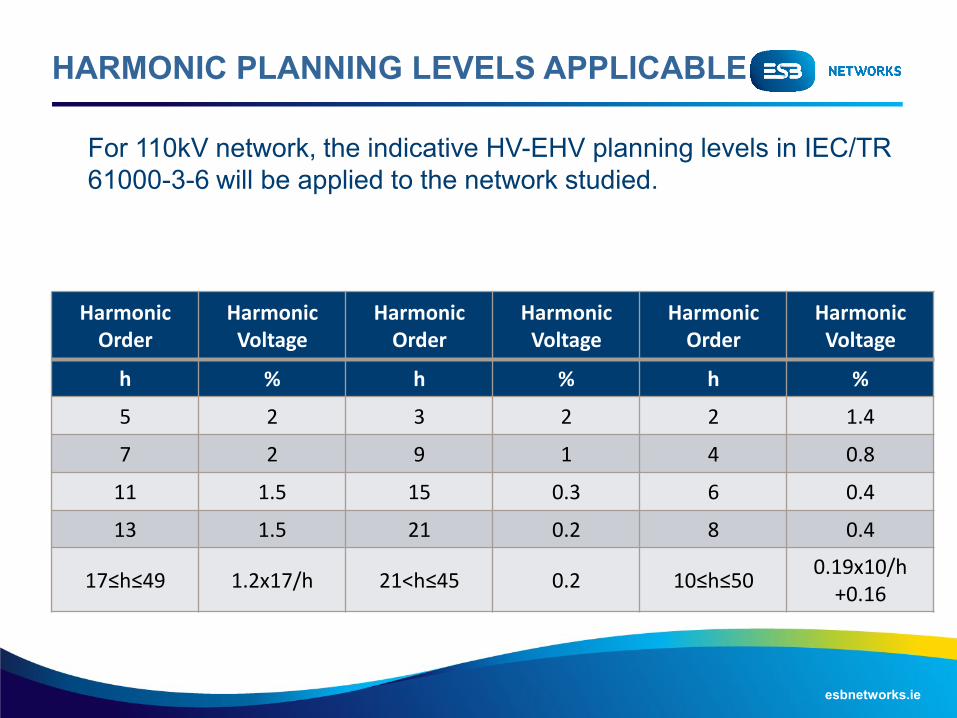
HARMONIC PLANNING LEVELS APPLICABLE
For 110kV network, the indicative HV-EHV planning levels in IEC/TR
61000-3-6 will be applied to the network studied.
Harmonic Order
Harmonic Voltage
Harmonic Order
Harmonic Voltage
Harmonic Order
Harmonic Voltage
h % h % h %
5 2 3 2 2 1.4
7 2 9 1 4 0.8
11 1.5 15 0.3 6 0.4
13 1.5 21 0.2 8 0.4
17≤h≤49 1.2x17/h 21<h≤45 0.2 10≤h≤50 0.19x10/h
+0.16
esbnetworks.ie
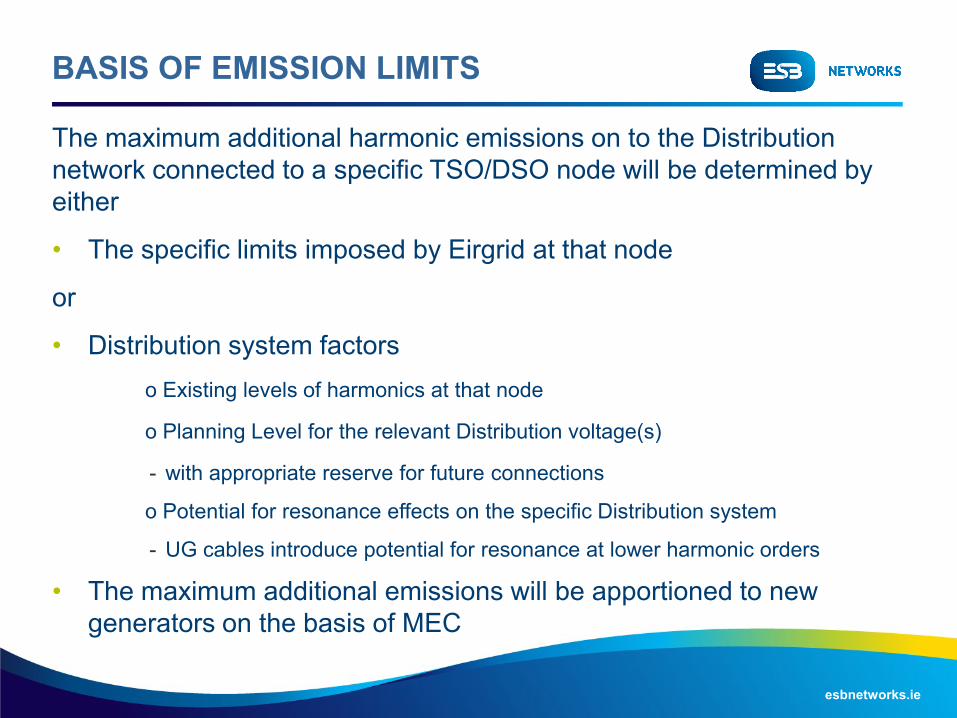
BASIS OF EMISSION LIMITS
The maximum additional harmonic emissions on to the Distribution
network connected to a specific TSO/DSO node will be determined by
either
• The specific limits imposed by Eirgrid at that node
or
• Distribution system factors
o Existing levels of harmonics at that node
o Planning Level for the relevant Distribution voltage(s)
- with appropriate reserve for future connections
o Potential for resonance effects on the specific Distribution system
- UG cables introduce potential for resonance at lower harmonic orders
• The maximum additional emissions will be apportioned to new
generators on the basis of MEC
esbnetworks.ie
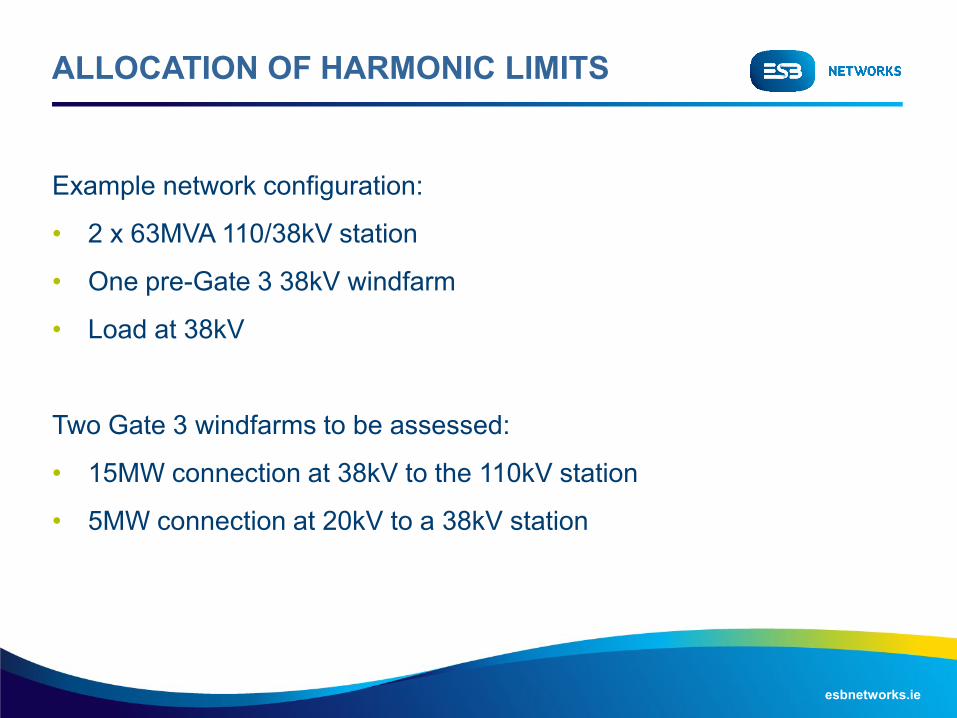
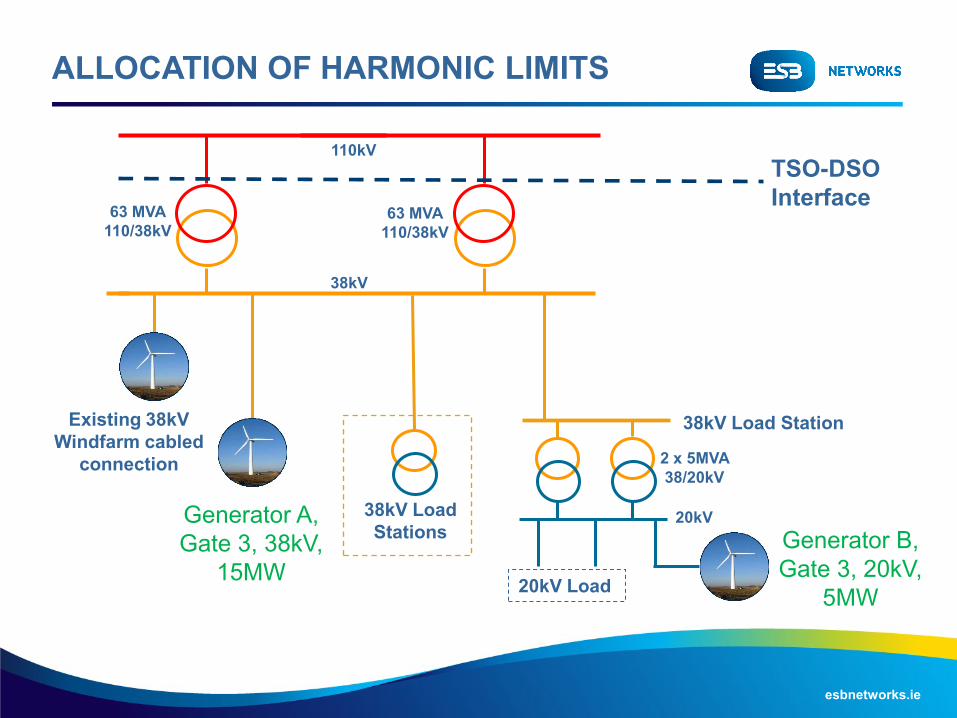
ALLOCATION OF HARMONIC LIMITS
Example network configuration:
• 2 x 63MVA 110/38kV station
• One pre-Gate 3 38kV windfarm
• Load at 38kV
Two Gate 3 windfarms to be assessed:
• 15MW connection at 38kV to the 110kV station
• 5MW connection at 20kV to a 38kV station
esbnetworks.ie
ALLOCATION OF HARMONIC LIMITS
63 MVA
110/38kV
38kV
110kV
63 MVA
110/38kV
2 x 5MVA
38/20kV
38kV Load Station
20kV
Generator B,
Gate 3, 20kV,
5MW
Generator A,
Gate 3, 38kV,
15MW
TSO-DSO
Interface
38kV Load
Stations
20kV Load
Existing 38kV
Windfarm cabled
connection
esbnetworks.ie
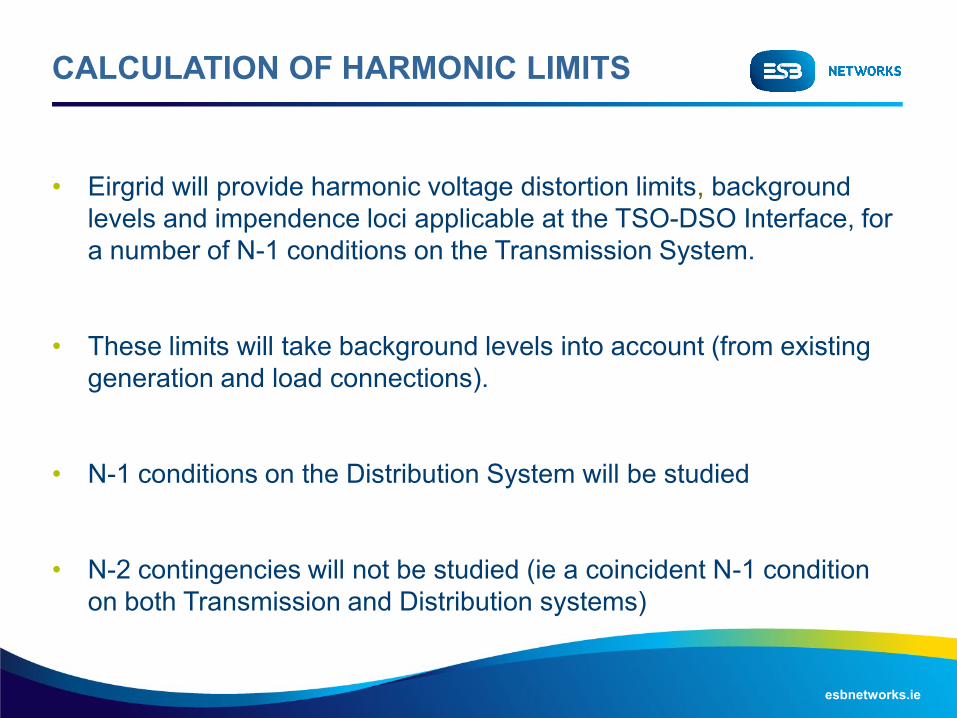
CALCULATION OF HARMONIC LIMITS
• Eirgrid will provide harmonic voltage distortion limits, background
levels and impendence loci applicable at the TSO-DSO Interface, for
a number of N-1 conditions on the Transmission System.
• These limits will take background levels into account (from existing
generation and load connections).
• N-1 conditions on the Distribution System will be studied
• N-2 contingencies will not be studied (ie a coincident N-1 condition
on both Transmission and Distribution systems)
esbnetworks.ie
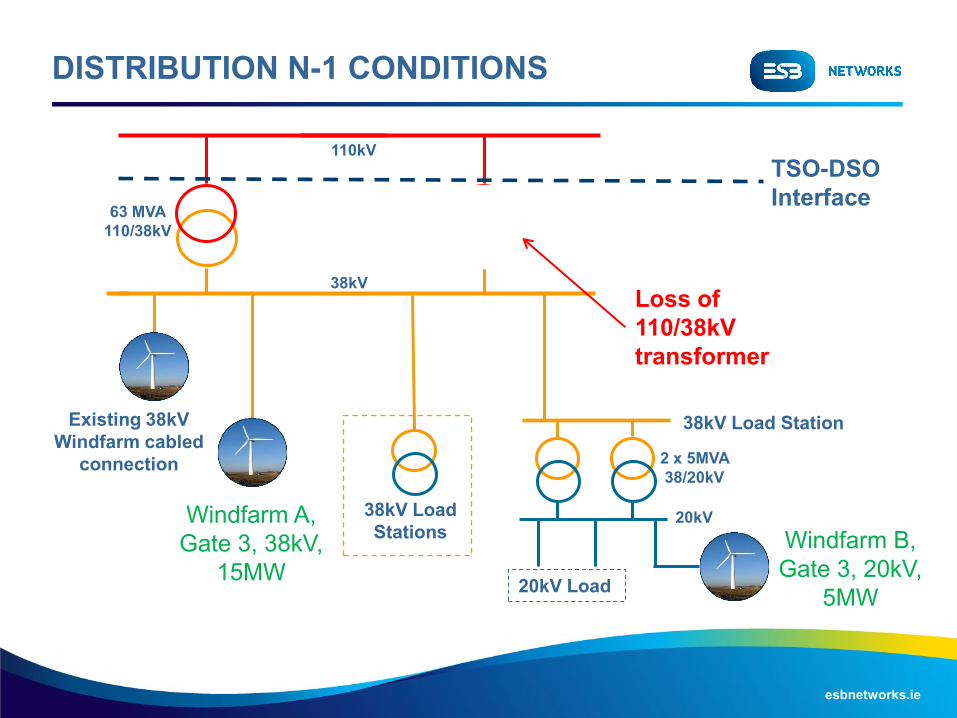
DISTRIBUTION N-1 CONDITIONS
63 MVA
110/38kV
38kV
110kV
63 MVA
110/38kV
2 x 5MVA
38/20kV
38kV Load Station
20kV
Existing 38kV
Windfarm cabled
connection
Windfarm B,
Gate 3, 20kV,
5MW
Windfarm A,
Gate 3, 38kV,
15MW
TSO-DSO
Interface
38kV Load
Stations
20kV Load
Loss of
110/38kV
transformer
esbnetworks.ie
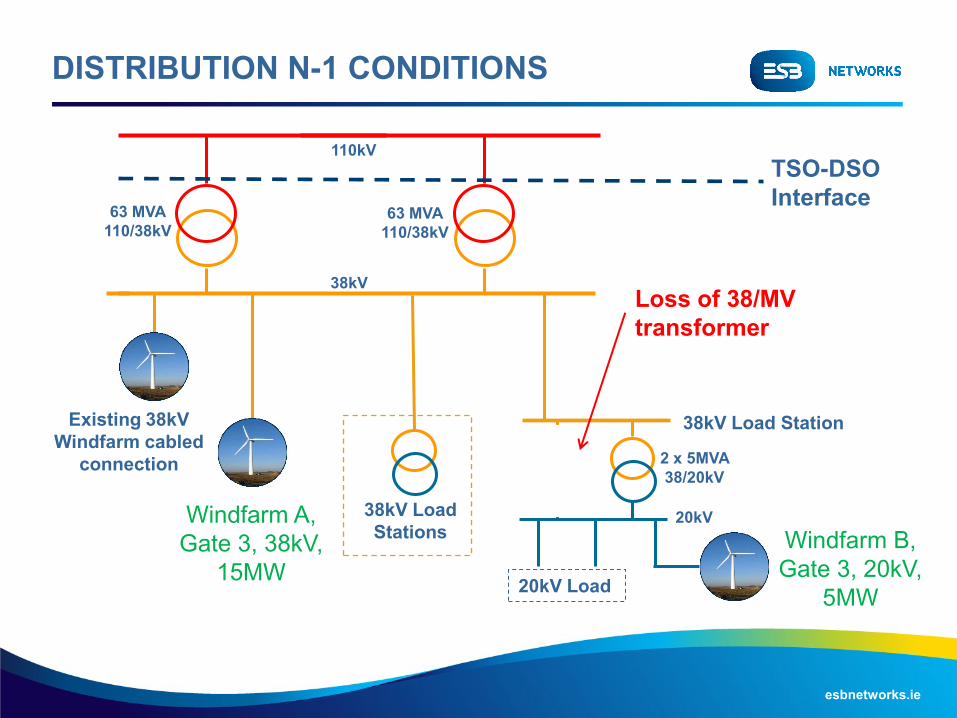
DISTRIBUTION N-1 CONDITIONS
63 MVA
110/38kV
38kV
110kV
63 MVA
110/38kV
2 x 5MVA
38/20kV
38kV Load Station
20kV
Windfarm B,
Gate 3, 20kV,
5MW
Windfarm A,
Gate 3, 38kV,
15MW
TSO-DSO
Interface
38kV Load
Stations
20kV Load
Loss of 38/MV
transformer
Existing 38kV
Windfarm cabled
connection
esbnetworks.ie
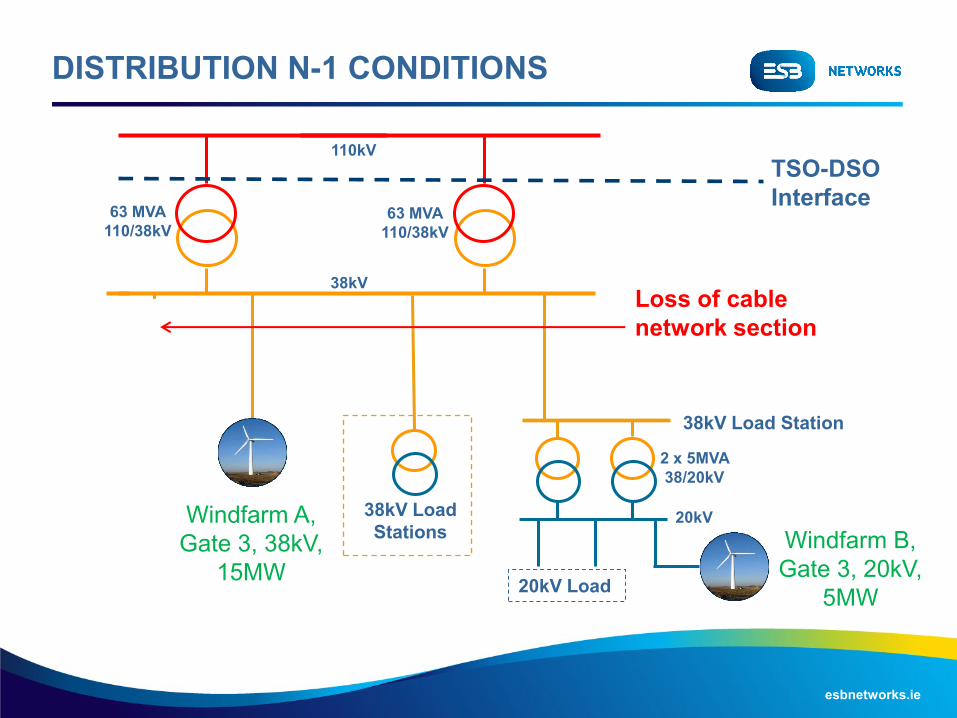
DISTRIBUTION N-1 CONDITIONS
63 MVA
110/38kV
38kV
110kV
63 MVA
110/38kV
2 x 5MVA
38/20kV
38kV Load Station
20kV
Windfarm B,
Gate 3, 20kV,
5MW
Windfarm A,
Gate 3, 38kV,
15MW
TSO-DSO
Interface
38kV Load
Stations
20kV Load
Loss of cable
network section
Existing 38kV
Windfarm cabled
connection

esbnetworks.ie
DISTRIBUTION N-1 CONDITIONS
63 MVA
110/38kV
38kV
110kV
63 MVA
110/38kV
2 x 5MVA
38/20kV
38kV Load Station
20kV
Windfarm B,
Gate 3, 20kV,
5MW
Windfarm A,
Gate 3, 38kV,
15MW
TSO-DSO
Interface
38kV Load
Stations
20kV Load
Loss of
significant load
Existing 38kV
Windfarm cabled
connection
esbnetworks.ie
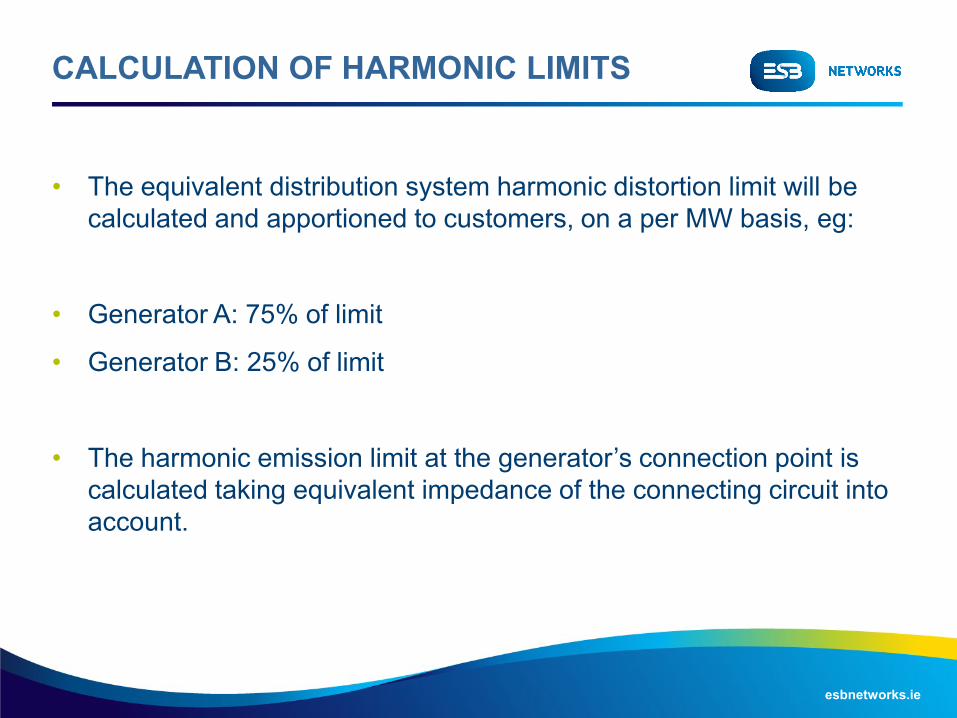
CALCULATION OF HARMONIC LIMITS
• The equivalent distribution system harmonic distortion limit will be
calculated and apportioned to customers, on a per MW basis, eg:
• Generator A: 75% of limit
• Generator B: 25% of limit
• The harmonic emission limit at the generator’s connection point is
calculated taking equivalent impedance of the connecting circuit into
account.
esbnetworks.ie
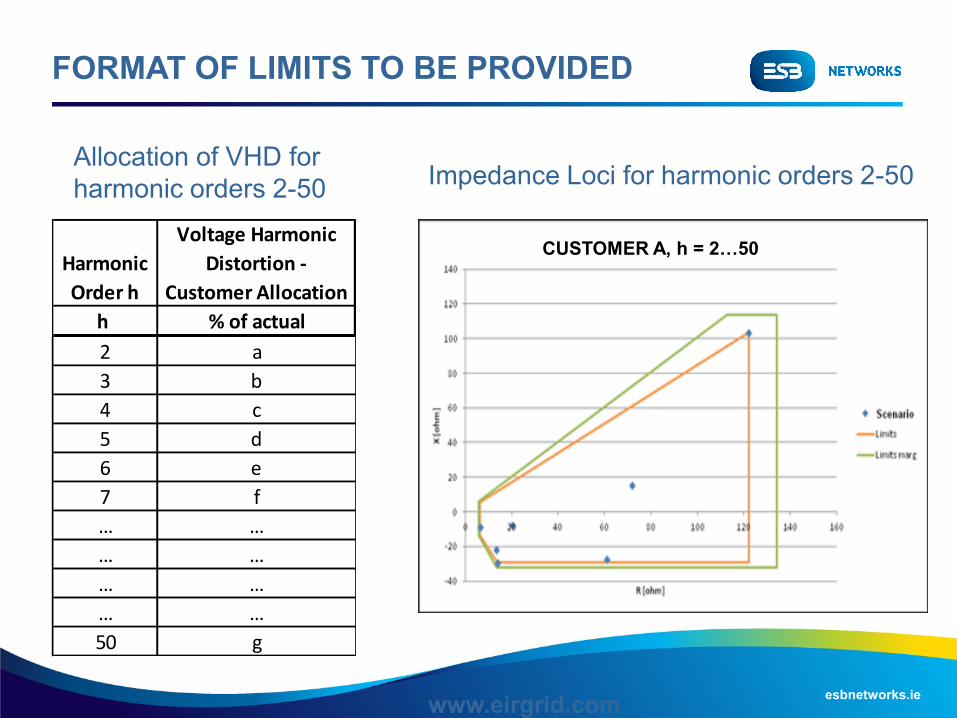
FORMAT OF LIMITS TO BE PROVIDED
www.eirgrid.com
Impedance Loci for harmonic orders 2-50
CUSTOMER A, h = 2…50 Harmonic
Order h
Voltage Harmonic
Distortion -
Customer Allocation
h % of actual
2 a
3 b
4 c
5 d
6 e
7 f
… …
… …
… …
… …
50 g
Allocation of VHD for
harmonic orders 2-50
esbnetworks.ie
THANK YOU
Footer
Session 2
Harmonics Mitigation Options
Marta Val Escudero
Transmission Access Planning
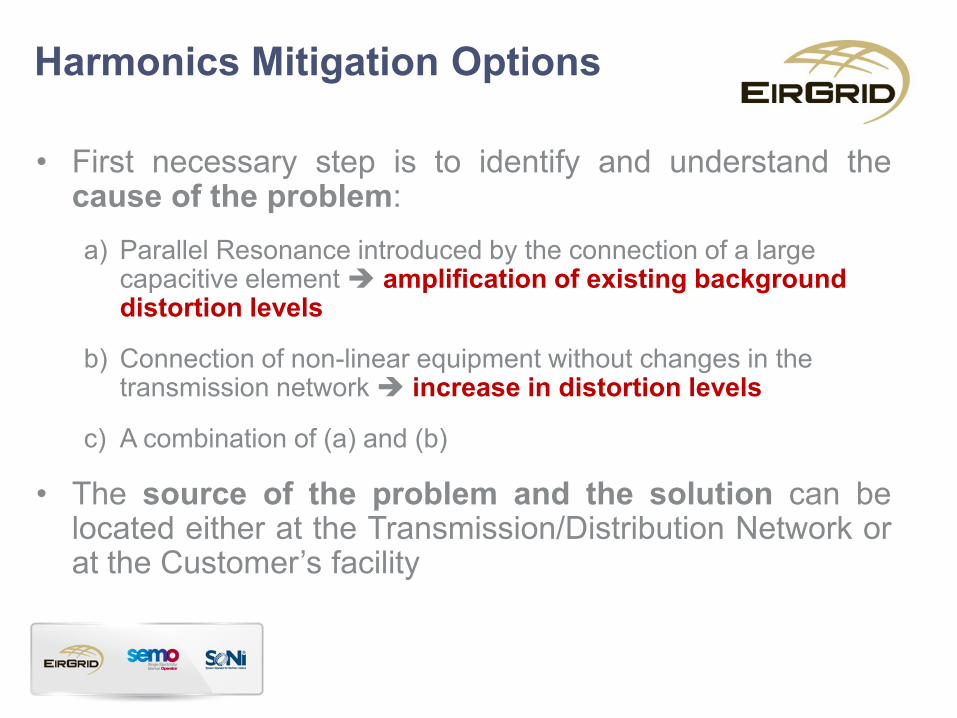
Harmonics Mitigation Options
• First necessary step is to identify and understand the cause of the problem:
a) Parallel Resonance introduced by the connection of a large capacitive element amplification of existing background distortion levels
b) Connection of non-linear equipment without changes in the transmission network increase in distortion levels
c) A combination of (a) and (b)
• The source of the problem and the solution can be located either at the Transmission/Distribution Network or at the Customer’s facility

Customer only Customer only
SO only SO only
SO or Customer
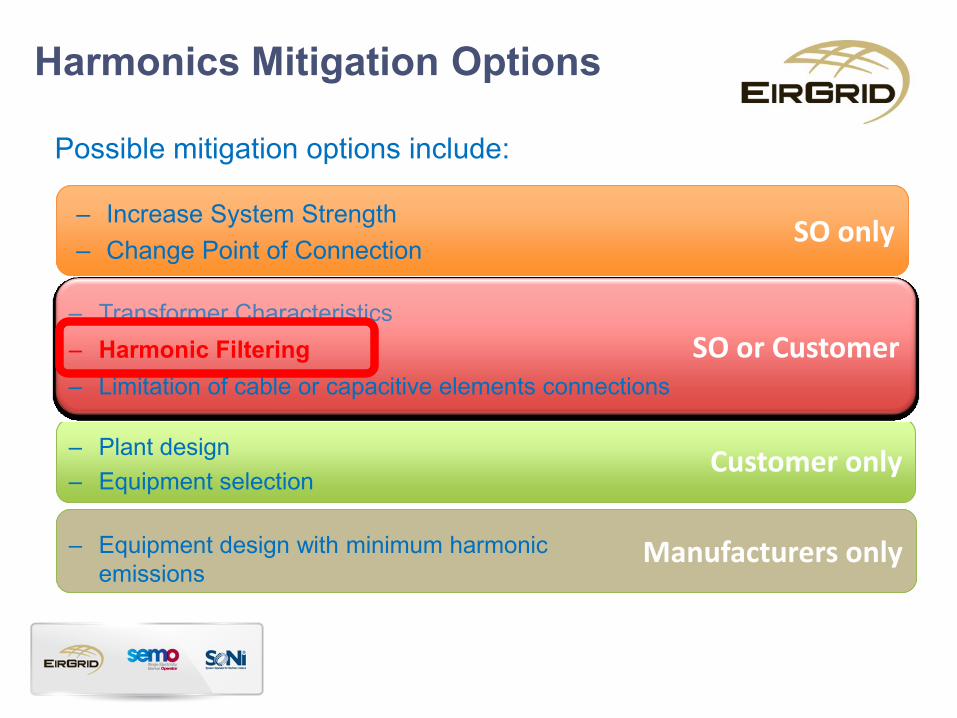
Possible mitigation options include:
Harmonics Mitigation Options
– Increase System Strength
– Change Point of Connection
– Transformer Characteristics
– Harmonic Filtering
– Limitation of cable or capacitive elements connections
– Plant design
– Equipment selection
only Manufacturers only – Equipment design with minimum harmonic
emissions
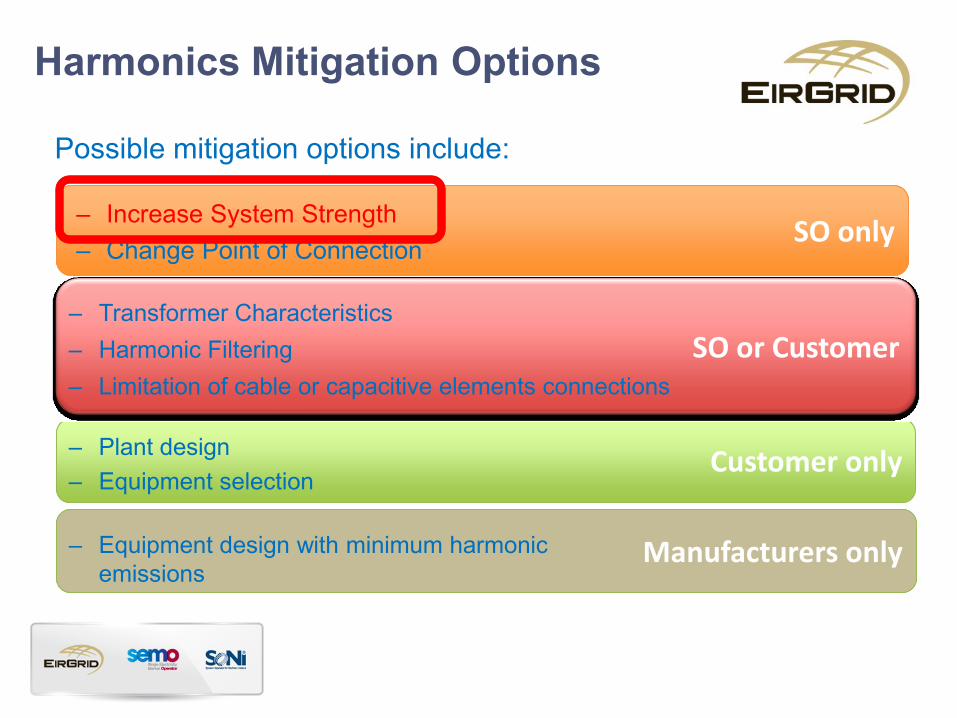
Customer only Customer only
SO only SO only
SO or Customer
Possible mitigation options include:
Harmonics Mitigation Options
– Increase System Strength
– Change Point of Connection
– Transformer Characteristics
– Harmonic Filtering
– Limitation of cable or capacitive elements connections
– Plant design
– Equipment selection
only Manufacturers only – Equipment design with minimum harmonic
emissions
0
100
200
300
400
500
600
700
800
900
1000
0 2 4 6 8 10 12 14 16 18 20
Z [Ω
]
harmonic order [h] SC=4kA (with cable)
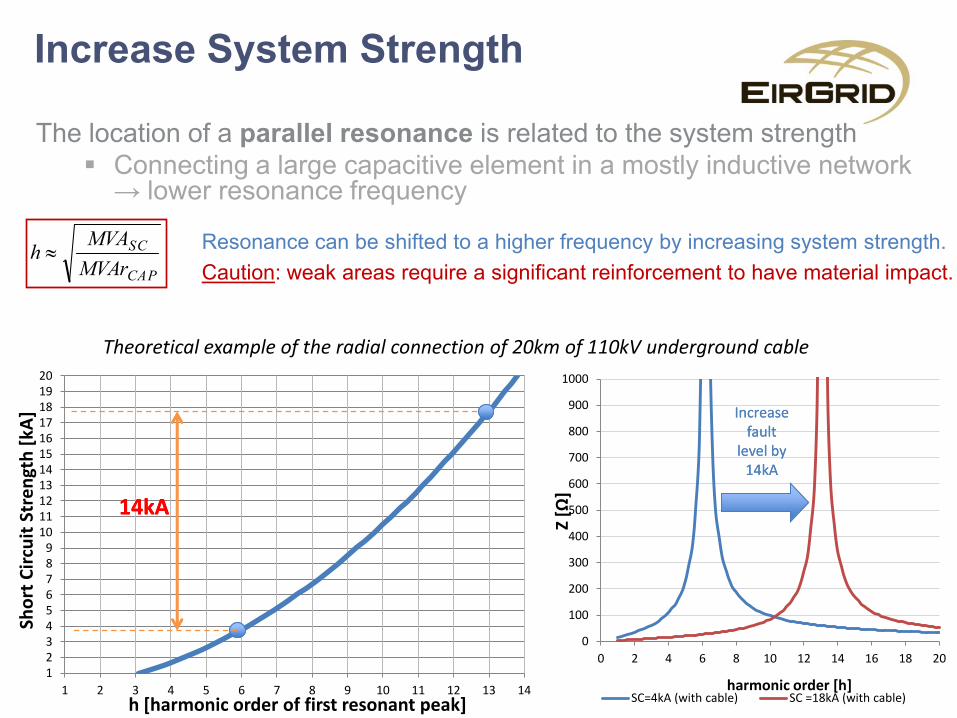
Increase System Strength
The location of a parallel resonance is related to the system strength
Connecting a large capacitive element in a mostly inductive network → lower resonance frequency
CAP
SC
MVAr
MVAh
1 2 3 4 5 6 7 8 9
10 11 12 13 14 15 16 17 18 19 20
1 2 3 4 5 6 7 8 9 10 11 12 13 14
Sho
rt C
ircu
it S
tre
ngt
h [
kA]
h [harmonic order of first resonant peak]
Theoretical example of the radial connection of 20km of 110kV underground cable
0
100
200
300
400
500
600
700
800
900
1000
0 2 4 6 8 10 12 14 16 18 20
Z [Ω
]
harmonic order [h] SC=4kA (with cable) SC =18kA (with cable)
Increase Increase fault fault
level by level by 14kA14kA
Resonance can be shifted to a higher frequency by increasing system strength.
Caution: weak areas require a significant reinforcement to have material impact.
14kA14kA
Increase System Strength
Methods of increasing system strength:
Can be costly and often have long lead times
– Building new circuits
– Installing more transformers from a higher voltage level
– Connecting (stiff) generation into the area
• Caution with increasing system strength – adequate rating of
switchgear?
• General principle to apply to system strength is:
“As High as Necessary, but As Low as Possible”

Customer only Customer only
SO only SO only
SO or Customer
Possible mitigation options include:
Harmonics Mitigation Options
– Increase System Strength
– Change Point of Connection
– Transformer Characteristics
– Harmonic Filtering
– Limitation of cable or capacitive elements connections
– Plant design
– Equipment selection
only Manufacturers only – Equipment design with minimum harmonic
emissions

Transformer Winding Connections
• High order harmonics are not typically passed through
transformers. Transformers effectively attenuate high harmonic
frequencies.
• Triplen harmonics are typically trapped in transformer delta
connected windings (assuming balanced loading conditions).
• Caution with triplen harmonic flows on the neutral conductor.
Customer only Customer only
SO only SO only
SO or Customer
Possible mitigation options include:
Harmonics Mitigation Options
– Increase System Strength
– Change Point of Connection
– Transformer Characteristics
– Harmonic Filtering
– Limitation of cable or capacitive elements connections
– Plant design
– Equipment selection
only Manufacturers only – Equipment design with minimum harmonic
emissions
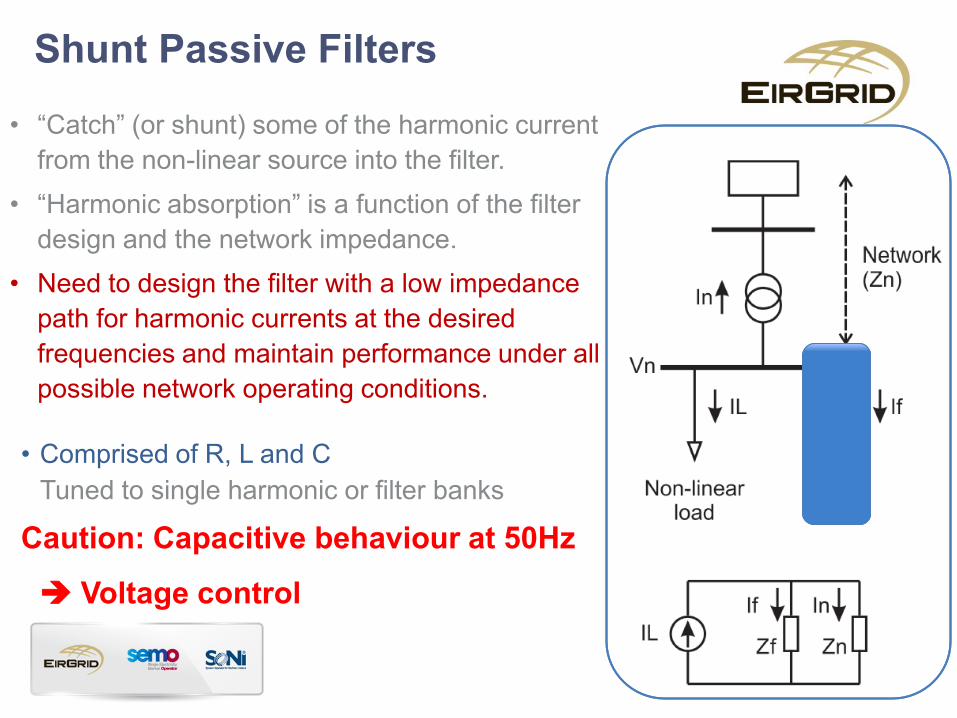
Shunt Passive Filters
• “Catch” (or shunt) some of the harmonic current
from the non-linear source into the filter.
• “Harmonic absorption” is a function of the filter
design and the network impedance.
• Need to design the filter with a low impedance
path for harmonic currents at the desired
frequencies and maintain performance under all
possible network operating conditions.
• Comprised of R, L and C
Tuned to single harmonic or filter banks
Caution: Capacitive behaviour at 50Hz
Voltage control

Shunt Passive Filters
• Tuned Filters
Single Tuned
Double Tuned
Triple Tuned
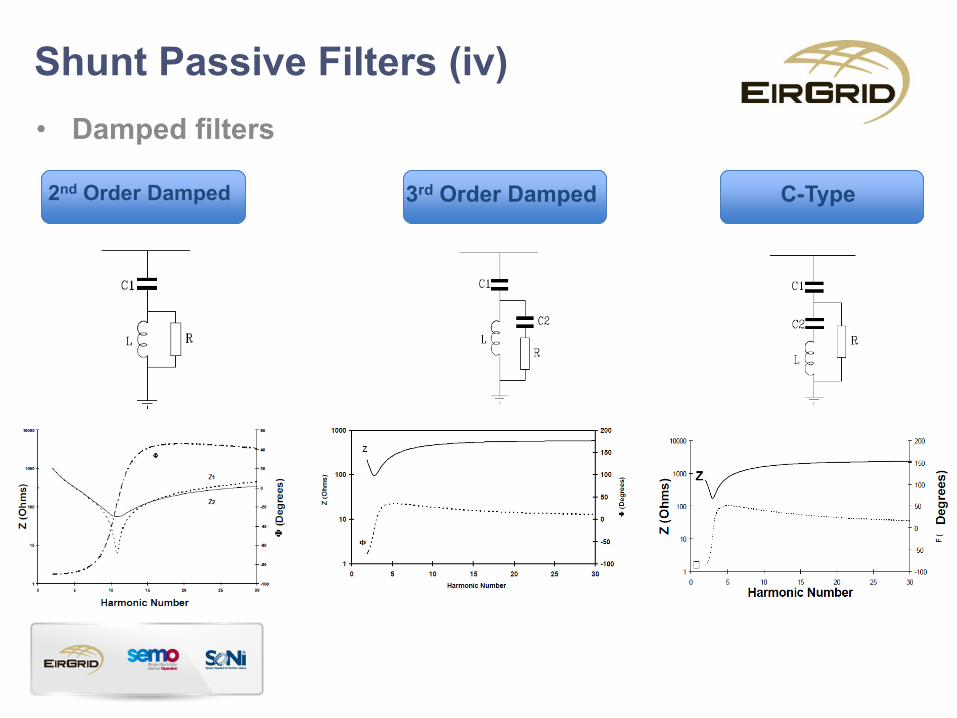
Shunt Passive Filters (iv)
• Damped filters
2nd Order Damped
3rd Order Damped
C-Type
Active Filters
• Based on power electronic converters that dynamically cancel harmonic
current. The device measures the load current, calculates the harmonic
current spectrum and then injects the required signal at the opposite phase
angle for each selected harmonic order to be cancelled.
• These devices are costly and are typically applied in the electric
distribution networks of industrial plants.
• No experience of application of active filters in transmission networks to
date.
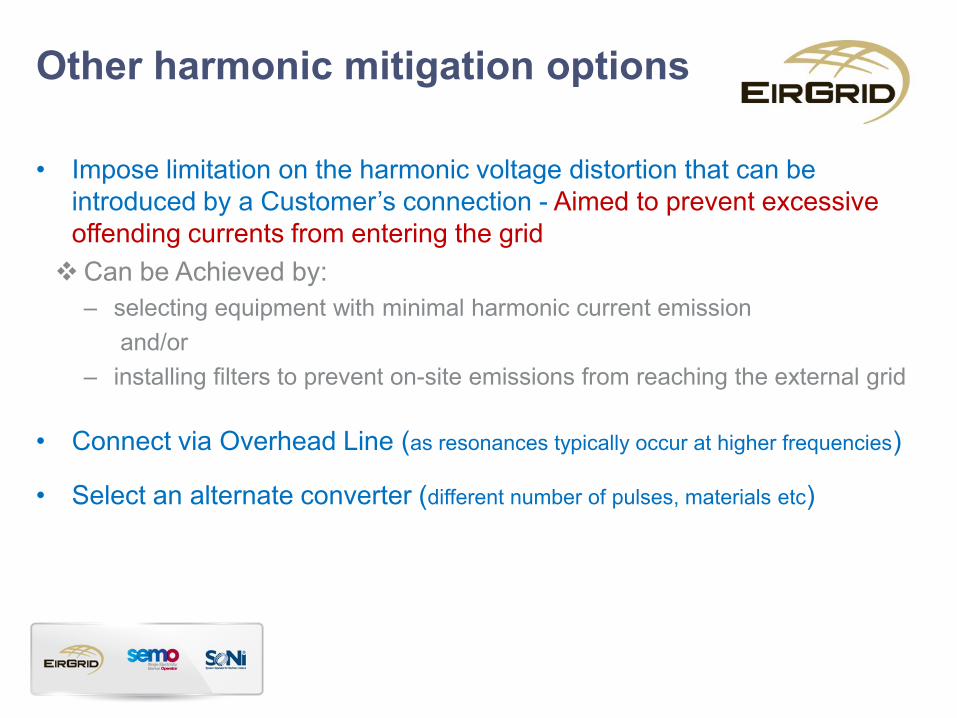
Other harmonic mitigation options
• Impose limitation on the harmonic voltage distortion that can be
introduced by a Customer’s connection - Aimed to prevent excessive
offending currents from entering the grid
Can be Achieved by:
– selecting equipment with minimal harmonic current emission
and/or
– installing filters to prevent on-site emissions from reaching the external grid
• Connect via Overhead Line (as resonances typically occur at higher frequencies)
• Select an alternate converter (different number of pulses, materials etc)

Application Example
Amplification of Background Distortion Due to Customer’s Internal Network
Harmonic Order
Existing Backgroun
d [%]
Emission Limit [%]
Planning Level [%]
n 1.16 0.5 2
Background Distortion
Emission Limit
R = 1.5 Ω X = 50 Ω
R = 4 Ω X = -48 Ω
Customer Customer Internal Internal Network Network ImpedanceImpedance
23.8
505.1484
484
jj
jFactorionAmplificatVoltage
ZZ
ZFactorionAmplificatVoltage
Networkcustomer
customer
1.66%
Voltage Distortion after Customer Voltage Distortion after Customer Connection = 8.23 x 1.16 = 9.54%
9.54%
Planning Level
Allowed Distortion at POC after connection
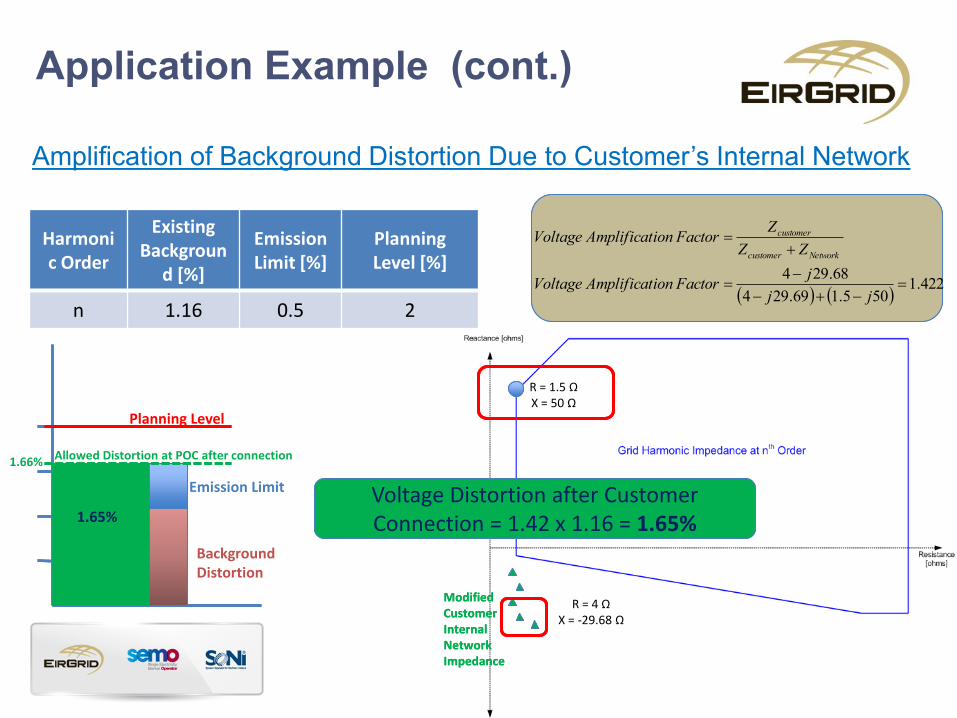
Application Example (cont.)
Amplification of Background Distortion Due to Customer’s Internal Network
Harmonic Order
Existing Backgroun
d [%]
Emission Limit [%]
Planning Level [%]
n 1.16 0.5 2
Background Distortion
Emission Limit
Planning Level
Allowed Distortion at POC after connection
R = 1.5 Ω X = 50 Ω
R = 4 Ω X = -29.68 Ω
Modified Modified Customer Customer Internal Internal Network Network ImpedanceImpedance
422.1
505.169.294
68.294
jj
jFactorionAmplificatVoltage
ZZ
ZFactorionAmplificatVoltage
Networkcustomer
customer
1.66%
Voltage Distortion after Customer Voltage Distortion after Customer Connection = 1.42 x 1.16 = 1.65% 1.65%
0
50
100
150
200
250
300
350
400
450
500
0 2 4 6 8 10 12 14
Z [Ω
]
harmonic order [h]
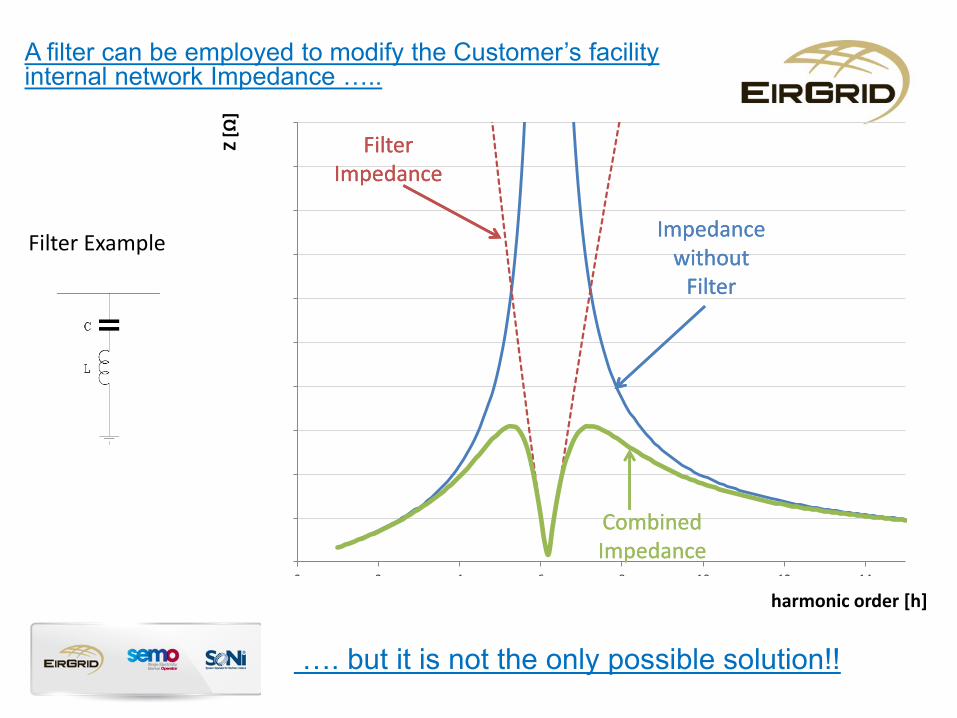
Filter Example Impedance Impedance
without without FilterFilter
Filter Filter ImpedanceImpedance
Combined Combined ImpedanceImpedance
A filter can be employed to modify the Customer’s facility internal network Impedance …..
…. but it is not the only possible solution!!

Monitoring Transmission System Power Quality
Ray Doyle
EirGrid
Overview of the Technology
• Disturbance Recorders with Power Quality functions
• Utilise protection or energy metering CT and VTs
• Devices Monitor:
– Voltage dips, swells, Supply interruptions
– Voltage and Current harmonics
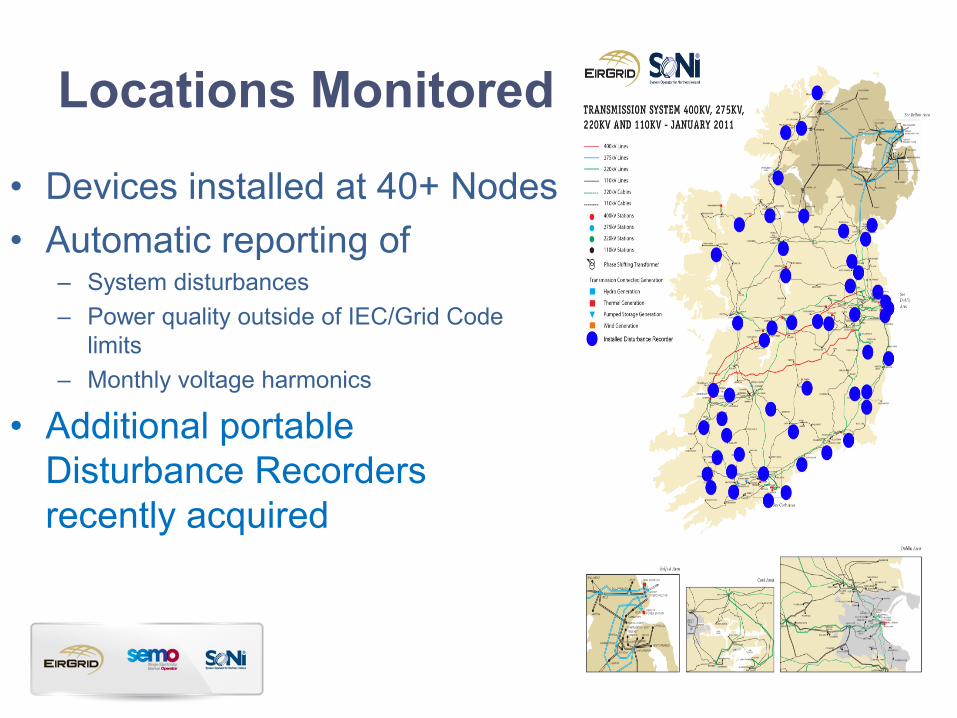
Locations Monitored
• Devices installed at 40+ Nodes
• Automatic reporting of – System disturbances
– Power quality outside of IEC/Grid Code
limits
– Monthly voltage harmonics
• Additional portable
Disturbance Recorders
recently acquired
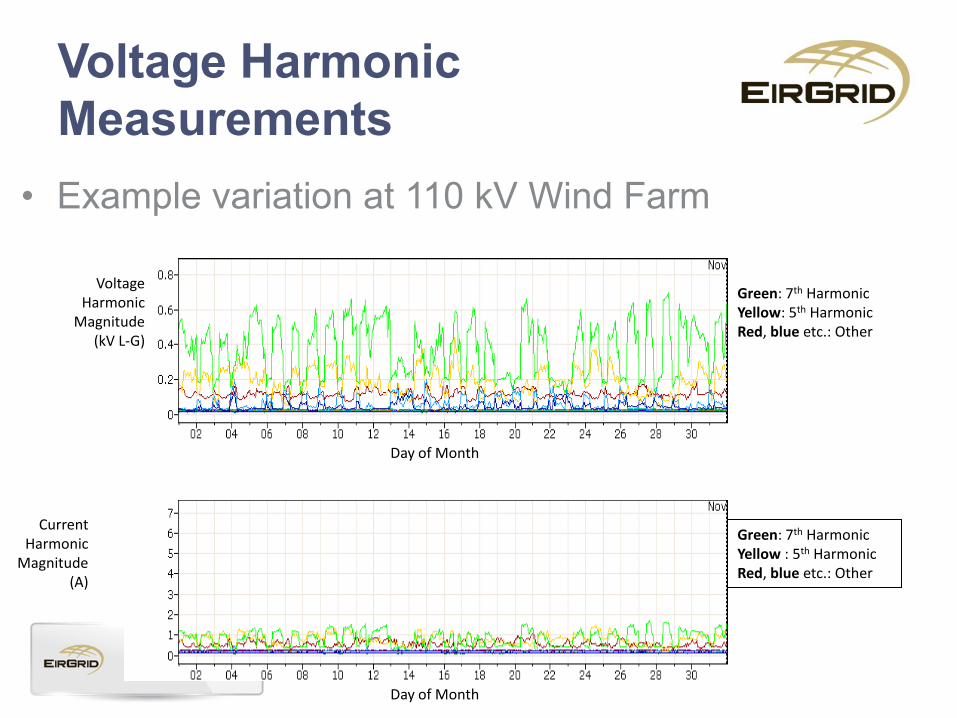
Voltage Harmonic
Measurements
• Example variation at 110 kV Wind Farm
Day of Month
Voltage Harmonic
Magnitude (kV L-G)
Green: 7th Harmonic Yellow: 5th Harmonic Red, blue etc.: Other
Day of Month
Current Harmonic
Magnitude (A)
Green: 7th Harmonic Yellow : 5th Harmonic Red, blue etc.: Other
Harmonic status
• No issues of breaching IEC recommendation on
the network today
• Recent DR data used as background harmonic
level to set up and tune the Digsilent models
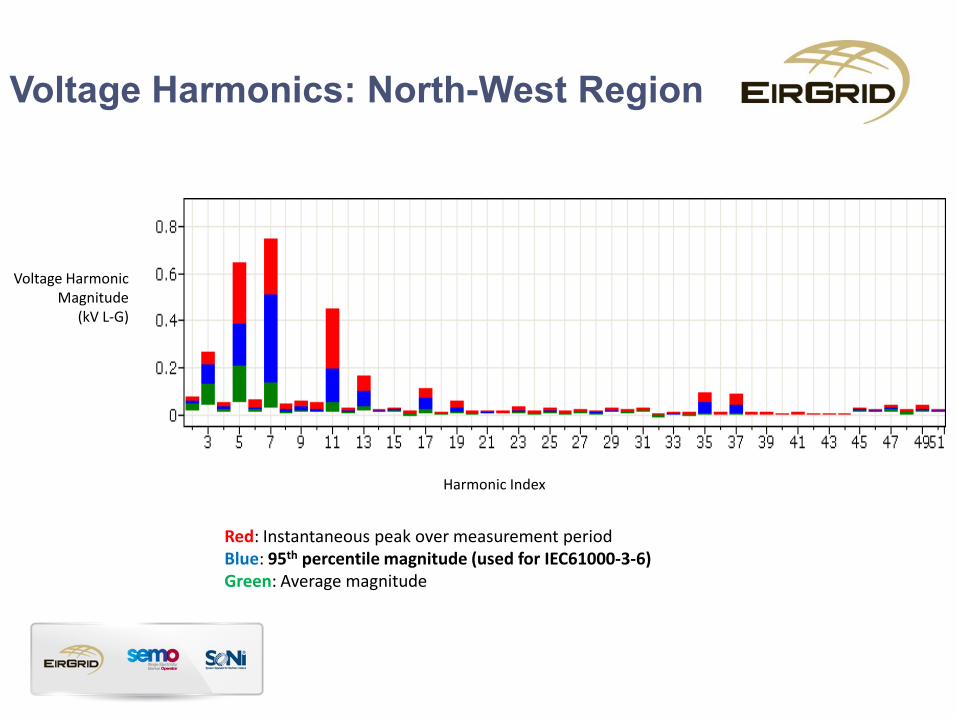
Voltage Harmonics: North-West Region
Voltage Harmonic Magnitude
(kV L-G)
Harmonic Index
Red: Instantaneous peak over measurement period Blue: 95th percentile magnitude (used for IEC61000-3-6) Green: Average magnitude
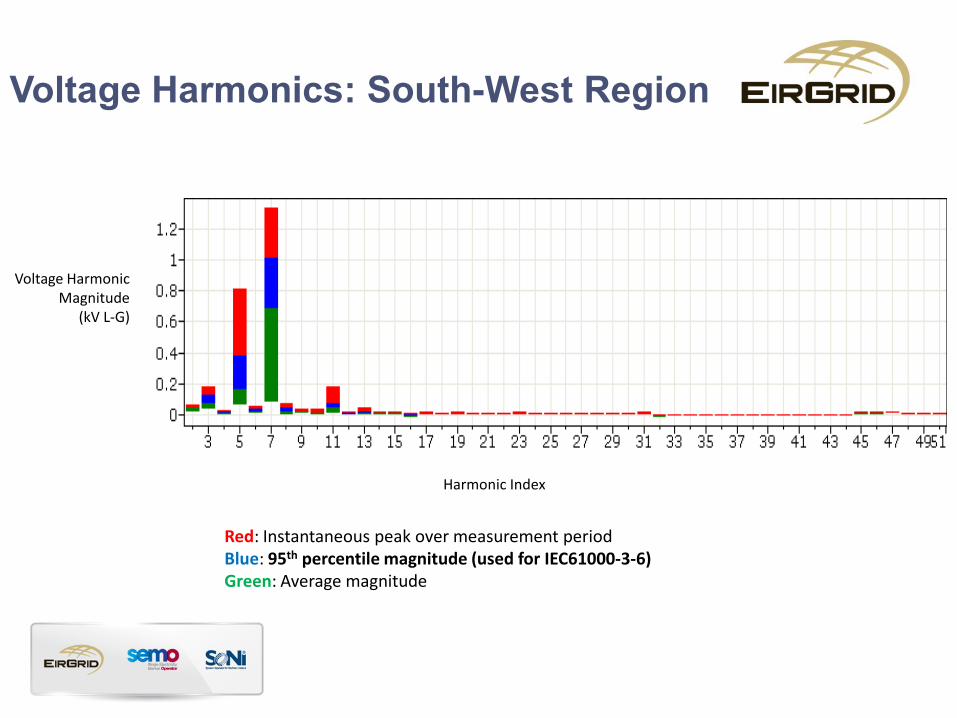
Voltage Harmonics: South-West Region
Harmonic Index
Voltage Harmonic Magnitude
(kV L-G)
Red: Instantaneous peak over measurement period Blue: 95th percentile magnitude (used for IEC61000-3-6) Green: Average magnitude
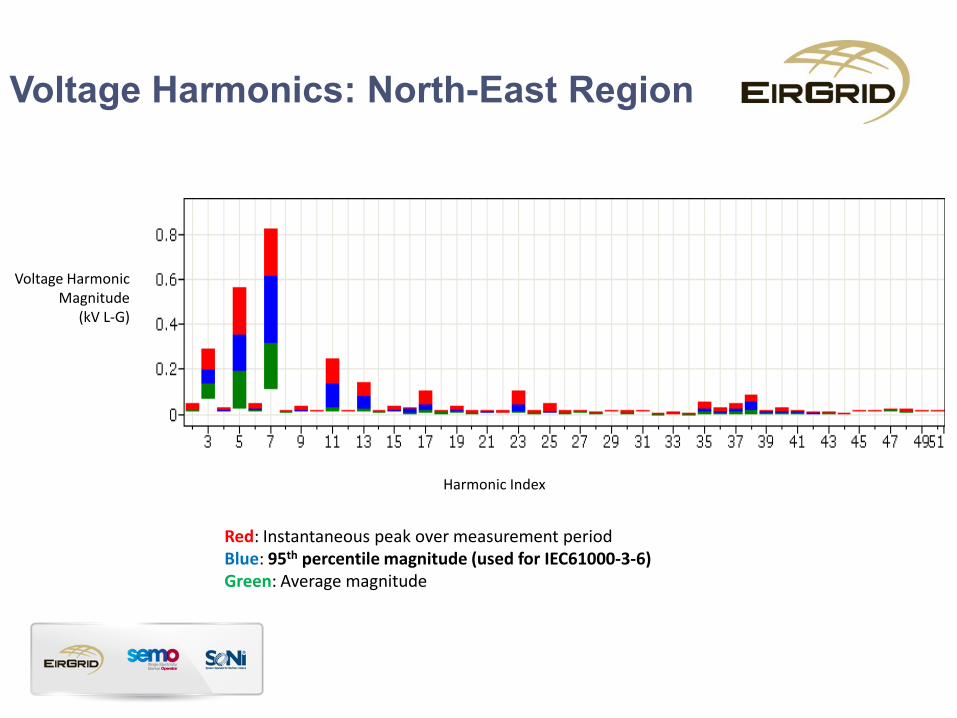
Voltage Harmonics: North-East Region
Harmonic Index
Voltage Harmonic Magnitude
(kV L-G)
Red: Instantaneous peak over measurement period Blue: 95th percentile magnitude (used for IEC61000-3-6) Green: Average magnitude
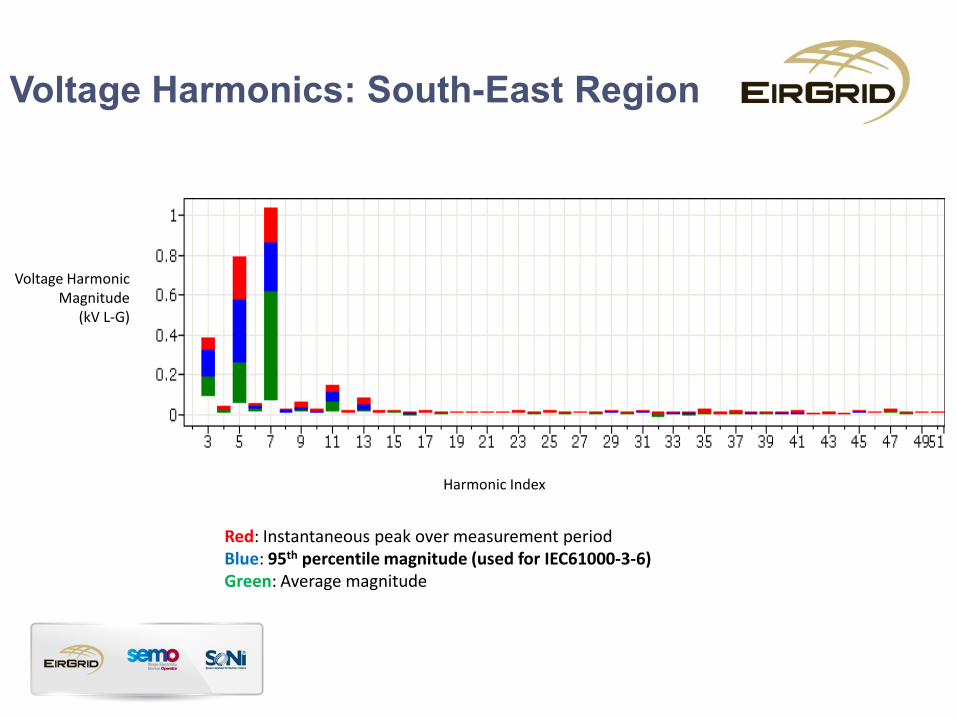
Voltage Harmonics: South-East Region
Harmonic Index
Voltage Harmonic Magnitude
(kV L-G)
Red: Instantaneous peak over measurement period Blue: 95th percentile magnitude (used for IEC61000-3-6) Green: Average magnitude
On-going monitoring
• IEC recommendation to have a DR in place at a suitable
transmission node at least 7 days prior to energisation of
customer site
– i.e. create background readings pre-connection
• DR provides on-going monitoring thereafter

Charging for Harmonics
Marie Hayden
Connection Contracts & Tariffs
21 November 2013
What is Connection Charging
• Recovery of shallow asset capital costs
associated with customer connections.
• Focused on transmission assets required up to
the meshed system.
• Governed by a number of regulatory approved
policy documents which set out high level
principles for the assigning of costs.
Connection Charging: Basics
• Charging is applied on a Least Cost Chargeable
(LCC) basis – charge may not correspond to the
actual build.
• Example Grid West Project: a 220kV line is required to connect Gate 3 wind
and is charged to customers as LCC; Actual build is 400kV to cater for
future needs and TUoS picks up the difference in cost
• Assets not driven exclusively by a given
customer/subgroup are considered “deep” – Example – uprating of meshed transmission system lines
Deep Asset Charging
• Connection Charging Methodology Statement
outlines that a customer will be required to pay
for any additional cost associated with customer
requested connection method which differs from
the LCC, including any additional system costs. – Example – customer requests a change in connection method from
overhead line to underground cable and this drives additional reactive
power support assets to be built
Harmonics issues in a charging context • The requirement to install a transmission
reinforcement (e.g a Filter Bank) to manage a harmonic issues is often driven by use of underground cable
• If use of cable is at customer request then per existing policy the cost of any required reinforcement is chargeable to the customer
• If harmonic solutions are optimised on a geographic basis, are deep in the system and mitigate harmonics for a number of applicants, how do we assign costs?
Upcoming Consultation
• We have existing high level charging principles approved by SEM-Committee that will be interpreted based on the specifics of this issue.
• EirGrid will run a consultation process to gather views on how existing principles should be interpreted
• The resulting approach needs to: – Be fair and proportional.
– Send a signal about the cost that cable requests impose on the system.
– Be relatively simple to apply, not requiring a suite of “charging” power quality studies.

Options being considered

Option 1: Charge for the
technical solution identified
Pros:
– Entirely cost reflective
Cons:
– Would require additional “charging” power quality
studies to determine “drivers” and the extent to which
individual subgroups/applicants are contributing to
optimised solutions
– Extremely complex from a charging & rebating
perspective
Option 2: Apply a Least Cost
approach Example
– Charge for a filter bank at the point of connection to the meshed system where the connection exceeds harmonics limits.
Pros:
– Consistent with the LCC principle, pay for the lowest cost solution to the problem, regardless of what is ultimately installed.
– Clear, transparent and well understood
Cons:
– May not be entirely cost reflective in all cases.
Option 3: Apply a harmonics
levy Proposal
– Apply a levy on all requests for cable regardless of impact on the system.
Pros:
– Reflects that harmonics issues are cumulative
– Clear & transparent, avoids rebating complexity
Cons:
– Customers that request cable in an area of low underlying harmonics pay the same as in high areas
– Not consistent with charging to date
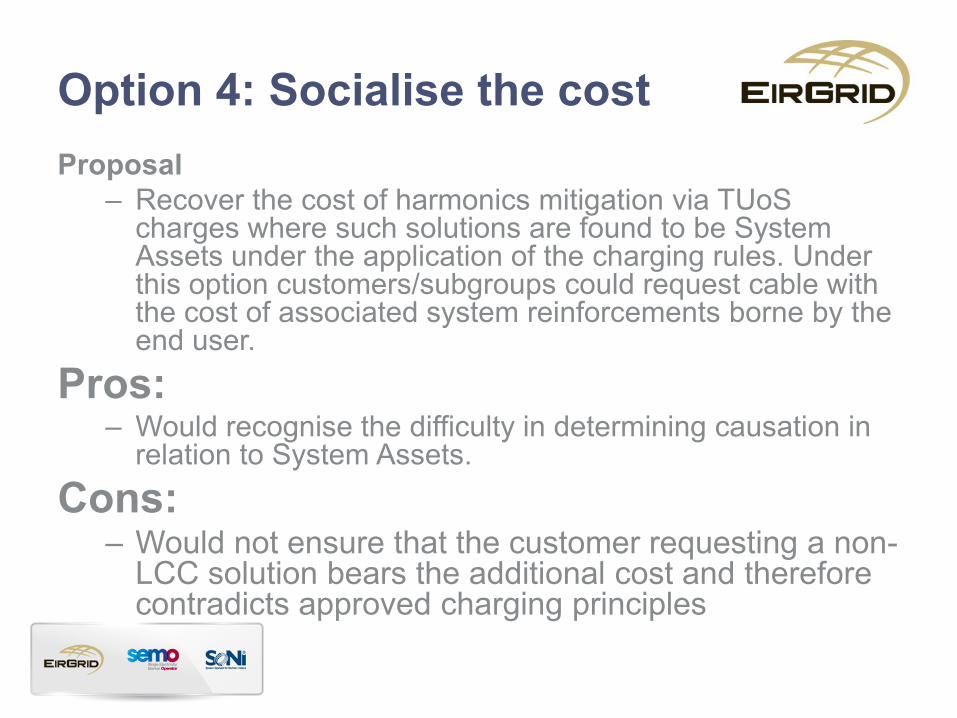
Option 4: Socialise the cost
Proposal
– Recover the cost of harmonics mitigation via TUoS charges where such solutions are found to be System Assets under the application of the charging rules. Under this option customers/subgroups could request cable with the cost of associated system reinforcements borne by the end user.
Pros: – Would recognise the difficulty in determining causation in
relation to System Assets.
Cons: – Would not ensure that the customer requesting a non-
LCC solution bears the additional cost and therefore contradicts approved charging principles
Next steps
• A consultation paper will be published for
industry comment
• Timelines
– Aiming to publish by 1st week in December
– Regulatory review and approval by Q1 2014


Programme Update and Customer
Communications
Brendan Kelly
Transmission Access Planning
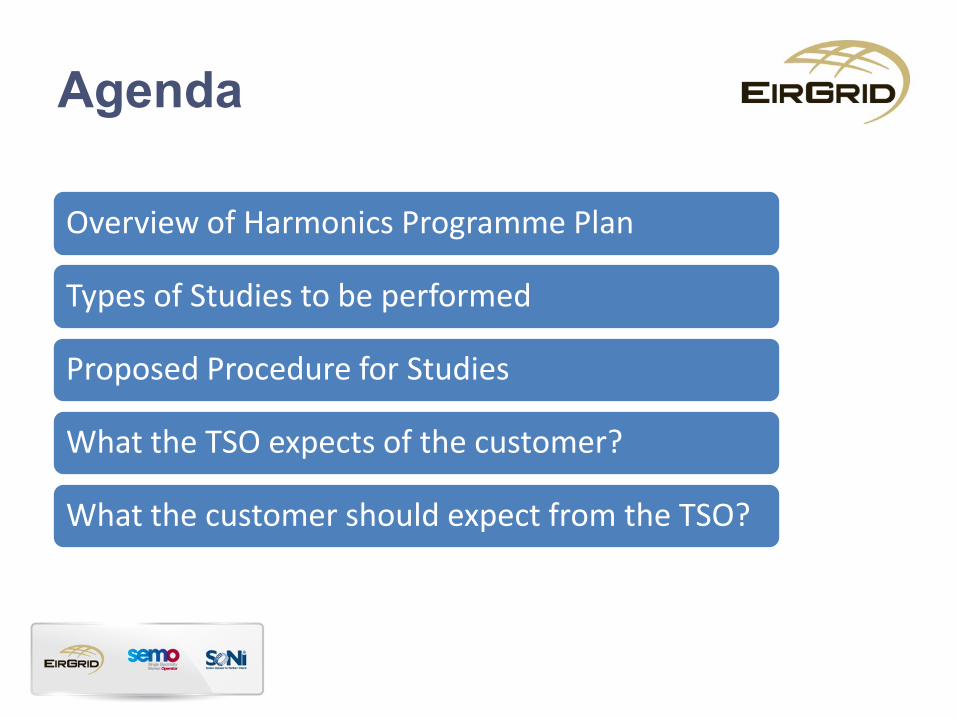
Agenda
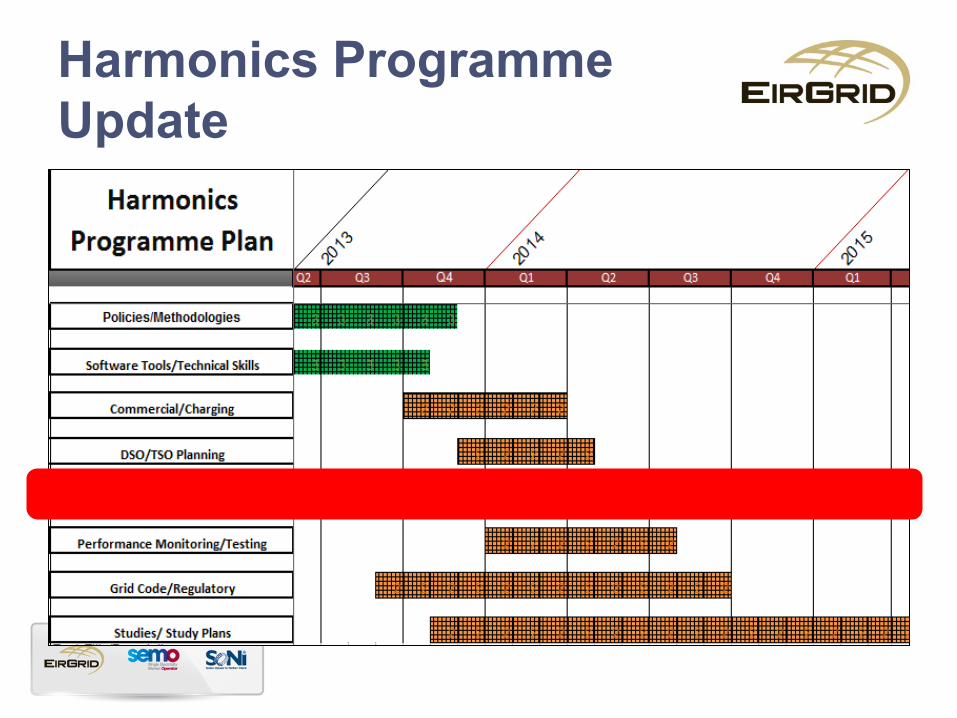
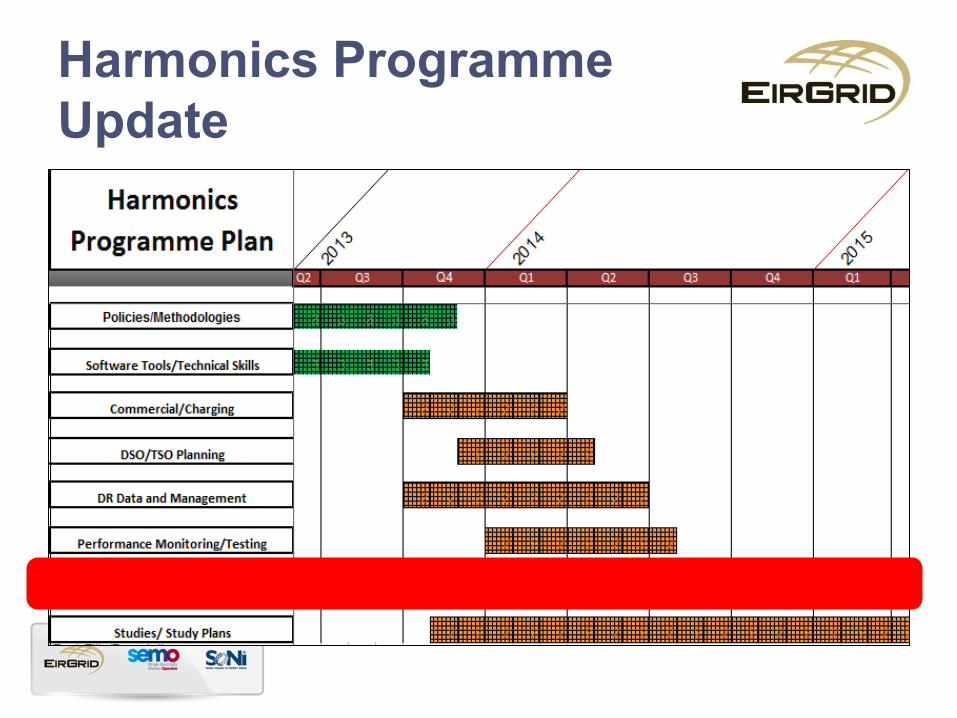
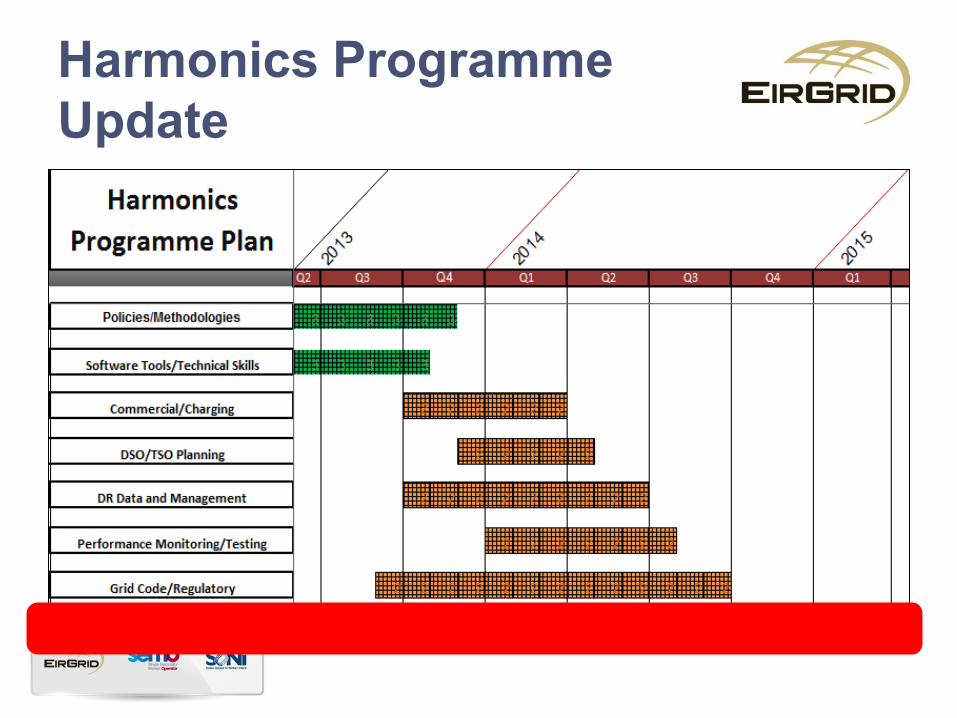
Overview of Harmonics Programme Plan
Types of Studies to be performed
Proposed Procedure for Studies
What the TSO expects of the customer?
What the customer should expect from the TSO?
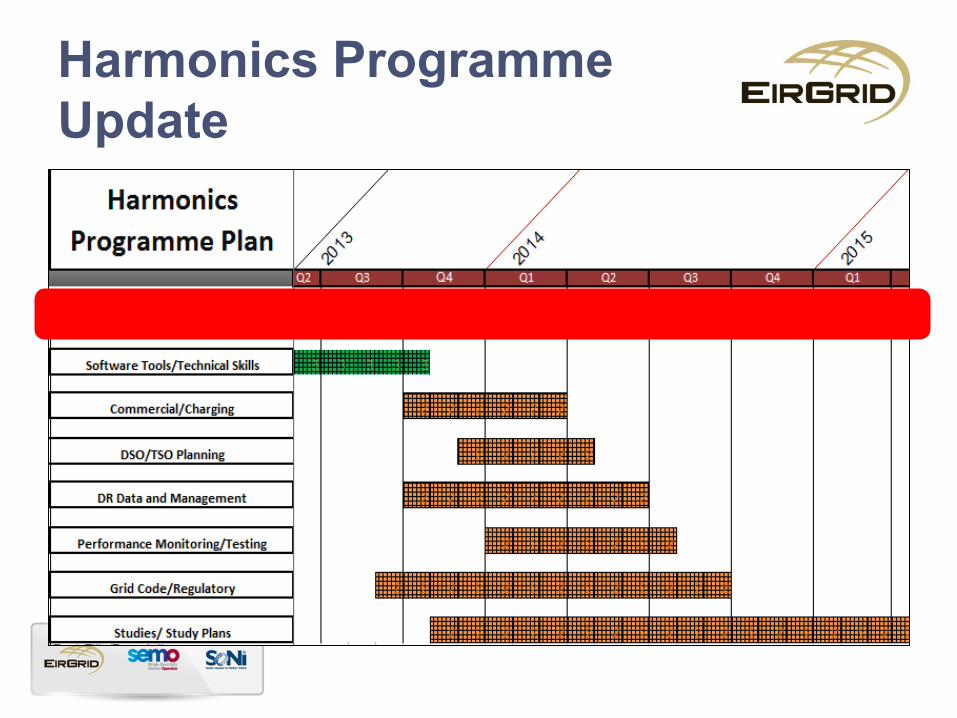
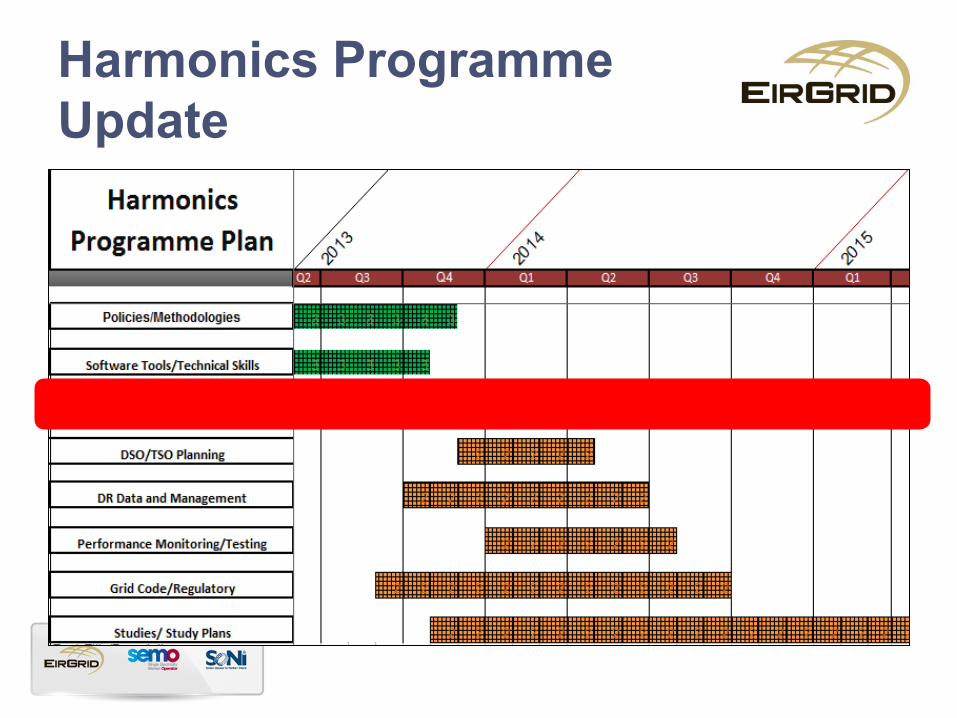
Harmonics Programme
Update

Harmonics Programme
Update
Software Tools/Technical
Skills
• Software tools – PowerFactory Software Package chosen
– Advanced Training Course on Harmonics Studies
– Tools Created for Determining Voltage Harmonics Limits
• Technical Up-skilling – Liaised with other TSO’s, e.g Energinet DK, National Grid
– Discussions with Industry Experts
– Reviewing Technical Papers and Documentation
Harmonics Programme
Update
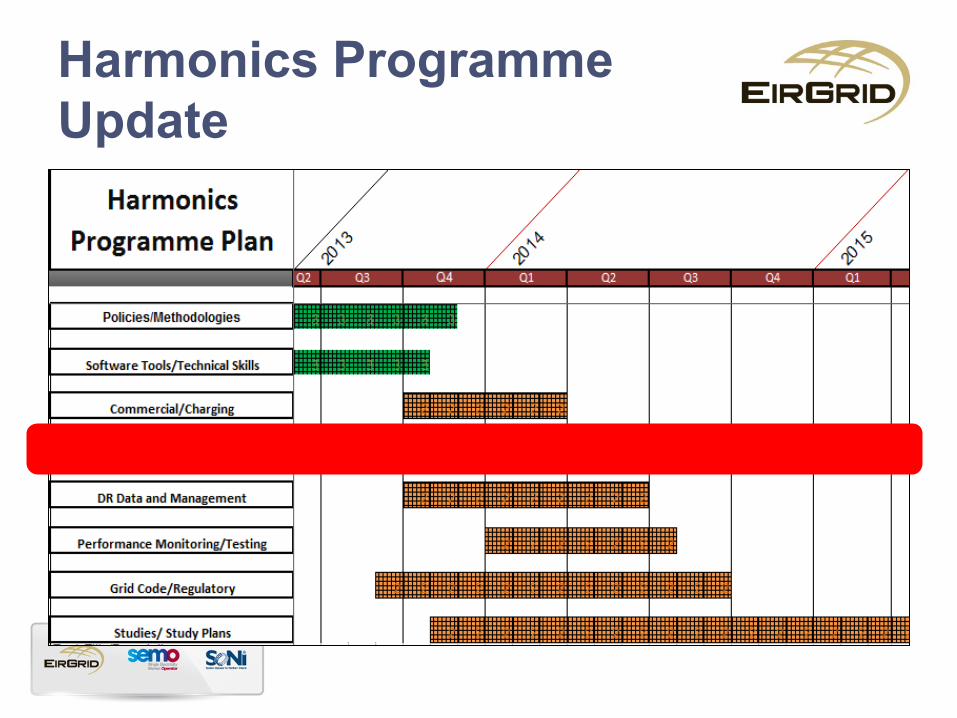
Harmonics Programme
Update
DSO/TSO Planning
• Sharing Measured VHD Data
• Agree Means of Issuing Limits
• Study Methodologies/Policy
• Alignment of Distribution Code and Grid Code
Modifications
Harmonics Programme
Update
Disturbance Recorder (DR) Data
and Data Management
• Roll out of more Disturbance Recorders over
next 12 months – Portable Disturbance Recorders which can be installed at short notice
• Aid in Validation of Network Model – Measurements in reality are replicated in the Network Model
• Review existing Disturbance Recorder Data on
an ongoing basis

Harmonics Programme
Update
Performance Monitoring
and Testing
• Test compliance with the Voltage Harmonic
Distortion Limits supplied
• All TSO connections will be tested
• Rules set and Procedures for Grid Code Testing
and Performance Monitoring to be reviewed
over the coming months – At present, Voltage Harmonic Distortion (VHD) levels monitored on ongoing
basis
Harmonics Programme
Update
Grid Code/Regulatory
• Presented at Grid Code Review Panel (Ireland)
• To set up All Island Grid Code Working Group on
Harmonics – Raised at Joint Grid Code Review Panel on 4th December
– Looking for input from the industry
– Kick off in the new year
– With aim of progressing modification to Grid Code(s) in relation to
Harmonics
• Align with European Network Codes
Harmonics Programme
Update

Study Plans
• Two stages to the studies that will be performed
by the TSO
Stage 1: Ensure Voltage Harmonic Distortion (VHD) within Planning
Levels (customers shallow connection only and formal application to
be submitted through Offer Process)
Stage 2: Allocation of VHD Limits to Customers(including VHD
allocation at TSO/DSO interface)
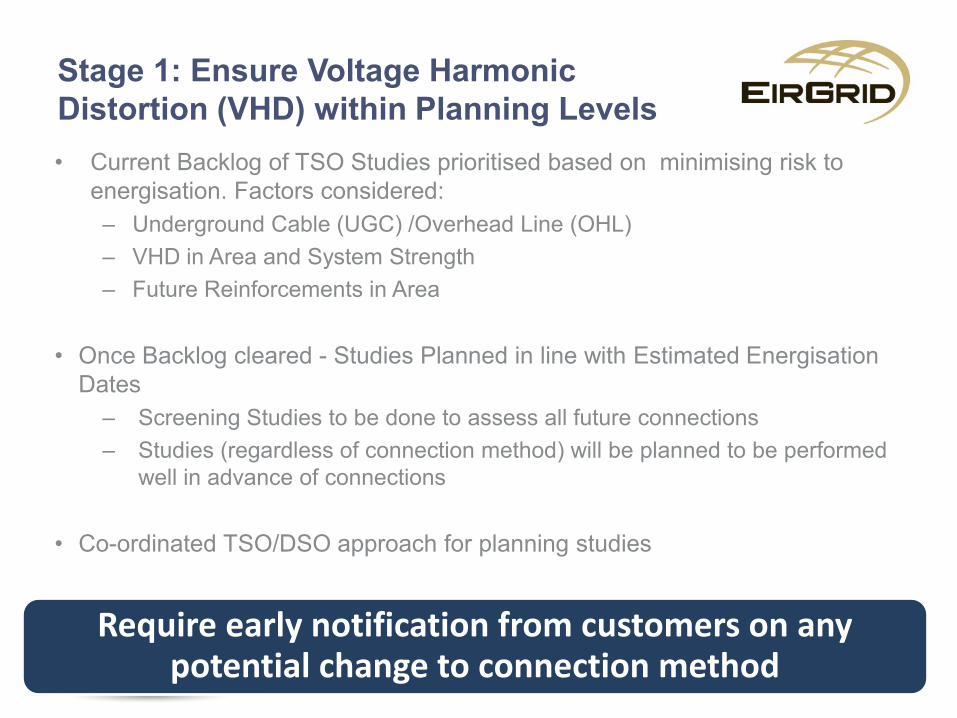
Stage 1: Ensure Voltage Harmonic
Distortion (VHD) within Planning Levels
• Current Backlog of TSO Studies prioritised based on minimising risk to
energisation. Factors considered:
– Underground Cable (UGC) /Overhead Line (OHL)
– VHD in Area and System Strength
– Future Reinforcements in Area
• Once Backlog cleared - Studies Planned in line with Estimated Energisation
Dates
– Screening Studies to be done to assess all future connections
– Studies (regardless of connection method) will be planned to be performed
well in advance of connections
• Co-ordinated TSO/DSO approach for planning studies
Require early notification from customers on any potential change to connection method

Proposed Timelines for Stage 1
Studies
• Context – Customer informed on results/requirements well in advance of connection
– Customer Agreed timelines of 12 months to provide TSO with PED
– Customer Connection Dates as advised by Customer/Grid Development/DSO
Proposal: Customer to notify SO of change to
connection method (UGC) at least 24 months prior to connection
TSO to meet and discuss options for Customers connecting in intervening period
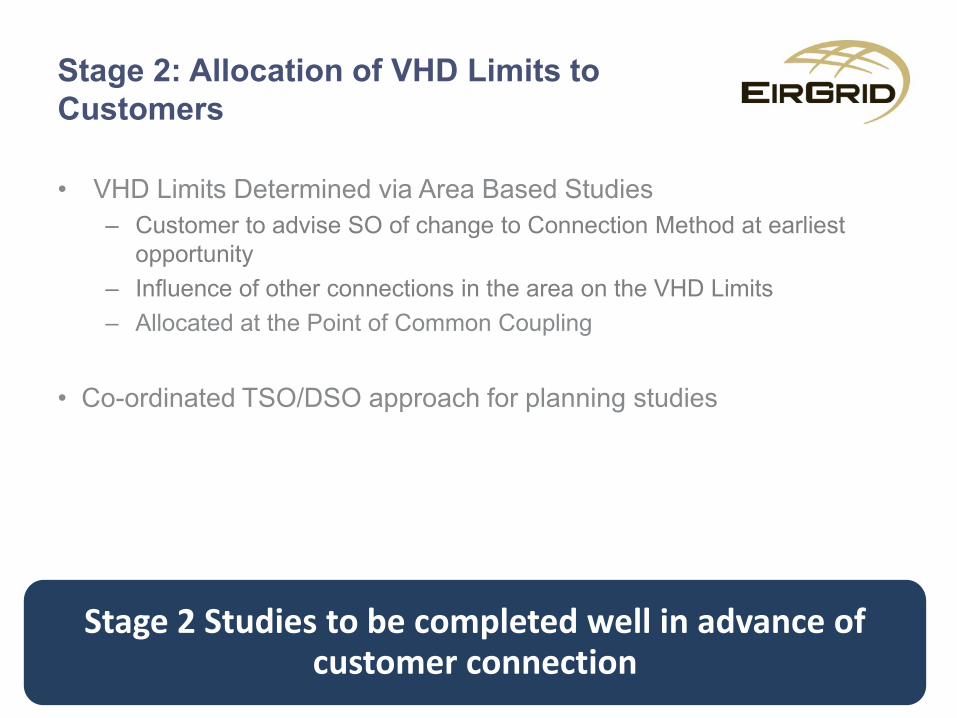
Stage 2: Allocation of VHD Limits to
Customers
• VHD Limits Determined via Area Based Studies
– Customer to advise SO of change to Connection Method at earliest
opportunity
– Influence of other connections in the area on the VHD Limits
– Allocated at the Point of Common Coupling
• Co-ordinated TSO/DSO approach for planning studies
Stage 2 Studies to be completed well in advance of customer connection
Proposed Timelines for Stage 2
Studies
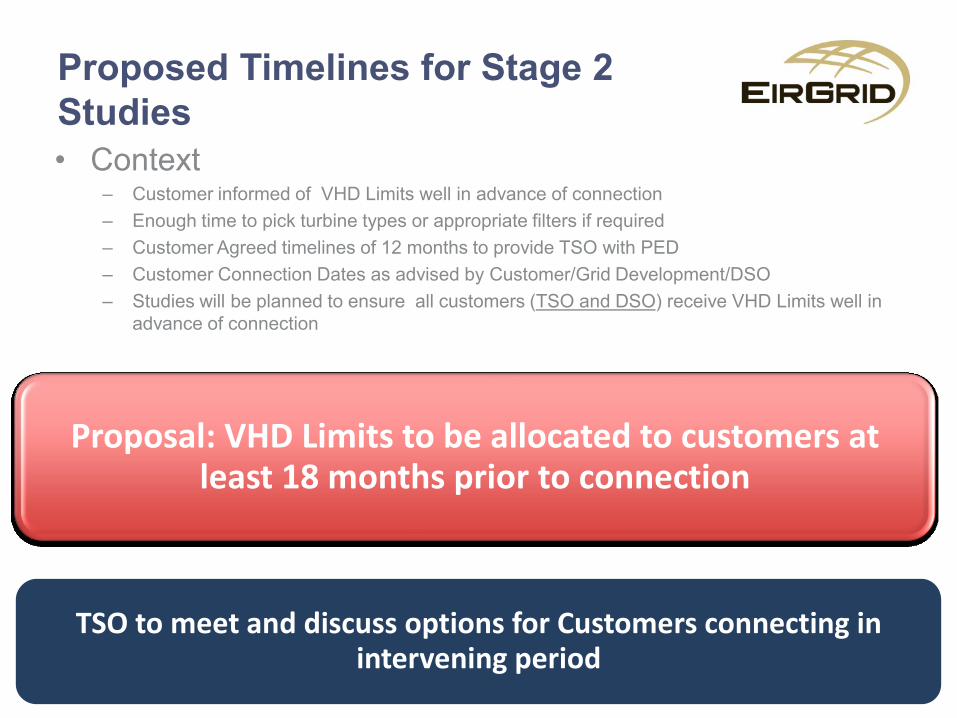
• Context – Customer informed of VHD Limits well in advance of connection
– Enough time to pick turbine types or appropriate filters if required
– Customer Agreed timelines of 12 months to provide TSO with PED
– Customer Connection Dates as advised by Customer/Grid Development/DSO
– Studies will be planned to ensure all customers (TSO and DSO) receive VHD Limits well in
advance of connection
Proposal: VHD Limits to be allocated to customers at
least 18 months prior to connection
TSO to meet and discuss options for Customers connecting in intervening period
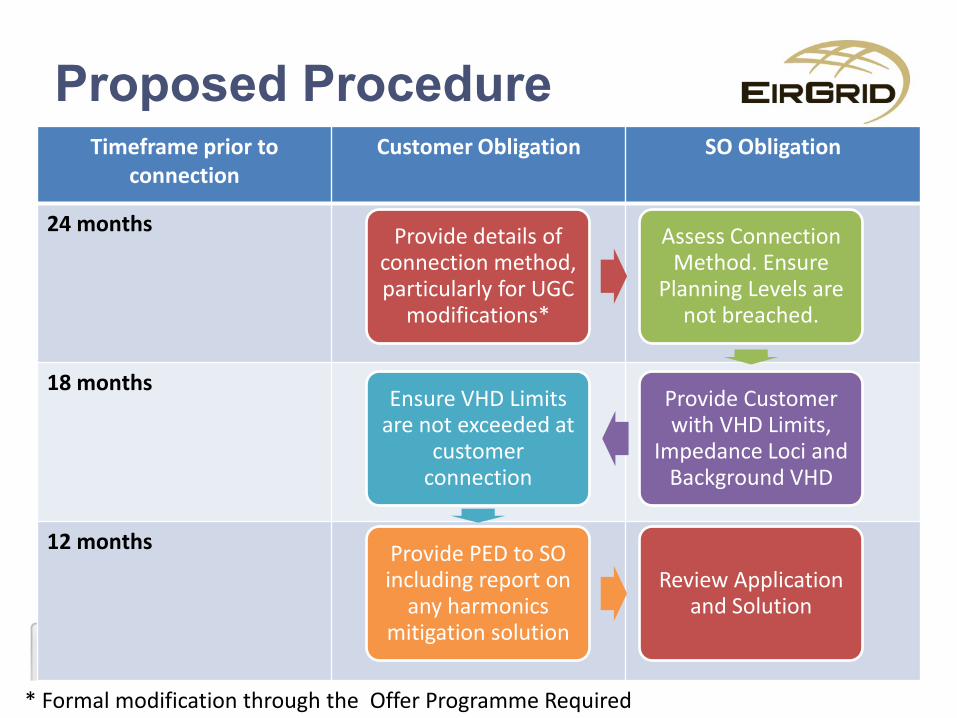
Timeframe prior to connection
Customer Obligation SO Obligation
24 months
18 months
12 months
Proposed Procedure
Provide details of connection method, particularly for UGC
modifications*
Assess Connection Method. Ensure
Planning Levels are not breached.
Provide Customer with VHD Limits,
Impedance Loci and Background VHD
Ensure VHD Limits are not exceeded at
customer connection
Provide PED to SO including report on
any harmonics mitigation solution
Review Application and Solution
* Formal modification through the Offer Programme Required
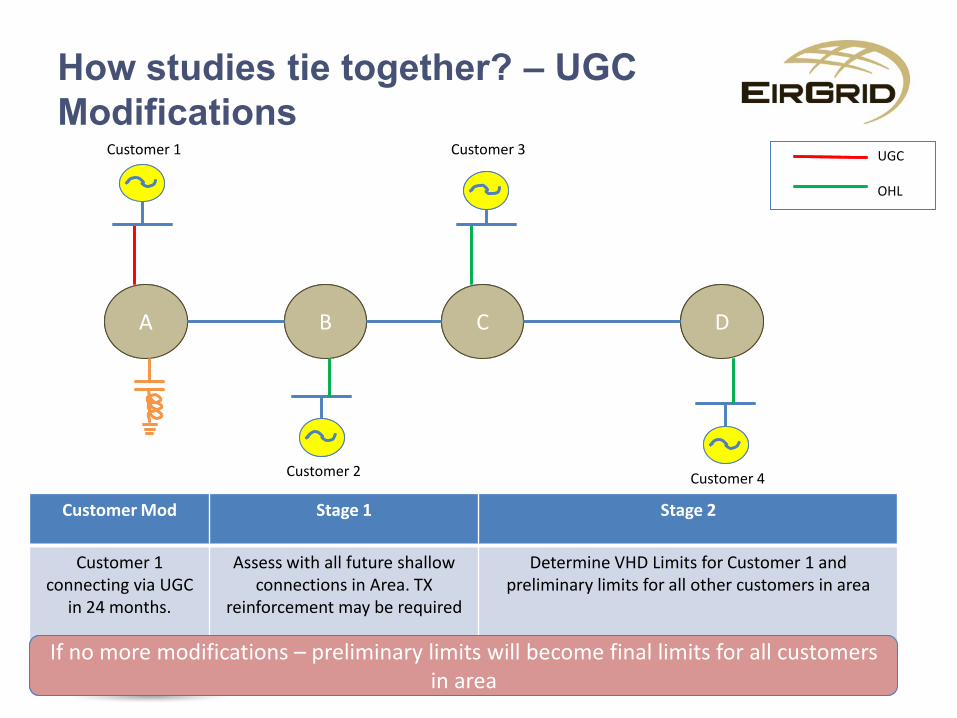
How studies tie together? – UGC
Modifications
B C A D
Customer 1
Customer 2
Customer 3
Customer 4
Customer Mod Stage 1 Stage 2
Customer 1 connecting via UGC
in 24 months.
Assess with all future shallow connections in Area. TX
reinforcement may be required
Determine VHD Limits for Customer 1 and preliminary limits for all other customers in area
If no more modifications – preliminary limits will become final limits for all customers If no more modifications – preliminary limits will become final limits for all customers in area
UGC OHL
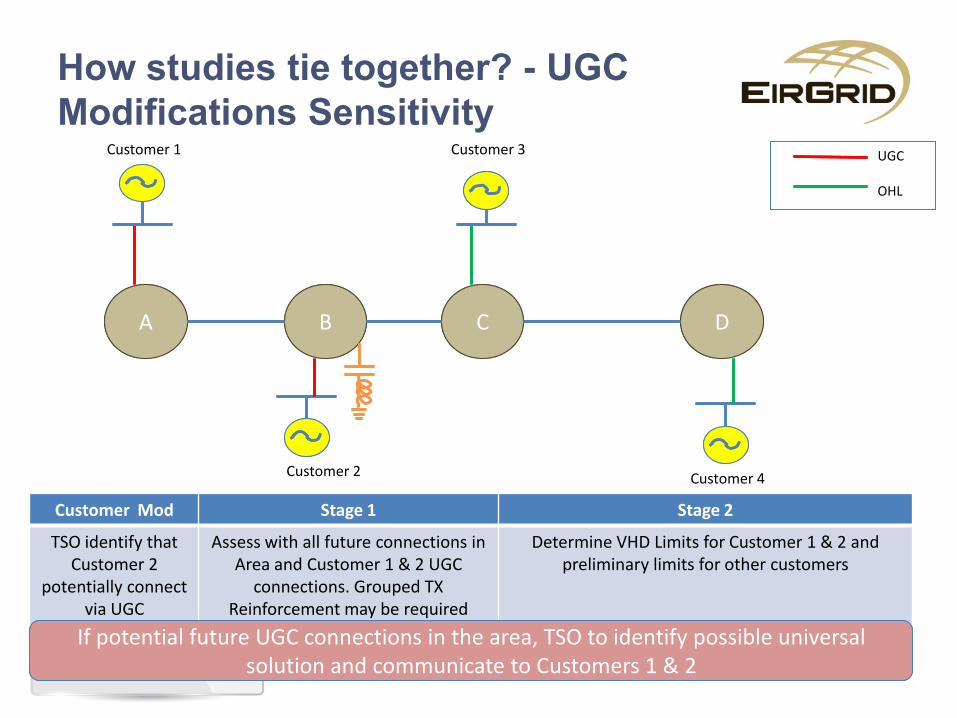
How studies tie together? - UGC
Modifications Sensitivity
B C A D
Customer 1
Customer 2
Customer 3
Customer 4
UGC OHL
Customer Mod Stage 1 Stage 2
TSO identify that Customer 2
potentially connect via UGC
Assess with all future connections in Area and Customer 1 & 2 UGC
connections. Grouped TX Reinforcement may be required
Determine VHD Limits for Customer 1 & 2 and preliminary limits for other customers
If potential future UGC connections in the area, TSO to identify possible universal If potential future UGC connections in the area, TSO to identify possible universal solution and communicate to Customers 1 & 2
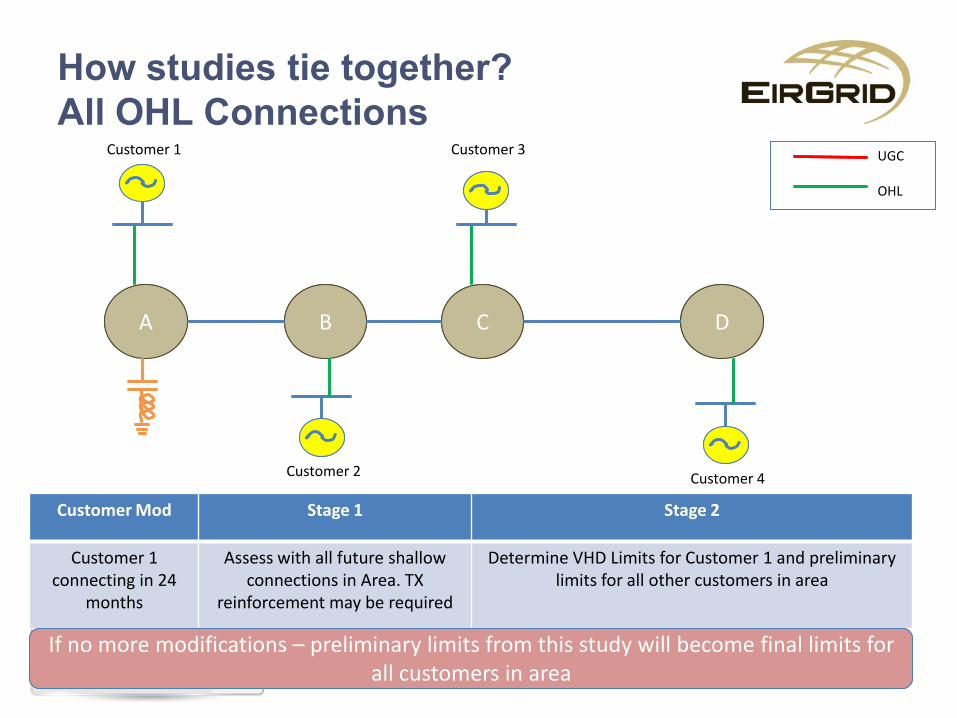
How studies tie together?
All OHL Connections
B C A D
Customer 1
Customer 2
Customer 3
Customer 4
UGC OHL
Customer Mod Stage 1 Stage 2
Customer 1 connecting in 24
months
Assess with all future shallow connections in Area. TX
reinforcement may be required
Determine VHD Limits for Customer 1 and preliminary limits for all other customers in area
If no more modifications – preliminary limits from this study will become final limits for If no more modifications – preliminary limits from this study will become final limits for all customers in area
What customers will receive?
1. Incremental VHD limit
2. Network Impedance Loci for each Harmonic Order
3. Background VHD at the connecting Node
4. A document outlining the modelling assumptions
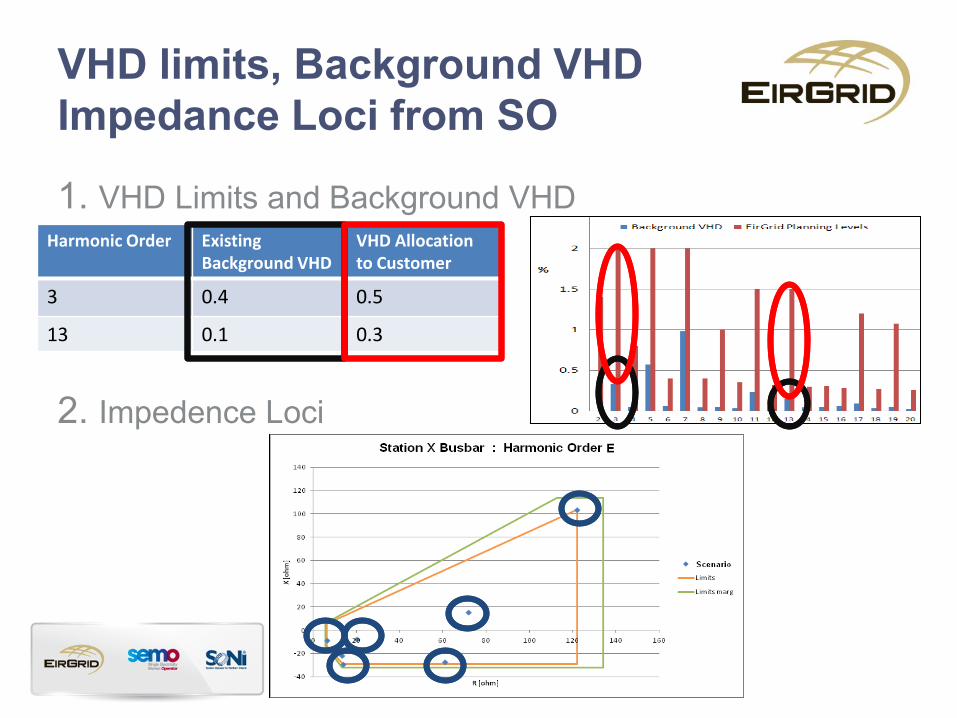
VHD limits, Background VHD
Impedance Loci from SO
1. VHD Limits and Background VHD
2. Impedence Loci
Harmonic Order Existing Background VHD
VHD Allocation to Customer
3 0.4 0.5
13 0.1 0.3
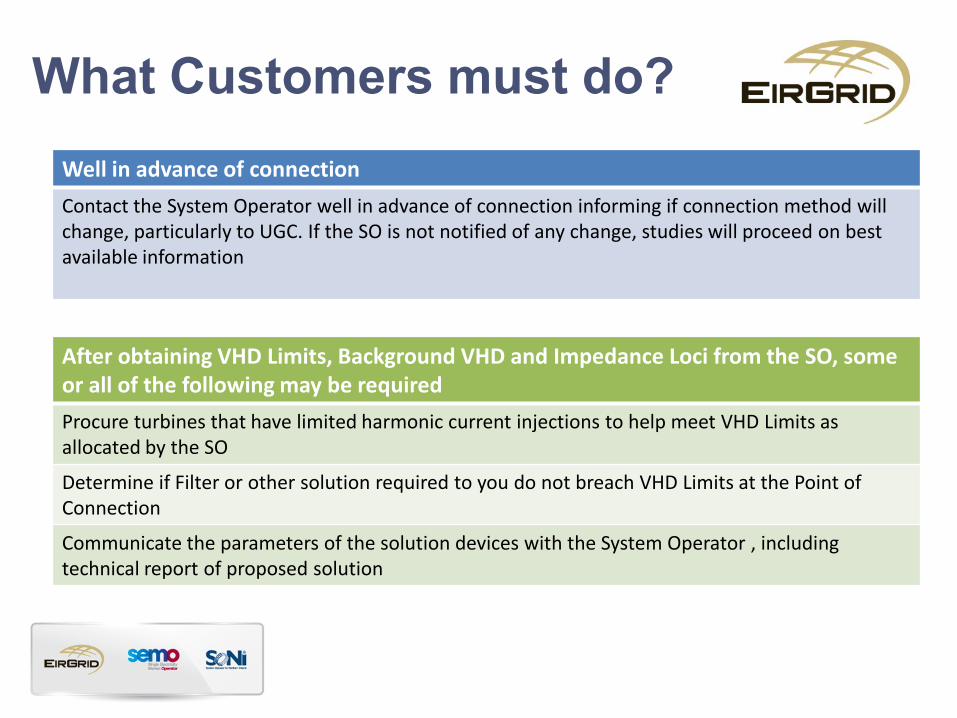
What Customers must do?
Well in advance of connection
Contact the System Operator well in advance of connection informing if connection method will change, particularly to UGC. If the SO is not notified of any change, studies will proceed on best available information
After obtaining VHD Limits, Background VHD and Impedance Loci from the SO, some or all of the following may be required
Procure turbines that have limited harmonic current injections to help meet VHD Limits as allocated by the SO
Determine if Filter or other solution required to you do not breach VHD Limits at the Point of Connection
Communicate the parameters of the solution devices with the System Operator , including technical report of proposed solution
Please forward any queries related to
harmonics to the following email address