Embed Size (px)
Citation preview
Harnessing EHR Data for Local Population Health Monitoring
July 12, 2018
Sara Schmitt, Director of Community Health Policy, Colorado Health InstituteKate Horle, Chief Operating Officer, CORHIO
1

Agenda
2
• Why data is important for population health improvement• Introduction to CHORDS and how it works• Governance structure• Why EHR data• Challenges and solutions• Data queries and outcomes • What we learned, how other communities can duplicate
Key Takeaways and Findings
3
A geography-based shared research and public health surveillance infrastructure contributes to a robust understanding of local population health.
CHORDS is a unique distributed data network in Colorado.
Governance structures enable effective access to data for data users and reliability for data partners.
A distributed data network can function as a secure space for providers to make their data available to other clinical and public health stakeholders and it creates some technical challenges.
Data and Population Health
• Real-time feedback to understand population health issues• Identify trends• Evaluate interventions• Explore and act on disparities• Make policy impacts
4
Real-Time Public Health Research
5
CHORDS is a distributed data network (DDN) conceived in 2011 that uses
electronic health record (EHR) data to support public health evaluation, monitoring and research efforts.
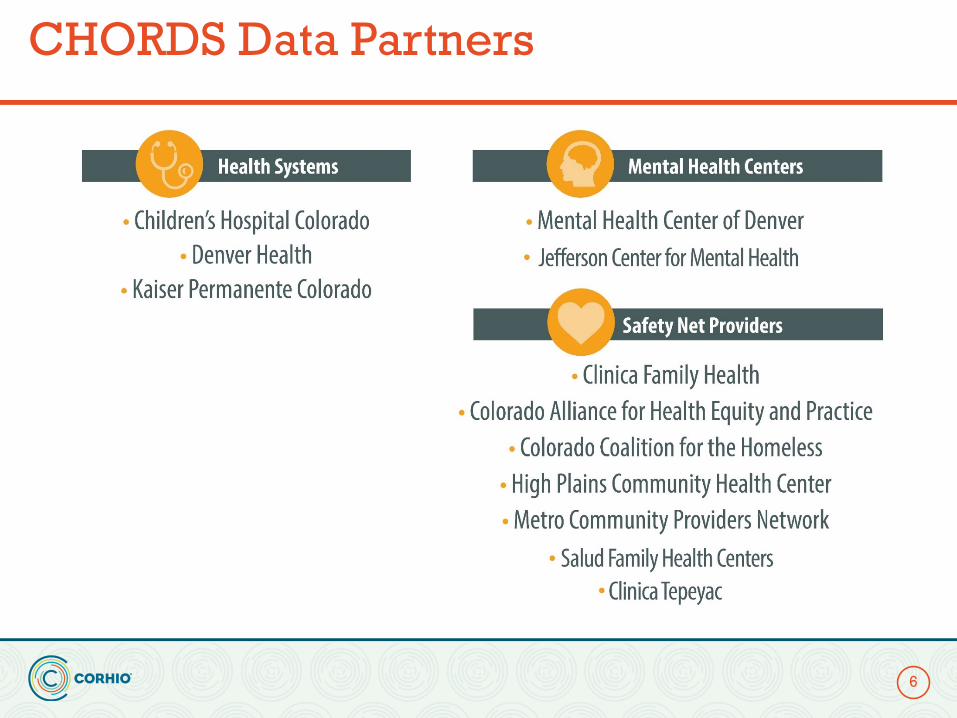
CHORDS Data Partners
6
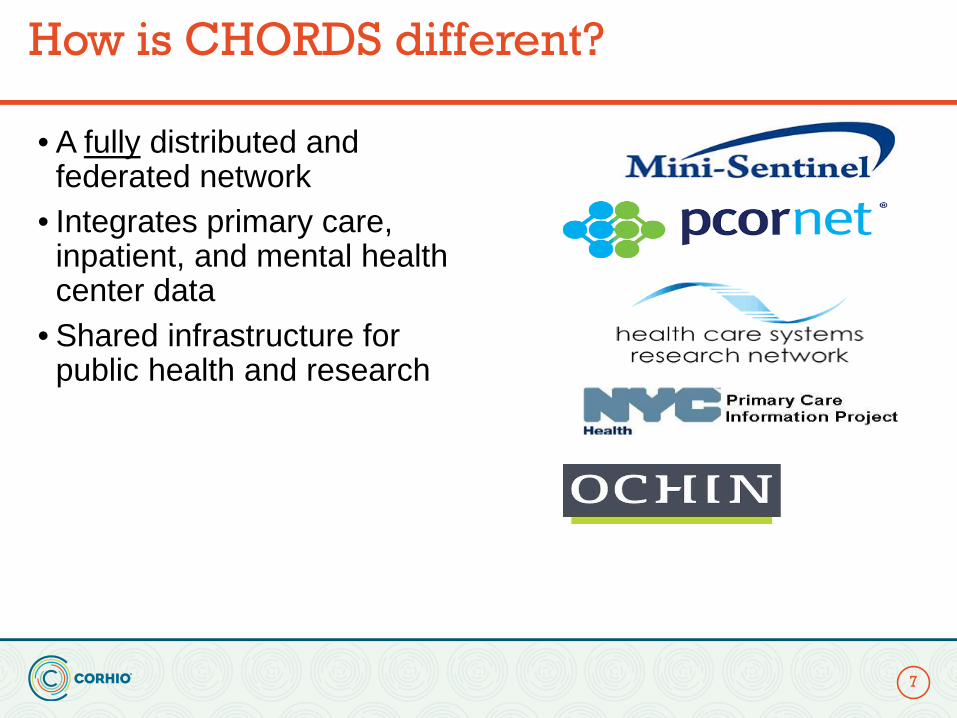
How is CHORDS different?
7
• A fully distributed and federated network
• Integrates primary care, inpatient, and mental health center data
• Shared infrastructure for public health and research
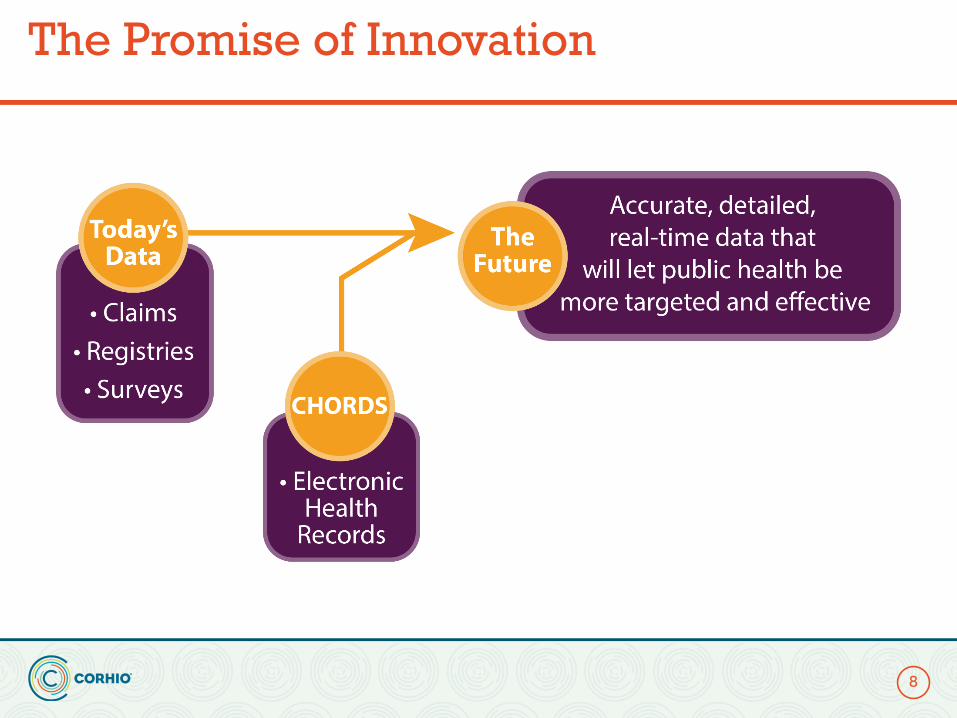
The Promise of Innovation
8
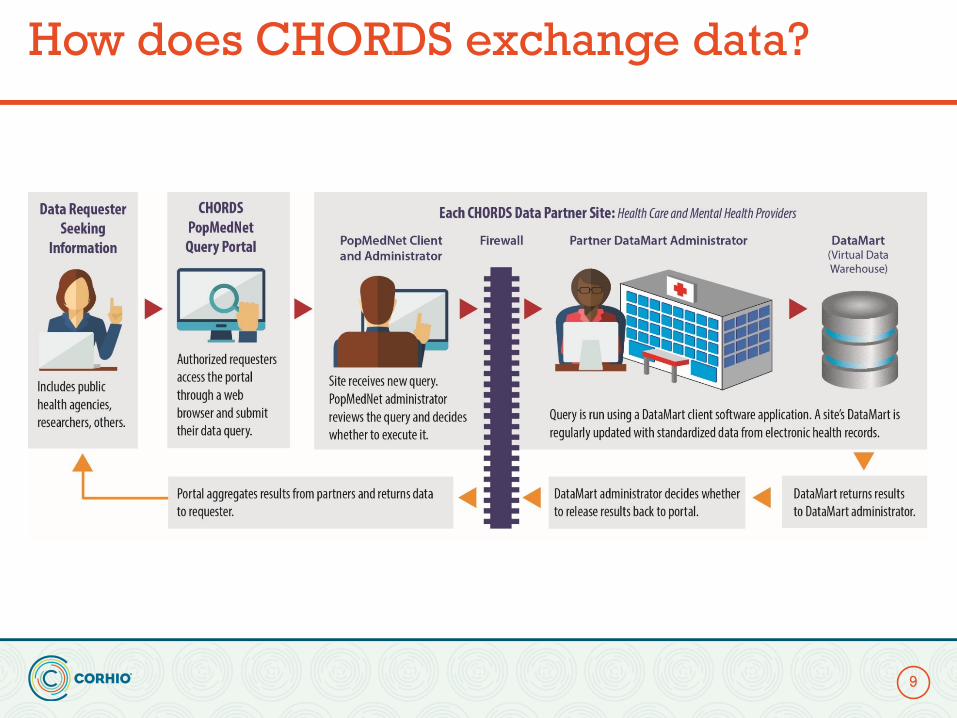
How does CHORDS exchange data?
9
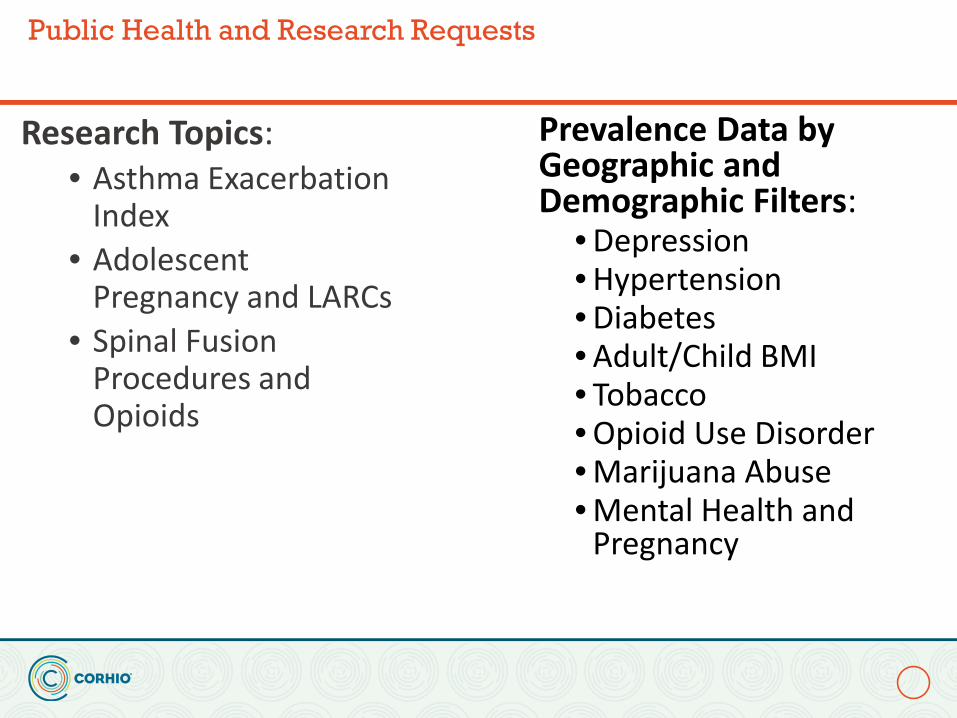
Public Health and Research Requests
Prevalence Data by Geographic and Demographic Filters:
• Depression• Hypertension• Diabetes• Adult/Child BMI• Tobacco• Opioid Use Disorder• Marijuana Abuse• Mental Health and
Pregnancy
Research Topics:• Asthma Exacerbation
Index• Adolescent
Pregnancy and LARCs• Spinal Fusion
Procedures and Opioids
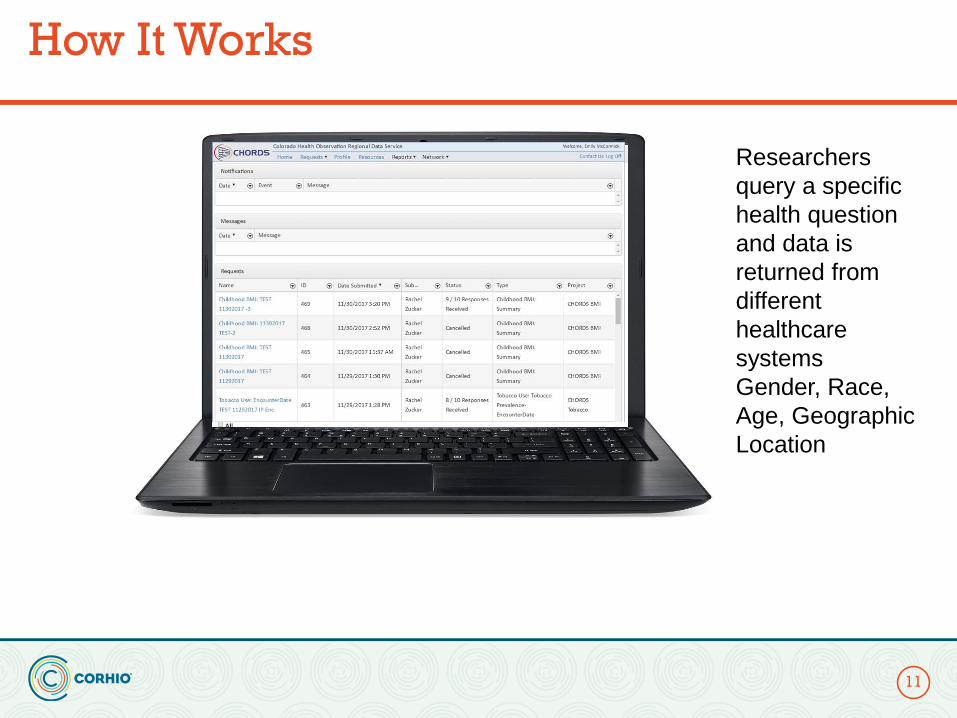
How It Works
11
Researchers query a specific health question and data is returned from different healthcare systemsGender, Race, Age, Geographic Location
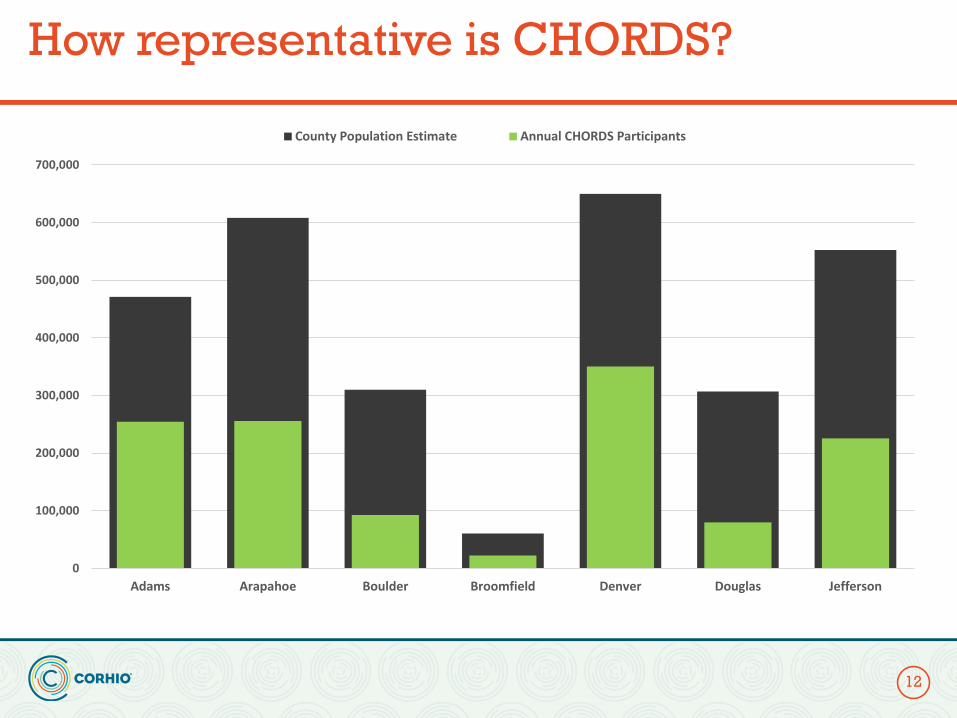
How representative is CHORDS?
12
0
100,000
200,000
300,000
400,000
500,000
600,000
700,000
Adams Arapahoe Boulder Broomfield Denver Douglas Jefferson
County Population Estimate Annual CHORDS Participants
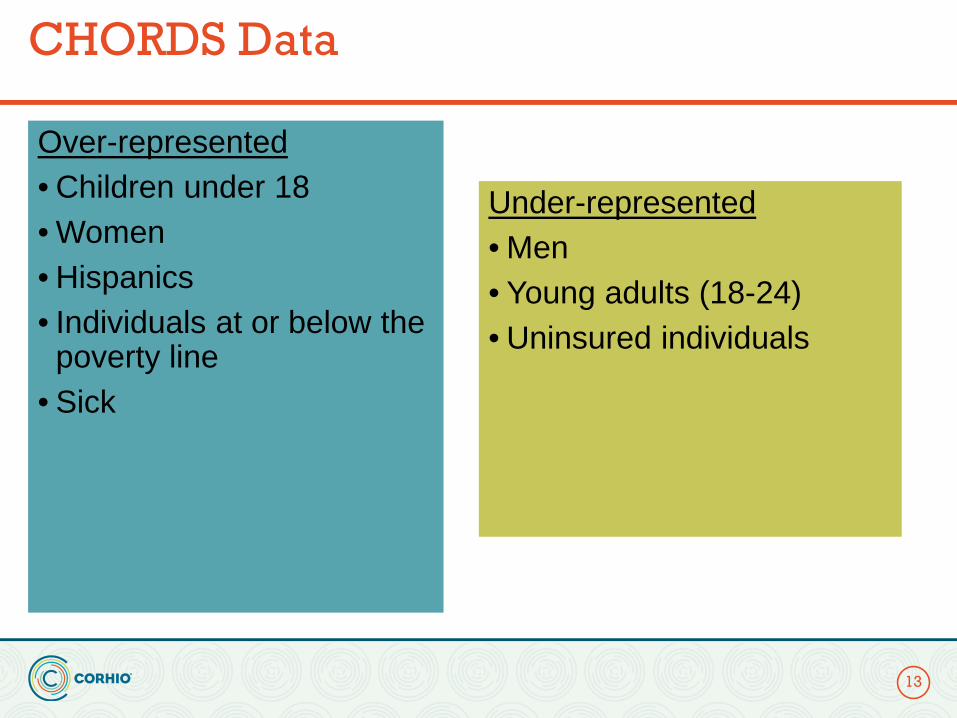
CHORDS Data
13
Over-represented• Children under 18• Women• Hispanics• Individuals at or below the
poverty line• Sick
Under-represented• Men• Young adults (18-24)• Uninsured individuals
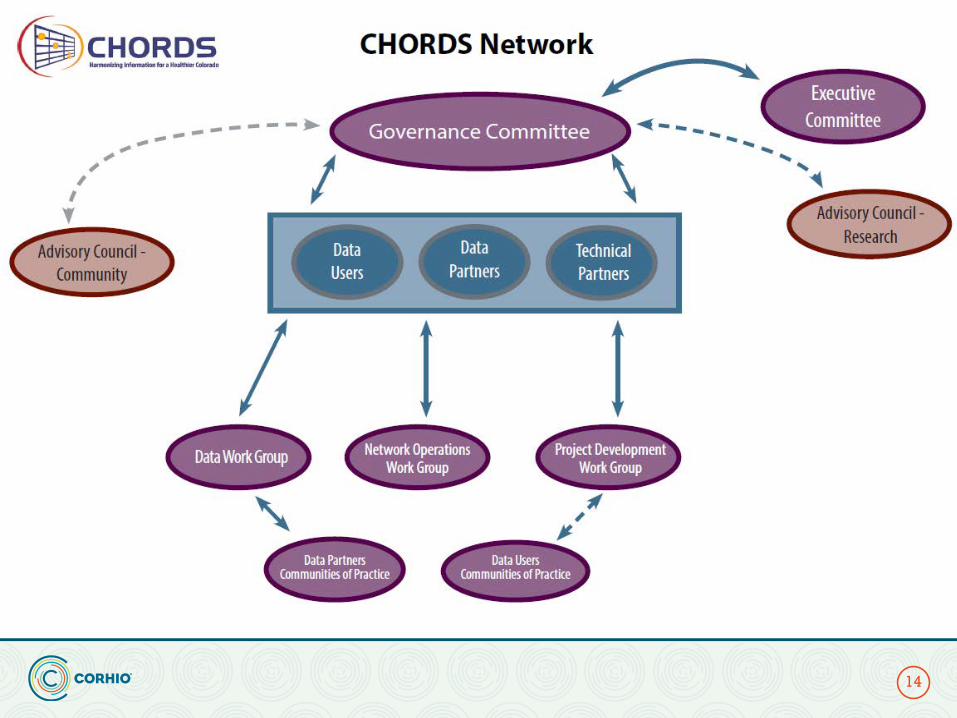
CHORDS Network
14
Governance BoardData Partners:Healthcare and
Mental Health Providers
Work Groups Advisory Councils
Data Users: Metro Denver
Public Health Agencies
Executive Committee
Convener: Colorado Health Institute

GovernanceGuiding Principles: The CHORDS Governance Committee
15
• Establish, document and conduct transparent decision-making processes
• Facilitate priority high-quality monitoring, evaluation and health improvement activities
• Identify and address new governance issues as necessary
GovernanceData Partners and Data Users
Data Partners will:
• Retain organizational autonomy in providing access to their data• Provide efficient stewardship of site and network data by leveraging resources• Engender collaborative citizenship and leadership within CHORDS• Strengthen and ensure compliance with site-specific, local, state and federal
policies and regulations
Data Users will:
• Adhere to responsibilities for data access and use • Enhance evidence-based health care and public health practice• Foster innovative methods • Assess population measures and discover generalizable knowledge for the public
domain• Encompass diverse perspectives: patient-centered, population-based, provider
and health care delivery systems• Maintain participating data partner confidentiality
16
Why EHR data?
17
Can be accessed in a timely mannerMay be used for repeated cross-sectional or longitudinal analysisAnd most importantly…the data are geo-locatable
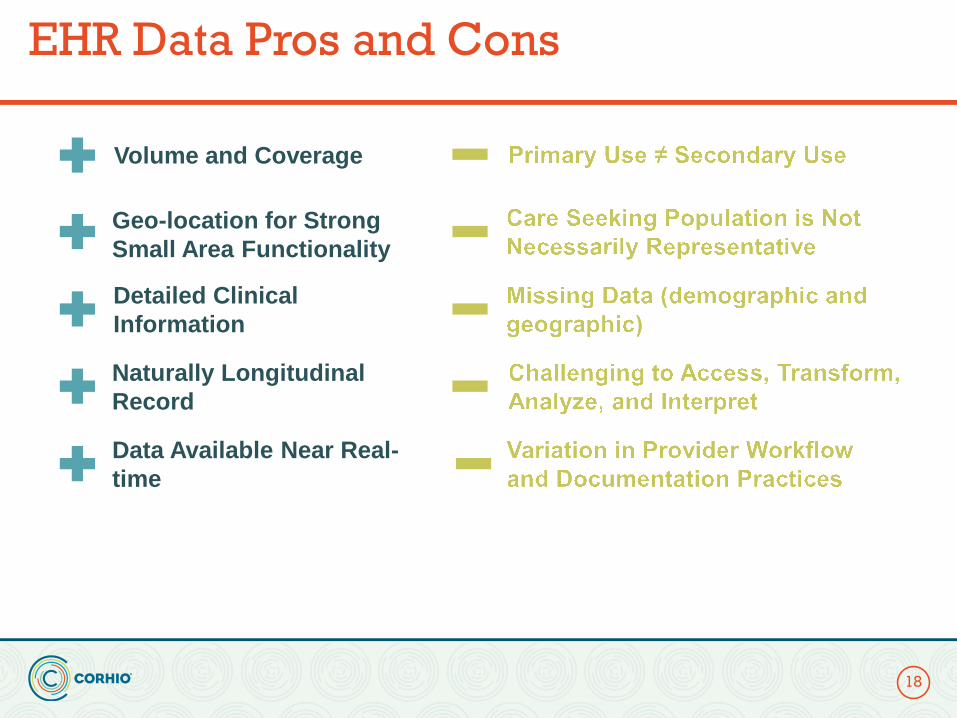
EHR Data Pros and Cons
18
Volume and Coverage
Geo-location for Strong Small Area Functionality
Detailed Clinical Information
Naturally Longitudinal Record
Data Available Near Real-time
Challenges
• Recruiting busy healthcare orgs was challenging• Healthcare providers have varied levels of technical expertise• Combining data can introduce duplicates and bias• Population Health stakeholders ≠ Health IT stakeholders • Difficult to maintain open source software• Interpreting EHR data at a population level is novel
19
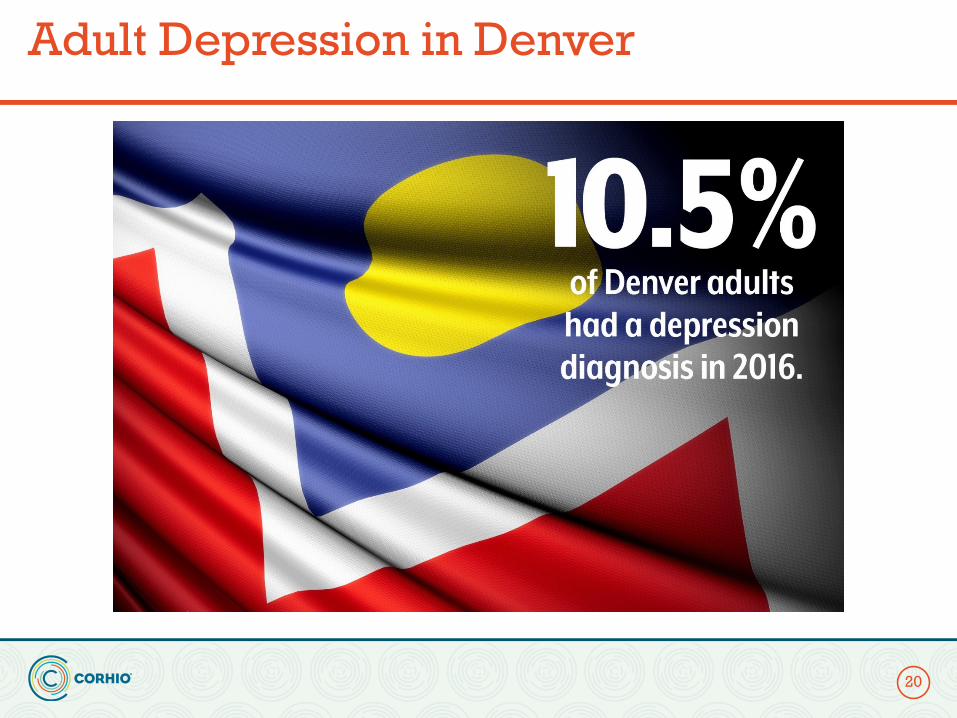
Adult Depression in Denver
20
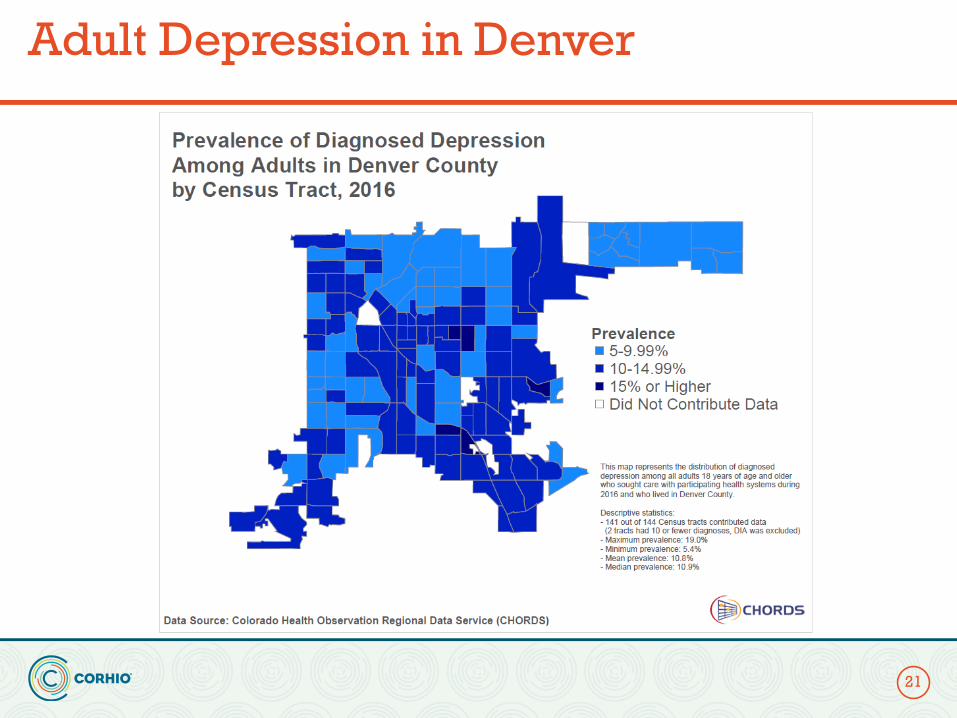
Adult Depression in Denver
21
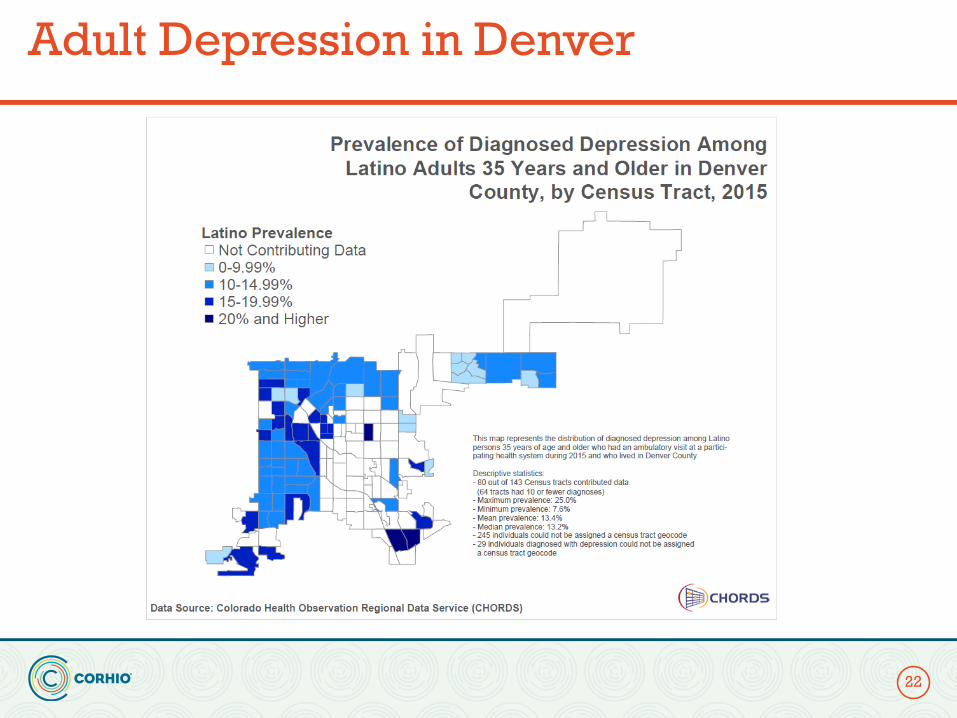
Adult Depression in Denver
22
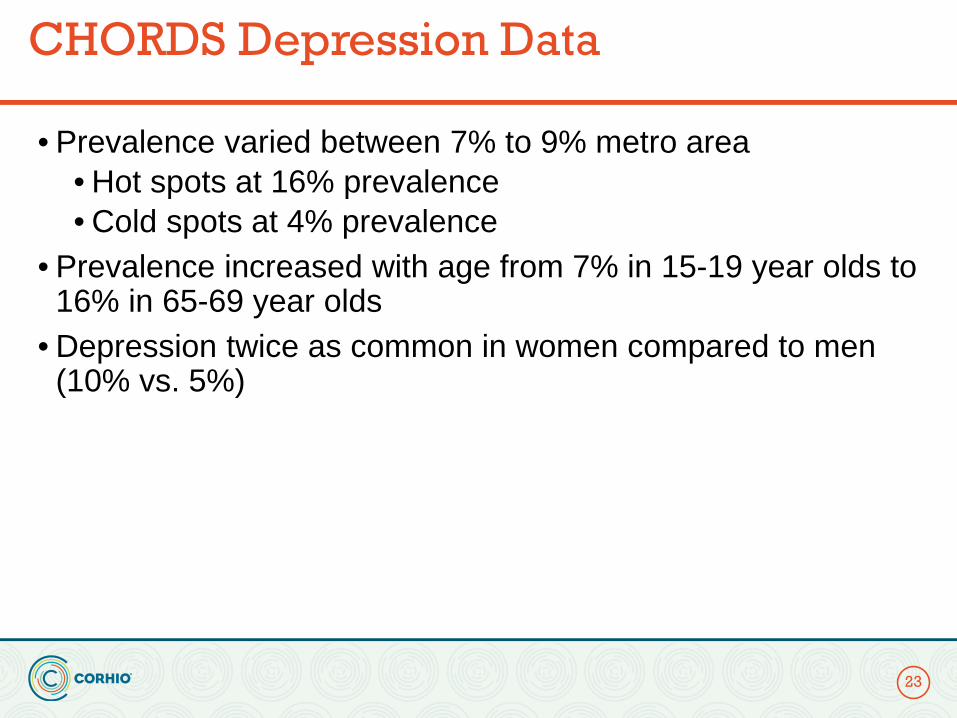
CHORDS Depression Data
• Prevalence varied between 7% to 9% metro area• Hot spots at 16% prevalence• Cold spots at 4% prevalence
• Prevalence increased with age from 7% in 15-19 year olds to 16% in 65-69 year olds
• Depression twice as common in women compared to men (10% vs. 5%)
23
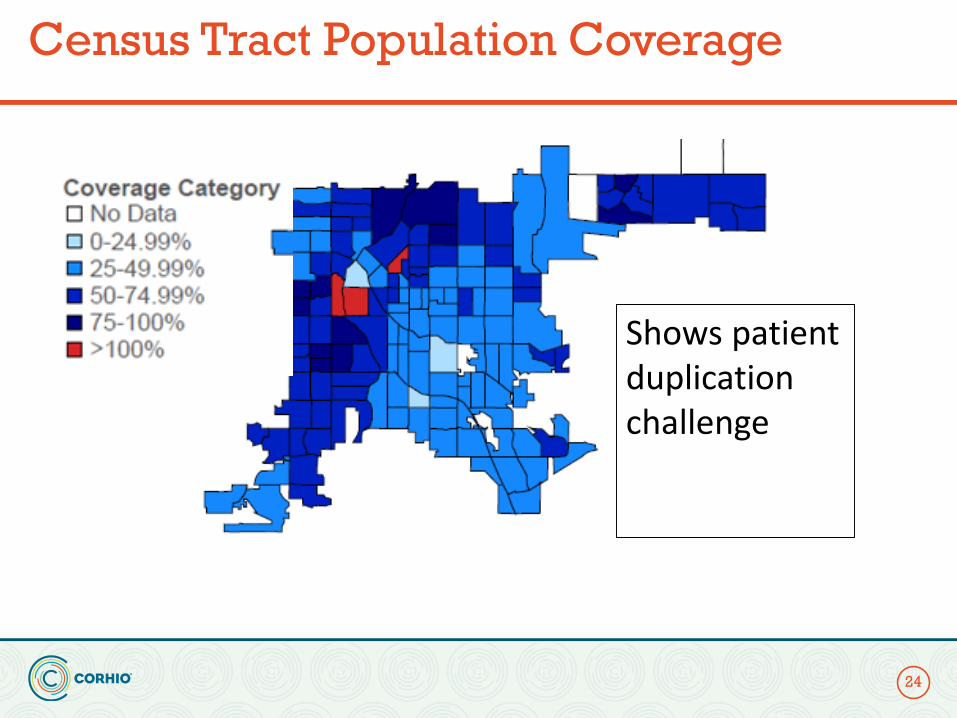
Census Tract Population Coverage
24
Shows patient duplication challenge
Challenges: De-Identification & De-Duplication
25
• Data must be aggregated across healthcare systems and de-identified to protect individual privacy - HIPAA regulations
• Data must be de-duplicatedwhen merging patient data from multiple health organizations – avoids the patient being represented more than once in the analyses
Solution
• By partnering with local health information exchange, CORHIO, and using an enterprise Master Patient Index, patient information was unified across providers and de-duplicated.
• Alpha-numeric identifiers uniquely distinguish individuals in the virtual data warehouse
• As an example, when CORHIO compared data between two data partners, a duplication was discovered that they shared 8% of patients
26
2018 Outcomes
• 12 data partners now share data• 5 public health agencies access that data• Local instance of query software deployed• Data partners built a datamart and configured software• Approved as a specialized Meaningful Use registry in 2016• Structured queries are available to estimate prevalence of depression,
obesity, diabetes, opioids, and hypertension • 47 queries have be submitted and provided data
27