Embed Size (px)
Citation preview

___________________________________________________________________________
2017/ISOM/SYM/003 Session 1
Harnessing Inclusive Opportunities: Embracing the Digital Future - Digital Economy and Inclusivity
Submitted by: PECC
Symposium on APEC 2018 PrioritiesPort Moresby, Papua New Guinea
5 December 2017

Harnessing Inclusive
Opportunities: Embracing the
Digital Future
Digital Economy and Inclusivity
ISOM Symposium
Stanley Hotel
Port Moresby
5 December, 2017
Eduardo Pedrosa
Secretary General
Pacific Economic Cooperation Council
The views expressed here are his own and do not necessarily
reflect those of the PECC nor its members.


Trade as a driver of growth?
-15.0
-10.0
-5.0
0.0
5.0
10.0
15.0
19
89
19
90
19
91
19
92
19
93
19
94
19
95
19
96
19
97
19
98
19
99
20
00
20
01
20
02
20
03
20
04
20
05
20
06
20
07
20
08
20
09
20
10
20
11
20
12
20
13
20
14
20
15
20
16
20
17
20
18
20
19
20
20
20
21
20
22
Difference Gross domestic product, constant prices Trade volume of goods and services

Data: The New Driving Force
Source: http://www.mckinsey.com/business-functions/strategy-and-corporate-finance/our-insights/the-global-forces-
inspiring-a-new-narrative-of-progress

Are we ready?1
1.1 1
6.2
9.3
7.6
21
.9
7.2
20
.2
28
.6
8.9
7.5
14
.7
4.3
6.2
5.5
20
.3
16
.9
16
18
.7
9.5
0
5
10
15
20
25
30
35
Au
stra
lia
Ca
na
da
Ch
ile
Ch
in
a
Ho
ng K
ong
(C
hin
a)
In
do
nesia
Jap
an
Ko
re
a
Ma
la
ysia
Me
xic
o
Ne
w Z
ealan
d
Pa
pua
N
ew
G
uin
ea
Pe
ru
Ph
ilip
pine
s
Sing
apo
re
Ch
in
ese
T
aipe
i
Th
aila
nd
Un
ited
S
ta
te
s
Vie
tn
am
Average Speed Mbps
Source: Akamai State of the Internet Report 2017 and http://www.dospeedtest.com/speedtest-result/country-statistics/
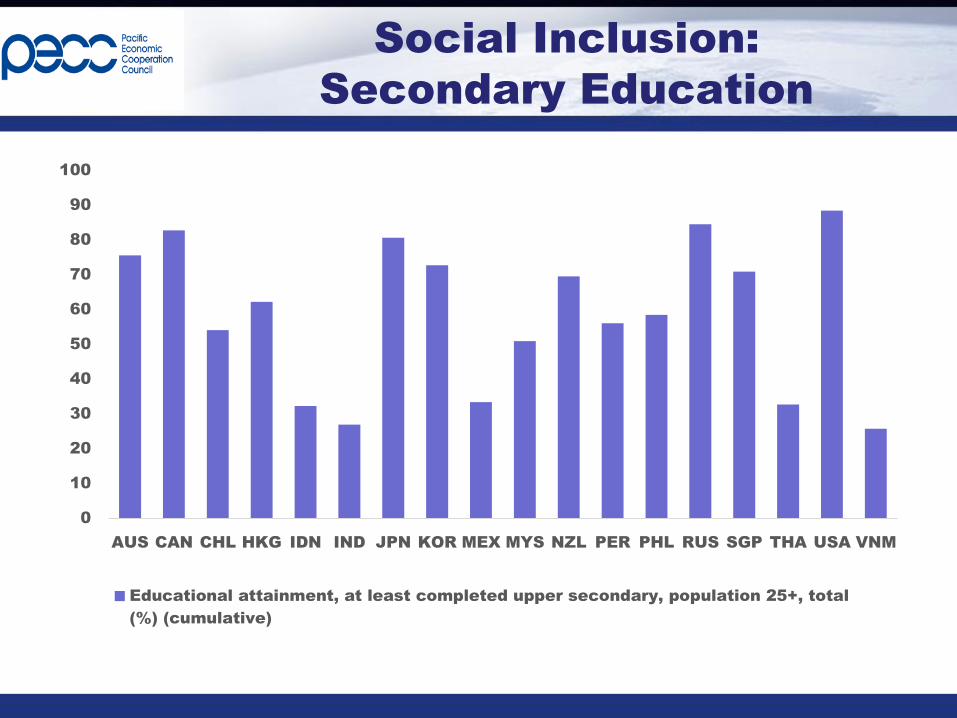
Social Inclusion:
Secondary Education
0
10
20
30
40
50
60
70
80
90
100
AUS CAN CHL HKG IDN IND JPN KOR MEX MYS NZL PER PHL RUS SGP THA USA VNM
Educational attainment, at least completed upper secondary, population 25+, total
(%) (cumulative)

Solution
Tech4Ed: ASL
• Tech4ED example in the Philippines includes Alternative
Learning System
– Uses 1000 public libraries
– TV White Space used to connect base stations to remote areas
– Bandwidth in the 600 MHz frequency range
• travels over hills and buildings and trees

Social Inclusion
Physicians per 10003
.2
7
1.4
4
2.0
7
1.0
3
1.9
4
1.3
2
0.2
0
2.3
0
2.1
4
2.1
0
1.2
0
2.7
4
1.1
3
1.1
5
0.0
6
4.3
1
1.9
5
0.3
9
2.4
5
1.1
9
0
0.5
1
1.5
2
2.5
3
3.5
4
4.5
5
Physicians (per 1,000 people)

Remote Healthcare Solutions
• Challenge:
– Fewer than 50 cardiologists to
service Cameroon’s 23 million
citizens
• Solution:
– Cardio Pad provide solutions
to heart patients based in
remote areas
– Allows nurses in remote areas
to do ECG
– Results sent over-the-air to
cardiologists in city centers
often hundreds of miles away
for doctor’s assessments

Financial Inclusion
% population (15+) with an account at a
financial institution
0
10
20
30
40
50
60
70
80
90
100
AUS CAN CHL CHN HKC IDN JPN KOR MEX MYS NZL PER PHL RUS SGP THA USA VNM

Mobile Accounts and GDP pc
0.0
10.0
20.0
30.0
40.0
50.0
60.0
70.0
6 7 8 9 10 11 12
Mo
bile
A
cc
ou
nt %
+1
5
Ln GDPpc
Early adopters aren’t
necessary high income
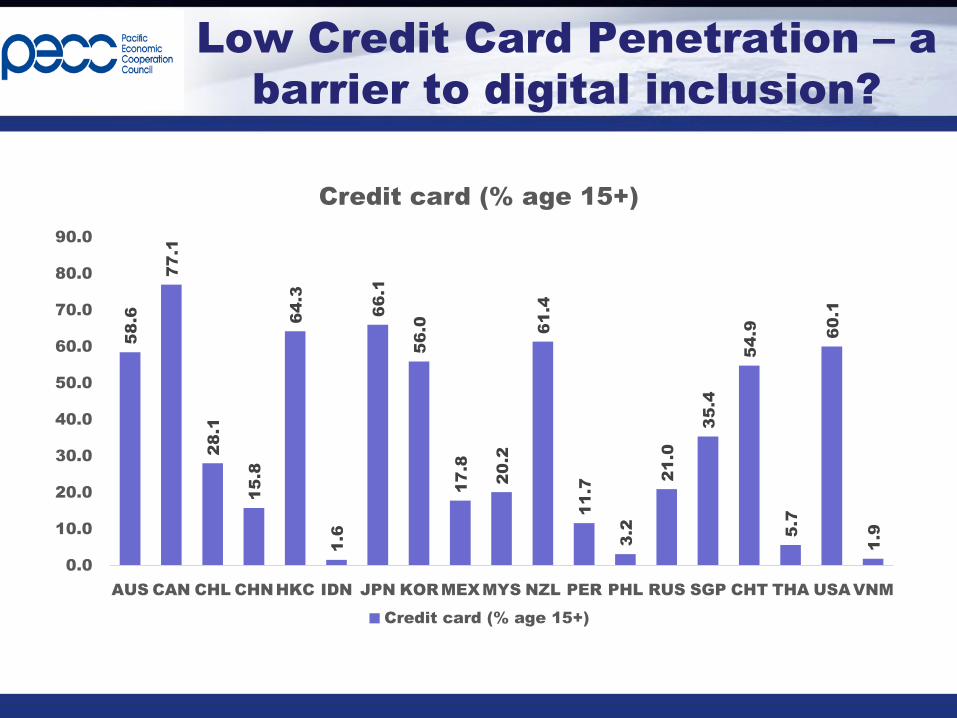
Low Credit Card Penetration – a
barrier to digital inclusion?
58
.6
77
.1
28
.1
15
.8
64
.3
1.6
66
.1
56
.0
17
.8
20
.2
61
.4
11
.7
3.2
21
.0
35
.4
54
.9
5.7
60
.1
1.9
0.0
10.0
20.0
30.0
40.0
50.0
60.0
70.0
80.0
90.0
AUS CAN CHL CHNHKC IDN JPN KORMEXMYS NZL PER PHL RUS SGP CHT THA USAVNM
Credit card (% age 15+)
Credit card (% age 15+)

Local solutions for Local Problems
Disrupting or Enabling Traditional Retail
Sector?
• Leading Online-to-Offline (O2O)
platform.
• Enables digital entrepreneurs to
become the gateway for unbanked
• Agent network across 500+ cities in
remote towns and rural areas of
Indonesia enables customers to
transact online
• Mixes traditional channels
• Allows online whilst still making
payments through cash.

Vendors not online but you are…
• 95% of home-stays and
guest houses do not have
own website
• Villagehuts.com works with
accommodation and tour
service providers to provide
secure way of booking
accommodation and tours
in PNG

Opportunities for more
inclusive growth
AUSCAN
CHN
HKG
IDN
JPN
MYS
MMR
NZL
PHL
SGP
THA
USA
VNM
0
20
40
60
80
100
120
0 5 10 15 20 25 30 35 40
Ac
co
un
t at a
fin
an
cia
l in
stitu
tio
n (%
a
ge
1
5+)
Commercial bank branches (per 100,000 adults)

Adoption not dependent on
income levels
-
20,000,000
40,000,000
60,000,000
80,000,000
100,000,000
120,000,000
Dec-11 Jun-12 Dec-12 Jun-13 Dec-13 Jun-14 Dec-14 Jun-15 Dec-15 Jun-16 Dec-16
Nu
mb
er o
f A
ctive
M
ob
ile
M
on
ey
Ac
co
un
ts
East Asia and Pacific Europe and Central Asia
Latin America and the Caribbean Sub-Saharan Africa
Source: GSMA Global Mobile Money dataset Date: April 2017 | Version: 1.0

Y-o-Y Growth Rate of Internet
Users in APEC
19
.2
%
12
.9
%
6.2
%
11
.2
%
9.7
%
3.1
%
8.0
%
1.1
%
-0
.1
%
1.7
%
-0
.2
%
4.5
%
1.4
%
2.5
%
2.6
%
50
.1
%
56
.7
%
32
.5
%
22
.2
%
21
.3
%
21
.6
%
37
.7
%
29
.5
%
22
.3
%
24
.2
%
13
.0
%
13
.6
%
8.0
%
6.2
%
7.9
%
-10%
0%
10%
20%
30%
40%
50%
60%
70%
80%
200
1
200
2
200
3
200
4
200
5
200
6
200
7
200
8
200
9
201
0
201
1
201
2
201
3
201
4
201
5
Advanced Emerging
Source: World Development Indicators

Affordability of Internet Access
0.3
5
0.6
5
0.9
4
1.4
6
1.3
0
0.8
3
1.3
6
1.2
5
0.4
3
1.3
2
1.9
1
0.6
3
21
.0
7
2.6
7
6.7
4
0.5
2
0.3
1
1.2
1
0.3
6
3.5
2
0
5
10
15
20
25
Au
stra
lia
Bru
nei D
aru
ssalam
Ca
na
da
Ch
ile
Ch
in
a
Ho
ng K
ong
(C
hin
a)
In
do
nesia
Jap
an
Ko
re
a
Ma
la
ysia
Me
xic
o
Ne
w Z
ealan
d
Pa
pua
N
ew
G
uin
ea
Pe
ru
Ph
ilip
pine
s
Ru
ssia
Sing
apo
re
Th
aila
nd
Un
ited
S
ta
te
s
Vie
tn
am
Co
st o
f 1
GB
a
s %
G
NI p
er c
ap
ita
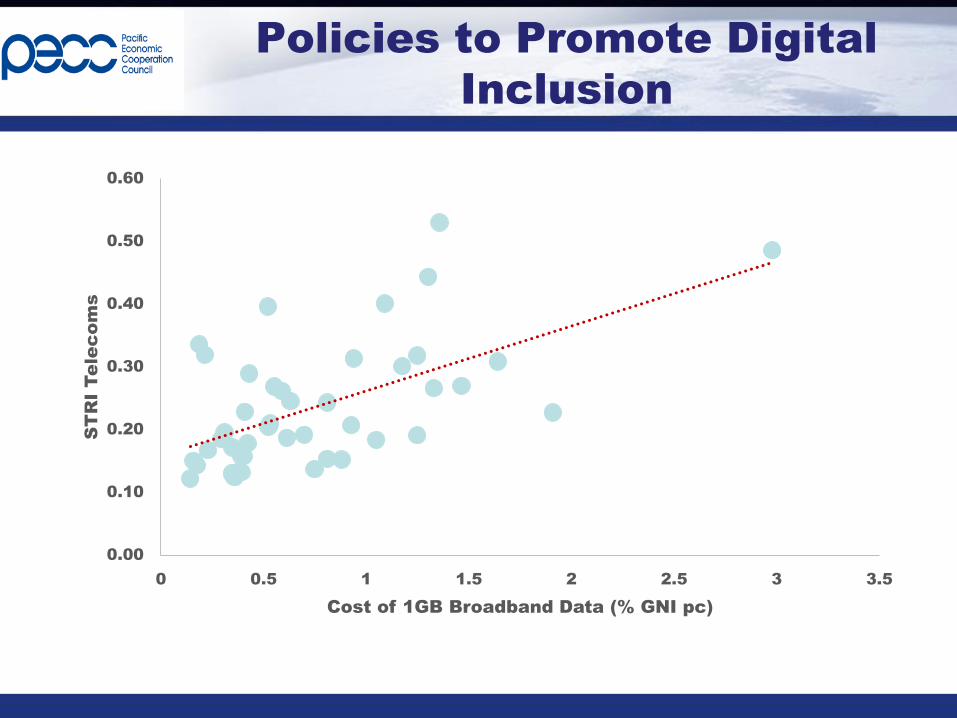
Policies to Promote Digital
Inclusion
0.00
0.10
0.20
0.30
0.40
0.50
0.60
0 0.5 1 1.5 2 2.5 3 3.5
ST
RI Te
le
co
ms
Cost of 1GB Broadband Data (% GNI pc)

What are the most important
benefits of the digital economy?
78.9%
77.3%
71.0%
67.0%
66.6%
58.7%
Growth in productivity
Access to larger markets – especially for micro
and small and medium enterprises
Increased consumer choices
More customized products and services
New job opportunities in my economy
Cheaper products and services
% important
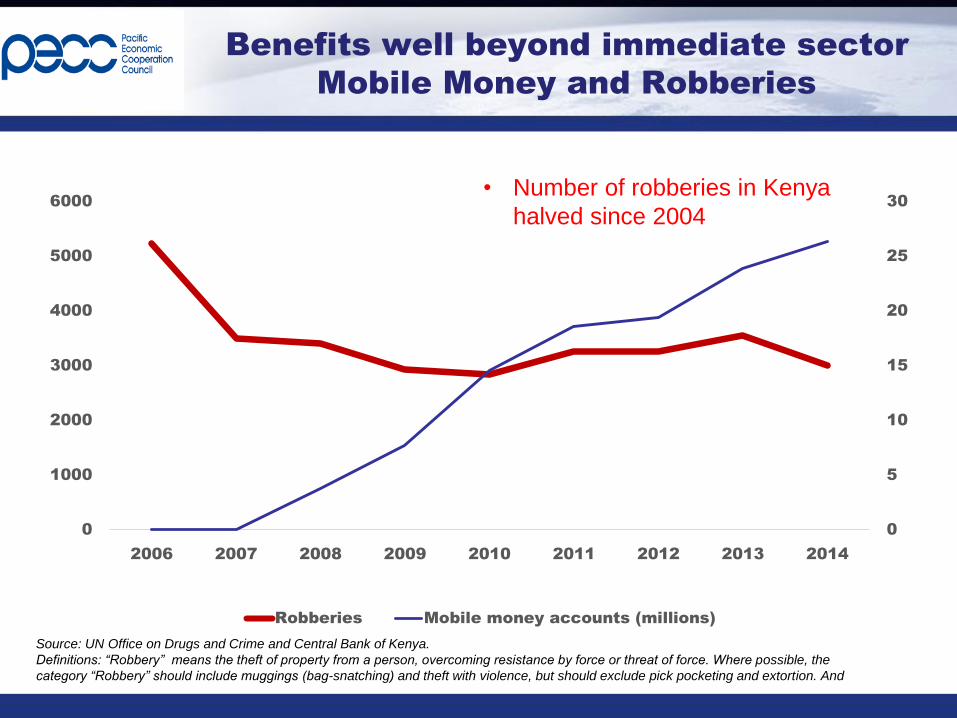
Benefits well beyond immediate sector
Mobile Money and Robberies
0
5
10
15
20
25
30
0
1000
2000
3000
4000
5000
6000
2006 2007 2008 2009 2010 2011 2012 2013 2014
Robberies Mobile money accounts (millions)
• Number of robberies in Kenya
halved since 2004
Source: UN Office on Drugs and Crime and Central Bank of Kenya.
Definitions: “Robbery” means the theft of property from a person, overcoming resistance by force or threat of force. Where possible, the
category “Robbery” should include muggings (bag-snatching) and theft with violence, but should exclude pick pocketing and extortion. And

Priorities issues for the growth
of the digital economy
70.9%
63.2%
60.2%
50.9%
44.4%
40.0%
37.9%
30.5%
29.3%
25.9%
26.4%
23.1%
24.0%
20.6%
11.5%
54.0%
50.3%
44.9%
33.5%
35.2%
32.4%
23.4%
28.3%
19.0%
18.2%
14.2%
14.8%
12.6%
13.9%
10.7%
0% 20% 40% 60% 80%
Data protection
Digital infrastructure
Data privacy
Universal broadband access
Digital literacy
Interoperability of platforms
Holistic (whole-of-government) policy frameworks
Seamless cross-border data flows
Regulatory equivalence to promote mutual recognition
Online dispute resolution mechanisms
Standardized digital economy measurements
Digital IDs
Common application of sales taxes (ie VAT, GST)
Open data programmes
De minimis levels of trade
Emerging Advanced
Question: How important do you think the following areas are for the growth of the digital economy?

Challenge: Speed of Change
Accelerating
75
38
13
4 3.5
0
10
20
30
40
50
60
70
80
Telephone Radio TV Internet Facebook
Years to reach audience of 50 million

Digital Economy and Inclusion
• Accelerating pace of change gives rise to imperatives:
– an imperative for swift action
– flexible approaches
– holistic approaches
• Benefits are beyond any one sectoral interest – social benefits?
• Slowing growth of internet penetration – why?
– Need to look at regulatory environment – openness and competition key to
affordability and speed
• Why is it important?
• Opportunity for more inclusive growth model
– Financial inclusion – mobile money – not correlated with high income
– Local innovators – finding solutions to local context
• Data protection and data privacy
– From being a risk manager, and an enforcer of sectoral regulation, the
regulator needs to become an advocate for, and an enabler of, digital
inclusion and innovation
– Balance need for security and privacy with drive for innovation and
inclusion
• Implementation of APEC Roadmap