Embed Size (px)
Citation preview

Month XX, 2017Copyright © 2018 Boeing. All rights reserved.
Copyright © 2018 Boeing. All rights reserved. Interservice / Industry Training, Simulation & Education Conference 2018
Harnessing the Power of Data Analytics to Optimize Training
Liz Gehr, Training and Professional Services, Boeing ([email protected])Laurie Dunagan, Training and Professional Services, Boeing ([email protected])
November 30, 2018
Boeing Global Services | Training and Professional Services
Copyright © 2018 Boeing. All rights reserved.
Interservice / Industry Training, Simulation & Education Conference 2018
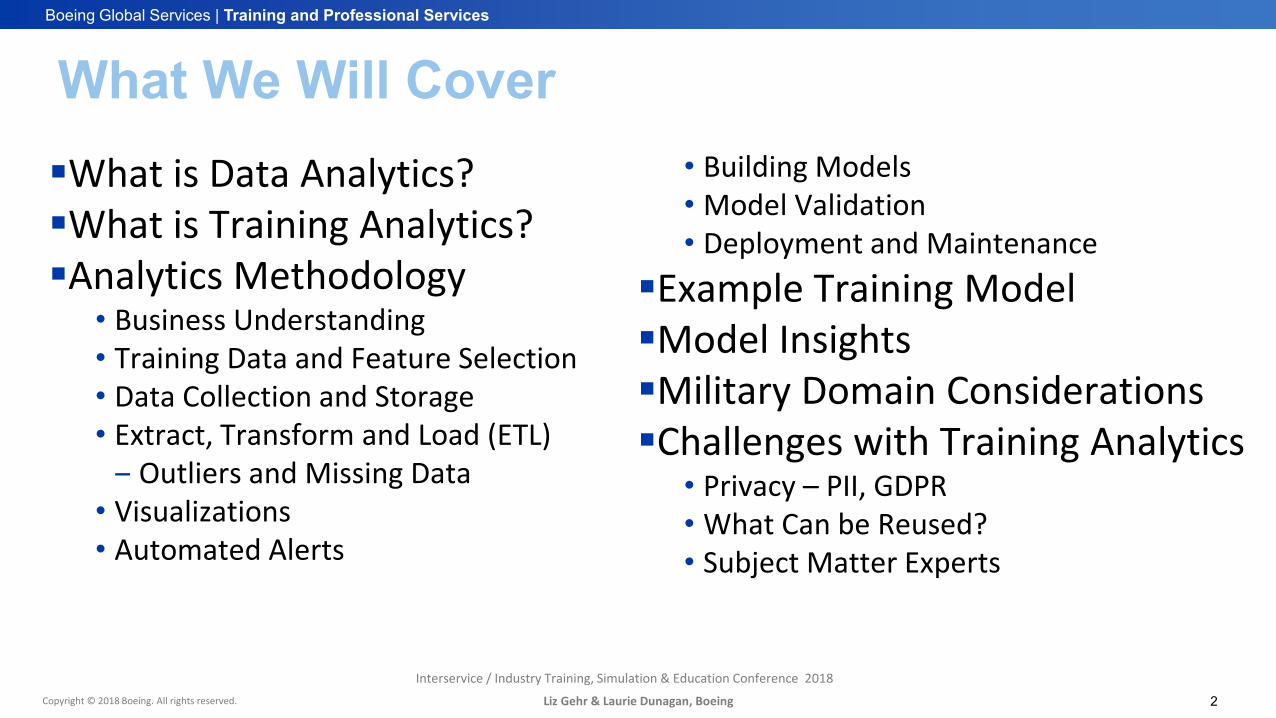
What is Data Analytics?What is Training Analytics?Analytics Methodology
• Business Understanding• Training Data and Feature Selection• Data Collection and Storage• Extract, Transform and Load (ETL)‒ Outliers and Missing Data
• Visualizations• Automated Alerts
• Building Models• Model Validation• Deployment and Maintenance
Example Training ModelModel InsightsMilitary Domain ConsiderationsChallenges with Training Analytics
• Privacy – PII, GDPR• What Can be Reused?• Subject Matter Experts
What We Will Cover
Liz Gehr & Laurie Dunagan, Boeing 2

Boeing Global Services | Training and Professional Services
Copyright © 2018 Boeing. All rights reserved.Interservice / Industry Training, Simulation & Education Conference 2018
•“The formula” to apply to learning data‒It doesn’t exist
What we won’t cover
Liz Gehr & Laurie Dunagan, Boeing 3

Copyright © 2018 Boeing. All rights reserved.
Boeing Global Services | Training and Professional Services
Interservice / Industry Training, Simulation & Education Conference 2018
DATA ANALYTICSData Analytics
Liz Gehr & Laurie Dunagan, Boeing4

Boeing Global Services | Training and Professional Services
Copyright © 2018 Boeing. All rights reserved.Interservice / Industry Training, Simulation & Education Conference 2018
How would you characterize it?• …
What is Analytics?
Liz Gehr & Laurie Dunagan, Boeing 5
Boeing Global Services | Training and Professional Services
Copyright © 2018 Boeing. All rights reserved.Interservice / Industry Training, Simulation & Education Conference 2018
Liz Gehr & Laurie Dunagan, Boeing 6
The scientific process of identifying,
accessing,cleaning & manipulating, AND
Analyzing data
to discover intelligence serving your objective(s)
Analytics Is:
Month XX, 2017Copyright © 2018 Boeing. All rights reserved.
Interservice / Industry Training, Simulation & Education Conference 2018
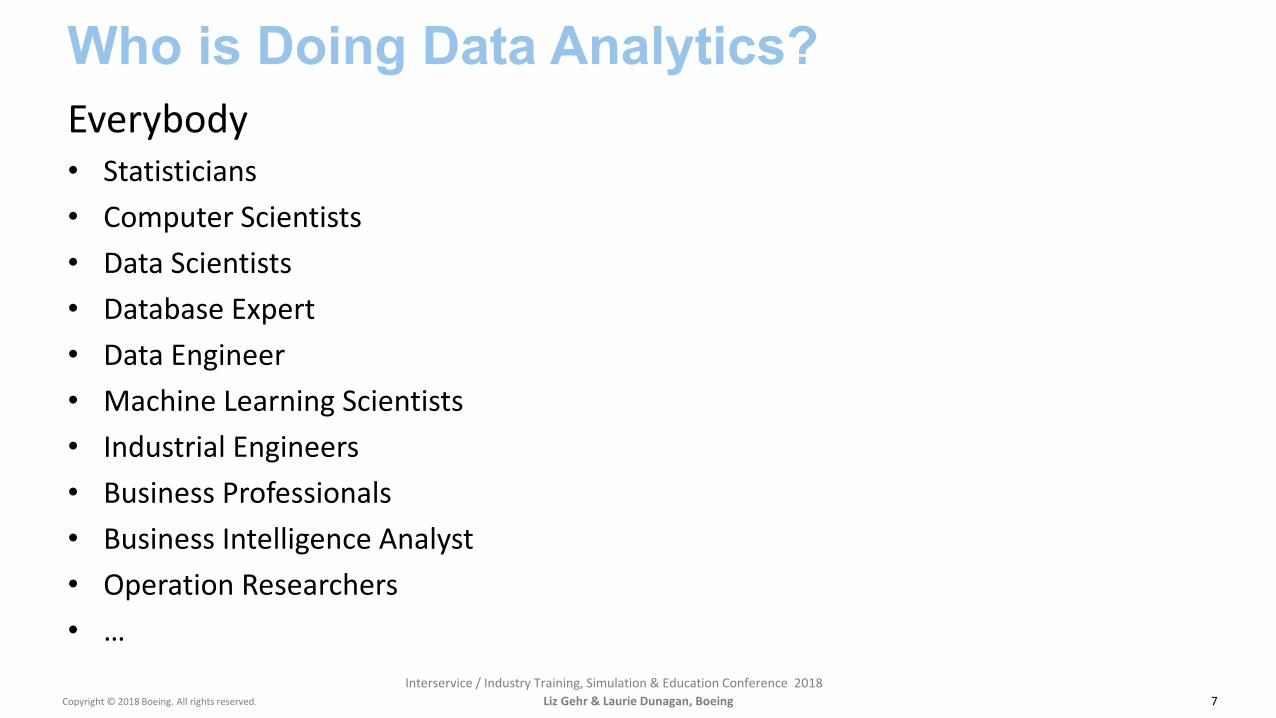
Everybody• Statisticians• Computer Scientists• Data Scientists• Database Expert• Data Engineer• Machine Learning Scientists• Industrial Engineers• Business Professionals• Business Intelligence Analyst• Operation Researchers• …
Who is Doing Data Analytics?
Liz Gehr & Laurie Dunagan, Boeing 7
Month XX, 2017Copyright © 2018 Boeing. All rights reserved.
Interservice / Industry Training, Simulation & Education Conference 2018
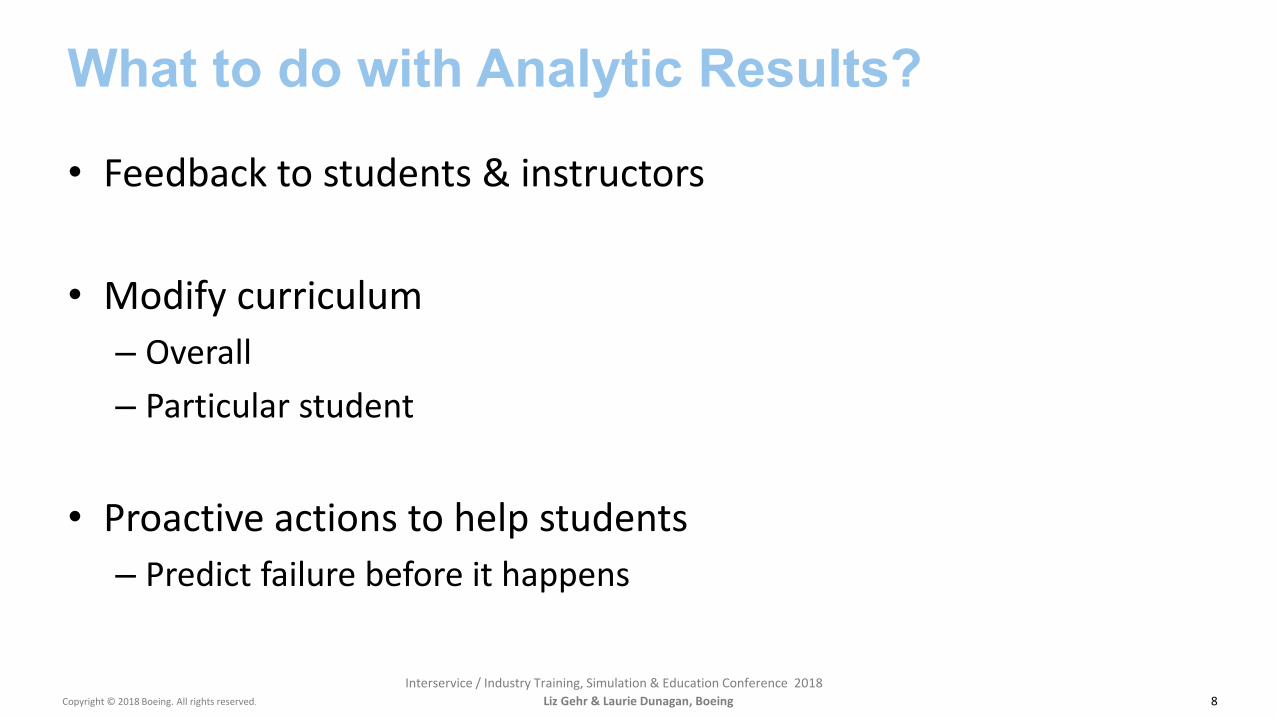
• Feedback to students & instructors
• Modify curriculum– Overall– Particular student
• Proactive actions to help students– Predict failure before it happens
What to do with Analytic Results?
8Liz Gehr & Laurie Dunagan, Boeing
Month XX, 2017Copyright © 2018 Boeing. All rights reserved.
Interservice / Industry Training, Simulation & Education Conference 2018
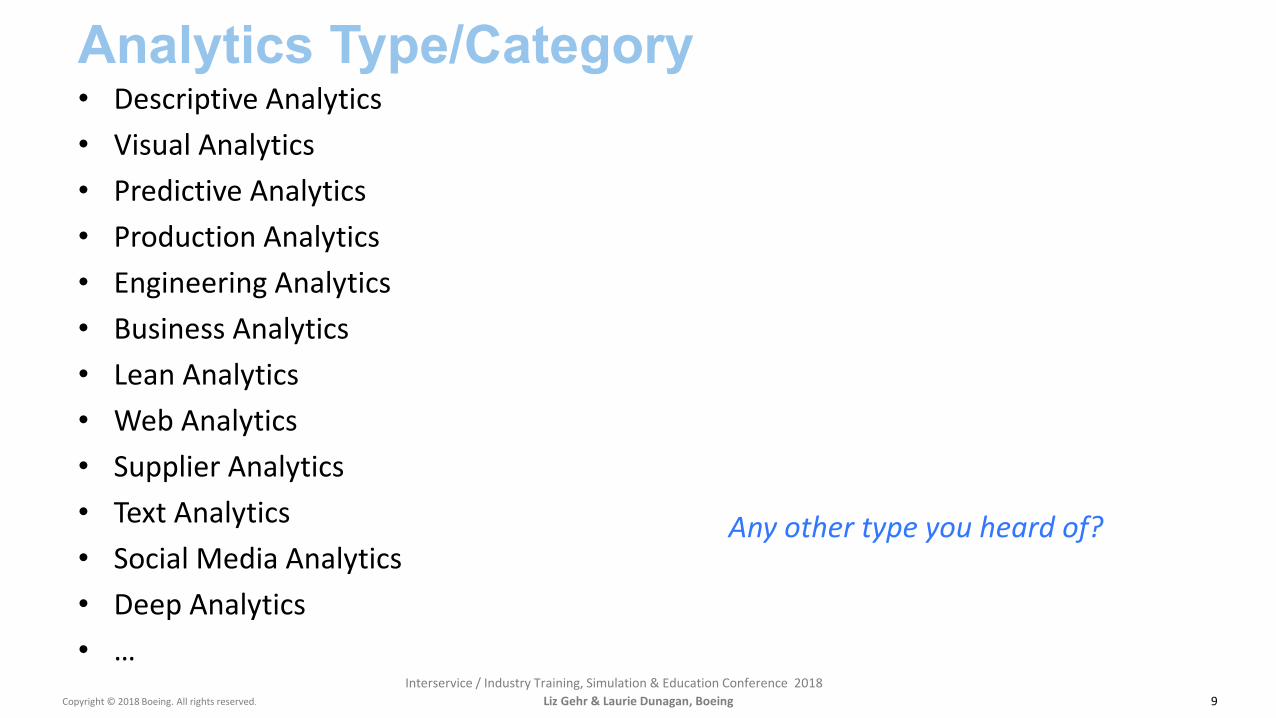
• Descriptive Analytics• Visual Analytics• Predictive Analytics• Production Analytics• Engineering Analytics• Business Analytics• Lean Analytics• Web Analytics• Supplier Analytics• Text Analytics• Social Media Analytics• Deep Analytics• …
Analytics Type/Category
Liz Gehr & Laurie Dunagan, Boeing 9
Any other type you heard of?

Month XX, 2017Copyright © 2018 Boeing. All rights reserved.
Interservice / Industry Training, Simulation & Education Conference 2018
Analytics Value Stream
10
Descriptive/ Visual
Analytics
Difficulty
Valu
e
Association/ Correlation
Predictive Analytics
Prescriptive Analytics
Historical
Learn from history
Projection for future
Proactive
Un-organized and Reactive
Proactive and Optimized
Low
High
Low High
Liz Gehr & Laurie Dunagan, Boeing

Month XX, 2017Copyright © 2018 Boeing. All rights reserved.
Interservice / Industry Training, Simulation & Education Conference 2018
• R (open source), Rstudio (open source), SparkR, Revolution• Python• SAS• Minitab• IBM SPSS• STATISTICA• TIBCO Spotfire (aka Splus)• Hadoop (parallel data ingest and analysis)• Hive• SAP• SQL Server Integration Services (SSIS) and Analysis (SSAS)• Alpine Miner• WEKA• Matlab• Tableau• Excel• …
Tools Used in Data Analytics
Liz Gehr & Laurie Dunagan, Boeing 11

Month XX, 2017Copyright © 2018 Boeing. All rights reserved.
Interservice / Industry Training, Simulation & Education Conference 2018
Who Are the Users of Results? How and When Will They Use It?
12
Contract
Delivery
Contrast• Who are your targeted users?• What processes do they follow?• How do they intend to incorporate your solution to their process?
With• What are the timelines for various data elements?• How long the Analytics will need? When results are available?• When will your targeted users need the results?• How would the users benefit from using the results?
Liz Gehr & Laurie Dunagan, Boeing
Copyright © 2018 Boeing. All rights reserved.
Boeing Global Services | Training and Professional Services
Interservice / Industry Training, Simulation & Education Conference 2018
DATA ANALYTICS VS LEARNING ANALYTICS
Data Analytics vs Training Analytics
Liz Gehr & Laurie Dunagan, Boeing13
Boeing Global Services | Training and Professional Services
Copyright © 2018 Boeing. All rights reserved.Interservice / Industry Training, Simulation & Education Conference 2018
•Poll:‒What is data analytics for training/education/learning?
Data Analytics in Training
Liz Gehr & Laurie Dunagan, Boeing 14

Month XX, 2017Copyright © 2018 Boeing. All rights reserved.
Interservice / Industry Training, Simulation & Education Conference 2018
• Educational Data Mining• Learning Analytics• Training Analytics
What is it Called?
15Liz Gehr & Laurie Dunagan, Boeing

Month XX, 2017Copyright © 2018 Boeing. All rights reserved.
Interservice / Industry Training, Simulation & Education Conference 2018
• “Educational data mining tends to focus on developing new tools for discovering patterns in data. These patterns are generally about the micro-concepts involved in learning: one-digit multiplication, subtraction with carries, and so on.”
• “Learning analytics—at least as it is currently contrasted with data mining—focuses on applying tools and techniques at larger scales, such as in courses and at schools and postsecondary institutions.”
• “Although there is no hard and fast distinction between these two fields, they have had somewhat different research histories and are developing as distinct research areas. Generally, educational data mining looks for new patterns in data and develops new algorithms and/or new models, while learning analytics applies known predictive models in instructional systems.”
US Department of Education 2012
16Liz Gehr & Laurie Dunagan, Boeing

Month XX, 2017Copyright © 2018 Boeing. All rights reserved.
Interservice / Industry Training, Simulation & Education Conference 2018
Related Journals:• Journal of Educational Data Mining• Journal of Statistical Education• International Journal of Educational Research• Journal of Educational Technology & Society• Journal of Educational and Behavioral Statistics• Journal of Educational Psychology• Journal of Technologies in Learning (online)• Journal of Educational Multimedia and Hypermedia
Opinion: it does not matter
What is it called?
17Liz Gehr & Laurie Dunagan, Boeing
Month XX, 2017Copyright © 2018 Boeing. All rights reserved.
Interservice / Industry Training, Simulation & Education Conference 2018
• K-12• College
– MOOCs
• Corporations
Where is Learning Analytics Currently Used?
18Liz Gehr & Laurie Dunagan, Boeing
Month XX, 2017Copyright © 2018 Boeing. All rights reserved.
Interservice / Industry Training, Simulation & Education Conference 2018
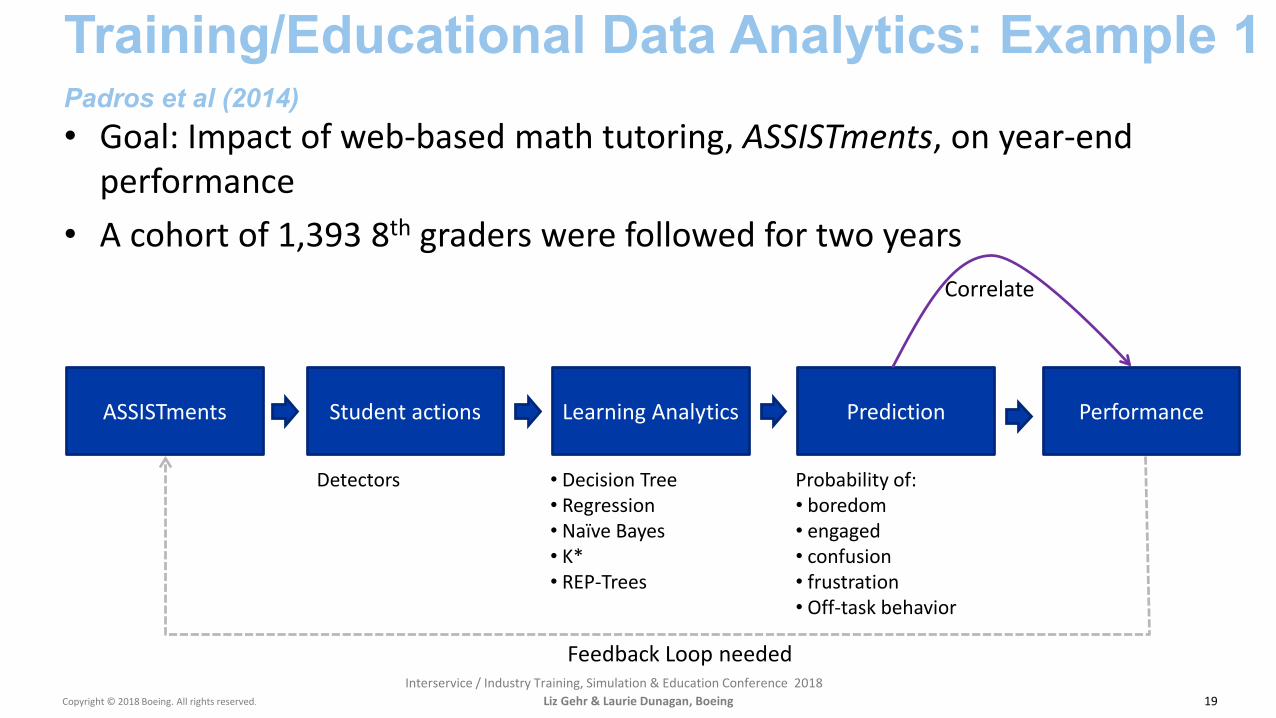
• Goal: Impact of web-based math tutoring, ASSISTments, on year-end performance
• A cohort of 1,393 8th graders were followed for two years
Training/Educational Data Analytics: Example 1Padros et al (2014)
19
Student actions Learning Analytics Prediction
Detectors • Decision Tree• Regression• Naïve Bayes• K*• REP-Trees
Probability of:• boredom• engaged• confusion• frustration• Off-task behavior
PerformanceASSISTments
Correlate
Feedback Loop needed
Liz Gehr & Laurie Dunagan, Boeing
Month XX, 2017Copyright © 2018 Boeing. All rights reserved.
Interservice / Industry Training, Simulation & Education Conference 2018
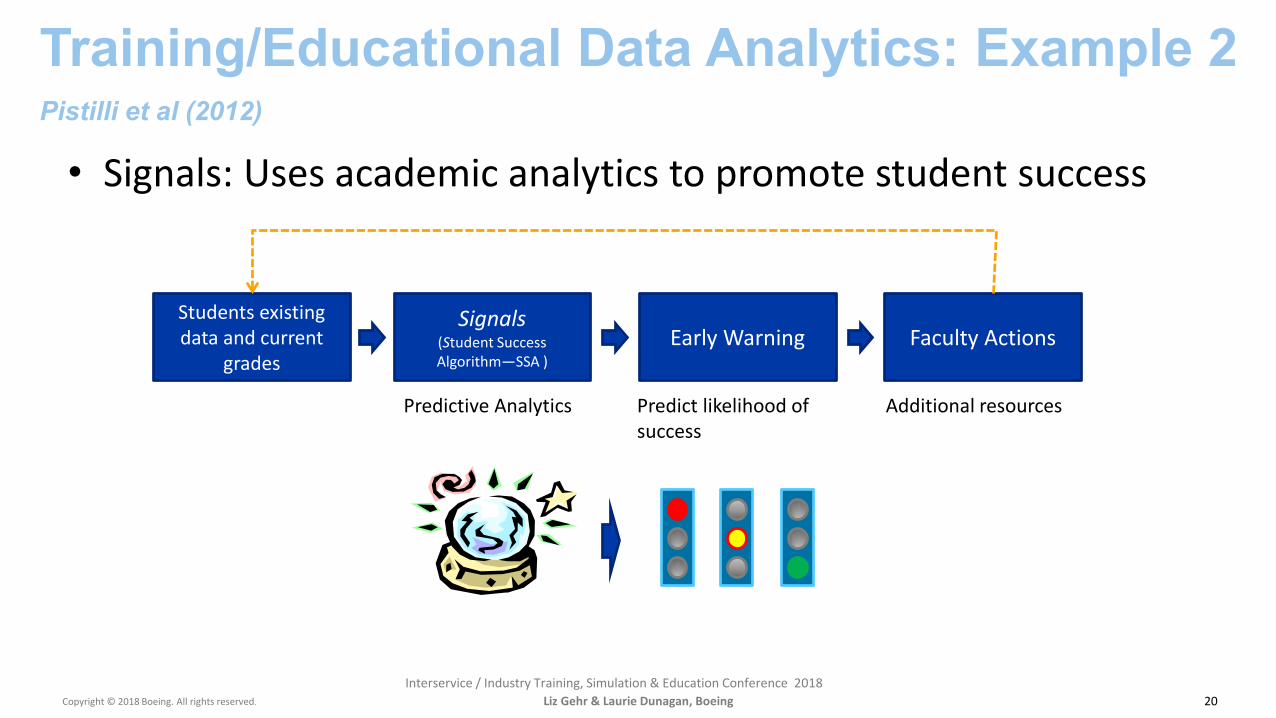
• Signals: Uses academic analytics to promote student success
Training/Educational Data Analytics: Example 2Pistilli et al (2012)
20
Signals(Student Success Algorithm—SSA )
Early Warning Faculty Actions
Predictive Analytics Predict likelihood of success
Additional resources
Students existing data and current
grades
Liz Gehr & Laurie Dunagan, Boeing

Month XX, 2017Copyright © 2018 Boeing. All rights reserved.
Interservice / Industry Training, Simulation & Education Conference 2018
• Proof of concept on instrumented rifle range• Used xAPI to collect training data• Role-specific visualizations of soldier performance data
Example 3: Military Application of AnalyticsDurlach et al (2015)
Liz Gehr & Laurie Dunagan, Boeing 21

Boeing Global Services | Training and Professional Services
Copyright © 2018 Boeing. All rights reserved.Interservice / Industry Training, Simulation & Education Conference 2018
Why Implement Training Analytics for Defense Customers?
Liz Gehr & Laurie Dunagan, Boeing 22
•Poll – what do you think?

Month XX, 2017Copyright © 2018 Boeing. All rights reserved.
Interservice / Industry Training, Simulation & Education Conference 2018
• Benefits– Predict failure & success
• Based on similar past students, will this student succeed easily?– Provide challenge material– “fast track” for early graduation
• Based on similar past students, will this student struggle?– Provide early intervention– Even if he takes longer, it is faster and cheaper than repeating the whole course
• If the student is passing all the tests, are there underlying objectives with which he is struggling that will need more study later?
– Provide short remedial material– Prevent later failure because of underlying deficiency
– Lower the cost of training• Reduce failure
– Early interventions to prevent course failure• Best students can graduate early
Training/Learning Analytics
23Liz Gehr & Laurie Dunagan, Boeing

Month XX, 2017Copyright © 2018 Boeing. All rights reserved.
Interservice / Industry Training, Simulation & Education Conference 2018
• Benefits – continued– Speed up training time
• Prevent poor students from having to retake the whole course• Allow best students to graduate early
– Insights based on location, instructor, course• When all the data is organized in one location, can run analyses to look for patterns• Is one location more successful than another?• Is one instructor a harder grader than others?
– Improved screening• What type of student will succeed?• What type of student will struggle?• Better selection will lead to fewer failure and retraining costs
Training/Learning Analytics
24Liz Gehr & Laurie Dunagan, Boeing

Month XX, 2017Copyright © 2018 Boeing. All rights reserved.
Interservice / Industry Training, Simulation & Education Conference 2018
• Benefits – continued– Provide interventions & automated alerts
• Prevent failure by giving remedial material when there is a need• Provide challenge material to advanced students
– Or allow them to skip material
– Data validation• Especially for demographic data
– Ensure good data to ensure good analyses
– Curriculum improvement• Look for areas of undertraining
– Even if everyone passes are there areas where students are struggling?• Reduce unplanned overtraining
– Assess changes to training program• Are students more successful?• Is there less need for remedial material?
Training/Learning Analytics
25Liz Gehr & Laurie Dunagan, Boeing

Month XX, 2017Copyright © 2018 Boeing. All rights reserved.
Interservice / Industry Training, Simulation & Education Conference 2018
How can it all fit together?
26
Taken from: Enhancing Teaching and Learning Through Educational Data Mining and Learning Analytics: An Issue Brief, US DoE, 2012
Liz Gehr & Laurie Dunagan, Boeing
Copyright © 2018 Boeing. All rights reserved.
Boeing Global Services | Training and Professional Services
Interservice / Industry Training, Simulation & Education Conference 2018
Analytics Methodology
Liz Gehr & Laurie Dunagan, Boeing27

Month XX, 2017Copyright © 2018 Boeing. All rights reserved.
Interservice / Industry Training, Simulation & Education Conference 2018
Analytics Methodology/Lifecycle
Liz Gehr & Laurie Dunagan, Boeing 28
Business Understanding
identify project objectives
Data Understanding
collect & review data Modeling(if needed)
manipulate data &draw conclusions
Evaluation
evaluate model &conclusions
Deployment
apply conclusions tobusiness
Data Preparation
select & cleanse data
Visualization
manipulate data &draw conclusions
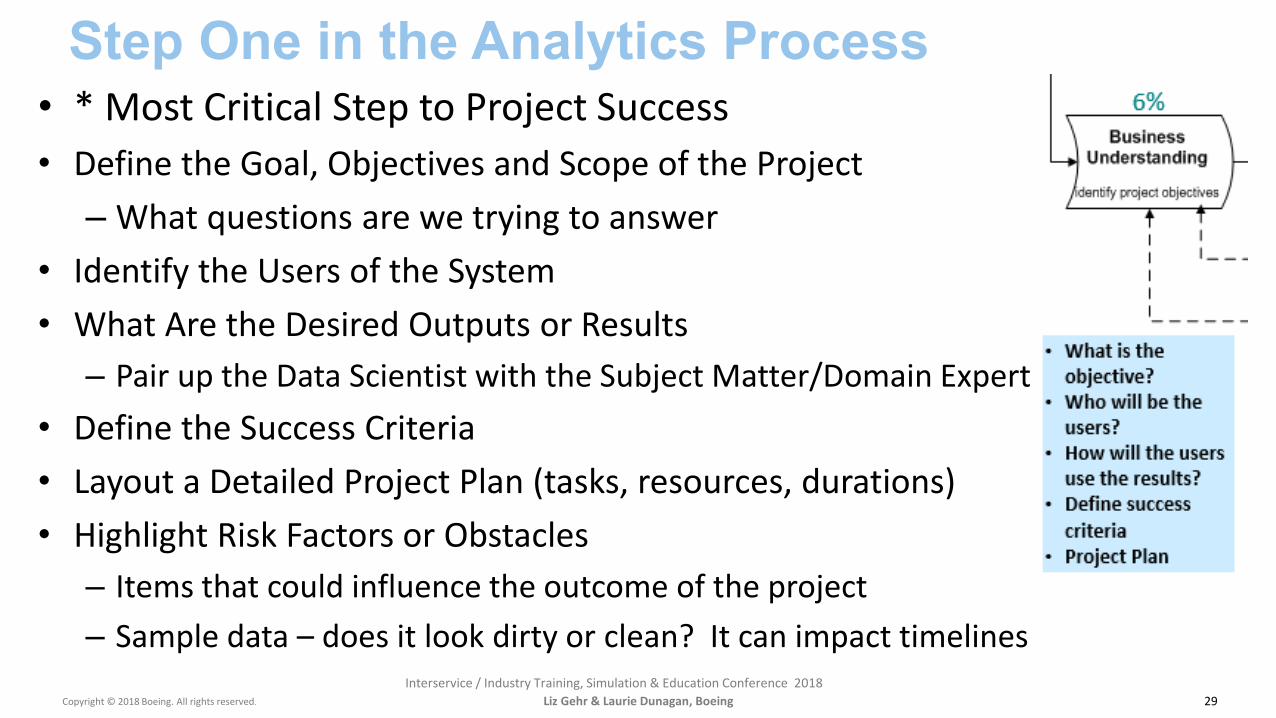
• What is the objective?
• Who will be the users?
• How will the users use the results?
• Define success criteria
• Project Plan
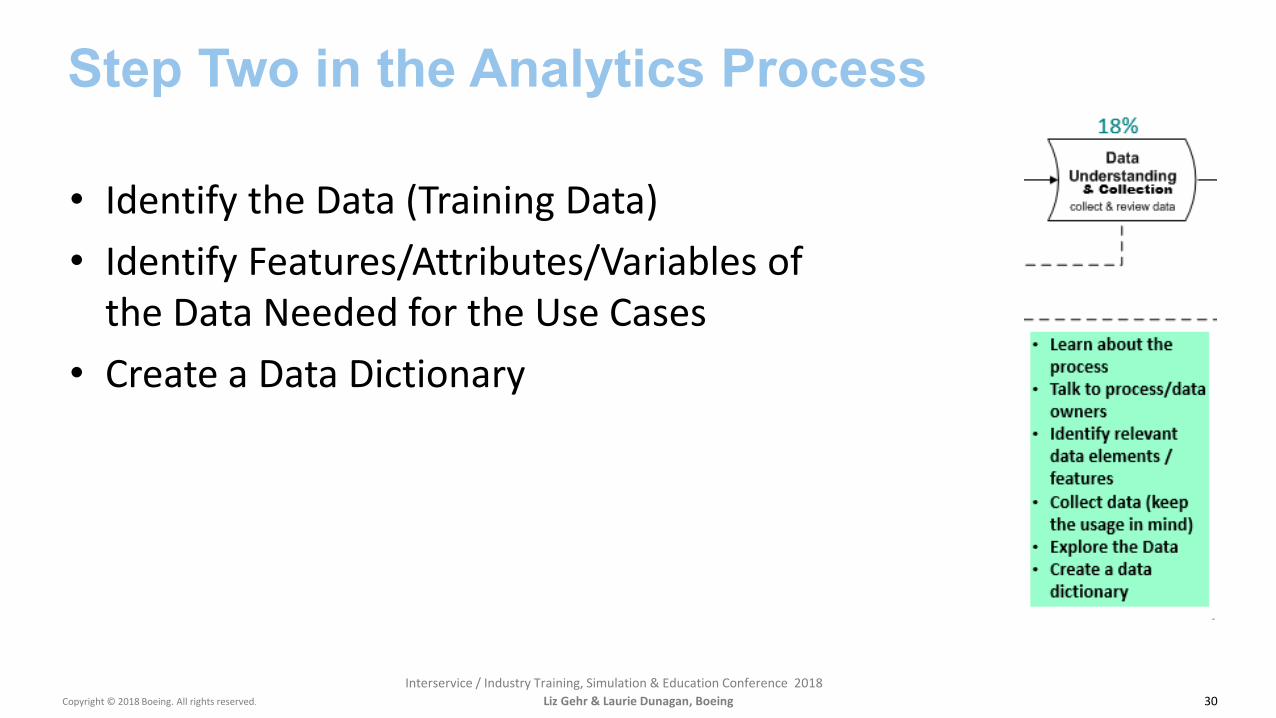
• Learn about the process
• Talk to process/data owners
• Identify relevant data elements / features
• Collect data (keep the usage in mind)
• Explore the Data• Create a data
dictionary
• Which data elements are needed?
• Clean and validate data
• Manipulate and combine data
• Create attributes (SME input may be helpful)
• Format data for analysis
• Mine the data• Aggregate and Summarize• Visualize the data• Manipulate data further if
needed• Select appropriate modeling
approach• Fine tune the model and assess
• Evaluate the model results
• Does it meet your success criteria?
• Determine next steps (go/ no go)
• Iterate on the framework lifecycle
• Plan deployment—keep users in mind
• Plan to monitor and maintain the system
• Final report• Project retrospect
Manage the Model
6% 18% 25% +
15%
20%
11%5%
https://www.datasciencecentral.com/profiles/blogs/the-data-science-project-lifecyclehttps://dataschool.com/data-science-life-cycle/https://visit.figure-eight.com/rs/416-ZBE-142/images/CrowdFlower_DataScienceReport_2016.pdfhttps://hbr.org/2018/08/what-data-scientists-really-do-according-to-35-data-scientistshttp://www.eweek.com/database/one-third-of-bi-pros-spend-up-to-90-of-time-cleaning-data
& Collection
Month XX, 2017Copyright © 2018 Boeing. All rights reserved.
Interservice / Industry Training, Simulation & Education Conference 2018
• * Most Critical Step to Project Success• Define the Goal, Objectives and Scope of the Project
– What questions are we trying to answer• Identify the Users of the System• What Are the Desired Outputs or Results
– Pair up the Data Scientist with the Subject Matter/Domain Expert• Define the Success Criteria• Layout a Detailed Project Plan (tasks, resources, durations)• Highlight Risk Factors or Obstacles
– Items that could influence the outcome of the project– Sample data – does it look dirty or clean? It can impact timelines
Step One in the Analytics Process
Liz Gehr & Laurie Dunagan, Boeing 29
Month XX, 2017Copyright © 2018 Boeing. All rights reserved.
Interservice / Industry Training, Simulation & Education Conference 2018
• Identify the Data (Training Data)• Identify Features/Attributes/Variables of
the Data Needed for the Use Cases• Create a Data Dictionary
Step Two in the Analytics Process
Liz Gehr & Laurie Dunagan, Boeing 30

Month XX, 2017Copyright © 2018 Boeing. All rights reserved.
Interservice / Industry Training, Simulation & Education Conference 2018
Where Is the Training Data?
31
A. Users and Producers of Training Data1. Students2. Instructors3. Training Managers
- On-site- Across all sites
4. Courseware Authors5. Training Devices
- Simulators- Virtual Reality - Augmented Reality- Virtual Instructor
B. Challenges1. Obtain Data in Digital Format2. Automate Collection and Storage
Liz Gehr & Laurie Dunagan, Boeing
Image by Tom Brown, © Boeing 2017
Month XX, 2017Copyright © 2018 Boeing. All rights reserved.
Interservice / Industry Training, Simulation & Education Conference 2018
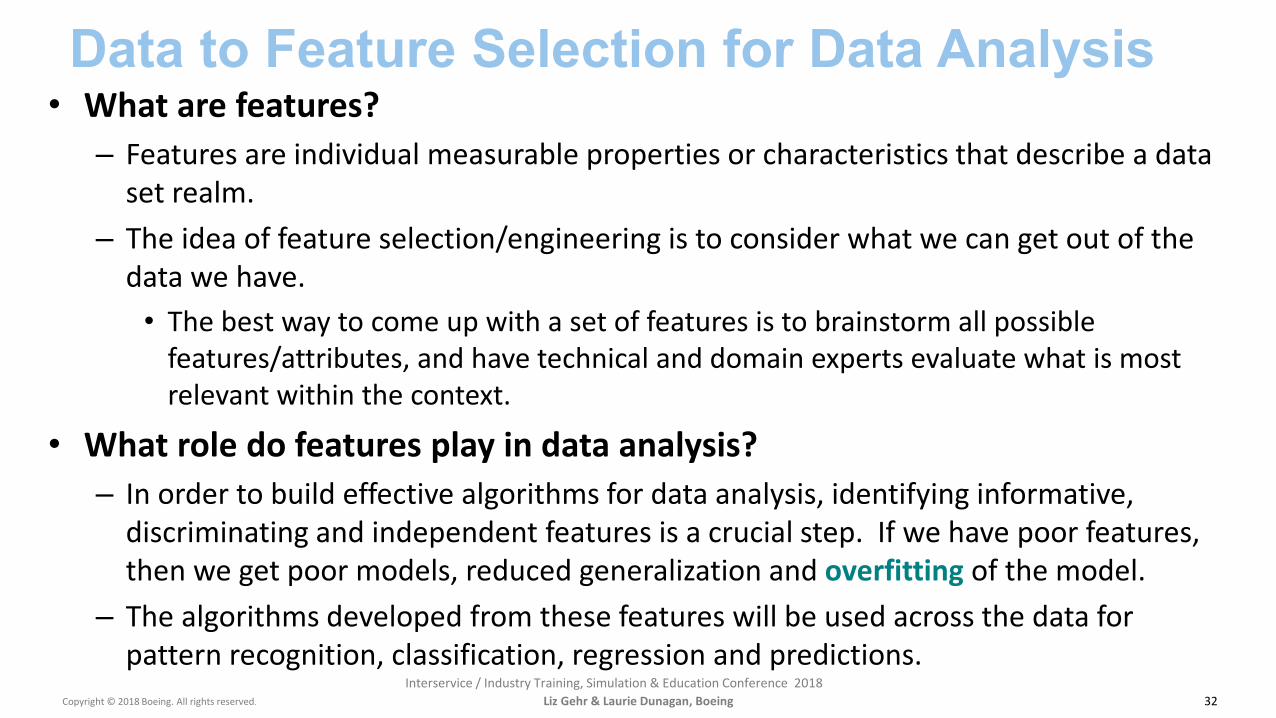
• What are features?– Features are individual measurable properties or characteristics that describe a data
set realm. – The idea of feature selection/engineering is to consider what we can get out of the
data we have. • The best way to come up with a set of features is to brainstorm all possible
features/attributes, and have technical and domain experts evaluate what is most relevant within the context.
• What role do features play in data analysis?– In order to build effective algorithms for data analysis, identifying informative,
discriminating and independent features is a crucial step. If we have poor features, then we get poor models, reduced generalization and overfitting of the model.
– The algorithms developed from these features will be used across the data for pattern recognition, classification, regression and predictions.
Data to Feature Selection for Data Analysis
Liz Gehr & Laurie Dunagan, Boeing 32
Month XX, 2017Copyright © 2018 Boeing. All rights reserved.
Interservice / Industry Training, Simulation & Education Conference 2018
• Feature relations: Make sure the features selected to use in the model are not the same features you are trying to predict. – For example, if you want to predict a final course grade, using the assignments and tests
leading to that grade would be nonsensical. Need to look at other aspects, such as why is a group performing lower than they should?
• Look at pre-existing sets of variables, and available domain expert knowledge to pick better variables. Evolve and test the feature set to create better models.
• When establishing features, may compare previous behaviors against later ones. – If some performance history is known, then can look at the mean of an activity and note if
performance falls below or above that norm.• Features may have different semantics based on context.
– For example, clarify if the training material was viewed for the first time before or during the actual training, as this may impact results.
Feature Considerations
Liz Gehr & Laurie Dunagan, Boeing 33
Month XX, 2017Copyright © 2018 Boeing. All rights reserved.
Interservice / Industry Training, Simulation & Education Conference 2018
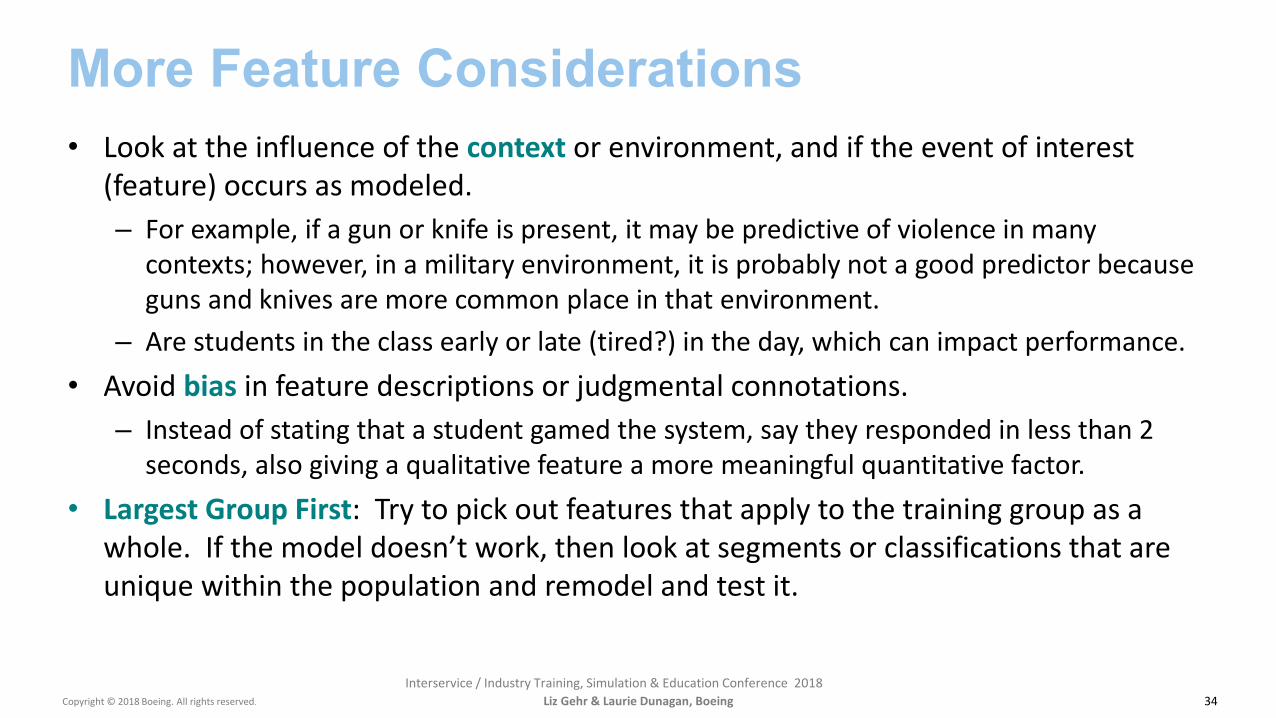
• Look at the influence of the context or environment, and if the event of interest (feature) occurs as modeled.– For example, if a gun or knife is present, it may be predictive of violence in many
contexts; however, in a military environment, it is probably not a good predictor because guns and knives are more common place in that environment.
– Are students in the class early or late (tired?) in the day, which can impact performance.• Avoid bias in feature descriptions or judgmental connotations.
– Instead of stating that a student gamed the system, say they responded in less than 2 seconds, also giving a qualitative feature a more meaningful quantitative factor.
• Largest Group First: Try to pick out features that apply to the training group as a whole. If the model doesn’t work, then look at segments or classifications that are unique within the population and remodel and test it.
More Feature Considerations
Liz Gehr & Laurie Dunagan, Boeing 34

Month XX, 2017Copyright © 2018 Boeing. All rights reserved.
Interservice / Industry Training, Simulation & Education Conference 2018
Identify Features from the Training Data That Is Available
35
Other???
Trainee Demographics
TrainingCharacteristics
Course History
Performance History
Keystrokes
Feedback
Instructor Demographic & Experience
Trainee Experience &
Cert.
Training Data
Liz Gehr & Laurie Dunagan, Boeing
Month XX, 2017Copyright © 2018 Boeing. All rights reserved.
Interservice / Industry Training, Simulation & Education Conference 2018
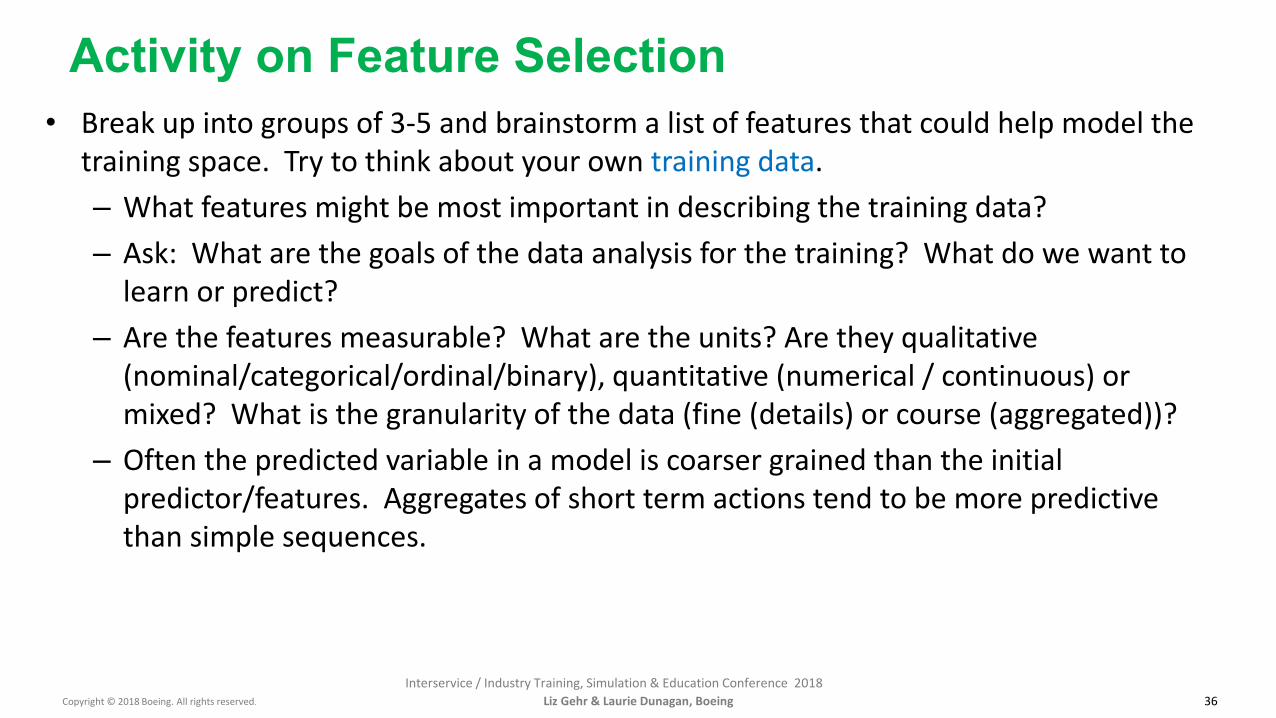
• Break up into groups of 3-5 and brainstorm a list of features that could help model the training space. Try to think about your own training data.– What features might be most important in describing the training data?– Ask: What are the goals of the data analysis for the training? What do we want to
learn or predict?– Are the features measurable? What are the units? Are they qualitative
(nominal/categorical/ordinal/binary), quantitative (numerical / continuous) or mixed? What is the granularity of the data (fine (details) or course (aggregated))?
– Often the predicted variable in a model is coarser grained than the initial predictor/features. Aggregates of short term actions tend to be more predictive than simple sequences.
Activity on Feature Selection
Liz Gehr & Laurie Dunagan, Boeing 36

Month XX, 2017Copyright © 2018 Boeing. All rights reserved.
Interservice / Industry Training, Simulation & Education Conference 2018
What Features Did You Identify?
Liz Gehr & Laurie Dunagan, Boeing 37

Month XX, 2017Copyright © 2018 Boeing. All rights reserved.
Interservice / Industry Training, Simulation & Education Conference 2018
Identified Features of the Training Data
38
Training Data
Trainee Demographic
Training Characteristics
Performance History
Trainee Experience
& Cert.
Instructor Demographic & Experience
Keystrokes
Trainee Feedback
Course History
• Past lessons and perf.• Current attempt no.• Remedial takes• Objective• …
• Difficulty• Delivery method (e.g.,
classroom, computer)• Resource (e.g.,
simulator, aircraft)• …
• Version• Content • Objective/scope• …
• Gender, age, education,…• Affiliation • Nationality • Rank • …• Certification (e.g.,
737)• Experience (e.g., 5k
FH on C-17)• …
• Gender, age, • Education,…• Affiliation • Nationality • Rank • …
• Free-form text• Pre-specified choice• …
• Time between…• Corrections…• …
Numeric/Continuous (bounded,unbounded, count…)
Categorical (binary, nominal, ordinal)
Mixed (can be either)
Liz Gehr & Laurie Dunagan, Boeing
Month XX, 2017Copyright © 2018 Boeing. All rights reserved.
Interservice / Industry Training, Simulation & Education Conference 2018
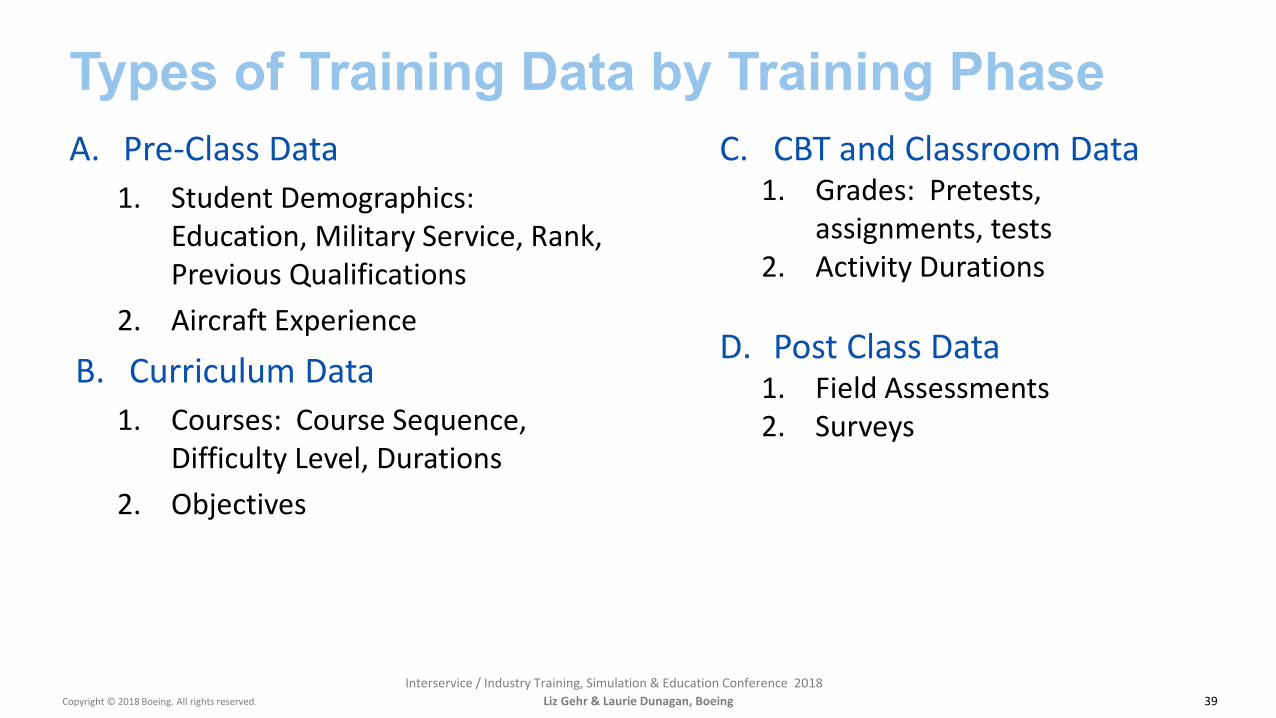
A. Pre-Class Data1. Student Demographics:
Education, Military Service, Rank, Previous Qualifications
2. Aircraft Experience
B. Curriculum Data1. Courses: Course Sequence,
Difficulty Level, Durations2. Objectives
Types of Training Data by Training Phase
39
C. CBT and Classroom Data1. Grades: Pretests,
assignments, tests2. Activity Durations
D. Post Class Data1. Field Assessments2. Surveys
Liz Gehr & Laurie Dunagan, Boeing
Month XX, 2017Copyright © 2018 Boeing. All rights reserved.
Interservice / Industry Training, Simulation & Education Conference 2018
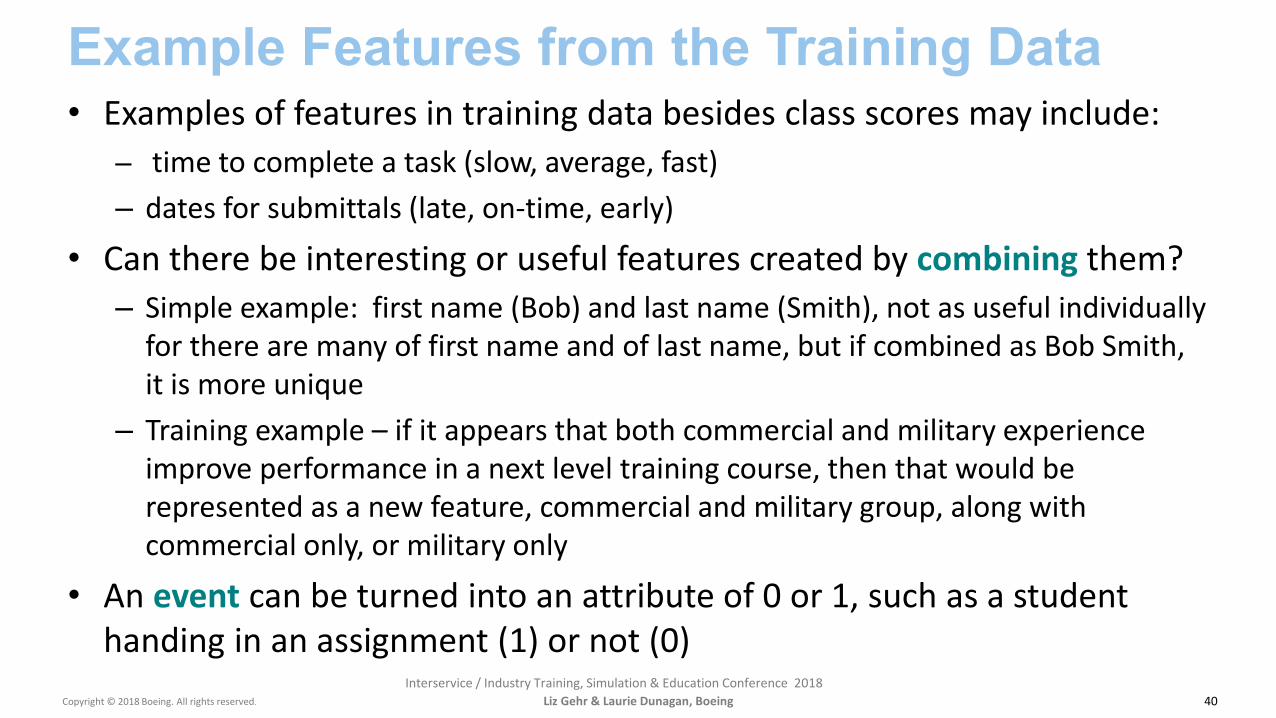
• Examples of features in training data besides class scores may include:– time to complete a task (slow, average, fast)– dates for submittals (late, on-time, early)
• Can there be interesting or useful features created by combining them?– Simple example: first name (Bob) and last name (Smith), not as useful individually
for there are many of first name and of last name, but if combined as Bob Smith, it is more unique
– Training example – if it appears that both commercial and military experience improve performance in a next level training course, then that would be represented as a new feature, commercial and military group, along with commercial only, or military only
• An event can be turned into an attribute of 0 or 1, such as a student handing in an assignment (1) or not (0)
Example Features from the Training Data
Liz Gehr & Laurie Dunagan, Boeing 40

Month XX, 2017Copyright © 2018 Boeing. All rights reserved.
Interservice / Industry Training, Simulation & Education Conference 2018
• Examples Specific to Training Results:• Completions (pass/fail)• Lesson scores• Objective scores• Question responses• Time
- In lesson- On each screen- For each response
• Number and Types of Hints requested• Consider Operational Results
• Link performance measurements on the job to feed back into the system and enhance training
Feature Data for Training Analytics
41Liz Gehr & Laurie Dunagan, Boeing

Month XX, 2017Copyright © 2018 Boeing. All rights reserved.
Interservice / Industry Training, Simulation & Education Conference 2018
• Data coming from multiple sources– LMS (Learning Management System)– LRS (Learning Record Store)
• xAPI statements– Unstructured Data – documents, Hadoop or NoSQL Database– Demographic information– Simulator information / IoT (Internet of Things) Information
• Gather disparate data together– Transactional, Relational Database – for current data being added
• Dashboards can pull most recent data to give current performance insights– Data Warehouse, Dimensional Database – historical training data
• Better for analysis, tables are collapsed, easier to query by eliminating joins and ideal for selecting a large amount of rows
How to House Training Data for Analytics?
42Liz Gehr & Laurie Dunagan, Boeing

Month XX, 2017Copyright © 2018 Boeing. All rights reserved.
Interservice / Industry Training, Simulation & Education Conference 2018
Learning Management Systems (LMS)
43
• Manage users, roles, courses, instructors, and facilities, and generate reports• Course calendar• Messaging and notifications• Assessments• Display scores and transcripts• Grading and roster processing• Web-based or blended course delivery
• Characteristics specific to corporate learning:• Auto-enrollment• Manager enrollment and approval• Integration with performance tracking and management systems• Identify skill gaps• Curriculum for training requirements at an individual and organizational level• Demographic-unit based grouping
Liz Gehr & Laurie Dunagan, Boeing

Month XX, 2017Copyright © 2018 Boeing. All rights reserved.
Interservice / Industry Training, Simulation & Education Conference 2018
• According to some estimates, it is a $10+ billion industry• Some top Learning Management Systems (LMS):
– Adobe Captivate Prime – can connect learning goals to training– Litmos – integrates easily with other apps, personalized learning paths– TalentLMS – some analytics, blended learning supports many content types (ie. TinCan)– Docebo – builds a user-generated knowledge base of questions/answers– iSpring Learn – cloud solution with unlimited storage space, rich authoring tool– Looop – induction built in to provide student resources based on progress, popular– Absorb – easy to use, smart design of complex interactions– Blackboard – categorize learners, desktop or mobile, cloud UI, integrates social learning– Brightspace – predictive modeling, MOOC support– eFront – advanced security and extensive customization
Learning Management Systems as an Industry
44Liz Gehr & Laurie Dunagan, Boeing
https://elearningindustry.com/the-20-best-learning-management-systems

Month XX, 2017Copyright © 2018 Boeing. All rights reserved.
Interservice / Industry Training, Simulation & Education Conference 2018
• Designed to record more diverse learning experiences – not just classroom learning– Actor – Verb – Subject format, known as the “I did this” format– Example: John Smith read the article “What is xAPI”
• xAPI data are stored in a Learning Record Store (LRS), often JSON format• DoDI 1322.26 directs the use of xAPI• Part of the Total Learning Architecture (TLA)
– An emerging standard for sharing learning data between applications sponsored by ADL (Advanced Distributed Learning) Initiative
• https://www.adlnet.gov/tla/• Freed, M., Folsom-Kovarik, J. T., & Schatz, S. (2017). More Than the Sum of Their Parts: Case Study and General
Approach for Integrating Learning Applications. In Proceedings of the 2017 Modeling and Simulation Conference.
Learning Record Store - Experience API (xAPI) option (application programming interface)
Liz Gehr & Laurie Dunagan, Boeing 45
Month XX, 2017Copyright © 2018 Boeing. All rights reserved.
Interservice / Industry Training, Simulation & Education Conference 2018
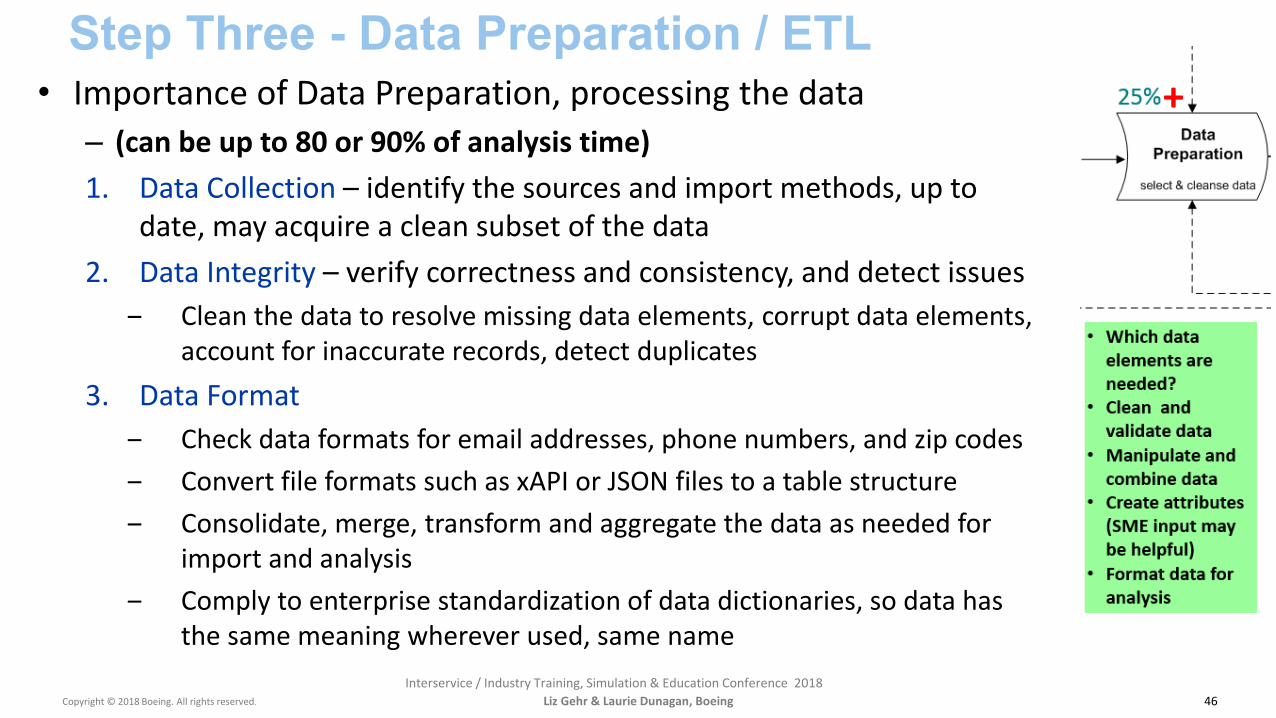
• Importance of Data Preparation, processing the data – (can be up to 80 or 90% of analysis time)1. Data Collection – identify the sources and import methods, up to
date, may acquire a clean subset of the data2. Data Integrity – verify correctness and consistency, and detect issues
‒ Clean the data to resolve missing data elements, corrupt data elements, account for inaccurate records, detect duplicates
3. Data Format‒ Check data formats for email addresses, phone numbers, and zip codes‒ Convert file formats such as xAPI or JSON files to a table structure ‒ Consolidate, merge, transform and aggregate the data as needed for
import and analysis‒ Comply to enterprise standardization of data dictionaries, so data has
the same meaning wherever used, same name
Step Three - Data Preparation / ETL
Liz Gehr & Laurie Dunagan, Boeing 46
+

Month XX, 2017Copyright © 2018 Boeing. All rights reserved.
Interservice / Industry Training, Simulation & Education Conference 2018
• Create data maps:– Sources to destination, identifying the data flow– Align data to data models and dictionaries
• defined data objects (attributes, fields, semantics)• how data is persisted in the data repository• label the data, metadata
• Approve record creation to avoid duplicates /incorrect entries• Have rules for:
– How the data fields should be populated– Correct data formatting/merging of records as needed
• Data Mapping and ETL tools include: E/R Studio, IBM DataStage, Talend, SSIS), Hive, SAS Data Mgmt, Data Wrangler/Trifacta, Visio
Standardize the Data
Liz Gehr & Laurie Dunagan, Boeing 47
E/R Studio
SSIS
Month XX, 2017Copyright © 2018 Boeing. All rights reserved.
Interservice / Industry Training, Simulation & Education Conference 2018
• Missing Values– The presence of missing values reduces the data that is available to be
analyzed, particularly in small datasets– Missing values can also cause significant bias in the results, and degrade the
efficiency/usage of the data
• Handling Missing Values1. Ignore Missing Values: If the sample size is large, it may be possible to just
ignore the missing values and not include the data for simplicity, known as listwise deletion. A variation of this is pairwise deletion, which removes missing values for required analysis, but leaves them for cases when all variables are present.
2. Use Logical Default Values: Based on having expert knowledge of the data, or a dummy indicator variable (1 – missing, others – 0)
Data Preparation - Missing Values
Liz Gehr & Laurie Dunagan, Boeing 48

Month XX, 2017Copyright © 2018 Boeing. All rights reserved.
Interservice / Industry Training, Simulation & Education Conference 2018
3. Use statistical methods: Possible to substitute the missing values with reasonable estimated values based on other available data, known as imputation analysis
a. Explicit modeling approach – assumes that variables have a certain predictive distribution and estimates the parameters of each distribution, using mean, median, probability, ratio, regression and assumption of distribution
b. Implicit modeling approach – uses a computed algorithm to generate possible values
Data Preparation – Missing Values
Liz Gehr & Laurie Dunagan, Boeing 49
Month XX, 2017Copyright © 2018 Boeing. All rights reserved.
Interservice / Industry Training, Simulation & Education Conference 2018
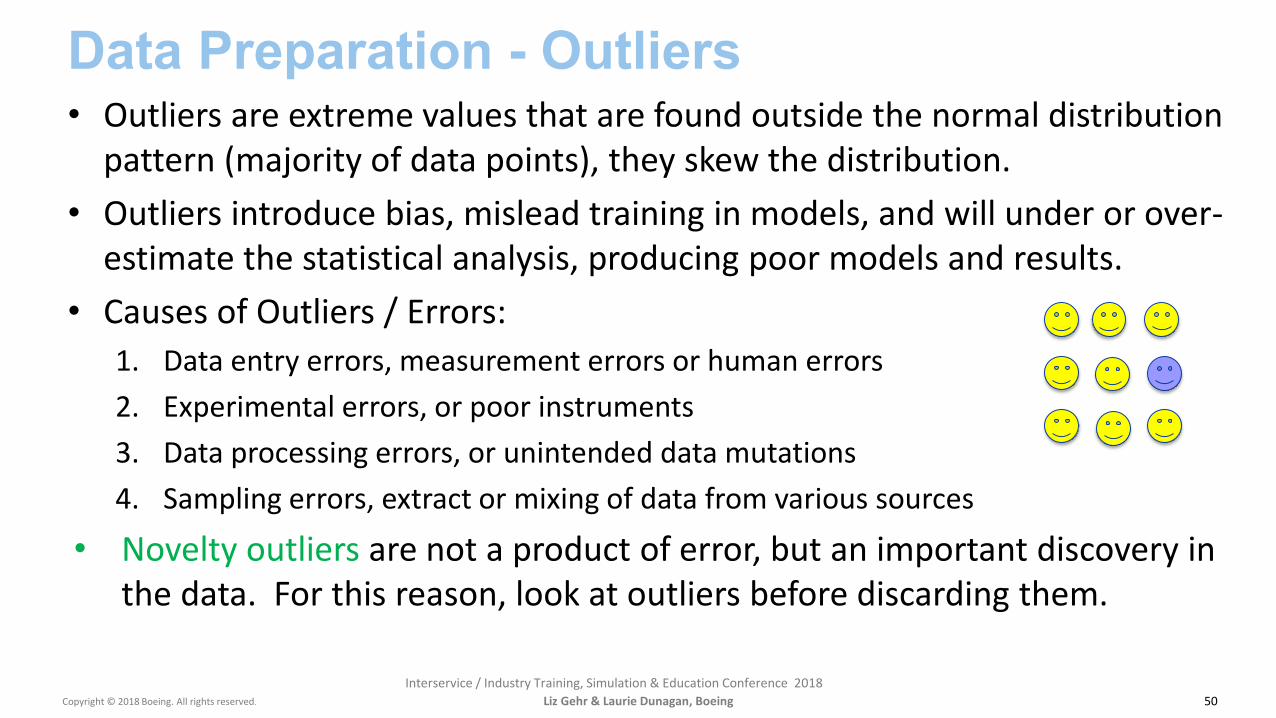
• Outliers are extreme values that are found outside the normal distribution pattern (majority of data points), they skew the distribution.
• Outliers introduce bias, mislead training in models, and will under or over-estimate the statistical analysis, producing poor models and results.
• Causes of Outliers / Errors:1. Data entry errors, measurement errors or human errors2. Experimental errors, or poor instruments3. Data processing errors, or unintended data mutations4. Sampling errors, extract or mixing of data from various sources
• Novelty outliers are not a product of error, but an important discovery in the data. For this reason, look at outliers before discarding them.
Data Preparation - Outliers
Liz Gehr & Laurie Dunagan, Boeing 50
Month XX, 2017Copyright © 2018 Boeing. All rights reserved.
Interservice / Industry Training, Simulation & Education Conference 2018
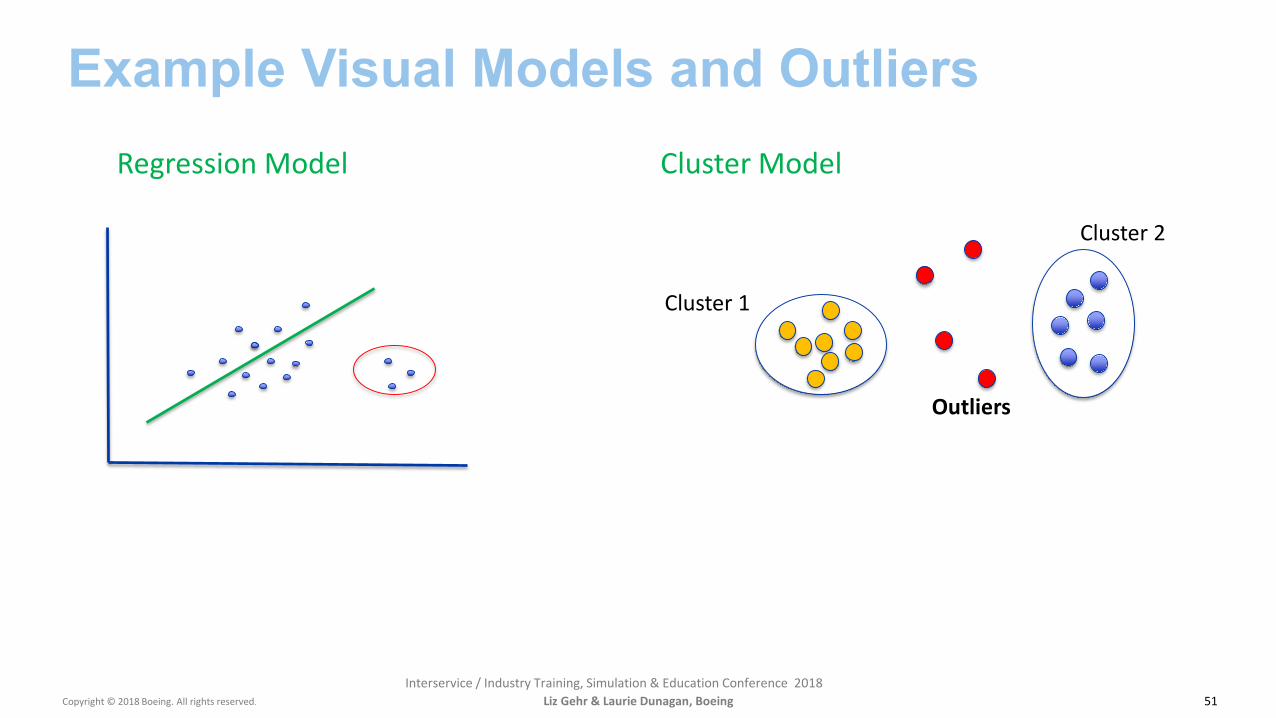
Example Visual Models and Outliers
Liz Gehr & Laurie Dunagan, Boeing 51
Regression Model Cluster Model
Cluster 1
Cluster 2
Outliers
Month XX, 2017Copyright © 2018 Boeing. All rights reserved.
Interservice / Industry Training, Simulation & Education Conference 2018
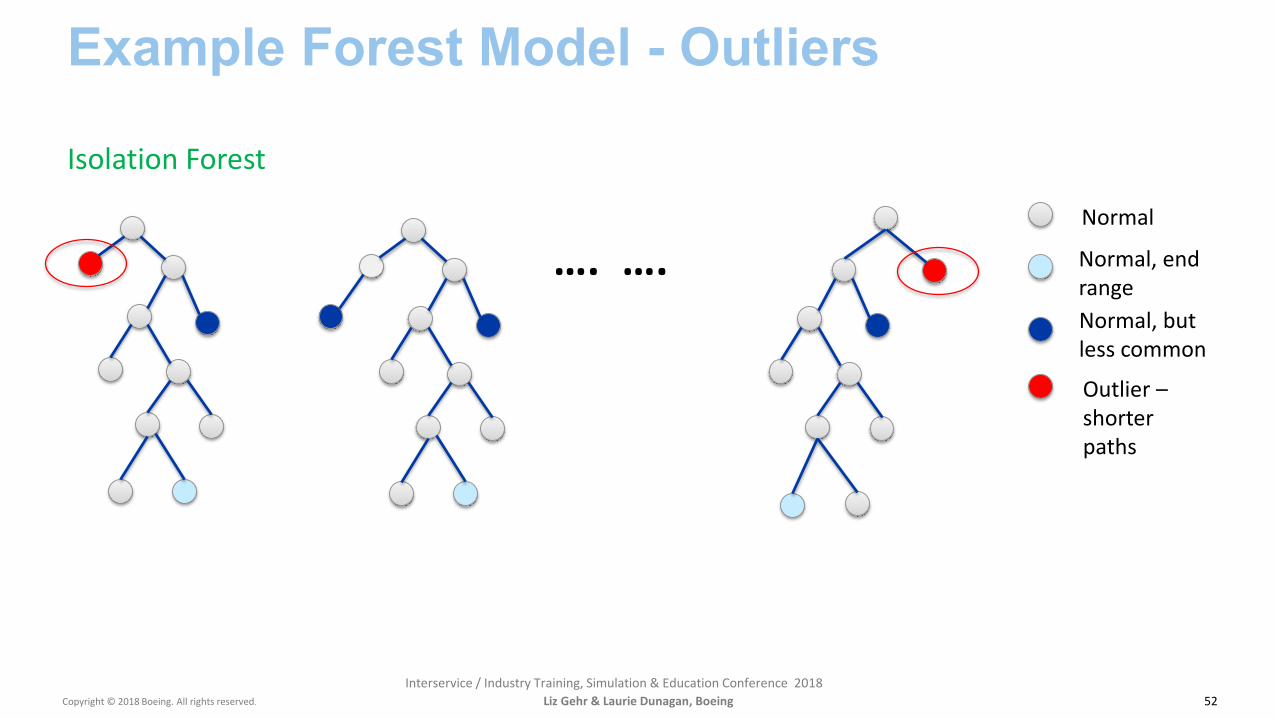
Example Forest Model - Outliers
Liz Gehr & Laurie Dunagan, Boeing 52
…. ….Normal
Normal, but less common
Outlier –shorter paths
Normal, end range
Isolation Forest
Month XX, 2017Copyright © 2018 Boeing. All rights reserved.
Interservice / Industry Training, Simulation & Education Conference 2018
Outliers are often handled in similar ways to missing data.1. Remove or trim the outliers from the data set, but increases bias (under/over-
estimation)2. Down-weight the outliers3. Replace the values with other expected values4. Replace the outlier with the largest or smallest normal observations, or with a
winsorized estimation mean (replace extreme values with the values before and take the mean)
5. Robust estimation can be used when the distribution is known. May use M-estimation(maximum likelihood, based on a weighted mean), L-estimation(linear), R-estimation (rank-test); cost of robust estimation is the confidence interval is wide.
Treatment of Outliers
Liz Gehr & Laurie Dunagan, Boeing 53
Copyright © 2018 Boeing. All rights reserved.
Boeing Global Services | Training and Professional Services
Interservice / Industry Training, Simulation & Education Conference 2018
Visualizations
Liz Gehr & Laurie Dunagan, Boeing54
Month XX, 2017Copyright © 2018 Boeing. All rights reserved.
Interservice / Industry Training, Simulation & Education Conference 2018
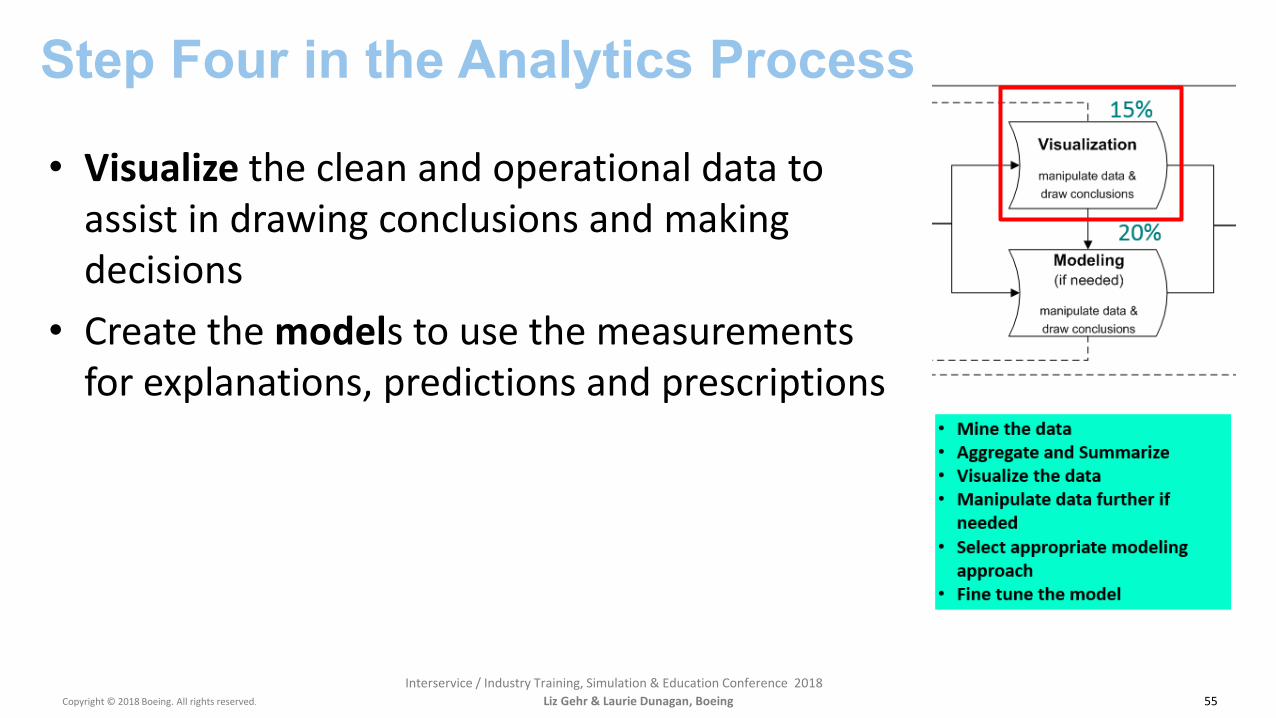
• Visualize the clean and operational data to assist in drawing conclusions and making decisions
• Create the models to use the measurements for explanations, predictions and prescriptions
Step Four in the Analytics Process
Liz Gehr & Laurie Dunagan, Boeing 55
Month XX, 2017Copyright © 2018 Boeing. All rights reserved.
Interservice / Industry Training, Simulation & Education Conference 2018
• Goal: to tell a clear, concise story with the data• Characteristics:
1. Simple - easy to read and understand 1. Not too cluttered2. Flows well, easy to follow start to end
2. Color – less is more, it should be used as a highlight to point out relevant data points, too much color is distracting
3. Fonts – use readable ones, such as Helvetica and Times for large blocks of text, decorative fonts can be used sparingly for titles or headers, but be within the tone (formal, business, casual)• Weight and SIZE can bring organization and emphasis
What makes a good visualization?
Liz Gehr & Laurie Dunagan, Boeing 56
Boeing Global Services | Training and Professional Services
Copyright © 2018 Boeing. All rights reserved.Interservice / Industry Training, Simulation & Education Conference 2018
•Poll: ‒What kinds of visualizations have you created or used?‒Which ones are your favorites and why?
Visualizations
Liz Gehr & Laurie Dunagan, Boeing 57
Month XX, 2017Copyright © 2018 Boeing. All rights reserved.
Interservice / Industry Training, Simulation & Education Conference 2018
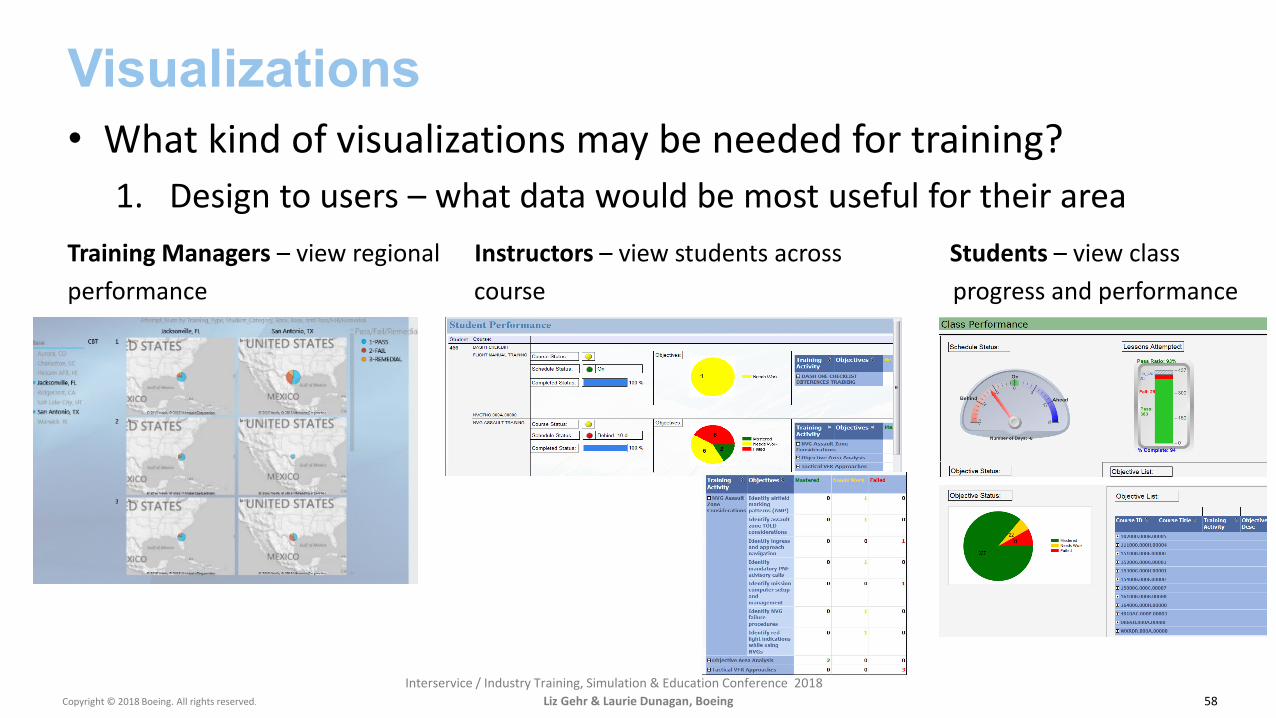
• What kind of visualizations may be needed for training?1. Design to users – what data would be most useful for their area
Training Managers – view regional Instructors – view students across Students – view classperformance course progress and performance
Visualizations
Liz Gehr & Laurie Dunagan, Boeing 58
Month XX, 2017Copyright © 2018 Boeing. All rights reserved.
Interservice / Industry Training, Simulation & Education Conference 2018
• Chart Types – there are a handful of chart types that have been provento be most effective because they are simple and easy to understand. – Creative charts
• Often not intuitive• Take time to understand• Harder to remember• Users often decide within seconds to move on if they don’t get it quickly
• Resources for Visualization Tips1. Art + Data by Tableau2. The Big Book of Dashboards by Steve Wexler, Jeffrey Shaffer3. Storytelling with Data by Cole Nussbaumer Knaflic4. Now You See It by Stephen Few
Visualizations
Liz Gehr & Laurie Dunagan, Boeing 59

Month XX, 2017Copyright © 2018 Boeing. All rights reserved.
Interservice / Industry Training, Simulation & Education Conference 2018
• What charts or graphs best describe the data?1. Bar Chart – best for comparing numbers, frequencies, means and
measurements that are in discrete groups
2. Line Graph – useful for displaying patterns and trends over time
Visualizations
Liz Gehr & Laurie Dunagan, Boeing 60
Hours
Month XX, 2017Copyright © 2018 Boeing. All rights reserved.
Interservice / Industry Training, Simulation & Education Conference 2018
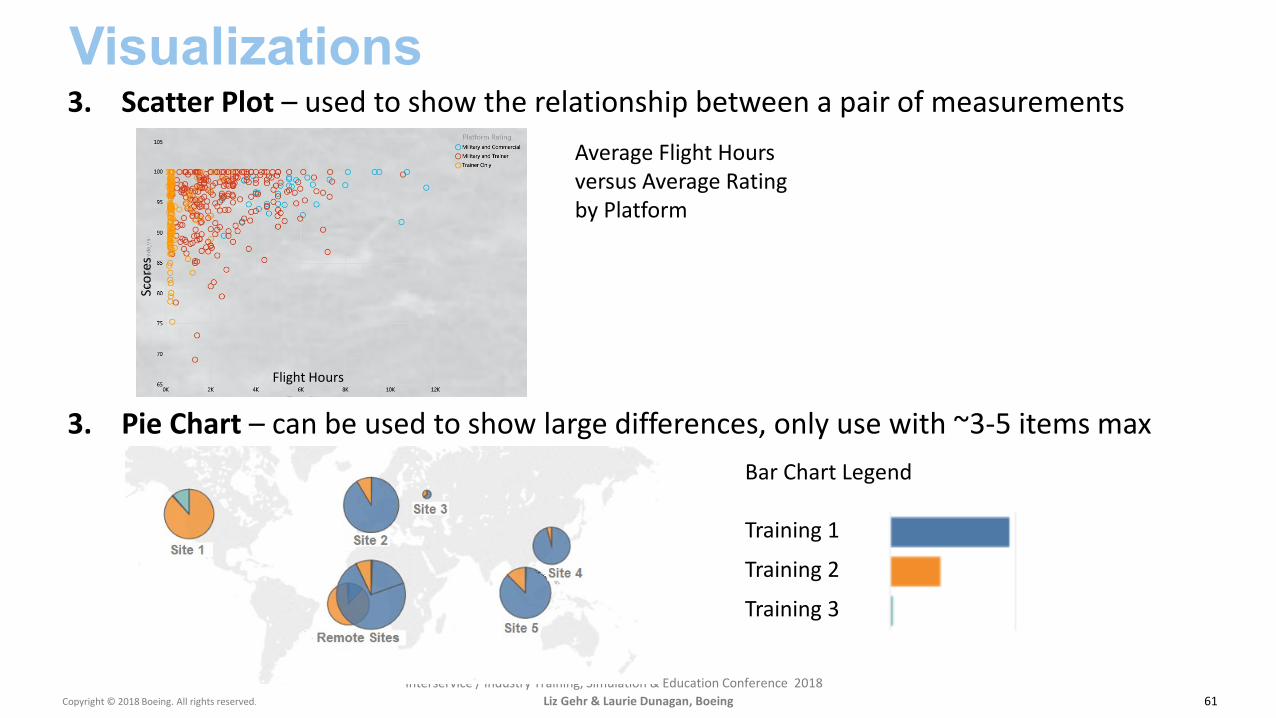
3. Scatter Plot – used to show the relationship between a pair of measurements
3. Pie Chart – can be used to show large differences, only use with ~3-5 items max
Visualizations
Liz Gehr & Laurie Dunagan, Boeing 61
Average Flight Hours versus Average Rating by Platform
Bar Chart Legend
Scor
es
Flight Hours
Training 1
Training 2
Training 3

Month XX, 2017Copyright © 2018 Boeing. All rights reserved.
Interservice / Industry Training, Simulation & Education Conference 2018
5. Heat Map – points out the weight of a number by color
6. Gantt Chart – useful for mapping out events by dates
Visualizations
Liz Gehr & Laurie Dunagan, Boeing 62

Month XX, 2017Copyright © 2018 Boeing. All rights reserved.
Interservice / Industry Training, Simulation & Education Conference 2018
Pulling it all together into a dashboard visualizationVisualizations
Liz Gehr & Laurie Dunagan, Boeing 63
Month XX, 2017Copyright © 2018 Boeing. All rights reserved.
Interservice / Industry Training, Simulation & Education Conference 2018
• Keep informed of how the students or training campuses are doing with automated alerts.
• Based on certain thresholds or KPIs (Key Performance Indicators) on a data attribute, the data processing step or the update of the dashboard, can send out an alert, either as an email or a visual highlight.
• Software programs used in any of the steps could also send out an alert when an error is encountered.
Automated Alerts
Liz Gehr & Laurie Dunagan, Boeing 64

Copyright © 2018 Boeing. All rights reserved.
Boeing Global Services | Training and Professional Services
Interservice / Industry Training, Simulation & Education Conference 2018
Building Models
Liz Gehr & Laurie Dunagan, Boeing65

Copyright © 2018 Boeing. All rights reserved.
Boeing Global Services | Training and Professional Services
Interservice / Industry Training, Simulation & Education Conference 2018
• Poll:‒What are your ideas on what an analytical model is?
Building Models
Liz Gehr & Laurie Dunagan, Boeing 66
Month XX, 2017Copyright © 2018 Boeing. All rights reserved.
Interservice / Industry Training, Simulation & Education Conference 2018
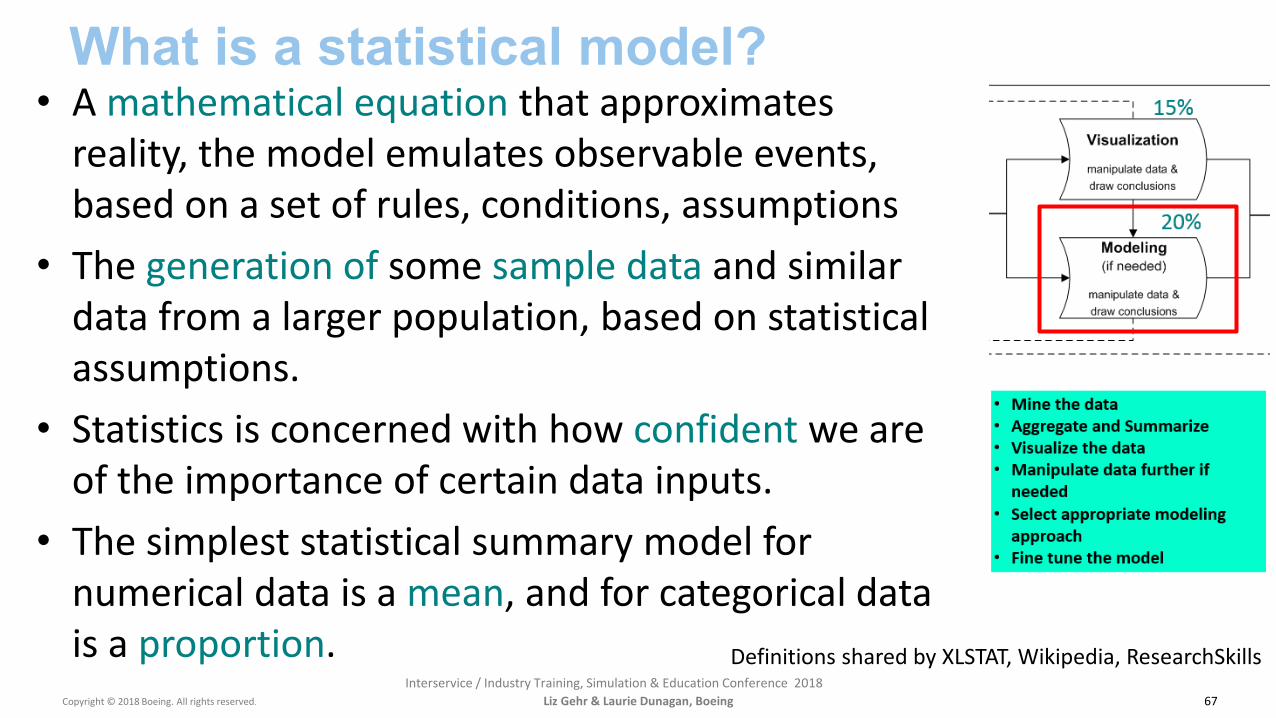
• A mathematical equation that approximates reality, the model emulates observable events, based on a set of rules, conditions, assumptions
• The generation of some sample data and similar data from a larger population, based on statistical assumptions.
• Statistics is concerned with how confident we are of the importance of certain data inputs.
• The simplest statistical summary model for numerical data is a mean, and for categorical data is a proportion.
What is a statistical model?
Liz Gehr & Laurie Dunagan, Boeing 67
Definitions shared by XLSTAT, Wikipedia, ResearchSkills
Month XX, 2017Copyright © 2018 Boeing. All rights reserved.
Interservice / Industry Training, Simulation & Education Conference 2018
• An analytical model is also a mathematical equation, which describes relationships among variables in a historical data set, which either estimates or classifies the data values. It often ties in data mining, statistics and machine learning.
• Analytical models contain algorithms of various types, exploratory and predictive.– Neural networks– Decision Trees– Clustering– Linear Regression – Logistic Regression
• Analytical and Statistical Tools: Python, R, SAS, Excel
What Is an Analytical Model?
Liz Gehr & Laurie Dunagan, Boeing 68
http://www.b-eye-network.com/blogs/eckerson/archives/business_analyt/

Month XX, 2017Copyright © 2018 Boeing. All rights reserved.
Interservice / Industry Training, Simulation & Education Conference 2018
• Target: It is important to define what the target of the model is early on, and the intended usage of the model. – For example, are you modeling for what will happen in the next course or in
the next year? – Are you modeling for a class of students or for all students of a program?– In a predictive model, what is the target prediction, and does the data and
model support it?
• Grain Size: Work on the variables at the appropriate grain size. – Try the most generalized model first, then, if the model doesn’t work across
groups, then identify the one(s) that it doesn’t work on and develop a model as needed for that group, based on the first model outcome, and the unique features.
Model Considerations
Liz Gehr & Laurie Dunagan, Boeing 69
Month XX, 2017Copyright © 2018 Boeing. All rights reserved.
Interservice / Industry Training, Simulation & Education Conference 2018
• Noise: Look at patterns and relationships in the model that don’t make sense.– For example, a person’s birthdate and age have perfect correlation because
they are essentially the same variable. Just use one in the model.• Value: Consider the value of the model in terms of cost and efficiency.
– The most statistically significant model may not be the most impactful. It may take a long time to build and be expensive.
– A model’s ease of implementation or distribution and repeatability may often provide the most value. Decide what statistical margin of error is acceptable.
– If it isn’t repeatable over time or if it is too complex to maintain, then it will not provide value.
Model Considerations
Liz Gehr & Laurie Dunagan, Boeing 70
Month XX, 2017Copyright © 2018 Boeing. All rights reserved.
Interservice / Industry Training, Simulation & Education Conference 2018
• Main Goal: Choose one or more analytical techniques to fulfill the goal of the project.
• Model Selection is based on three main factors1. Type of Variables (quantitative - numeric, qualitative - categorical, mixed)2. Number of Variables (univariate, bivariate, multivariate)
‒ The underlying structure of the independent variables in relation to the dependent variable determines the power and longevity of a model.
3. Objective/Goal of Analysis – what question is being answered
• Models are evaluated for goodness of fit (model best fits a set of observations – Chi-Squared Test), simplicity and fitting the curve (curve best describes the function of generated points).
Which Model Type to Choose?
Liz Gehr & Laurie Dunagan, Boeing 71

Month XX, 2017Copyright © 2018 Boeing. All rights reserved.
Interservice / Industry Training, Simulation & Education Conference 2018
• A data set with a qualitative variable, such as gender, can be used in an ANOVAmodel (analysis of variance), where the independent variable is qualitative (gender) and the dependent variable is quantitative, the measure of interest. It measures the differences or variations between groups’ mean values. For example, we could test if males score higher in engineering courses than females. – Similar to a t-test, which also tests a hypothesis, only two groups compared; ANOVA
can be used when two or more groups are compared.
• A quantitative variable, such as age, may describe a group in a linear fashion for learning, so a linear regression model could be useful.
• If counts are included in the data, such as the number of graduates at a school, a log-linear regression (Poisson Distribution) model may work to explain or predict the number of graduates for certain programs.
Model Types
Liz Gehr & Laurie Dunagan, Boeing 72

Month XX, 2017Copyright © 2018 Boeing. All rights reserved.
Interservice / Industry Training, Simulation & Education Conference 2018
• K-Nearest Neighbors (K-Means) – used for classification and regression, where the output assigns objects to classes, or gives a property value, which is the average of the values of the nearest neighbors.
• Naïve Bayes – a family of algorithms that is based on Bayes Theorem, where each feature is independent and each contributes to the probability of an event or prediction. P(A|B) = P(B|A) * P(A) / P(B)
• Random Forest (Decision Trees) – may be used for classification and regression to make predictions, where each tree is created with a random parameter.
Model Types
Liz Gehr & Laurie Dunagan, Boeing 73
A B
AnB
Y N
Y N?
?
TM1*
TM2 TM3* TM=terminal node
Month XX, 2017Copyright © 2018 Boeing. All rights reserved.
Interservice / Industry Training, Simulation & Education Conference 2018
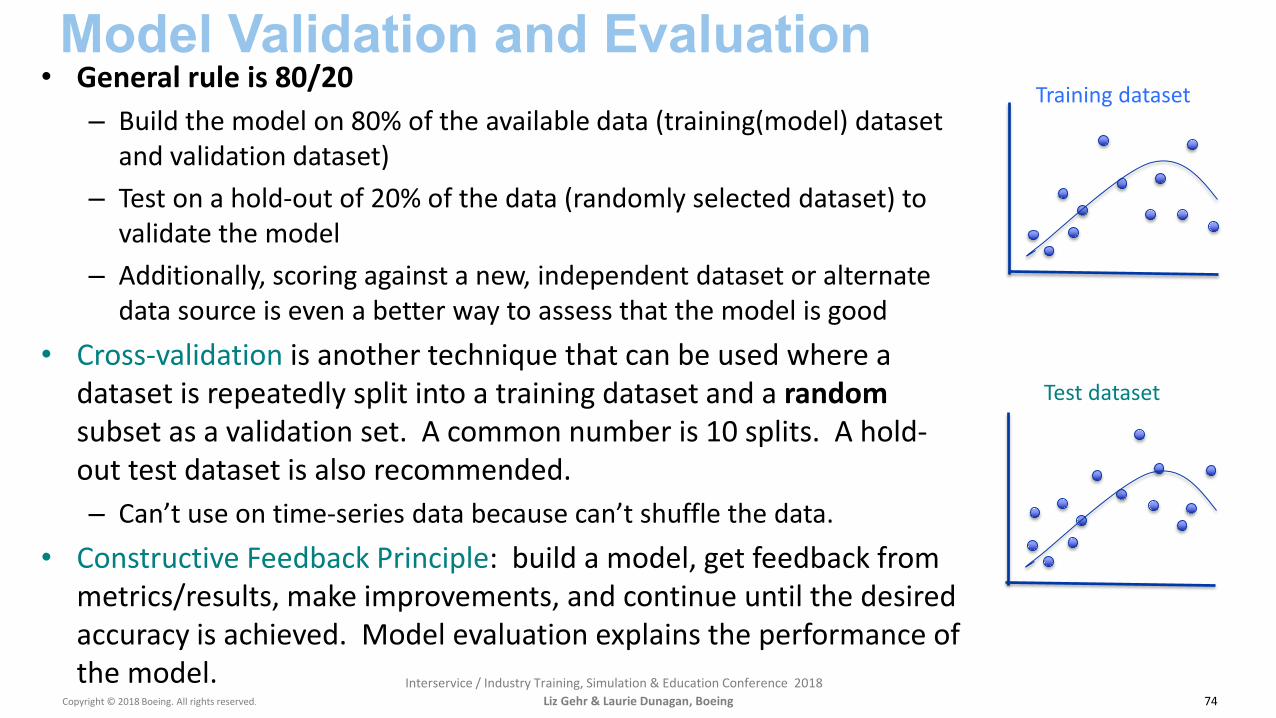
• General rule is 80/20– Build the model on 80% of the available data (training(model) dataset
and validation dataset) – Test on a hold-out of 20% of the data (randomly selected dataset) to
validate the model– Additionally, scoring against a new, independent dataset or alternate
data source is even a better way to assess that the model is good• Cross-validation is another technique that can be used where a
dataset is repeatedly split into a training dataset and a randomsubset as a validation set. A common number is 10 splits. A hold-out test dataset is also recommended. – Can’t use on time-series data because can’t shuffle the data.
• Constructive Feedback Principle: build a model, get feedback from metrics/results, make improvements, and continue until the desired accuracy is achieved. Model evaluation explains the performance of the model.
Model Validation and Evaluation
Liz Gehr & Laurie Dunagan, Boeing 74
Training dataset
Test dataset
Month XX, 2017Copyright © 2018 Boeing. All rights reserved.
Interservice / Industry Training, Simulation & Education Conference 2018
• Does the model appear valid and accurate on the dataset?• Do the model results match up to expected outputs when reviewed by
the subject matter/domain experts?• Does the model sufficiently address the business problem and meet the
project goals?• Have any mistakes become evident?• Is more data or input needed for the model to perform as expected?• Can the model be deployed in a runtime environment?• Should another model or design be considered and tested?
– May need to try many combinations of variables and techniques to get the final model with sufficient predictive value
Model Evaluation
Liz Gehr & Laurie Dunagan, Boeing 75

Copyright © 2018 Boeing. All rights reserved.
Boeing Global Services | Training and Professional Services
Interservice / Industry Training, Simulation & Education Conference 2018
Example Training Model
Liz Gehr & Laurie Dunagan, Boeing76
Month XX, 2017Copyright © 2018 Boeing. All rights reserved.
Interservice / Industry Training, Simulation & Education Conference 2018
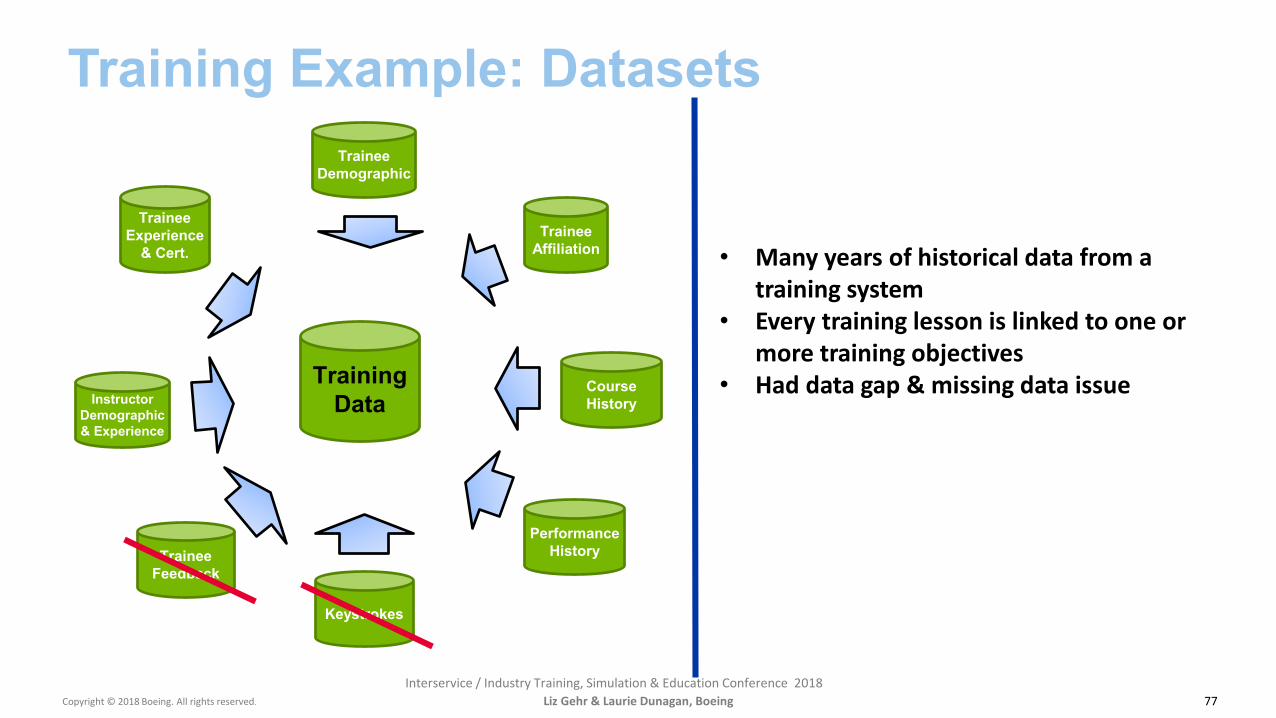
Training Example: Datasets
77
Training Data
Trainee Demographic
Trainee Affiliation
Performance History
Trainee Experience
& Cert.
Instructor Demographic & Experience
Keystrokes
Trainee Feedback
Course History
• Many years of historical data from a training system
• Every training lesson is linked to one or more training objectives
• Had data gap & missing data issue
Liz Gehr & Laurie Dunagan, Boeing
Month XX, 2017Copyright © 2018 Boeing. All rights reserved.
Interservice / Industry Training, Simulation & Education Conference 2018
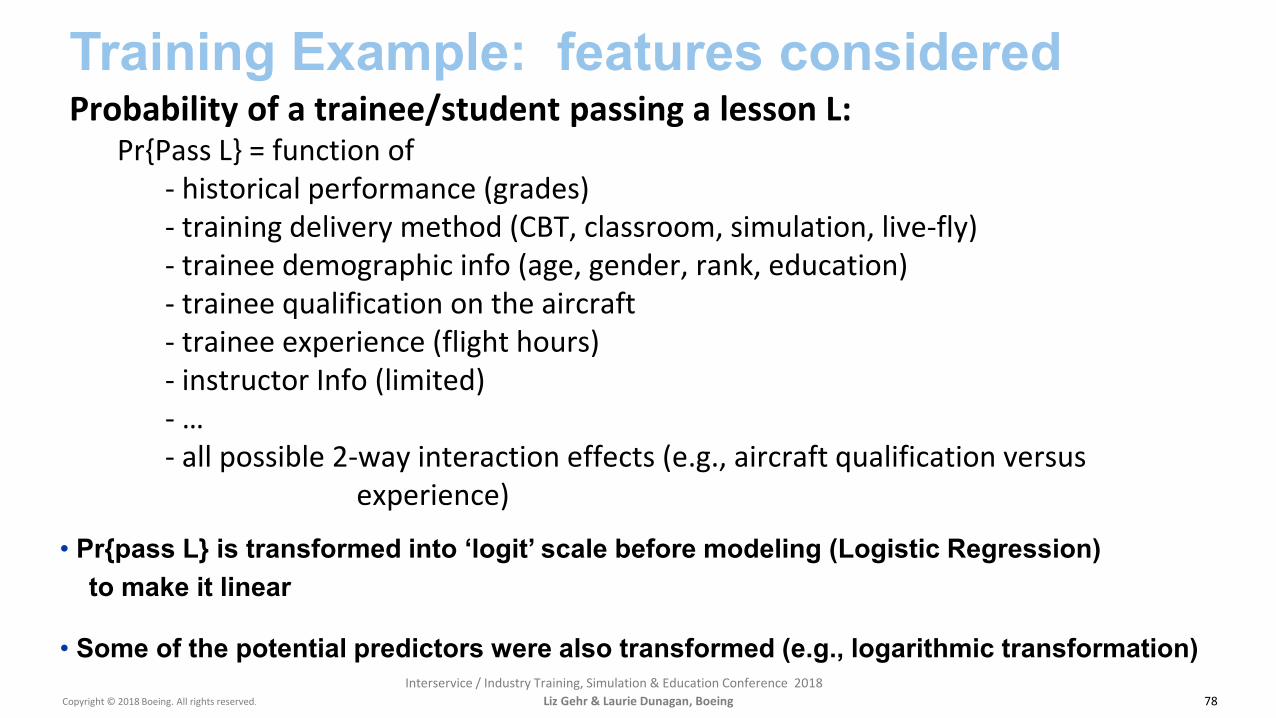
Training Example: features considered
78
Probability of a trainee/student passing a lesson L:Pr{Pass L} = function of
- historical performance (grades)- training delivery method (CBT, classroom, simulation, live-fly)- trainee demographic info (age, gender, rank, education)- trainee qualification on the aircraft- trainee experience (flight hours)- instructor Info (limited)- …- all possible 2-way interaction effects (e.g., aircraft qualification versus
experience)
• Pr{pass L} is transformed into ‘logit’ scale before modeling (Logistic Regression) to make it linear
• Some of the potential predictors were also transformed (e.g., logarithmic transformation)
Liz Gehr & Laurie Dunagan, Boeing
Month XX, 2017Copyright © 2018 Boeing. All rights reserved.
Interservice / Industry Training, Simulation & Education Conference 2018
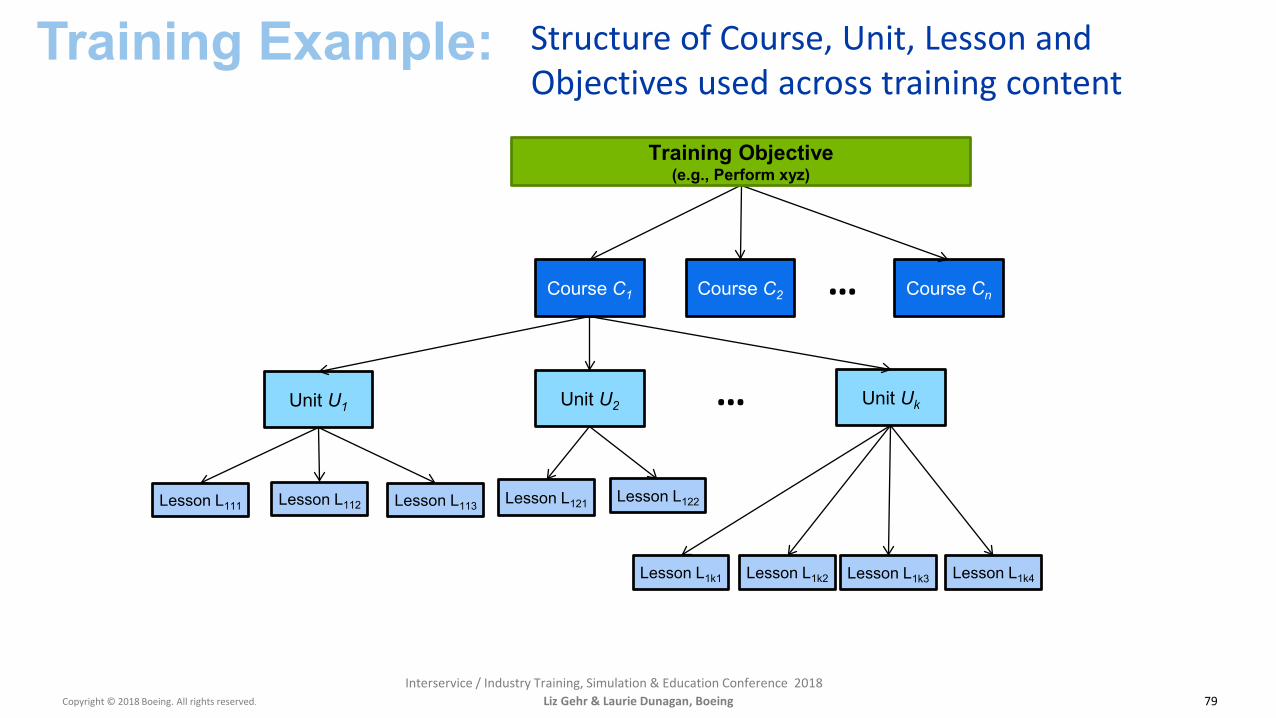
Training Example:
79
Course C1
Unit U1 Unit U2 Unit Uk
…
Lesson L111 Lesson L112 Lesson L113 Lesson L121 Lesson L122
Lesson L1k1 Lesson L1k2 Lesson L1k3 Lesson L1k4
Course C2 Course Cn
…
Training Objective(e.g., Perform xyz)
Liz Gehr & Laurie Dunagan, Boeing
Structure of Course, Unit, Lesson and Objectives used across training content

Month XX, 2017Copyright © 2018 Boeing. All rights reserved.
Interservice / Industry Training, Simulation & Education Conference 2018
Training Example Model Structure:
80
Note: The chronological sequence of lessons, units, and courses may be different for different trainees. Models described above will follow the actual training sequence. Could try a Naïve Bayes predictive model as well.
Probability of Passing a:
Models
Unit Pr{Pass U1} = Pr{Pass L113 | L112, L111}x Pr{Pass L112 | L111}x Pr{Pass L111}
Course Pr{Pass C1 } = Pr{Pass Uk | Uk-1,…,U1} x Pr{Pass Uk-1 | Uk-2,…,U1}
…x Pr{Pass U1}
Training Objective Pr{Pass Training Objective } = Pr{Pass Cn | Cn-1,…,C1} x Pr{Pass Cn-1 | Cn-2,…,C1} …x Pr{Pass C1}
Liz Gehr & Laurie Dunagan, Boeing
Applied a logistic regression model to look at the Probability of Passing
Month XX, 2017Copyright © 2018 Boeing. All rights reserved.
Interservice / Industry Training, Simulation & Education Conference 2018
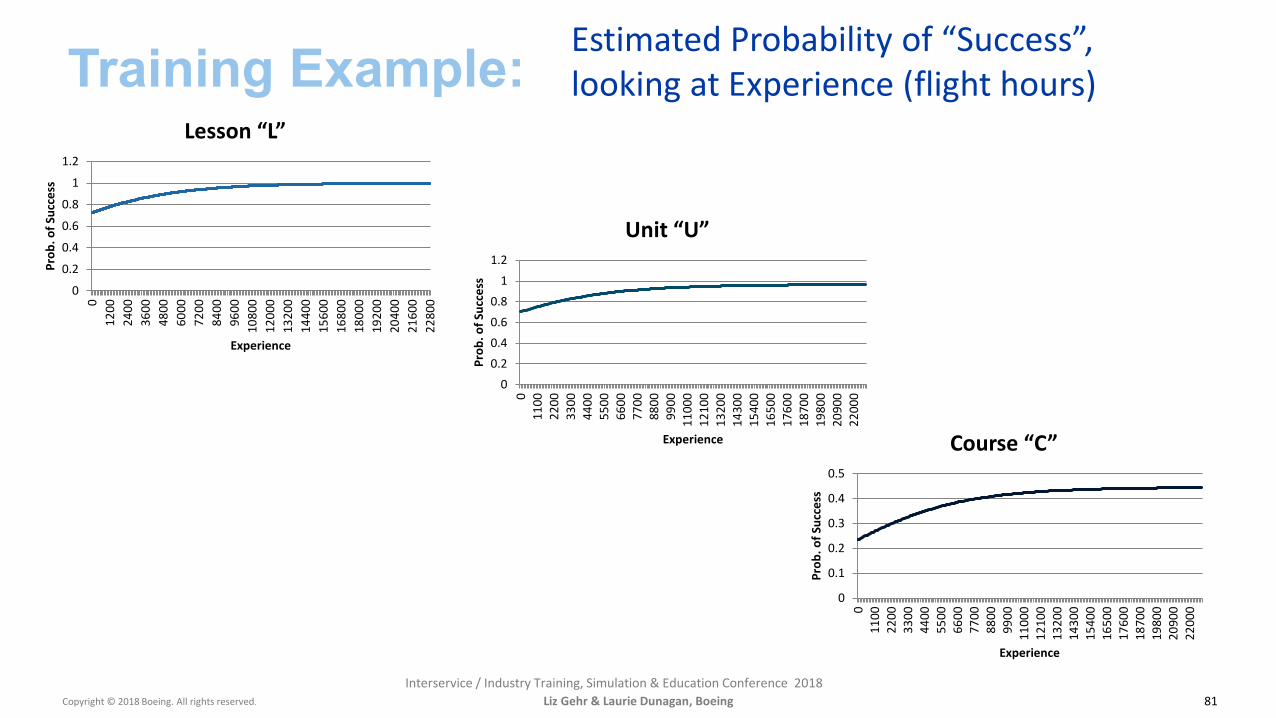
Training Example:
81
0
0.2
0.4
0.6
0.8
1
1.2
012
0024
0036
0048
0060
0072
0084
0096
0010
800
1200
013
200
1440
015
600
1680
018
000
1920
020
400
2160
022
800
Prob
. of S
ucce
ss
Experience
Lesson “L”
00.20.40.60.8
11.2
011
0022
0033
0044
0055
0066
0077
0088
0099
0011
000
1210
013
200
1430
015
400
1650
017
600
1870
019
800
2090
022
000
Prob
. of S
ucce
ss
Experience
Unit “U”
0
0.1
0.2
0.3
0.4
0.5
011
0022
0033
0044
0055
0066
0077
0088
0099
0011
000
1210
013
200
1430
015
400
1650
017
600
1870
019
800
2090
022
000
Prob
. of S
ucce
ss
Experience
Course “C”
Liz Gehr & Laurie Dunagan, Boeing
Estimated Probability of “Success”, looking at Experience (flight hours)
Month XX, 2017Copyright © 2018 Boeing. All rights reserved.
Interservice / Industry Training, Simulation & Education Conference 2018
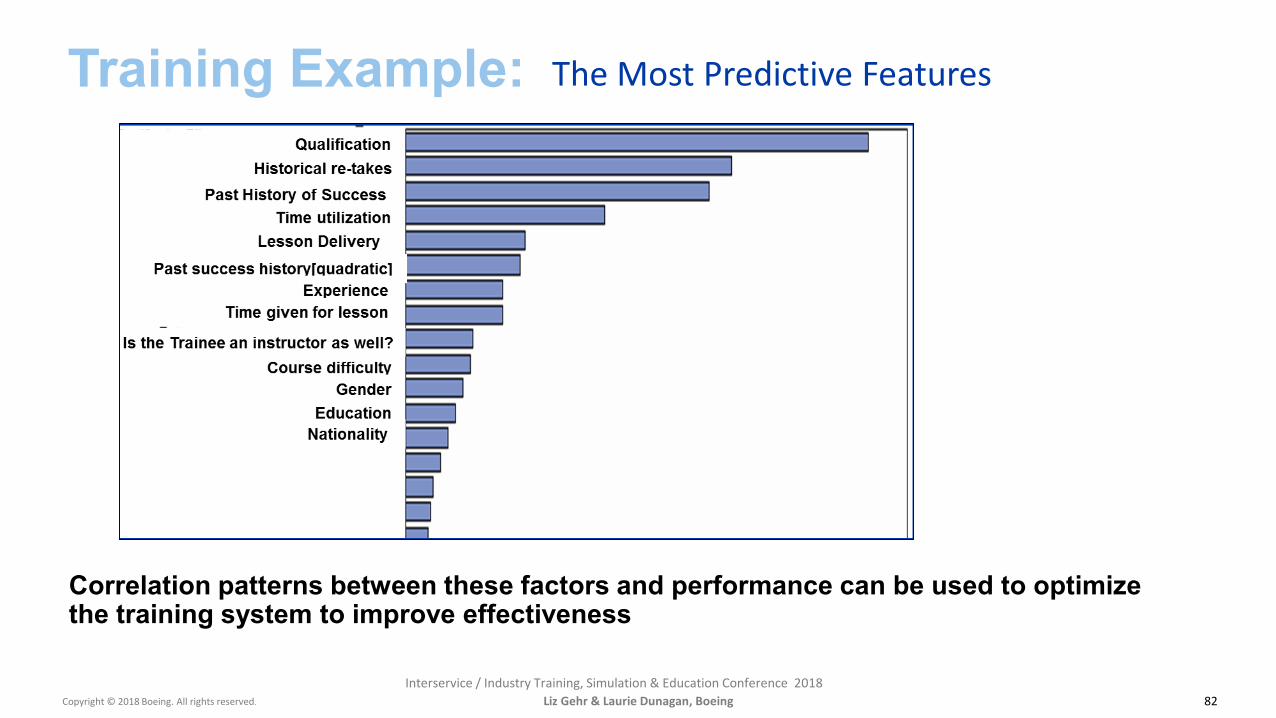
Training Example:
82
Correlation patterns between these factors and performance can be used to optimize the training system to improve effectiveness
Liz Gehr & Laurie Dunagan, Boeing
The Most Predictive Features
Month XX, 2017Copyright © 2018 Boeing. All rights reserved.
Interservice / Industry Training, Simulation & Education Conference 2018
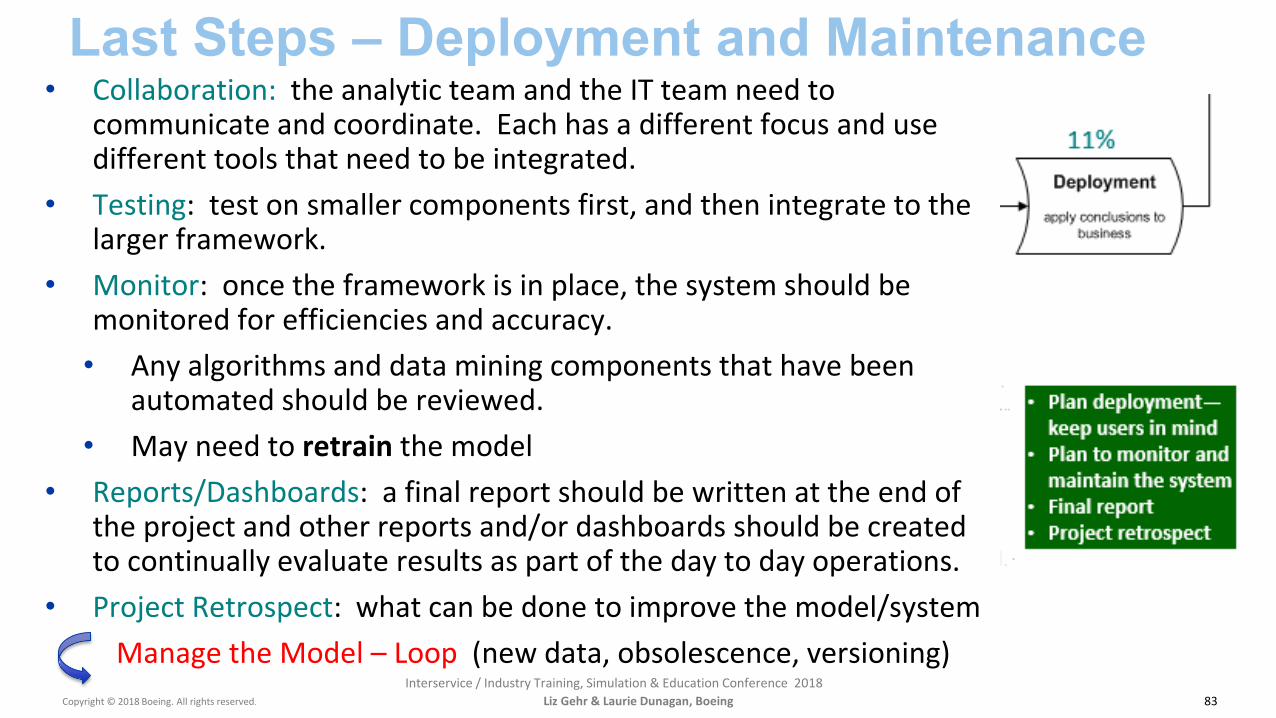
Last Steps – Deployment and Maintenance
83
• Collaboration: the analytic team and the IT team need to communicate and coordinate. Each has a different focus and use different tools that need to be integrated.
• Testing: test on smaller components first, and then integrate to the larger framework.
• Monitor: once the framework is in place, the system should be monitored for efficiencies and accuracy.
• Any algorithms and data mining components that have been automated should be reviewed.
• May need to retrain the model• Reports/Dashboards: a final report should be written at the end of
the project and other reports and/or dashboards should be created to continually evaluate results as part of the day to day operations.
• Project Retrospect: what can be done to improve the model/systemManage the Model – Loop (new data, obsolescence, versioning)
Liz Gehr & Laurie Dunagan, Boeing

Copyright © 2018 Boeing. All rights reserved.
Boeing Global Services | Training and Professional Services
Interservice / Industry Training, Simulation & Education Conference 2018
Model Insights
Liz Gehr & Laurie Dunagan, Boeing84

Month XX, 2017Copyright © 2018 Boeing. All rights reserved.
Interservice / Industry Training, Simulation & Education Conference 2018
How Do The Models Help?
85
The models provide:• Insight into characteristics of training programs• Data-driven prediction of student performance• Profile-specific recommendations• A data-driven framework for interventions and remedial actions
• An extra lesson• One on one instruction• Supplemental reading material
• Assessment of training course evolutions
Liz Gehr & Laurie Dunagan, Boeing

Month XX, 2017Copyright © 2018 Boeing. All rights reserved.
Interservice / Industry Training, Simulation & Education Conference 2018
No, keep learning on the new training data & interventionsShould We Just Keep Using These Models?
86
Training Data
Training Recommendation
Effectiveness Assessments
Remedial Actions
Predictive Models
Additional Future Data
Automated System for Analytics
Liz Gehr & Laurie Dunagan, Boeing

Month XX, 2017Copyright © 2018 Boeing. All rights reserved.
Interservice / Industry Training, Simulation & Education Conference 2018
• Feedback to students/instructors/training managers• Modify curriculum – overall/particular student• Adaptive Learning• Proactive actions to help students – predict failure before it
happens
What to do with Results?
87Liz Gehr & Laurie Dunagan, Boeing

Boeing Global Services | Training and Professional Services
Copyright © 2018 Boeing. All rights reserved.Interservice / Industry Training, Simulation & Education Conference 2018
• Poll - What would be evidence that data analytics has improvedtraining?
Learning Analytics Results
Liz Gehr & Laurie Dunagan, Boeing 88

Month XX, 2017Copyright © 2018 Boeing. All rights reserved.
Interservice / Industry Training, Simulation & Education Conference 2018
• No high level studies showing that data analytics improves training– Doesn’t mean it does not improve the training, but there are no
studies– Smaller scale studies have shown parts to be effective– Historic lack of large, complete training data set
Learning Analytics Results
89Liz Gehr & Laurie Dunagan, Boeing
Copyright © 2018 Boeing. All rights reserved.
Boeing Global Services | Training and Professional Services
Interservice / Industry Training, Simulation & Education Conference 2018
Considerations for Applying Analytics in the Defense Industry
Liz Gehr & Laurie Dunagan, Boeing90

Month XX, 2017Copyright © 2018 Boeing. All rights reserved.
Interservice / Industry Training, Simulation & Education Conference 2018
• Defense customers can benefit in many ways– Not all programs will want all aspects– Can be implemented in phases
• Visualizations– Although some consider this the goal of data analytics, it is not the only use for data– However, it can help get buy in– A picture is worth a thousand words– Lots of ideas of what to graph depending on what you are trying to do– Consider the audience:
• Student• Instructor• Training Manager
– Can pull real time data– Can navigate to drill into data
How Can the Defense Training Community Use Analytics?
91Liz Gehr & Laurie Dunagan, Boeing
Month XX, 2017Copyright © 2018 Boeing. All rights reserved.
Interservice / Industry Training, Simulation & Education Conference 2018
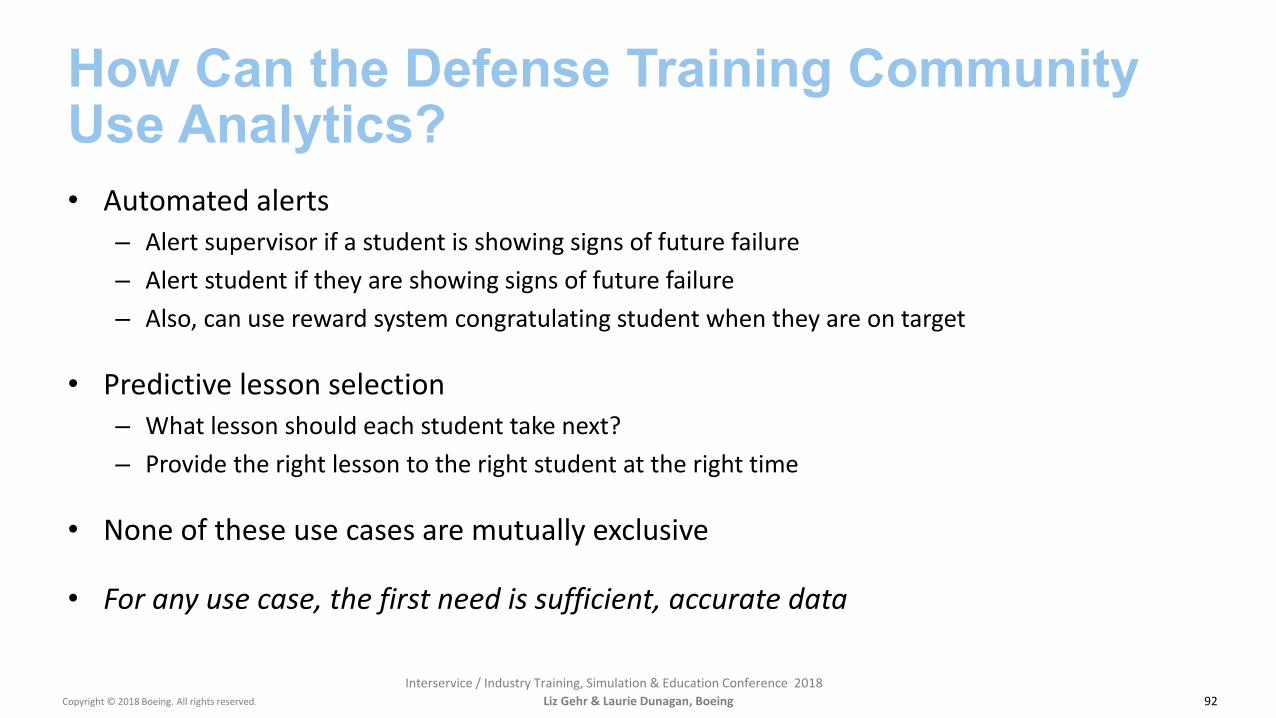
• Automated alerts– Alert supervisor if a student is showing signs of future failure– Alert student if they are showing signs of future failure– Also, can use reward system congratulating student when they are on target
• Predictive lesson selection– What lesson should each student take next?– Provide the right lesson to the right student at the right time
• None of these use cases are mutually exclusive
• For any use case, the first need is sufficient, accurate data
How Can the Defense Training Community Use Analytics?
92Liz Gehr & Laurie Dunagan, Boeing

Copyright © 2018 Boeing. All rights reserved.
Boeing Global Services | Training and Professional Services
Interservice / Industry Training, Simulation & Education Conference 2018
Challenges with Training Analytics
Liz Gehr & Laurie Dunagan, Boeing93
Boeing Global Services | Training and Professional Services
Copyright © 2018 Boeing. All rights reserved.Interservice / Industry Training, Simulation & Education Conference 2018
•Poll:‒What are the challenges with training data collection?
Training Analytics Challenges
Liz Gehr & Laurie Dunagan, Boeing 94
Month XX, 2017Copyright © 2018 Boeing. All rights reserved.
Interservice / Industry Training, Simulation & Education Conference 2018
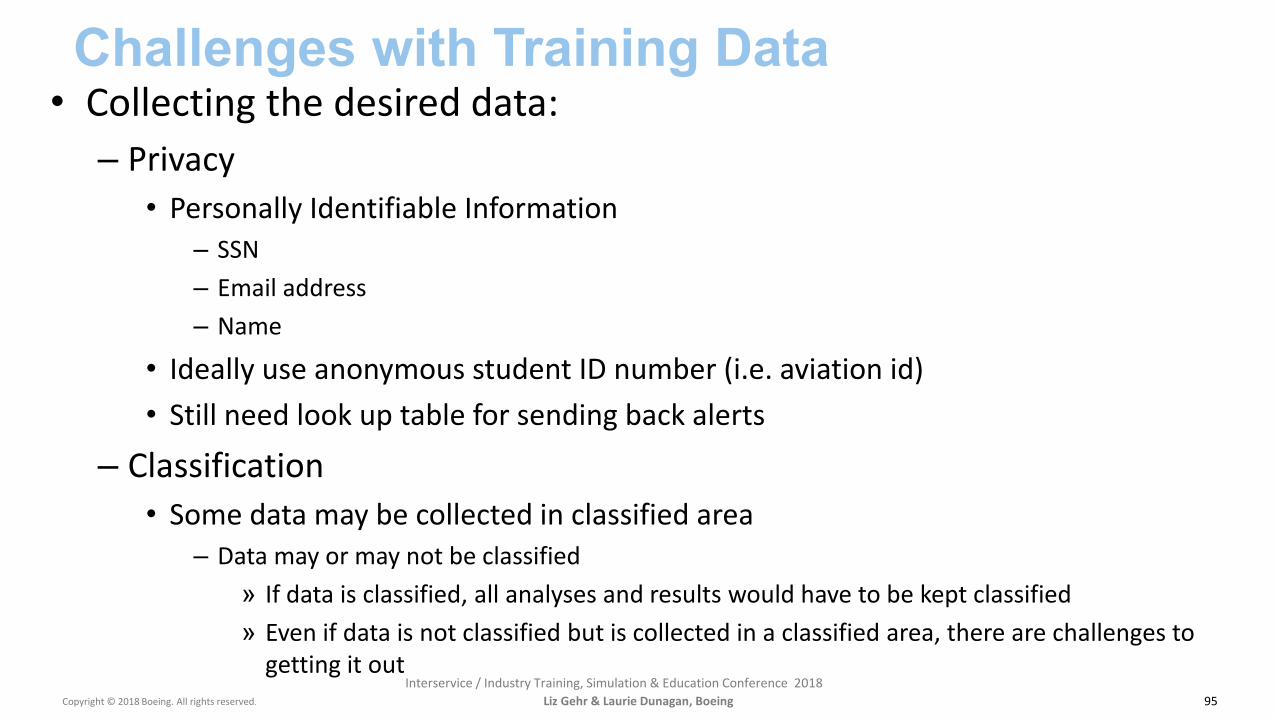
• Collecting the desired data:– Privacy
• Personally Identifiable Information– SSN– Email address– Name
• Ideally use anonymous student ID number (i.e. aviation id)• Still need look up table for sending back alerts
– Classification• Some data may be collected in classified area
– Data may or may not be classified» If data is classified, all analyses and results would have to be kept classified» Even if data is not classified but is collected in a classified area, there are challenges to
getting it out
Challenges with Training Data
95Liz Gehr & Laurie Dunagan, Boeing

Month XX, 2017Copyright © 2018 Boeing. All rights reserved.
Interservice / Industry Training, Simulation & Education Conference 2018
• Increase Territorial Scope (extraterritorial applicability)• Data Subject Rights:
– Breach Notification– Right to Access– Right to be Forgotten– Data Portability– Privacy by Design
• https://eugdpr.org/the-regulation/
Challenges with Training Data
Liz Gehr & Laurie Dunagan, Boeing 96
GDPR – General Data Protection Regulation

Month XX, 2017Copyright © 2018 Boeing. All rights reserved.
Interservice / Industry Training, Simulation & Education Conference 2018
– Multiple sites• Training may occur in multiple locations• Operational data may be stored at another site
– Multiple formats• Simulator data• CBT• Instructor led• xAPI data
– On the job performance data• Relating it back to student/user ID• Getting “buy in” from operational squad
Challenges with Training Data
97Liz Gehr & Laurie Dunagan, Boeing

Month XX, 2017Copyright © 2018 Boeing. All rights reserved.
Interservice / Industry Training, Simulation & Education Conference 2018
• Defense culture resistant to change– Don’t want to shorten for some students for liability reasons– Need evidence that it will definitely be effective
• Hard to prove until you have data from that type of student
• Hard to get access to all data– Classification issues– Training is geographically dispersed
• Learning model– Takes data to develop initial model
• Can’t implement on day 1• Phased in application
– Can’t “plug and play” model developed for one training program into another
Challenges to Implementing Defense Training Analytics
98Liz Gehr & Laurie Dunagan, Boeing

Month XX, 2017Copyright © 2018 Boeing. All rights reserved.
Interservice / Industry Training, Simulation & Education Conference 2018
• What can be reused from one training program / dataset(s) to another?– Analytics Process / Methodology– Database Structures (tables, transactional and dimensional database architectures)– Identified Features– Established thresholds and key performance indicators (KPIs)– Dashboards and Effective Alerts– Training Surveys– Deployment Strategies
• What can not be reused?– The Analytical Models – these must be re-created and tested on the new program and dataset(s),
algorithms may be similar but need to function on the new information, may discover new features.
• What needs to occur for the new program?– New Evaluation of each step in the process, starting with the business understanding to final
deployment. Training programs may be similar but will have their own unique elements. New questions to answer for new users.
– Continually evaluate the system and models to improve
Training Analytics Considerations
Liz Gehr & Laurie Dunagan, Boeing 99
Month XX, 2017Copyright © 2018 Boeing. All rights reserved.
Interservice / Industry Training, Simulation & Education Conference 2018
• Poll – who would you put on your training analytics team?
Training Analytics Teaming Considerations
Liz Gehr & Laurie Dunagan, Boeing 100
Month XX, 2017Copyright © 2018 Boeing. All rights reserved.
Interservice / Industry Training, Simulation & Education Conference 2018
• A successful training analytics project will have a diverse team– Data Scientist– Statistician– Subject Matter Expert– Research Psychologist– Database Expert– Data Engineer– Instructional Designer– Cyber Security Expert– Others as needed
Training Analytics Teaming Considerations
Liz Gehr & Laurie Dunagan, Boeing 101

Month XX, 2017Copyright © 2018 Boeing. All rights reserved.
Interservice / Industry Training, Simulation & Education Conference 2018
How can it all fit together?
102
Taken from: Enhancing Teaching and Learning Through Educational Data Mining and Learning Analytics: An Issue Brief, US DoE, 2012
Liz Gehr & Laurie Dunagan, Boeing

Boeing Global Services | Training and Professional Services
Copyright © 2018 Boeing. All rights reserved.Interservice / Industry Training, Simulation & Education Conference 2018
Liz Gehr & Laurie Dunagan, Boeing 103
• Analytics is a scientific process of extracting intelligence toward achieving a goal‒ The word “Analytics” is sometimes used loosely!‒ “Analysis” is often not paid attention to!!
• Training Data is usually not a big dataset• Methods (statistical/ machine learning) applicable to Analytics, are mostly applicable to
Learning/Education/Training Analytics• Analytics enables proactive actions to prevent “failure”• Need to collect the correct data in order to be able to do useful analytics• Dynamic analytical models are needed for dynamic systems: keep learning‒ Fine tuning with relevant data is important especially for automated analytics
• Free-form text (e.g., comment) requires text mining• Technical and manufacturing industries are aggressively investing in analytics capabilities‒ Benefits are often significant
• In some industries, the speed of analytics is not matched by the speed at which processes embrace the findings
Summary
Month XX, 2017Copyright © 2018 Boeing. All rights reserved.
Interservice / Industry Training, Simulation & Education Conference 2018
• Bernard M., Baker R. and Blikstein P. (2014), “Educational Data Mining and Learning Analytics: Applications to Constructionist Research”, Technology, Knowledge and Learning, Vol. 19, Issue 1, pp205-220.
• Bienkowski M., Feng M., & Means B. (2012), “Enhancing teaching and learning through educational data mining and learning analytics”: An issue brief. US Department of Education, Office of Educational Technology, 1-57.
• Bowne-Anderson, Hugo of the Harvard Business Review (2018), “What Data Scientists Really Do, According to 35 Data Scientists”, https://hbr.org/2018/08/what-data-scientists-really-do-according-to-35-data-scientists
• Breiman, L. (2001a), “Random Forests,” Machine Learning, 45, 5–32.• CrowdFlower Report (2016), “2016 Data Science Report”, https://visit.figure-eight.com/rs/416-ZBE-
142/images/CrowdFlower_DataScienceReport_2016.pdf• Durlach, P., Washburn, N., Regan, D., & Oviedo, F. L. (2015), “Putting Live Firing Range Data to Work Using the xAPI”. In
Interservice/Industry Training, Simulation, and Education Conference (I/ITSEC)• Few, Stephen (2009), “Now You See It”• Freed, M., Folsom-Kovarik, J. T., & Schatz, S. (2017), “More Than the Sum of Their Parts: Case Study and General Approach for
Integrating Learning Applications”. In Proceedings of the 2017 Modeling and Simulation Conference.• Friedman, J., Hastie, T. and Tibshirani, R. (2008), “Regularization Paths for Generalized Linear Models via Coordinate Descent”,
Journal of Statistical Software, Vol. 33, Issue 1.• Hastie T., Tibshirani R. and Friedman J. (2001), “The Elements of Statistical Learning; Data Mining, Inference and Prediction”,
Springer, New York.• Joseph, Rohan, “Data Science Life Cycle”, https://dataschool.com/data-science-life-cycle/
References
104Liz Gehr & Laurie Dunagan, Boeing

Month XX, 2017Copyright © 2018 Boeing. All rights reserved.
Interservice / Industry Training, Simulation & Education Conference 2018
• Manna, Maloy (2014), “The Data Science Project Lifecycle”, Data Science Central, https://www.datasciencecentral.com/profiles/blogs/the-data-science-project-lifecycle
• Nussbaumer Knaflic, Cole (2015), “Storytelling with Data, a Data Visualiztion Guide for Business Professionals”• Padros Z., Baker R., Pedro M., Gowda S. and Gowda S.(2014), “Affective states and state tests: Investigating how affect throughout
the school year predicts end of year learning outcomes”, Journal of Learning Analytics, Volume 1, No 1, pp107-128.• Pistilli M., Arnold K. and Bethune M. (2014), “Signals: Using Academic Analytics to Promote Student Success”, EDUCAUSEreview.• Sandri M., and Zuccolotto P. (2008), “A Bias Correction Algorithm for the Variable Importance Measure in Classification Trees”,
Journal of Computational and Graphical Statistics, Volume 17, Number 3, pp611-628.• Sang Kyu Kwak, Jone Hae Kim (2017), “Statistical Data Preparation: Management of Missing Values and Outliers”, Korean Journal
of Anesthesiology, Vol. 70 (4), 407-411.• Santoyo, Sergio (2017), “A Brief Overview of Outlier Detection Techniques”, Towards Data Science platform,
https://towardsdatascience.com/a-brief-overview-of-outlier-detection-techniques-1e0b2c19e561• Tableau (2016) from the 2016 Tableau Conference, “Art + Data, A Collection of Tableau Dashboards”• Taft, Darryl K. (2015), “One-Third of BI Pros Spend Up to 90% of Time Cleaning Data”, http://www.eweek.com/database/one-
third-of-bi-pros-spend-up-to-90-of-time-cleaning-data• Wexler, Steve; Shaffer, Jeffrey; Cotgreave, Andy (2017), “The Big Book of Dashboards, Visualizing Your Data Using Real-World
Business Scenarios”
References
105Liz Gehr & Laurie Dunagan, Boeing

Copyright © 2018 Boeing. All rights reserved.
Interservice / Industry Training, Simulation & Education Conference 2018106
Liz Gehr: [email protected] Dunagan: [email protected]
Liz Gehr & Laurie Dunagan, Boeing