Embed Size (px)
Citation preview
HARPS-N: the new planet hunter at TNG
Rosario Cosentino1, Christophe Lovis2 , Francesco Pepe2 , Andrew Collier Cameron3, David W. Latham4, Emilio Molinari1, Stephane Udry2, Naidu Bezawada11, Martin Black11, Andy Born11, Nicolas Buchschacher2, Dave Charbonneau4, Pedro Figueira10, Michel Fleury2, Alberto Galli1, Angus Gallie11, Xiaofeng Gao11, Adriano Ghedina1, Carlos Gonzalez1, Manuel Gonzalez1, Jose Guerra1, David Henry11,
Keith Horne3, Ian Hughes2, Dennis Kelly11, Marcello Lodi1, David Lunney11, Charles Maire2, Michel Mayor2, Giusi Micela5, Mark P. Ordway4, John Peacock8, David Phillips4, Giampaolo Piotto6, Don
Pollacco7, Didier Queloz2, Ken Rice8, Carlos Riverol1, Luis Riverol1, Jose San Juan1, Dimitar Sasselov4, Damien Segransan2, Alessandro Sozzetti9, Danuta Sosnowska2, Brian Stobie11, Andrew Szentgyorgyi4,
Andy Vick11, Luc Weber2
1-INAF – TNG, 2-Observatoire Astronomique de l'Université de Genève Switzerland, 3-SUPA, School of Physics & Astronomy University of St Andrews UK, 4-Harvard-Smithsonian Center for Astrophysics USA , 5-INAF - Osservatorio Astronomico Palermo Italy, 6-Dipartimento di Astronomia, Università di Padova Italy, 7-Astrophysics Research Centre, School of Mathematics and Physics, Queens University, Belfast UK, 8-SUPA, Institute for Astronomy, University of Edinburgh, Royal Observatory UK, 9-INAF - Osservatorio ASTROFISICO di TorinoItaly, 10-Centro de Astrofisica da Universidade do Porto Portugal, 11-UK Astronomy Technology Centre, Royal Observatory, Blackford hill, Edinburgh, UK
ABSTRACT
The Telescopio Nazionale Galileo (TNG)[9] hosts, starting in April 2012, the visible spectrograph HARPS-N. It is based on the design of its predecessor working at ESO’s 3.6m telescope, achieving unprecedented results on radial velocity measurements of extrasolar planetary systems. The spectrograph’s ultra-stable environment, in a temperature-controlled vacuum chamber, will allow measurements under 1 m/s which will enable the characterization of rocky, Earth-like planets. Enhancements from the original HARPS include better scrambling using octagonal section fibers with a shorter length, as well as a native tip-tilt system to increase image sharpness, and an integrated pipeline providing a complete set of parameters.
Observations in the Kepler field will be the main goal of HARPS-N, and a substantial fraction of TNG observing time will be devoted to this follow-up. The operation process of the observatory has been updated, from scheduling constraints to telescope control system. Here we describe the entire instrument, along with the results from the first technical commissioning.
Keywords: Telescopio Nazionale Galileo, HARPS-North, high resolution, spectrograph, instrumentation,telescope
1. INTRODUCTION
The main scientific rationale of HARPS-N is the confirmation and characterization of terrestrial planets by combining transits and Doppler measurements. In particular, it will dedicate a large amount of observation time to the follow-up of candidates identified by the Kepler mission. Also, it will be used to search for rocky planets in the habitable zones of solar-like stars.The HARPS-N Project is a collaboration between the Astronomical Observatory of the Geneva University (lead), the Harvard-Smithsonian Center for Astrophysics in Cambridge (USA), the Universities of St. Andrews and Edinburgh, the Queens University of Belfast, and the TNG-INAF Observatory. The project started in 2006, but suffered a two-year delay due to financial problems. After a re-organization of the project in 2010 it was successfully completed in less than two years. In March and April 2012, HARPS-N was installed at the Nasmyth B Focus of the 3.6m TNG, at the Observatory of the
SPIE8446-66
Roque de los Muchachos, La Palma Island. The first commissioning took place in April and the first scientific observation were started on May 21st. HARPS-N will be offered to the community starting in August 2012.
HARPS-N is an echelle spectrograph. This instrument allows the measurement of radial velocities with the highest accuracy available in the northern hemisphere and is designed to avoid spectral drifts due to temperature and air pressure variations thanks to a very accurate control of pressure and temperature. HARPS-N is fiber-fed by the Nasmyth B Focus of the 3.6m TNG telescope through a Front End Unit (FEU). The two HARPS fibers (object + sky or simultaneous reference) have an aperture on the sky of 1". Both fibers are equipped with an image scrambler to provide a uniform spectrograph pupil illumination, independent from pointing decentering.
2. GENERAL CHARACTERISTICS
HARPS-N is a fiber-fed, cross-dispersed echelle spectrograph, based on the design of its predecessor working at ESO 3.6m [7]. This successful spectrograph already has proven its capability to achieve a precision better than 1 meter per second and revealed several super-earth planets in the habitable zone , as for example HD 85512[10].Two fibers, an object and a reference fiber of 1 arcsec aperture pick up the light at the Nasmyth B focus of the telescope and feed the spectrograph either with calibration or stellar light. The fiber entrance is re-imaged by the spectrograph optics onto a 4k×4k CCD, where echelle spectra of 69 orders are formed for each fiber. The covered spectral domain ranges from 390nm to 690 nm. The resolution of the spectrograph is given by the fiber diameter and reaches an average value of R = 115000. At this resolution each spectral element is still sampled by 3.3 CCD pixels. The spectrograph is mounted on a nickel plated stainless steel mount and contains no moving parts. Furthermore, in order to avoid spectral drifts due to temperature and air pressure variations, it is accurately controlled in pressure and temperature. In Figure 1 the mechanical mount (on the left) and the installation inside the vacuum vessel (on the right) are shown. A summary of the main HARPS characteristics is given in Table 1.
Figure 1 – HARPS-N mechanical design and vacuum vessel
SPIE8446-66

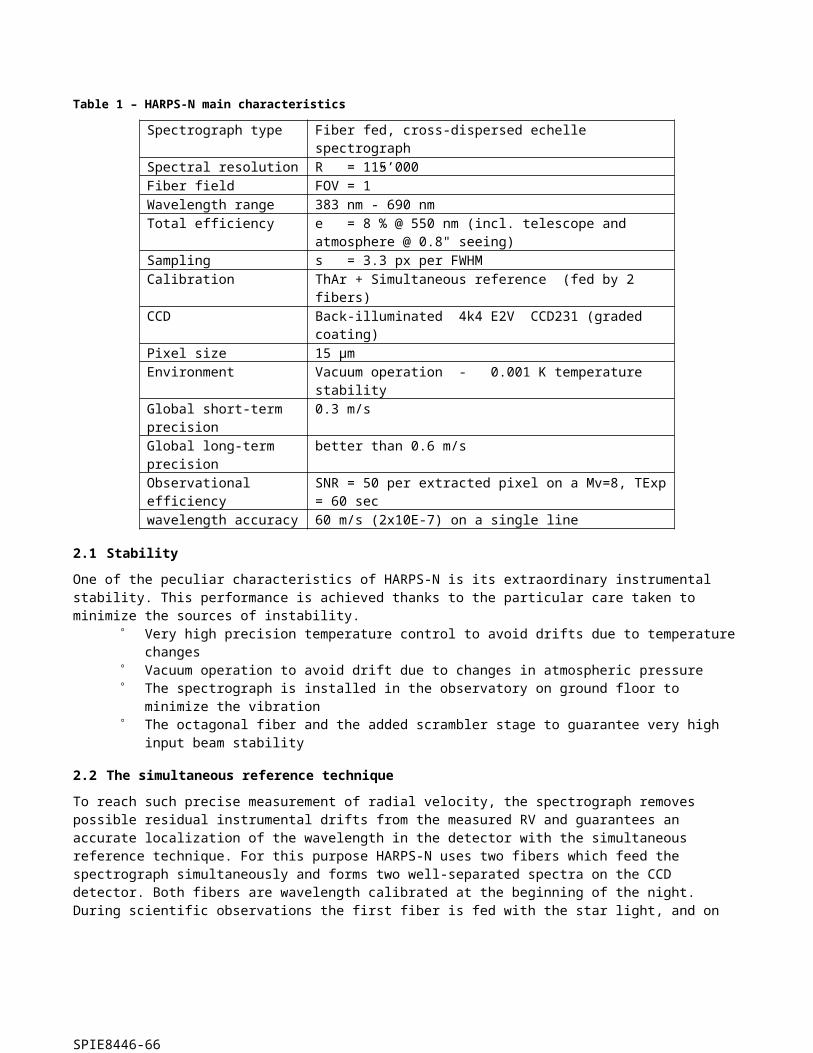
Table 1 – HARPS-N main characteristics
Spectrograph type Fiber fed, cross-dispersed echelle spectrographSpectral resolution R = 115’000Fiber field FOV = 1”Wavelength range 383 nm - 690 nmTotal efficiency e = 8 % @ 550 nm (incl. telescope and atmosphere @ 0.8"
seeing)Sampling s = 3.3 px per FWHMCalibration ThAr + Simultaneous reference (fed by 2 fibers)CCD Back-illuminated 4k4 E2V CCD231 (graded coating)Pixel size 15 µmEnvironment Vacuum operation - 0.001 K temperature stabilityGlobal short-term precision 0.3 m/sGlobal long-term precision better than 0.6 m/sObservational efficiency SNR = 50 per extracted pixel on a Mv=8, TExp = 60 secwavelength accuracy 60 m/s (2x10E-7) on a single line
2.1 Stability
One of the peculiar characteristics of HARPS-N is its extraordinary instrumental stability. This performance is achieved thanks to the particular care taken to minimize the sources of instability.
Very high precision temperature control to avoid drifts due to temperature changes Vacuum operation to avoid drift due to changes in atmospheric pressure The spectrograph is installed in the observatory on ground floor to minimize the vibration The octagonal fiber and the added scrambler stage to guarantee very high input beam stability
2.2 The simultaneous reference technique
To reach such precise measurement of radial velocity, the spectrograph removes possible residual instrumental drifts from the measured RV and guarantees an accurate localization of the wavelength in the detector with the simultaneous reference technique. For this purpose HARPS-N uses two fibers which feed the spectrograph simultaneously and forms two well-separated spectra on the CCD detector. Both fibers are wavelength calibrated at the beginning of the night. During scientific observations the first fiber is fed with the star light, and on this spectrum the stellar radial velocity is computed by referring to the wavelength solution determined at the beginning of the night. The second fiber is illuminated with the same spectral reference all the time, during wavelength calibration and scientific exposures. If an instrumental drift had occurred in between, the simultaneous reference spectrum on the second fiber would measure it.
2.3 Scheduling of observations
One of the HARPS-N software modules is the Short Term Scheduler (STS) that helps to prepare the list of observations for the night. The list is composed of Observation Blocks (scientific, calibration and technical) containing templates, that correspond to specific configurations of the spectrograph and data acquisition modes. These templates are executed by a dedicated software, the HARPS-N Sequencer, that dispatches the commands to the corresponding subsystems. More details are described in the software section of this article.
2.4 Real time data reduction (DRS)
The DRS [1] provides to the observer a complete reduced data set only 25 seconds after the end of the exposure. The data reduction pipeline takes into account the data images (calibration, bias, dark and scientific), performs quality control on them and executes a complete data reduction. The result is a set of data including reduced, wavelength-calibrated spectra, radial velocities, S/N etc.
SPIE8446-66
3. INSTRUMENT COUPLING TO THE TELESCOPE
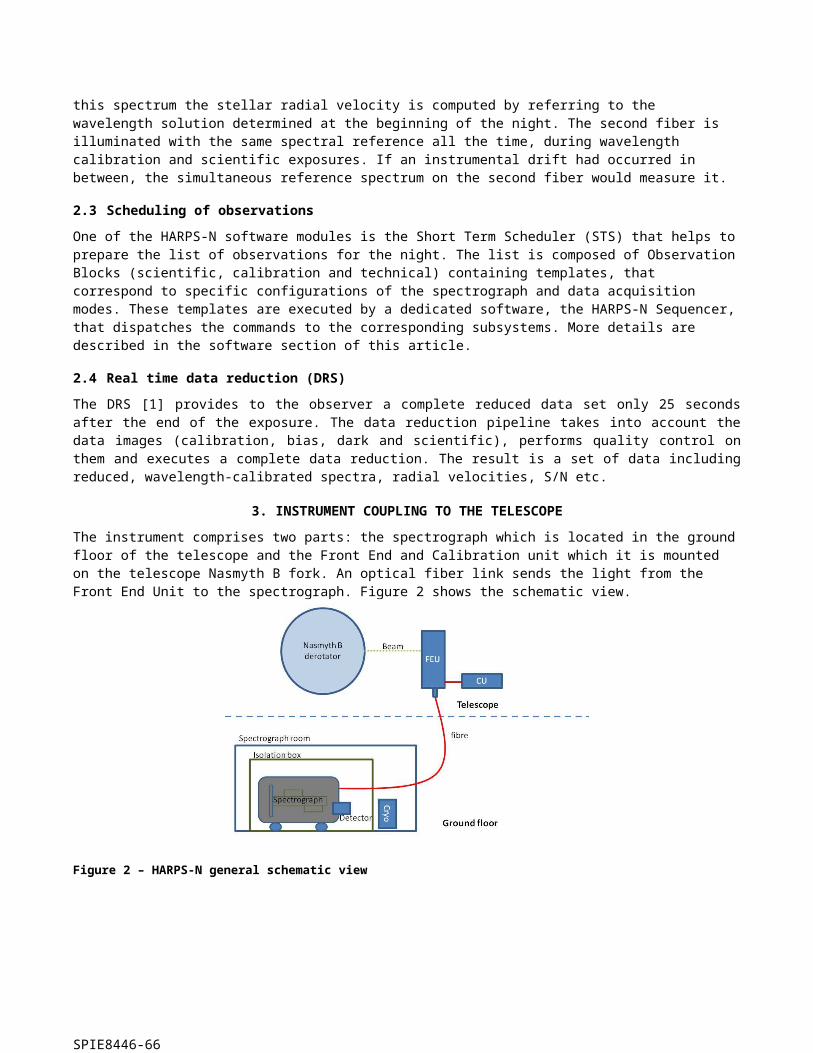
The instrument comprises two parts: the spectrograph which is located in the ground floor of the telescope and the Front End and Calibration unit which it is mounted on the telescope Nasmyth B fork. An optical fiber link sends the light from the Front End Unit to the spectrograph. Figure 2 shows the schematic view.
Figure 2 – HARPS-N general schematic view
3.1 Front End Unit (FEU)
The FEU is the first part of the spectrograph where the incoming light from the telescope and from the calibration unit is conditioned and collimated in the fibers. In this stage the incoming beam from the telescope is corrected by the atmosphere dispersion corrector (ADC). The star is maintained in the fiber thanks to the tip-tilt mirror acting together with the autoguider system. The folding mirror selects which object/reference configuration has to be put into the fibers. The optical scheme in Figure 3 shows the optical path inside the FEU and the main components.
Figure 3 – FEU optical scheme
SPIE8446-66
3.2 Calibration Unit (CU)
The calibration unit contains the lamps and their power supply and provides the reference source (thorium, tungsten) for the FEU. Two external high-precision references are included. The first is already available and consists of an ultra-stable Fabry-Perot interferometer [2]. The second one, a stabilized laser-frequency comb, is currently under development an will become available in 2013.
3.3 Fiber link
To send the light from the FEU to the spectrograph we use a 26 m octagonal fiber link. This new geometry increases the light scrambling effect and guarantees a very high precision in radial velocity measurement, since they minimize spectrograph illumination changes due to the positioning error of the star in the fiber entrance. These fibers have shown excellent laboratory performances [3],[4] and demonstrated excellent results on sky [5].
4. INSTRUMENT CONTROL ELECTRONICS
The HARPS-N control electronics are illustrated in Figure 5. The instrument is essentially split up in two physical locations – the Front-End Unit and the Calibration Unit, which are near to the Nasmyth B telescope interface, and the telescope ground floor containing the spectrograph and detector equipment. The following sections will describe the Front End and Calibration Unit. Functionally, the electro-optical mechanisms in the FEU and CU are handled by controller/drivers located in a control rack. These controllers are commanded by software running on the PCs that are also in the control rack.
Figure 4 - Front End Unit
SPIE8446-66

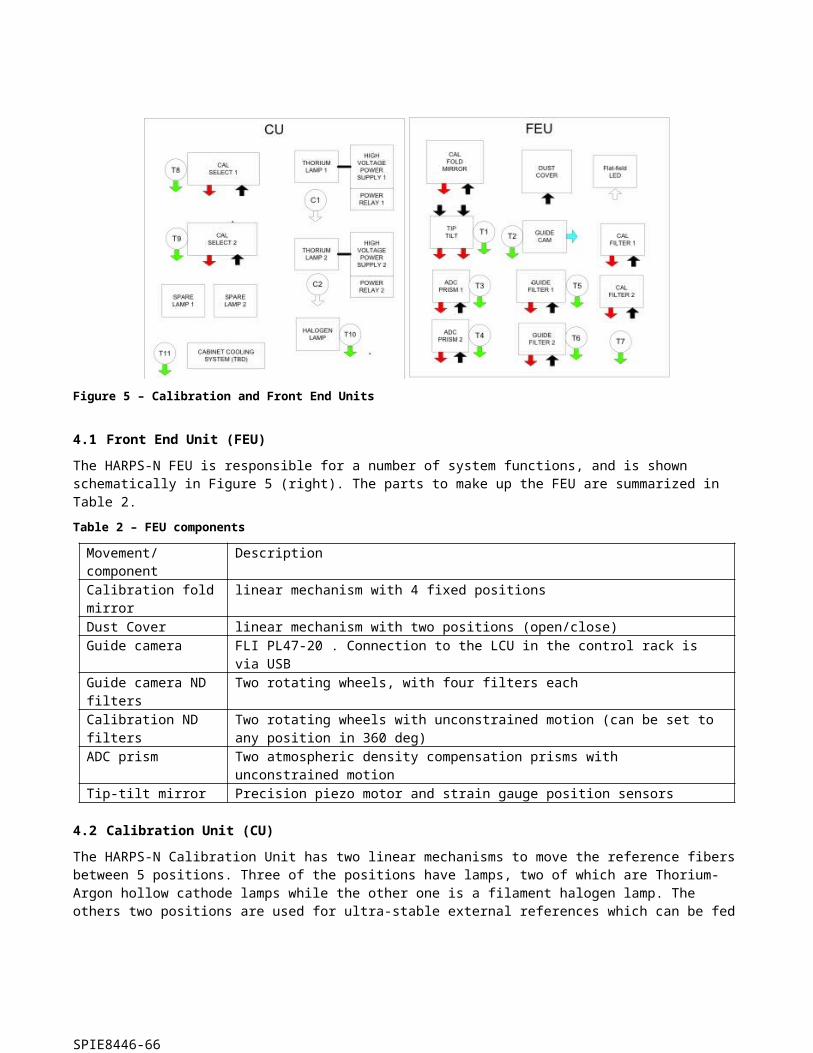
Figure 5 – Calibration and Front End Units
4.1 Front End Unit (FEU)
The HARPS-N FEU is responsible for a number of system functions, and is shown schematically in Figure 5 (right). The parts to make up the FEU are summarized in Table 2.
Table 2 – FEU components
Movement/component DescriptionCalibration fold mirror linear mechanism with 4 fixed positionsDust Cover linear mechanism with two positions (open/close)Guide camera FLI PL47-20 . Connection to the LCU in the control rack is via USBGuide camera ND filters Two rotating wheels, with four filters eachCalibration ND filters Two rotating wheels with unconstrained motion (can be set to any position in 360 deg)ADC prism Two atmospheric density compensation prisms with unconstrained motionTip-tilt mirror Precision piezo motor and strain gauge position sensors
4.2 Calibration Unit (CU)
The HARPS-N Calibration Unit has two linear mechanisms to move the reference fibers between 5 positions. Three of the positions have lamps, two of which are Thorium-Argon hollow cathode lamps while the other one is a filament halogen lamp. The others two positions are used for ultra-stable external references which can be fed through an optical fiber connection. At the moment one of these positions hosts the Fabry-Perot interferometer, located in the HARPS-N cabinet, close to the spectrograph.
Table 3 – CU source components
Movement/component DescriptionThorium lamps 1 and 2 The Thorium Argon lamps are type 4160AHP from S&J Juniper & Co.Halogen lamp The halogen lamp is a type 6337 Quartz Tungsten Halogen bulb from NewportFabry-Perot The FP interferometer is located close to the spectrograph
SPIE8446-66

5. DETECTOR AND CONTROLLER
5.1 General detector characteristics
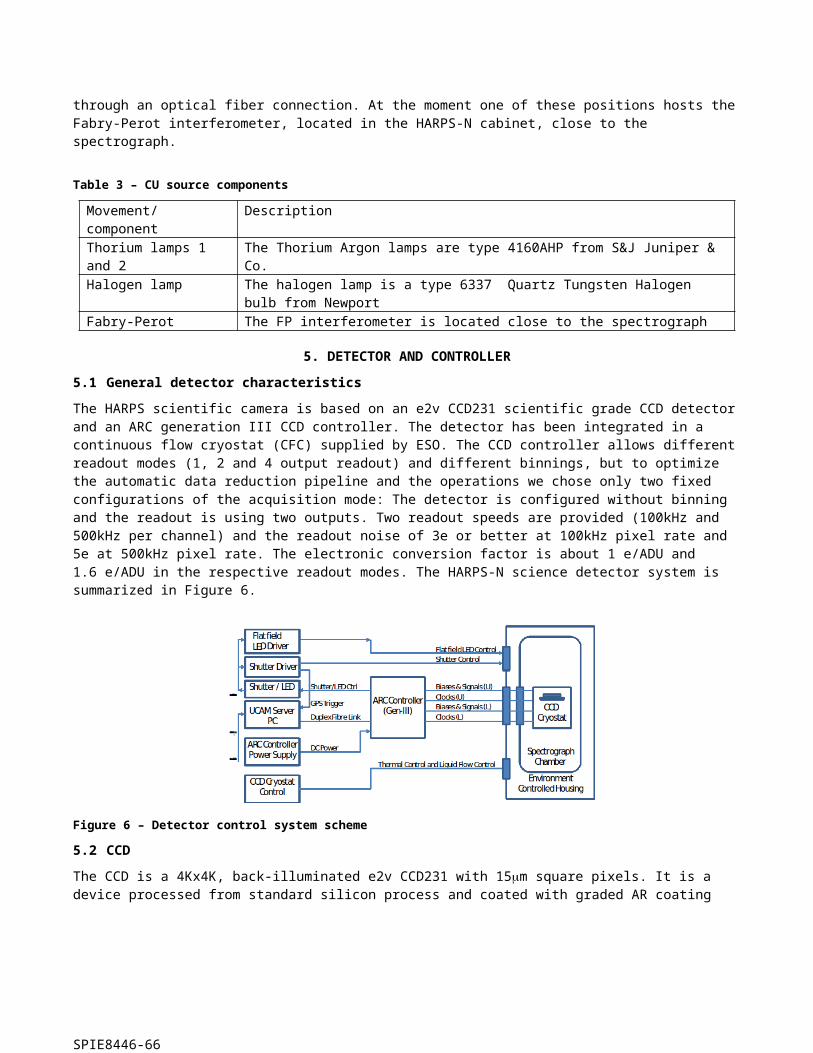
The HARPS scientific camera is based on an e2v CCD231 scientific grade CCD detector and an ARC generation III CCD controller. The detector has been integrated in a continuous flow cryostat (CFC) supplied by ESO. The CCD controller allows different readout modes (1, 2 and 4 output readout) and different binnings, but to optimize the automatic data reduction pipeline and the operations we chose only two fixed configurations of the acquisition mode: The detector is configured without binning and the readout is using two outputs. Two readout speeds are provided (100kHz and 500kHz per channel) and the readout noise of 3e or better at 100kHz pixel rate and 5e at 500kHz pixel rate. The electronic conversion factor is about 1 e/ADU and 1.6 e/ADU in the respective readout modes. The HARPS-N science detector system is summarized in Figure 6.
Figure 6 – Detector control system scheme
5.2 CCD
The CCD is a 4Kx4K, back-illuminated e2v CCD231 with 15m square pixels. It is a device processed from standard silicon process and coated with graded AR coating parallel to the readout direction for enhanced response from 380nm to 690nm from left to right as shown in Figure.
Figure 7 – The CCD coating and quantum efficiency
5.3 Cryostat
An ESO supplied continuous liquid nitrogen flow cryostat houses the CCD and a preamplifier board. A dedicated controller regulates the LN flow to maintain the temperature of the base plate inside the cryostat at a suitable temperature. The CCD mount stage has a separate temperature control system using a Lakeshore controller to maintain the CCD temperature at its operating value.
SPIE8446-66
5.4 CCD controller
The HARPS-N Camera control and data acquisition system (UCam) uses the controller hardware from Astronomy Research Cameras, Inc. USA (ARC Controllers). The ARC controller provides all the bias voltages and clocks required to operate the detector and process the CCD video signal.
5.5 Shutter
A 45mm clear aperture bi-stable Uniblitz shutter is mounted just outside the spectrograph vessel to get the timed science exposures. The shutter is controlled by its own controller located in the detector electronics rack close to the spectrograph. The input to the shutter controller is derived from the ARC controller.
5.6 Data acquisition software
The camera control and data acquisition system (UCam) operates under PC control, running RTLinux, interfaced to a Generation-III ARC Controller. The software can be run remotely with a network connection to the host computer. The UCam software runs on three HTTP server processes; Camera Control, File Save and Data De-multiplexer servers. The Camera Control server initializes, configures, downloads and executes applications. The File Save server handles the image data and writes to disk a meta-data file. It also contains instructions to sample and de-multiplex the raw data image. The De-multiplexer server processes the saved data and saves it in FITS file format. A GUI client application is used for controlling the UCam server application.
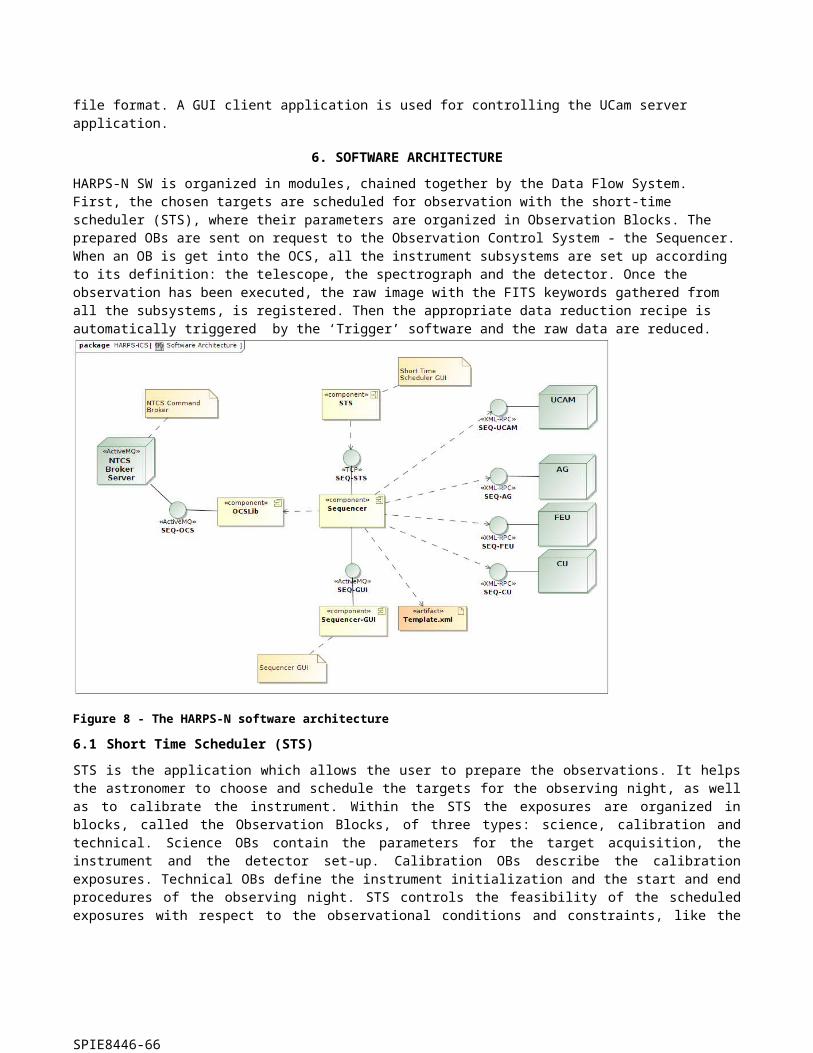
6. SOFTWARE ARCHITECTURE
HARPS-N SW is organized in modules, chained together by the Data Flow System. First, the chosen targets are scheduled for observation with the short-time scheduler (STS), where their parameters are organized in Observation Blocks. The prepared OBs are sent on request to the Observation Control System - the Sequencer. When an OB is get into the OCS, all the instrument subsystems are set up according to its definition: the telescope, the spectrograph and the detector. Once the observation has been executed, the raw image with the FITS keywords gathered from all the subsystems, is registered. Then the appropriate data reduction recipe is automatically triggered by the ‘Trigger’ software and the raw data are reduced.
Figure 8 - The HARPS-N software architecture
SPIE8446-66
6.1 Short Time Scheduler (STS)
STS is the application which allows the user to prepare the observations. It helps the astronomer to choose and schedule the targets for the observing night, as well as to calibrate the instrument. Within the STS the exposures are organized in blocks, called the Observation Blocks, of three types: science, calibration and technical. Science OBs contain the parameters for the target acquisition, the instrument and the detector set-up. Calibration OBs describe the calibration exposures. Technical OBs define the instrument initialization and the start and end procedures of the observing night. STS controls the feasibility of the scheduled exposures with respect to the observational conditions and constraints, like the airmass limit, out-of-the-night placement etc. The Exposure Time Calculator, which is part of the STS, helps the user to optimize the exposure time depending on the SNR and vice versa. The STS GUI is shown on Figure 9.
Figure 9 - Short Time Scheduler screenshot
6.2 Sequencer
The sequencer is the HARPS-N observation control software. It gets the observation blocks from the STS, and executes them according to several XML template files. Sequencer template files define the commands, statements and variables to run an Observing Block. Moreover the sequencer is able to emulate HARPS-N units and display, through a GUI, the execution status for each of the commands defined in the command template file (Figure 10).
6.3 Front End Unit, Autoguider and Calibration Unit control (instrument software)
The FEU and CU software are LabView modules which controls the movements and settings of the instrument and the autoguider . This software can also control the units in stand-alone mode as an engineering interface or by the HARPS-N sequencer using an XML-RPC interface.
6.4 Telescope Control System
HARPS-N has an interface to the TCS. This interface enables the instrument to send commands to the telescope via the TNG library [8]. Currently HARPS-N is able to send three commands: Pointing, AG offsets and M2 offsets to calculate and correct the focus via an automatic procedure. The connections between both systems are completely asynchronous but when the command finishes successfully the TCS returns an Ok status. When an error condition has arisen, the TCS also returns a message back to the sequencer flagging that condition.
SPIE8446-66

Figure 10 - Sequencer GUI screenshot
Figure 11 – FEU screenshot. Autoguider and Front End Monitor.
SPIE8446-66
6.5 Data Reduction Software
An automatic data reduction system (DRS) is included with HARPS-N to reduce, shortly after the exposure, observations for "classical" spectroscopy and high-precision Doppler measurements with simultaneous wavelength reference. For science exposures, the DRS outcomes are flat-fielded, wavelength-calibrated spectra and, when possible and requested, the barycentric radial velocity of the target. Calibration exposures are used by the DRS to calibrate the instrument for best-quality scientific reduction. The DRS is designed to run automatically like a batch process on the archived frames. All relevant parameters required by the DRS are passed to the DRS through the FITS headers of the archived frames. Results of the DRS are stored in the FITS keywords of reduced frames.The top level of the DRS is represented by a set of programs (recipes) performing the various calibration and science tasks. They take as inputs the raw data produced by the instrument and are executed online. Each raw product has its associated DRS recipe which performs the required reduction tasks. An additional top layer application - Trigger - acts as an automatic on-line recipe launcher.The role of the Data Reduction Software (DRS) is to transform the raw data produced by the instrument into reduced data of scientific quality. These represent the basic products from which the user will start in order to perform the desired specific analysis. Therefore, the endpoint of the DRS processing is defined as the furthest stage at which the data products are still sufficiently generic to be used as inputs for all main HARPS-N science cases.
The main steps of the scientific data reduction are:
- Bias and dark subtraction - Bad pixels correction - Background subtraction - Order extraction with cosmic rejection - Flat-fielding - Wavelength calibration - Merging and rebinning of the spectral orders - Sky subtraction (if applicable) - Instrumental drift correction (if applicable) - Flux calibration Cross-correlation with a numerical template - Radial velocity computation
For HARPS-N the final products of the DRS process have been found to be the extracted, background-subtracted, cosmic-corrected, flat-fielded and wavelength-calibrated spectra (with and without merging of the spectral orders). The possibility to flux-calibrate the spectra is also available. These products are provided also for the reference fiber (sky or simultaneous wavelength calibration) if applicable. In addition to these reduction products, cross-correlation functions of the spectra are also computed to provide high-precision radial velocities.One important feature of the DRS environment is the calibration database, in which all calibration products needed to reduce science data are stored. The complete calibration database can be accessed at any time by the DRS recipes, which always choose the best available calibration dataset.
SPIE8446-66
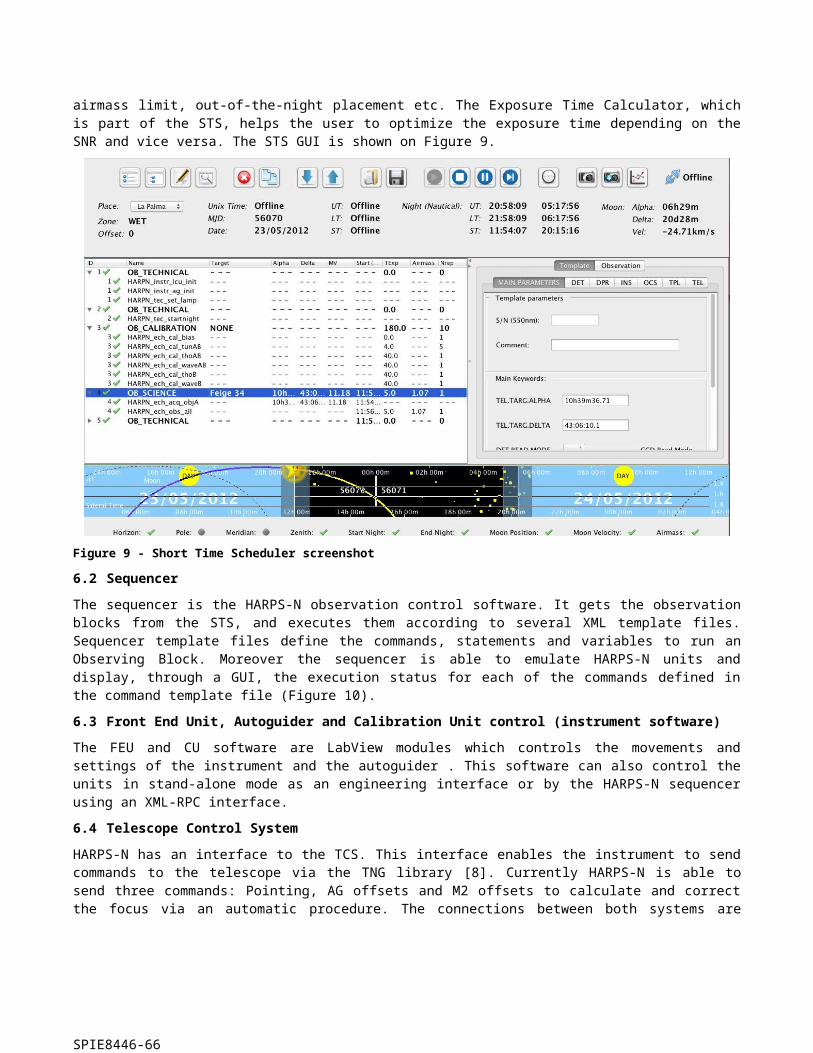
Figure 12 – Screenshot of the data-reduction trigger
7. PERFORMANCES AND FIRST RESULTS
7.1 Spectral format and resolution
The recorded spectral format corresponds well to the calculated values. Table 4 gives the order number, central wavelength and the total spectral range covered by the respective echelle order at the top, center, and bottom of the CCD. All the orders up to #158 could be localized and extracted using a tungsten flat-field lamp, while the wavelength calibration was done using the ThAr spectral lamp. Figure 13 shows a part of the corresponding extracted and wavelength calibrated spectrum.
Table 4 – Central wavelength and spectral range of the echelle orders
Order N° Central wavelength [Å]
Total spectral range [Å]
89 6880.8 75.990 6804.4 75.191 6729.7 74.3
156 3951.6 43.4157 3926.3 43.1158 3901.3 42.8
SPIE8446-66
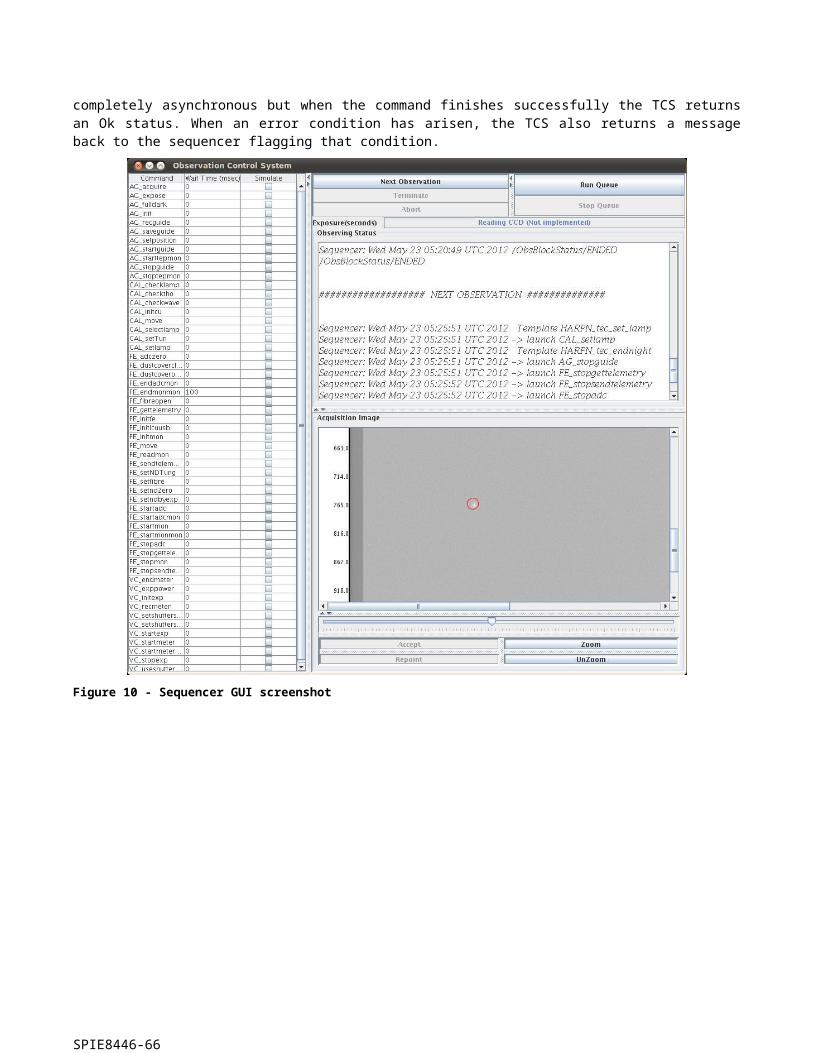
Figure 13 - Portion of the extracted ThAr spectrum order
The image quality, and thus the spectral resolution, varies only slightly in the cross-dispersion direction (seeTable 5). The variation is below 10% across the whole CCD. In the main dispersion direction we encounter a larger spread in image quality of the order of 20%-30% increasing toward the red side of the echelle order. This effect is however mostly compensated by the echelle-grating dispersion, which increases by about the same amount from the blue to the red side of the echelle order.
Table 5 - Image quality of the spectrograph. The FWHM of a spectral line expressed in pixels is indicated for different positions on the scientific CCD.
Y = 0 Y = 2000 Y = 4000
X = 0 Dispersion 3.2 3.2 3.7Cross-dispersion 3.1 2.9 3.1
X = 2000 Dispersion 2.8 3.0 4.0Cross-dispersion 3.2 3.1 3.8
X = 4000 Dispersion 2.9 3.2 4.1Cross-dispersion 3.3 3.2 4.2
The measured optical parameters are listed in Table 6. These have been determined by means of ThAr calibration exposures. The performances are all compliant with the specifications. The image quality could not be measured directly, thus we give here only a upper limit estimated from the FWHM values for the spectral lines given inTable 5. In order to compute the spectral resolution one has to multiply these values by the pixel size expressed in wavelength. At 530 nm for example, in the center of the CCD, the scale is 0.001415 nm/pixel, and the spectral resolution taking into account the measured spotsize is computed to about R = 124’000. Because of the changing dispersion and image quality along the orders the spectral resolution is not perfectly constant. Nowhere on the CCD does the spectral resolution decrease below R = 100,000, however.
Table 6 - Measured spectrograph parameters
Wavelength range on the CCD 390.1 – 691.5 nmSpectral resolution at center 124’000Order width (FWHM) at center 3.1 pixelsSampling at CCD center 0.0014 nm/pixelSeparation of fibers 16.8 pixels
SPIE8446-66

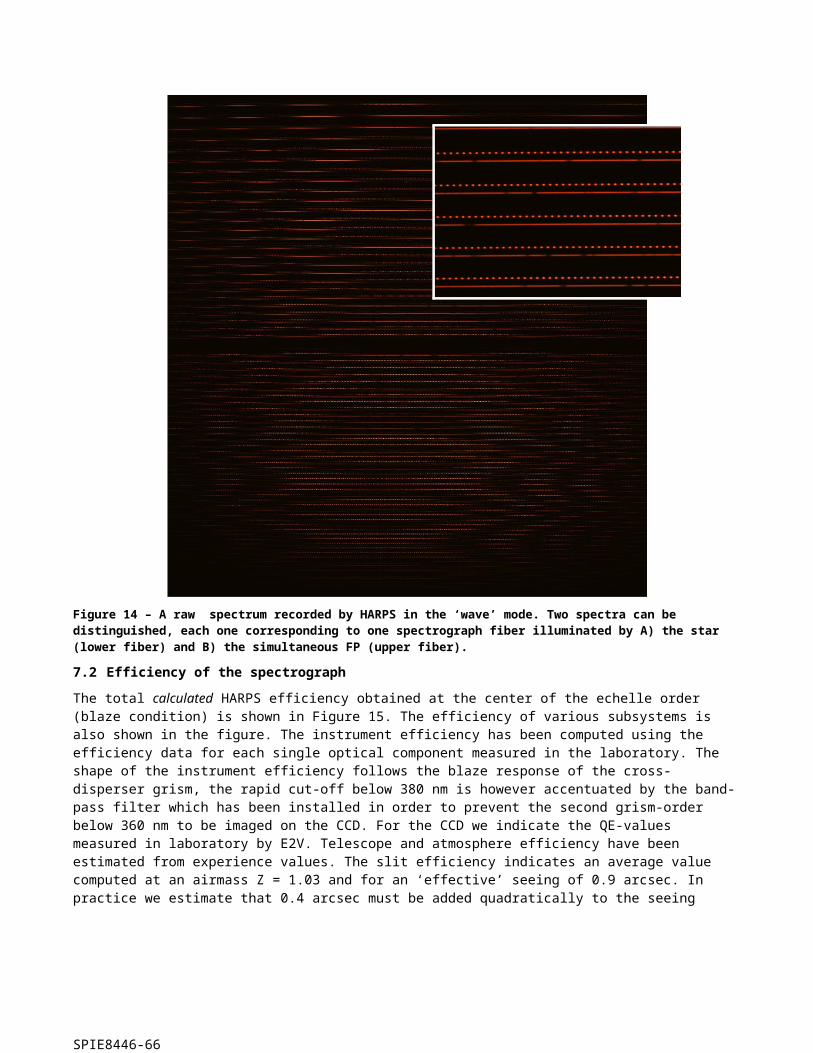
Figure 14 – A raw spectrum recorded by HARPS in the ‘wave’ mode. Two spectra can be distinguished, each one corresponding to one spectrograph fiber illuminated by A) the star (lower fiber) and B) the simultaneous FP (upper fiber).
7.2 Efficiency of the spectrograph
The total calculated HARPS efficiency obtained at the center of the echelle order (blaze condition) is shown in Figure 15. The efficiency of various subsystems is also shown in the figure. The instrument efficiency has been computed using the efficiency data for each single optical component measured in the laboratory. The shape of the instrument efficiency follows the blaze response of the cross-disperser grism, the rapid cut-off below 380 nm is however accentuated by the band-pass filter which has been installed in order to prevent the second grism-order below 360 nm to be imaged on the CCD. For the CCD we indicate the QE-values measured in laboratory by E2V. Telescope and atmosphere efficiency have been estimated from experience values. The slit efficiency indicates an average value computed at an airmass Z = 1.03 and for an ‘effective’ seeing of 0.9 arcsec. In practice we estimate that 0.4 arcsec must be added quadratically to the seeing value to account for additional telescope effects due to image quality and possible defocus.
SPIE8446-66

Figure 15 - Total efficiency of HARPS-N (black plain curve, right-hand scale), and efficiency of subsystems (left-hand scale). The values have been calculated for each echelle order at its blaze wavelength. The fast drop below 380 nm is produced by a band-pass filter installed in the fiber-link to remove 2nd-order of the grism. The grey area shows HARPS-N’ spectral range.
An interesting aspect is to measure the on-sky performances and derive the instrument efficiency. It is however almost impossible to calculate precisely the effective efficiency of the instrument by observing standard stars, since the sky conditions, telescope focus, etc. are not known with sufficient accuracy. Therefore we prefer just to compare real measurements with calculated count rates. This procedure allows us to identify possible discrepancies without focusing on the detailed efficiency curve, which depends on too many observational parameters. Figure 16 shows the measured SNR as a function of wavelength obtained during one of the first GTO nights on May 24th, 2012. We observed HD127334, a G5V star with mv = 6.36. The exposure time was Texp = 120 sec, and the observation was taken at an airmass of 1.03 and with a seeing of about 0.9 arcsec.The best measurement of this night is shown, since one has to be sure that efficiency losses due to effects not considered in the exposure-time calculator ETC (e.g. varying atmospheric extinction or telescope defocus) are minimized. The calculated curve was derived for a seeing of 1 arcsec, which actually has been chosen to take into account for the 0.4 arcsec image-quality losses discussed above.The measured signal-to-noise-ratio SNR is in excellent agreement with the calculated curve. The curve may slightly differ mainly because a) a K0 spectrum was used for the computation and b) the theoretical values of some sub-components may be affected by small errors. On the other hand, and as mentioned above, other aspects such as seeing variations, extinction, image quality etc. cannot be controlled in detail. We conclude therefore that at a level of about 20% precision the expected efficiency matches the actual efficiency of the instrument.
The radial velocity precision obtained on a given star depends on many factors, not the least being the stellar intrinsic noise or jitter. Nevertheless, even for a ‘quiet’ star, the obtained precision depends on the spectral line width, depths, and density, which all depend partially on the spectral type [6]. In order to provide a bench mark for the transformation between SNR and expected radial-velocity precision, we focus on a quiet, non-rotating K0 dwarf. In this case, a SNR per extracted pixel of about 50 is obtained on a star with mv = 8.0 in 60 s. At this SNR value a radial-velocity (photon-noise-limited) precision of the order of 1.3 m/s can be expected.
SPIE8446-66
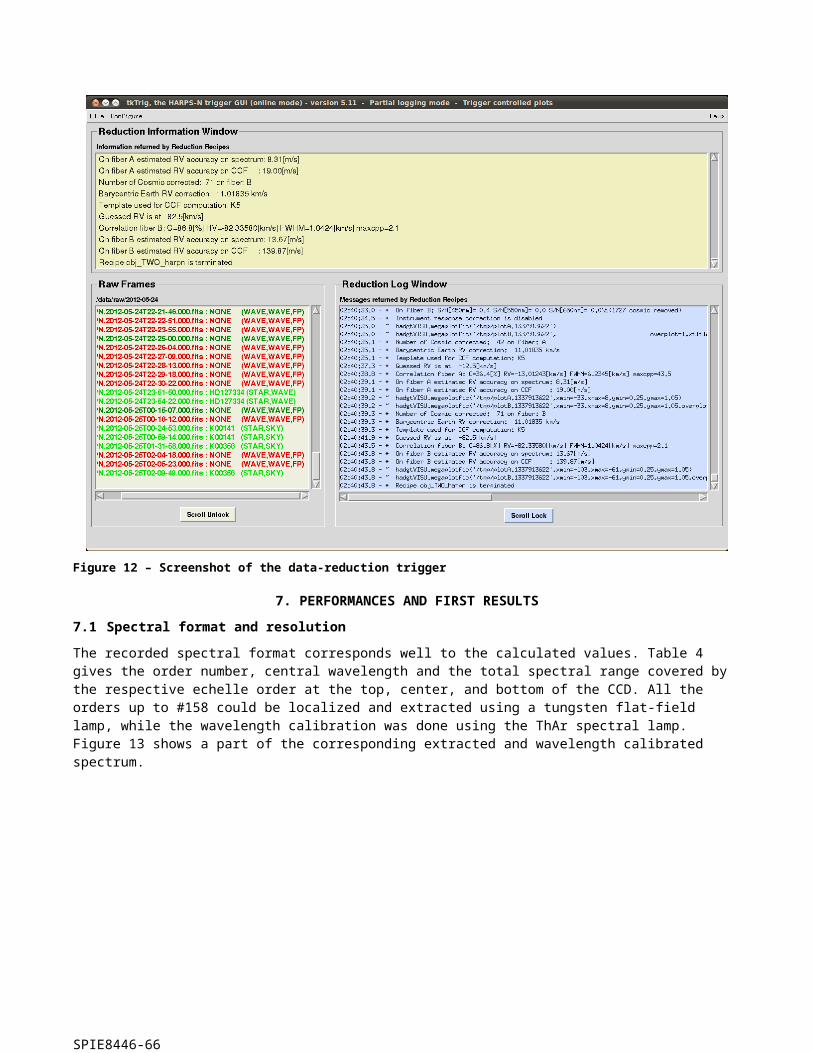
Figure 16 - Measured signal-to-noise ratio SNR of HARPS-N (red curve) compared with the values computed by the exposure-time calculator of the STS (blue dcurve). The efficiency tests have be carried out on HD 127334, a mv = 6.36 G5 star. The exposure time was of 120 seconds.
7.3 Instrumental stability and simultaneous reference
When observing in ‘wave’ mode, it is possible to feed fiber A with a ThAr spectrum and fiber B with the FP spectrum. By doing so, it is possible to a) track possible instrumental drifts and b) estimate the power of the ‘simultaneous reference’ technique. This technique is employed in HARPS-N to remove possible instrumental drifts from the stellar radial velocity: While calibrating the instrument or observing the star, the second spectrograph fiber B is always illuminated by a spectral reference source, in this case a Fabry-Pérot (FP) etalon illuminated in white light. The stable FP records potential drifts of the instrument that occurred between the time of calibration and observation. Once expressed in terms of radial-velocity, the recorded value can be subtracted from the measured stellar radial velocity to correct for these drifts.We have done laboratory tests to measure the performances of the simultaneous reference technique. An example is shown in Figure 17, which shows the ‘radial velocity’ of the ThAr (fiber A) and FP (fiber B) spectral sources as a function of exposure number. Since one exposure was taken every minute, the series represents a time span of about 5 hours. During this time, we have made a ‘stress test’ of the instrument by pumping on the vacuum chamber and by changing the temperature of the detector dewar, both producing ‘absolute’ radial-velocity changes of several meters-per-second.The obtained results are very satisfactory: During the first hour, during which the instrument was not touched, the radial velocity remains stable well within the 1 m/s level. It must be noted that this means that the spectrum did not move, in absolute terms, by more than 0.001 pixels or 15 nm on the scientific CCD. This is actually the typical stability obtained with HARPS-N during a night, despite the fact that the thermal control system of HARPS-N has not yet been fully implemented. The dispersion on the drift measurements over this same 1-hour period is of the order of 30 cm/s. This “noise” has a typical period of 10 minutes. It is observed also on HARPS (south) and it is possibly due to tiny, but periodic temperature variations of the CCD or its dewar. It is important to note, however, that on the differential value one obtains a dispersion of 8 cm/s, which is almost identical with the combined photon-noise precision of the ThAr and FP spectral sources. This demonstrates without any doubt that the simultaneous reference technique is able to correct for drifts at the level of 10 cm/s and below.This statement is strengthened by the fact that, over the whole test duration, the differential drift never exceeded the 40 cm/s level, despite the fact that the instrument had been exposed to extreme stress-conditions never occurring during standard operations. Furthermore, the differential drift appears to be compatible with zero after 5 hours, which not only confirms the power of the technique but also demonstrates that our FP-based reference source is stable within 10 cm/s during an observation night.
SPIE8446-66
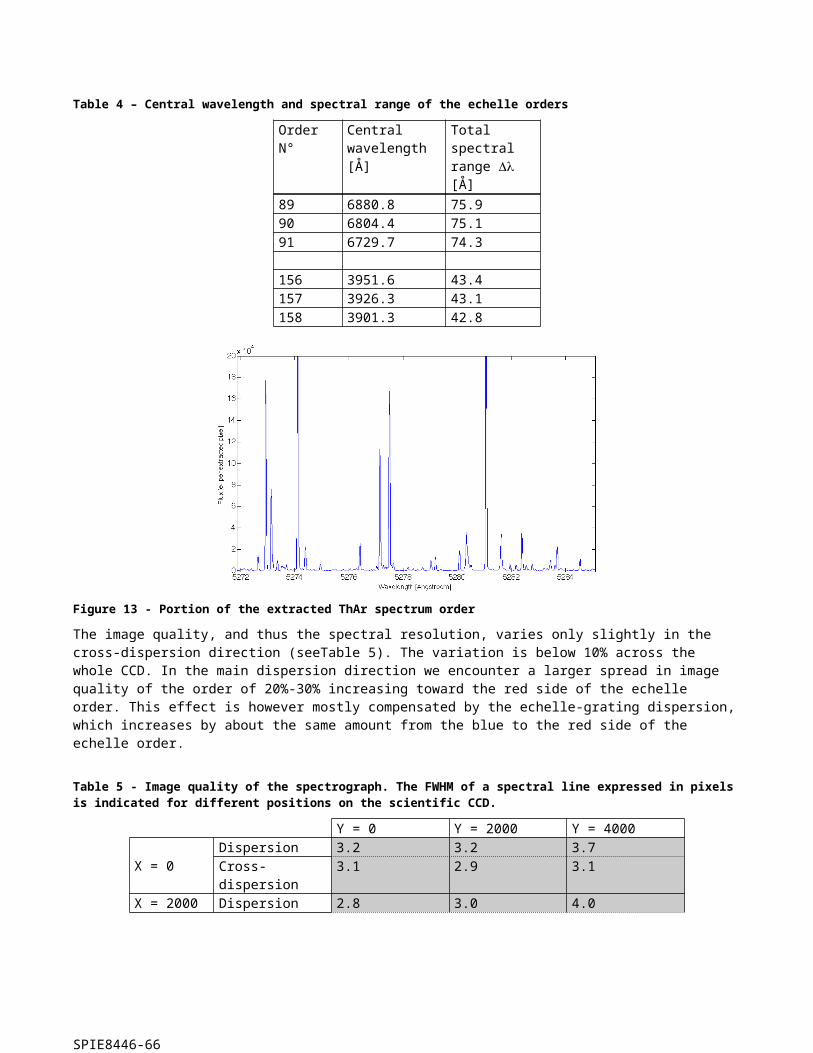
Figure 17 -Short-term stability of the spectrograph and quality of the FP and ThAr tracking technique
7.4 On-sky precision
HARPS-N uses octagonal optical fibers and a double scrambler, which, when combined, are supposed to perfectly scramble the light illuminating the spectrograph and thus remove any potential guiding effect on the measured radial velocity. On HARPS (south), an effect of the order of 3 to 4 m/s was measured when moving the star from the center of the fiber to the edge. This effect was observed to be symmetric with respect to the fiber center and fully understood as a consequence of differential pupil illumination of the spectrograph due to non-perfect scrambling by circular fibers [3].This experience led us to use octagonal fibers for HARPS-N. Tests in the laboratory had already shown that we could expect an excellent performance [4], but tests on the sky and using a ‘real’ star had to be performed. Figure 18 summarizes the results of this test: During a night with good atmospheric seeing conditions (always below 1 arcsec) we measured the radial-velocity of the star HD 89269. During this sequence we have alternatively centered and de-centered the star at the entrance of the optical fiber. The de-centering was of 0.5 arcsec, which means that the star was placed on the edge of the fiber, in the identical way we had done this on HARPS (south) in 2003. The first remarkable aspect is that the p-modes of the star (pulsation) of about 2 m/s semi-amplitude are directly visible in the temporal series. The second aspect concerns the excellent scrambling, and is represented by the fact that no discontinuity is observed in the radial velocities when switching from centered to de-centered observations. In order to estimate the off-guiding effect on the radial velocity we have averaged all centered exposures and compared them to all de-centered exposures. The difference in radial velocity is of the order of 0.5 m/s, which is in turn small compared to results obtained on HARPS (south). We consider this value to be actually an upper limit of the effect, since the measurement ‘noise’ is dominated by the stellar pulsation. This result is thus fully consistent with the laboratory measurement, which had indicated an improvement of about a factor 10 on the scrambling efficiency of octagonal fibers compared to circular fibers.
At the moment of writing no long-term radial-velocity performances can be reported, given the fact that HARPS-N was installed in April 2012 and that the first GTO run took place from May 21st to 25th, 2012. Nevertheless, we can show, in Figure 19, the radial velocity series obtained on the standard star HD 127334 during a single night. The radial-velocity dispersion over 2.5 hours and 41 exposures is of only 1.08 m/s; most probably this is completely dominated by the stellar p-modes. The same star was observed, although at much lower frequency, during all the four half nights of the first GTO run. The obtained dispersion is of the order of 1.5 m/s. We are convinced that this value will be improved further by optimizing the instrument and the data-reduction software. We expect that a long-term instrumental precision of the about 0.5 m/s can and will be attained after the first semester of operations.
SPIE8446-66
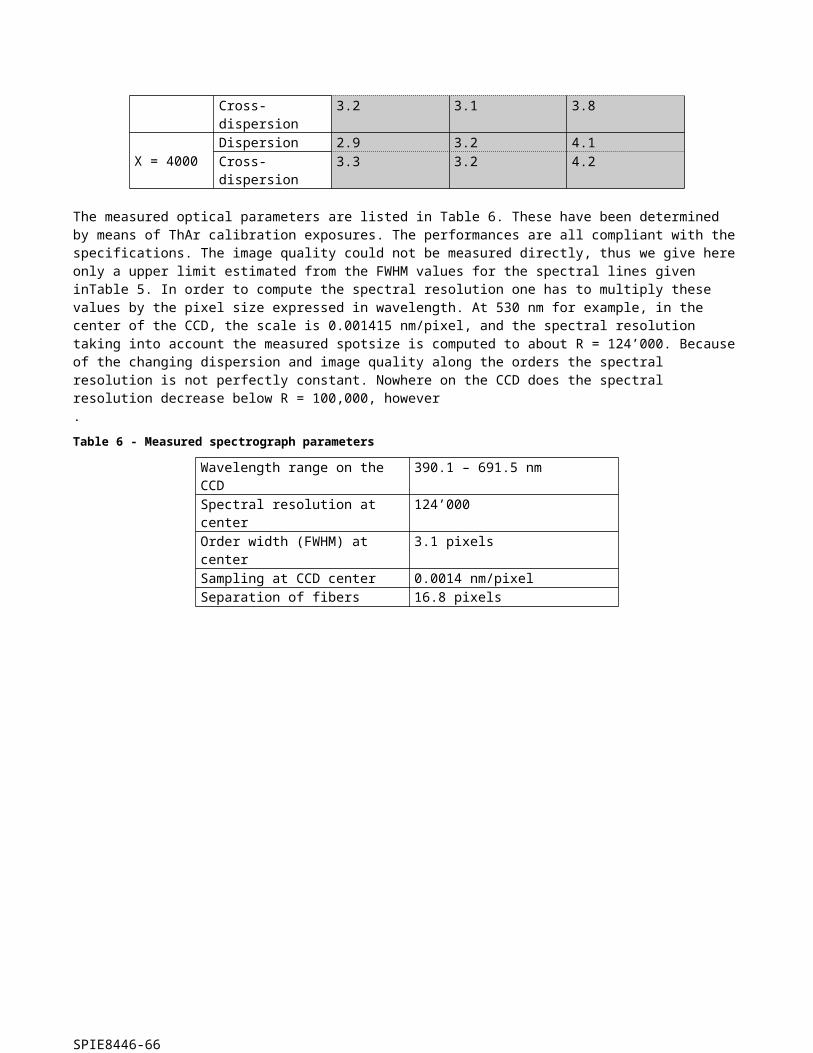
Figure 18 -De-centering tests on HARPS-N, which prove the excellent scrambling property of octagonal fibers and the consequently weak impact of ‘bad guiding’ on the radial-velocity measurement.
Figure 19 - Series of radial-velocity measurements on HD 127334
REFERENCES
[1] Sosnowska D. Vick A., Lodi M., et al., Astronomical Telescopes + Instrumentation, SPIE Conference Proceeding, 8451-68 (2012)
[2] Wildi F., Chazelas B., Pepe F., Astronomical Telescopes + Instrumentation, SPIE Conference Proceeding, 8446-324 (2012)
[3] Chazelas B., Pepe F., Wildi F. et al., Modern Technologies in Space- and Ground-based Telescopes and Instrumentation. Edited by Atad-Ettedgui, Eli; Lemke, Dietrich. Proceedings of the SPIE, Volume 7739, pp. 773947-773947-9 (2010)
[4] Chazelas B., Pepe F., Wildi, F., Astronomical Telescopes + Instrumentation, SPIE Conference Proceeding, 8450-124 (2012)
[5] Perruchot S., Bouchy F., Chazelas, B. et al., Techniques and Instrumentation for Detection of Exoplanets V. Edited by Shaklan, Stuart. Proceedings of the SPIE, Volume 8151, pp. 815115-815115-12 (2011)
SPIE8446-66
[6] Bouchy, F., Pepe, F., Queloz, D., Astronomy and Astrophysics, v.374, p.733-739 (2001)[7] Mayor M., Pepe F. Queloz D. et al., The Messenger (ISSN0722-6691), No.114, p. 20-24 (December 2003)[8] Guerra, J et al. , Astronomical Telescopes + Instrumentation, SPIE Conference Proceeding, Proc. SPIE 8451-92
(2012)[9] Barbieri, C. , Optical Telescopes of Today and Tomorrow, Proc. SPIE Vol. 2871, p. 244-255 (1997)[10] Pepe, F et all, 2011A&A...534A..58P (2011)
SPIE8446-66