Embed Size (px)
Citation preview
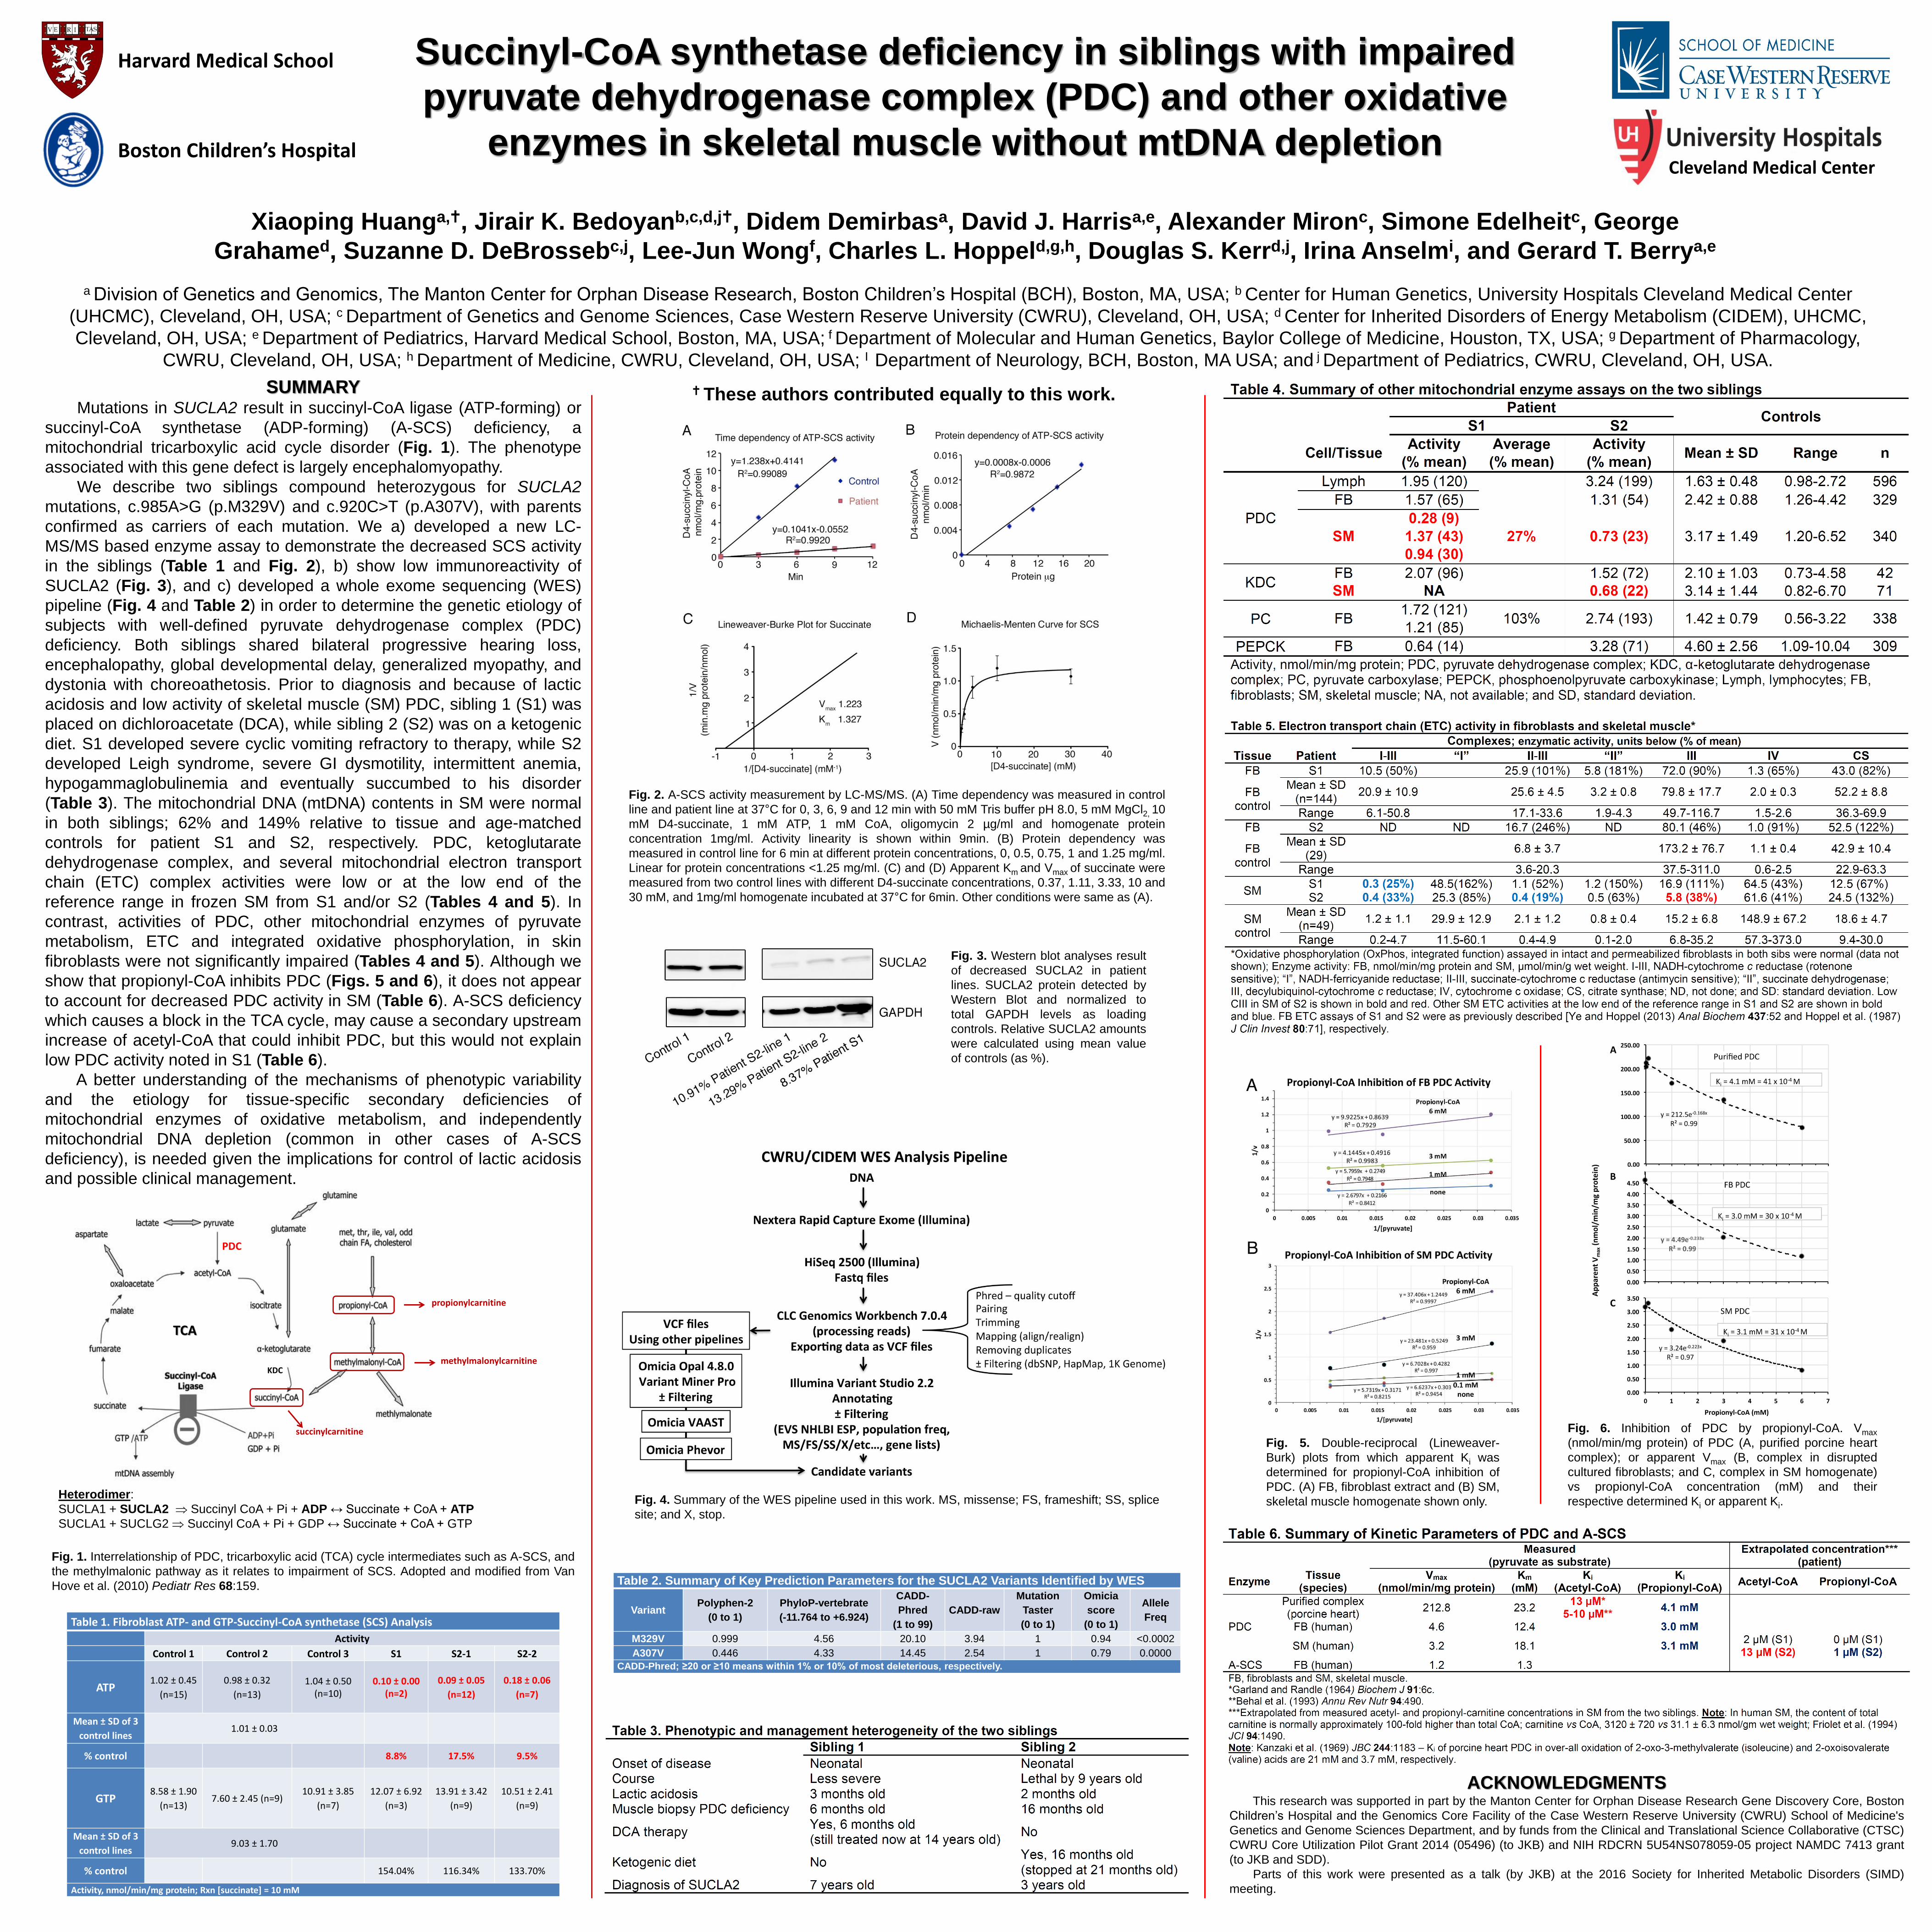
SUMMARY Mutations in SUCLA2 result in succinyl-CoA ligase (ATP-forming) or
succinyl-CoA synthetase (ADP-forming) (A-SCS) deficiency, a
mitochondrial tricarboxylic acid cycle disorder (Fig. 1). The phenotype
associated with this gene defect is largely encephalomyopathy.
We describe two siblings compound heterozygous for SUCLA2
mutations, c.985A>G (p.M329V) and c.920C>T (p.A307V), with parents
confirmed as carriers of each mutation. We a) developed a new LC-
MS/MS based enzyme assay to demonstrate the decreased SCS activity
in the siblings (Table 1 and Fig. 2), b) show low immunoreactivity of
SUCLA2 (Fig. 3), and c) developed a whole exome sequencing (WES)
pipeline (Fig. 4 and Table 2) in order to determine the genetic etiology of
subjects with well-defined pyruvate dehydrogenase complex (PDC)
deficiency. Both siblings shared bilateral progressive hearing loss,
encephalopathy, global developmental delay, generalized myopathy, and
dystonia with choreoathetosis. Prior to diagnosis and because of lactic
acidosis and low activity of skeletal muscle (SM) PDC, sibling 1 (S1) was
placed on dichloroacetate (DCA), while sibling 2 (S2) was on a ketogenic
diet. S1 developed severe cyclic vomiting refractory to therapy, while S2
developed Leigh syndrome, severe GI dysmotility, intermittent anemia,
hypogammaglobulinemia and eventually succumbed to his disorder
(Table 3). The mitochondrial DNA (mtDNA) contents in SM were normal
in both siblings; 62% and 149% relative to tissue and age-matched
controls for patient S1 and S2, respectively. PDC, ketoglutarate
dehydrogenase complex, and several mitochondrial electron transport
chain (ETC) complex activities were low or at the low end of the
reference range in frozen SM from S1 and/or S2 (Tables 4 and 5). In
contrast, activities of PDC, other mitochondrial enzymes of pyruvate
metabolism, ETC and integrated oxidative phosphorylation, in skin
fibroblasts were not significantly impaired (Tables 4 and 5). Although we
show that propionyl-CoA inhibits PDC (Figs. 5 and 6), it does not appear
to account for decreased PDC activity in SM (Table 6). A-SCS deficiency
which causes a block in the TCA cycle, may cause a secondary upstream
increase of acetyl-CoA that could inhibit PDC, but this would not explain
low PDC activity noted in S1 (Table 6).
A better understanding of the mechanisms of phenotypic variability
and the etiology for tissue-specific secondary deficiencies of
mitochondrial enzymes of oxidative metabolism, and independently
mitochondrial DNA depletion (common in other cases of A-SCS
deficiency), is needed given the implications for control of lactic acidosis
and possible clinical management.
Succinyl-CoA synthetase deficiency in siblings with impaired
pyruvate dehydrogenase complex (PDC) and other oxidative
enzymes in skeletal muscle without mtDNA depletion
Harvard Medical School
Boston Children’s Hospital
Table 2. Summary of Key Prediction Parameters for the SUCLA2 Variants Identified by WES
Variant Polyphen-2
(0 to 1)
PhyloP-vertebrate
(-11.764 to +6.924)
CADD-
Phred
(1 to 99)
CADD-raw
Mutation
Taster
(0 to 1)
Omicia
score
(0 to 1)
Allele
Freq
M329V 0.999 4.56 20.10 3.94 1 0.94 <0.0002
A307V 0.446 4.33 14.45 2.54 1 0.79 0.0000
CADD-Phred; ≥20 or ≥10 means within 1% or 10% of most deleterious, respectively.
Fig. 5. Double-reciprocal (Lineweaver-
Burk) plots from which apparent Ki was
determined for propionyl-CoA inhibition of
PDC. (A) FB, fibroblast extract and (B) SM,
skeletal muscle homogenate shown only.
Fig. 6. Inhibition of PDC by propionyl-CoA. Vmax
(nmol/min/mg protein) of PDC (A, purified porcine heart
complex); or apparent Vmax (B, complex in disrupted
cultured fibroblasts; and C, complex in SM homogenate)
vs propionyl-CoA concentration (mM) and their
respective determined Ki or apparent Ki. Fig. 4. Summary of the WES pipeline used in this work. MS, missense; FS, frameshift; SS, splice
site; and X, stop.
Xiaoping Huanga,, Jirair K. Bedoyanb,c,d,j, Didem Demirbasa, David J. Harrisa,e, Alexander Mironc, Simone Edelheitc, George
Grahamed, Suzanne D. DeBrossebc,j, Lee-Jun Wongf, Charles L. Hoppeld,g,h, Douglas S. Kerrd,j, Irina Anselmi, and Gerard T. Berrya,e
a Division of Genetics and Genomics, The Manton Center for Orphan Disease Research, Boston Children’s Hospital (BCH), Boston, MA, USA; b Center for Human Genetics, University Hospitals Cleveland Medical Center
(UHCMC), Cleveland, OH, USA; c Department of Genetics and Genome Sciences, Case Western Reserve University (CWRU), Cleveland, OH, USA; d Center for Inherited Disorders of Energy Metabolism (CIDEM), UHCMC,
Cleveland, OH, USA; e Department of Pediatrics, Harvard Medical School, Boston, MA, USA; f Department of Molecular and Human Genetics, Baylor College of Medicine, Houston, TX, USA; g Department of Pharmacology,
CWRU, Cleveland, OH, USA; h Department of Medicine, CWRU, Cleveland, OH, USA; I Department of Neurology, BCH, Boston, MA USA; and j Department of Pediatrics, CWRU, Cleveland, OH, USA.
Cleveland Medical Center
Table 1. Fibroblast ATP- and GTP-Succinyl-CoA synthetase (SCS) Analysis
Activity
Control 1 Control 2 Control 3 S1 S2-1 S2-2
ATP 1.02 ± 0.45
(n=15)
0.98 ± 0.32
(n=13)
1.04 ± 0.50
(n=10)
0.10 ± 0.00 (n=2)
0.09 ± 0.05
(n=12)
0.18 ± 0.06
(n=7)
Mean ± SD of 3
control lines 1.01 ± 0.03
% control 8.8% 17.5% 9.5%
GTP 8.58 ± 1.90
(n=13) 7.60 ± 2.45 (n=9)
10.91 ± 3.85
(n=7)
12.07 ± 6.92
(n=3)
13.91 ± 3.42
(n=9)
10.51 ± 2.41
(n=9)
Mean ± SD of 3
control lines 9.03 ± 1.70
% control 154.04% 116.34% 133.70%
Activity, nmol/min/mg protein; Rxn [succinate] = 10 mM
Fig. 3. Western blot analyses result
of decreased SUCLA2 in patient
lines. SUCLA2 protein detected by
Western Blot and normalized to
total GAPDH levels as loading
controls. Relative SUCLA2 amounts
were calculated using mean value
of controls (as %).
Fig. 2. A-SCS activity measurement by LC-MS/MS. (A) Time dependency was measured in control
line and patient line at 37°C for 0, 3, 6, 9 and 12 min with 50 mM Tris buffer pH 8.0, 5 mM MgCl2, 10
mM D4-succinate, 1 mM ATP, 1 mM CoA, oligomycin 2 µg/ml and homogenate protein
concentration 1mg/ml. Activity linearity is shown within 9min. (B) Protein dependency was
measured in control line for 6 min at different protein concentrations, 0, 0.5, 0.75, 1 and 1.25 mg/ml.
Linear for protein concentrations <1.25 mg/ml. (C) and (D) Apparent Km and Vmax of succinate were
measured from two control lines with different D4-succinate concentrations, 0.37, 1.11, 3.33, 10 and
30 mM, and 1mg/ml homogenate incubated at 37°C for 6min. Other conditions were same as (A).
methylmalonylcarnitine
succinylcarnitine
TCA
propionylcarnitine
PDC
KDC
Heterodimer:
SUCLA1 + SUCLA2 Succinyl CoA + Pi + ADP ↔ Succinate + CoA + ATP
SUCLA1 + SUCLG2 Succinyl CoA + Pi + GDP ↔ Succinate + CoA + GTP
Fig. 1. Interrelationship of PDC, tricarboxylic acid (TCA) cycle intermediates such as A-SCS, and
the methylmalonic pathway as it relates to impairment of SCS. Adopted and modified from Van
Hove et al. (2010) Pediatr Res 68:159.
ACKNOWLEDGMENTS This research was supported in part by the Manton Center for Orphan Disease Research Gene Discovery Core, Boston
Children’s Hospital and the Genomics Core Facility of the Case Western Reserve University (CWRU) School of Medicine's
Genetics and Genome Sciences Department, and by funds from the Clinical and Translational Science Collaborative (CTSC)
CWRU Core Utilization Pilot Grant 2014 (05496) (to JKB) and NIH RDCRN 5U54NS078059-05 project NAMDC 7413 grant
(to JKB and SDD).
Parts of this work were presented as a talk (by JKB) at the 2016 Society for Inherited Metabolic Disorders (SIMD)
meeting.
These authors contributed equally to this work.