Embed Size (px)
Citation preview
Harvestingandharnessingdataforbiogeographicalresearch
A.Species TreeGeography TreeB.
20406080100
2 1
3
– inventories and surveys• natural areas, preserves, state
forests, private properties• development permits
– herbarium/museum specimens• collectors often target specific
places or taxa• records of what, where, when,
and by whom
How do we know what grows where?
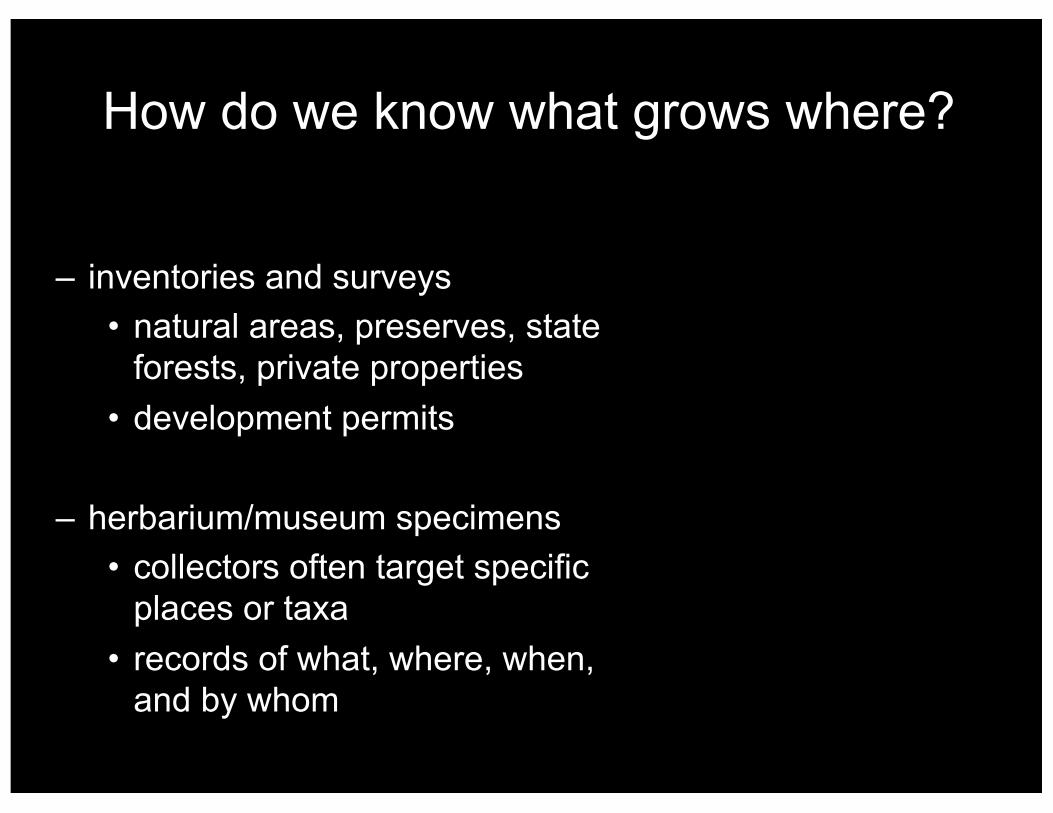
How do we know what grows where?
∑ Local observations = State Flora
blackbulrush
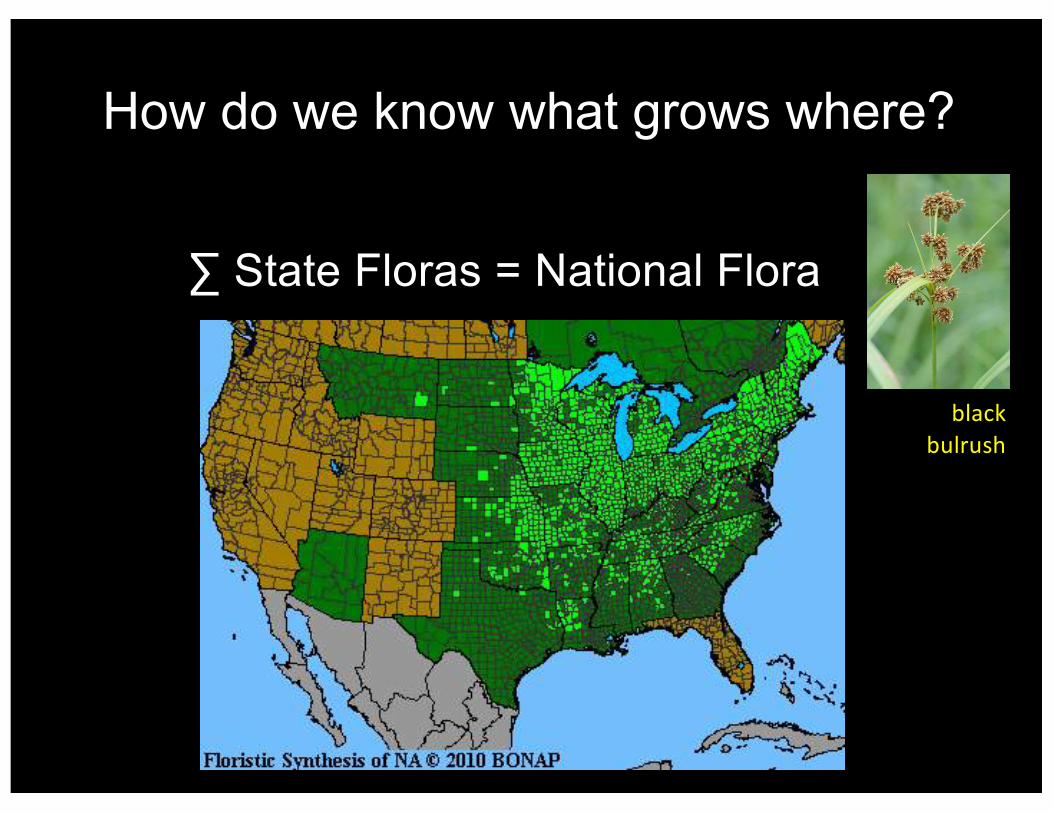
How do we know what grows where?
∑ State Floras = National Flora
blackbulrush
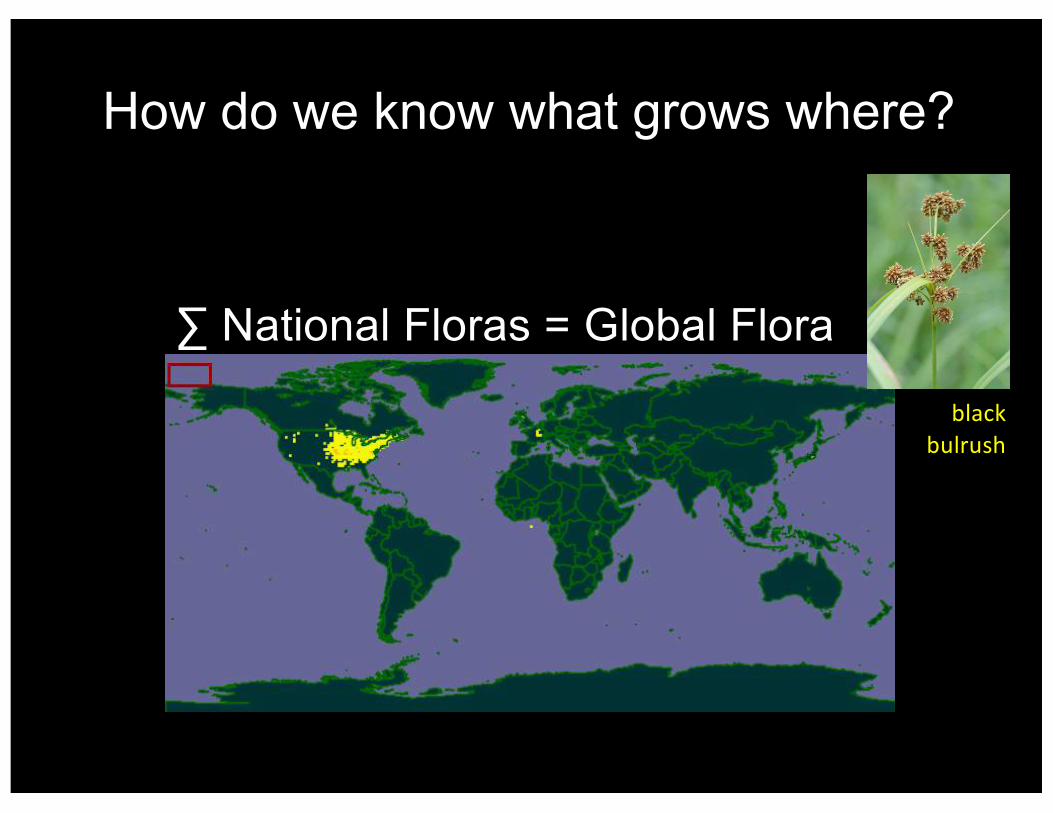
How do we know what grows where?
∑ National Floras = Global Flora
blackbulrush
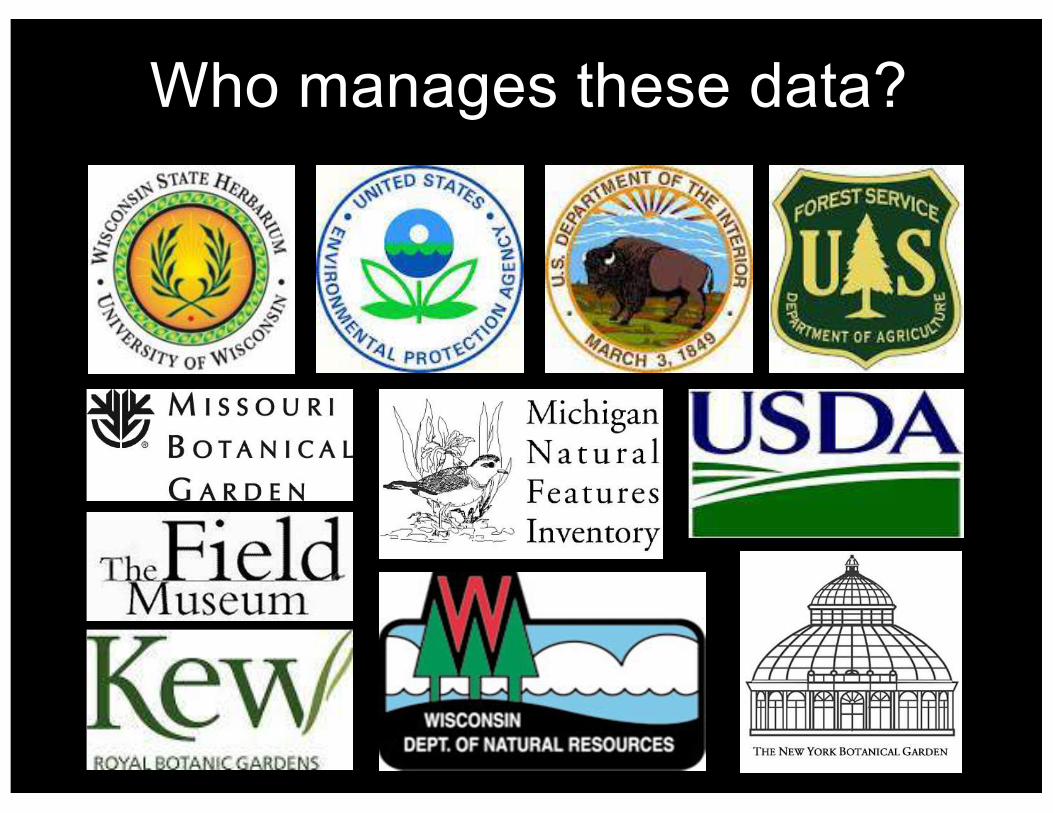
Who manages these data?
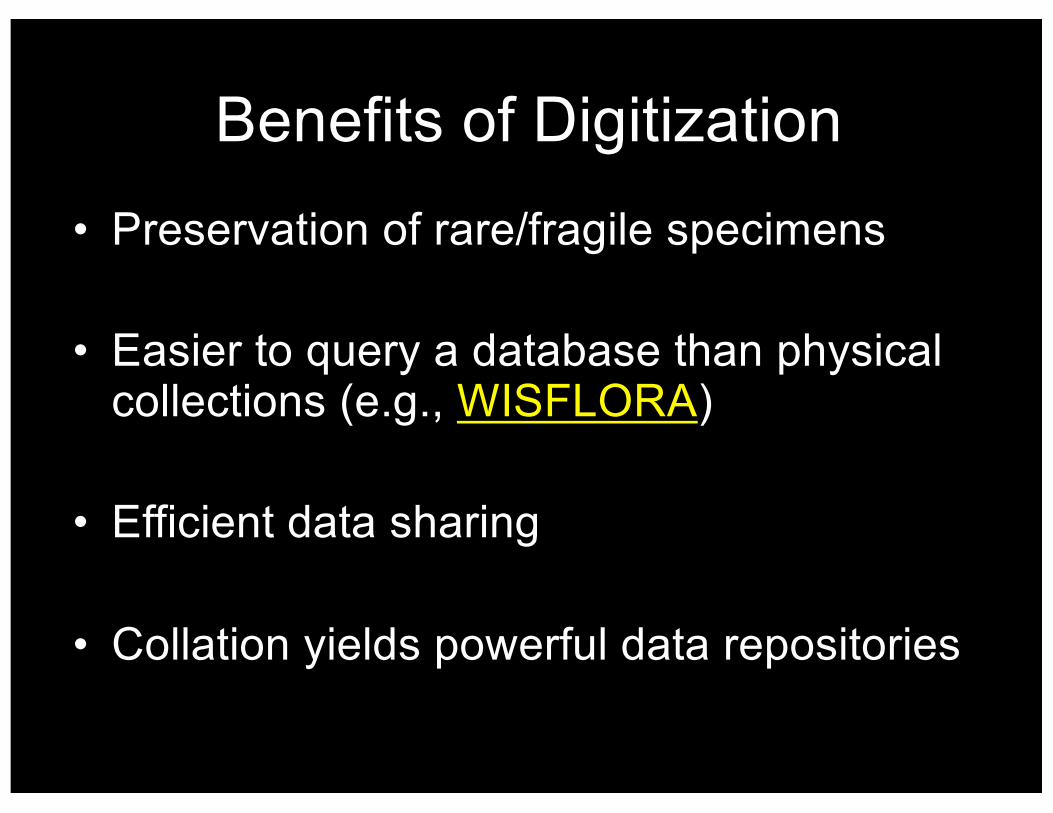
Benefits of Digitization• Preservation of rare/fragile specimens
• Easier to query a database than physical collections (e.g., WISFLORA)
• Efficient data sharing
• Collation yields powerful data repositories
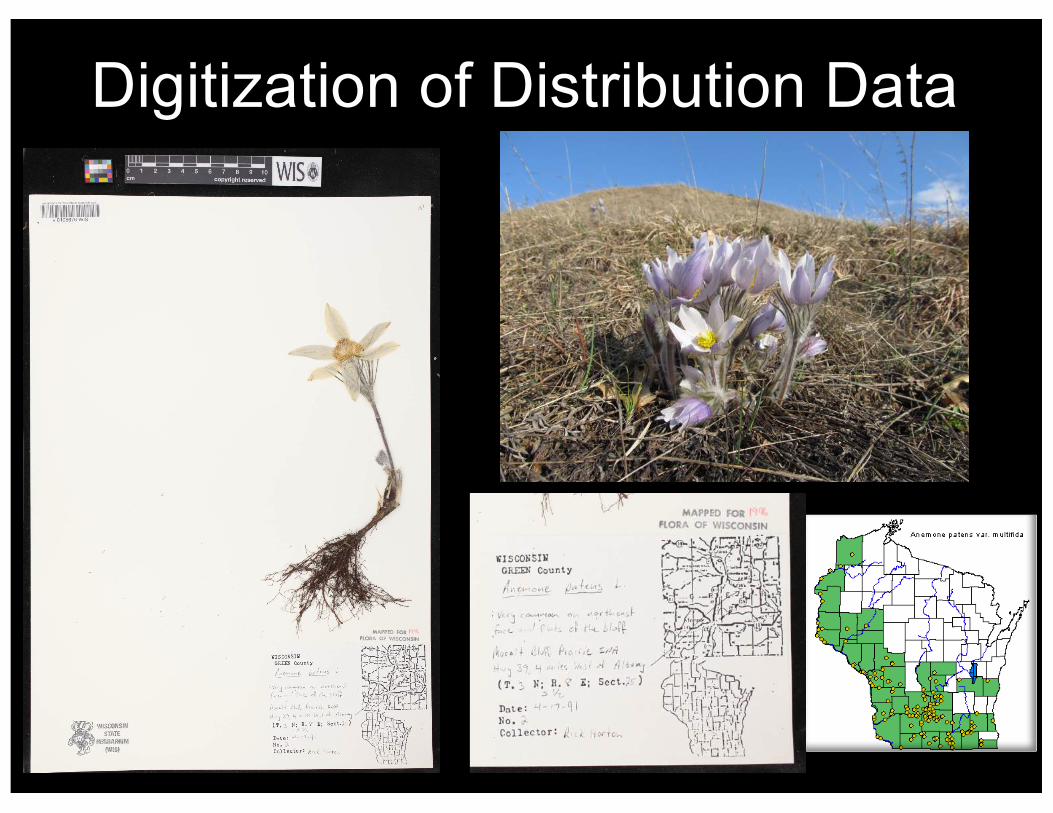
Digitization of Distribution Data
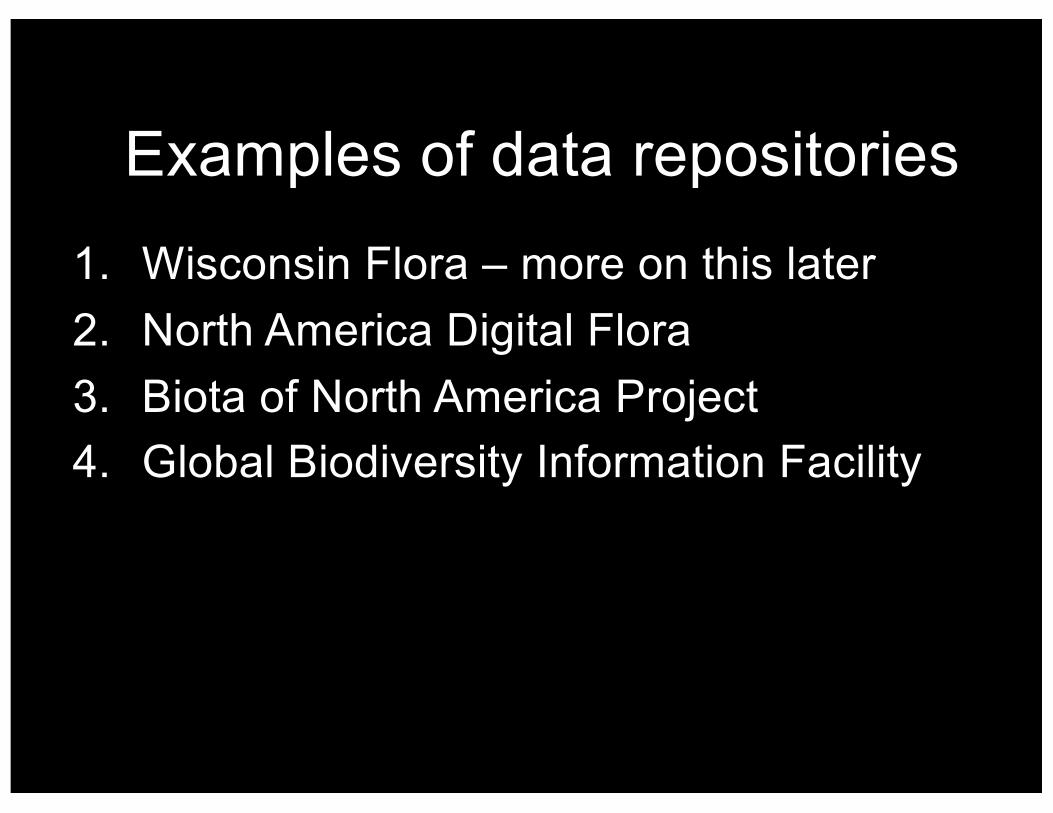
Examples of data repositories1. Wisconsin Flora – more on this later2. North America Digital Flora3. Biota of North America Project4. Global Biodiversity Information Facility
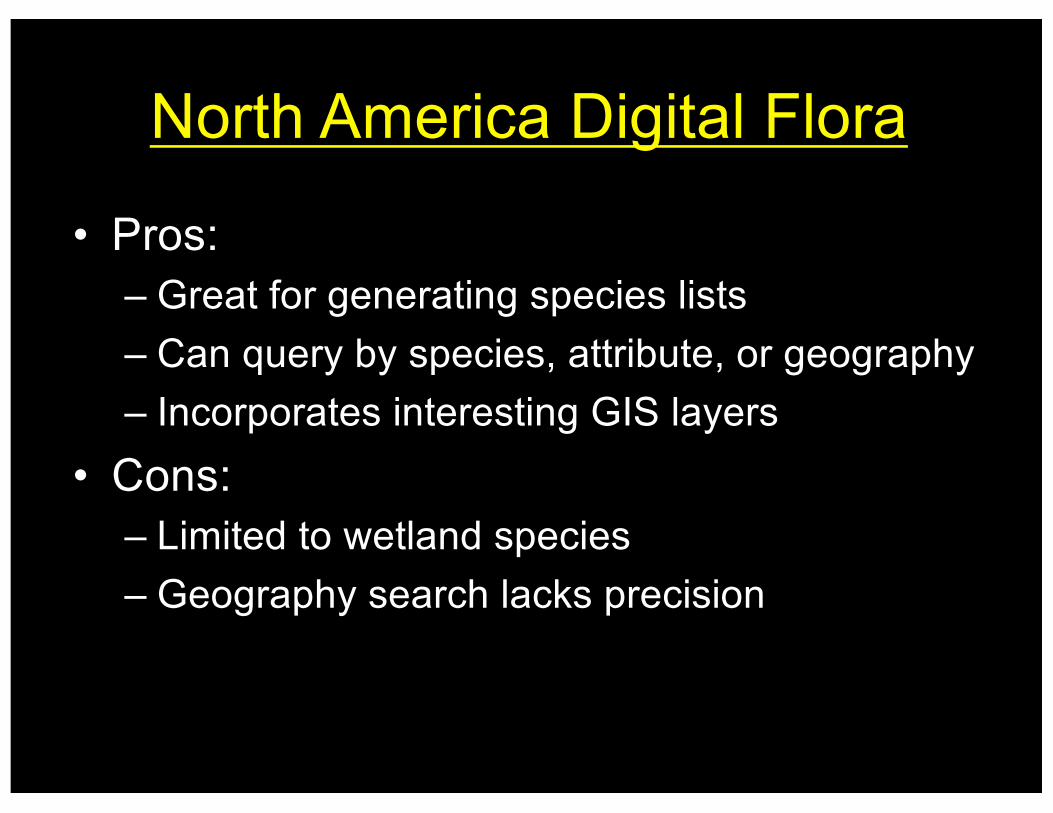
North America Digital Flora
• Pros:– Great for generating species lists– Can query by species, attribute, or geography– Incorporates interesting GIS layers
• Cons:– Limited to wetland species– Geography search lacks precision
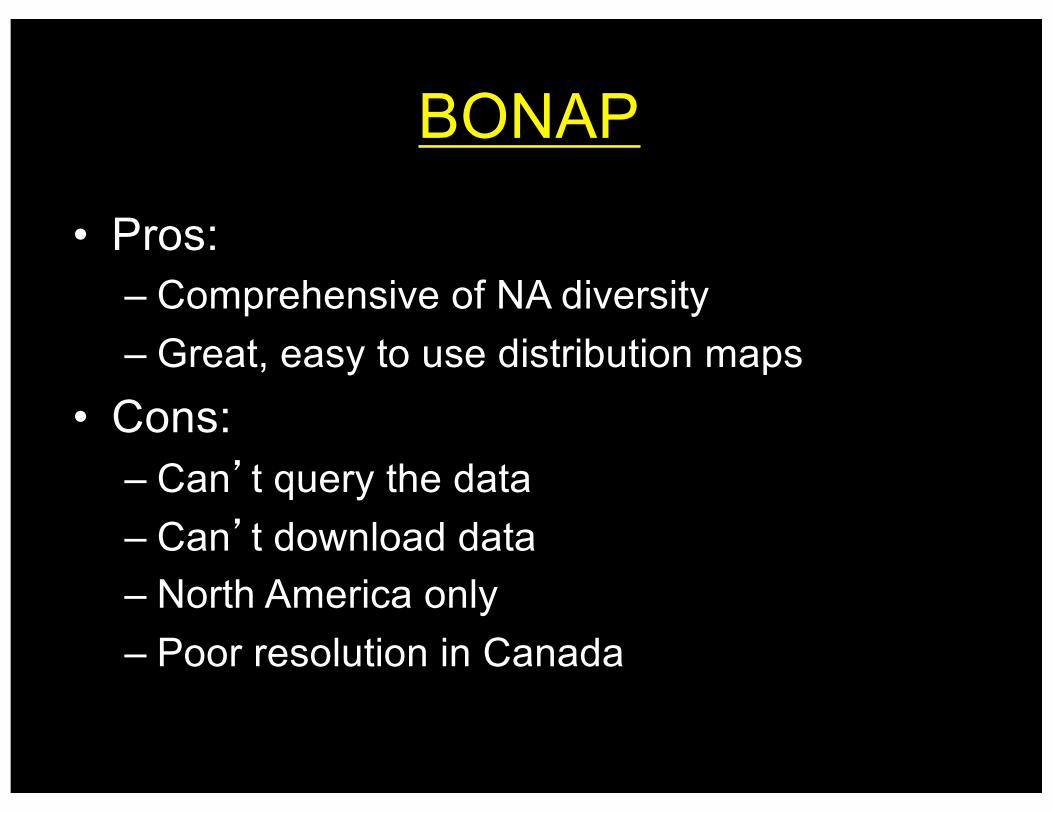
BONAP
• Pros:– Comprehensive of NA diversity– Great, easy to use distribution maps
• Cons:– Can’t query the data– Can’t download data– North America only– Poor resolution in Canada
GBIF
• Pros– Global data of plants, animals, fungi– Database is fully searchable– Data are downloadable
• Cons– Data are incomplete (WIS not in yet)– Some records are suspect
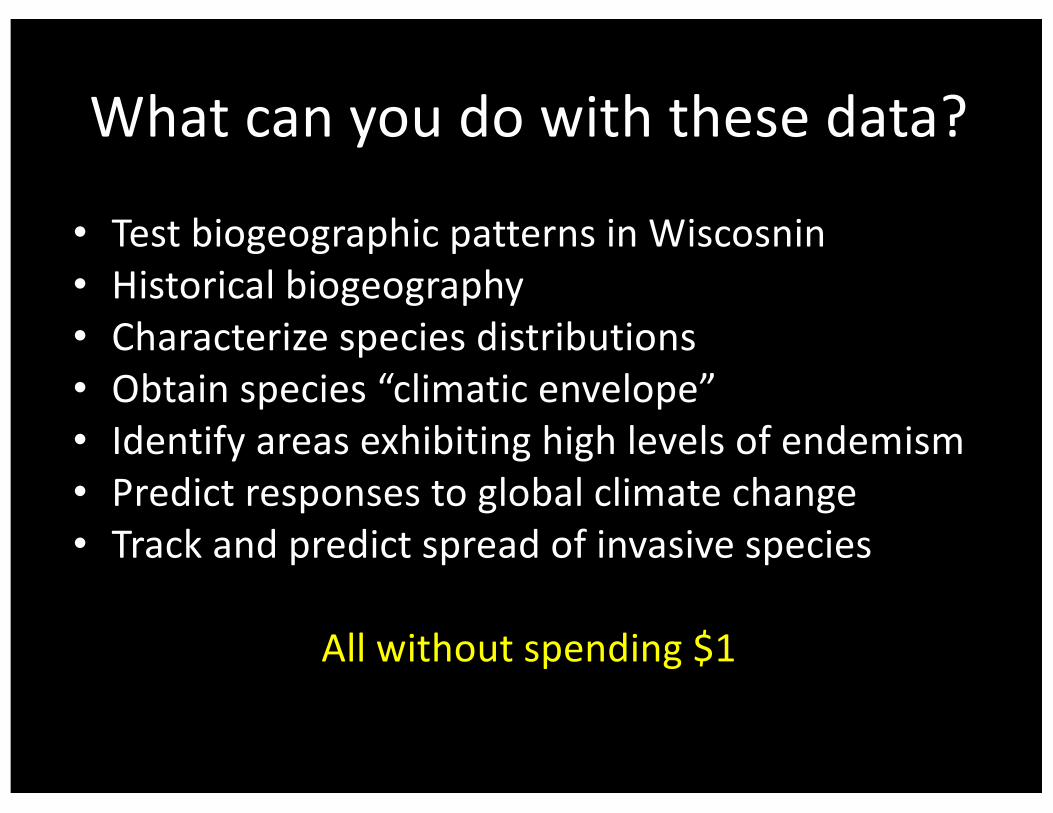
Whatcanyoudowiththesedata?
• TestbiogeographicpatternsinWiscosnin• Historicalbiogeography• Characterizespeciesdistributions• Obtainspecies“climaticenvelope”• Identifyareasexhibitinghighlevelsofendemism• Predictresponsestoglobalclimatechange• Trackandpredictspreadofinvasivespecies
Allwithoutspending$1
Wisflora
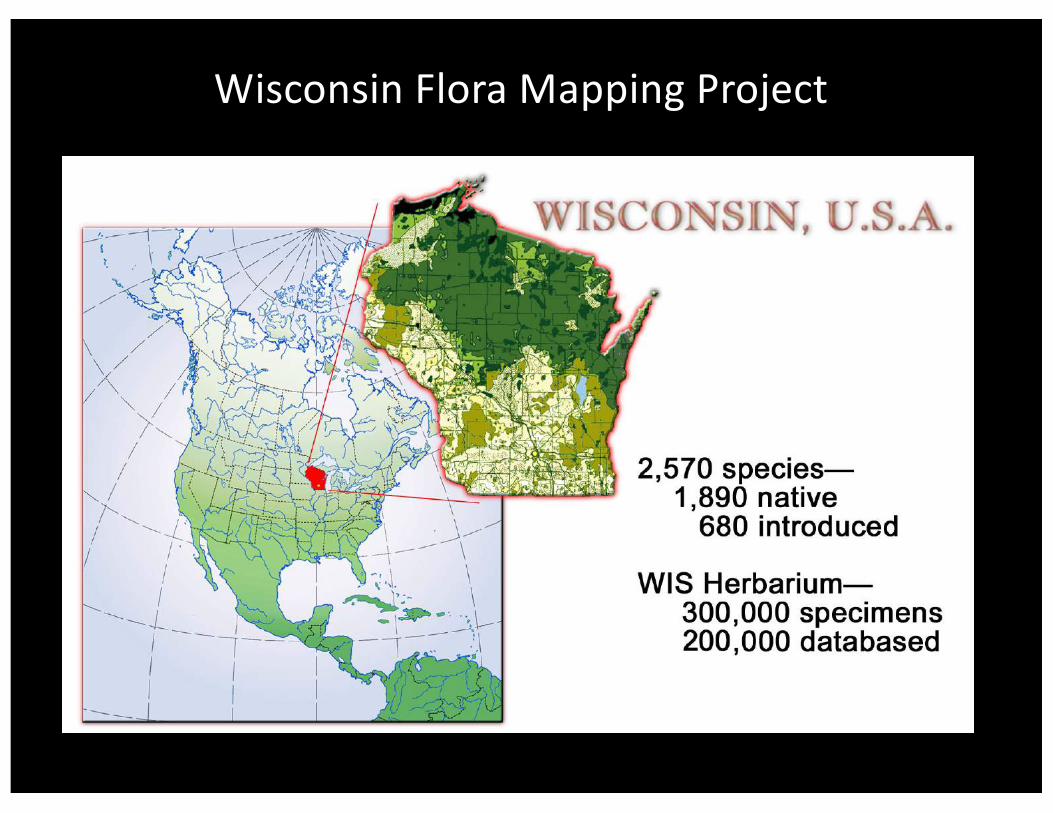
WisconsinFloraMappingProject
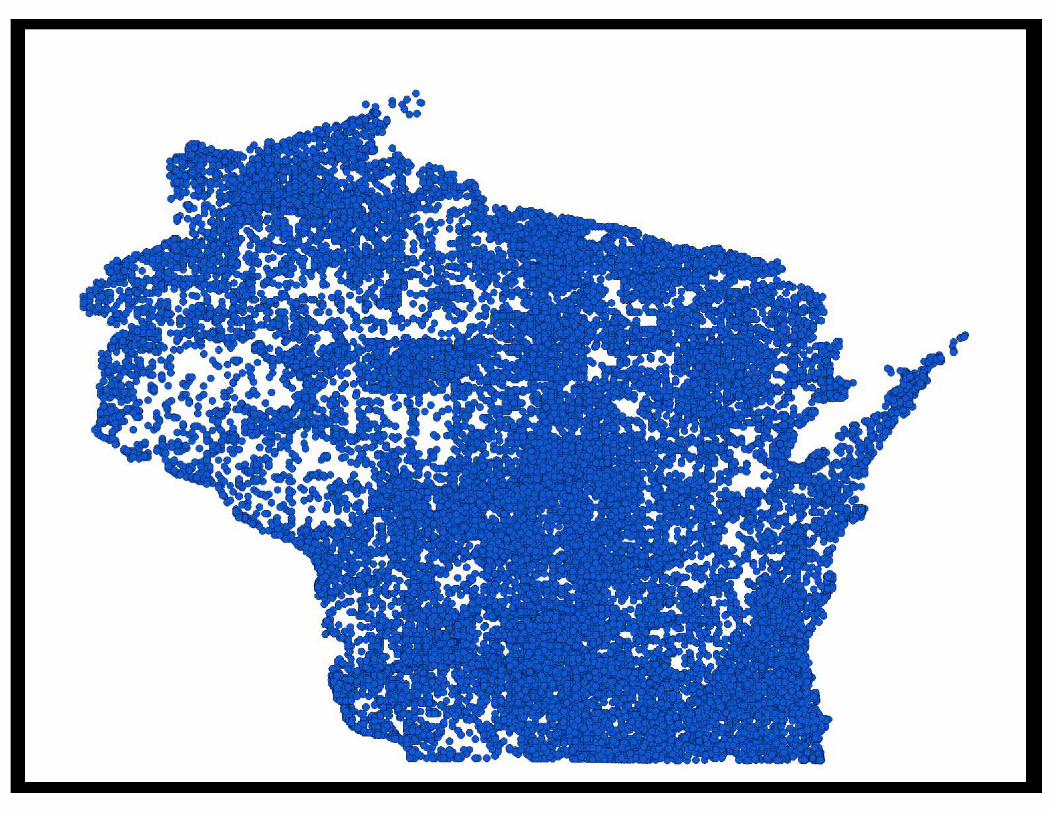
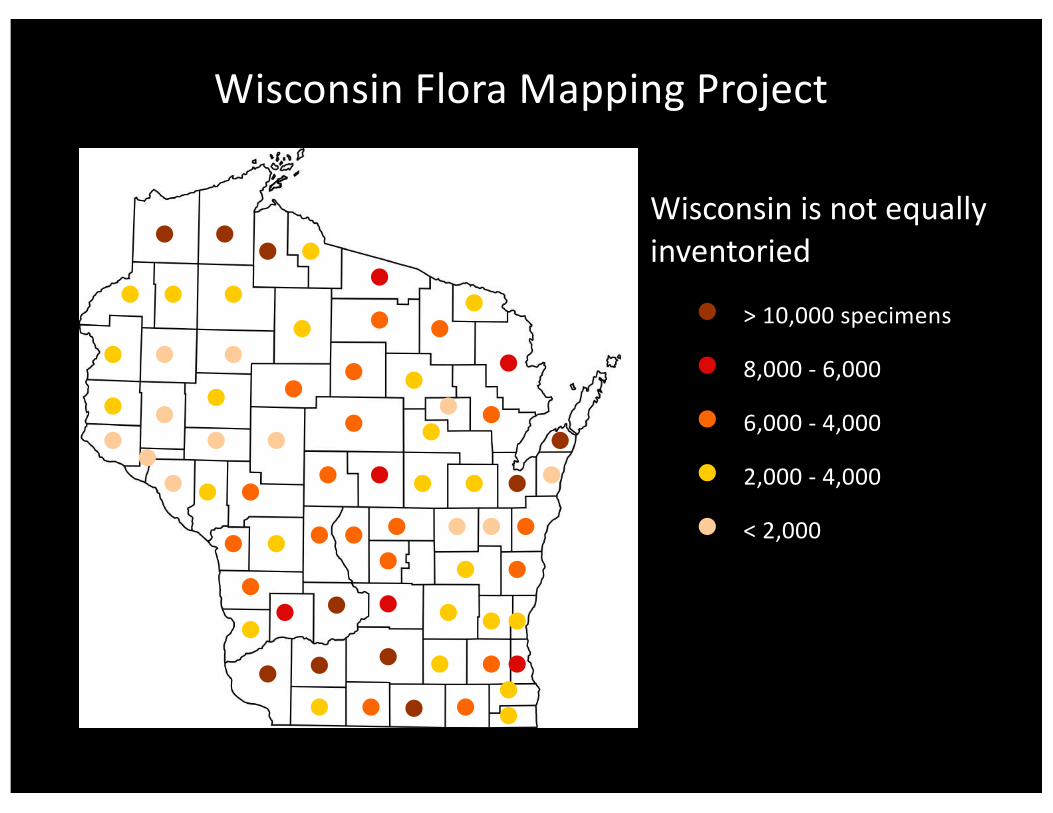
WisconsinFloraMappingProject
Wisconsinisnotequallyinventoried
>10,000specimens
8,000- 6,000
6,000- 4,000
2,000- 4,000
<2,000
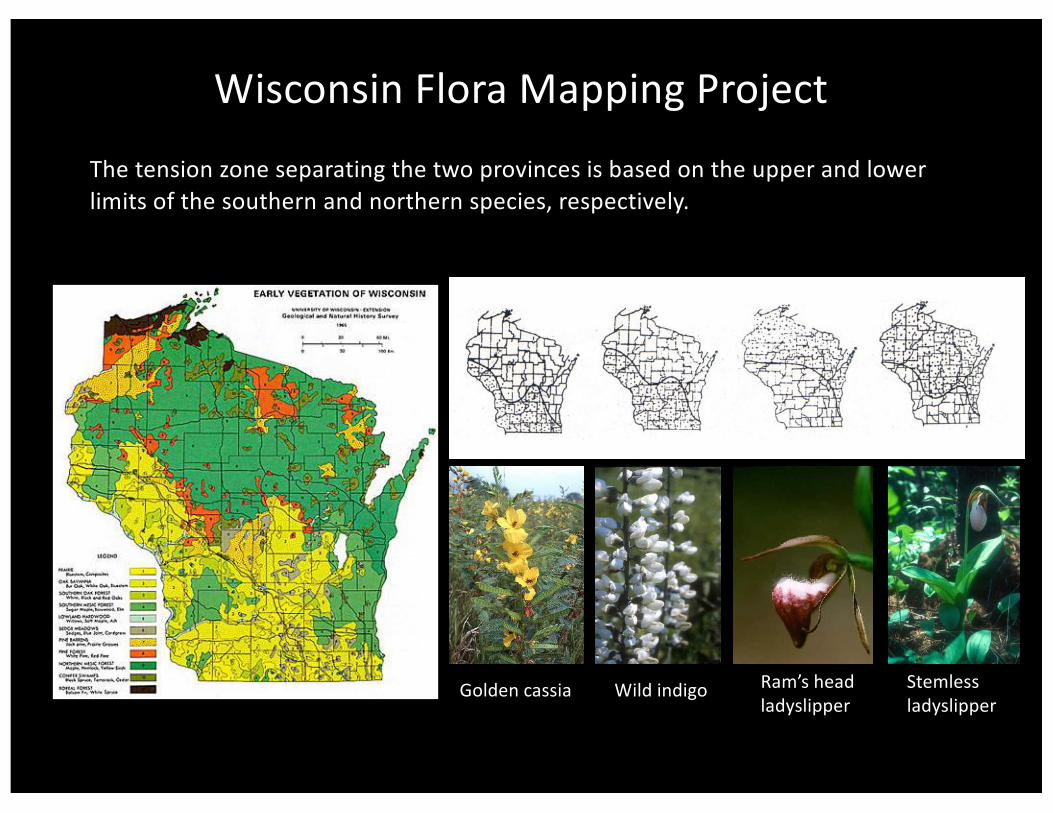
Thetensionzoneseparatingthetwoprovincesisbasedontheupperandlowerlimitsofthesouthernandnorthernspecies,respectively.
Goldencassia Wildindigo Ram’sheadladyslipper
Stemlessladyslipper
WisconsinFloraMappingProject
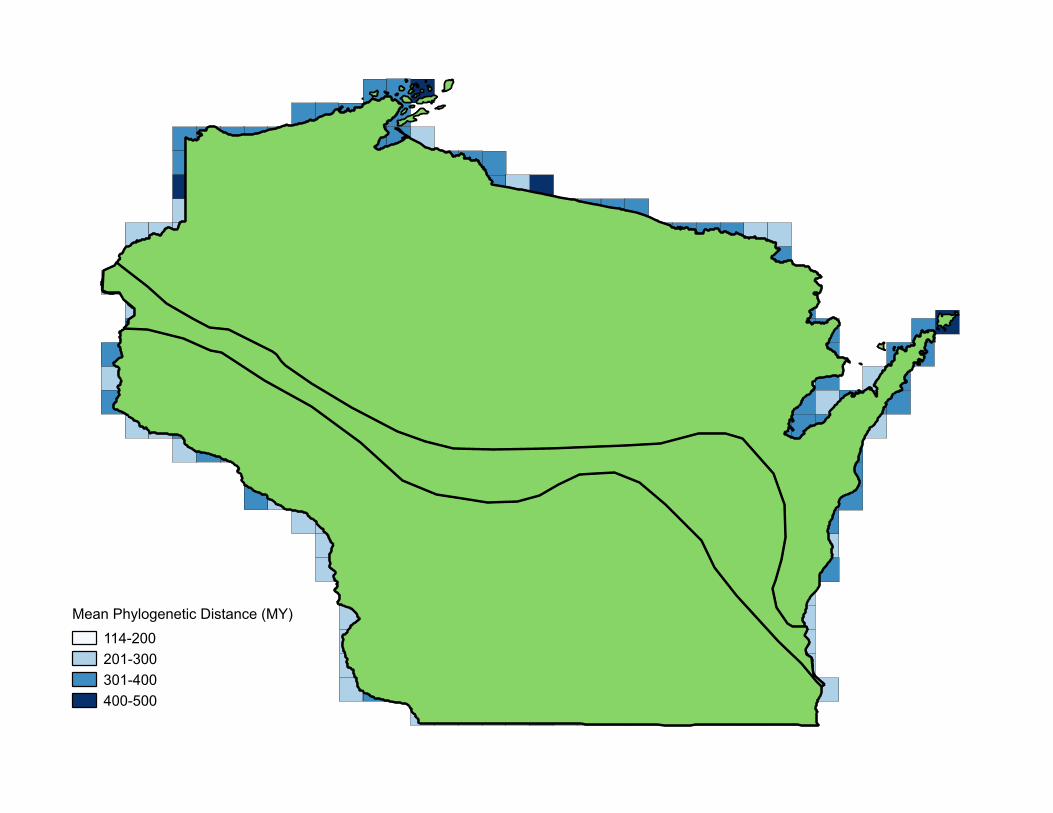
Mean Phylogenetic Distance (MY)
114-200201-300301-400400-500
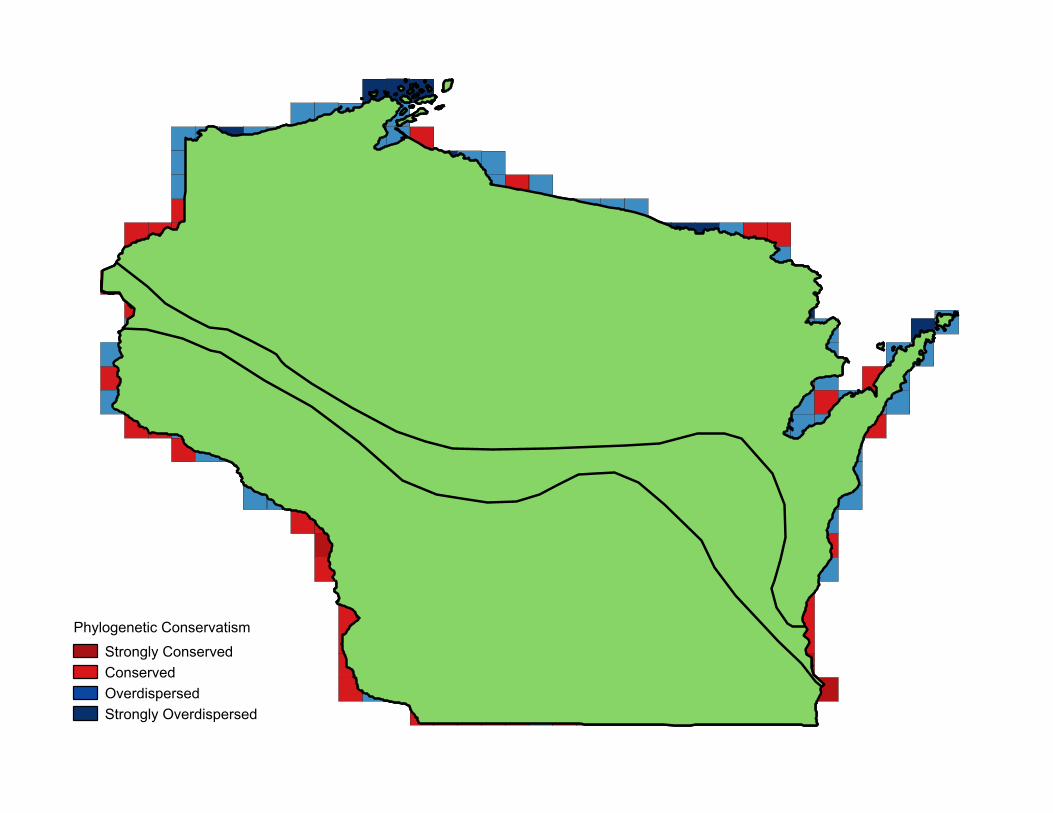
Phylogenetic Conservatism
Strongly ConservedConservedOverdispersedStrongly Overdispersed
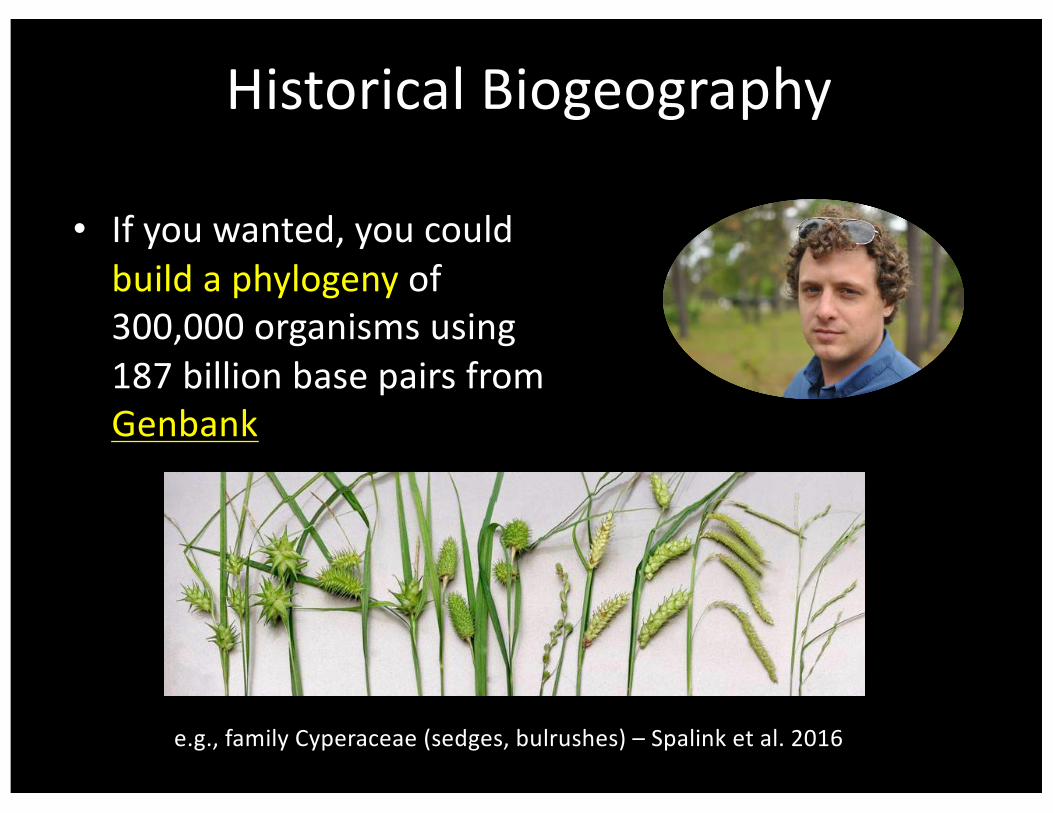
HistoricalBiogeography
• Ifyouwanted,youcouldbuildaphylogenyof300,000organismsusing187billionbasepairsfromGenbank
e.g.,familyCyperaceae (sedges,bulrushes)– Spalink etal.2016
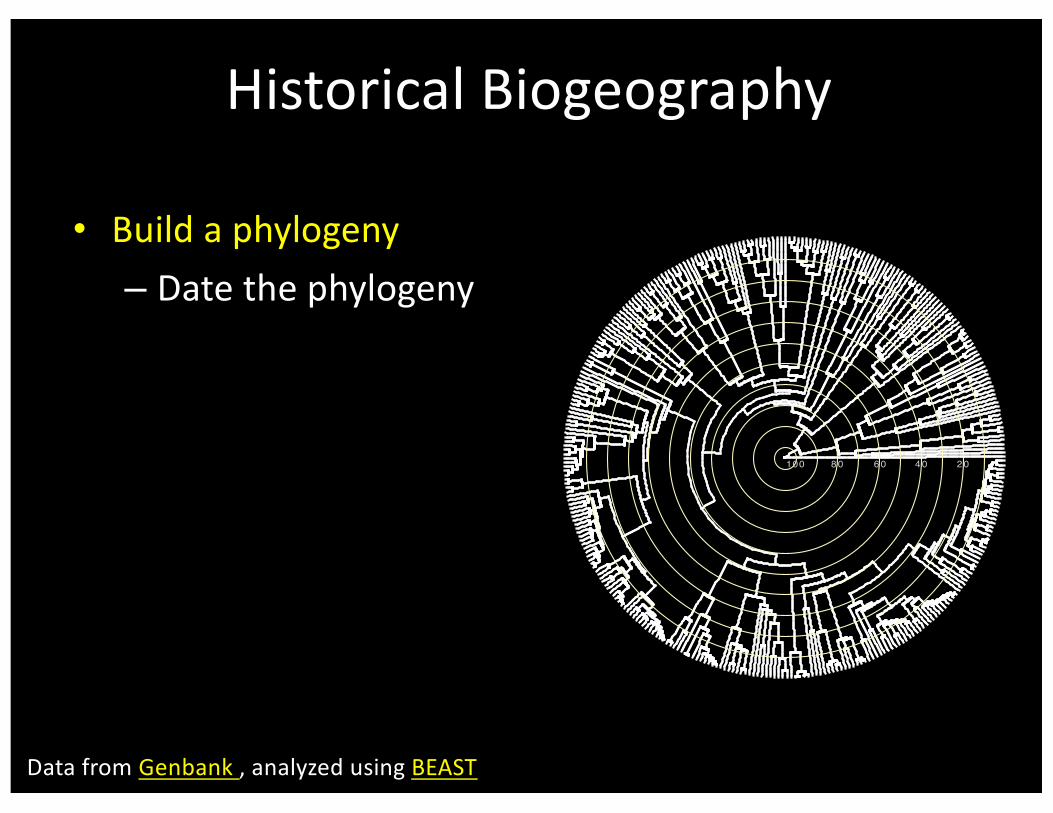
HistoricalBiogeography
• Buildaphylogeny– Datethephylogeny
20406080100
DatafromGenbank,analyzedusingBEAST
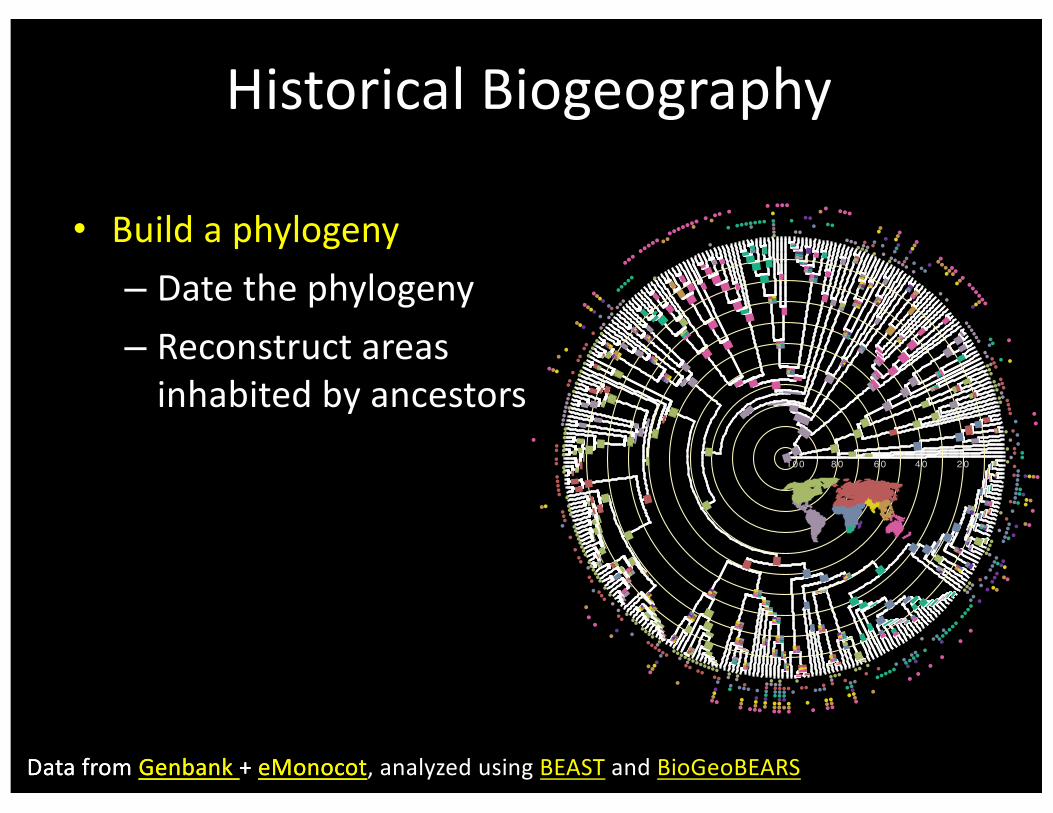
HistoricalBiogeography
• Buildaphylogeny– Datethephylogeny– Reconstructareasinhabitedbyancestors
20406080100
DatafromGenbank+eMonocotDatafromGenbank+eMonocot,analyzedusingBEAST andBioGeoBEARS
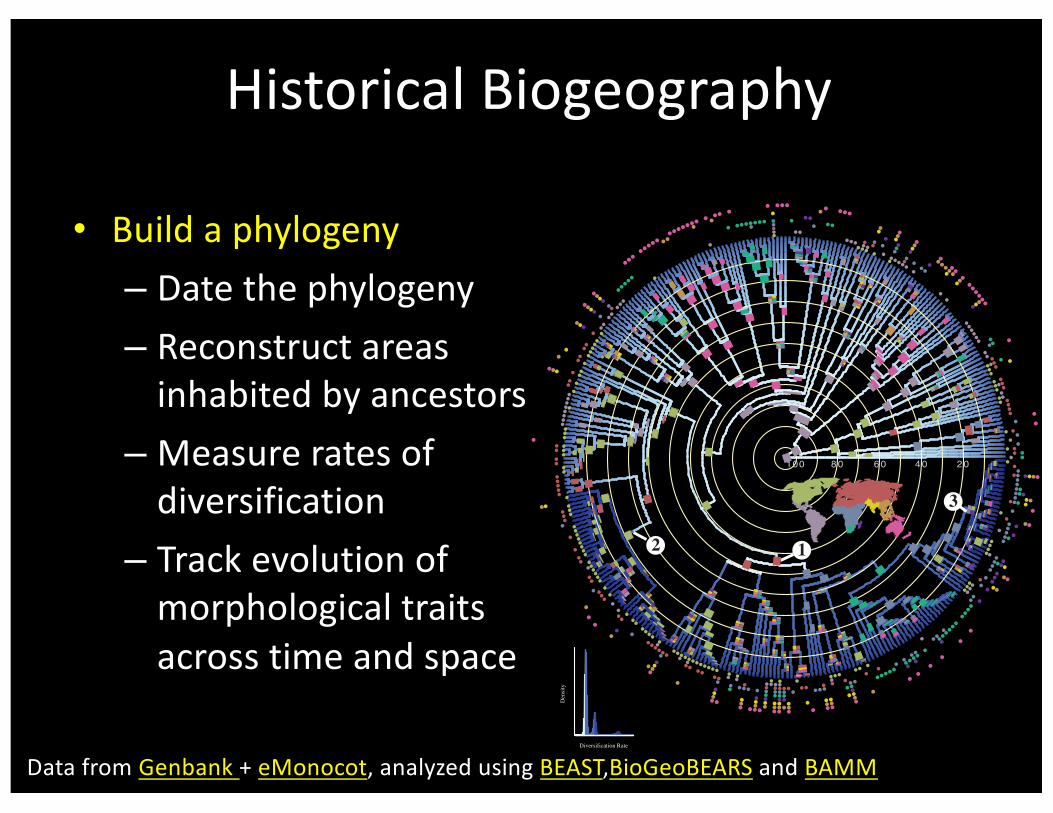
HistoricalBiogeography
• Buildaphylogeny– Datethephylogeny– Reconstructareasinhabitedbyancestors
– Measureratesofdiversification
– Trackevolutionofmorphologicaltraitsacrosstimeandspace
20406080100
2 1
3
Diversification Rate
Den
sity
DatafromGenbank+eMonocot,analyzedusingBEAST,BioGeoBEARS andBAMM
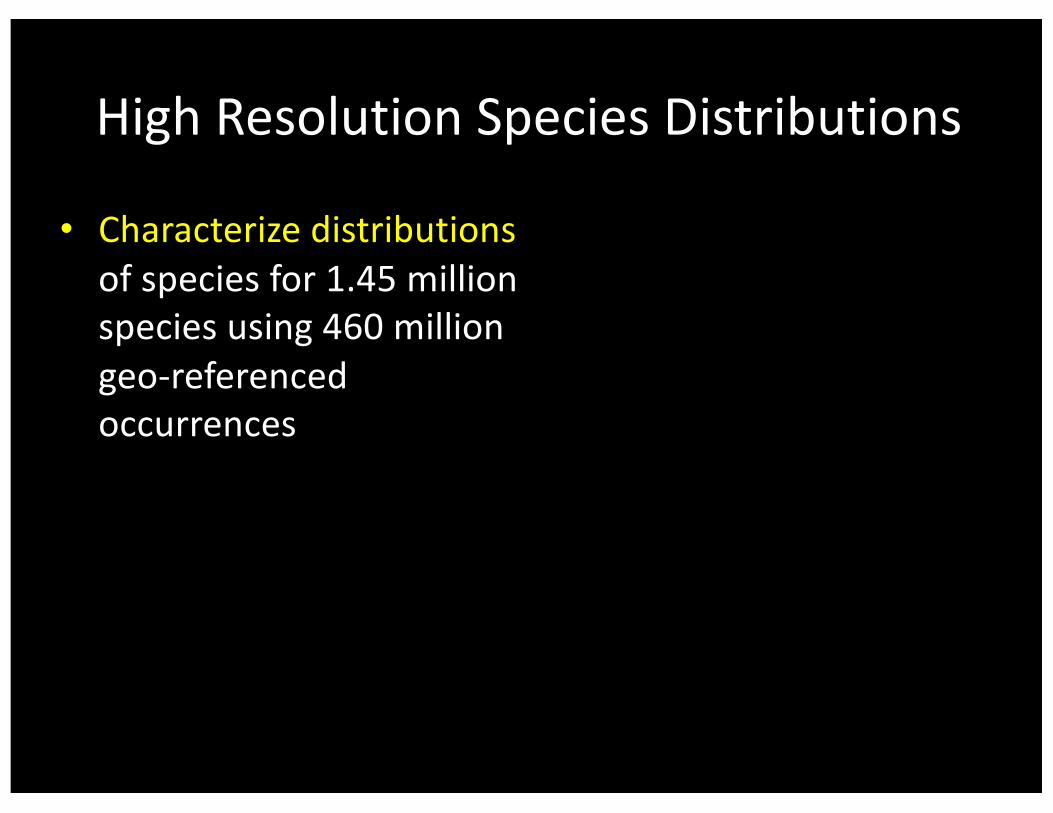
HighResolutionSpeciesDistributions
• Characterizedistributionsofspeciesfor1.45millionspeciesusing460milliongeo-referencedoccurrences
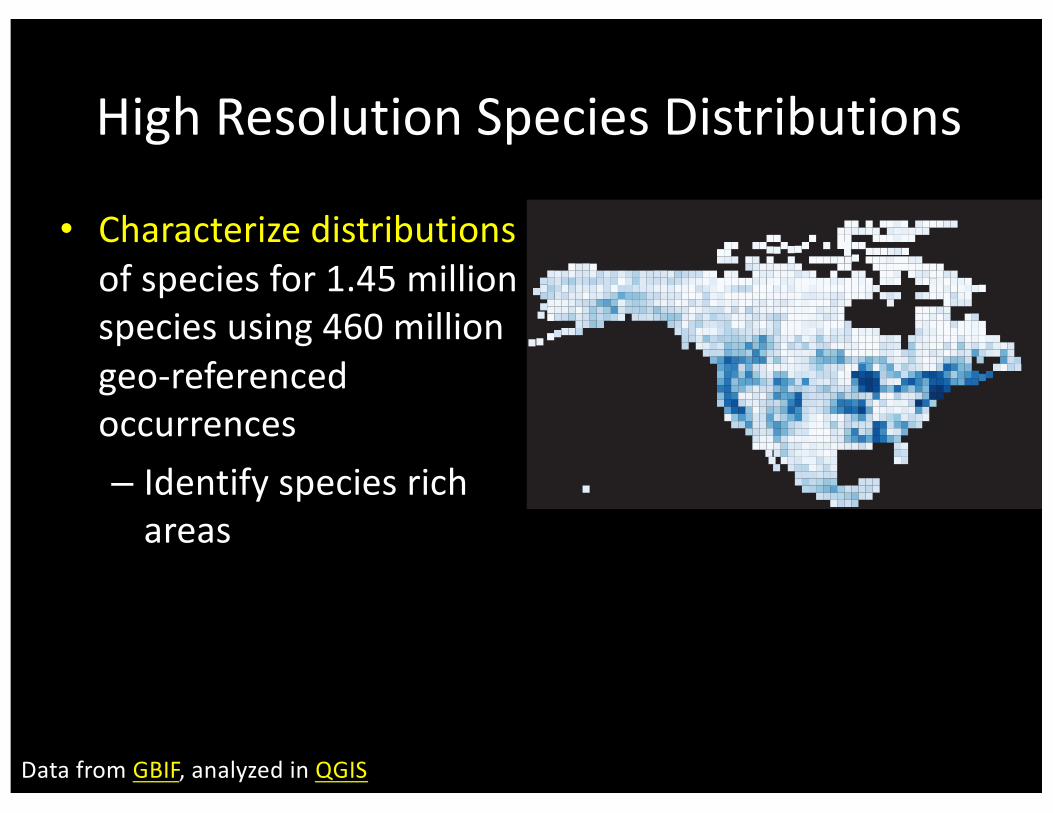
HighResolutionSpeciesDistributions
• Characterizedistributionsofspeciesfor1.45millionspeciesusing460milliongeo-referencedoccurrences– Identifyspeciesrichareas
DatafromGBIF,analyzedinQGIS
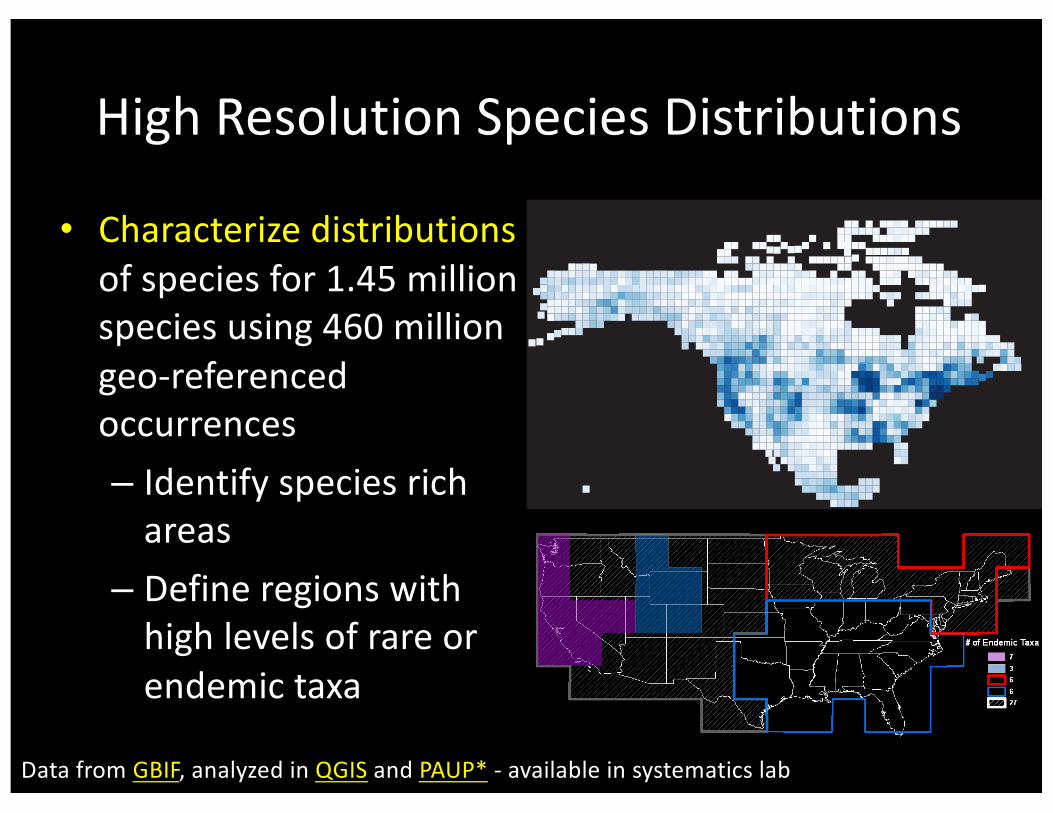
HighResolutionSpeciesDistributions
• Characterizedistributionsofspeciesfor1.45millionspeciesusing460milliongeo-referencedoccurrences– Identifyspeciesrichareas
– Defineregionswithhighlevelsofrareorendemictaxa
DatafromGBIF,analyzedinQGIS andPAUP* - availableinsystematicslab
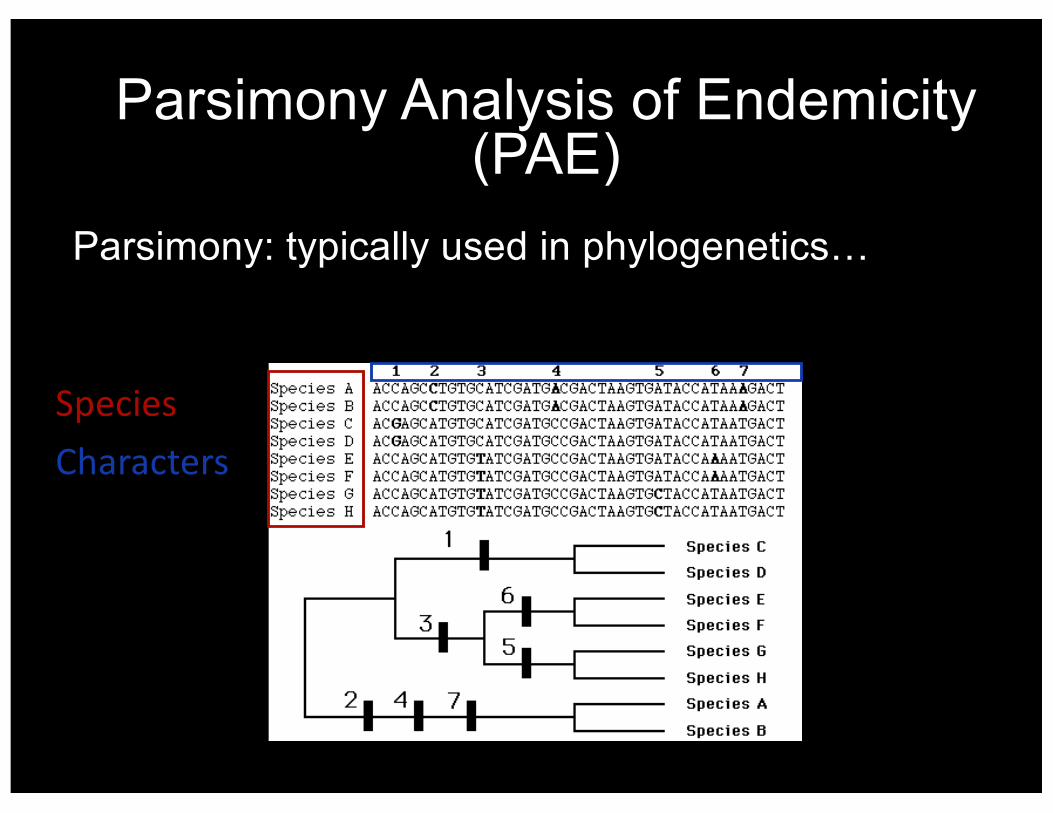
Parsimony: typically used in phylogenetics…
ExampledatasetfromSRDownie
SpeciesCharacters
Parsimony Analysis of Endemicity(PAE)
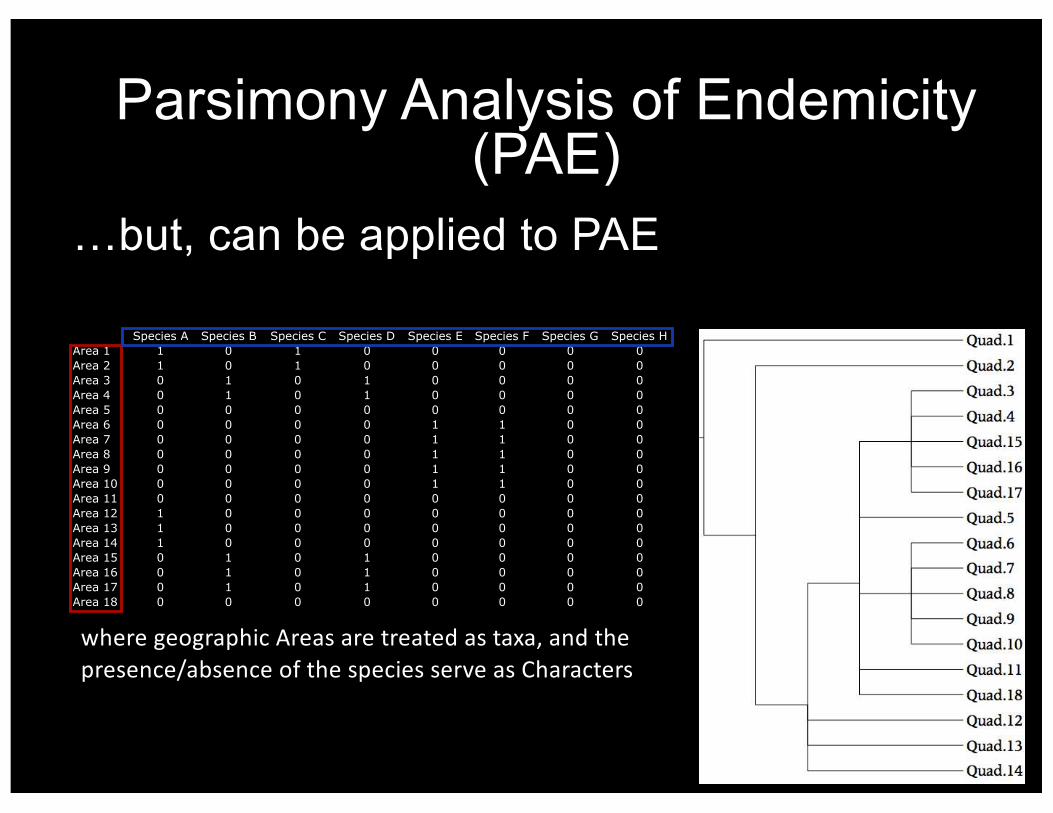
…but, can be applied to PAE
Species A Species B Species C Species D Species E Species F Species G Species HArea 1 1 0 1 0 0 0 0 0Area 2 1 0 1 0 0 0 0 0Area 3 0 1 0 1 0 0 0 0Area 4 0 1 0 1 0 0 0 0Area 5 0 0 0 0 0 0 0 0Area 6 0 0 0 0 1 1 0 0Area 7 0 0 0 0 1 1 0 0Area 8 0 0 0 0 1 1 0 0Area 9 0 0 0 0 1 1 0 0Area 10 0 0 0 0 1 1 0 0Area 11 0 0 0 0 0 0 0 0Area 12 1 0 0 0 0 0 0 0Area 13 1 0 0 0 0 0 0 0Area 14 1 0 0 0 0 0 0 0Area 15 0 1 0 1 0 0 0 0Area 16 0 1 0 1 0 0 0 0Area 17 0 1 0 1 0 0 0 0Area 18 0 0 0 0 0 0 0 0
wheregeographicAreasaretreatedastaxa,andthepresence/absenceofthespeciesserveasCharacters
Parsimony Analysis of Endemicity(PAE)
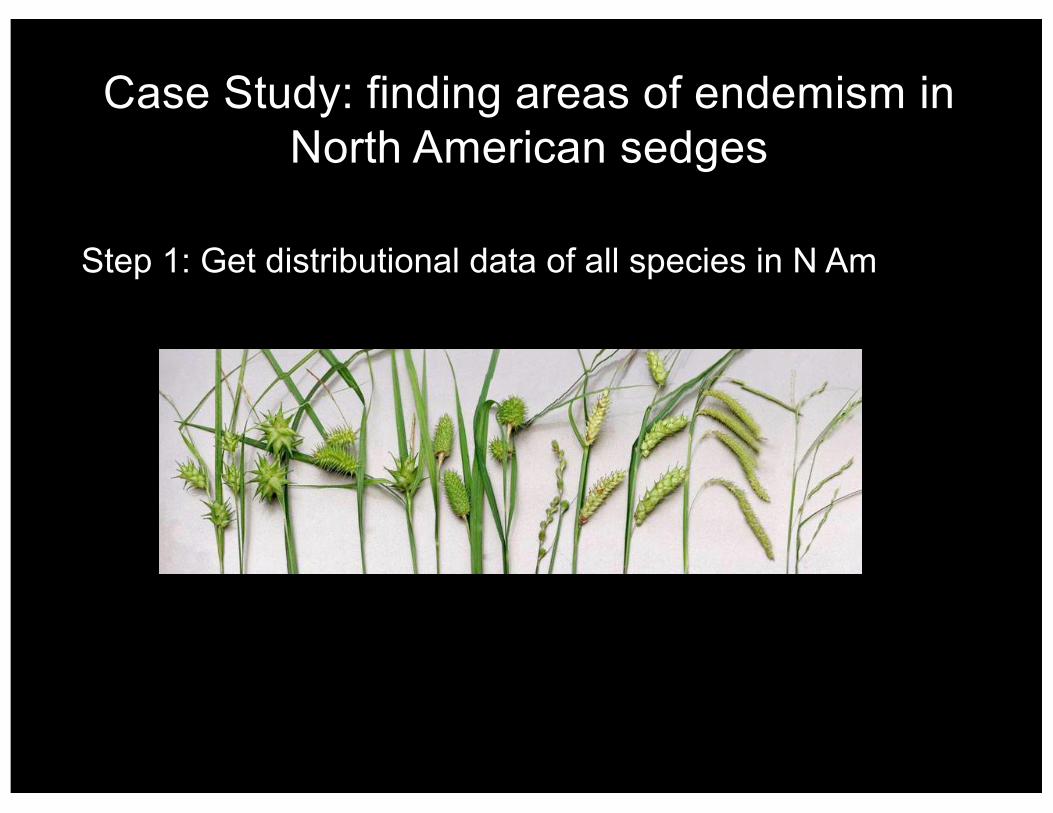
Case Study: finding areas of endemism in North American sedges
Step 1: Get distributional data of all species in N Am
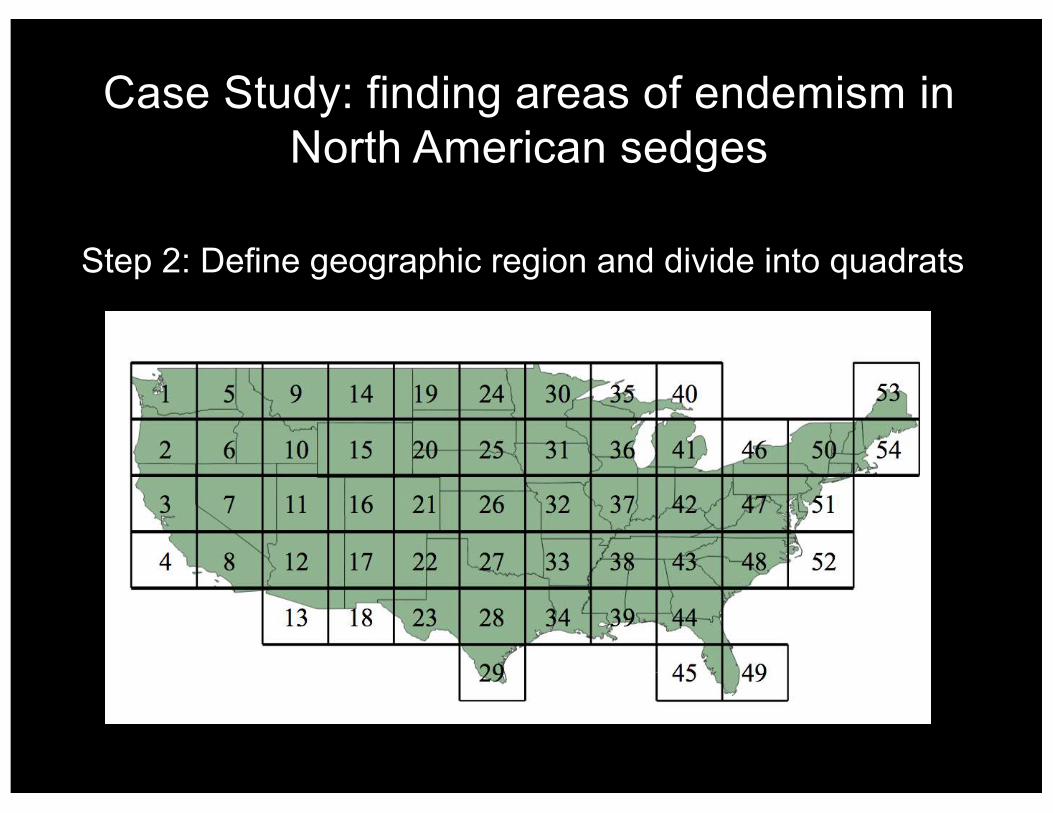
Step 2: Define geographic region and divide into quadrats
Case Study: finding areas of endemism in North American sedges
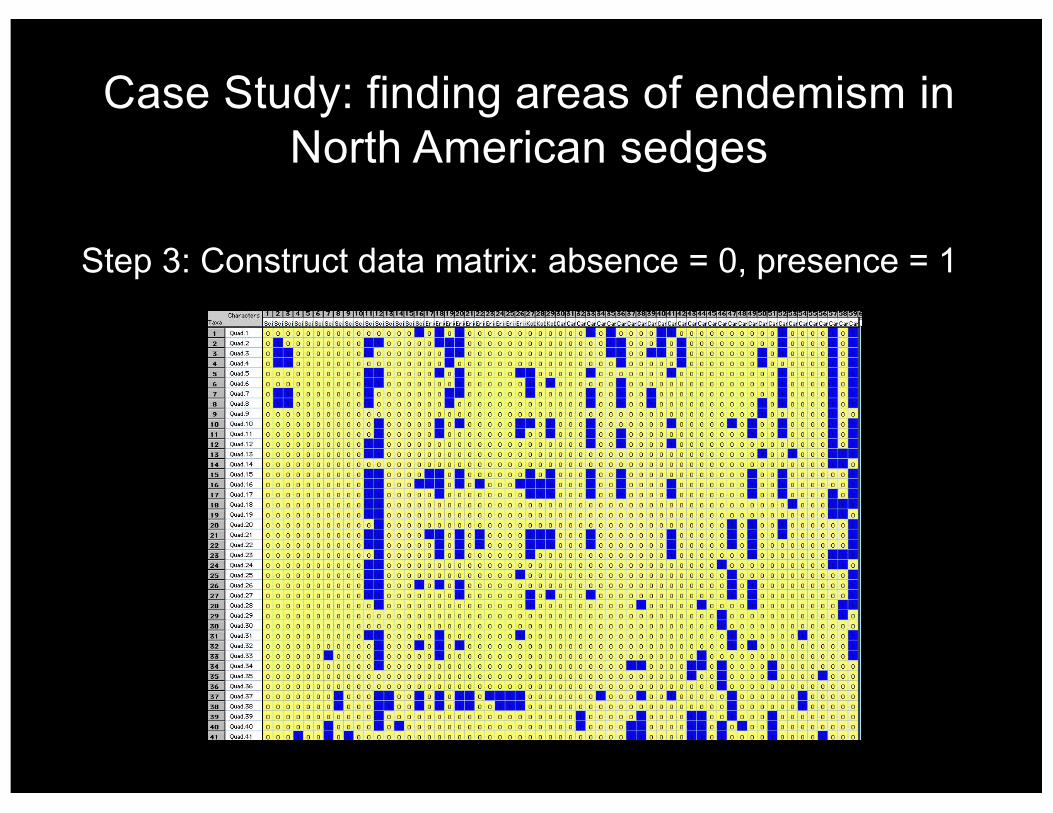
Step 3: Construct data matrix: absence = 0, presence = 1
Case Study: finding areas of endemism in North American sedges
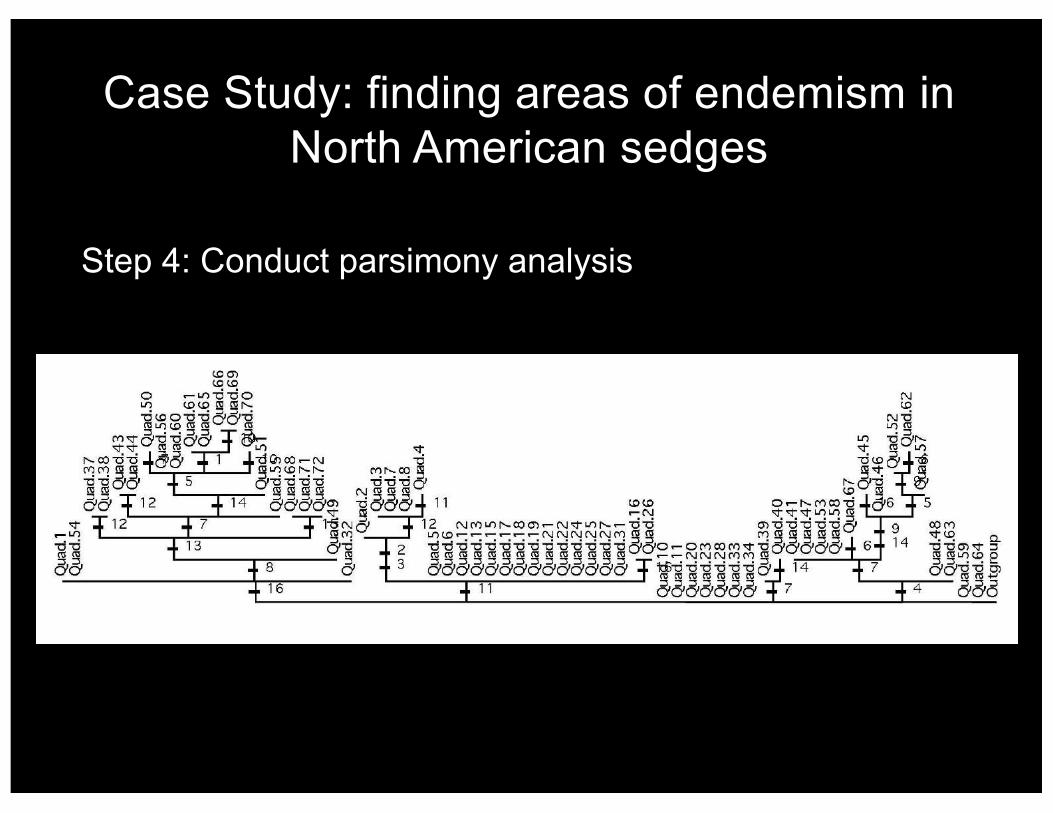
Step 4: Conduct parsimony analysis
Case Study: finding areas of endemism in North American sedges
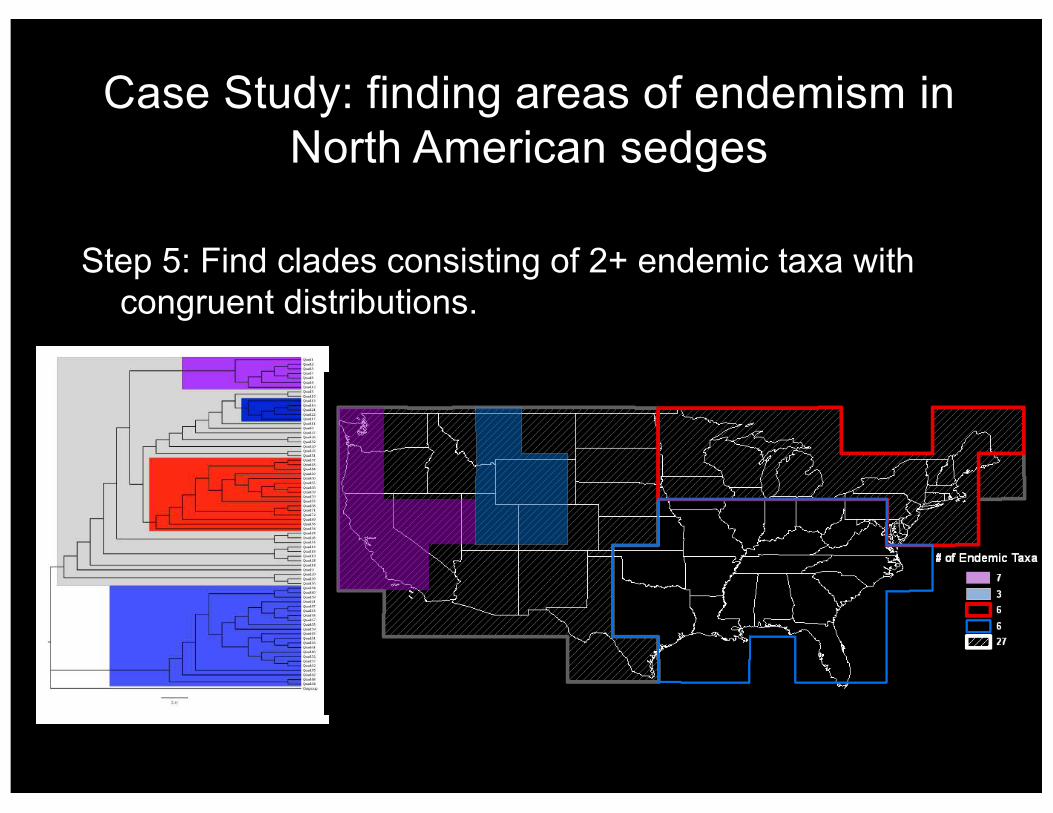
Step 5: Find clades consisting of 2+ endemic taxa with congruent distributions.
Case Study: finding areas of endemism in North American sedges
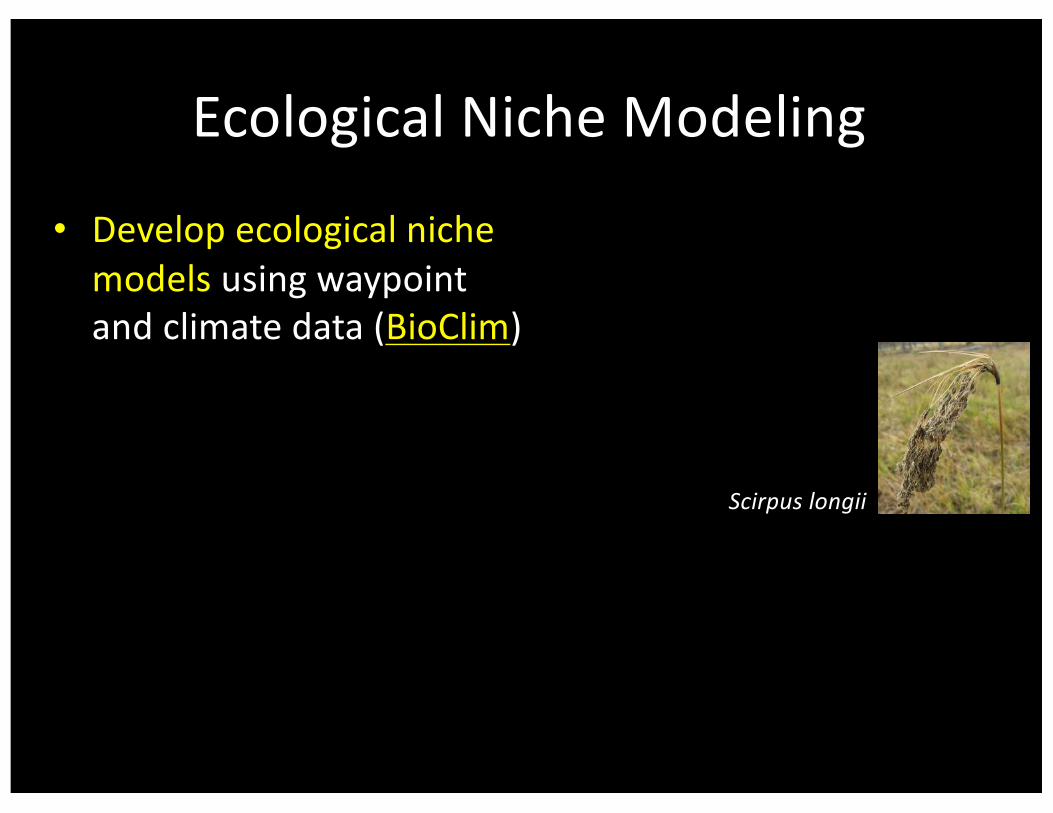
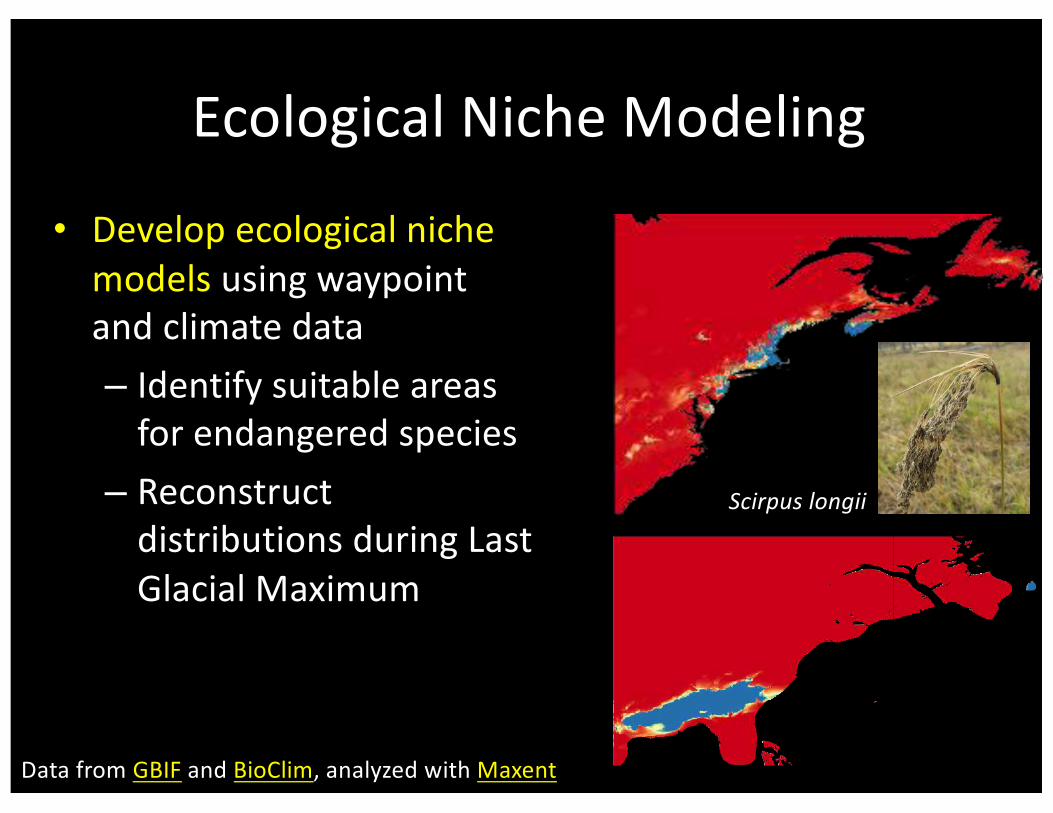
EcologicalNicheModeling
• Developecologicalnichemodelsusingwaypointandclimatedata(BioClim)
Scirpus longii
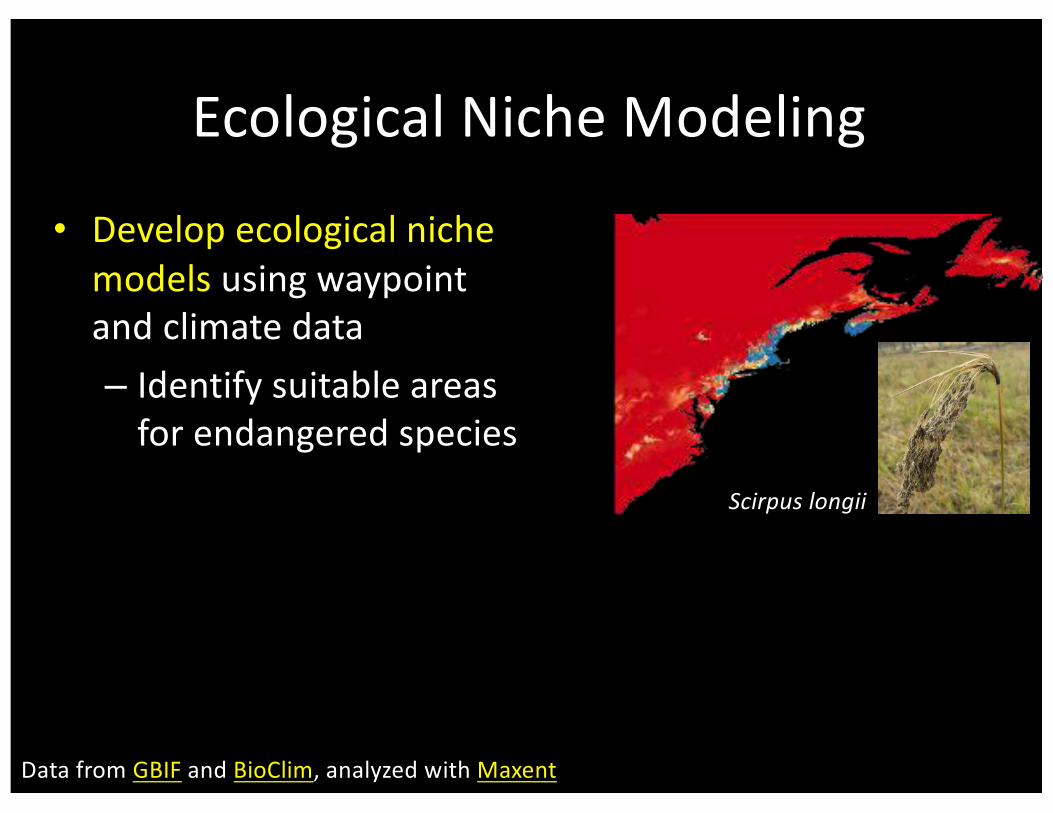
EcologicalNicheModeling
• Developecologicalnichemodelsusingwaypointandclimatedata– Identifysuitableareasforendangeredspecies
DatafromGBIF andBioClim,analyzedwithMaxent
Scirpus longii
EcologicalNicheModeling
• Developecologicalnichemodelsusingwaypointandclimatedata– Identifysuitableareasforendangeredspecies
– ReconstructdistributionsduringLastGlacialMaximum
DatafromGBIF andBioClim,analyzedwithMaxent
Scirpus longii
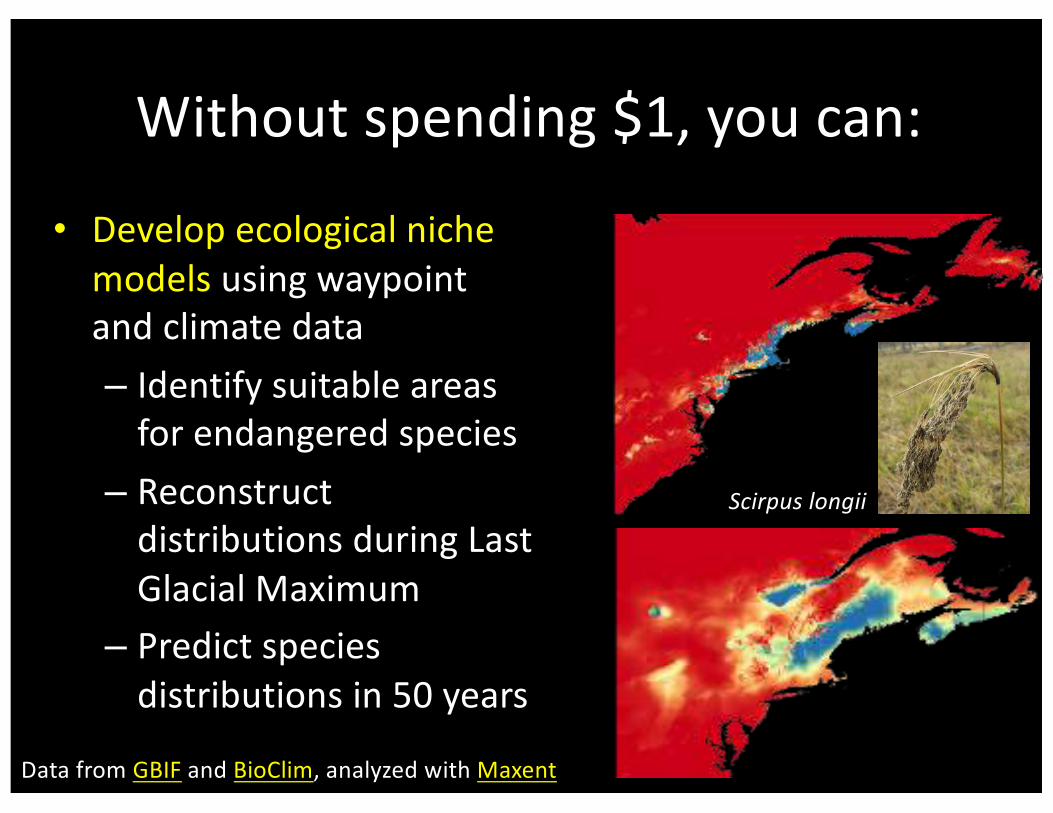
Withoutspending$1,youcan:
• Developecologicalnichemodelsusingwaypointandclimatedata– Identifysuitableareasforendangeredspecies
– ReconstructdistributionsduringLastGlacialMaximum
– Predictspeciesdistributionsin50years
DatafromGBIF andBioClim,analyzedwithMaxent
Scirpus longii
Trackspreadofinvasivespecies
• Wheredidtheyoriginate?
• Whendidtheygethere?
• Wherearetheygoing?
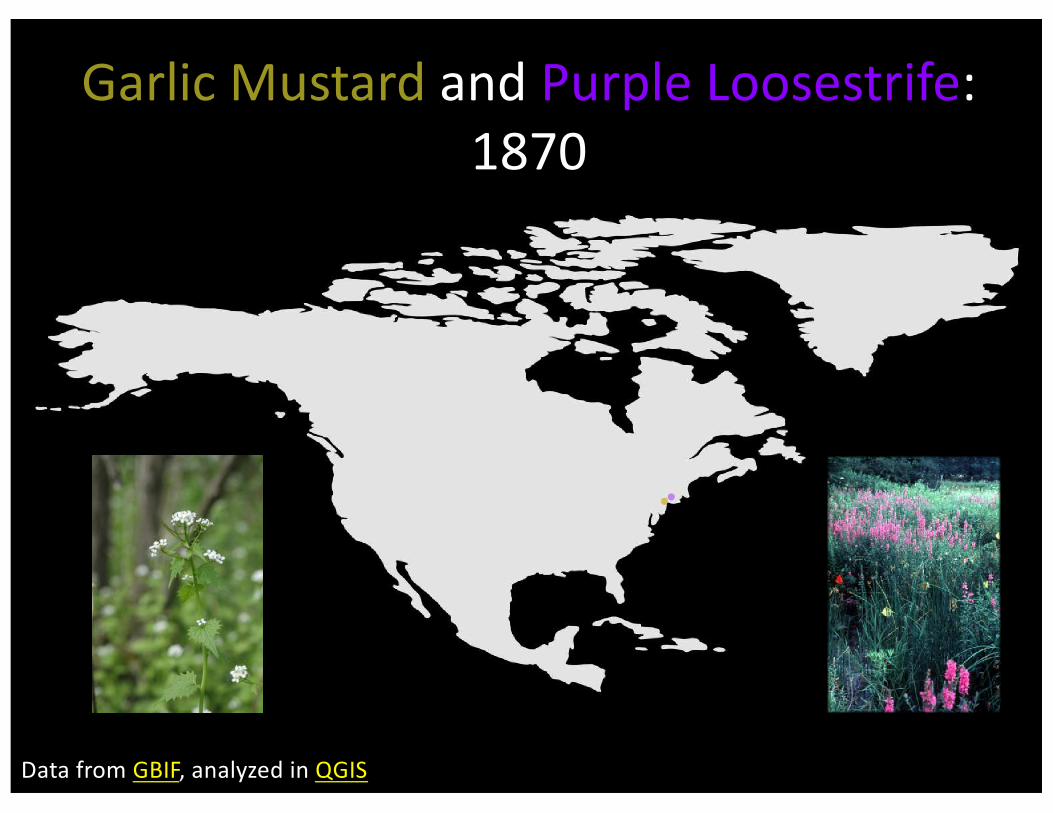
GarlicMustardandPurpleLoosestrife:1870
DatafromGBIF,analyzedinQGIS

GarlicMustardandPurpleLoosestrife:1900
DatafromGBIF,analyzedinQGIS

GarlicMustardandPurpleLoosestrife:1910
DatafromGBIF,analyzedinQGIS

GarlicMustardandPurpleLoosestrife:1920
DatafromGBIF,analyzedinQGIS
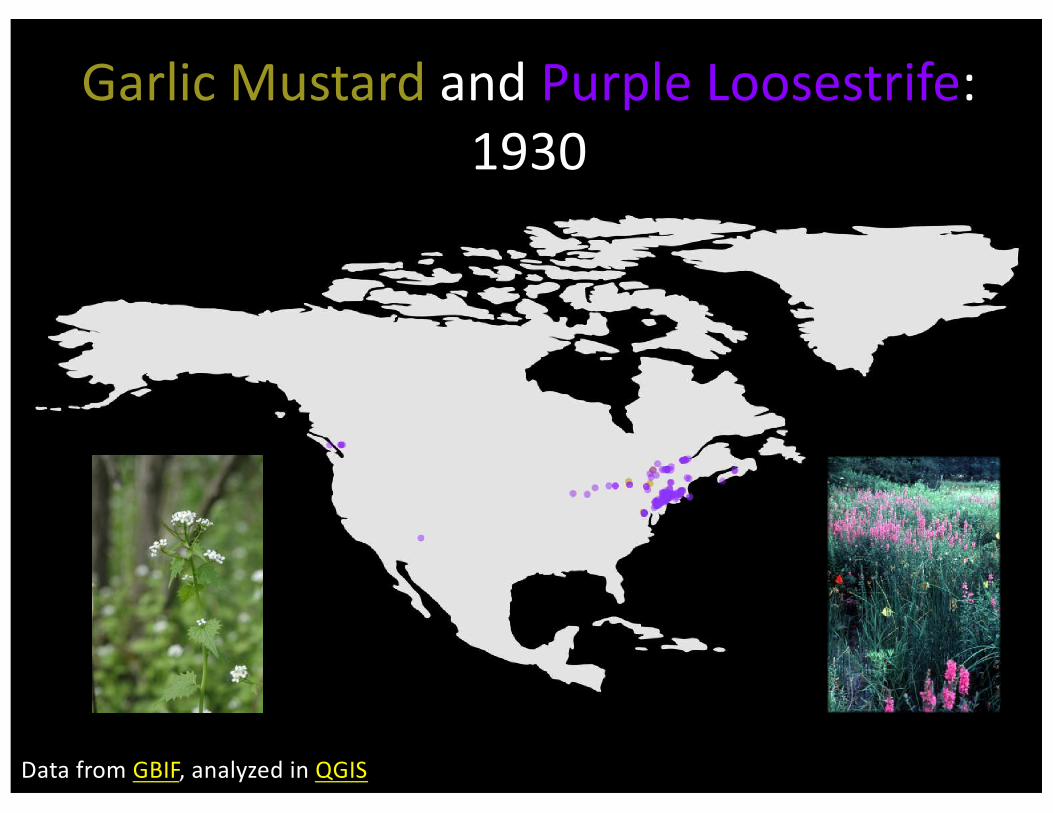
GarlicMustardandPurpleLoosestrife:1930
DatafromGBIF,analyzedinQGIS
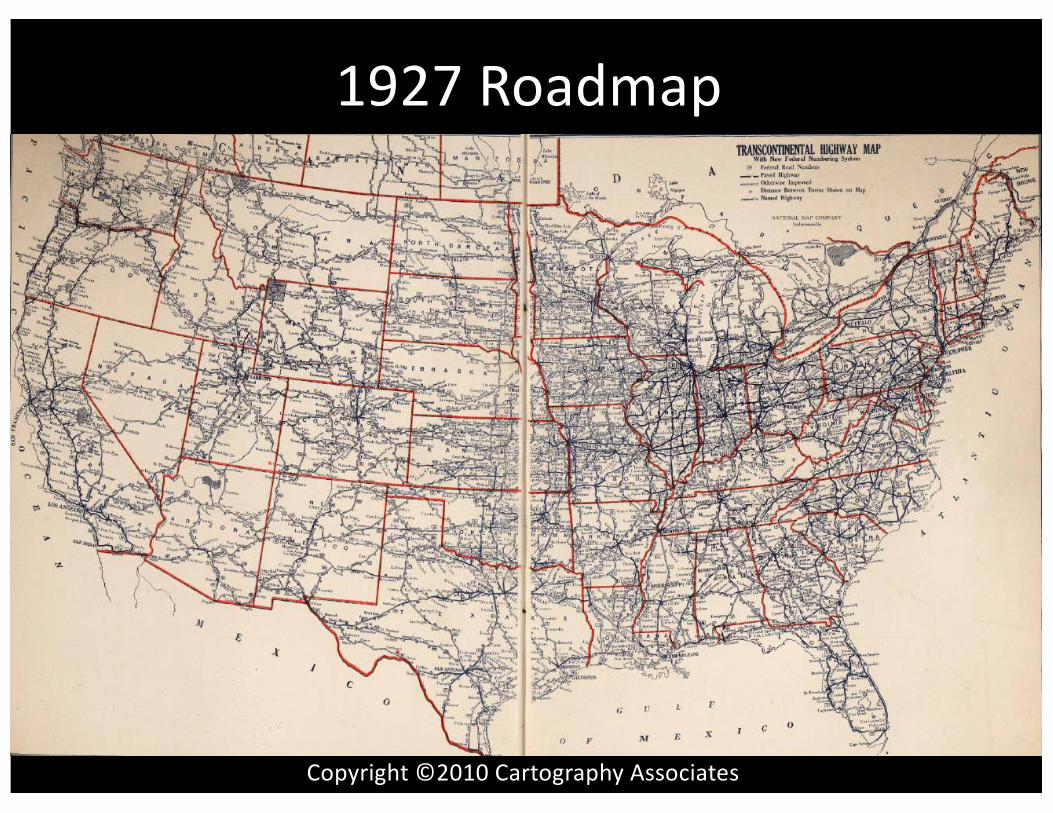
1927Roadmap
Copyright©2010CartographyAssociates

GarlicMustardandPurpleLoosestrife:1940
DatafromGBIF,analyzedinQGIS

GarlicMustardandPurpleLoosestrife:1950
DatafromGBIF,analyzedinQGIS

GarlicMustardandPurpleLoosestrife:1960
DatafromGBIF,analyzedinQGIS
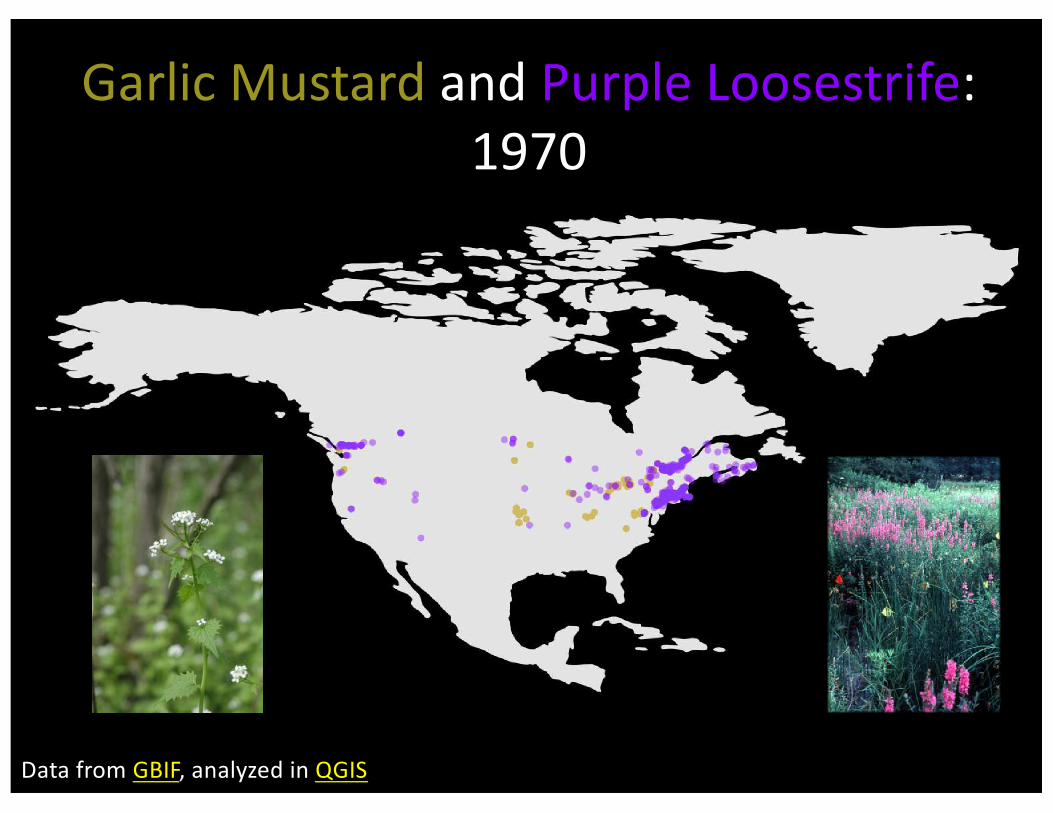
GarlicMustardandPurpleLoosestrife:1970
DatafromGBIF,analyzedinQGIS

GarlicMustardandPurpleLoosestrife:1980
DatafromGBIF,analyzedinQGIS
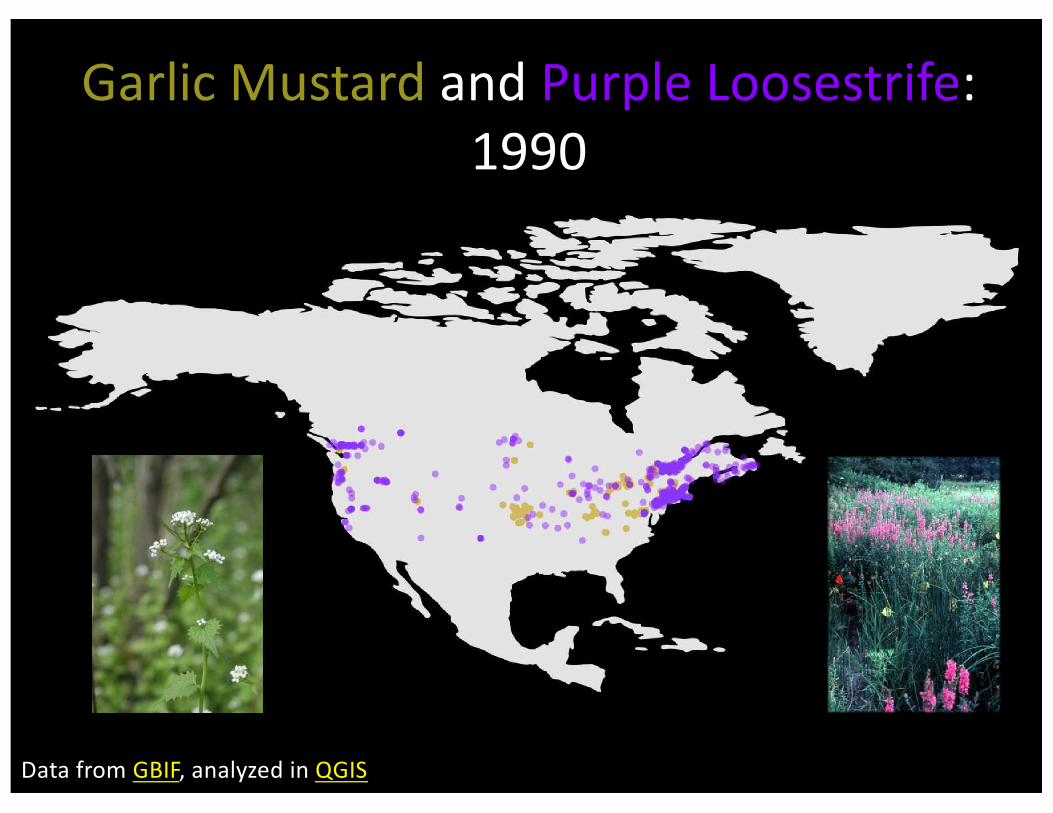
GarlicMustardandPurpleLoosestrife:1990
DatafromGBIF,analyzedinQGIS
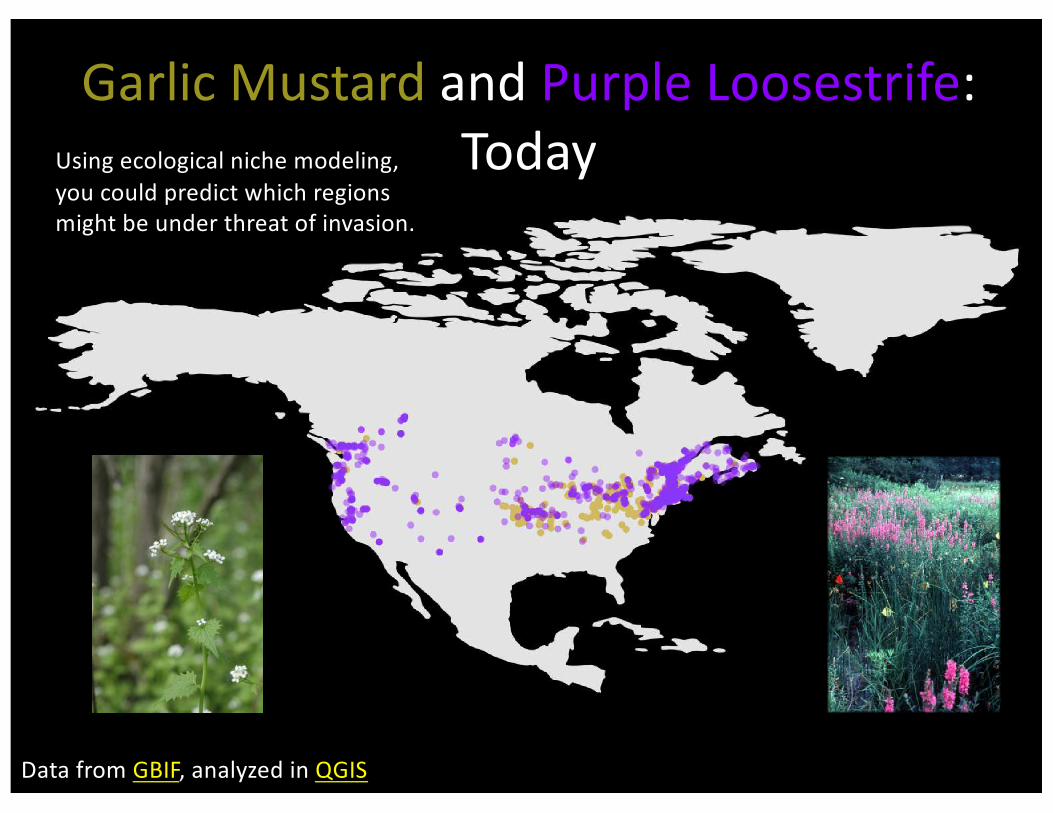
GarlicMustardandPurpleLoosestrife:Today
DatafromGBIF,analyzedinQGIS
Usingecologicalnichemodeling,youcouldpredictwhichregionsmightbeunderthreatofinvasion.
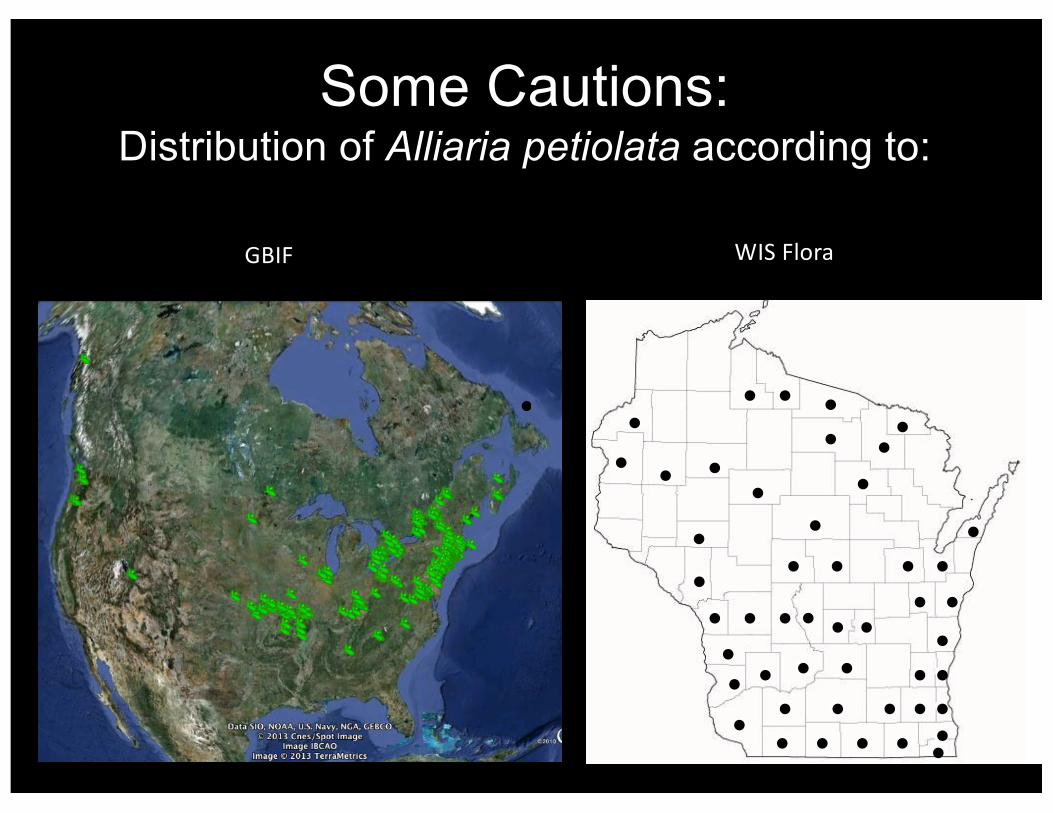
Some Cautions:Distribution of Alliaria petiolata according to:
GBIF WISFlora
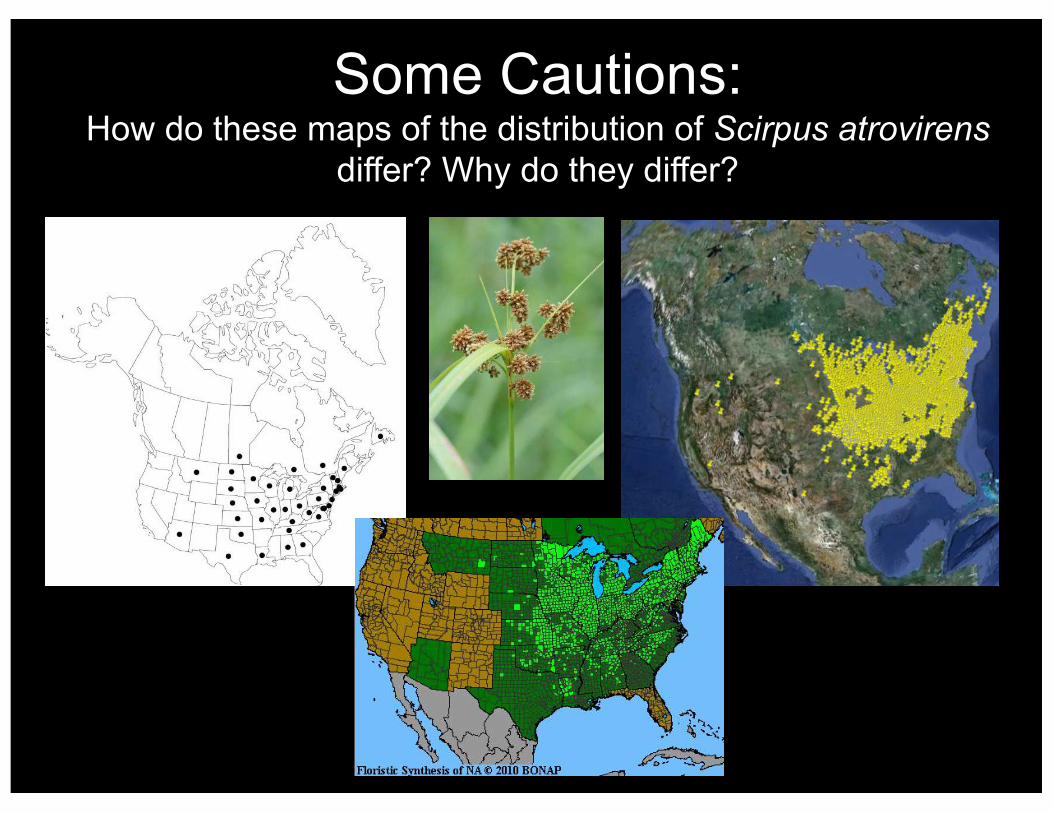
Some Cautions:How do these maps of the distribution of Scirpus atrovirens
differ? Why do they differ?
AdditionalResources
• panbiogeography analysis(martitracks)• simulateoriginandspreadofspecies(biogeosim)• forecastspeciesdistributions(biomod)• spatialanalysisofdiversity(biodiverse)• listoffreephylogeneticsoftwarehere• simulatehistoricalislandbiogeography(shiba)• spatialanalysisinmacroecology (SAM)• predictandanalyzedistributions(GARP)