Embed Size (px)
Citation preview

Preliminary
Has Persistence Persisted in Private Equity?
Evidence From Buyout and Venture Capital Funds Robert S. Harris*, Tim Jenkinson,** Steven N. Kaplan*** and Ruediger Stucke****
This Draft: April 2013 Abstract
The conventional wisdom for investors in private equity funds is to invest in partnerships that have performed well in the past, so-called top quartile funds. This conventional wisdom is based on the belief that performance in private equity persists across funds for the same partnership. We present new evidence on the persistence of U.S. private equity (buyout and venture capital) funds using a new research-quality dataset from Burgiss, sourced from over 200 institutional investors. Using detailed cash-flow data for funds, we study the persistence of buyout and venture capital fund performance of the same general partners across different funds. We pay particular attention to persistence pre- and post-2000. Previous research, studying largely pre-2000 data, has found strong persistence for both buyout and venture capital firms.
We confirm the previous findings on persistence in pre-2000 funds. There is significant persistence for buyout funds and, particularly for venture funds.
Post-2000, we find mixed evidence of persistence in buyout funds. When funds are sorted by the quartile of performance of their previous funds, performance of the current fund is statistically indistinguishable regardless of quartile. Returns for partnerships in all previous fund quartiles, including the bottom, exceed those of public markets as measured by the S&P 500. At the same time, however, regression estimates do find that current fund performance is significantly related to previous fund performance.
Post-2000, we find that performance in venture capital funds remains as statistically and economically persistent as pre-2000. Partnerships whose previous funds are below the median for their vintage year subsequently tend to be below median and have returns below those of the public markets (S&P 500). Partnerships in the top two quartiles tend to stay above the median and their returns exceed those of the public markets.
* University of Virginia Darden School of Business, ** Said Business School, University of Oxford and CEPR, and *** University of Chicago Booth School of Business and NBER, **** Said Business School, University of Oxford. This research has been supported by the UAI Foundation and the Center for Research in Security Prices. Rui Cui provided able research assistance. We thank Burgiss for supplying data. Kaplan has consulted to private equity general partners and limited partners. He also has invested in private and public equities. Address correspondence to Steven Kaplan, University of Chicago Booth School of Business, 5807 South Woodlawn Avenue, Chicago, IL 60637 or e-mail at [email protected].

1
1. Introduction
The conventional wisdom for investors in private equity funds is to invest in partnerships
that have performed well in the past, particularly, so-called top quartile funds.1 This conventional
wisdom is based on the belief that performance in private equity persists across funds for the
same partnership. Previous research, studying largely pre-2000 data, has been consistent with
this conventional wisdom. For example, Kaplan and Schoar (2005) find evidence of persistence
in venture capital (VC) and buyout funds raised in the 1980s and 1990s. Robinson and Sensoy
(2011a) obtain similar results for a sample of buyout funds, again raised largely in the 1980s and
1990s. Chung (2012) studies buyout and VC funds raised through 2000 and finds somewhat less
persistence than in the other papers.
While previous work finds persistence, there is still some question about its existence.
Kaplan and Schoar rely on Venture Economics data that Stucke (2011) shows to be flawed.
Robinson and Sensoy rely on the funds invested in by just one investor or limited partner (LP).
Chung does not have access to fund-level cash flows.
We present new and more recent evidence on the persistence of U.S. private equity
(buyout and venture capital) funds using the research-quality dataset from Burgiss used in Harris,
Jenkinson and Kaplan (2013). We refer to private equity as the asset class that includes buyout
funds and VC funds. We analyze the two types of funds separately. A key attribute of the
Burgiss data is that they are derived entirely from institutional investors (the limited partners or
LPs) for whom Burgiss’ systems provide record-keeping and performance monitoring services.
This feature results in detailed, verified and cross-checked investment histories for nearly 1400
private equity funds derived from the holdings of over 200 institutional investors.
1 For example, see Swensen (2000) and Mulcahy et al. (2012)

2
Using detailed cash-flow data for funds, we study the persistence of buyout and VC fund
performance of the same investors or general partners (GPs) across different funds. We pay
particular attention to persistence in post-2000 funds.
We confirm the previous findings on persistence in pre-2000 funds. There is significant
persistence for buyout funds and, particularly for venture funds.
Post-2000, we find mixed evidence of persistence in buyout funds. When funds are
sorted by the quartile of performance of their previous funds, performance of the current fund is
statistically indistinguishable regardless of quartile. Returns for partnerships in all previous fund
quartiles, including the bottom, exceed those of public markets as measured by the S&P 500. At
the same time, however, regression estimates do find that current fund performance is
significantly related to previous fund performance.
Post-2000, we find that performance in venture capital funds remains as statistically and
economically persistent as pre-2000. Partnerships whose previous funds are below the median
for their vintage year subsequently tend to be below median and have returns below those of the
public markets (S&P 500). Partnerships in the top two quartiles tend to stay above the median
and their returns exceed those of the public markets.
We conclude by considering the implications of these results.
The paper proceeds as follows. In section 2, we discuss the data we use. In section 3, we
present and discuss our persistence results. In section 4, we conclude and summarize the
implications of our results.
2. Data

3
We use vintage year performance data for U.S. buyout and venture capital funds from
Burgiss for performance as of December 2011. We include all funds for whom Burgiss can
identify the GP. Our results aggregate performance for funds in a particular fund raising
(vintage) year. Burgiss classifies a vintage year as the year in which a fund first draws capital
from its LPs. We report performance for vintages from 1984 through 2008. We do not report
vintages after 2008 because those funds are relatively unseasoned. Relatively few funds have
available data pre-1984.
The Burgiss dataset “is sourced exclusively from LPs and includes their complete
transactional and valuation history between themselves and their primary fund investments. The
flows are rescaled to be representative of the full fund.” The Burgiss data include all funds and
cash flows from the LPs that provide the data. The data come from “over 200 investment
programs and represent over $1 trillion in committed capital.” The LPs comprise a wide array of
institutions and over two thirds have private equity commitments in excess of $100 million. Of
these, about sixty percent are pension funds (a mix of public and corporate) and over 20% are
endowments or foundations.
The underlying cash flow data of the funds are likely to be extremely accurate because
LPs use Burgiss’ systems for record keeping and fund investment monitoring. This “check
book” data – recording the exact cash outflows made by the LPs to the GPs as well as the
distributions from the GPs back to the LPs – has a number of advantages for research purposes.
The fact that the data are sourced from the back-office systems used by the LPs for reporting and
fund accounting, and are cross-checked across investors in the same fund, results in levels of
data integrity and completeness that could not be achieved by surveys, voluntary reporting, or
(largely) involuntary reporting using Freedom of Information (FOIA) requests (the method

4
employed by Preqin). Furthermore, when data are sourced at least in part from GPs it is possible
for a GP to strategically stop reporting. The Burgiss data also are up to date – given the need for
quarterly reporting by most investors – and so there are no problems resulting from a lack of
updating as there can be with other commercial databases. In other words, for a given LP, there
is unlikely to be any selection bias. This is an advantage over other commercial sources whose
data rely on voluntary and FOIA disclosures by GPs and LPs.
The potential bias in the Burgiss data – which it shares with the other commercial sources
– is how representative the LPs (and resulting GPs) are. For example, it is possible that the LPs
in the Burgiss sample have had better than average experience with private equity which is why
they use Burgiss and allow Burgiss to aggregate their results. The results in Harris et al. (2012)
suggest that this bias is not present. Harris et al. (2013) provide a more detailed discussion of
the Burgiss data and its advantages.
For each GP, we identify whether the GP has more than one type of fund. For example,
some buyout fund GPs have both large cap and small cap buyout funds; and some VC fund GPs
have both early stage and later stage VC funds. Because the characteristics and the partners of
the different types of funds can vary, we look at persistence across the same fund type offered by
the GP, not across the entire GP. For example, we look at whether the performance of a GP’s
early stage fund predicts the performance of the next early stage fund it raises, not the next later
stage fund. In doing this, we are effectively following the sequence numbers that the GPs put on
their fund.
We also eliminate annex funds and side funds. Annex funds are funds that extend an
existing fund. Side funds are invested side-by-side with the main fund and have the same
performance. Our results are qualitatively identical if we include these funds.

5
A. Buyout funds
Panel A of Table 1 reports summary information on the 607 U.S. buyout funds in the
Burgiss data set. The first column reports the number of funds per vintage year. The data set
includes more funds than the March 2011 data set analyzed by Harris et al. (2013). The
additional funds came from additional limited partners who made their data available to Burgiss
after March 2011. The second column reports the average capital committed to the funds each
vintage year. Overall, these funds represent committed capital of roughly $700 billion.
The third column reports the unrealized portion of the funds as a percentage of the total
invested capital in the fund value. Vintage years before 2000 are largely realized, with
unrealized values less than ten percent of total realized and unrealized fund value. Unrealized
values make up 19% to 37% of the total fund values for vintage years between 2000 and 2003.
Vintage years after 2003 more than 50% unrealized suggesting that the analysis of those funds is
subject to change in the future.
While we would prefer the more recent funds to be more fully realized, the unrealized
values should approximate true market values. Since the end of 2009, topic 820 of the Financial
Accounting Standards Board (FASB) has required private equity firms to value their assets at fair
value every quarter, rather than permitting them to value the assets at cost until an explicit
valuation change. This has likely had the practical effect of making estimated unrealized values
closer to true market values than in the past, particularly for buyout funds. Second, the Burgiss
figures for both distributions and NAVs are up-to-date because the data are sourced directly from
LPs, subject to extensive cross-checks, and part of the Burgiss systems that are used for the LPs’
monitoring and record-keeping. Finally, both Brown et al. (2013), using data from Burgiss, and
6
Jenkinson et al. (2013), using data from CALPERS, a large LP, find that unrealized values are,
on average, conservative.
The next three columns present average (annualized) IRRs, Multiples of Invested Capital
(MOICs), and Public Market Equivalents (PMEs) by vintage year. See Harris et al. (2013) for
definitions and discussions of these measures. The average PMEs, particularly for 2006 to 2008
vintages are somewhat higher than those in Harris et al. (2013) reflecting positive performance in
2011.
In this sample, Burgiss identify the fund manager / general partner (GP). For GPs who
offer more than one type of fund or fund family, Burgiss also identifies the type of fund. Burgiss
also tells us the fund sequence number for that GP. This allows us to determine whether the GP
is fund raising for the first time or has raised funds for quite some time. All of these identifiers
allow us to track the performance of the same types of funds managed by the same GP.
The last four columns present by vintage year, respectively, the number of funds that
have previous performance history and the average IRRs, MOICs, and PMEs for those funds.
We have 285 funds that have information on previous fund performance. This compares to only
76 in Kaplan and Schoar (2005).
B. Venture capital funds
Panel A of Table 1 reports summary information on the 852 U.S. VC funds in the Burgiss
data set. The first column reports the number of funds per vintage year. The data set includes
more funds than the March 2011 data set analyzed by Harris et al. The additional funds came
from additional limited partners who made their data available to Burgiss after March 2011. The

7
second column reports the average capital committed to the funds each vintage year. Overall,
these funds represent committed capital of over $225 billion.
The third column reports the unrealized portion of the funds as a percentage of the total
realized and unrealized fund value. Vintage years before 1999 are largely realized, with
unrealized values less than ten percent of total realized and unrealized fund value. Unrealized
values make up less than 50% of the total fund values for vintage years between 1999 and 2002.
Vintage years after 2002 are all more than 50% unrealized suggesting that the analysis of those
funds is subject to change in the future.
The next three columns present average (annualized) IRRs, Multiples of Invested Capital
(MOICs), and Public Market Equivalents (PMEs) by vintage year. As with the buyout funds, the
average PMEs for the VC funds are somewhat higher than those in Harris et al. (2012) reflecting
positive performance in 2011. VC fund vintages after 2003 consistently average PMEs greater
than 1.0.
The last four columns present by vintage year, respectively, the number of funds that
have previous performance history and the average IRRs, MOICs, and PMEs for those funds.
We have 436 funds that have information on previous fund performance. This compares to 323
in Kaplan and Schoar (2005).
C. Top Quartile Funds
Table 2 establishes the differences in performance of funds in different performance
quartiles. For each vintage year, we place each of the funds in our sample in a performance
quartile based on their PME. We do this separately for buyout and VC funds.
Panel A.1 shows that top quartile buyout funds have average PMEs of 1.80 compared to
average PMEs of 0.78 for bottom quartile funds. The analogous annualized IRRs are 26.1% and

8
-2.5%. These are large differences. Panels A.2 and A.3 distinguish between pre-2001 and post-
2000 buyout funds. The PME differential between top and bottom quartiles is greater for pre-
2001 funds at 1.29 than for post-2000 funds at 0.82. The IRR and MOIC differentials also are
somewhat greater for pre-2001 funds.
Panel B.1 shows that the differentials between top and bottom quartile funds are much
larger for VC funds than for buyout funds. Top quartile VC funds have average PMEs of 2.56
compared to average PMEs of 0.49 for bottom quartile funds. The analogous annualized IRRs
are 42.5% and -9.7%. Panels A.2 and A.3 distinguish between pre-2001 and post-2000 buyout
funds. The PME differentials between top and bottom quartiles are substantially larger for pre-
2001 funds at 2.74 than for post-2000 funds at 1.11. The IRR and MOIC differentials also are
markedly greater for pre-2001 funds.
These results show that it would be very valuable to be able to predict and invest in those
funds that will end up in the top two quartiles while avoiding funds that will end up in the bottom
two quartiles. In the next section, we consider whether past performance helps with that
prediction.
3. Persistence
In this section, we present several different analyses of persistence. The analyses focus
on the PME performance measure developed by Kaplan and Schoar (2005). The PME or public
market equivalent is effectively a market-adjusted multiple of invested capital. It measures how
an investment in a private equity funds compares to an investment in public equities. Sorensen
and Jagannathan (2013) provide “a general justification for the use of the PME as a performance
9
measure …” Importantly, the PME “remains a valid economic measure of performance
regardless of the risk of the capital calls and distributions.”
We measure public equity performance with the return on the S&P 500. A PME of 1.5
for example implies that an investor in the fund earned a total of 50% more over the life of the
fund than if the investor had left its money in the S&P 500. (Our results are qualitatively similar
when we use the returns on the Russell 2000, an index for smaller capitalization stocks.) The
IRR and MOIC do not adjust for stock market movements and, therefore, vary meaningfully
across periods of different market returns. While we focus on PME, our persistence results are
generally qualitatively similar using IRR and MOIC.
A. Persistence by Quartiles – Previous Fund
In this section, we consider the conventional wisdom of investing in top quartile funds.
For each vintage year, we place each of the funds in our sample in a performance quartile based
on their PME. We do this separately for buyout and VC funds. This is not possible in practice
as the current PME not the final PME is known when a GP raises a subsequent fund. Our
results, then, should be viewed as an upper bound as to what an investor could obtain in practice.
Brown et al. (2013) and Jenkinson et al. (2013) study the interaction of fundraising and interim
performance.
Once we have performance benchmarks for each vintage year, we sort all funds into one
of six groups. We place funds in groups one to four based on the past performance quartile of its
most recently raised fund (as of December 2011) if such performance is available. If
performance of the previous fund is not available, we place the fund into a fifth group if the fund
sequence number is greater than one, i.e., it does not appear to be a first-time fund. We place the

10
fund into a sixth group of first-time funds if its fund sequence number is equal to one. We
eliminate funds that do not have a GP identification.
i. Buyout Funds
Panel A.1 of Table 3 reports the crosstabs of PME quartiles of subsequent buyout funds
relative to the four PME quartiles and two other classifications of the previous fund. The panel
also reports the average IRR, MOIC and PME for the six different classifications.
The panel shows that there is modest persistence in buyout fund performance. Funds
with a previous fund in the top quartile are in the top quartile 27.5% and above median 55% of
the time. Funds with a previous fund in the bottom quartile are in the top quartile less than 20%
and above median less than 40% of the time. The differences between the top and bottom
quartile are not significant at the 10% level (chi-squared test).
Funds previously in the top quartile have an average PME of 1.34 while funds in the
bottom quartile have an average PME of only 1.10. The difference in means is significant at the
1% level. Funds in the second and third quartile have average PMEs lower than those in the top
quartile and higher than those in the bottom quartile, but the differences are not significant.
Funds that are missing previous fund performance, both first-time funds and non-first
time funds, have average performance that is between the average performance of the top
quartile and second quartile funds.
Panels A.2 and A.3 report the analogous results for funds raised, respectively, before
2001 and after 2000. Panel A.2 shows stronger persistence in the pre-2001 period than in the
sample overall. Funds previously in the top quartile are in the top quartile 37.5% and above
median 62.5% of the time. Funds previously in the bottom quartile are in the top quartile 17.4%

11
and above median 43.5% of the time. Again, the previous top quartile funds have the best
average PMEs. Those PMEs are significantly greater than the bottom quartile PMEs.
The persistence appears to have weakened post-2000. Funds previously in the top
quartile are in the top quartile 22% and above median 50.8% of the time. Funds in the top
quartile have average PMEs that are only 0.02 greater than those in the second quartile. The
average PMEs are lower than those for first-time funds and equal to those without a previous
fund performance. There does seem to be modest persistence in the bottom quartile. Funds
previously in the bottom quartile are in the top quartile 21.4% and above median 14.3% of the
time. The average PMEs of the bottom quartile funds while economically lower than those of
the top quartile funds (1.09 versus 1.26) are not statistically significantly lower. Overall, then,
the results in panel A.3 suggest that persistence in buyouts has weakened and barely persisted
post-2000.
Two other results in panel A are worth noting. First, fund in all six groups have average
PMEs that exceed one, i.e., average performance exceeds that of the S&P 500. This is true in
both subperiods.
Second, funds with better quartile performance appear to be more likely to raise a
subsequent fund. Panel A includes 91 funds whose previous funds were top quartile, but only 51
funds whose previous funds were in the bottom quartile. That pattern is present in both the pre-
2001 and post-2000 subsample. This is consistent with the results in Kaplan and Schoar (2005)
and Chung et al. (forthcoming) that the ability to raise a subsequent fund is significantly related
to past performance.
ii. Venture Capital Funds

12
Panel B.1 of Table 3 reports the crosstabs of PME quartiles of subsequent VC funds
relative to the four PME quartiles and two other classifications of the previous fund. The panel
also reports the average IRR, MOIC and PME for the six different classifications.
The panel shows that there is marked persistence in VC fund performance. Funds with a
previous fund in the top quartile are in the top quartile and above median , respectively, more
than 48% and 65% of the time. Funds with a previous fund in the bottom quartile are in the top
quartile less than 15% and above median less than one-third of the time. The differences
between the top and bottom quartile are significant at the 1% level (chi-squared test).
Funds previously in the top quartile have an average PME of 2.26 while funds in the
bottom quartile have an average PME of only 0.79 The difference in means is significant.
Funds in the second and third quartile have significantly lower average PMEs than those in the
top quartile, but significantly higher than those in the bottom quartile.
Funds that appear to be first-time funds have average performance roughly equal to the
average performance of funds in the second quartile. Funds that do not have previous
performance, but may not be first-time funds have average PMEs that are between those of third
and fourth quartile funds.
It is worth noting that funds in the top three quartiles have average PMEs that exceed
one, i.e., average performance exceeds that of the S&P 500. This is at odds with the
conventional wisdom that only top quartile funds beat the S&P 500.
Panels B.2 and B.3 report the analogous results for funds raised, respectively, before
2001 and after 2000. Panel B.2 shows very strong persistence in the pre-2001 period. Funds
previously in the top quartile are in the top quartile almost 49% and above median almost 63% of
the time. Funds previously in the bottom quartile are in the top quartile less than 9% and above

13
median less than 29% of the time. Again, the previous top quartile funds have the best average
PMEs. Those PMEs are significantly greater than the average PMEs of the three other quartiles.
The bottom quartile PMEs are significantly lower than those in the three other quartiles.
The persistence has continued to be strong, if not stronger post-2000. Funds previously
in the top quartile are in the top quartile 48% and above median 68% of the time. Funds in the
top quartile have average PMEs that are significantly greater than those in the other three
quartiles. Funds previously in the bottom quartile are in the top quartile less than 23% and above
median less than 38% of the time. The differences between the top and bottom quartile are
significant at the 1% level (chi-squared test).
The results in panel B.3 suggest that persistence has persisted post-2000. Average PMEs
exceed 1.07 for both top and second quartile funds. The results are consistent with the
conventional wisdom to avoid third and bottom quartile funds. The results are, however, at odds
with the conventional wisdom that only top quartile funds beat the S&P 500. Second quartile
funds have done so as well, both pre- and post-2000.
Panel B for VC funds, like panel A for buyout funds, shows that the likelihood a general
partner is able to raise a subsequent fund decreases with fund performance. Panel B includes
132 funds whose previous funds were top quartile, but only 81 funds whose previous funds were
in the bottom quartile. That pattern is present in both the pre-2001 and post-2000 subsample and
is, again, consistent with the findings in Kaplan and Schoar (2005) and Chung et al.
(forthcoming).
iii. Sensitivity

14
As mentioned earlier, the results are qualitatively similar if we sort by previous fund IRR
or previous fund MOIC quartiles for both buyout and VC funds.
Because some of the funds are largely unrealized, particularly 2007 and 2008 funds, we
repeated our analyses excluding 2007 and 2008 vintages. We obtained qualitatively similar
results for both buyout and VC funds. This suggests that the results are not likely to be
explained by the fact that some of the post-2000 funds are not fully realized.
We also sorted previous funds on PME ranges. We considered top quartiles funds to
have PMEs above 1.50; second quartile funds, PMEs between 1.25 and 1.50; third quartile funds
beteween 1.0 and 1.25; and bottom quartile funds, PMEs below 1.0. Table 4 reports the results
of these sorts. For both buyout and VC funds, we obtained qualitatively similar results to those
found using quartile sorts.
B. Persistence by Quartiles – Second Previous Fund
It is possible that the current and previous funds of a private equity GP include
investments in the same company. If some of these investments are particularly successful or
unsuccessful, they might induce persistence across current and previous funds. Investments are
less likely to coincide in the current fund and the second previous fund. Accordingly, table 5
repeats the analyses in table 3 using the second previous fund.
i. Buyout Funds
Panel A.1 of table 5 shows little if any persistence from the second previous fund to the
current fund for buyout funds. Funds with second previous funds in the top quartile average the

15
highest PMEs (of 1.36), but they are not significantly different from those for any of the other
quartiles.
Panel A.2 shows that funds with second previous funds in the top quartile did very well
before 2001 with an average PME of 1.78 and 73% of those funds subsequently having above
median performance. The second previous funds in the third quartile, however, did almost as
well, with average PMEs of 1.45 and with 80% of funds above median. The few second
previous funds in the bottom quartile, however, did almost as well, with average PMEs of 1.32.
Panel A.3 shows no evidence at all of persistence in post-2000 funds. Funds with second
previous funds in the top quartile have average PME of 1.19 with fewer than 46% of those funds
subsequently having above median performance. Funds with second previous funds in the third
and fourth quartiles have higher average PMEs although the differences are not significant.
In sum, there is little evidence of persistent persistence across the entire sample and no
evidence of persistent persistence post-2000 from the second previous fund to current fund
performance
ii. Venture Capital Funds
Panel B.1 of table 4 shows that persistence persists from the second previous fund to the
current fund for VC funds. Funds with second previous funds in the top quartile average the
highest PMEs (of 2.25, and they are significantly different from those for the other quartiles.
More than 67% of the top quartile funds are subsequently above median. At the same time, that
is true for fewer than 41% of bottom quartile funds.
Panel B.2 shows similar patterns for pre-2001 funds. Funds with second previous funds
in the top quartile have the highest average PMEs while funds with second previous funds in the

16
bottom quartile have the lowest average PMEs in both sub-periods. The average PMEs of the
second previous top quartile funds are significantly greater than those of the second previous
bottom quartiles funds.
There is still persistence across second previous funds after 2000, but it is concentrated in
the bottom quartile. Funds with second previous funds in the bottom quartile have the lowest
average PMEs. Fewer than 30% are above median. Funds with second previous funds not in the
bottom quartile perform in both sub-periods while funds with second previous funds in the
bottom quartile have the lowest average PMEs in both sub-periods. The average PMEs of the
previous top quartile funds are significantly greater than those of the previous bottom quartiles
funds for both sub-periods.
In sum, there is strong evidence of persistent persistence across the entire sample and in
both sub-periods from the second previous fund to current fund performance.
C. Persistence Regressions: PMEs versus previous fund PMEs
In this section, we estimate regressions to explain current fund PMEs using previous fund
PMEs as well as measures of fund size. We use the log of PME to reflect the fact that the
distribution of PME is right skewed. The regressions include vintage year dummy variables for
both the current and previous funds.
i. Buyout Funds
Panel A of table 6 reports regressions for the 285 funds in the buyout sample with
previous fund performance. Previous fund PME is significantly related to current fund PME.

17
The coefficient in column 1 implies that a 10% increase in the previous fund PME is associated
with a 2.7% increase in the current fund PME.
There is a positive, but insignificant relationship between the second previous fund PME
and the current fund PME.
The fourth and fifth columns of panel A of table 6 include measures of fund size. Some
LPs believe that increases in fund size lead to poor subsequent performance. Other LPs believe
that larger funds do not perform as well as smaller funds. Column four includes the (log) change
in fund size from the previous fund. Column five includes the (log) of current fund size. Neither
size variable is statistically significant.
Panel B repeats the regression analyses only with pre-2001 vintage year funds. The
previous fund PME is again significantly related to current fund performance with a coefficient
of 0.293, implying that a 10% increase in the previous fund PME is associated with a 2.9%
increase in the current fund PME. Again, change in fund size and fund size are unrelated to
performance.
Panel C repeats the regression analyses only with post-2000 vintage year funds. The
previous fund PME is related to current fund performance with a similar and statistically
significant coefficient of 0.280. This implies that a 10% increase in the previous fund PME is
associated with a 2.8% increase in the current fund PME. Again, change in fund size and fund
size are unrelated to performance.
By these regression measures, there is persistence in buyout fund PMEs in the sample
overall as well as in both sub-periods. The magnitudes are similar in both sub-periods. These
results are statistically stronger than the non-parametric results in the quartile analysis in tables 3
and 4.

18
ii. Venture Capital Funds
Panel A of table 6 also reports regressions for the 436 funds in the VC sample with
previous fund performance. Previous fund PME is significantly related to current fund PME.
The coefficient in the first VC regression implies that a 10% increase in the previous fund PME
is associated with a 3.4% increase in the current fund PME. This is greater that the coefficient
for buyout funds, albeit not significantly so.
There is also a significant, but economically small relationship between the second
previous fund PME and the current fund PME. A 10% increase in the second previous fund
PME is associated with a 1.7% increase in the current fund PME.
The fourth and fifth VC regressions of panel A of table 6 include measures of fund size.
While the coefficient on the (log) change in fund size from the previous fund is not significant,
the coefficient on the (log) of current fund size is positive and statistically significant. This
indicates that larger funds are associated with higher PMEs. This result is not consistent with
larger funds leading to lower returns in the cross-section.
Panel B repeats the regression analyses only with pre-2001 vintage year funds. The
previous fund PME is again significantly related to current fund performance with a coefficient
of 0.365. This implies that a 10% increase in the previous fund PME is associated with a 3.65%
increase in the current fund PME. Again, the log of fund size is positively related to
performance.
Panel C repeats the regression analyses only with post-2000 vintage year funds. The
previous fund PME is related to current fund performance with a smaller, but still statistically
significant coefficient of 0.281. This implies that a 10% increase in the previous fund PME is

19
associated with a 2.8% increase in the current fund PME. Again, the change in fund size is not
related to performance. The log of fund size is positively, but only marginally significantly
related to performance.
By these regression measures, there is persistence in VC fund performance in the sample
overall as well as both sub-periods.
D. Persistence Regressions: PMEs versus previous fund quartiles
In this section, we estimate regressions to explain current fund PMEs using the
previous fund PME quartile. We also include dummy variables for funds that are first-time
funds as well as funds that are not first-time funds, but do not have previous fund performance
information. The excluded variable is previous fund in the top quartile. Again, we use the log of
PME as the dependent variable. The regressions include vintage year dummy variables for the
current fund. The coefficients on the dummy variables measure the percentage change in PME
from the PME of a fund that was previously in the top quartile.
i. Buyout Funds
The first regression in panel A of table 7 shows that top quartile funds have the highest
average PMEs. However, previous 2nd and 3rd quartile funds as well as first-time funds and
funds without previous return information do not perform significantly worse than top quartile
funds. Only bottom quartile funds significantly underperform the top quartile funds.
In pre-2001 vintages, top quartile funds significantly outperform 4th quartile funds and
first-time funds. In post-2000 vintages, however, top quartile funds do not significantly

20
outperform any of the other quartiles or fund categories. In fact, none of the fund categories is
significantly different from one another.
As with the results in tables 3 and 4, the results in panel A of table 7 indicate that
persistence has substantially weakened in buyouts post-2000.
ii. Venture Capital Funds
Panel B of table 7 presents the analogous regression for VC funds. The first regression in
panel B shows that funds previously in the top quartile have the highest average PMEs. They
have performed significantly better than all other fund categories. Funds previously in the
second and third quartile have significantly outperformed funds in the bottom quartile.
For the most part, the patterns are qualitatively similar for pre-2001 and post-2000
vintages. The primary exception is that post-2000 the difference between funds that were
previously in the top quartile and the other funds is economically smaller.
As with the previous results, the results in panel B of table 7 indicate that persistence has
persisted in venture capital.
E. Persistence Regressions: PMEs versus previous fund PMEs with GP fixed effects
In this section, we estimate the regressions of PMEs versus previous fund PMEs using
GP fixed effects. This estimate measures the variation of PMEs within particular GPs.
i. Buyout Funds

21
Panel A of Table 8 reports the regression results for buyout funds. Current fund PMEs
are consistently negatively related to previous fund PMEs although the relations are strongly
statistically significant only post-2000. The negative coefficients suggest that there has been
regression to the mean for individual GPs since 2000. In other words, since 2000, GPs who
perform particularly well in one fund, perform less well in the next fund. Combined with the
opposite results in the earlier regressions that do not include fixed effects, these results indicate
that funds that were previously high (low) performers perform better (worse) than the average
fund in subsequent funds, but do not attain the same level of superior (inferior) performance as
they did previously.
The regressions also indicate that increased fund size by a particular GP is associated
with worse subsequent performance in the earlier pre-2001 period, but does not appear to have
any effect in the later, post-2000 period.
ii. Venture Capital Funds
Panel B of Table 8 reports the regression results for VC funds. Current fund PMEs are
negatively related to previous fund PMEs in both sub-periods. As with the buyout funds results,
the negative coefficients suggest that there is some regression to the mean for individual GPs. In
other words, GPs who perform particularly well in one fund, perform less well in the next fund.
Combined with the opposite results in the earlier regressions that do not include fixed effects,
these results indicate that funds that were previously high (low) performers perform better
(worse) than the average fund in subsequent funds, but do not attain the same level of superior
(inferior) performance as they did previously.

22
Surprisingly, the regressions also indicate that increased fund size by a particular GP is
not associated with a decline in performance..
4. Summary and Implications
In this paper, we have used detailed cash-flow data to study the persistence of buyout and
VC fund performance of the same investors or general partners (GPs) across different funds.
We confirm the previous findings on persistence in pre-2000 funds. There is significant
persistence for buyout funds and, particularly for venture funds.
Post-2000, we find mixed evidence of persistence in buyout funds. When funds are
sorted by the quartile of performance of their previous funds, performance of the current fund is
statistically indistinguishable regardless of quartile. Returns for partnerships in all previous fund
quartiles, including the bottom, exceed those of public markets as measured by the S&P 500. At
the same time, however, regression estimates do find that current fund performance is
significantly related to previous fund performance.
It also is worth adding that our results overstate the amount of persistence because they
assume that previous fund performance is known at the time the next fund is raised. In fact,
previous fund performance at the time of fundraising is a noisy measure of the eventual fund
performance.
These results have interesting implications for buyout fund investors. First, the decline
in buyout fund persistence combined with a continuation of above public market returns is
consistent with at least two explanations. It is possible that the buyout business has changed,
with operating engineering becoming increasingly important. (See Kaplan and Stromberg

23
(2009)). Some general partners adjusted while others did not. Alternatively, it is possible that
general partners learned from each other and that has led to the reduction in persistence.
Second, the decline in persistence casts doubt on the industry rule of thumb to invest only
in funds that were previously in the top quartile. Except, perhaps, for the bottom quartile,
previous quartile performance is not a strong predictor of current fund quartile performance.
Third, the lack of a performance-size relation suggests that buyout funds have been able
to scale their performance as they have become larger. PMEs in the post-2000 period are not
appreciably different from those in the earlier period despite much larger fund sizes.
For VC funds, post-2000, we find that performance more or less remains as statistically
and economically persistent as pre-2000. Partnerships whose previous funds are below the
median for their vintage year subsequently tend to be below median and have returns below
those of the public markets (S&P 500). Partnerships in the top two quartiles tend to stay above
the median and their returns exceed those of the public markets. We also fail to find a negative
relation between performance and fund size. These results imply much greater stability in the
venture capital industry over time. The same forces that operated in the 1980s and 1990s appear
to still be in effect.
Our results on VC funds have two implications. First, the persistence of persistence
suggests that the industry rule of thumb to invest in funds that have previously performed well
and to avoid funds that have not remains consistent with our results. At the same time however,
funds with previous performance in both the top and second quartiles outperform the S&P 500.
This is not consistent with the view that only very few funds outperform. In fact, previous funds
that are above median appear to do so.

24
References
Brown, Greg, Oleg Gredil and Steven N. Kaplan, 2013, Do Private Equity Funds Game Returns? Working Paper, University of North Carolina. Chung, J., Performance Persistence in Private Equity Funds, working paper, Chinese University of Hong Kong. Chung, J., B. Sensoy, L Stern and M. Weisbach, forthcoming, Pay for Performance from Future Fund Flows: The Case of Private Equity, Review of Financial Studies. Cornelius, P., 2011, International Investments in Private Equity: Asset Allocation, Markets, and Industry Structure, London, UK: Academic Press. Harris, R., T. Jenkinson, and R. Stucke, 2010, A White Paper on Private Equity Data and Research, UAI Foundation Working Paper, University of Virginia. Harris, Robert S., Tim Jenkinson, and Steven N. Kaplan, 2013, Private equity performance: What do we know?, Working Paper. Jegadeesh, N., R. Kraussl, and J. Pollet, 2009, Risk and Expected Returns of Private Equity Investments: Evidence Based on Market Prices. Journal of Finance. Jenkinson, Tim, Miguel Sousa, and Rudiger Stucke, 2013, How Fair are the Valuations of Private Equity Funds? Working Paper, Oxford University. Jones, C. and M. Rhodes-Kropf, 2004, The Price of Diversifiable Risk in Venture Capital and Private Equity. Working Paper, Columbia University Kaplan, S. N., and A. Schoar, 2005. Private Equity Returns: Persistence and Capital flows. Journal of Finance 60, 1791-1823. Kaplan, S.N. and P. Strömberg, 2009, Leveraged Buyouts and Private Equity. Journal of Economic Perspectives, Winter, 121-146. Kocis, James M., James C. Bachman, Austin M. Long and Craig J. Nickels, 2009, Inside Private Equity, Hoboken, N.J., USA: John Wiley & Sons, Inc. Korteweg, Arthur and Morten Sorensen, 2010. Risk and Return Characteristics of Venture Capital-Backed Entrepreneurial Companies. Review of Financial Studies. Lerner, Josh, Antoinette Schoar and Wan Wongsunwai, 2007, Smart Institutions, Foolish Choices? The Limited Partner Performance Puzzle, Journal of Finance 62:731-64. Ljungqvist, A. and M. Richardson, 2003, The Cash Flow, Return, and Risk Characteristics of Private Equity. Working Paper No. 9495, NBER.

25
Ljungqvist, A., M. Richardson, and D. Wolfenzon, 2007, The Investment Behavior of Buyout Funds: Theory and Evidence. Metrick, Andrew, and Ayako Yasuda, 2010. The Economics of Private Equity Funds. Review of Financial Studies 23: 2303-2341. Mulcahy, D., B. Weeks and H. Bradley, 2012, “WE HAVE MET THE ENEMY… AND HE IS US” Lessons from Twenty Years of the Kauffman Foundation’s Investments in Venture Capital Funds and The Triumph of Hope over Experience, Working paper, Kauffman Foundation. Phalippou, Ludovic and Oliver Gottschalg, 2009, The Performance of Private Equity Funds, Review of Financial Studies Vol. 22, No. 4, 1747-1776. Robinson, D. and B. Sensoy, 2011a, Private Equity in the 21st Century: Liquidity, Cash Flows, and Performance from 1984-2010, Working Paper, Duke University and Ohio State University. Robinson, David and Berk Sensoy, 2011b. Manager Compensation, Ownership, and the Cash Flow Performance of Private Equity Funds, Working Paper, Duke University and Ohio State University. Sorensen, Morten and Ravi Jagannathan, 2013, The Strong Case for the Public Market Equivalent as the Premier Measure of Private Equity Performance, Working Paper, Columbia University. Stucke, R., 2011, Updating History, Working Paper, Oxford University Swensen, D. 2000, Pioneering Portfolio Management: An Unconventional Approach to Institutional Investment. Free Press.

Table 1: Summary Information on Funds
Panel A : Buyout FundsVintage Total Ave. Capital % Average Average Average Funds with Average Average Average
Committed ($M) Unrealized IRR MOIC PME Perf. IRR MOIC PMEHistory
1984 1 01986 6 407 0.0% 11.9% 2.15 0.93 01987 8 282 0.0% 17.8% 2.87 1.32 2 18.5% 3.42 1.551988 6 427 0.1% 14.3% 2.06 0.98 11989 11 445 3.8% 16.8% 2.33 1.12 2 8.2% 1.69 0.711990 3 237 0.4% 25.6% 2.53 1.30 01991 3 1,170 0.2% 29.1% 2.51 1.32 2 30.7% 2.57 1.331992 9 233 0.2% 22.9% 2.46 1.19 2 19.1% 1.57 1.031993 9 314 0.1% 30.8% 2.79 1.41 2 14.9% 2.08 0.991994 17 470 0.1% 26.9% 2.35 1.34 5 30.0% 2.67 1.491995 20 705 0.8% 19.7% 1.96 1.27 7 21.5% 2.00 1.281996 15 440 5.3% 4.2% 1.29 1.00 8 2.4% 1.19 0.891997 34 753 4.1% 6.2% 1.30 1.13 20 10.3% 1.48 1.281998 38 1,030 6.9% 9.6% 1.57 1.48 20 6.9% 1.47 1.361999 30 927 8.6% 4.6% 1.32 1.20 12 1.0% 1.18 1.062000 46 1,190 19.4% 13.2% 1.69 1.46 23 14.7% 1.74 1.492001 26 1,210 29.5% 16.9% 1.65 1.39 15 16.6% 1.66 1.392002 20 715 32.9% 17.9% 1.81 1.50 9 14.6% 1.74 1.412003 15 1,300 36.5% 18.2% 1.94 1.68 7 17.4% 1.70 1.492004 43 822 51.2% 14.3% 1.60 1.46 19 11.8% 1.50 1.382005 56 1,100 66.6% 8.2% 1.36 1.28 32 9.0% 1.37 1.292006 66 1,740 73.7% 5.7% 1.20 1.14 33 3.0% 1.10 1.052007 67 1,990 81.5% 9.1% 1.23 1.12 30 10.8% 1.24 1.142008 58 1,540 83.5% 11.6% 1.22 1.07 34 11.9% 1.23 1.08Total / Ave. 607 846 22.0% 15.5% 1.88 1.26 285 13.7% 1.73 1.24Overall Sample 1,150 40.8% 11.9% 1.56 1.26 10.7% 1.46 1.24
Panel B : Venture Capital FundsVintage Total Capital % Average Average Average Funds with Average Average Average
Committed ($M) Unrealized IRR MOIC PME Perf. IRR MOIC PMEHistory
1984 18 67 0.0% 2.1% 1.60 0.63 01985 19 45 0.0% 5.8% 2.00 0.73 01986 12 44 0.9% 11.6% 2.30 0.97 11987 18 84 0.0% 15.9% 2.68 1.17 5 17.1% 2.91 1.301988 18 80 0.2% 17.9% 2.40 1.17 6 19.1% 2.74 1.241989 22 60 0.2% 19.1% 2.83 1.28 12 23.3% 3.10 1.521990 13 75 0.0% 26.9% 3.05 1.55 4 37.7% 4.08 2.111991 8 221 4.3% 27.6% 2.78 1.34 4 19.2% 2.24 1.041992 18 110 0.4% 19.9% 2.60 1.22 12 23.1% 2.49 1.161993 21 117 0.0% 38.9% 4.83 2.13 10 52.3% 7.82 3.211994 21 115 0.5% 39.4% 5.17 2.35 12 51.1% 7.06 3.161995 27 115 0.9% 54.9% 5.21 2.98 12 47.3% 3.53 2.091996 21 141 2.0% 67.7% 5.92 3.78 14 90.3% 7.90 4.981997 37 163 3.1% 61.7% 2.88 2.32 17 101.8% 4.21 3.371998 50 191 9.5% 14.6% 1.52 1.40 34 19.3% 1.79 1.651999 78 322 18.0% -2.8% 0.90 0.84 34 -2.5% 0.99 0.952000 97 427 35.6% -2.7% 0.91 0.78 66 -2.3% 0.92 0.792001 50 387 46.9% 1.2% 1.13 0.92 29 2.4% 1.18 0.962002 17 318 48.3% 0.8% 1.08 0.87 9 0.5% 1.07 0.872003 27 246 59.1% -0.3% 1.09 0.95 11 3.7% 1.31 1.152004 35 257 73.9% 1.0% 1.25 1.12 17 -0.4% 1.03 0.932005 51 337 78.0% 3.4% 1.36 1.25 36 4.5% 1.48 1.362006 64 395 84.1% 2.4% 1.14 1.05 31 4.2% 1.23 1.132007 65 345 88.1% 6.6% 1.23 1.12 35 6.8% 1.22 1.112008 45 340 87.9% 10.6% 1.27 1.08 25 16.4% 1.40 1.20Total / Ave. 852 200 25.7% 17.8% 2.36 1.40 436 24.3% 2.80 1.69Overall Sample 265 37.5% 12.5% 1.88 1.28 16.4% 2.10 1.47

Table 2: Performance by Quartile
Panel A : Buyout FundsA.1 Total Sample Average Average Average N
IRR MOIC PMECurrent FundQuartile PME
1 26.1% 2.30 1.80 1612 14.1% 1.59 1.32 1483 8.1% 1.32 1.08 1574 -2.5% 0.93 0.78 141
A.2 Pre-2001 FundsCurrent FundQuartile PME
1 30.2% 2.87 1.97 712 14.9% 1.81 1.33 613 7.3% 1.39 1.01 674 -2.7% 0.92 0.68 57
A.3 Post-2000 FundsCurrent FundQuartile PME
1 22.8% 1.86 1.67 902 13.6% 1.44 1.31 873 8.7% 1.27 1.14 904 -2.4% 0.94 0.85 84
Panel B : Venture Capital FundsB.1 Total Sample Average Average Average N
IRR MOIC PMECurrent FundQuartile PME
1 42.5% 3.86 2.56 2252 12.3% 1.65 1.16 2083 2.4% 1.15 0.81 2164 -9.7% 0.69 0.49 203
B.2 Pre-2001 FundsCurrent FundQuartile PME
1 58.4% 5.20 3.14 1332 16.8% 1.98 1.23 1203 4.6% 1.28 0.78 1274 -8.9% 0.69 0.40 118
B.3 Post-2000 FundsCurrent FundQuartile PME
1 19.5% 1.93 1.72 922 6.0% 1.20 1.06 883 -0.8% 0.96 0.84 894 -10.9% 0.70 0.61 85

Table 3: Persistence by PME Quartile of Previous Fund
Panel A : Buyout Funds
A.1 Total Sample Average Average AverageCurrent Fund Quartile PME Current Fund Current Fund Current Fund
Previous Fund 1 2 3 4 Total IRR MOIC PMEQuartile PME
1 27.5% 27.5% 26.4% 18.7% 100.0% 13.2% 1.59 1.3425 25 24 17 91 91 91 91
2 26.3% 22.4% 31.6% 19.7% 100.0% 10.3% 1.42 1.2320 17 24 15 76 76 76 76
3 17.9% 26.9% 35.8% 19.4% 100.0% 10.2% 1.44 1.2112 18 24 13 67 67 67 67
4 19.6% 19.6% 31.4% 29.4% 100.0% 7.8% 1.28 1.1010 10 16 15 51 51 51 51
NA, but not First Time 28.9% 26.1% 22.8% 22.2% 100.0% 13.5% 1.67 1.2952 47 41 40 180 180 180 180
First Time 29.6% 21.8% 19.7% 28.9% 100.0% 12.0% 1.61 1.2742 31 28 41 142 142 142 142
A.2 Pre-2001 Funds
Previous FundQuartile PME
1 37.5% 25.0% 18.8% 18.8% 100.0% 17.3% 1.97 1.4812 8 6 6 32 32 32 32
2 30.4% 21.7% 30.4% 17.4% 100.0% 7.2% 1.51 1.227 5 7 4 23 23 23 23
3 21.4% 25.0% 32.1% 21.4% 100.0% 11.0% 1.63 1.236 7 9 6 28 28 28 28
4 17.4% 26.1% 30.4% 26.1% 100.0% 8.2% 1.38 1.124 6 7 6 23 23 23 23
NA, but not First Time 30.2% 25.6% 25.6% 18.6% 100.0% 16.4% 1.99 1.3326 22 22 16 86 86 86 86
First Time 25.0% 20.3% 25.0% 29.7% 100.0% 11.8% 1.77 1.2116 13 16 19 64 64 64 64
A.3 Post-2000 Funds
Previous FundQuartile PME
1 22.0% 28.8% 30.5% 18.6% 100.0% 11.0% 1.39 1.2613 17 18 11 59 59 59 59
2 24.5% 22.6% 32.1% 20.8% 100.0% 11.6% 1.39 1.2413 12 17 11 53 53 53 53
3 15.4% 28.2% 38.5% 17.9% 100.0% 9.6% 1.31 1.196 11 15 7 39 39 39 39
4 21.4% 14.3% 32.1% 32.1% 100.0% 7.4% 1.20 1.096 4 9 9 28 28 28 28
NA, but not First Time 27.7% 26.6% 20.2% 25.5% 100.0% 10.9% 1.39 1.2626 25 19 24 94 94 94 94
First Time 33.3% 23.1% 15.4% 28.2% 100.0% 12.1% 1.48 1.3126 18 12 22 78 78 78 78

Table 3: Persistence by Quartile of Previous FundPanel B : Venture Capital Funds
B.1 Total Sample Average Average AverageCurrent Fund Quartile PME Current Fund Current Fund Current Fund
Previous Fund 1 2 3 4 Total IRR MOIC PMEQuartile PME
1 48.5% 16.7% 24.2% 10.6% 100.0% 33.1% 3.28 2.2664 22 32 14 132 132 132 132
2 28.9% 34.2% 20.2% 16.7% 100.0% 14.6% 1.84 1.3033 39 23 19 114 114 114 114
3 22.0% 29.4% 29.4% 19.3% 100.0% 10.4% 1.74 1.1924 32 32 21 109 109 109 109
4 14.8% 17.3% 29.6% 38.3% 100.0% -0.3% 1.00 0.7912 14 24 31 81 81 81 81
NA, but not First Time 22.0% 21.2% 27.3% 29.5% 100.0% 7.6% 1.53 0.9852 62 72 74 260 260 260 260
First Time 23.6% 22.1% 24.4% 29.9% 100.0% 9.7% 1.86 1.2640 39 33 44 156 156 156 156
B.2 Pre-2001 Funds
Previous FundQuartile PME
1 48.7% 14.1% 23.1% 14.1% 100.0% 47.7% 4.41 2.7938 11 18 11 78 78 78 78
2 33.3% 27.0% 27.0% 12.7% 100.0% 22.0% 2.35 1.4821 17 17 8 63 63 63 63
3 26.8% 35.7% 17.9% 19.6% 100.0% 18.2% 2.33 1.4015 20 10 11 56 56 56 56
4 8.7% 19.6% 26.1% 45.7% 100.0% -0.3% 1.00 0.714 9 12 21 46 46 46 46
NA, but not First Time 19.9% 21.9% 30.1% 28.1% 100.0% 10.9% 1.78 1.0030 43 50 44 167 167 167 167
First Time 24.3% 23.0% 24.3% 28.4% 100.0% 16.0% 2.36 1.4025 20 20 23 88 88 88 88
B.3 Post-2000 Funds
Previous FundQuartile PME
1 48.1% 20.4% 25.9% 5.6% 100.0% 12.1% 1.65 1.4926 11 14 3 54 54 54 54
2 23.5% 43.1% 11.8% 21.6% 100.0% 5.5% 1.21 1.0712 22 6 11 51 51 51 51
3 17.0% 22.6% 41.5% 18.9% 100.0% 2.2% 1.11 0.969 12 22 10 53 53 53 53
4 22.9% 14.3% 34.3% 28.6% 100.0% -0.3% 1.01 0.908 5 12 10 35 35 35 35
NA, but not First Time 25.9% 19.8% 22.2% 32.1% 100.0% 1.9% 1.08 0.9422 19 22 30 93 93 93 93
First Time 22.6% 20.8% 24.5% 32.1% 100.0% 1.6% 1.21 1.0815 19 13 21 68 68 68 68

Table 4: Persistence by PME Level of Previous Fund
Panel A : Buyout Funds
A.1 Total Sample Average Average AverageCurrent Fund Quartile PME Current Fund Current Fund Current Fund
Previous Fund PME 1 2 3 4 Total IRR MOIC PME
Lagged PME > 1.50 30.1% 28.2% 25.2% 16.5% 100.0% 13.7% 1.55 1.3431 29 26 17 103 103 103 103
1.50 > PME > 1.25 17.4% 27.5% 29.0% 26.1% 100.0% 8.4% 1.35 1.2212 19 20 18 69 69 69 69
1.25 > PME > 1.00 26.1% 15.2% 45.7% 13.0% 100.0% 11.0% 1.45 1.1712 7 21 6 46 46 46 46
Lagged PME < 1.0 17.9% 22.4% 31.3% 28.4% 100.0% 8.5% 1.41 1.1412 15 21 19 67 67 67 67
NA, but not First Time 28.9% 26.1% 22.8% 22.2% 100.0% 13.5% 1.67 1.2952 47 41 40 180 180 180 180
First Time 29.6% 21.8% 19.7% 28.9% 100.0% 12.0% 1.61 1.2742 31 28 41 142 142 142 142
A.2 Pre-2001 Funds
Previous Fund PME
Lagged PME > 1.50 37.5% 29.2% 12.5% 20.8% 100.0% 18.5% 1.92 1.489 7 3 5 24 24 24 24
1.50 > PME > 1.25 33.3% 27.8% 27.8% 11.1% 100.0% 11.4% 1.69 1.456 5 5 2 18 18 18 18
1.25 > PME > 1.00 31.6% 10.5% 36.8% 21.1% 100.0% 8.7% 1.64 1.156 2 7 4 19 19 19 19
Lagged PME < 1.0 17.8% 26.7% 31.1% 24.4% 100.0% 9.0% 1.50 1.178 12 14 11 45 45 45 45
NA, but not First Time 30.2% 25.6% 25.6% 18.6% 100.0% 16.4% 1.99 1.3326 22 22 16 86 86 86 86
First Time 25.0% 20.3% 25.0% 29.7% 100.0% 11.8% 1.77 1.2216 13 16 19 64 64 64 64
A.3 Post-2000 Funds
Previous Fund PME
Lagged PME > 1.50 27.5% 28.8% 28.8% 15.0% 100.0% 12.3% 1.44 1.3022 23 23 12 80 80 80 80
1.50 > PME > 1.25 11.8% 27.5% 29.4% 31.4% 100.0% 7.3% 1.24 1.146 14 15 16 51 51 51 51
1.25 > PME > 1.00 22.2% 18.5% 51.9% 7.4% 100.0% 12.6% 1.32 1.196 5 14 2 27 27 27 27
Lagged PME < 1.0 18.2% 13.6% 31.8% 36.4% 100.0% 7.4% 1.23 1.094 3 7 8 22 22 22 22
NA, but not First Time 27.7% 26.6% 20.2% 25.5% 100.0% 10.9% 1.39 1.2626 25 19 24 94 94 94 94
First Time 33.3% 23.1% 15.4% 28.2% 100.0% 12.1% 1.48 1.3126 18 12 22 78 78 78 78

Table 4: Persistence by PME Level of Previous FundPanel B : Venture Capital Funds
B.1 Total Sample Average Average AverageCurrent Fund Quartile PME Current Fund Current Fund Current Fund
Previous Fund PME 1 2 3 4 Total IRR MOIC PME
Lagged PME > 1.50 50.0% 17.6% 18.6% 13.7% 100.0% 43.8% 3.72 2.5451 18 19 14 102 102 102 102
1.50 > PME > 1.25 42.1% 26.3% 21.1% 10.5% 100.0% 20.5% 2.67 1.6316 10 8 4 38 38 38 38
1.25 > PME > 1.00 26.4% 22.2% 36.1% 15.3% 100.0% 8.5% 1.61 1.2319 16 26 11 72 72 72 72
Lagged PME < 1.0 21.0% 28.1% 25.9% 25.0% 100.0% 5.8% 1.41 1.0247 63 58 56 224 224 224 224
NA, but not First Time 22.0% 21.2% 27.3% 29.5% 100.0% 7.6% 1.53 0.9852 62 72 74 260 260 260 260
First Time 23.6% 22.1% 24.4% 29.9% 100.0% 9.7% 1.86 1.2640 39 33 44 156 156 156 156
B.2 Pre-2001 Funds
Previous Fund PME
Lagged PME > 1.50 45.8% 19.3% 19.3% 15.7% 100.0% 49.9% 4.21 2.8038 16 16 13 83 83 83 83
1.50 > PME > 1.25 39.1% 21.7% 21.7% 17.4% 100.0% 24.6% 3.32 1.719 5 5 4 23 23 23 23
1.25 > PME > 1.00 21.4% 14.3% 42.9% 21.4% 100.0% 10.6% 1.85 1.096 4 12 6 28 28 28 28
Lagged PME < 1.0 22.9% 29.4% 22.0% 25.7% 100.0% 10.1% 1.75 1.1025 32 24 28 109 109 109 109
NA, but not First Time 19.9% 21.9% 30.1% 28.1% 100.0% 10.9% 1.78 1.0030 43 50 44 167 167 167 167
First Time 24.3% 23.0% 24.3% 28.4% 100.0% 16.0% 2.36 1.4025 20 20 23 88 88 88 88
B.3 Post-2000 Funds
Previous Fund PME
Lagged PME > 1.50 68.4% 10.5% 15.8% 5.3% 100.0% 16.8% 1.59 1.4113 2 3 1 19 19 19 19
1.50 > PME > 1.25 46.7% 33.3% 20.0% 0.0% 100.0% 14.2% 1.67 1.507 5 3 0 15 15 15 15
1.25 > PME > 1.00 29.5% 27.3% 31.8% 11.4% 100.0% 7.2% 1.46 1.3213 12 14 5 44 44 44 44
Lagged PME < 1.0 19.1% 27.0% 29.6% 24.3% 100.0% 1.8% 1.09 0.9622 31 34 28 115 115 115 115
NA, but not First Time 25.9% 19.8% 22.2% 32.1% 100.0% 1.9% 1.08 0.9422 19 22 30 93 93 93 93
First Time 22.6% 20.8% 24.5% 32.1% 100.0% 1.6% 1.21 1.0815 19 13 21 68 68 68 68
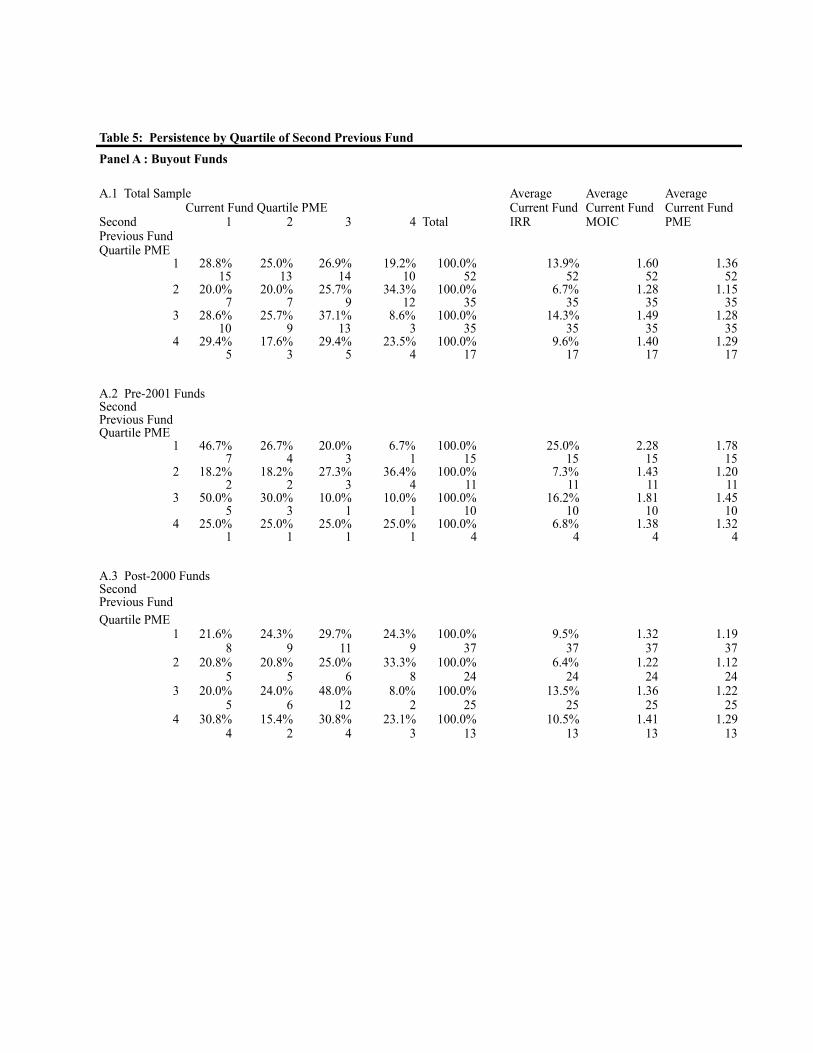
Table 5: Persistence by Quartile of Second Previous Fund
Panel A : Buyout Funds
A.1 Total Sample Average Average AverageCurrent Fund Quartile PME Current Fund Current Fund Current Fund
Second 1 2 3 4 Total IRR MOIC PMEPrevious FundQuartile PME
1 28.8% 25.0% 26.9% 19.2% 100.0% 13.9% 1.60 1.3615 13 14 10 52 52 52 52
2 20.0% 20.0% 25.7% 34.3% 100.0% 6.7% 1.28 1.157 7 9 12 35 35 35 35
3 28.6% 25.7% 37.1% 8.6% 100.0% 14.3% 1.49 1.2810 9 13 3 35 35 35 35
4 29.4% 17.6% 29.4% 23.5% 100.0% 9.6% 1.40 1.295 3 5 4 17 17 17 17
A.2 Pre-2001 FundsSecondPrevious FundQuartile PME
1 46.7% 26.7% 20.0% 6.7% 100.0% 25.0% 2.28 1.787 4 3 1 15 15 15 15
2 18.2% 18.2% 27.3% 36.4% 100.0% 7.3% 1.43 1.202 2 3 4 11 11 11 11
3 50.0% 30.0% 10.0% 10.0% 100.0% 16.2% 1.81 1.455 3 1 1 10 10 10 10
4 25.0% 25.0% 25.0% 25.0% 100.0% 6.8% 1.38 1.321 1 1 1 4 4 4 4
A.3 Post-2000 FundsSecondPrevious FundQuartile PME
1 21.6% 24.3% 29.7% 24.3% 100.0% 9.5% 1.32 1.198 9 11 9 37 37 37 37
2 20.8% 20.8% 25.0% 33.3% 100.0% 6.4% 1.22 1.125 5 6 8 24 24 24 24
3 20.0% 24.0% 48.0% 8.0% 100.0% 13.5% 1.36 1.225 6 12 2 25 25 25 25
4 30.8% 15.4% 30.8% 23.1% 100.0% 10.5% 1.41 1.294 2 4 3 13 13 13 13

Table 5: Persistence by Quartile of Second Previous FundPanel B : Venture Capital Funds
B.1 Total Sample Average Average AverageCurrent Fund Quartile PME Current Fund Current Fund Current Fund
Second 1 2 3 4 Total IRR MOIC PMEPrevious FundQuartile PME
1 40.7% 26.7% 19.8% 12.8% 100.0% 33.4% 3.30 2.2535 23 17 11 86 86 86 86
2 35.2% 23.9% 23.9% 16.9% 100.0% 17.0% 2.62 1.7325 17 17 12 71 71 71 71
3 27.6% 34.5% 24.1% 13.8% 100.0% 17.7% 1.87 1.4416 20 14 8 58 58 58 58
4 16.2% 24.3% 35.1% 24.3% 100.0% 2.4% 1.11 0.946 9 13 9 37 37 37 37
B.2 Pre-2001 FundsSecondPrevious FundQuartile PME
1 47.1% 23.5% 13.7% 15.7% 100.0% 50.5% 4.63 2.9824 12 7 8 51 51 51 51
2 42.4% 21.2% 15.2% 21.2% 100.0% 29.2% 3.90 2.1614 7 5 7 33 33 33 33
3 27.6% 31.0% 24.1% 17.2% 100.0% 29.6% 2.46 1.748 9 7 5 29 29 29 29
4 30.0% 40.0% 20.0% 10.0% 100.0% 9.6% 1.44 1.113 4 2 1 10 10 10 10
B.3 Post-2000 FundsSecondPrevious FundQuartile PME
1 31.4% 31.4% 28.6% 8.6% 100.0% 8.4% 1.37 1.1811 11 10 3 35 35 35 35
2 28.9% 26.3% 31.6% 13.2% 100.0% 6.4% 1.51 1.3611 10 12 5 38 38 38 38
3 27.6% 37.9% 24.1% 10.3% 100.0% 5.9% 1.27 1.138 11 7 3 29 29 29 29
4 11.1% 18.5% 40.7% 29.6% 100.0% 0.0% 0.99 0.883 5 11 8 27 27 27 27

Table 6Relation of Current Fund (log) PME to Past Fund (log) PMEs
Panel A: All Vintage Years
Previous Fund PME 0.273*** 0.407*** 0.271*** 0.269*** 0.338*** 0.272*** 0.339*** 0.321***[0.053] [0.087] [0.053] [0.053] [0.044] [0.062] [0.044] [0.044]
2nd Previous Fund PME 0.053 -0.002 0.167*** 0.063[0.075] [0.082] [0.060] [0.060]
(Log) Change Fund Size 0.019 -0.057[0.057] [0.069]
(Log) Fund Size 0.0273 0.157***[0.021] [0.042]
Year Dummies Y Y Y Y Y Y Y Y Y Y
N 285 139 139 285 285 436 252 252 436 436Adj. R-squared 0.20 0.01 0.25 0.19 0.20 0.32 0.38 0.44 0.32 0.34
Panel B: Vintage Years 2000 and EarlierSample:Previous Fund PME 0.293*** 0.570*** 0.286*** 0.296*** 0.365*** 0.252** 0.367*** 0.340***
[0.094] [0.162] [0.096] [0.094] [0.063] [0.097] [0.063] [0.062]
2nd Previous Fund PME 0.131 -0.045 0.171 0.064[0.154] [0.157] [0.109] [0.109]
(Log) Change Fund Size -0.092 -0.110[0.154] [0.113]
(Log) Fund Size 0.051 0.265***[0.051] [0.075]
Year Dummies Y Y Y Y Y Y Y Y Y Y
N 106 40 40 106 106 243 123 123 243 243Adj. R-squared 0.14 0.00 0.27 0.14 0.14 0.34 0.41 0.46 0.34 0.38
Panel C: Vintage Years 2001 and LaterSample:Previous Fund PME 0.280*** 0.320*** 0.258*** 0.271*** 0.281*** 0.319*** 0.282*** 0.270***
[0.062] [0.107] [0.074] [0.062] [0.053] [0.073] [0.053] [0.053]
2nd Previous Fund PME -0.017 -0.004 0.133** 0.057[0.098] [0.098] [0.058] [0.054]
(Log) Change Fund Size 0.074 -0.010[0.050] [0.063]
(Log) Fund Size 0.025 0.061*[0.019] [0.036]
Year Dummies Y Y Y Y Y Y Y Y Y Y
N 179 99 99 179 179 193 129 129 193 193Adj. R-squared 0.20 0.00 0.14 0.21 0.21 0.17 0.01 0.16 0.16 0.18
Buyout Funds VC Funds
Buyout Funds VC Funds
Buyout Funds VC Funds

Table 7Relation of Current Fund Log PME to Past Fund PME Quartiles
All Years Pre-2001 Post-2000 All Years Pre-2001 Post-2000Previous Fund Performance
2nd Quartile -0.048 -0.170 0.015 -0.275*** -0.312*** -0.218**[0.062] [0.136] [0.059] [0.085] [0.134] [0.085]
3rd Quartile -0.070 -0.180 -0.010 -0.317*** -0.311*** -0.299***[0.065] [0.132] [0.065] [0.087] [0.133] [0.085]
4th (Lowest) Quartile -0.194*** -0.331** -0.110 -0.631*** -0.811*** -0.381***[0.071] [0.140] [0.072] [0.095] [0.141] [0.095]
No Previous Fund Info -0.023 -0.095 0.008 -0.504*** -0.600*** -0.361***[0.052] [0105] [0.052] [0.073] [0.111] [0.080]
First-Time Fund -0.078 -0.209* -0.00 -0.421*** -0.502*** -0.311***[0.054] [0.111] [0.054] [0.080] [0.126] [0.080]
Year Dummies Y Y Y Y Y YN 607 256 351 852 498 354R-squared 0.09 0.06 0.11 0.21 0.24 0.09
A. Buyout Funds B. Venture Capital Funds
Table 8Relation of Current Fund PME to Past Fund PME With GP Fixed Effects
A. Buyout FundsAll Years All Years Pre-2001 Pre-2001 Post-2000 Post-2000
Previous Fund Performance
Previous Fund PME -0.045 -0.067 0.033 -0.044 -0.319*** -0.318***[0.063] [0.065] [0.081] [0.077] [0.094] [0.094]
(Log) Fund Size -0.080** -0.283*** -0.00[0.061] [0.096] [0.077]
Year Dummies Y Y Y Y Y YGP Fixed Effects Y Y Y Y Y YN 285 285 106 106 179 179R-squared 0.06 0.04 0.10 0.04 0.02 0.02
B. Venture Capital FundsAll Years All Years Pre-2001 Pre-2001 Post-2000 Post-2000
Previous Fund Performance
Previous Fund PME -0.081* -0.089* -0.219*** -0.219*** -0.245* -0.232[0.049] [0.048] [0.082] [0.083] [0.141] [0.140]
(Log) Fund Size -0.131 0.008 0.172[0.109] [0.127] [0.118]
Year Dummies Y Y Y Y Y YGP Fixed Effects Y Y Y Y Y YN 436 436 243 243 193 193R-squared 0.15 0.12 0.13 0.13 0.00 0.01