Embed Size (px)
Citation preview
SEPTEMBER 2019
Has the dollar lost ground as the dominant international currency?
Eswar Prasad
Yixuan Cai, Luke O’Leary, and Minchen Sun provided excellent research assistance.
Has the dollar lost ground as the dominant
international currency?
Eswar Prasad*
Cornell University and Brookings Institution
September 2019
A currency’s share of global foreign exchange (FX) reserves, as reported by the IMF, is a
key indicator of its prominence as a reserve currency. In 2013, the IMF had information
about the currency composition of only about half of global FX reserves. Today, that
share stands at 94 percent as most major reserve holders, including China, now report
(confidentially) to the IMF the currency composition of their FX reserves.
The recent seemingly precipitous four-percentage-point decline in the dollar’s share of
global FX reserves, from 66 percent in 2015 to 62 percent in 2018, is probably a
statistical artifact related to changes in the reporting of reserves. This shift in the dollar’s
share was likely affected by how China and other previous non-reporters chose to report
the currency composition of their reserves, which they did gradually over the 2014-2018
period.
As of 2019Q1, the dollar’s share of global FX reserves was 62 percent, essentially the
same as during the 2009-2012 period. It remains by far the dominant global reserve
currency.
Compared with 2007, however, the dollar’s share of global FX reserves has declined by 2
percentage points while the euro’s share is down 6 percentage points. Over this period,
the Japanese yen’s share has risen by 2 percentage points, while other less prominent
reserve currencies have increased their total share by 4 percentage points. The
renminbi, which was not an official reserve currency in 2007, now accounts for 2 percent
of global FX reserves.
By some measures, the dollar has regained its status as the dominant international
payments currency, displacing the euro. For instance, from 2012 to 2019, the dollar’s
share of cross-border payments intermediated through the SWIFT messaging network
has risen by 10 percentage points to 40 percent, while the euro’s share has declined by
10 percentage points to 34 percent. The renminbi’s share of global payments has fallen
back to under 2 percent.
The renminbi’s uneven rise and other developments—including attempts by other
countries to shake free from the dollar and U.S. government policies—have not
weakened the dollar’s grip on global finance. Many central banks, especially those of
China and Russia, have been buying gold. During 2018, Russia’s central bank sold about
$100 billion in U.S. Treasury securities and moved those reserves into renminbi- and
euro-denominated assets. Such moves by U.S. geopolitical rivals and other
developments in global financial markets have not dented global holdings of dollar
reserves. Rather, they have resulted mostly in a reshuffling of the relative positions of
the second-tier currencies, including the euro.
In short, the euro has stumbled, the renminbi has stalled, and dollar supremacy remains
unchallenged.
- 1 -
1. Overview
The looming loss of the U.S. dollar’s status as the dominant international currency is a
recurring theme in international finance. This issue also has a geopolitical edge as countries
around the world, from traditional allies in Europe to rivals such as China and Russia, have
chafed at the dollar’s dominance in global finance.1 Countries targeted by U.S. financial
sanctions—including Iran, Russia, and Venezuela—have attempted (with limited success) to
work around the dollar’s key role in the international payments system. Indeed, the centrality
of the U.S. dollar in the global payments system is what that gives U.S. sanctions their
potency.
Currencies that are prominent in international financial markets play several related but
distinct roles—as mediums of exchange, units of account, and stores of value.
Oil and other commodity contracts are mostly denominated in U.S. dollars, making it an
important unit of account. The dollar is the dominant invoicing currency in international trade
transactions, especially if one excludes trade within Europe and European countries’ trade
with the rest of the world, a significant fraction of which is invoiced in euros.2 The dollar and
euro together account for about three-quarters of international payments made to settle
cross-border trade and financial transactions, making them the leading mediums of
exchange.
The store-of-value function is related to reserve currency status. Reserve currencies are
typically hard currencies, which are easily available and can be traded freely in global
currency markets, that are seen as safe stores of value.
A key aspect of the configuration of global reserve currencies is the composition of global
foreign exchange (FX) reserves, which are the foreign currency asset holdings of national
central banks.3 The dollar has been the main global reserve currency since it usurped the
British pound sterling’s place after World War II.4 The global financial crisis, which originated
in the U.S. and ought to have hurt the dollar’s status, paradoxically strengthened the dollar’s
dominance as a global safe haven. The eurozone debt crisis, by contrast, put to rest any
pretensions the euro might have had of challenging the dollar’s supremacy as a reserve
currency. The Chinese renminbi, which just recently ascended to the status of an official
reserve currency, has made rapid progress but still accounts for only a modest fraction of
global FX reserves. Nevertheless, the purported erosion of the dollar’s status as the main
global reserve currency remains a persistent topic of popular discussion and news reporting.
Narratives about the recent rise and fall of reserve currencies rely on data from the IMF’s
quarterly Composition of Foreign Exchange Reserves (COFER) updates. National authorities
report the currency composition of their FX reserves to the IMF but often do so on a
confidential basis because they view this information as market sensitive or politically
sensitive. To preserve the confidentiality of country-specific information, the IMF presents
1 See, for instance, Keith Johnson, “Europe’s Dream: Escaping the Dictatorship of the Dollar,” Foreign Affairs, June 14,
2019; Henry Foy, “Can Russia Stop Using the U.S. Dollar?” Financial Times, October 3, 2018. 2 See Gita Gopinath, “The International Price System,” Proceedings of the Jackson Hole Symposium, 2016, and Chart 26
in “The International Role of the Euro,” European Central Bank, June 2019. Also see Linda Goldberg, “Is the
International Role of the Dollar Changing?” Federal Reserve Bank of New York, 2010. 3 A country’s international reserves include its central bank’s holdings of reserve currencies and gold plus the country’s
allocation of IMF Special Drawing Rights. FX reserves now account for 86 percent of global reserves. 4 See Barry Eichengreen, The Rise and Fall of the Dollar and the Future of the International Monetary System, Oxford
University Press, 2011.
- 2 -
only aggregated data and, until recently, did not reveal which countries do or do not report
the composition of their FX reserves.
For the past decade, a problem has complicated interpretations of the COFER data. The
problem lurks in two categories of reserves that appear in the COFER reports—allocated and
unallocated reserves. The IMF uses the term allocated reserves to denote those FX reserves
whose currency composition it is aware of, i.e., FX reserves that it can allocate to various
reserve currencies based on information provided by national authorities. The remaining
reserves are unallocated.
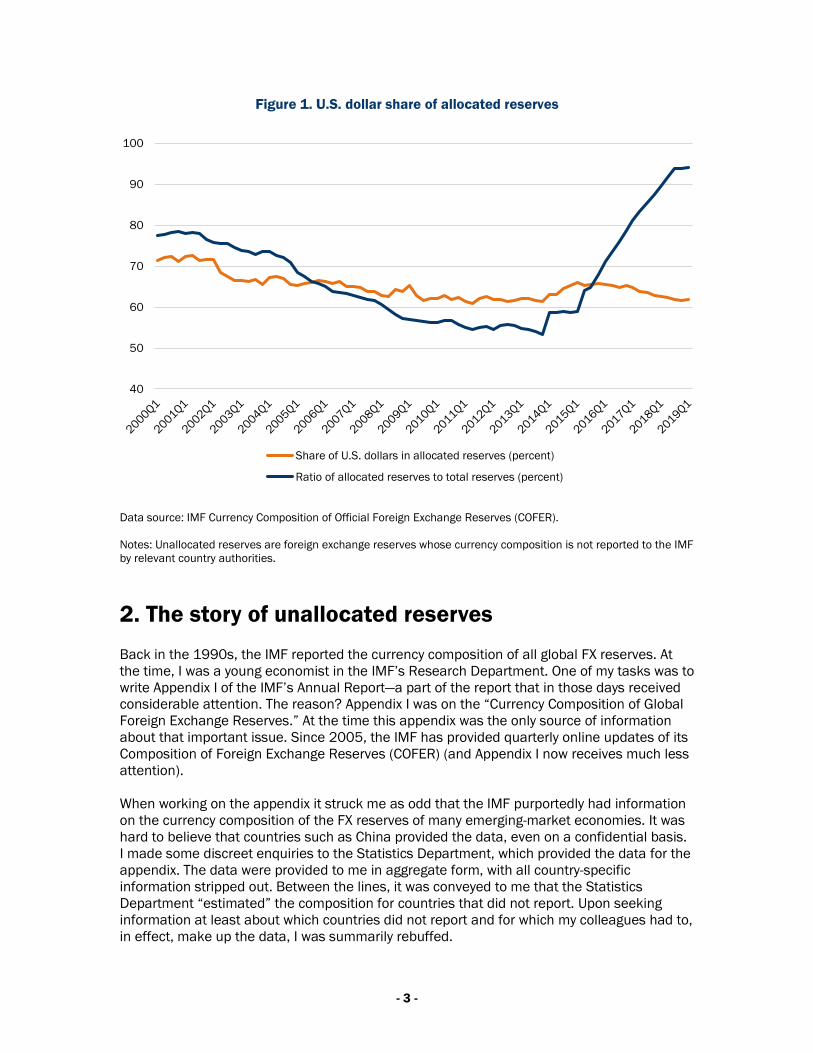
In 2000, global FX reserves amounted to just under $2 trillion. At that time, the ratio of
allocated reserves to total FX reserves was about 80 percent (see Figure 1). By the end of
2013, global FX reserves had ballooned about six-fold to $11.7 trillion and this ratio had
fallen to 53 percent. In other words, the IMF did not know the currency composition of 47
percent of global FX reserves, valued at roughly $5.5 trillion.
Starting in 2014, the ratio of allocated reserves, those whose currency composition the IMF
knows, began to rise. By 2018Q3, this ratio had risen to 94 percent, a level that has
remained steady since then. So now the IMF is in the dark about the currency composition of
only about $700 billion out of a total stock of global FX reserves of $11.5 trillion.
Later in this note, I will explore the reasons for the huge decline and subsequent surge in the
share of allocated reserves in total reserves. One key reason is that China and certain other
economies began reporting the currency composition of their FX reserves to the IMF in 2014.
But they did so only in a phased manner to protect the confidentiality of this information.
For now, I focus on one key implication: that changes in the currency composition of global
FX reserves over the period from 2013 to the present should be interpreted with
considerable caution. Why is this period important? After remaining roughly stable, in the
range of 61-62 percent, over the 2009-2012 period, the dollar’s share then rose to 66
percent in 2015Q1 before it began declining to the 62 percent level at which it now stands.
Dollar doomsayers and news reports have highlighted the seemingly precipitous 4-
percentage-point fall in the dollar’s share from 2015Q1 to 2018Q3 as a sign of the dollar’s
waning dominance.5 This narrative has become less compelling now that the share of the
dollar has remained stable over the last three quarters (2018Q3-2019Q1), at roughly the
2013Q1 level.
In other words, the share of the dollar rose and fell during a period when China and some
other previous non-reporters were gradually revealing the currency composition of their FX
reserves to the IMF. In Section 4.1 of this brief, I explain why China might have front-loaded
the reporting of its dollar reserves. The main point is that, once the share of allocated
reserves in total FX reserves settled down, so did the dollar’s share in total allocated
reserves. Therein lies a tale.
5 See Brendan Murray, “Dollar Share of Currency Reserves Slips to Near Five-Year Low,” Bloomberg, December 28,
2018; Dion Rabouin, “The World’s Slow Drift From the Dollar,” Axios, January 17, 2019.
- 3 -
Figure 1. U.S. dollar share of allocated reserves
Data source: IMF Currency Composition of Official Foreign Exchange Reserves (COFER).
Notes: Unallocated reserves are foreign exchange reserves whose currency composition is not reported to the IMF
by relevant country authorities.
2. The story of unallocated reserves
Back in the 1990s, the IMF reported the currency composition of all global FX reserves. At
the time, I was a young economist in the IMF’s Research Department. One of my tasks was to
write Appendix I of the IMF’s Annual Report—a part of the report that in those days received
considerable attention. The reason? Appendix I was on the “Currency Composition of Global
Foreign Exchange Reserves.” At the time this appendix was the only source of information
about that important issue. Since 2005, the IMF has provided quarterly online updates of its
Composition of Foreign Exchange Reserves (COFER) (and Appendix I now receives much less
attention).
When working on the appendix it struck me as odd that the IMF purportedly had information
on the currency composition of the FX reserves of many emerging-market economies. It was
hard to believe that countries such as China provided the data, even on a confidential basis.
I made some discreet enquiries to the Statistics Department, which provided the data for the
appendix. The data were provided to me in aggregate form, with all country-specific
information stripped out. Between the lines, it was conveyed to me that the Statistics
Department “estimated” the composition for countries that did not report. Upon seeking
information at least about which countries did not report and for which my colleagues had to,
in effect, make up the data, I was summarily rebuffed.
40
50
60
70
80
90
100
Share of U.S. dollars in allocated reserves (percent)
Ratio of allocated reserves to total reserves (percent)

- 4 -
By the early 2000s, when China and other emerging markets had started accumulating vast
quantities of reserves, it had become untenable to estimate the currency composition of
their reserves. So the IMF came clean—creating a new category called unallocated reserves
and reporting the currency composition only of allocated reserves. But one thing did not
change—the IMF did not reveal which countries failed to report the composition of their FX
reserves, i.e., which countries were responsible for the unallocated reserves.
At the time of the COFER online database launch in December 2005, the IMF noted that
“COFER data are submitted to the IMF on a voluntary and confidential basis by 114 member
countries, comprising all 24 industrial countries and 90 out of the 160 developing
countries.”
Some forensic analysis and public information (leavened with information from
knowledgeable sources) indicates that the unallocated reserves can be attributed mostly to
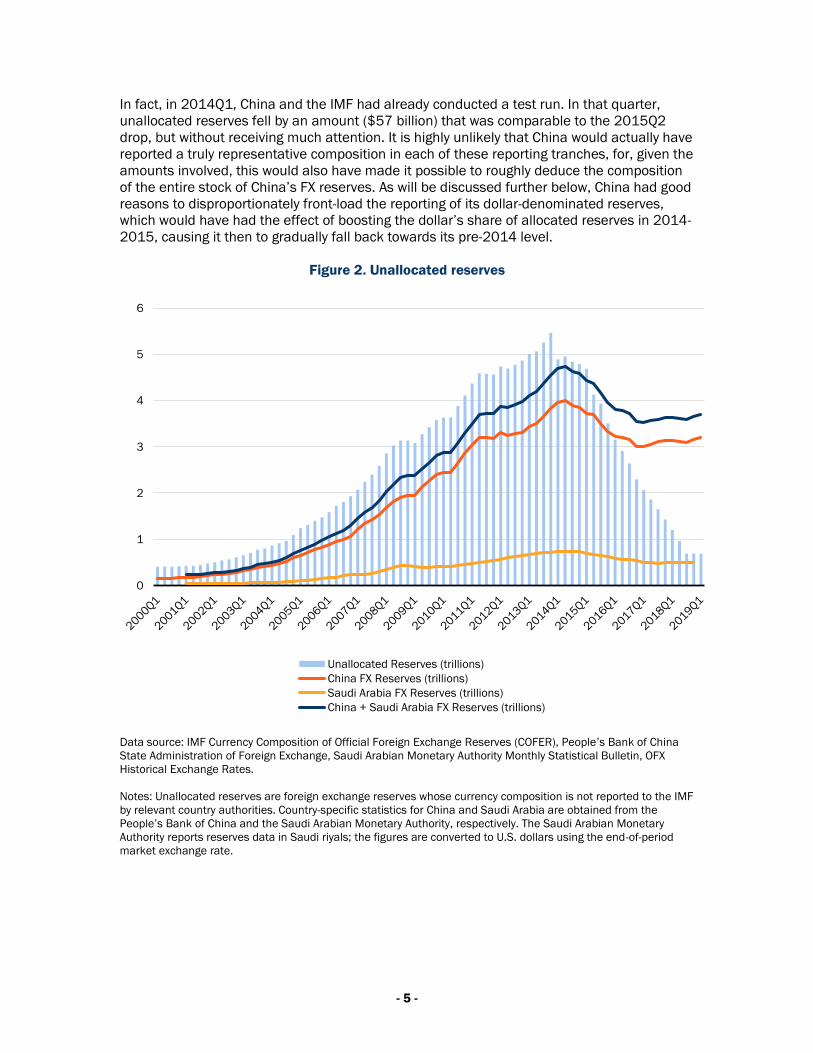
China and, perhaps, Saudi Arabia.6 Figure 2 shows total unallocated reserves, the FX
reserves of China and Saudi Arabia, and the sum of these two countries’ FX reserves.
Unallocated reserves rose from $0.42 trillion in 2001Q1 to a peak of $5.46 trillion in
2013Q4, an increase of $5.05 trillion. Over this period, the combined FX reserves of China
and Saudi Arabia rose from $0.23 trillion to $4.55 trillion, an increase of $4.32 trillion. Thus,
in 2013Q4, these two countries accounted for 83 percent of unallocated reserves and a
slightly higher share (86 percent) of the increase in unallocated reserves over those 13
years.
2.1. Unallocated reserves begin to fall
As shown in Figures 1 and 2, starting in 2014Q1 the total amount of unallocated reserves
and the share of allocated reserves in global FX reserves have clearly and sharply reversed
direction from their previous trends. Unallocated reserves, which had been rising steadily
since 2000, started falling in that quarter. Conversely, the share of allocated reserves in total
reserves, which had been falling steadily since 2000, started rising. Both series level off in
2018Q3.
Given the enormous size of China’s FX reserves, it would have been possible to deduce the
currency composition of those reserves if China had reported those data to the IMF in one
shot. Hence, the IMF came to an agreement with China that the currency composition of
Chinese FX reserves would be reported gradually, over a period of two to three years. In
October 2015, the IMF announced that China had reported the composition of a
“representative portfolio on a partial basis.”7 Indeed, that was reflected in a $56 billion drop
in unallocated reserves in 2015Q2, raising the share of allocated reserves in global FX
reserves by 5 percentage points.
6 Some analysts include India in the list of previous non-reporters. India signed up to the SDDS in December 1996,
though, and had met the reporting requirements by December 2001, so it is unlikely that it was a COFER non-reporter in
the 2000s. https://dsbb.imf.org/sdds/subscription-date. Participation in the SDDS requires reporting the currency
composition of foreign exchange reserves to the IMF at least once a year. See Table 6.1 in
https://dsbb.imf.org/content/pdfs/sddsguide13.pdf 7 These details were confirmed in an IMF conference call in September 2016:
https://www.imf.org/en/News/Articles/2016/09/22/tr092216-sdr-basket-conference-call China announced its intention to sign up to the Special Data Dissemination Standards in November 2014 and formally
signed up in October 2015. See https://www.imf.org/external/np/sec/pr/2014/pr14520.htm and
https://www.imf.org/en/News/Articles/2015/09/14/01/49/pr15466
- 5 -
In fact, in 2014Q1, China and the IMF had already conducted a test run. In that quarter,
unallocated reserves fell by an amount ($57 billion) that was comparable to the 2015Q2
drop, but without receiving much attention. It is highly unlikely that China would actually have
reported a truly representative composition in each of these reporting tranches, for, given the
amounts involved, this would also have made it possible to roughly deduce the composition
of the entire stock of China’s FX reserves. As will be discussed further below, China had good
reasons to disproportionately front-load the reporting of its dollar-denominated reserves,
which would have had the effect of boosting the dollar’s share of allocated reserves in 2014-
2015, causing it then to gradually fall back towards its pre-2014 level.
Figure 2. Unallocated reserves
Data source: IMF Currency Composition of Official Foreign Exchange Reserves (COFER), People’s Bank of China
State Administration of Foreign Exchange, Saudi Arabian Monetary Authority Monthly Statistical Bulletin, OFX
Historical Exchange Rates.
Notes: Unallocated reserves are foreign exchange reserves whose currency composition is not reported to the IMF
by relevant country authorities. Country-specific statistics for China and Saudi Arabia are obtained from the
People’s Bank of China and the Saudi Arabian Monetary Authority, respectively. The Saudi Arabian Monetary
Authority reports reserves data in Saudi riyals; the figures are converted to U.S. dollars using the end-of-period
market exchange rate.
0
1
2
3
4
5
6
Unallocated Reserves (trillions)
China FX Reserves (trillions)
Saudi Arabia FX Reserves (trillions)
China + Saudi Arabia FX Reserves (trillions)
- 6 -
Since 2018Q3, unallocated reserves have remained level at $690 billion, while Saudi
Arabia’s FX reserves have been stable at $500 billion. Saudi Arabia was, until September
2019, the only G-20 economy that had not subscribed to the IMF’s Special Data
Dissemination Standards (SDDS), which require reporting of the currency composition of FX
reserves to the IMF. Hence, it is a reasonable conjecture that Saudi Arabia was a non-
reporter during the period analyzed in this brief.8
Which countries account for the remaining $190 billion? As of February 2019, 75 of the
IMF’s 187 member countries had signed up to the IMF’s SDDS, which in principle requires
reporting the currency composition of FX reserves to the IMF, at least on a confidential basis.
In other words, the reserves of these countries are part of the allocated reserves. As of
August 2019, the COFER website indicated that 149 countries report FX reserve currency
composition data to the IMF, with 97 of those reporting countries (including SDDS
participants) allowing themselves to be identified publicly on that website.9 In other words,
most of the major FX reserve holders now do report the currency composition of their
reserves to the IMF. With Saudi Arabia’s recent subscription to the SDDS, unallocated
reserves in COFER are likely to soon decline further.
3. Shifting shares of reserve currencies
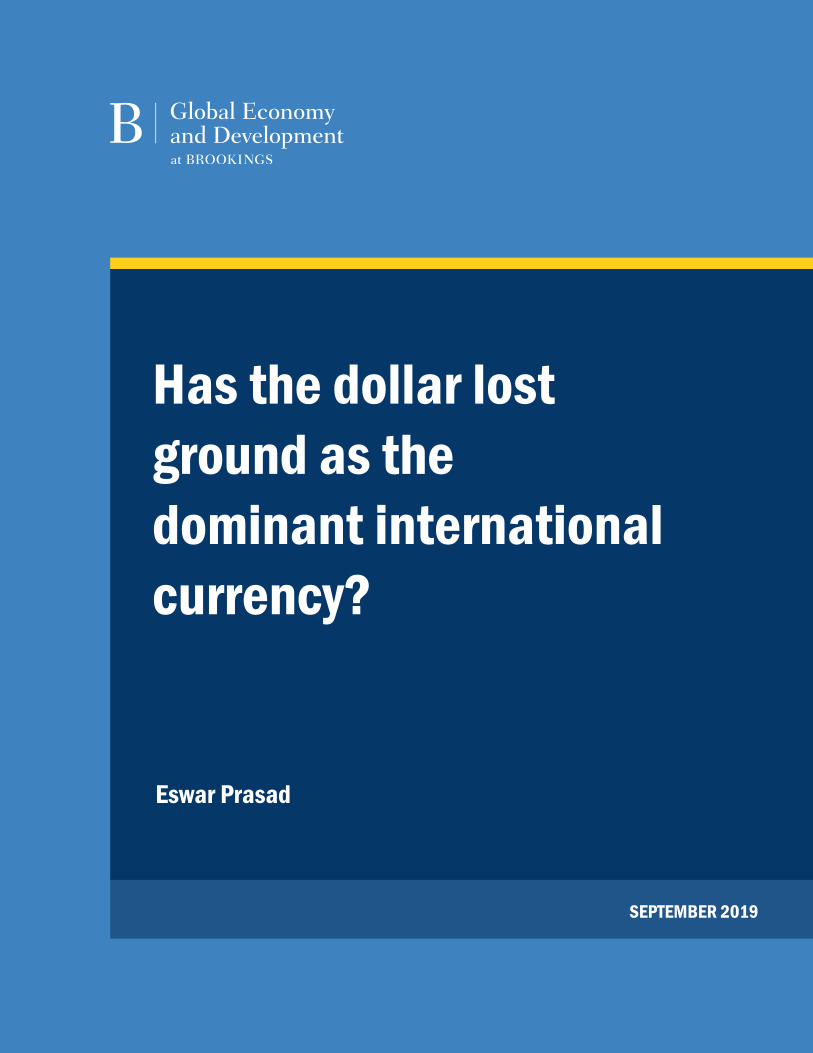
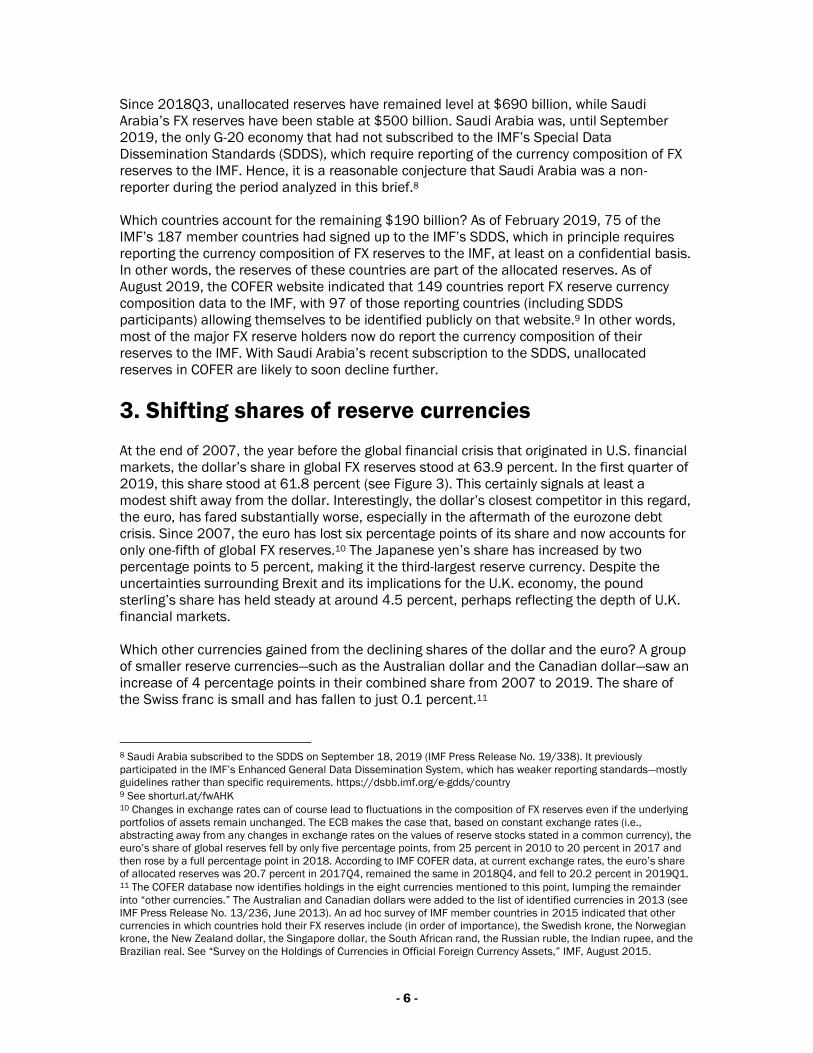
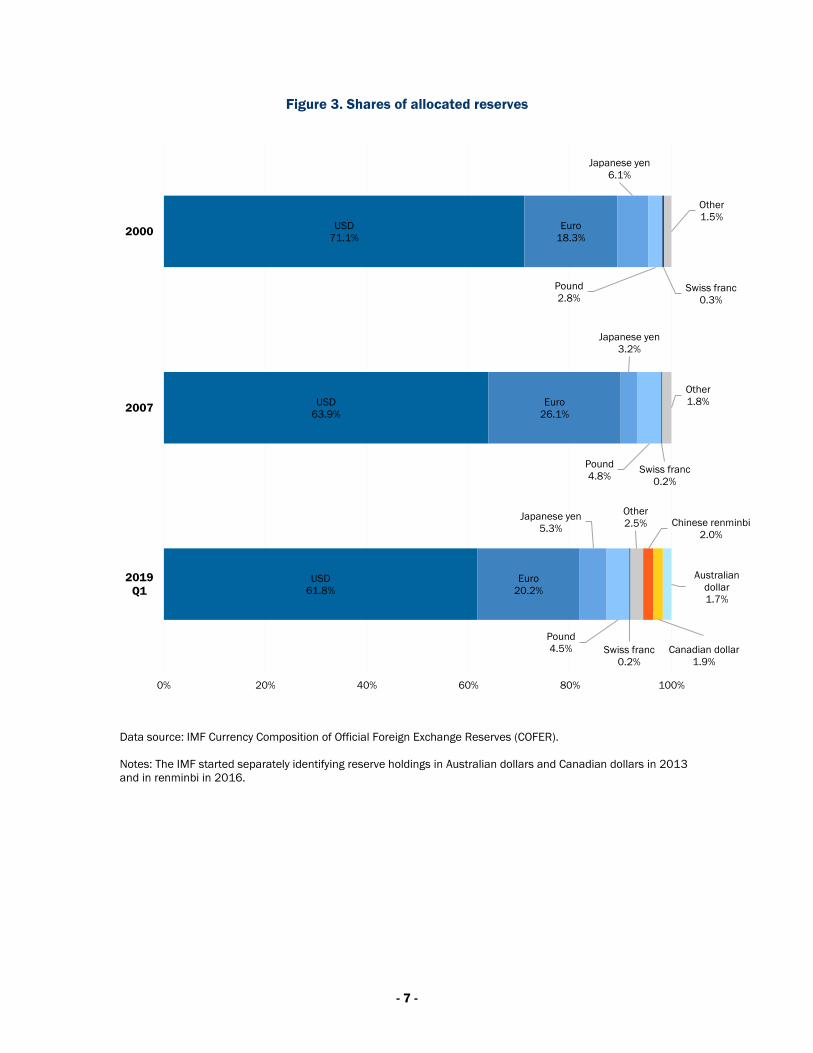
At the end of 2007, the year before the global financial crisis that originated in U.S. financial
markets, the dollar’s share in global FX reserves stood at 63.9 percent. In the first quarter of
2019, this share stood at 61.8 percent (see Figure 3). This certainly signals at least a
modest shift away from the dollar. Interestingly, the dollar’s closest competitor in this regard,
the euro, has fared substantially worse, especially in the aftermath of the eurozone debt
crisis. Since 2007, the euro has lost six percentage points of its share and now accounts for
only one-fifth of global FX reserves.10 The Japanese yen’s share has increased by two
percentage points to 5 percent, making it the third-largest reserve currency. Despite the
uncertainties surrounding Brexit and its implications for the U.K. economy, the pound
sterling’s share has held steady at around 4.5 percent, perhaps reflecting the depth of U.K.
financial markets.
Which other currencies gained from the declining shares of the dollar and the euro? A group
of smaller reserve currencies—such as the Australian dollar and the Canadian dollar—saw an
increase of 4 percentage points in their combined share from 2007 to 2019. The share of
the Swiss franc is small and has fallen to just 0.1 percent.11
8 Saudi Arabia subscribed to the SDDS on September 18, 2019 (IMF Press Release No. 19/338). It previously
participated in the IMF’s Enhanced General Data Dissemination System, which has weaker reporting standards—mostly
guidelines rather than specific requirements. https://dsbb.imf.org/e-gdds/country 9 See shorturl.at/fwAHK 10 Changes in exchange rates can of course lead to fluctuations in the composition of FX reserves even if the underlying
portfolios of assets remain unchanged. The ECB makes the case that, based on constant exchange rates (i.e.,
abstracting away from any changes in exchange rates on the values of reserve stocks stated in a common currency), the
euro’s share of global reserves fell by only five percentage points, from 25 percent in 2010 to 20 percent in 2017 and
then rose by a full percentage point in 2018. According to IMF COFER data, at current exchange rates, the euro’s share
of allocated reserves was 20.7 percent in 2017Q4, remained the same in 2018Q4, and fell to 20.2 percent in 2019Q1. 11 The COFER database now identifies holdings in the eight currencies mentioned to this point, lumping the remainder
into “other currencies.” The Australian and Canadian dollars were added to the list of identified currencies in 2013 (see
IMF Press Release No. 13/236, June 2013). An ad hoc survey of IMF member countries in 2015 indicated that other
currencies in which countries hold their FX reserves include (in order of importance), the Swedish krone, the Norwegian
krone, the New Zealand dollar, the Singapore dollar, the South African rand, the Russian ruble, the Indian rupee, and the
Brazilian real. See “Survey on the Holdings of Currencies in Official Foreign Currency Assets,” IMF, August 2015.
- 7 -
Figure 3. Shares of allocated reserves
Data source: IMF Currency Composition of Official Foreign Exchange Reserves (COFER).
Notes: The IMF started separately identifying reserve holdings in Australian dollars and Canadian dollars in 2013
and in renminbi in 2016.
USD
61.8%
USD
63.9%
USD
71.1%
Euro
20.2%
Euro
26.1%
Euro
18.3%
Japanese yen
5.3%
Japanese yen
3.2%
Japanese yen
6.1%
Pound
4.5%
Pound
4.8%
Pound
2.8%
Swiss franc
0.2%
Swiss franc
0.2%
Swiss franc
0.3%
Other
2.5%
Other
1.8%
Other
1.5%
Chinese renminbi
2.0%
Canadian dollar
1.9%
Australian
dollar
1.7%
0% 20% 40% 60% 80% 100%
2019
Q1
2007
2000
- 8 -
3.1. The renminbi gains ground, then stalls
Then there is the Chinese renminbi, a currency that seemed to have made a dramatic move
onto the global financial stage after 2010, when the Chinese government started opening up
China’s capital account and promoting its currency through a variety of policy measures. In
2016, the IMF gave the renminbi its official imprimatur as a reserve currency, potentially
adding momentum to the progress the renminbi had already made as an international
payment currency.
The renminbi has since come to be a modest player in international finance, now accounting
for about 1.8 percent of global payments intermediated through the SWIFT network.12 As
with other measures of the renminbi’s role as an international currency, this represents a
decline after a rapid rise from just 0.3 percent in 2010 to 2.8 percent in 2015. Other
indicators such as renminbi deposits in Hong Kong and the offshore issuance of renminbi-
denominated bonds (dim sum bonds), all of which were on a rapidly rising trajectory in the
first half of this decade, have fallen off sharply since 2015.
Why did the renminbi’s rise to prominence in international financial markets stall? Starting in
mid-2014, the Chinese economy seemed to be losing steam, domestic and foreign investors
became less confident about the stability of China’s financial markets, and, to compound
these problems, China’s central bank made some missteps as it attempted in August 2015
to reduce its management of the currency’s value. Due to poor communication from the
central bank, this August 2015 policy shift, which was intended to give freer rein to market
forces in determining the renminbi exchange rate, was misinterpreted by financial market
participants as an attempt by the Chinese government to devalue the currency in order to
boost exports.13 These developments led to capital outflows and further currency
depreciation, which the government tried to counteract with capital controls. The
reimposition of capital controls, persistent depreciation pressures on the currency, and the
lack of financial market and other reforms seem to have taken the shine off the renminbi’s
rise.
The renminbi now accounts for 2 percent of global FX reserves, an important but still modest
fraction. Nevertheless, even these modest shares rank the renminbi fifth worldwide as an
international payment currency and as a reserve currency. The currencies ahead of the
renminbi are the dollar, the euro, the Japanese yen, and the British pound sterling. The
renminbi and the Canadian dollar share the fifth rank in both respects.
In short, the renminbi’s rise has been significant—especially for a currency issued by a
country that does not have an open capital account or a market-determined exchange rate—
but uneven. It has not proven to be the key challenger to the dollar’s dominance that some
had expected it to be, particularly in its role as a store of value.
12 See SWIFT RMB Tracker, August 2019. https://www.swift.com/our-solutions/compliance-and-shared-
services/business-intelligence/renminbi/rmb-tracker/document-centre 13 See, for instance, Gabriel Wildau, “Renminbi Devaluation Tests China’s Commitment to Free Markets,” Financial
Times, August 12, 2015.
- 9 -
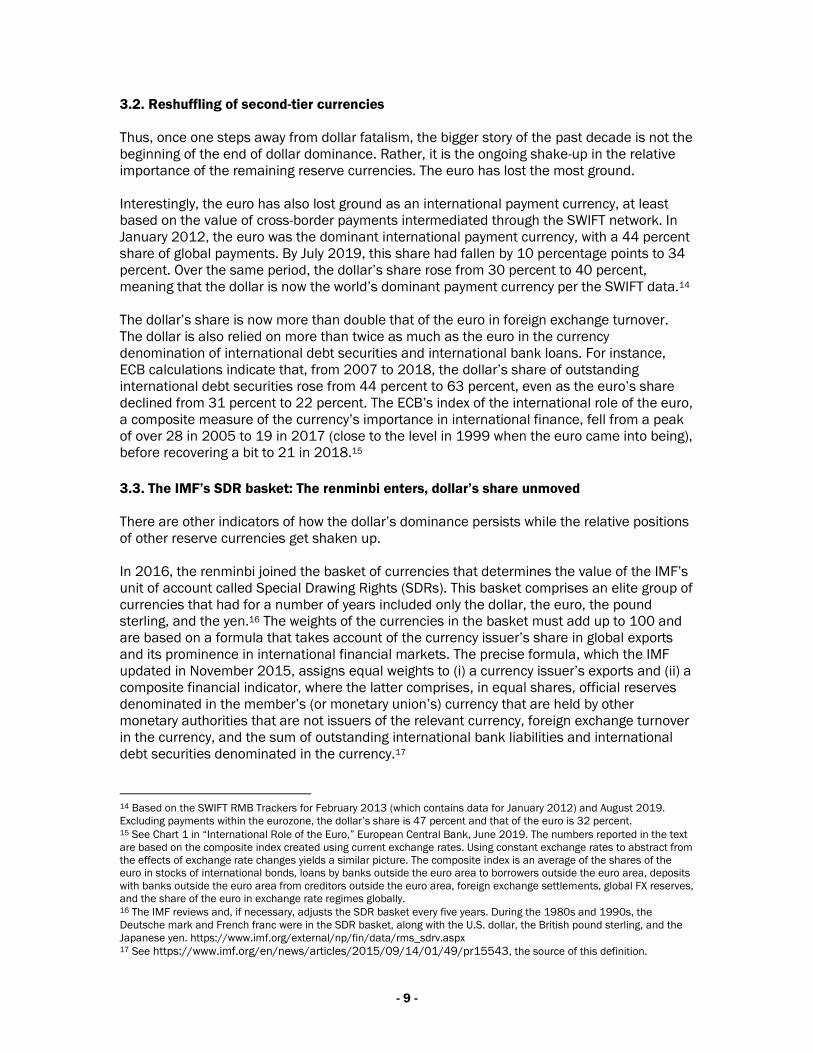
3.2. Reshuffling of second-tier currencies
Thus, once one steps away from dollar fatalism, the bigger story of the past decade is not the
beginning of the end of dollar dominance. Rather, it is the ongoing shake-up in the relative
importance of the remaining reserve currencies. The euro has lost the most ground.
Interestingly, the euro has also lost ground as an international payment currency, at least
based on the value of cross-border payments intermediated through the SWIFT network. In
January 2012, the euro was the dominant international payment currency, with a 44 percent
share of global payments. By July 2019, this share had fallen by 10 percentage points to 34
percent. Over the same period, the dollar’s share rose from 30 percent to 40 percent,
meaning that the dollar is now the world’s dominant payment currency per the SWIFT data.14
The dollar’s share is now more than double that of the euro in foreign exchange turnover.
The dollar is also relied on more than twice as much as the euro in the currency
denomination of international debt securities and international bank loans. For instance,
ECB calculations indicate that, from 2007 to 2018, the dollar’s share of outstanding
international debt securities rose from 44 percent to 63 percent, even as the euro’s share
declined from 31 percent to 22 percent. The ECB’s index of the international role of the euro,
a composite measure of the currency’s importance in international finance, fell from a peak
of over 28 in 2005 to 19 in 2017 (close to the level in 1999 when the euro came into being),
before recovering a bit to 21 in 2018.15
3.3. The IMF’s SDR basket: The renminbi enters, dollar’s share unmoved
There are other indicators of how the dollar’s dominance persists while the relative positions
of other reserve currencies get shaken up.
In 2016, the renminbi joined the basket of currencies that determines the value of the IMF’s
unit of account called Special Drawing Rights (SDRs). This basket comprises an elite group of
currencies that had for a number of years included only the dollar, the euro, the pound
sterling, and the yen.16 The weights of the currencies in the basket must add up to 100 and
are based on a formula that takes account of the currency issuer’s share in global exports
and its prominence in international financial markets. The precise formula, which the IMF
updated in November 2015, assigns equal weights to (i) a currency issuer’s exports and (ii) a
composite financial indicator, where the latter comprises, in equal shares, official reserves
denominated in the member’s (or monetary union’s) currency that are held by other
monetary authorities that are not issuers of the relevant currency, foreign exchange turnover
in the currency, and the sum of outstanding international bank liabilities and international
debt securities denominated in the currency.17
14 Based on the SWIFT RMB Trackers for February 2013 (which contains data for January 2012) and August 2019.
Excluding payments within the eurozone, the dollar’s share is 47 percent and that of the euro is 32 percent. 15 See Chart 1 in “International Role of the Euro,” European Central Bank, June 2019. The numbers reported in the text
are based on the composite index created using current exchange rates. Using constant exchange rates to abstract from
the effects of exchange rate changes yields a similar picture. The composite index is an average of the shares of the
euro in stocks of international bonds, loans by banks outside the euro area to borrowers outside the euro area, deposits
with banks outside the euro area from creditors outside the euro area, foreign exchange settlements, global FX reserves,
and the share of the euro in exchange rate regimes globally. 16 The IMF reviews and, if necessary, adjusts the SDR basket every five years. During the 1980s and 1990s, the
Deutsche mark and French franc were in the SDR basket, along with the U.S. dollar, the British pound sterling, and the
Japanese yen. https://www.imf.org/external/np/fin/data/rms_sdrv.aspx 17 See https://www.imf.org/en/news/articles/2015/09/14/01/49/pr15543, the source of this definition.
- 10 -
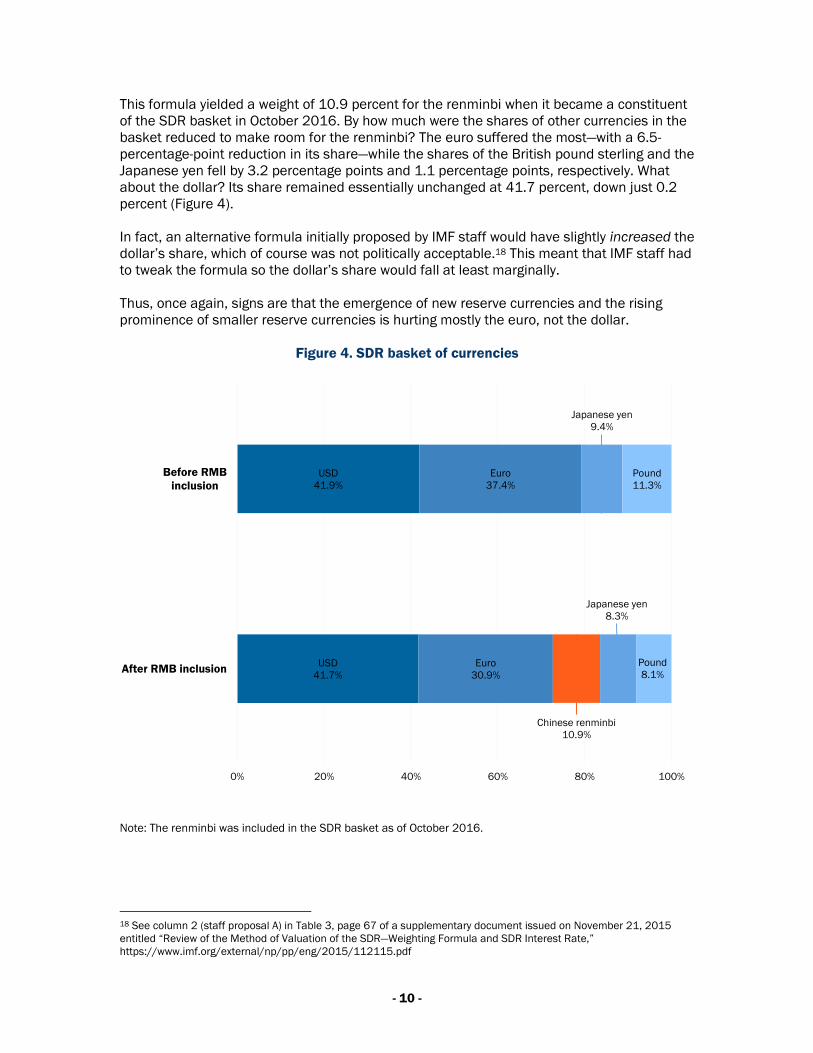
This formula yielded a weight of 10.9 percent for the renminbi when it became a constituent
of the SDR basket in October 2016. By how much were the shares of other currencies in the
basket reduced to make room for the renminbi? The euro suffered the most—with a 6.5-
percentage-point reduction in its share—while the shares of the British pound sterling and the
Japanese yen fell by 3.2 percentage points and 1.1 percentage points, respectively. What
about the dollar? Its share remained essentially unchanged at 41.7 percent, down just 0.2
percent (Figure 4).
In fact, an alternative formula initially proposed by IMF staff would have slightly increased the
dollar’s share, which of course was not politically acceptable.18 This meant that IMF staff had
to tweak the formula so the dollar’s share would fall at least marginally.
Thus, once again, signs are that the emergence of new reserve currencies and the rising
prominence of smaller reserve currencies is hurting mostly the euro, not the dollar.
Figure 4. SDR basket of currencies
Note: The renminbi was included in the SDR basket as of October 2016.
18 See column 2 (staff proposal A) in Table 3, page 67 of a supplementary document issued on November 21, 2015
entitled “Review of the Method of Valuation of the SDR—Weighting Formula and SDR Interest Rate,”
https://www.imf.org/external/np/pp/eng/2015/112115.pdf
USD
41.9%
USD
41.7%
Euro
37.4%
Euro
30.9%
Chinese renminbi
10.9%
Japanese yen
9.4%
Japanese yen
8.3%
Pound
11.3%
Pound
8.1%
0% 20% 40% 60% 80% 100%
Before RMB
inclusion
After RMB inclusion
- 11 -
3.4. U.S. is dominant provider of net reserves
Major advanced economy central banks and, now that the renminbi is a reserve currency,
the People’s Bank of China (PBC) provide reserve assets to foreign central banks. A central
bank does not, of course, count the currency it issues as part of its reserves—euros are
assets on the balance sheets of non-eurozone central banks but are a liability on the ECB’s
balance sheet.
The Fed holds a minimal amount of FX reserves but all of the other reserve currency
economies hold significant amounts of such reserves on their central banks’ balance sheets.
The other central banks all tend to intervene in foreign exchange markets—something that
the U.S. has not done since the dollar went off the gold standard (but which Trump has now
threatened to do to unilaterally weaken the dollar19).
Which central banks provide more reserves to foreign countries than they themselves hold?
In other words, how much in net reserves do the major reserve currency central banks supply
to the rest of the world?
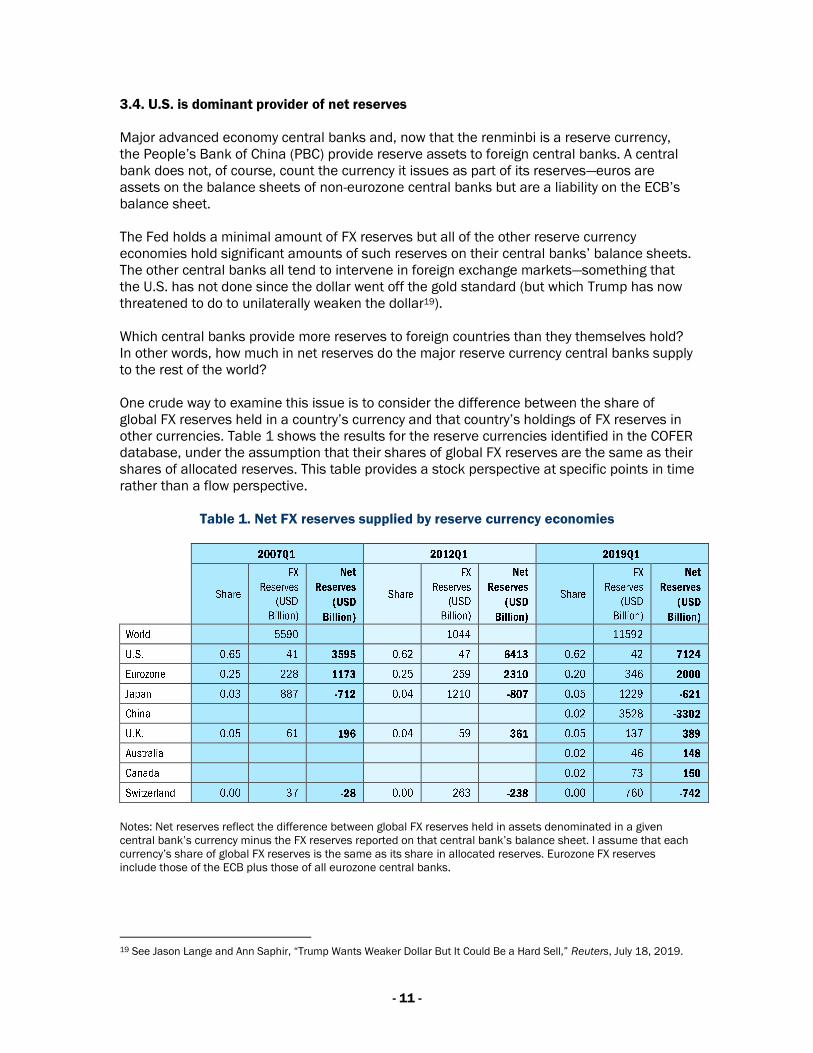
One crude way to examine this issue is to consider the difference between the share of
global FX reserves held in a country’s currency and that country’s holdings of FX reserves in
other currencies. Table 1 shows the results for the reserve currencies identified in the COFER
database, under the assumption that their shares of global FX reserves are the same as their
shares of allocated reserves. This table provides a stock perspective at specific points in time
rather than a flow perspective.
Table 1. Net FX reserves supplied by reserve currency economies
Notes: Net reserves reflect the difference between global FX reserves held in assets denominated in a given
central bank’s currency minus the FX reserves reported on that central bank’s balance sheet. I assume that each
currency’s share of global FX reserves is the same as its share in allocated reserves. Eurozone FX reserves
include those of the ECB plus those of all eurozone central banks.
19 See Jason Lange and Ann Saphir, “Trump Wants Weaker Dollar But It Could Be a Hard Sell,” Reuters, July 18, 2019.
- 12 -
The results are again striking. In 2019, only five of the eight reserve currency central banks
identified separately in the COFER database are net providers of reserves. China is, of
course, a major net demander rather than supplier of reserves. Japan, whose central bank
issues the third-most-prominent reserve currency, is a net demander as well, as is
Switzerland.
In 2007, the U.S. provided about $2.4 trillion more in net reserve assets to the rest of the
world than the eurozone. By 2019Q1, the difference had doubled to $5 trillion. The provision
of net reserves by the U.S. to the rest of the world, which now exceeds $7 trillion, is more
than 3.5 times that of the eurozone.
Thus, in net terms, the U.S. again dominates the provision of FX reserves to the world and to
an even greater extent than suggested by the identified currency composition of global FX
reserves.
4. China’s reserves
In 2000, China held $166 billion in FX reserves, accounting for 9 percent of global FX
reserves. By mid-2014, its stockpile had grown to just shy of $4 trillion, one-third of global FX
reserves, largely because of the Chinese central bank’s intervention in foreign exchange
markets to prevent rapid appreciation of the renminbi that ought to have resulted from the
large current account (trade) and capital account surpluses that China was running for much
of this period.
Then things changed. Starting in the summer of 2014, concerns about the Chinese economy,
plunging stock markets, the corruption crackdown, and capital account liberalization
measures that created more channels enabling capital to flow out of China all came
together, prompting a surge of capital outflows that created depreciation pressures on the
renminbi. With the prospects of rapid currency depreciation generating more capital outflows
(and smaller inflows from foreign investors), the Chinese central bank stepped in to stanch a
capital outflow-currency depreciation spiral. It did this by intervening in foreign exchange
markets, but this time selling its FX reserves to prevent too much and too rapid depreciation
of the renminbi.
By the end of 2016, China’s FX reserves had shrunk to $3 trillion. Since then, the stock of
China’s FX reserves has held relatively steady, in a range of around $3 to $3.2 trillion.
The stock of FX reserves, seen as representing China’s wealth, has been a politically
sensitive issue for the central bank and the government. This was particularly true during the
period when China was accumulating reserves month after month, but remains an issue
even now that the stock of reserves is no longer rising but remains large.
The first concern was that the reserve accumulation, a large share of which was presumed to
be going into dollar reserves, was helping to finance U.S. budget deficits at a time when the
U.S. was castigating China for its trade and currency policies. The second was that the
reserves were earning low rates of return because government bonds issued by the U.S. and
other major advanced economies, which are typical investment vehicles for FX reserves,
have yielded very low interest rates since the global financial crisis.
In light of longstanding U.S.-China frictions on economic and political issues, China’s holdings
of U.S. government bonds have been a particularly sensitive issue within and outside China.

- 13 -
To this day, financial news reporting tends to read enormous significance into purported
purchases or sales of U.S. Treasuries by China’s central bank.
4.1. China’s holdings of U.S. Treasury securities
Much of the reporting about China’s dollar-denominated FX reserves has been based on data
from the Treasury International Capital (TIC) System, maintained by the U.S. Treasury. The
key table in that database is “Major Foreign Holders of Treasury Securities.” The data
reported in this table, which include holdings of foreign private entities but largely reflect
holdings of central banks and other official agencies, receive considerable attention. The
table is updated every month and every increase or dip in the numbers for China becomes
vested with enormous significance in news reportage.20 Yet, as will be demonstrated below,
the TIC data reflect just over half of China’s holdings of dollar-denominated FX reserves.
This gap in the TIC data exists because reserve purchases by a country’s central bank or
private entities that are undertaken through or held in accounts of financial institutions
based in other countries are often characterized as holdings of those countries rather than of
the source countries. As indicated in the footnotes to the TIC table: “The data in this table are
collected primarily from U.S.-based custodians and broker-dealers. Since U.S. securities held
in overseas custody accounts may not be attributed to the actual owners, the data may not
provide a precise accounting of individual country ownership of Treasury securities.” This
issue had been recognized for a long time but, in the absence of any other publicly-available
data and given the enormous interest in China’s purchases or sales of U.S. Treasuries, the
TIC data receive far more attention than ought to be the case.
The veil over China’s reserve holdings has now been lifted—albeit partially and with a
considerable lag. In July 2019, China for the first time indicated how much of its FX reserves
have been held in dollar-denominated assets (there is no breakdown provided for assets
denominated in other currencies). The data appeared in the 2018 annual report of the State
Administration of Foreign Exchange (SAFE), which manages those reserves.
The report indicates that dollar reserves accounted for 79 percent of China’s FX reserves in
1995 and that this proportion had fallen to 58 percent in 2014. The report highlights that
this share was lower than the share of global FX reserves held in dollars in 2014. SAFE
certainly has more recent data available, so it appears that these two years are chosen
carefully to make two points: (i) the dollar is now less prominent in China’s reserve portfolio
than it was two decades ago and (ii) the portfolio is more diversified away from the dollar
than the global average.
The data in the report help put the TIC data in proper perspective. In December 2014, China
held $3.84 trillion in FX reserves, so its reported official holdings of dollar reserves amounted
to $2.23 trillion. According to TIC data, China held $1.24 trillion in U.S. dollar-denominated
securities at that time. Thus, the TIC coverage amounted to only 56 percent of China’s actual
dollar reserves or, to put it another way, the ratio of total dollar reserves relative to the TIC
data was 1.8. Clearly, with nearly half of China’s dollar reserves not covered by the TIC data,
20 See, for instance, Joe Rennison and Colby Smith, “China Dumps U.S. Treasuries at Fastest Pace in Two Years,”
Financial Times, May 15, 2019; Gertrude Chavez-Dreyfuss, “China Holdings of U.S. Treasuries in April Skid to Nearly
Two-Year Low,” Reuters, June 17, 2019.
- 14 -
month-to-month variations in the TIC data should not be interpreted as reflecting overall net
purchases or sales of dollar-denominated securities in China’s reserve portfolio.21
Chinese foreign assets of course include other dollar-denominated securities, not just U.S.
Treasuries. Another TIC data table on foreign ownership of financial assets in the U.S. shows
that, in May 2019, Chinese residents held $214 billion in U.S. agency bonds, $14 billion in
U.S. corporate and other bonds, and $178 billion in U.S. stocks.22 At the end of 2011, the
earliest year for which data for China are available in this database, the corresponding
figures were $237 billion, $18 billion, and $189 billion, respectively. While these numbers
have fluctuated since 2011, there is no discernible trend. Moreover, it is not obvious from
this data source whether the holdings are part of the central bank reserves (which alone
constitute FX reserves) or holdings of other Chinese government agencies, corporations, or
households. Central banks tend to be conservative and hold only safe and liquid financial
assets in their reserve portfolios. Hence, these alternative U.S. assets and other non-U.S.
dollar-denominated reserves are likely to constitute only a minimal share of China’s FX
reserves. I will abstract from them in the calculations that follow.
Assuming that the dollar’s share in China’s reserve portfolio has not changed since 2014
implies that China held about $1.8 trillion in dollar-denominated assets as of July 2019 (FX
reserves of $3.1 trillion multiplied by 0.58), a significantly higher number than the $1.1
trillion in U.S. Treasury security holdings attributed to China in the TIC data. However,
consider an alternative assumption—that the ratio of China’s overall holdings of dollar-
denominated securities to those reported in the TIC data has remained at 1.8. Then the
implied amount of dollar-denominated reserves would be just over $2 trillion ($1.11 trillion
per the TIC report for July 2019 multiplied by a factor of 1.8) out of a total of $3.1 trillion,
yielding a dollar share of 64.5 percent. While this is a rough calculation, the point is that the
share of dollar-denominated assets in China’s reserve portfolio has probably risen back up
since 2014, perhaps explaining once again why the 2018 annual report contains data for
2014 rather than more recent data, which SAFE surely has.23
To summarize the foregoing discussion, so long as China has a large stock of FX reserves, it
remains stuck holding a large volume of U.S. Treasury securities for want of better
alternatives.
21 Brad Setser’s blog at the Council on Foreign Relations provides additional interesting details on some of the issues
discussed here. https://www.cfr.org/blog/Setser 22 https://ticdata.treasury.gov/Publish/slt1d.txt 23 A reasonable counter-argument is that China’s sales of dollar-denominated securities during 2015-2016, when it was
trying to limit the renminbi’s depreciation against the dollar, could have been conducted mostly through financial
institutions in other countries rather than through its direct holdings as reported in the TIC data. In other words, the ratio
of overall dollar reserves to TIC holdings could have fallen rather than staying level at around 1.8. My conjecture is that,
if this were true and if the share of dollar assets in China’s reserves had remained flat or continued to decline, SAFE
would have had an incentive to report the share of dollar assets in its reserves in 2018 rather than in 2014.

- 15 -
4.2. China’s official external assets: Returns and diversification
As an aside, and in the context of the earlier discussion about the political sensitivity of
China’s reserve holdings, the SAFE annual report indicates that China earned an average
annual return of 3.68 percent on its reserve portfolio over the 2005-2014 period.
(Interestingly, the average yield on U.S. ten-year government securities over this period was,
at 3.35 percent, not far from this figure.) The report does not state whether the returns are
reported in dollar or renminbi terms but, since all external financial assets in the report are in
U.S. dollars, it is likely that the returns are also in dollar terms. The renminbi appreciated
significantly over this ten-year period—about 25 percent relative to the dollar.24 Hence, the
cumulative return in renminbi terms was substantially lower.
The returns data suggest that most of China’s FX reserves, as would be expected, are held in
advanced-economy government securities. The Chinese government has used other
avenues, such as the creation of a sovereign wealth fund, to generate better returns on its
external assets. The China Investment Corporation (CIC) was set up in September 2007 “. . .
as a vehicle to diversify China’s foreign exchange holdings and seek maximum returns for its
shareholder within acceptable risk tolerance.” Assets managed by the CIC, which were
valued at $200 billion at its inception, are now about estimated at about $950 billion.25 Even
though the CIC is a government organization, its assets are not counted as part of official
reserves, which are limited to central bank external assets.
In its 2017 annual report, the CIC indicates that its net cumulative annualized return from
2007 to 2014 was 5.66 percent in dollar terms, certainly better than the returns on SAFE’s
reserves holdings.26 But even the CIC holds about 16 percent of its portfolio in fixed-income
securities and more than half of that is in advanced-economy government bonds, which
probably includes a healthy share in U.S. Treasury securities. This, too, implies that the TIC
data underestimate China’s official holdings of U.S. Treasuries.
5. Gold
There is a longstanding notion that the Fed’s actions to support the U.S. economy in the
aftermath of the global financial crisis through conventional and unconventional monetary
policy measures (low interest rates, quantitative easing) and rising U.S. budget deficits
should have eroded confidence in the U.S. dollar, especially U.S. Treasury securities, as a
store of value. More recently, news reports have highlighted central bank purchases of gold,
suggesting that this represents a shift away from dollar reserves.27 Such a shift would
perhaps also signal a shift away from FX reserves more broadly. (SDR balances at the IMF,
the other component of a country’s gross international reserves, cannot be changed
unilaterally by a country; additional SDR allocations have to be agreed to by the broader IMF
membership and would be allocated based on country quotas determined by the IMF.)
24 The USD-CNY exchange rate was 8.28 on January 3, 2005 and 6.20 on December 31, 2014. This implies a 25
percent appreciation of the renminbi relative to the dollar (33 percent if calculated as dollar depreciation relative to the
renminbi). 25 https://www.swfinstitute.org/profile/598cdaa50124e9fd2d05ac89 26 The net cumulative annualized return from 2007 to 2017 was 5.94 percent according to Table 7 in the 2017 annual
report, which states explicitly that the returns are reported in U.S. dollar terms. Since 2014, when the renminbi has
depreciated relative to the dollar, returns in renminbi terms will of course be higher than those in dollar terms. CIC
annual reports are available at: http://www.china-inv.cn/chinainven/Media/Annual_Report.shtml 27 See, for instance: Harry Dempsey, “Central Banks Make Record $15.7 bn Gold Purchases,” Financial Times, August 1,
2019; Elena Mazneva, “Central Bank’s Gold-Buying Spree is Far From Over, Poll Shows,” Bloomberg, July 19, 2019.

- 16 -
Reasonable asset managers, including central banks, should of course seek diversification of
their asset holdings subject to their tolerance of risk. Official reserve managers tend to
emphasize three criteria in making their investment decisions—safety, liquidity, and yield. The
first two characteristics usually take precedence over yield. As reserves grow large and as
concerns about U.S. economic and other policies take hold, it seems reasonable that reserve
managers would seek to diversify into other assets such as gold, even if such investments
offer limited safety and liquidity. But recent gold purchases by central banks, while large in
absolute amounts, pale into insignificance in the broader evolution of the composition of
international reserves.
This point can be illustrated using China as an example. Several news reports have
speculated that the Chinese central bank’s purchases of gold are motivated by its desire to
diversify away from dollar reserves, particularly in the context of the U.S.-China trade war.
This is technically correct but misses the big picture that, even if China’s gold reserves were
underestimated by two or three times, they would still be minuscule relative to China’s dollar
reserves.
5.1. China diversifying from dollars into gold?
In July 2019, China’s total official reserve assets amounted to just over $3.2 trillion, of which
$3.1 trillion (97 percent of the total) was held in the form of FX reserves. Gold holdings
amounted to about $89 billion while China’s allocation of SDRs and its reserve position at
the IMF came to $19 billion.
China tripled its reported official gold holdings from 600 metric tons in 2008 to 1,852 metric
tons in 2018. The market value of those reserves more than quadrupled (by 4.5 times, to be
precise), from $17 billion in 2008 to $76 billion in 2018.
During the first seven months of 2019, China added about 85 metric tons to its official gold
holdings. With gold prices rising, the value of China’s gold holdings stood at $94 billion as of
mid-September 2019, up $18 billion from its end-of-2018 level.
Coming amid rising trade tensions with the U.S., the 5 percent increase in China’s gold stock
and the 24 percent increase in the value of its official gold holdings during 2019 have been
interpreted as a sign of China’s attempting to diversify its reserve holdings away from U.S.
dollars. If this interpretation was indeed correct, China has a long way to go.
Gold now accounts for 3 percent of China’s gross international reserves. From a global
financial market perspective, and especially relative to its overall international reserves, the
$18 billion increase in the value of China’s gold reserves during 2019 is trivial; it barely
registers as a shift in the composition of China’s overall reserves. Assuming that China still
holds 58 percent of its FX reserves in dollar-denominated assets, the value of those assets in
July 2019 was $1.8 trillion. So, the value of its gold reserves, $94 billion, is a mere one-
twentieth of that of China’s dollar-denominated reserves.
- 17 -
5.2. Russia attempts to break free from the dollar
Among the major global central banks, Russia’s has taken the most aggressive steps to
diversify its reserves away from dollar assets. First, as the U.S. tightened financial sanctions
on Russia during 2018, the Central Bank of Russia sold about $100 billion in U.S. dollar-
denominated assets and shifted into euro- and renminbi-denominated assets.28 The share of
the dollar in Russia’s total reserves fell in half during 2018, from 46 percent to 23 percent,
while the share of the euro rose by 10 percentage points to 32 percent and the renminbi’s
share jumped from 3 percent to 14 percent.29
Second, Russia’s central bank has increased its purchases of gold. In July 2019, Russia’s
gold reserves had a value of $102 billion, roughly one-fifth of its total international reserves
of $520 billion.30 By contrast, in December 2012, when the U.S. imposed the first round of
financial sanctions against Russia, only 10 percent of Russia’s reserves of $538 billion was
held in gold. The Central Bank of Russia now holds close to 2,200 metric tons of gold, more
than is held any other emerging market central bank.
5.3. The bigger picture
What happened to U.S. interest rates when a major central bank disposed of nearly $100
billion in dollar reserves, which were presumably held in the form of U.S. Treasury securities?
The yield on the 10-year U.S. Treasury note did rise from 2.5 percent at the beginning of
2018 to 3.2 percent by early fall. By the end of 2018, though, it had fallen back to 2.7
percent and has now collapsed to under 2 percent. Although central bank purchases have
not been an important driving factor for Treasury yields for some years now, it is still
noteworthy that the prospect of foreign central banks diversifying away from dollars has
hardly led to a panicked sell-off of Treasuries (a more rigorous counterfactual exercise is of
course needed to establish this point). In fact, foreign official holdings of U.S. Treasury
securities, after declining slightly during 2018 (down $73 billion, from $4.02 trillion in
December 2017 to $3.95 trillion in December 2018), have increased by $182 billion through
July 2019 (to a level of $4.13 trillion).31
It is striking that, so far during 2019—amid all the trade wars, geopolitical tensions, and
economic and political recriminations against the U.S.—foreign central banks in aggregate
have been net purchasers of U.S. Treasury securities.
As for gold, the share of gold reserves in total international reserves has actually been
relatively stable, in the 10-12 percent range, since 2000, with some sizable short-term
fluctuations attributable mainly to swings in gold prices. At the end of 2007, gold accounted
for 10.6 percent of total international reserves. Coincidentally, perhaps, gold’s share was
exactly the same in the first quarter of 2019. Moreover, for all the talk of the Chinese,
Russian, and other central banks buying up gold, this share was unchanged from the first
quarter of 2017, suggesting that gold is not exactly taking over as a major reserve asset.
It is also worth keeping in mind that a substantial proportion of gold reserves is held by major
advanced-economy central banks and international financial institutions. The total gold
28 See Max Seddon, “Russia Ditched Dollar Holdings to Foil U.S. Sanctions,” Financial Times, January 10, 2019. 29 https://www.cbr.ru/eng/publ/obzor/ 30 https://www.cbr.ru/eng/hd_base/mrrf/mrrf_m/ 31 See https://ticdata.treasury.gov/Publish/mfh.txt for the latest TIC data and
https://ticdata.treasury.gov/Publish/mfhhis01.txt for historical data
- 18 -
reserves of the Bank for International Settlements, the Bank of England, the Bank of Japan,
the ECB, the Federal Reserve, the IMF, and the Swiss National Bank amounted to $1 trillion
in 2019Q1—equivalent to 71 percent of the total stock of world gold reserves of $1.4 trillion
identified by the World Gold Council. One significant shift is that this share, which comprised
84 percent of total world gold reserves in 2000, has fallen gradually in the last two decades,
including a 2-percentage-point fall in the past two years. Thus, while the absolute amounts of
gold holdings might not be large relative to their share in overall international reserves, many
of the non-reserve currency central banks around the world do seem to be adding to their
gold reserves at the margin.
6. Prognosis for the dollar’s role in international
finance
Central banks around the world are undoubtedly looking for ways to diversify their FX reserve
portfolios and their recent purchases reflect this factor rather than any fundamental shift in
the composition of global reserves. Relative to the stock of FX reserves that now total more
than $11 trillion dollars, the recent surge in central bank purchases of gold amount to only a
minor diversification of central bank reserve portfolios.
The dollar’s share of global FX reserves has fallen modestly, by about 2 percent, since 2007.
In contrast, the euro’s share has fallen substantially since 2007 and, given the ongoing
economic difficulties and political tensions in the eurozone, it is difficult to envision the euro
posing much of a challenge to the dollar’s dominance as a reserve currency or even as an
international payment currency.
Does the renminbi pose a realistic challenge to the dollar in the long run? China’s large and
rising weight in global GDP and trade will no doubt stimulate greater use of the renminbi in
the denomination and settlement of cross-border trade and financial transactions. The
renminbi’s role as an international payment currency will, however, be constrained by the
Chinese government’s unwillingness to free up the capital account and to allow the
currency’s value to be determined by market forces. The currency’s role in global finance will
ultimately be determined by the degree of commitment that Chinese President Xi Jinping’s
government makes to economic and financial market reforms.32
Nevertheless, on account of China’s clout as a major trading partner for many other
countries, and its especially large role in global commodity trade, the renminbi is likely to
make further, although very gradual, progress as an international payment currency.
As the costs and complications of trading in currencies such as the renminbi fall, there is
likely to be a modest erosion in the roles of traditional heavyweight currencies, such as the
dollar and the euro, in pricing or mediating the settlement of international transactions. It is
not unreasonable to envision a world in which the overwhelming share of commodity
contracts, especially for oil, are no longer denominated in dollars alone but instead involve a
broader range of currencies, including the renminbi.33 Through its policy actions and through
32 See Eswar Prasad, Gaining Currency: The Rise of the Renminbi, Oxford University Press, 2016. 33 China launched renminbi-denominated oil futures contracts in March 2018. Despite initial concerns about the viability
of these contracts, trading volume has picked up although much of the trading in these contracts has been by Chinese
rather than foreign players. See Anjli Raval, “China’s Petroyuan Dream Needs Foreign Help,” Financial Times, May 8,
2018, and Shen Hong, “China’s Oil Futures Give New York and London a Run for Their Money,” Wall Street Journal,
March 27, 2019.
- 19 -
currency and trading pacts with countries such as Russia, China’s government can certainly
add some momentum to the process of raising the renminbi’s prominence as an
international payment and settlement currency.
A greater role for the renminbi is likely to result in a significant realignment of the relative
positions of global payment currencies. The dollar’s position as the dominant international
currency may be eroded slightly but the bigger effects are likely to be on the second-tier
currencies, such as the euro and the British pound sterling, which could face a significant
decline in importance. The best-case scenario for the euro, as summarized in a recent ECB
report, is that “The euro [remains] unchallenged as the second most important currency in
the international monetary system.”34
6.1. U.S. institutions under stress
The dollar’s role as a global currency could in principle be adversely affected by other
countries’ desire to reduce their dealings with U.S. financial institutions. Under the Trump
administration, the U.S. is increasingly seen as an unreliable and untrustworthy partner in
trade, military, and other agreements, whether bilateral or multilateral. This has damaged
U.S. international credibility and also sown fear that Trump could wield the dollar as a
weapon of control over other countries. Consequently, rather than using the dollar and U.S.
financial institutions, countries like China and Russia are setting up their own payment
systems and channels that bypass the U.S. The effects of such changes are likely to be
modest in the short run, however, given the overwhelming dominance of the dollar in global
financial markets. For this reason, neither the euro nor the renminbi is likely to pose any
serious challenge.
Even if the dollar’s dominance as the medium of exchange for international transactions
were to wane, it will remain unparalleled as a safe haven.35 Foreign investors, including
central banks, have shown no signs of forsaking their dollar assets. The sheer size of U.S.
government and corporate bond markets, which dwarf those of any other major economy, is
a key factor.36 But it is also a matter of trust.
The institutions that engender and maintain the trust of both domestic and foreign investors
in U.S. financial markets and dollar assets include an open and transparent system of
democratic government, along with an institutionalized system of checks and balances.37
This framework needs to be underpinned by trusted public institutions, especially a central
bank free from direct political interference with the rule of law administered by an
independent judiciary. Trust in U.S. institutions is why, despite the prospect of rising
government debt levels and all the economic uncertainty unleashed by Trump, the dollar
remains dominant.
The dollar’s role as a safe haven currency is not under imminent threat, although the Trump
administration’s overt and covert steps to erode America’s institutional framework could
34 https://www.ecb.europa.eu/pub/ire/html/ecb.ire201906~f0da2b823e.en.html#toc1 For a good discussion of
why the euro has not lived up to its initial promise, see Benoît Cœuré, “The Euro’s Global Role in a Changing World: A
Monetary Policy Perspective,” ECB, February 2019. 35 For a different perspective, see Barry Eichengreen, Arnaud Mehl, and Livia Chitu, How Global Currencies Work: Past,
Present, and Future, Princeton University Press, 2017. 36 See, for instance, Zhiguo He, Arvind Krishnamurthy, and Konstantin Milbradt, “What Makes U.S. Government Bonds
Safe Assets,” American Economic Review, May 2016. 37 Eswar Prasad, The Dollar Trap: How the Dollar Tightened Its Grip on Global Finance, Princeton University Press, 2016.

- 20 -
certainly increase foreign investors’ wariness.38 U.S. institutions have withstood the test of
time, though taking them for granted could prove costly. When the U.S. political system has
come under severe stress in the past, a free press, backed by an independent judiciary, has
contributed to a self-correcting mechanism. All of these institutions are under constant
attack by Trump, aided and abetted by Republicans in Congress. This could lead to a gradual
erosion of the dollar’s dominance as the global safe haven currency, but not its displacement
insofar as, realistically, there are no other currencies backed by the combination of the
financial market depth and still-robust institutional framework of the U.S.
6.2. New alternatives to the dollar
Facebook’s proposal to create a new cryptocurrency called Libra and Bank of England
Governor Mark Carney’s August 2019 speech calling for an alternative to the dollar as a
global safe haven asset have generated additional discussion of the erosion of the dollar’s
dominance.39
Libra is envisioned as a “stablecoin” that promotes more efficient and low-cost payments
within and across countries and that is fully backed by a reserve of real assets. According to
the Facebook white paper, this reserve will consist of a “collection of liquid, low-volatility
assets, including bank deposits and government securities in currencies from stable and
reputable central banks.” Although Facebook has provided no further details of the currency
composition of this basket of assets, it is likely that the basket will resemble the current
composition of global FX reserves. In fact, given (i) the relative thinness of the bond markets
of core eurozone economies (such as Austria, France, Germany, and the Netherlands)
compared with those of the U.S. and (ii) concerns about Chinese capital controls, the Libra
reserve could end up being disproportionately weighted towards dollar assets. This could
reinforce the reserve currency status of the dollar although, if in fact Libra were to gain
traction in global payments, it could add to other factors that might eventually reduce the
dollar’s dominance as an invoicing and payment currency.
Carney has proposed the creation of a synthetic hegemonic currency (SHC) that would be
“provided by the public sector, perhaps through a network of central bank digital currencies.”
The SHC is seen as serving as an invoicing and payment currency whose widespread use
could eventually lead central banks, investors, and financial market participants to perceive
the currencies that comprise its basket as reliable reserve assets, thereby displacing the
dollar’s dominance in international trade and finance, including in credit markets.
Presumably this basket would tilt away from the dollar to achieve this objective. For all of the
intentions to break free of the dollar and the consensus over problems caused by a unipolar
international monetary system, however, the viability of an SHC is likely to be limited. A
number of factors suggest this conclusion, including the current parlous state of multilateral
cooperation, concerns about the economic and political stability of most of the major
economies in the world, and the relatively smaller size and lower liquidity of financial markets
outside the U.S. and in international transactions that do not involve the dollar.
While change might eventually come, the recent strengthening of certain aspects of the
dollar’s dominance in global finance suggests that such change could be far off into the
38 See Eswar Prasad, “How Trump Could Fatally Weaken the Dollar,” New York Times, October 15, 2018 and “America
Beware: Dollar Supremacy Is Not Forever,” Financial Times, May 20, 2018. 39 Mark Carney, “The Growing Challenges for Monetary Policy in the Current International Monetary and Financial
System,” Jackson Hole Symposium Speech, August 2019. https://www.bankofengland.co.uk/speech/2019/mark-
carney-speech-at-jackson-hole-economic-symposium-wyoming. The Libra white paper is available at www.libra.org.
- 21 -
future. It would require substantial changes in the economic and, in some cases, financial
and institutional structures of major economies accompanied by significant modifications to
the system of global governance.
For now and into the foreseeable future—and given the lack of viable alternatives—the dollar
reigns supreme.

- 22 -
Acknowledgements
The Brookings Institution is a nonprofit organization devoted to independent research
and policy solutions. Its mission is to conduct high-quality, independent research and,
based on that research, to provide innovative, practical recommendations for
policymakers and the public. The conclusions and recommendations of any Brookings
publication are solely those of its author(s), and do not reflect the views of the
Institution, its management, or its other scholars.
Brookings recognizes that the value it provides is in its absolute commitment to
quality, independence and impact. Activities supported by its donors reflect this
commitment and the analysis and recommendations are not determined or influenced
by any donation. A full list of contributors to the Brookings Institution can be found in
the Annual Report at www.brookings.edu/about-us/annual-report/.