Embed Size (px)
Citation preview
The Department of International Environment and Development Studies, Noragric, is the international gateway for the Norwegian University of Life Sciences (UMB). Eight departments, associated research institutions and the Norwegian College of Veterinary Medicine in Oslo. Established in 1986, Noragric’s contribution to international development lies in the interface between research, education (Bachelor, Master and PhD programmes) and assignments. The Noragric Master theses are the final theses submitted by students in order to fulfil the requirements under the Noragric Master programme “Management of Natural Resources and Sustainable Agriculture” (MNRSA), “Development Studies” and other Master programmes. The findings in this thesis do not necessarily reflect the views of Noragric. Extracts from this publication may only be reproduced after prior consultation with the author and on condition that the source is indicated. For rights of reproduction or translation contact Noragric. ©Marte Haugerud Moe, June 2008 [email protected] Noragric Department of International Environment and Development Studies P.O. Box 5003 N-1432 Ås Norway Tel.: +47 64 96 52 00 Fax: +47 64 96 52 01 Internet: http://www.umb.no/noragric
I
Declaration
I, Marte Haugerud Moe, declare that this thesis is a result of my research investigations and
findings. Sources of information other than my own have been acknowledged and a reference list
has been applied. This work has not previously been submitted to any other university for award
of any type of academic degree.
Place and date: Signature:
_________________________________ ______________________________
II
Acknowledgement
To my supervisor Arild Vatn - this thesis could never been accomplished without you,
To my co-supervisor Simon Pahle for inspiration and actuation,
To José Garcia and the rest of the ACDI/VOCA staff in Quevedo,
To Iven Ose and the rest of the ADCI/VOCA staff in Guayaquil,
To Frank Blacio and the rest of the Nestlé staff in Guayaquil,
To all my respondents for sharing their experiences,
To the Nobel Institute for providing a work space and brilliant assistance,
To my family and friends for continuous support and encouragement,
To Jostein for always believing in me,
Thank you / Muchas gracias
III
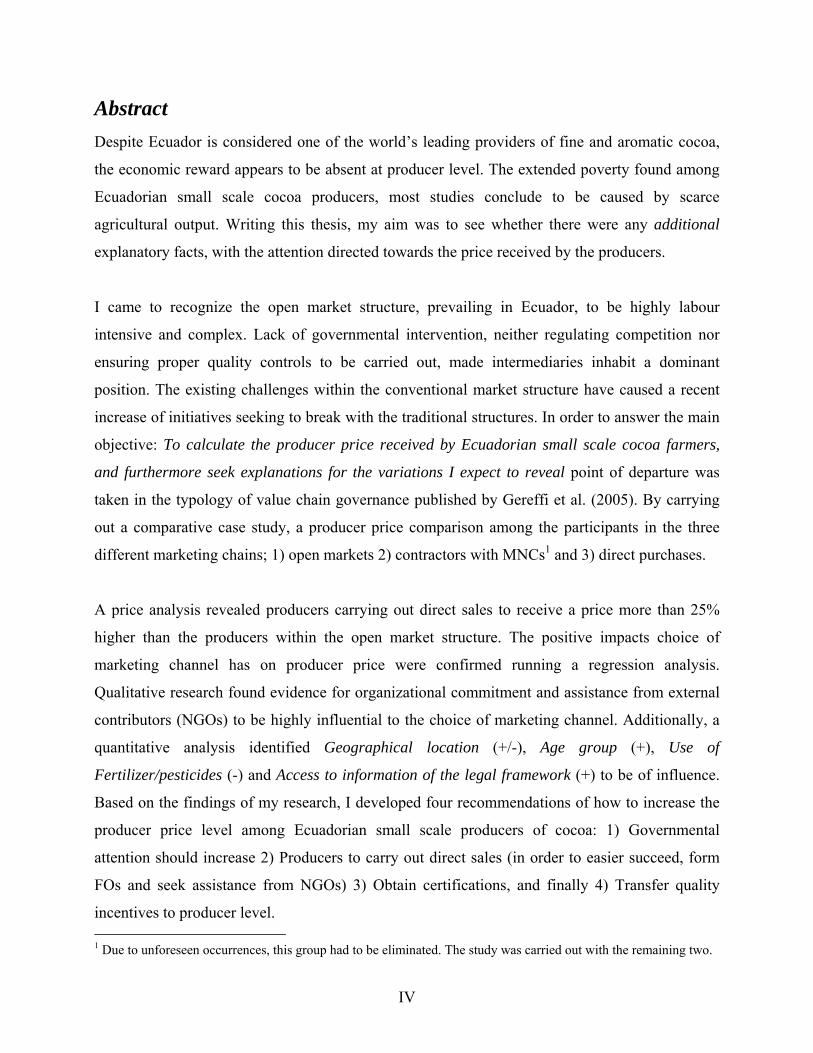
Abstract Despite Ecuador is considered one of the world’s leading providers of fine and aromatic cocoa,
the economic reward appears to be absent at producer level. The extended poverty found among
Ecuadorian small scale cocoa producers, most studies conclude to be caused by scarce
agricultural output. Writing this thesis, my aim was to see whether there were any additional
explanatory facts, with the attention directed towards the price received by the producers.
I came to recognize the open market structure, prevailing in Ecuador, to be highly labour
intensive and complex. Lack of governmental intervention, neither regulating competition nor
ensuring proper quality controls to be carried out, made intermediaries inhabit a dominant
position. The existing challenges within the conventional market structure have caused a recent
increase of initiatives seeking to break with the traditional structures. In order to answer the main
objective: To calculate the producer price received by Ecuadorian small scale cocoa farmers,
and furthermore seek explanations for the variations I expect to reveal point of departure was
taken in the typology of value chain governance published by Gereffi et al. (2005). By carrying
out a comparative case study, a producer price comparison among the participants in the three
different marketing chains; 1) open markets 2) contractors with MNCs1 and 3) direct purchases.
A price analysis revealed producers carrying out direct sales to receive a price more than 25%
higher than the producers within the open market structure. The positive impacts choice of
marketing channel has on producer price were confirmed running a regression analysis.
Qualitative research found evidence for organizational commitment and assistance from external
contributors (NGOs) to be highly influential to the choice of marketing channel. Additionally, a
quantitative analysis identified Geographical location (+/-), Age group (+), Use of
Fertilizer/pesticides (-) and Access to information of the legal framework (+) to be of influence.
Based on the findings of my research, I developed four recommendations of how to increase the
producer price level among Ecuadorian small scale producers of cocoa: 1) Governmental
attention should increase 2) Producers to carry out direct sales (in order to easier succeed, form
FOs and seek assistance from NGOs) 3) Obtain certifications, and finally 4) Transfer quality
incentives to producer level. 1 Due to unforeseen occurrences, this group had to be eliminated. The study was carried out with the remaining two.
IV
Table of contents 1. Introduction…………………………………………………………………………………… 1
1.1 Global production systems……………………………………………………...………. 1
1.2 Purpose of the study including its objectives……………………………………........... 2
1.3 Limitations of the thesis…………………………………………………………………. 3
1.4 Chapter outline………………………………………………………………………...… 3
2. Background……………………………………………………………………………………. 4
2.1 Ecuadorian cocoa production…………………………………………………………… 4
2.2 Causes of change………………………………………………………………………..... 6
2.3 Profoundness of the problem……………………………………………………………. 9
3. Theory……………………………………………………………………………………...… 10
3.1 Commodity Chains……………………………………………………………………... 10
3.1.1 Commodity Chain Analysis (CCA)…………………………………………….…. 10 3.1.2 Global Value Chains (GVCs)……………………………………………………... 11 3.1.3 Global Commodity Chains (GCCs)……………………………………………….. 14
3.2 Organization and participation……………………………………………………...… 16 3.2.1 Organization and its obstacles………………….…………………………………. 16 3.2.2 Participation……………………………………………………………………..… 18
3.3 The role of NGOs……………………………………………………………………….. 19
3.4 Theoretical framework……………………………………………………………….… 21
4. Previous studies…………………………………………………………………………...… 25
4.1 Commodity chain studies in Ecuador…………………………………………………. 25
4.2 Studies of international cocoa trade……………………………………………..…….. 27
5.0 Method………………………………………………………………………………………. 29
5.1 Case studies……………………………………………………………………………... 29
5.2 Choice of research strategies……………………………………...…………………… 29
5.2.1 Abduction…………………………………………………………………….…… 30 5.2.2 Combining qualitative and quantitative research…………………………….…… 31
5.3 Choice of methods for data collection……………………………………………….… 31 5.3.1 Quantitative methods…………………………………………………..………….. 32
V
5.3.2 Qualitative methods……………………………………………………………..… 32
5.4 Choice of methods for analysis………………………………………………………… 33
5.4.1 Analysis of quantitative data……………………………………………………… 33 5.4.2 Analysis of qualitative data………………………………………………….……. 36
6. Analysis and discussions……………………………………………………………..……… 37
6.1 Research area and sample …………………………………………….………………. 37
6.1.1 Research area…………………………………………………………………...…. 37 6.1.2 Sample…………………………………………………………………………….. 38
6.2 How is the production and marketing of cocoa organized in Ecuador?..................... 44
6.2.1 The structure of the Ecuadorian cocoa market……………………………………. 45 6.2.2 Marketing chain participants……………………………………………...………. 47 6.2.3 Challenges within the commodity chain……………………..…………………… 50 6.2.4 Alternative marketing channels………………………………………………….... 53
6.3 What is the average price ($/qq) farmers participating in the different marketing channels receive for their cocoa?........................................................................ 59
6.3.1 Price setting mechanisms in the global cocoa market………………………..…… 59 6.3.2 Price setting mechanisms in the Ecuadorian domestic cocoa market……..……… 61 6.3.3 FOB prices of cocoa in grain……………………………………………………… 64 6.3.4 Average price received among Ecuadorian cocoa farmers………………………... 66 6.3.5 Price variations in correspondence to quality……………………………………... 70
6.4 How can the variation in producer prices be explained?.............................................. 73 6.4.1 Presentation of the independent variables included in the regression analyses…... 73 6.4.2 Which factors are influential to the price paid to the producers………………....... 78 6.4.3 Which factors are influential to the choice of marketing channel?.......................... 84 6.4.4 What are my major findings and how do they relate to the framework sketched out in Chapter 3?................................................................................................. 88
7.0 Conclusion and recommendations……………………………………………….………… 94
7.1 How is the production and marketing of cocoa organized in Ecuador?..................... 94
7.2 What is the average price ($/qq) offered to the producers within the
various marketing channels and how does this price correlate with the quality
of the cocoa purchased?......................................................................................................... 95
7.3 How can the variation in the producer prices be explained?....................................... 96
7.4 Recommendation of improvements to be carried out in order to enhance to
producer prices…………………………………………………………………………..…. 97
References………………………………………………………………………………...…… 100
VI
List of figures Figure 2.1 FOB prices cocoa in grain 2006…………………………………………….……. 5 Figure 2.2 The vicious circle within the Ecuadorian cocoa sector…………………...……… 6 Figure 2.3 National vs. international prices for cocoa in grain 2005 and 2006……………… 9 Figure 3.1 Four links in a simple value chain…………………………………….………… 11 Figure 3.2 Five global value chain governance types…………………………………….… 13 Figure 3.3 The Organization of Producer-driven Commodity Chains……………………… 15 Figure 3.4 The Organization of Buyer-driven Commodity Chains ………………….…….. 15 Figure 3.5 NGOs: diversity in the crowd…………………………………………………… 20 Figure 3.6 Framework for analysis of factors influencing choice of marketing channel and
price received among Ecuadorian small scale producers of cocoa……………… 22 Figure 5.1 The epistemological model of diagnostic reasoning………………………….… 30 Figure 6.1 Cocoa producing areas in Ecuador………………………………………...……. 38 Figure 6.2 Size of plantation in hectares………………………………………….………… 41 Figure 6.3 Global production of cocoa beans, in thousand tons……………………….…… 44 Figure 6.4 The conventional cocoa value chain………………………………………..…… 45 Figure 6.5 The national cocoa chain…………………………………………………...…… 46 Figure 6.6 Marketing chain participants………………………………………………….… 47 Figure 6.7 Adjusted version of the national cocoa chain…………………………………… 48 Figure 6.8 Influencing factors for choice of purchaser among my respondents……….…… 49 Figure 6.9 Central problem - low level of competitiveness in the chain of fine and
aromatic cocoa…………………………………………….…………………..… 51 Figure 6.10 The process of measurement and quality certification at Nestlé, Guayaquil…… 55 Figure 6.11 Cultivation- and post-harvest practices in the organization Unión y Progresso... 58 Figure 6.12 FAO Food Price Index…………………………………………………….......… 60 Figure 6.13 Average global cocoa prices ($/qq) 1998 – 2007…………………………..…… 60 Figure 6.14 Perception (in %) of prices to vary according to quality……………………...… 71 Figure 6.15 Level of satisfaction with price offered for the cocoa (in %)…………………… 71 Figure 6.16 Revised for analysis of factors influencing choice of marketing channel
and price received among Ecuadorian small scale producers of cocoa……….… 89 Figure 6.17 Open market structure in the Ecuadorian context…………………………….… 90 Figure 6.18 Collective sales to direct purchasers…………………………………………..… 90
VII
List of tables Table 6.1 Age, sex and geographical division of the respondents answering the survey...... 40 Table 6.2 List of interviewees……………………………………………………...……… 42 Table 6.3 UNOCACE associates and their levels of production………………………...… 56 Table 6.4 Ecuadorian reference prices FOB ($/qq) for cocoa in grain, 1998 – 2007……… 65 Table 6.5 Producer prices for cocoa in grain…………………………………………….… 67 Table 6.6 Producer shares of FOB prices 2003 – 2006………………………………….… 67 Table 6.7 Cocoa Prices 2007 – Average prices received among Ecuadorian cocoa
producers compared to the global stock exchange prices…..…………………… 69 Table 6.8 Measurements and explications of the independent variables applied in the
regressions…………….………………………………………………………… 79 Table 6.9 Multiple linear regression: Producer price……………………..……………..… 81 Table 6.10 Binary Logistic regression: Marketing channel…………………………….…… 85 List of appendices Appendix 1 ICCO forecast on global cocoa production and consumption……………………...i Appendix 2 The 3 botanic varieties of cocoa trees worldwide…………………………………ii Appendix 3 The 3 different stages of the harvest season………………………………………iv Appendix 4 Quality classification system of Ecuadorian cocoa……………………………….vi Appendix 5 Original questionnaire in Spanish………………………………………………..vii Appendix 6 English version of questionnaire………………………………………………...xvi Appendix 7 Total exportations of cocoa in grain 2003 – 2007…………………………...….xxv Appendix 8 Collinearity diagnostics – producer price………………………………………xxvi Appendix 9 Multiple linear regression – producer price (1st & 5th run)…………………...xxviii Appendix 10 Collinearity diagnostics – Marketing channel…………………………………..xxx Appendix 11 Binary logistic regression – Marketing channel (1st & 4th run)………………..xxxii
VIII
List of abbreviations ANECACAO Asociacíon Nacional de Exportadores de Cacao
(The Ecuadorian national association of cocoa exporters) CC Commodity Chain CCA Commodity Chain Analysis CORPEI Corporación de Promoción de Exportaciones y Inversiones Ecuadorian organ for the promotion of export and innovations) FFS Farmer Field School FO Farmer Organisation FOB Free On Board BCS BCS Öko-Garantie GmbH
(A Germany based international organic certifier and controlling agency)
FAO Food and Agriculture Organization of the United Nations GCC Global Commodity Chains GDP Gross Domestic Product GTZ Deutche Gesellschaft für Technische Zusammenarbeit (A Germany based international cooperation enterprise for sustainable development with worldwide operations) GVC Global Value Chain ha Hectares ICCO International Cocoa Organization ICE Intercontinental Exchange IICA Instituto Interamericano de Cooperación para la Agrícultura (Inter-American institute for agricultural cooperation) IMF International Monetary Fund
IX
INIAP Instituto Nacional Autónomo de Investigaciones Agropecuarias (The Ecuadorian national autonomous institute for agricultural research)
LA Latin America LCA Latent Content Analysis LDC Low Developed Country LIFFE London International Financial Futures Exchange MAG Ministerio de Agricultura, Ganadería, Acuacultura y Pesca (the Ecuadorian Ministry of Agriculture and Livestock) MCA Manifest Content Analysis MIC Ministerio de Industrias y Competitividad (the Ecuadorian Ministry of Industrialisation and Competitiveness) MNC Multi National Company MT Metric tons. Unit of measurement equivalent to 1000 kilograms NBR National Bureau of Economic Research NGO Non-Governmental Organisation NRI Natural Research Institute NYBOT New York Board of Trade PP Producer price qq Quintales. 1 quintal = 100 Spanish libras. Unit of measurement
equivalent to 45,36 kilograms TNC Trans National Company UDENOR Unión de Enxeñerías do Noroeste, S. A. Union of Engineers in the south-western part of South America) UNOCACE La Unión de Organizaciones Campesinas Cacaoteras del Ecuador
(Union of Ecuadorian cocoa producer organizations)
X
‘[Value] is adjusted… Not by any accurate measure, but
by the haggling and bargaining of the market, according
to that sort of rough equality which, though not exact, is
sufficient for carrying on the business of common life’
Adam Smith2
2 In The Wealth of Nations, book 1, chapter V.
XI
1. Introduction
1.1 Global production systems Increased globalization has made a variety of services offered in all corners of the world available
to the ‘global client’. The international trading pattern is frequently expanded through factors like
extended division of labour and global dispersion of production. A recent trend is outsourcing of
labour, which has been proved to be a very efficient way to conduct business. To comply with the
demands of a fastidious group of clients, improvements must be carried out continuously. The
high levels of expertise required in various fields have resulted in extended specialization. This
development of ‘knowledge clusters’ corresponds to Adam Smith’s ideas of an advanced
economy best to be achieved through specialization and detailed division of labour (Todaro and
Smith 2003). As a consequence, it is not longer sufficient for an industry to maintain an efficient
production in order to enter the global market and allow for sustained income growth. As well,
an overall understanding of the existing dynamics of the entire value chain is required to take
advantage of the new global production system (Kaplinsky and Morris 2002).
Unfortunately, it is still apparent that the appointment of winners cannot happen without losers.
Prebish and Singer presented in 1950 evidence for a tendency of relative prices of raw materials
(including agricultural products), when compared with the price of manufactured goods, to
experience a steady decline in the long term (Todaro and Smith 2003). As most production of
primary goods is located in Low Developed Countries (LDCs), their inhabitants tend to account
for the losers within the global trade pattern.
Tracing a global value chain of agricultural commodities reveals the ‘losers’ often to be found at
the very bottom; the farm level. This tendency being apparent in the world’s cocoa trade is
demonstrated by farmers struggling with low return of investments, despite the global cocoa
consumption3 is reaching new peaks annually (ICCO 2007a). Cocoa, being a buyer-driven
commodity whose value is set by the global produce exchange, is extremely vulnerable to price
fluctuation. When prices are low, it is easily observed within all levels of the value chain. But is
3 For further details, see ICCO forecast for global cocoa production and consumption in Appendix 1.
- 1 -
this the case as well when the prices are increasing? Or is some of the surplus likely to disappear
within the chain before reaching producer level? How can it else be explained that most
Ecuadorian farmers are living in poverty when the global market seems never to get enough of
the fine and aromatic cocoa of which Ecuador is the world’s leading producer?
1.2 Purpose of the study including its objectives Low agricultural output has been uttered by numerous (Ramírez 2006, 2007, Collinson and Leon
2000) to be the main explanation to the extended problem of poverty among actors operating at
the lower levels within the Ecuadorian cocoa sector. This is a well-documented and
acknowledged fact. The purpose of this study is to reveal whether there are any other
explanations to the existing poverty among Ecuadorian cocoa producers, with special attention
drawn to the price disbursed at farm level. With the goal set, I defined my main objective to be:
To calculate the producer price received by Ecuadorian small scale cocoa farmers, and
furthermore seek explanations for the variations I expect to reveal.
As I assume participation in alternative marketing channels to be of considerable importance to
the price received by the individual farmer, generating a general overview of the organization of
the national cocoa industry early in the research process will be crucial. Holding the motivation
of acquiring a profound understanding of both the design and structure of the commodity chain
constituted for the design of the first of my three sub-objectives:
Q1: How is the production and marketing of cocoa organized in Ecuador?
After having recognized its main components, my aim is to move all the way down to the very
bottom of the chain. Here I am to investigate the average price paid to producers participating in
the various marketing channels. In addition, I seek to reveal whether the price paid to the
producers is influenced by the quality of the product they offer.
Q2: What is the average price ($/qq) offered to the producers within the various marketing
channels and how does this price correlate with the quality of the cocoa purchased?
- 2 -
Expecting to find variations in the price offered to the producers within the different marketing
channels, I now seek to know why it is so. What characteristics do the farmers participating in the
commodity chain offering the highest/lowest prices inhabit, and how can they be differentiated
from the other cocoa producers?
Q3: How can the variation in the producer prices be explained?
In order to give an answer to the third sub-objective, the structural advantages as well as
disadvantages of each particular marketing chain must be given account for. Asking how come
farmers are better off participating in one commodity chain, may help reveal weaknesses or
limitations within the other chains, seen from the farmers’ perspective.
1.3 Limitations of the thesis As indicated in the previous section, the focus of this thesis is to trace the commodity chain of
Ecuadorian cocoa. Due to time constrains and vast amount of information in need to be gathered,
the limitation is set by the marketing of cocoa in grain. My sample will be gathered within the
region of Los Rios with the respondents selected randomly. Cocoa producers giving their answers
to my survey will constitute for the main sample, but additional information will be extracted
through semi-structured and observations of actors found at all level of the commodity chain.
1.4 Chapter outline The outline of the thesis will be as follows: With the purpose of providing the reader with basic
information of the functions, mechanisms and challenges within the Ecuadorian cocoa market, I
will in the following chapter (2) give a presentation of the national production system. Chapter 3
is used to present the theory, resulting in a framework to be applied in the analysis. For the reader
to obtain a better insight of the existing studies within the field, Chapter 4 will give account for
some of the previous research conducted. In Chapter 5 the methods applied in this study are
presented. Chapter 6 contain findings, analyses and discussions. With basis in the prior analyses,
I conclusions are drawn in Chapter 7.
- 3 -
2. Background
2.1 Ecuadorian cocoa production Ecuador is said to be the birthplace of cocoa (The Success Alliance 2007), and the country’s
history of cocoa cultivation can be traced back to the 17th century. Ecuador experienced a rapid
economic growth at the very start of the 20th century, with cocoa as the dominant export
commodity. When the Panama Canal opened in 1914, Ecuador was brought to the position as the
world’s main cocoa exporter, accounting for 20% of the global market (UN 1994). A historical
peak was reached in the years 1914 and 1916, when exports amounted for approximately $ 77
millions. In the latter period of the cocoa cycle (1926 – 1930), the structure of Ecuadorian exports
diversified, now accounting for coffee and rice as well. This transformation brought the shares of
cocoa exports to account for less than 50% of the total national exports (ibid). Despite the fact
that cocoa maintained the position as one of Ecuador’s most important export commodities
throughout big parts of the 20th century, the country’s share of the world’s total cocoa production
fell from 18% at the very start of the century, to 2% in 1945 (UNCTAD 1991).
Ecuador, producing the two types of cocoa; Nacional and CCN51, is world famous for its high
quality products. The variety Nacional, being a unique Ecuadorian product, has experienced a
widespread global demand for decades. Nacional, being the traditional variety cultivated for
centuries, does still dominate the national cocoa production, covering 95% of all the land areas
applied for cocoa production (SICA 2007a). Despite having its origin from the Forastero4 family
Nacional is considered being a fine and aromatic cocoa. Due to its characteristics, it has been
described as Pepa del Oro (‘Golden bean’) for decades. Its large sized seeds are developed by
light brown cotillions. The aroma of chocolate which is delicately accompanied by a floral
flavour characterizes its taste, is known as Arriba (ANECACAO 2007). The extraordinary
flavour is developed due to the quick fermentation5 of the cocoa seeds. In contrast to most other
types of cocoa which seeds in about six days, the Ecuadorian only needs three or four (Shared
interests 2007).
4 See Appendix 2 for further information about the different cocoa varieties. 5 See Appendix 3 for further information about the different stages of the harvest season.
- 4 -
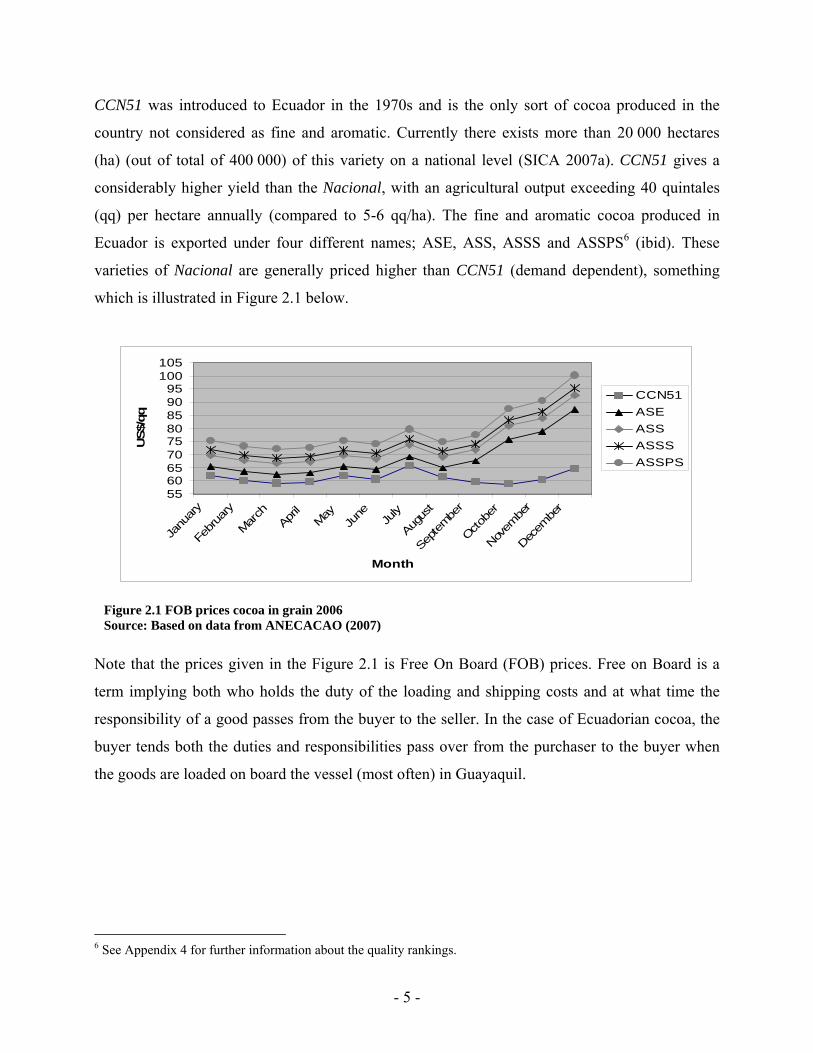
CCN51 was introduced to Ecuador in the 1970s and is the only sort of cocoa produced in the
country not considered as fine and aromatic. Currently there exists more than 20 000 hectares
(ha) (out of total of 400 000) of this variety on a national level (SICA 2007a). CCN51 gives a
considerably higher yield than the Nacional, with an agricultural output exceeding 40 quintales
(qq) per hectare annually (compared to 5-6 qq/ha). The fine and aromatic cocoa produced in
Ecuador is exported under four different names; ASE, ASS, ASSS and ASSPS6 (ibid). These
varieties of Nacional are generally priced higher than CCN51 (demand dependent), something
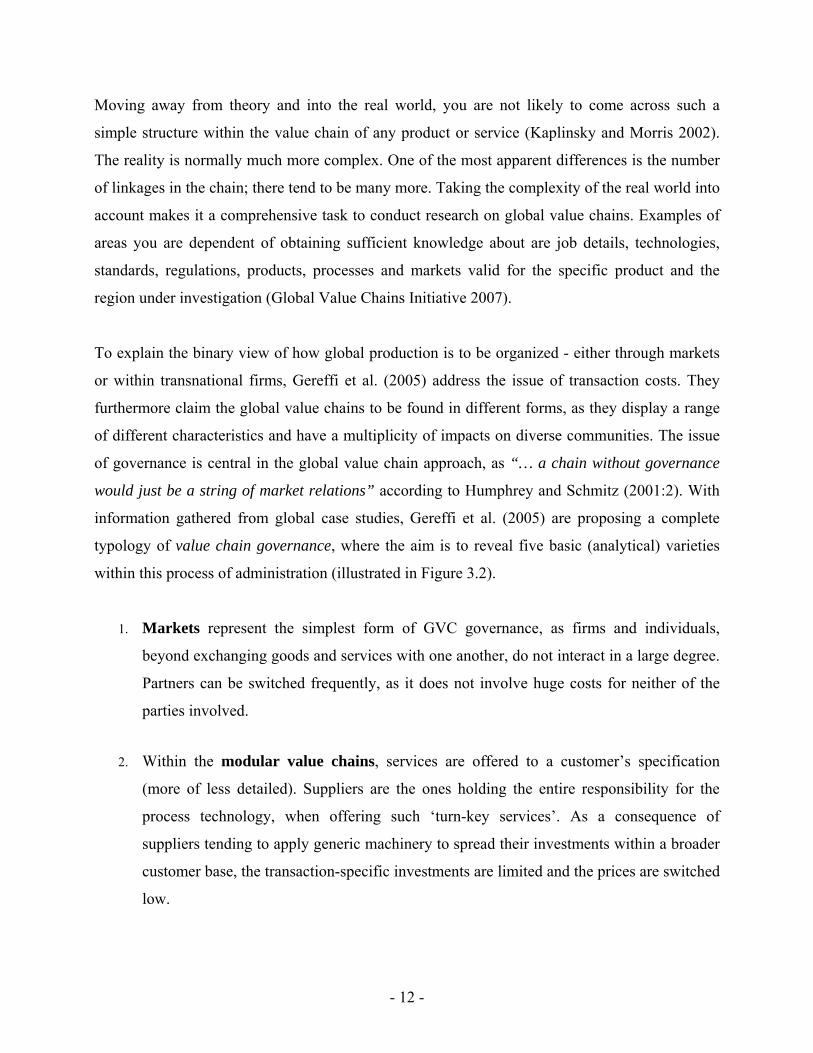
which is illustrated in Figure 2.1 below.
556065707580859095
100105
Janu
ary
Februa
ry
March
April
MayJu
ne July
Augus
t
Septembe
r
Octobe
r
Novem
ber
Decem
ber
Month
US$
CCN51ASEASSASSSASSPS
N
t
r
b
t
6
Figure 2.1 FOB prices cocoa in grain 2006 Source: Based on data from ANECACAO (2007)
ote that the prices given in the Figure 2.1 is Free On Board (FOB) prices. Free on Board is a
erm implying both who holds the duty of the loading and shipping costs and at what time the
esponsibility of a good passes from the buyer to the seller. In the case of Ecuadorian cocoa, the
uyer tends both the duties and responsibilities pass over from the purchaser to the buyer when
he goods are loaded on board the vessel (most often) in Guayaquil.
See Appendix 4 for further information about the quality rankings.
- 5 -
2.2 Causes of change Cocoa Nacional has made Ecuador an important and demanded actor in the global cocoa market.
For several years, Ecuador produced more than 50% of the global share of fine and aromatic
cocoa and was considered the most important producer worldwide (ANECACAO 2007). Despite
prices being set higher for the variety Nacional, this does not compensate for the low agricultural
output extracted. The ripple effects of holding limited access to a valuable product have occurred
in two levels: 1) Farmers seeking short cuts cause frequent neglections within the post harvest
practices. 2) Middlemen, traders and exporters mixing together the two varieties. In 1994 the
International Cocoa Organization (ICCO) punished the fraud taking place by adjusting
Ecuadorian cocoa 25% down, now being considered a nation producing 75% fine and aromatic
cocoa (ibid).
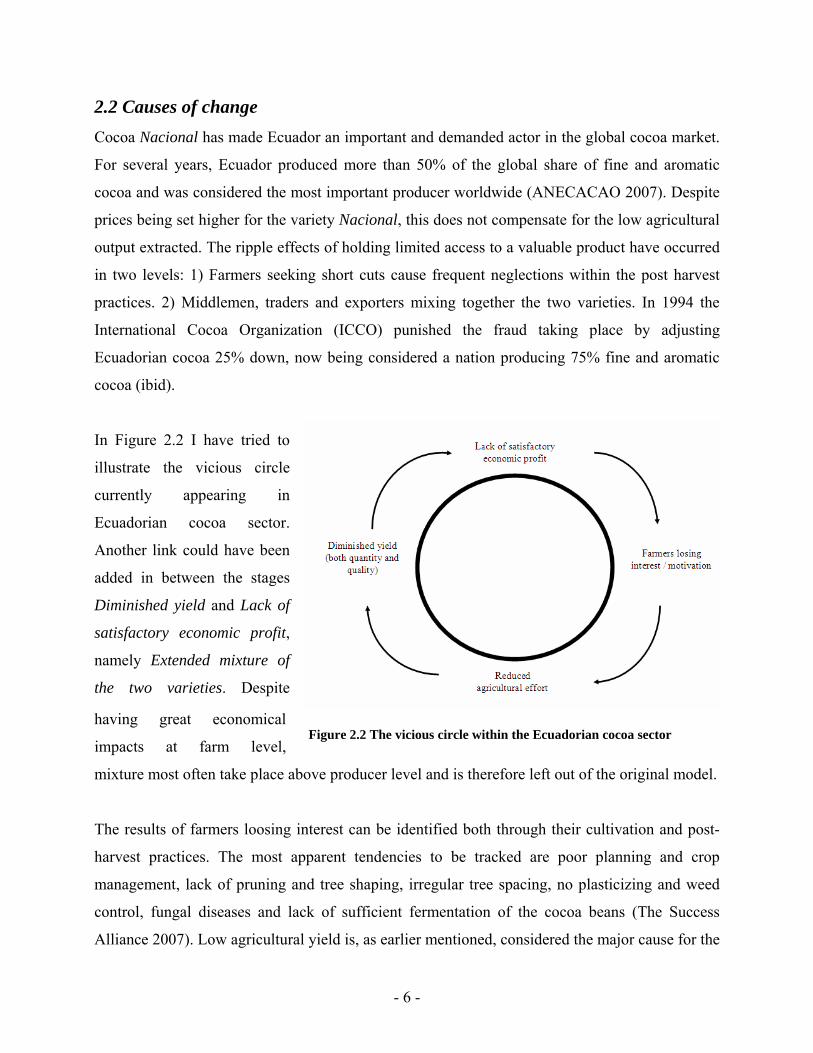
Figure 2.2 The vicious circle within the Ecuadorian cocoa sector
In Figure 2.2 I have tried to
illustrate the vicious circle
currently appearing in
Ecuadorian cocoa sector.
Another link could have been
added in between the stages
Diminished yield and Lack of
satisfactory economic profit,
namely Extended mixture of
the two varieties. Despite
having great economical
impacts at farm level,
mixture most often take place above producer level and is therefore left out of the original model.
The results of farmers loosing interest can be identified both through their cultivation and post-
harvest practices. The most apparent tendencies to be tracked are poor planning and crop
management, lack of pruning and tree shaping, irregular tree spacing, no plasticizing and weed
control, fungal diseases and lack of sufficient fermentation of the cocoa beans (The Success
Alliance 2007). Low agricultural yield is, as earlier mentioned, considered the major cause for the
- 6 -
extended poverty among Ecuadorian cocoa producers and a range of studies and projects have
been carried out holding the aim of increase the agricultural output extracted. However, there are
factors above actor level which should be brought up, discussing influences for Ecuador
gradually to loose its position in the global cocoa market.
Rough and unpredictable weather conditions make farming in Ecuador a continuous struggle. The
country has been a victim of natural hazards as drought and floods over the years, most severe in
the years 1975, 1983, 1995 and 1998, as well as earthquakes (1987) and volcano eruptions (1999)
(ICG 2007). Secondly, unstable relations to their neighbouring countries have made Ecuador
suffer from lack of foreign investment initiatives. The Colombian guerrilla movements in the
north and brief wars with Peru in the south (1981, 1995) have contributed to undermine the
nation’s economic environment (ibid). Furthermore, the nation’s economy has suffered from
governmental mismanagement (rent-seeking and corruption) throughout the last decades. U.S.
Department of State utters Ecuador's political parties to “... have historically been small, loose
organizations that depend more on populist, often charismatic, leaders to retain support than on
programs or ideology” (U.S. Department of State 2007). Years of governmental mismanagement
has made the population loose faith in the political system, as there has been a tendency of
Ecuadorian politicians to prioritize western interest (as well as self interests) rather than the
national. As a consequence of natural disasters (among others El Niño) and a sharp decline in the
world’s petroleum prices, Ecuador experienced a major banking crisis and recession in 1999
(CIA 2007). As the real GDP contracted with more then 6% and the banking system collapsed,
Ecuador had no choice but to adopt U.S. dollars as a legal tender in 2000 (ibid).
During the decades of 1950s, ‘60s and ‘70s, import substitution policies were pursued in most
Latin American (LA) countries (Stiglitz & Charlton 2005). Despite experiencing a rapid growth
in their economies during the period, a turning point was met in the early 1980s when none of the
LA countries experienced much economic growth. A regional average of 6% growth during the
1970s felt to almost zero in the 80s. Professionals have argued against one another for the causes
of this stagnation. While the neo-liberal view, favoured by IMF and the World Bank, put the
blame on import substitution combined with an excessively degree of state intervention, an
alternative view has put more emphasis on Latin America’s open capital markets. This view
- 7 -
claims Latin America’s reliance on foreign direct investments and external flows of capital to be
the factor most influential for the area being so vulnerable of global economic shocks. The heavy
loans the LA nations undertook during the ‘70s enabled them, for some while, to avoid the global
recession which followed the oil price shock. Finally, the Latin American debt crisis became a
crude fact in the early 1980s, when the US Federal Reserve augmented the interest rates of these
loans to level unmanageable for most of the nations to handle (ibid).
According to a report from The Natural Resource Institute (NRI) Ecuadorian cocoa is marketed
without governmental interference, meaning local prices are calculated taking point of departure
in international prices and local supply and demand (Collinson and Leon 2000). This leads local
prices occasionally to move out-of-sympathy with the New York7 and London prices (where the
world’s cocoa exchange are situated) as they are determined by the demand from the nations own
cocoa processing industry and neighbouring countries (ibid). The report identifies other
hallmarks in the Ecuadorian cocoa sector to be lack of competition laws, absence of monopolies
and cartels, minimal governmental interference, low levels of vertical and horizontal integration
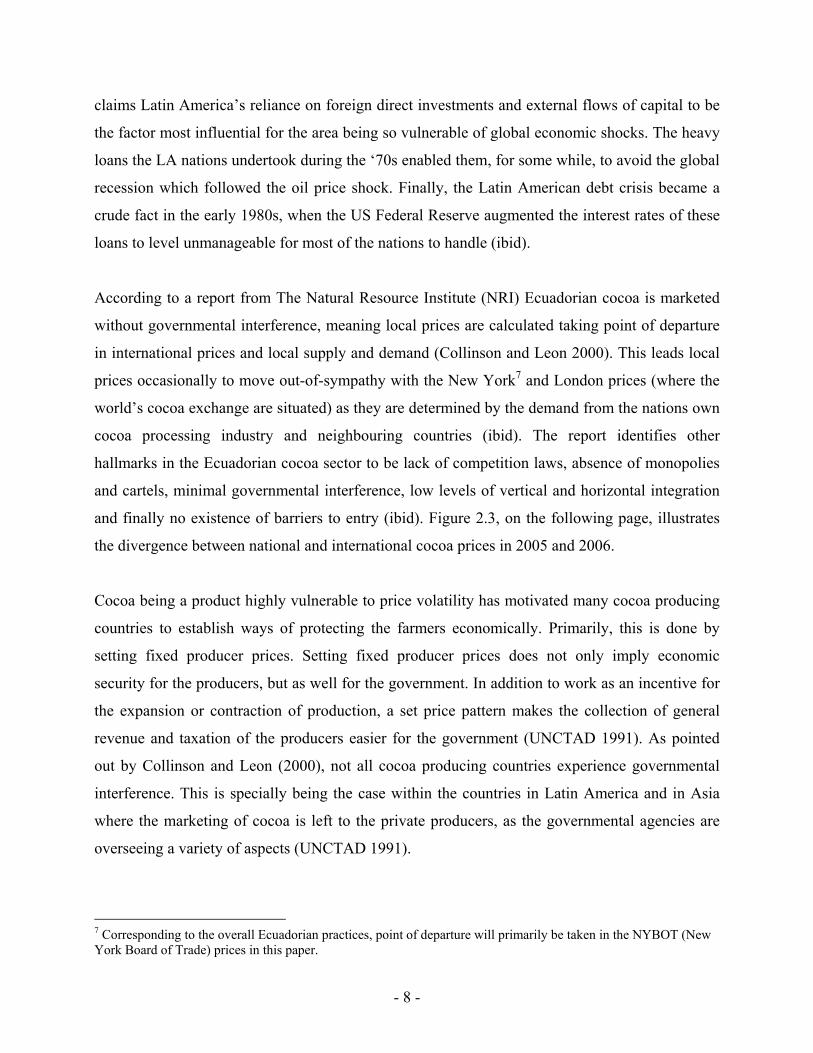
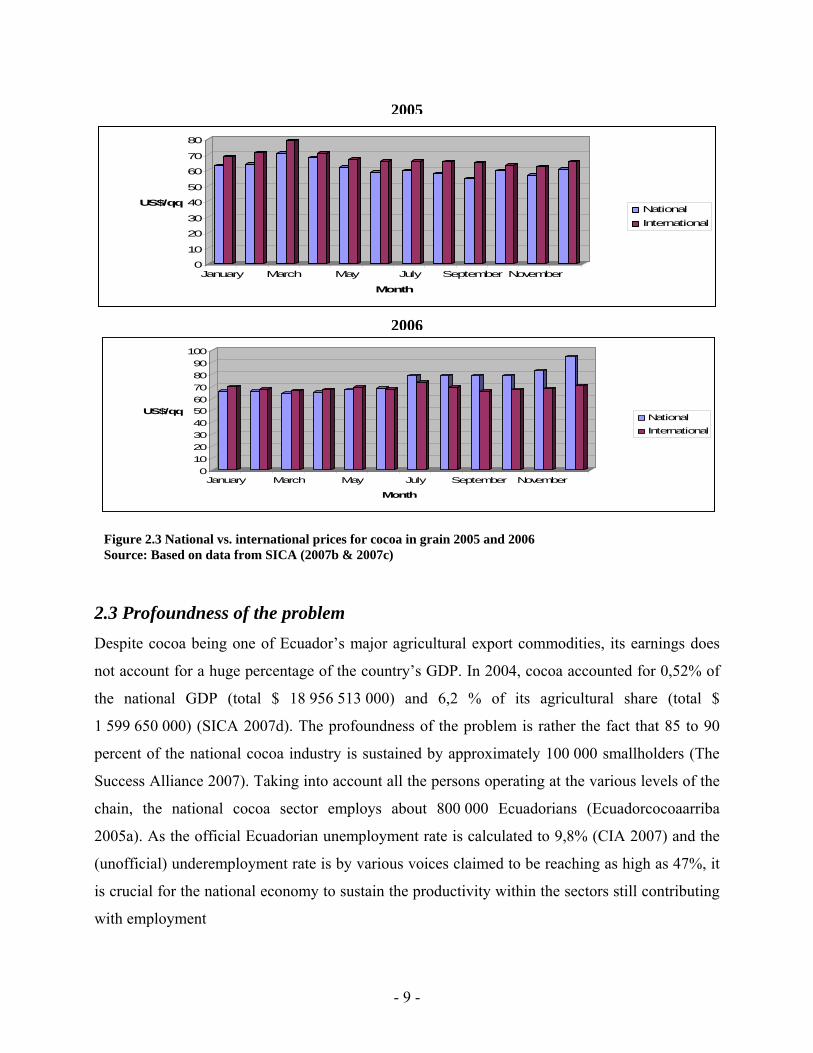
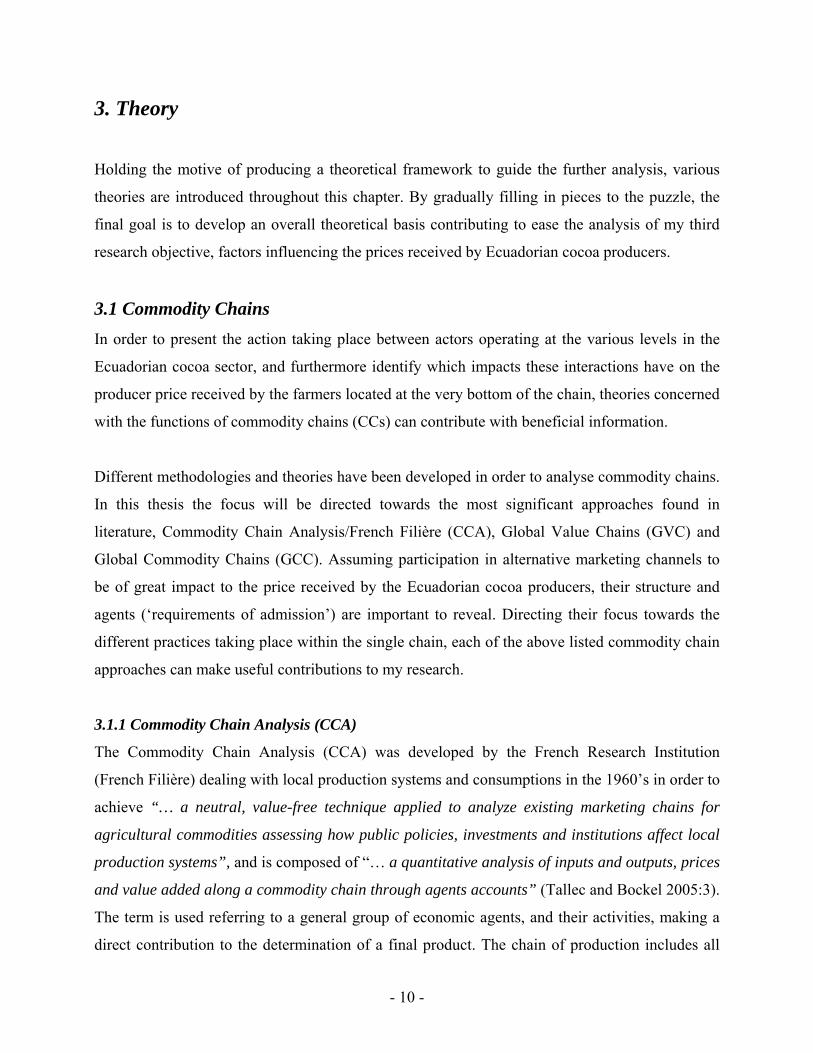
and finally no existence of barriers to entry (ibid). Figure 2.3, on the following page, illustrates
the divergence between national and international cocoa prices in 2005 and 2006.
Cocoa being a product highly vulnerable to price volatility has motivated many cocoa producing
countries to establish ways of protecting the farmers economically. Primarily, this is done by
setting fixed producer prices. Setting fixed producer prices does not only imply economic
security for the producers, but as well for the government. In addition to work as an incentive for
the expansion or contraction of production, a set price pattern makes the collection of general
revenue and taxation of the producers easier for the government (UNCTAD 1991). As pointed
out by Collinson and Leon (2000), not all cocoa producing countries experience governmental
interference. This is specially being the case within the countries in Latin America and in Asia
where the marketing of cocoa is left to the private producers, as the governmental agencies are
overseeing a variety of aspects (UNCTAD 1991).
7 Corresponding to the overall Ecuadorian practices, point of departure will primarily be taken in the NYBOT (New York Board of Trade) prices in this paper.
- 8 -
2005
0
10
20
30
40
50
60
70
80
US$/qq
January March May July September November
Month
NationalInternational
2006
0102030405060708090
100
US$/qq
January March May July September November
Month
NationalInternational
Figure 2.3 National vs. international prices for cocoa in grain 2005 and 2006 Source: Based on data from SICA (2007b & 2007c)
2.3 Profoundness of the problem Despite cocoa being one of Ecuador’s major agricultural export commodities, its earnings does
not account for a huge percentage of the country’s GDP. In 2004, cocoa accounted for 0,52% of
the national GDP (total $ 18 956 513 000) and 6,2 % of its agricultural share (total $
1 599 650 000) (SICA 2007d). The profoundness of the problem is rather the fact that 85 to 90
percent of the national cocoa industry is sustained by approximately 100 000 smallholders (The
Success Alliance 2007). Taking into account all the persons operating at the various levels of the
chain, the national cocoa sector employs about 800 000 Ecuadorians (Ecuadorcocoaarriba
2005a). As the official Ecuadorian unemployment rate is calculated to 9,8% (CIA 2007) and the
(unofficial) underemployment rate is by various voices claimed to be reaching as high as 47%, it
is crucial for the national economy to sustain the productivity within the sectors still contributing
with employment
- 9 -
3. Theory
Holding the motive of producing a theoretical framework to guide the further analysis, various
theories are introduced throughout this chapter. By gradually filling in pieces to the puzzle, the
final goal is to develop an overall theoretical basis contributing to ease the analysis of my third
research objective, factors influencing the prices received by Ecuadorian cocoa producers.
3.1 Commodity Chains In order to present the action taking place between actors operating at the various levels in the
Ecuadorian cocoa sector, and furthermore identify which impacts these interactions have on the
producer price received by the farmers located at the very bottom of the chain, theories concerned
with the functions of commodity chains (CCs) can contribute with beneficial information.
Different methodologies and theories have been developed in order to analyse commodity chains.
In this thesis the focus will be directed towards the most significant approaches found in
literature, Commodity Chain Analysis/French Filière (CCA), Global Value Chains (GVC) and
Global Commodity Chains (GCC). Assuming participation in alternative marketing channels to
be of great impact to the price received by the Ecuadorian cocoa producers, their structure and
agents (‘requirements of admission’) are important to reveal. Directing their focus towards the
different practices taking place within the single chain, each of the above listed commodity chain
approaches can make useful contributions to my research.
3.1.1 Commodity Chain Analysis (CCA)
The Commodity Chain Analysis (CCA) was developed by the French Research Institution
(French Filière) dealing with local production systems and consumptions in the 1960’s in order to
achieve “… a neutral, value-free technique applied to analyze existing marketing chains for
agricultural commodities assessing how public policies, investments and institutions affect local
production systems”, and is composed of “… a quantitative analysis of inputs and outputs, prices
and value added along a commodity chain through agents accounts” (Tallec and Bockel 2005:3).
The term is used referring to a general group of economic agents, and their activities, making a
direct contribution to the determination of a final product. The chain of production includes all
- 10 -
processes taking place from the transformation until delivery to the final market of one particular
agricultural product (ibid). The empirical research tradition has been dominant since the rise of
the filière analysis. Throughout its development the main objective has always been to map out
the abovementioned commodity flows and to identify the agents (typically done through the
design of flow-charts of commodities and transformations) (Raikes et al. 2000). Launched almost
half a century ago, the CCA has provided the basis for the development of the GVC and GCC
approaches. Due to their common origin, similarities are easily traced and differentiation can
sometimes be hard.
3.1.2 Global Value Chains (GVCs)
“In its most basic form, a value-added chain is the process by which technology is combined with
material and labor inputs, and then processed inputs are assembled, marketed, and distributed”
(Kogut quoted in Gereffi et al. 2005:79). Its purpose is to give account for the activities firms and
their workers go through when bringing a product or a service from its conception to its end use
(Global Value Chains Initiative 2007). In order to illustrate the process of bringing a product, or a
service, from its conception, throughout the different production stages until it reaches the final
consumers, and at the very last, to final disposal after it is used (Kaplinsky and Morris 2002), the
value chain has to include a full range of different activities. These activities include elements
such as design, production, marketing and distribution (Global Value Chains Initiative 2007).
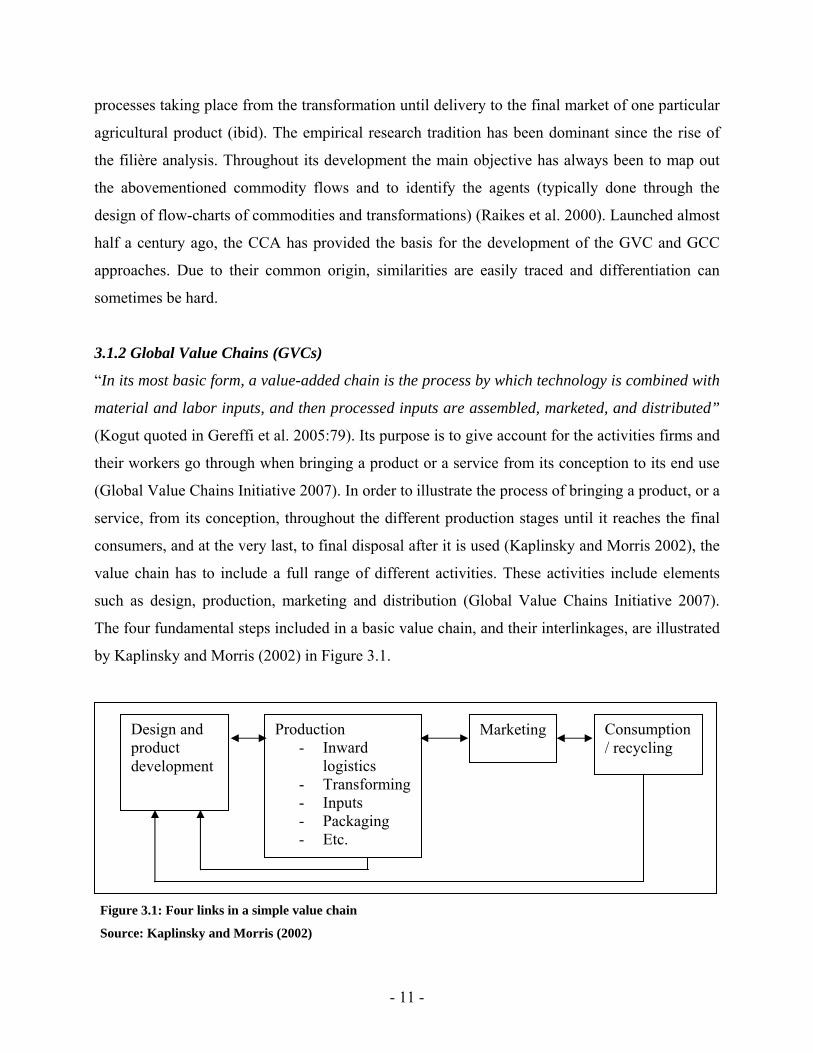
The four fundamental steps included in a basic value chain, and their interlinkages, are illustrated
by Kaplinsky and Morris (2002) in Figure 3.1.
Design and product development
Production - Inward
logistics - Transforming - Inputs - Packaging - Etc.
Marketing Consumption / recycling
Figure 3.1: Four links in a simple value chain
Source: Kaplinsky and Morris (2002)
- 11 -
Moving away from theory and into the real world, you are not likely to come across such a
simple structure within the value chain of any product or service (Kaplinsky and Morris 2002).
The reality is normally much more complex. One of the most apparent differences is the number
of linkages in the chain; there tend to be many more. Taking the complexity of the real world into
account makes it a comprehensive task to conduct research on global value chains. Examples of
areas you are dependent of obtaining sufficient knowledge about are job details, technologies,
standards, regulations, products, processes and markets valid for the specific product and the
region under investigation (Global Value Chains Initiative 2007).
To explain the binary view of how global production is to be organized - either through markets
or within transnational firms, Gereffi et al. (2005) address the issue of transaction costs. They
furthermore claim the global value chains to be found in different forms, as they display a range
of different characteristics and have a multiplicity of impacts on diverse communities. The issue
of governance is central in the global value chain approach, as “… a chain without governance
would just be a string of market relations” according to Humphrey and Schmitz (2001:2). With
information gathered from global case studies, Gereffi et al. (2005) are proposing a complete
typology of value chain governance, where the aim is to reveal five basic (analytical) varieties
within this process of administration (illustrated in Figure 3.2).
1. Markets represent the simplest form of GVC governance, as firms and individuals,
beyond exchanging goods and services with one another, do not interact in a large degree.
Partners can be switched frequently, as it does not involve huge costs for neither of the
parties involved.
2. Within the modular value chains, services are offered to a customer’s specification
(more of less detailed). Suppliers are the ones holding the entire responsibility for the
process technology, when offering such ‘turn-key services’. As a consequence of
suppliers tending to apply generic machinery to spread their investments within a broader
customer base, the transaction-specific investments are limited and the prices are switched
low.
- 12 -
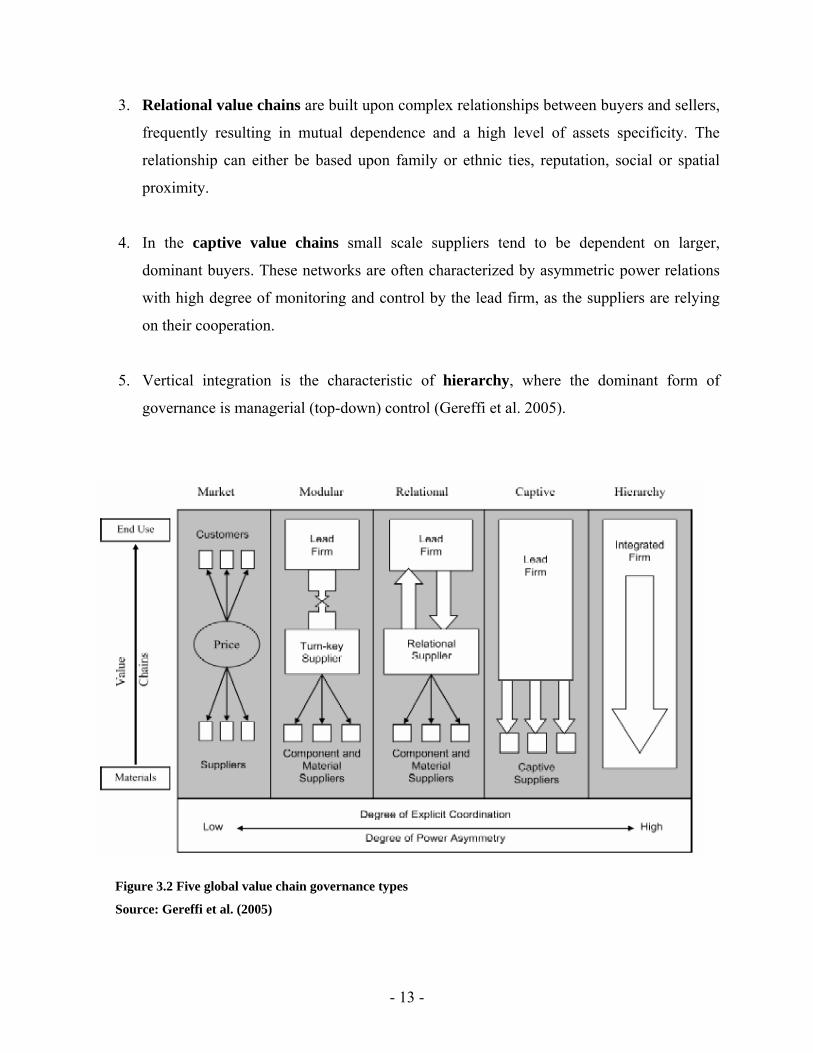
3. Relational value chains are built upon complex relationships between buyers and sellers,
frequently resulting in mutual dependence and a high level of assets specificity. The
relationship can either be based upon family or ethnic ties, reputation, social or spatial
proximity.
4. In the captive value chains small scale suppliers tend to be dependent on larger,
dominant buyers. These networks are often characterized by asymmetric power relations
with high degree of monitoring and control by the lead firm, as the suppliers are relying
on their cooperation.
5. Vertical integration is the characteristic of hierarchy, where the dominant form of
governance is managerial (top-down) control (Gereffi et al. 2005).
Figure 3.2 Five global value chain governance types
Source: Gereffi et al. (2005)
- 13 -

3.1.3 Global Commodity Chains (GCCs)
While the Global Value Chains has its focus directed towards the value added to a product while
it moves upwards the chain, the GCC approach is more interested in revealing the processes
taking place between the different stages.
Despite being defined by Hopkins and Wallerstein already in 1986 as “… a network of labour
and production processes whose end result is a finished commodity” (Gereffi and Korzeniewicz
1994:2), the concept of Global Commodity Chains became first well-known after being
introduced to the literature by Gary Gereffi in the mid-1990’s, referring to GCCs as the whole
range of activities involved in the design, production and marketing of a product (ibid). The
global Commodity Chain has as its primary focus “… to analyse the international trading system
and the increasing economic integration of international production and marketing chains”
(Tallec and Bockel 2005:3). Hopkins and Wallerstein indicate its greatest virtue to be its
emphasis on the process (Gereffi and Korzeniewicz 1994). Originally the concept of GCC was
created to analyse the impact of globalization on industrial commodity chains. Moreover, GCCs
were to emphasize the embedded power relations in value chain analyses, by unveiling the
dominant party (parties) determining the overall characteristic of the chain. Gereffi and
Korzeniewicz apply the term network referring to the overall configuration of relations in the
network or its parts. By using these properties in their analyses of commodity chains, they claim
to include the ‘length’ of the chain and the ‘density’ of interactions in a particular segment, as
well as the ‘depth’ or number of levels occurring at different stages of a GCC (ibid).
The form for governance conducted in a GCC, Gereffi (1999) argues either to be producer- or
buyer driven. The producer-driven commodity chain he characterizes to contain huge firms
playing central roles in the coordination of the production networks. The archetypal actors are
technology- and capital intensive manufacturers, including the industry of cars, aircrafts and
other heavy machineries (ibid). One of the major differences between the producer- and buyer
driven commodity chains is the control being exercised by the administrative headquarters of
Transnational Companies (TNCs) in producer-driven production systems (Gereffi and
Korzeniewicz 1994). Figure 3.3 illustrates the structure of a simple producer-driven commodity
chain.
- 14 -
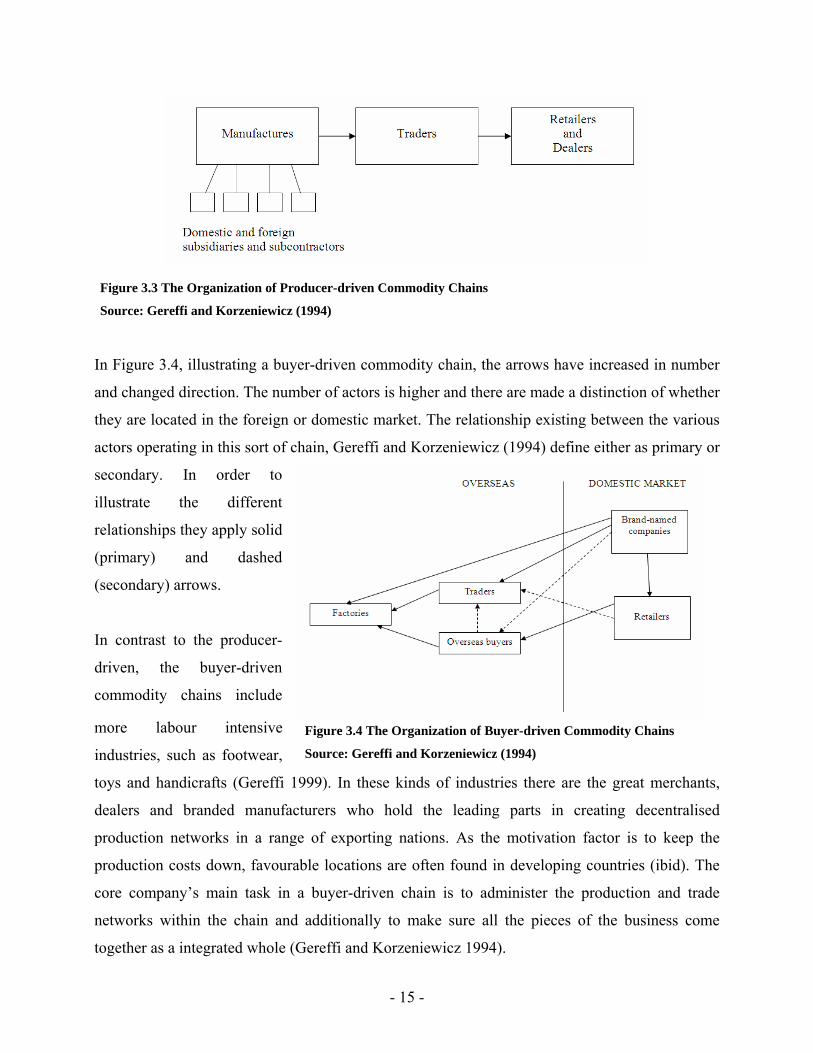
Figure 3.3 The Organization of Producer-driven Commodity Chains
Source: Gereffi and Korzeniewicz (1994)
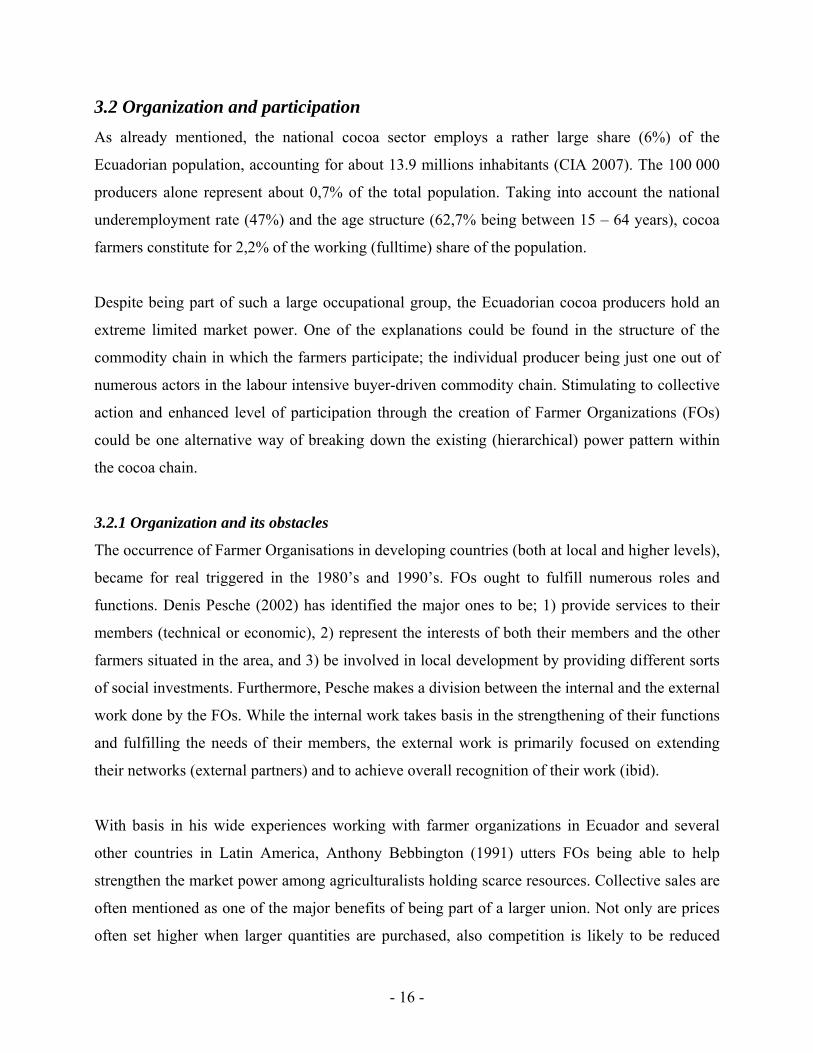
In Figure 3.4, illustrating a buyer-driven commodity chain, the arrows have increased in number
and changed direction. The number of actors is higher and there are made a distinction of whether
they are located in the foreign or domestic market. The relationship existing between the various
actors operating in this sort of chain, Gereffi and Korzeniewicz (1994) define either as primary or
secondary. In order to
illustrate the different
relationships they apply solid
(primary) and dashed
(secondary) arrows.
Figure 3.4 The Organization of Buyer-driven Commodity Chains
Source: Gereffi and Korzeniewicz (1994)
In contrast to the producer-
driven, the buyer-driven
commodity chains include
more labour intensive
industries, such as footwear,
toys and handicrafts (Gereffi 1999). In these kinds of industries there are the great merchants,
dealers and branded manufacturers who hold the leading parts in creating decentralised
production networks in a range of exporting nations. As the motivation factor is to keep the
production costs down, favourable locations are often found in developing countries (ibid). The
core company’s main task in a buyer-driven chain is to administer the production and trade
networks within the chain and additionally to make sure all the pieces of the business come
together as a integrated whole (Gereffi and Korzeniewicz 1994).
- 15 -
3.2 Organization and participation As already mentioned, the national cocoa sector employs a rather large share (6%) of the
Ecuadorian population, accounting for about 13.9 millions inhabitants (CIA 2007). The 100 000
producers alone represent about 0,7% of the total population. Taking into account the national
underemployment rate (47%) and the age structure (62,7% being between 15 – 64 years), cocoa
farmers constitute for 2,2% of the working (fulltime) share of the population.
Despite being part of such a large occupational group, the Ecuadorian cocoa producers hold an
extreme limited market power. One of the explanations could be found in the structure of the
commodity chain in which the farmers participate; the individual producer being just one out of
numerous actors in the labour intensive buyer-driven commodity chain. Stimulating to collective
action and enhanced level of participation through the creation of Farmer Organizations (FOs)
could be one alternative way of breaking down the existing (hierarchical) power pattern within
the cocoa chain.
3.2.1 Organization and its obstacles
The occurrence of Farmer Organisations in developing countries (both at local and higher levels),
became for real triggered in the 1980’s and 1990’s. FOs ought to fulfill numerous roles and
functions. Denis Pesche (2002) has identified the major ones to be; 1) provide services to their
members (technical or economic), 2) represent the interests of both their members and the other
farmers situated in the area, and 3) be involved in local development by providing different sorts
of social investments. Furthermore, Pesche makes a division between the internal and the external
work done by the FOs. While the internal work takes basis in the strengthening of their functions
and fulfilling the needs of their members, the external work is primarily focused on extending
their networks (external partners) and to achieve overall recognition of their work (ibid).
With basis in his wide experiences working with farmer organizations in Ecuador and several
other countries in Latin America, Anthony Bebbington (1991) utters FOs being able to help
strengthen the market power among agriculturalists holding scarce resources. Collective sales are
often mentioned as one of the major benefits of being part of a larger union. Not only are prices
often set higher when larger quantities are purchased, also competition is likely to be reduced
- 16 -
when the farmers collaborate rather than compete. Finally, Bebbington utters farmers being easier
detected by the other participants within the chain to be of crucial importance when combating
the existing power structures in the general commodity chain.
According to Bebbington (1991), FOs can furthermore, by actively adapt and disseminate
agricultural technologies in programs they themselves control and administer, contribute to build
sustainable livelihood for the rural poor. In addition, farmer organizations can act as a ‘user
constituency’ for the rural poor, pressuring public sector and non-governmental agricultural
agencies to orient their work to the needs of the rural poor. Lastly, farmer organizations is
claimed by Bebbington to act as an ‘interface’ between the research and extension worlds of
development agencies and the livelihood conditions of the resource poor farmer population (ibid).
With the current recognition of the benefits attached to the creation of farmer organization, how
come the phenomena are not better splayed on a global scale? The Norwegian sociologist, author
and politician Gudmund Hernes (1975) lists five circumstances, under which the possibilities for
people organizing are reduced. The first obstacle in order to organize, Hernes claims to be the
possible deprivation of freedom of speech and organization among the citizens within a nation.
The second obstacle he identifies to involve costs. Namely, that the ones with the highest
advantages of joining such an organization are in some cases unable of handling the costs of
establishment, something often resulting in insufficient representation of interests. In his third
point, Hernes emphasizes the problem of solidarity. He claims the possibilities for organization to
be reduced when the actors with common interest within one field, are affected in different
degrees of resolutions made within other fields. His fourth point is touching upon more concrete
barriers. Even though actors have democratic freedom and permanent interests which are shared
with others, they can meet problems in terms of organization due to physical barriers (i.e. large
distances, poor infrastructure, etc.). In his final point, Hernes underlines despite overcoming all
the abovementioned factors, actors can still meet difficulties in the case of organization due to
their personal terms of action. The problem of free riders is to be found within the field of
organization as well as most other places in the society. When the services offered by an
organization are not limited only to its members, but to all members of the society, it is difficult
- 17 -
to encourage organizational commitment (ibid). Despite being presented more than 30 years ago,
the problematic brought up by Hernes do still prevail, especially within the context of LDCs.
3.2.2 Participation
Holding the common goal of increased development for the global poor, the importance of
participation is commonly agreed. Organizing farmers is one way to encourage involvement, and
the history provides us with numerous evidences of the close connection existing between NGOs,
FOs and the level of participation.
The era of aid and development was up to the late 1970’s dominated by top-down approaches,
concerned by implementing western ideas and knowledge rather than to encourage participation.
Throughout history agricultural projects have tended to be (at least to some degree) participatory,
as farmers often have been included in discussions about their challenges and needs. Anyhow, it
is not until recently that the necessity of more formal participation has been recognized within
most disciplines, including the agricultural (Oakley et al. 1991). A common understanding does
now exist among most professionals, namely that in order to better ensure the success of a project
farmers’ participation has to be developed more formally (ibid).
In addition to recognize how to best ensure an agricultural project’s efficiency and effectiveness,
Oakley et al. (1991:26) address a range of benefits that can be gained from formal participation of
farmers. In areas containing low level of farmers with access and active contact with agricultural
services, formal participation can make the farmers (or clients) more visible and thereby
contribute to increase the coverage and extension of such services (individual farmers easier
ignored or ‘failed to see’). Furthermore, formal participation of farmers can help breaking down
the inherent resistance to change often apparent in farming communities, and as well assist dispel
any mistrust of external ideas by ensuring the farmers that their ideas will be taken into
consideration and built into the objectives of any given projects. By formal participation it is
easier to guarantee the needs of the farmers to be covered rather than only depend of the ideas of
the outside professionals. Finally, formal participation can make contributions to ensure projects
to benefit the groups of smaller and more marginal farmers, not only the ones better off (ibid).
- 18 -
3.3 The role of NGOs NGOs, or non-governmental organizations, have experienced a steady increase of their activities
throughout the twentieth century, with a particular acceleration within the last couple of decades.
A recent estimate has claimed it to be between fifteen and twenty five thousand NGOs operating
on a global scale (Eade 2000). The primary geopolitical focus is concentrated on the ‘Third
World’ of former European colonies and the ‘Second World” of former (and some still
remaining) communist states (DeMars 2005). Their activities cover a spectre of issues, “…from
feeding famine victims and protecting endangered species, to eliminating nuclear weapons and
AIDS, to democratizing Russia and the Arab world” (ibid:1). Farrington, Bebbington et al.
(1993) claim NGOs to constitute for a promising, but not yet firmly established ‘third sector’.
Hence, it is a sector which is contrasting itself from the practices of both the public (state) and
private (for-profit), due to its frequent interaction with both.
But what is to be included in the expression NGO? All organizations without any governmental
interference, as the name implies? Bebbington, Thiele et al. (1993) claim the term NGOs to
traditionally been applied describing both national and international organizations, based either in
North or South. Clark is being criticized by Farrington, Bebbington et al. (1993) to be all
inclusive when applying the term. Despite distinguishing between the six categories relief and
welfare agencies, technical innovation organizations, public service contractors, popular
development organizations, grassroots development organizations and advocacy groups and
networks, Clark consider them all as NGOs. These classifications made by Clark do not make
any sense according to Farrington, Bebbington et al, claiming they are not being able to
distinguish the work by Oxfam with the work of a local neighbourhood organization when
applying his system. Instead they are presenting their own figure (3.5), where classifications in
accordance to location, scale ownership, orientation, approach and operational dimensions are
made (ibid).
Having the complexity of the term presented, I will throughout the remaining parts of the thesis
refer to NGOs as organizations giving support to grassroots organizations, rather than themselves
being one.
- 19 -
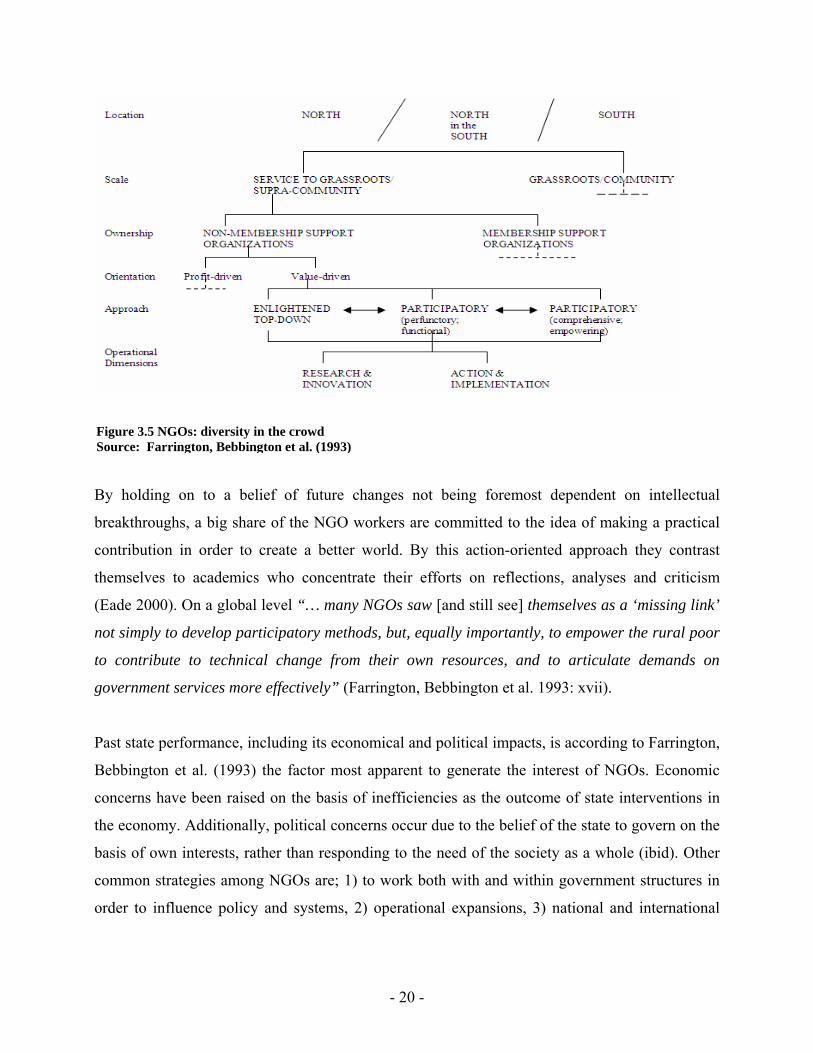
Figure 3.5 NGOs: diversity in the crowd Source: Farrington, Bebbington et al. (1993)
By holding on to a belief of future changes not being foremost dependent on intellectual
breakthroughs, a big share of the NGO workers are committed to the idea of making a practical
contribution in order to create a better world. By this action-oriented approach they contrast
themselves to academics who concentrate their efforts on reflections, analyses and criticism
(Eade 2000). On a global level “… many NGOs saw [and still see] themselves as a ‘missing link’
not simply to develop participatory methods, but, equally importantly, to empower the rural poor
to contribute to technical change from their own resources, and to articulate demands on
government services more effectively” (Farrington, Bebbington et al. 1993: xvii).
Past state performance, including its economical and political impacts, is according to Farrington,
Bebbington et al. (1993) the factor most apparent to generate the interest of NGOs. Economic
concerns have been raised on the basis of inefficiencies as the outcome of state interventions in
the economy. Additionally, political concerns occur due to the belief of the state to govern on the
basis of own interests, rather than responding to the need of the society as a whole (ibid). Other
common strategies among NGOs are; 1) to work both with and within government structures in
order to influence policy and systems, 2) operational expansions, 3) national and international
- 20 -
lobbying and advocacy, and finally 4) to strength the organization of the poor (including
networking and federations) (Eade 2000).
The last point by Eade is of particular interest conducting research at farm level. As mentioned
earlier in this chapter, farmers who organize enhance their chances of breaking out of the
traditional power structure within a commodity chain. Their odds are further strengthened if their
FO receives support from a NGO, as these organizations often constitute a part of an extended
network of partners not only holding agricultural knowledge and technology/equipment, but as
well political influence and economic resources. Being intercepted by a NGO can be vital for the
prosperity among individual farmers or an independent FO. By strengthening the producers in
certain areas or within specific organizations, Bebbington (1991) claims the appearance of NGOs
is likely cause power asymmetries at the producer level.
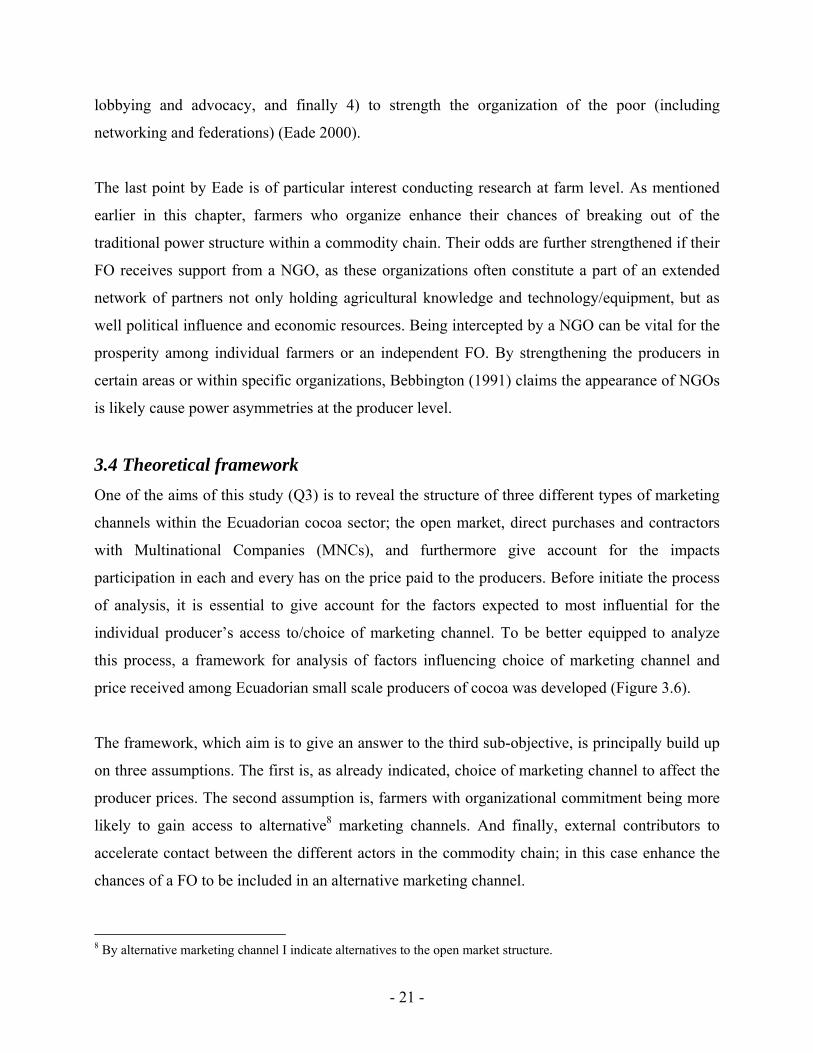
3.4 Theoretical framework One of the aims of this study (Q3) is to reveal the structure of three different types of marketing
channels within the Ecuadorian cocoa sector; the open market, direct purchases and contractors
with Multinational Companies (MNCs), and furthermore give account for the impacts
participation in each and every has on the price paid to the producers. Before initiate the process
of analysis, it is essential to give account for the factors expected to most influential for the
individual producer’s access to/choice of marketing channel. To be better equipped to analyze
this process, a framework for analysis of factors influencing choice of marketing channel and
price received among Ecuadorian small scale producers of cocoa was developed (Figure 3.6).
The framework, which aim is to give an answer to the third sub-objective, is principally build up
on three assumptions. The first is, as already indicated, choice of marketing channel to affect the
producer prices. The second assumption is, farmers with organizational commitment being more
likely to gain access to alternative8 marketing channels. And finally, external contributors to
accelerate contact between the different actors in the commodity chain; in this case enhance the
chances of a FO to be included in an alternative marketing channel.
8 By alternative marketing channel I indicate alternatives to the open market structure.
- 21 -
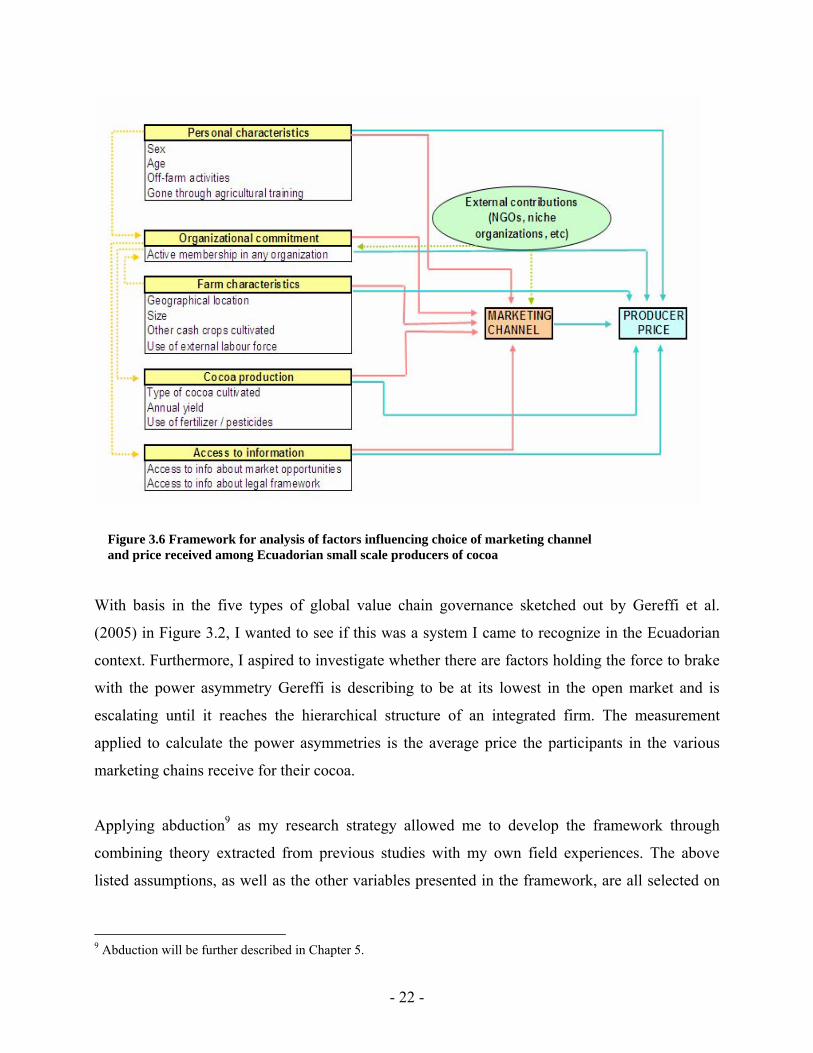
Figure 3.6 Framework for analysis of factors influencing choice of marketing channel and price received among Ecuadorian small scale producers of cocoa
With basis in the five types of global value chain governance sketched out by Gereffi et al.
(2005) in Figure 3.2, I wanted to see if this was a system I came to recognize in the Ecuadorian
context. Furthermore, I aspired to investigate whether there are factors holding the force to brake
with the power asymmetry Gereffi is describing to be at its lowest in the open market and is
escalating until it reaches the hierarchical structure of an integrated firm. The measurement
applied to calculate the power asymmetries is the average price the participants in the various
marketing chains receive for their cocoa.
Applying abduction9 as my research strategy allowed me to develop the framework through
combining theory extracted from previous studies with my own field experiences. The above
listed assumptions, as well as the other variables presented in the framework, are all selected on
9 Abduction will be further described in Chapter 5.
- 22 -
basis of first and secondary information and experiences of which determinants to be influential
to the price setting mechanisms within the Ecuadorian cocoa sector.
The uncertainties were many in the initial part of the research process as I neither held much
knowledge about the global, nor the Ecuadorian cocoa sector before start writing this thesis. Not
knowing exactly ‘where to start searching’ resulted in a rather comprehensive questionnaire10.
The survey was divided into five subsections, each one constituting for what I considered to be of
overall importance in revealing the differences in producer prices.
The first sequence of my questionnaire, cocoa production, was included with the intention to
reveal whether cultivation practices had any impacts on the price received by the farmer. As
already mentioned, there have been conducted a range of studies demonstrating insufficient effort
at producer level to cause low agricultural output (Ramírez 2006, 2007, Collinson and Leon
2000, etc). My motivation was to test whether the agricultural efforts had any impacts on the
price offered the farmers as well (through enhanced quality of the product). The second
subsection is marketing. Taking basis in the commodity chain theory presented earlier in this
chapter, I sought to identify the economical impacts of the individual producer’s sales practices.
Motivated to unveil the advantages obtained by producers participating in different kinds of
marketing channels, special attention was given to the five types of value chain governance
Gereffi et al. (2005) describe in Figure 3.2. Questions concerning national structures/policy
constitute the third part. This group of question was included into the questionnaire to
demonstrate the effects of Collinson and Leon (2000) claiming Ecuadorian cocoa to be marketed
without governmental interference. The matter of organization is the concern of the fourth
subsection, organization and participation theories providing the basis. Here I aspired to figure
out whether the motivation factors and outcome of joining an organization among my selection of
respondents being organized could be compared to the ones listed by Pesche (2000) and
Bebbington et al. (1991). Simultaneously I sought to disclose if it was possible to draw parallels
betweens the ideas presented Hernes (1975) and the motivations for not joining organizations
among the unorganized share of my respondents. In the last subsection, the respondents of my
questionnaire were asked to give account for their background information. These questions
10 See Appendix 5 and 6 for outline of the questionnaires (Spanish and English version)
- 23 -
worked as control variables, controlling whether any personal characteristics could cause impacts
on the producer price.
In the selection of which questions from my survey to transform into independent variables in the
framework, two considerations were done. First, I drew advantage of the experiences gained
through conducting interviews and observations. Additionally, I got the questionnaires reviewed
by professionals within the Ecuadorian cocoa sector, expressing their opinions of the covered
issues. The hypotheses developed in this process (presented in Chapter 6), became later on the
independent variables presented in Figure 3.6.
The yellow dashed arrows at the very left side of the framework are included in order to illustrate
the assumed relationship between the independent variables. Unveiling the relationships between
these variables will be a task too comprehensive to include in this study, and they will therefore
not be given any further attention.
- 24 -
4. Previous studies There exist a range of studies with their attention drawn towards agricultural commodity trade.
While some narrow down their focus to concentrate on one particular link within the commodity
chain, others hold motive of mapping the entire chain, including its function and its stakeholders.
These latter kinds of studies can either trace the chain upwards, with point of departure in farm
level, or downwards, with a finish product as their starting point. The amount of studies covering
the same aspects of cocoa trade, within the similar conditions as in my research area in Ecuador,
is however smaller. The absence of identical studies causes a wider range of studies to be referred
to in this chapter. Some of the research looks at trade and marketing of cocoa in West African
countries, while other is conducted in Ecuador, concentrating on various aspects within the
national cocoa sector. Unfortunately, I am a little bit too early in getting my hands on a study
currently carried out by the ICCO11 in Ecuador (among several countries), analysing the value
chain in cocoa producing countries
4.1 Commodity chain studies in Ecuador Pilar A. Jano (2007), conducting a study of the marketing chain of Ecuadorian cocoa for her
Master degree at Virginia Polytechnic Institute and State University in 2007, brings up the very
important issue of incentives to produce quality, in form of price premiums, not to be transmitted
efficiently along the marketing chain all the way down to farm level. Among the range of themes
she covers in her thesis, a specific attention directed towards the role of the middlemen is to be
found. Jano concludes with intermediaries to be weak on transaction transparency, creating
transaction costs impediments and reducing the transmission of price incentives to the farmers,
with particular respect to incentives to produce high quality cocoa. Additionally, the author
advertises for the national standards to approve the cocoa exports (INEN norms) to be modified,
resulting in exporters being more demanding with respect to quality from the wholesalers who
will transmit these requirements to the local middlemen and finally to the producers.
Conducting a study of the economic viability of ethical cocoa trading in Ecuador, Chris Collinson
and Marcelo Leon (2000) take point of departure in Agroexportadora Maquita, an alternative 11 For further project description, see http://www.icco.org/projects/projects1.aspx?id=z2p2766
- 25 -
trade organization operating in Ecuador. The aim of their study is to find out how current ethical
trade practitioners operate in the forest products context and whether the trade brings incremental
benefits to forest dependent people. They conclude with Maquita’s business performance to be
impressive, as Ecuador provides a difficult environment in which to conduct business with a
national marketing system not restricting competition. Due to its remarkable commercial
performance, the organization has managed to deliver substantial economic benefits to its target
smallholder cocoa producers. Thereby the authors stress the importance of organization and
collective sales to be carried out in order to enhance the income level of Ecuadorian cocoa
farmers. Certifications (Fair Trade, Rain Forest friendly, Organic, etc) contributing to increase
the value of their product are difficultly achieved for individual farmers. Easier access to
certifications is one of a whole range of factors contributing to an enhanced likelihood of
increased income for smallholders joining organizational activities.
Anthony Bebbington (1991) is covering the issue of farmer organizations in Ecuador. In addition
to bring up three main functions of farmer organizations (already referred to in the theory
chapter), Bebbington claims Ecuadorian FOs to be formally organized at several levels. Moving
away from the basic stage constituting for a household or kin group, FO’s are found at
community-, parish- and county level. While the lower level groups primarily perform an
interfacing function, the active research and extension function, in addition to the constituency
role, are more likely to be performed among the higher level groups. Another point made by
Bebbington is the interference of NGOs. Despite bringing a range of advantages to the FOs
‘gaining their support’, external contributions by NGOs are likely stimulate competitiveness
between communities and thereby weaken the inter-community collaboration.
Being presented as a study of the structure and dynamics of the Ecuadorian cocoa chain, the
technical document set out by Pedro Ramírez (2006) for Ecuadorcocoaarriba12 gives a thorough
account for the different mechanics and actors in the global cocoa market. Loaded with frequent
statistics and illustrations, the paper is designed as a general ‘cocoa guide’. The document
provides the reader with useful and well arranged information, especially in its last chapter,
12 A collaboration between the German international cooperation enterprise GTZ and the Ecuadorian innovation and exportation organ CORPEI
- 26 -
presenting the visions and goal for how the chains should develop towards 2010. The formulation
of these goals can be interpreted as solution to current problems or challenges within the sector.
Some of them Ramírez identifies to be: 1) Renovate and create new plantations in order to obtain
larger volumes 2) Ensure better quality of the cocoa exported by strengthen the national quality
control system, forbid exportation of products with poor quality and create agreement within all
levels of the chain in order award (economically) high quality cocoa 3) Create new and
strengthen existing farmer organizations to encourage collective commercialization.
CORPEI (2006) is the author of Ecuador Exporta, a magazine presenting various issues
concerned with innovations and market dynamics. In December 2006 the entire edition was
dedicated to the topic of how to establish a competitive strategy of the chain of fine and aromatic
cocoa in Ecuador, with various key figures in the Latin American cocoa industry making their
contribution. The conclusion of where to direct the attention after having the different viewpoint
presented, was narrowed down to include four core areas: 1) Enter new markets 2) Increased
quality of the cocoa 3) Provide technical assistance 4) Extended commercialization. Based upon
the background of the contributors in this debate, these four areas are where the LA ‘cocoa elite’
identifies the recent, most severe challenges in Ecuadorian cocoa sector to be located, and where
future improvements must be carried out.
4.2 Studies of international cocoa trade With an aim to investigate the effects of domestic policies on exportable primary commodities,
W. Asenso Okyere (1989) applies the case of cocoa in Ghana. In the paper he argues it is not only
international market problems, but additionally the misguided and conflicting economic policies
of LDCs which are responsible for the economic challenges faced by these nations. In order to
illustrate his point, Okyere illuminate the strong connection between LDCs domestic economic
policies and the well-being of their export sector. In the conclusion, the author explains the
improvements in the Ghanaian cocoa sector and the nation’s economy to be caused by the
country’s careful examination and adjustment of its domestic economic prices, rather than
improvements in international terms of trade or dramatic changes in the consumer demand for
cocoa.
- 27 -
In a working paper for National Bureau of Economic Research (NBR), Christopher L. Gilbert
and Panos Varangis (2003) take point of departure in West African cocoa producers in
illustrating the effects of liberalization of the tropical agricultural markets. As a consequence of
the liberalization, which major objective was farmers to obtain a higher share of the FOB price,
cocoa producers do now face global, rather than domestic prices. The motivation for the study
conducted by Gilbert and Varangis was to identify what impacts this new trade pattern, caused by
an increased globalization, has caused on producer level. The authors argue producers currently
to get a higher share of a lower price, as lower world prices are the outcome of a downward shift
of the aggregated supply curve, in conjunction with inelastic demand. In other words, the farmers
belonging to the liberalized African markets can in general not be claimed for being better or
worse off.
Ghana provides as well the basis for Niels Fold’s (2002) studies stressing the importance of
spatial sub-systems of the global cocoa chain. According to Fold, the structural patterns and
relationships in two given sub-systems, the regional trading-sorting-grinding complex in the
Zaanstreek, Amsterdam and the national cocoa bean supply system in Ghana, suggest that the
dynamic of ‘bi-polar’ buyer-driven chains is best comprehended in terms of various types of
containment strategies of the lead firm. In the type of bi-polar chain Fold claims the cocoa chain
to be, the major markets are slow-growing and far-reaching mergers and acquisitions are
extremely costly. These characteristics make containment the key for understanding the dynamics
of the chain. In the understanding of the word containment, Fold includes “…company strategies
constantly defend and try to improve positions in the global market by creating competition
among suppliers upstream and expanding the portfolio of customers and sales outlets
downstream” (ibid: 246). Like Gilbert and Varangis, Fold brings up the theme of liberalization
and privatization of domestic trade, by stating the former focus on market prices now to have
been accompanied by a concern for global supply stability. The reason for this concern is the
impacts declined income among smallholders may have on the global supply of cocoa. The
producers are likely to put less effort in the cultivation practices if they feel they are not awarded
properly for their labour input.
- 28 -
5. Method
“Sometimes we find a case, and sometimes a case finds us. In both instances, selection combines
purpose and serendipity” (Hay 2000:41).
5.1 Case studies The phrase by Iain Hay introducing this chapter does in a large degree reflect the circumstances
which took place in my own process of picking a case to investigate. My aim, or purpose, was to
conduct a case study concerned with agricultural commodity trade in Latin America, a
coincident, or call it serendipity, made it cocoa trade in Ecuador.
A case study Yin (1993:3) defines as a “... method of choice when the phenomenon under study is
not readily distinguishable from its context”. Sine I was to compare the average price received by
cocoa producers participating in various marketing channels, it became crucial to locate a
geographical area where these kinds of farmers were to be found, producing and selling their
cocoa under conditions as similar as possible. To give account for the circumstances giving the
producers access to one of the given marketing channels, a framework for comparative case study
was applied. The application of such a comparison, Charles C. Ragin states “... provides a basis
for making statements about empirical regularities and for evaluating and interpreting cases
relative to substantive and theoretical criteria” (1989:1).
5.2 Choice of research strategies
5.2.1 Abduction
The 20th century’s philosophers of science have generally drawn distinctions between the logic of
discovery and the logic of justification. With the aim of unifying these two perspectives and
providing some design insights for future ones, the new abstraction paradigm of abduction was
introduced (Magnani 2001).
- 29 -

Figure 5.1 The epistemological model of diagnostic reasoning Source: Magnani (2001:23)
Abduction explains effects. It is reasoning
from effect to cause or reason. Declaring
theory both to guide and to be the
outcome of research, abduction must be
placed somewhere in between the
disciplines of deduction and induction.
Daniel W. Bromley (2006:217) claims
abduction to be ”… inferring the
existence of a fact quite different from
anything observed, from which, according
to known laws, something observed would
necessarily result”. By this he recognize a
third way of knowing, and thereby
contrasts himself from other scientists
who he claims to be unaware of this fact,
as they are imagining “… induction and
deduction [to] constitute (and exhaust) our
ways of fixing beliefs” (ibid: 23). Bromley
furthermore argues abduction to provide
valuable insights and prospects to
researchers, or others, deeply interested in discovering the reason for the occurrence of particular
events. To better illustrate the distinctions (and connections) between induction, deduction and
abduction, Magnani (2001) developed an epistemological model of scientific theory (Figure 5.1),
demonstrating abduction to take use of both observed and expected data in creating hypotheses.
5.2.2 Combining qualitative and quantitative research
The recent increase in the application of multi-strategy research can be interpreted as an outcome
of the criticism directed towards both the quantitative and the qualitative research strategies. As
have been argued by Sayer (1992 quoted in Hay 2000:39-40), that “… each method helps us
answer different research questions, employs different research methods, has different
limitations, and ensures rigour differently”. By combining quantitative and qualitative data, the
- 30 -
researcher is able to take advantage of the qualities from both types (and thereby prevent some of
the limitations held by each) and additionally, he or she can benefit from the possible synergies
between the two.
5.2.3 Validity and reliability
By claiming “Communicating qualitative research is as much about how we know, as it is about
what we know” Iain Hay (2000:180) underlines the importance of transparency in the research
process, including the matters of validity and reliability. Validity, defined by Bryman (2004:545)
as “… a concern with the integrity of the conclusions that are generated from a piece of
research”, can be categorized as external or internal. While the external is concerned with the
possibility of generalization across social settings, the internal examines the correlation between
the observations done by the researcher and the theoretical ideas and concepts developed (ibid).
By applying methods which provides you with more than one technique to measure a concept,
the confidence in your findings is likely to be enhanced (Webb et al. (1966) referred to in
Bryman 2004). In this study a triangulation is constituted by combining the use of questionnaires
with in-depth interviews and independent simple observations, enabling me to cross-check the
obtained results from one research method with another. Reliability, asking to what degree the
measurements of a concept are stable, is of particular concern within the area of quantitative
research. As it is impossible to freeze or copy a social setting, the criterion of reliability is more
difficult to meet in qualitative research (Bryman 2004). Reliability is closely connected to
replication, asking whether the results of a study are possible to repeat or not. A way for the
researcher to ensure the trustworthiness represented by reliability and replication is through
transparency, by detailed descriptions of his or her procedures during the investigation. It is
easier for a researcher to create trust among his readers by being conscious (and consistent) of the
importance of reliability from the very start of the investigation process.
5.3 Choice of methods for data collection The information gathered to this study was extracted in two different ways; through quantitative
and qualitative research strategies. The purpose behind combining the two strategies was the
quantitative data collection to assist guide the direction of the further qualitative research.
- 31 -
Holding a limited number of contacts in the area in which I was to carry out the fieldwork, the
respondents for both research strategies had to be picked through the application of snowball
sampling. Snowball sampling is identified by the researcher first to establish contact with a small
group of people, and further uses these contacts to find further participants for his or hers
research (Bryman 2004). In this case, this initial group of people was key figures (above farm
level) within the marketing channels I was to investigate.
5.3.1 Quantitative methods
To extract quantitative information from the producers, questionnaires primarily made up of
closed questions were distributed. The motivation for using this technique was surveys being a
great way to gather standardised and comparable information easily applied in data analyses, and
additionally being able to collect a rather large quantity of data within a short period of time.
Expecting the level of illiteracy to be high among my respondents, I designed most questions to
contain alternatives to be ticked out. Reading the questions out loud and encouraging the
respondents to help each other if written comments or explanations where requested, enabled me
to gather information from groups of respondents simultaneously (which was crucial for me as I
was to collect all the data myself). The questionnaires were commented and adjusted by one of
my contacts in the Ecuadorian cocoa sector and pre-tested by a group of farmers before applied
for further the data collection.
5.3.2 Qualitative methods
The part of my fieldwork involving qualitative research was based upon semi-structured
interviews and observations. In addition to interview a selection farmers, the purpose of my
qualitative data collection was to extract information from actors above farm level. Carrying out
interviews at producer level, point of departure was taken in the questions listed in the
abovementioned questionnaire. In order to transform the questionnaire to a semi-structured
interview guide the original questions were made more open. By eliminating the alternatives
given in the questionnaire I allowed my respondents to answer on their own terms and to come
up with unexpected responses.
- 32 -
When conducting interviews with purchasers, NGO workers and other key figures within the
cocoa sector, I applied loosely designed interview guides based on few, but very wide questions.
When collecting this ‘additional information’ I took full advantage of the flexibility of the semi-
structured interviewing. I made continuous adjustment in between and during interviews in order
to extract information as useful as possible.
When entering the ‘unfamiliar’ role as an interview object, the respondents are likely forget,
oversee or avoid certain facts, with or without purpose of doing so. In order to achieve a general
overview and better understanding of information hard to extract from interviews I applied
simple observation. Bryman (2004:544) defines this research method as “… the passive and
unobtrusive observation of behaviour”. By doing so, I got the possibility to discover ‘everyday’
events and practices with my own eyes, trying not to interrupt the surroundings with my
appearance.
5.4 Choice of methods for analysis Having conducted a multiple-strategy research, including the collection of both quantitative and
qualitative data, different methods and equipments are needed in order to analysis the results.
5.4.1 Analysis of quantitative data
The quantitative data collection was carried out to reveal tendencies apparent among my selection
of respondents, as well as to develop a solid and clearly set out basis for the further analysis
throughout the commodity chain. To examine, identify and explain connections between the
gathered quantitative information different techniques in SPSS and MiniTab were applied. My
theoretical framework containing two different stages in need to undergo quantitative analyses
implied two distinct regressions to be conducted. In the first regression analysis marketing
channel was appointed to be the dependent variable, in the other, producer price. The two
dependent variables being differently shaped created a need for two different types of analyses to
be applied running the regressions. Marketing channel being a categorical variable with the
alternatives open market and direct purchase, requested the application of binary logistic
regression. Producer price being an ordinal variable enabled me to run a linear regression in
SPSS in order to both measure and draw relationships between the variables.
- 33 -
Multiple regression
As multivariate analysis enables the researcher to augment the numbers of variables applied, it is
claimed to cause a better coverage and a more complete presentation of the overall picture of the
specific research area (Midtbø 2007). Running a multiple regression does as well result in
augmented precision, and thereby enhanced credibility. This is achieved by exclusion of
distorting influences from the other independent variables, as these are held constant while the
effect of one particular variable is measured (Midtbø 2007, Lewis-Beck 1980).
The purpose of conducting a regression analysis is to identify the relationship between the
dependent variable Y and the explanatory variable X (Hagen 2003). The procedure of performing
a multiple regression is a straightforward extension of a bivariate (Lewis-Beck 1980), but where
the latter is only concerned with identifying a relationship between two variables, a multivariate
analysis ”entails the simultaneous analysis of three or more variables” (Bryman 2004:235). As
“… few phenomena are products of a single cause” Lewis-Beck (1980:47) argues for the
dependent variable to be fuller explained with the application of multiple regression.
In simple linear regression, the outcome variable Y is predicted using a straight line/equation
(Field 2005). In an elementary three-variable case is Y to be determined by X1 and X2, plus the
error term e. Y = Dependent / result variable X = Explanatory / independent variable(s) a = Constant b = Parameter for explanatory / independent variable(s) k = Number of explanatory variables e = Error term Subscript = Explanatory variables
Y = a0 + b1X1 + b2X2 + b3X3 … bkXk + e
Working with a dependent variable which is categorical requires the application of logistic
regression. The reason this is the relatively high probability for the assumption to be violated
when a dichotomous outcome variable is applied in a linear regression. Logistic regression is
characterized by Andy Field (2005) as a multiple regression applying a dependent variable which
is a categorical dichotomy and predictor variables being either continuous or categorical. In other
words, logistic regression identifies to what degree the various independent variables have any
impacts of whether the dependent variable inhabit one out of two different characteristics. The
equation for a multiple predictor version is written:
- 34 -
P (Y) = Probability for Y to occur
e = The base of natural logarithms
b0 = Constant x1 = Predictor variable b1 = Coefficient
P (Y) = _______________1_________________ _ (0 + b1x1 + b2x2 + … + bnxn + εi) 1 + e
Studying the equation a multiple regression equation can be identified at the bottom line. Despite
the similarities between the two analyses, we cannot apply linear regression directly into a
situation in which the outcome variable is dichotomous. The reason for this is the
abovementioned assumption of the relationship between the variables in a linear regression to be
linear in order for the model to be valid.
Multicollinearity
Multicollinearity, meaning “… a situation in which two or more variables are very closely
linearly related” (Field 2005:738), might affect the parameters of a regression model. Perfect
multicollinearity occurs when one of the independent variables is perfectly correlated with
another independent variable or linear combination of other independent variables (Lewis-Beck
1980). According to the Swedish professor of mathematics Rolf Sundberg (2002:365), “The
‘collinearity problem’ refers to the fact that in a multiple regression with collinearity, least
squares regressions are unstable or not even uniquely defined, have highly inflated variances,
and are impossible to interpret individually”.
With the following multiple regression model: Y = a0 + b1X1 + b2X2 + e,
a perfect multicollinearity would be present if: X2 = c0 + c1X1
as X2 is the perfect linear function of X1 (Lewis-Beck 1980).
Sundberg (2002) argues that there are two frequent causes for collinearity. He claims the first to
take place when the independent variables represent the composition of a sample so they sum up
(or very near) to a 100%. The second cause occurs in the application of a measuring instrument
meant to register a large set of variables (often automatic) is exposed to a limited sample (i.e. due
to cost or time reasons). A perfect multicollinearity will cause a breakdown of the entire analysis
(Midtbø 2007). But although a high level of multicollinearity will make it hard to separate the
individual effects, its occurrence does not necessary cause harm to a prediction. The most
- 35 -
important consideration to take when collinearity is detected is to find out whether it is inherent
in the studied data set, or if it is generated by design (Sundberg 2002).
5.4.2 Analysis of qualitative data
The purpose of my qualitative data collection was not only to fill in the gaps from the
quantitative research, but as well to conduct a further and deeper investigation moving upwards
in the commodity chain and seek to talk to key persons within the Ecuadorian cocoa sector.
Content analysis
In order to seek meaning from the data, researchers analyse the information extracted during
interviews. A content analysis can either be carried out searching for manifest or latent content
(Hay 2000). While a Manifest Content Analysis (MCA) is used in order to evaluate the visible,
surface content of a document, the Latent Content Analysis (LCA) is applied to search the
document for certain themes. The document, often being an interview transcript, is thereby
searched for different words (expressing feelings, etc) in a MCA, and for a specific matter in a
LCA (ibid). A range of definitions are set out in order to cover the purpose of a content analysis,
in most of the suggestions the qualities objectivity and being systematic are referred to. This is as
well apparent in the definition drawn by Holsti in 1969, claiming content analysis to be “… any
technique for making interferences by objectively and systematically identifying specified
characteristics of messages” (quoted in Bryman 2004:182).
Narrative analysis
To get a better understanding of the interviewees’ perception of certain events or circumstances,
the application of a narrative analysis can be useful. According to Bryman (2004:412) “Narrative
analysis is a term that covers quite a wide variety of approaches that are concerned with the
search for and analysis of the stories that people employ to understand their lives and the world
around them”. In other words, it is not what really happened which is focused on, but rather to
create an understanding of how the respondent makes sense of it. In my case, asking the
producers about the dynamics of the commodity chain will not necessarily provide me with the
correct answers, but I will get an idea of how the farmers comprehend the different mechanisms -
an opinion which can be even more interesting.
- 36 -
6. Analysis and discussions
Before presenting the analysis I will give a brief description of the research area and my sample.
The three following sections (6.2 – 6.4) will be dedicated to the analysis of my sub-objectives,
one by one being presented within each sub-chapter. Section 6.2 will be a rather comprehensive
chapter, giving account for the organization of the production and marketing of cocoa in Ecuador.
In Section 6.3 the producer prices received by the farmers participating in different marketing
channels are presented and compared to price statistics published by ANECACAO and the
Ecuadorian Ministry of Agriculture and Livestock (MAG). Finally, section 6.4 explains the
various factors causing variations in the producer price among the participants in the various
marketing channels.
6.1 Research area and sample
6.1.1 Research area
According to the last Censo Agropecuario (national agricultural survey), realized in 2000,
243 059 hectares of single cultivated cocoa and 190 919 hectares of associated cocoa cultivation
exist in Ecuador (SICA 2007d). The province of Los Rios account for 24,1% of the nation’s
single cocoa production, while Guayas account for 21,8%, Manabí 21,63%, Esmeraldas 10,09%
and El Oro 7,62%. The left out share (14,76%) is cultivated in the remaining provinces of the
inter-Andean alley and in the Amazon (ibid).
As mentioned in the Chapter 5, my goal was to accomplish a study of cocoa producers
participating in open markets, contractors with MNCs and direct purchases. The occurrence of
these three groups of farmers became therefore crucial in my selection of research site. Having
located several provinces where participants in the three marketing channels were apparent, the
final decision fell on Los Rios. Choosing Los Rios was not done only on the basis of holding the
county’s biggest share of single-cocoa producers, but as well its geographic position was a
contributing factor for this choice. Being located halfway between the capital Quito and the
location of Ecuador’s most important port, Guayaquil, made transportation in between the three
sites relatively fast and uncomplicated (see illustration in Figure 6.1).
- 37 -
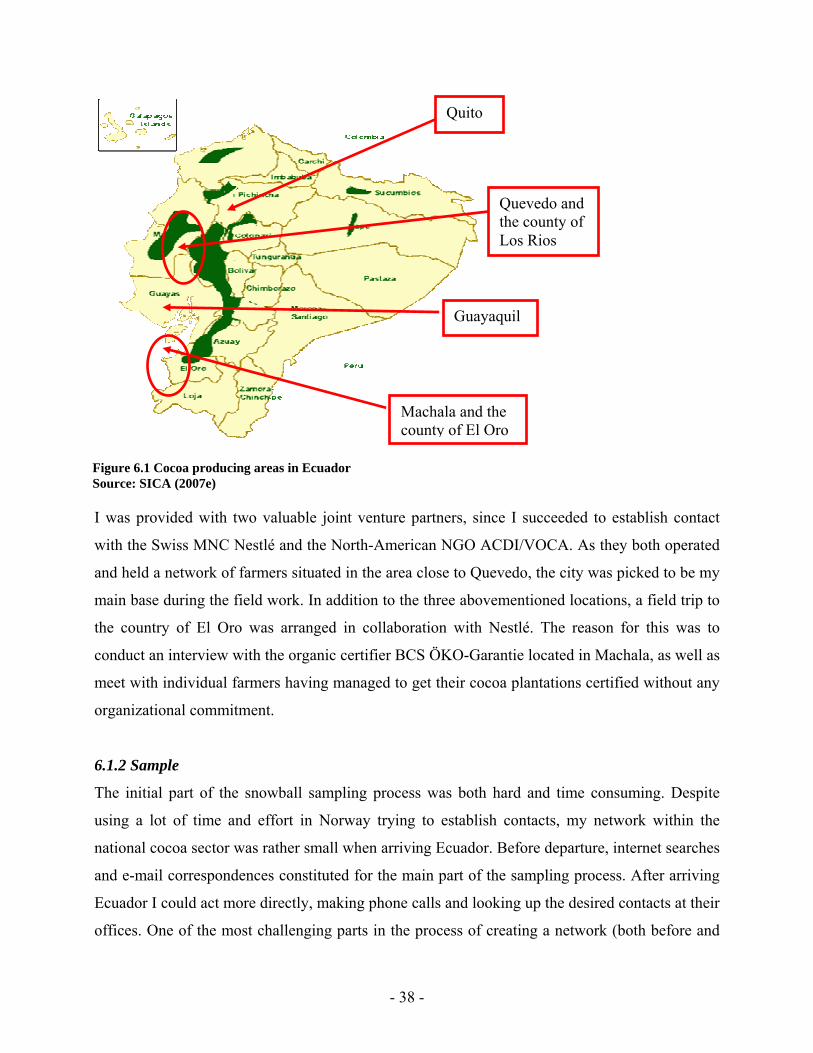
Quevedo and the county of Los Rios
Machala and the county of El Oro
Guayaquil
Quito
Figure 6.1 Cocoa producing areas in Ecuador Source: SICA (2007e)
I was provided with two valuable joint venture partners, since I succeeded to establish contact
with the Swiss MNC Nestlé and the North-American NGO ACDI/VOCA. As they both operated
and held a network of farmers situated in the area close to Quevedo, the city was picked to be my
main base during the field work. In addition to the three abovementioned locations, a field trip to
the country of El Oro was arranged in collaboration with Nestlé. The reason for this was to
conduct an interview with the organic certifier BCS ÖKO-Garantie located in Machala, as well as
meet with individual farmers having managed to get their cocoa plantations certified without any
organizational commitment.
6.1.2 Sample
The initial part of the snowball sampling process was both hard and time consuming. Despite
using a lot of time and effort in Norway trying to establish contacts, my network within the
national cocoa sector was rather small when arriving Ecuador. Before departure, internet searches
and e-mail correspondences constituted for the main part of the sampling process. After arriving
Ecuador I could act more directly, making phone calls and looking up the desired contacts at their
offices. One of the most challenging parts in the process of creating a network (both before and
- 38 -
during my fieldwork) was to deal with aspects like frequent delays and cancellation of meetings,
unreliability and disclaims of liability. These ‘cultural differences’ resulted in many
disappointments, schedules being revised over and over again and lot of waiting and uncertainty.
The importance and utility of networking are increasingly being acknowledged on a global scale,
and this was something I certainly got to experience during my fieldwork. When reaching
through to key figures in ACDI/VOCA and Nestlé (which came to be my most important partners
both during and after my stay), getting access to farmer organizations, as well as other actors in
the sector became a lot easier. Additionally, this cooperation, especially with ACDI/VOCA,
became crucial for reaching out to the producers, as they, due to lack of registration and mapping,
were hard to track without holding local knowledge.
After spending three months in Ecuador I had managed to collect 96 questionnaire responses and
conducted about 50 interviews with various actors placed at all levels within the national
commodity chain (including unskilled and professionals, both directly and indirectly involved in
the process of commercialization). Unfortunately the intended group of contractors with MNCs
had to be eliminated. This happened due to two reasons. First I came to experience that Nestlé
encouraged and stimulated to direct purchase without signing supply contracts with the farmers.
As the farmers did not have any obligations to Nestlé and where free to sell their cocoa to various
purchasers (which they did when they were offered higher prices), the differences to the farmers
selling their cocoa at the open market vanished. Secondly, the strategy of Nestlé to increase the
amount of cocoa being purchased directly from the farmers was a brand new project and the
producers involved were still very few. Hence, it would have been hard to gather responses from
a sufficient amount of farmers. Despite the difficulties, I did accomplish the cooperation with
Nestlé. My contacts within the corporation provided me with valuable information about the
purchasing practices carried out by the company and the Ecuadorian cocoa sector in general.
Furthermore, holding a vast network, my contacts helped me get in touch with a range of actors
within the sector. Additionally, I was enabled to conduct interviews with some of the farmers
recently being included in the project of direct purchase, learning about their experiences so far.
- 39 -
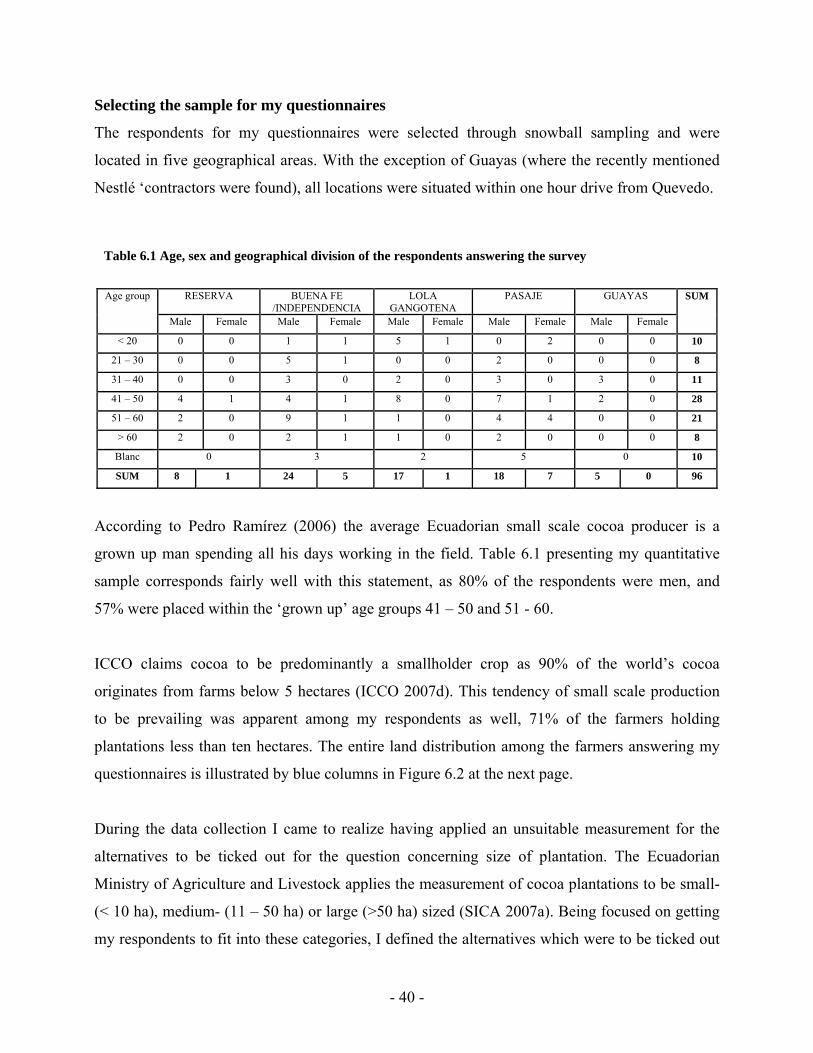
Selecting the sample for my questionnaires
The respondents for my questionnaires were selected through snowball sampling and were
located in five geographical areas. With the exception of Guayas (where the recently mentioned
Nestlé ‘contractors were found), all locations were situated within one hour drive from Quevedo.
Table 6.1 Age, sex and geographical division of the respondents answering the survey
RESERVA BUENA FE /INDEPENDENCIA
LOLA GANGOTENA
PASAJE GUAYAS Age group
Male Female Male Female Male Female Male Female Male Female
SUM
< 20 0 0 1 1 5 1 0 2 0 0 10
21 – 30 0 0 5 1 0 0 2 0 0 0 8
31 – 40 0 0 3 0 2 0 3 0 3 0 11
41 – 50 4 1 4 1 8 0 7 1 2 0 28
51 – 60 2 0 9 1 1 0 4 4 0 0 21
> 60 2 0 2 1 1 0 2 0 0 0 8
Blanc 0 3 2 5 0 10
SUM 8 1 24 5 17 1 18 7 5 0 96
According to Pedro Ramírez (2006) the average Ecuadorian small scale cocoa producer is a
grown up man spending all his days working in the field. Table 6.1 presenting my quantitative
sample corresponds fairly well with this statement, as 80% of the respondents were men, and
57% were placed within the ‘grown up’ age groups 41 – 50 and 51 - 60.
ICCO claims cocoa to be predominantly a smallholder crop as 90% of the world’s cocoa
originates from farms below 5 hectares (ICCO 2007d). This tendency of small scale production
to be prevailing was apparent among my respondents as well, 71% of the farmers holding
plantations less than ten hectares. The entire land distribution among the farmers answering my
questionnaires is illustrated by blue columns in Figure 6.2 at the next page.
During the data collection I came to realize having applied an unsuitable measurement for the
alternatives to be ticked out for the question concerning size of plantation. The Ecuadorian
Ministry of Agriculture and Livestock applies the measurement of cocoa plantations to be small-
(< 10 ha), medium- (11 – 50 ha) or large (>50 ha) sized (SICA 2007a). Being focused on getting
my respondents to fit into these categories, I defined the alternatives which were to be ticked out
- 40 -
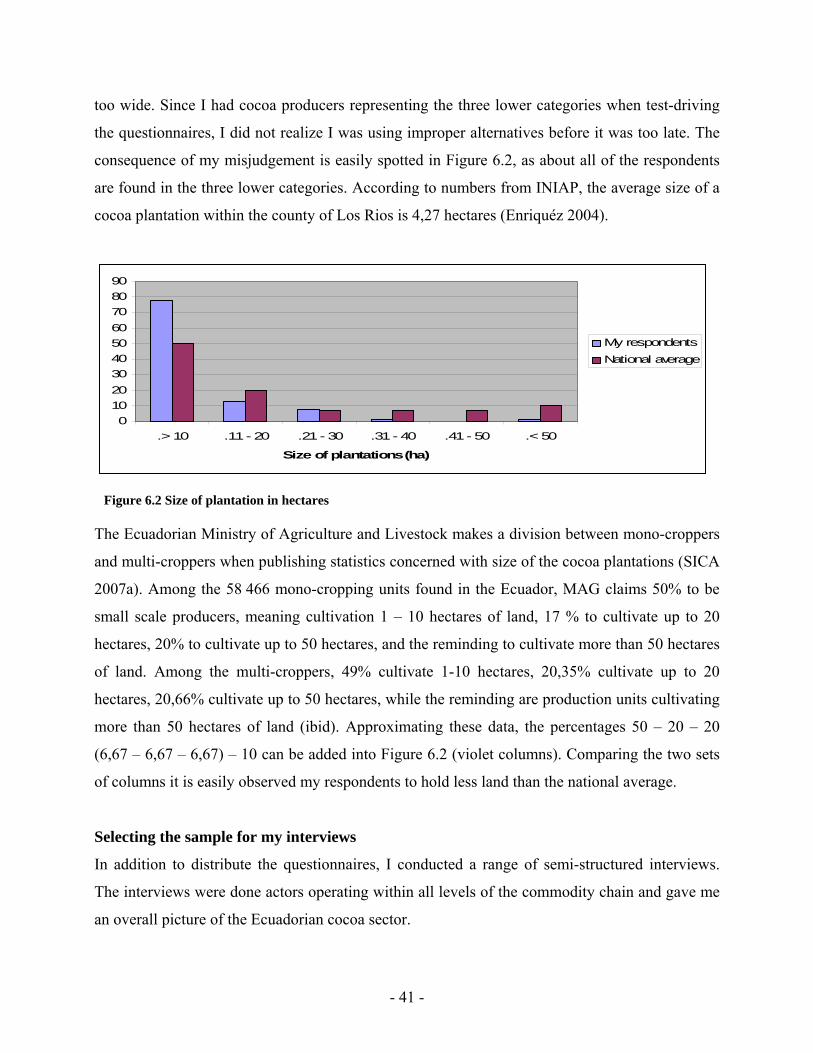
too wide. Since I had cocoa producers representing the three lower categories when test-driving
the questionnaires, I did not realize I was using improper alternatives before it was too late. The
consequence of my misjudgement is easily spotted in Figure 6.2, as about all of the respondents
are found in the three lower categories. According to numbers from INIAP, the average size of a
cocoa plantation within the county of Los Rios is 4,27 hectares (Enriquéz 2004).
0102030405060708090
.> 10 .11 - 20 .21 - 30 .31 - 40 .41 - 50 .< 50
Size of plantations (ha)
My respondentsNational average
Figure 6.2 Size of plantation in hectares
The Ecuadorian Ministry of Agriculture and Livestock makes a division between mono-croppers
and multi-croppers when publishing statistics concerned with size of the cocoa plantations (SICA
2007a). Among the 58 466 mono-cropping units found in the Ecuador, MAG claims 50% to be
small scale producers, meaning cultivation 1 – 10 hectares of land, 17 % to cultivate up to 20
hectares, 20% to cultivate up to 50 hectares, and the reminding to cultivate more than 50 hectares
of land. Among the multi-croppers, 49% cultivate 1-10 hectares, 20,35% cultivate up to 20
hectares, 20,66% cultivate up to 50 hectares, while the reminding are production units cultivating
more than 50 hectares of land (ibid). Approximating these data, the percentages 50 – 20 – 20
(6,67 – 6,67 – 6,67) – 10 can be added into Figure 6.2 (violet columns). Comparing the two sets
of columns it is easily observed my respondents to hold less land than the national average.
Selecting the sample for my interviews
In addition to distribute the questionnaires, I conducted a range of semi-structured interviews.
The interviews were done actors operating within all levels of the commodity chain and gave me
an overall picture of the Ecuadorian cocoa sector.
- 41 -
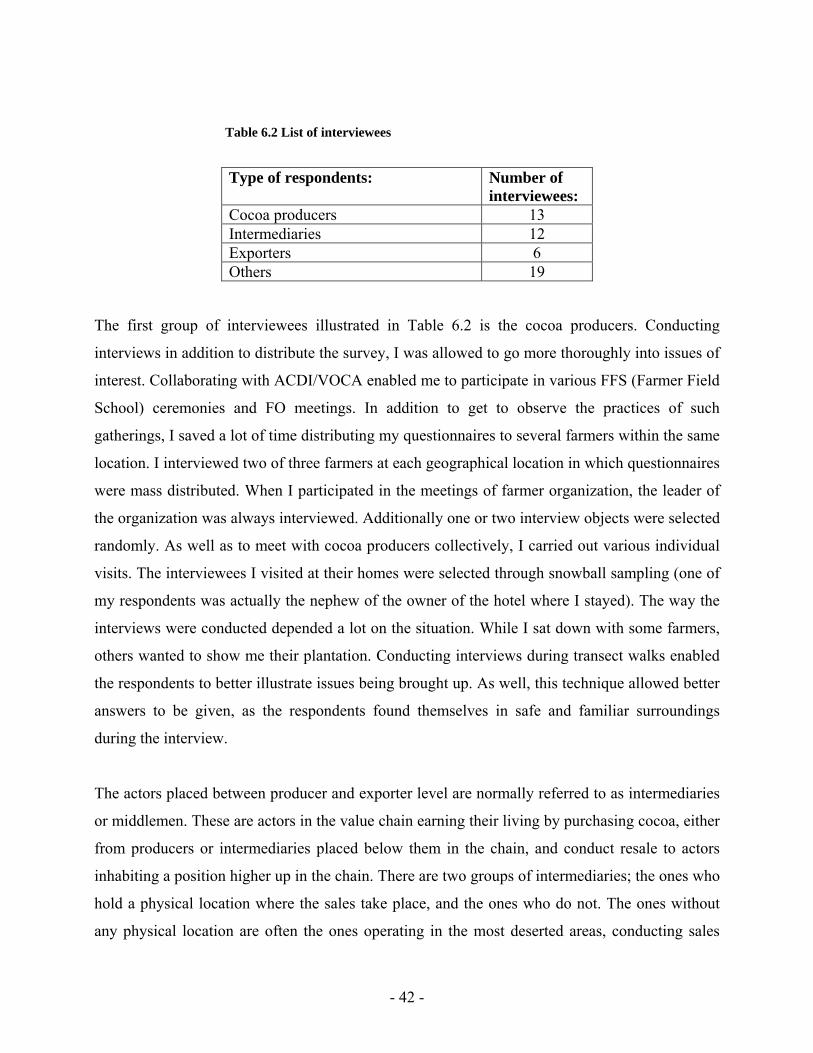
Type of respondents: Number of interviewees:
Cocoa producers 13 Intermediaries 12 Exporters 6 Others 19
Table 6.2 List of interviewees
The first group of interviewees illustrated in Table 6.2 is the cocoa producers. Conducting
interviews in addition to distribute the survey, I was allowed to go more thoroughly into issues of
interest. Collaborating with ACDI/VOCA enabled me to participate in various FFS (Farmer Field
School) ceremonies and FO meetings. In addition to get to observe the practices of such
gatherings, I saved a lot of time distributing my questionnaires to several farmers within the same
location. I interviewed two of three farmers at each geographical location in which questionnaires
were mass distributed. When I participated in the meetings of farmer organization, the leader of
the organization was always interviewed. Additionally one or two interview objects were selected
randomly. As well as to meet with cocoa producers collectively, I carried out various individual
visits. The interviewees I visited at their homes were selected through snowball sampling (one of
my respondents was actually the nephew of the owner of the hotel where I stayed). The way the
interviews were conducted depended a lot on the situation. While I sat down with some farmers,
others wanted to show me their plantation. Conducting interviews during transect walks enabled
the respondents to better illustrate issues being brought up. As well, this technique allowed better
answers to be given, as the respondents found themselves in safe and familiar surroundings
during the interview.
The actors placed between producer and exporter level are normally referred to as intermediaries
or middlemen. These are actors in the value chain earning their living by purchasing cocoa, either
from producers or intermediaries placed below them in the chain, and conduct resale to actors
inhabiting a position higher up in the chain. There are two groups of intermediaries; the ones who
hold a physical location where the sales take place, and the ones who do not. The ones without
any physical location are often the ones operating in the most deserted areas, conducting sales
- 42 -
with cocoa producers without access to markets or transportation opportunities. In remote areas
the competition among the intermediaries is normally scarce. If there are several middlemen
operating within the same area, they try to attract clients with fringe benefits like lending services
and advanced payments. The second group of intermediaries are the ones holding fixed locations.
Being physically established in an environment where competition is likely to be apparent, makes
these middlemen operate in a distinct way than the first mentioned group. The middlemen were
often hard to track and unwilling to talk. While some interviews were conducted within the
duration of a purchase or a sale, others were carried out more profoundly. Anyhow, after
spending quite some days tracing middlemen, I managed to collect the needed information in
order to move one step upward the commodity chain.
The third group of interviewees is the exporters. They tend to be located in core areas for
commercialization of cocoa (in Guayaquil or in the ‘capital’ of highly productive cocoa
producing regions), and are directing their sales primarily towards foreign buyers. Most of the
exporters are associated through ANECACAO (2007), which lists 35 different purchasers to be
connected through the association. I got to conduct interviews with representatives from 6 of
these exporters, three located in Quevedo (Manobanda, Martinetti and Quevexport), the
remaining in Guayaquil (Nestlé, Transmar (Colonial) and UNOCACE). The reason for selecting
these exporters was I traced them to be destinations for the cocoa being cultivated by my
respondents.
‘Others’ constitute the fourth and final group of respondents of my interviews. I addition to
conduct interviews with actors directly involved in the production and commercialisation of
cocoa, I did as well talk to a range of other key figures in the Ecuadorian cocoa sector. Some of
them, like the ones representing ANECACAO and the Ministry of Agriculture and Livestock
were early targeted, while others caught my interest first after being mentioned by other
respondents (INIAP, GTZ, BCS, etc). After having been exposed to a range of personal opinions
conducting interviews within the value chain of cocoa, these respondents13, holding more general
viewpoints, were useful in order to avoid getting too narrow minded.
13 A complete list of correspondences and interviews conducted is found in the Reference chapter, in the very end of the thesis
- 43 -
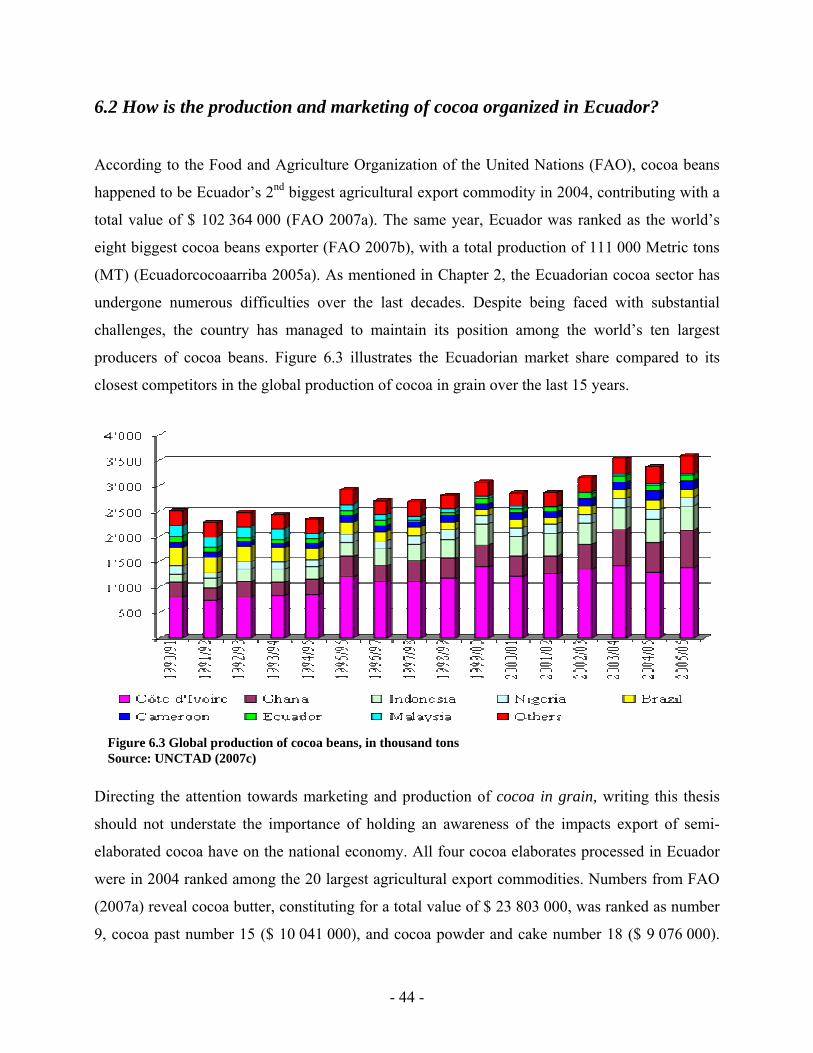
6.2 How is the production and marketing of cocoa organized in Ecuador?
According to the Food and Agriculture Organization of the United Nations (FAO), cocoa beans
happened to be Ecuador’s 2nd biggest agricultural export commodity in 2004, contributing with a
total value of $ 102 364 000 (FAO 2007a). The same year, Ecuador was ranked as the world’s
eight biggest cocoa beans exporter (FAO 2007b), with a total production of 111 000 Metric tons
(MT) (Ecuadorcocoaarriba 2005a). As mentioned in Chapter 2, the Ecuadorian cocoa sector has
undergone numerous difficulties over the last decades. Despite being faced with substantial
challenges, the country has managed to maintain its position among the world’s ten largest
producers of cocoa beans. Figure 6.3 illustrates the Ecuadorian market share compared to its
closest competitors in the global production of cocoa in grain over the last 15 years.
Figure 6.3 Global production of cocoa beans, in thousand tons Source: UNCTAD (2007c)
Directing the attention towards marketing and production of cocoa in grain, writing this thesis
should not understate the importance of holding an awareness of the impacts export of semi-
elaborated cocoa have on the national economy. All four cocoa elaborates processed in Ecuador
were in 2004 ranked among the 20 largest agricultural export commodities. Numbers from FAO
(2007a) reveal cocoa butter, constituting for a total value of $ 23 803 000, was ranked as number
9, cocoa past number 15 ($ 10 041 000), and cocoa powder and cake number 18 ($ 9 076 000).
- 44 -
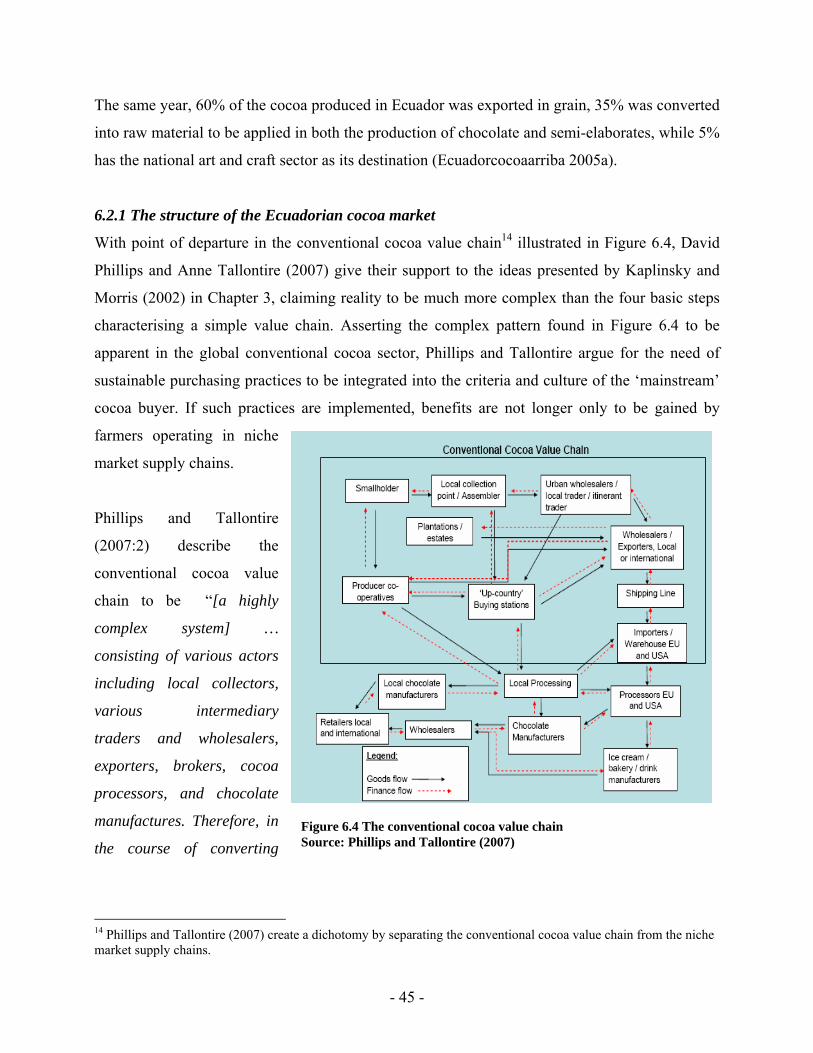
The same year, 60% of the cocoa produced in Ecuador was exported in grain, 35% was converted
into raw material to be applied in both the production of chocolate and semi-elaborates, while 5%
has the national art and craft sector as its destination (Ecuadorcocoaarriba 2005a).
6.2.1 The structure of the Ecuadorian cocoa market
With point of departure in the conventional cocoa value chain14 illustrated in Figure 6.4, David
Phillips and Anne Tallontire (2007) give their support to the ideas presented by Kaplinsky and
Morris (2002) in Chapter 3, claiming reality to be much more complex than the four basic steps
characterising a simple value chain. Asserting the complex pattern found in Figure 6.4 to be
apparent in the global conventional cocoa sector, Phillips and Tallontire argue for the need of
sustainable purchasing practices to be integrated into the criteria and culture of the ‘mainstream’
cocoa buyer. If such practices are implemented, benefits are not longer only to be gained by
farmers operating in niche
market supply chains.
Figure 6.4 The conventional cocoa value chain Source: Phillips and Tallontire (2007)
Phillips and Tallontire
(2007:2) describe the
conventional cocoa value
chain to be “[a highly
complex system] …
consisting of various actors
including local collectors,
various intermediary
traders and wholesalers,
exporters, brokers, cocoa
processors, and chocolate
manufactures. Therefore, in
the course of converting
14 Phillips and Tallontire (2007) create a dichotomy by separating the conventional cocoa value chain from the niche market supply chains.
- 45 -
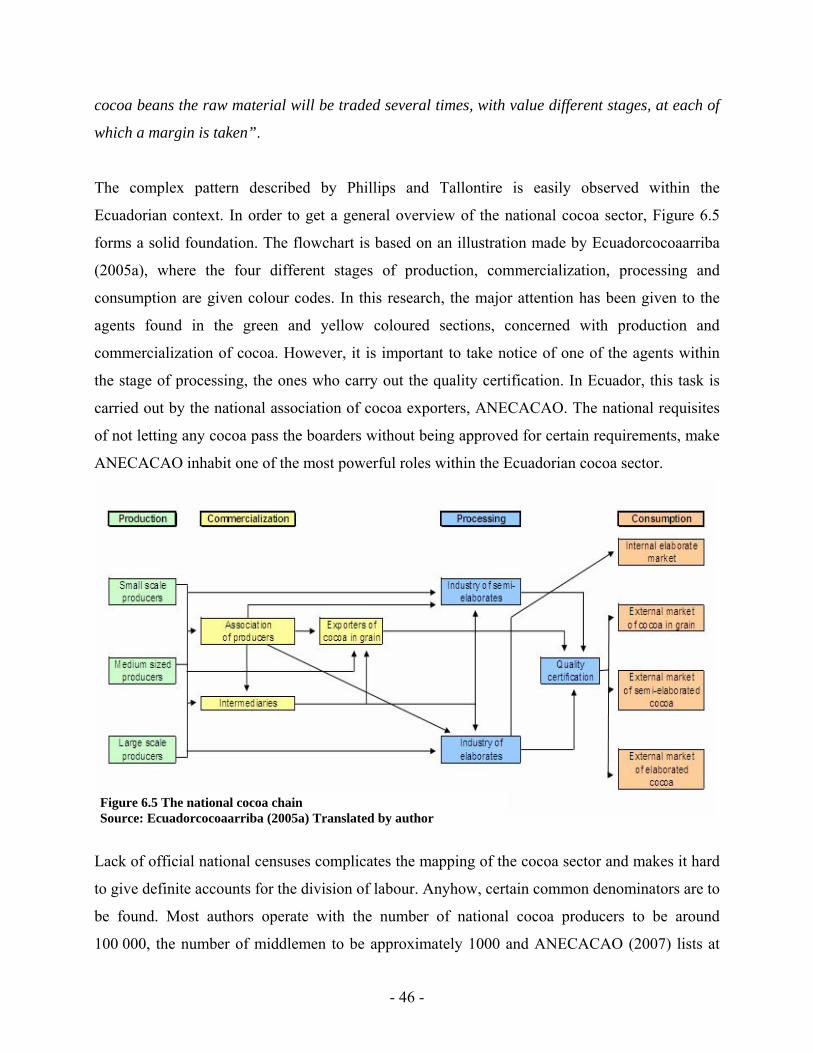
cocoa beans the raw material will be traded several times, with value different stages, at each of
which a margin is taken”.
The complex pattern described by Phillips and Tallontire is easily observed within the
Ecuadorian context. In order to get a general overview of the national cocoa sector, Figure 6.5
forms a solid foundation. The flowchart is based on an illustration made by Ecuadorcocoaarriba
(2005a), where the four different stages of production, commercialization, processing and
consumption are given colour codes. In this research, the major attention has been given to the
agents found in the green and yellow coloured sections, concerned with production and
commercialization of cocoa. However, it is important to take notice of one of the agents within
the stage of processing, the ones who carry out the quality certification. In Ecuador, this task is
carried out by the national association of cocoa exporters, ANECACAO. The national requisites
of not letting any cocoa pass the boarders without being approved for certain requirements, make
ANECACAO inhabit one of the most powerful roles within the Ecuadorian cocoa sector.
Figure 6.5 The national cocoa chain Source: Ecuadorcocoaarriba (2005a) Translated by author
Lack of official national censuses complicates the mapping of the cocoa sector and makes it hard
to give definite accounts for the division of labour. Anyhow, certain common denominators are to
be found. Most authors operate with the number of national cocoa producers to be around
100 000, the number of middlemen to be approximately 1000 and ANECACAO (2007) lists at
- 46 -
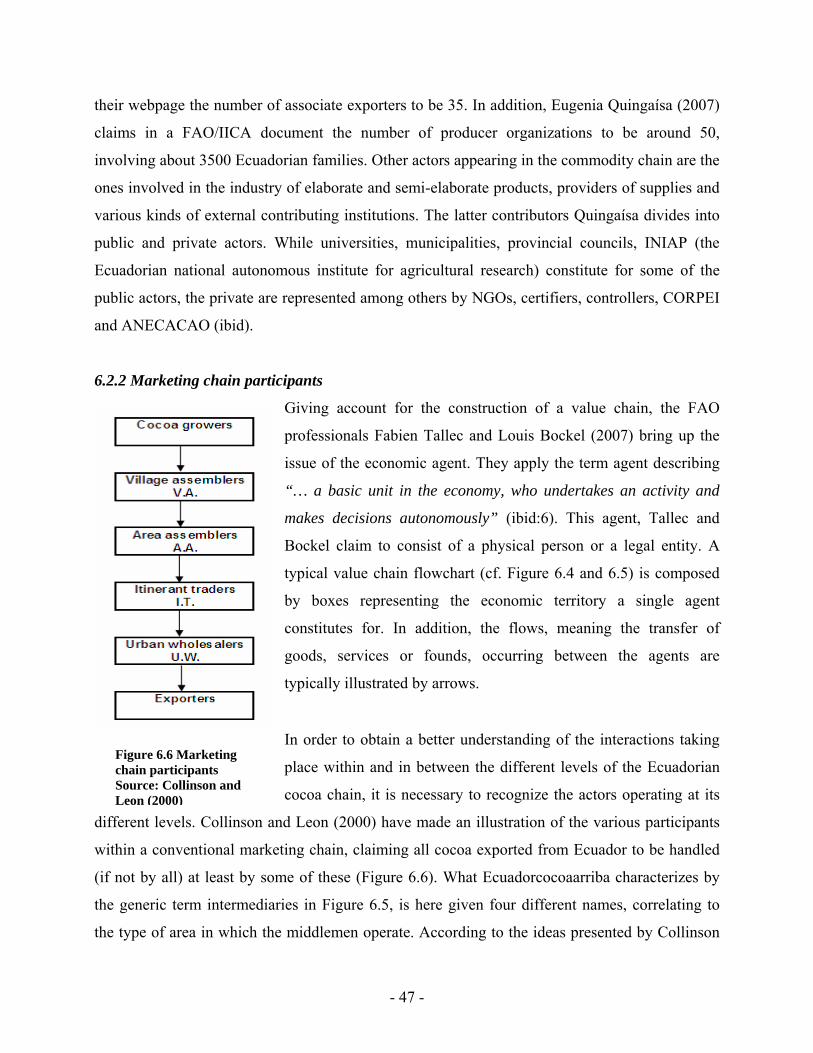
their webpage the number of associate exporters to be 35. In addition, Eugenia Quingaísa (2007)
claims in a FAO/IICA document the number of producer organizations to be around 50,
involving about 3500 Ecuadorian families. Other actors appearing in the commodity chain are the
ones involved in the industry of elaborate and semi-elaborate products, providers of supplies and
various kinds of external contributing institutions. The latter contributors Quingaísa divides into
public and private actors. While universities, municipalities, provincial councils, INIAP (the
Ecuadorian national autonomous institute for agricultural research) constitute for some of the
public actors, the private are represented among others by NGOs, certifiers, controllers, CORPEI
and ANECACAO (ibid).
6.2.2 Marketing chain participants
Giving account for the construction of a value chain, the FAO
professionals Fabien Tallec and Louis Bockel (2007) bring up the
issue of the economic agent. They apply the term agent describing
“… a basic unit in the economy, who undertakes an activity and
makes decisions autonomously” (ibid:6). This agent, Tallec and
Bockel claim to consist of a physical person or a legal entity. A
typical value chain flowchart (cf. Figure 6.4 and 6.5) is composed
by boxes representing the economic territory a single agent
constitutes for. In addition, the flows, meaning the transfer of
goods, services or founds, occurring between the agents are
typically illustrated by arrows.
Figure 6.6 Marketing chain participants Source: Collinson and Leon (2000)
In order to obtain a better understanding of the interactions taking
place within and in between the different levels of the Ecuadorian
cocoa chain, it is necessary to recognize the actors operating at its
different levels. Collinson and Leon (2000) have made an illustration of the various participants
within a conventional marketing chain, claiming all cocoa exported from Ecuador to be handled
(if not by all) at least by some of these (Figure 6.6). What Ecuadorcocoaarriba characterizes by
the generic term intermediaries in Figure 6.5, is here given four different names, correlating to
the type of area in which the middlemen operate. According to the ideas presented by Collinson
- 47 -
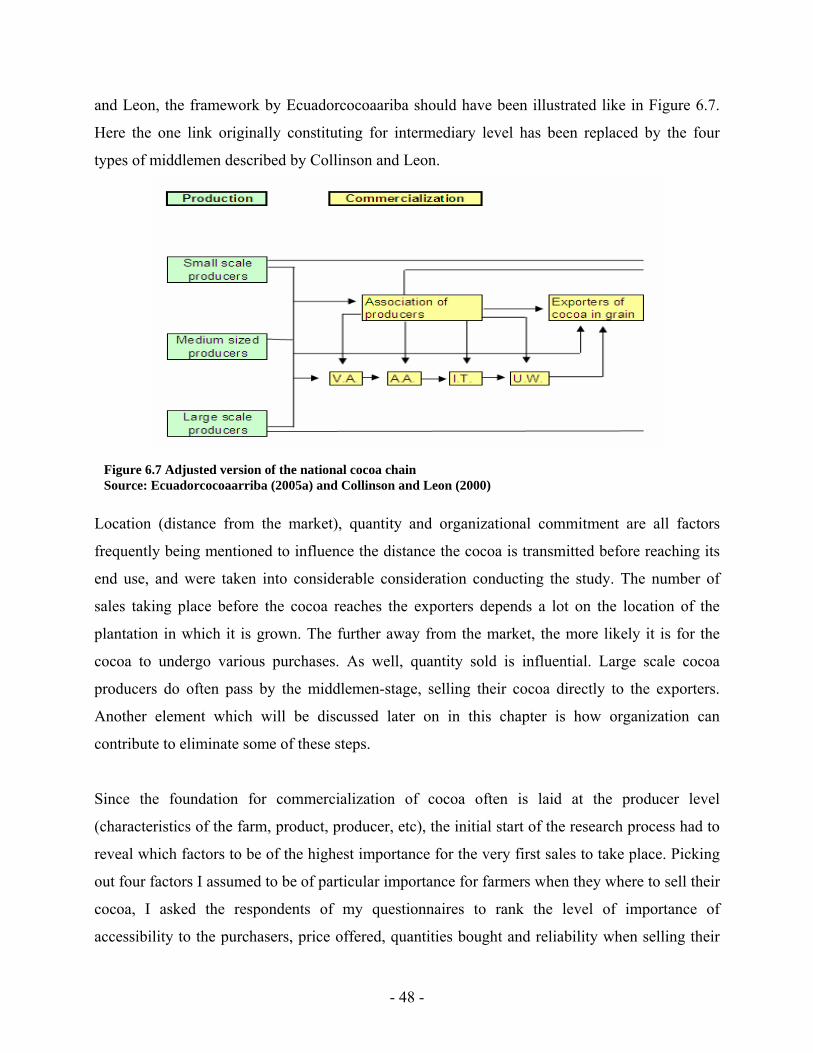
and Leon, the framework by Ecuadorcocoaariba should have been illustrated like in Figure 6.7.
Here the one link originally constituting for intermediary level has been replaced by the four
types of middlemen described by Collinson and Leon.
Figure 6.7 Adjusted version of the national cocoa chain Source: Ecuadorcocoaarriba (2005a) and Collinson and Leon (2000)
Location (distance from the market), quantity and organizational commitment are all factors
frequently being mentioned to influence the distance the cocoa is transmitted before reaching its
end use, and were taken into considerable consideration conducting the study. The number of
sales taking place before the cocoa reaches the exporters depends a lot on the location of the
plantation in which it is grown. The further away from the market, the more likely it is for the
cocoa to undergo various purchases. As well, quantity sold is influential. Large scale cocoa
producers do often pass by the middlemen-stage, selling their cocoa directly to the exporters.
Another element which will be discussed later on in this chapter is how organization can
contribute to eliminate some of these steps.
Since the foundation for commercialization of cocoa often is laid at the producer level
(characteristics of the farm, product, producer, etc), the initial start of the research process had to
reveal which factors to be of the highest importance for the very first sales to take place. Picking
out four factors I assumed to be of particular importance for farmers when they where to sell their
cocoa, I asked the respondents of my questionnaires to rank the level of importance of
accessibility to the purchasers, price offered, quantities bought and reliability when selling their
- 48 -
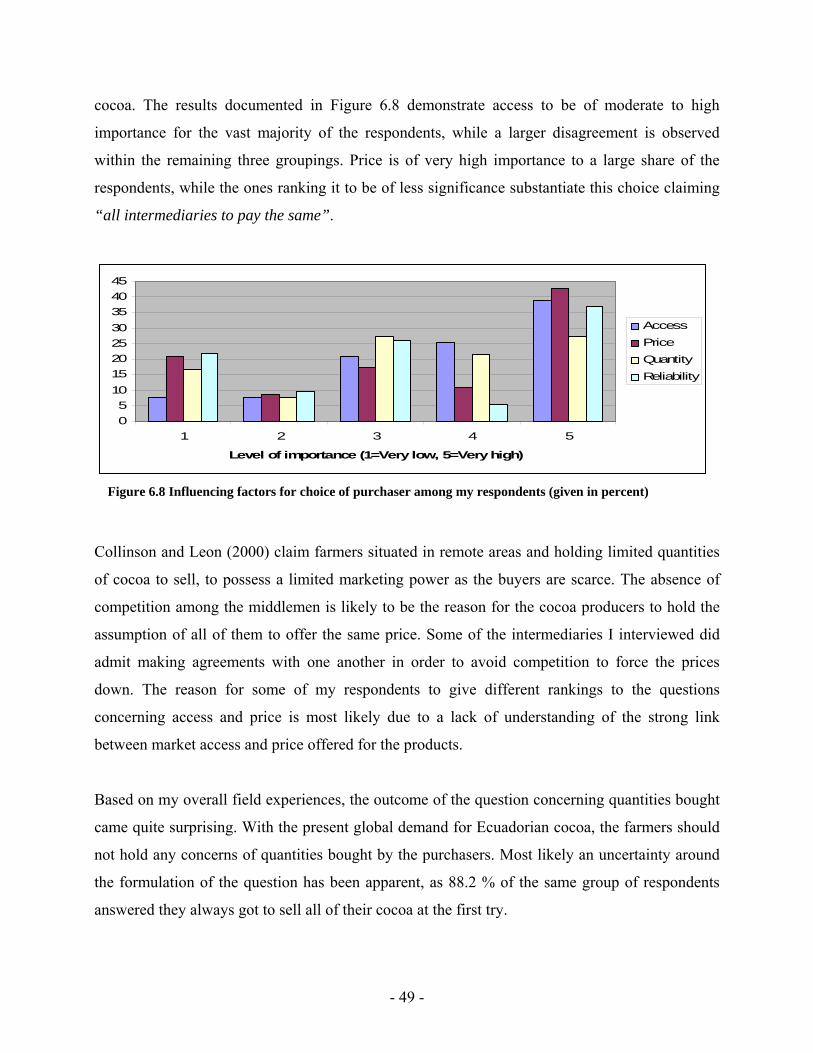
cocoa. The results documented in Figure 6.8 demonstrate access to be of moderate to high
importance for the vast majority of the respondents, while a larger disagreement is observed
within the remaining three groupings. Price is of very high importance to a large share of the
respondents, while the ones ranking it to be of less significance substantiate this choice claiming
“all intermediaries to pay the same”.
05
1015202530354045
1 2 3 4 5
Level of importance (1=Very low, 5=Very high)
AccessPriceQuantityReliability
Figure 6.8 Influencing factors for choice of purchaser among my respondents (given in percent)
Collinson and Leon (2000) claim farmers situated in remote areas and holding limited quantities
of cocoa to sell, to possess a limited marketing power as the buyers are scarce. The absence of
competition among the middlemen is likely to be the reason for the cocoa producers to hold the
assumption of all of them to offer the same price. Some of the intermediaries I interviewed did
admit making agreements with one another in order to avoid competition to force the prices
down. The reason for some of my respondents to give different rankings to the questions
concerning access and price is most likely due to a lack of understanding of the strong link
between market access and price offered for the products.
Based on my overall field experiences, the outcome of the question concerning quantities bought
came quite surprising. With the present global demand for Ecuadorian cocoa, the farmers should
not hold any concerns of quantities bought by the purchasers. Most likely an uncertainty around
the formulation of the question has been apparent, as 88.2 % of the same group of respondents
answered they always got to sell all of their cocoa at the first try.
- 49 -
The respondents seem to disagree strongly about the fourth and final matter concerning the
importance of reliability. Tendencies unveiled in the interviews were my respondents either to
hold a very strong and close relationship to their purchaser, or not holding anyone at all. Limited
or none relationship to the purchaser was apparent among farmers hunting the best price for their
cocoa. These farmers did not belong to the group of the poorest respondents and could afford
await sales when prices were low. A closer relationship to the purchaser was found among the
producers holding limited access to capital. For this group of farmers a close connection with a
purchaser offering lending services was of higher importance than the price offered for their
cocoa. According to the answers given in the questionnaire, 41,8% of the respondents had always
worked with the same purchaser. Another consideration is whether the producers have the
possibility to change purchaser. Among my respondents, as many as 45,6% answered they did
not hold this opportunity (due to both limited access and other commitments/obligations).
6.2.3 Challenges within the commodity chain
As illustrated earlier in this chapter, the global, as well as the Ecuadorian, commodity chain of
cocoa is very complex. With an extensive number of actors involved in the process of
commercialization, it is hard to generate proper revenue for the actors found at the very bottom of
the chain. Some of the authors making contributions to this matter are Collinson and Leon
(2000), Ramírez (2006, 2007) and Jano (2007). All bring up causes and effects at producer level
of the traditional marketing chain of cocoa in Ecuador being very comprehensive.
A range of explanations to the recent problems within the Ecuadorian cocoa sector were
presented in Chapter 2. Despite some of these problems are being more profound than others,
they do all impact the low level of competitiveness apparent in the commercialization of
Ecuadorian cocoa. Pedro Ramírez (2007) has listed what he defines to be the most central
problems within the national cocoa sector into five different categories (Figure 6.9). The first
grouping broaches the matter of low agricultural output. Conducting interviews with exporters, as
well as other key persons within the Ecuadorian sector I came to experience an overall
disappointment of the insufficient governmental assistance and founding related to action taking
place at farm level. My respondents felt they were left with an unfair and hopeless task, as they
claimed the state to leave all the responsibility to the individual actors. From several sources,
- 50 -
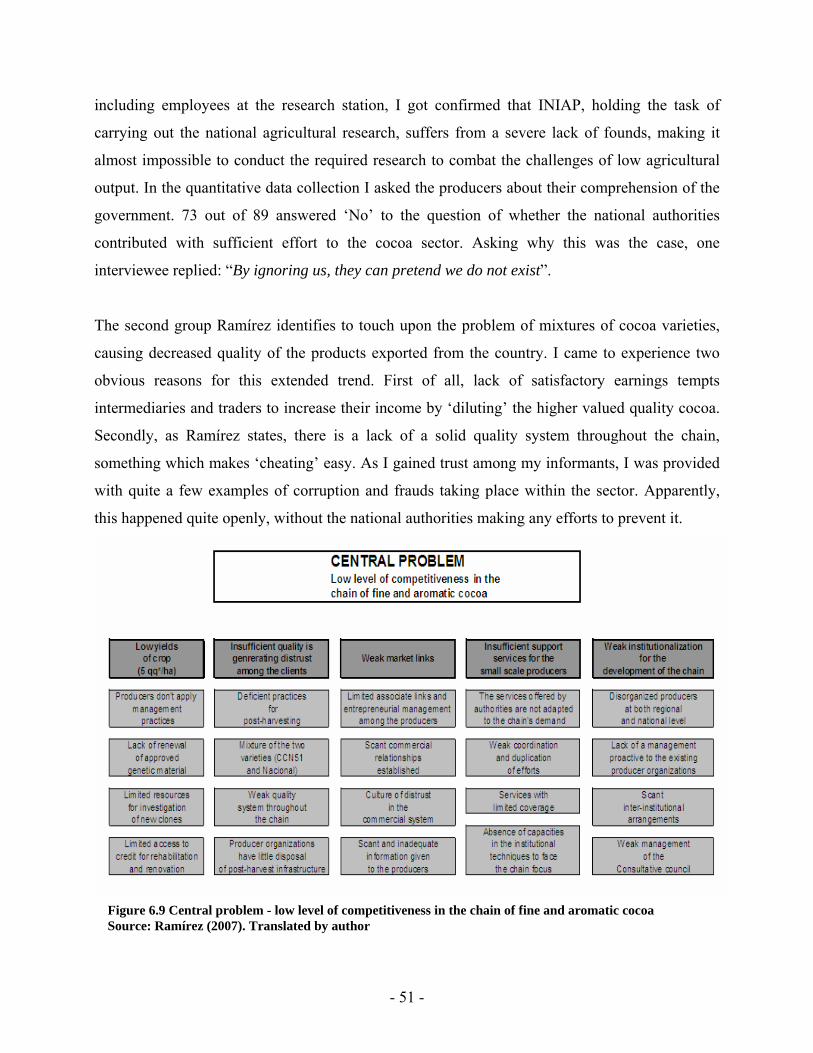
including employees at the research station, I got confirmed that INIAP, holding the task of
carrying out the national agricultural research, suffers from a severe lack of founds, making it
almost impossible to conduct the required research to combat the challenges of low agricultural
output. In the quantitative data collection I asked the producers about their comprehension of the
government. 73 out of 89 answered ‘No’ to the question of whether the national authorities
contributed with sufficient effort to the cocoa sector. Asking why this was the case, one
interviewee replied: “By ignoring us, they can pretend we do not exist”.
The second group Ramírez identifies to touch upon the problem of mixtures of cocoa varieties,
causing decreased quality of the products exported from the country. I came to experience two
obvious reasons for this extended trend. First of all, lack of satisfactory earnings tempts
intermediaries and traders to increase their income by ‘diluting’ the higher valued quality cocoa.
Secondly, as Ramírez states, there is a lack of a solid quality system throughout the chain,
something which makes ‘cheating’ easy. As I gained trust among my informants, I was provided
with quite a few examples of corruption and frauds taking place within the sector. Apparently,
this happened quite openly, without the national authorities making any efforts to prevent it.
Figure 6.9 Central problem - low level of competitiveness in the chain of fine and aromatic cocoa Source: Ramírez (2007). Translated by author
- 51 -
The third problem defined by Ramírez is weak market links. Absence of cooperation was a
frequently given answer by actors placed at all levels when they were asked to identify
weaknesses in the current chain design. In addition to the absence of governmental initiatives, I
found this lack of collaboration to be caused by distrust among the actors. The creation of
ANECACAO in 1987 was a private attempt to unify the exporters of cocoa and ease the process
of sell and purchase Ecuadorian cocoa. However, the extended mixtures resulting in ICCO in
1994 to degrade Ecuadorian cocoa only to be 75% fine and aromatic made many of the exporters
lose faith in the practices exercised by ANECACAO15. Due to mistrust, several of my
respondents at exporter level saw few, if any, advantages being associated through ANECACAO.
In order to combat the problem of weak market links, a recent private initiative to associate the
producers was approved by the ministerial agreement August 15th 2007 (CONCACAO 2007).
The aim of CONCACAO is contribute to enhance the economic development of Ecuadorian
small scale producers of fine and aromatic cocoa. 6000 Ecuadorian cocoa farmers, holding
20 000 hectares of land, were associated through the organization in August 2007 (ibid). The
intention is to make the producers more accessible to potential buyers. A problem raised by
several of my respondents was buyers and sellers not to connect with each other due to lack of
registrations and overall weak internal and external market links.
The fourth factor referred to by Ramírez touches upon weak support services. In the
questionnaire I asked the producers whether they received or had access to information about
commercialization or national laws and regulations (legal framework). The results revealed 29 %
to have access to the former, 14,7% to the latter. Asking from whom they received this
information, the most frequent answers were from the buyers, the media or others. Furthermore, I
asked whether the respondents held any kind of membership in national agricultural
organizations. Not a single producer did. After a time I came to realize the total absence of such
organizations at national level (with the exception of the recent initiative of CONCACAO).
15 During my stay, the air was thick with rumors of ICCO soon to execute a further degradation of Ecuadorian cocoa to only be 40% fine and aromatic. So far, this has not happened.
- 52 -
The fifth and final grouping designed by Ramírez, weak institutionalization for the development
of the chain, holds many similarities with the already discussed third group. Absence of
organization and cooperation makes it challenging to carry out collective actions. Despite
accomplishments of individual initiatives, lack of overall management prevents others (and the
initiative takers themselves) to gain benefits from these actions. A typical example was farmers
creating FOs not providing them with any benefits, as the organization was not adapted into any
networks, marketing channels or other kind of support systems.
The complexity and the various dysfunctions apparent in the national commodity chain have
caused a recent tendency of both producers and purchasers of cocoa to search for alternative
trading patterns. The result of these trends gaining terrain is the construction of new and
alternative chains, eliminating some of the steps and practices in the original commodity chain.
6.2.4 Alternative marketing channels
Despite attempts to develop alternative marketing channels, the open market structure does still
prevail in the Ecuadorian cocoa sector. Conducting this study, one of my aims was to investigate
how alternative marketing channels operated and what benefits producers and buyers gained from
their participation. Establishing contact with Nestlé and UNOCACE provided me with useful
information about the motives of MNCs and niche organizations conducting direct purchases.
Multinational companies – Nestlé experience
Nestlé, at their own homepage declaring themselves the world’s foremost Nutrition, Health and
Wellness Company (Nestlé 2008a), has managed to erect a tremendous market share world wide.
This is especially evident within the Latin American context, where 79% of the entire population
bought a Nestlé product in 2004. The percentage valid for Ecuador was as high as 90 (Nestlé
2006). Being among the world’s most well-known trademarks, Nestlé is often being mentioned in
the same sentence as brands like Nike, Cocoa Cola and McDonalds. Like most celebrities, the
company is a popular target of criticism. Being in the constant searchlight of the media, it is
important for Nestlé frequently to demonstrate to the world the company holding a corporate
social responsibility. The company claims to fully support the United Nations Global Compact’s
- 53 -
10 principles on human rights, labour, the environment and corruption, having incorporated all of
them in the latest edition of Nestlé Corporate Business Principles (Nestlé 2006).
In order to maintain the social responsibility within the Ecuadorian cocoa sector, Nestlé states at
their national homepage: “The vision of Nestlé Ecuador is to bypass the phase of the company
only to be a buyer and rather transform into being an allied who contributes to increase the
quality and quantity of the production of fine and aromatic cocoa” (Nestlé 2008b). In order to
fulfil this vision, Nestlé recently implemented a strategy favouring direct purchases. According to
my main contact within the company, Frank Blacio, about 10% of the cocoa bought by Nestlé
Ecuador in 2007 happened through direct purchases from the producers. Within 2010 his goal is
to enhance this percentage to 25–30 %.
Being among the world’s largest multinational companies, holding tremendous resources to
develop new technologies, clones, etc, Nestlé still has to deal with many of the same problems as
the other actors within the Ecuadorian cocoa sector. One of the most apparent challenges is the
already mentioned issue of weak market links. Blacio claims most of the cocoa to have
undergone at least three or four purchases before reaching their Centro de acopio (‘trade centre’)
in Guayaquil. This extended use of middlemen makes the exporters appear very distant to the
farmers, and visa versa. In order to get in touch with the farmers, Nestlé has created a co-
operation with ACDI/VOCA. ACDI/VOCA does not only establish contact between the
producers and Nestlé, but as well assists transportation and grouping of the farmers (perform
collective sales). The support Nestlé receives from ACDI/VOCA corresponds with a current
tendency of increased collaboration between NGOs and the private sector. As being stated by
Farrington, Bebbington et al. (1993:169) “… while many NGOs may have been critical of market
‘penetration’ and capitalist development in the past, their increasing interaction with commercial
interests suggests that their approach is changing away from a simple critique of capitalism
towards efforts to increase the capacity of NGOs themselves and of the rural poor to use the
marketplace as a resource”.
In order to sell their cocoa to Nestlé farmers have to bring their cocoa to the Centro de acopio
and fulfil the minimum quota of 10 quintales. A third requirement is to hold a bank account, as
- 54 -
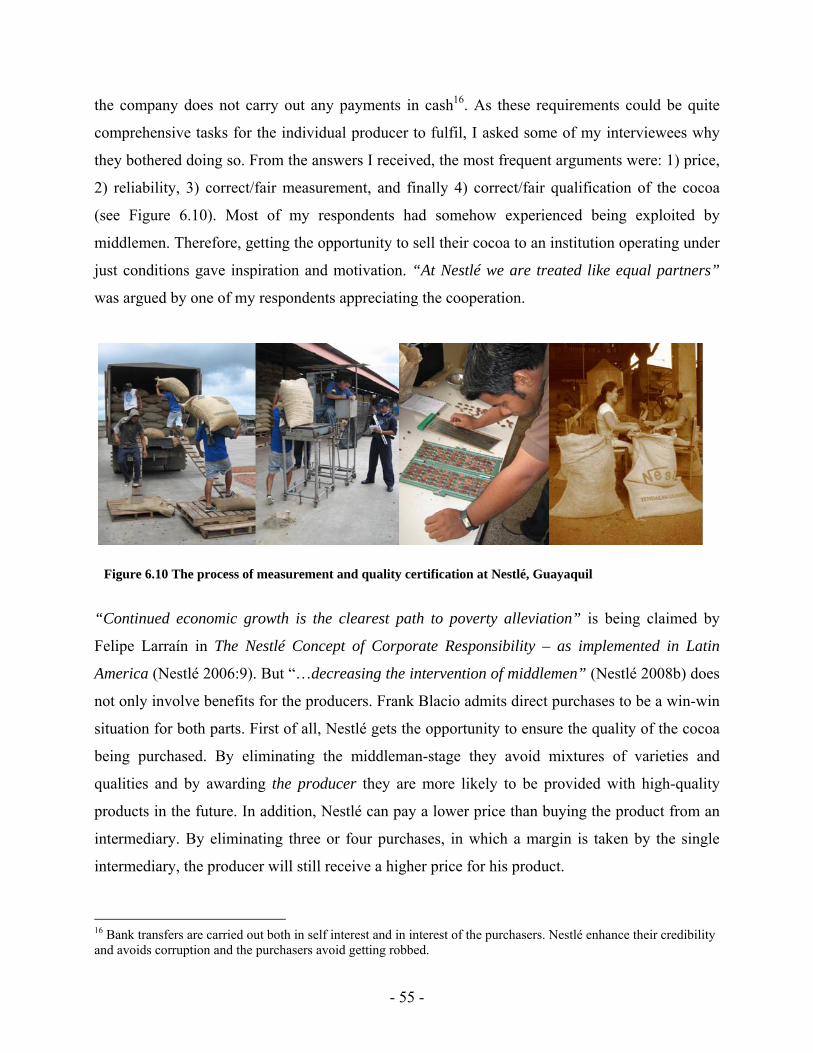
the company does not carry out any payments in cash16. As these requirements could be quite
comprehensive tasks for the individual producer to fulfil, I asked some of my interviewees why
they bothered doing so. From the answers I received, the most frequent arguments were: 1) price,
2) reliability, 3) correct/fair measurement, and finally 4) correct/fair qualification of the cocoa
(see Figure 6.10). Most of my respondents had somehow experienced being exploited by
middlemen. Therefore, getting the opportunity to sell their cocoa to an institution operating under
just conditions gave inspiration and motivation. “At Nestlé we are treated like equal partners”
was argued by one of my respondents appreciating the cooperation.
Figure 6.10 The process of measurement and quality certification at Nestlé, Guayaquil
“Continued economic growth is the clearest path to poverty alleviation” is being claimed by
Felipe Larraín in The Nestlé Concept of Corporate Responsibility – as implemented in Latin
America (Nestlé 2006:9). But “…decreasing the intervention of middlemen” (Nestlé 2008b) does
not only involve benefits for the producers. Frank Blacio admits direct purchases to be a win-win
situation for both parts. First of all, Nestlé gets the opportunity to ensure the quality of the cocoa
being purchased. By eliminating the middleman-stage they avoid mixtures of varieties and
qualities and by awarding the producer they are more likely to be provided with high-quality
products in the future. In addition, Nestlé can pay a lower price than buying the product from an
intermediary. By eliminating three or four purchases, in which a margin is taken by the single
intermediary, the producer will still receive a higher price for his product.
16 Bank transfers are carried out both in self interest and in interest of the purchasers. Nestlé enhance their credibility and avoids corruption and the purchasers avoid getting robbed.
- 55 -
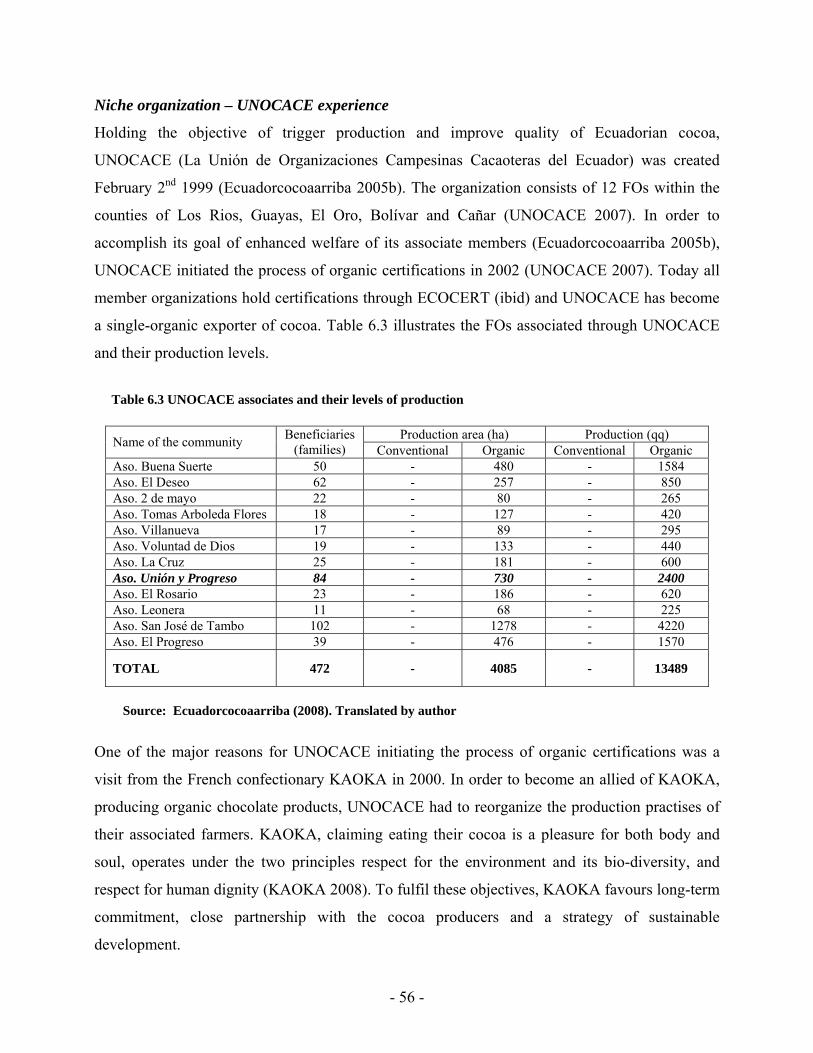
Niche organization – UNOCACE experience
Holding the objective of trigger production and improve quality of Ecuadorian cocoa,
UNOCACE (La Unión de Organizaciones Campesinas Cacaoteras del Ecuador) was created
February 2nd 1999 (Ecuadorcocoaarriba 2005b). The organization consists of 12 FOs within the
counties of Los Rios, Guayas, El Oro, Bolívar and Cañar (UNOCACE 2007). In order to
accomplish its goal of enhanced welfare of its associate members (Ecuadorcocoaarriba 2005b),
UNOCACE initiated the process of organic certifications in 2002 (UNOCACE 2007). Today all
member organizations hold certifications through ECOCERT (ibid) and UNOCACE has become
a single-organic exporter of cocoa. Table 6.3 illustrates the FOs associated through UNOCACE
and their production levels.
Table 6.3 UNOCACE associates and their levels of production
Production area (ha) Production (qq) Name of the community Beneficiaries (families) Conventional Organic Conventional Organic
Aso. Buena Suerte 50 - 480 - 1584 Aso. El Deseo 62 - 257 - 850 Aso. 2 de mayo 22 - 80 - 265 Aso. Tomas Arboleda Flores 18 - 127 - 420 Aso. Villanueva 17 - 89 - 295 Aso. Voluntad de Dios 19 - 133 - 440 Aso. La Cruz 25 - 181 - 600 Aso. Unión y Progreso 84 - 730 - 2400 Aso. El Rosario 23 - 186 - 620 Aso. Leonera 11 - 68 - 225 Aso. San José de Tambo 102 - 1278 - 4220 Aso. El Progreso 39 - 476 - 1570
TOTAL 472 - 4085 - 13489
Source: Ecuadorcocoaarriba (2008). Translated by author
One of the major reasons for UNOCACE initiating the process of organic certifications was a
visit from the French confectionary KAOKA in 2000. In order to become an allied of KAOKA,
producing organic chocolate products, UNOCACE had to reorganize the production practises of
their associated farmers. KAOKA, claiming eating their cocoa is a pleasure for both body and
soul, operates under the two principles respect for the environment and its bio-diversity, and
respect for human dignity (KAOKA 2008). To fulfil these objectives, KAOKA favours long-term
commitment, close partnership with the cocoa producers and a strategy of sustainable
development.
- 56 -
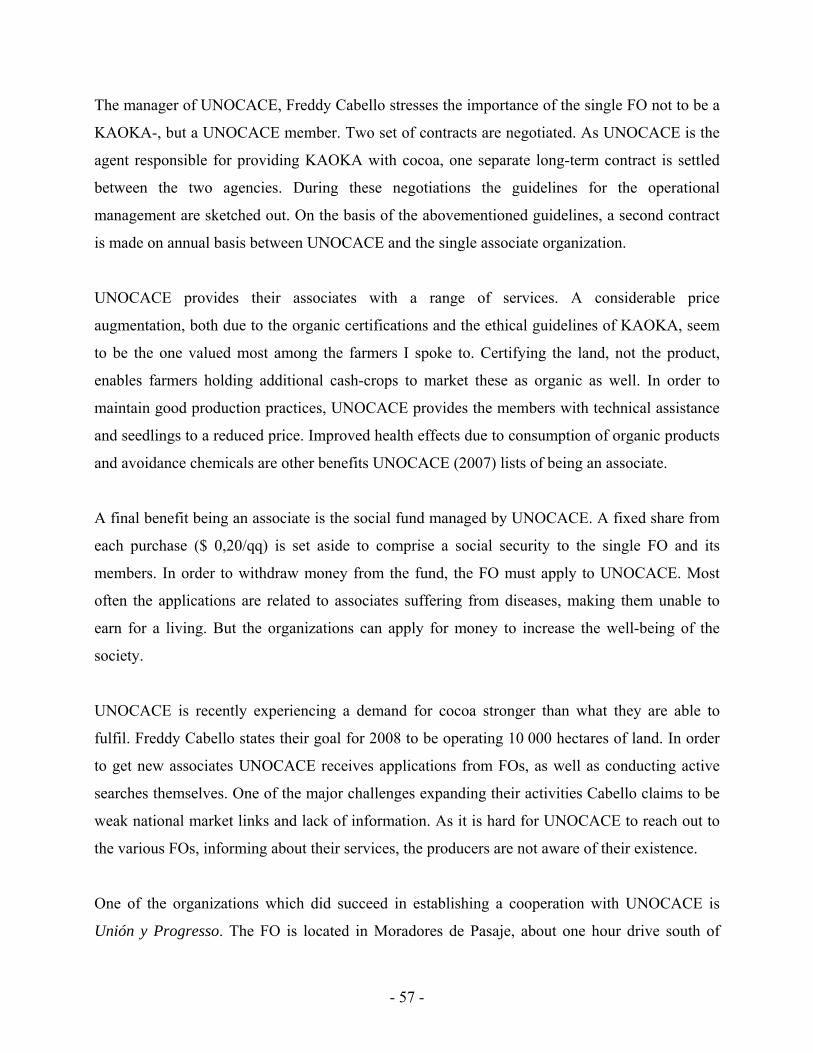
The manager of UNOCACE, Freddy Cabello stresses the importance of the single FO not to be a
KAOKA-, but a UNOCACE member. Two set of contracts are negotiated. As UNOCACE is the
agent responsible for providing KAOKA with cocoa, one separate long-term contract is settled
between the two agencies. During these negotiations the guidelines for the operational
management are sketched out. On the basis of the abovementioned guidelines, a second contract
is made on annual basis between UNOCACE and the single associate organization.
UNOCACE provides their associates with a range of services. A considerable price
augmentation, both due to the organic certifications and the ethical guidelines of KAOKA, seem
to be the one valued most among the farmers I spoke to. Certifying the land, not the product,
enables farmers holding additional cash-crops to market these as organic as well. In order to
maintain good production practices, UNOCACE provides the members with technical assistance
and seedlings to a reduced price. Improved health effects due to consumption of organic products
and avoidance chemicals are other benefits UNOCACE (2007) lists of being an associate.
A final benefit being an associate is the social fund managed by UNOCACE. A fixed share from
each purchase ($ 0,20/qq) is set aside to comprise a social security to the single FO and its
members. In order to withdraw money from the fund, the FO must apply to UNOCACE. Most
often the applications are related to associates suffering from diseases, making them unable to
earn for a living. But the organizations can apply for money to increase the well-being of the
society.
UNOCACE is recently experiencing a demand for cocoa stronger than what they are able to
fulfil. Freddy Cabello states their goal for 2008 to be operating 10 000 hectares of land. In order
to get new associates UNOCACE receives applications from FOs, as well as conducting active
searches themselves. One of the major challenges expanding their activities Cabello claims to be
weak national market links and lack of information. As it is hard for UNOCACE to reach out to
the various FOs, informing about their services, the producers are not aware of their existence.
One of the organizations which did succeed in establishing a cooperation with UNOCACE is
Unión y Progresso. The FO is located in Moradores de Pasaje, about one hour drive south of
- 57 -
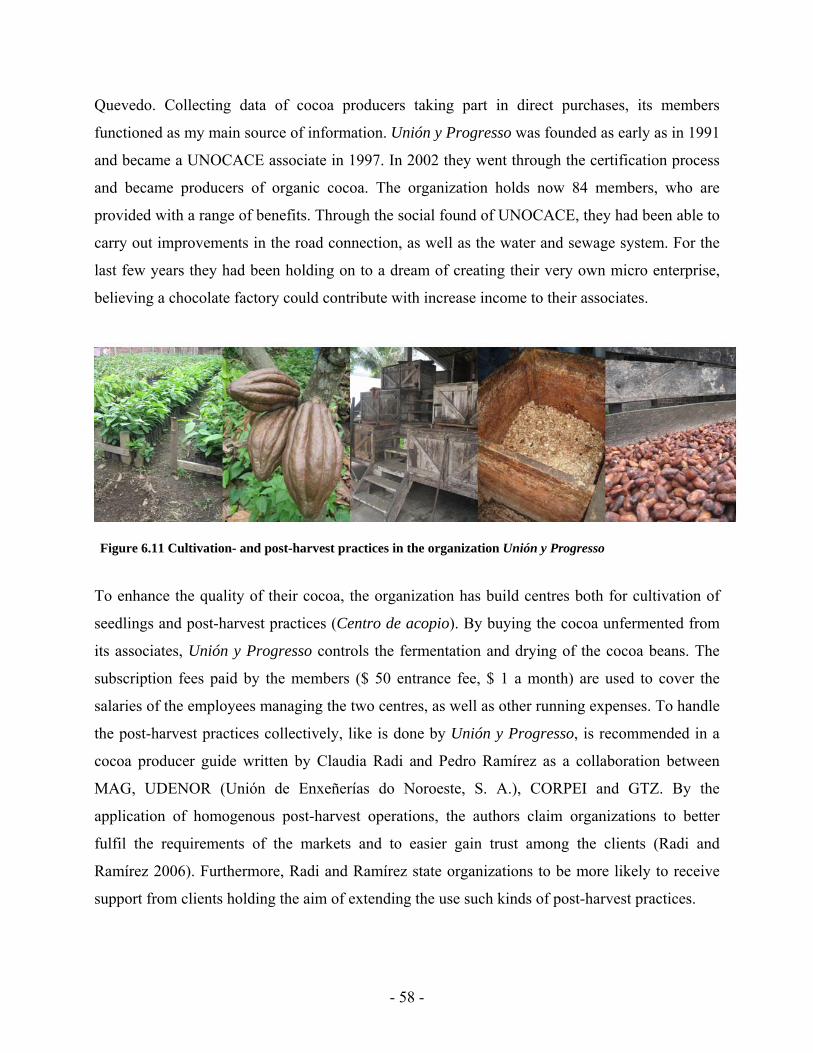
Quevedo. Collecting data of cocoa producers taking part in direct purchases, its members
functioned as my main source of information. Unión y Progresso was founded as early as in 1991
and became a UNOCACE associate in 1997. In 2002 they went through the certification process
and became producers of organic cocoa. The organization holds now 84 members, who are
provided with a range of benefits. Through the social found of UNOCACE, they had been able to
carry out improvements in the road connection, as well as the water and sewage system. For the
last few years they had been holding on to a dream of creating their very own micro enterprise,
believing a chocolate factory could contribute with increase income to their associates.
Figure 6.11 Cultivation- and post-harvest practices in the organization Unión y Progresso
To enhance the quality of their cocoa, the organization has build centres both for cultivation of
seedlings and post-harvest practices (Centro de acopio). By buying the cocoa unfermented from
its associates, Unión y Progresso controls the fermentation and drying of the cocoa beans. The
subscription fees paid by the members ($ 50 entrance fee, $ 1 a month) are used to cover the
salaries of the employees managing the two centres, as well as other running expenses. To handle
the post-harvest practices collectively, like is done by Unión y Progresso, is recommended in a
cocoa producer guide written by Claudia Radi and Pedro Ramírez as a collaboration between
MAG, UDENOR (Unión de Enxeñerías do Noroeste, S. A.), CORPEI and GTZ. By the
application of homogenous post-harvest operations, the authors claim organizations to better
fulfil the requirements of the markets and to easier gain trust among the clients (Radi and
Ramírez 2006). Furthermore, Radi and Ramírez state organizations to be more likely to receive
support from clients holding the aim of extending the use such kinds of post-harvest practices.
- 58 -
6.3 What is the average price ($/qq) farmers participating in the different
marketing channels receive for their cocoa?
In this chapter I will give account for the price received among Ecuadorian cocoa producers
participating in the different marketing channels. To see whether my sample is representative
within a national context I will compare the numbers extracted from my quantitative data
collection with national statistics published by the Ministry of Agriculture and ANECACAO. In
order to demonstrate whether the typical Ecuadorian cocoa producer receives a ‘fair’ share of the
export price, I will, in addition to the average producer prices, present the FOB statistics for
Ecuadorian cocoa in grain over the last year. The purpose of carrying out these analyses is to
identify the economical impacts for cocoa producers participating in one particular marketing
chain in preference to another. Before proceed with the price analysis, I will give the reader a
brief introduction to the price setting mechanisms both in the international and national cocoa
market.
6.3.1 Price setting mechanisms in the global cocoa market
The global cocoa prices, given in US dollars ($) or British Pound (£) per metric ton17 (MT), are
set by New York Board of Trade (NYBOT) and London International Financial Futures
Exchange (LIFFE). In addition to these two actors, the ICCO calculates its own daily prices for
cocoa in grain. The ICCO estimate is conducted with point of departure in the average of the
quotations of the coming three months of trading on LIFFE and, in order to future the U.S. at the
time of London close, the American financial company ICE (Intercontinental Exchange) (ICCO
2008a). The exchange prices are valid for conventional cocoa and work as a basis when
premiums for varieties or quality are to be added. After having been provided with a sample of
the cocoa, the premiums are defined in an agreement between purchaser and buyer in each single
sale (with point of departure in more or less fixed percentages).
17 In order to get the price per quintal (which is the measurement primarily applied in this thesis), the metric ton must be divided with 22.046
- 59 -
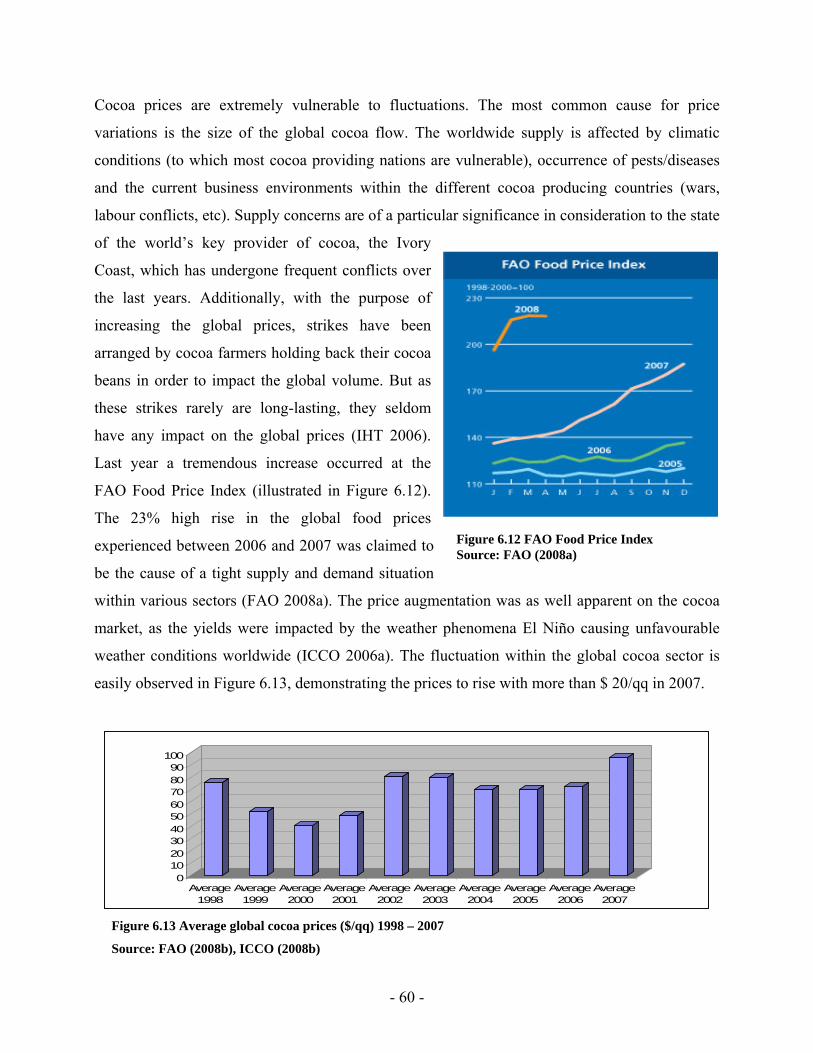
Figure 6.12 FAO Food Price Index Source: FAO (2008a)
Cocoa prices are extremely vulnerable to fluctuations. The most common cause for price
variations is the size of the global cocoa flow. The worldwide supply is affected by climatic
conditions (to which most cocoa providing nations are vulnerable), occurrence of pests/diseases
and the current business environments within the different cocoa producing countries (wars,
labour conflicts, etc). Supply concerns are of a particular significance in consideration to the state
of the world’s key provider of cocoa, the Ivory
Coast, which has undergone frequent conflicts over
the last years. Additionally, with the purpose of
increasing the global prices, strikes have been
arranged by cocoa farmers holding back their cocoa
beans in order to impact the global volume. But as
these strikes rarely are long-lasting, they seldom
have any impact on the global prices (IHT 2006).
Last year a tremendous increase occurred at the
FAO Food Price Index (illustrated in Figure 6.12).
The 23% high rise in the global food prices
experienced between 2006 and 2007 was claimed to
be the cause of a tight supply and demand situation
within various sectors (FAO 2008a). The price augmentation was as well apparent on the cocoa
market, as the yields were impacted by the weather phenomena El Niño causing unfavourable
weather conditions worldwide (ICCO 2006a). The fluctuation within the global cocoa sector is
easily observed in Figure 6.13, demonstrating the prices to rise with more than $ 20/qq in 2007.
0102030405060708090
100
Average1998
Average1999
Average2000
Average2001
Average2002
Average2003
Average2004
Average2005
Average2006
Average2007
Figure 6.13 Average global cocoa prices ($/qq) 1998 – 2007
Source: FAO (2008b), ICCO (2008b)
- 60 -
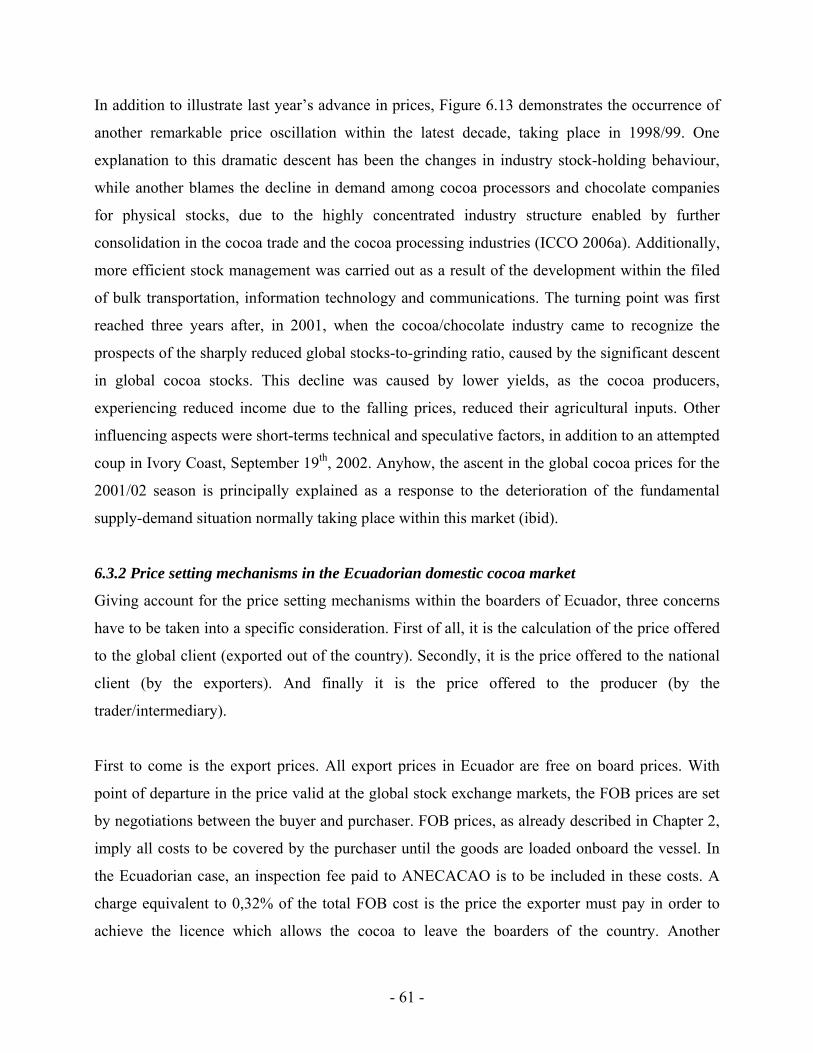
In addition to illustrate last year’s advance in prices, Figure 6.13 demonstrates the occurrence of
another remarkable price oscillation within the latest decade, taking place in 1998/99. One
explanation to this dramatic descent has been the changes in industry stock-holding behaviour,
while another blames the decline in demand among cocoa processors and chocolate companies
for physical stocks, due to the highly concentrated industry structure enabled by further
consolidation in the cocoa trade and the cocoa processing industries (ICCO 2006a). Additionally,
more efficient stock management was carried out as a result of the development within the filed
of bulk transportation, information technology and communications. The turning point was first
reached three years after, in 2001, when the cocoa/chocolate industry came to recognize the
prospects of the sharply reduced global stocks-to-grinding ratio, caused by the significant descent
in global cocoa stocks. This decline was caused by lower yields, as the cocoa producers,
experiencing reduced income due to the falling prices, reduced their agricultural inputs. Other
influencing aspects were short-terms technical and speculative factors, in addition to an attempted
coup in Ivory Coast, September 19th, 2002. Anyhow, the ascent in the global cocoa prices for the
2001/02 season is principally explained as a response to the deterioration of the fundamental
supply-demand situation normally taking place within this market (ibid).
6.3.2 Price setting mechanisms in the Ecuadorian domestic cocoa market
Giving account for the price setting mechanisms within the boarders of Ecuador, three concerns
have to be taken into a specific consideration. First of all, it is the calculation of the price offered
to the global client (exported out of the country). Secondly, it is the price offered to the national
client (by the exporters). And finally it is the price offered to the producer (by the
trader/intermediary).
First to come is the export prices. All export prices in Ecuador are free on board prices. With
point of departure in the price valid at the global stock exchange markets, the FOB prices are set
by negotiations between the buyer and purchaser. FOB prices, as already described in Chapter 2,
imply all costs to be covered by the purchaser until the goods are loaded onboard the vessel. In
the Ecuadorian case, an inspection fee paid to ANECACAO is to be included in these costs. A
charge equivalent to 0,32% of the total FOB cost is the price the exporter must pay in order to
achieve the licence which allows the cocoa to leave the boarders of the country. Another
- 61 -
expression for these kinds of expenses is ‘exporter share’, a term in which ICCO (2006c)
includes all the functions involved in getting the cocoa ready for shipment and loaded onboard
the ship.
The price of the cocoa is determined by first and foremost two different factors, the variety and
the quality18. Often the exporters know which type of quality the buyer is looking for, just
looking at his origin. According to one of my sources in Nestlé the finest cocoa is normally
exported to Europe (Switzerland, France and Spain) and Japan, where the demand for dark and
luxurious chocolate is high. Buyers from United States do often prefer something ‘in-between’,
while the cocoa with the lowest quality is normally exported to the Latin American countries.
Despite the FOB prices are being set through negotiations in each particular sale, Ecuador
operates with minimum reference prices FOB for cocoa. The method for stipulation of minimum
reference prices FOB for exportation of cocoa in grain and elaborates, Inés Hidalgo at the
Ministry of Industrialisation and Competitiveness (MIC) explains to be given in Law 79,
Regulation 743 and the Executive edicts 1720ª and 887. It is the Management of External Trade
Policies within the Sub-secretary of Trade and Innovations (part of the MIC), which is
responsible to carry out these calculations. As point of departure they use the prices for cocoa at
stipulated by the financial market data and news service provider REUTERS at the produce
exchange in New York (NYBOT).
The second set of prices to be estimated is the ones offered to the national client. By this term I
indicate the price offered by the exporters to the ones who come to sell their cocoa at the Centro
de acopio. There are no set rules for these calculations, but in order to attract clients the exporters
need to offer competitive prices. Frank Blacio shared with me the two rules of thumb applied by
Nestlé when calculating the prices they are to offer. First of all, point of departure must be taken
in the current NYBOT price. Secondly, it is important to be aware of the local price. Despite not
using the same reward system as when the cocoa is exported abroad, high quality is rewarded.
The size of the premium depends on the international demand for high quality cocoa (but seldom
more than 2 or 3 dollars per quintal). According to Blacio, it is easily observed if another exporter
18 Qualification table listed in Appendix 4
- 62 -
close by offers a better price than Nestlé; no one will show up offering to sell their cocoa. As the
intermediaries always seem to keep track of the prices offered within the area, they are the one
the exporters communicates with when they need to know the prices offered by their
competitors. Blacio underlines market penetration through rivals undercutting each other’s prices
seldom occurs. If it is not a severe shortness of cocoa, exporters tend to cooperate, offering more
or less the same prices.
The third and final concern is the mechanisms regulating the price offered the producers. In this
case the middlemen or the traders need to take more or less the same considerations as the
exporters, but instead of the NYBOT prices, they take point of departure in the prices paid by the
exporter, or the person placed above him within the value chain. The second consideration is the
price offered by other buyers of cocoa operating in the same area. Like the exporters, the
purchasers are as well cooperating when setting the prices. According to one of my respondents
the middlemen, in order to avoid competition, often separate the area in which they operate into
individual zones in addition to agree on the prices they are to offer the producers (something
which explains why nearly half of my respondents claim not to hold the possibility to change
purchaser). My respondents claim Nacional averagely to be valued $ 5/qq higher than CCN51
when purchased below exporter level, quality is seldom rewarded.
The profit gained by the single purchaser depends a lot on the length of the value chain. During
my research I got to hear two statements concerning the augmentation of the cocoa prices
throughout the value chain. The first tendency was cocoa to averagely increase $ 10/qq in value
from being purchased from the farmer until it reaches the exporter, while the second was each
‘link’ or actor operating between producer- and exporter level to averagely take a margin of
$ 2/qq. For the two statements to correspond with each other, Ecuadorian cocoa normally
undergoes five purchases before reaching the exporters. Due to the complexity of the channels
through which the cocoa is transported to the port, ICCO (2006c) favours the application of the
term ‘traders share’ to involve the share taken by the sum of functions involved in the process of
transporting the cocoa from the farm all the way to the exporter at the port.
- 63 -
6.3.3 FOB prices of cocoa in grain
The ICCO is currently conducting a very similar study to mine in a range of cocoa producing
countries (including Ecuador), where they state “…the ultimate objective of the analysis of the
value chains is to improve insight into the net income derived by farmers and other stakeholders
from cocoa cultivation and trade, and to enhance knowledge of the use of resources in cocoa
production, trade and exporting” (ICCO 2006b). As part of the preparation for this project a
meeting was held in London June 2006 and there was set out some standards of how to best
calculate the shares (of the total value of the beans) received by the different market participants
within the value chain. First of all ICCO asserts the total value need to be established. The best
parameter is to apply FOB price for cocoa in grain during a recent period of heavy trading (ICCO
2006c).
Despite reading through a range of previous studies where similar price comparisons have been
made, I decided to take basis in the standards set by the ICCO in order to calculate the price
received by the ‘average’ Ecuadorian cocoa producer. With a desire to conduct a price analysis,
not only valid for the period of time I spent conducting my fieldwork, but within a more extended
time span, I looked up the reference prices of Ecuadorian cocoa in grain over the last ten years at
the databases of ANECACAO and SICA. As I did not succeed encountering a place where all
this information was gathered together, tracing the prices for all cocoa varieties over the last 10
years was a quite comprehensive task.
The results from my reference price research are listed in Table 6.4 at the following page. The
reason for only having listed recent reference prices of CCN51 is due to a total absence of
information regarding this variety before 2005. Despite CCN51 being introduced to the country
in the 1970s, the general manger of ANECACAO, Pablo Vega Garcia, explains the lack of
registration of reference prices as a consequence of the variety still being rather novel in Ecuador.
- 64 -
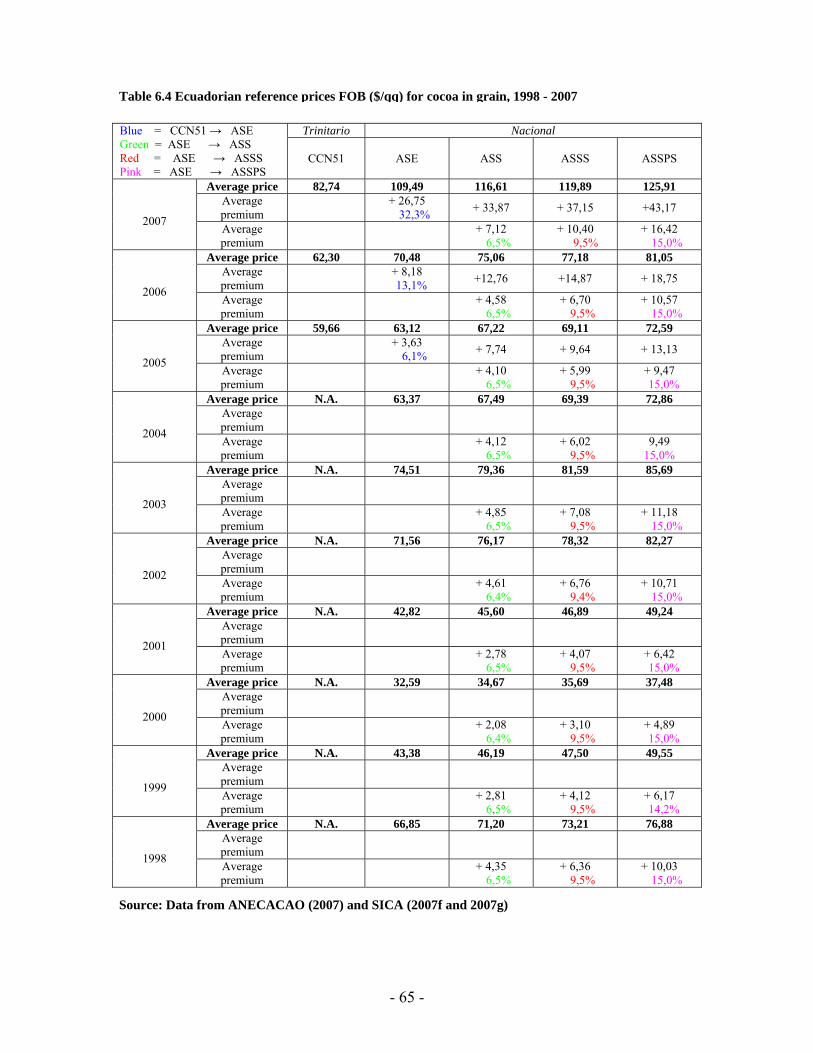
Table 6.4 Ecuadorian reference prices FOB ($/qq) for cocoa in grain, 1998 - 2007 Trinitario Nacional Blue = CCN51 → ASE
Green = ASE → ASS Red = ASE → ASSS Pink = ASE → ASSPS
CCN51 ASE ASS ASSS ASSPS
Average price 82,74 109,49 116,61 119,89 125,91 Average premium + 26,75
32,3% + 33,87 + 37,15 +43,17 2007 Average
premium + 7,12 6,5%
+ 10,40 9,5%
+ 16,42 15,0%
Average price 62,30 70,48 75,06 77,18 81,05 Average premium + 8,18
13,1% +12,76 +14,87 + 18,75 2006
Average premium + 4,58
6,5% + 6,70
9,5% + 10,57
15,0% Average price 59,66 63,12 67,22 69,11 72,59
Average premium + 3,63
6,1% + 7,74 + 9,64 + 13,13 2005 Average
premium + 4,10 6,5%
+ 5,99 9,5%
+ 9,47 15,0%
Average price N.A. 63,37 67,49 69,39 72,86 Average premium
2004 Average premium + 4,12
6,5% + 6,02
9,5% 9,49
15,0% Average price N.A. 74,51 79,36 81,59 85,69
Average premium
2003 Average premium + 4,85
6,5% + 7,08
9,5% + 11,18
15,0% Average price N.A. 71,56 76,17 78,32 82,27
Average premium
2002 Average premium + 4,61
6,4% + 6,76
9,4% + 10,71
15,0% Average price N.A. 42,82 45,60 46,89 49,24
Average premium
2001 Average premium + 2,78
6,5% + 4,07
9,5% + 6,42
15,0% Average price N.A. 32,59 34,67 35,69 37,48
Average premium
2000 Average premium + 2,08
6,4% + 3,10
9,5% + 4,89
15,0% Average price N.A. 43,38 46,19 47,50 49,55
Average premium
1999 Average premium + 2,81
6,5% + 4,12
9,5% + 6,17
14,2% Average price N.A. 66,85 71,20 73,21 76,88
Average premium
1998 Average premium + 4,35
6,5% + 6,36
9,5% + 10,03
15,0% Source: Data from ANECACAO (2007) and SICA (2007f and 2007g)
- 65 -
In addition to demonstrate the reference prices (FOB) for CCN51 and the four varieties of cocoa
Nacional within the last decade (written in bold letters), Table 6.4 illustrates the price
augmentation between the five cocoa qualities. The blue percentage expresses the increase in
price between CCN51 and ASE (the lowest quality of Nacional), the green the difference
between ASE and ASS, the red the difference between ASE and ASSS, and the pink the
difference between ASE and ASSPS (the highest quality of Nacional). Calculating these
percentages a fixed pattern of price augmentations in between the varieties of Nacional was
revealed (6,5% – 9,5% and 15%). Disregard slight divergences in 1999 and 2002, the price
differences between the four sub-categories of Nacional have been calculated using the same
percentages the last ten years. Since I had asked a number of persons within the Ecuadorian
cocoa sector whether such a pricing system existed, without getting any confirmations to this
suspicion, this discovery came quite surprisingly.
6.3.4 Average price received among Ecuadorian cocoa farmers
In order to calculate the share received by the farmers, ICCO suggests taking point of departure
in average ex-farm prices which correspond to the period of time for which the FOB prices were
calculated (ICCO 2006c). These prices I extracted in two different modes. The first way was
through my survey, where I formulated a question to ask for the average price received by the
respondent19 for his/hers cocoa in 2007. Secondly I searched for statistics concerning producer
prices at ANECACAO and the Ministry of Agriculture.
Table 6.5 is composed by monthly averages of price paid to producer for conventional and
organic cocoa within the time span 2003 to 2006. The annual averages of the monthly estimates
are marked bold at the bottom of the table, and these will provide the basis for the average prices
received by the producers within the given period of time. As I was only provided with
information concerning producer prices for both conventional and organic cocoa within the
period of time 2003 – 2006 from MAG, it is within this period of time the comparisons based
upon second-hand information take place.
19 In this comparison I operate with only two groups of respondents. The answers extracted from the ‘contractors’ with MNCs have been incorporated to the groups of producers connected to the open market structure.
- 66 -
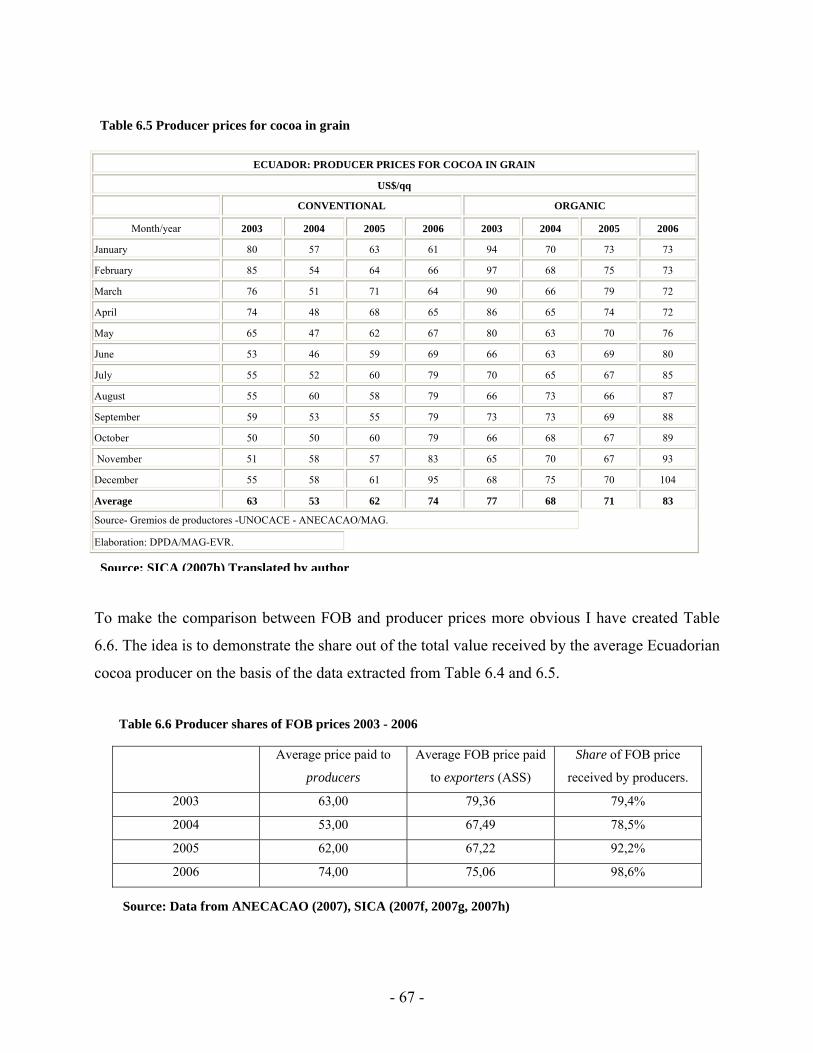
Table 6.5 Producer prices for cocoa in grain
ECUADOR: PRODUCER PRICES FOR COCOA IN GRAIN
US$/qq
CONVENTIONAL ORGANIC
Month/year 2003 2004 2005 2006 2003 2004 2005 2006
January 80 57 63 61 94 70 73 73
February 85 54 64 66 97 68 75 73
March 76 51 71 64 90 66 79 72
April 74 48 68 65 86 65 74 72
May 65 47 62 67 80 63 70 76
June 53 46 59 69 66 63 69 80
July 55 52 60 79 70 65 67 85
August 55 60 58 79 66 73 66 87
September 59 53 55 79 73 73 69 88
October 50 50 60 79 66 68 67 89
November 51 58 57 83 65 70 67 93
December 55 58 61 95 68 75 70 104
Average 63 53 62 74 77 68 71 83
Source- Gremios de productores -UNOCACE - ANECACAO/MAG.
Elaboration: DPDA/MAG-EVR.
Source: SICA (2007h) Translated by author
To make the comparison between FOB and producer prices more obvious I have created Table
6.6. The idea is to demonstrate the share out of the total value received by the average Ecuadorian
cocoa producer on the basis of the data extracted from Table 6.4 and 6.5.
Table 6.6 Producer shares of FOB prices 2003 - 2006
Average price paid to
producers
Average FOB price paid
to exporters (ASS)
Share of FOB price
received by producers.
2003 63,00 79,36 79,4%
2004 53,00 67,49 78,5%
2005 62,00 67,22 92,2%
2006 74,00 75,06 98,6%
Source: Data from ANECACAO (2007), SICA (2007f, 2007g, 2007h)
- 67 -
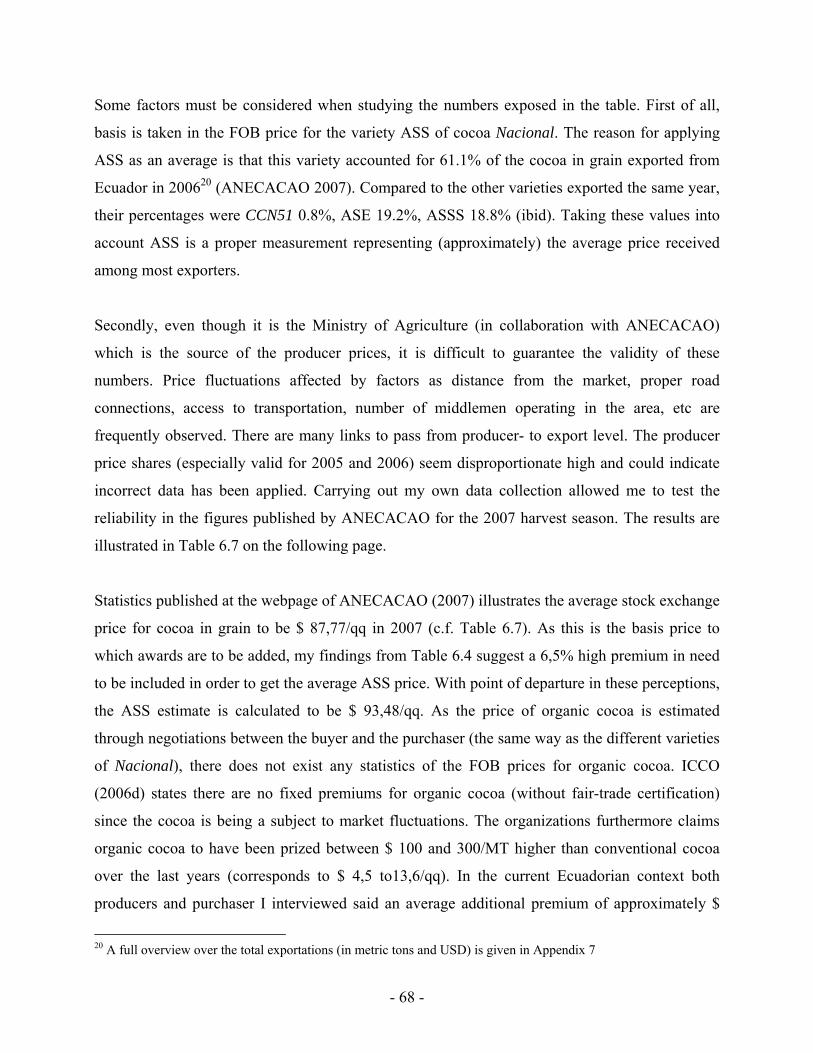
Some factors must be considered when studying the numbers exposed in the table. First of all,
basis is taken in the FOB price for the variety ASS of cocoa Nacional. The reason for applying
ASS as an average is that this variety accounted for 61.1% of the cocoa in grain exported from
Ecuador in 200620 (ANECACAO 2007). Compared to the other varieties exported the same year,
their percentages were CCN51 0.8%, ASE 19.2%, ASSS 18.8% (ibid). Taking these values into
account ASS is a proper measurement representing (approximately) the average price received
among most exporters.
Secondly, even though it is the Ministry of Agriculture (in collaboration with ANECACAO)
which is the source of the producer prices, it is difficult to guarantee the validity of these
numbers. Price fluctuations affected by factors as distance from the market, proper road
connections, access to transportation, number of middlemen operating in the area, etc are
frequently observed. There are many links to pass from producer- to export level. The producer
price shares (especially valid for 2005 and 2006) seem disproportionate high and could indicate
incorrect data has been applied. Carrying out my own data collection allowed me to test the
reliability in the figures published by ANECACAO for the 2007 harvest season. The results are
illustrated in Table 6.7 on the following page.
Statistics published at the webpage of ANECACAO (2007) illustrates the average stock exchange
price for cocoa in grain to be $ 87,77/qq in 2007 (c.f. Table 6.7). As this is the basis price to
which awards are to be added, my findings from Table 6.4 suggest a 6,5% high premium in need
to be included in order to get the average ASS price. With point of departure in these perceptions,
the ASS estimate is calculated to be $ 93,48/qq. As the price of organic cocoa is estimated
through negotiations between the buyer and the purchaser (the same way as the different varieties
of Nacional), there does not exist any statistics of the FOB prices for organic cocoa. ICCO
(2006d) states there are no fixed premiums for organic cocoa (without fair-trade certification)
since the cocoa is being a subject to market fluctuations. The organizations furthermore claims
organic cocoa to have been prized between $ 100 and 300/MT higher than conventional cocoa
over the last years (corresponds to $ 4,5 to13,6/qq). In the current Ecuadorian context both
producers and purchaser I interviewed said an average additional premium of approximately $
20 A full overview over the total exportations (in metric tons and USD) is given in Appendix 7
- 68 -
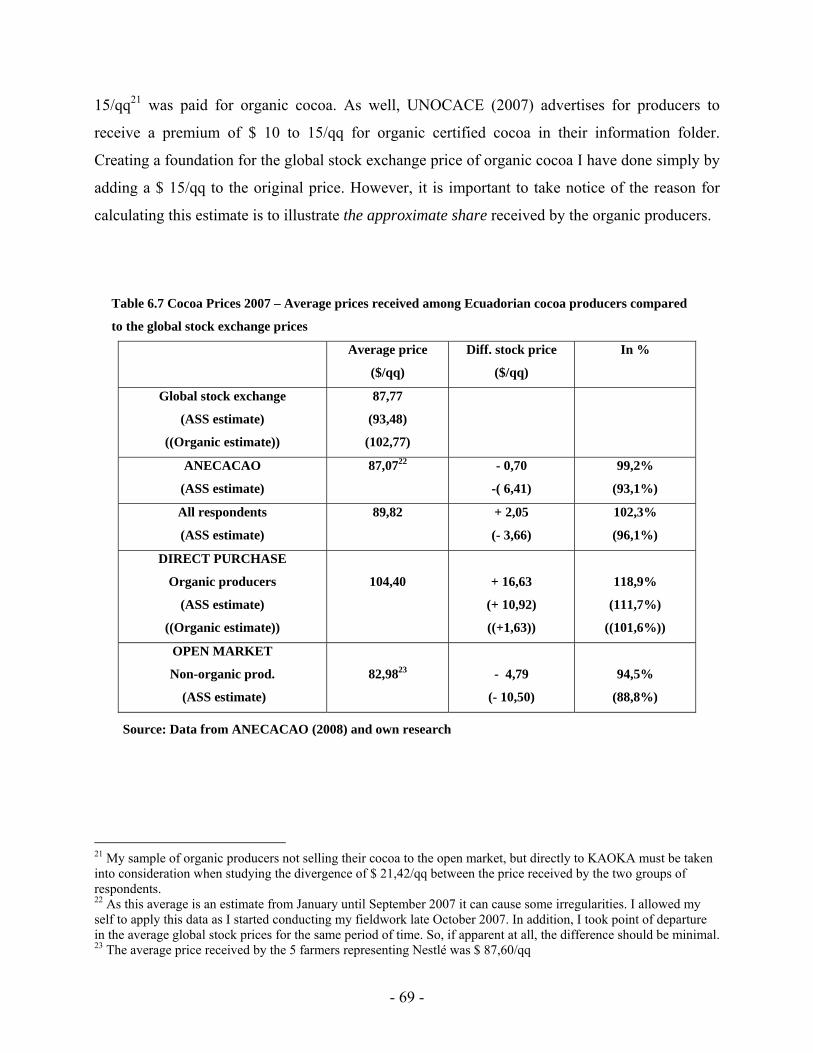
15/qq21 was paid for organic cocoa. As well, UNOCACE (2007) advertises for producers to
receive a premium of $ 10 to 15/qq for organic certified cocoa in their information folder.
Creating a foundation for the global stock exchange price of organic cocoa I have done simply by
adding a $ 15/qq to the original price. However, it is important to take notice of the reason for
calculating this estimate is to illustrate the approximate share received by the organic producers.
Table 6.7 Cocoa Prices 2007 – Average prices received among Ecuadorian cocoa producers compared
to the global stock exchange prices
Average price
($/qq)
Diff. stock price
($/qq)
In %
Global stock exchange
(ASS estimate)
((Organic estimate))
87,77
(93,48)
(102,77)
ANECACAO
(ASS estimate)
87,0722 - 0,70
-( 6,41)
99,2%
(93,1%)
All respondents
(ASS estimate)
89,82 + 2,05
(- 3,66)
102,3%
(96,1%)
DIRECT PURCHASE
Organic producers
(ASS estimate)
((Organic estimate))
104,40
+ 16,63
(+ 10,92)
((+1,63))
118,9%
(111,7%)
((101,6%))
OPEN MARKET
Non-organic prod.
(ASS estimate)
82,9823
- 4,79
(- 10,50)
94,5%
(88,8%)
Source: Data from ANECACAO (2008) and own research
21 My sample of organic producers not selling their cocoa to the open market, but directly to KAOKA must be taken into consideration when studying the divergence of $ 21,42/qq between the price received by the two groups of respondents. 22 As this average is an estimate from January until September 2007 it can cause some irregularities. I allowed my self to apply this data as I started conducting my fieldwork late October 2007. In addition, I took point of departure in the average global stock prices for the same period of time. So, if apparent at all, the difference should be minimal. 23 The average price received by the 5 farmers representing Nestlé was $ 87,60/qq
- 69 -
ANECACAO (2007) claiming the average price received among Ecuadorian cocoa producers in
2007 to be $ 87,07/qq is an estimate slightly lower than my own. After making a calculation of
the 94 responses (2 blanc) I collected from my survey, the average price among my entire group
of respondents became $ 89,82/qq. Taking into consideration 30 of my respondents being
certified as organic producers, this amount need to be adjusted. Disregard the responses given by
the group of farmers holding organic certifications reveal a new annual average of $ 82,98/qq for
my sample of open market participants. This new average is 4,7% lower than the price
ANECACAO utters the average Ecuadorian cocoa producer to have received in 2007, and
constitute for 88,8% of the estimated FOB price for ASS. For the respondents conducting direct
sales (organic) the average price is $ 104,40/qq constituting for 101,6% of the estimated FOB
price for organic cocoa.
Despite some variation, all the estimates illustrate a significant rise in the price share received by
the Ecuadorian cocoa producers to have occurred during the last few years. According to ICCO,
Ecuadorian cocoa producers received an average price for their cocoa constituting for about 80%
of the global stock price in 2001 (ICCO 2003). The same year, Nigerian farmers were the ones
who received the highest share (96%) and the farmers from the Ivory Coast who received the
smallest (52%). Making a retrospect to Table 6.6, the ICCO estimates correspond closely to the
findings valid for the years 2002 and 2003. The current positive trend in the producer price share
received by Ecuadorian cocoa farmers is being confirmed by Pablo Vega Garcia in
ANECACAO. He claims Ecuadorian cocoa producers to receive the world’s highest share for
their products. Bringing up the problem of extended poverty among the farmers, Vega Garcia
argues this not to be caused by the prices paid to the producers, but rather the low agricultural
output.
6.3.5 Price variations in correspondence to quality
To reveal whether variations in quality had any impacts on the price received by the producers
became a difficult task as I, during my field work, came to realize the quality reward system was
only applied at the exporter level. In the test-drive of my questionnaire I had listed the four
different export qualities of Nacional (ASE, ASS, ASSS, ASSPS) and asked under which
category the cocoa cultivated at the farm was sold. Coming to learn these measurements were not
- 70 -
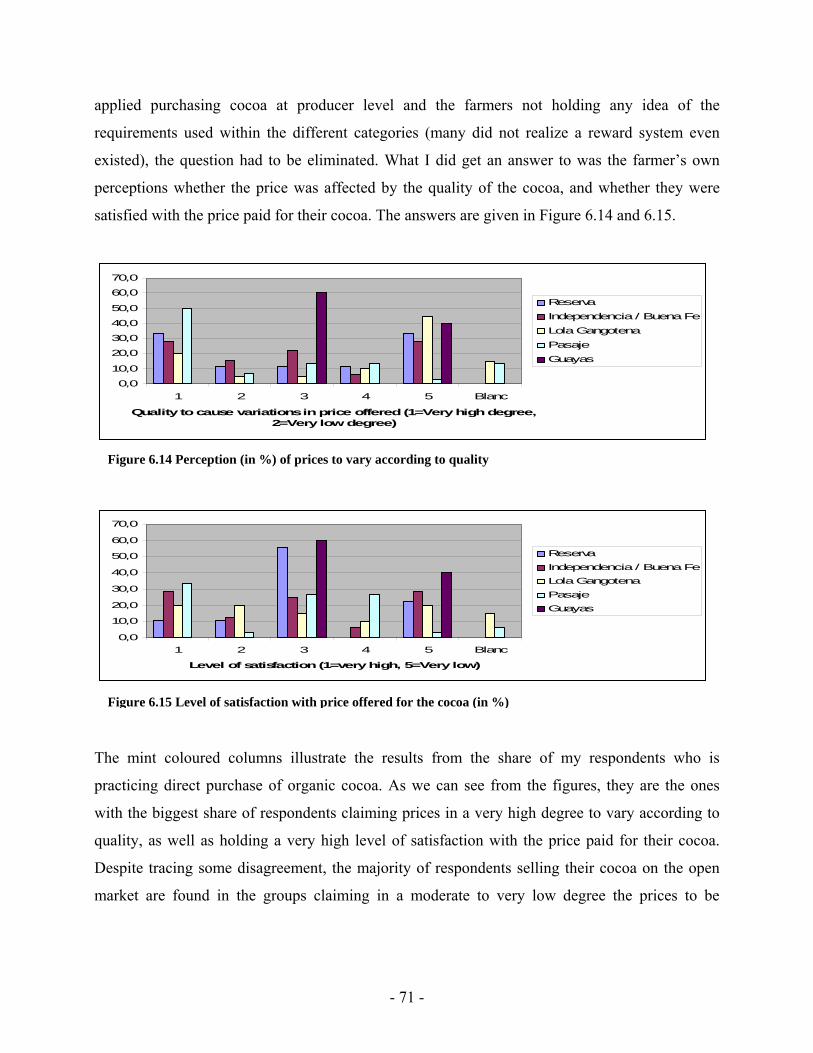
applied purchasing cocoa at producer level and the farmers not holding any idea of the
requirements used within the different categories (many did not realize a reward system even
existed), the question had to be eliminated. What I did get an answer to was the farmer’s own
perceptions whether the price was affected by the quality of the cocoa, and whether they were
satisfied with the price paid for their cocoa. The answers are given in Figure 6.14 and 6.15.
0,0
10,0
20,0
30,0
40,0
50,0
60,0
70,0
1 2 3 4 5 Blanc
Quality to cause variations in price offered (1=Very high degree, 2=Very low degree)
ReservaIndependencia / Buena FeLola GangotenaPasajeGuayas
Figure 6.14 Perception (in %) of prices to vary according to quality
0,0
10,0
20,0
30,0
40,0
50,0
60,0
70,0
1 2 3 4 5 Blanc
Level of satisfaction (1=very high, 5=Very low)
ReservaIndependencia / Buena FeLola GangotenaPasajeGuayas
Figure 6.15 Level of satisfaction with price offered for the cocoa (in %)
The mint coloured columns illustrate the results from the share of my respondents who is
practicing direct purchase of organic cocoa. As we can see from the figures, they are the ones
with the biggest share of respondents claiming prices in a very high degree to vary according to
quality, as well as holding a very high level of satisfaction with the price paid for their cocoa.
Despite tracing some disagreement, the majority of respondents selling their cocoa on the open
market are found in the groups claiming in a moderate to very low degree the prices to be
- 71 -
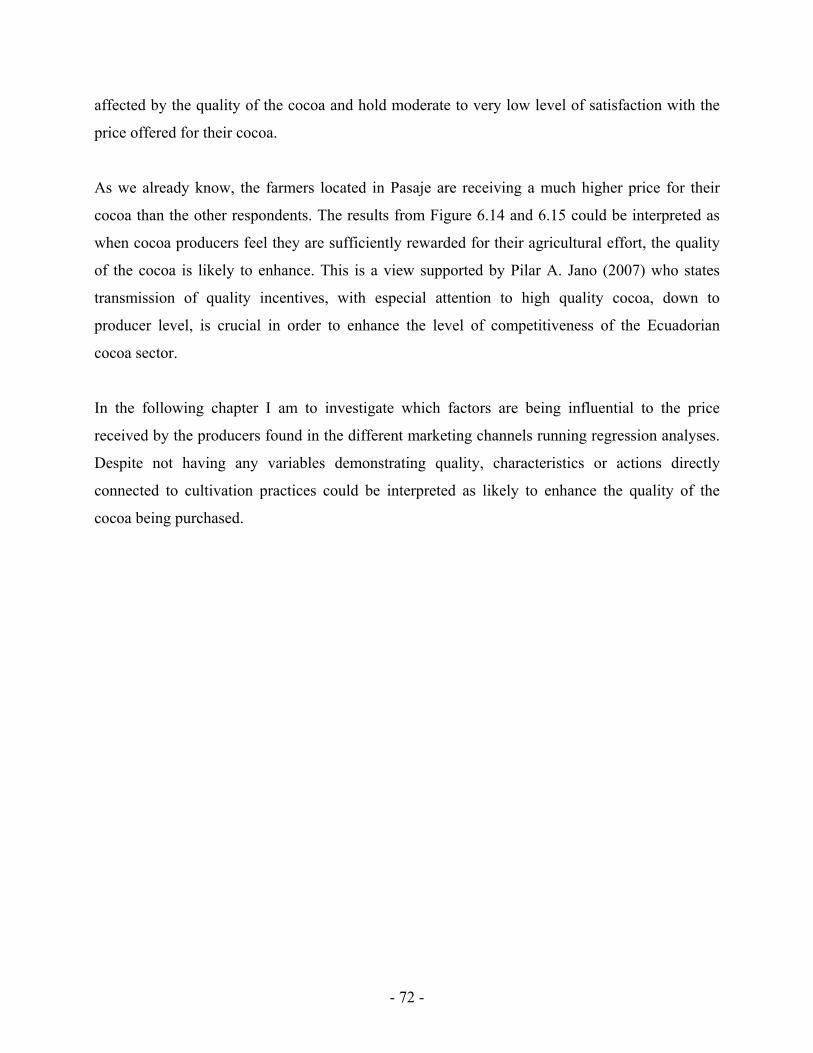
affected by the quality of the cocoa and hold moderate to very low level of satisfaction with the
price offered for their cocoa.
As we already know, the farmers located in Pasaje are receiving a much higher price for their
cocoa than the other respondents. The results from Figure 6.14 and 6.15 could be interpreted as
when cocoa producers feel they are sufficiently rewarded for their agricultural effort, the quality
of the cocoa is likely to enhance. This is a view supported by Pilar A. Jano (2007) who states
transmission of quality incentives, with especial attention to high quality cocoa, down to
producer level, is crucial in order to enhance the level of competitiveness of the Ecuadorian
cocoa sector.
In the following chapter I am to investigate which factors are being influential to the price
received by the producers found in the different marketing channels running regression analyses.
Despite not having any variables demonstrating quality, characteristics or actions directly
connected to cultivation practices could be interpreted as likely to enhance the quality of the
cocoa being purchased.
- 72 -
6.4 How can the variation in producer prices be explained?
In the previous chapter we observed a significant variation between the prices received by the
producers connected to the open market and the ones involved in direct purchases. In this section
the aim is to substantiate the assumption of choice of marketing channel to cause impacts on the
producer price level. Additionally, to reveal whether there are any other variables affecting the
price received by the cocoa producers. In order to do such an examination, statistical analyses
based on the framework presented in Figure 3.6 was carried out. The process of analysis involved
two stages. In the first, causes for the variations in producer price are to be analyzed. In the
second, I try to demonstrate factors influencing choice of marketing channel. After a presentation
of the variables applied in the regressions, the results extracted from the two analyses are
presented in section 6.4.2 and 6.4.3.
6.4.1 Presentation of the independent variables included in the regression analyses
The five subsections of my questionnaires were, as already explained in Chapter 3, transformed
into five groupings of independent variables in the Framework for analysis of factors influencing
choice of marketing channel and price received among Ecuadorian small scale producers of
cocoa (Figure 3.6). Chapter 6.3 demonstrated marketing channel to be important to the producer
price level. But how big is the importance of marketing channel? And are there as any additional
factors influencing the price variations? On basis of the below listed descriptions of the
independent variables24 applied in the regression, hypotheses of with factors to influence the
price received by the producers (positively or negatively) were developed. These will be
presented later on in this chapter.
A: Personal characteristics
A1 Sex
When describing the characteristics of my sample in the beginning of Chapter 6, I referred to
Pedro Ramírez (2006) claiming the Ecuadorian cocoa sector to be male dominated. According to
Ramírez it is in a large degree the man who administers and decides which cultivation- and 24 The presentation of the independent variables is done in the same order as in the framework (Figure 3.6).
- 73 -
production practices the family is to follow, while the women first gets to play a more active role
first when it comes to commercialization and decisions upon the economic resources of the
family (ibid). As most of my questionnaires were distributed during farmer trainings, meetings
and ceremonies, female responses25 became an indicator on their agricultural involvement
(Women = 0, Men = 1, in the regression).
A2 Age
Figure 2.2, illustrating the vicious circle within the Ecuadorian cocoa sector, demonstrates how
lack of economic profit can cause reduced agricultural effort. Experiencing such kind of
disappointment over a long period of time would be likely to make cocoa producers loose their
motivation and quit seeking for new and alternative ways to enhance their profits. Hence, age
distribution26 can indicate which respondents still to hold inspiration.
A3 Off-farm activities (labour)
Cocoa has two annual harvest seasons. In the time span within these two labour intensive periods,
some farmers choose to work outside the farm. Off-farm labour is principally done in order to
earn an additional income. But in some cases, farmers holding diverse crops help each other out
during the different harvest periods. Just above half of the respondents of my questionnaire
(52,9%) answered to be involved in off-farm labour.
A4 Gone through agricultural training
Access to agricultural training does often imply access to institutions reaching out to the farmers,
meaning cocoa producers having access to better information, knowledge, technology, etc.
Anyhow, farmers feeling they are in a situation where knew skills are not needed may reject
joining such initiatives. Agricultural trainings are likely to enhance both marketing skills and
cultivation practices of their participants. Conducting my research in an area implemented in the
action plan of ACDI/VOCA, as many as 82,9% of my respondents had participated in
agricultural training.
25 Sexual distribution of my respondents is listed in Table 6.1 26 Age distribution of my respondents is listed in Table 6.1
- 74 -
B: Organizational commitment
B1 Active membership in any organizations
The creation of farmer organization and societies is being favoured by international NGOs
worldwide, claiming it is a way to empower the rural people in LDCs. Providing technical and
economic services to their members and working as door openers in terms of improving
production practices and create/strengthening market links are arguments favouring the positive
effect membership in organizations can have on the price receive for their cocoa. Among the 50
FOs operating in the Ecuadorian context (Quingaísa 2007), I got to interview members from
three, constituting for 58,9% of my respondents.
C: Farm characteristics
C1 Geographical location
Geographical location can cause huge impacts on the producer price. One of the reasons is
distance to the market, where more purchasers are located. Another reason is NGOs and other
contributors to pick certain areas where they concentrate their activities. Being located in an area
closer to the market or which (even better) is intercepted by an external contributor could supply
the individual producer with a range of benefits (cf. Eade 2000). My selection of cocoa producers
was collected from five geographical locations. As all of them (except from the five Nestlé
‘contractors’) were situated close to Quevedo, the difference in market distance was not very
prominent.
C2 Size
According to numbers from INIAP, only 13,2% of the Ecuadorian cocoa producers
(monoculture) holds more than 50 hectares of land27 (Enriquéz 2004). These numbers reveal the
majority of the cocoa no longer to be cultivated in the large plantations which dominated during
colonial time, but rather is held by smallholders (ibid).
27 Land distribution among my respondents is given in Figure 6.2
- 75 -
C3 Other cash-crops cultivated
According to Enriquéz (2004), among the 96 829 Ecuadorian cocoa producing units, 38 361
(39,6 %) hold other crops than cocoa. The crop most frequently cultivated together with cocoa is
coffee, the second is bananas. Due to a various ecological benefits (i.e. protection of the plant and
its fruits) INIAP favours cocoa to be grown in the shadow of higher threes (ibid). Another benefit
by multi-cropping is, holding a variety of crops can assist extensions of your market connections
and furthermore attract intermediaries buying several kinds of crops. Among the respondents
answering my questionnaire, the share holding additional cash crops was 87,5%.
C4 Use of external labour force
Cocoa can be kept in two different ways; either you can pay attention to the plantation throughout
the year, or only in the harvest season. According to the Success Alliance (2007) the major
challenge at producer level is absence of practices like pruning, three shaping, protection against
fungal diseases and irregular three spacing. 69,3% of my respondents claimed they applied
external labour force.
D: Cocoa production
D1 Type of cocoa cultivated
Looking at Ecuadorian reference prices FOB in Table 6.4 reveals an award system with
significant differences between the prices paid for CCN51 and the four varieties of Nacional.
This tendency is as well apparent at producer level, my respondents claiming the difference
between the two sorts of cocoa averagely is $ 5 in favour of Nacional. Being the fine and
aromatic cocoa cultivated in Ecuador for centuries, Nacional does as well hold an advantage in
terms of obtaining certifications as organic, rain forest friendly, etc as the traditional cultivation
practices are maintained by most producers. Among my respondents 84,3% were producers of
Nacional, 8,3% of CCN51 and7,2 % cultivated both varieties.
- 76 -
D2 Annual yield
Annual yield can provide us with an indication of how much effort a cocoa producer put into his
cultivation practices. Anyhow, different sorts of cocoa cultivated is a more likely explanation
when huge yield differences are observed within a sample of farmers. Results from my
quantitative data collection revealed 35,7% of my respondents to rank type of cocoa cultivated as
the factor influencing their agricultural output the most. CCN51 is a high yielding breed, being
able to extract outputs eight times as high as with the cultivation of Nacional (SICA 2007a). Both
varieties hold a potential of obtaining much higher yields than what is achieved by the average
Ecuadorian cocoa producers. Within my sample of cocoa producers, the difference in annual
yield was not as significant as expected, the yield of the CCN51 producers (15,9 qq/year) only
being 19,5% higher than the Nacional producers (13,3 qq/year).
D3 Use of fertilizer / pesticides
Use of fertilizer / pesticides gives us an indicator of two different factors. The first is whether the
farmer produces organic products. Despite not holding any, farmers not applying fertilizer or
pesticides are more likely to obtain certifications. Secondly, it is a good indicator of which sort of
cocoa being cultivated. Receiving a lower premium for the cocoa, it is important for the farmers
cultivating CCN51 to maximize their yields. This fact explains why the application of fertilizer
and pesticides is more splayed among this group of producers. This tendency was confirmed by
the results of my questionnaires. Within the share of respondents cultivating Nacional, 16,9%
applied fertilizer or/and pesticides. The percentage valid for the producers of CCN51 was 53,3.
E: Access to information
E1 Access to information about market opportunities
Access to information about market opportunities28 could be crucial for cocoa producers seeking
alternative ways to market and sell their cocoa. The absence of a national organ organizing all
Ecuadorian cocoa producers, leaves the farmers themselves with the responsibility to get in touch
with institutions offering such kind of information. As being confirmed by Freddy Cabello in
28 Percentage of respondents with access to information about market opportunities is given in Chapter 6.2.3
- 77 -
UNOCACE and Frank Blacio in Nestlé, there exist a vast number of purchasers seeking
producers from whom they can buy the cocoa directly.
E2 Access to information about the legal framework
Like the variable concerning access to information about market opportunities, this variable is
affected by the lack of a national organization of cocoa producers. Holding access to this kind of
information the cocoa producers can be enlightened with rules like standards for cocoa
qualification and certification which can contribute to increase the quality of their products and
thereby enhance their chances of achieving a higher price.
F: Marketing channel
F1 Choice of marketing channel
With foundation in Figure 3.2, Gereffi et al. (2005) present a complete typology of value chain
governance. They claim the power asymmetry between the sellers and purchasers to be
determined by which type of value chain they participate. Despite power relations are likely to
affect the wage level of the actors within a marketing channel, also its design is influential.
Gereffi and Korzeniewicz (1994) stress the importance of including the three elements when
analysing global commodity chains; 1) length of the chain, 2) density of the interactions, and 3)
depth, meaning number of levels within the various stages of a GCC. The conventional cocoa
value chain is described by both Kaplinsky and Morris (2002) and Phillips and Tallontire (2007)
to be highly complex and extensive. Ecuador is no exception. Alternative marketing channels
enhance the likelihood of the farmers to bypass some of the actors operating in the conventional
chain (Open market = 0, direct purchase = 1, in the regression).
6.4.2 Which factors are influential to the price paid to the producers?
In order to create the framework presented in Figure 3.6, a set of hypotheses (Table 6.8) was, as
already mentioned earlier in this chapter, developed throughout the research process. The aim of
this section is to test the validity of the hypotheses by running a multiple regression containing
the variables in the framework.
- 78 -
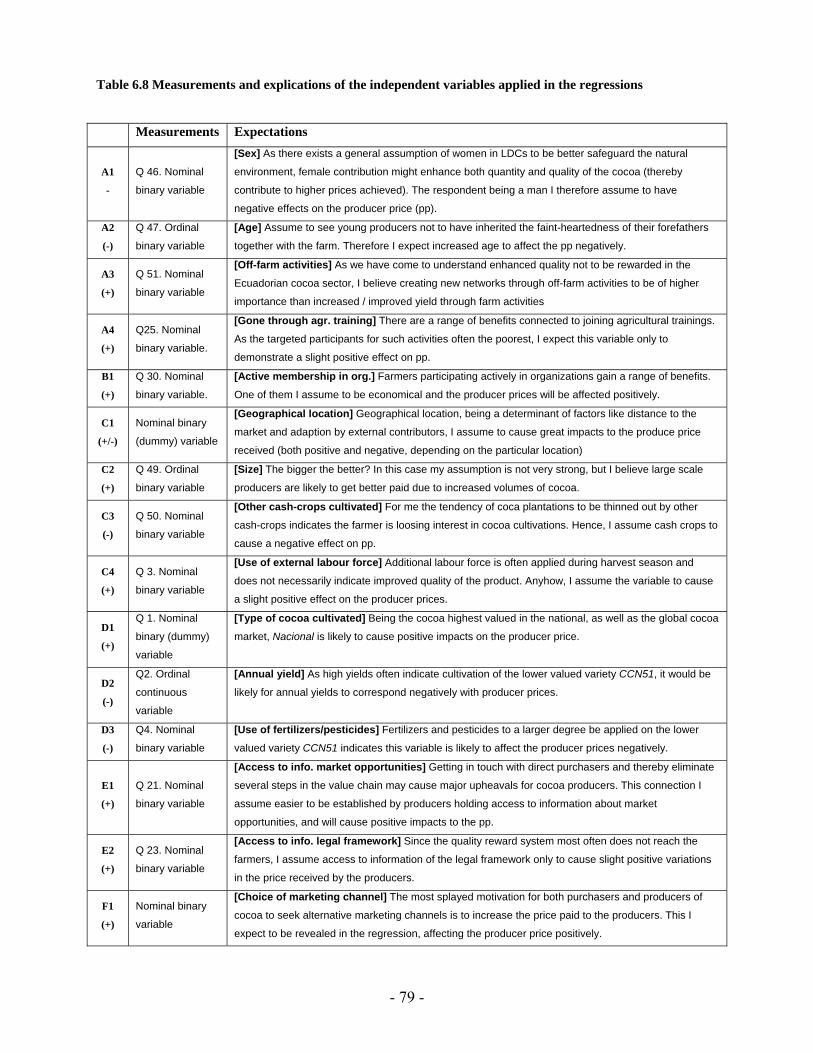
Measurements Expectations
A1
-
Q 46. Nominal
binary variable
[Sex] As there exists a general assumption of women in LDCs to be better safeguard the natural
environment, female contribution might enhance both quantity and quality of the cocoa (thereby
contribute to higher prices achieved). The respondent being a man I therefore assume to have
negative effects on the producer price (pp).
A2
(-)
Q 47. Ordinal
binary variable [Age] Assume to see young producers not to have inherited the faint-heartedness of their forefathers
together with the farm. Therefore I expect increased age to affect the pp negatively.
A3
(+)
Q 51. Nominal
binary variable
[Off-farm activities] As we have come to understand enhanced quality not to be rewarded in the
Ecuadorian cocoa sector, I believe creating new networks through off-farm activities to be of higher
importance than increased / improved yield through farm activities
A4
(+)
Q25. Nominal
binary variable.
[Gone through agr. training] There are a range of benefits connected to joining agricultural trainings.
As the targeted participants for such activities often the poorest, I expect this variable only to
demonstrate a slight positive effect on pp.
B1
(+)
Q 30. Nominal
binary variable.
[Active membership in org.] Farmers participating actively in organizations gain a range of benefits.
One of them I assume to be economical and the producer prices will be affected positively.
C1
(+/-)
Nominal binary
(dummy) variable
[Geographical location] Geographical location, being a determinant of factors like distance to the
market and adaption by external contributors, I assume to cause great impacts to the produce price
received (both positive and negative, depending on the particular location)
C2
(+)
Q 49. Ordinal
binary variable
[Size] The bigger the better? In this case my assumption is not very strong, but I believe large scale
producers are likely to get better paid due to increased volumes of cocoa.
C3
(-)
Q 50. Nominal
binary variable
[Other cash-crops cultivated] For me the tendency of coca plantations to be thinned out by other
cash-crops indicates the farmer is loosing interest in cocoa cultivations. Hence, I assume cash crops to
cause a negative effect on pp.
C4
(+)
Q 3. Nominal
binary variable
[Use of external labour force] Additional labour force is often applied during harvest season and
does not necessarily indicate improved quality of the product. Anyhow, I assume the variable to cause
a slight positive effect on the producer prices.
D1
(+)
Q 1. Nominal
binary (dummy)
variable
[Type of cocoa cultivated] Being the cocoa highest valued in the national, as well as the global cocoa
market, Nacional is likely to cause positive impacts on the producer price.
D2
(-)
Q2. Ordinal
continuous
variable
[Annual yield] As high yields often indicate cultivation of the lower valued variety CCN51, it would be
likely for annual yields to correspond negatively with producer prices.
D3
(-)
Q4. Nominal
binary variable
[Use of fertilizers/pesticides] Fertilizers and pesticides to a larger degree be applied on the lower
valued variety CCN51 indicates this variable is likely to affect the producer prices negatively.
E1
(+)
Q 21. Nominal
binary variable
[Access to info. market opportunities] Getting in touch with direct purchasers and thereby eliminate
several steps in the value chain may cause major upheavals for cocoa producers. This connection I
assume easier to be established by producers holding access to information about market
opportunities, and will cause positive impacts to the pp.
E2
(+)
Q 23. Nominal
binary variable
[Access to info. legal framework] Since the quality reward system most often does not reach the
farmers, I assume access to information of the legal framework only to cause slight positive variations
in the price received by the producers.
F1
(+)
Nominal binary
variable
[Choice of marketing channel] The most splayed motivation for both purchasers and producers of
cocoa to seek alternative marketing channels is to increase the price paid to the producers. This I
expect to be revealed in the regression, affecting the producer price positively.
Table 6.8 Measurements and explications of the independent variables applied in the regressions
- 79 -
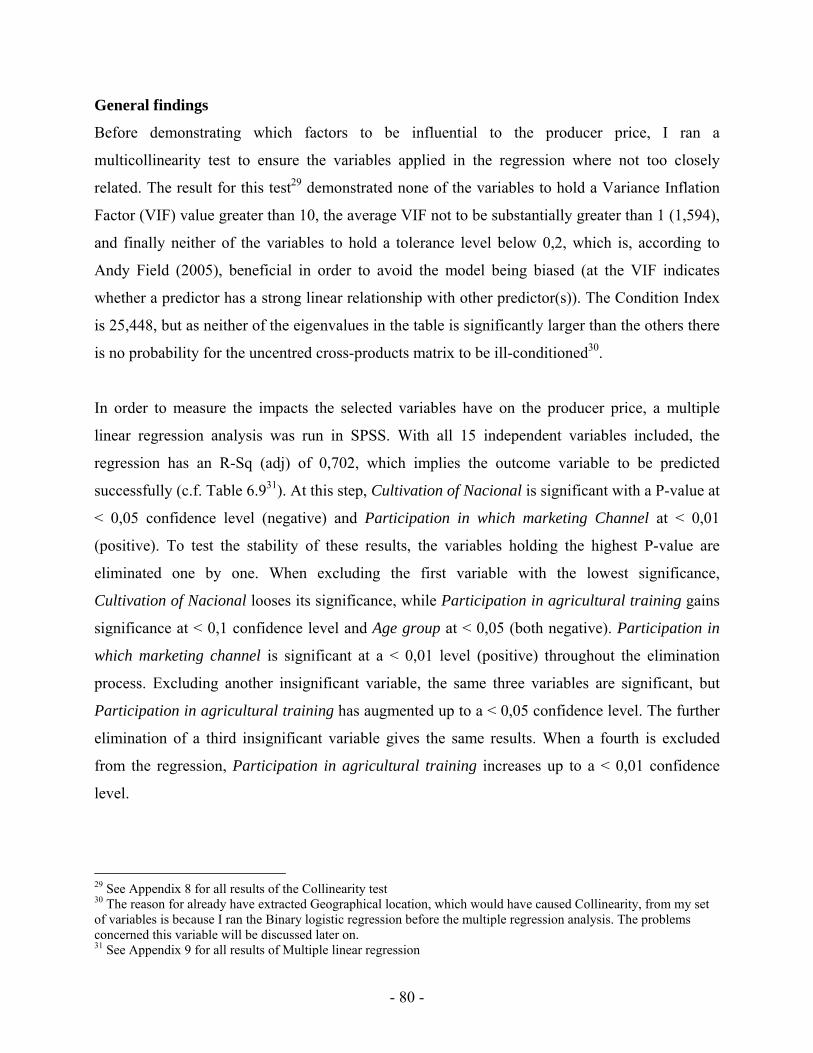
General findings
Before demonstrating which factors to be influential to the producer price, I ran a
multicollinearity test to ensure the variables applied in the regression where not too closely
related. The result for this test29 demonstrated none of the variables to hold a Variance Inflation
Factor (VIF) value greater than 10, the average VIF not to be substantially greater than 1 (1,594),
and finally neither of the variables to hold a tolerance level below 0,2, which is, according to
Andy Field (2005), beneficial in order to avoid the model being biased (at the VIF indicates
whether a predictor has a strong linear relationship with other predictor(s)). The Condition Index
is 25,448, but as neither of the eigenvalues in the table is significantly larger than the others there
is no probability for the uncentred cross-products matrix to be ill-conditioned30.
In order to measure the impacts the selected variables have on the producer price, a multiple
linear regression analysis was run in SPSS. With all 15 independent variables included, the
regression has an R-Sq (adj) of 0,702, which implies the outcome variable to be predicted
successfully (c.f. Table 6.931). At this step, Cultivation of Nacional is significant with a P-value at
< 0,05 confidence level (negative) and Participation in which marketing Channel at < 0,01
(positive). To test the stability of these results, the variables holding the highest P-value are
eliminated one by one. When excluding the first variable with the lowest significance,
Cultivation of Nacional looses its significance, while Participation in agricultural training gains
significance at < 0,1 confidence level and Age group at < 0,05 (both negative). Participation in
which marketing channel is significant at a < 0,01 level (positive) throughout the elimination
process. Excluding another insignificant variable, the same three variables are significant, but
Participation in agricultural training has augmented up to a < 0,05 confidence level. The further
elimination of a third insignificant variable gives the same results. When a fourth is excluded
from the regression, Participation in agricultural training increases up to a < 0,01 confidence
level.
29 See Appendix 8 for all results of the Collinearity test 30 The reason for already have extracted Geographical location, which would have caused Collinearity, from my set of variables is because I ran the Binary logistic regression before the multiple regression analysis. The problems concerned this variable will be discussed later on. 31 See Appendix 9 for all results of Multiple linear regression
- 80 -
Independent variables:
Sex
Age group
Off-farm activities
A: P
erso
nal c
hara
cter
istic
s
Participation in agricultural training
B:
Org
aniz
atio
nal
com
mitm
ent
Active membership in any organizations
Size
Other cash-crops cultivated
C: F
arm
ch
arac
teris
tics
Use of external labour force
CCN51 cultivated
Nacional cultivated
Average yield / year
D: C
ocoa
pro
duct
ion
Use of fertilizer / pesticides
Receive info. market opportunities
E: A
cces
s to
in
form
atio
n
Receive info. legal framework
F:M
arke
ting
chan
nel
Participation in which marketing channel
All observations The least
significant variable excluded
The two least significant
variables excluded
The three least significant
variables excluded
The four least significant
variables excluded
R-Sq (adj) =0. 702 R-Sq (adj) = 0.545 R-Sq (adj) =0. 547 R-Sq (adj) =0. 559 R-Sq (adj) = 0.581
Reg. coeff:
P-value:
Dir. and conf. level
Reg. coeff:
P-value:
Dir. and conf. level
Reg. coeff:
P-value:
Dir. and conf. level
Reg. coeff:
P-value:
Dir. and conf. level
Reg. coeff:
P-value:
Dir. and confi. Level
1,340 ,600 -4,075 ,247 -4,102 ,239 -3,960 ,236 -
4,247 ,176
-,772 ,191 -1,671 0,41 _ ** -1,698 ,039 - ** -1,661 ,032 - ** -
1,593 ,030 - **
-,554 ,752 -2,336 ,341 -1,686 ,489 -1,728 ,453 -
1,540 ,484
-2,233 ,417 -6,042 ,079 _ * -7,789 ,019 - ** -7,812 0,11 - ** -
7,773 ,010 - ***
-2,496 ,363 -,086 ,980 X X X X X X X X X
,479 ,618 1,178 ,377 1,772 ,173 1,809 ,140 1,734 ,145
-2,559 ,294 -2,134 ,533 -2,274 ,507 -1,805 ,570 -
1,338 ,647
-2,248 ,270 -1,855 ,518 -2,724 ,318 -2,504 ,333 -
2,442 ,323
-4,577 ,283 -4,543 ,455 -5,074 ,396 -4,776 ,402 -
4,313 ,430
-7,320 ,028 - ** -7,264 ,122 -7,435 ,116 -6,978 ,119 -
6,984 ,110
-,016 ,814 X X X X X X X X X X X X
-2,313 ,287 -,1046 ,728 -1,572 ,603 X X X X X X
2,282 ,380 1,976 ,569 1,772 ,588 1,269 ,664 X X X
-1,386 ,600 -2,677 ,451 -3,161 ,376 -3,155 ,349 -
2,551 ,408
23,629 ,000 + *** 25,436 ,000 +
*** 25,64
5 ,000 + *** 25,832 ,000 + *** 25,25
4 ,000 + ***
Table 6.9 Multiple linear regression: Producer price *** = P-value < 0,01, ** = P-value < 0,05, * = P-value < 0,1
- 81 -
Producer price
The dependent variable Producer price constitute what the respondent answering my
questionnaires listed to be the average price received for their cocoa in the 2007 harvest season.
Price calculations done in the previous chapter revealed the average price received for their cocoa
among the producers in the open market structure was $ 82,98/qq, while the producers
conducting direct sales received $ 104,40/qq for their cocoa.
A: Personal characteristics
Neither of the variables within the first factor group, personal characteristics, is significant in the
first step of the regression, but changes occur when the least significant variable (Yield) is
removed. Both Age group and Participation in Agricultural training become significant (< 0,05
and < 0,10 confidence level). Age group corresponding negatively with Producer price could
indicate younger producers to put more effort into their agricultural activities, like it was assumed
in my hypothesis. As well, Participation in agricultural training to be negatively correlated was
not expected, but could, as earlier indicated, have been affected by these kinds of activities
principally to be directed towards the poorest group of cocoa producers.
B: Organizational commitment
Being one of the variables in my ‘Holy Trinity’ (Organization, Marketing channel, Producer
price), Active membership in any organizations to be the second variable eliminated from the
regression analysis due to its low level of significance did not correspond to my expectations.
Luckily, I had come to recognize its importance through my qualitative research, and did
therefore search for explanations for its lack of significance in the regression analysis.
Distributing the questionnaire in three different FOs, whereby only one had managed to break
with the open market structure and sell their cocoa directly, is the reason for Producer prices not
to be affected by the variable. Not being able to illustrate the group of farmers receiving the
highest price for their cocoa all to be organized. This illustrates Active membership in any
organizations not to be equivalent to receiving a higher Producer price, but to enhance the
chances of being adapted into an alternative marketing channel offering higher prices.
- 82 -
C: Farm characteristics
The third factor group, farm characteristics, does not hold any significant variables in any of the
regressions. This falsifies all my hypotheses of attention given to farm activities to have impacts
on the price received by the producers. Neither Size, Other cash-crops cultivated nor Use of
external labour force seem to have any impacts on the price the producer receive for his or hers
cocoa.
D: Cocoa production
Nacional cultivated holds a < 0,05 confidence level (negative) in the first regression, where all
the variables are included. When Annual yield is removed as the least significant variable,
Nacional looses its significance. Throughout the regression it remains stable just above < 0.1
level. As I expected the variable to hold a positive, rather than a negative effect on Producer
price, the results given in the questionnaire was studied closer. As was the case with Active
membership in any organizations, Nacional is actually being cultivated among the respondents
receiving the highest price for their cocoa. As the variety is being cultivated by most farmers in
Ecuador, the poorest share of my respondents affects the outcome of the regression model
negatively.
E: Access to information
Neither Access to information about the legal framework nor Access to information about market
opportunities has any significance to the Producer price.
F: Participation in which marketing channel
While the impact of the other variables, due to their instability, was a somehow hard to interpret,
this was not the case with the final variable, Participation in which marketing channel. The
results from the multiple regression analysis leave us with no doubt. This is the variable causing
the greatest impacts on the Producer price. Producers conducting direct purchases (1 value in the
variable) are positively correlated to Producer price at < 0,01 level throughout the elimination of
insignificant variables. This is a result which supports the view of various professionals claiming
the best way to enhance producer prices is to eliminate some of the steps in the conventional
cocoa chain (c.f. Phillips and Tallontire 2007, Collinson and Leon 2000).
- 83 -

6.4.3 Which factors are influential to the choice of marketing channel?
Marketing channel to hold significance to the price offered producers of Ecuadorian cocoa has
been confirmed both through a price analysis in Chapter 3 and the multiple regression analysis
earlier in this chapter. As well, this discovery makes interesting the factors influencing the
individual producer’s access to a marketing channel where direct sales can be carried out. To help
reveal variables holding significance to choice of marketing channel, a binary logistic regression
was run in MiniTab.
General findings
Also in this case I performed a multicollinearity test32. Neither this time did any of the variables
hold a VIF value greater than 10, the average VIF was not substantially greater than 1 (1,933),
and none of the variables held a tolerance level below 0,2. The Condition Index is 27,354, but as
well in this case neither of the eigenvalues was much larger than the others.
Despite having tested for Collinearity, problems occurred when I was to run the binary logistic
regression. The entire regression collapsed, and I found the reason to be a perfect correlation
between the dummy variables for Geographical location and the dependent variable. After a
consultation with the UMB statistician Ellen Sandberg, we agreed on running the regression
without the problematic variable. However, the reason for the break down is a remarkable
finding. The marketing channel, in which the producers have the chance to participate, is to a
large degree predetermined by the geographical location.
After having excluded the variable Geographical location, the binary logistic regression was
carried out. Table 6.1033 demonstrates the original set of data to have a Hosmer Lemeshow P-
value of 0,413, indicating the model being appropriate. Accepting P-values a 10% confidence
level, Age group (positive), Use of fertilizer / pesticides (negative) and Receive information about
the legal framework (positive) is significant. In order to test its stability, the model was run four
times, excluding the variables holding the lowest significance one at the time. The variables
32 See Appendix 10 for all results of the Collinearity test 33 See Appendix 11 for all results of Binary logistic regression
- 84 -
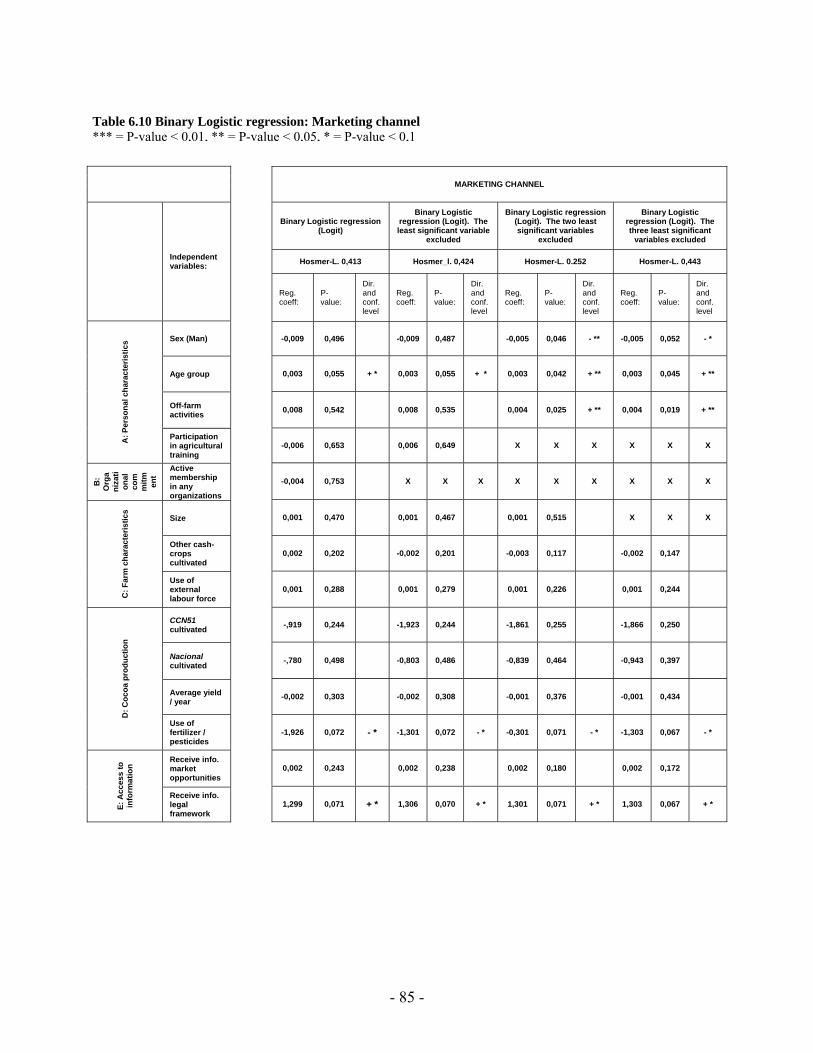
Independent variables:
Sex (Man)
Age group
Off-farm activities
A: P
erso
nal c
hara
cter
istic
s
Participation in agricultural training
B:
Org
ani
zati
onal
co
mm
itm ent
Active membership in any organizations
Size
Other cash-crops cultivated
C: F
arm
cha
ract
eris
tics
Use of external labour force
CCN51 cultivated
Nacional cultivated
Average yield / year
D: C
ocoa
pro
duct
ion
Use of fertilizer / pesticides
Receive info. market opportunities
E: A
cces
s to
in
form
atio
n
Receive info. legal framework
MARKETING CHANNEL
Binary Logistic regression (Logit)
Binary Logistic regression (Logit). The least significant variable
excluded
Binary Logistic regression (Logit). The two least significant variables
excluded
Binary Logistic regression (Logit). The three least significant
variables excluded
Hosmer-L. 0,413 Hosmer_l. 0,424 Hosmer-L. 0.252 Hosmer-L. 0,443
Reg. coeff:
P-value:
Dir. and conf. level
Reg. coeff:
P-value:
Dir. and conf. level
Reg. coeff:
P-value:
Dir. and conf. level
Reg. coeff:
P-value:
Dir. and conf. level
-0,009 0,496 -0,009 0,487 -0,005 0,046 - ** -0,005 0,052 - *
0,003 0,055 + * 0,003 0,055 + * 0,003 0,042 + ** 0,003 0,045 + **
0,008 0,542 0,008 0,535 0,004 0,025 + ** 0,004 0,019 + **
-0,006 0,653 0,006 0,649 X X X X X X
-0,004 0,753 X X X X X X X X X
0,001 0,470 0,001 0,467 0,001 0,515 X X X
0,002 0,202 -0,002 0,201 -0,003 0,117 -0,002 0,147
0,001 0,288 0,001 0,279 0,001 0,226 0,001 0,244
-,919 0,244 -1,923 0,244 -1,861 0,255 -1,866 0,250
-,780 0,498 -0,803 0,486 -0,839 0,464 -0,943 0,397
-0,002 0,303 -0,002 0,308 -0,001 0,376 -0,001 0,434
-1,926 0,072 - * -1,301 0,072 - * -0,301 0,071 - * -1,303 0,067 - *
0,002 0,243 0,002 0,238 0,002 0,180 0,002 0,172
1,299 0,071 + * 1,306 0,070 + * 1,301 0,071 + * 1,303 0,067 + *
Table 6.10 Binary Logistic regression: Marketing channel *** = P-value < 0,01, ** = P-value < 0,05, * = P-value < 0,1
- 85 -
holding significance initially remained at the same confidence level when one variable was
excluded. In the third run Age group augmented its confidence level to < 0,05, as well as Sex (<
0,05, negative) and Off-farm activities (< 0.05, positive) came to be significant. In the fourth and
final run, the three variables holding significance originally still remained significant (Use of
fertilizer / pesticides and Receive information about the legal framework at < 0,10 level, Age
group at < 0,05 level), as well as the additional variables Sex (< 0,10) and Off-farm activities (<
0,05).
A: Personal characteristics
Within the first factor group, Age group, is significant (< 0.10) and has a positive regression
coefficient. Its significance augments (<0.05 level, third run) and remains positive throughout the
process of eliminating the most outlying observations. Increased age to be positively correlated
with the dependent variable was somehow a bit surprising, as I expected younger producers to
hold more initiative and motivation in order to break with the open market structures. But we
should keep in mind the result from the multiple regression, revealing age to be negatively
correlated with price. Young producers to obtain the highest prices within the open market
structure may prevent them from searching alternative marketing channels.
Two additional variables, Sex (< 0.05, negative) and Off-farm activities (< 0.05 positive) become
significant in the third step of the regression, when the two least significant variables are
excluded. While the significance of Sex drops down to a < 0.1 level in the final step of the
regression, Off-farm activities remain stable. Off-farm activities I assumed to have effects on the
producer price, due to the producers interactions and networking outside the farm. The
assumption failed regarding the producer prices, but could be an explanation to the relationship
between Off-farm activities and Marketing channel. Being a female to correspond positively to
alternative marketing channels is a positive trend, as their involvement could contribute to
combat the traditional patter of sex roles often found in LDCs.
B: Organizational commitment
As well as in the case of Producer price, Active membership in any organization being the least
significant variable in the first step of the regression, not causing any impacts on participation in
- 86 -
alternative marketing channels came as a huge surprise, and was about to destroy my entire idea
of how the selected variables were connected. What is not illustrated in the regression analysis is
all the respondents participating in alternative marketing channels were organized. Bias occurs
due to the vast amount of organized farmers who participate in the open market structure. Hence,
despite enhancing your chances for being adopted within an alternative marketing channel,
organizational activity is not being equivalent to break out of the open market structure.
Unión y Progresso, the only organization which had succeeded establishing contact with a direct
purchaser, was older than the other organizations I visited. This could indicate organizations
being well-established and mature easier to be traced by direct purchasers looking for contacts.
According to Freddy Cabello in UNOCACE, contact is established with the organization both-
way; through active searches for FOs and application from the FOs. According to the current
leader in Unión y Progresso, the organization had been in touch with various NGOs before
getting in touch with UNOCACE. It was through these workers the connection was made with
UNOCACE.
C: Farm characteristics
Table 6.10 does not demonstrate any variables to be significant in the third factor group.
However, this is after having excluded the variable Geographical location. The reason for
Geographical location to have a perfect correspondence with Marketing channel was all my
respondents conducting directs sales were located within one geographical location. This
occurrence could indicate the most important determinant for farmers to be targeted by direct
purchasers is their place of residence.
D: Cocoa production
Within the factor group Cocoa production we find the second significant variable in the
regression analysis (when all variables are included). Use of fertilizer/pesticides holds a stable
negatively significance at < 0,10 level throughout the regression, as well when least significant
variables are being removed. The traditional agriculture without any use of fertilizers and
pesticides (which still is dominant in Ecuadorian cocoa cultivation) could seem to enhance your
chances of getting access in an alternative marketing channel. Purchasers holding a social
- 87 -
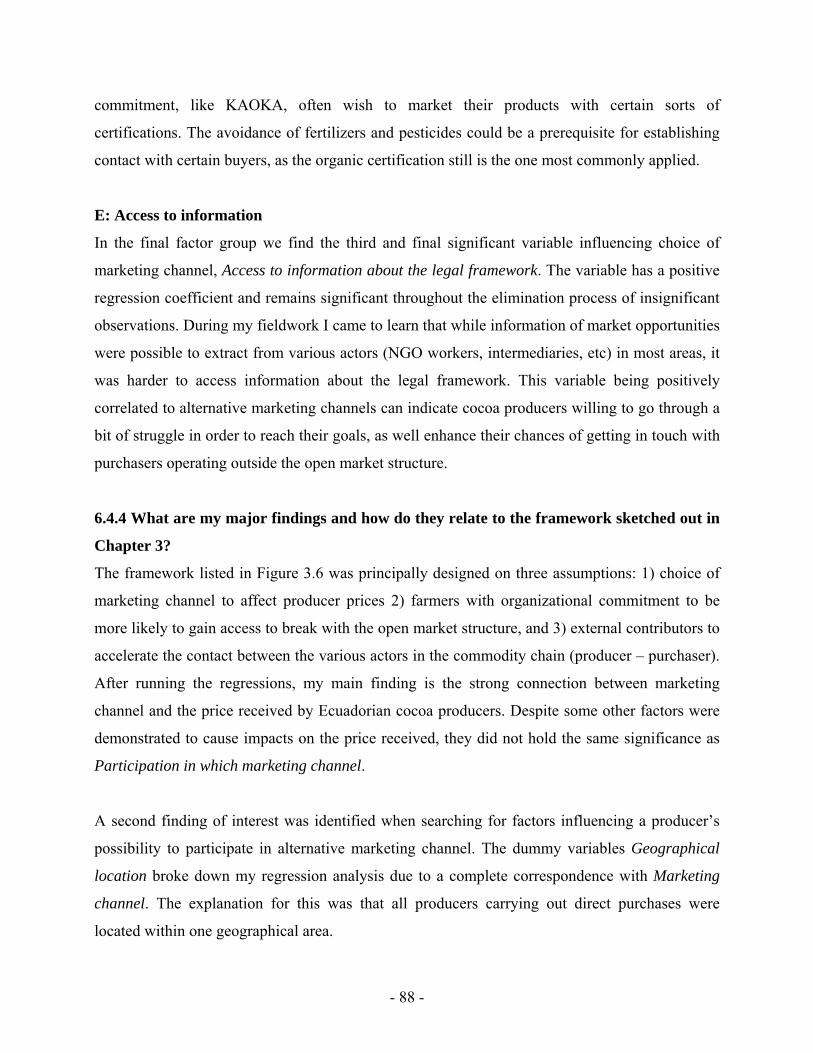
commitment, like KAOKA, often wish to market their products with certain sorts of
certifications. The avoidance of fertilizers and pesticides could be a prerequisite for establishing
contact with certain buyers, as the organic certification still is the one most commonly applied.
E: Access to information
In the final factor group we find the third and final significant variable influencing choice of
marketing channel, Access to information about the legal framework. The variable has a positive
regression coefficient and remains significant throughout the elimination process of insignificant
observations. During my fieldwork I came to learn that while information of market opportunities
were possible to extract from various actors (NGO workers, intermediaries, etc) in most areas, it
was harder to access information about the legal framework. This variable being positively
correlated to alternative marketing channels can indicate cocoa producers willing to go through a
bit of struggle in order to reach their goals, as well enhance their chances of getting in touch with
purchasers operating outside the open market structure.
6.4.4 What are my major findings and how do they relate to the framework sketched out in
Chapter 3?
The framework listed in Figure 3.6 was principally designed on three assumptions: 1) choice of
marketing channel to affect producer prices 2) farmers with organizational commitment to be
more likely to gain access to break with the open market structure, and 3) external contributors to
accelerate the contact between the various actors in the commodity chain (producer – purchaser).
After running the regressions, my main finding is the strong connection between marketing
channel and the price received by Ecuadorian cocoa producers. Despite some other factors were
demonstrated to cause impacts on the price received, they did not hold the same significance as
Participation in which marketing channel.
A second finding of interest was identified when searching for factors influencing a producer’s
possibility to participate in alternative marketing channel. The dummy variables Geographical
location broke down my regression analysis due to a complete correspondence with Marketing
channel. The explanation for this was that all producers carrying out direct purchases were
located within one geographical area.
- 88 -
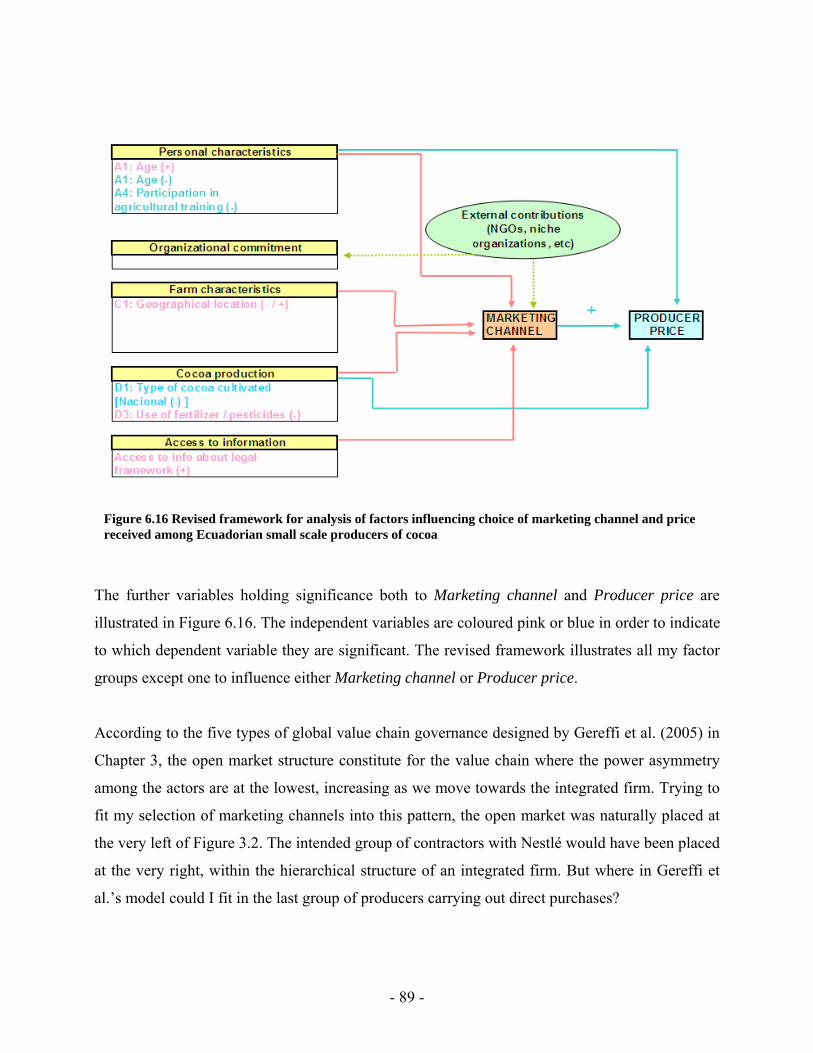
Figure 6.16 Revised framework for analysis of factors influencing choice of marketing channel and price received among Ecuadorian small scale producers of cocoa
The further variables holding significance both to Marketing channel and Producer price are
illustrated in Figure 6.16. The independent variables are coloured pink or blue in order to indicate
to which dependent variable they are significant. The revised framework illustrates all my factor
groups except one to influence either Marketing channel or Producer price.
According to the five types of global value chain governance designed by Gereffi et al. (2005) in
Chapter 3, the open market structure constitute for the value chain where the power asymmetry
among the actors are at the lowest, increasing as we move towards the integrated firm. Trying to
fit my selection of marketing channels into this pattern, the open market was naturally placed at
the very left of Figure 3.2. The intended group of contractors with Nestlé would have been placed
at the very right, within the hierarchical structure of an integrated firm. But where in Gereffi et
al.’s model could I fit in the last group of producers carrying out direct purchases?
- 89 -
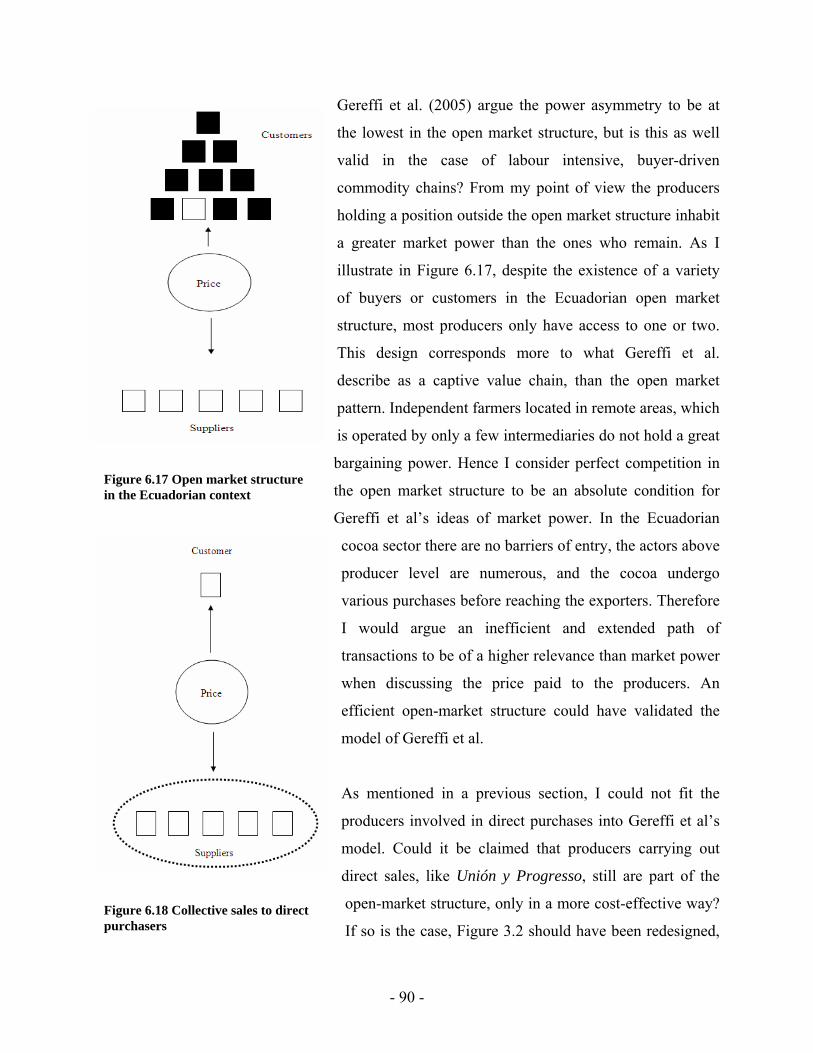
Gereffi et al. (2005) argue the power asymmetry to be at
the lowest in the open market structure, but is this as well
valid in the case of labour intensive, buyer-driven
commodity chains? From my point of view the producers
holding a position outside the open market structure inhabit
a greater market power than the ones who remain. As I
illustrate in Figure 6.17, despite the existence of a variety
of buyers or customers in the Ecuadorian open market
structure, most producers only have access to one or two.
This design corresponds more to what Gereffi et al.
describe as a captive value chain, than the open market
pattern. Independent farmers located in remote areas, which
is operated by only a few intermediaries do not hold a great
bargaining power. Hence I consider perfect competition in
the open market structure to be an absolute condition for
Gereffi et al’s ideas of market power. In the Ecuadorian
cocoa sector there are no barriers of entry, the actors above
producer level are numerous, and the cocoa undergo
various purchases before reaching the exporters. Therefore
I would argue an inefficient and extended path of
transactions to be of a higher relevance than market power
when discussing the price paid to the producers. An
efficient open-market structure could have validated the
model of Gereffi et al.
Figure 6.17 Open market structure in the Ecuadorian context
As mentioned in a previous section, I could not fit the
producers involved in direct purchases into Gereffi et al’s
model. Could it be claimed that producers carrying out
direct sales, like Unión y Progresso, still are part of the
open-market structure, only in a more cost-effective way?
If so is the case, Figure 3.2 should have been redesigned, Figure 6.18 Collective sales to direct purchasers
- 90 -
making room for alternative purchases to take place within the open market as well. Figure 6.18
is an attempt to describe the process of sale which took place among my respondents being
involved in direct purchases. The dashed circle is to illustrate the sales to happen collectively.
The customer is not taking part of the extended intermediary-structure which is illustrated in
Figure 6.17.
My research illustrating the advantages gained by being adopted in an alternative market
structure makes it important to identify ways cocoa producers can break with the traditional open
markets structure. The results from my findings reveal Geographical location, Active
membership in any organizations and access to the assistance from External contributors to be of
high relevance in order to get in touch with a direct purchaser. As commented earlier in the
chapter, organizational activity is neither equivalent to getting access to an alternative marketing
channel, nor to receive a higher price for the cocoa, but it enhances the chances for both
incidences to take place. What I identified as the key for a FO to get in touch with a direct
purchaser was to get assistance from an External contributor (NGO). As NGOs often target
certain areas for action, Geographic location becomes a central matter. In other words,
organizations per se are not the most important matter, but rather where they are located.
All three organizations I worked with had (to various degrees) been in touch with external
contributors, but only one had succeeded in getting in touch with a direct purchaser. One of the
explanations for this occurrence could be corresponding to Bebbington’s (1991) ideas of NGOs
to operate within specific areas and Unión y Progresso to be incorporated due to its physical
location. Another explanation could be concerned with the establishment of the organization.
Unión y Progresso was founded already in 1991, but did not become a UNOCACE member until
1997. As well as the two other organizations, which were both less than 3 years, Unión y
Progresso once was in the phase of establishment. As one of my interviewees within the
organization uttered “We have spent years in the game of commercialization. We have fallen. We
have been defeated as well”. Another claimed “We are moving forward”. There are no doubt
that the organization had not been where it is today without the contribution from UNOCACE.
The NGO has provided the FO with both a direct purchaser, KAOKA, and organic certifications,
- 91 -
which according to my analyzes has contributed to the producers to receive a price $ 21,42/qq
higher than the average among my remaining respondents.
Increased price seems to be the biggest motivation factor for producers to organize. When I asked
the members of Unión y Progresso in the questionnaire what to be the biggest impact on their
market activities after joining the organization, 91,6% answered Higher prices offered. Among
the other organized respondents, not yet having experienced the same economic benefits as the
members of Unión y Progresso, the most answered alternatives were Higher prices offered
(47,5%) and Access to new markets (36,9%). When I asked them whether they had experienced
any increase in the market price, they answered they had not, but were expecting it to come.
Giving answer to the question of non-market related advantages being member of a FO, 57,1% of
all the organized respondents answered the major advantage was Access to training/information.
Listing the benefits of being organized, it is interesting to reveal why some cocoa producers
choose to stay unorganized. The unorganized respondents of my questionnaire saw the benefits of
being organized, 54,4% claimed Access to bigger markets to be the major advantage.
Furthermore 34,5% answered the reason for not being organized was No access. Taking into
consideration 37,9% ticked out Other, many furthermore commented “No hay” (“There are
none”), the vast majority of the unorganized share of my respondents claimed lack of possibility
to enter as the main cause for not being organized. This finding can easily be interpreted as
supportive to what Gudmund Hernes (1975) lists as his forth obstacle to organization, physical
barriers. After further investigation I found out it was not only distance which excluded these
respondents from organizational activities, but as well what Hernes describes as a problem of
solidarity. What I came to learn during my stay was namely FOs to be created within one
community and not being available for anybody else to enter.
The way I interpret my findings is organizational activities and contributions by external actors to
inhabit the power to break with the traditional governance pattern described by Gereffi et al.
(2005). This view is supported by Anthony Bebbington (1991), uttering FOs to increase the
market power of farmers with limited resources. The UNOCACE – Unión y Progresso
experience is a perfect example of how NGOs can strengthen the organization of the poor (c.f.
- 92 -
Eade 2000), and how the producers through carrying out direct sales have experienced a
decreased power asymmetry compared to being a participant in the open market structure.
If we chose to stress the complexity of the chain structure in the Ecuadorian open market, rather
than underlining the importance of market power, it is crucial to eliminate as many actors as
possible in order to enhance the price received by the producers. (c.f. Phillips and Tallontire
2007). As in the case with market power, NGOs can assist farmer organizations in this process by
establishing contacts, to whom they can conduct direct sales.
- 93 -
7.0 Conclusion and recommendations
Based on the analyses carried out in Chapter 6, I will in this chapter present a conclusion to my
main objective of this thesis; To calculate the producer price received by Ecuadorian small scale
cocoa farmers, and furthermore seek explanations for the variations I expect to reveal. In order
to do so, I will in each of the next sections give account for the conclusions to my three sub-
objectives. In the very last section of this thesis, I will present alternative ways to increase the
price received by Ecuadorian cocoa farmers
7.1 How is the production and marketing of cocoa organized in Ecuador? The first sub-objective was designed to offer a better insight of the structure of the Ecuadorian
cocoa producing sector. The way I chose to approach the question of how production and
marketing of cocoa to be organized in Ecuador was through theories concerned with commodity
chains, their functions and participants.
We have come to learn that cocoa is a buyer-driven commodity, and the conventional cocoa
value chain is highly complex and labour intensive. Ecuador, holding a national system which
does not restrict competition, is no an exception. Despite of some recent attempts to create
alternative market channels, the open market structure still prevails in the Ecuadorian cocoa
sector. Often the cocoa undergoes four of five purchases before reaching the exporters. Lack of
official national censuses forces us to trust secondary sources stating the Ecuadorian cocoa sector
to employ approximately 100 000 producers, 1000 intermediaries and 35 exporters. Taking into
account all the personnel involved in the steps of production, commercialization and processing,
the national cocoa sector employs 800 000 Ecuadorians.
Lack of sufficient agricultural output of the high valued cocoa variety Nacional has resulted in
frauds frequently to take place in the sector. Extended mixtures of varieties and qualities have
made ‘the golden bean’ loose its value. After ICCO decided to degrade Ecuadorian cocoa to 75%
fine and aromatic in 1994, many have come to worry about the future prospects of the sector. The
actors found at the very bottom of the commodity chain, the producers, are the biggest victims in
- 94 -
the present system. Middlemen reign the market. They avoid competition by creating individual
zones and through internal price arrangements. In order to combat the fraud taking place in the
process of commercialization, a demand for better control mechanisms and presence of the
national authorities in a sector being ignored for the recent decades has been uttered.
7.2 What is the average price ($/qq) offered to the producers within the various
marketing channels and how does this price correlate with the quality of the
cocoa purchased? The aim of the second sub-objective was to identify the differences in producer prices among
farmers participating in the open market structure and farmers conducting direct sales. In order to
place my findings in a national context, an analysis calculating the producer price share was
conducted with point of departure in data concerned with producer- and FOB prices for cocoa in
grain, published by the Ministry of Agriculture and Livestock and ANECACAO.
Being forced to eliminate one of my alternative marketing channels, contractors with MNCs, my
price comparison was carried out between producers belonging to the open market structure and
producer carrying out direct sales. The price difference between the two groups of producers
answering my questionnaire was astonishing. While the producers participating in the open
market received an average price for their cocoa of $ 82,98/qq, the producers conducting direct
sales received $ 104,40/qq. ANECACAO (2007) claims the Ecuadorian cocoa producer in 2007
to averagely receive $ 87,07/qq for his or hers cocoa. These numbers indicate the share of my
respondents participating in the open market structure to receive a price considerable below the
national average. The huge difference in price received by the two groups of producers ($
21,42/qq) I discovered to have two explanations; the producers subordinated a direct purchaser
held certifications for their cocoa being organic, as well as the purchaser operated under a
purpose of safeguard human dignity, as well as the environment and its biodiversity.
The focus on quality was the second target for investigation within this sub-objective. During my
research I came to learn the emphasis on high quality products to be of considerable difference
within the two marketing channels. Asking whether quality had impacts on the price level
revealed this to be more apparent among the producers breaking with the open market structure.
- 95 -
Their contract with the purchaser is dependent on the quality of the product. On the other hand,
within the open market structure the quality incentives are not transferred down to the producer
level. While cocoa Nacional is exported from Ecuador under four different categories indicating
the quality (the highest quality priced 15% higher than the lowest), the farmer does not gain any
benefit from producing high quality cocoa. Ecuador does still experience a huge demand for their
high quality cocoa. A vicious circle of decreased quality due to lack of economic rewards is
currently taking place in the Ecuadorian cocoa sector. Many have come to realize a need for the
quality of Ecuadorian cocoa to increase drastically. If this not happen, the international demand
will diminish significantly in the years to come.
7.3 How can the variation in the producer prices be explained? The second sub-objective revealed a significant difference in the prices received by the two
groups of producers participating in different marketing channels. In order to better understand
the price gap, this section is dedicated to identify which factors to cause the price variations.
A multiple linear regression analysis was carried out to demonstrate the factors holding impacts
to the producer price. The results from the regression revealed Age group, Participation in
agricultural training and Nacional cultivated all to have negative impacts on the price level. The
most convincing result was anyhow the impacts of Marketing channel. Participation in direct
purchases was significant at a < 0,01 confidence level, holding a positive correlation to producer
prices. Despite not being demonstrated in the regression analyses, some other factors were
identified as influential to the producer prices through information extracted from interviews and
observations: 1) Active membership in farmer organizations. Despite not being a determinant for
increased prices, the chances are enhanced of being traced by a direct purchaser being organized.
2) Get assistance from external contributors (NGOs). Due to lack of a national support system,
neither farmer organizations nor individual producers know how to establish contact with
purchasers directly. 3) Obtaining certifications. Despite most Ecuadorian cocoa is cultivated
organic, the minority hold the certification which can contribute to rise the price received
significantly.
- 96 -
The assumption of choice of marketing channel to be the factor most likely to cause variation in
the producer prices was verified. Therefore, a binary logistic regression was carried out to reveal
which factors to influence producers to participate in the various marketing channels. The factor
holding the highest level of significance was Geographical location, demonstrating producers
located within certain areas to be targeted by direct purchasers. As well, the results from the
regression revealed Age group and Access to information about the legal framework to be
positively correlated to alternative marketing channels, while use of fertilizer/pesticides held a
negative correlation.
Producers to get insufficient paid for their cocoa could be claimed to be a matter of market
structure, rather than market power. The complexity of the conventional cocoa chain causes many
actors to obtain a limited margin. Rather than being focused on increasing the market power of
Ecuadorian cocoa producers, the emphasis could be to eliminate some of the actors in the
traditional value chain. NGOs do an extremely important job in strengthening the market links,
establishing contact between farmer organizations and direct purchasers.
7.4 Recommendation of improvements to be carried out in order to enhance to
producer prices On the basis of my findings and previously published studies, I have listed four factors which I
find to be of specific importance in order to increase the Ecuadorian producer prices of cocoa.
1. Governmental attention should increase
Numerous authors have uttered lack of sufficient governmental attention to be the core of the
recent problems within the Ecuadorian cocoa sector. Insufficient agricultural output has led to
increased mixtures of cocoa holding different qualities. Due to inadequate control mechanisms,
the international market is frequently provided with ‘diluted’ Ecuadorian cocoa. In order to
prevent a ruin of the national cocoa sector, the state is obliged to pay it more attention. Specific
consideration must be directed towards the areas of control mechanisms and market regulations.
The recent system, not restricting competition, leaves the cocoa producers in an extremely
unfortunate market position.
- 97 -
2. Producers to carry out direct sales
The abovementioned lack of sufficient governmental attention has resulted in a market dominated
by the intermediaries. Before reaching the exporter, Ecuadorian cocoa often bypass four or five
intermediaries, who each take a margin. Simple math should do in calculating the producers to
increase their revenue by carrying out direct sales themselves. The absence of national farmer
organizations and distribution of general information makes it difficult for individual producers
to break out of the open market structure. The results of my studies revealed external
contributors, like NGOS operating at a national/international level, to inhabit an extremely
important role in strengthening the market links in the Ecuadorian cocoa sector. In order to get in
touch with a NGO, often targeting specific areas of action, it is important for the farmers to be
‘visible’. One of the major tasks of larger NGOs is to strengthen the existing farmer
organizations. Hence, the first step for farmers, seeking to break with the open market structure,
is to organize. Once being target by a NGO, the cocoa producers get better access to information
and assistance of how to strengthen their market power.
3. Obtain certifications
The resent global focus on environmental consciousness and ethical trade has increased the
demand for products holding certifications like Fair Trade, Rainforest Friendly, Organic, etc.
Most Ecuadorian cocoa is cultivated applying organic practices, but very few farmers hold
organic certifications. Obtaining a certificate is likely to cause a solid increase in the price paid to
the producers, as exporters of certificated commodities often are obliged to pay a minimum price.
The easiest way for Ecuadorian cocoa producers to achieve a certificate is through a FO seeking
assistance from a NGO. Certifications are given to individual independent producers as well, but
my experience was the process to be rather comprehensive and complicated.
4. Transfer quality incentives to producer level
Today Ecuadorian cocoa is not categorized in terms of quality of the beans before it reaches the
exporter level. The producers not achieving any economic reward for good cultivation- and
harvesting practices does not stimulate to maintenance of deliverance of high quality products.
For Ecuador to maintain its position as one of the world’s leading producers of fine and aromatic
cocoa, the country is dependent of the actions taking place at farm level to be sustainable. The
- 98 -
low yielding breed Nacional, which dominate the national cocoa industry, is prized considerably
higher than regular cocoa in the international market. Farmers taking part in this reward system
are more likely to intensify and improve their farm activities. Hence, the national cocoa industry
will have larger volumes of higher quality cocoa to provide the international market.
- 99 -
References ANECACAO (2007). Todo sobre cacao en Ecuador. [online]: http://www.anecacao.com/Español/español.htm, accessed 2008/04/03 ANECACAO (2008). Statistics. [online]: http://www.anecacao.com/English/ingles.htm http://www.anecacao.com/English/ingles.htm, accessed 2008/05/22 Bebbington A. (1991). Farmer Organisations in Ecuador: Contribution to Farmers First Research and Development. Gatekeeper series No. 26, International Institute for Environment and Development, London Bebbington A. and Thiele G. with Davies P., Prager M. and Riveros H. (1993). Non-Governmental Organizations and the State in Latin America. Rethinking the Roles in Sustainable Agricultural Development. Routledge, London and New York Bromley D. W. (2006). Sufficient Reason. Volitional Paradigms and the Meaning of Economic Institutions. Princeton University Press, Princeton and Oxford Bryman A. (2004). Social Research Methods. 2nd ed. Oxford University Press, New York CIA (2007). The World Factbook: Ecuador. [online]: https://www.cia.gov/library/publications/the-world-factbook/print/ec.html, accessed 2007/07/18 Collinson C. and Leon M. (2000): Economic Viability of Ethical Cocoa Trading in Ecuador. Report 2519, Natural Research and Ethical Trade Program, Natural Resource Institute, University of Greenwich. [online]: http://www.nri.org/projects/NRET/cocoa.pdf, accessed 2007/06/04 CONCACAO (2007). Arriba Concacao! Information folder published August 2007, Guayaquil CORPEI (2006). Establecimiento de una Estrategia de Competitividad de la Cadena de Cacao Fino y de Aroma en el Ecuador. Ecuador Exporta No 12, Diciembre 2006. [online]: http://www.corpei.org/data/boletines/boletin_200612.pdf, accessed 2007/10/17 DeMars W. E. (2005). NGOs and Transnational Networks. Wild Cards in World Politics. Pluto Press, London Eade D. (2000). Development, NGOs and Civil Society. Oxfam GB, Oxford
- 100 -
Ecuadorcocoaarriba (2005) a) La Cadena Nacional de Cacao. [online]:
http://www.ecuadorcocoaarriba.com/esp/cadena-cacao-arriba-ecuador.php, accessed 2007/10/17
b) Organización UNOCACE. [online]: http://www.ecuadorcocoaarriba.com/esp/caracteristicas-producto-arriba-ecuador-unocace.php, accessed 2008/05/29
Enriqués G. A. (2004). Cacao Orgánico. Guía para productores ecuatorians. INIAP, Manual No 54. AGC Ediciones, Quito FAO (2007). Economic and Social Department. The Statistics Division.
a) Key Statistics of Food and Agriculture External Trade. Commodities by country. [online]: http://www.fao.org/es/ess/toptrade/trade.asp?dir=exp&country=58&ryear=2004, accessed 2007/06/05
b) Key Statistics of Food and Agriculture External Trade. Countries by commodity. [online]: http://www.fao.org/es/ess/toptrade/trade.asp?disp=countrybycomm&dir=exp&resource=661&ryear=2004, accessed 2007/06/05
FAO (2008)
a) Food Price Indices. [online]: http://www.fao.org/worldfoodsituation/FoodPricesIndex,
accessed 2008/03/25
b) International commodity prices. [online]: http://www.fao.org/es/esc/prices, accessed
2008/03/25
Farrington J. and Bebbington A. with Wellard K. and Lewis D. J. (1993). Reluctant Partners? Non-Governmental Organizations, the State and Sustainable Agricultural Development. Routledge, London and New York Field A. (2005). Discovering Statistics Using SPSS. 2nd edition. Sage Publications, London, Thousand Oaks and New Delhi Fold N. (2002). Lead Firms and Competition in ‘Bi-polar’ Commodity Chains: Grinders and Branders in the Global Cocoa-chocolate Industry. Journal of Agrarian Change, Vol. 2, No 2, April 2002, pp. 228 - 247 Gereffi G. and Korzeniewicz (1994). Commodity Chains and Global Capitalism. Praeger Publishers, Westport Gereffi G. (1999). A Commodity Chains Framework for Analyzing Global Industries. Journal of International Economics, Volume 48, No 1, June 1999, pp. 37 – 70. [online]: http://www.azc.uam.mx/socialesyhumanidades/06/departamentos/relaciones%20productivas/Pdf.%20De%20curso%20de%20MESO/Gereffi%201999.pdf, accessed 2008/04/07
- 101 -
Gereffi G., Humphrey J. and Surgeon T. (2005): The governance of global value chains. Published. Review of International Political Economy 12:1 February 2005, pp. 78 – 104. [online]: http://web.mit.edu/ipc/sloan05/GVC_Governance.pdf, accessed 2007/10/24 Gilbert C. L. and Varangis P. (2003). Globalization and International Commodity Trade with Specific Reference to the West African Cocoa Producers. Working Paper 9668, National Bureau of Economic Research, Inc, Cambridge Global Value Chains Initiative (2007). Concepts and Tools. [online]: http://www.globalvaluechains.org/concepts.html, accessed 2007/10/24 Hagen P. C. (2003). Innføring i sannsynlighetsregning og statistikk. 4th ed. Cappelen Akademisk Forlag, Oslo Hay I. (2000). Qualitative Research Strategies in Human Geography. Oxford University Press, Melbourne Hernes G. (1975). Makt og Avmakt. En begrepsanalyse. Universitetsforlaget, Bergen, pp. 174-180 Humphrey J. and Schmitz H. (2001). Governance in Global Value Chains. IDS Bulletin Vol. 32, No 3, pp. 19 – 29. [online]: http://www.inti.gov.ar/cadenasdevalor/HumphreySchmitz.pdf, accessed 2008/04/07 International Cocoa Organization (ICCO) (2006)
a) Assessments of the movements of Global Supply and Demand – February 2006. Market committee, 9th meeting, Kuala Lumpur, March 14th 2007. [online]: http://www.icco.org/statistics/other.aspx, accessed 2008/04/08
b) Project description: Analysis of the value chain in cocoa producing countries. [online]: http://www.icco.org/projects/Projects1.aspx?Id=hqh2737, accessed 2008/04/21
c) Analysis of the value chain in cocoa producing countries. Proposal for a global comparative study. Executive committee, 129th meeting, London, June 6th – 8th 2006. [online]: http://www.icco.org/documents/documents.aspx, accessed 2008/04/21
d) A study on the market of Organic Cocoa – September 2006. Executive committee, 130th meeting, London, September 12th – 15th 2006. [online]: http://www.icco.org/statistics/other.aspx, accessed 2008/06/04
International Cocoa Organization (ICCO) (2007).
a) Annual forecast of production and consumption and estimates of production levels to achieve equilibrium in the world cocoa market. Market Committee, 9th meeting, Kuala Lumpur, March 14th 2007. [online]: http://www.icco.org/economics/cost.aspx, accessed 2008/04/21
b) Origins of cocoa and its spread around the world. [online]: http://www.icco.org/about/growing.aspx, accessed 2007/10/16
- 102 -
c) Harvesting and Post-harvest. [online]: http://www.icco.org/about/Harvesting.aspx, accessed 2007/10/16
d) Cocoa Economy: Production. [online]: http://www.icco.org/economics/promotion.aspx, accessed 2007/10/10
International Cocoa Organization (ICCO) (2008)
a) Trading and shipping cocoa beans. [online]: http://www.icco.org/about/shipping.aspx, accessed 2008/04/08
b) ICCO Monthly Averages of Daily Prices. [online]: http://www.icco.org/statistics/monthly.aspx?AD=2007&MD=1&AH=2007&MH=12&Tipo=Tabla&Datos=USD, accessed 2008/03/25
International Crisis Group (ICG) (2007). Ecuador: Overcoming Instability? Latin America Report, No 22, August 2007 International Herald Tribune (IHT) (2006). Cocoa farmers strike in Ivory Coast, world's largest producer. [online]: http://www.iht.com/articles/ap/2006/10/16/business/AF_FIN_Ivory_Coast_Cocoa.php, accessed 2008/04/08 Jano P. A. (2007). Quality incentives and the Development of a High Value Agrifood Markets: Ecuador’s Cacao Marketing Chain. Virginia Polytechnic Institute and State University, Blacksburg. [online]: http://scholar.lib.vt.edu/theses/available/etd-06082007-131653/unrestricted/2007_07_17_PJanoMasterThesis.pdf, accessed 2008/03/03 KAOKA (2008). Who we are? [online]: http://www.kaoka.fr/cadre258.php?sCadre=inter/html/uk/accueil/index.php&cookLangueTmp=uk, accessed 2008/05/29 Kaplinsky R. and Morris M. (2002). A Handbook for Value chain Research. Prepared for the IDRC (The International Development Research Centre), Brighton. [online]: http://www.redepapa.org/valuechain.pdf, accessed 2008/03/26 Lewis-Beck, M. S. (1980). Applied regression. An introduction. Sage Publications Inc. Beverly Hills and London Magnani L. (2001). Abduction, Reason, and Science. Process of Discovery and Explanation. Kluwer Academic/Plenum Publishers, New York, Boston, Dordrecht, London and Moscow Midtbø, T. (2007). Regresjonsanalyse for samfunnsvitere. Med eksempler i SPSS. Oslo, Universitetsforlaget Nestlé (2006). The Nestlé Concept of Corporate Responsibility – as implemented in Latin America. A collaboration between Foundation Strategy Group, Geneva, Switzerland, and Nestlé S.A. Public Affairs, March 2006. [online]: http://www.nestle.com/Resource.axd?Id=7F757F03-B601-49EA-8395-E24095231754, 2007/10/17
- 103 -
Nestlé (2008). a) Nestlé is... [online]: http://www.nestle.com/, accessed 2008/05/27 b) Responsabilidad social. [online]. http://www.nestle.com.ec/institucional/responsabilidad_apoyo.asp, accessed 2008/05/27 Oakley P. et al. (1991). Projects with people. The practice of participation in rural development. International Labour Office, Geneva Okyere W. A. (1989). The effects of domestic policies on exportable primary commodities: The case of Ghana and cocoa. African Rural Social Science Series, Research report number 1, Winrock International, Institute for Agricultural Development, Arkansas Pesche D. (2002). How can farmers’ organizations be strengthened? The Courier 2002:195, pp. 56-57 Phillips T. and Tallontire A. (2007). Drivers and Barriers to sustainable purchasing practices in the cocoa sector. NRET (Natural Research and Ethical Trade) Working Paper June 2007. [online]: http://www.nri.org/projects/NRET/responsible_cocoa.pdf, accessed 2008/04/02 Quingaísa E. (2007. Estudio de Caso: Denominacion de Origen “Cacao Arriba”. Consultation realized for FAO and IIAC, Quito, Ecuador. [online]: http://www.fao.org/ag/agn/agns/Projects_SQP_Santiago/Documentos/Estudios%20de%20caso/Cacao_Ecuador.pdf, accessed 2008/05/25 Radi C. and Ramírez P. (2006). El abc para la comercialización directa de cacao especial y con certificación. A collaboration between MAG, UDENOR, CORPEI and GTZ. GTZ-GESOREN, Quito Ragin C. C. (1989). The Comparative Method. Moving beyond qualitative and quantitative strategies. University of California Press, Berkeley and Los Angeles Raikes S., Jensen M.F. and Ponte S. (2000). Global Commodity Chain Analysis and the French Filière Approach: Comparison and Critique. Economy and Society. 2000, Vol. 29, No 3, pp. 390 – 417. [online]: http://66.102.1.104/scholar?hl=no&lr=&q=cache:59RnHThkVpEJ:www.ids.ac.uk/ids/global/pdfs/GCCs%2520and%2520filieres.pdf, accessed 2008/04/14 Ramírez P. (2006). Estructura y dinamica de la cadena de cacao en el Ecuador. Documento tecnoco. Primer borrador. [online]: http://www.ecuadorcocoaarriba.com/docs/Dinamica_cadena_cacao_Ecuador.pdf, accessed 2007/10/17 Ramírez P. (2007). Estrategia de fomento de la cadena de cacao en Ecuador. In cooperation with GTZ. [online]: http://www.ecuadorcocoaarriba.com/docs/estrategia_fomento_cacao.pdf , accessed 2007/10/17
- 104 -
Servicio de Información y Censo Agropecuario (SICA) (2007). a) Historia e importancia de la cadena del cacao en el Ecuador. [online]:
http://www.sica.gov.ec/cadenas/cacao/docs/importanciacadenacacao05.htm, accessed 2007/11/16
b) Ecuador: Precios internacionales del cacao bolsa de Nueva York. [online]: http://www.sica.gov.ec/cadenas/cacao/docs/preintcacao06.htm, accessed 2007/11/16
c) Ecuador: Precios del cacao en grano al productor. [online]: http://www.sica.gov.ec/cadenas/cacao/docs/preciodomesticocacao06.htm, accessed 2007/11/16
d) Ecuador: Partic. de la produccion de cacao en el PIB total y PIB agricula.[online]: http://www.sica.gov.ec/cadenas/cacao/docs/produccion_pib.html, accessed 2007/06/05
e) Ubicación de las principales zonas cacaoteras del Ecuador. [online]: http://www.sica.gov.ec/cadenas/cacao/docs/mapa.htm, accessed 2007/06/04
f) Ecuador: Precios referenciales FOB de exportacion de cacao en grano (2004 – 2005). [online]: http://www.sica.gov.ec/cadenas/cacao/docs/prereffobcacao05.htm, accessed 2007/11/16
g) Ecuador: Precios referenciales FOB de exportacion de cacao en grano (2005 – 2006). [online]: http://www.sica.gov.ec/cadenas/cacao/docs/prereffobcacao06.htm, accessed 2007/11/16
h) Ecuador: Precios del cacao en grano al productor. [online]: http://www.sica.gov.ec/cadenas/cacao/docs/preciodomesticocacao06.htm, accessed 2007/11/16
Shared interest (2007). Investing in a fairer world. [online]: http://www.shared-interest.com/files/QR56_ClearPrint.pdf, accessed 2007/06/05 Stiglitz J. E. and Charlton A. (2005). Fair Trade For All. How Trade Can Promote Development. Oxford University Press, Oxford Sundberg R. (2002). Collinearity. In Encyclopedia of Environmetrics. Vol. 1. John Wiley and Sons, Ltd, Chichester, pp 365 – 366. [online]: http://www2.math.su.se/~rolfs/Publikationer/Collinearity.pdf, accessed 2008/05/30 Tallec F. and Bockel L. for FAO (2005). Commodity Chain Analysis. Constructing the Commodity Chain Functional Analysis and Flow Charts. FAO, EASYPol, Module 043. [online]: http://www.fao.org/docs/up/easypol/330/cca_043EN.pdf, accessed 2008/04/07 The Success Alliance (2007). Program Summary. [online]: http://thesuccessalliance.org/ecuador.html, accessed 2007/06/04 Todaro M. P. and Smith S. C. (2003). Economic Development. Eighth edition. Pearson Education Limited, Essex
- 105 -
Unión de Organizaciones Compesinas Cacaoteras del Ecuador (UNOCACE) (2007). UNOCACE, líderes en produccion y exportación de cacao orgánico tipo nacional fino o de aroma. Information folder published 2007, Guayaquil United Nations Conference on Trade and Development (UNCTAD) (1991): Prospects for the world cocoa market until the year 2005. United Nations Publications, New York United Nations Conference on Trade and Development (UNCTAD) (2007). INFO COMM. Market information in the commodities area.
a) Characteristics. [online]: http://www.unctad.org/infocomm/anglais/cocoa/characteristics.htm, accessed 2007/10/16
b) Crop. [online]: http://www.unctad.org/infocomm/anglais/cocoa/crop.htm, accessed 2007/10/16
c) Market. [online]: http://www.unctad.org/infocomm/anglais/cocoa/market.htm, accessed 2007/10/16
United Nations (UN), Economic Commission for Latin America and the Caribbean (1994). CEPAL review 54. United Nations Publication, Santiago U.S. Department of State (2007). Background Note: Ecuador. [online]: http://www.state.gov/r/pa/ei/bgn/35761.htm, accessed 2007/06/05 World Cocoa Foundation (WCF) (2007). Encouraging Sustainable, responsible, cocoa growing.
a) Handling the harvest. [online]: http://www.worldcocoafoundation.org/tree-to-table/handling-the-harvest.asp, accessed 2007/10/17
b) After the harvest. [online]: http://www.worldcocoafoundation.org/tree-to-table/after-the-harvest.asp, accessed 2007/10/17
Yin R. K. (1993). Application of Case Study Research. Sage Publications, Newbury Park
- 106 -
Overview of institutions from which I gained new insight through personal communication / correspondence ACDI/VOCA GUAYAQUIL: Iven Ose, Jaime Freire + additional staff
ACDI/VOCA QUEVEDO: Jose Garcia + Estefanny Calero + additional staff
ANECACAO: Pablo Vega Garcia
ARAZA ECUADOR: Alvaro Aristizobal
BCS-ÖKO: Armando Bonifaz
GTZ/CORPEI: Sergio Pino
INIAP: Alfonso Vasco
MAG: Edgar Vera
MIC: Inés Hidalgo
MANOBANDA: Various staff
MARTINETTI: Various staff
NESTLE AGRISON: Frank Blacio + additional staff
NESTLE COLLO: Various staff
NESTLE FABRICA SUR: Henry Gabrilla + Mark Resink
QUEVEXPORT: Various staff
TRANSMAR (COLONIAL): Patricio Espinoza
UNOCACE: Freddy Cabello
- 107 -
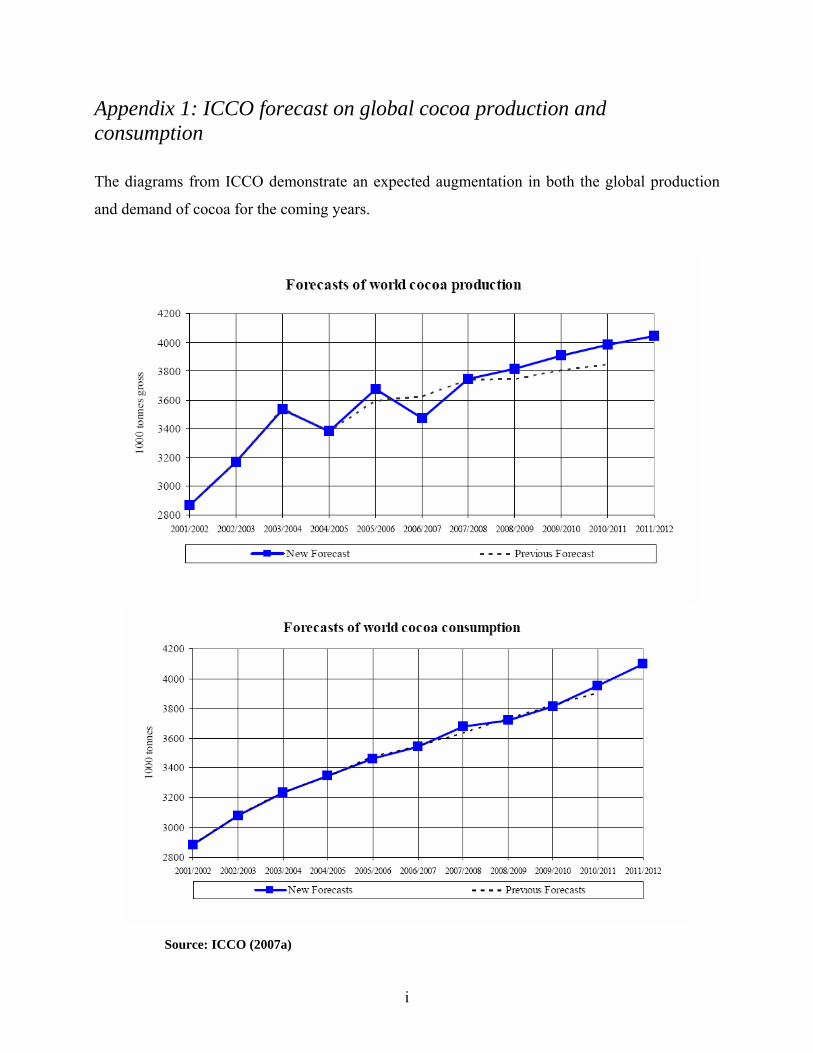
Appendix 1: ICCO forecast on global cocoa production and consumption
The diagrams from ICCO demonstrate an expected augmentation in both the global production
and demand of cocoa for the coming years.
Source: ICCO (2007a)
i
Appendix 2: The 3 botanic varieties of cocoa trees worldwide
There are three factors causing the major impact on the taste developed from the cocoa beans; 1)
the botanic origin 2) the environmental conditions within the production area and 3) the post
harvesting conditions (ANECACAO 2007). You can find three different botanic varieties of
cocoa trees worldwide, the Criollo, Forestero and Trinitario:
1. Criollo Criollo, producing fine and flavoured beans, was frequently cultivated and dominated the
market until the 18th century (ICCO 2007b). In the era before the colonization, Criollo was
cultivated in Central America, some islands in the Pacific, in Indonesia and Sri Lanka
(ANECACAO 2007). In recent times, the Criollo tree has most frequently been grown in the
Caribbean, Venezuela, Papua New Guinea, the West Indies, Sri Lanka, East Timor and Java
(UNCTAD 2007a). The ICCO claims it to be few (if any at all) pure Criollo trees remaining
today, meaning the ones being cultivated in the abovementioned nations are modern varieties
of the traditional species (ICCO 2007b). The characterization of Criollo, is its small to
medium sized beans with bright coloured cotillions which present a delicate aroma of
chocolate accompanied by a light nutty taste (ANECACAO 2007).
2. Forastero Forastero is the most common cocoa tree, accounting for about 90% of the cocoa beans
produced on a global scale (UNCTAD 2007a). This type of cocoa is cultivated in Asia and
Africa, as well as in the Amazonian basin (ANECACAO 2007). Forastero is found both in
wild, semi-wild and cultivated forms, whereby the population called Amelonado is the most
frequently grown by cocoa farmers worldwide. Amelonado comes in different varieties,
including Comom in Brazil, West African Amelonado in Africa, Cacao Nacional in Ecuador
and Matina in Costa Rica and Mexico (ICCO 2007b). The Forastero produces small to
medium sized beans with dark brown coloured cotillions and have a strong aroma of
chocolate with a bitter taste (ANECACAO 2007).
ii
3. Trinitario Trinitario is the third and final variety of cocoa trees. This variety is actually a hybrid of the
two abovementioned cocoa populations, although being considered part of the Forasteros
(ICCO 2007b). The Trinitario is recognized for its medium to large sized kernels with brown
or reddish cotillions, which develops an additional taste to the chocolate aroma, often
described as fruity (ANECACAO 2007). Trinitario was, as the name implicate, first
cultivated in Trinidad, so to be spread to Venezuela, followed by Ecuador, Cameroon, Samoa,
Sri Lanka, Java and New Guinea (ICCO 2007b). Now the variety is mainly cultivated in
Trinidad, Jamaica, Colombia and Costa Rica (ANECACAO 2007)
iii
Appendix 3: The 3 different stages of the harvest season Cocoa producers go through three different stages in the harvest season before they bag the beans
for delivery. These stages include harvesting, fermentation and drying of the cocoa beans. Two
harvests are usually made annually, although cocoa mature all through the year. These two
harvests are termed mid- and main-crop, whereby the latter most frequently are bigger than the
former (UNCTAD 2007b). The annual timing of the two harvest periods depends on the
geographical position of the cocoa producer, although extreme weather changes can disturb this
pattern, resulting in annual fluctuations (WCF 2007a).
Harvesting The cocoa beans are to be found inside the pods. During harvest the ripe pods need to be picked
in order to extract the seeds. At this stage the seeds are wet and cream coloured, and the pods are
kept for between seven and ten days after harvested before opened to start the process of
fermentation (ICCO 2007c).
Fermentation Although the process of fermentation can be carried out in several different ways, the basic
principle is to extract the seeds from the pods and furthermore collect them into piles or in gather
them in boxes “… to allow micro-organisms to develop and initiate the fermentation of the pulp
surrounding the beans” (ICCO 2007c). The duration of the fermentation depends on the variety
of cocoa applied, but normally it takes somewhere between three and nine days (WCF 2007b).
The chemical reactions occurring during the fermentation is crucial for the beans to develop both
the colour and the taste of chocolate (ICCO 2007c), as the raw and bitter taste of the cocoa is
removed when the sugar contained in the beans is converted to (lactic and acetic) acid (WCF
2007b).
iv
Drying After the fermentation, the cocoa holds a high level of humidity (up to 60%). In order to decrease
this level (down to a preferred 7,5%), the beans need to be dried (ICCO 2007c). This can either
take place naturally (on trays or mats out in the sun) or artificially (with the use of solar dryers)
(WCF 2007b). During the drying process, it is crucial to be aware of the temperature (never to
exceed 65°C). In order to prevent affecting the flavour negatively, the beans should neither be
dried too quickly nor too slowly (ICCO 2007c).
v
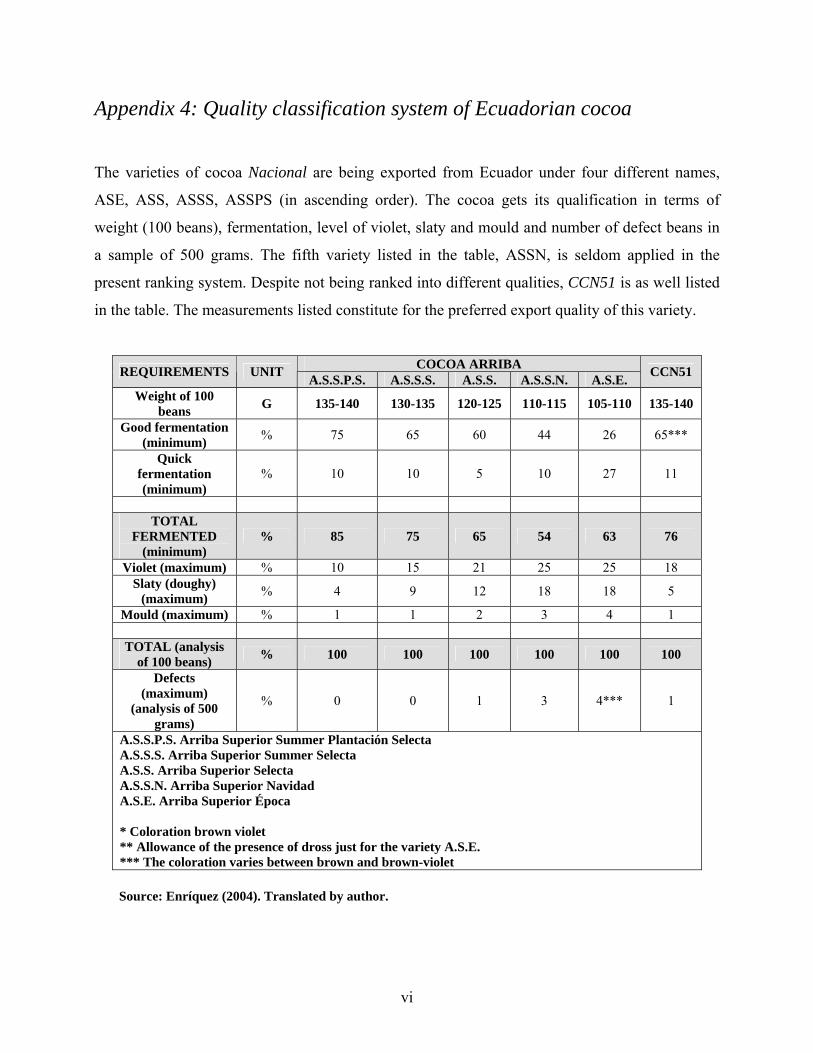
Appendix 4: Quality classification system of Ecuadorian cocoa
The varieties of cocoa Nacional are being exported from Ecuador under four different names,
ASE, ASS, ASSS, ASSPS (in ascending order). The cocoa gets its qualification in terms of
weight (100 beans), fermentation, level of violet, slaty and mould and number of defect beans in
a sample of 500 grams. The fifth variety listed in the table, ASSN, is seldom applied in the
present ranking system. Despite not being ranked into different qualities, CCN51 is as well listed
in the table. The measurements listed constitute for the preferred export quality of this variety.
COCOA ARRIBA REQUIREMENTS UNIT A.S.S.P.S. A.S.S.S. A.S.S. A.S.S.N. A.S.E. CCN51
Weight of 100 beans G 135-140 130-135 120-125 110-115 105-110 135-140
Good fermentation (minimum) % 75 65 60 44 26 65***
Quick fermentation (minimum)
% 10 10 5 10 27 11
TOTAL
FERMENTED (minimum)
% 85 75 65 54 63 76
Violet (maximum) % 10 15 21 25 25 18 Slaty (doughy)
(maximum) % 4 9 12 18 18 5
Mould (maximum) % 1 1 2 3 4 1
TOTAL (analysis of 100 beans) % 100 100 100 100 100 100
Defects (maximum)
(analysis of 500 grams)
% 0 0 1 3 4*** 1
A.S.S.P.S. Arriba Superior Summer Plantación Selecta A.S.S.S. Arriba Superior Summer Selecta A.S.S. Arriba Superior Selecta A.S.S.N. Arriba Superior Navidad A.S.E. Arriba Superior Época * Coloration brown violet ** Allowance of the presence of dross just for the variety A.S.E. *** The coloration varies between brown and brown-violet
Source: Enríquez (2004). Translated by author.
vi
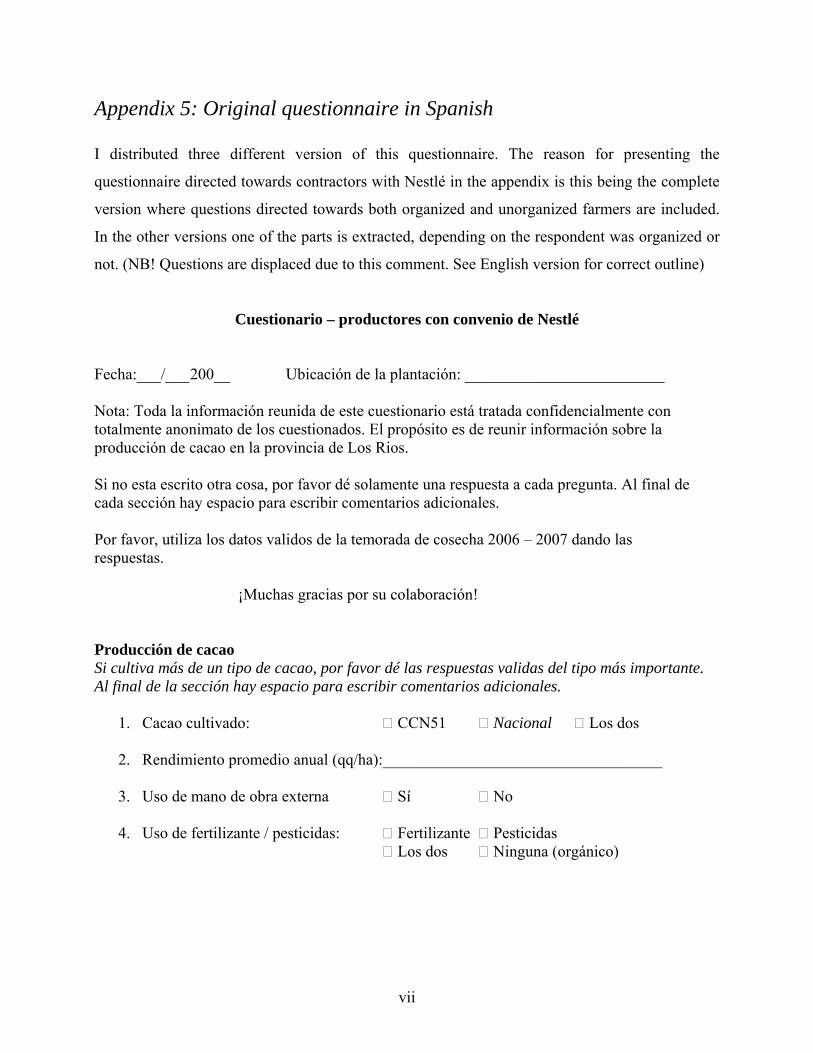
Appendix 5: Original questionnaire in Spanish I distributed three different version of this questionnaire. The reason for presenting the
questionnaire directed towards contractors with Nestlé in the appendix is this being the complete
version where questions directed towards both organized and unorganized farmers are included.
In the other versions one of the parts is extracted, depending on the respondent was organized or
not. (NB! Questions are displaced due to this comment. See English version for correct outline)
Cuestionario – productores con convenio de Nestlé Fecha:___/___ 200__ Ubicación de la plantación: _________________________ Nota: Toda la información reunida de este cuestionario está tratada confidencialmente con totalmente anonimato de los cuestionados. El propósito es de reunir información sobre la producción de cacao en la provincia de Los Rios. Si no esta escrito otra cosa, por favor dé solamente una respuesta a cada pregunta. Al final de cada sección hay espacio para escribir comentarios adicionales. Por favor, utiliza los datos validos de la temorada de cosecha 2006 – 2007 dando las respuestas. ¡Muchas gracias por su colaboración! Producción de cacao Si cultiva más de un tipo de cacao, por favor dé las respuestas validas del tipo más importante. Al final de la sección hay espacio para escribir comentarios adicionales.
1. Cacao cultivado: CCN51 Nacional Los dos
2. Rendimiento promedio anual (qq/ha):___________________________________ 3. Uso de mano de obra externa Sí No 4. Uso de fertilizante / pesticidas: Fertilizante Pesticidas
Los dos Ninguna (orgánico)
vii
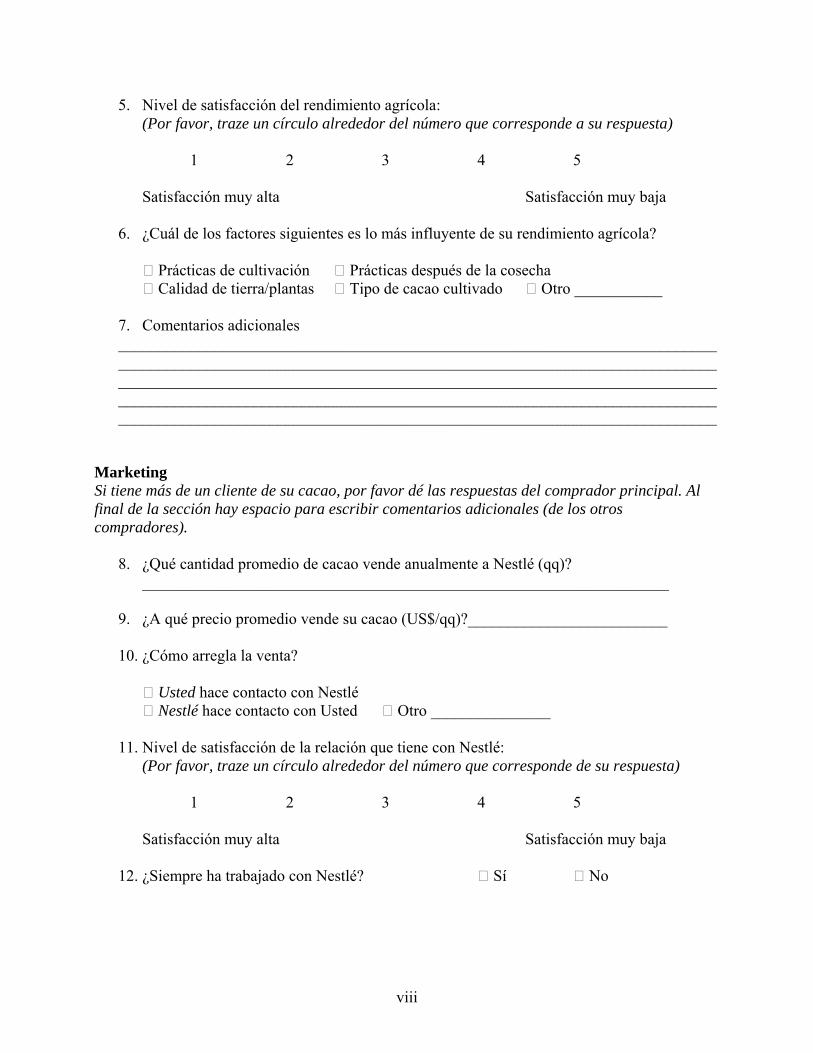
5. Nivel de satisfacción del rendimiento agrícola: (Por favor, traze un círculo alrededor del número que corresponde a su respuesta)
1 2 3 4 5
Satisfacción muy alta Satisfacción muy baja 6. ¿Cuál de los factores siguientes es lo más influyente de su rendimiento agrícola?
Prácticas de cultivación Prácticas después de la cosecha Calidad de tierra/plantas Tipo de cacao cultivado Otro ___________
7. Comentarios adicionales _______________________________________________________________________________________________________________________________________________________________________________________________________________________________________________________________________________________________________________________________________________________________________________________
Marketing Si tiene más de un cliente de su cacao, por favor dé las respuestas del comprador principal. Al final de la sección hay espacio para escribir comentarios adicionales (de los otros compradores).
8. ¿Qué cantidad promedio de cacao vende anualmente a Nestlé (qq)? __________________________________________________________________
9. ¿A qué precio promedio vende su cacao (US$/qq)?_________________________ 10. ¿Cómo arregla la venta?
Usted hace contacto con Nestlé Nestlé hace contacto con Usted Otro _______________
11. Nivel de satisfacción de la relación que tiene con Nestlé:
(Por favor, traze un círculo alrededor del número que corresponde de su respuesta)
1 2 3 4 5
Satisfacción muy alta Satisfacción muy baja 12. ¿Siempre ha trabajado con Nestlé? Sí No
viii
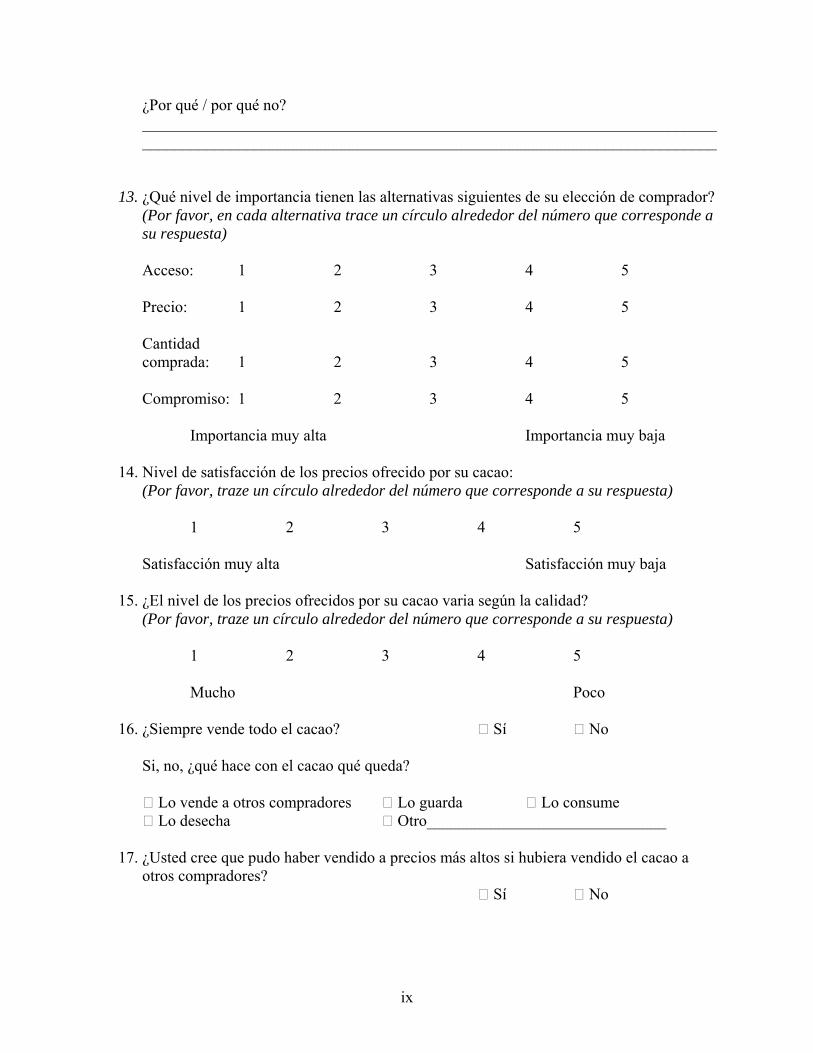
¿Por qué / por qué no? ________________________________________________________________________________________________________________________________________________
13. ¿Qué nivel de importancia tienen las alternativas siguientes de su elección de comprador?
(Por favor, en cada alternativa trace un círculo alrededor del número que corresponde a su respuesta) Acceso: 1 2 3 4 5
Precio: 1 2 3 4 5 Cantidad comprada: 1 2 3 4 5 Compromiso: 1 2 3 4 5
Importancia muy alta Importancia muy baja 14. Nivel de satisfacción de los precios ofrecido por su cacao:
(Por favor, traze un círculo alrededor del número que corresponde a su respuesta)
1 2 3 4 5
Satisfacción muy alta Satisfacción muy baja 15. ¿El nivel de los precios ofrecidos por su cacao varia según la calidad?
(Por favor, traze un círculo alrededor del número que corresponde a su respuesta)
1 2 3 4 5 Mucho Poco
16. ¿Siempre vende todo el cacao? Sí No
Si, no, ¿qué hace con el cacao qué queda? Lo vende a otros compradores Lo guarda Lo consume Lo desecha Otro______________________________
17. ¿Usted cree que pudo haber vendido a precios más altos si hubiera vendido el cacao a
otros compradores? Sí No
ix
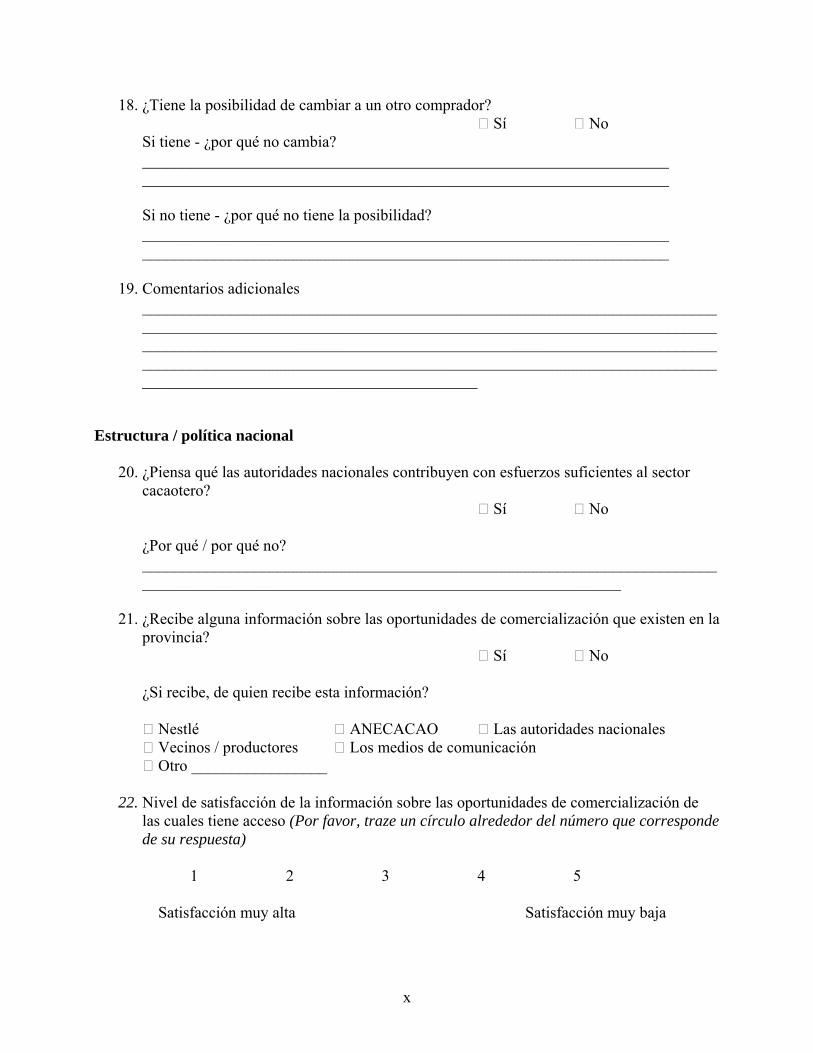
18. ¿Tiene la posibilidad de cambiar a un otro comprador? Sí No
Si tiene - ¿por qué no cambia? __________________________________________________________________ __________________________________________________________________ Si no tiene - ¿por qué no tiene la posibilidad? __________________________________________________________________ __________________________________________________________________
19. Comentarios adicionales __________________________________________________________________________________________________________________________________________________________________________________________________________________________________________________________________________________________________________________________________________
Estructura / política nacional
20. ¿Piensa qué las autoridades nacionales contribuyen con esfuerzos suficientes al sector cacaotero?
Sí No ¿Por qué / por qué no?
____________________________________________________________________________________________________________________________________
21. ¿Recibe alguna información sobre las oportunidades de comercialización que existen en la
provincia? Sí No
¿Si recibe, de quien recibe esta información? Nestlé ANECACAO Las autoridades nacionales Vecinos / productores Los medios de comunicación Otro _________________
22. Nivel de satisfacción de la información sobre las oportunidades de comercialización de
las cuales tiene acceso (Por favor, traze un círculo alrededor del número que corresponde de su respuesta)
1 2 3 4 5
Satisfacción muy alta Satisfacción muy baja
x
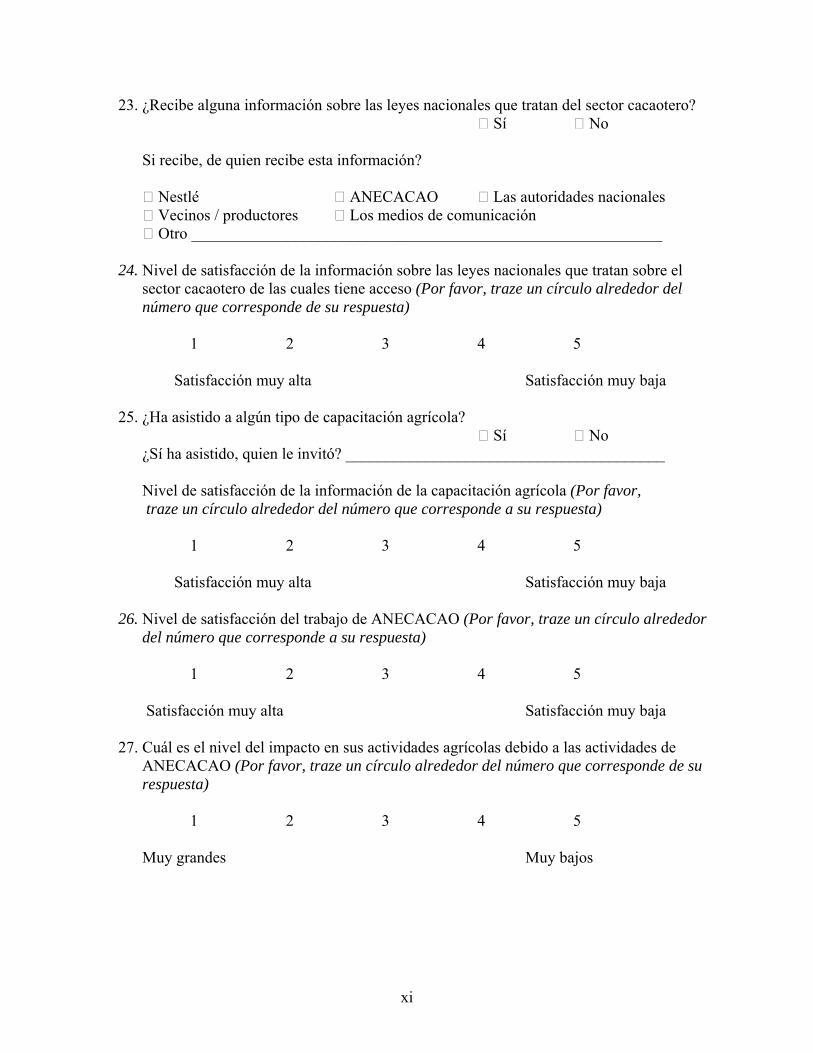
23. ¿Recibe alguna información sobre las leyes nacionales que tratan del sector cacaotero? Sí No
Si recibe, de quien recibe esta información?
Nestlé ANECACAO Las autoridades nacionales Vecinos / productores Los medios de comunicación Otro ___________________________________________________________
24. Nivel de satisfacción de la información sobre las leyes nacionales que tratan sobre el
sector cacaotero de las cuales tiene acceso (Por favor, traze un círculo alrededor del número que corresponde de su respuesta)
1 2 3 4 5
Satisfacción muy alta Satisfacción muy baja 25. ¿Ha asistido a algún tipo de capacitación agrícola?
Sí No ¿Sí ha asistido, quien le invitó? ________________________________________
Nivel de satisfacción de la información de la capacitación agrícola (Por favor, traze un círculo alrededor del número que corresponde a su respuesta)
1 2 3 4 5
Satisfacción muy alta Satisfacción muy baja
26. Nivel de satisfacción del trabajo de ANECACAO (Por favor, traze un círculo alrededor del número que corresponde a su respuesta)
1 2 3 4 5 Satisfacción muy alta Satisfacción muy baja
27. Cuál es el nivel del impacto en sus actividades agrícolas debido a las actividades de
ANECACAO (Por favor, traze un círculo alrededor del número que corresponde de su respuesta)
1 2 3 4 5 Muy grandes Muy bajos
xi
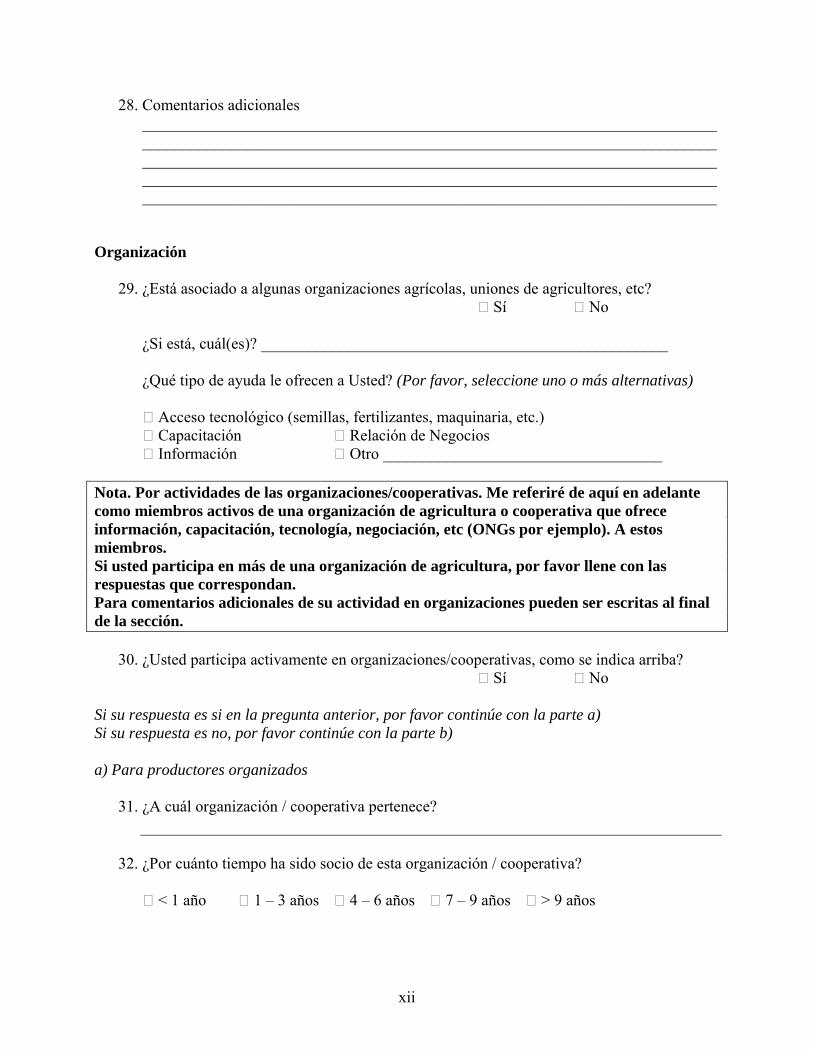
28. Comentarios adicionales ________________________________________________________________________________________________________________________________________________________________________________________________________________________________________________________________________________________________________________________________________________________________________
Organización
29. ¿Está asociado a algunas organizaciones agrícolas, uniones de agricultores, etc? Sí No
¿Si está, cuál(es)? ___________________________________________________
¿Qué tipo de ayuda le ofrecen a Usted? (Por favor, seleccione uno o más alternativas) Acceso tecnológico (semillas, fertilizantes, maquinaria, etc.) Capacitación Relación de Negocios Información Otro ___________________________________
Nota. Por actividades de las organizaciones/cooperativas. Me referiré de aquí en adelante como miembros activos de una organización de agricultura o cooperativa que ofrece información, capacitación, tecnología, negociación, etc (ONGs por ejemplo). A estos miembros. Si usted participa en más de una organización de agricultura, por favor llene con las respuestas que correspondan. Para comentarios adicionales de su actividad en organizaciones pueden ser escritas al final de la sección.
30. ¿Usted participa activamente en organizaciones/cooperativas, como se indica arriba? Sí No
Si su respuesta es si en la pregunta anterior, por favor continúe con la parte a) Si su respuesta es no, por favor continúe con la parte b) a) Para productores organizados
31. ¿A cuál organización / cooperativa pertenece?
32. ¿Por cuánto tiempo ha sido socio de esta organización / cooperativa?
< 1 año 1 – 3 años 4 – 6 años 7 – 9 años > 9 años
xii
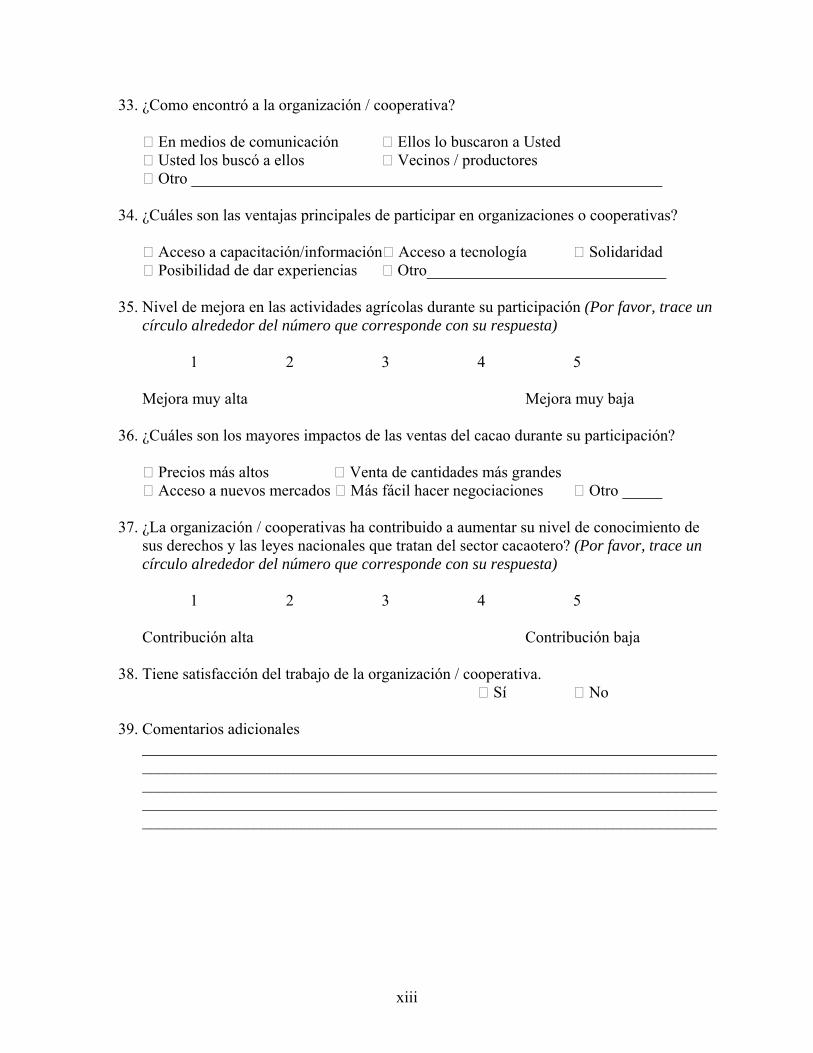
33. ¿Como encontró a la organización / cooperativa?
En medios de comunicación Ellos lo buscaron a Usted Usted los buscó a ellos Vecinos / productores Otro ___________________________________________________________
34. ¿Cuáles son las ventajas principales de participar en organizaciones o cooperativas?
Acceso a capacitación/información Acceso a tecnología Solidaridad Posibilidad de dar experiencias Otro______________________________
35. Nivel de mejora en las actividades agrícolas durante su participación (Por favor, trace un
círculo alrededor del número que corresponde con su respuesta) 1 2 3 4 5 Mejora muy alta Mejora muy baja 36. ¿Cuáles son los mayores impactos de las ventas del cacao durante su participación?
Precios más altos Venta de cantidades más grandes Acceso a nuevos mercados Más fácil hacer negociaciones Otro _____
37. ¿La organización / cooperativas ha contribuido a aumentar su nivel de conocimiento de
sus derechos y las leyes nacionales que tratan del sector cacaotero? (Por favor, trace un círculo alrededor del número que corresponde con su respuesta)
1 2 3 4 5 Contribución alta Contribución baja 38. Tiene satisfacción del trabajo de la organización / cooperativa.
Sí No 39. Comentarios adicionales
________________________________________________________________________________________________________________________________________________________________________________________________________________________________________________________________________________________________________________________________________________________________________
xiii
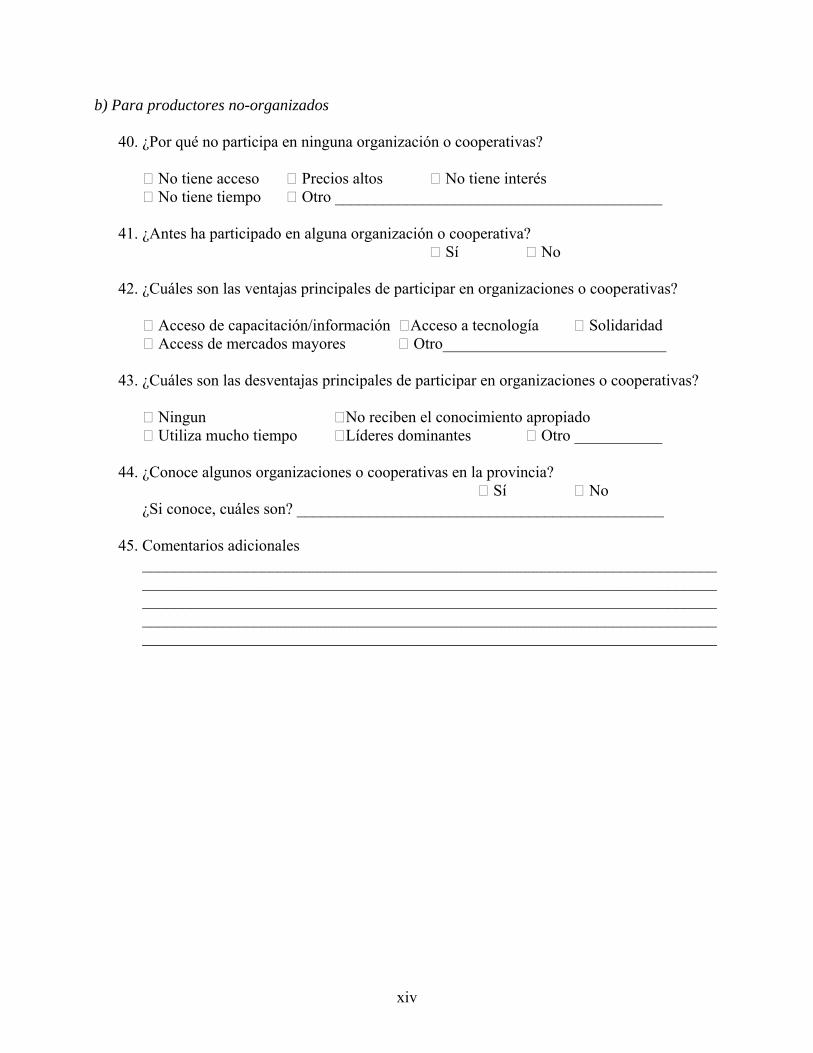
b) Para productores no-organizados
40. ¿Por qué no participa en ninguna organización o cooperativas?
No tiene acceso Precios altos No tiene interés No tiene tiempo Otro _________________________________________
41. ¿Antes ha participado en alguna organización o cooperativa?
Sí No
42. ¿Cuáles son las ventajas principales de participar en organizaciones o cooperativas? Acceso de capacitación/información Acceso a tecnología Solidaridad Access de mercados mayores Otro____________________________
43. ¿Cuáles son las desventajas principales de participar en organizaciones o cooperativas?
Ningun No reciben el conocimiento apropiado Utiliza mucho tiempo Líderes dominantes Otro ___________
44. ¿Conoce algunos organizaciones o cooperativas en la provincia?
Sí No ¿Si conoce, cuáles son? ______________________________________________
45. Comentarios adicionales ________________________________________________________________________________________________________________________________________________________________________________________________________________________________________________________________________________________________________________________________________________________________________
xiv
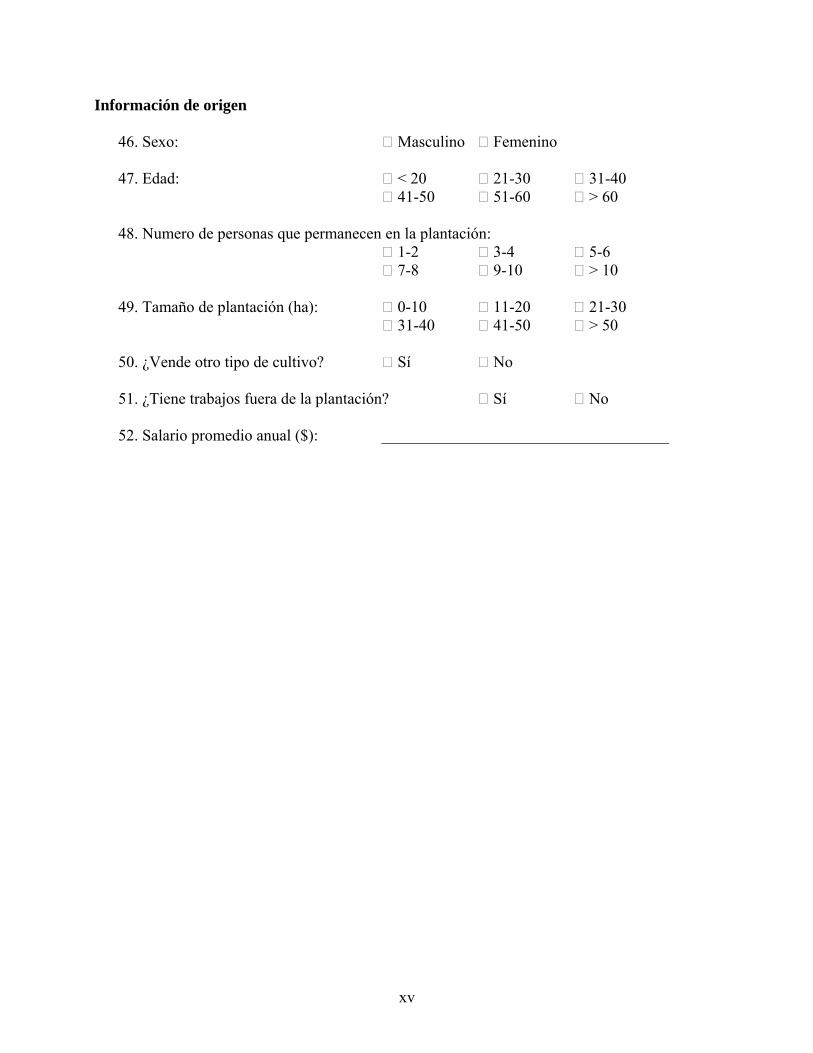
Información de origen
46. Sexo: Masculino Femenino 47. Edad: < 20 21-30 31-40
41-50 51-60 > 60
48. Numero de personas que permanecen en la plantación: 1-2 3-4 5-6 7-8 9-10 > 10
49. Tamaño de plantación (ha): 0-10 11-20 21-30
31-40 41-50 > 50 50. ¿Vende otro tipo de cultivo? Sí No
51. ¿Tiene trabajos fuera de la plantación? Sí No
52. Salario promedio anual ($): ____________________________________
xv
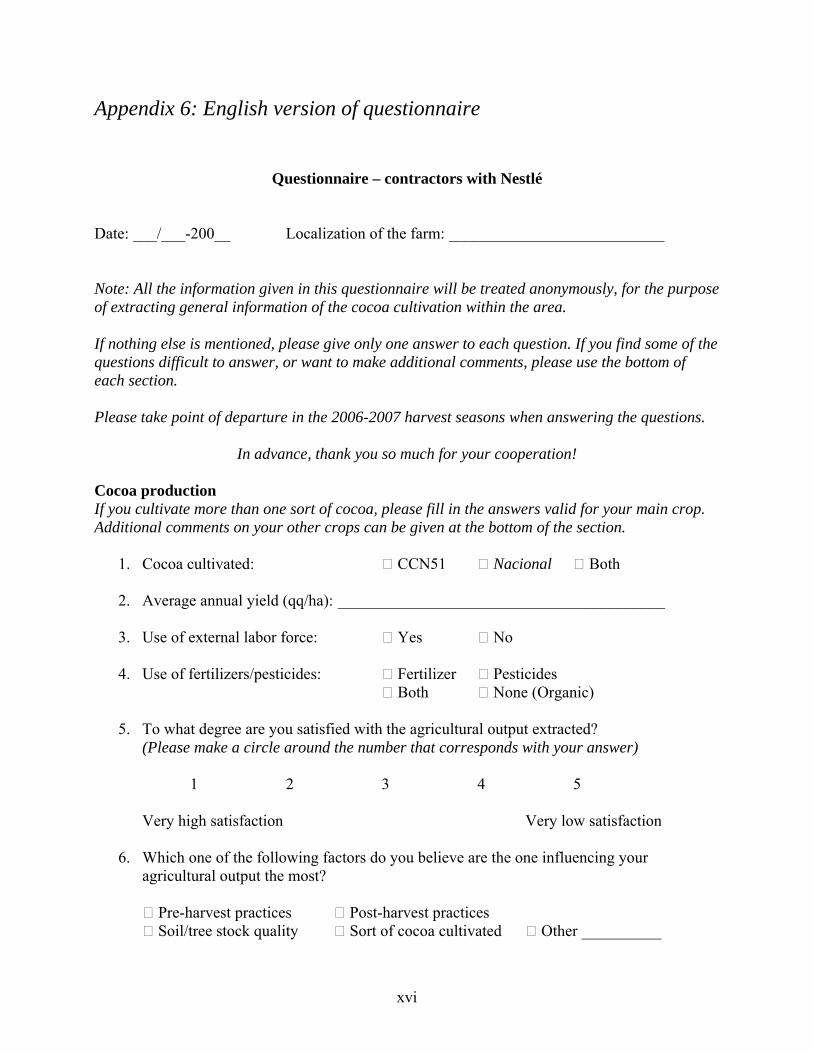
Appendix 6: English version of questionnaire
Questionnaire – contractors with Nestlé Date: ___/___-200__ Localization of the farm: ___________________________ Note: All the information given in this questionnaire will be treated anonymously, for the purpose of extracting general information of the cocoa cultivation within the area. If nothing else is mentioned, please give only one answer to each question. If you find some of the questions difficult to answer, or want to make additional comments, please use the bottom of each section. Please take point of departure in the 2006-2007 harvest seasons when answering the questions.
In advance, thank you so much for your cooperation! Cocoa production If you cultivate more than one sort of cocoa, please fill in the answers valid for your main crop. Additional comments on your other crops can be given at the bottom of the section.
1. Cocoa cultivated: CCN51 Nacional Both
2. Average annual yield (qq/ha): _________________________________________ 3. Use of external labor force: Yes No 4. Use of fertilizers/pesticides: Fertilizer Pesticides
Both None (Organic)
5. To what degree are you satisfied with the agricultural output extracted? (Please make a circle around the number that corresponds with your answer)
1 2 3 4 5
Very high satisfaction Very low satisfaction
6. Which one of the following factors do you believe are the one influencing your agricultural output the most?
Pre-harvest practices Post-harvest practices Soil/tree stock quality Sort of cocoa cultivated Other __________
xvi

7. Additional comments ________________________________________________________________________________________________________________________________________________________________________________________________________________________________________________________________________________________________________________________________________________________________________
Marketing If you have more than one buyer of your cocoa, please fill in the answers valid for your main purchaser. Additional comments on your other purchasers can be given at the bottom of the section.
8. How many qq of cocoa do you annually deliver to Nestlé? __________________
9. To what price do you averagely sell your cocoa (US$/qq)? __________________ 10. How do you arrange the sale?
You contact Nestlé Nestlé contacts you Other __________________________________________________________
11. In what degree are you satisfied with your relationship to Nestlé?
(Please make a circle around the number that corresponds with your answer)
1 2 3 4 5 Very high satisfaction Very low satisfaction 12. Have you always cooperated with Nestlé? Yes No
Why / why not? ________________________________________________________________________________________________________________________________________________
xvii
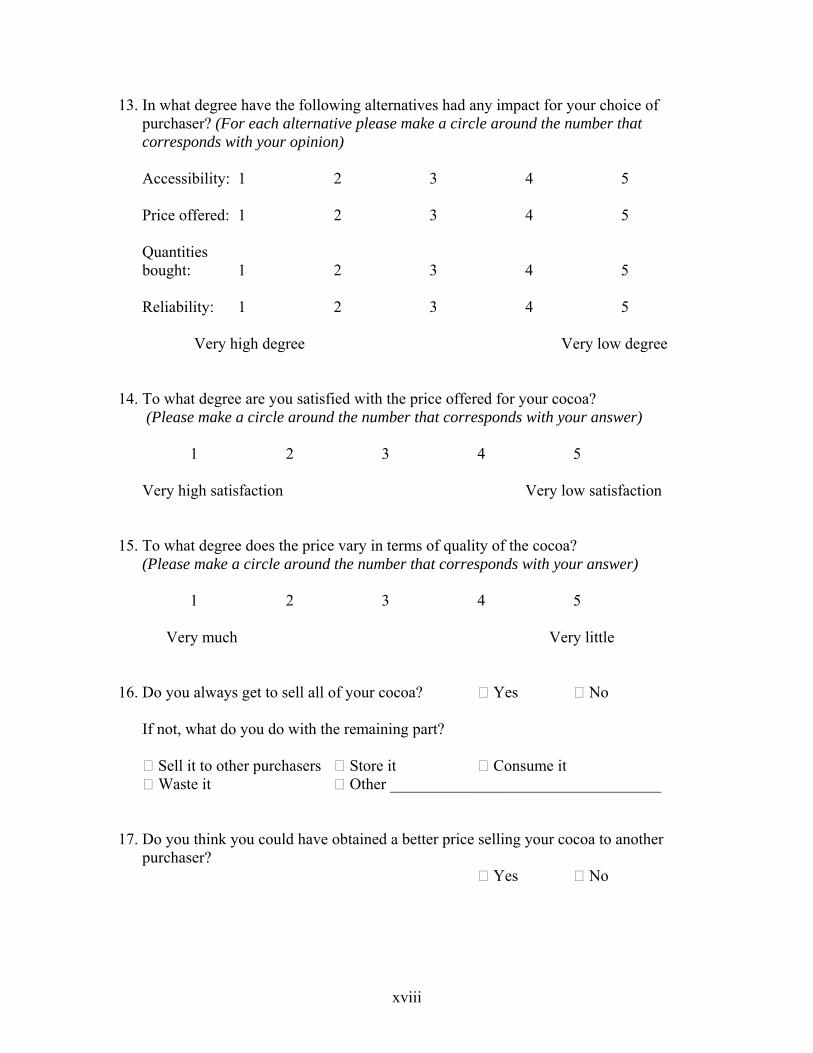
13. In what degree have the following alternatives had any impact for your choice of purchaser? (For each alternative please make a circle around the number that corresponds with your opinion)
Accessibility: 1 2 3 4 5 Price offered: 1 2 3 4 5 Quantities bought: 1 2 3 4 5 Reliability: 1 2 3 4 5 Very high degree Very low degree
14. To what degree are you satisfied with the price offered for your cocoa? (Please make a circle around the number that corresponds with your answer)
1 2 3 4 5 Very high satisfaction Very low satisfaction
15. To what degree does the price vary in terms of quality of the cocoa?
(Please make a circle around the number that corresponds with your answer)
1 2 3 4 5
Very much Very little
16. Do you always get to sell all of your cocoa? Yes No
If not, what do you do with the remaining part? Sell it to other purchasers Store it Consume it Waste it Other __________________________________
17. Do you think you could have obtained a better price selling your cocoa to another
purchaser? Yes No
xviii
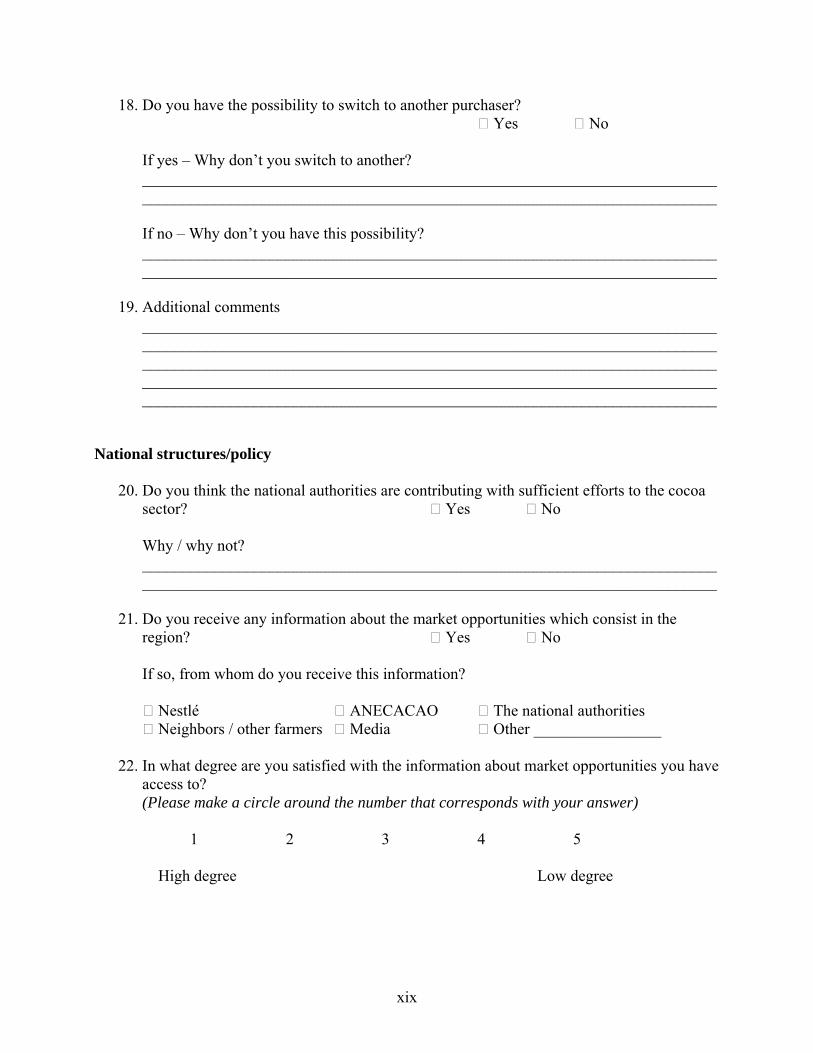
18. Do you have the possibility to switch to another purchaser? Yes No
If yes – Why don’t you switch to another? ________________________________________________________________________ ________________________________________________________________________ If no – Why don’t you have this possibility? ________________________________________________________________________ ________________________________________________________________________
19. Additional comments ________________________________________________________________________________________________________________________________________________________________________________________________________________________________________________________________________________________________________________________________________________________________________
National structures/policy
20. Do you think the national authorities are contributing with sufficient efforts to the cocoa sector? Yes No
Why / why not? ________________________________________________________________________________________________________________________________________________
21. Do you receive any information about the market opportunities which consist in the
region? Yes No
If so, from whom do you receive this information? Nestlé ANECACAO The national authorities Neighbors / other farmers Media Other ________________
22. In what degree are you satisfied with the information about market opportunities you have
access to? (Please make a circle around the number that corresponds with your answer)
1 2 3 4 5 High degree Low degree
xix
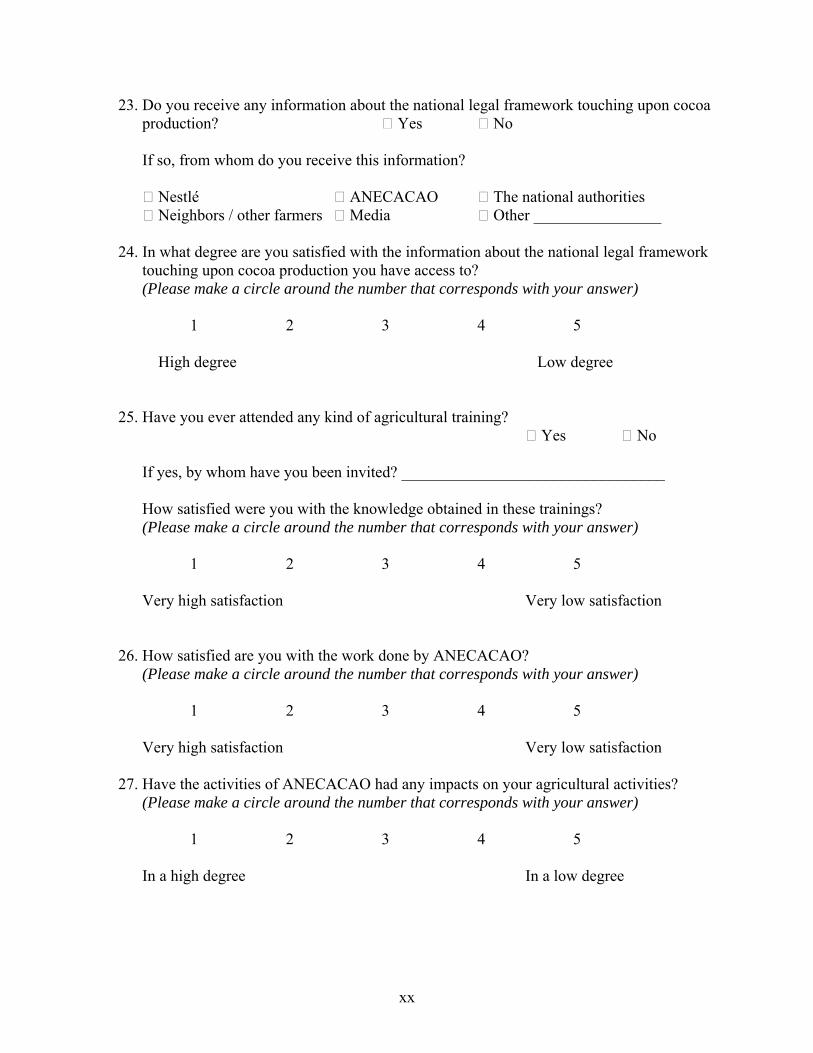
23. Do you receive any information about the national legal framework touching upon cocoa production? Yes No
If so, from whom do you receive this information? Nestlé ANECACAO The national authorities Neighbors / other farmers Media Other ________________
24. In what degree are you satisfied with the information about the national legal framework
touching upon cocoa production you have access to? (Please make a circle around the number that corresponds with your answer)
1 2 3 4 5 High degree Low degree
25. Have you ever attended any kind of agricultural training? Yes No
If yes, by whom have you been invited? _________________________________
How satisfied were you with the knowledge obtained in these trainings? (Please make a circle around the number that corresponds with your answer)
1 2 3 4 5 Very high satisfaction Very low satisfaction
26. How satisfied are you with the work done by ANECACAO?
(Please make a circle around the number that corresponds with your answer) 1 2 3 4 5
Very high satisfaction Very low satisfaction
27. Have the activities of ANECACAO had any impacts on your agricultural activities? (Please make a circle around the number that corresponds with your answer)
1 2 3 4 5 In a high degree In a low degree
xx
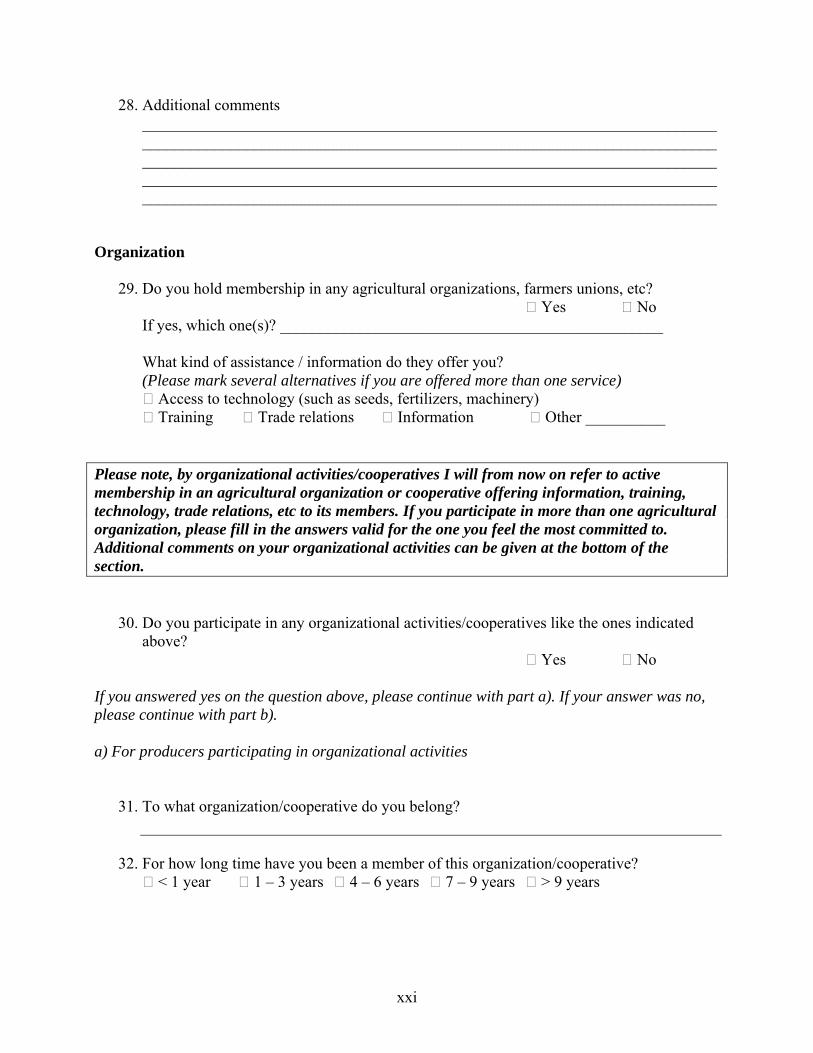
28. Additional comments ________________________________________________________________________________________________________________________________________________________________________________________________________________________________________________________________________________________________________________________________________________________________________
Organization
29. Do you hold membership in any agricultural organizations, farmers unions, etc? Yes No
If yes, which one(s)? ________________________________________________
What kind of assistance / information do they offer you? (Please mark several alternatives if you are offered more than one service) Access to technology (such as seeds, fertilizers, machinery) Training Trade relations Information Other __________
Please note, by organizational activities/cooperatives I will from now on refer to active membership in an agricultural organization or cooperative offering information, training, technology, trade relations, etc to its members. If you participate in more than one agricultural organization, please fill in the answers valid for the one you feel the most committed to. Additional comments on your organizational activities can be given at the bottom of the section.
30. Do you participate in any organizational activities/cooperatives like the ones indicated above?
Yes No
If you answered yes on the question above, please continue with part a). If your answer was no, please continue with part b). a) For producers participating in organizational activities
31. To what organization/cooperative do you belong?
32. For how long time have you been a member of this organization/cooperative?
< 1 year 1 – 3 years 4 – 6 years 7 – 9 years > 9 years
xxi
33. How did you get in touch with the organization/cooperative? Through media They looked you up You looked them up Through neighbors/others Other __________________________________
34. What are the major benefits belonging to an organization/cooperative?
Access to training/information Access to technology Solidarity Feed back opportunities Other_____________________________
35. To what degree have your farm activities improved after joining the
organization/cooperative? (Please make a circle around the number that corresponds with your answer)
1 2 3 4 5 In a high degree No change 36. What are the major impacts on your market activities belonging to an
organization/cooperative? Higher prices offered Larger quantities sold Access to new markets Better bargaining position Others__________
37. To what degree has the organization/cooperative contributed to increase your awareness about you rights and the national legal framework? (Please make a circle around the number that corresponds with your answer)
1 2 3 4 5 In a high degree In a low degree
38. Are you satisfied with the overall performance of the organization?
Yes No
39. Additional comments ________________________________________________________________________________________________________________________________________________________________________________________________________________________________________________________________________________________________________________________________________________________________________
xxii
b) For producers not participating in any organizational activities
40. Why do you not participate in any organizational activities/cooperatives? No access High costs No interests No time Other ________________________________________
41. Have you ever participated in any kind of organizational activities/cooperatives? Yes No
42. What do you think are the major advantages participating in such
organizations/cooperatives? Access to training/information Access to technology Solidarity Better market access Other_____________________________
43. What do you think are the major disadvantages participating in such
organizations/cooperatives? None Time consuming Not appropriate knowledge Leader dominated Other___________________________________
44. Do you know of any agricultural organizations/cooperatives which are located in the
area? Yes No
If so, which one(s)? _________________________________________________
45. Additional comments ________________________________________________________________________________________________________________________________________________________________________________________________________________________________________________________________________________________________________________________________________________________________________
xxiii
Background information
46. Sex: Male Female 47. Age: < 20 21-30 31-40
41-50 51-60 > 60
48. Household size: 1-2 3-4 5-6 7-8 9-10 > 10
49. Farm size (hectares): 0-10 11-20 21-30
31-40 41-50 > 50 50. Other cash-crops cultivated: Yes No
51. Off-farm labor: Yes No
52. Average income per year ($): ____________________________________
xxiv
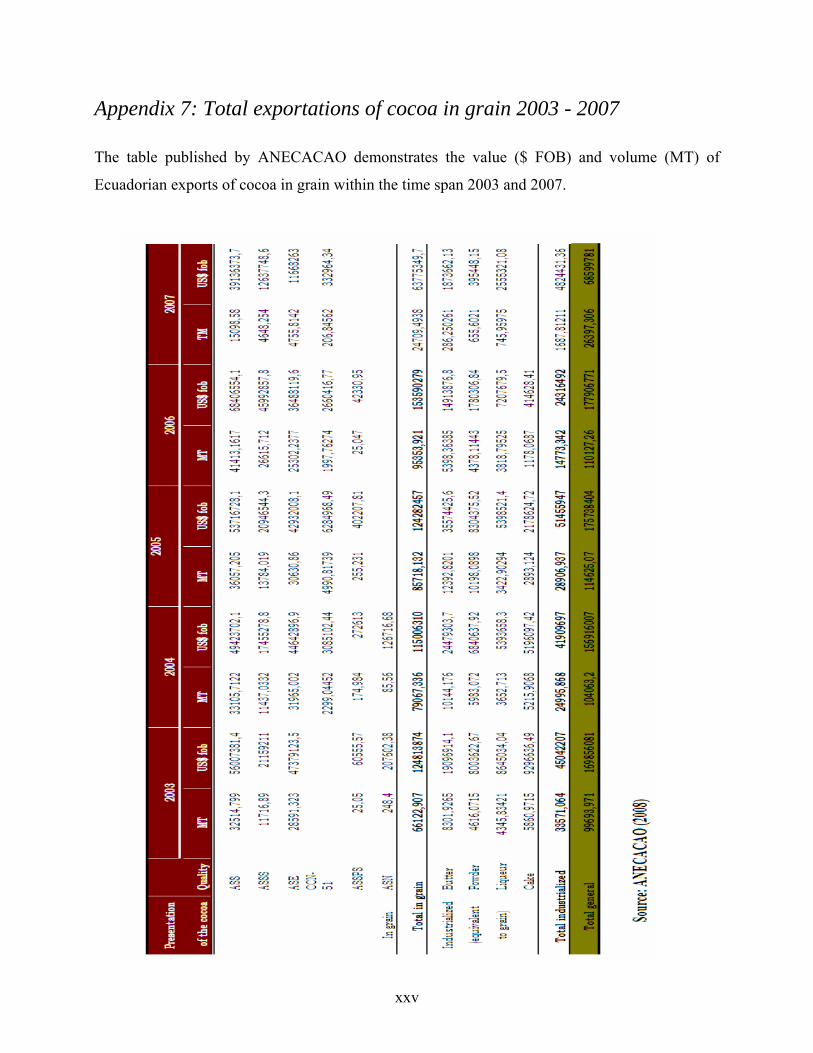
Appendix 7: Total exportations of cocoa in grain 2003 - 2007
The table published by ANECACAO demonstrates the value ($ FOB) and volume (MT) of
Ecuadorian exports of cocoa in grain within the time span 2003 and 2007.
xxv
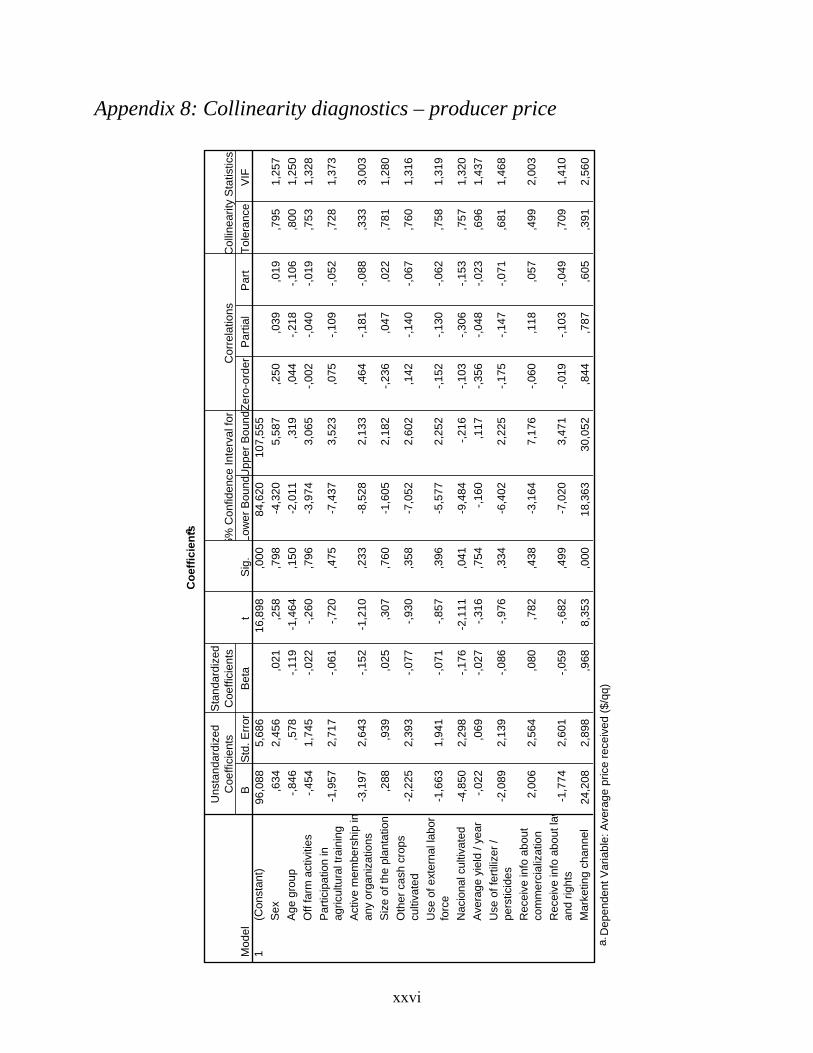
Appendix 8: Collinearity diagnostics – producer price
xxvi
Coe
ffici
entsa
96,0
885,
686
16,8
98,0
0084
,620
107,
555
,634
2,45
6,0
21,2
58,7
98-4
,320
5,58
7,2
50,0
39,0
19,7
951,
257
-,846
,578
-,119
-1,4
64,1
50-2
,011
,319
,044
-,218
-,106
,800
1,25
0-,4
541,
745
-,022
-,260
,796
-3,9
743,
065
-,002
-,040
-,019
,753
1,32
8
-1,9
572,
717
-,061
-,720
,475
-7,4
373,
523
,075
-,109
-,052
,728
1,37
3
-3,1
972,
643
-,152
-1,2
10,2
33-8
,528
2,13
3,4
64-,1
81-,0
88,3
333,
003
,288
,939
,025
,307
,760
-1,6
052,
182
-,236
,047
,022
,781
1,28
0
-2,2
252,
393
-,077
-,930
,358
-7,0
522,
602
,142
-,140
-,067
,760
1,31
6
-1,6
631,
941
-,071
-,857
,396
-5,5
772,
252
-,152
-,130
-,062
,758
1,31
9
-4,8
502,
298
-,176
-2,1
11,0
41-9
,484
-,216
-,103
-,306
-,153
,757
1,32
0-,0
22,0
69-,0
27-,3
16,7
54-,1
60,1
17-,3
56-,0
48-,0
23,6
961,
437
-2,0
892,
139
-,086
-,976
,334
-6,4
022,
225
-,175
-,147
-,071
,681
1,46
8
2,00
62,
564
,080
,782
,438
-3,1
647,
176
-,060
,118
,057
,499
2,00
3
-1,7
742,
601
-,059
-,682
,499
-7,0
203,
471
-,019
-,103
-,049
,709
1,41
0
24,2
082,
898
,968
8,35
3,0
0018
,363
30,0
52,8
44,7
87,6
05,3
912,
560
(Con
stan
t)S
exA
ge g
roup
Off
farm
act
iviti
esP
artic
ipat
ion
inag
ricul
tura
l tra
inin
gA
ctiv
e m
embe
rshi
p in
any
orga
niza
tions
Siz
e of
the
plan
tatio
n O
ther
cas
h cr
ops
culti
vate
dU
se o
f ext
erna
l lab
orfo
rce
Nac
iona
l cul
tivat
edA
vera
ge y
ield
/ ye
arU
se o
f fer
tiliz
er /
pers
ticid
esR
ecei
ve in
fo a
bout
com
mer
cial
izat
ion
Rec
eive
info
abo
ut la
wan
d rig
hts
Mar
ketin
g ch
anne
l
Mod
el1
BSt
d. E
rror
Uns
tand
ardi
zed
Coe
ffici
ents
Beta
Sta
ndar
dize
dC
oeffi
cien
tst
Sig
.Lo
wer
Bou
ndU
pper
Bou
nd5%
Con
fiden
ce In
terv
al fo
r Zero
-ord
erP
artia
lP
art
Cor
rela
tions
Tole
ranc
eVI
FC
ollin
earit
y S
tatis
tics
Dep
ende
nt V
aria
ble:
Ave
rage
pric
e re
ceiv
ed ($
/qq)
a.
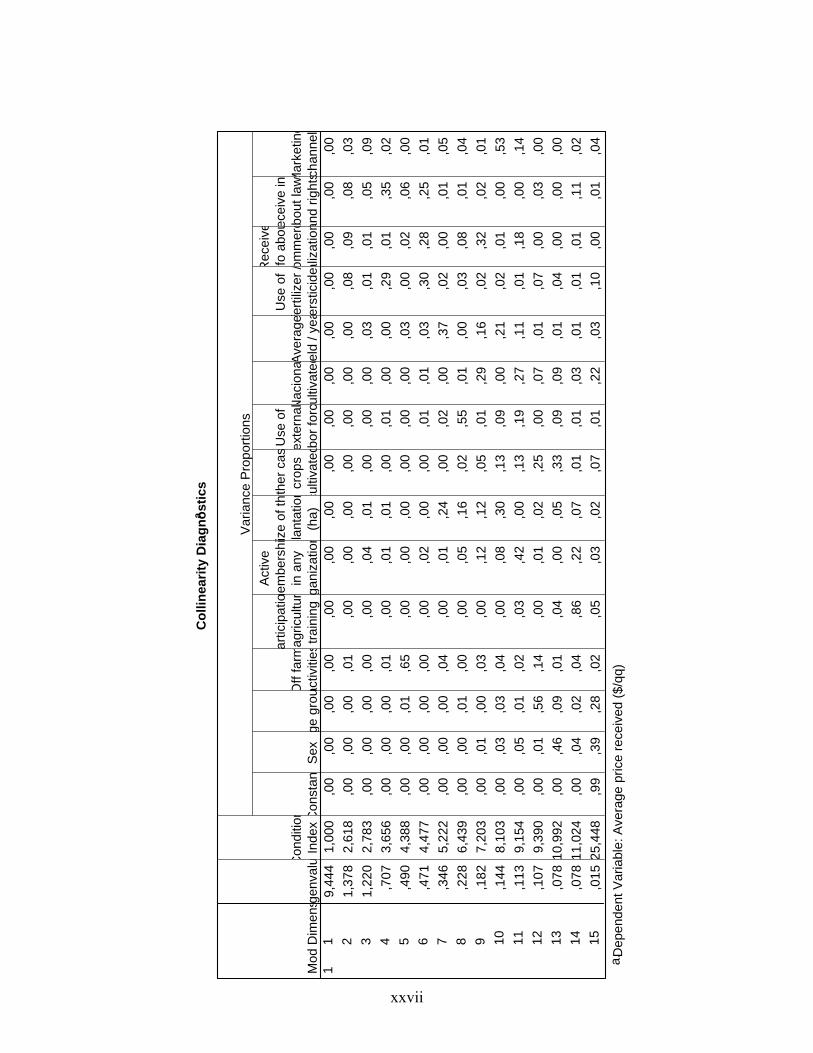
xxvii
Col
linea
rity
Dia
gnos
tics
a
9,44
41,
000
,00
,00
,00
,00
,00
,00
,00
,00
,00
,00
,00
,00
,00
,00
,00
1,37
82,
618
,00
,00
,00
,01
,00
,00
,00
,00
,00
,00
,00
,08
,09
,08
,03
1,22
02,
783
,00
,00
,00
,00
,00
,04
,01
,00
,00
,00
,03
,01
,01
,05
,09
,707
3,65
6,0
0,0
0,0
0,0
1,0
0,0
1,0
1,0
0,0
1,0
0,0
0,2
9,0
1,3
5,0
2,4
904,
388
,00
,00
,01
,65
,00
,00
,00
,00
,00
,00
,03
,00
,02
,06
,00
,471
4,47
7,0
0,0
0,0
0,0
0,0
0,0
2,0
0,0
0,0
1,0
1,0
3,3
0,2
8,2
5,0
1,3
465,
222
,00
,00
,00
,04
,00
,01
,24
,00
,02
,00
,37
,02
,00
,01
,05
,228
6,43
9,0
0,0
0,0
1,0
0,0
0,0
5,1
6,0
2,5
5,0
1,0
0,0
3,0
8,0
1,0
4,1
827,
203
,00
,01
,00
,03
,00
,12
,12
,05
,01
,29
,16
,02
,32
,02
,01
,144
8,10
3,0
0,0
3,0
3,0
4,0
0,0
8,3
0,1
3,0
9,0
0,2
1,0
2,0
1,0
0,5
3,1
139,
154
,00
,05
,01
,02
,03
,42
,00
,13
,19
,27
,11
,01
,18
,00
,14
,107
9,39
0,0
0,0
1,5
6,1
4,0
0,0
1,0
2,2
5,0
0,0
7,0
1,0
7,0
0,0
3,0
0,0
7810
,992
,00
,46
,09
,01
,04
,00
,05
,33
,09
,09
,01
,04
,00
,00
,00
,078
11,0
24,0
0,0
4,0
2,0
4,8
6,2
2,0
7,0
1,0
1,0
3,0
1,0
1,0
1,1
1,0
2,0
1525
,448
,99
,39
,28
,02
,05
,03
,02
,07
,01
,22
,03
,10
,00
,01
,04
Dim
ens
1 2 3 4 5 6 7 8 9 10 11 12 13 14 15
Mod
1ig
enva
luCon
ditio
nIn
dexC
onst
antS
exge
gro
uOff
farm
activ
ities
artic
ipat
ioag
ricul
tur
train
ing
Activ
em
embe
rshi
in a
nyga
niza
tioniz
e of
thpl
anta
tion
(ha)
Oth
er c
ascr
ops
culti
vate
dUse
of
exte
rnal
abor
forcN
acio
naul
tivat
e dAver
age
eld
/ ye a
Use
of
ferti
lizer
/er
stic
idesR
ecei
venf
o ab
ouom
mer
cal
izat
ionec
eive
inf
abou
t law
san
d rig
htsM
arke
ting
chan
nel
Var
ianc
e P
ropo
rtion
s
Dep
ende
nt V
aria
ble:
Ave
rage
pric
e re
ceiv
ed ($
/qq)
a.
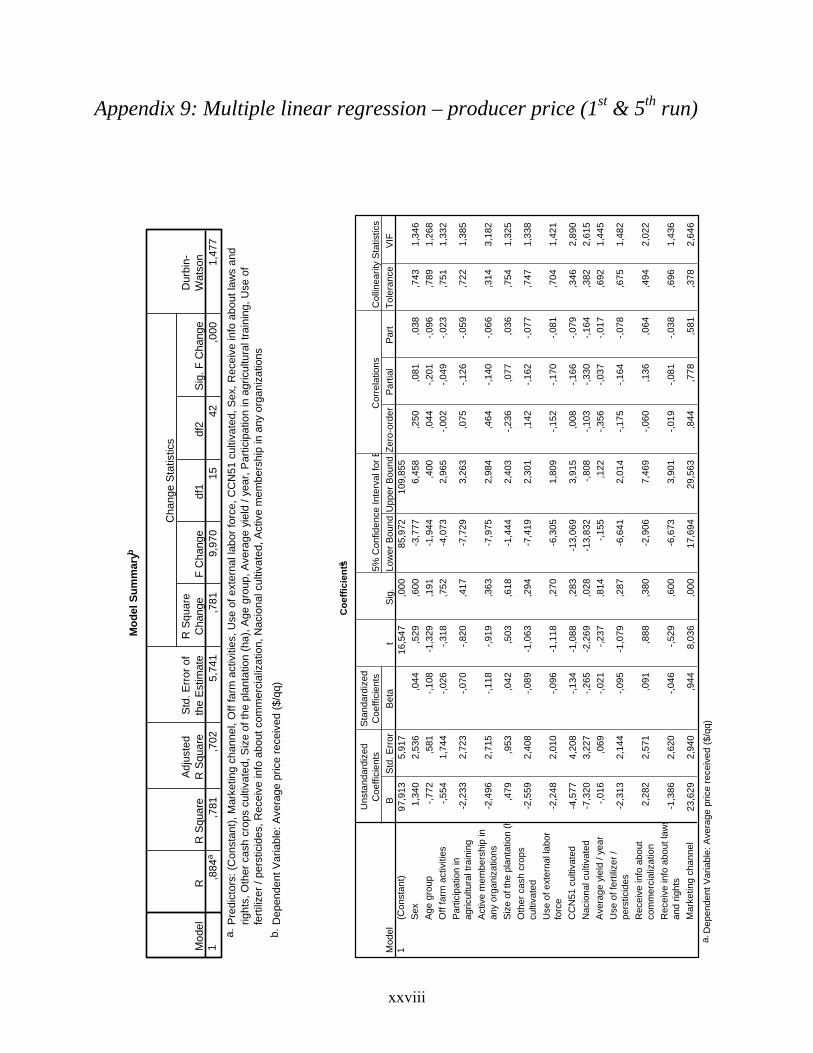
Appendix 9: Multiple linear regression – producer price (1st & 5th run)
xxviii
Mod
el S
umm
aryb
,884
a,7
81,7
025,
741
,781
9,97
015
42,0
001,
477
Mod
el1
RR
Squ
are
Adj
uste
dR
Squ
are
Std
. Erro
r of
the
Est
imat
eR
Squ
are
Cha
nge
F C
hang
edf
1df
2Si
g. F
Cha
nge
Cha
nge
Sta
tistic
sD
urbi
n-W
atso
n
Pred
icto
rs: (
Con
stan
t), M
arke
ting
chan
nel,
Off
farm
act
iviti
es, U
se o
f ext
erna
l lab
or fo
rce,
CC
N51
cul
tivat
ed, S
ex,
right
s, O
ther
cas
h cr
ops
culti
vate
d, S
ize
of th
e pl
anta
tion
(ha)
, Age
gro
up, A
vera
ge y
ield
/ ye
ar, P
artic
ipat
ion
in a
gric
ultu
rafe
rtiliz
er /
pers
ticid
es, R
ecei
ve in
fo a
bout
com
mer
cial
izat
ion,
Nac
iona
l cul
tivat
ed, A
ctiv
e m
embe
rshi
p in
any
a.
Rec
eive
info
abo
ut la
ws
and
l tra
inin
g, U
se o
f o
rgan
izat
ions
Dep
ende
nt V
aria
ble:
Ave
rage
pric
e re
ceiv
ed ($
/qq)
b.
Coe
ffici
entsa
97,9
135,
917
16,5
47,0
0085
,972
109,
855
1,34
02,
536
,044
,529
,600
-3,7
776,
458
,250
,081
,038
,743
1,34
6-,7
72,5
81-,1
08-1
,329
,191
-1,9
44,4
00,0
44-,2
01-,0
96,7
891,
268
-,554
1,74
4-,0
26-,3
18,7
52-4
,073
2,96
5-,0
02-,0
49-,0
23,7
511,
332
-2,2
332,
723
-,070
-,820
,417
-7,7
293,
263
,075
-,126
-,059
,722
1,38
5
-2,4
962,
715
-,118
-,919
,363
-7,9
752,
984
,464
-,140
-,066
,314
3,18
2
,479
,953
,042
,503
,618
-1,4
442,
403
-,236
,077
,036
,754
1,32
5
-2,5
592,
408
-,089
-1,0
63,2
94-7
,419
2,30
1,1
42-,1
62-,0
77,7
471,
338
-2,2
482,
010
-,096
-1,1
18,2
70-6
,305
1,80
9-,1
52-,1
70-,0
81,7
041,
421
-4,5
774,
208
-,134
-1,0
88,2
83-1
3,06
93,
915
,008
-,166
-,079
,346
2,89
0-7
,320
3,22
7-,2
65-2
,269
,028
-13,
832
-,808
-,103
-,330
-,164
,382
2,61
5-,0
16,0
69-,0
21-,2
37,8
14-,1
55,1
22-,3
56-,0
37-,0
17,6
921,
445
-2,3
132,
144
-,095
-1,0
79,2
87-6
,641
2,01
4-,1
75-,1
64-,0
78,6
751,
482
2,28
22,
571
,091
,888
,380
-2,9
067,
469
-,060
,136
,064
,494
2,02
2
-1,3
862,
620
-,046
-,529
,600
-6,6
733,
901
-,019
-,081
-,038
,696
1,43
6
23,6
292,
940
,944
8,03
6,0
0017
,694
29,5
63,8
44,7
78,5
81,3
782,
646
(Con
stan
t)S
exA
ge g
roup
Off
farm
act
iviti
esP
artic
ipat
ion
inag
ricul
tura
l tra
inin
gA
ctiv
e m
embe
rshi
p in
any
orga
niza
tions
Siz
e of
the
plan
tatio
n (h
Oth
er c
ash
crop
scu
ltiva
ted
Use
of e
xter
nal l
abor
forc
eC
CN
51 c
ultiv
ated
Nac
iona
l cul
tivat
edA
vera
ge y
ield
/ ye
arU
se o
f fer
tiliz
er /
pers
ticid
esR
ecei
ve in
fo a
bout
com
mer
cial
izat
ion
Rec
eive
info
abo
ut la
ws
and
right
sM
arke
ting
chan
nel
Mod
el1
BS
td. E
rror
Uns
tand
ardi
zed
Coe
ffici
ents
Bet
a
Sta
ndar
dize
dC
oeffi
cien
tst
Sig
.Lo
wer
Bou
ndU
pper
Bou
nd95
% C
onfid
ence
Inte
rval
for B
Zero
-ord
erP
artia
lP
art
Cor
rela
tions
Tole
ranc
eV
IFC
ollin
earit
y S
tatis
tics
Dep
ende
nt V
aria
ble:
Ave
rage
pric
e re
ceiv
ed ($
/qq)
a.
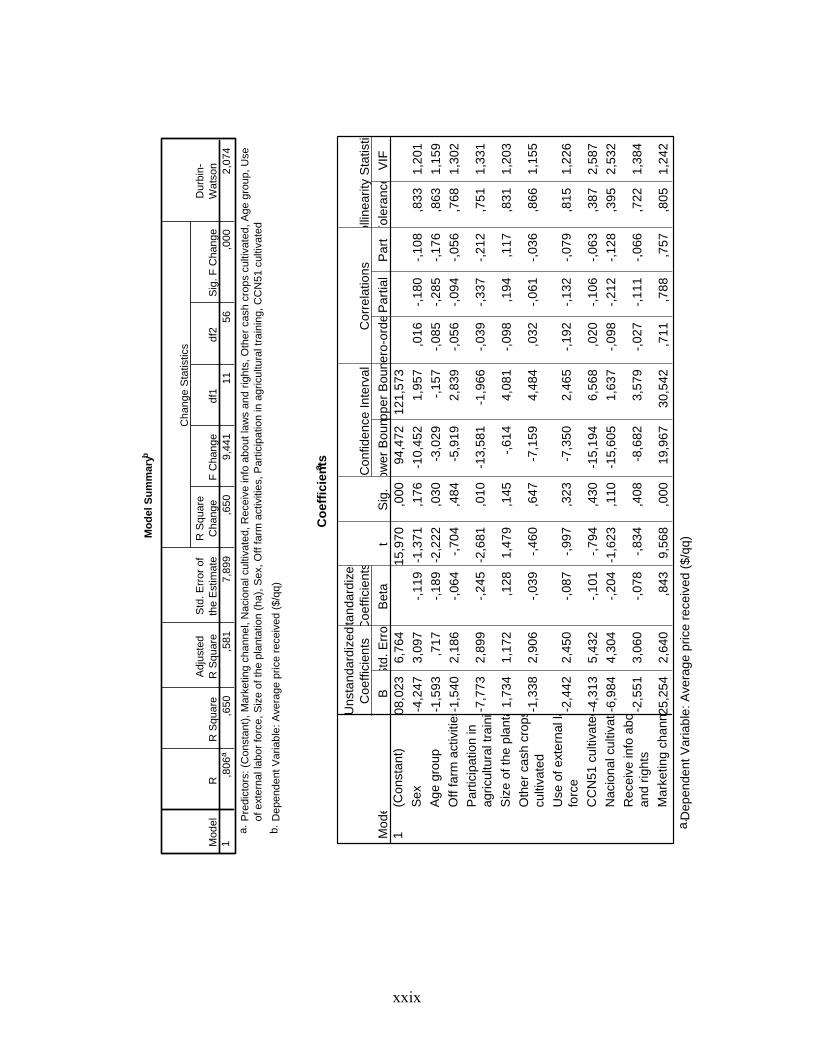
xxix
Coe
ffici
entsa
08,0
236,
764
15,9
70,0
0094
,472
121,
573
-4,2
473,
097
-,119
-1,3
71,1
76-1
0,45
21,
957
,016
-,180
-,108
,833
1,20
1-1
,593
,717
-,189
-2,2
22,0
30-3
,029
-,157
-,085
-,285
-,176
,863
1,15
9-1
,540
2,18
6-,0
64-,7
04,4
84-5
,919
2,83
9-,0
56-,0
94-,0
56,7
681,
302
-7,7
732,
899
-,245
-2,6
81,0
10-1
3,58
1-1
,966
-,039
-,337
-,212
,751
1,33
1
1,73
41,
172
,128
1,47
9,1
45-,6
144,
081
-,098
,194
,117
,831
1,20
3
-1,3
382,
906
-,039
-,460
,647
-7,1
594,
484
,032
-,061
-,036
,866
1,15
5
-2,4
422,
450
-,087
-,997
,323
-7,3
502,
465
-,192
-,132
-,079
,815
1,22
6
-4,3
135,
432
-,101
-,794
,430
-15,
194
6,56
8,0
20-,1
06-,0
63,3
872,
587
-6,9
844,
304
-,204
-1,6
23,1
10-1
5,60
51,
637
-,098
-,212
-,128
,395
2,53
2
-2,5
513,
060
-,078
-,834
,408
-8,6
823,
579
-,027
-,111
-,066
,722
1,38
4
25,2
542,
640
,843
9,56
8,0
0019
,967
30,5
42,7
11,7
88,7
57,8
051,
242
(Con
stan
t)S
exA
ge g
roup
Off
farm
act
iviti
esP
artic
ipat
ion
inag
ricul
tura
l tra
ini
Siz
e of
the
plan
taO
ther
cas
h cr
ops
culti
vate
dU
se o
f ext
erna
l la
forc
eC
CN
51 c
ultiv
ated
Nac
iona
l cul
tivat
eR
ecei
ve in
fo a
boan
d rig
hts
Mar
ketin
g ch
ann
Mod
e1
BS
td. E
rror
Uns
tand
ardi
zed
Coe
ffici
ents
Bet
a
tand
ardi
zed
Coe
ffici
ents
tS
ig.
ower
Bou
nppe
r Bou
nC
onfid
ence
Inte
rval
f Zero
-ord
eP
artia
lP
art
Cor
rela
tions
Tole
ranc
eV
IFol
linea
rity
Sta
tistic
Dep
ende
nt V
aria
ble:
Ave
rage
pric
e re
ceiv
ed ($
/qq)
a.
Mod
el S
umm
aryb
,806
a,6
50,5
817,
899
,650
9,44
111
56,0
002,
074
Dur
bin-
Wat
son
Mod
el1
RR
Squ
are
Adj
uste
dR
Squ
are
Std
. Erro
r of
the
Est
imat
eR
Squ
are
Cha
nge
F C
hang
edf
1df
2S
ig. F
Cha
nge
Cha
nge
Sta
tistic
s
Pre
dict
ors:
(Con
stan
t), M
arke
ting
chan
nel,
Nac
iona
l cul
tivat
ed, R
ecei
ve in
fo a
bout
law
s an
d rig
hts,
Oth
er c
ash
crop
s cu
ltiva
ted
of e
xter
nal l
abor
forc
e, S
ize
of th
e pl
anta
tion
(ha)
, Sex
, Off
farm
act
iviti
es, P
artic
ipat
ion
in a
gric
ultu
ral t
rain
ing,
CC
N51
ca.
, A
ge g
roup
, Use
ultiv
ated
Dep
ende
nt V
aria
ble:
Ave
rage
pric
e re
ceiv
ed ($
/qq)
b.
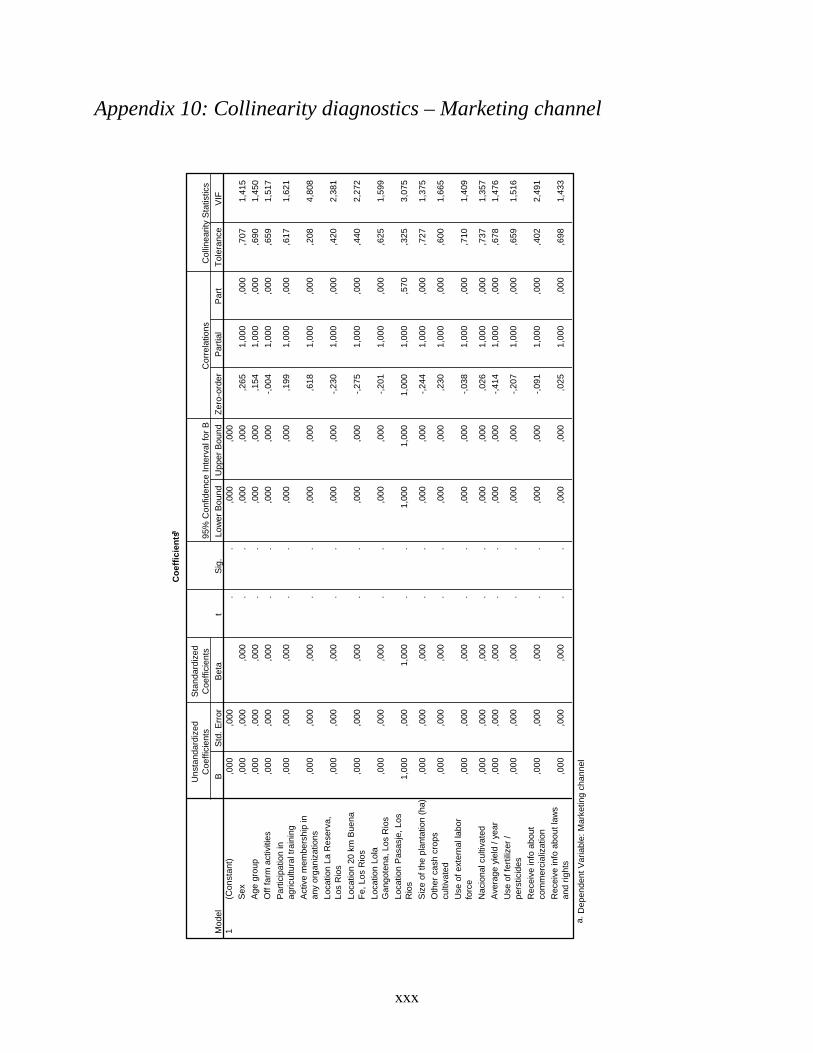
Appendix 10: Collinearity diagnostics – Marketing channel
xxx
Coe
ffici
entsa
,000
,000
..
,000
,000
,000
,000
,000
..
,000
,000
,265
1,00
0,0
00,7
071,
415
,000
,000
,000
..
,000
,000
,154
1,00
0,0
00,6
901,
450
,000
,000
,000
..
,000
,000
-,004
1,00
0,0
00,6
591,
517
,000
,000
,000
..
,000
,000
,199
1,00
0,0
00,6
171,
621
,000
,000
,000
..
,000
,000
,618
1,00
0,0
00,2
084,
808
,000
,000
,000
..
,000
,000
-,230
1,00
0,0
00,4
202,
381
,000
,000
,000
..
,000
,000
-,275
1,00
0,0
00,4
402,
272
,000
,000
,000
..
,000
,000
-,201
1,00
0,0
00,6
251,
599
1,00
0,0
001,
000
..
1,00
01,
000
1,00
01,
000
,570
,325
3,07
5
,000
,000
,000
..
,000
,000
-,244
1,00
0,0
00,7
271,
375
,000
,000
,000
..
,000
,000
,230
1,00
0,0
00,6
001,
665
,000
,000
,000
..
,000
,000
-,038
1,00
0,0
00,7
101,
409
,000
,000
,000
..
,000
,000
,026
1,00
0,0
00,7
371,
357
,000
,000
,000
..
,000
,000
-,414
1,00
0,0
00,6
781,
476
,000
,000
,000
..
,000
,000
-,207
1,00
0,0
00,6
591,
516
,000
,000
,000
..
,000
,000
-,091
1,00
0,0
00,4
022,
491
,000
,000
,000
..
,000
,000
,025
1,00
0,0
00,6
981,
433
(Con
stan
t)Se
xA
ge g
roup
Off
farm
act
iviti
esP
artic
ipat
ion
inag
ricul
tura
l tra
inin
gA
ctiv
e m
embe
rshi
p in
any
orga
niza
tions
Loca
tion
La R
eser
va,
Los
Rio
sLo
catio
n 20
km
Bue
naFe
, Los
Rio
sLo
catio
n Lo
laG
ango
tena
, Los
Rio
sLo
catio
n P
asas
je, L
osR
ios
Siz
e of
the
plan
tatio
n (h
a)O
ther
cas
h cr
ops
culti
vate
dU
se o
f ext
erna
l lab
orfo
rce
Nac
iona
l cul
tivat
edA
vera
ge y
ield
/ ye
arU
se o
f fer
tiliz
er /
pers
ticid
esR
ecei
ve in
fo a
bout
com
mer
cial
izat
ion
Rec
eive
info
abo
ut la
ws
and
right
s
Mod
el1
BSt
d. E
rror
Uns
tand
ardi
zed
Coe
ffici
ents
Beta
Sta
ndar
dize
dC
oeffi
cien
tst
Sig.
Low
er B
ound
Upp
er B
ound
95%
Con
fiden
ce In
terv
al fo
r BZe
ro-o
rder
Parti
alP
art
Cor
rela
tions
Tole
ranc
eVI
FC
ollin
earit
y S
tatis
tics
Dep
ende
nt V
aria
ble:
Mar
ketin
g ch
anne
la.
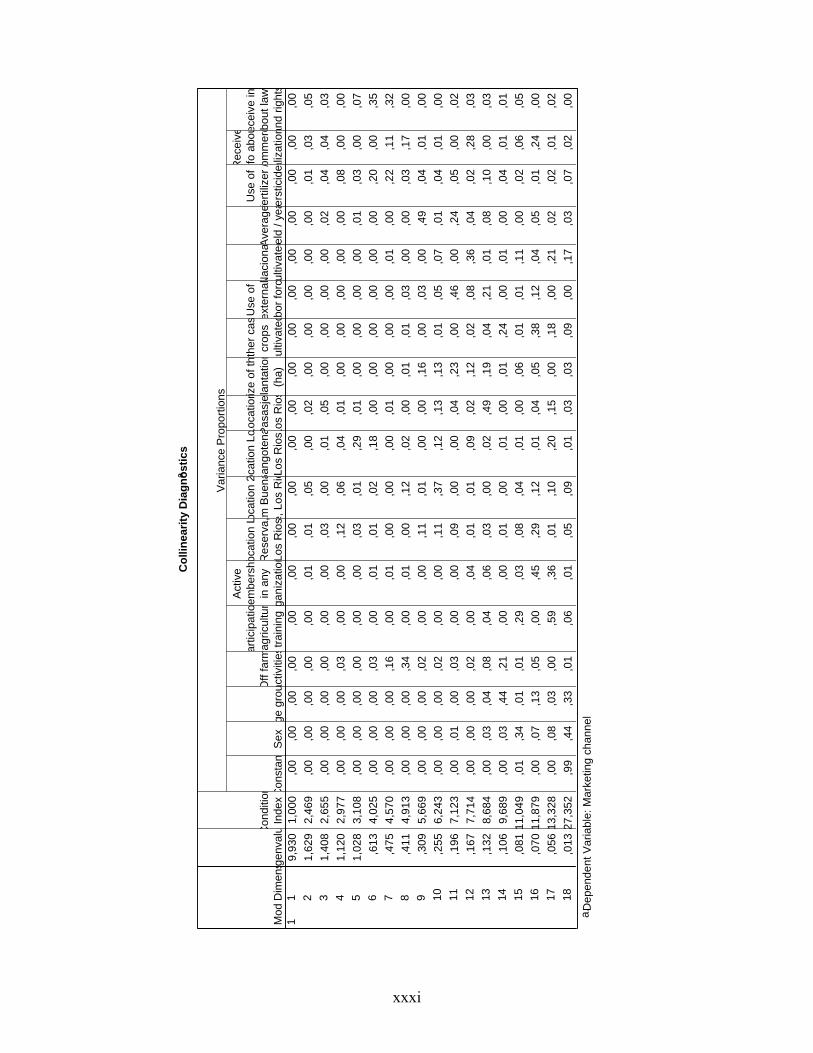
xxxi
Col
linea
rity
Dia
gnos
tics
a
9,93
01,
000
,00
,00
,00
,00
,00
,00
,00
,00
,00
,00
,00
,00
,00
,00
,00
,00
,00
,00
1,62
92,
469
,00
,00
,00
,00
,00
,01
,01
,05
,00
,02
,00
,00
,00
,00
,00
,01
,03
,05
1,40
82,
655
,00
,00
,00
,00
,00
,00
,03
,00
,01
,05
,00
,00
,00
,00
,02
,04
,04
,03
1,12
02,
977
,00
,00
,00
,03
,00
,00
,12
,06
,04
,01
,00
,00
,00
,00
,00
,08
,00
,00
1,02
83,
108
,00
,00
,00
,00
,00
,00
,03
,01
,29
,01
,00
,00
,00
,00
,01
,03
,00
,07
,613
4,02
5,0
0,0
0,0
0,0
3,0
0,0
1,0
1,0
2,1
8,0
0,0
0,0
0,0
0,0
0,0
0,2
0,0
0,3
5,4
754,
570
,00
,00
,00
,16
,00
,01
,00
,00
,00
,01
,00
,00
,00
,01
,00
,22
,11
,32
,411
4,91
3,0
0,0
0,0
0,3
4,0
0,0
1,0
0,1
2,0
2,0
0,0
1,0
1,0
3,0
0,0
0,0
3,1
7,0
0,3
095,
669
,00
,00
,00
,02
,00
,00
,11
,01
,00
,00
,16
,00
,03
,00
,49
,04
,01
,00
,255
6,24
3,0
0,0
0,0
0,0
2,0
0,0
0,1
1,3
7,1
2,1
3,1
3,0
1,0
5,0
7,0
1,0
4,0
1,0
0,1
967,
123
,00
,01
,00
,03
,00
,00
,09
,00
,00
,04
,23
,00
,46
,00
,24
,05
,00
,02
,167
7,71
4,0
0,0
0,0
0,0
2,0
0,0
4,0
1,0
1,0
9,0
2,1
2,0
2,0
8,3
6,0
4,0
2,2
8,0
3,1
328,
684
,00
,03
,04
,08
,04
,06
,03
,00
,02
,49
,19
,04
,21
,01
,08
,10
,00
,03
,106
9,68
9,0
0,0
3,4
4,2
1,0
0,0
0,0
1,0
0,0
1,0
0,0
1,2
4,0
0,0
1,0
0,0
4,0
1,0
1,0
8111
,049
,01
,34
,01
,01
,29
,03
,08
,04
,01
,00
,06
,01
,01
,11
,00
,02
,06
,05
,070
11,8
79,0
0,0
7,1
3,0
5,0
0,4
5,2
9,1
2,0
1,0
4,0
5,3
8,1
2,0
4,0
5,0
1,2
4,0
0,0
5613
,328
,00
,08
,03
,00
,59
,36
,01
,10
,20
,15
,00
,18
,00
,21
,02
,02
,01
,02
,013
27,3
52,9
9,4
4,3
3,0
1,0
6,0
1,0
5,0
9,0
1,0
3,0
3,0
9,0
0,1
7,0
3,0
7,0
2,0
0
Dim
ens
1 2 3 4 5 6 7 8 9 10 11 12 13 14 15 16 17 18
Mod
1ge
nval
uCon
ditio
nIn
dexC
onst
anS
exge
gro
uOff
farm
activ
itiesar
ticip
atio
agric
ultu
rtra
inin
g
Act
ive
mem
bers
hiin
any
gani
zatio
nocat
ion
LR
eser
va,
Los
Rio
socat
ion
2km
Bue
nae,
Los
Riooc
atio
n Lo
Gan
gote
naLo
s R
iosLo
catio
nP
asas
jeLo
s R
iosiz
e of
thla
ntat
ion
(ha)
Oth
er c
ascr
ops
culti
vate
dUse
of
exte
rnal
abor
forcN
acio
naul
tivat
edAve
rage
eld
/ yea
Use
of
ferti
lizer
/er
stic
idesR
ecei
vefo
abo
uom
mer
cal
izat
ionec
eive
inf
bout
law
san
d rig
hts
Var
ianc
e P
ropo
rtion
s
Dep
ende
nt V
aria
ble:
Mar
ketin
g ch
anne
la.
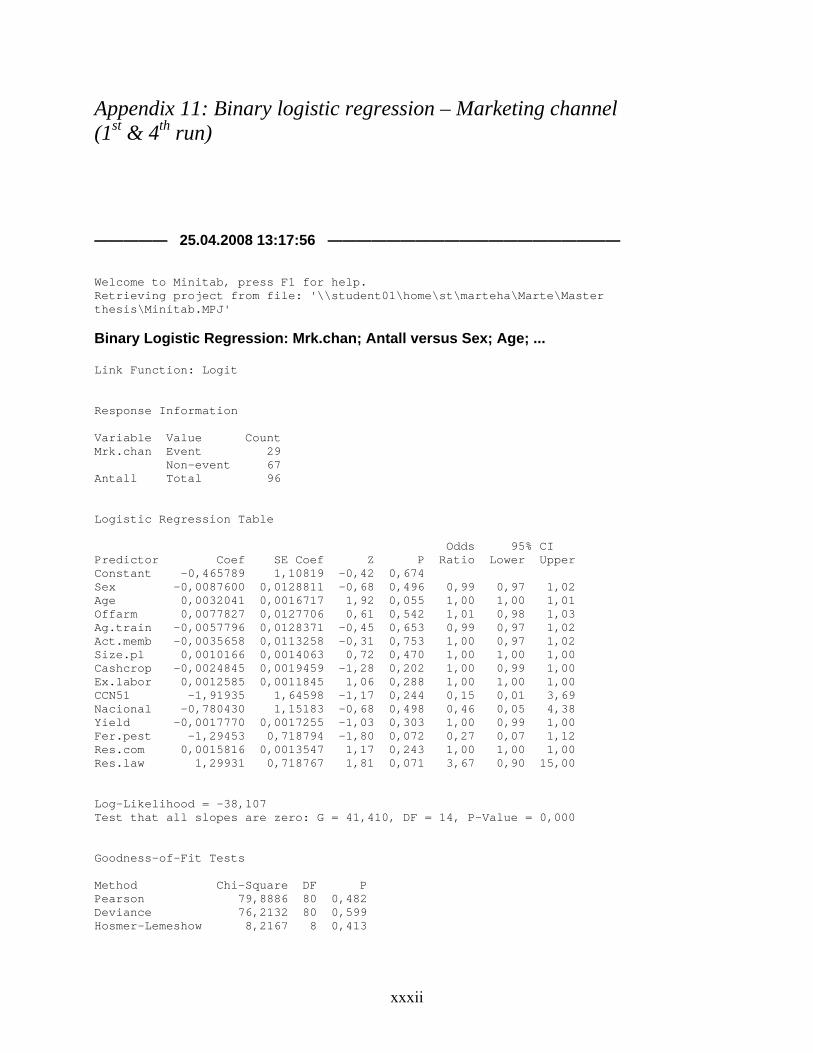
Appendix 11: Binary logistic regression – Marketing channel (1st & 4th run) ————— 25.04.2008 13:17:56 ———————————————————— Welcome to Minitab, press F1 for help. Retrieving project from file: '\\student01\home\st\marteha\Marte\Master thesis\Minitab.MPJ' Binary Logistic Regression: Mrk.chan; Antall versus Sex; Age; ... Link Function: Logit Response Information Variable Value Count Mrk.chan Event 29 Non-event 67 Antall Total 96 Logistic Regression Table Odds 95% CI Predictor Coef SE Coef Z P Ratio Lower Upper Constant -0,465789 1,10819 -0,42 0,674 Sex -0,0087600 0,0128811 -0,68 0,496 0,99 0,97 1,02 Age 0,0032041 0,0016717 1,92 0,055 1,00 1,00 1,01 Offarm 0,0077827 0,0127706 0,61 0,542 1,01 0,98 1,03 Ag.train -0,0057796 0,0128371 -0,45 0,653 0,99 0,97 1,02 Act.memb -0,0035658 0,0113258 -0,31 0,753 1,00 0,97 1,02 Size.pl 0,0010166 0,0014063 0,72 0,470 1,00 1,00 1,00 Cashcrop -0,0024845 0,0019459 -1,28 0,202 1,00 0,99 1,00 Ex.labor 0,0012585 0,0011845 1,06 0,288 1,00 1,00 1,00 CCN51 -1,91935 1,64598 -1,17 0,244 0,15 0,01 3,69 Nacional -0,780430 1,15183 -0,68 0,498 0,46 0,05 4,38 Yield -0,0017770 0,0017255 -1,03 0,303 1,00 0,99 1,00 Fer.pest -1,29453 0,718794 -1,80 0,072 0,27 0,07 1,12 Res.com 0,0015816 0,0013547 1,17 0,243 1,00 1,00 1,00 Res.law 1,29931 0,718767 1,81 0,071 3,67 0,90 15,00 Log-Likelihood = -38,107 Test that all slopes are zero: G = 41,410, DF = 14, P-Value = 0,000 Goodness-of-Fit Tests Method Chi-Square DF P Pearson 79,8886 80 0,482 Deviance 76,2132 80 0,599 Hosmer-Lemeshow 8,2167 8 0,413
xxxii

Table of Observed and Expected Frequencies: (See Hosmer-Lemeshow Test for the Pearson Chi-Square Statistic) Group Value 1 2 3 4 5 6 7 8 9 10 Total Event Obs 0 0 2 0 3 1 4 3 6 10 29 Exp 0,0 0,5 0,8 2,0 2,2 2,0 2,2 3,4 5,9 9,9 Non-event Obs 9 10 7 10 7 8 6 6 4 0 67 Exp 9,0 9,5 8,2 8,0 7,8 7,0 7,8 5,6 4,1 0,1 Total 9 10 9 10 10 9 10 9 10 10 96 Measures of Association: (Between the Response Variable and Predicted Probabilities) Pairs Number Percent Summary Measures Concordant 1615 83,1 Somers' D 0,70 Discordant 263 13,5 Goodman-Kruskal Gamma 0,72 Ties 65 3,3 Kendall's Tau-a 0,30 Total 1943 100,0 Delta Chi-Square versus P
xxxiii
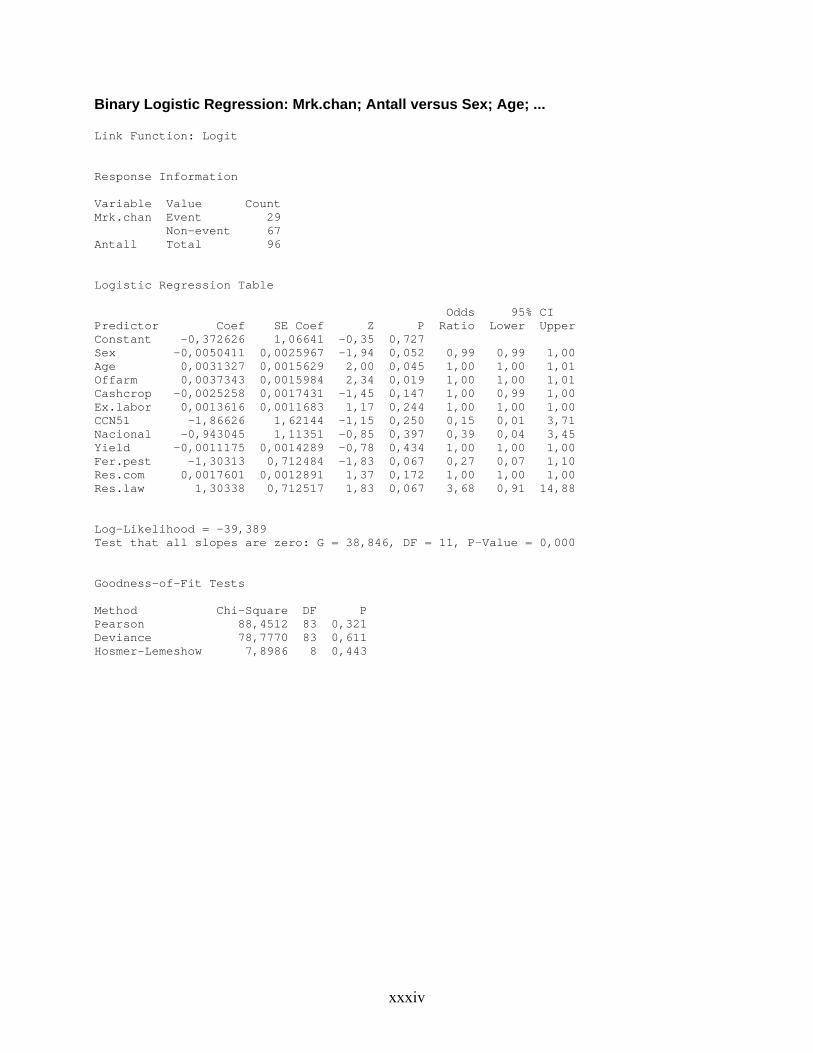
Binary Logistic Regression: Mrk.chan; Antall versus Sex; Age; ... Link Function: Logit Response Information Variable Value Count Mrk.chan Event 29 Non-event 67 Antall Total 96 Logistic Regression Table Odds 95% CI Predictor Coef SE Coef Z P Ratio Lower Upper Constant -0,372626 1,06641 -0,35 0,727 Sex -0,0050411 0,0025967 -1,94 0,052 0,99 0,99 1,00 Age 0,0031327 0,0015629 2,00 0,045 1,00 1,00 1,01 Offarm 0,0037343 0,0015984 2,34 0,019 1,00 1,00 1,01 Cashcrop -0,0025258 0,0017431 -1,45 0,147 1,00 0,99 1,00 Ex.labor 0,0013616 0,0011683 1,17 0,244 1,00 1,00 1,00 CCN51 -1,86626 1,62144 -1,15 0,250 0,15 0,01 3,71 Nacional -0,943045 1,11351 -0,85 0,397 0,39 0,04 3,45 Yield -0,0011175 0,0014289 -0,78 0,434 1,00 1,00 1,00 Fer.pest -1,30313 0,712484 -1,83 0,067 0,27 0,07 1,10 Res.com 0,0017601 0,0012891 1,37 0,172 1,00 1,00 1,00 Res.law 1,30338 0,712517 1,83 0,067 3,68 0,91 14,88 Log-Likelihood = -39,389 Test that all slopes are zero: G = 38,846, DF = 11, P-Value = 0,000 Goodness-of-Fit Tests Method Chi-Square DF P Pearson 88,4512 83 0,321 Deviance 78,7770 83 0,611 Hosmer-Lemeshow 7,8986 8 0,443
xxxiv
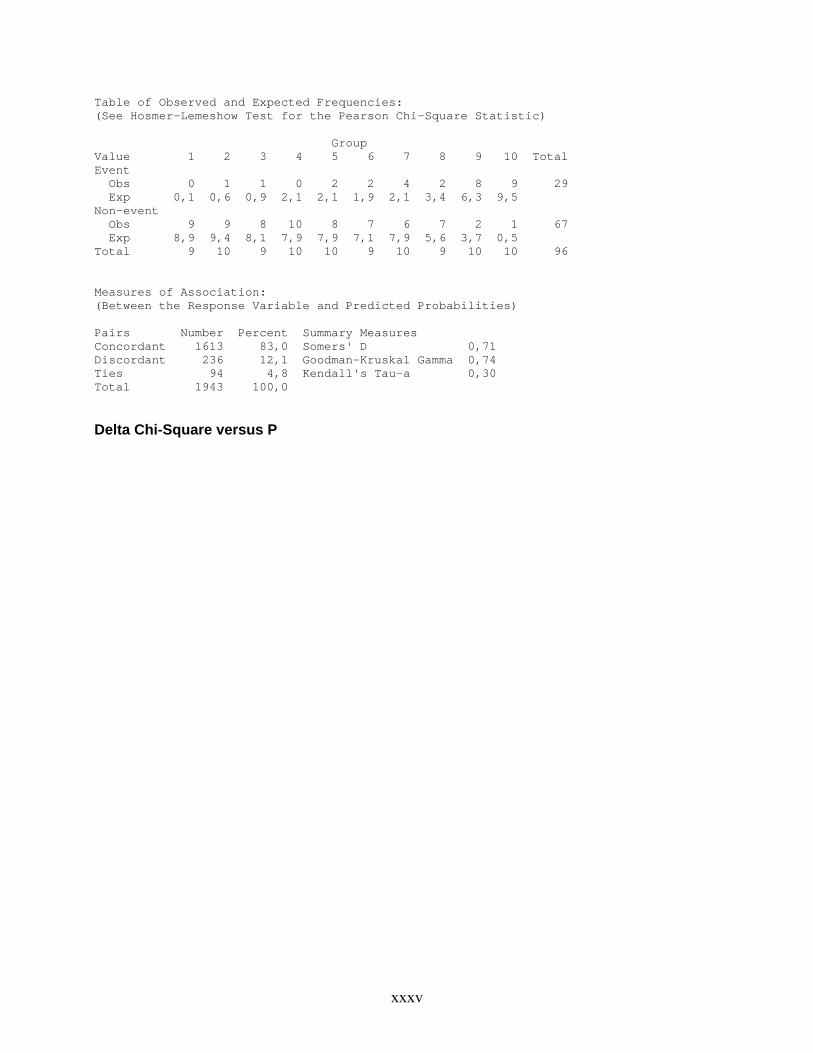
Table of Observed and Expected Frequencies: (See Hosmer-Lemeshow Test for the Pearson Chi-Square Statistic) Group Value 1 2 3 4 5 6 7 8 9 10 Total Event Obs 0 1 1 0 2 2 4 2 8 9 29 Exp 0,1 0,6 0,9 2,1 2,1 1,9 2,1 3,4 6,3 9,5 Non-event Obs 9 9 8 10 8 7 6 7 2 1 67 Exp 8,9 9,4 8,1 7,9 7,9 7,1 7,9 5,6 3,7 0,5 Total 9 10 9 10 10 9 10 9 10 10 96 Measures of Association: (Between the Response Variable and Predicted Probabilities) Pairs Number Percent Summary Measures Concordant 1613 83,0 Somers' D 0,71 Discordant 236 12,1 Goodman-Kruskal Gamma 0,74 Ties 94 4,8 Kendall's Tau-a 0,30 Total 1943 100,0 Delta Chi-Square versus P
xxxv