Embed Size (px)
Citation preview
Has the Investment in Public Cancer EducationDelivered Observable Changes in Knowledgeover the Past 10 Years?
Christine Paul, Ph.D., B.A. (Hons)1,2
Flora Tzelepis, B.Sc.1
Raoul A. Walsh, Ph.D., B.A., DipEd3
Afaf Girgis, Ph.D., B.Sc.1,2
Lesley King3
Jeanie McKenzie, M.Sc., B.Sc. (Hons)3
1 The Center for Health Research and Psycho-oncology, The Cancer Council New South Wales,New South Wales, Australia.
2 The University of Newcastle, NSW, Australia.
3 The Cancer Council NSW, Austraila.
The authors gratefully acknowledge the statisticaladvice and support of Patrick McElduff and Chris-tophe Lecathelinais.
Address for reprints: Christine Paul, Ph.D., Centrefor Health Research and Psycho-oncology, LockedBag 10, Wallsend 2287, New South Wales, Aus-tralia; Fax: (011) 61-(02) 49246208; E-mail: [email protected]
This article was prepared by The Cancer CouncilNew South Wales Center for Health Research andPsycho-oncology. The views expressed are notnecessarily those of The Cancer Council.
Received November 18, 2002; revision receivedFebruary 27, 2003; accepted March 2, 2003.
BACKGROUND. During the 1990s, Western countries, such as Australia, directed
substantial funds toward public cancer education. An important indicator of
whether this investment has been worthwhile is a shift over time in the proportion
of the population who have accurate knowledge regarding cancer.
METHODS. In the year 2000, a cross-sectional telephone survey was administered to
685 residents selected from the New South Wales (Australia) Electronic White
Pages telephone directory. This study replicated in part a survey conducted in
1989.
RESULTS. In the 2000 survey, smoking (96.0%) and sun exposure (80.4%) were
well-known as risk factors for lung cancer and melanoma, respectively. However,
community knowledge of risk factors for colorectal, breast, cervical, and prostate
cancer was poor. Most respondents were able to nominate mammograms (82.2%)
and Pap tests (86.8%) as screening tests for breast and cervical cancer, respectively.
Approximately two-thirds of the sample were able to nominate foods that reduce
the risk of developing cancer. Compared with the 1989 data, there appeared to
have been improvements in community knowledge of mammograms as a screen-
ing test for breast cancer. For the other cancers, knowledge gains appeared smaller
or marginal. With regard to the lifetime risk of developing these cancers, commu-
nity understanding remains poor. Predictors of greater knowledge include a higher
level of education.
CONCLUSIONS. Where ongoing investments have been made, like in the case of
breast cancer education, there have been improvements in community knowledge.
However, major challenges remain. Potential targets for future public education
campaigns are discussed. Cancer 2003;97:2931–9.
© 2003 American Cancer Society.
DOI 10.1002/cncr.11393
KEYWORDS: cancer, prevention, early detection, perceptions.
I t has long been recognized that the greatest opportunity for con-trolling cancer lies in the community adopting behaviors that have
been shown to prevent cancer or allow its early detection and treat-ment.1 It has been acknowledged that the roles of prevention andearly detection make significant contributions to declines in mortalityassociated with some types of malignancies.2,3
Over the last few decades, there have been consistent effortsmade in developed countries to provide public education regardingcancer prevention and early detection. For example: 1) In the U.S., anational campaign has focused annually on the dangers of sun expo-sure and the benefits of sun protection,4 and the Florida Pilot Pro-gram on Tobacco Control has spent � $126 million since 1998.5 2) In
2931
© 2003 American Cancer Society
the United Kingdom, the National Health Servicebreast screening and cervical screening programshave been established.6,7 3) In Australia, the NationalTobacco Campaign included an intensive, 6-month,mass-media campaign, costing approximately $7 mil-lion,8 and mass-media promotion of mammographyoperated from 1995–1999.9
Therefore, it is reasonable to expect that, as aresult of these and other efforts, knowledge concern-ing cancer prevention and early detection would begreater than it was 10 or 20 years ago. However, stud-ies of community knowledge can produce unexpectedfindings. For example, a study in the U.S. of trends insun exposure knowledge, attitudes, and behaviors be-tween 1986 –19964 found that, in response to morethan 10 years of public education, there was a broaderrecognition within the community that the sun hadharmful effects (such as sunburn and wrinkles), butthere was a significant decline in the ability to identifyskin cancer as one of those harmful effects.4 A lack ofbalance in the mass-media presentation of certainaspects of cancer also can affect community percep-tions.10
Australia is one of the countries that has made aconsistently increasing effort to provide wide publiceducation concerning cancer. In one Australian statealone, The Cancer Council NSW spent over $16 mil-lion on public education during 1997–1999;11 whereas,10 years earlier, the same group spent $3.7 million onpublic education.12,13 Some examples of campaignsinclude efforts that promoted mammographic screen-ing, smoking cessation, sun protection, and cervicalscreening.3,8,14,15 There also has been strong and in-creasing community interest in cancer prevention inAustralia in the past decade. For example, nationalcontributions to cancer fund raising, such as DaffodilDay and Australia’s Biggest Morning Tea, increased1.7-fold and 3.4-fold, respectively,16 and the commu-nity has become strongly supportive of cancer controlmeasures, such as increased smoking bans.17
A number of Australian studies have exploredcommunity perceptions regarding particular cancersat various times in the 1980s and 1990s. One of themost-studied and most-promoted issues has beenknowledge in relation to breast cancer and skin can-cer.18 –26 Australian studies conducted in the 1980s and1990s show that the proportion of women who wereable to nominate mammography as a method of earlydetection rose from 43% in 198820 to 93% in 1996.27,28
However, despite major public education campaignsover the same period that focused on the issues of riskand age, knowledge of risk generally was not accurate,with up to 40% of women continuing to over-estimatetheir lifetime risk of developing breast cancer. The
proportion who nominated increasing age as a riskfactor continued to be � 5%.20,27 Similar changes inrelation to breast cancer knowledge have been foundin other countries, such as the U.S.29,30 The publishedstudies in the areas of colorectal, cervical, and prostatecancer suggest that a number of misconceptions andknowledge gaps have existed.31–37 To our knowledge,relatively little has been published regarding commu-nity knowledge of diet and the risk of developing can-cer.38
The published Australian studies generally fo-cused on one type cancer, used survey instruments oritems that did not allow direct comparisons betweenstudies or across types of cancers, and were conductedat unrelated and irregular times. Tracking knowledgeacross cancers over long periods places cancer knowl-edge in context. This allows public educators to com-pare how knowledge regarding one cancer has im-proved while knowledge about another has stood stillor to identify whether a knowledge item (for example,lifetime risk) may be understood poorly across can-cers. This information then can be interpreted in lightof the range of public education campaigns conductedover the corresponding period and can be incorpo-rated into future planning.
The current study, which was conducted in 2000,explored community knowledge about these issuesacross specific types of cancer and knowledge con-cerning diet and cancer. The objectives of the currentstudy were 1) to explore current community knowl-edge about the lifetime risk of developing cancer, riskfactors, prospects for survival, recommended screen-ing tests, and potential cancer symptoms in relation tobreast cancer, melanoma, cervical cancer, lung can-cer, colorectal cancer, prostate cancer, and diet andcancer; 2) to explore predictors of accurate knowledgeabout those types of cancer; and 3) to compare levelsof community knowledge in 2000 with the levels ofcommunity knowledge in the Newcastle Health Sur-vey of 1989.20
MATERIALS AND METHODSThis study was conducted as part of a larger commu-nity survey of cancer-related knowledge, perceptions,and practices conducted in June and August, 2000.
Sample and ProcedureHouseholds were selected at random from the NewSouth Wales (NWS), Australia Electronic White Pagesand were mailed an information letter. Within thefollowing 4 weeks, the household was contacted bytelephone. Of the individuals in that household age 15years or older, the individual with the next birthdaywas asked to complete a computer-assisted telephone
2932 CANCER June 15, 2003 / Volume 97 / Number 12
interview that lasted 15–20 minutes. The sample andprocedure for the 1989 Newcastle Health Survey20 dif-fered from the current survey, in that the 1989 studysurveyed Newcastle (one region of NSW) residentsdoor-to-door.
Survey ItemsThe survey items used for comparisons of 1989 re-sponses and 2000 responses were identical. Table 1outlines the survey items. Respondents were askedonly about gender-relevant cancers. Randomly se-lected subsamples were asked about either melanomaor other skin cancers, and randomly selected sub-samples of women were asked about either breastcancer or cervical cancer. Most of the survey itemtypes had undergone pilot testing and had demon-strated reliability27,28 or were similar to those used in aprevious survey.39
AnalysesFrequencies with 95% confidence intervals (95% CI)and mean values with standard errors were used todescribe the prevalence of knowledge, attitudes, andperceptions. For comparisons between 1989 data and2000 data, 95% CIs were used. It must be noted that
the methodologic differences between the two studiesplaced some limitations on the interpretation of suchanalyses.
RESULTSSampleOf 1492 telephone numbers identified in the samplingprocess, 379 numbers were ineligible. Among the re-maining 1113 telephone numbers, 230 individualswere not contacted, 198 individuals refused to partic-ipate or did not complete the interview, and 685 indi-viduals gave complete interviews, for a response rateof 61.5% and a consent rate of 77.6%.
The demographic characteristics of the survey re-spondents were compared with characteristics of theNSW population from the 1996 census. There weresome minor differences between the survey sampleand the census data for gender, age, education, mar-ital status, employment situation, and country ofbirth. Compared with the census data, survey partici-pants were more likely to be female, ages 60 –90 years,have a tertiary education, married, and born in Aus-tralia; whereas they were less likely to be unemployed.Overall, the sample was broadly comparable with theNSW population. The 1989 survey sample also had a
TABLE 1Survey Items
Perceptions about prevention and early detectionHow preventable do you think the following types of cancer are?Overall, how much do you believe that you can personally reduce your risk of getting cancer by your own actions or behaviors?If you treated the following types of cancer in the early stages rather than a later stage, how much difference would it make to how long you’d live?
Probability of developing cancerHow likely do you think it is that you will suffer from any of the following problems at some time in your life? (for any cancer and each specific type of cancer): very likely,quite likely, a little likely, not very likely, or don’t know.
Imagine 100 Australian men and women. How many of them do you think will get get the following types of of cancer at some time in their life? (Responses were recordedas a number between 0 and 100 for each type of cancer; for gender specific malignancies, the question stem was altered to include only the relevant gender, i.e., “imagine100 Australian women . . .”)
Prospects for survivalImagine there are 100 people who have only just found out they have a particular type of cancer. How many of them do you think would have died from the followingtypes of cancer in 5 years time? (Responses were recorded as a number between 0 and 100 for each type of cancer.)
Risk factorsDo you know of anything that increases your risk of getting (specify type) cancer? Which of these would be the main ones?
Signs and symptomsDo you know of any symptoms or signs that might suggest you have (specify type) cancer?
Tests and checksDo you know of any tests or checks that you or your doctor could do to see if you had (specify type) cancer?
DietDo you know of any things people can eat or drink more of which will reduce their risk of cancer?Do you know of any things people can eat or drink less of which will reduce their risk of cancer?Do you know of any specific fruits people can eat more of to reduce their risk of cancer?Do you know of any specific vegetables people can eat more of to reduce their risk of cancer?
DemographicsDemographic items included age, gender, health insurance status, having a regular GP, whether they visited a GP within the last 12 months, Aboriginal or Torres StraitIslander origin, country of birth, level of education, marital status, and employment status.
a GP: general practitioner.
Community Knowledge of Cancer/Paul et al. 2933
slightly higher proportion of women and older peoplecompared with the sampling frame.20
Perceptions Regarding Prevention and Early DetectionWith regard to the personal risk of developing cancer,37.2% of participants (95% CI, 33.6 – 40.8) respondedthey could reduce their cancer risk greatly or com-pletely. Approximately half of respondents believedthat lung cancer (49.9%; 95% CI, 46.2–53.7), melanoma(50.9%; 95% CI, 47.2–54.7), and other skin cancers(47.3%, 95% CI, 43.5,51.1) were very preventable orcompletely preventable. Approximately 20% of re-spondents believed that cervical cancer (20.0%; 95%CI, 17.0 –23.0) and colorectal cancer (20.9%; 95% CI,17.8 –23.9) were very preventable or completely pre-ventable. Less than 20% of respondents believed thatbreast cancer (17.1%; 95% CI, 14.3–19.9) and prostatecancer (13.4%; 95% CI, 10.9 –16.0) were very prevent-able or completely preventable.
Approximately 70% of the sample believed thatearly detection made a “great deal” of difference tosurvival with regard to melanoma (72.1%; 95% CI,68.8 –75.5), other skin cancers (71.2%; 95% CI, 67.9 –74.6), and breast cancer (70.1%; 95% CI, 66.6 – 68.1).Approximately three-fifths of the sample believed thatearly detection would make a great deal of differenceto survival with regard to cervical cancer (64.5%; 95%CI, 60.9 – 68.1), colorectal cancer (63.6%; 95% CI, 60.0 –67.3), and prostate cancer (59.0%; 95% CI, 55.3– 62.7).Only half of the sample (52.3%; 95% CI, 48.5–56.0)reported that early detection would make a great dealof difference to survival with regard to lung cancer.
Probability of Developing Cancer and Cancer SurvivalGreater than two-fifths of the sample (44%; 95% CI,40.4 – 47.8) perceived that they were very likely or quitelikely to develop cancer during their lifetime. The pro-portions of the sample who responded that they werevery likely or quite likely to develop particular cancerswere as follows: other skin cancers, 29.2%; melanoma,28.2%; breast cancer (females only), 22.3%; prostatecancer (males only), 21.4%; lung cancer, 15.6%; colo-rectal cancer, 15.0%; and cervical cancer (femalesonly), 11.7%.
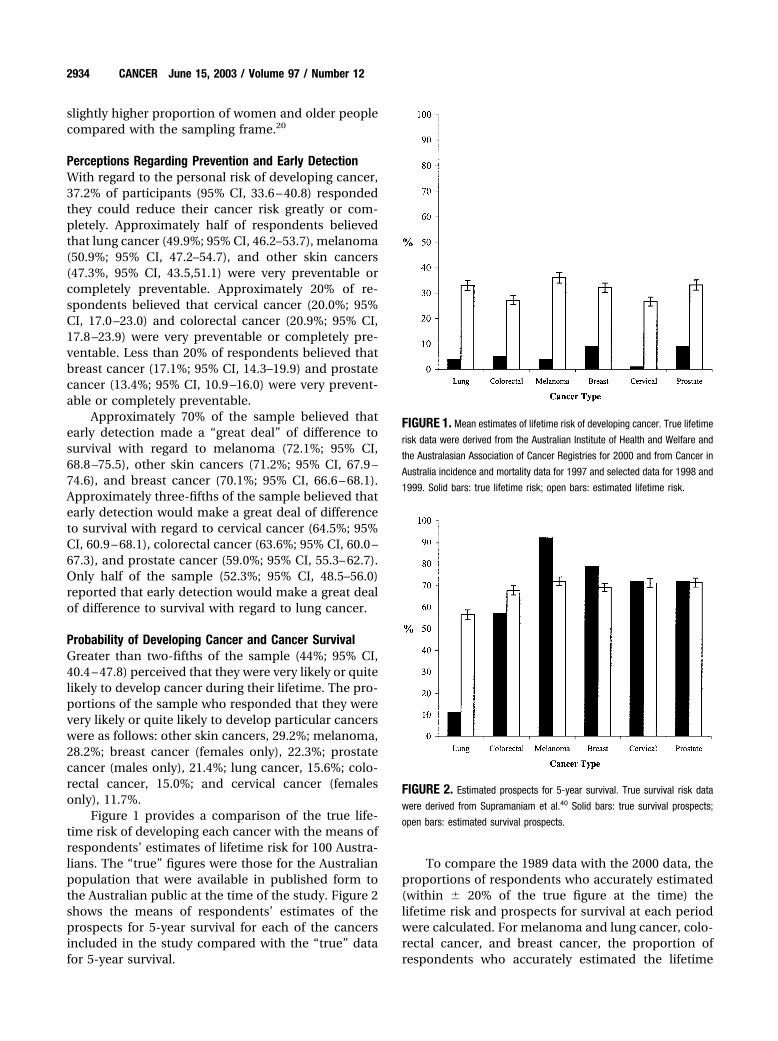
Figure 1 provides a comparison of the true life-time risk of developing each cancer with the means ofrespondents’ estimates of lifetime risk for 100 Austra-lians. The “true” figures were those for the Australianpopulation that were available in published form tothe Australian public at the time of the study. Figure 2shows the means of respondents’ estimates of theprospects for 5-year survival for each of the cancersincluded in the study compared with the “true” datafor 5-year survival.
To compare the 1989 data with the 2000 data, theproportions of respondents who accurately estimated(within � 20% of the true figure at the time) thelifetime risk and prospects for survival at each periodwere calculated. For melanoma and lung cancer, colo-rectal cancer, and breast cancer, the proportion ofrespondents who accurately estimated the lifetime
FIGURE 1. Mean estimates of lifetime risk of developing cancer. True lifetime
risk data were derived from the Australian Institute of Health and Welfare and
the Australasian Association of Cancer Registries for 2000 and from Cancer in
Australia incidence and mortality data for 1997 and selected data for 1998 and
1999. Solid bars: true lifetime risk; open bars: estimated lifetime risk.
FIGURE 2. Estimated prospects for 5-year survival. True survival risk data
were derived from Supramaniam et al.40 Solid bars: true survival prospects;
open bars: estimated survival prospects.
2934 CANCER June 15, 2003 / Volume 97 / Number 12
risk were within 8 percentage points, and the 95% CIsclearly overlapped. For cervical cancer, more womenaccurately estimated the lifetime risk of developingcancer in 2000 compared with 1989 (44.2%; 95% CI,40.5– 48.0; 33%; 95% CI, 26.1–39.9, respectively). For5-year survival prospects, the 95% CIs overlapped forbreast cancer and cervical cancer. For colorectal can-cer and melanoma, the proportion of respondentswho accurately estimated survival prospects was lowerin 2000 compared with 1989 (colorectal cancer: 18.9%;95% CI, 15.9 –21.8; 36%; 95% CI, 30.3– 41.7, respec-tively; melanoma: 51.9%; 95% CI, 48.2–55.6; 79%; 95%CI, 74.1– 83.8; respectively). For lung cancer, the pro-portion of respondents who accurately estimated sur-vival was higher in 2000 compared with 1989 (42.5%;95% CI, 38.8 – 46.2; 29%; 95% CI, 23.6 –34.4, respective-ly).
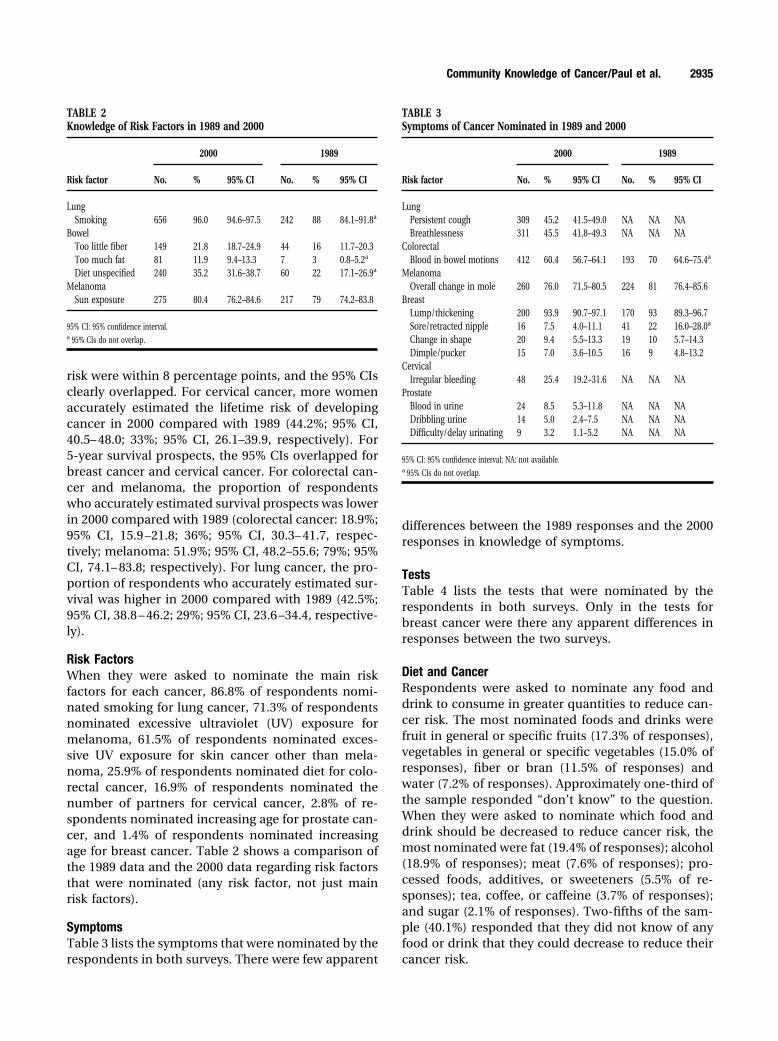
Risk FactorsWhen they were asked to nominate the main riskfactors for each cancer, 86.8% of respondents nomi-nated smoking for lung cancer, 71.3% of respondentsnominated excessive ultraviolet (UV) exposure formelanoma, 61.5% of respondents nominated exces-sive UV exposure for skin cancer other than mela-noma, 25.9% of respondents nominated diet for colo-rectal cancer, 16.9% of respondents nominated thenumber of partners for cervical cancer, 2.8% of re-spondents nominated increasing age for prostate can-cer, and 1.4% of respondents nominated increasingage for breast cancer. Table 2 shows a comparison ofthe 1989 data and the 2000 data regarding risk factorsthat were nominated (any risk factor, not just mainrisk factors).
SymptomsTable 3 lists the symptoms that were nominated by therespondents in both surveys. There were few apparent
differences between the 1989 responses and the 2000responses in knowledge of symptoms.
TestsTable 4 lists the tests that were nominated by therespondents in both surveys. Only in the tests forbreast cancer were there any apparent differences inresponses between the two surveys.
Diet and CancerRespondents were asked to nominate any food anddrink to consume in greater quantities to reduce can-cer risk. The most nominated foods and drinks werefruit in general or specific fruits (17.3% of responses),vegetables in general or specific vegetables (15.0% ofresponses), fiber or bran (11.5% of responses) andwater (7.2% of responses). Approximately one-third ofthe sample responded “don’t know” to the question.When they were asked to nominate which food anddrink should be decreased to reduce cancer risk, themost nominated were fat (19.4% of responses); alcohol(18.9% of responses); meat (7.6% of responses); pro-cessed foods, additives, or sweeteners (5.5% of re-sponses); tea, coffee, or caffeine (3.7% of responses);and sugar (2.1% of responses). Two-fifths of the sam-ple (40.1%) responded that they did not know of anyfood or drink that they could decrease to reduce theircancer risk.
TABLE 2Knowledge of Risk Factors in 1989 and 2000
Risk factor
2000 1989
No. % 95% CI No. % 95% CI
LungSmoking 656 96.0 94.6–97.5 242 88 84.1–91.8a
BowelToo little fiber 149 21.8 18.7–24.9 44 16 11.7–20.3Too much fat 81 11.9 9.4–13.3 7 3 0.8–5.2a
Diet unspecified 240 35.2 31.6–38.7 60 22 17.1–26.9a
MelanomaSun exposure 275 80.4 76.2–84.6 217 79 74.2–83.8
95% CI: 95% confidence interval.a 95% CIs do not overlap.
TABLE 3Symptoms of Cancer Nominated in 1989 and 2000
Risk factor
2000 1989
No. % 95% CI No. % 95% CI
LungPersistent cough 309 45.2 41.5–49.0 NA NA NABreathlessness 311 45.5 41.8–49.3 NA NA NA
ColorectalBlood in bowel motions 412 60.4 56.7–64.1 193 70 64.6–75.4a
MelanomaOverall change in mole 260 76.0 71.5–80.5 224 81 76.4–85.6
BreastLump/thickening 200 93.9 90.7–97.1 170 93 89.3–96.7Sore/retracted nipple 16 7.5 4.0–11.1 41 22 16.0–28.0a
Change in shape 20 9.4 5.5–13.3 19 10 5.7–14.3Dimple/pucker 15 7.0 3.6–10.5 16 9 4.8–13.2
CervicalIrregular bleeding 48 25.4 19.2–31.6 NA NA NA
ProstateBlood in urine 24 8.5 5.3–11.8 NA NA NADribbling urine 14 5.0 2.4–7.5 NA NA NADifficulty/delay urinating 9 3.2 1.1–5.2 NA NA NA
95% CI: 95% confidence interval; NA: not available.a 95% CIs do not overlap.
Community Knowledge of Cancer/Paul et al. 2935
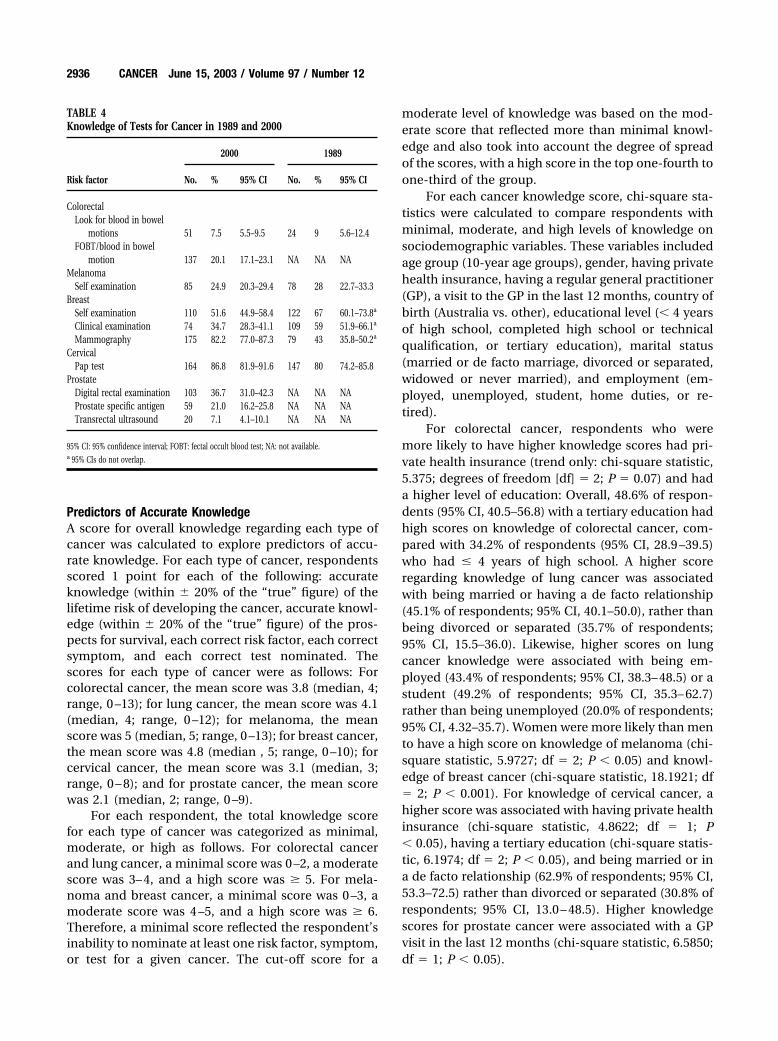
Predictors of Accurate KnowledgeA score for overall knowledge regarding each type ofcancer was calculated to explore predictors of accu-rate knowledge. For each type of cancer, respondentsscored 1 point for each of the following: accurateknowledge (within � 20% of the “true” figure) of thelifetime risk of developing the cancer, accurate knowl-edge (within � 20% of the “true” figure) of the pros-pects for survival, each correct risk factor, each correctsymptom, and each correct test nominated. Thescores for each type of cancer were as follows: Forcolorectal cancer, the mean score was 3.8 (median, 4;range, 0 –13); for lung cancer, the mean score was 4.1(median, 4; range, 0 –12); for melanoma, the meanscore was 5 (median, 5; range, 0 –13); for breast cancer,the mean score was 4.8 (median , 5; range, 0 –10); forcervical cancer, the mean score was 3.1 (median, 3;range, 0 – 8); and for prostate cancer, the mean scorewas 2.1 (median, 2; range, 0 –9).
For each respondent, the total knowledge scorefor each type of cancer was categorized as minimal,moderate, or high as follows. For colorectal cancerand lung cancer, a minimal score was 0 –2, a moderatescore was 3– 4, and a high score was � 5. For mela-noma and breast cancer, a minimal score was 0 –3, amoderate score was 4 –5, and a high score was � 6.Therefore, a minimal score reflected the respondent’sinability to nominate at least one risk factor, symptom,or test for a given cancer. The cut-off score for a
moderate level of knowledge was based on the mod-erate score that reflected more than minimal knowl-edge and also took into account the degree of spreadof the scores, with a high score in the top one-fourth toone-third of the group.
For each cancer knowledge score, chi-square sta-tistics were calculated to compare respondents withminimal, moderate, and high levels of knowledge onsociodemographic variables. These variables includedage group (10-year age groups), gender, having privatehealth insurance, having a regular general practitioner(GP), a visit to the GP in the last 12 months, country ofbirth (Australia vs. other), educational level (� 4 yearsof high school, completed high school or technicalqualification, or tertiary education), marital status(married or de facto marriage, divorced or separated,widowed or never married), and employment (em-ployed, unemployed, student, home duties, or re-tired).
For colorectal cancer, respondents who weremore likely to have higher knowledge scores had pri-vate health insurance (trend only: chi-square statistic,5.375; degrees of freedom [df] � 2; P � 0.07) and hada higher level of education: Overall, 48.6% of respon-dents (95% CI, 40.5–56.8) with a tertiary education hadhigh scores on knowledge of colorectal cancer, com-pared with 34.2% of respondents (95% CI, 28.9 –39.5)who had � 4 years of high school. A higher scoreregarding knowledge of lung cancer was associatedwith being married or having a de facto relationship(45.1% of respondents; 95% CI, 40.1–50.0), rather thanbeing divorced or separated (35.7% of respondents;95% CI, 15.5–36.0). Likewise, higher scores on lungcancer knowledge were associated with being em-ployed (43.4% of respondents; 95% CI, 38.3– 48.5) or astudent (49.2% of respondents; 95% CI, 35.3– 62.7)rather than being unemployed (20.0% of respondents;95% CI, 4.32–35.7). Women were more likely than mento have a high score on knowledge of melanoma (chi-square statistic, 5.9727; df � 2; P � 0.05) and knowl-edge of breast cancer (chi-square statistic, 18.1921; df� 2; P � 0.001). For knowledge of cervical cancer, ahigher score was associated with having private healthinsurance (chi-square statistic, 4.8622; df � 1; P� 0.05), having a tertiary education (chi-square statis-tic, 6.1974; df � 2; P � 0.05), and being married or ina de facto relationship (62.9% of respondents; 95% CI,53.3–72.5) rather than divorced or separated (30.8% ofrespondents; 95% CI, 13.0 – 48.5). Higher knowledgescores for prostate cancer were associated with a GPvisit in the last 12 months (chi-square statistic, 6.5850;df � 1; P � 0.05).
TABLE 4Knowledge of Tests for Cancer in 1989 and 2000
Risk factor
2000 1989
No. % 95% CI No. % 95% CI
ColorectalLook for blood in bowel
motions 51 7.5 5.5–9.5 24 9 5.6–12.4FOBT/blood in bowel
motion 137 20.1 17.1–23.1 NA NA NAMelanoma
Self examination 85 24.9 20.3–29.4 78 28 22.7–33.3Breast
Self examination 110 51.6 44.9–58.4 122 67 60.1–73.8a
Clinical examination 74 34.7 28.3–41.1 109 59 51.9–66.1a
Mammography 175 82.2 77.0–87.3 79 43 35.8–50.2a
CervicalPap test 164 86.8 81.9–91.6 147 80 74.2–85.8
ProstateDigital rectal examination 103 36.7 31.0–42.3 NA NA NAProstate specific antigen 59 21.0 16.2–25.8 NA NA NATransrectal ultrasound 20 7.1 4.1–10.1 NA NA NA
95% CI: 95% confidence interval; FOBT: fectal occult blood test; NA: not available.a 95% CIs do not overlap.
2936 CANCER June 15, 2003 / Volume 97 / Number 12
DISCUSSIONThe current study data suggest that communityknowledge levels are high in relation to some aspectsof the cancers studied, and public education has madea significant impact on some aspects of communityknowledge, which also has been the true in othercountries.30,41 Of course, these changes must be inter-preted with caution and are considered only indica-tive, given the differences in methodology betweenthis study and the earlier survey.
Community perceptions regarding the prevent-ability of cancers correspond to educational messagesover recent decades in Australia, in that lung cancerand melanoma were considered very preventable orcompletely preventable by a much greater proportionof the population compared with the other types ofcancers studied. However, approximately half of thesample did not believe that even lung cancer andmelanoma were greatly preventable. This suggeststhat the potential impact of prevention may not beaccepted by some in the community. Similarly, � 40%of the sample perceived that they could greatly reducetheir personal risk of developing cancer generally.These responses may be explained in a number ofways: Possibilities include a perceived lack of ability tochange one’s own behavior, a fatalistic approach tohealth, an over-emphasis on the importance of ge-netic or environmental factors, the respondents’ be-liefs that they currently lead healthy lifestyles, or per-haps a failure to translate the general concept ofprevention to personal control over cancer risks.
It is acknowledged by the majority in the commu-nity that early detection makes a “great deal” of dif-ference in survival from some cancers. Approximately70% of the sample believed that early detection andtreatment made a great deal of difference in survivalfrom breast cancer, melanoma, and other skin can-cers. Of concern is the finding that approximatelyone-third of the sample did not believe that earlydetection and treatment had such effects for cervicalcancer or colorectal cancer. This may explain in partthe participation rate of 62.4% of the target groups inAustralia’s National Cervical Screening Program.42
The potential impact of early detection on survival issubstantial for these types of cancer.43 Clearly, therestill is scope for increasing community awareness ofthe potential impact of early detection and treatmentfor certain cancers.
Respondents’ estimates of the lifetime risk of de-veloping cancers and their estimates of case-fatalitysuggest that there is little more than a superficial un-derstanding of risk and survival in the community, asalso found in the U.S.30 and the United Kingdom.44
The survey respondents consistently overestimatedtheir lifetime risk of developing cancers by a margin of20 –25% for most of the cancers studied. This wasdespite an intensive national media campaign forbreast cancer in the late 1990s that addressed lifetimerisk directly.15 It appears that this over-estimation isnot necessarily associated with high levels of concernor anxiety or with increased screening behavior.28
However, the consistency of such findings interna-tionally has raised concern that the high salience ofcertain cancers has led to reduced public attention toother important causes of morbidity and mortality,such as heart disease.10 Similarly, the tendency ofpublic education to highlight risks and to emphasizeimmediate cues and actions may reduce the salienceof other types of information.
The survey respondents’ estimates were more ac-curate regarding case fatality than for lifetime risk.However, the fact that the mean responses for cancersother than lung cancer were around 70% may meanthat respondents were operating on a general assump-tion that approximately 70% of individuals with cancersurvive for 5 years, rather than having a more accuratelevel of understanding about the length of survivalregarding particular cancers. There were some differ-ences between the 1989 study and the 2000 study inthe proportion of respondents who made accurateestimates of case fatality. An examination of thesedifferences suggests that the differences may be re-lated to changes in case fatality over time for somecancers rather than changes in individual’s estimates.
The high proportion of respondents who nomi-nated smoking as a risk factor for lung cancer (96%)and UV exposure as a risk factor for melanoma (80%)demonstrates that it is possible to achieve high levelsof understanding of health risks across the whole com-munity. The increase in levels of awareness of smok-ing from 88% to 96% between 1989 and 2000 (andparallel declines in smoking rates over the sameperiod)45– 47 demonstrate the potential impact of long-term, sustained efforts to educate the public about ahealth risk. Levels of knowledge regarding some othermajor risk factors, such as diet and colorectal cancer,remain low. Conflicting reports in recent years regard-ing the link between diet and cancer may play somepart in such findings.48 Increasing age as a major riskfactor for breast and prostate cancer clearly is under-stood poorly.
With regard to tests for cancer, high proportionsof the sample nominated the Papanicolaou test andmammography. This is not surprising given the con-siderable promotion of these screening tests over anumber of years.14,15 The data lend support to theview that that multifaceted interventions, including
Community Knowledge of Cancer/Paul et al. 2937
mass media, like those used in Australia to promotemammography can be successful in producing changein community knowledge. Knowledge of mammogra-phy as a test for breast cancer has increased over thepast decade, with results indicating that 43% in 1989,63% in 1996,27 and 82% in 2000 were aware of mam-mography, alongside a targeted national campaign topromote and increase screening. The relatively earlystage of public education regarding colorectal cancerand prostate cancer is reflected in low levels of knowl-edge about screening tests for these malignancies.Therefore, the knowledge levels reflected in the cur-rent report provide a useful benchmark against whichto measure future public education efforts.
The total knowledge scores for each type of cancersuggest that the majority of the community in Austra-lia has at least a moderate level of knowledge regard-ing the cancers studied. Not surprisingly, respondentswith a higher socioeconomic status, as indicated byfactors such as private health insurance and level ofeducation, were more likely to have higher levels ofknowledge for some cancers. With regard to knowl-edge of prostate cancer, the importance of havingvisited a GP in the previous 12 months suggests thatsuch health care providers are likely to be key to thedissemination of information about prostate cancer.
The data concerning knowledge of diet and canceralso provides benchmark data for the evaluation offuture efforts to educate the public regarding diet andcancer. The survey respondents did not identify par-ticular foods that were associated with reduced cancerrisks. Rather, a general understanding of increasingthe consumption of fruits, vegetables, and fiber anddecreasing the consumption of fats was evident. Ifcancer prevention in the form of dietary recommen-dations is to be taken up, then there is considerablescope for public education.
ConclusionsIt appears that there have been substantial gains incommunity knowledge in some areas, yet there re-main major challenges in others areas. The study dataalso require consideration in terms of improving ourunderstanding of the way the community interpretspublic-education messages and how this affects theirdecisions about behavior. Each of the following shouldbe considered potential targets for improving publicunderstanding related to the prevention and early de-tection of cancer: personal control over cancer pre-vention and early detection, particularly for colorectalcancer, lung cancer, and melanoma; the potential im-pact of early detection and treatment for patients withmelanoma and cervical cancers; understanding life-time risk and fatality and whether these are important
with regard to attitudes and behavior; and risk factorsother than smoking and UV exposure, particularly age.A potential future direction for research is an interna-tional examination of trends in perceptions and prac-tices over time in relation to exposure to major edu-cational efforts to gain greater understanding aboutthe types of campaigns or efforts that may be the mosteffective in achieving sustained change.
REFERENCES1. Rimer BK. Cancer control research 2001. Cancer Causes
Control. 2000;11:257–270.2. Catford J. Reducing health inequalities—time for optimism
[editorial]. Health Promot Int. 2002;17:101–104.3. Marks R. Two decades of the public health approach to skin
cancer control in Australia: why, how and where are wenow? Australas J Dermatol. 1999;40:1–5.
4. Robinson JK, Rigel DS, Amonette RA. Trends in sun expo-sure knowledge, attitudes and behaviours: 1986 to 1996.J Am Acad Dermatol. 1997;37:179 –186.
5. Bauer UE, Johnson TM, Hopkins RS, Brooks RG. Changes inyouth cigarette use and intentions following implementa-tion of a tobacco control program: findings from the FloridaYouth Tobacco Survey, 1998 –2000. JAMA. 2000;284:723–728.
6. Blanks RG, Moss SM, McGahan CE, Quinn MJ, Babb PJ.Effect of NHS breast screening programme on mortalityfrom breast cancer in England and Wales, 1990 –1998: com-parison of observed with predicted mortality. Br Med J.2000;321:665– 669.
7. Fylan F. Screening for cervical cancer: a review of women’sattitudes, knowledge, and behaviour. Br J Gen Pract. 1998;48:1509 –1514.
8. Hill D, Hassard K. Overview. In: National Tobacco Cam-paign. Australia’s National Tobacco Campaign EvaluationReport, volume 1: every cigarette is doing you damage.Canberra: Commonwealth of Australia, 1999.
9. McNair AGB. Evaluation research for the BreastScreen Aus-tralia Campaign report. North Sydney: AGB McNair, 1997.Available at URL: http://www.breastscreen.info.au/marketing/campaigns.html
10. Gottlieb N. The age of breast cancer awareness: what is theeffect of media coverage? J Natl Cancer Inst. 2001;93:1520 –1522.
11. The Cancer Council NSW. Cancer Council annual report2000 –2001. Sydney: NSW Cancer Council, 2002.
12. The Cancer Council NSW. Cancer Council annual report1991–1992. Sydney: NSW Cancer Council, 1993.
13. The Cancer Council NSW. Cancer Council annual report1986 –1987. Sydney: NSW Cancer Council, 1988.
14. Australian Institute of Health and Welfare. Cervical screen-ing in Australia 1997–1998. AIHW cat. no. CAN 9, cancerseries no. 14. Canberra: Australian Institute of Health andWelfare, 2000.
15. Australian Institute of Health and Welfare . BreastScreenAustralia achievement report 1997–1998. AIHW cat. no. CAN8, cancer series no. 13. Canberra: Australian Institute ofHealth and Welfare, 2000.
16. Australian Cancer Society. Annual report. Leading the fightagainst cancer. Australia: Australian Cancer Society, 1999.
17. Walsh RA, Paul CL, Tzelepis F. Overwhelming support forsmoking bans. Aust NZ J Public Health. 2000;24:640 – 641.
2938 CANCER June 15, 2003 / Volume 97 / Number 12
18. Irwig L, Cockburn J, Turnbull D, Simpson JM, Mock P,Tattersall M. Women’s perceptions of screening mammog-raphy. Aust J Public Health. 1991;15:24 –32.
19. McMichael AJ, Armstrong BK. Breast cancer in Australia:occurrence, risk factors, preventability and screening. Med JAust. 1998;148:86 – 88.
20. Clover K, Redman S, Boyle K, Wiggers J, Sanson-Fisher R.Community knowledge of cancer. Health Promot Int. 1991;6:93–101.
21. Cockburn J, Murphy B, Schofield P, Hill D, Borland R. De-velopment of a strategy to encourage attendance for screen-ing mammography. Health Educ Res. 1991;6:279 –290.
22. Fitzgerald P, Diggins L, Moore D. A survey of knowledge,attitudes and behaviour of women resident in the SouthWest statistical division and pilot project target area ofWestern Australia. Subiaco: Women’s Cancer PreventionUnit, 1990.
23. Diamond M, Fitzgerald P, Moore D. Breast cancer screeningand mammography: a survey of knowledge, attitudes andbehaviour of women resident in the Cannington Pilotproject target area of Western Australia. Subiaco: Women’sCancer Prevention Unit, 1990.
24. Beckett M, Redman S, Lee C. Breast self-examination, can-cer knowledge and breast disease in a sample of HunterValley women. Behav Change. 1990;7:136 –142.
25. Cockburn J, Hennrikus D, Scott R, Sanson-Fisher R. Adoles-cent use of sun protection measures. Med J Aust. 1989;151:136 –140.
26. Lower T, Girgis A, Sanson-Fisher R. The prevalence andpredictors of solar protection use among adolescents. PrevMed. 1998;27:391–399.
27. Barratt A, Cockburn J, Lowe J, Paul C Perkins J, Redman S.Report on the 1996 Breast Health Survey. Sydney: NHMRCNational Breast Cancer Centre, 1997.
28. Barratt A, Cockburn J, Redman S, Paul C, Perkins J. Mam-mographic screening: results from the 1996 National BreastCancer Centre. Med J Aust. 1997:167:521–524.
29. Pearlman DN, Clark MA, Rakowski W, Ehrich B. Screeningfor breast and cervical cancers: the importance of knowl-edge and perceived cancer survivability. Women Health.1999;28:93–112.
30. Breslow RA, Sorkin JD, Frey CM, Kessler LG. Americans’knowledge of cancer risk and survival. Prev Med. 1997;26:170 –177.
31. Weller DP, Owen N, Hiller JE, Willson K, Wilson D. Colorec-tal cancer and its prevention: prevalence of beliefs, atti-tudes, intentions and behaviour. Aust J Public Health. 1995;19:19 –23.
32. Harris MA, Byles JE. A survey of screening complianceamong first degree relatives of people with colon cancer inNew South Wales. J Med Screen. 1997;4:29 –34.
33. Thomas RJS, Clarke VA. Colorectal cancer: a survey of com-
munity beliefs and behaviours in Victoria. Med J Aust. 1998;169:37– 40.
34. Lowe JB, Balanda KP, Gillespie AM, Stanton WR, AndersonPJ. Community perceptions of bowel cancer. Health EducQuarterly. 1995;54:331–339.
35. Weller D, Pinnock C, Silagy C, Hiller JE, Marshall, VR. Pros-tate cancer testing in SA men: influence of sociodemo-graphic factors, health beliefs and LUTS. Aust NZ J PublicHealth. 1998;22:400 – 402.
36. Ward JE, Hughes A, Hirst GHL, Winchester L. Men’s esti-mates of prostate cancer risk and self-reported rates ofscreening. Med J Aust. 1997;167:250 –253.
37. Pinnock CB, Weller DP, Marshall VR. Self-reported preva-lence of prostate-specific antigen testing in South Australia:a community study. Med J Aust. 1998;169:25–28.
38. Terry P, Giovannucci E, Michels KB, et al. Fruit, vegetables,dietary fibre and risk of colorectal cancer. J Natl Cancer Inst.2001;93:525–533.
39. Hill D, White V, Borland R, Cockburn J. Cancer-related be-liefs and behaviours in Australia. Aust J Public Health. 1991;15:14 –23.
40. Supramaniam R, Smith DP, Coates MS, Armstrong BK. Sur-vival from cancer in New South Wales in 1980 to 1995.Sydney: NSW Cancer Council, 1998.
41. De Grasse CE, Oconnor AM, Perrault DJ, Aitken SE, JoanisseS. Changes in women’s breast cancer screening practices,knowledge and attitudes in Ottowa-Carleton since 1991.Can J Public Health. 1996;87:333–338.
42. Australian Institute of Health and Welfare, BreastScreenAustralia, and the National Cervical Screening Program.Breast and cervical cancer screening in Australia 1996 –1997.AIHW no. CAN3. Canberra: Australian Institute of Healthand Welfare, 2000.
43. McDonald C. The American Cancer Society addressing dis-parities in the disproportionate burden of cancer. Cancer.2001;91(1 Suppl):195–198.
44. Grunfeld EA, Ramirez AJ, Hunter MS, Richards MA. Wom-en’s knowledge and beliefs regarding breast cancer. Br JCancer. 2002;86:1373–1378.
45. Walsh RA, Paul CL, McElduff P. Smoking rates may be de-clining. Med J Aust. 2001;175:339.
46. Tan N, Wakefield M, Freeman J. Changes associated withthe National Tobacco Campaign: results of the second fol-low-up survey. In: Hassard K, editor. Australia’s NationalTobacco Campaign. Evaluation report, vol 2: every cigaretteis doing you damage. Canberra: Commonwealth of Austra-lia, 2000:21–76.
47. Hill DJ, White VM, Scollo MM. Smoking behaviours of Aus-tralian adults in 1995: trends and concerns. Med J Aust.1998;168:209 –213.
48. Clark G. Recent studies cloud link between diet and cancer.J Natl Cancer Inst. 2000;92:1794 –1795.
Community Knowledge of Cancer/Paul et al. 2939