Embed Size (px)
Citation preview

HASTINGS AREA NITRATE STUDY
FINAL REPORT
Dakota County
Environmental Management
March 2003
1

HASTINGS AREA NITRATE STUDY
ACKNOWLEDGEMENTS
Farmers and other residents made the Hastings Area Nitrate Study possible by participating in the Farm Nutrient Management Assessment Program, by allowing monitoring wells to be installed on their private property, or allowing samples to be taken of their drinking water. Without the voluntary, confidential, cooperation of so many Dakota County residents, this study would not have been possible. The Hastings Area Nitrate Study was the product of successful interagency cooperation. Dakota County is very grateful to the many state and local agency staff people who helped with this project. David Swenson of Dakota County Environmental Management and Eric Evenson (then of the Dakota County Office of Planning) originally conceived of and designed the project, and Swenson provided oversight from beginning to end. Barry Schade, Director of Environmental Management for Dakota County, supported the project throughout. Dakota County was very fortunate to benefit from the technical and professional assistance of its HANS Task Force members: Sheila Grow, Minnesota Department of Health; Denton Bruening and Joe Zachmann, Minnesota Department of Agriculture; Leigh Harrod, Metropolitan Council; Tom Montgomery, City of Hastings, Chuck Regan, Minnesota Pollution Control Agency, and Brian Watson, Dakota County Soil and Water Conservation District. Jill V. Trescott served as project manager. Denton Bruening, MDA, conducted the Hastings area Farm Nutrient Management Assessment Program. Mary Wagner, now of the Dakota County Transportation Department, recruited many of the FANMAP participants. Sheila Grow, MDH, and Jerry Floren, MDA, analyzed samples for nitrate, which were collected by Jim Heusser and John Zgoda, City of Hastings; Charlotte Shover, Dakota County Environmental Education; Amanda Cornell, Vanessa Demuth, Jeff Harthun, Jeff Luehrs, Terry Muller, Bill Olsen, Michael Rutten, Kay Schoenecker, Bev Schomburg, and David Swenson, Dakota County Environmental Management Department; Dee Jarvis and Eric Zweber, Dakota County Office of Planning; Laura Jester and Jennifer Morrow, Dakota County SWCD; Chuck Regan, Minnesota Pollution Control Agency. Dakota County Groundwater Protection interns Kyle Fredricks, Emily Lund, Erin Mortensen, and Holly Parks collected static water levels and nitrate samples from the HANS monitoring wells in the full range of Minnesota weather. Sheila Grow, MDH, also assisted in this effort by collecting samples, collecting water quality data, and analyzing samples for nitrate. Emily Lund also installed seepage meters and minipotentiometers in the Vermillion River to try to better understand the surface water/groundwater interactions, with the assistance of Jim Lundy of the MPCA and Kerry Keen of the University of Wisconsin – River Falls. Jim Walsh, MPCA, assisted with oxygen isotope analysis of water samples to evaluate the surface water component of groundwater. Laura Jester, SWCD, and Terrie O’Dea, Metropolitan Council, provided valuable surface water monitoring data. Bill Olsen, Dakota County Environmental Management, developed and applied the Hastings Area Groundwater Model.
David Holmen, SWCD, performed the Land Cover Analysis of the Hastings area. Betty Schneider and Mike Thurman, USGS Organic Chemistry Research Laboratory, were very helpful with pesticide and pesticide metabolite analysis. Bob Poreda, University of Rochester, New York, Department of Earth and Environmental Sciences, assisted with helium-tritium age-dating. Todd Peterson and Jim Berg, Minnesota Department of Natural Resources, conducted a geophysical survey of buried bedrock valley features in the Hastings area. The Hastings Area Nitrate Study was funded in part by a $75,000 Clean Water Partnership grant through the MPCA. The Minnesota Department of Agriculture, Minnesota Department of Health, Dakota County Soil and Water Conservation District, City of Hastings, and Metropolitan Council also provided cash and in-kind support for this project.
HASTINGS AREA NITRATE STUDY TABLE OF CONTENTS
Acknowledgements Table of Contents List of Abbreviations List of Tables List of Charts List of Figures Executive Summary . . . . . . . . . . . . . . . . . . . . . . . . . . . . . . . . . . . . . . . . . . . . . . . . . . . . 1 Introduction . . . . . . . . . . . . . . . . . . . . . . . . . . . . . . . . . . . . . . . . . . . . . . . . . . . . . . . . . . . 8 Project Milestones . . . . . . . . . . . . . . . . . . . . . . . . . . . . . . . . . . . . . . . . . . . . . . . . . . . . . 14 Diagnostic Study . . . . . . . . . . . . . . . . . . . . . . . . . . . . . . . . . . . . . . . . . . . . . . . . . . . . . . 15 I. Description of Project Area . . . . . . . . . . . . . . . . . . . . . . . . . . . . . . . . . . . . . . . . 15 II. Water Quality Monitoring . . . . . . . . . . . . . . . . . . . . . . . . . . . . . . . . . . . . . . . . . 18 Nitrate Sampling . . . . . . . . . . . . . . . . . . . . . . . . . . . . . . . . . . . . . . . . . . . . . . . . 20 Caffeine Sampling . . . . . . . . . . . . . . . . . . . . . . . . . . . . . . . . . . . . . . . . . . . . . . 27 Pesticide Sampling . . . . . . . . . . . . . . . . . . . . . . . . . . . . . . . . . . . . . . . . . . . . . . 27 Vermillion River Monitoring Wells . . . . . . . . . . . . . . . . . . . . . . . . . . . . . . . . . . . 33 III. Farm Nutrient Management Assessment . . . . . . following Vermillion River Wells IV. Groundwater Modeling . . . . . . . . . . . . . . . . . . . . . . . . . . .. . . . . . . . . . . . . . . . . 38 V. Discussion . . . . . . . . . . . . . . . . . . . . . . . . . . . . . . . . . . . . . . .. . . . . . . . . . . . . . 49 VI. Conclusions . . . . . . . . . . . . . . . . . . . . . . . . . . . . . . . . . . . . . .. . . . . . . . . . . . . . 53 Implementation Plan . . . . . . . . . . . . . . . . . . . . . . . . . . . . . . . . . . . . . . . . . . . . . . . . . . . 54 I. Implementation Objectives. . . . . . . . . . . . . . . . . . . . . . . . . . . . . . . . . . . . . . . . . 54 I. Implementation Practices . . . . . . . . . . . . . . . . . . . . . . . . . . . . . . . . . . . . . . . . . 55 Figures References Distribution List
4

Appendices: A: Summary of studies reviewed in “Nitrate in Drinking Water and Human Health,”
March 2001 B: Detailed Financial Report C: Domestic Wells – Consolidated Sampling Results D: Domestic Wells – Caffeine Results E: Domestic Wells – Pesticide and Pesticide Breakdown Product Results (U.S.G.S) F: Monitoring Well Construction Logs G: Groundwater Modeling Input H: Dakota County Farmland and Natural Areas Program I. Bedrock Stratigraphic Column
5

HASTINGS AREA NITRATE STUDY
ABBREVIATIONS AND ACRONYMS BMP – Best Management Practice
CBS – Minnesota DNR County Biological Survey
CWP – Clean Water Partnership
CWI – County Well Index
DNR – Minnesota Department of Natural Resources
DOQQ – Digital Ortho Quarter Quad (spatially corrected aerial photograph)
EPA – United States Environmental Protection Agency
FANMAP – Farm Nutrient Management Assessment Program
GC/MS – Gas Chromatography/Mass Spectrometry
HANS – Hastings Area Nitrate Study
HPLC/MS – Liquid Chromatography/Mass Spectrometry
HRL – Hazard Risk Limit (established by MDH)
LGU – Local Government Unit
MCL – maximum contaminant limit (established by EPA)
MSL – mean sea level (elevation)
Metro Model – Metropolitan Area Groundwater Model
mg/L – milligrams per liter (parts per million)
MDA – Minnesota Department of Agriculture
MDH – Minnesota Department of Health
MPCA – Minnesota Pollution Control Agency
MLAEM -- Multi Layer Analytical Element Model
NAWQA – USGS National Ambient Water Quality Assessment Program
NOC – N-nitroso compound
NWI – National Wetlands Inventory
6 SWCD – Dakota County Soil and Water Conservation District

µg/L – micrograms per liter (parts per billion)
USGCRP – United States Global Change Research Project
USGS – United States Geological Survey
U of M Extension – University of Minnesota Agricultural Extension Service
WELLMAN -- Dakota County Well and Water Management System (data management
system)
7

HASTINGS AREA NITRATE STUDY
LIST OF TABLES Table 1: Nitrate levels by classification Table 2: Nitrate results by aquifer Table 3: Nitrate results by depth of well Table 4: Dakota County Delegated Well Program Table 5: Nitrate results by Drilling Company Table 6: Nitrate results by use of grout Table 7: Nitrate results by casing type Table 8: Nitrate results by Municipality Table 9: Nitrate results and land use Table 10: Summary of Pesticide Results Table 11: Sum of Pesticide Parent Compounds and Degradates Table 12: Pesticide Co-Detections Table 13: Age-Dating Results LIST OF CHARTS Chart 1: Median Nitrate Levels by Depth Interval Chart 2: Percentage of Nitrate over Drinking Water Standards by Well Depth Interval Chart 3: Percentage of Nitrate at Background Level by Well Depth Interval Chart 4: Static Water Levels in Monitoring Wells over Time Chart 5: Static Water Levels in Monitoring Wells (excluding upstream wells) Chart 6: Monitoring Well Nitrate Levels over Time Chart 7: Monitoring Well Nitrate Levels over Time (excluding GW912) Chart 8: Nitrate results by depth of well: Hastings municipal wells vs. area domestic
wells LIST OF FIGURES Figure 1: United States Geological Survey National Ambient Water Quality Assessment
Program – Risk of Groundwater Contamination Figure 2: Hastings Municipal Wells Nitrate Results, 1993-2003 Figure 3: Nitrate Study Area Figure 4: Year 2000 Digital Orthophoto Figure 5: Year 2000 Land Cover Classification Figure 6: Zoning Figure 7: Municipal Services Figure 8: Bedrock Geology Figure 9: Depth to Bedrock Figure 10: Surficial (Quaternary) Geology Figure 11: General Soil Type Figure 12: Groundwater Sensitivity to Pollution Figure 13: Vermillion River Watershed Figure 14: Nitrate Results Figure 15: Nitrate Results Figure 16: High Nitrate Areas and Soil Type Figure 17: Caffeine and Pesticide Detections Figure 18: Monitoring Well Locations Figure 19: Upstream Monitoring Well Locations and Static Water Levels Figure 20: Buried Bedrock Valley Monitoring Well Locations and Static Water Levels
8 Figure 21: Downstream Monitoring Well Locations and Static Water Levels

Figure 22: Changes in Water Table vs. Vermillion River Figure 23: Vermillion River Monitoring Results (Map) Figure 24: Vermillion River Monitoring Results (Chart) Figure 25: Water Table: HANS Monitoring Well Data compared to Dakota County Geologic
Atlas Piezometric Surface Figure 26: Bedrock Elevation Trend Surface (LSE Fit) Figure 27: Bedrock Elevation Trend Surface (Exact Fit) Figure 28: Thickness of the Prairie du Chien Group (ignoring Quaternary erosion) Figure 29: Thickness of the Jordan Aquifer (ignoring Quaternary erosion) Figure 30: Base of the Jordan Aquifer (ignoring Quaternary erosion) Figure 31: Groundwater Model: Polygon IDs 1 Figure 32: Groundwater Model: Polygon IDs 2 Figure 33: Groundwater Model: Approximate Effective Aquifer Base Figure 34: Groundwater Model: Aquifer Thickness Figure 35: Groundwater Model: Aquifer Permeability Figure 36: Groundwater Model: Infiltration and Exfiltration Rates at the Top of the Aquifer Figure 37: Groundwater Model: Leakage at the Bottom of the Aquifer Figure 38: Groundwater Model: Line Elements for Rivers Figure 39: Groundwater Model: Piezometric Contours Figure 40: Groundwater Model: Residuals to Observation Heads Figure 41: Groundwater Model: Estimated Flow Paths to HANS Wells
9

HASTINGS AREA NITRATE STUDY EXECUTIVE SUMMARY I. Abstract Dakota County conducted this Clean Water Partnership (CWP) project to determine the cause and extent of nitrate contamination in the groundwater in the City of Hastings and the surrounding townships. The County’s partners in the Hastings Area Nitrate Study were
The City of Hastings The Minnesota Department of Health (MDH) The Minnesota Department of Agriculture (MDA) Dakota County Soil and Water Conservation District (SWCD), and The Metropolitan Council.
In order to quantify and map patterns of elevated nitrate in the City of Hastings and the surrounding townships, the County and its project partners gathered and analyzed data on:
private and public drinking water quality, surface water quality, farming practices, sewage treatment conditions, geology, soils, and groundwater flow patterns.
The study found that the major source of nitrate contamination was row-crop agriculture, although strong evidence of sewage contamination was also found. The study also developed an Implementation Plan to reverse the trend in nitrate contamination and restore water quality through new and existing activities:
public outreach and education; improving agricultural practices; protecting the Vermillion River; protecting natural areas; maintaining and upgrading septic systems; regulating well construction and sealing; and follow-up monitoring and research.
II. Project Background Clientele The people served by this project are the current and future residents of the City of Hastings and the surrounding area. Hastings had a population of 18,000 in the 2000 census (an 18% increase over 1990), and is expected to grow to 28,400 by the year 2020. The surrounding rural area has approximately 2,000 residents. In addition, the information obtained through this study will be used to protect the drinking water for the residents of Dakota County (which had a 2000 population of 356,000), 92% of whom rely on groundwater for their drinking water supply. Objectives The Hastings Area Nitrate Study had two primary goals:
1) determine the cause and extent of nitrate contamination in the Prairie du Chien and Jordan Aquifers in Hastings and the surrounding area; and
10

2) develop an implementation plan to reverse the trend in nitrate contamination and restore water quality through a combination of education, management practices, and other activities.
Need for the Project The City of Hastings is a historic Mississippi River town, about twenty miles downstream from St. Paul, in the northeast corner of Dakota County, of which it is the county seat. The Hastings Area Nitrate Study began in July 1999, when Dakota County received a Clean Water Partnership grant in the amount of $75,000 to conduct the study. Dakota County staff had become aware of increasing nitrate levels in the City of Hastings municipal water supply while also noting (through the County’s well regulation program) increasing numbers of private drinking water wells with elevated nitrate levels. Municipal wells for the City of Hastings had shown rising levels of nitrate for a number of years. The City of Hastings and the residents of the surrounding Townships derive 100% of their drinking water from groundwater. Hastings started the siting process for a new municipal well in 1997, to help meet growing demand. Two test wells were drilled into the Jordan aquifer, and both wells showed levels of nitrate at approximately 8 mg/L (milligrams per liter). The city tested five private wells within the search area for the new municipal well and found elevated nitrate levels ranging from 12 to 16 mg/L. In May 1999, just before the Study began, the MDH closed Hastings Municipal Well #6 for several weeks, after samples contained average nitrate concentrations of 10.5 mg/L. Nitrate levels in the other municipal wells have been below the drinking water standard, but over the last ten years, the wells have shown steady increases. Nitrate is the most common form of non-point-source groundwater pollution, especially in the Corn Belt of the Midwestern United States. Nitrate is a form of nitrogen that is found naturally, at low levels, in surface water bodies and in groundwater; it comes from human or animal wastes, nitrogen fertilizers (such as anhydrous ammonia, urea, or ammonium nitrate), and plant decay. In natural environments, nitrate is converted to harmless forms of nitrogen such as proteins or atmospheric nitrogen. In environments affected by human activity, nitrate can accumulate to unhealthy levels. In particular, infants whose drinking water contains more nitrate than the drinking water standard of 10 mg/L can develop methemoglobinemia (“blue baby” syndrome). Also, nitrate is a strong indicator that human activities are affecting water quality and that other contaminants may be present. Local water managers and resource specialists are concerned about the increasing levels of nitrates being detected in deeper aquifers. The general public is anxious about the safety and quality of their drinking water, but their concerns are generally non-technical in nature. In May 1999, the Minnesota Pollution Control Agency (MPCA) conducted eight public sessions, “The Governor’s Forums: Citizens Speak Out on the Environment.” On a statewide basis, the participants in these forums chose the environment and education as the state’s most pressing public policy issues. In each of the regional forums, water quality issues ranked among citizens’ highest concerns. In a 1996 survey of Dakota County residents, 22% thought groundwater protection should be the County’s highest environmental priority, and 42% thought groundwater protection should be the first or second priority: groundwater protection received the most “votes” by far of any environmental issue.
11
The same study indicated that the public’s specific understanding of concepts such as watersheds, wellhead protection, or groundwater flow tended to be vague. Consequently,

the public may not be aware of the origins of their own drinking water or how agricultural practices, feedlots, or septic systems may be affecting their water supply. Those who will be most effected by groundwater protection programs may be reluctant to change; they may not willingly adopt practices and behaviors to reduce groundwater contamination unless it can be shown how their practices contribute to the problem. III. Project Results The Hastings Area Nitrate Study achieved its objectives of determining the extent and sources of the nitrate contamination in the area’s drinking water supply and developing an Implementation Plan to address the problem. In a representative sample of private drinking water wells, the results justified the concerns that had prompted the study to begin with: more than half the wells had high nitrate levels:
26% exceeded the drinking water standard of 10 mg/L; another 26% were in the “elevated” ranged of 3 to 10 mg/L. The results for the City of Hastings municipal wells were all below the drinking water
standard, but ranged from 2.1 mg/L to 8.5 mg/L. County staff analyzed the results statistically and spatially, determining that the Hastings area does not have a “plume” of nitrate contamination. Instead, staff identified a set of major risk factors associated with high nitrate results within the study area: the depth of the well (deeper is better), the age of the well (newer is better), and the soil type in which the well was constructed (clay soils have lower nitrate than sandy soils). In order to determine where the nitrate was coming from, staff reviewed land use in the surrounding area and identified three suspected sources of nitrate: row crop agriculture, feedlots, and leaking septic systems. Farm Nutrient Management Assessment Program (FANMAP) In order to characterize and quantify the area’s agricultural practices related to nitrate, the MDA conducted a Farm Nutrient Management Assessment Program (FANMAP). In a FANMAP study, the MDA conducts extensive, one-on-one, confidential interviews with farmers in the area, to learn in detail how many acres they farm, the crops they grow, the livestock they raise, their fertilizer and pesticide application practices, irrigation, and manure management practices. From the FANMAP results, County staff learned that corn and soybeans, grown in rotation, are more dominant in the area than expected (69% of the acreage), while potato acreage was less than expected (7%). Farmers in the area were found to be following University of Minnesota-recommended Best Management Practices for both fertilizer and pesticide use. Finally, feedlots were eliminated as a significant source of nitrate because relatively few livestock were raised within the study area. Indicator Compounds In order to differentiate between the potential sources of nitrate, a representative subset (20%) of the samples from the private wells were analyzed for certain compounds that were considered tracers, in addition to nitrate. Specifically, the samples were analyzed for caffeine as a tracer for small quantities of sewage affecting the water and for certain agricultural pesticides (and pesticide metabolites) as tracers for row crop farming effects. Caffeine was selected as a tracer for wastewater contamination because it does not occur naturally in groundwater and the only known source is through human consumption.
12

Caffeine was detected in 89% of the samples, and pesticides (or pesticide metabolites) were detected in 70% of the samples. All of the samples had at least one of the two types of contaminants. Because caffeine was more widely detected than nitrate, it was not directly correlated to nitrate levels. By contrast, the relationship was extremely strong between a well’s nitrate levels and its pesticide levels. From this, County staff concluded that the major source of nitrate in the study area was row crop agriculture. Even though the FANMAP indicated that farmers in the area are following Best Management Practices, the area’s soil and geological conditions are working against them. Vermillion River and Groundwater Modeling The Vermillion River, which passes through the study area, was considered a possible transport mechanism for nitrate contamination. County staff installed and sampled three sets of monitoring wells along the Vermillion, then used the results of this sampling and existing data to model groundwater flows in the study area. They concluded that the Vermillion carries 4 to 9 mg/L of nitrate and, within the City of Hastings, loses a significant quantity of water to the groundwater. Therefore, the Vermillion affects Hastings’ drinking water quality. IV. Implementation Plan Dakota County staff conducted the Hastings Area Nitrate Study with the intention that it would not lead to new county regulations, but would provide information to support voluntary groundwater protection efforts. Based on the study’s findings, staff developed an Implementation Plan to improve groundwater quality through new and existing activities: public outreach and education; improving agricultural practices; protecting the Vermillion River; protecting natural areas; maintaining and upgrading septic systems; regulating well construction and sealing; and follow-up monitoring and research. Public Education and Outreach The Study results were presented to the Dakota County Commissioners and Hastings City Council and were covered in newspaper articles, radio interviews, and articles in the Minnesota Groundwater Association newsletter, Dakota County Update, and Dakota County Rural Solid Waste Commission newsletter. The Study and its findings were also presented to:
The Dakota County Township Officers Association, Dakota County Public Health nurses, MDH Well Management staff and the managers of Delegated Well Programs from
around the state, MPCA “Rocks and Water 2002” Conference, Minnesota Groundwater Association Fall Meeting (2002), and MPCA “Air, Water, and Waste” Conference, Spring 2003.
Dakota County Environmental Education staff created an educational exercise for the Volunteer Stream Monitoring Partnership Annual River Summit using the Nitrate Study results as well.
13
County residents who drink well water, especially those in the Study area, are encouraged to have their well tested for nitrate and coliform bacteria on a regular basis. The County offers a free nitrate clinic at the County Fair every year (with assistance from the MDA), and will test well water throughout the year for a fee. A special nitrate clinic was offered in Hastings in June 2002, with 112 well owners participating.

Agriculture The Study’s sampling of private drinking water wells in the area indicated that row-crop agriculture in the area is the major source of nitrate in the groundwater, even though area farmers are following the University of Minnesota’s recommended Best Management Practices (BMPs) for fertilizer and pesticides. This is good news and bad news: the good news is that farmers in the area are making an effort to protect the environment. The bad news is that the information the farmers are getting needs to be updated and refined to reflect the sensitive geological conditions in that part of Dakota County. The MDA has discussed the findings of the Hastings Study with major growers, seed companies, and cooperatives, including:
General Mills/Green Giant Agricultural Research (peas and sweet corn), Seneca Foods, Remington Seeds (Mycogen, seed corn), and Farmers Union Co-op.
These companies, in turn, make recommendations to farmers regarding fertilizer and pesticide quantities, timing, and methods. The prevalence of agricultural pesticides in Minnesota groundwater has become a significant issue for the MDA. In February 2002, Gene Hugoson, Commissioner of Agriculture, issued a “Notice of Determination of Common Detection for Atrazine, Metolachlor, and Metribuzin in Groundwater of Minnesota.” This notice means that detection of these active ingredients is the result of normal use, not a spill or other accident, and initiates the process of developing BMPs that are specific to each pesticide. The MDA will issue draft BMPs for these specific pesticides early in 2003. (The active pesticide ingredients, or their breakdown products, that were found in the Hastings Study were Atrazine, Metolachlor, Acetochlor, Alachlor, and Dimethenamid. All were at levels well below drinking water standards.) The MDA’s complete FANMAP report is included herein and is also available at http://www.mda.state.mn.us/appd/ace/fanmaphastings.pdf. Vermillion River The Study found that, within the City of Hastings, the Vermillion River leaks water into the underlying groundwater. Therefore, the water quality of the Vermillion has an impact on the City of Hastings’ drinking water quality. Staff from the Dakota County Environmental Management Department, MDH, Dakota County SWCD, and Metropolitan Council are continuing to monitor the quality of the river and the interactions between the river and the groundwater. Dakota County and Scott County have formed the Vermillion River Watershed Joint Powers Organization to replace the former Vermillion River Watershed Management Organization. In 2003, this new organization will draft a revised Watershed Management Plan and submit it to the Minnesota Board of Water and Soil Resources for approval. Metropolitan Council’s Environmental Services Division is proceeding with plans to expand the Empire Wastewater Treatment Plant and redirect the effluent from the Vermillion River in Empire Township to the Mississippi River in Rosemount. Removing the Empire effluent from the Vermillion should reduce nitrate levels in the river by 2 to 4 parts per million.
14

(Current levels in the Vermillion downstream of the Empire plant range from 4 to 9 parts per million.) Additional information about the Vermillion River Watershed Joint Powers Organization is available on-line at http://www.co.dakota.mn.us/planning/vermillionjpo/index.htm. Natural Areas Areas of permanent vegetation -- especially native grasses, shrubs and trees -- serve to protect groundwater from nitrate contamination in two ways. First, the groundwater below forests, grasslands, or pastures has been found to be lower in nitrate than the groundwater below row crops or developed areas. Water leaches more slowly through plants and their roots than it does through bare soil, which provides an opportunity for nitrate or other contaminants to be taken up by the plants or stick to the soil particles, rather than being carried down into the groundwater. Second, vegetated buffer strips that are at least 80 feet wide on each side of streams, rivers, or lakes significantly reduce the amount of nitrate, phosphorus, or pesticides that reach the surface water and then leak into the groundwater. In the November 2002 general election, Dakota County voters approved a bond referendum to raise $20 million for a new farmland and natural areas protection program in Dakota County. These funds will provide an incentive for property owners, on a voluntary basis, to establish and maintain natural areas and to continue to farm agricultural land rather than developing it. One of the selection criteria for this program will be drinking water protection. Additional information about Dakota County’s Farmland and Natural Areas program is included in Appendix H, and is also available on-line at http://www.co.dakota.mn.us/planning/fnap/Index.htm. Septic System Maintenance and Code Enforcement Virtually all households within the City of Hastings are connected to municipal water and sewer service, but residents of the surrounding townships rely on individual wells and septic systems. In order to determine if leaking septic systems were one source of nitrate in the groundwater, the Study analyzed a selection of wells for caffeine, as a tracer for household sewage. Of the wells tested for caffeine, 89% contained trace amounts, indicating that domestic sewage is having a widespread effect on drinking water supplies (although at very low levels). Several County programs are working to eliminate failing septic systems. State Rule requires septic system owners to have their systems pumped out at least every three years, and Metropolitan Council now requires local units of government to enforce this requirement. In 2000, Dakota County began administering a septic system maintenance program on behalf of the local governments. Since this program began, the number of households having their septic systems pumped out or inspected each year has increased 30% compared to previous years. In addition, when a property in Dakota County with a septic system is sold or otherwise transferred, or if additional bedrooms are added to a house, the septic system must be inspected and brought up to current code. Within the Study area, approximately 1,000 households rely on septic systems; of these, more than 800 have had their septic systems pumped out, inspected, or replaced within the past three years. http://www.co.dakota.mn.us/environ/septic_systems.htm. Well Regulation
15
The MDH regulates private well construction and sealing throughout the State, but will delegate their regulatory authority to local governments that meet certain standards. Dakota
County has had a Delegated Well Program since 1989, and the Nitrate Study found that wells constructed since the County established its Well Program had median nitrate results of zero, while wells constructed prior to 1989 had median nitrate results of 5.7 parts per million. An unsealed, unused well is a potential threat to the drinking water supply because it can provide a direct connection between contamination at the surface and the groundwater far below. As a result, a property owner with an unused well is required to have the well professionally sealed, register the well with the County (for a fee of $100 per year), or bring the well back into use. Well sealing is a high priority for both the County Well Program and for the MDH; approximately 300 wells are sealed in the County every year. http://www.co.dakota.mn.us/environ/wells.htm. Follow-Up Monitoring and Research Dakota County’s goals for monitoring and research are to: monitor nitrate levels in groundwater and surface water in areas upgradient from the
study area; characterize more confidently the groundwater flow patterns within the City of Hastings
between the Vermillion River and the Hastings buried bedrock valley; better understand the surface water/groundwater interactions throughout the Vermillion
River watershed; investigate the presence of pesticides and other agricultural chemicals in Dakota County
water resources; investigate the presence of organic wastewater components in Dakota County water
resources; and investigate effects of rapid urbanization on Dakota County water resources. The County has been conducting a multi-year Ambient Groundwater Study to monitor groundwater quality throughout the County on an ongoing basis. Nitrate has been one of the parameters measured by the Ambient Groundwater Study since it started in 1999, and other parameters such as agricultural pesticides have been added in response to the Hastings Area Nitrate Study. Regarding the Vermillion River, staff from the Dakota County Environmental Management Department and SWCD continue to monitor water quality and groundwater-surface water interactions along the river. Also, since the South Branch of the Vermillion River appears to contribute nitrate to the downstream reaches of the river, additional study of the South Branch Subwatershed is being planned for the future. In addition, the County is developing follow-up research in the upstream areas of the Vermillion River Watershed, to assess the effects of rapid urbanization on both the Vermillion River and the groundwater.
16

HASTINGS AREA NITRATE STUDY INTRODUCTION I. Nitrate in Groundwater – National Context Nitrate is a form of nitrogen that is found naturally, at low levels, in surface water bodies and in groundwater. Nitrate comes from plant decay, human or animal wastes, nitrogen fertilizers (anhydrous ammonia), and air pollution (automobile emissions). In natural environments, nitrate is converted to harmless forms of nitrogen such as proteins or atmospheric nitrogen. In environments affected by human activity, nitrate can accumulate to unhealthy levels. (“Nitrate” in this report refers to “nitrate nitrogen,” or concentrations of nitrite plus nitrate, expressed as equivalent masses of elemental nitrogen). Human Health Risks The human health risks associated with elevated nitrate in drinking water have been studied with results that are conclusive in some cases but less clear in others. A summary of epidemiological studies on the subject is included in Appendix A. As the author of this summary explains, nitrate itself does not pose a direct health risk, but once it is in a person’s body, it can be converted to nitrite and N-nitroso compounds (NOCs); “Infant exposure to nitrite has been linked to development of Methemoglobinemia (“blue baby” syndrome). NOCs are some of the strongest known carcinogens, can act systemically, and have been found to induce cancer in a variety of organs in more than 40 animal species including higher primates.” (Weyer, 2001) The Environmental Protection Agency’s (EPA) maximum contaminant level (MCL), and the MDH hazard risk limit (HRL), for nitrate in drinking water is 10 mg/L based on risk of “blue baby” syndrome. Other non-cancer health risks linked to high nitrate include hyperthyroidism, insulin-dependent diabetes (levels greater than 0.77 mg/L), birth defects (levels greater than 5 mg/L), spontaneous abortion (levels greater than 19 mg/L), and genetic damage (levels greater than 25 mg/L). A study of 22,000 women in Iowa found that women whose average drinking water nitrate exposure level was greater than 2.46 mg/L were nearly 3 times more likely to develop bladder cancer than women in the lowest nitrate exposure level (Weyer et al, 2001). While a 1993 study in Nebraska found a positive link between nitrate and non-Hodgkins lymphoma (nitrate levels greater than 4 mg/L), the Iowa study found no such link. However, the Iowa study linked nitrate with ovarian cancer, but earlier studies in Canada and Denmark did not find a link (Weyer, 2001). Animal Health Risks Elevated nitrate levels in the water can present a greater immediate risk to animal health than human health, because of differences in metabolism and diet. Livestock such as cows, sheep, or horses can be susceptible to acute or chronic nitrate poisoning at concentrations as low as 20 mg/L in their water supply, depending on the feed used and the age of the animals. (Hall et al, 2001) Ecological Risk Nitrate presents an ecological risk because it contributes to eutrophication of surface waters. When high levels of nutrients, such as nitrate or phosphorus, are in surface waters, algae in the water have a “population boom” that depletes the oxygen from the water. The “dead
17

zone” in the Gulf of Mexico is a massive case of eutrophication resulting from nitrate carried by the Mississippi River from the Upper Midwest to the Gulf (USGCRP Seminar, 1999). Nitrate as an Indicator for Other Contaminants Elevated nitrate levels in drinking water can be a leading indicator of other human impacts on the water supply. Sources of nitrate usually also generate other contaminants, and the toxicology of these other contaminants -- as endocrine disrupters, carcinogens, or other health risks – has not yet been well studied. Domestic sewage also includes bacteria; viruses; detergents and cleansers; antibiotics and other prescription medications; personal care products; and plasticizers. Waste from livestock operations includes bacteria, viruses, antibiotics, and feed supplements. The groundwater below row crop agriculture receives herbicides, insecticides, and fungicides in addition to excess nutrients such as nitrate. Nitrate has physical properties (it is highly soluble and tends to be conserved once it enters groundwater) that make it move at the same rate as the groundwater in which it flows, whereas other materials from the same sources may move more slowly than the water itself. Considering nitrate a general indicator of non-point-source pollution and considering the human health studies mentioned above raises two issues. Why would consuming nitrate in drinking water be associated with increased health risks when a diet high in nitrate-rich foods is healthy and associated with decreased risks? Some reports indicate that as much as 85% of a person’s daily consumption of nitrate comes from vegetables such as carrots or leafy greens like lettuce or spinach. Why would epidemiological studies conducted in different times and places come up with such different, sometimes contradictory, results? The emerging possibility is that “elevated nitrate” in a drinking water source does not just reflect a problem with a single chemical – nitrate – but with a complex and variable brew of chemicals for which toxicology (individually or in combination) is not yet available and detection by analytical methods is new and expensive. National Distribution of Nitrate in Water Supplies The United States Geological Survey’s National Ambient Water Quality Assessment Program (NAWQA) detected nitrate in 71 percent of groundwater samples across the country. Nitrate exceeded the MCL in more than 15 percent of groundwater samples from four of 33 major aquifers commonly used as source of drinking water (Nolan and Stoner, 2000). NAWQA developed a national map of nitrate contamination risk based on nitrogen inputs (nitrogen deposited on the land surface) and aquifer vulnerability (the likelihood that nitrate from a surface source would leach to the water table). In general, areas with the highest risk have high nitrogen input, well-drained soils, and less extensive forested areas relative to cropland. As can be seen on the map reproduced in Figure 1, the Corn Belt of the Upper Midwest is the country’s most extensive area of high nitrogen inputs (Nolan et al, 1998). Nationally, by land use and aquifer depth, NAWQA detected nitrate in: 81% of samples from shallow groundwater in agricultural areas, 74% of samples from shallow groundwater in urban areas, and 71% of samples from major aquifers. Within the Upper Mississippi River Basin study unit, NAWQA detected nitrate in 93% of samples from shallow groundwater in agricultural areas, 70% of samples from shallow groundwater in urban areas, and
18 76% of samples from major aquifers.

Within the Upper Mississippi River Basin study unit, nitrate exceeded 10 mg/L in 38% of the agricultural samples, less than 4 percent of the urban samples, and was virtually undetected in forested areas (Stark et al, 2000). Co-Detections of Nitrate with Pesticides NAWQA has extensively studied the prevalence of both nitrate and pesticides throughout the United States. However, detections of individual pesticide compounds have almost always been below drinking water standards. In addition, analytical methods that have lower detection limits and that detect pesticide breakdown products have become available only recently. These methods are expensive compared to analytical methods for nitrate. Because there are no standards or guidelines for combinations of pesticides or pesticide degrades, with nitrate or each other, NAWQA for the most part has not compared nitrate results from a given water source to low levels of pesticides. One exception is Central Columbia Plateau Study Unit in Washington and Idaho, where pesticides were present in more than one-half of the wells that contained elevated nitrate. The higher the nitrate concentration, the greater the percentage of wells with pesticides (Williamson et al, 1998). In Minnesota, two studies have compared nitrate with pesticide detections. Out of 31 wells in southeastern Minnesota completed in the Prairie du Chien and Jordan aquifers, the 20 wells with detectable herbicide had median nitrate concentrations of 5.9 mg/L, compared to 0.4 mg/L in the wells with no detectable herbicide (Walsh et al, 1993). In Cottage Grove, Minnesota, wells with detectable herbicide had a median nitrate concentration of 6.7 mg/L, compared to 0.5 mg/L in wells without detectable herbicide (MPCA, 2000). Hastings Area Nitrate Study The Hastings nitrate study was intended to quantify the occurrence of nitrate in the area’s public and private drinking water supplies, to determine the sources of the nitrate, to estimate the groundwater flow of nitrate-contaminated water, and to propose solutions to nitrate contamination. The main suspected sources were row crop agriculture, septic systems, and feedlots. A large number of wells were sampled for nitrate; from those wells, a representative number were also analyzed for low levels of pesticides and pesticide degradates (as a tracer for crop impacts) and for caffeine (as a tracer for septic system impacts).
19

II. Hastings Area Nitrate Study – Project Background Project Partners Dakota County, in partnership with the City of Hastings, the MDH, the MDA, the Dakota County SWCD, and the Metropolitan Council, conducted this CWP project to determine the cause and extent of nitrate contamination in the Jordan aquifer and Shakopee aquifer of the Prairie du Chien group in Hastings and the surrounding townships. The project also developed an implementation plan to reverse the trend in nitrate contamination and restore water quality through a combination of education, management practices, and other activities. County’s Role in Devising and Implementing the Program The study had five major areas of effort: 1) sampling private and public wells for nitrate and other indicator compounds; 2) conducting a Farm Nutrient Management Assessment Program (FANMAP); 3) installing and monitoring piezometers along the Vermillion River to understand the surface water/groundwater interactions within the study area; 4) modeling groundwater flows within the study area and conducting age-dating and other isotope analysis to calibrate the groundwater flow model; and 5) developing an implementation plan to reduce nitrate contamination. Dakota County staff identified the nitrate problem in the Hastings area; recruited state and local agencies to provide financial, technical, and logistical support for the project; and wrote the Clean Water Partnership grant proposal. County staff administered the project; supervised contractors; collected samples; managed, compiled and analyzed the data; modeled groundwater flows, wrote the Implementation Plan, interim, and final reports; and communicated the results to stakeholders. Contribution of Other Partners The MPCA administers the Clean Water Partnership grant program, which provided about 40% of the project funding. The MDA conducted the FANMAP on behalf of this study, in addition to providing equipment and staff to analyze nitrate samples. The MDH provided equipment and staff for sample analysis. The Metropolitan Council provided funding and its own surface water monitoring data for the study. The City of Hastings provided funding and logistical support. The SWCD completed the digital land cover map of the study area based on aerial photos and also provided surface water data. All project partners assisted with sample collection and provided technical assistance and peer review to the project. History of the waters of concern The City of Hastings and the residents of the surrounding Townships derive 100% of their drinking water from groundwater. Nitrate concentrations appear to be increasing toward unsafe levels in the Shakopee and Jordan aquifers, which are the sources for all the municipal wells and 63% of domestic wells in the study area. The City of Hastings started the siting process for a new municipal well in 1997, to help meet growing demand. Two test wells were drilled into the Jordan aquifer, and both wells showed levels of nitrate at approximately 8 mg/L. The city tested five private wells within the search area for the new municipal well and found elevated nitrate levels ranging from 12 to 16 mg/L. In May 1999, the MDH closed Hastings Municipal Well #6 for several weeks, after samples contained average nitrate concentrations of 10.5 mg/L.
20
Existing municipal wells in Hastings are also showing increasing levels of nitrates. Although nitrate levels are below the recommended HRLs, over the last ten years, the municipal wells

producing out of the Shakopee and Jordan aquifers have shown increases of 1 to 2 mg/L of nitrates (Figure 2). Why the project took place Local water managers and resource specialists are concerned about the increasing levels of nitrates being detected in deeper aquifers. The general public is anxious about the safety and quality of their drinking water, but their concerns are generally non-technical in nature. In May 1999, the MPCA conducted eight public sessions, “The Governor’s Forums: Citizens Speak Out on the Environment.” On a statewide basis, the participants in these forums chose the environment and education as the state’s most pressing public policy issues. In each of the regional forums, water quality issues ranked among citizens’ highest concerns. In a 1996 survey of Dakota County residents, 22% thought groundwater protection should be the County’s highest environmental priority, and 42% thought groundwater protection should be the first or second priority: groundwater protection received the most “votes” by far of any environmental issue. The same study indicated that the public’s specific understanding of concepts such as watersheds, wellhead protection, or groundwater flow tended to be vague. Consequently, the public may not be aware of the origins of their own drinking water or how agricultural practices, feedlots, or septic systems may be affecting their water supply. Those who will be most effected by groundwater protection programs may be reluctant to change; they may not willingly adopt practices and behaviors to reduce groundwater contamination unless it can be shown how their practices contribute to the problem. In 1999, Dakota County completed a five year Public Health Plan. To develop the plan, a Public Health Action Team identified 27 problem statements, ranked them based on public health priority, then submitted them to the Human Service Advisory Committee. The Human Service Advisory Committee identified potential health risks from consumption of contaminated groundwater as the number one emerging health problem in Dakota County. The Hastings Area Nitrate Study provides useful information to local government units (LGUs), the public, and other agencies. The study also provides strategies to address nitrate contamination in this area, and the City of Hastings will be able to apply the results of the study to its wellhead protection plans.
21
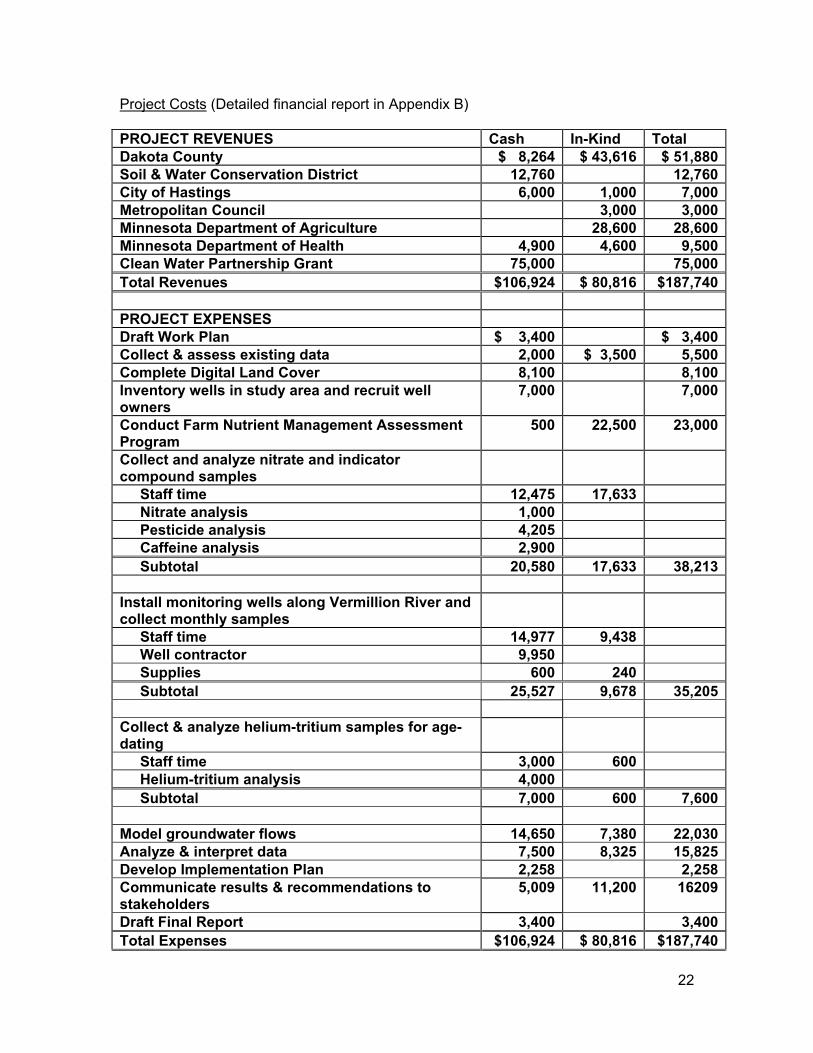
Project Costs (Detailed financial report in Appendix B) PROJECT REVENUES Cash In-Kind Total Dakota County $ 8,264 $ 43,616 $ 51,880Soil & Water Conservation District 12,760 12,760City of Hastings 6,000 1,000 7,000Metropolitan Council 3,000 3,000Minnesota Department of Agriculture 28,600 28,600Minnesota Department of Health 4,900 4,600 9,500Clean Water Partnership Grant 75,000 75,000Total Revenues $106,924 $ 80,816 $187,740 PROJECT EXPENSES Draft Work Plan $ 3,400 $ 3,400Collect & assess existing data 2,000 $ 3,500 5,500Complete Digital Land Cover 8,100 8,100Inventory wells in study area and recruit well owners
7,000 7,000
Conduct Farm Nutrient Management Assessment Program
500 22,500 23,000
Collect and analyze nitrate and indicator compound samples
Staff time 12,475 17,633 Nitrate analysis 1,000 Pesticide analysis 4,205 Caffeine analysis 2,900 Subtotal 20,580 17,633 38,213 Install monitoring wells along Vermillion River and collect monthly samples
Staff time 14,977 9,438 Well contractor 9,950 Supplies 600 240 Subtotal 25,527 9,678 35,205 Collect & analyze helium-tritium samples for age-dating
Staff time 3,000 600 Helium-tritium analysis 4,000 Subtotal 7,000 600 7,600 Model groundwater flows 14,650 7,380 22,030Analyze & interpret data 7,500 8,325 15,825Develop Implementation Plan 2,258 2,258Communicate results & recommendations to stakeholders
5,009 11,200 16209
Draft Final Report 3,400 3,400Total Expenses $106,924 $ 80,816 $187,740
22
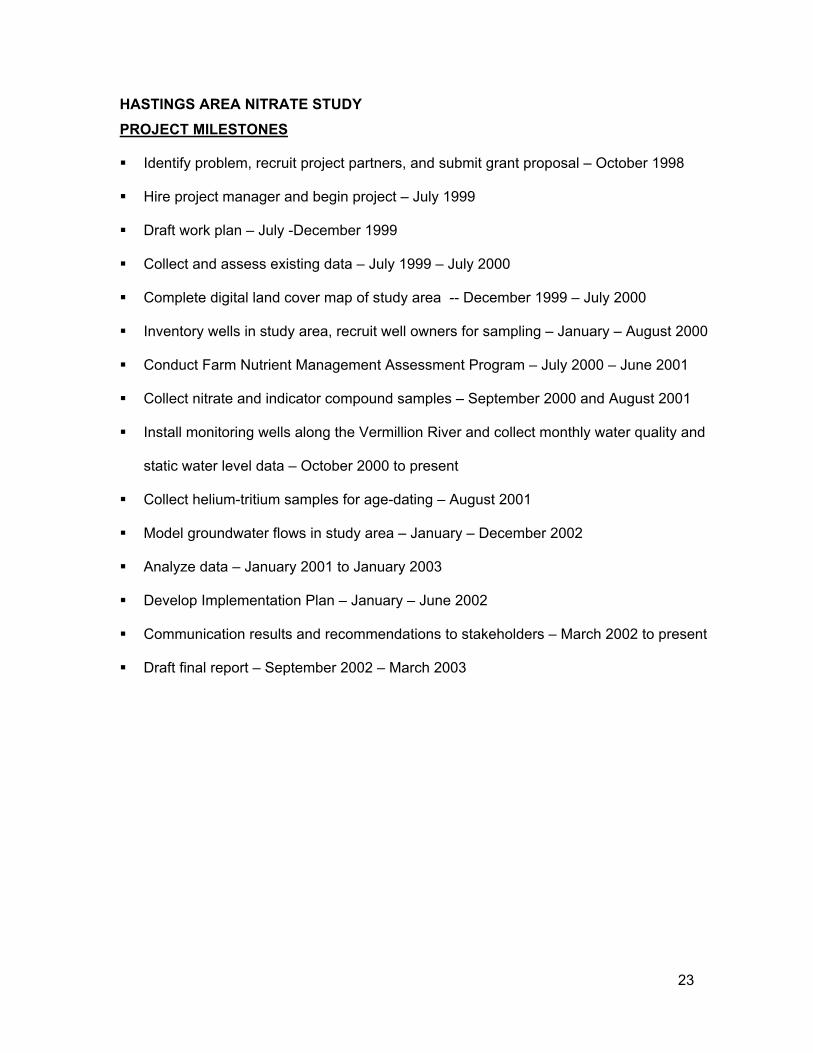
HASTINGS AREA NITRATE STUDY PROJECT MILESTONES Identify problem, recruit project partners, and submit grant proposal – October 1998
Hire project manager and begin project – July 1999
Draft work plan – July -December 1999
Collect and assess existing data – July 1999 – July 2000
Complete digital land cover map of study area -- December 1999 – July 2000
Inventory wells in study area, recruit well owners for sampling – January – August 2000
Conduct Farm Nutrient Management Assessment Program – July 2000 – June 2001
Collect nitrate and indicator compound samples – September 2000 and August 2001
Install monitoring wells along the Vermillion River and collect monthly water quality and
static water level data – October 2000 to present
Collect helium-tritium samples for age-dating – August 2001
Model groundwater flows in study area – January – December 2002
Analyze data – January 2001 to January 2003
Develop Implementation Plan – January – June 2002
Communication results and recommendations to stakeholders – March 2002 to present
Draft final report – September 2002 – March 2003
23

HASTINGS AREA NITRATE STUDY DIAGNOSTIC STUDY I. Description of Project Area Population and Land Use The City of Hastings is a historic Mississippi River town, about twenty miles downstream from St. Paul. As can be seen in the map in Figure 3 and Year 2000 digital orthophotos (Figure 4), Hastings is in the northeast corner of Dakota County, of which it is the county seat. The project area includes all of the cities of Hastings and Vermillion and portions of the surrounding townships: Marshan, Nininger, Ravenna, and Vermillion Townships. The City of Hastings had a population of 18,000 in the 2000 census, an 18% increase over 1990, and is expected to grow to 28,400 by the year 2020. The surrounding portions of the study area have approximately 2,000 residents. The surrounding townships are planning for a continued mix of agricultural and rural residential land use, with most of the rural residential growth expected to occur in Nininger and Ravenna Townships. Figures 5 and 6 show the existing land cover and zoning in the project area. Most of the land is used for row crop agriculture, but the area also contains urban uses within the City of Hastings and rural residential (2.5- to 10-acre plots) in the surrounding townships. The predominant crops are corn and soybeans, although in recent years increasing acreage has been planted with potatoes, peas, and sweet corn. Environmental concerns have been raised about potato farming, in particular, because of the extensive use of irrigation and agricultural chemicals on potatoes. Commercial horticulture is also an important component of the area’s agriculture. Overall, land use is expected to remain constant over the long term with the exception of the City of Hastings and Ravenna Township. It is expected that Hastings will be annexing additional land to keep pace with its anticipated growth and that Ravenna Township will continue to subdivide land into 2.5-10 acre parcels. Development in the City of Hastings is moving towards the west and southeast, while development in Ravenna Township is moving towards the northwest. Municipal Services As can be seen in Figure 7, most of the City of Hastings is served by municipal sewer and water, and it is anticipated that these services will expand moderately as the City grows. In addition, the City of Vermillion has municipal water supplies, but no sewer service. The rest of the study area is served by private drinking water wells and individual septic systems. The County estimates that the study area contains about 900 septic systems; 65% of these have been built, replaced, or maintained within the past three years; another 5% have been built, replaced, or maintained within the past three to ten years; 30% are older than ten years and have not been maintained. Geology and Soils Bedrock Geology (Dakota County Geologic Atlas) For reference, Appendix I shows the bedrock stratigraphic column representing southeastern Minnesota, including the Hastings study area (Runkel et al, 2003).
24

Within the study area, the bedrock geology consists of a thin layer of outwash on top of the Prairie du Chien group and Jordan sandstone, but the bedrock is criss-crossed by two notable features, as can be seen in Figure 8. The valley of an ancient precursor to the Mississippi River cuts through the Prairie du Chien and Jordan formations, crossing the area from the northwest to the southeast, so that the City of Hastings sits on three bedrock “islands.” As Figure 9 shows, the buried valley has depths-to-bedrock of more than 500 feet, compared to less than 50 feet in the areas outside the buried valley. However, the buried valley is filled with later glacial outwash, so it is not visible to the casual observer. The Empire Fault of the Mid-Continental Rift System cuts across the area from the southwest to the northeast. The bedrock north of the Empire Fault is about 100 feet higher than the bedrock south of the Empire Fault. Dolostone of the Shakopee formation forms the upper two thirds to half of the Prairie du Chien group. The lower part, the Oneota Dolomite, acts as an aquitard. Much of the Prairie du Chien is karst throughout the study area, especially near the river within the City of Hastings. The evidence of karst includes reports of sinkholes (Figure 13), the presence of major fractures in the limestone, and the presence of running water in small cave systems. Quaternary/Surficial Geology (Dakota County Geologic Atlas) The quaternary geology of the Hastings area is shown in Figure 10, overlaying the bedrock geology. The oldest glaciers of which there is evidence within the study area originated in the Keewatin ice center to the northwest; they advanced and receded during the pre-Wisconsinan period, leaving “Old Gray” tills on top of the northernmost of the bedrock “islands” in what is now Nininger Township and western Hastings. After a long period of weathering and erosion, the Labradorean Superior lobe advanced from the northeast into Dakota County during the Illinoian glaciation, depositing reddish till and sediments of the River Falls formation, some of which remains near the surface in Nininger Township and Hastings. The Superior lobe advanced to cover much of Dakota County during the late Wisconsinan period, retreated, then advanced to an equilibrium position where melting of the ice front kept pace with the flow of ice, to building the extensive St. Croix moraine, the southern tip of which covered northern Dakota County. Layers of outwash from the St. Croix moraine formed the Rosemount outwash plain, which buried the bedrock valley in the eastern part of the County. Later, the Des Moines lobe of Keewatin ice advanced from the northwest, reaching its equilibrium point in western Dakota County. As it melted, the meltwater cut into the Superior lobe sediment and lay down new layers of outwash, forming the modern valley of the Vermillion River in the center of the County and the Rich Valley, through the Rosemount outwash plain, further north. These two streams of Des Moines outwash met and completed the filling of the bedrock valley in the Hastings area, covering most of the southern bedrock “island,” about half of the middle “island”, but little of the northernmost “island.” Soils (Dakota County Soil Survey) The area has fertile, well-drained to excessively-drained soils formed in sandy, loamy, or silty sediments on outwash plains and stream terraces (Figure 11). Sands and sandy loams have high leaching potential. Soils in the area are fertile, coarsely textured, and heavily irrigated. Most of the farmland supports a corn and soybean rotation, but potatoes, peas, and sweet corn are also grown. Irrigation improves the productivity of excessively drained soils, but accelerates the transport of contaminants from the surface to the groundwater.
25

Groundwater Resources The Jordan aquifer is the principal source of drinking water for both private wells and the City of Hastings municipal wells. (Dakota County has the delegated authority to regulate private drinking water wells in the County. In that capacity, the County has established a policy separating the Jordan and the Shakopee formation of the Prairie du Chien because of the presence of the Oneota formation between the two, as an aquitard, and because of significant differences between the two in terms of water chemistry and quality.) The shallow sand and gravel aquifer is the source for many private drinking water wells, especially within the buried bedrock valley area. The Shakopee is a less-used source for drinking water; in much of the study area, regulations do not allow new wells to be completed in the Shakopee aquifer because the Prairie du Chien lacks a confining layer or a thick enough layer of unconsolidated material above it. The material above the Prairie du Chien tends to be both shallow and highly permeable, making it susceptible to contamination, as shown in Figure 12. Some newer wells are being finished in the deep Franconia aquifer. Vermillion River The Vermillion River, which drains much of Dakota County, crosses the study area from the southwest to the northeast, flowing over the Vermillion Falls within the City of Hastings and then into the Mississippi (Figure 13). The river follows the path of the Empire Fault for much of its course, crossing over the buried bedrock valley (Figure 8) but bends southward of the Fault where the Quaternary geology changes as it enters the City of Hastings (Figure 10). According to the Dakota County Groundwater Model, the general direction of groundwater flow in the area is parallel to the flow of the Vermillion. In 1990 and 1991, the USGS conducted a study to explore the relationship between the hydrology and the water quality in the Vermillion River watershed (Almendinger and Mitton, 1995). This study showed a reduction of stream flow east of the City of Vermillion, indicating that surface water was discharging into the surficial and bedrock formations in this area. The USGS study also concluded that there might be a relationship between groundwater quality and water quality in the Vermillion River.
26

II. Water Quality Monitoring: Methods and Results Quality Assurance and Quality Control Procedures for data collection and analysis were evaluated to ensure that data quality objectives for representativeness, comparability, completeness, accuracy, and precision were met. Procedures for data collection included:
1) Communicating project goals and objectives to project personnel. 2) Communicating project organization and delegated responsibilities to project
personnel. 3) Adherence to sampling procedures. 4) Adherence to sample transportation and custody procedures. 5) Selection of qualified independent laboratories that adhered to analytical methods
procedures. 6) Adherence to data analysis, validation, transfer, and reporting procedures. 7) Adherence to proper procedures for assessing data precision, accuracy,
representativeness, comparability, and completeness. Quality Control Procedures
1) Representativeness: each collected sample was determined to be representative of its derived milieu: a. Site selection procedure used pre-identified, documentable, logical criteria. b. Site descriptions included specific coordinates for identification including GPS,
measured distances, and descriptive documentation. c. Sampling conditions were noted, including physical descriptions.
2) Comparability: sampling and testing was evaluated to assure comparability of data
(formatting, reporting units, and expression or results).
3) Completeness: quality of data was evaluated to support sampling and testing plans.
4) Accuracy Assessment: methods by which reported values are comparable to “true value”. a. Qualified independent laboratories were selected for water sample analysis. b. Standards used were NIST, USEPA, or other primary standards. c. Sampling tracking system was maintained. d. Data traceability allows reconstruction from field records through data storage
and retrieval. e. Methodology included strict adherence to approved standard operating
procedures.
5) Precision Assessment: the reproducibility of the measurement process. a. Replicate sampling was performed and replicates tested. b. Duplicate samples were analyzed. c. Inter-laboratory Testing was used when replicate samples were taken of wells
with anomalous results. d. Instrument checks were performed to determine that variables were within
acceptable levels. 6) Standards and Sample Analysis: procedures to insure that results are valid.
27 a. Use of standard curve calibration, and corrective formulas where necessary.

b. When sample results fell outside calibration standards range, samples were diluted and reanalyzed.
Data Management, Statistical and Spatial Analysis Data collected were entered in Microsoft Excel and Access and double-checked for transcription errors. Statistical analyses were completed using SPSS and Statistix software. Dakota County Geographic Information Systems resources (ArcView 3.2 files and other geo-coded databases) that were utilized in this project include the following: Dakota County Well and Water Management System (WELLMAN), a data management system for well records in Dakota County that includes construction and geologic data, such as depth, static water level, year constructed, aquifer, well contractor, and other construction details. The County is in the process of refining its well location data and has surveyed approximately 6% of the wells in the County using its Global Positioning System equipment. Real estate parcel data, including owner, parcel size, and zoning. County septic system inventory, which includes age of system and date of last
maintenance. Dakota County Geologic Atlas (in digital format), created by the Minnesota Geological
Survey, which includes bedrock geology, surficial geography, water table, and groundwater sensitivity to pollution.
Digital Land Cover Map, created by the Dakota County SWCD. Aerial photographs taken in 2000 were interpreted according to the Minnesota Land Cover Classification System. The Dakota County Land Cover Inventory is documented according to Minnesota Geographic Metadata Guidelines. Quality Control/Accuracy for Interpretation: verified where possible with supporting GIS data layers (CBS, NWI, Hydric Soils, etc.), field verified individual polygons where possible from roads/public access - all field verified polygons are populated with a field check level from 1-4: 1 - walked, 2 - partially walked, 3 - viewed from edge, 4 - viewed from distance. Database Entry: Checked for completeness against delineated source maps. Queried in Arcview and ArcInfo to insure all classification codes were valid, manually entered associated attribute fields were populated and valid, and all automatically entered associated attribute fields (via AML routine) were populated and valid. Polygon Boundaries/Codes: Plotted polygon boundaries and classification codes on current DOQQ's and spot-checked for completeness and/or discrepancies. Data updated to 2000 DOQQ's for all cities and Townships. Digital soil maps. Digital maps of surface water features.
28

Nitrate Sampling Methods In September 2000, 20 representatives of Dakota County and its HANS partners sampled 146 domestic wells, plus five City of Hastings municipal supply wells. To identify domestic wells for sampling, the Dakota County Well and Water Management System (WELLMAN) (adapted from the County Well Index, Wahl and Tipping, 1991) and Parcel Query database were searched for wells for which the County had construction and geologic data, such as depth, static water level, year constructed, aquifer, and construction details. WELLMAN has records for very few wells constructed prior to 1974, but the study area has been settled for 150 years (and is home to a number of “Century Farms” that have been farmed by the same family for at least one hundred years). Therefore, the wells sampled may generally be younger than the total population of wells in the area. Well owners were contacted beforehand for permission to sample and were notified by letter of their results after the sample analysis was completed. While the representatives were sampling, they drew sketches estimating the locations and separations of wells, septic systems, and structures at each site where such features could be seen. All wells had samples, taken after the faucet had been run for 15 minutes, which were analyzed for nitrate; these are the nitrate results discussed in detail below. In addition, twenty percent (29) of the 151 wells were selected for other analyses, including a time-series comparison of the number of minutes the faucet was run (5, 10, 15, and 20 minutes) before the sample was taken. Samples from this subset of wells were also analyzed for caffeine and pesticides. The 29 wells were selected to be representative of the study area’s aquifers, well depths, and geographic (horizontal) locations. Descriptive Statistics The samples were analyzed for nitrate (as nitrogen) using a Hach DR 4000 photospectrometer, calibrated with 1.0 mg/L, 3.0 mg/L, and 7.0 mg/L standards to ± 0.5 mg/L accuracy. (Accuracy as stated as high as 10.4 mg/L. Samples with initial results of 10.4 mg/L or higher were diluted by a factor of ten and re-analyzed. Ten percent of samples were saved as duplicates, refrigerated, and analyzed by a different MDA lab. ) Complete nitrate results are reported in Appendix C. (To ensure the confidentiality of individual well results, an alias was assigned to each well for reporting purposes.) Of the 151 samples analyzed (from the 15-minute sampling interval), nitrate results ranged from zero to 40.0 mg/L. The median result was 3.70 mg/L; the mean 6.31 mg/L; and the standard deviation was 7.66. The results were skewed and not normally distributed (Shapiro-Wilk W = 0.8135, p <0.0001). Table 1 and Figures 14 and 15 show the results.
29

Table 1: Nitrate levels by classification (MDH, 1998): Nitrate Level (mg/L) Count PercentageNon-detect (0.0) 51 34%Background (>0 and < 1.0) 10 7%Transitional (>= 1.0 and < 3.0)
11 7%
Elevated (>= 3.0 and < 10.0)
40 26%
Exceeds standards (>= 10.0 mg/L)
39 26%
Total 151 100% Time Series Analysis The samplers took samples at 5-, 10-, 15-, and 20-minute intervals from 29 of the wells. The nitrate results from the 29 wells in the multi-analysis subset were representative of those found in the full sample set. (Means, medians, and variances were not found to be unequal.) The amount of time the faucet had been run was not found to make a difference in the nitrate results for each well (Friedman’s ANOVA (rank sum) Χ2
r = 1.1304, p = 0.7697). Aquifer As shown in Table 2 below, the results were significantly different between wells completed in unconsolidated materials, the Shakopee, and Jordan aquifers (Kruskal-Wallis H = 31.72, p = 0.0000), but the highest results were from the Shakopee. The buried bedrock valley in the study area complicates the relationship between the aquifer in which a well was completed and the depth of the well. Because of the depth of unconsolidated material in the buried bedrock valley, the deepest Quaternary wells in the study area are deeper than the shallowest Jordan wells. Table 2: Nitrate Results by Aquifer
AQUIFER Number of Wells
Nitrate Results: Range
Nitrate Results: Median
Depth of well (feet
bgs): Range
Total Depth of Well (feet
bgs): Median
Quaternary 34 0.0-29.0 mg/L
8.7 mg/L 125-340 178.5
Shakopee 13 0.0-40.0 mg/L
15.0 mg/L 125-321 200
Jordan 88 0.0-26.0 mg/L
1.85 mg/L 180-500 320
Risk Factors for High Nitrate The major risk factors significantly associated with high nitrate results are the depth of the well (Spearman’s rho = -0.4727, p = 0.0000), the age of the well (Spearman’s rho = -0.4312, p = 0.0000), and the type of soil in which it is located (Kruskal-Wallis H = 4.3297, p = 0.0375). It should be noted that well depth and age are cross-correlated; newer wells are also deeper wells.
30
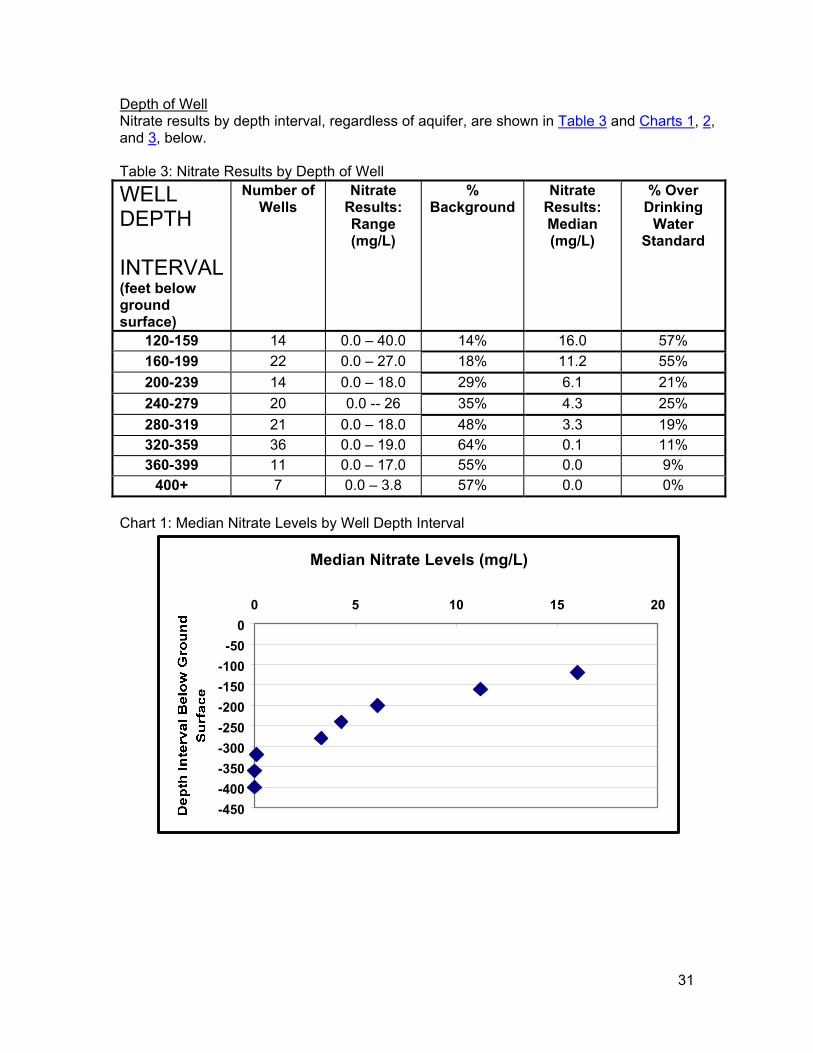
Depth of Well Nitrate results by depth interval, regardless of aquifer, are shown in Table 3 and Charts 1, 2, and 3, below. Table 3: Nitrate Results by Depth of Well
WELL DEPTH INTERVAL (feet below ground surface)
Number of Wells
Nitrate Results: Range (mg/L)
% Background
Nitrate Results: Median (mg/L)
% Over Drinking
Water Standard
120-159 14 0.0 – 40.0 14% 16.0 57% 160-199 22 0.0 – 27.0 18% 11.2 55% 200-239 14 0.0 – 18.0 29% 6.1 21% 240-279 20 0.0 -- 26 35% 4.3 25% 280-319 21 0.0 – 18.0 48% 3.3 19% 320-359 36 0.0 – 19.0 64% 0.1 11% 360-399 11 0.0 – 17.0 55% 0.0 9%
400+ 7 0.0 – 3.8 57% 0.0 0% Chart 1: Median Nitrate Levels by Well Depth Interval
Median Nitrate Levels (mg/L)
-450-400-350-300-250-200-150-100-50
00 5 10 15 20
31

Chart 2: Nitrate over Drinking Water Standards by Well Depth Interval
Wells with Nitrate over 10 ppm
-440-400-360-320-280-240-200-160-120-80-40
00% 10% 20% 30% 40% 50% 60%
Chart 3: Nitrate at Background Level by Well Depth Interval
Wells with Nitrate at Background Levels
-440-400-360-320-280-240-200-160-120-80-40
00% 10% 20% 30% 40% 50% 60% 70%
Soil Type Using ArcView GIS 3.2, the nitrate results per well were compared to the soil survey description of the soils in which the well had been constructed. The median nitrate result for wells in areas of loam or clay loam was 2.05 mg/L, while the median result in areas of sand or sandy loam was 4.65 mg/L. The soil type serves to explain apparent clusters of high nitrate. Figure 16 shows nitrate results overlaying soil types, with two areas of high nitrate delineated. Closer examination of these areas shows that variations in soil type over short distances are associated with variations in nitrate results; i.e., that relatively small areas of sand or sandy loam soils have higher nitrate than neighboring areas with higher clay content in their soils.
32
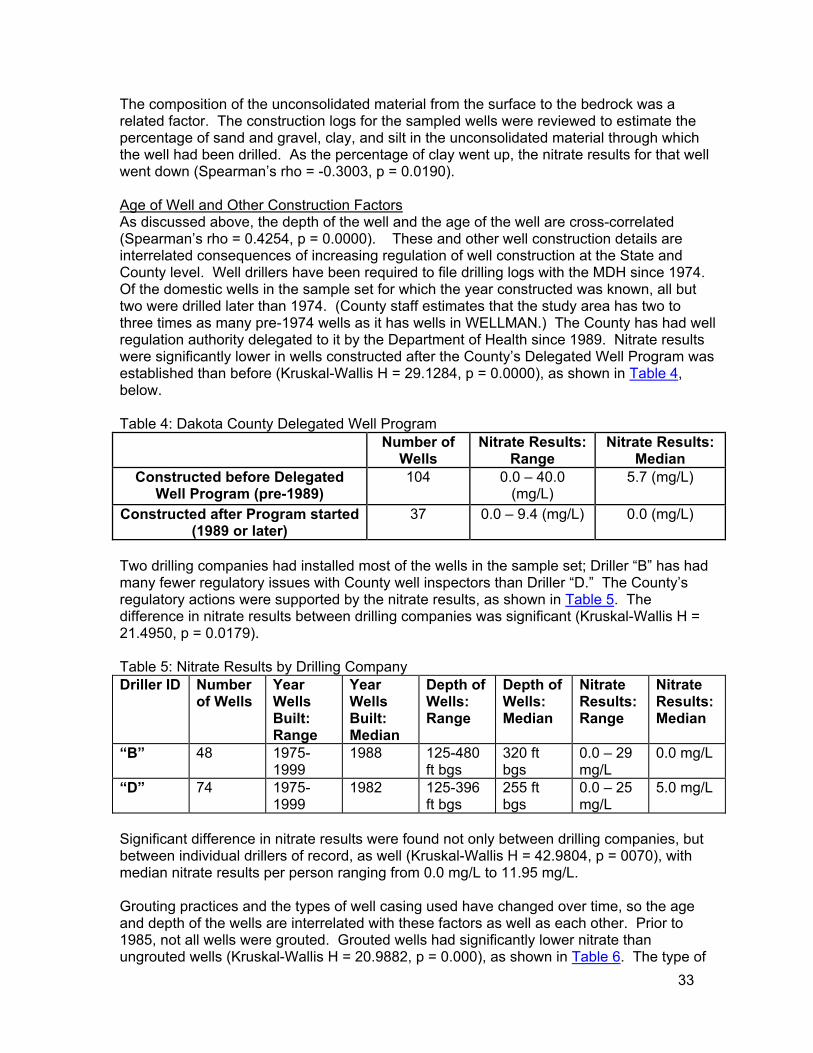
The composition of the unconsolidated material from the surface to the bedrock was a related factor. The construction logs for the sampled wells were reviewed to estimate the percentage of sand and gravel, clay, and silt in the unconsolidated material through which the well had been drilled. As the percentage of clay went up, the nitrate results for that well went down (Spearman’s rho = -0.3003, p = 0.0190). Age of Well and Other Construction Factors As discussed above, the depth of the well and the age of the well are cross-correlated (Spearman’s rho = 0.4254, p = 0.0000). These and other well construction details are interrelated consequences of increasing regulation of well construction at the State and County level. Well drillers have been required to file drilling logs with the MDH since 1974. Of the domestic wells in the sample set for which the year constructed was known, all but two were drilled later than 1974. (County staff estimates that the study area has two to three times as many pre-1974 wells as it has wells in WELLMAN.) The County has had well regulation authority delegated to it by the Department of Health since 1989. Nitrate results were significantly lower in wells constructed after the County’s Delegated Well Program was established than before (Kruskal-Wallis H = 29.1284, p = 0.0000), as shown in Table 4, below. Table 4: Dakota County Delegated Well Program Number of
Wells Nitrate Results:
Range Nitrate Results:
Median Constructed before Delegated
Well Program (pre-1989) 104 0.0 – 40.0
(mg/L) 5.7 (mg/L)
Constructed after Program started (1989 or later)
37 0.0 – 9.4 (mg/L) 0.0 (mg/L)
Two drilling companies had installed most of the wells in the sample set; Driller “B” has had many fewer regulatory issues with County well inspectors than Driller “D.” The County’s regulatory actions were supported by the nitrate results, as shown in Table 5. The difference in nitrate results between drilling companies was significant (Kruskal-Wallis H = 21.4950, p = 0.0179). Table 5: Nitrate Results by Drilling Company Driller ID Number
of Wells Year Wells Built: Range
Year Wells Built: Median
Depth of Wells: Range
Depth of Wells: Median
Nitrate Results: Range
Nitrate Results: Median
“B” 48 1975-1999
1988 125-480 ft bgs
320 ft bgs
0.0 – 29 mg/L
0.0 mg/L
“D” 74 1975-1999
1982 125-396 ft bgs
255 ft bgs
0.0 – 25 mg/L
5.0 mg/L
Significant difference in nitrate results were found not only between drilling companies, but between individual drillers of record, as well (Kruskal-Wallis H = 42.9804, p = 0070), with median nitrate results per person ranging from 0.0 mg/L to 11.95 mg/L. Grouting practices and the types of well casing used have changed over time, so the age and depth of the wells are interrelated with these factors as well as each other. Prior to 1985, not all wells were grouted. Grouted wells had significantly lower nitrate than ungrouted wells (Kruskal-Wallis H = 20.9882, p = 0.000), as shown in Table 6. The type of
33

grout used (neat cement vs. bentonite) did not produce significantly different results (Kruskal-Wallis H = 3.3369, p = 0.1885). Some well regulators have expressed concern about the effectiveness of high-solids bentonite, because of the difficulty of installing it correctly. Only two wells in the sample set were grouted with high-solids bentonite, so significant conclusions cannot be drawn, but the wells, which were both drilled in 1999, had nitrate results of 9.4 mg/L and 5.5 mg/L. Grouting practices and types of well casing are interrelated with the age and depth of wells. Table 6: Nitrate Results by Use of Grout Number of
Wells Year Wells Built: Range
Year Wells Built: Median
Nitrate Results: Range
Nitrate Results: Median
Grouted Wells
111 1972-1999 1985 0.0 – 29 mg/L
1.1 mg/L
Ungrouted Wells
19 1975-1985 1976 0.0 – 25 mg/L
15.0 mg/L
Most drillers stopped using threaded steel casing by 1980, welding the casing together, instead. However, the sample set did include one threaded casing well constructed in 1984 and one in 1999, in addition to older wells with threaded casing. Welded steel casing produced significantly lower nitrate results than threaded casing (Kruskal-Wallis H = 16.6336, p = 0.0000), as shown in Table 7. (The well constructed in 1999 with threaded casing was also the well with high-solids bentonite grout that had nitrate results of 5.5 mg/L.) Table 7: Nitrate Results by Casing Type Number of
Wells Year Wells Built: Range
Year Wells Built: Median
Nitrate Results: Range
Nitrate Results: Median
Welded Steel Casing
97 1975-1999 1986 0.0 – 29 mg/L
0.7 mg/L
Threaded Steel Casing
26 1975-1999 1976 0.0 – 25 mg/L
13.0 mg/L
34
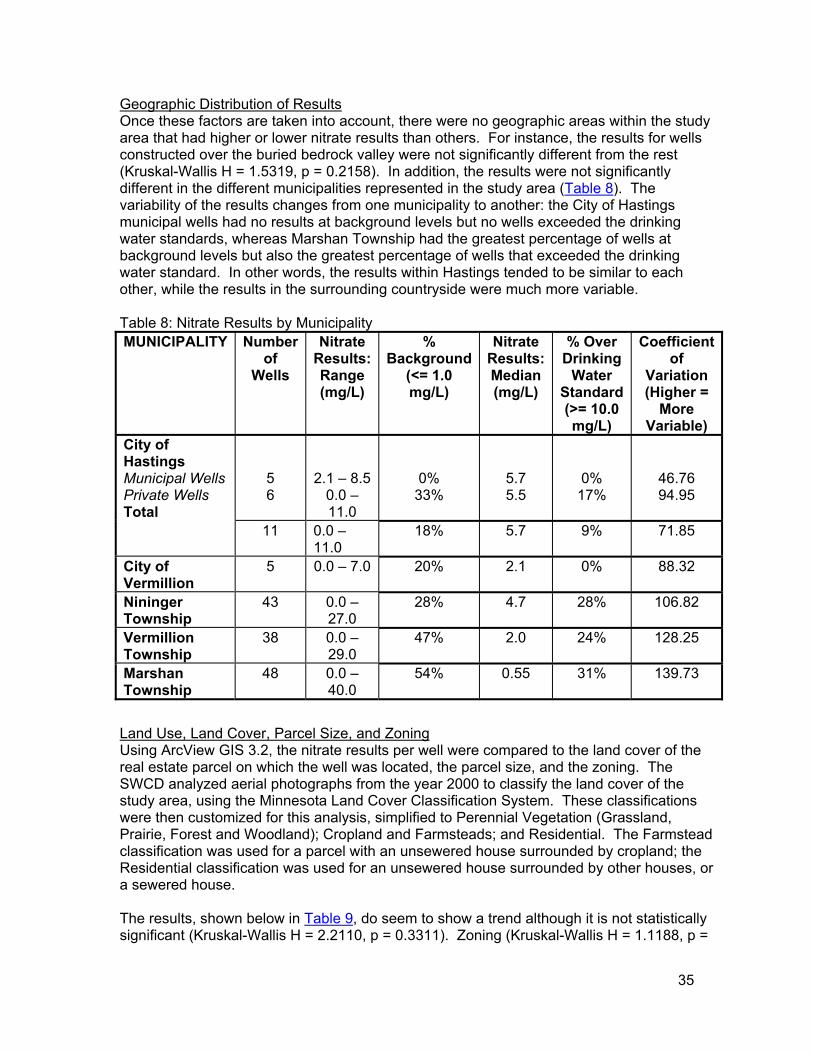
Geographic Distribution of Results Once these factors are taken into account, there were no geographic areas within the study area that had higher or lower nitrate results than others. For instance, the results for wells constructed over the buried bedrock valley were not significantly different from the rest (Kruskal-Wallis H = 1.5319, p = 0.2158). In addition, the results were not significantly different in the different municipalities represented in the study area (Table 8). The variability of the results changes from one municipality to another: the City of Hastings municipal wells had no results at background levels but no wells exceeded the drinking water standards, whereas Marshan Township had the greatest percentage of wells at background levels but also the greatest percentage of wells that exceeded the drinking water standard. In other words, the results within Hastings tended to be similar to each other, while the results in the surrounding countryside were much more variable. Table 8: Nitrate Results by Municipality MUNICIPALITY Number
of Wells
Nitrate Results: Range (mg/L)
% Background
(<= 1.0 mg/L)
Nitrate Results: Median (mg/L)
% Over Drinking
Water Standard (>= 10.0 mg/L)
Coefficient of
Variation (Higher =
More Variable)
5 6
2.1 – 8.50.0 – 11.0
0% 33%
5.7 5.5
0% 17%
46.76 94.95
City of Hastings Municipal Wells Private Wells Total
11 0.0 – 11.0
18% 5.7 9% 71.85
City of Vermillion
5 0.0 – 7.0 20% 2.1 0% 88.32
Nininger Township
43 0.0 – 27.0
28% 4.7 28% 106.82
Vermillion Township
38 0.0 – 29.0
47% 2.0 24% 128.25
Marshan Township
48 0.0 – 40.0
54% 0.55 31% 139.73
Land Use, Land Cover, Parcel Size, and Zoning Using ArcView GIS 3.2, the nitrate results per well were compared to the land cover of the real estate parcel on which the well was located, the parcel size, and the zoning. The SWCD analyzed aerial photographs from the year 2000 to classify the land cover of the study area, using the Minnesota Land Cover Classification System. These classifications were then customized for this analysis, simplified to Perennial Vegetation (Grassland, Prairie, Forest and Woodland); Cropland and Farmsteads; and Residential. The Farmstead classification was used for a parcel with an unsewered house surrounded by cropland; the Residential classification was used for an unsewered house surrounded by other houses, or a sewered house. The results, shown below in Table 9, do seem to show a trend although it is not statistically significant (Kruskal-Wallis H = 2.2110, p = 0.3311). Zoning (Kruskal-Wallis H = 1.1188, p =
35

0.7725) and parcel size (Spearman’s rho = -0.062, p = 0.4581) were also not significantly correlated with nitrate results. Table 9: Nitrate Results and Land Use
Land Use Number of Wells
Nitrate Results: Range
Nitrate Results: Median
Perennial Vegetation 23 0.0 – 20.0 (mg/L)
0.10 (mg/L)
Cropland or Farmstead 63 0.0 – 40.0 (mg/L)
3.3 (mg/L)
Residential 56 0.0 – 27.0 (mg/L)
4.0 (mg/L)
Caffeine The 29 wells selected for the time-series comparison of nitrate results were also analyzed for caffeine (as a tracer for domestic wastewater) and pesticides (as a tracer for row crop agricultural impacts). Medallion Laboratories analyzed the samples for caffeine using a proprietary HPLC analytical method with a detection limit of 0.001 mg/kg. Complete results are report in Appendix D. Low levels of caffeine were detected in 26 of the 29 samples (90%), with concentrations ranging from 0.001 mg/kg to 0.051 mg/kg. The median result was 0.005 mg/kg; the mean 0.007 mg/kg; and the results were not normally distributed (Shapiro-Wilk W = 0.5114, p < 0.0001). The caffeine results were not significantly correlated with the nitrate results (Spearman’s rho = -0.3311, p = 0.799); however, they were significantly correlated with the age of the well (Spearman’s rho = 0.4770, p = 0.0126). Caffeine results were not significantly correlated with the aquifer of the well (Kruskal-Wallis H = 0.8670, p = 0.8334), the depth of the well (Spearman’s rho = 0.2913, p = 0.1319), or the soil type (Kruskal-Wallis H = 3.1746, p = 0.0748). Neither the caffeine results (Spearman’s rho = 0.1309, p = 0.5768) nor the nitrate results (Spearman’s rho = -0.0644, p = 0.4539) were correlated with the estimated distance between the well and the septic system. Pesticides First Sampling Event Minnesota Valley Testing Laboratories analyzed the samples for MDA List 1 pesticides (reference method U.S. E.P.A. SW 846-8081-8141A-3510), with detection limits from 0.2-0.5 µg/L. The MDA List 1 includes the pesticides most commonly used in the corn-soybean crop rotation in Minnesota. Also, the pesticides found most frequently in groundwater in the USGS NAWQA program (atrazine, deethylatrazine, simazine, metolachlor, and prometon) (Kolpin et al, 1998) are included in MDA List 1. From this initial sampling, a single sample contained a detectable quantity of atrazine (0.5 mg/L). Second Sampling Event In August 2001, in order to analyze the groundwater for pesticides and pesticide metabolites at lower detection limits (0.05 µg/L compared to 0.5 µg/L) and to be able to compare the Hastings results with MPCA’s similar study in Cottage Grove, Dakota County staff re-sampled 27 of the wells above, plus three additional wells. (The wells were re-sampled for nitrate at the same time; the 2001 results were not significantly different from the 2000 results; t = -0.22, p = 0.8279.) The USGS Organic Geochemistry Research Laboratory
36
analyzed the samples for low levels of pesticides using GC/MS and pesticide breakdown products using HPLC/MS, with a detection limit of 0.05 µg/L. Complete results are reported in Appendix E. As summarized in Tables 10, 11, and 12: Pesticides or their degradates were detected in 22 (73%) of the wells; 20 wells (67%) had multiple pesticides detected. None of the pesticides detected exceeded current drinking water standards. The most frequently detected compounds were alachlor and alachlor degradates (16
wells, or 53%) and metolachlor and metolachlor degradates (16 wells, 53%). Atrazine and atrazine degradates were detected in 12 wells (40%). Acetochlor was introduced to the market in 1994; acetochlor or acetochlor breakdown
products were detected in 8 wells (27%); Dimethenamid was introduced in 1993, and a dimethenamid breakdown product was
detected in one well.
37

Table 10: Summary of Pesticide Results Number Overall
Median (µg/L)
Median Where Detected (µg/L)
Maximum (µg/L)
HRL/HBV (Parent) (µg/L)
MCL (µg/L)
Toxic Endpoint
Total wells sampled 30 Wells where pesticide detected
22 (73%)
Wells with no detections
8 (27%)
Wells with multiple detections
20 (67%)
Number of parent compounds in wells with detections
0 3
Number of degradates in wells with detections
1 7
Acetochlor 0 -- -- -- 10 (HBV) Cardio-vascular/ Blood; Liver
Acetochlor ESA 8 (27%)
<0.05 1.30 4.04 --
Acetochlor OXA 1 (3%)
<0.05 0.21 0.21
Alachlor 1 (3%)
<0.05 0.35 0.35 4 (HRL) -- Cancer
Alachlor ESA 14 (47%)
<0.05 1.74 8.62 100 (HBV)
--
Alachlor OXA 6 (20%)
<0.05 0.08 0.53
Atrazine 10 (33%)
<0.05 0.08 0.54 20 (HRL) 3 Cancer
Deethylatrazine 11 (37%)
<0.05 0.09 0.37
Deisopropylatrazine 5 (17%)
<0.05 0.06 0.12
Metolachlor 1 (3%)
<0.05 0.11 0.11 100 (HRL)
-- Repro-ductive
Metolachlor ESA 16 (53%)
<0.05 0.6 4.30
Metolachlor OXA 13 (43%)
<0.05 0.44 3.00
Dimethenamid 0 -- -- -- 40 (HBV) -- Liver Dimethenamid ESA 1
(3%) <0.05 0.11 0.11
38

Table 11: Sum of Pesticide Parent Compounds and Degradates Compounds
Brand Names
Year Introduced
Number of Detections
Median Sum of
Parent and Degradates
(µg/L)
Maximum Sum of
Parent and Degradates
(µg/L)
Median Nitrate Result
(mg/L) in wells in which
Compound detected
Acetochlor and/or Degradates
Acenit, Guardian, Harness, Harness
20G, Harness
Xtra, Relay, Sacemid, Surpass
100, Top Hand,
Trophy, Winner
1994 8(27%)
1.295 4.25 8.3
Alachlor and/or Degradates
Arena, Confidence,
Cropstar, Judge, Lasso,
Partner, Stall
1969 16(53%)
1.52 9.50 9.8
Atrazine and/or Degradates
Atrazine 4L, Atrazine 90
WDG, Aatrex,
Basis Gold, Extrazine II
DF, Harness
Xtra, Laddok S-
12, Marksman,
Surpass 100
1956 12(40%)
0.17 0.98 14.0
Metolachlor and/or Degradates
Dual II Magnum,
Dual II Magnum SI
1976 16(53%)
0.87 7.41 10.3
Dimethenamid and/or Degradates
Frontier 1993 1(3%)
0.11 0.11 14
39

Table 12: Co-detections of Pesticides: Number and Percentage of Wells with One Compound Detected Which Also Another
Number of Wells in which
Compound detected
Acetochlor and/or
degradates Alachlor and/or
Degradates Atrazine and/or
degradates
Metolachlor and/or
degradates
Dimethenamid and/or
degradates Acetochlor and/or degradates 8 2 (25%) 3 (38%) 7 (88%) 1 (13%)
Alachlor and/or degradates 16 2 (13%) 10 (63%) 12 (75%) 1 (6%)
Atrazine and/or degradates 12 3 (25%) 10 (83%) 10 (83%) 1 (8%)Metolachlor and/or degradates 16 7 (44%) 12 (75%) 10 (63%) 1 (8%)Dimethenamid and/or degradates 1 1 (100%) 1 (100%) 1 (100%) 1 (100%)
40

The August 2001 sample from one well produced anomalous results, with 55 µg/L of acetochlor, 0.68 µg/L of atrazine, 0.11 µg/L of deethylatrazine, 0.05 µg/L of metolachlor, 0.05 µg/L of prometon, and 0.42 µg/L of alachlor ESA. When the well had been sampled in September 2000, neither pesticides nor nitrate were detected. The August 2001 nitrate level in the well was 0.1 mg/L. Because of the high level of acetochlor, Dakota County staff resampled this well in November 2001 for USGS analysis; this sample contained 0.45 µg/L of alachlor ESA and nothing else. Since the August 2001 sample did not seem to represent the water quality in the well, the November 2001 results were used in this analysis and discussion. The pesticide results (summed mass of all pesticides and degradates in µg/L were highly correlated to nitrate results (Spearman’s rho = 0.793, p = 0.0000). The pesticide results were not significantly correlated to the aquifer of the well (Kruskal Wallis H = 2.6333, p = 0.4517), the depth of the well (Spearman’s rho = -0.3073, p = 0.1050), the age of the well (Spearman’s rho = -0.3337, p = 0.0771), or the soil type (Kruskal Wallis H = 0.1419, p = 0.7064). The pesticide results were also not correlated to the caffeine results (Spearman’s rho = -0.3311, p = 0.0799). As shown in Figure 17, of the 27 wells that were analyzed for both caffeine and low-level pesticides, 16 (59%) had detectable levels of both caffeine and pesticides; 8 (30%) had detectable levels of caffeine but not pesticides; and 3 (11%) had detectable levels of pesticides but not caffeine. Every well had something.
41

Vermillion River Monitoring Well Installation In September and October of 2000, three clusters of monitoring wells were installed along the Vermillion River – upstream of the buried bedrock valley, over the buried bedrock valley, and downstream of the valley -- to study water level and nitrate level differences between the groundwater and surface water. The property owners gave permission for the wells to be installed temporarily and to be monitored on a regular basis. Static water levels and nitrate samples were taken every month (with some omissions due to weather or staffing.) The well installation plan was to have three wells at each site – one well near the river, about ten feet deeper than the water table; one well next to the first, about fifty feet deeper than the water table; and one well about 100 feet away from the river, the same depth as the first. Static water level observations from monitoring wells configured in this way create a three-dimensional representation of the local groundwater/surface water interactions. The water level in the shallow well near the river compared to that of the well away from the river indicates the horizontal direction of water movement (away from the river or toward the river). The water level in the shallow well near the river compared to that of the deeper well next to it indicates the vertical direction of water movement. (N.B., wells configured in this way are usually referred to as “piezometers;” however, in this case, since water quality samples were taken from the wells in addition to the static water level measurements, these are technically monitoring wells.) The wells were installed in this pattern at the upstream and downstream locations; however, over the buried bedrock valley, the water table was relatively deep near the river, about fifty feet below ground surface, so only two wells were installed at that location. The well locations relative to the bedrock geology are shown in Figure 18, and the well logs are included in Appendix F. After the wells were completed, the County Land Survey department recorded the location of each well using GPS. Groundwater-surface water interactions Cross-sections of each site showing the stratigraphy and static water levels for each well are shown in Figures 19, 20, and 21. Chart 4, below, shows the static water levels over the sampling period; Chart 5 shows the same information, but without the upstream set of wells. As can be seen from these charts and Figure 22, in the three miles between the upstream and buried bedrock valley wells, the groundwater table drops approximately 70 feet, where the ground surface only drops 8 to 15 feet. In the two miles between the buried bedrock valley and downstream wells, the groundwater table is approximately level, where the ground surface drops 15 feet. In some time periods, the groundwater table is higher at the downstream wells in Hastings than at the buried bedrock valley wells. The monitoring well results indicate that: upstream of the buried bedrock valley, the groundwater table is higher than the river, so that groundwater is flowing into the river, but where the river crosses the valley, the groundwater table drops sharply. Over the valley, the river is “perched,” with little interaction with the groundwater below, but further downstream, within the City of Hastings, the river loses water into the groundwater. Based on these observations, and referring to Figure 8 (Surficial Geology, from the Dakota County Geologic Atlas), it appears that the Vermillion River/groundwater interactions change where the river enters the City of Hastings and the surficial geology changes from mixed outwash to older glacial deposits and karst limestone.
42
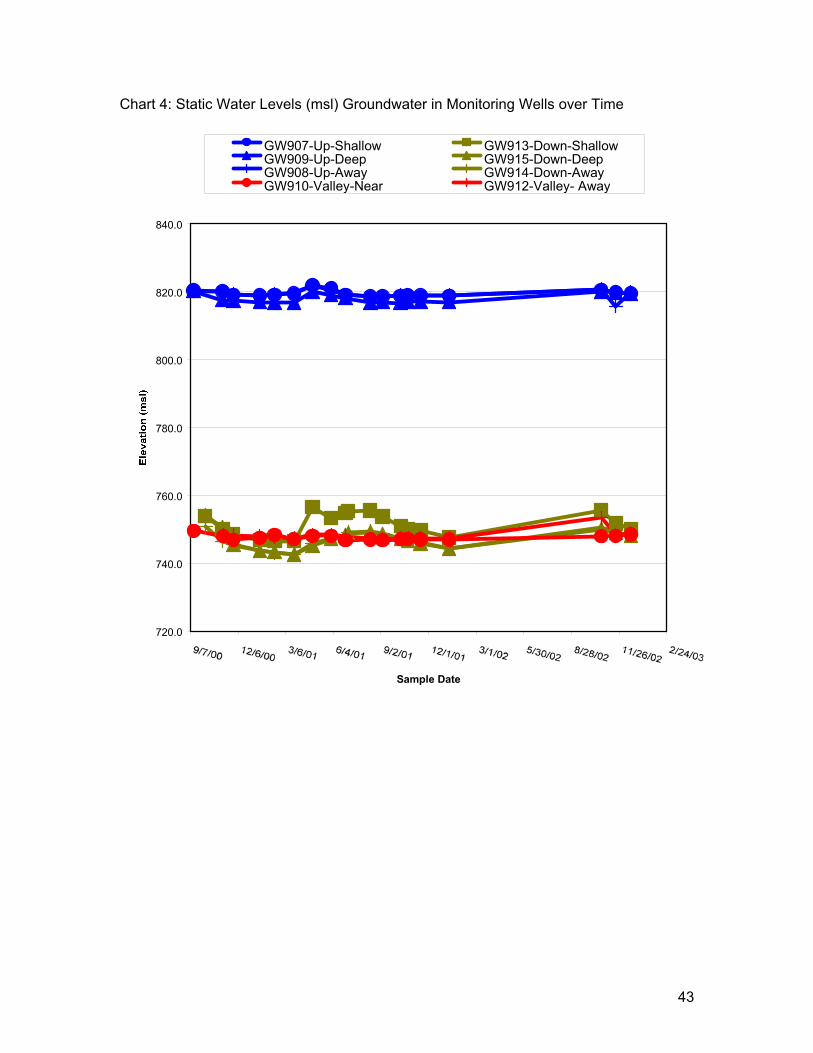
Chart 4: Static Water Levels (msl) Groundwater in Monitoring Wells over Time
720.0
740.0
760.0
780.0
800.0
820.0
840.0
Sample Date
GW907-Up-Shallow GW913-Down-ShallowGW909-Up-Deep GW915-Down-DeepGW908-Up-Away GW914-Down-AwayGW910-Valley-Near GW912-Valley- Away
43

Chart 5: Static Water Levels (msl) in Monitoring Wells (excluding upstream wells)
740
745
750
755
760
Date Sampled
GW913-Down-Shallow GW915-Down-DeepGW914-Down-Away GW910-Valley-NearGW912-Valley-Away
Nitrate Results At the same time that static water levels were measured in each monitoring well, nitrate samples were taken from the well and from the adjacent river. (Nitrate analysis was performed by the Minnesota Department of Health.) These results are shown in Charts 6 and 7, below. Chart 7 shows the same information as Chart 6, but without the extreme results of Site GW912. Also, the SWCD has been monitoring the Vermillion River for nitrate, fecal coliform bacteria, and other water quality parameters since February 2000; Metropolitan Council has been monitoring river water quality upstream and downstream of the Empire Wastewater Treatment Plant (WWTP) since the treatment plant was constructed in the 1970’s. The nitrate results from the SWCD, Metropolitan Council, and this project’s monitoring wells are
44

shown in Figures 23 (map) and 24 (chart). Based on nitrate results, these groundwater and surface water monitoring sites can be grouped as follows: the upstream monitoring wells (median results of 0.0 to 0.2 mg/L); river samples taken upstream of the Empire WWTP (median results of 1.06 to 2.07 mg/L); river samples taken downstream of the Empire WWTP, the downstream wells, and the buried bedrock valley well near the river (median results of 4.4 to 8.4 mg/L); and the buried bedrock valley well away from the river (GW912, median results of 19.0 mg/L). This well is adjacent to an irrigated cornfield. Chart 6 : Monitoring Well Nitrate Levels Over Time
0.0
8.0
16.0
24.0
32.0
Sample Date
GW907-Up-Shallow GW913-Down-Shallow GW910-Valley-NearGW909-Up-Deep GW915-Down-Deep GW912-Valley-AwayGW908-Up-Away GW914-Down-Away SW902-Valley-RiverSW901-Up-River SW903-Down-River
45

Chart 7: Monitoring Well Nitrate Levels Over Time (excluding GW912)
0.0
4.0
8.0
12.0
Sample Date
GW907-Up-Shallow GW913-Down-Shallow GW910-Valley-Near GW909-Up-DeepGW915-Down-Deep GW908-Up-Away GW914-Down-Away SW902-Valley-RiverSW901-Up-River SW903-Down-River
These nitrate results are consistent with the water level results in indicating that the Vermillion River appears to be contributing to the nitrate in the groundwater within the City of Hastings, but not upstream of the city itself.
46

IV. Groundwater Modeling Introduction A groundwater model was constructed of the greater HANS study area. The purpose of the model was to estimate the source water locations for the wells sampled in the HANS study, so that correlations could be drawn between the source location, the time of travel, and the water quality test results. Background: Previous Models The purpose of modeling groundwater flow in the HANS area was to characterize the movement of contaminated water from its original source to the domestic wells in which it was detected. The HANS plan for groundwater modeling was to adapt and refine the Dakota County Groundwater Flow Model, in order to create a more detailed model of the Hastings area and to incorporate the static water level and water quality data collected in the HANS effort. The Dakota County Model proved to be unworkable, and the MPCA Metropolitan Area Groundwater Model (Metro Model) was used as a starting point, instead. Several regional scale groundwater flow models have been constructed which cover the HANS project area. In addition to the piezometric surface (water table) modeled in the Dakota County Geologic Atlas (Plates 5 and 6, Palen, 1990), computer models have included finite difference (MODFLOW) models and Multi Layer Analytical Element Models (MLAEM). Their construction has been an ongoing effort, in which each model uses information developed by previous models. In chronological order, these regional models are: USGS Twin Cities model by M.E. Schoenberg MODFLOW Inver Grove Heights Groundwater Flow Model MLAEM Dakota County Groundwater Flow Model MLAEM The MPCA Metropolitan Area Groundwater Flow Model MLAEM The MPCA Quaternary Groundwater Flow Model MLAEM Scott-Dakota County Groundwater Flow Model MODFLOW
These groundwater models have established approximate values for the physical aquifer parameters and for recharge and discharge rates from the aquifers. They have also shown that the Vermillion River above Hastings is a source of aquifer recharge, and that the glacial deposits in the buried bedrock valley have a strong influence on groundwater flow patterns. Figure 25 shows the piezometric surface from the Dakota County Geologic Atlas (Plate 6, Palen, 1990), as well as the bedrock geology (Plate 2, Mossler, 1990) and the approximate water levels obtained from the HANS monitoring wells along the Vermillion River. As can be seen from this figure, the piezometric surface in the Geologic Atlas shows a local high in south Hastings, south of the Vermillion, from which water flows outward from the city, toward the Hastings buried bedrock valley to the southeast as well as toward the Mississippi River. Also notable on this figure are the water level observations from the HANS monitoring wells, which indicate a higher water table than the Geologic Atlas estimates, especially in the buried bedrock valley and the City of Hastings. The difference might be because the Vermillion River locally affects the water table there or it might be because the HANS observations were made after a decade of relatively high precipitation. The regional computer models reflect the 1990-91 USGS study that explored the relationship between the hydrology and the water quality in the Vermillion River watershed
47

(Almendinger and Mitton, 1995). This study showed a reduction of stream flow east of the City of Vermillion, indicating that surface water was discharging into the Quaternary and bedrock formations in this area. The HANS monitoring well data somewhat contradict, or at least modify, this interpretation. The HANS monitoring wells indicate that the Vermillion does not lose much water where it crosses the buried bedrock valley, but loses extensive water starting further downstream, within Hastings itself. The HANS nitrate results also suggest that the hydrology beneath the City of Hastings operates differently than the hydrology in the remainder of the study area. As discussed above, the domestic well nitrate results were very strongly correlated with the total depth of the well. In the City of Hastings municipal wells, this relationship does not hold. Chart 8, below, shows the HANS median and maximum results for domestic wells, by depth interval, which clearly shows nitrate levels declining with depth. The City of Hastings HANS results, and median and maximum MDH monitoring results (1993-2003) show no observable change with depth. This suggests that the groundwater transport of nitrate is different within the City of Hastings than it is in the surrounding area, in a way that conveys water with elevated nitrate concentrations to deeper levels than in the surrounding area. Chart 8: Nitrate Results by Depth Interval: Hastings Municipal Wells vs. HANS Study Private
Drinking Water Wells
0.0
2.0
4.0
6.0
8.0
10.0
12.0
14.0
16.0
18.0
20.0
22.0
24.0
26.0
28.0
30.0
Total Depth of Well (feet bgs)
HASTINGS HANS RESULT HASTINGS HISTORICAL MEDIAN HASTINGS HISTORICAL MAXIMUMCOMPARABLE DEPTH HANS MEDIAN COMPARABLE DEPTH HANS MAXIMUM
The HANS Groundwater Model attempts to reconcile the groundwater flow issues raised by the HANS data that are not addressed in the existing regional models.
48

HANS Groundwater Model Description The groundwater flow in the HANS area was modeled in MLAEM version 5.1.08 Dev (Multi Layer Analytic Element Model by Otto D. L. Strack), and was calibrated using PEST version 4.0. The starting point for the modeling effort was the Metro Model, South Province model (Hansen and Seaberg, 2001). The Metro model is a two-layer model, with the upper layer being the St. Peter Sandstone aquifer, and the lower layer being the combined Prairie du Chien (Shakopee and Oneota) and Jordan aquifers. The St. Peter aquifer is separated from the Shakopee aquifer by the lower St. Peter confining unit. Where the St. Peter is absent, the upper layer represents Quaternary aquifers, perhaps separated by Quaternary clay layers such as glacial tills. In the HANS area, the St. Peter aquifer is absent, and the Quaternary deposits are typically sandy outwash in good hydrologic contact with the Shakopee aquifer. Therefore, the two-layer model was converted to a single layer model; the transmissivities of the two layers were summed; infiltration from the top layer and leakage through the bottom of the lower layer were retained, and head-specified linesinks were retained along rivers. The model was truncated about 10 miles west of Dakota County with a head specified boundary, using heads extracted from the original model. Bedrock Model as Groundwater Flow Model Input Methods Construction and stratigraphy for wells in the HANS region, plus a surrounding buffer up to several miles wide, were extracted from WELLMAN. Each record was examined to determine the elevations of the top of each bedrock unit at the well's location. Data sets were extracted for each of the following layers: Top of Bedrock, Top of Prairie du Chien Group, Top of Jordan Sandstone, and Top of St. Lawrence Formation. Each data set was modeled as described below to develop a contour map of the specified surface. The quality of the raw data was highly variable. Outlier data points were included, corrected, or excluded through an iterative modeling process. Outliers were identified by plotting the layer contours in SURFER, then examining the contours for unusual patterns. Outlier data were progressively either thrown out as unreliable or corrected following analysis of original well records. Staff created final contour plots and performed additional outlier analysis using an interpolator MEI.EXE written by William Olsen (Dakota County Environmental Management). MEI.EXE is an interpolator that includes multi-quadric radial basis functions, linesinks, and linear area sink functions in an Analytic Element model. The linear area sink functions are created by integrating a circular area of specified radius and constant divergence along a line segment. The latter function resembles a linesink with curved rather than creased contours along the line. MEI.EXE can solve an interpolation problem exactly or in a least squared error sense. When linear trend lines are used, the interpolation can be performed in 2 iterations: in the first iteration the linear trend functions are solved in a least squared error sense, and in the second iteration the remaining residuals are solved for exactly using the multiquadric basis points. This program is not documented, but has been shown to reproduce contours generated by SURFER when identical interpolator methods are selected. MEI.EXE is more useful than SURFER it incorporates linear trend functions and because it generates contour lines that can be imported to ArcView with the elevation as an attribute field.
49

Each bedrock layer was first examined by contouring points where the layer was observed in its full thickness, i.e. points where bedrock layers both above and below the target layer were present, and the top of the target layer was not subject to Quaternary erosion. These analyses were used to estimate layer thicknesses and elevations assuming no Quaternary erosion. This in turn was used in searching for data points that were outliers either in thickness or theoretical elevation. Next, contour maps were produced for each layer by contouring points where the layer was observed in either full or partial thickness. These contours span regions where the layers may be absent. However, this was deemed adequate for the purpose of groundwater modeling because water in the bedrock aquifers continues to flow more or less horizontally through quaternary deposits wherever the bedrock aquifer is eroded away. These plots are discussed below. The lowest layer analyzed was the top of the St. Lawrence confining unit. This is identified below as the bottom of the Jordan aquifer. Using this model and the model of the top of the Jordan, a new model was created of the thickness of the Jordan aquifer. Results The analyses of the bedrock surface elevation were largely successful. The bedrock surface maps are in acceptable agreement with the Dakota County Geologic Atlas. The bedrock elevation trend surface plot (Figure 26) shows the basic geological interpretation of bedrock erosion patterns but does not fit the observation data exactly. This surface is generated by MEI using 213 linear functions and 26 point functions, and is a least squared error fit to 788 elevation specified observation points. The detailed bedrock elevation surface plot (Figure 27) incorporates the trend model, but also fits all of the included observation data. This surface is generated by MEI using 213 linear trend functions, 26 synthetic observation points, and 788 elevation specified observation points. The surface passes through all observations exactly. The Prairie du Chien Group (Figure 28) was found to increase in thickness from approximately 180 feet thick in the North to approximately 280 feet thick in the South. The surface is generated by MEI using 256 thickness specified observation points. The surface passes through all observations exactly. The Jordan Sandstone (Figure 29) was found to have a fairly consistent thickness of 80 to 100 feet. The surface is generated by MEI using 43 thickness specified observation points. The surface passes through all observations exactly. The base of the Jordan aquifer (Figure 30), where present, was found to have some significant variation. The surface is generated by MEI using 19 linear trend functions, 7 linear functions for far-field control, and 541 elevation specified observation points. The surface passes through all observations exactly. Some outliers appear to remain in the observation data set. There is an overall dip in the base of the Jordan aquifer from southeast to northwest. There also appears to be a slight dipping toward the buried bedrock valley that runs from southeast to northwest between Vermillion and Hastings, but this may be due to a lack of observation data along that line. A step up of roughly 100 feet from South to North was observed in the data along the Empire Fault. The Empire fault runs through Hastings from southwest to northeast. The location of the fault appeared to be fairly well constrained by observation points in the region northeast of the City of Vermillion, and was modeled with two parallel strips of linesink functions to bound the probable fault location; the fitted model
50
created a jump there of approximately 100 feet. The faulting appears to continue to the south of the City of Vermillion, but the location of the faulting was not well determined, and the model here was allowed only to show a vague step. The same method was used, two parallels strips of linesinks, but they were spaced much farther apart. Immediately South of the City of Vermillion, the modeling effort became uncertain due to two deep exploration wells, recorded in the County Well Index (CWI) database, with highly anomalous elevations for this surface. Because copies of the original well records could not be located for verification, no attempt was made to resolve the anomalies, and the final plot shows that the model is poorly constructed here. Application to Groundwater Model The bedrock modeling results were used in determining the structure of the groundwater model. The location of the buried bedrock valley was important because it has different properties of hydraulic conductivity and porosity. The base elevation in the model was taken as either the depth bedrock, or as the bottom of the Jordan aquifer, where it was present. The aquifer thickness directly affects both the transmissivity and velocity of flow, and so modeling it correctly was critical to the groundwater model development and interpretation. The final groundwater model was based on the Metro Model, in which the Shakopee and Jordan aquifers are combined. As a consequence, the separate information developed about the Prairie du Chien group and the Jordan aquifer was not used. Conceptual Hydrogeologic Model The following description is restricted to the HANS study area. The principle bedrock aquifers and confining units, from top downward, are the Shakopee Dolomite aquifer, the Oneota Dolomite confining unit, the Jordan Sandstone aquifer, the St. Lawrence Formation confining unit, and the Franconia Sandstone aquifer. The Prairie du Chien Group, including the Oneota formation, varies from 160 to 260 feet thick where it is present. Typical values for its hydraulic conductivity and porosity in the Twin Cities metro area are 25 feet per day, and 9 percent, respectively (Barr Engineering, 1996 and Robertson, 2002). The properties of the Oneota formation are poorly known in this area. In Burnsville, the thickness and resistivity of the Oneota have been measured at about 60 feet and 4000 days, respectively. Informal discussions with well drillers indicate that the Oneota may be somewhat thinner in the HANS area, but a detailed and extensive review of well records proved inconclusive. The integrity of the Oneota as a confining unit may also be compromised in Hastings; it is known that the dolostone is eroded on all sides and that the Shakopee dolostone is relatively highly fractured karst. The Jordan Sandstone aquifer varies from 80 to 110 feet thick. Typical values for its hydraulic conductivity and porosity in the Twin Cities metro area are 40 feet per day, and 21 percent, respectively. The St. Lawrence confining unit is very impermeable, and is treated as the bottom impermeable boundary in the HANS Groundwater Model. It is eroded in some areas of the Hastings Valley, and is there treated as a leaky aquitard. It may contain sandy units within it that can produce moderate quantities of water.
51

An aquifer system composed of two aquifers with a confining unit between them has an important descriptive number called its characteristic length, which is represented by the Greek character lambda (λ). The importance of the characteristic length is that more than 96 percent of leakage through the confining unit occurs within a distance of 3λ from the source of stress. Examples of sources of stress include rivers, wells, and breaks in the confining unit such as the edge of a buried bedrock valley. The characteristic length (λ) of such a two aquifer system is defined by
+=
212
1111TTcλ
where T1 and T2 are the transmissivities of the aquifers, and c is the resistivity of the confining unit. The transmissivity is the product of the thickness and hydraulic conductivity. Solving for lambda gives
+
=
21
11TT
cλ
Using the values reported above, the aquifer system composed of the Shakopee, Oneota, and Jordan formation has a characteristic length of about 0.6 miles, which may be much smaller in the Hastings area. Using values reported in the Inver Grove Heights Groundwater Model, the aquifer system composed of the Prairie du Chien-Jordan aquifer group, the St. Lawrence, and the Franconia and Ironton-Galesville aquifer group has a characteristic length of about 3 miles. These values support the choice to combine the Shakopee and Jordan units into the same aquifer in this model but to exclude the Franconia and Ironton-Galesville aquifer. The uppermost aquifer materials are the surficial unconsolidated sediments, also referred to as Quaternary deposits. The Quaternary deposits lack significant continuous clay layers, and are well connected hydrogeologically to the underlying bedrock units. They average 10 to 100 feet thick. Because they are well connected to the underlying bedrock units, they are combined with the Shakopee and Jordan units into a single unconfined aquifer in this model. Several very large and significant buried bedrock valleys, and at least one major fault are located in the HANS area. The major fault is known as the Empire fault, and runs from the City of Empire eastward to the City of Vermillion, and then northeastward through northwest Hastings and across the river. Where buried bedrock valleys exist, they are filled with glacial sediments. The major buried bedrock valley on the southwest side of Hastings is referred to within this report as the Hastings Valley. The Hastings Valley appears to be filled with highly permeable sediments; in some places no finer than cobbles, although clay lenses are present in other places. The sediments filling in the other buried bedrock valleys are less well known; they typically appear very permeable, but less so than those in the Hastings Valley. Where the bedrock layers are cut through by buried valleys and filled with sediments, the horizontal flow of groundwater is not constrained; groundwater apparently flows freely between the bedrock and the valley sediments. Therefore, in the groundwater model, the buried bedrock valleys are represented as aquifer regions with altered properties of permeability and porosity. The value of porosity used for unconsolidated sediments is 0.30, which is a typical measured value. The fitted values of permeability for the valley sediments in the Hastings Valley are quite high, on the order of 5000 feet per day. This value is 10 to
52

30 times higher than previously published values, and thus is drawn into question. The fact that this fitted value is high may be related to the fact that the fitted values of infiltration are also somewhat high. The very high permeability has the unanticipated result of causing the simulated groundwater flow direction to reverse and flow from the City of Hastings to the Hastings Valley, southwest. This flow direction is supported by the static water level observation data set, which is considerably more extensive than that used for any previous groundwater model in this area. The final model input data files are provided in the HANS data sets, and the parameters used are illustrated in figures 31 through 37. Recharge and Discharge Zones Rainfall infiltration rates as fit in this model are typically 5 or 6 inches per year over the bedrock valleys, and up to 10 to 24 inches per year elsewhere. The higher values are somewhat higher than infiltration rates in similar models. The fitting data (static water levels) are not particularly sensitive to infiltration, and so we cannot report high confidence in the model fitted values. Infiltration to the topmost modeled aquifer is modeled with constant given strength VAREL elements. The strengths used were obtained through the model calibration process, and were constrained to reasonable values. The Minnesota River, Mississippi River, Cannon River, and the upper portion of the Vermillion River are connected to the groundwater. They are all modeled with head specified line-sinks, as illustrated in Figure 38. This method neglects the extra resistance to groundwater flow that may be present in riverbed sediments. This method was selected because it is efficient and simple, because it is the method generally used in the models on which this model is based, and because the river reaches closest to the area of interest are probably well connected to the aquifers. The most critical river reach appears to be the portion of the Vermillion River between the City of Vermillion and the falls in Hastings. In this model, this portion of the river was divided into two reaches, one from the City of Vermillion to the Hastings city limit, and the other from the Hastings city limit to the falls within the city. The monitoring wells installed for the HANS project showed that the Vermillion River from the City of Vermillion to the City of Hastings is apparently perched relative to the groundwater; the water table is as much as 50 feet below the river elevation. Therefore, this reach of the river was left out of the model because it was estimated that the infiltration through the river bottom would not be much in excess of the rainfall infiltration. Previous studies have concluded that there are losses from the Vermillion River between the City of Vermillion and the falls in Hastings. To account for these losses, a stretch of the river from the Hastings city limit to the falls was included in the model as a given strength (discharge specified) curvilinear linesink string. This linesink was modeled as having a constant discharge rate along its length. The amount of discharge was treated as an unknown, and was fit by PEST to meet the observation head data. The final fitted value for the strength was 8,640,000 cubic feet per day, or 32 cubic feet per second. This represents about one third of the base flow of the Vermillion River at the Hastings falls (Montgomery Watson Harza, 2003). If this fitted value is correct, this volume probably has minimal visual effect on the river flow, but it has a deciding influence on the groundwater flow.
53
Special modeling simplifications Instability of the model was observed when base jumps were introduced. For this reason, the model as run has no base jumps. In order to simulate the variations in aquifer transmissivity due to the base jump, the hydraulic conductivity was adjusted by a factor equal to the true average saturated thickness divided by the model average saturated thickness. This adds a small error in unconfined areas with large variations in saturated thickness, but these are minimal. Modifying the saturated thickness in this way also affects the total pore volume, and so the porosity used in the model was also modified so that the groundwater velocity estimates would be not be affected. Note that a typical accepted value for the porosity of the Shakopee aquifer is 0.09, for the Jordan aquifer is 0.21, and for unconsolidated sediments is as much as 0.30. Because of the model used, and the fact that the model was a single layer, it was not possible to differentiate these porosities vertically. Therefore a single porosity value of 0.30 was used throughout, and was adjusted only according to the aquifer thickness correction described above. No attempt was made to correct the times of travel using this information. Calibration data set The final calibration data set consists of 554 piezometric head elevations from wells in an area approximately 15 miles square. This data set began as 950 wells in the WELLMAN database. They were selected because they were in this area and had static water levels. This data set was reviewed both manually and utilizing statistical outlier analysis in Surfer. The manual analysis consisted of looking for extreme patterns in a kriged surface. Outliers were removed automatically where observation density was high. Where the observation data density was low, well records were investigated individually to verify location, elevation and data entry. The process of removing outliers and again repeating the analysis was repeated a number of times until the final data set of 554 wells was accepted. The piezometric surface thus estimated is shown in Figure 39. The data set has several problems. First, the data represent a long time span, while the model is steady state. Second, the data come from many sources, and are measured with varying care and precision. Finally, the data are typically recorded as depth below ground level and the elevation is computed by subtracting this depth from the elevation of the nearest land elevation contour, but the contour coverage through much of this area is accurate only to the nearest 10 feet. As a result, estimation differences of 10 to 20 feet from the observations are not necessarily errors. Special care was taken to enter accurately the average head data from a relatively dense network of observation wells just above the falls in Hastings. Calibration Method The model was calibrated with PEST version 4.0. The PEST control files, model files, and PEST results files are included in the HANS data set. The parameters that PEST was allowed to fit included both hydraulic conductivity and infiltration rates. This technique has the shortcoming that these parameters can be linearly dependent, and so the calibration may not be able to fit them uniquely at the same time. To avoid this problem, the parameters were applied to areas or groups of areas that were as large as possible, and that did not coincide with each other.
54
Calibration Results The standard error of weighted residuals in the calibrated model is 19.60 feet. This is not excellent. This is 8.6 percent of the range of heads in the observation set. A plot of the residuals (Figure 40) appears to show a random distribution of positive and negative errors, with the following exceptions: too low in eastern Rosemount, too low around Miesville, and too low in central Hastings. Failure to obtain better results is due to both the quality of the observation data set and errors and simplifications in the conceptual model. Additionally, it is possible that the technique of simultaneously fitting infiltration and hydraulic conductivity could have hampered the fitting process. It may also have led to an undetectable bias in the result. In particular, the high values of infiltration in Hastings, and the high hydraulic conductivity in the Hastings Valley may be so related. Model Results Complete model results are in Appendix G. The estimated flow paths from the drinking water wells sampled for HANS back to the source of the water are shown in Figure 41. Validation of Model Results Age-dating Ten of the domestic wells from the HANS sample set were selected for helium-tritium age-dating based on geographic distribution in the study area, nitrate sampling results, and the depth of the well. Three wells were selected to represent “expected” conditions; i.e., they were relatively shallow and had high nitrate levels. Seven wells were select to represent “non-expected” conditions: three were shallow but had low nitrate and four were deep but had high nitrate. Samples were analyzed and interpreted by the University of Rochester (New York). The results are shown in Table 13, below. The age-dating results indicated that all the well water was much younger than anticipated, ranging from 40 to 4.8 years in the ground. Among the three wells with “expected” conditions, the inverse correlations between estimated age and nitrate, and estimated age and modeled travel times, were perfect (Spearman’s rho = -1.000, p = 0.0000). Among the wells with “non-expected” conditions, there was no correlation between the age-dating results and either the nitrate results (Spearman’s rho = -0.0545, p = 0.9055) or the estimated travel times (Spearman’s rho = -0.2523, p = 0.6040). However, the sample size may have been simply too small, and the well construction too variable, to reach valid conclusions. (If age-dating samples are repeated in the future, the sampled wells will be selected for recent construction – later than 1989 – and narrow screen intervals, for more precise aquifer representation.) The age-dating results were significantly correlated with the well depth (Spearman’s rho = 0.6433, p = 0.0490).
55
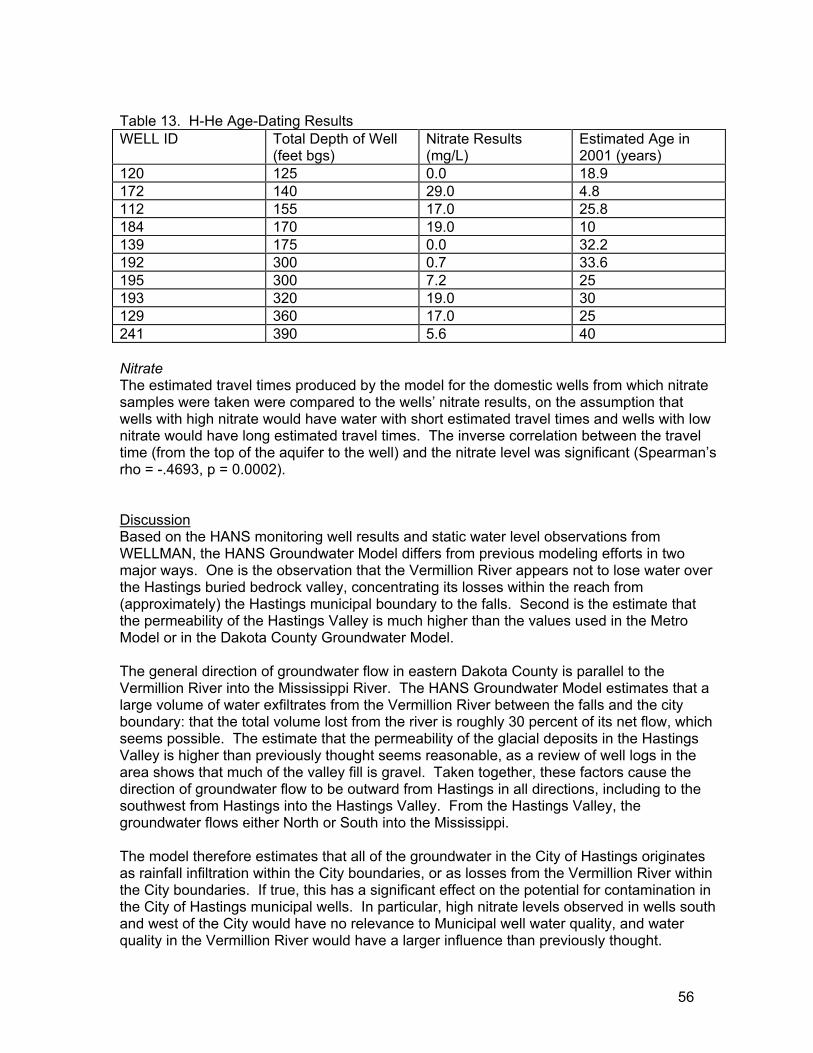
Table 13. H-He Age-Dating Results WELL ID Total Depth of Well
(feet bgs) Nitrate Results (mg/L)
Estimated Age in 2001 (years)
120 125 0.0 18.9 172 140 29.0 4.8 112 155 17.0 25.8 184 170 19.0 10 139 175 0.0 32.2 192 300 0.7 33.6 195 300 7.2 25 193 320 19.0 30 129 360 17.0 25 241 390 5.6 40 Nitrate The estimated travel times produced by the model for the domestic wells from which nitrate samples were taken were compared to the wells’ nitrate results, on the assumption that wells with high nitrate would have water with short estimated travel times and wells with low nitrate would have long estimated travel times. The inverse correlation between the travel time (from the top of the aquifer to the well) and the nitrate level was significant (Spearman’s rho = -.4693, p = 0.0002). Discussion Based on the HANS monitoring well results and static water level observations from WELLMAN, the HANS Groundwater Model differs from previous modeling efforts in two major ways. One is the observation that the Vermillion River appears not to lose water over the Hastings buried bedrock valley, concentrating its losses within the reach from (approximately) the Hastings municipal boundary to the falls. Second is the estimate that the permeability of the Hastings Valley is much higher than the values used in the Metro Model or in the Dakota County Groundwater Model. The general direction of groundwater flow in eastern Dakota County is parallel to the Vermillion River into the Mississippi River. The HANS Groundwater Model estimates that a large volume of water exfiltrates from the Vermillion River between the falls and the city boundary: that the total volume lost from the river is roughly 30 percent of its net flow, which seems possible. The estimate that the permeability of the glacial deposits in the Hastings Valley is higher than previously thought seems reasonable, as a review of well logs in the area shows that much of the valley fill is gravel. Taken together, these factors cause the direction of groundwater flow to be outward from Hastings in all directions, including to the southwest from Hastings into the Hastings Valley. From the Hastings Valley, the groundwater flows either North or South into the Mississippi. The model therefore estimates that all of the groundwater in the City of Hastings originates as rainfall infiltration within the City boundaries, or as losses from the Vermillion River within the City boundaries. If true, this has a significant effect on the potential for contamination in the City of Hastings municipal wells. In particular, high nitrate levels observed in wells south and west of the City would have no relevance to Municipal well water quality, and water quality in the Vermillion River would have a larger influence than previously thought.
56

The most significant oversimplification in the model is combining the Shakopee aquifer and the Jordan aquifer into a single layer. This made estimations of head near areas of aquifer stress approximate. The unusual findings of the model are that the sediments in the Hastings Valley have a much higher hydraulic conductivity than previously thought, and that leakage from the Vermillion River supplies a major portion of the groundwater to the City of Hastings Municipal wells. These findings differ from earlier groundwater studies, and should be considered as tentative until verified by further study. Conclusions The HANS Groundwater Model is derived from the Metro Model, with numerous additional static water level observations taken from WELLMAN and accounting for the static water level observations from the HANS monitoring wells. The model results are significantly correlated with the HANS domestic well nitrate results. However, as referred to in the discussion of previous groundwater models, above, the elevated nitrate levels in the Hastings municipal wells are independent of depth; also, the Hastings municipal water contains agricultural pesticide metabolites and caffeine at levels comparable to the rest of the study area. The most logical sources of the pesticides are the farmlands surrounding the City; the most logical sources of the caffeine are septic systems outside the City plus the effluent from the Empire WWTP. These observations combined -- the elevated nitrate in deeper wells, the pesticides and the caffeine – strongly suggest that a quantity of shallow, contaminated groundwater from west and south of Hastings flows into the buried bedrock valley, mixes with deeper groundwater, then flows beneath the City itself. So, the model results are consistent with the remainder of HANS observations for the area surrounding the City of Hastings, but the model requires additional data and additional refinement to estimate reliably the groundwater flow patterns within Hastings.
57
V. Discussion Assessment of the Project Area’s Water Quality The first objective of the Hastings Area Nitrate Study was to describe nitrate conditions in the Shakopee aquifer of the Prairie du Chien group and the Jordan aquifer and to identify the sources of nitrate in the area’s groundwater. Groundwater quality issues can be viewed in two ways: aquifer conditions – what’s under ground – or drinking water conditions – what comes out of residents’ taps. This study found that well construction factors both influence the quality of the drinking water and complicate the investigation of aquifer conditions. Nitrate Conditions The results of the sampling done in September 2000 of private and public drinking water wells showed that the City of Hastings and the surrounding area do indeed have a “nitrate problem,” with a quarter of the wells exceeding the drinking water standard of 10.0 mg/L and a quarter of the wells in the “elevated” range of 3.0 to 10.0 mg/L. Hastings’ municipal supply wells were all below the drinking water standard, ranging from 2.1 to 8.5 mg/L, with a median result of 5.7 mg/L. While this is acceptable, the facts that most of the City’s wells are in the “elevated” range and that the MDH’s routine municipal well sampling shows that the City’s nitrate levels continue to increase indicate that drinking water quality in the City will be a concern for the foreseeable future. The results showed significantly different nitrate levels in wells completed in unconsolidated materials (Quaternary), the Shakopee, and Jordan aquifers. Shakopee had the highest levels (15.0 mg/L), followed by Quaternary (8.7 mg/L) and Jordan (1.85 mg/L). However, the presence of the Hastings buried bedrock valley, with depths to bedrock of 500 feet or more, means that the deepest Quaternary wells in the study area may be deeper than the Shakopee wells. Associated with that, the depth of the well was a stronger predictor of nitrate level than the aquifer in which the well was constructed. Throughout the study area, the nitrate results did not indicate a “plume” of contamination. Instead, a set of risk factors was associated with high nitrate levels in a given well: the depth of the well (deeper wells have lower nitrate), the age of the well (newer wells have lower nitrate), and the soil type in which it was constructed (wells in sand or sandy loam have higher nitrate than wells in soils with a higher clay content). As well construction has become more regulated, first with Minnesota’s first Well Code in 1974 and then with the establishment of Dakota County’s Delegated Well Program in 1989, new wells have been drilled deeper than old ones, so the depth of the well and the age of the well are interrelated. Sources of Nitrate Three potential sources of nitrate were considered: row-crop agriculture, feedlots, and septic systems. Lawn fertilizers can also be a potential source of nitrate, but after reviewing the land use in the study area and determining that the acreage devoted to lawns was insignificant compared to the acreage devoted to agriculture, lawn fertilizers were not pursued as a line of inquiry. Two research tools were used to identify sources of nitrate: conducting a MDA FANMAP to better understand agricultural practices in the area, and sampling for indicator compounds (agricultural pesticides and caffeine) to determine what other parameters might be associated with nitrate in wells.
58

Farm Nutrient Management Assessment Program In order to quantify the agricultural nitrogen inputs to the study area, the MDA conducted an FANMAP, representing the 2000 cropping season. In this program, MDA staff conducts comprehensive, confidential interviews with farm operators in the study area. The farmers provide detailed information about how what crops they are growing that year, how many acres have been planted in each, what their fertilizing practices are, what pesticides they use and when, what livestock they raise, and what their manure management practices are. The farmers’ practices are then compared to the University of Minnesota’s recommended Best Management Practices, which are intended to maximize crop yields and minimize water pollution, to see if there are areas for improvement. In the HANS area, the MDA found the greatest crop diversity of any of the areas of Minnesota where they have conducted FANMAPs. However, the dominant crop regime is corn and soybeans grown in rotation (69% of acreage). The acreage devoted to potatoes (7%) was lower than expected. However, irrigation was prevalent (63% of the acreage), including all of the potato acres. The study found that farmers in the area were adopting the educational materials and recommended nitrogen management strategies available from the U of M for the study area. The study also found that, while some beef cattle, dairy cattle, and hogs were raised in the study area, the number of livestock raised in the area was not large enough for their manure to be a significant source of nitrogen compared to commercial nitrogen fertilizers. Indicator Compounds A representative subset of the private drinking water wells sampled for nitrate was also sampled for caffeine (as a tracer for domestic wastewater coming from septic systems) and for agricultural pesticides (as a tracer for row crop agriculture). All of these samples contained at least one of the parameters: caffeine was detected in 89% of the wells, and pesticides or pesticide metabolites were detected in 70% of the wells. The caffeine detections were extremely low, and all the pesticide detections were well below drinking water standards. Caffeine levels were not statistically related to nitrate levels, which is logical considering that caffeine was even found in wells contained no nitrate. The frequency with which caffeine was detected does indicate that the groundwater is being widely affected by domestic wastewater. The statistical relationship between nitrate and the total mass of pesticide or pesticide metabolites in a well was extremely strong. When the results of the indicator compound analysis are combined with the FANMAP results, the conclusion is that row-crop agriculture is the main source of the elevated nitrate in the study area. Although farmers in the area are following recommended Best Management Practices for both fertilizer and pesticide application, the area’s soil and geological conditions are working against them. As was seen from the helium-tritium isotope age-dating, the groundwater in the area is all “young,” ranging from five to 40 years since it fell as rainwater. Indeed, one of the pesticides whose breakdown products were detected in a 27% of the wells, Acetochlor, was not introduced to the market until 1994, so the water in those wells was younger than that. This indicates that within the study area, water moves very quickly from the surface to the groundwater, carrying any contamination with it. Movement of Contaminated Water Within the Study Area Vermillion River The results from the monitoring wells installed along the Vermillion River indicate that the relationship between the river and the groundwater is complex and changes along the
59
course of the river. Water levels measured in the wells show that upstream of the Hastings buried bedrock valley, the groundwater table is higher than the river, so that groundwater is flowing into the river, but where the river crosses the valley, the groundwater table drops sharply. Over the valley, the river is “perched,” with little interaction with the groundwater below, but further downstream, within the City of Hastings, the river loses water into the groundwater. The nitrate results from the SWCD, Metropolitan Council, and this project’s monitoring wells are consistent with the water level data in indicating that the Vermillion River appears to be contributing to the nitrate in the groundwater within the City of Hastings, but not upstream of the city itself. Groundwater Modeling The general direction of groundwater flow in eastern Dakota County is parallel to the Vermillion River into the Mississippi River. The HANS groundwater model, using static water level data from the study’s monitoring wells along the Vermillion River and from WELLMAN records, estimates that a large volume of water exfiltrates from the Vermillion River between the falls and the city boundary: that the total volume lost from the river is roughly 30 percent of its net flow. The model also estimates that the permeability of the Hastings buried bedrock valley is much higher than the values used in the Metro Model or in the Dakota County Groundwater Model. Taken together, these factors cause the direction of groundwater flow to be outward from Hastings in all directions, including to the southwest from Hastings into the Hastings buried bedrock valley. From the Hastings buried bedrock valley, the groundwater flows either north or south into the Mississippi. The model therefore estimates that all of the groundwater in the City of Hastings originates as rainfall infiltration within the City boundaries, or as losses from the Vermillion River within the City boundaries. If true, this has a significant effect on the potential for contamination in the City of Hastings municipal wells. In particular, high nitrate levels observed in wells south and west of the City would have no relevance to Municipal well water quality, and water quality in the Vermillion River would have a larger influence than previously thought. The HANS model fundamentally disagrees with previous groundwater flow models about the direction of flow between the City of Hastings and the Hastings buried bedrock valley. Additional observations of Vermillion River/groundwater interactions and of static water levels in the area between the Vermillion River and the Hastings valley will be required before these differences can be resolved. Resource Water Quality Objectives The second objective of the Hastings Area Nitrate Study was to develop non-regulatory strategies for addressing the area’s water quality concerns. Based on the Diagnostic Study, Dakota County’s proposed water quality objectives for the Hastings area are
1) to raise public awareness of drinking water quality issues in the Hastings area and throughout Dakota County;
2) to improve the quality of groundwater reaching the City of Hastings municipal wells, addressing current and future concerns about nitrate levels and the presence of agricultural pesticide and organic wastewater components in the public water supply, and
3) to improve the quality of groundwater reaching private drinking water wells in the rural area around Hastings, addressing concerns about nitrate, agricultural pesticides, and organic wastewater components in the area’s drinking water aquifers.
60

Goals for chemical, biological and physical measurements: 1) To improve the quality of groundwater flowing to the each individual City of Hastings
municipal water supply well so that MDH sampling results remain below 10 parts per million, without treatment, and reverse the upward trend in the City of Hastings municipal wells’ MDH nitrate results.
2) To continue to meet drinking water standards for agricultural pesticides and/or pesticide breakdown products in each individual City of Hastings municipal water supply well, and to reduce the number and quantity of such chemicals detected in municipal wells.
3) To have median nitrate levels, per Dakota County local government unit, at or below 3 parts per million, without treatment, in private drinking water wells throughout Dakota County.
4) To continue to meet drinking water standards for agricultural pesticides and/or pesticide breakdown products in private drinking water wells, and to reduce the number and quantity of such chemicals detected in private drinking water wells.
5) To reduce organic wastewater components in Dakota County drinking water supplies (public and private) below current detection limits.
Goals for economic and health factors:
1) To encourage agricultural practices that protect and improve groundwater and surface water quality without affecting the economic viability of agriculture in Dakota County.
2) To meet all health standards for public and private drinking water supplies, as outlined above.
Priority Management Areas: Two Priority Management areas are identified, based on the findings of the Diagnostic Study and ongoing Vermillion River surface water monitoring: the Wellhead Protection Area currently being delineated by the City of Hastings and the South Branch Sub-watershed of the Vermillion River subwatershed.
61
VI. Conclusions The Hastings Area Nitrate Study raises concerns about the quality of water in the area and how human activities are affecting the drinking water supply. The City of Hastings and the surrounding area do have a “nitrate problem” in the groundwater. The City of Hastings municipal supply meets drinking water standards, but drinking water quality in the City will continue to be a concern for the foreseeable future. The high correlation between nitrate and pesticides points to row-crop agriculture as the main source of groundwater contamination. The frequency of caffeine detections indicates widespread effects from domestic wastewater. Farmers in the Hastings area are following recommended Best Management Practices for both fertilizer and pesticide application, but the soil and geological conditions are working against them. The Vermillion River may be having an effect on drinking water quality within the Hastings city limits. Areas for future study include developing a better understanding of the Vermillion River/groundwater interactions, accurately characterizing the groundwater flow between the Vermillion River in the City of Hastings and the buried bedrock valley, and studying nitrate as an indicator for other forms of contamination in groundwater (such as agricultural chemicals or organic wastewater contaminants) in all of Dakota County.
62

HASTINGS AREA NITRATE STUDY IMPLEMENTATION PLAN I. Implementation Objectives Dakota County staff conducted the Hastings Area Nitrate Study with the intention that it would not lead to new county regulations, but would provide information to support voluntary groundwater protection efforts. Achieving the HANS water quality objectives will require involvement from numerous agencies and the voluntary cooperation of private property owners and farm operators within the study area; therefore, the implementation plan will be presented in general terms. The major activities to improve groundwater quality are in public outreach and education, improving agricultural practices, protecting the Vermillion River, protecting natural areas, maintaining and upgrading septic systems, regulating well construction and sealing, and follow-up monitoring and research. The objectives developed by the Diagnostic Study were:
1) to raise public awareness of drinking water quality issues in the Hastings area and throughout Dakota County;
2) to improve the quality of groundwater reaching the City of Hastings municipal wells, addressing current and future concerns about nitrate levels and the presence of agricultural pesticide and organic wastewater components in the public water supply, and
3) to improve the quality of groundwater reaching private drinking water wells in the rural area around Hastings, addressing concerns about nitrate, agricultural pesticides, and organic wastewater components in the area’s drinking water aquifers.
Goals for chemical, biological and physical measurements:
6) To improve the quality of groundwater flowing to the each individual City of Hastings municipal water supply well so that MDH sampling results remain below 10 parts per million, without treatment, and reverse the upward trend in the City of Hastings municipal wells’ MDH nitrate results.
7) To continue to meet drinking water standards for agricultural pesticides and/or pesticide breakdown products in each individual City of Hastings municipal water supply well, and to reduce the number and quantity of such chemicals detected in municipal wells.
8) To have median nitrate levels, per Dakota County local government unit, at or below 3 parts per million, without treatment, in private drinking water wells throughout Dakota County.
9) To continue to meet drinking water standards for agricultural pesticides and/or pesticide breakdown products in private drinking water wells, and to reduce the number and quantity of such chemicals detected in private drinking water wells.
10) To reduce organic wastewater components in Dakota County drinking water supplies (public and private) below current detection limits.
Goals for economic and health factors:
1) To encourage agricultural practices that protect and improve groundwater and surface water quality without affecting the economic viability of agriculture in Dakota County.
2) To meet all health standards for public and private drinking water supplies, as outlined above.
63

Priority Management Areas: Two Priority Management areas are identified, based on the findings of the Diagnostic Study and ongoing Vermillion River surface water monitoring: the Wellhead Protection Area currently being delineated by the City of Hastings and the South Branch Sub-watershed of the Vermillion River subwatershed. II. Implementation Practices The following activities are elements of long-term groundwater protection within Dakota County and should not necessarily be considered as components of a single comprehensive project. Accordingly, not all of the following activities would be elements of an implementation-phase grant application to the MPCA. Many of these activities are already underway and are at least partially funded. Federal, state, or local permits are not required for any of the activities described. Public Education and Outreach The HANS results were presented to the Dakota County Commissioners and Hastings City Council and were covered in newspaper articles, radio interviews, and articles in the Minnesota Groundwater Association newsletter, Dakota County Update, and Dakota County Rural Solid Waste Commission newsletter. The study and its findings have also been presented to:
The Dakota County Township Officers Association, Dakota County Public Health nurses, MDH Well Management staff and the managers of Delegated Well Programs from
around the state, MPCA “Rocks and Water 2002” Conference, Minnesota Groundwater Association Fall Meeting (2002), and MPCA “Air, Water, and Waste” Conference, Spring 2003.
Dakota County Environmental Education staff created an educational exercise for the Volunteer Stream Monitoring Partnership Annual River Summit using the HANS results as well. A summary of the HANS results will be distributed to the property owners who participated in well sampling and will be made available to the general public as well. County residents who drink well water, especially those in the Study area, are encouraged to have their well tested for nitrate and coliform bacteria on a regular basis. With the assistance of the MDA, Dakota County offers a free nitrate clinic at the County Fair every year, and will test well water throughout the year for a fee. A special nitrate clinic was offered in Hastings in June 2002, with 112 well owners participating. In spring 2003, Dakota County Environmental Education staff are preparing a postcard encouraging private drinking water well testing, to be mailed to all septic system owners in the County. Agriculture The HANS sampling of private drinking water wells in the area indicated that row-crop agriculture in the area is the major source of nitrate in the groundwater, even though the FANMAP conducted by MDA indicates that area farmers are following the University of Minnesota’s recommended BMPs for fertilizer and pesticides. This is good news and bad news: the good news is that farmers in the area are making an effort to protect the environment. The bad news is that the information the farmers are getting needs to be updated and refined to reflect the sensitive geological conditions in that part of Dakota
64
County. The complete FANMAP report is included in this report and is also available at http://www.mda.state.mn.us/appd/ace/fanmaphastings.pdf. The MDA has discussed the HANS findings with major growers, seed companies, and cooperatives, including:
General Mills/Green Giant Agricultural Research (peas and sweet corn), Seneca Foods, Remington Seeds (Mycogen, seed corn), R.D. Offut Company (potatoes) and Farmers Union Co-op.
These companies, in turn, make recommendations to farm operators regarding fertilizer and pesticide quantities, timing, and methods. The prevalence of agricultural pesticides in Minnesota groundwater has become a significant issue for the MDA. In February 2002, Gene Hugoson, Commissioner of Agriculture, issued a “Notice of Determination of Common Detection for Atrazine, Metolachlor, and Metribuzin in Groundwater of Minnesota.” This notice means that detection of these active ingredients is the result of normal use, not a spill or other accident, and initiates the process of developing BMPs that are specific to each pesticide. The MDA will issue draft BMPs for these specific pesticides early in 2003. (The active pesticide ingredients, or their breakdown products, that were found in this study area were Atrazine, Metolachlor, Acetochlor, Alachlor, and Dimethenamid. All were at levels well below drinking water standards.) Staff from Dakota County and the MDA are continuing to work together to develop future monitoring and outreach programs. Vermillion River The HANS found that, within the City of Hastings, the Vermillion River leaks water into the underlying groundwater. Therefore, the water quality of the Vermillion has an impact on the City of Hastings’ drinking water quality. Staff from the Dakota County Environmental Management Department (with the assistance of the Minnesota Department of Health), Soil and Water Conservation District, and Metropolitan Council are continuing to monitor the quality of the river and the interactions between the river and the groundwater. Dakota County and Scott County have formed the Vermillion River Watershed Joint Powers Organization to replace the former Vermillion River Watershed Management Organization. In 2003, this new organization will draft a revised Watershed Management Plan and submit it to the Minnesota Board of Water and Soil Resources for approval. Metropolitan Council’s Environmental Services Division is proceeding with plans to expand the Empire Wastewater Treatment Plant and redirect the effluent from the Vermillion River in Empire Township to the Mississippi River in Rosemount. Removing the Empire effluent from the Vermillion should reduce nitrate levels in the river by 2 to 4 parts per million. (Current levels in the Vermillion downstream of the Empire plant range from 4 to 9 parts per million.) Additional information about the Vermillion River Watershed Joint Powers Organization is available on-line at http://www.co.dakota.mn.us/planning/vermillionjpo/index.htm.
65

Natural Areas Areas of permanent vegetation -- especially native grasses, shrubs and trees -- serve to protect groundwater from nitrate contamination in two ways. First, the groundwater below forests, grasslands, or pastures has been found to be lower in nitrate than the groundwater below row crops or developed areas. Water leaches more slowly through plants and their roots than it does through bare soil, which provides an opportunity for nitrate or other contaminants to be taken up by the plants or stick to the soil particles, rather than being carried down into the groundwater. Second, vegetated buffer strips that are at least 80 feet wide on each side of streams, rivers, or lakes significantly reduce the amount of nitrate, phosphorus, or pesticides that reach the surface water and then leak into the groundwater. In the November 2002 general election, Dakota County voters approved a bond referendum to raise $20 million for a new farmland and natural areas protection program in Dakota County. These funds will provide an incentive for property owners, on a voluntary basis, to establish and maintain natural areas and to continue to farm agricultural land rather than developing it. One of the selection criteria for this program will be drinking water protection. Additional information about Dakota County’s Farmland and Natural Areas program is included in Appendix H, and is also available on-line at http://www.co.dakota.mn.us/planning/fnap/Index.htm. Septic System Maintenance and Code Enforcement Virtually all households within the City of Hastings are connected to municipal water and sewer service, but residents of the surrounding townships rely on individual wells and septic systems. In order to determine if leaking septic systems were one source of nitrate in the groundwater, the HANS analyzed a selection of wells for caffeine, as a tracer for household sewage. 90% of the wells tested for caffeine contained trace amounts, indicating that domestic sewage is having a widespread effect on drinking water supplies (although at very low levels). Several County programs are working to eliminate failing septic systems. State Rule requires septic system owners to have their systems pumped out at least every three years, and Metropolitan Council now requires local units of government to enforce this requirement. In 2000, Dakota County began administering a septic system maintenance program on behalf of the local governments. Since this program began, the number of households having their septic systems pumped out or inspected each year has increased 30% compared to previous years. In addition, when a property in Dakota County with a septic system is sold or otherwise transferred, or if additional bedrooms are added to a house, the septic system must be inspected and brought up to current code. Within the Study area, approximately 1,000 households rely on septic systems; of these, more than 800 have had their septic systems pumped out, inspected, or replaced within the past three years. Dakota County’s septic system programs are fee-supported. Well Regulation The Minnesota Department of Health regulates private well construction and sealing throughout the State, but will delegate their regulatory authority to local governments that meet certain standards. Dakota County has had a Delegated Well Program since 1989, and the HANS found that wells constructed since the County established its Well Program had median nitrate results of zero, while wells constructed prior to 1989 had median nitrate results of 5.7 parts per million. Dakota County’s Delegated Well Program is fee-supported. An unsealed, unused well is a potential threat to the drinking water supply because it can provide a direct connection between contamination at the surface and the groundwater far
66

below. As a result, a property owner with an unused well is required to have the well professionally sealed, register the well with the County (for a fee of $100 per year), or bring the well back into use. Well sealing is a high priority for both the County Well Program and for the Minnesota Department of Health, and approximately 300 wells are sealed in the County every year. http://www.co.dakota.mn.us/environ/wells.htm Follow-Up Monitoring and Research Dakota County’s goals for monitoring and research are to: monitor nitrate levels in groundwater and surface water in areas upgradient from the
study area; characterize more confidently the groundwater flow patterns within the City of Hastings
between the Vermillion River and the Hastings buried bedrock valley; better understand the surface water/groundwater interactions throughout the Vermillion
River watershed; investigate the presence of pesticides and other agricultural chemicals in Dakota County
water resources; investigate the presence of organic wastewater components in Dakota County water
resources; and investigate effects of rapid urbanization on Dakota County water resources.
The County has been conducting a multi-year Ambient Groundwater Study to monitor groundwater quality throughout the County on an ongoing basis. Nitrate has been one of the parameters measured by the Ambient Groundwater Study since it started in 1999, and other parameters such as agricultural pesticides have been added in response to the Hastings Area Nitrate Study. Regarding the Vermillion River, staff from the Dakota County Environmental Management Department and SWCD continue to monitor water quality and groundwater-surface water interactions along the river. Also, since the South Branch of the Vermillion River appears to contribute nitrate to the downstream reaches of the river, additional study of the South Branch Subwatershed is being planned for the future. In addition, the County is developing follow-up research in the upstream areas of the Vermillion River Watershed, to assess the effects of rapid urbanization on both the Vermillion River and the groundwater.
67

HASTINGS AREA NITRATE STUDY REFERENCES Almendinger, J.E., and Mitton, G. B., 1995, Hydrology and Relation of Selected Water Quality Constituents to Selected Physical Factors in Dakota County, Minnesota 1990-1991, United States Geological Survey Water Resources Investigations Report 94-4207. Barber, Larry B., II; Leenheer, Jerry A.; Pereira, Wilfred E.; Noyes, Ted I.; Brown, Greg K.; Tabor, Charles F.; Writer, Jeff H. “Organic Contamination of the Mississippi River from Municipal and Industrial Wastewater.” http://water.usgs.gov/pubs/circ/ circ1133/organic.html. U.S. Geological Survey Circular 1133, Reston, Virginia, 1995. Barr Engineering, 1996, Dakota County Groundwater Model, Summary Report. Dakota County, 1993, Ground Water Protection Plan. Dakota County, 1998, Clean Water Partnership Grant Application. Decision Resources, Ltd., 1996, Dakota County Subwatersheds Residential Survey on Lawn Care and Water Quality. Decision Resources, Ltd., 1998, Dakota County 1997 Environmental Issues Study. Doherty, John. 1998. PEST, Model-Independent Parameter Estimation, Watermark Numerical Computing. Hall, Robert; Crowley, Jim; Keeney, Dennis; Jackson, Gary, Webendorfer, Bruce. “Nitrate, Groundwater and Livestock Health.” University of Wisconsin, Cooperative Extension Service, Publication #G3217. 2001. Hansen, Douglas D., and John K. Seaberg. 2001. “Metropolitan Area Groundwater Model Project Summary, South Province, Layers 2 and 3 Model, Version 1.01.” http://www.pca.state.mn.us/water/groundwater/mm-overview.html. Minnesota Pollution Control Agency. May 2001. Hobbs, Howard C.; Aronow, Saul; and Patterson, Carrie J. “Surficial Geology.” Geologic Atlas of Dakota County, Minnesota. County Atlas Series, Atlas C-6, Plate 3 of 9, Quaternary Geology. University of Minnesota, Minnesota Geological Survey, 1990. Hundley, Steven J. Soil Survey of Dakota County Minnesota. Soil Conservation Service, United States Department of Agriculture, in cooperation with the Minnesota Agricultural Experiment Station. April, 1983. http://www.co.dakota.mn.us/gis/data/soils.htm Jaeger, James W.; Carlson, Ian H.; Porter, Warren P. “Endocrine, immune, and behavioral effects of aldicarb (carbamate), atrazine (triazine) and nitrate (fertilizer) mixtures at groundwater concentrations.” Toxicology and Industrial Health, 1999 (Vol. 15, Nos. 1/2), pp. 133-150.
68

Kolpin, Dana W.; Barbash, Jack E.; Gilliom, Robert J. “Occurrence of Pesticides in Shallow Ground Water of the United States: Initial Results from the National Water Quality Assessment Program. http://ca.water.usgs.gov/pnsp/ja/est32/ Adapted from original article published in Environmental Science & Technology, v 32, 1998. Metropolitan Council of the Twin Cities Area, on behalf of the Minnesota Department of Natural Resources, 1993, Guidebook for Local Groundwater Protection in Minnesota. Minnesota Department of Health, Nitrate Work Group, 1998, “Draft Guidance for Mapping Nitrate in Minnesota Groundwater.” Minnesota Pollution Control Agency, Ground Water Monitoring and Assessment Program. “Ground Water Quality in Cottage Grove, Minnesota.” June, 2000. http://www.pca.state.mn.us/water/groundwater/gwmap/rpt-gwq-cottage.pdf Montgomery Watson Harza, “Dakota County Vermillion River Volume Study.” January 2003. Mossler, John H. “Bedrock Geology.” Geologic Atlas of Dakota County, Minnesota. County Atlas Series, Atlas C-6, Plate 2 of 9, Bedrock Geology. University of Minnesota, Minnesota Geological Survey, 1990. Nolan, Bernard T.; Stoner, Jeffrey D. “Nutrients in Ground Waters of the Coterminous United States, 1992-1995.” Environmental Science and Technology, vol. 34, no. 7, 2000, p. 1156-1165. http://water.usgs.gov/nawqa/nutrients/pubs/est_v34_no7/ Nolan, Bernard T; Ruddy, Barbara C.; Hitt, Kerie J.; Helsel, Dennis R. “A National Look at Nitrate Contamination of Ground Water.” http://water.usgs.gov/nawqa/wcp/index.html Electronic version of article in Water Conditioning and Purification, v. 39, no. 12, pp 76-79, 1998. Replaces USGS Fact Sheet FS-092-96. Palen, Barbara M. “Bedrock Hydrogeology.” Geologic Atlas of Dakota County, Minnesota. County Atlas Series, Atlas C-6, Plate 6 of 9, Bedrock Hydrogeology. University of Minnesota, Minnesota Geological Survey, 1990. Palen, Barbara M. “Quaternary Hydrogeology.” Geologic Atlas of Dakota County, Minnesota. County Atlas Series, Atlas C-6, Plate 5 of 9, Quaternary Hydrogeology. University of Minnesota, Minnesota Geological Survey, 1990. Robertson, Steve, Minnesota Department of Health, Sourcewater Protection, 2002. Personal communication. Runkel, Anthony C.; Tipping, Robert G.; Alexander, E. Calvin, Jr.; Green, Jeffrey A.; Mossler, John H.; Alexander, Scott C. Hydrogeology of the Paleozoic Bedrock in Southeastern Minnesota. Minnesota Geological Survey, Report of Investigations 61, 2003. ftp://156.98.153.1/pub3/ri-61/RI61.pdf Stark, J.R.; Hanson, P.E.; Goldstein, R. M.; Fallon, J.D.; Fong, A.L.; Lee, K.E.; Kroening, S.E.; Andrews, W.J. “Water Quality in the Upper Mississippi River Basin, Minnesota, Wisconsin, South Dakota, Iowa, and North Dakota, 1995-98. United States Geological Survey Water Quality Circular 1211, 2000. http://water.usgs.gov/pubs/circ/circ1211/
69
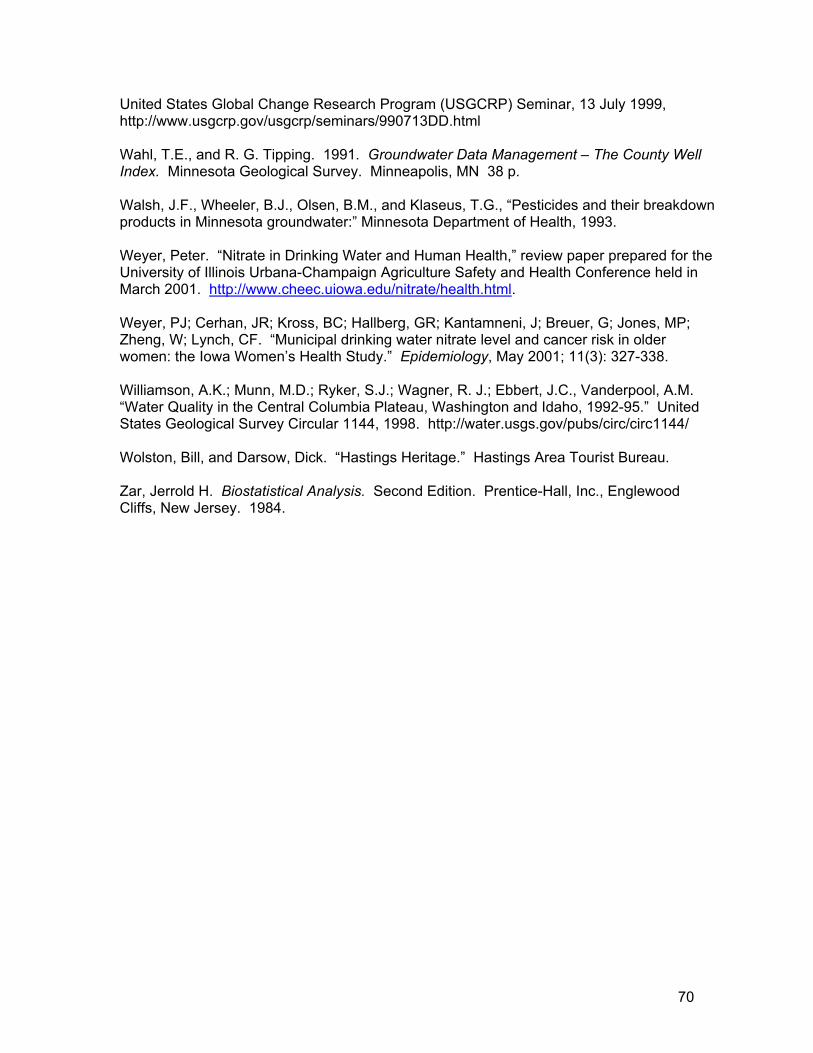
United States Global Change Research Program (USGCRP) Seminar, 13 July 1999, http://www.usgcrp.gov/usgcrp/seminars/990713DD.html Wahl, T.E., and R. G. Tipping. 1991. Groundwater Data Management – The County Well Index. Minnesota Geological Survey. Minneapolis, MN 38 p. Walsh, J.F., Wheeler, B.J., Olsen, B.M., and Klaseus, T.G., “Pesticides and their breakdown products in Minnesota groundwater:” Minnesota Department of Health, 1993. Weyer, Peter. “Nitrate in Drinking Water and Human Health,” review paper prepared for the University of Illinois Urbana-Champaign Agriculture Safety and Health Conference held in March 2001. http://www.cheec.uiowa.edu/nitrate/health.html. Weyer, PJ; Cerhan, JR; Kross, BC; Hallberg, GR; Kantamneni, J; Breuer, G; Jones, MP; Zheng, W; Lynch, CF. “Municipal drinking water nitrate level and cancer risk in older women: the Iowa Women’s Health Study.” Epidemiology, May 2001; 11(3): 327-338. Williamson, A.K.; Munn, M.D.; Ryker, S.J.; Wagner, R. J.; Ebbert, J.C., Vanderpool, A.M. “Water Quality in the Central Columbia Plateau, Washington and Idaho, 1992-95.” United States Geological Survey Circular 1144, 1998. http://water.usgs.gov/pubs/circ/circ1144/ Wolston, Bill, and Darsow, Dick. “Hastings Heritage.” Hastings Area Tourist Bureau. Zar, Jerrold H. Biostatistical Analysis. Second Edition. Prentice-Hall, Inc., Englewood Cliffs, New Jersey. 1984.
70

United States Geological SurveyNational Ambient Water Quality Assessment Program
Risk of Groundwater Contamination
Nol
an e
t al,
1998
HANS Figure 1
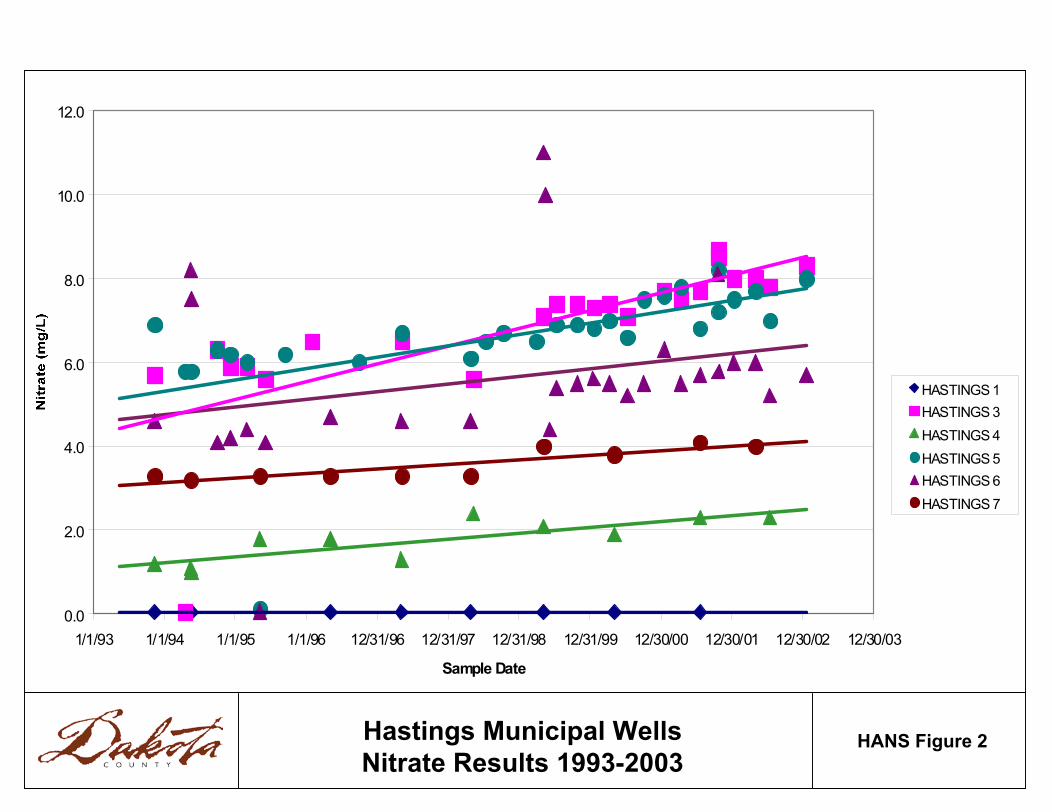
Hastings Municipal WellsNitrate Results 1993-2003
0.0
2.0
4.0
6.0
8.0
10.0
12.0
1/1/93 1/1/94 1/1/95 1/1/96 12/31/96 12/31/97 12/31/98 12/31/99 12/30/00 12/30/01 12/30/02 12/30/03
Sample Date
HASTINGS 1HASTINGS 3HASTINGS 4HASTINGS 5HASTINGS 6HASTINGS 7
HANS Figure 2
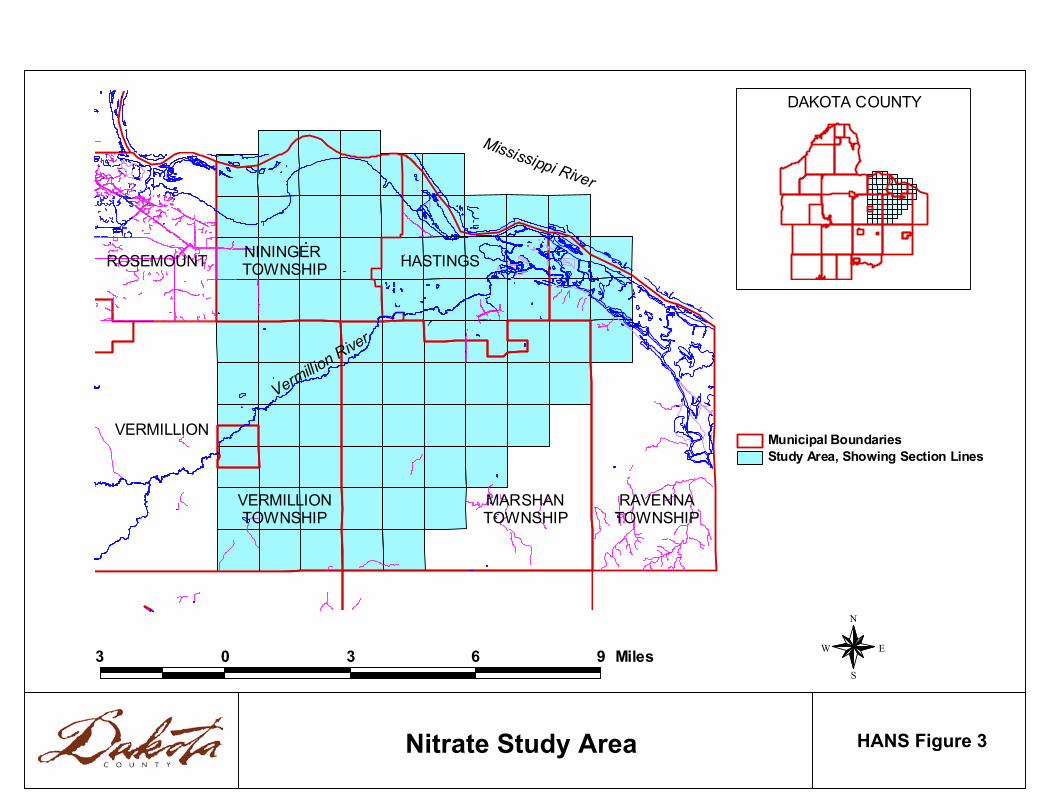
HANS Figure 3Nitrate Study Area
Study Area, Showing Section LinesMunicipal Boundaries
3 0 3 6 9 Miles
DAKOTA COUNTY
N
EW
S
HASTINGSNININGER TOWNSHIP
VERMILLIONTOWNSHIP
VERMILLION
MARSHANTOWNSHIP
ROSEMOUNT
RAVENNATOWNSHIP
Vermillion River
Mississippi River
5 0 5 10 Miles
Municipal BoundaryStudy Area
N
EW
S
2000 Digital Orthophoto HANS Figure 4

HANS Figure 52000 Land Cover Classification
Land Cover ClassificationBuildings/Pavement51%-75% ImperviousUp to 50% Impervious26%-50% Impervious11%-25% Impervious4%-10% ImperviousForest/WoodlandGrassland/PrairieMarshShrublandPlanted/cultivated vegetationCroplandWater
Municipal BoundariesStudy Area
N
EW
S
2 0 2 4 6 Miles
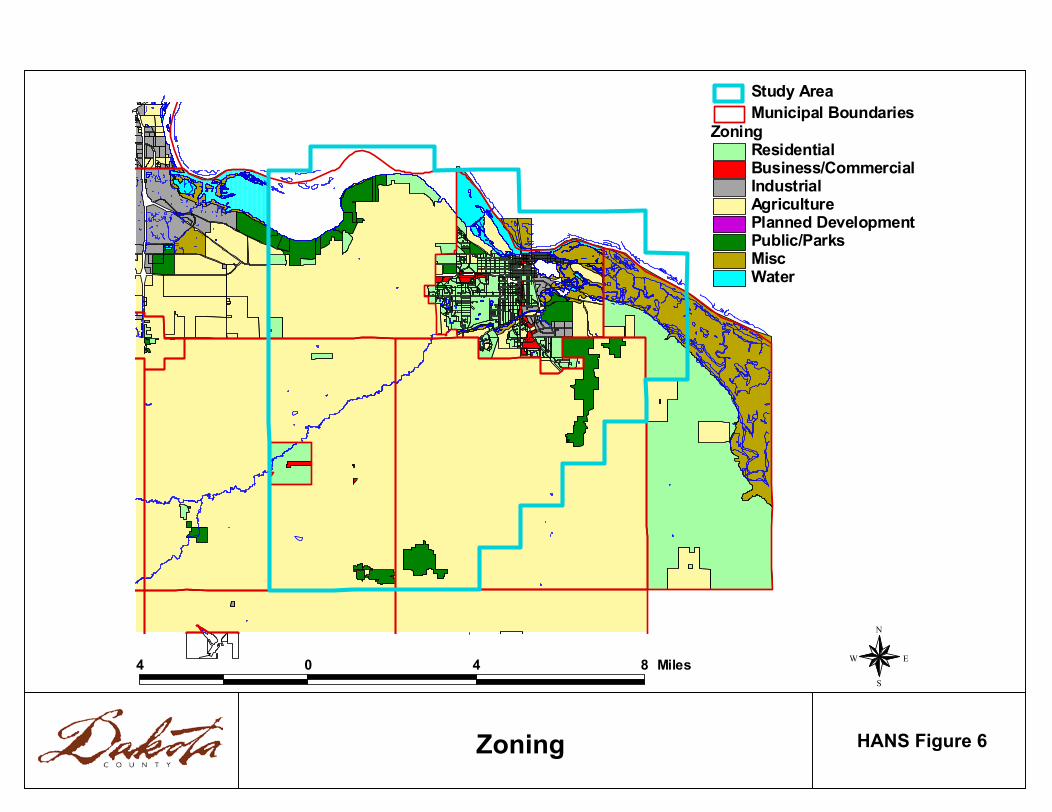
HANS Figure 6
ZoningResidentialBusiness/CommercialIndustrialAgriculturePlanned DevelopmentPublic/ParksMiscWater
Municipal BoundariesStudy Area
4 0 4 8 Miles
N
EW
S
Zoning

HANS Figure 7Municipal Services
######
#
##############
#############
###
##
####
#
##
#
###
#
#
##
###
## #
###
#
# #
##
## ##
##
#
##
#
#
#
##
#
#
#
#
## #
#
##
#
#
#
# #
##
#
###
##
#
#
### #
#
#
# ##
#
### ##
#
######
###
##
#
##
##
#
#
### #
#
#
##
# # # #
#
# #
## ##
#
#
####
##
#
#
##
# ## #####
#
#
##
# ####
#
##
#
#
#
##
##
##
##
#
##
###
#
## ##
##
##
#
# #
##
##
#
#####
#
##
## # ####
#
#####
####
#
#
#
#
#
#
#
#
###
#
#
#####
##########
####
#
##
#
###
##
##
######
####
###
#
# ## ###
##
##
####
#
##
####
####
## #
#####
##
# ########
###
##
###
#
##
#
##
#
######
#
####
##
#
####
##
#
## #
#
#
###
## ####
##
#
# ## ## ## ### #
#
##
##
## #
# #
##
#
##
#
##
#
#
##
#
##
##
#
###
##########
#
# ####
##
#
##
#
####
#####
##########
##
####
#######
####
###
# ## ##
#####
##
# ##
##
######
####
#################
####
#
######
##
####
#####
######
#
#
#
#
#
#####
#
##
##
# #####
##
#
##
#
###
#
#
#
#
# #
#
#
### #
######
##
#
#
#
###
###
#
#
#
#
#
##
#
#
#
# ##
#
#
## #
#
##
# #
#
###
##
# #
#
##
##
#
#
##
#
##
##
###
#
#
## # ## #
#
#
#
#
##### ### ##
# ###
#
#
#
#
# #
# #### ##
###
#
##
#
#######
##
##
### ###
## #
#
####
#
#######
##
##
#
#
##
#
#
#
#
# #
#
#
##
#####
#
############
###########
##
##
###
#
##
#
###
#
#
##
##
##
##
#
#
##
## ##
#
##
#
#
##
#
#
#
#
## ###
#
#
# #
#
#
##
##
# #
#
#
# ##
#
### ##
#
#####
###
##
#
##
##
#
#
## #
#
#
# # # #
#
#
###
#
###
#
#
##
# ## #####
#
#
##
# ####
#
##
#
#
#
##
##
##
##
#
##
###
#
# ##
##
##
#
#
##
####
#
##
# # ###
#
####
####
#
#
#
#
#
#
#
#
#####
#######
####
#
##
#
##
##
#####
###
###
#
# ## ###
###
####
#
##
####
#
## #
#####
#
#####
###
##
###
#
#
#
#
######
#
####
##
#
##
#
#
##
#
#
## ####
##
#
# ## ## #### #
#
##
##
## #
# #
##
##
##
#
#
##
#
##
##
#
###
####
#####
#
# ## #
##
#
########
#########
##
###
#######
###
##
#####
##
# ##
##
#####
#
###############
###
##
##
####
###
#####
##
#
#
###
##
# #####
#
#
#
###
#
#
#
#
# #
#
#
### #
######
## ###
###
#
#
#
#
##
#
#
# #
#
#
#
#
##
#
#
##
##
# #
#
##
#
#
#
##
#
##
##
##
#
#
## ## #
#
#
#
##### ## ##
# ##
#
#
# #
# ###
##
###
#
##
#
#######
##
#
### ##
##
#
######
##
#
#
#
##
#
#
#
# #
#
#
##
Municipal BoundariesMetropolitan Urban Services, 2040 (est.)Metropolitan Urban Services 1998Study Area
# No information on septic system maintenance or construction
Septic Systems# Built or maintained within the past 3 years (1998-2002)# Built or maintained 3 to 10 years ago (1992-1998)# Built or maintained more than 10 years ago
N
EW
S
4 0 4 8 Miles

HANS Figure 8Bedrock Geology
Bedrock GeologyPlatteville & Glenwood FormationsSt. Peter SandstonePrairie du Chien LimestoneJordan SandstoneFranconia Sandstone/Shale
Municipal BoundariesStudy Area
5 0 5 10 Miles
N
EW
S

HANS Figure 9
Depth to BedrockLess than 5051-100101-150151-200201-250251-300301-350351-400401-500More than 500
Municipal BoundariesStudy Area
5 0 5 10 Miles
N
EW
S
Depth to Bedrock

Surficial (Quaternary) GeologyFloodplain AlluviumColluviumSlopewash SandLower River TerraceMiddle River TerraceUpper River TerraceDes Moines/Superior Mixed OutwashSuperior OutwashRiver Falls (Pre-Wisconsinan) Drift"Old Gray" (Pre-Wisconsinan) TillBedrockWater
Bedrock GeologyPlatteville & Glenwood FormationsSt. Peter SandstonePrairie du Chien LimestoneJordan SandstoneFranconia Sandstone/Shale
Municipal BoundariesStudy Area
4 0 4 8 Miles
N
EW
S
HANS Figure 10Surficial (Quaternary) Geology

HANS Figure 11General Soil Type
SoilsSilty ClayClayClay LoamLoamSandy LoamSandUnknownWater
Municipal BoundariesStudy Area
5 0 5 10 Miles
N
EW
S

HANS Figure 12Groundwater Sensitivity to Pollution
Pollution Sensivity: Water Transit from Surface to AquiferVery High -- Hours to MonthsHigh -- Weeks to yearsHigh-Moderate -- Years to a decadeModerate -- Several years to decadesWater
Municipal BoundariesStudy Area
3 0 3 6 Miles
N
EW
S
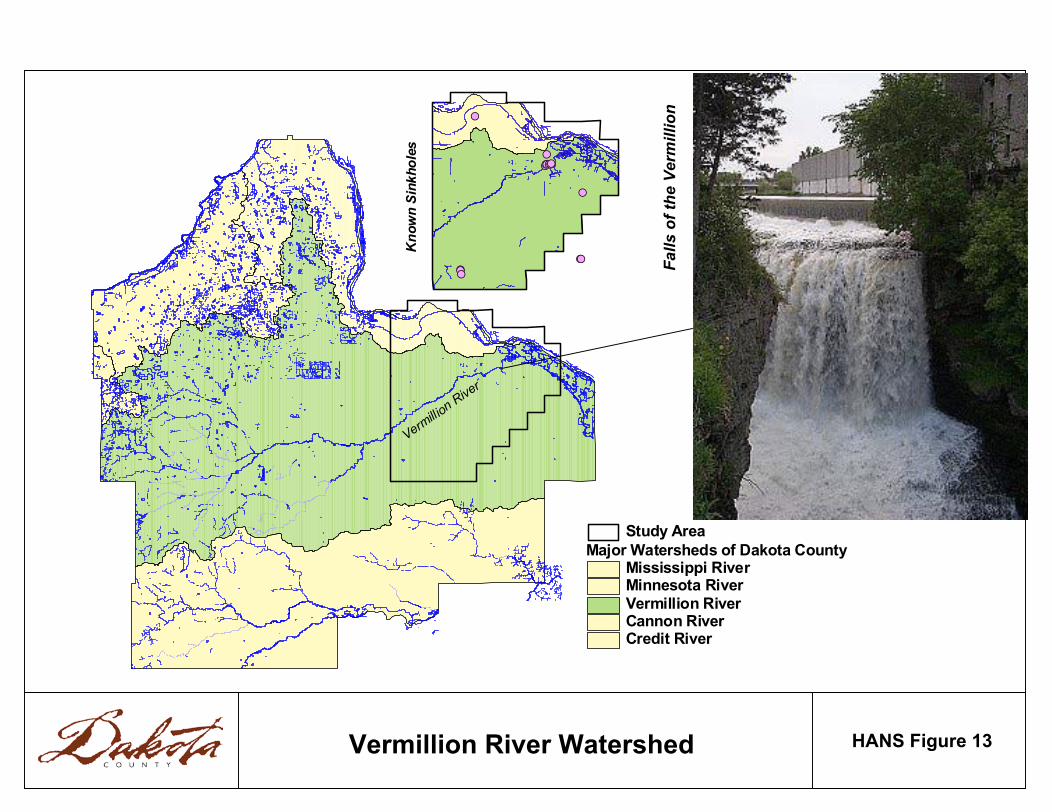
HANS Figure 13Vermillion River Watershed
Vermillio
n River
Major Watersheds of Dakota CountyMississippi RiverMinnesota RiverVermillion RiverCannon RiverCredit River
Study Area
#S
#S#S#S#S#S#S#S
#S
#S#S#S#S#S
Kno
wn
Sink
hole
s
Falls
of t
he V
erm
illio
n

HANS Figure 14
#S
#S
#S#S
#S
#S
#S
#S
#S
#S
#S
#S
#S
#S
#S#S
#S
#S
#S
#S
#S
#S#S#S
#S
#S
#S
#S
#S
#S
#S
#S
#S
#S
#S
#S
#S
#S
#S
#S
#S #S
#S
#S
#S
#S
#S
#S
#S
#S
#S
#S
#S
#S
#S#S
#S
#S
#S
#S
#S
#S
#S
#S
#S
#S
#S
#S
#S
#S
#S
#S
#S
#S
#S
#S
#S
#S
#S
#S
#S#S
#S
#S
#S
#S
#S
#S
#S
#S
#S
#S
#S
#S
#S
#S
#S
#S
#S
#S
#S
#S#S
#S
#S
#S
#S
#S
#S
#S
#S
#S
#S
#S
#S
#S
#S
#S
#S
#S
#S
#S
#S
#S
#S
#S
#S
#S
#S
#S
#S
#S
#S#S
#S #S
#S
#S
#S
#S
#S
#S
#S#S
#S #S#S
$Z$Z
$Z
$Z$Z
$Z
$Z$Z
Municipal BoundaryStudy Area
Nitrate Results#S 0 - 1 Background#S 1 - 3 Showing Human Impact#S 3 - 10 Elevated#S 10 - 40 Exceeds Drinking Water Standard
$Z Municipal Wells
5 0 5 10 Miles
N
EW
S
Nitrate Results

HANS Figure 15Nitrate Results
Background (0-1 ppm)
41%
Elevated(3-10 ppm)
26%
Exceeds Drinking Water Standard(10 ppm or more)
26%
Showing Human Impact (1-3 ppm)
7%

HANS Figure 17
Caffeine&
Pesticides 59%
Caffeine and Pesticide Detections
CaffeineOnly 30%
Pesticides Only 11%
Neither0%
Caffeine was detected in 89%
of wells sampled
Pesticides were detected in 70%
of wells sampled

HANS Figure 18Monitoring Well Locations
ððð
ðð
ððð
GW907: Near river, shallow
GW910: Near river, deep
GW912: Away from river, deep
GW908: Away from river, shallowGW909: Near river, deep
GW913: Near river, shallowGW914: Away from river, shallowGW915: Near river, deep
Bedrock GeologyPlatteville & Glenwood FormationsSt. Peter SandstonePrairie du Chien LimestoneJordan SandstoneFranconia Sandstone/Shale
Municipal BoundariesStudy Area
ð HANS Monitoring Wells
5 0 5 10 Miles
N
EW
S
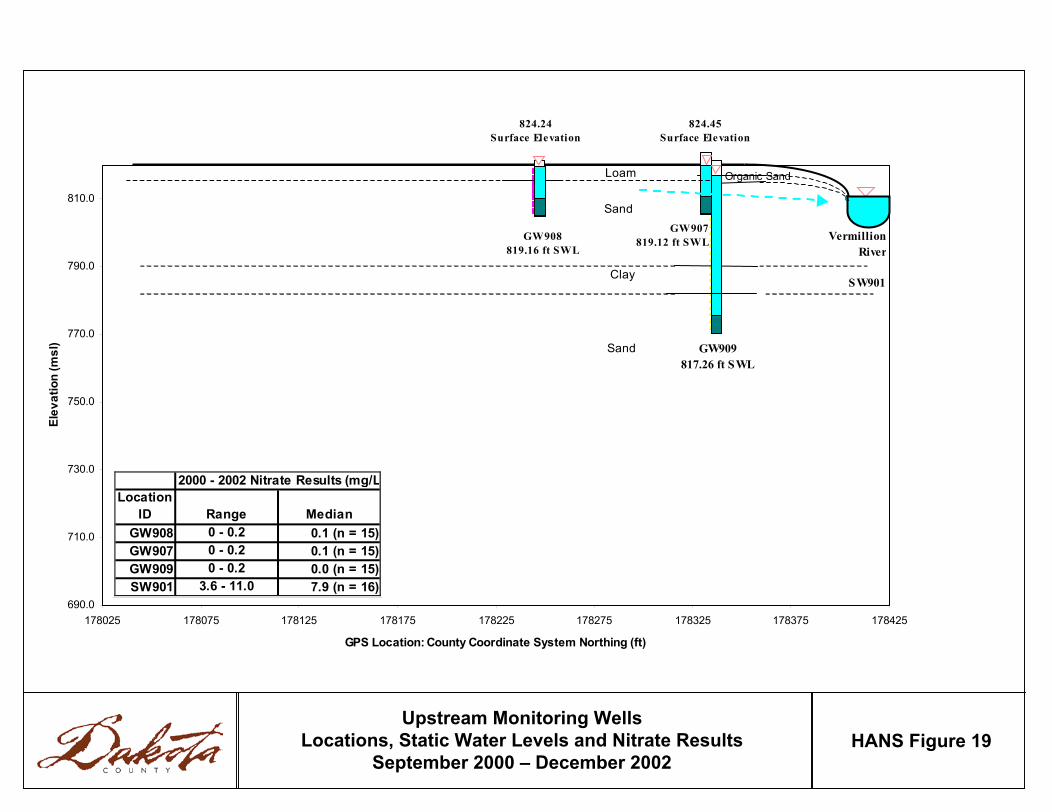
690.0
710.0
730.0
750.0
770.0
790.0
810.0
178025 178075 178125 178175 178225 178275 178325 178375 178425
GPS Location: County Coordinate System Northing (ft)
Elev
atio
n (m
sl)
GW907819.12 ft SWL
GW909817.26 ft SWL
GW908819.16 ft SWL
Loam
Sand
Clay
Sand
Organic Sand
VermillionRiver
824.24 Surface Elevation
824.45 Surface Elevation
SW901
HANS Figure 19Upstream Monitoring Wells
Locations, Static Water Levels and Nitrate ResultsSeptember 2000 – December 2002
Location ID Range Median
GW908 0 - 0.2 0.1 (n = 15)GW907 0 - 0.2 0.1 (n = 15)GW909 0 - 0.2 0.0 (n = 15)SW901 3.6 - 11.0 7.9 (n = 16)
2000 - 2002 Nitrate Results (mg/L

690.0
710.0
730.0
750.0
770.0
790.0
810.0
185550 185600 185650 185700 185750 185800 185850 185900
GPS Location: County Coordinate System Northing (ft)
Elev
atio
n (m
sl)
GW912747.84 ft SWL
GW910747.38 ft SWL
Loam
SandFine Sand
Silty SandVery Fine Sand
Limestone/Sand
Sand & Rock
Sand
Fine Sand
VermillionRiver
816.20Surface Elevation
809.61Surface Elevation
SW902
HANS Figure 20Monitoring Wells over Buried Bedrock Valley
Locations, Static Water Levels, and Nitrate ResultsOctober 2000 – December 2002
Location ID Range Median
GW912 0.1 - 32.0 19.0 (n = 15)GW910 0.5 - 7.1 4.4 (n = 15)SW902 3.4 - 11 8.4 (n = 15)
2000 - 2002 Nitrate Results (mg/L

690.0
710.0
730.0
750.0
770.0
790.0
810.0
190350 190400 190450 190500 190550 190600 190650 190700
GPS Location: County Coordinate System Northing (ft)
Elev
atio
n (m
sl)
GW914747.25 ft SWL
GW915747.18 ft SWL
GW913750.23 ft SWL
Very Fine Sand
Fine Sand
Sand & Rock
LoamSand
Fine Sand
Fine SiltySand
Fine Sand
Fine Silty Sand
SWL Key:March 2001April 2001May 2001
VermillionRiver
795.25Surface Elevation
794.12Surface Elevation
SW903
Location ID Range Median
GW914 0.2 - 7.5 4.4 (n = 15)GW915 0.1 - 7.2 5.79 (n = 14)GW913 1.95 - 8.9 5.9 (n = 15)SW903 3.5 - 11 7.35 (n = 16)
2000 - 2002 Nitrate Results (mg/L
HANS Figure 21Downstream Monitoring Wells
Locations, Static Water Levels, and Nitrate ResultsOctober 2000 – December 2002