Embed Size (px)
Citation preview
Supplemen
Hate crime, cyber security and the experience of crime among children: Findings from the 2010/11 British Crime Survey:
Supplementary Volume 3 to Crime in England and Wales 2010/11
Kevin Smith (Ed.), Deborah Lader, Jacqueline Hoare and Ivy Lau
March 2012 06/12
Home Office Statistical Bulletin
Statistical Bulletins are prepared by
staff in Home Office Statistics under
the National Statistics Code of
Practice and can be downloaded
from both the UK Statistics Authority
website and the Home Office
website:
http://www.statistics.gov.uk
http://www.homeoffice.gov.uk/science-
research
© Crown Copyright 2012
You may re-use this information (not
including logos) free of charge in
any format or medium, under the
terms of the Open Government
Licence. To view this licence, visit
http://www.nationalarchives.gov.uk/doc/o
pen-government-licence/
or write to the Information Policy
Team, The National Archives, Kew,
London, TW9 4DU or e-mail:
ISSN 1759-7005 ISBN 978 1 84987 728 2

2
Hate crime, cyber security and the experience of crime among children: Findings from the 2010/11 British Crime Survey
Supplementary Volume 3 to Crime in England and Wales 2010/11
Kevin Smith (Ed.), Deborah Lader, Jacqueline Hoare and Ivy Lau
ISSN 1759-7005
ISBN 978 1 84987 728-2
March 2012
3
Acknowledgements
This publication and the accompanying web tables have been prepared by staff in the Crime Statistics Programme, which is part of the Home Office Statistics Unit of Home Office Science. The editor and authors are grateful for the support received from: Maya Bhudia, Andrew Britton, Richard Cheeseman, John Flatley, Jennifer Parfrement-Hopkins, Phil Hall, Jenny Innes, Rachel Murphy, Sarah Osborne and Tim Pateman. Special thanks are due to Irene Ogunbor who coordinated the production of the volume. The editor also thanks David Blunt, the Home Office Chief Statistician and Head of Profession for Statistics for his support and guidance during the preparation of this report. Thanks also to colleagues who commented on a draft report during quality assurance of this bulletin and to colleagues in the Communications Development Section who assisted in preparing the report. We would also like to thank staff involved in the work on the British Crime Survey (BCS) at TNS-BMRB, the interviewers working on the BCS and members of the public who kindly agreed to take part in the survey.
Further information
Copies of other Home Office publications are available from the Home Office Science Internet pages: http://www.homeoffice.gov.uk/science-research/research-statistics/ The dates of forthcoming publications are pre-announced and can be found via the UK National Statistics Publication Hub: http://www.statistics.gov.uk/hub/index.html
For further information about the British Crime Survey and police recorded crime statistics, please email [email protected] or write to: Home Office Statistics, 5th Floor, Peel Building, 2 Marsham Street, London, SW1P 4DF Home Office Responsible Statistician David Blunt, Chief Statistician and Head of Profession for Statistics Contact via [email protected]
The United Kingdom Statistics Authority has designated these statistics as National Statistics, in accordance with the Statistics and Registration Service Act 2007 and signifying compliance with the Code of Practice for Official Statistics. Designation can be broadly interpreted to mean that the statistics: meet identified user needs; are well explained and readily accessible; are produced according to sound methods; and are managed impartially and objectively in the public interest. Once statistics have been designated as National Statistics it is a statutory requirement that the Code of Practice shall continue to be observed. This statistical bulletin is produced to the highest professional standards and is free from political interference. It has been produced by statisticians working in the Home Office Statistics Unit in accordance with the Home Office’s Statement of Compliance with the Code of Practice for Official Statistics, which covers our policy on revisions and other matters. The Home Office Statistics Unit works under the direct line management of the Home Office Chief Statistician, who reports to the National Statistician with respect to all professional statistical matters. From April 2012 publication of Crime Statistics bulletins will transfer to the Office for National Statistics.
This publication should be read in conjunction with the User Guide to Home Office Crime Statistics, a useful reference guide with explanatory notes regarding the issues and classifications which are key to the production and presentation of the crime statistics: http://www.homeoffice.gov.uk/publications/science-research-statistics/research-statistics/crime-research/user-guide-crime-statistics/
4
Contents
Page
Introduction ...................................................................................................................................... 7
Conventions used in figures and tables ........................................................................................... 8
List of figures ...................................................................................................................................... 9
List of tables .................................................................................................................................... 10
Chapter 1 The extent of and perceptions towards hate crime ............................................... 13
Deborah Lader
1.1 Summary ............................................................................................................... 13
1.2 Introduction ........................................................................................................... 14
1.3 Extent of hate crime .............................................................................................. 17
1.4 Repeat victimisation .............................................................................................. 19
1.5 Reporting hate crime ............................................................................................ 20
1.6 Victim satisfaction with the police ......................................................................... 20
1.7 Effects of hate crime ............................................................................................. 22
1.8 Worry about hate crime and perceptions of the likelihood of victimisation ........... 23
1.9 Age and gender-motivated hate crime ................................................................. 25
1.10 Other sources of hate crime data ....................................................................... 25
Chapter 2 Use of the internet and cyber security ................................................................... 41
Jacqueline Hoare
2.1 Summary ............................................................................................................... 41
2.2 Introduction ........................................................................................................... 42
2.3 Levels of internet use ............................................................................................ 42
2.4 What the internet is used for ................................................................................. 43
2.5 Worry about security of personal details .............................................................. 45
5
Supplementary Volume 3 to Crime England and Wales 2010/2011
2.6 Protecting personal details ................................................................................... 46
2.7 Perceived barriers to internet use ......................................................................... 48
2.8 Negative experiences while using the internet ..................................................... 50
Chapter 3 Experimental statistics on the experience of crime among children aged 10 to 15 ....................................................................................................................... 65
Ivy Lau and Jacqueline Hoare
3.1 Summary ............................................................................................................... 65
3.2 Introduction ........................................................................................................... 66
3.3 The nature of violence .......................................................................................... 67
3.4 The nature of theft ................................................................................................ 70
3.5 Variation in victimisation rates among children .................................................... 72
Bibliography .................................................................................................................................... 83
6
Introduction
This bulletin is the third and final in a series of supplementary volumes that accompany the main
annual Home Office Statistical Bulletin, ‘Crime in England and Wales 2010/11’ (Chaplin et al., 2011).
These supplementary volumes report on additional analysis not included in the main annual
publication.
This bulletin covers three topic areas. These are:
The extent of and perceptions towards hate crime
This chapter contains analysis of figures from the 2009/10 and 2010/11 British Crime Surveys,
including extent and reporting of hate crime, its effects on victims and victim satisfaction with the
police. It also looks at a range of public perception measures relating to hate crime. Questions were
asked of adults aged 16 or over in England and Wales.
Use of the internet and cyber security
This chapter contains information from the 2010/11 British Crime Survey on levels of internet use,
concerns people may have about using the internet, and any measures taken to protect personal
details when using the internet. Variations by age and sex are highlighted throughout the chapter.
Questions were asked of adults aged 16 or over in England and Wales.
Experimental statistics on the experience of crime among children aged 10 to 15
This chapter is based on data collected from 10 to 15 year olds who took part in the 2010/11 British
Crime Survey. Questions were asked of children in England and Wales who had experienced a crime
about the circumstances of the incident, any details on the offender(s) and their views of the incident.
Experimental statistics is a designation for statistics still in a development phase.
7
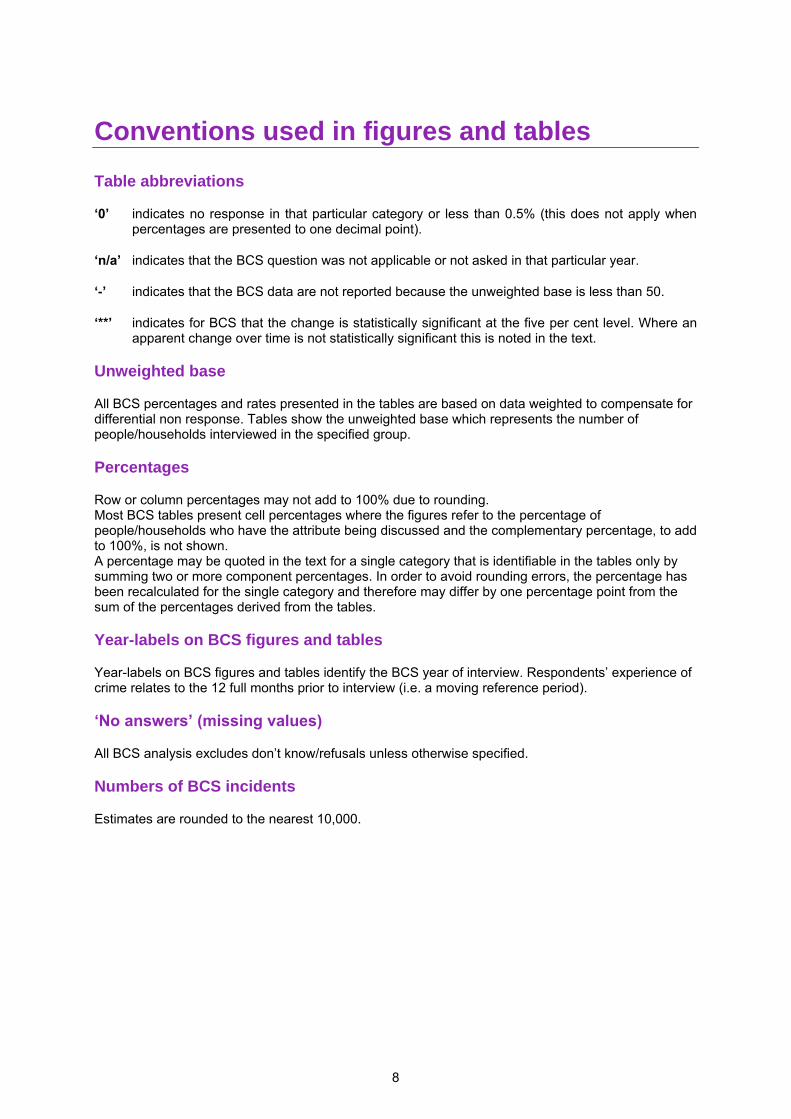
Conventions used in figures and tables
Table abbreviations
‘0’ indicates no response in that particular category or less than 0.5% (this does not apply when percentages are presented to one decimal point).
‘n/a’ indicates that the BCS question was not applicable or not asked in that particular year.
‘-’ indicates that the BCS data are not reported because the unweighted base is less than 50.
‘**’ indicates for BCS that the change is statistically significant at the five per cent level. Where an apparent change over time is not statistically significant this is noted in the text.
Unweighted base
All BCS percentages and rates presented in the tables are based on data weighted to compensate for differential non response. Tables show the unweighted base which represents the number of people/households interviewed in the specified group.
Percentages
Row or column percentages may not add to 100% due to rounding. Most BCS tables present cell percentages where the figures refer to the percentage of people/households who have the attribute being discussed and the complementary percentage, to add to 100%, is not shown. A percentage may be quoted in the text for a single category that is identifiable in the tables only by summing two or more component percentages. In order to avoid rounding errors, the percentage has been recalculated for the single category and therefore may differ by one percentage point from the sum of the percentages derived from the tables.
Year-labels on BCS figures and tables
Year-labels on BCS figures and tables identify the BCS year of interview. Respondents’ experience of crime relates to the 12 full months prior to interview (i.e. a moving reference period).
‘No answers’ (missing values)
All BCS analysis excludes don’t know/refusals unless otherwise specified.
Numbers of BCS incidents
Estimates are rounded to the nearest 10,000.
8
List of figures
Chapter 1 The extent of and perceptions towards hate crime ............................................... 13
Figure 1.1 Victim satisfaction with the police, 2009/10 and 2010/11 BCS .................................. 21
Figure 1.2 Emotional impact of hate crime incident, 2009/10 and 2010/11 BCS ........................ 22
Figure 1.3 Perceptions of crime by ethnic group, 2009/10 and 2010/11 BCS ............................. 24
Chapter 2 Use of the internet and cyber security ................................................................... 41
Figure 2.1 Types of activities that the internet is used for among internet users aged 16 and over, 2010/11 BCS .............................................................................................. 44
Figure 2.2 Variation by age in use of activities among internet users aged 16 and over, 2010/11 BCS ............................................................................................................... 44
Figure 2.3 Proportion of internet users aged 16 and over taking measures to protect personal details online, 2010/11 BCS......................................................................... 47
Figure 2.4 Proportion of internet users aged 16 and over who experienced a computer virus in the last 12 months by age, sex and internet usage, 2010/11 BCS ................ 51
Chapter 3 Experimental statistics on the experience of crime among children aged 10 to 15 ....................................................................................................................... 65
Figure 3.1 Proportion of violent incidents experienced by children and adults by timing of incident, 2010/11 BCS ................................................................................................ 68
Figure 3.2 Proportion of violent incidents experienced by children and adults by relationship to the offender, 2010/11 BCS .................................................................. 69
Figure 3.3 Variation in violence victimisation rate among children aged 10 to 15 by household income, 2010/11 BCS ............................................................................... 74
9
List of tables
Chapter 1 The extent of and perceptions towards hate crime ............................................... 13
Table 1a Percentage of incidents that were identified as hate crime by type of incident ......... 18
Table 1.01 Number of incidents of hate crime and all BCS crime, by monitored strand ............. 27
Table 1.02 Incidence rate of hate crime and all BCS crime, by monitored strand ....................... 27
Table 1.03 Proportion of adults and households who were victims of hate crime and all BCS crime, by monitored strand ........................................................................................ 28
Table 1.04 Proportion of adults who were victims of hate crime and all BCS crime, by personal characteristics ............................................................................................................ 29
Table 1.05 Proportion of adults and households who were victims of hate crime and all BCS crime, by household and area characteristics ........................................................... 30
Table 1.06 Proportion of adults who were victims of racially-motivated hate crime, by ethnic group .......................................................................................................................... 31
Table 1.07 Proportion of adults who were victims of religion-motivated hate crime, by ethnic group and religion ................................................................................................................. 32
Table 1.08 Proportion of adults who were victims of sexual-orientation-motivated hate crime, by age and sex ............................................................................................................... 32
Table 1.09 Proportion of adults who were victims of disability-motivated hate crime, by employment status and presence of long-standing illness or disability ...................... 33
Table 1.10 Number of times victims were victimised in previous year ......................................... 33
Table 1.11 Proportion of BCS crime incidents reported to the police ........................................... 34
Table 1.12 Reasons for not reporting crime incident to the police ............................................... 34
Table 1.13 Satisfaction with police handling of crime incidents ................................................... 35
Table 1.14 Emotional impact of crime incident ............................................................................ 35
Table 1.15 Perceptions of racially-motivated hate crime, by ethnic group .................................. 36
Table 1.16 Age- and gender-motivated hate crime .................................................................... 37
Table 1.17 Proportion of adults who were victims of age-motivated hate crime, by age and sex .............................................................................................................................. 38
Table 1.18 Proportion of adults who were victims of gender-motivated hate crime, by age and sex ............................................................................................................................ 39
10
List of tables
Chapter 2 Use of the internet and cyber security ................................................................... 41
Table 2a Negative experiences in the last year among internet users aged 16 and over ........ 51
Table 2.01 Proportion of adults using the internet in the last year, by age and sex ..................... 54
Table 2.02 Frequency of internet use among adults who used the internet in the last year, by age and sex ....................................................................................................................... 55
Table 2.03 Internet activities among adults who used the internet in the last year, by age, sex and internet usage ............................................................................................................. 56
Table 2.04 Proportion of adults who had used the internet in the last year for each activity who were worried about the security of personal details entered online for that activity ... 57
Table 2.05 Proportion of adults who had used the internet in the last year for each activity who were worried about the security of personal details entered online for that activity, by age, sex and internet usage ....................................................................................... 58
Table 2.06 Measures taken by adults who used the internet in the last year to protect personal details online, by age, sex and internet usage ........................................................... 59
Table 2.07a Reasons for not using the internet for buying goods or services among adults who used the internet in the last year, by age, sex and internet usage ............................. 60
Table 2.07b Reasons for not using the internet for online banking or managing finances among adults who used the internet in the last year, by age, sex and internet usage ........... 61
Table 2.07c Reasons for not using the internet for online government services among adults who used the internet in the last year, by age, sex and internet usage ............................. 62
Table 2.08 Negative experiences in the last year among internet users, by age, sex and internet usage .......................................................................................................................... 63
Chapter 3 Experimental statistics on the experience of crime among children aged 10 to 15 ....................................................................................................................... 65
Table 3.01 Experimental statistics: Where incidents experienced by children aged 10 to 15 took place ........................................................................................................................... 76
Table 3.02 Experimental statistics: Timing of when incidents experienced by children aged 10 to 15 took place ............................................................................................................... 76
Table 3.03 Experimental statistics: Offender characteristics in incidents experienced by children aged 10 to 15 .............................................................................................................. 77
Table 3.04 Experimental statistics: What injuries were sustained in violent incidents experienced by children aged 10 to 15 ........................................................................................... 78
Table 3.05 Experimental statistics: What weapons were used in violent incidents experienced by children aged 10 to 15 ................................................................................................ 78
11
Supplementary Volume 3 to Crime in England and Wales 2010/2011
Table 3.06 Experimental statistics: Perceptions of incidents experienced by children aged 10 to 15 ................................................................................................................................ 79
Table 3.07 Experimental statistics: Who incidents experienced by children aged 10 to 15 were reported to ................................................................................................................... 79
Table 3.08 Experimental statistics: What items were stolen in thefts experienced by children aged 10 to 15 ....................................................................................................................... 80
Table 3.09 Experimental statistics: Proportion of children aged 10 to 15 who experienced victimisation in the last year, by personal characteristics ........................................... 81
Table 3.10 Experimental statistics: Proportion of children aged 10 to 15 who experienced victimisation in the last year, by household and area characteristics ......................... 82
12
1 The extent of and perceptions towards hate crime
Deborah Lader
1.1 SUMMARY
This chapter presents findings from the 2009/10 and 2010/11 British Crime Survey (BCS). Data from the two survey years have been combined to provide more robust estimates of hate crime. Hate crime is any crime which is perceived as having been motivated (entirely or partially) by a hostility or prejudice to a personal characteristic or perceived personal characteristic, such as ethnicity or religion.
The 2009/10 and 2010/11 BCS showed that 0.5 per cent of adults were victims of hate crime1 in
the 12 months prior to interview. A similar percentage were victims of personal hate crime and household hate crime (0.2%). In comparison, 22 per cent of adults were victims of at least one BCS crime overall.
The monitored strand most commonly perceived by the victim as an offender’s motivation for committing a crime was the victim’s race (accounting for an estimated 136,000 incidents on average per year).
Hate crime was more likely to be repeatedly experienced for household crime offences than for personal crime offences; 37 per cent of victims of household hate crime had been victimised more than once, compared with 19 per cent of victims of personal hate crime. This difference is larger than that found in the BCS overall (29% of victims of BCS household crime were repeat victims, compared with 21% of victims of BCS personal crime).
The police were more likely to come to know about hate crime than BCS crime overall; 49 per cent of incidents of hate crime came to the attention of the police compared with 39 per cent of incidents of BCS crime overall.
Fifty-three per cent of hate crime victims were satisfied with the police handling of the hate crime incident (33% were very satisfied and 21% were fairly satisfied) and 45 per cent were not satisfied. Victims of hate crime were less satisfied with this police contact than victims of BCS crime overall: 53 per cent and 69 per cent respectively were satisfied (very or fairly).
In only 45 per cent of incidents of hate crime, victims thought the police took the matter as seriously as they should, compared with 65 per cent of incidents of BCS crime overall.
Victims of hate crime were less likely to think the police had treated them fairly or with respect, compared with victims of BCS crime overall. For example, in 63 per cent of hate crime incidents victims thought the police treated them fairly, compared with 79 per cent of incidents of BCS crime overall. Similarly, in 76 per cent of incidents of hate crime, victims thought the police treated them with respect, compared with 89 per cent of incidents of BCS crime overall.
Victims of hate crime were more likely than victims of BCS crime overall to say they were emotionally affected by the incident (92% and 86% respectively).
1 Monitored hate crime covers five ‘strands’: disability; race; religion/faith; sexual orientation; and gender-identity. The BCS asks
about the first 4 of these. Questions on gender identity were added to the BCS in 2011/12. See Section 1.2 for further discussion of hate strands.
13
Supplementary Volume 3 to Crime in England and Wales 2010/11
1.2 INTRODUCTION
This is the first Home Office Statistics publication to produce information on hate crime, although breakdowns of overall crime and individual crime types have been shown by different characteristics (age, sex, ethnicity, etc.) in previous publications (Chaplin et al., 2011, Botherby et al., 2011
2).
Challenge it, Report it, Stop it: The Government’s Plan to Tackle Hate Crime3 sets out the challenges
faced in tackling hate crime. It brings together activity by a wide range of Government Departments – working with local agencies and voluntary sector organisations, as well as with its Independent
Advisory Group on Hate Crime – to meet three key objectives to: prevent hate crime happening in the
first place; increase reporting and victims’ access to support; and improve the operational response to hate crimes.
In 2007, the police, Crown Prosecution Service (CPS), Prison Service (now the National Offender Management Service) and other agencies that make up the criminal justice system agreed a common definition of ‘hate crime’ and five ‘strands’ that would be monitored centrally:
‘Hate crime is defined as any criminal offence which is perceived, by the victim or any other person, to be motivated by a hostility or prejudice towards someone based on a personal characteristic.’
The five monitored strands are:
disability;
gender-identity;
race;
religion/faith; and
sexual orientation.4
These characteristics are referred to as equality strands. Primarily, this was to ensure a consistent working definition to allow accurate recording and monitoring. Crimes based on hostility to age, gender, or appearance, for example, can also be hate crimes, although they are not centrally monitored.
Hate crime can take many forms including:
physical attacks such as assault, grievous bodily harm and murder, damage to property, offensive graffiti and arson;
threat of attack including offensive letters, abusive or obscene telephone calls, groups hanging around to intimidate, and unfounded, malicious complaints; and
verbal abuse, insults or harassment − taunting, offensive leaflets and posters, abusive gestures, dumping of rubbish outside homes or through letterboxes, and bullying at school or in the workplace.
2 Botcherby, et al. (2011) conducted an analysis of a combined 2007/08, 2008/09 and 2009/10 BCS dataset to look at hate
crime incidents in England and Wales for the Equality and Human Rights Commission. The research paper looked at different equality groups’ expectations about being insulted and their experience of intimidation, threats, violence and crime. It also analysed the experience and reporting of hate crime.
3 http://www.homeoffice.gov.uk/publications/crime/hate-crime-action-plan/ 4 http://cps.gov.uk/news/fact_sheets/hate_crime/index.html
14
The extent of and perceptions towards hate crime
Whether a crime or incident is hate-related has a subjective element as it relies on an individual’s perceptions and reporting of the incident and so what is included or excluded may vary between individuals.
The police have been recording reported hate crimes since 1 April 2008 for the five monitored strands listed above. Figures (covering England, Wales and Northern Ireland for 2009) were first published by The Association of Chief Police Officers (ACPO) in 2010, and figures for 2010 were published in September 2011.
5 Further details can be found in Section 1.10.
Measuring hate crime on the British Crime Survey
The British Crime Survey (BCS) is a face-to-face victimisation survey in which people resident in households in England and Wales are asked about their experiences of crime in the 12 months prior to interview.
6 Due to the low volume of hate crime offences the figures are too unreliable to report for a
single year of the BCS. Data from two survey years (2009/10 and 2010/11) have therefore been combined to give more robust estimates by increasing the number of incidents available for analysis. Hence for the combined 2009/10 and 2010/11 BCS, the analysis includes incidents experienced by respondents between April 2008 and February 2011. It should be noted that figures reported in this chapter are 12-month averages of the estimates from the two survey years and so are comparable with 12-month BCS estimates presented elsewhere in this and other Home Office Statistics bulletins.
Given this longer reference period, there are limitations to how findings can be generalised to the population as a whole, so the findings should be used as a guide to the level of hate crime.
The BCS question on whether an incident was motivated by race was first introduced in 1988, and has been kept as a separate question since then. BCS information on racially-motivated hate crime has been previously published in the Ministry of Justice’s publication on Race and the Criminal Justice System.
7
Religiously-motivated hate crime used to be asked about as a separate question (in the 2005/06 and 2006/07 BCS) but was merged into the main BCS question when further hate crime questions referring to sexual orientation, age and disability were introduced in 2007/08. In 2009/10, gender was added as a motivation, and transgender or gender identity was added as a motivation to the 2011/12
survey; hence results are not yet available. Details of the questions are in Box 1.1 overleaf.
Police recorded crime provides good coverage of well-reported crimes committed against the public and enable police force level analysis of hate crime. The BCS crime estimates are higher than the number of crimes recorded by the police as the survey captures offences that are not reported to or recorded by the police. Together the BCS and police recorded crime provide a more comprehensive picture than could be obtained from either series alone.
5 http://www.acpo.presscentre.com/Press-Releases/ACPO-publishes-hate-crime-data-for-2010-111.aspx 6 See Section 2.4 of the User Guide for details of reference periods. 7 Statistics on Race and the Criminal Justice System available at: http://www.justice.gov.uk/downloads/publications/statistics-
and-data//mojstats/stats-race-cjs-2010.pdf.
15
Supplementary Volume 3 to Crime in England and Wales 2010/11
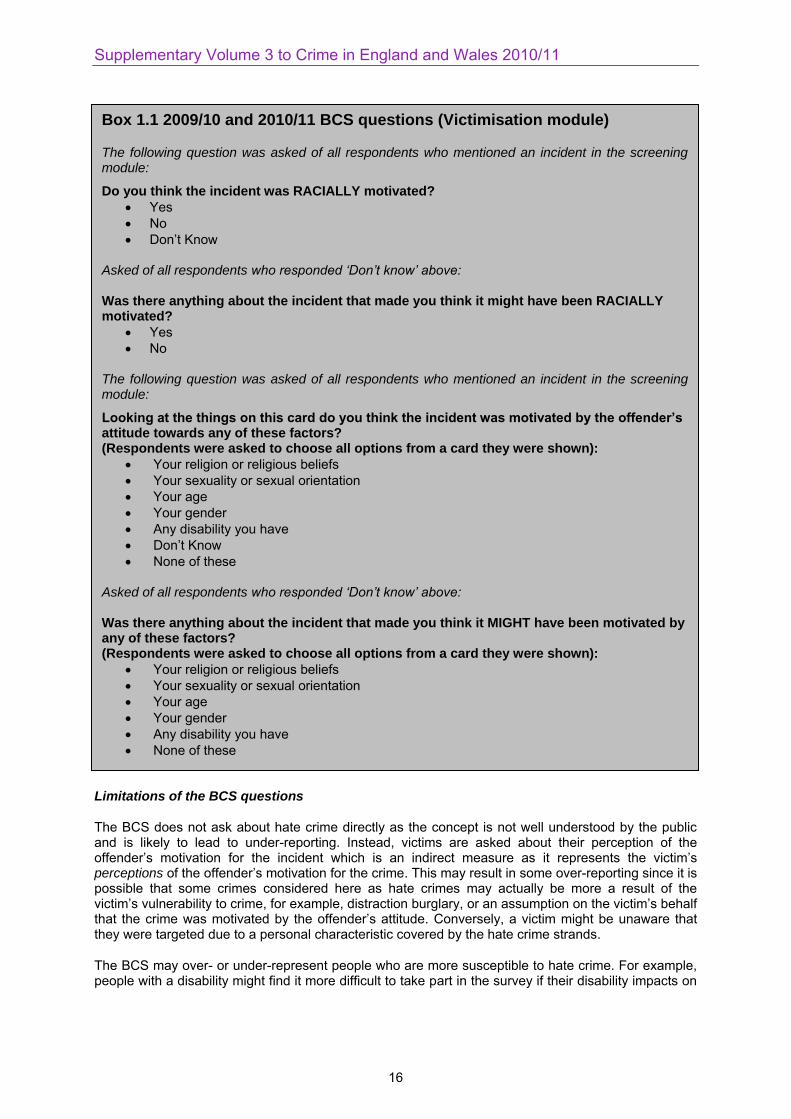
Box 1.1 2009/10 and 2010/11 BCS questions (Victimisation module)
The following question was asked of all respondents who mentioned an incident in the screening module:
Do you think the incident was RACIALLY motivated?
Yes
No
Don’t Know Asked of all respondents who responded ‘Don’t know’ above: Was there anything about the incident that made you think it might have been RACIALLY motivated?
Yes
No The following question was asked of all respondents who mentioned an incident in the screening module:
Looking at the things on this card do you think the incident was motivated by the offender’s attitude towards any of these factors? (Respondents were asked to choose all options from a card they were shown):
Your religion or religious beliefs
Your sexuality or sexual orientation
Your age
Your gender
Any disability you have
Don’t Know
None of these Asked of all respondents who responded ‘Don’t know’ above: Was there anything about the incident that made you think it MIGHT have been motivated by any of these factors? (Respondents were asked to choose all options from a card they were shown):
Your religion or religious beliefs
Your sexuality or sexual orientation
Your age
Your gender
Any disability you have
None of these
Limitations of the BCS questions
The BCS does not ask about hate crime directly as the concept is not well understood by the public and is likely to lead to under-reporting. Instead, victims are asked about their perception of the offender’s motivation for the incident which is an indirect measure as it represents the victim’s perceptions of the offender’s motivation for the crime. This may result in some over-reporting since it is possible that some crimes considered here as hate crimes may actually be more a result of the victim’s vulnerability to crime, for example, distraction burglary, or an assumption on the victim’s behalf that the crime was motivated by the offender’s attitude. Conversely, a victim might be unaware that they were targeted due to a personal characteristic covered by the hate crime strands.
The BCS may over- or under-represent people who are more susceptible to hate crime. For example, people with a disability might find it more difficult to take part in the survey if their disability impacts on
16
The extent of and perceptions towards hate crime
their ability to communicate in particular. Conversely, response rates to the survey might be higher among victims than non-victims as the topic seems more relevant to them.
Moreover, there may also be other characteristics underlying those covered by the equality strands which mean that the victim is more at risk of particular crime types. For example, findings from the BCS have consistently shown that young people aged 16 to 24 are more likely to be victims of crime and it is known that particular Black and Minority Ethnic groups have a lower age profile than that for the general population in England and Wales.
It should also be noted that although the BCS asks whether or not the victim perceived the incident to be motivated by an equality strand (for example, his or her disability status), it is possible in the cases of household crimes that it was someone else in the household that has the characteristic.
1.3 EXTENT OF HATE CRIME
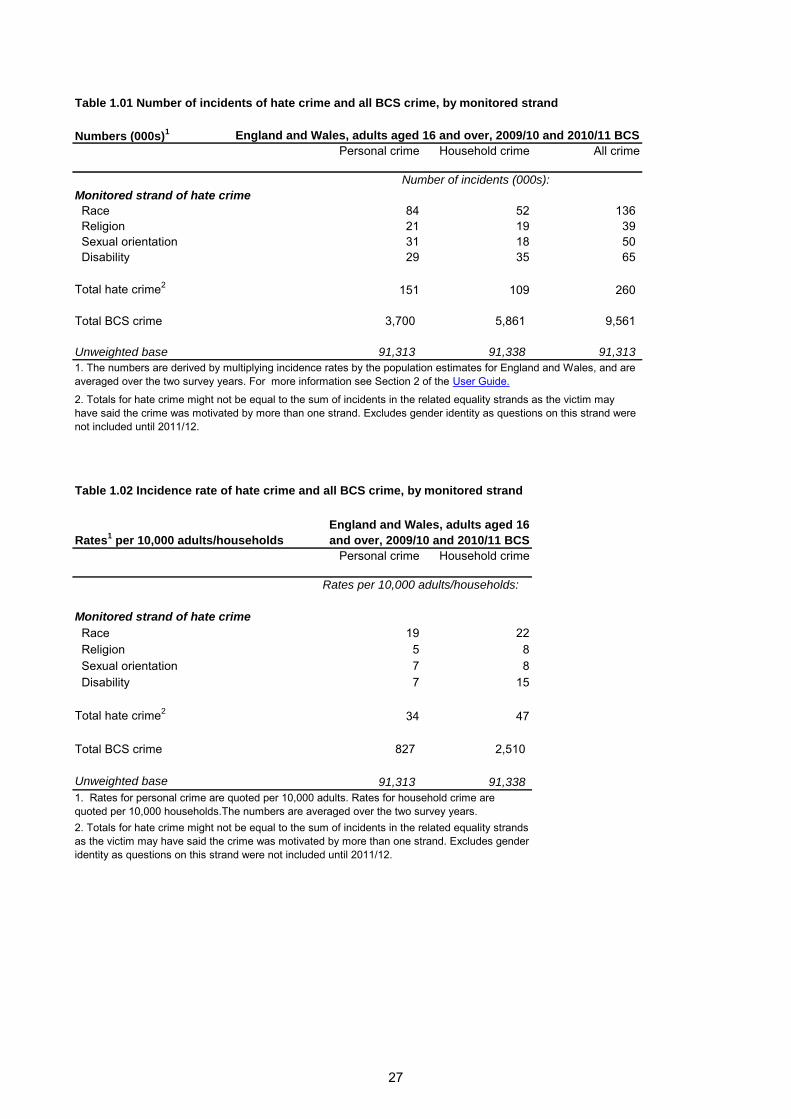
According to the 2009/10 and 2010/11 BCS, there were around 260,000 incidents of hate crime a year, compared with around 9,561,000 incidents of crime overall in the BCS
8 (Table 1.01).
Of the monitored strands asked about in the 2009/10 and 2010/11 BCS (race, religion, sexual orientation and disability), the strand most commonly perceived as an offender’s motivation for committing a crime was the offender’s attitude to the victim’s race (around 136,000 incidents on average a year). The equality strand least commonly perceived as an offender’s motivation for committing a crime was the victim’s religion (Table 1.01).
Incidents relating to the offender’s attitude towards the victim’s age and gender, which are not monitored strands, are shown in Section 1.9.
The BCS provides estimates of the levels of personal and household crimes experienced by adults in England and Wales. Personal crimes relate to all crimes against the individual and only relate to the respondent’s own personal experience (not that of other people in the household). Household crimes are considered to be all property-related crimes and respondents are asked whether anyone currently residing in the household has experienced any incidents within the reference period.
9
The 2009/10 and 2010/11 combined BCS shows there were around 151,000 incidents of personal hate crime and 109,000 incidents of household hate crime a year, compared with around 3,700,000 incidents of personal crime and 5,861,000 incidents of household crime a year overall in the BCS (Table 1.01).
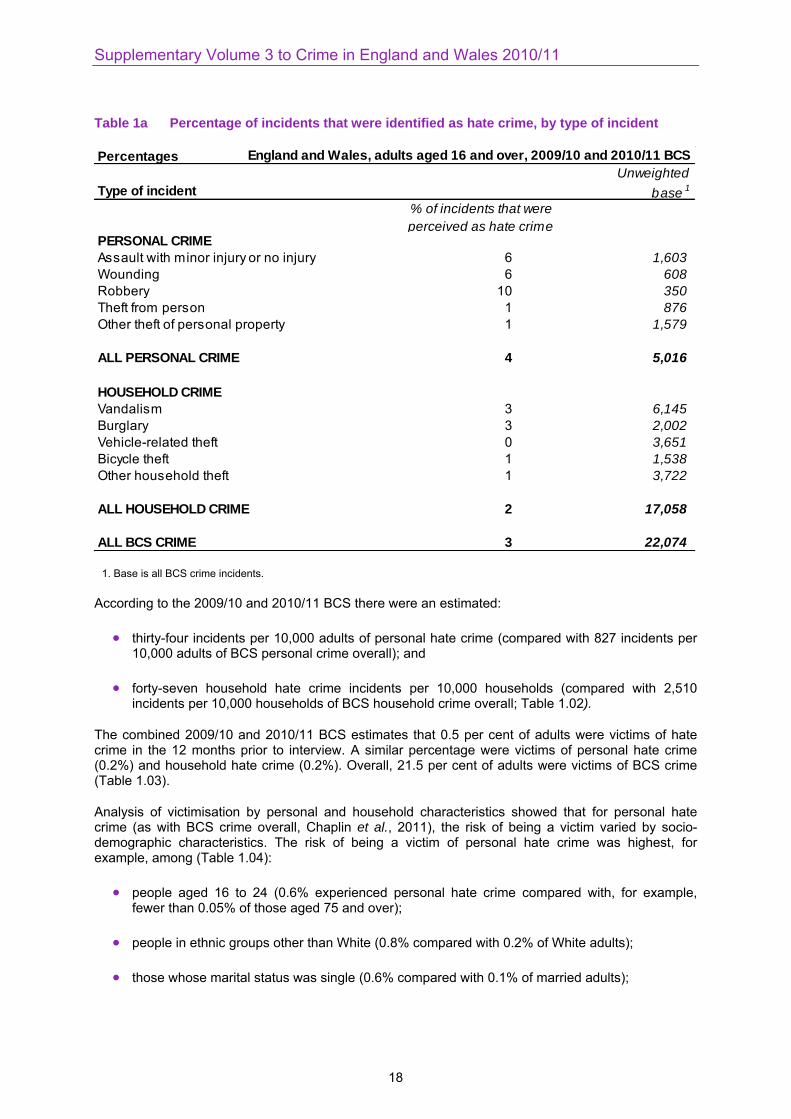
Three per cent of crime incidents overall in the BCS (4% of BCS incidents of personal crime and 2% of BCS incidents of household crime) were perceived to be hate crime incidents. The proportion of incidents that were perceived to be hate crime varied by crime type from one per cent or fewer of household theft incidents to ten per cent of robbery incidents (Table 1a).
8 The 9,561,000 incidents of crime overall in the BCS is the average of the 9,503,000 and 9,618,000 incidents reported in the
2009/10 and 2010/11 BCS. 9 See Section 2.5 of the User Guide for a discussion of measures of BCS crime.
17
Supplementary Volume 3 to Crime in England and Wales 2010/11
Table 1a Percentage of incidents that were identified as hate crime, by type of incident
Percentages England and Wales, adults aged 16 and over, 2009/10 and 2010/11 BCS
Type of incident
Unweighted
base1
PERSONAL CRIME
Assault with minor injury or no injury 6 1,603
Wounding 6 608
Robbery 10 350
Theft from person 1 876
Other theft of personal property 1 1,579
ALL PERSONAL CRIME 4 5,016
HOUSEHOLD CRIME
Vandalism 3 6,145
Burglary 3 2,002
Vehicle-related theft 0 3,651
Bicycle theft 1 1,538
Other household theft 1 3,722
ALL HOUSEHOLD CRIME 2 17,058
ALL BCS CRIME 3 22,074
% of incidents that were
perceived as hate crime
1. Base is all BCS crime incidents.
According to the 2009/10 and 2010/11 BCS there were an estimated:
thirty-four incidents per 10,000 adults of personal hate crime (compared with 827 incidents per 10,000 adults of BCS personal crime overall); and
forty-seven household hate crime incidents per 10,000 households (compared with 2,510 incidents per 10,000 households of BCS household crime overall; Table 1.02).
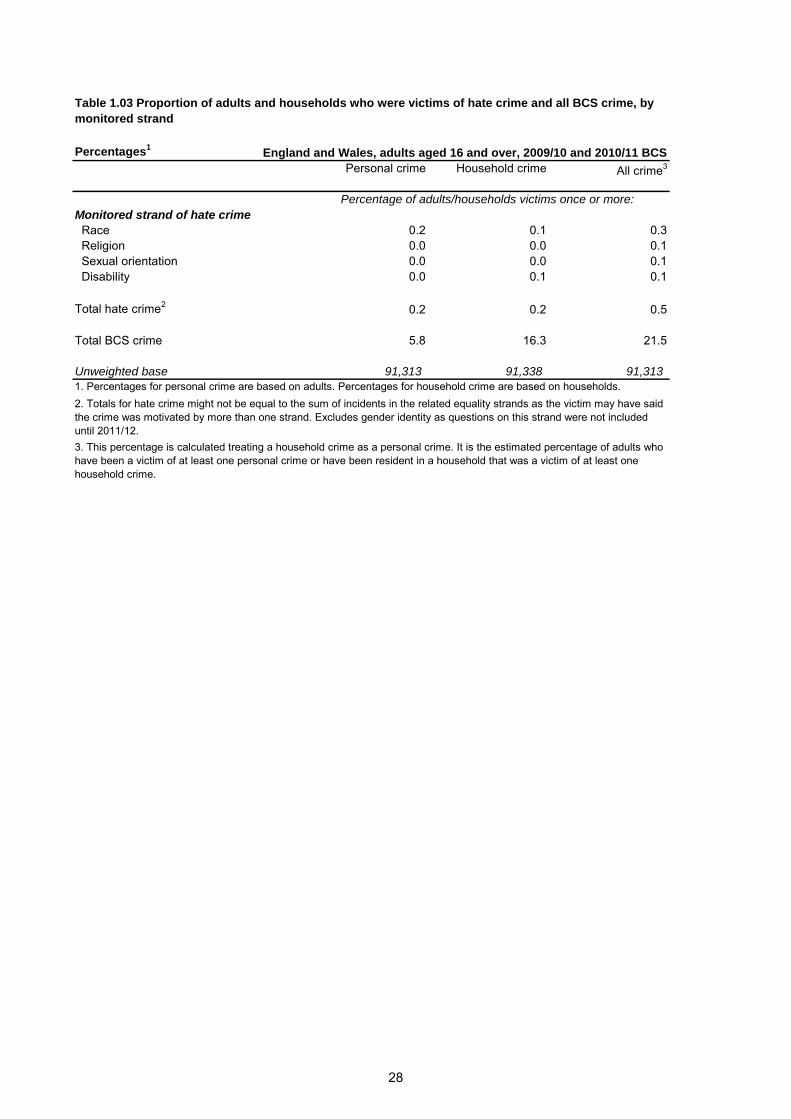
The combined 2009/10 and 2010/11 BCS estimates that 0.5 per cent of adults were victims of hate crime in the 12 months prior to interview. A similar percentage were victims of personal hate crime (0.2%) and household hate crime (0.2%). Overall, 21.5 per cent of adults were victims of BCS crime (Table 1.03).
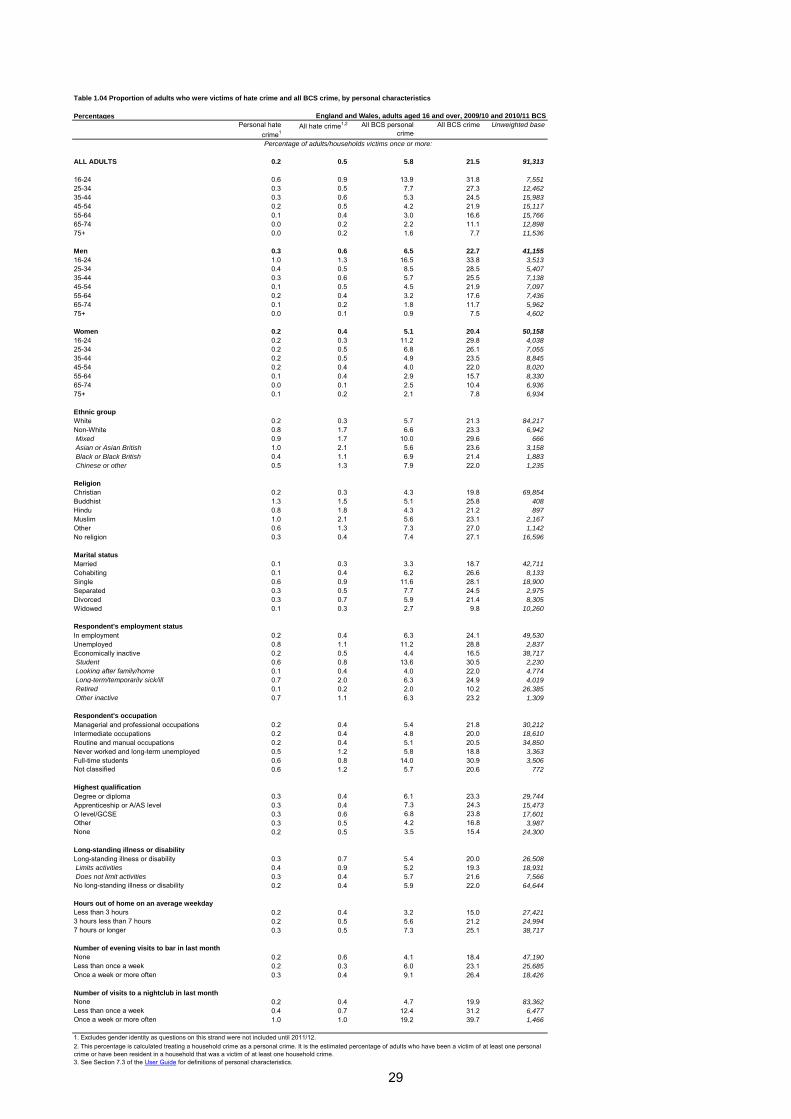
Analysis of victimisation by personal and household characteristics showed that for personal hate crime (as with BCS crime overall, Chaplin et al., 2011), the risk of being a victim varied by socio-demographic characteristics. The risk of being a victim of personal hate crime was highest, for example, among (Table 1.04):
people aged 16 to 24 (0.6% experienced personal hate crime compared with, for example, fewer than 0.05% of those aged 75 and over);
people in ethnic groups other than White (0.8% compared with 0.2% of White adults);
those whose marital status was single (0.6% compared with 0.1% of married adults);
18
The extent of and perceptions towards hate crime
the unemployed (0.8% compared with 0.2% of adults in employment);
those with a long-standing illness or disability that limits their daily activities (0.4% compared with 0.2% of those with no long-standing illness or disability); or
those who visit night clubs at least once a week (1.0% compared with 0.2% of those who did not visit nightclubs at all in the last month).
It should be noted that differences in victimisation rates between ethnic groups may be at least partly attributable to factors other than ethnicity. Previous research (Jansson, 2006; Salisbury and Upson, 2004) has shown that people with a Mixed ethnic background are most at risk of crime. However, multivariate analyses identified that, for the key crime types, ethnicity was not independently associated with the risk of victimisation (Jansson et al., 2007). The proportion of young people in the Mixed ethnic group was, for example, found to be large in comparison to other ethnic groups; and young people are at a higher risk of victimisation (Flatley et al., 2010). There are also inter-relationships between other personal characteristics.
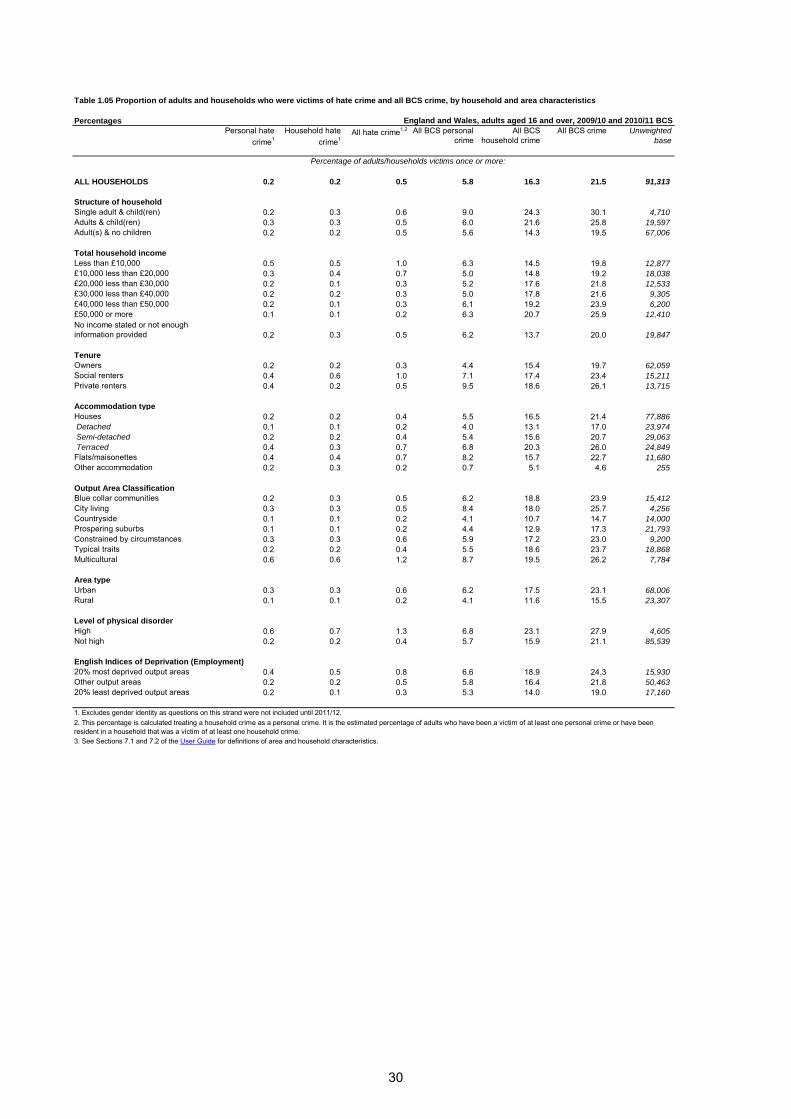
The risk of being a victim of household hate crime was highest among, for example, people who (Table 1.05):
lived in flats or maisonettes (0.4% experienced household hate crime compared with, for example, 0.1% of those living in a detached house);
lived in a household with a total income of less than £10,000 (0.5% compared with 0.1% among those who lived in households with a total income of £50,000 or more);
lived in a ‘multicultural’ area (0.6% compared with 0.1% of those who lived in a ‘countryside’ area); or
lived in an ‘urban’ area (0.3% compared with 0.1% of those who lived in ‘rural’ areas).
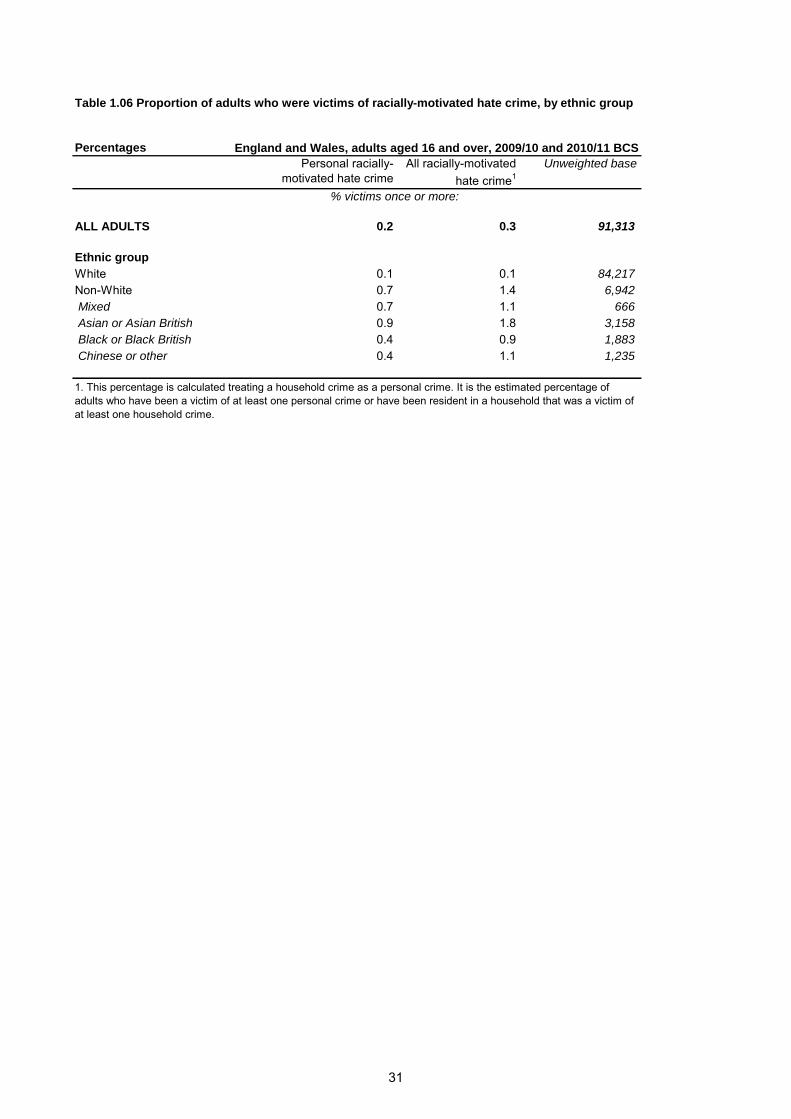
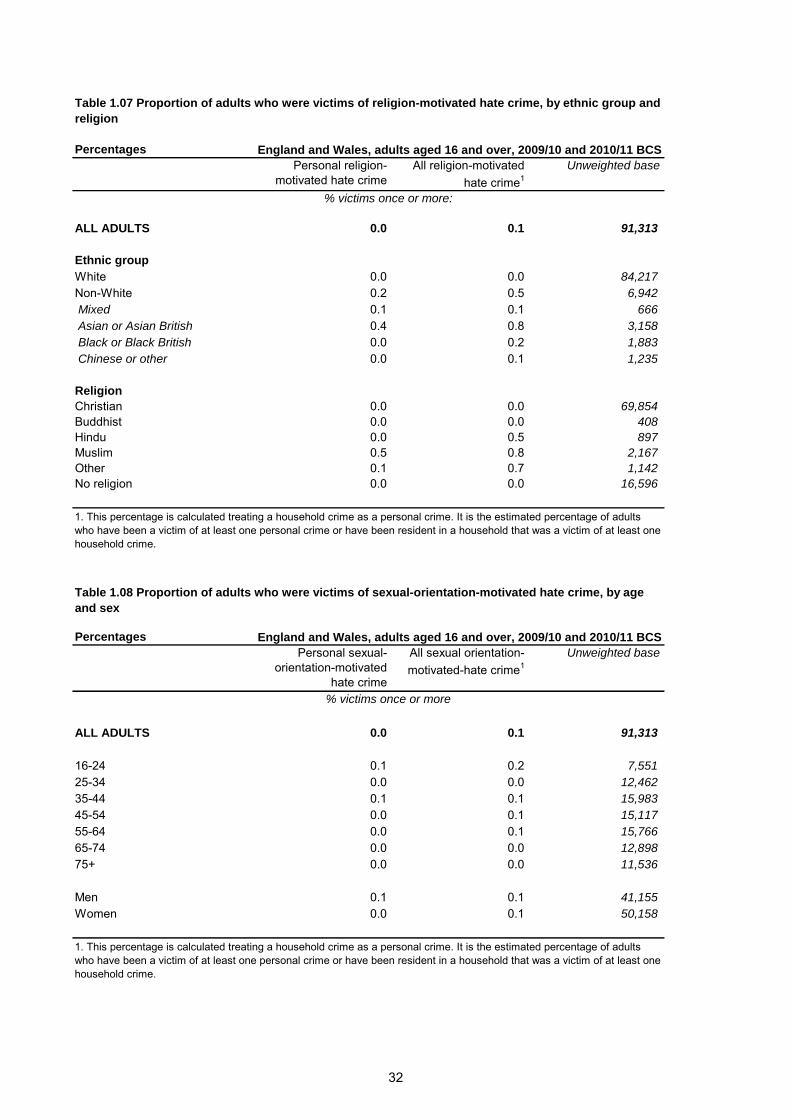
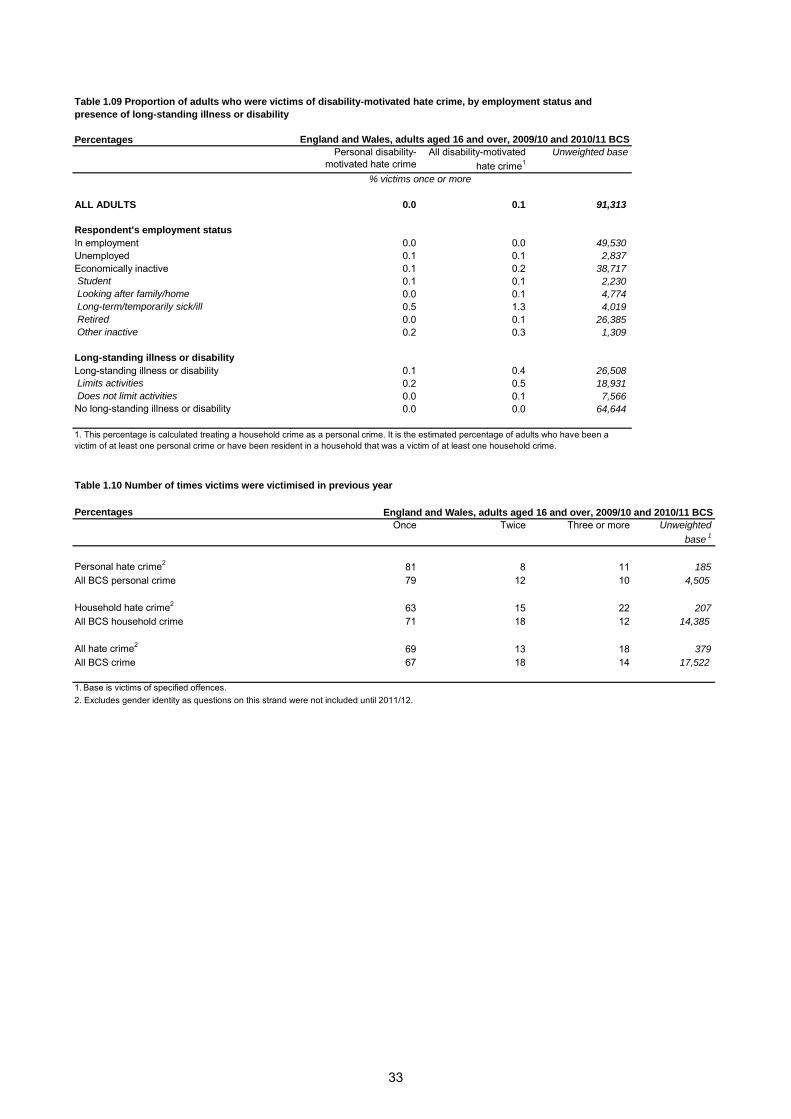
Tables 1.06 to 1.09 show the prevalence of hate crime for the separate equality strands by key personal characteristics. For example, the prevalence of racially-motivated crime is shown by ethnic group and the prevalence of disability-motivated hate crime is shown by long-term illness or disability. It can be seen that respondents with the personal characteristic they report as being a factor that they perceived motivated the incident were more likely to be at risk of being a victim of hate crime. For example, 0.2 per cent of adults who said they had a long-standing illness or disability that limited their daily activities said they were victims of disability motivated hate crime, compared with fewer than 0.05 per cent of respondents who had no long-standing illness or disability.
1.4 REPEAT VICTIMISATION
Repeat victimisation10
is defined here as being a victim of the same type of crime more than once in the last year.
11 Levels of repeat victimisation account for differences between BCS estimates of
incidence rates (see Table 1.02) and victimisation rates (see Table 1.03). For instance, high levels of repeat victimisation will be demonstrated by lower victimisation rates when compared with corresponding incidence rates as is found with domestic violence and vandalism (see for example, Chaplin et al., 2011).
10 See Section 2.5 of the User Guide for a discussion of repeat victimisation. 11 Where incidents of a similar nature that are probably carried out by the same perpetrator(s) have occurred, BCS estimates
only include the first five incidents in this ‘series’ of victimisations, see Section 2.5 of the User Guide.
19
Supplementary Volume 3 to Crime in England and Wales 2010/11
Nearly one-third (31%) of the victims of hate crime were victimised more than once in the previous year and 18 per cent were victimised three or more times. This is similar to the extent of repeat victimisation for BCS crime overall (33% had been victimised more than once).
BCS figures have consistently shown that levels of repeat victimisation vary by offence type (Chaplin et al., 2011). One reason for this may be that victims are able to take more preventative measures against repeat victimisation for some crime types, such as theft from the person. It also reflects the different nature of offences.
It can be seen that hate crime was more likely to be repeatedly experienced for household crime offences than for personal crime offences; 37 per cent of victims of household hate crime had been victimised more than once in the previous year, compared with 19 per cent of victims of personal hate crime. This difference is larger than that found in the BCS overall (29% of victims of BCS household crime were repeat victims, compared with 21% of victims of BCS personal crime; Table 1.10).
1.5 REPORTING HATE CRIME
The BCS asks people who experienced crimes in the past year whether the police came to know about the incident, that is, whether they reported it or the police came to know about it in another way (for example, they arrived at the scene). A ‘reporting rate’ is calculated by dividing the number of BCS incidents that victims state the police came to know about by the total number of BCS incidents.
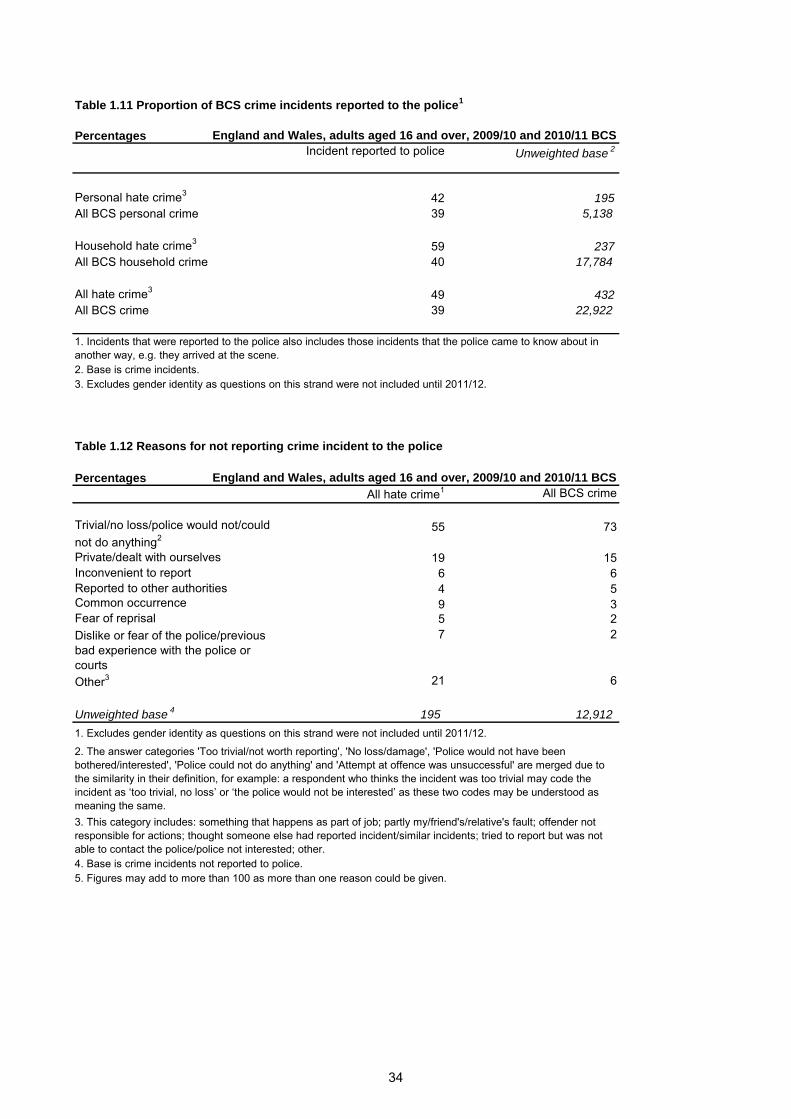
Based on the 2009/10 and 2010/11 BCS, the police were more likely to come to know about hate crime than BCS crime overall; 49 per cent of incidents of hate crime came to the attention of the police compared with 39 per cent of incidents of BCS crime overall (Table 1.11).
Although there was little difference in the likelihood of victims of personal hate crime reporting such offences to the police compared with all BCS personal crime (42% and 39% respectively), hate crime victims were more likely to report household crimes (59% compared with 40% for all BCS household crime). This difference could be due to the types and seriousness of offence recorded as hate crime. The 2010/11 BCS (Chaplin et al., 2011) showed that thefts of vehicles were most likely to be reported and incidents of burglary were also well reported.
Victims of crime who did not report incidents to the police were asked why they did not do so. The most frequently mentioned reason for not reporting hate crime incidents was that victims perceived them to be too trivial, there was no loss, or they believed that the police would or could not do much about them (55% of hate crime incidents that were not reported). The second most frequently mentioned reason was that it was a private matter or the victims chose to deal with it themselves (19% of unreported hate crimes).
Victims of hate crime were less likely than victims of BCS crime overall to say that the incident was too trivial to report to the police (55% compared with 73%). Conversely, they were more likely to give an answer from one of the less common categories grouped as ‘other’, for example something that happened as part of their job or someone else reported it (Table 1.12).
1.6 VICTIM SATISFACTION WITH THE POLICE
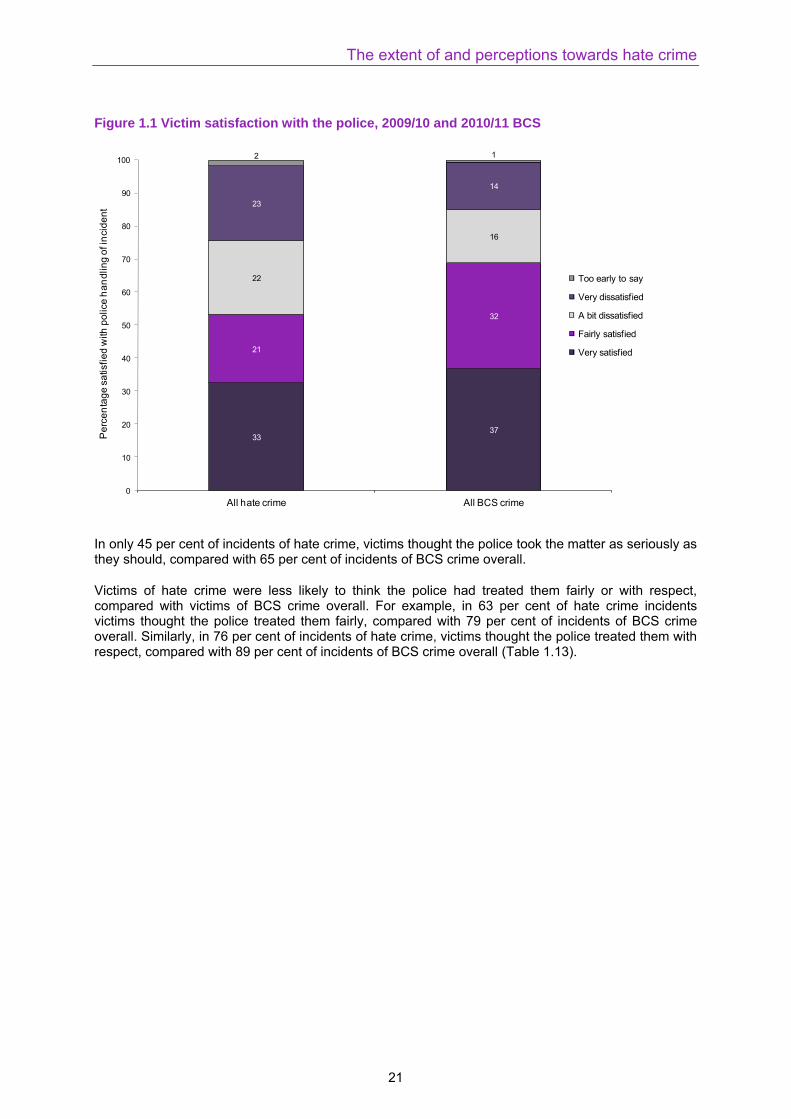
BCS respondents who were victims of crime and had contact with the police in the last 12 months were asked how satisfied they were with the way the police handled the matter. Based on the combined 2009/10 and 2010/11 surveys, in 53 per cent of incidents hate crime victims were satisfied with the way that the police handled the matter – in 33 per cent of incidents hate crime victims were very satisfied and in 21 per cent they were fairly satisfied with the way that the police handled the matter - and 45 per cent were not satisfied with the handling. Victims of hate crime were less satisfied with the way the police handled the matter than victims of BCS crime overall: in 53 per cent and 69 per cent of incidents respectively victims were satisfied (very or fairly) with the way the police handled the matter (Figure 1.1 and Table 1.13).
20
The extent of and perceptions towards hate crime
3337
21
32
22
16
23
14
2 1
0
10
20
30
40
50
60
70
80
90
100
All hate crime All BCS crime
Pe
rce
nta
ge
sa
tisfi
ed
with
po
lice
ha
nd
lin
g o
f in
cid
en
t
Too early to say
Very dissatisfied
A bit dissatisfied
Fairly satisfied
Very satisfied
Figure 1.1 Victim satisfaction with the police, 2009/10 and 2010/11 BCS
In only 45 per cent of incidents of hate crime, victims thought the police took the matter as seriously as they should, compared with 65 per cent of incidents of BCS crime overall.
Victims of hate crime were less likely to think the police had treated them fairly or with respect, compared with victims of BCS crime overall. For example, in 63 per cent of hate crime incidents victims thought the police treated them fairly, compared with 79 per cent of incidents of BCS crime overall. Similarly, in 76 per cent of incidents of hate crime, victims thought the police treated them with respect, compared with 89 per cent of incidents of BCS crime overall (Table 1.13).
21
Supplementary Volume 3 to Crime in England and Wales 2010/11
1.7 EFFECTS OF HATE CRIME
As part of the follow-up questions on their crime experience, victims were asked if they had an emotional reaction after the incident and, if so, how much they were affected and in which ways. There is evidence that perceiving that you have been targeted because of who you are has a greater impact on one’s wellbeing than being the victim of a non-hate crime (Iganski, 2001 and 2008).
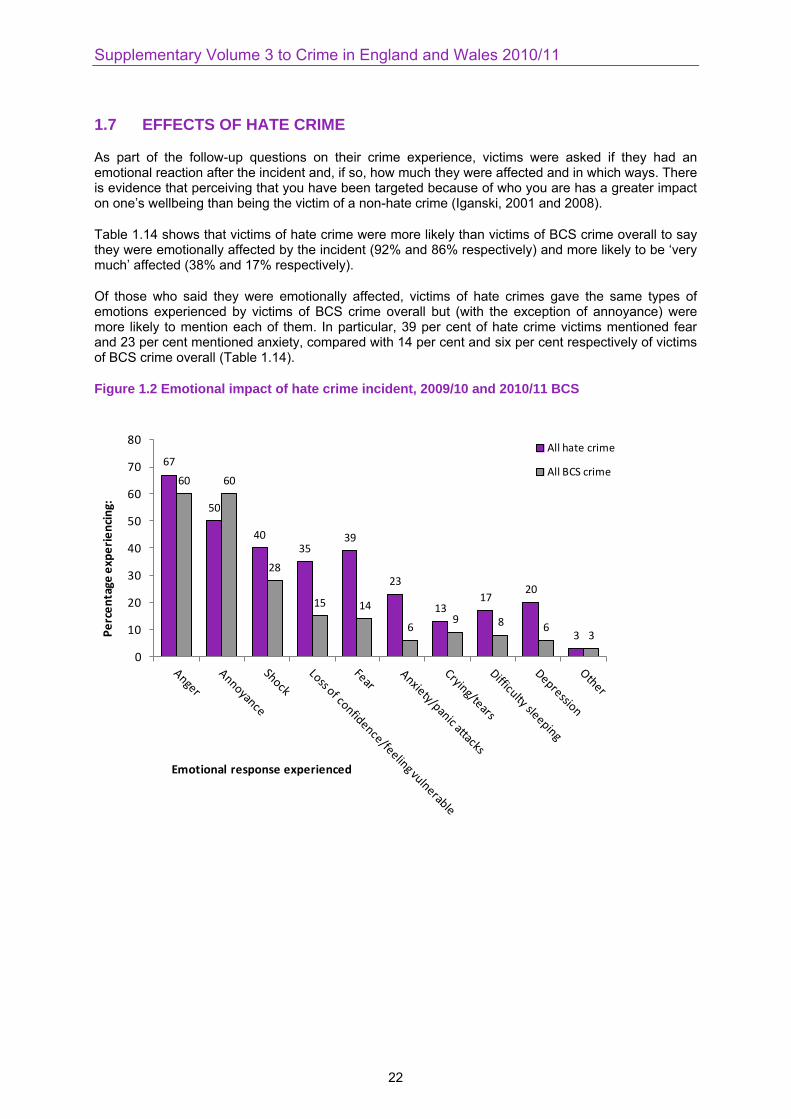
Table 1.14 shows that victims of hate crime were more likely than victims of BCS crime overall to say they were emotionally affected by the incident (92% and 86% respectively) and more likely to be ‘very much’ affected (38% and 17% respectively).
Of those who said they were emotionally affected, victims of hate crimes gave the same types of emotions experienced by victims of BCS crime overall but (with the exception of annoyance) were more likely to mention each of them. In particular, 39 per cent of hate crime victims mentioned fear and 23 per cent mentioned anxiety, compared with 14 per cent and six per cent respectively of victims of BCS crime overall (Table 1.14).
Figure 1.2 Emotional impact of hate crime incident, 2009/10 and 2010/11 BCS
67
50
4035
39
23
1317
20
3
60 60
28
15 14
69 8 6
3
0
10
20
30
40
50
60
70
80
Pe
rce
nta
ge e
xpe
rie
nci
ng:
Emotional response experienced
All hate crime
All BCS crime
22
The extent of and perceptions towards hate crime
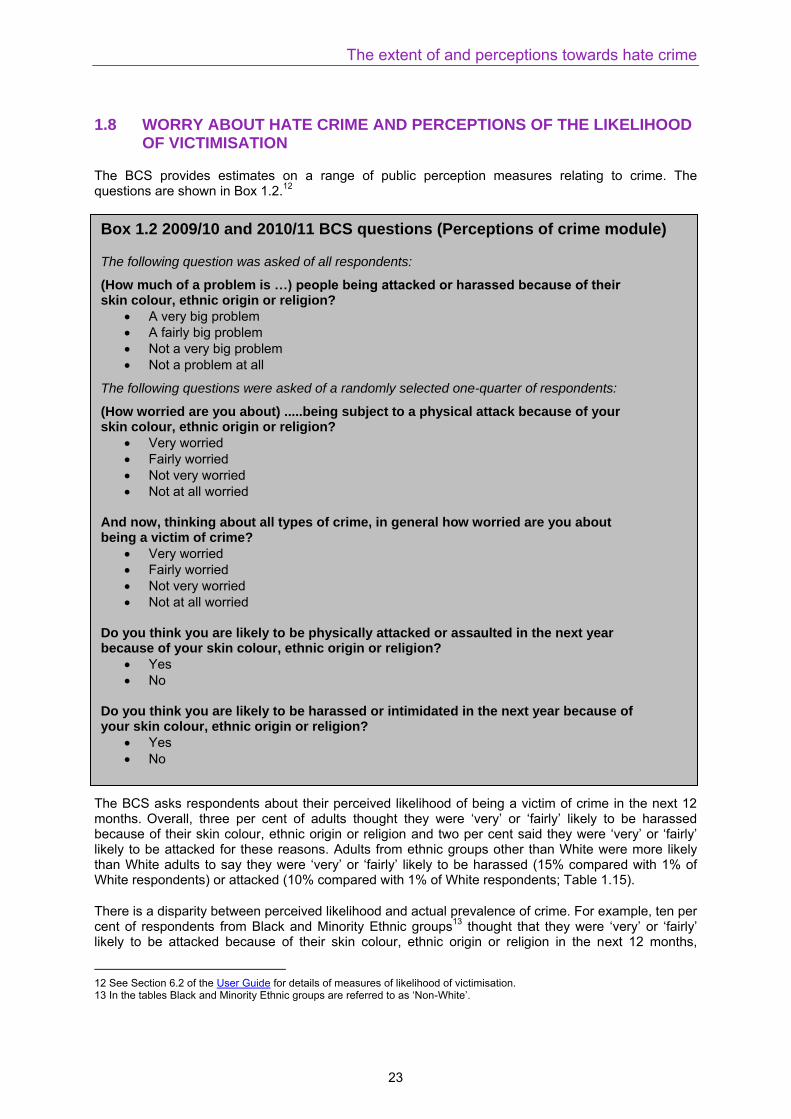
Box 1.2 2009/10 and 2010/11 BCS questions (Perceptions of crime module)
The following question was asked of all respondents:
(How much of a problem is …) people being attacked or harassed because of their skin colour, ethnic origin or religion?
A very big problem
A fairly big problem
Not a very big problem
Not a problem at all
The following questions were asked of a randomly selected one-quarter of respondents:
(How worried are you about) .....being subject to a physical attack because of your skin colour, ethnic origin or religion?
Very worried
Fairly worried
Not very worried
Not at all worried And now, thinking about all types of crime, in general how worried are you about being a victim of crime?
Very worried
Fairly worried
Not very worried
Not at all worried Do you think you are likely to be physically attacked or assaulted in the next year because of your skin colour, ethnic origin or religion?
Yes
No Do you think you are likely to be harassed or intimidated in the next year because of your skin colour, ethnic origin or religion?
Yes
No
1.8 WORRY ABOUT HATE CRIME AND PERCEPTIONS OF THE LIKELIHOOD OF VICTIMISATION
The BCS provides estimates on a range of public perception measures relating to crime. The questions are shown in Box 1.2.
12
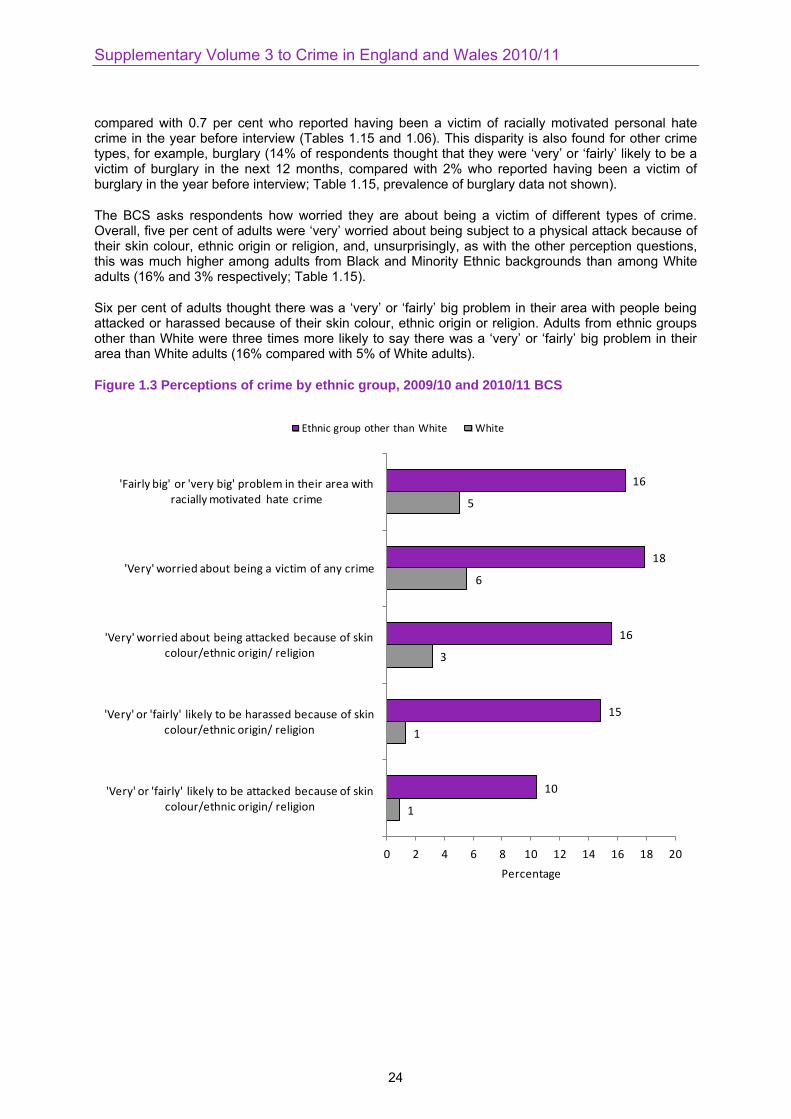
The BCS asks respondents about their perceived likelihood of being a victim of crime in the next 12 months. Overall, three per cent of adults thought they were ‘very’ or ‘fairly’ likely to be harassed because of their skin colour, ethnic origin or religion and two per cent said they were ‘very’ or ‘fairly’ likely to be attacked for these reasons. Adults from ethnic groups other than White were more likely than White adults to say they were ‘very’ or ‘fairly’ likely to be harassed (15% compared with 1% of White respondents) or attacked (10% compared with 1% of White respondents; Table 1.15).
There is a disparity between perceived likelihood and actual prevalence of crime. For example, ten per cent of respondents from Black and Minority Ethnic groups
13 thought that they were ‘very’ or ‘fairly’
likely to be attacked because of their skin colour, ethnic origin or religion in the next 12 months,
12 See Section 6.2 of the User Guide for details of measures of likelihood of victimisation. 13 In the tables Black and Minority Ethnic groups are referred to as ‘Non-White’.
23
Supplementary Volume 3 to Crime in England and Wales 2010/11
compared with 0.7 per cent who reported having been a victim of racially motivated personal hate crime in the year before interview (Tables 1.15 and 1.06). This disparity is also found for other crime types, for example, burglary (14% of respondents thought that they were ‘very’ or ‘fairly’ likely to be a victim of burglary in the next 12 months, compared with 2% who reported having been a victim of burglary in the year before interview; Table 1.15, prevalence of burglary data not shown).
The BCS asks respondents how worried they are about being a victim of different types of crime. Overall, five per cent of adults were ‘very’ worried about being subject to a physical attack because of their skin colour, ethnic origin or religion, and, unsurprisingly, as with the other perception questions, this was much higher among adults from Black and Minority Ethnic backgrounds than among White adults (16% and 3% respectively; Table 1.15).
Six per cent of adults thought there was a ‘very’ or ‘fairly’ big problem in their area with people being attacked or harassed because of their skin colour, ethnic origin or religion. Adults from ethnic groups other than White were three times more likely to say there was a ‘very’ or ‘fairly’ big problem in their area than White adults (16% compared with 5% of White adults).
Figure 1.3 Perceptions of crime by ethnic group, 2009/10 and 2010/11 BCS
1
1
3
6
5
10
15
16
18
16
0 2 4 6 8 10 12 14 16 18 20
'Very' or 'fairly' likely to be attacked because of skin colour/ethnic origin/ religion
'Very' or 'fairly' likely to be harassed because of skin colour/ethnic origin/ religion
'Very' worried about being attacked because of skin colour/ethnic origin/ religion
'Very' worried about being a victim of any crime
'Fairly big' or 'very big' problem in their area with racially motivated hate crime
Percentage
Ethnic group other than White White
24
The extent of and perceptions towards hate crime
1.9 AGE AND GENDER-MOTIVATED HATE CRIME
The BCS also collects information on incidents that respondents perceive to be motivated by the offender’s attitude towards the victim’s age or gender. Estimates of age-motivated hate crime in particular should be treated with caution, as it is possible, for example, that older victims who may be targeted for their age-related vulnerability, are answering that the incident was motivated by the offender’s attitude towards their age rather than this vulnerability.
Table 1.16 outlines the number of incidents for which victims said that they thought the offender was motivated by attitude to their age or gender for the combined survey years 2009/10 and 2010/11. The number of incidents is the average per year over the two survey years.
In total, there were around 143,000 incidents of age-motivated hate crime a year, and around 0.3 per cent of people perceived they were victims of an age-motivated hate crime (Table 1.16)
There were around 120,000 incidents of gender-motivated hate crime a year, and around 0.2 per cent of adults were victims of a gender-motivated hate crime.
Table 1.17 shows the prevalence of age-motivated hate crime by age and sex. The youngest and oldest age groups were more likely to say they thought they had been a victim of age-motivated hate crime than other age groups (0.7% of those aged 16−24 and 0.6% of those aged 75 and over were victims of age-motivated hate crimes compared with 0.3% of those aged 65−74). This suggests that some people may have misunderstood or misheard the question and mistakenly be reporting an incident as age-motivated.
Women were more likely than men to say they were victims of gender-motivated hate crime (0.3% and 0.1% respectively; Table 1.18).
1.10 OTHER SOURCES OF HATE CRIME DATA
ACPO/Police data
The police have been recording reported hate crimes since 1 April 2008 for the five monitored strands of hate crime. Figures (covering England, Wales and Northern Ireland for 2009) were first published by the Association of Chief Police Officers (ACPO) in 2010, and figures for 2010 were published in September 2011
14. In 2011/12 the hate crime data collection was made part of the Home Office
Annual Data Requirement15
.
Between January and December 201016
, the police recorded 48,127 crimes in England, Wales and Northern Ireland where the victim, or any other person, perceived the criminal offence to be motivated by hostility based on a person’s race, religious belief, sexual orientation, disability or where the victim was perceived to be transgender.
Of these:
39,311 were racist crimes;
2,007 were religious (faith) hate crimes;
4,883 were based on sexual orientation;
14 http://www.acpo.presscentre.com/Press-Releases/ACPO-publishes-hate-crime-data-for-2010-111.aspx 15 The Annual Data Requirement (ADR) is a list of all requests made to all police forces in England and Wales under the Home
Secretary's statutory powers. 16 Data published per calendar year.
25
Supplementary Volume 3 to Crime in England and Wales 2010/11
357 targeted transgender people; and
1,569 targeted people with disabilities.
As expected, BCS hate crime estimates are higher than the number of hate crimes recorded by the police as the survey captures offences that are not reported to or recorded by the police.
Crown Prosecution Service data
In 2008, the CPS began publishing an annual report on Hate Crime in England and Wales. The most recent publication ‘Hate crime and crimes against older people report 2010−2011’ presents information on CPS performance in prosecuting racist and religious hate crime, transphobic and homophobic crime, and disability hate crime.
17
The Life Opportunities Survey
In December 2011, the Office for Disability Issues published the Life Opportunities Survey Wave One results 2009/11
18 based on a total of 31,161 interviews with adults aged 16 and over, across 19,951
households.
The survey found that two per cent of all adults interviewed had been a victim of hate crime in the past 12 months. This is higher than the BCS estimate of 0.5 per cent, partly because it includes age and gender-motivated hate crime but partly due to the different question wording.
Those who reported being a victim of hate crime were asked to select all motivations for the crime that applied to them from the following: age, sex, a health condition, illness or impairment, a disability, ethnicity, religion, sexual orientation, or none of these reasons. The most common motivation reported for all adults who experienced hate crime was ethnicity (37%) followed by sexual orientation (11%). It is important to note, however, that 34 per cent of adults with a mental or physical impairment and 30 per cent of adults without a mental or physical impairment gave the answer ‘none of these reasons’ to the question on motivation of hate crime and, thus, felt they were the victim of a hate crime motivated by factors not covered by the questionnaire.
17 http:/www.cps.gov.uk/publications/docs/cps_hate_crime_report_2011.pdf 18 Office for Disability Issues (2011) Life Opportunities Survey: Wave One results, 2009/11. Available at: http://statistics.dwp.gov.uk/asd/asd1/los/los_wave_one_200911.pdf.
26
Numbers (000s)1
Personal crime Household crime All crime
Race 84 52 136
Religion 21 19 39
Sexual orientation 31 18 50
Disability 29 35 65
Total hate crime2
151 109 260
Total BCS crime 3,700 5,861 9,561
Unweighted base 91,313 91,338 91,313
Table 1.02 Incidence rate of hate crime and all BCS crime, by monitored strand
Personal crime Household crime
Race 19 22
Religion 5 8
Sexual orientation 7 8
Disability 7 15
Total hate crime2
34 47
Total BCS crime 827 2,510
Unweighted base 91,313 91,338
Number of incidents (000s):
1. The numbers are derived by multiplying incidence rates by the population estimates for England and Wales, and are
averaged over the two survey years. For more information see Section 2 of the User Guide.
2. Totals for hate crime might not be equal to the sum of incidents in the related equality strands as the victim may
have said the crime was motivated by more than one strand. Excludes gender identity as questions on this strand were
not included until 2011/12.
Monitored strand of hate crime
England and Wales, adults aged 16 and over, 2009/10 and 2010/11 BCS
Table 1.01 Number of incidents of hate crime and all BCS crime, by monitored strand
Rates per 10,000 adults/households:
Monitored strand of hate crime
England and Wales, adults aged 16
and over, 2009/10 and 2010/11 BCSRates1 per 10,000 adults/households
1. Rates for personal crime are quoted per 10,000 adults. Rates for household crime are
quoted per 10,000 households.The numbers are averaged over the two survey years.
2. Totals for hate crime might not be equal to the sum of incidents in the related equality strands
as the victim may have said the crime was motivated by more than one strand. Excludes gender
identity as questions on this strand were not included until 2011/12.
27
Percentages1
Personal crime Household crime All crime3
Race 0.2 0.1 0.3
Religion 0.0 0.0 0.1
Sexual orientation 0.0 0.0 0.1
Disability 0.0 0.1 0.1
Total hate crime2
0.2 0.2 0.5
Total BCS crime 5.8 16.3 21.5
Unweighted base 91,313 91,338 91,313
Table 1.03 Proportion of adults and households who were victims of hate crime and all BCS crime, by
monitored strand
3. This percentage is calculated treating a household crime as a personal crime. It is the estimated percentage of adults who
have been a victim of at least one personal crime or have been resident in a household that was a victim of at least one
household crime.
1. Percentages for personal crime are based on adults. Percentages for household crime are based on households.
Percentage of adults/households victims once or more:
2. Totals for hate crime might not be equal to the sum of incidents in the related equality strands as the victim may have said
the crime was motivated by more than one strand. Excludes gender identity as questions on this strand were not included
until 2011/12.
Monitored strand of hate crime
England and Wales, adults aged 16 and over, 2009/10 and 2010/11 BCS
28
Percentages
Personal hate
crime1
All hate crime1,2 All BCS personal
crime
All BCS crime Unweighted base
ALL ADULTS 0.2 0.5 5.8 21.5 91,313
16-24 0.6 0.9 13.9 31.8 7,551
25-34 0.3 0.5 7.7 27.3 12,462
35-44 0.3 0.6 5.3 24.5 15,983
45-54 0.2 0.5 4.2 21.9 15,117
55-64 0.1 0.4 3.0 16.6 15,766
65-74 0.0 0.2 2.2 11.1 12,898
75+ 0.0 0.2 1.6 7.7 11,536
Men 0.3 0.6 6.5 22.7 41,155
16-24 1.0 1.3 16.5 33.8 3,513
25-34 0.4 0.5 8.5 28.5 5,407
35-44 0.3 0.6 5.7 25.5 7,138
45-54 0.1 0.5 4.5 21.9 7,097
55-64 0.2 0.4 3.2 17.6 7,436
65-74 0.1 0.2 1.8 11.7 5,962
75+ 0.0 0.1 0.9 7.5 4,602
Women 0.2 0.4 5.1 20.4 50,158
16-24 0.2 0.3 11.2 29.8 4,038
25-34 0.2 0.5 6.8 26.1 7,055
35-44 0.2 0.5 4.9 23.5 8,845
45-54 0.2 0.4 4.0 22.0 8,020
55-64 0.1 0.4 2.9 15.7 8,330
65-74 0.0 0.1 2.5 10.4 6,936
75+ 0.1 0.2 2.1 7.8 6,934
Ethnic group
White 0.2 0.3 5.7 21.3 84,217
Non-White 0.8 1.7 6.6 23.3 6,942
Mixed 0.9 1.7 10.0 29.6 666
Asian or Asian British 1.0 2.1 5.6 23.6 3,158
Black or Black British 0.4 1.1 6.9 21.4 1,883
Chinese or other 0.5 1.3 7.9 22.0 1,235
Religion
Christian 0.2 0.3 4.3 19.8 69,854
Buddhist 1.3 1.5 5.1 25.8 408
Hindu 0.8 1.8 4.3 21.2 897
Muslim 1.0 2.1 5.6 23.1 2,167
Other 0.6 1.3 7.3 27.0 1,142
No religion 0.3 0.4 7.4 27.1 16,596
Marital status
Married 0.1 0.3 3.3 18.7 42,711
Cohabiting 0.1 0.4 6.2 26.6 8,133
Single 0.6 0.9 11.6 28.1 18,900
Separated 0.3 0.5 7.7 24.5 2,975
Divorced 0.3 0.7 5.9 21.4 8,305
Widowed 0.1 0.3 2.7 9.8 10,260
Respondent's employment status
In employment 0.2 0.4 6.3 24.1 49,530
Unemployed 0.8 1.1 11.2 28.8 2,837
Economically inactive 0.2 0.5 4.4 16.5 38,717
Student 0.6 0.8 13.6 30.5 2,230
Looking after family/home 0.1 0.4 4.0 22.0 4,774
Long-term/temporarily sick/ill 0.7 2.0 6.3 24.9 4,019
Retired 0.1 0.2 2.0 10.2 26,385
Other inactive 0.7 1.1 6.3 23.2 1,309
Respondent's occupation
Managerial and professional occupations 0.2 0.4 5.4 21.8 30,212
Intermediate occupations 0.2 0.4 4.8 20.0 18,610
Routine and manual occupations 0.2 0.4 5.1 20.5 34,850
Never worked and long-term unemployed 0.5 1.2 5.8 18.8 3,363
Full-time students 0.6 0.8 14.0 30.9 3,506
Not classified 0.6 1.2 5.7 20.6 772
Highest qualification
Degree or diploma 0.3 0.4 6.1 23.3 29,744
Apprenticeship or A/AS level 0.3 0.4 7.3 24.3 15,473
O level/GCSE 0.3 0.6 6.8 23.8 17,601
Other 0.3 0.5 4.2 16.8 3,987
None 0.2 0.5 3.5 15.4 24,300
Long-standing illness or disability
Long-standing illness or disability 0.3 0.7 5.4 20.0 26,508
Limits activities 0.4 0.9 5.2 19.3 18,931
Does not limit activities 0.3 0.4 5.7 21.6 7,566
No long-standing illness or disability 0.2 0.4 5.9 22.0 64,644
Hours out of home on an average weekday
Less than 3 hours 0.2 0.4 3.2 15.0 27,421
3 hours less than 7 hours 0.2 0.5 5.6 21.2 24,994
7 hours or longer 0.3 0.5 7.3 25.1 38,717
Number of evening visits to bar in last month
None 0.2 0.6 4.1 18.4 47,190
Less than once a week 0.2 0.3 6.0 23.1 25,685
Once a week or more often 0.3 0.4 9.1 26.4 18,426
Number of visits to a nightclub in last month
None 0.2 0.4 4.7 19.9 83,362
Less than once a week 0.4 0.7 12.4 31.2 6,477
Once a week or more often 1.0 1.0 19.2 39.7 1,466
1. Excludes gender identity as questions on this strand were not included until 2011/12.
3. See Section 7.3 of the User Guide for definitions of personal characteristics.
England and Wales, adults aged 16 and over, 2009/10 and 2010/11 BCS
2. This percentage is calculated treating a household crime as a personal crime. It is the estimated percentage of adults who have been a victim of at least one personal
crime or have been resident in a household that was a victim of at least one household crime.
Percentage of adults/households victims once or more:
Table 1.04 Proportion of adults who were victims of hate crime and all BCS crime, by personal characteristics
29
Percentages
Personal hate
crime1
Household hate
crime1
All hate crime1,2 All BCS personal
crime
All BCS
household crime
All BCS crime Unweighted
base
ALL HOUSEHOLDS 0.2 0.2 0.5 5.8 16.3 21.5 91,313
Structure of household
Single adult & child(ren) 0.2 0.3 0.6 9.0 24.3 30.1 4,710
Adults & child(ren) 0.3 0.3 0.5 6.0 21.6 25.8 19,597
Adult(s) & no children 0.2 0.2 0.5 5.6 14.3 19.5 67,006
Total household income
Less than £10,000 0.5 0.5 1.0 6.3 14.5 19.8 12,877
£10,000 less than £20,000 0.3 0.4 0.7 5.0 14.8 19.2 18,038
£20,000 less than £30,000 0.2 0.1 0.3 5.2 17.6 21.8 12,533
£30,000 less than £40,000 0.2 0.2 0.3 5.0 17.8 21.6 9,305
£40,000 less than £50,000 0.2 0.1 0.3 6.1 19.2 23.9 6,200
£50,000 or more 0.1 0.1 0.2 6.3 20.7 25.9 12,410
No income stated or not enough
information provided 0.2 0.3 0.5 6.2 13.7 20.0 19,847
Tenure
Owners 0.2 0.2 0.3 4.4 15.4 19.7 62,059
Social renters 0.4 0.6 1.0 7.1 17.4 23.4 15,211
Private renters 0.4 0.2 0.5 9.5 18.6 26.1 13,715
Accommodation type
Houses 0.2 0.2 0.4 5.5 16.5 21.4 77,886
Detached 0.1 0.1 0.2 4.0 13.1 17.0 23,974
Semi-detached 0.2 0.2 0.4 5.4 15.6 20.7 29,063
Terraced 0.4 0.3 0.7 6.8 20.3 26.0 24,849
Flats/maisonettes 0.4 0.4 0.7 8.2 15.7 22.7 11,680
Other accommodation 0.2 0.3 0.2 0.7 5.1 4.6 255
Output Area Classification
Blue collar communities 0.2 0.3 0.5 6.2 18.8 23.9 15,412
City living 0.3 0.3 0.5 8.4 18.0 25.7 4,256
Countryside 0.1 0.1 0.2 4.1 10.7 14.7 14,000
Prospering suburbs 0.1 0.1 0.2 4.4 12.9 17.3 21,793
Constrained by circumstances 0.3 0.3 0.6 5.9 17.2 23.0 9,200
Typical traits 0.2 0.2 0.4 5.5 18.6 23.7 18,868
Multicultural 0.6 0.6 1.2 8.7 19.5 26.2 7,784
Area type
Urban 0.3 0.3 0.6 6.2 17.5 23.1 68,006
Rural 0.1 0.1 0.2 4.1 11.6 15.5 23,307
Level of physical disorder
High 0.6 0.7 1.3 6.8 23.1 27.9 4,605
Not high 0.2 0.2 0.4 5.7 15.9 21.1 85,539
English Indices of Deprivation (Employment)
20% most deprived output areas 0.4 0.5 0.8 6.6 18.9 24.3 15,930
Other output areas 0.2 0.2 0.5 5.8 16.4 21.8 50,463
20% least deprived output areas 0.2 0.1 0.3 5.3 14.0 19.0 17,160
1. Excludes gender identity as questions on this strand were not included until 2011/12.
England and Wales, adults aged 16 and over, 2009/10 and 2010/11 BCS
Table 1.05 Proportion of adults and households who were victims of hate crime and all BCS crime, by household and area characteristics
Percentage of adults/households victims once or more:
2. This percentage is calculated treating a household crime as a personal crime. It is the estimated percentage of adults who have been a victim of at least one personal crime or have been
resident in a household that was a victim of at least one household crime.
3. See Sections 7.1 and 7.2 of the User Guide for definitions of area and household characteristics.
30
Percentages
Personal racially-
motivated hate crime
All racially-motivated
hate crime1
Unweighted base
ALL ADULTS 0.2 0.3 91,313
Ethnic group
White 0.1 0.1 84,217
Non-White 0.7 1.4 6,942
Mixed 0.7 1.1 666
Asian or Asian British 0.9 1.8 3,158
Black or Black British 0.4 0.9 1,883
Chinese or other 0.4 1.1 1,235
% victims once or more:
Table 1.06 Proportion of adults who were victims of racially-motivated hate crime, by ethnic group
England and Wales, adults aged 16 and over, 2009/10 and 2010/11 BCS
1. This percentage is calculated treating a household crime as a personal crime. It is the estimated percentage of
adults who have been a victim of at least one personal crime or have been resident in a household that was a victim of
at least one household crime.
31
Percentages
Personal religion-
motivated hate crime
All religion-motivated
hate crime1
Unweighted base
ALL ADULTS 0.0 0.1 91,313
Ethnic group
White 0.0 0.0 84,217
Non-White 0.2 0.5 6,942
Mixed 0.1 0.1 666
Asian or Asian British 0.4 0.8 3,158
Black or Black British 0.0 0.2 1,883
Chinese or other 0.0 0.1 1,235
Religion
Christian 0.0 0.0 69,854
Buddhist 0.0 0.0 408
Hindu 0.0 0.5 897
Muslim 0.5 0.8 2,167
Other 0.1 0.7 1,142
No religion 0.0 0.0 16,596
Percentages
Personal sexual-
orientation-motivated
hate crime
All sexual orientation-
motivated-hate crime1
Unweighted base
ALL ADULTS 0.0 0.1 91,313
16-24 0.1 0.2 7,551
25-34 0.0 0.0 12,462
35-44 0.1 0.1 15,983
45-54 0.0 0.1 15,117
55-64 0.0 0.1 15,766
65-74 0.0 0.0 12,898
75+ 0.0 0.0 11,536
Men 0.1 0.1 41,155
Women 0.0 0.1 50,158
Table 1.07 Proportion of adults who were victims of religion-motivated hate crime, by ethnic group and
religion
Table 1.08 Proportion of adults who were victims of sexual-orientation-motivated hate crime, by age
and sex
% victims once or more
1. This percentage is calculated treating a household crime as a personal crime. It is the estimated percentage of adults
who have been a victim of at least one personal crime or have been resident in a household that was a victim of at least one
household crime.
% victims once or more:
England and Wales, adults aged 16 and over, 2009/10 and 2010/11 BCS
1. This percentage is calculated treating a household crime as a personal crime. It is the estimated percentage of adults
who have been a victim of at least one personal crime or have been resident in a household that was a victim of at least one
household crime.
England and Wales, adults aged 16 and over, 2009/10 and 2010/11 BCS
32
Percentages
Personal disability-
motivated hate crime
All disability-motivated
hate crime1
Unweighted base
ALL ADULTS 0.0 0.1 91,313
Respondent's employment status
In employment 0.0 0.0 49,530
Unemployed 0.1 0.1 2,837
Economically inactive 0.1 0.2 38,717
Student 0.1 0.1 2,230
Looking after family/home 0.0 0.1 4,774
Long-term/temporarily sick/ill 0.5 1.3 4,019
Retired 0.0 0.1 26,385
Other inactive 0.2 0.3 1,309
Long-standing illness or disability
Long-standing illness or disability 0.1 0.4 26,508
Limits activities 0.2 0.5 18,931
Does not limit activities 0.0 0.1 7,566
No long-standing illness or disability 0.0 0.0 64,644
Percentages
Once Twice Three or more Unweighted
base1
Personal hate crime2
81 8 11 185
All BCS personal crime 79 12 10 4,505
Household hate crime2
63 15 22 207
All BCS household crime 71 18 12 14,385
All hate crime2
69 13 18 379
All BCS crime 67 18 14 17,522
1. Base is victims of specified offences.
2. Excludes gender identity as questions on this strand were not included until 2011/12.
England and Wales, adults aged 16 and over, 2009/10 and 2010/11 BCS
% victims once or more
England and Wales, adults aged 16 and over, 2009/10 and 2010/11 BCS
Table 1.09 Proportion of adults who were victims of disability-motivated hate crime, by employment status and
presence of long-standing illness or disability
1. This percentage is calculated treating a household crime as a personal crime. It is the estimated percentage of adults who have been a
victim of at least one personal crime or have been resident in a household that was a victim of at least one household crime.
Table 1.10 Number of times victims were victimised in previous year
33
Percentages
Incident reported to police Unweighted base2
Personal hate crime3
42 195
All BCS personal crime 39 5,138
Household hate crime3
59 237
All BCS household crime 40 17,784
All hate crime3
49 432
All BCS crime 39 22,922
2. Base is crime incidents.
3. Excludes gender identity as questions on this strand were not included until 2011/12.
Percentages
All hate crime1 All BCS crime
55 73
Private/dealt with ourselves 19 15
Inconvenient to report 6 6
Reported to other authorities 4 5Common occurrence 9 3Fear of reprisal 5 2
7 2
Other3 21 6
195 12,912
1. Excludes gender identity as questions on this strand were not included until 2011/12.
4. Base is crime incidents not reported to police.
5. Figures may add to more than 100 as more than one reason could be given.
1. Incidents that were reported to the police also includes those incidents that the police came to know about in
another way, e.g. they arrived at the scene.
England and Wales, adults aged 16 and over, 2009/10 and 2010/11 BCS
Table 1.11 Proportion of BCS crime incidents reported to the police1
England and Wales, adults aged 16 and over, 2009/10 and 2010/11 BCS
2. The answer categories 'Too trivial/not worth reporting', 'No loss/damage', 'Police would not have been
bothered/interested', 'Police could not do anything' and 'Attempt at offence was unsuccessful' are merged due to
the similarity in their definition, for example: a respondent who thinks the incident was too trivial may code the
incident as ‘too trivial, no loss’ or ‘the police would not be interested’ as these two codes may be understood as
meaning the same.
3. This category includes: something that happens as part of job; partly my/friend's/relative's fault; offender not
responsible for actions; thought someone else had reported incident/similar incidents; tried to report but was not
able to contact the police/police not interested; other.
Dislike or fear of the police/previous
bad experience with the police or
courts
Table 1.12 Reasons for not reporting crime incident to the police
Trivial/no loss/police would not/could
not do anything2
Unweighted base4
34
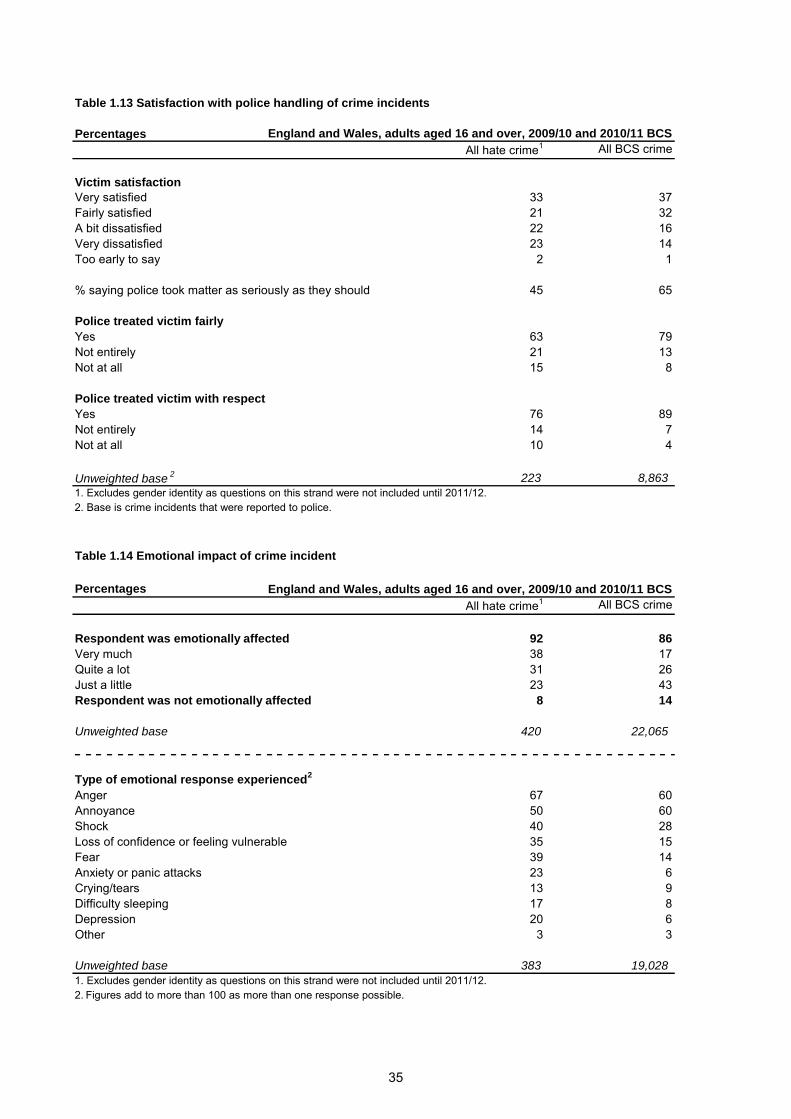
Percentages
All hate crime1 All BCS crime
Victim satisfaction
Very satisfied 33 37
Fairly satisfied 21 32
A bit dissatisfied 22 16
Very dissatisfied 23 14
Too early to say 2 1
% saying police took matter as seriously as they should 45 65
Police treated victim fairly
Yes 63 79
Not entirely 21 13
Not at all 15 8
Police treated victim with respect
Yes 76 89
Not entirely 14 7
Not at all 10 4
Unweighted base2 223 8,863
1. Excludes gender identity as questions on this strand were not included until 2011/12.
2. Base is crime incidents that were reported to police.
Percentages
All hate crime1 All BCS crime
Respondent was emotionally affected 92 86
Very much 38 17
Quite a lot 31 26
Just a little 23 43
Respondent was not emotionally affected 8 14
Unweighted base 420 22,065
Type of emotional response experienced2
Anger 67 60
Annoyance 50 60
Shock 40 28
Loss of confidence or feeling vulnerable 35 15
Fear 39 14
Anxiety or panic attacks 23 6
Crying/tears 13 9
Difficulty sleeping 17 8
Depression 20 6
Other 3 3
Unweighted base 383 19,028
1. Excludes gender identity as questions on this strand were not included until 2011/12.
England and Wales, adults aged 16 and over, 2009/10 and 2010/11 BCS
Table 1.13 Satisfaction with police handling of crime incidents
England and Wales, adults aged 16 and over, 2009/10 and 2010/11 BCS
Table 1.14 Emotional impact of crime incident
2. Figures add to more than 100 as more than one response possible.
35
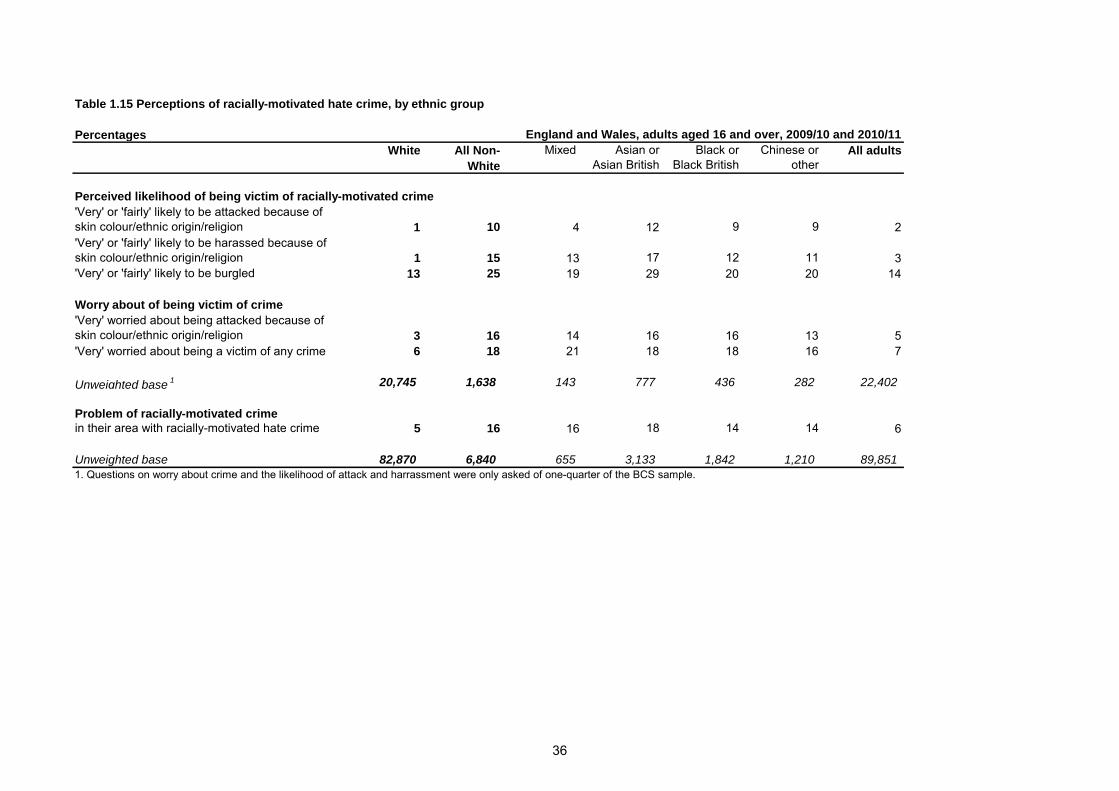
Percentages
White All Non-
White
Mixed Asian or
Asian British
Black or
Black British
Chinese or
other
All adults
Perceived likelihood of being victim of racially-motivated crime
'Very' or 'fairly' likely to be attacked because of
skin colour/ethnic origin/religion 1 10 4 12 9 9 2
'Very' or 'fairly' likely to be harassed because of
skin colour/ethnic origin/religion 1 15 13 17 12 11 3
'Very' or 'fairly' likely to be burgled 13 25 19 29 20 20 14
Worry about of being victim of crime
'Very' worried about being attacked because of
skin colour/ethnic origin/religion 3 16 14 16 16 13 5
'Very' worried about being a victim of any crime 6 18 21 18 18 16 7
Unweighted base1 20,745 1,638 143 777 436 282 22,402
Problem of racially-motivated crime% saying there is a 'fairly big' or 'very big' problem
in their area with racially-motivated hate crime 5 16 16 18 14 14 6
Unweighted base 82,870 6,840 655 3,133 1,842 1,210 89,851
1. Questions on worry about crime and the likelihood of attack and harrassment were only asked of one-quarter of the BCS sample.
England and Wales, adults aged 16 and over, 2009/10 and 2010/11
Table 1.15 Perceptions of racially-motivated hate crime, by ethnic group
36
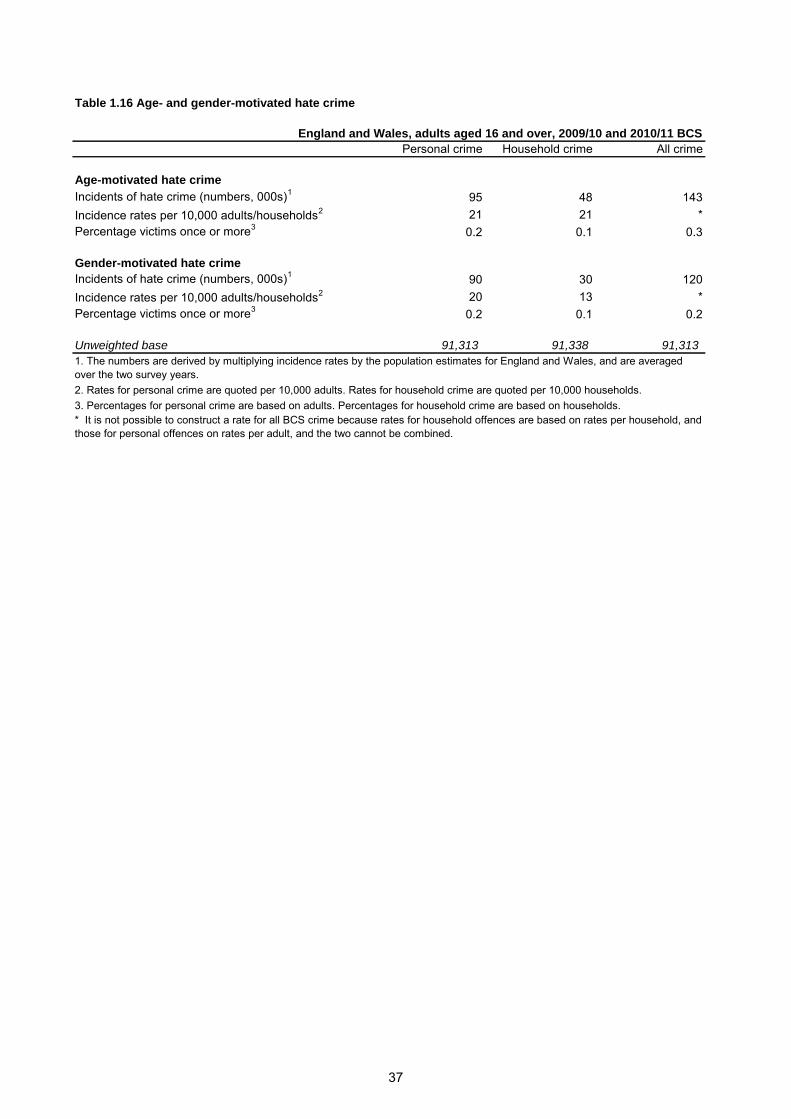
England and Wales, adults aged 16 and over, 2009/10 and 2010/11 BCS
Personal crime Household crime All crime
Age-motivated hate crime
Incidents of hate crime (numbers, 000s)1
95 48 143
Incidence rates per 10,000 adults/households2 21 21 *
Percentage victims once or more3
0.2 0.1 0.3
Gender-motivated hate crime
Incidents of hate crime (numbers, 000s)1
90 30 120
Incidence rates per 10,000 adults/households2 20 13 *
Percentage victims once or more3
0.2 0.1 0.2
Unweighted base 91,313 91,338 91,313
1. The numbers are derived by multiplying incidence rates by the population estimates for England and Wales, and are averaged
over the two survey years.
2. Rates for personal crime are quoted per 10,000 adults. Rates for household crime are quoted per 10,000 households.
3. Percentages for personal crime are based on adults. Percentages for household crime are based on households.
Table 1.16 Age- and gender-motivated hate crime
* It is not possible to construct a rate for all BCS crime because rates for household offences are based on rates per household, and
those for personal offences on rates per adult, and the two cannot be combined.
37
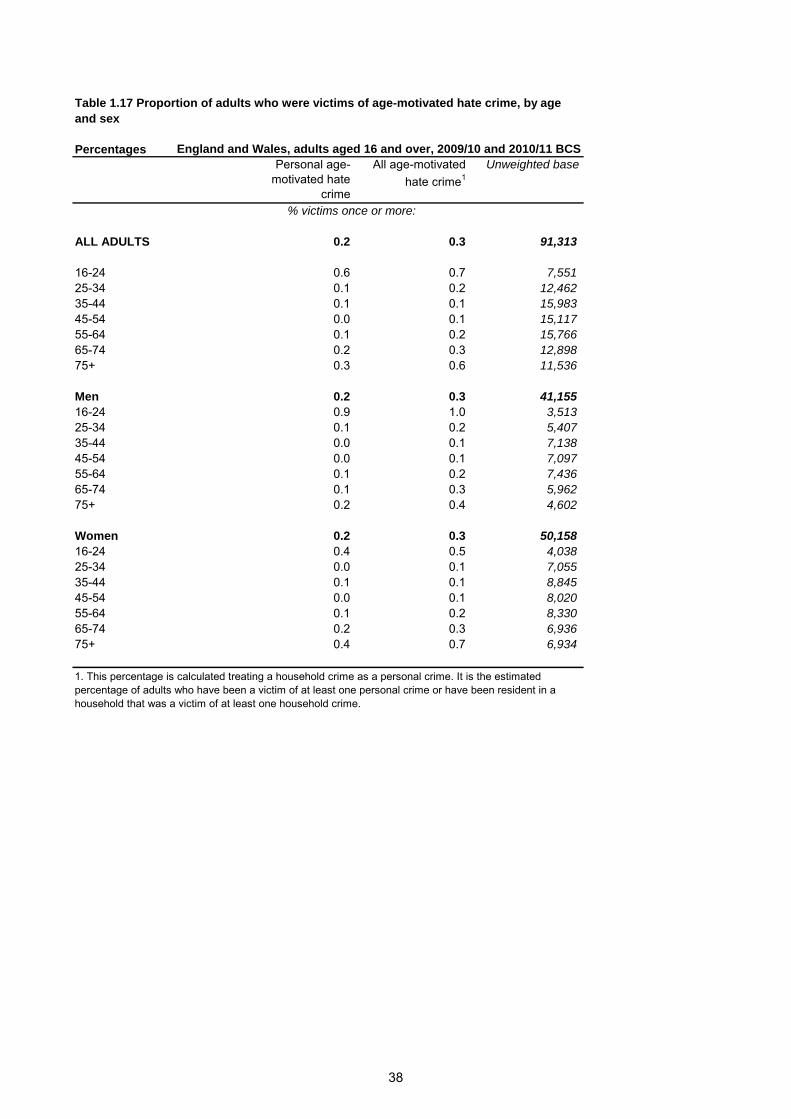
Percentages
Personal age-
motivated hate
crime
All age-motivated
hate crime1
Unweighted base
ALL ADULTS 0.2 0.3 91,313
16-24 0.6 0.7 7,551
25-34 0.1 0.2 12,462
35-44 0.1 0.1 15,983
45-54 0.0 0.1 15,117
55-64 0.1 0.2 15,766
65-74 0.2 0.3 12,898
75+ 0.3 0.6 11,536
Men 0.2 0.3 41,155
16-24 0.9 1.0 3,513
25-34 0.1 0.2 5,407
35-44 0.0 0.1 7,138
45-54 0.0 0.1 7,097
55-64 0.1 0.2 7,436
65-74 0.1 0.3 5,962
75+ 0.2 0.4 4,602
Women 0.2 0.3 50,158
16-24 0.4 0.5 4,038
25-34 0.0 0.1 7,055
35-44 0.1 0.1 8,845
45-54 0.0 0.1 8,020
55-64 0.1 0.2 8,330
65-74 0.2 0.3 6,936
75+ 0.4 0.7 6,934
% victims once or more:
England and Wales, adults aged 16 and over, 2009/10 and 2010/11 BCS
Table 1.17 Proportion of adults who were victims of age-motivated hate crime, by age
and sex
1. This percentage is calculated treating a household crime as a personal crime. It is the estimated
percentage of adults who have been a victim of at least one personal crime or have been resident in a
household that was a victim of at least one household crime.
38
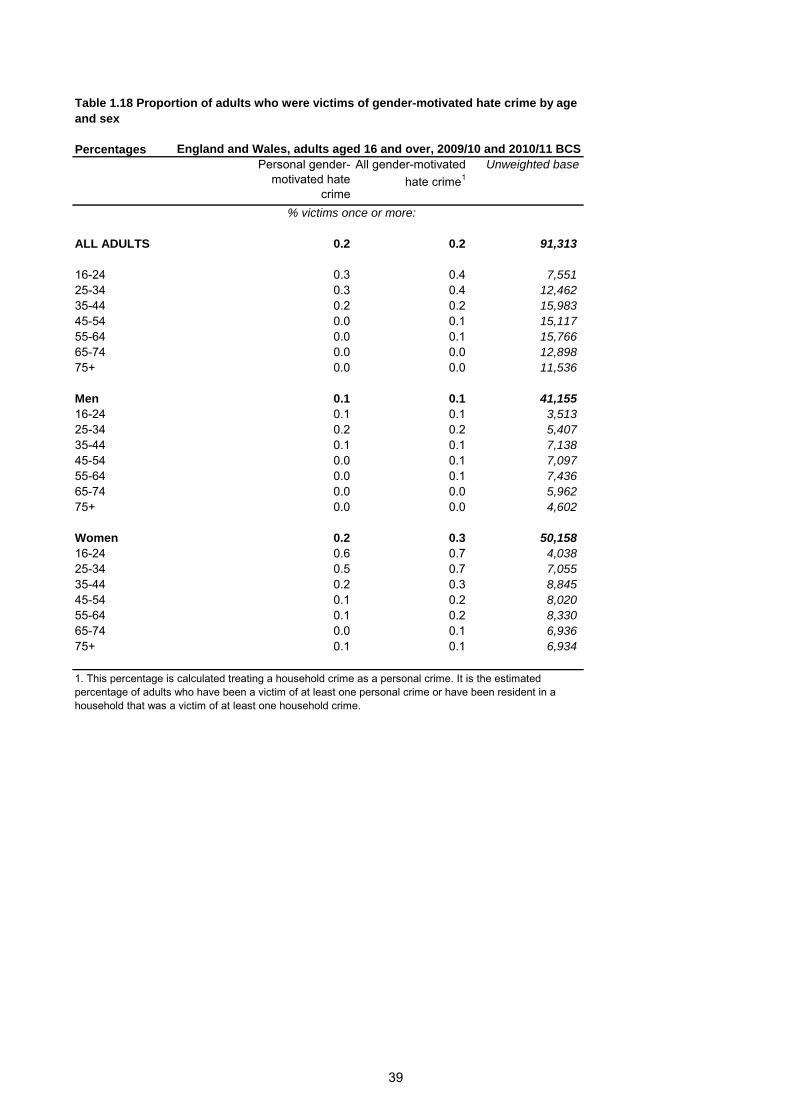
Percentages
Personal gender-
motivated hate
crime
All gender-motivated
hate crime1
Unweighted base
ALL ADULTS 0.2 0.2 91,313
16-24 0.3 0.4 7,551
25-34 0.3 0.4 12,462
35-44 0.2 0.2 15,983
45-54 0.0 0.1 15,117
55-64 0.0 0.1 15,766
65-74 0.0 0.0 12,898
75+ 0.0 0.0 11,536
Men 0.1 0.1 41,155
16-24 0.1 0.1 3,513
25-34 0.2 0.2 5,407
35-44 0.1 0.1 7,138
45-54 0.0 0.1 7,097
55-64 0.0 0.1 7,436
65-74 0.0 0.0 5,962
75+ 0.0 0.0 4,602
Women 0.2 0.3 50,158
16-24 0.6 0.7 4,038
25-34 0.5 0.7 7,055
35-44 0.2 0.3 8,845
45-54 0.1 0.2 8,020
55-64 0.1 0.2 8,330
65-74 0.0 0.1 6,936
75+ 0.1 0.1 6,934
% victims once or more:
England and Wales, adults aged 16 and over, 2009/10 and 2010/11 BCS
Table 1.18 Proportion of adults who were victims of gender-motivated hate crime by age
and sex
1. This percentage is calculated treating a household crime as a personal crime. It is the estimated
percentage of adults who have been a victim of at least one personal crime or have been resident in a
household that was a victim of at least one household crime.
39

40
2 Use of the internet and cyber security
Jacqueline Hoare
2.1 SUMMARY
This chapter contains information from the 2010/11 British Crime Survey (BCS) on levels of internet use, concerns people may have about using the internet, and any measures taken to protect personal details when using the internet. Questions were asked of adults aged 16 or over in England and Wales. Headline findings are summarised below and interesting variations by age and sex are highlighted throughout the chapter.
Internet usage
According to the 2010/11 BCS, 78 per cent of adults had used the internet in the last year; men were more likely than women to have done so (81% and 75% respectively). Levels of usage decreased with increasing age, from 98 per cent of 16 to 24 year olds to 19 per cent of those aged 75 or older.
Among adults who had used the internet in the last year, the most commonly reported use was for emailing, instant messaging or visiting chat rooms (83% of internet users). Around three-quarters (77%) said they used the internet for buying goods or services online and 73 per cent to browse for news or homework. Half (50%) of adults said they used the internet for online government services.
Protection of personal details
Among adults who said they had used the internet for any of the three online activities of interest (buying goods or services, online banking or managing finances and online government services), level of worry about the security of the personal details entered online varied as follows:
Of adults who said they used the internet for buying goods or services, 44 per cent said they were worried and just over a third of adults (37%) who reported using the internet for banking or managing finances were worried.
Around a quarter of adults (26%) who said they had used the internet for government services were worried about their personal details being secure online, the lowest among users of each of these internet services.
The most commonly mentioned actions taken by adults to protect their personal details online were: having up-to-date security software installed on home computer (67%), using only well-known, popular or trusted sites (67%), and using secure sites (such as indicated by a closed padlock, 61%).
Perceived barriers to use
The main reason given by adults who said they had not used the internet for each of the three online activities of interest (buying goods or services, online banking or managing finances and online government services) was that there was no need to (36%, 33% and 53% respectively).
Concern about personal details being insecure was given as a reason that had stopped people using the internet most commonly for online banking or managing finances (34%), then for buying goods or services (26%) and then for accessing online government services (10%).
Concern about losing money or having money stolen was given as a reason by 16 per cent of adults in relation to stopping them accessing online banking or managing finances, then for buying goods or services (12%) and less commonly for online government services (3%).
41
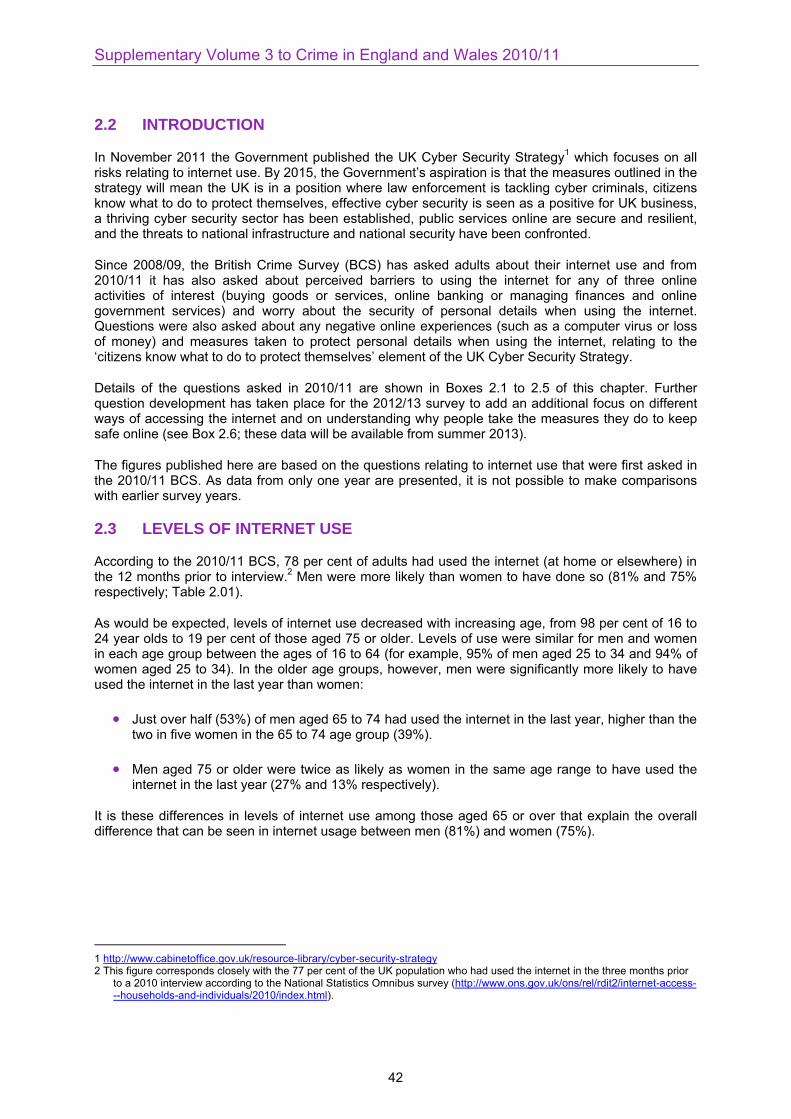
Supplementary Volume 3 to Crime in England and Wales 2010/11
2.2 INTRODUCTION
In November 2011 the Government published the UK Cyber Security Strategy1 which focuses on all
risks relating to internet use. By 2015, the Government’s aspiration is that the measures outlined in the strategy will mean the UK is in a position where law enforcement is tackling cyber criminals, citizens know what to do to protect themselves, effective cyber security is seen as a positive for UK business, a thriving cyber security sector has been established, public services online are secure and resilient, and the threats to national infrastructure and national security have been confronted.
Since 2008/09, the British Crime Survey (BCS) has asked adults about their internet use and from 2010/11 it has also asked about perceived barriers to using the internet for any of three online activities of interest (buying goods or services, online banking or managing finances and online government services) and worry about the security of personal details when using the internet. Questions were also asked about any negative online experiences (such as a computer virus or loss of money) and measures taken to protect personal details when using the internet, relating to the ‘citizens know what to do to protect themselves’ element of the UK Cyber Security Strategy.
Details of the questions asked in 2010/11 are shown in Boxes 2.1 to 2.5 of this chapter. Further question development has taken place for the 2012/13 survey to add an additional focus on different ways of accessing the internet and on understanding why people take the measures they do to keep safe online (see Box 2.6; these data will be available from summer 2013).
The figures published here are based on the questions relating to internet use that were first asked in the 2010/11 BCS. As data from only one year are presented, it is not possible to make comparisons with earlier survey years.
2.3 LEVELS OF INTERNET USE
According to the 2010/11 BCS, 78 per cent of adults had used the internet (at home or elsewhere) in the 12 months prior to interview.
2 Men were more likely than women to have done so (81% and 75%
respectively; Table 2.01).
As would be expected, levels of internet use decreased with increasing age, from 98 per cent of 16 to 24 year olds to 19 per cent of those aged 75 or older. Levels of use were similar for men and women in each age group between the ages of 16 to 64 (for example, 95% of men aged 25 to 34 and 94% of women aged 25 to 34). In the older age groups, however, men were significantly more likely to have used the internet in the last year than women:
Just over half (53%) of men aged 65 to 74 had used the internet in the last year, higher than the two in five women in the 65 to 74 age group (39%).
Men aged 75 or older were twice as likely as women in the same age range to have used the internet in the last year (27% and 13% respectively).
It is these differences in levels of internet use among those aged 65 or over that explain the overall difference that can be seen in internet usage between men (81%) and women (75%).
1 http://www.cabinetoffice.gov.uk/resource-library/cyber-security-strategy 2 This figure corresponds closely with the 77 per cent of the UK population who had used the internet in the three months prior
to a 2010 interview according to the National Statistics Omnibus survey (http://www.ons.gov.uk/ons/rel/rdit2/internet-access---households-and-individuals/2010/index.html).
42
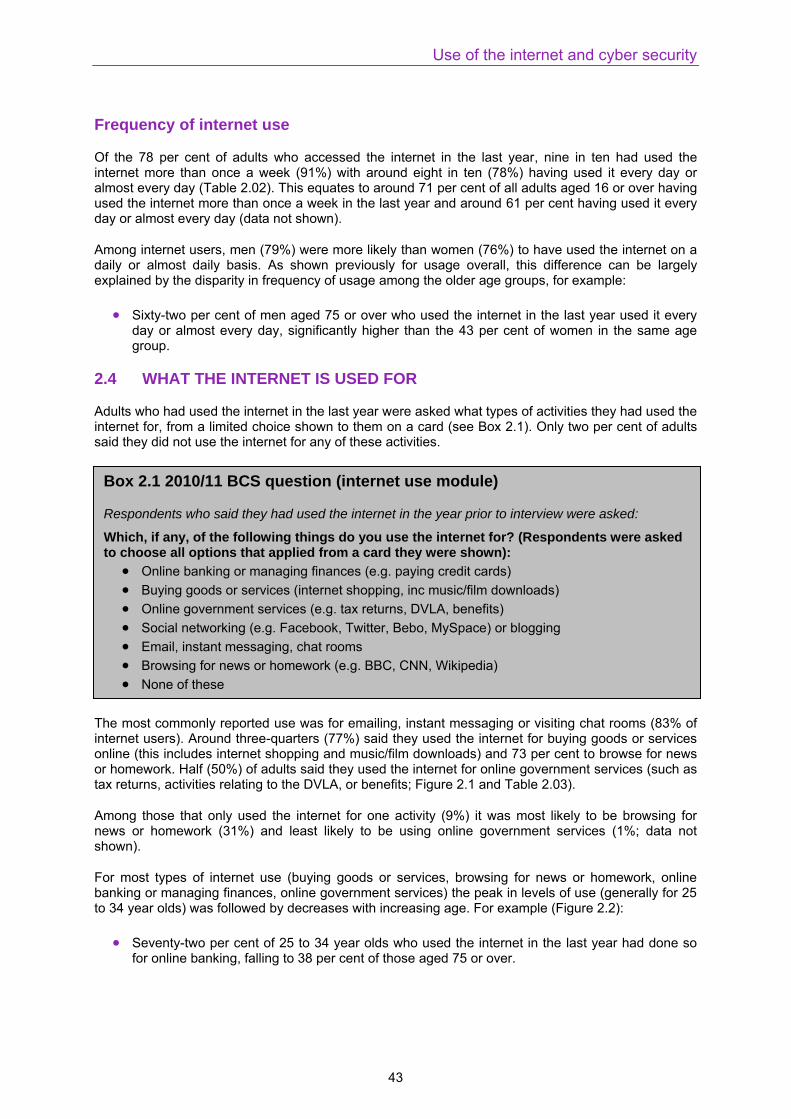
Use of the internet and cyber security
Frequency of internet use
Of the 78 per cent of adults who accessed the internet in the last year, nine in ten had used the internet more than once a week (91%) with around eight in ten (78%) having used it every day or almost every day (Table 2.02). This equates to around 71 per cent of all adults aged 16 or over having used the internet more than once a week in the last year and around 61 per cent having used it every day or almost every day (data not shown).
Among internet users, men (79%) were more likely than women (76%) to have used the internet on a daily or almost daily basis. As shown previously for usage overall, this difference can be largely explained by the disparity in frequency of usage among the older age groups, for example:
Sixty-two per cent of men aged 75 or over who used the internet in the last year used it every day or almost every day, significantly higher than the 43 per cent of women in the same age group.
2.4 WHAT THE INTERNET IS USED FOR
Adults who had used the internet in the last year were asked what types of activities they had used the internet for, from a limited choice shown to them on a card (see Box 2.1). Only two per cent of adults said they did not use the internet for any of these activities.
The most commonly reported use was for emailing, instant messaging or visiting chat rooms (83% of internet users). Around three-quarters (77%) said they used the internet for buying goods or services online (this includes internet shopping and music/film downloads) and 73 per cent to browse for news or homework. Half (50%) of adults said they used the internet for online government services (such as tax returns, activities relating to the DVLA, or benefits; Figure 2.1 and Table 2.03).
Among those that only used the internet for one activity (9%) it was most likely to be browsing for news or homework (31%) and least likely to be using online government services (1%; data not shown).
For most types of internet use (buying goods or services, browsing for news or homework, online banking or managing finances, online government services) the peak in levels of use (generally for 25 to 34 year olds) was followed by decreases with increasing age. For example (Figure 2.2):
Seventy-two per cent of 25 to 34 year olds who used the internet in the last year had done so for online banking, falling to 38 per cent of those aged 75 or over.
Box 2.1 2010/11 BCS question (internet use module)
Respondents who said they had used the internet in the year prior to interview were asked:
Which, if any, of the following things do you use the internet for? (Respondents were asked to choose all options that applied from a card they were shown):
Online banking or managing finances (e.g. paying credit cards)
Buying goods or services (internet shopping, inc music/film downloads)
Online government services (e.g. tax returns, DVLA, benefits)
Social networking (e.g. Facebook, Twitter, Bebo, MySpace) or blogging
Email, instant messaging, chat rooms
Browsing for news or homework (e.g. BBC, CNN, Wikipedia)
None of these
43
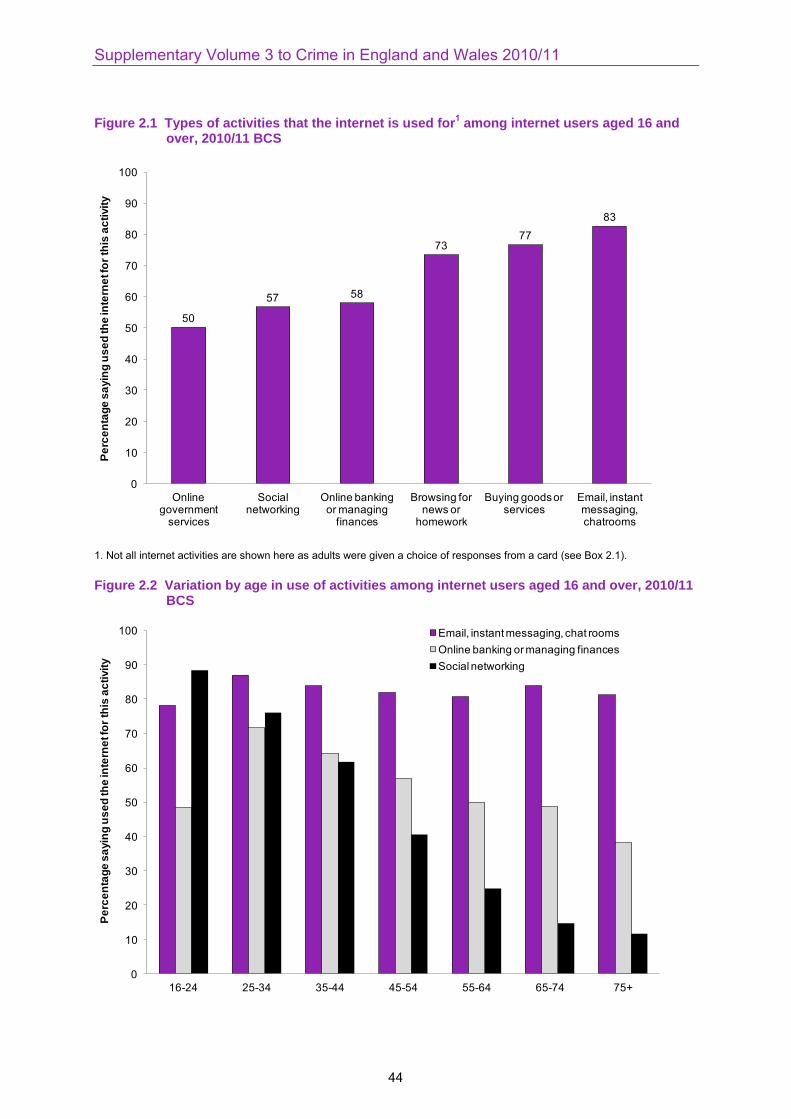
Supplementary Volume 3 to Crime in England and Wales 2010/11
Figure 2.1 Types of activities that the internet is used for1 among internet users aged 16 and
over, 2010/11 BCS
50
57 58
7377
83
0
10
20
30
40
50
60
70
80
90
100
Online government
services
Social networking
Online banking or managing
finances
Browsing for news or
homework
Buying goods or services
Email, instant messaging, chatrooms
Pe
rce
nta
ge
sa
yin
g u
se
d th
e in
tern
et fo
r th
is a
cti
vit
y
1. Not all internet activities are shown here as adults were given a choice of responses from a card (see Box 2.1).
Figure 2.2 Variation by age in use of activities among internet users aged 16 and over, 2010/11 BCS
0
10
20
30
40
50
60
70
80
90
100
16-24 25-34 35-44 45-54 55-64 65-74 75+
Pe
rce
nta
ge
sa
yin
g u
se
d th
e in
tern
et fo
r th
is a
cti
vit
y
Email, instant messaging, chat rooms
Online banking or managing finances
Social networking
44
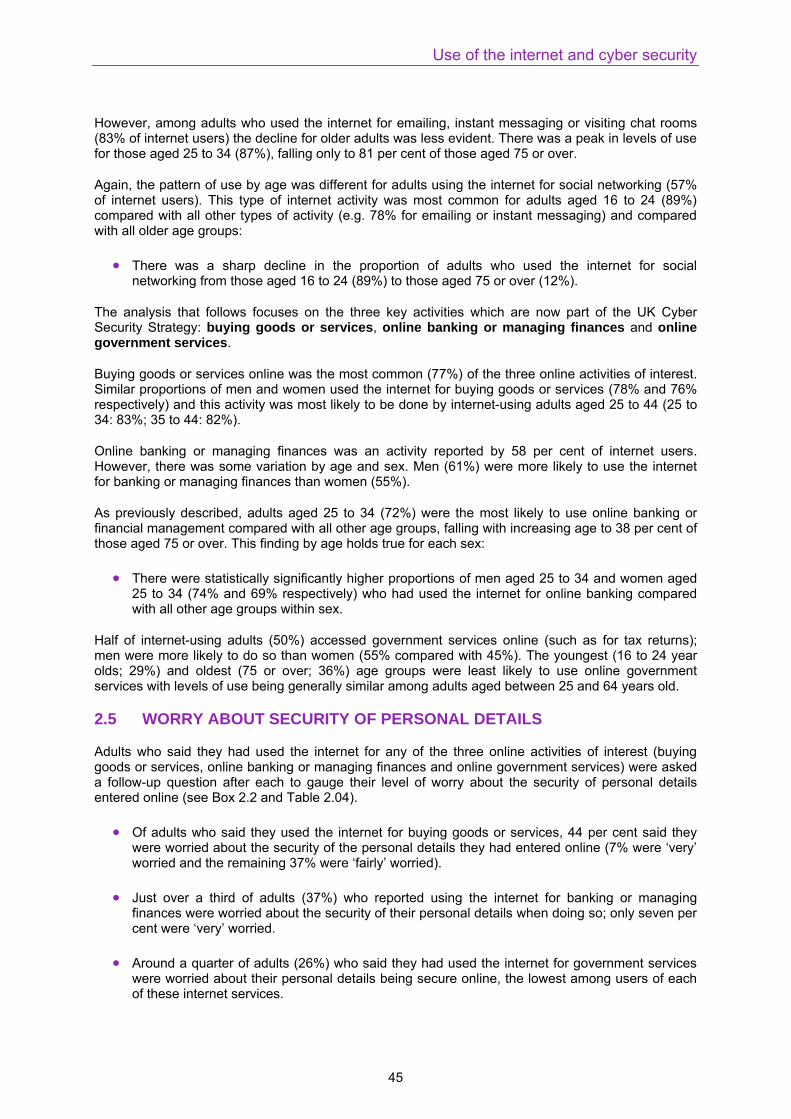
Use of the internet and cyber security
However, among adults who used the internet for emailing, instant messaging or visiting chat rooms (83% of internet users) the decline for older adults was less evident. There was a peak in levels of use for those aged 25 to 34 (87%), falling only to 81 per cent of those aged 75 or over.
Again, the pattern of use by age was different for adults using the internet for social networking (57% of internet users). This type of internet activity was most common for adults aged 16 to 24 (89%) compared with all other types of activity (e.g. 78% for emailing or instant messaging) and compared with all older age groups:
There was a sharp decline in the proportion of adults who used the internet for social networking from those aged 16 to 24 (89%) to those aged 75 or over (12%).
The analysis that follows focuses on the three key activities which are now part of the UK Cyber Security Strategy: buying goods or services, online banking or managing finances and online government services.
Buying goods or services online was the most common (77%) of the three online activities of interest. Similar proportions of men and women used the internet for buying goods or services (78% and 76% respectively) and this activity was most likely to be done by internet-using adults aged 25 to 44 (25 to 34: 83%; 35 to 44: 82%).
Online banking or managing finances was an activity reported by 58 per cent of internet users. However, there was some variation by age and sex. Men (61%) were more likely to use the internet for banking or managing finances than women (55%).
As previously described, adults aged 25 to 34 (72%) were the most likely to use online banking or financial management compared with all other age groups, falling with increasing age to 38 per cent of those aged 75 or over. This finding by age holds true for each sex:
There were statistically significantly higher proportions of men aged 25 to 34 and women aged 25 to 34 (74% and 69% respectively) who had used the internet for online banking compared with all other age groups within sex.
Half of internet-using adults (50%) accessed government services online (such as for tax returns); men were more likely to do so than women (55% compared with 45%). The youngest (16 to 24 year olds; 29%) and oldest (75 or over; 36%) age groups were least likely to use online government services with levels of use being generally similar among adults aged between 25 and 64 years old.
2.5 WORRY ABOUT SECURITY OF PERSONAL DETAILS
Adults who said they had used the internet for any of the three online activities of interest (buying goods or services, online banking or managing finances and online government services) were asked a follow-up question after each to gauge their level of worry about the security of personal details entered online (see Box 2.2 and Table 2.04).
Of adults who said they used the internet for buying goods or services, 44 per cent said they were worried about the security of the personal details they had entered online (7% were ‘very’ worried and the remaining 37% were ‘fairly’ worried).
Just over a third of adults (37%) who reported using the internet for banking or managing finances were worried about the security of their personal details when doing so; only seven per cent were ‘very’ worried.
Around a quarter of adults (26%) who said they had used the internet for government services were worried about their personal details being secure online, the lowest among users of each of these internet services.
45
Supplementary Volume 3 to Crime in England and Wales 2010/11
While not directly comparable, levels of worry about the security of personal details entered online appeared higher than for estimates of worry about other crime types from the BCS, for example, ten per cent of adults were worried about being a victim of burglary (Chaplin et al., 2011). However, levels of worry were lower than worry about being a victim of plastic card fraud (53% of plastic card owners, Moon et al., 2010).
However, it is worth noting that overall between a half and three-quarters of internet users were not worried about the security of their personal details entered online when using the internet for the specified activities; that is, 56 per cent of adults who had used the internet for buying goods or services, 63 per cent who used online banking and 74 per cent who had used online government services.
There were some variations in levels of worry when considering personal characteristics, although fewer differences than found elsewhere in this chapter. Among those who had used the internet for buying goods or services, women were more likely than men to be worried about the security of their personal details online (46% and 42% respectively; Table 2.05).
It was clear that among adults who had used the internet to buy goods or services, those aged 16 to 24 were the least likely to be worried about the security of their personal details entered online (32%, compared with 51% of 45 to 54 year olds for example). While 16 to 24 year olds were not the highest online consumers of goods or services, seven in ten (71%) internet users said they did use the internet to buy goods or services. Of those that did, two-thirds (68%) were not worried about the security of personal details online.
2.6 PROTECTING PERSONAL DETAILS
Adults who had used the internet in the last year were asked whether or not they had taken certain measures to protect personal details online (see Box 2.3).
Nearly everyone who used the internet reported that they had adopted at least one of the measures asked about. Only three per cent said they did nothing to protect their personal details as they were not worried about security.
Box 2.2 2010/11 BCS question (internet use module)
For respondents who said they had used the internet for online banking or managing finances, for buying goods or services or for online government services:
When you use the internet for [this activity] how worried are you about the security of the personal details you have entered online? By personal details I mean details such as your name, bank account or credit card number, username or password. (Respondents were asked to choose all options that applied from a card they were shown):
Very worried
Fairly worried
Not very worried
Not at all worried
46
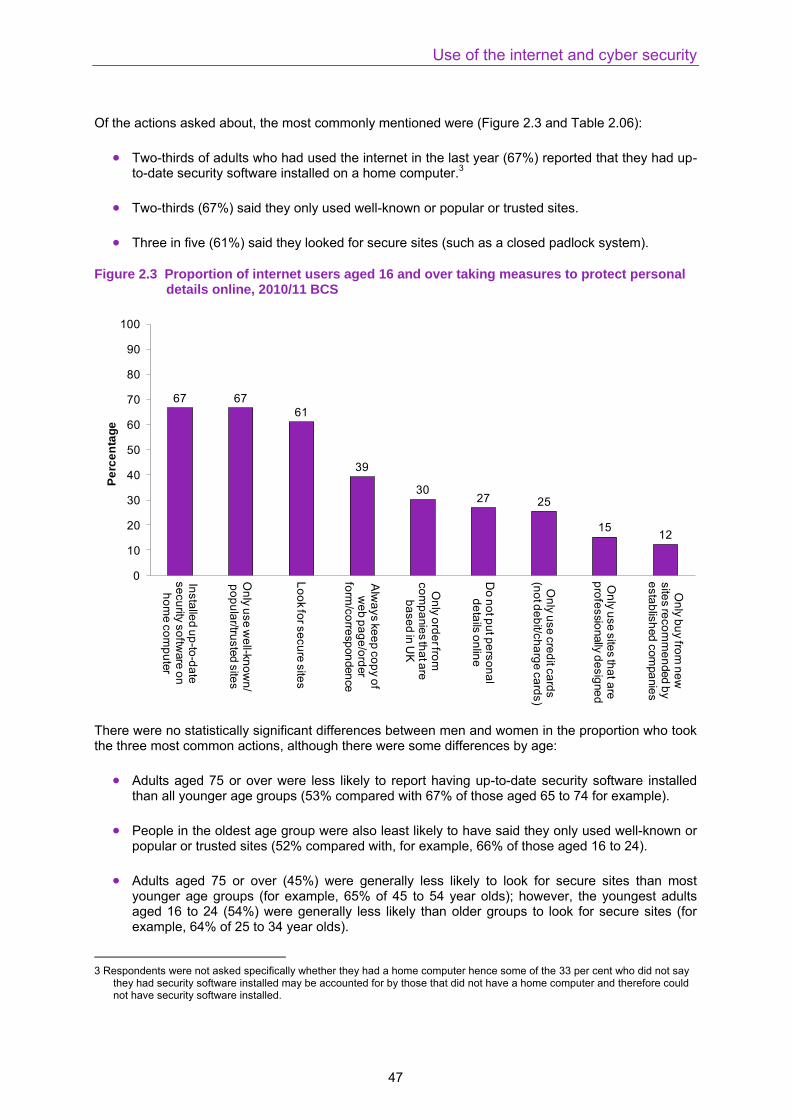
Use of the internet and cyber security
Of the actions asked about, the most commonly mentioned were (Figure 2.3 and Table 2.06):
Two-thirds of adults who had used the internet in the last year (67%) reported that they had up-to-date security software installed on a home computer.
3
Two-thirds (67%) said they only used well-known or popular or trusted sites.
Three in five (61%) said they looked for secure sites (such as a closed padlock system).
Figure 2.3 Proportion of internet users aged 16 and over taking measures to protect personal details online, 2010/11 BCS
67 67
61
39
3027 25
1512
0
10
20
30
40
50
60
70
80
90
100
Insta
lled
up
-to-d
ate
se
cu
rity s
oftw
are
on
h
om
e c
om
pu
ter
On
ly u
se
we
ll-kn
ow
n/
po
pu
lar/tru
ste
d s
ites
Lo
ok fo
r se
cu
re s
ites
Alw
ays k
ee
p c
op
y o
f w
eb
pa
ge
/ord
er
form
/co
rresp
on
den
ce
On
ly o
rde
r from
co
mp
anie
s th
at a
re
ba
se
d in
UK
Do
no
t pu
t pe
rso
na
l d
eta
ils o
nlin
e
On
ly u
se
cre
dit c
ard
s
(no
t de
bit/c
ha
rge
ca
rds)
On
ly u
se
site
s th
at a
re
pro
fessio
nally
de
sig
ne
d
On
ly b
uy fro
m n
ew
site
s re
co
mm
en
ded
by
esta
blis
hed c
om
pa
nie
s
Pe
rce
nta
ge
There were no statistically significant differences between men and women in the proportion who took the three most common actions, although there were some differences by age:
Adults aged 75 or over were less likely to report having up-to-date security software installed than all younger age groups (53% compared with 67% of those aged 65 to 74 for example).
People in the oldest age group were also least likely to have said they only used well-known or popular or trusted sites (52% compared with, for example, 66% of those aged 16 to 24).
Adults aged 75 or over (45%) were generally less likely to look for secure sites than most younger age groups (for example, 65% of 45 to 54 year olds); however, the youngest adults aged 16 to 24 (54%) were generally less likely than older groups to look for secure sites (for example, 64% of 25 to 34 year olds).
3 Respondents were not asked specifically whether they had a home computer hence some of the 33 per cent who did not say
they had security software installed may be accounted for by those that did not have a home computer and therefore could not have security software installed.
47
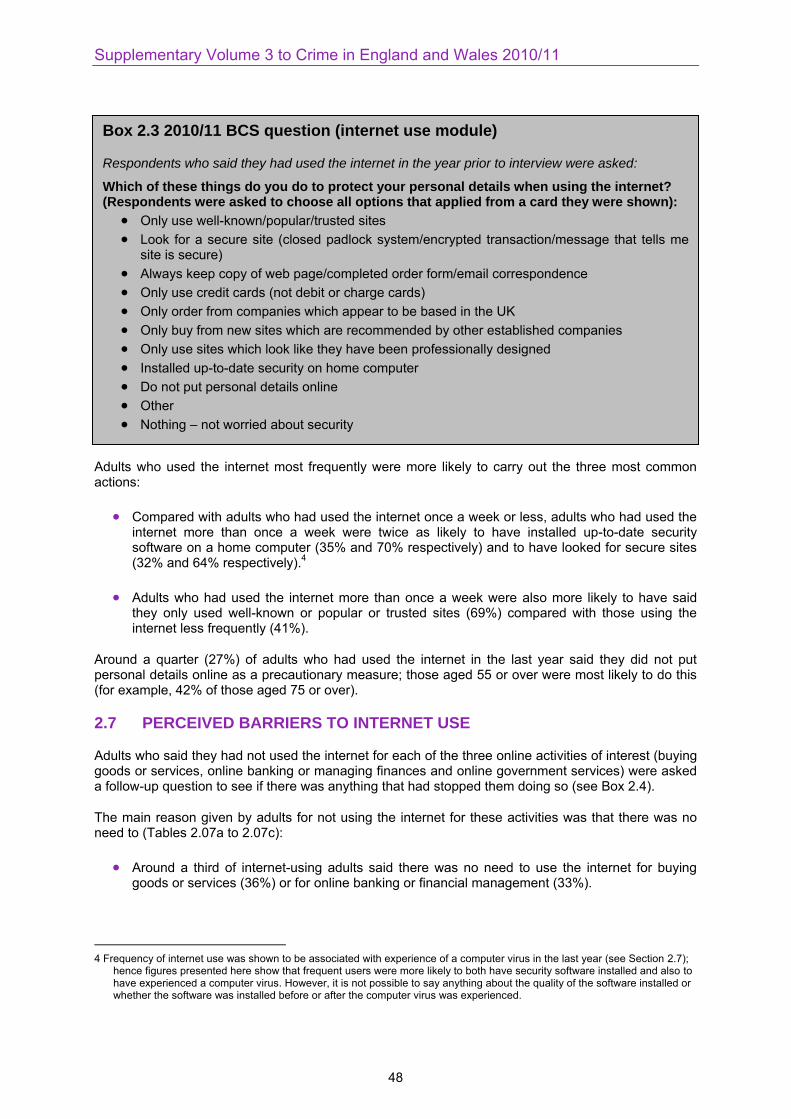
Supplementary Volume 3 to Crime in England and Wales 2010/11
Adults who used the internet most frequently were more likely to carry out the three most common actions:
Compared with adults who had used the internet once a week or less, adults who had used the internet more than once a week were twice as likely to have installed up-to-date security software on a home computer (35% and 70% respectively) and to have looked for secure sites (32% and 64% respectively).
4
Adults who had used the internet more than once a week were also more likely to have said they only used well-known or popular or trusted sites (69%) compared with those using the internet less frequently (41%).
Around a quarter (27%) of adults who had used the internet in the last year said they did not put personal details online as a precautionary measure; those aged 55 or over were most likely to do this (for example, 42% of those aged 75 or over).
2.7 PERCEIVED BARRIERS TO INTERNET USE
Adults who said they had not used the internet for each of the three online activities of interest (buying goods or services, online banking or managing finances and online government services) were asked a follow-up question to see if there was anything that had stopped them doing so (see Box 2.4).
The main reason given by adults for not using the internet for these activities was that there was no need to (Tables 2.07a to 2.07c):
Around a third of internet-using adults said there was no need to use the internet for buying goods or services (36%) or for online banking or financial management (33%).
4 Frequency of internet use was shown to be associated with experience of a computer virus in the last year (see Section 2.7);
hence figures presented here show that frequent users were more likely to both have security software installed and also to have experienced a computer virus. However, it is not possible to say anything about the quality of the software installed or whether the software was installed before or after the computer virus was experienced.
Box 2.3 2010/11 BCS question (internet use module)
Respondents who said they had used the internet in the year prior to interview were asked:
Which of these things do you do to protect your personal details when using the internet? (Respondents were asked to choose all options that applied from a card they were shown):
Only use well-known/popular/trusted sites
Look for a secure site (closed padlock system/encrypted transaction/message that tells me site is secure)
Always keep copy of web page/completed order form/email correspondence
Only use credit cards (not debit or charge cards)
Only order from companies which appear to be based in the UK
Only buy from new sites which are recommended by other established companies
Only use sites which look like they have been professionally designed
Installed up-to-date security on home computer
Do not put personal details online
Other
Nothing – not worried about security
48
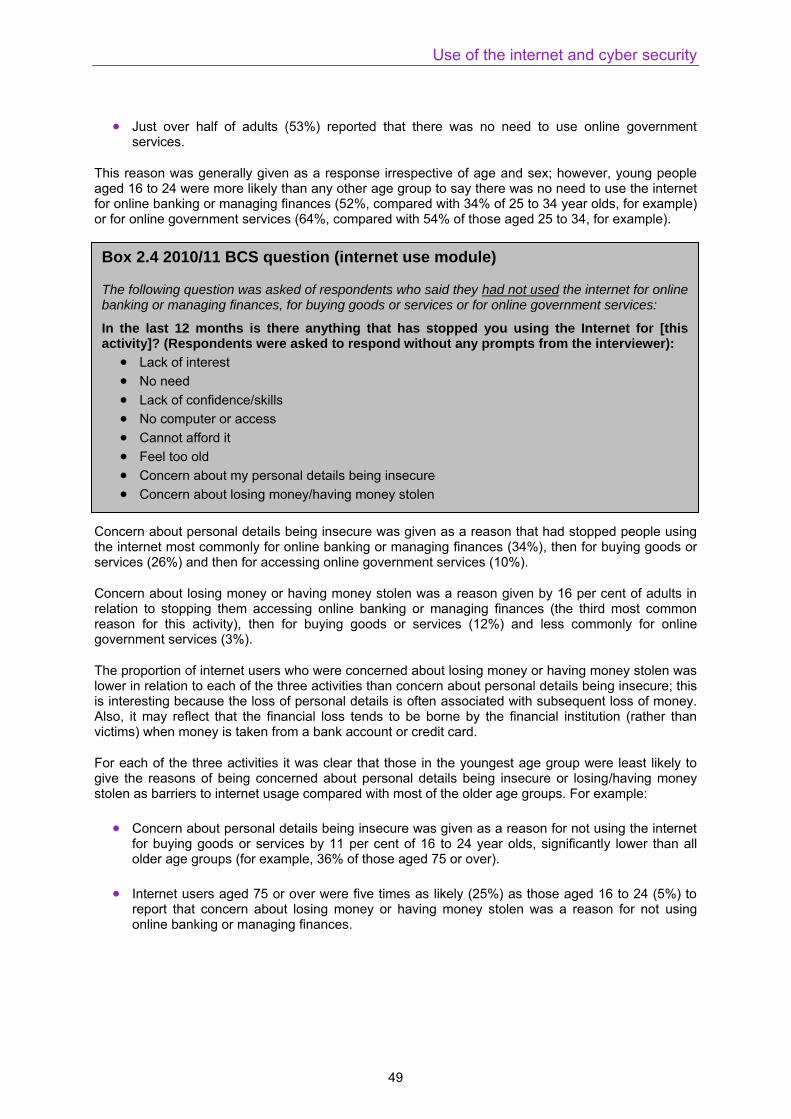
Use of the internet and cyber security
Just over half of adults (53%) reported that there was no need to use online government services.
This reason was generally given as a response irrespective of age and sex; however, young people aged 16 to 24 were more likely than any other age group to say there was no need to use the internet for online banking or managing finances (52%, compared with 34% of 25 to 34 year olds, for example) or for online government services (64%, compared with 54% of those aged 25 to 34, for example).
Concern about personal details being insecure was given as a reason that had stopped people using the internet most commonly for online banking or managing finances (34%), then for buying goods or services (26%) and then for accessing online government services (10%).
Concern about losing money or having money stolen was a reason given by 16 per cent of adults in relation to stopping them accessing online banking or managing finances (the third most common reason for this activity), then for buying goods or services (12%) and less commonly for online government services (3%).
The proportion of internet users who were concerned about losing money or having money stolen was lower in relation to each of the three activities than concern about personal details being insecure; this is interesting because the loss of personal details is often associated with subsequent loss of money. Also, it may reflect that the financial loss tends to be borne by the financial institution (rather than victims) when money is taken from a bank account or credit card.
For each of the three activities it was clear that those in the youngest age group were least likely to give the reasons of being concerned about personal details being insecure or losing/having money stolen as barriers to internet usage compared with most of the older age groups. For example:
Concern about personal details being insecure was given as a reason for not using the internet for buying goods or services by 11 per cent of 16 to 24 year olds, significantly lower than all older age groups (for example, 36% of those aged 75 or over).
Internet users aged 75 or over were five times as likely (25%) as those aged 16 to 24 (5%) to report that concern about losing money or having money stolen was a reason for not using online banking or managing finances.
Box 2.4 2010/11 BCS question (internet use module)
The following question was asked of respondents who said they had not used the internet for online banking or managing finances, for buying goods or services or for online government services:
In the last 12 months is there anything that has stopped you using the Internet for [this activity]? (Respondents were asked to respond without any prompts from the interviewer):
Lack of interest
No need
Lack of confidence/skills
No computer or access
Cannot afford it
Feel too old
Concern about my personal details being insecure
Concern about losing money/having money stolen
49
Supplementary Volume 3 to Crime in England and Wales 2010/11
Three per cent of those aged 16 to 24 who had used the internet in the last year but not for online government services reported that concern about personal details being insecure was a reason for not doing so, lower than the 20 per cent of adults aged 75 or over who gave the same reason.
Part of the UK Cyber Security Strategy includes ‘The need for everyone to have the ability – in terms of skills, technology, confidence and opportunity – to access cyberspace’. Figures from the 2010/11 BCS showed that (Tables 2.07a to 2.07c):
Lack of confidence or skills was reported as a reason stopping them using the internet for buying goods or services by five per cent of internet-using adults who did not use the internet for this activity. The equivalent figures for online banking or managing finances and online government services were seven and four per cent respectively.
Among internet users who did not use the internet for each of the three activities, only very low proportions gave no computer or access to a computer as a reason stopping them from accessing goods or services, banking or financial management or government services online (2%, 1% and 1% respectively).
Although still a low proportion, women were more likely than men to say that lack of confidence or skills was a reason stopping them from using online banking or managing finances (8% and 6% respectively) or online government services (5% and 3% respectively).
Adults aged 16 to 34 who had not used the internet for buying goods or services were least likely to say that lack of confidence or skills was a reason stopping them using the internet for this activity (16 to 24 year olds: 1%; 25 to 34 year olds: 2%; compared with 13% of adults aged 65 to 74 for example).
Although there were some patterns in the data that suggested variation on barriers to internet use by age, these were not all statistically significant. This may in part be due to the small numbers of people responding to these questions when broken down by age group; small numbers will affect the tests of significance hence any real differences may not be detected.
2.8 NEGATIVE EXPERIENCES WHILE USING THE INTERNET
Adults who had used the internet in the last year were asked whether or not they had experienced certain types of negative behaviours or actions as a result of using the internet (see Box 2.5). This question is an indicator but not a measure of cyber-enabled crimes as the experiences asked about may or may not have been criminal.
Box 2.5 2010/11 BCS question (internet use module)
Respondents who said they had used the internet in the year prior to interview were asked:
In the last 12 months, have you personally experienced any of the things mentioned on this card while using the internet? (Respondents were asked to choose all options that applied from a card they were shown):
A computer virus
Loss of money
Unauthorised access to/use of personal data (e.g. email account, bank account)
Upsetting images/illegal images
Abusive/ threatening behaviour
None of these
50
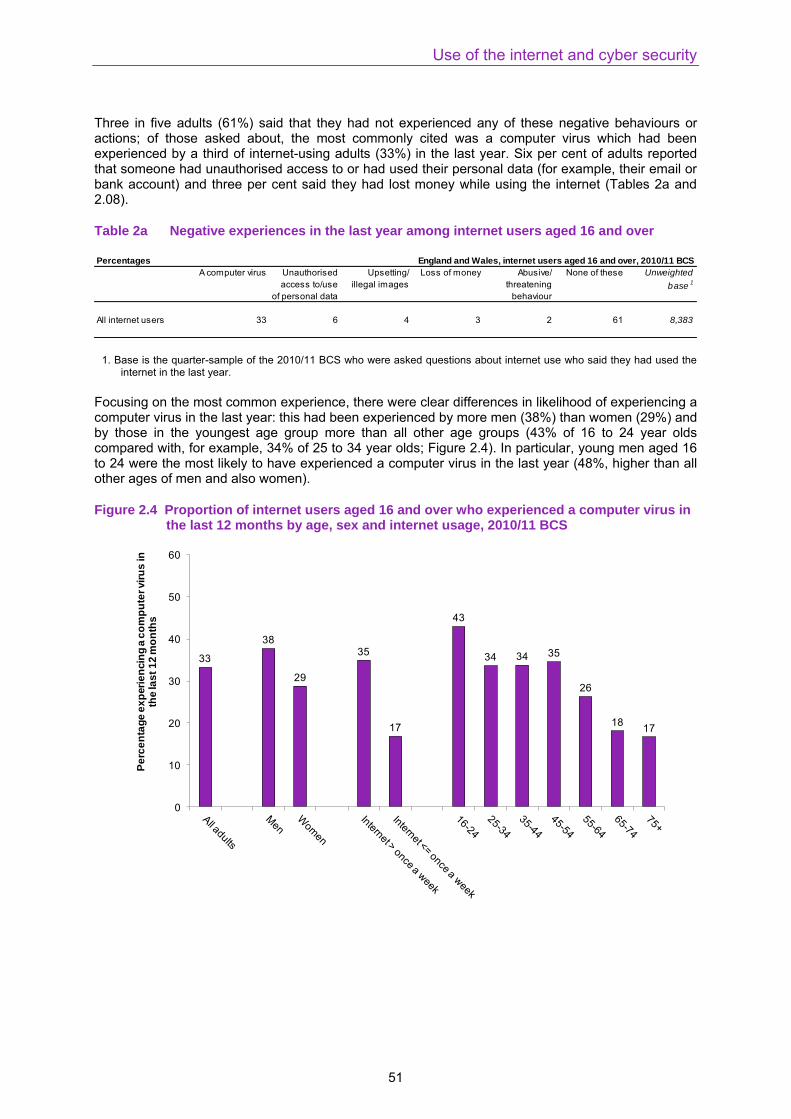
Use of the internet and cyber security
Three in five adults (61%) said that they had not experienced any of these negative behaviours or actions; of those asked about, the most commonly cited was a computer virus which had been experienced by a third of internet-using adults (33%) in the last year. Six per cent of adults reported that someone had unauthorised access to or had used their personal data (for example, their email or bank account) and three per cent said they had lost money while using the internet (Tables 2a and 2.08).
Table 2a Negative experiences in the last year among internet users aged 16 and over
Percentages
All internet users 33 6 4 3 2 61 8,383
Unweighted
base1
England and Wales, internet users aged 16 and over, 2010/11 BCS
A computer virus Unauthorised
access to/use
of personal data
Upsetting/
illegal images
Loss of money Abusive/
threatening
behaviour
None of these
1. Base is the quarter-sample of the 2010/11 BCS who were asked questions about internet use who said they had used the internet in the last year.
Focusing on the most common experience, there were clear differences in likelihood of experiencing a computer virus in the last year: this had been experienced by more men (38%) than women (29%) and by those in the youngest age group more than all other age groups (43% of 16 to 24 year olds compared with, for example, 34% of 25 to 34 year olds; Figure 2.4). In particular, young men aged 16 to 24 were the most likely to have experienced a computer virus in the last year (48%, higher than all other ages of men and also women).
Figure 2.4 Proportion of internet users aged 16 and over who experienced a computer virus in the last 12 months by age, sex and internet usage, 2010/11 BCS
33
38
29
35
17
43
34 34 35
26
1817
0
10
20
30
40
50
60
Pe
rce
nta
ge
ex
peri
en
cin
g a
co
mp
ute
r vir
us
in
th
e la
st
12
mo
nth
s
51
Supplementary Volume 3 to Crime in England and Wales 2010/11
Unsurprisingly, frequency of internet use was associated with experience of a computer virus in the last year. Adults who used the internet more than once a week were twice as likely to have had a computer virus as those using the internet once a week or less (35% and 17% respectively).
5
5 Further analysis of these data suggests that the relationship between frequency of use and experience of a computer virus
holds true irrespective of age.
52
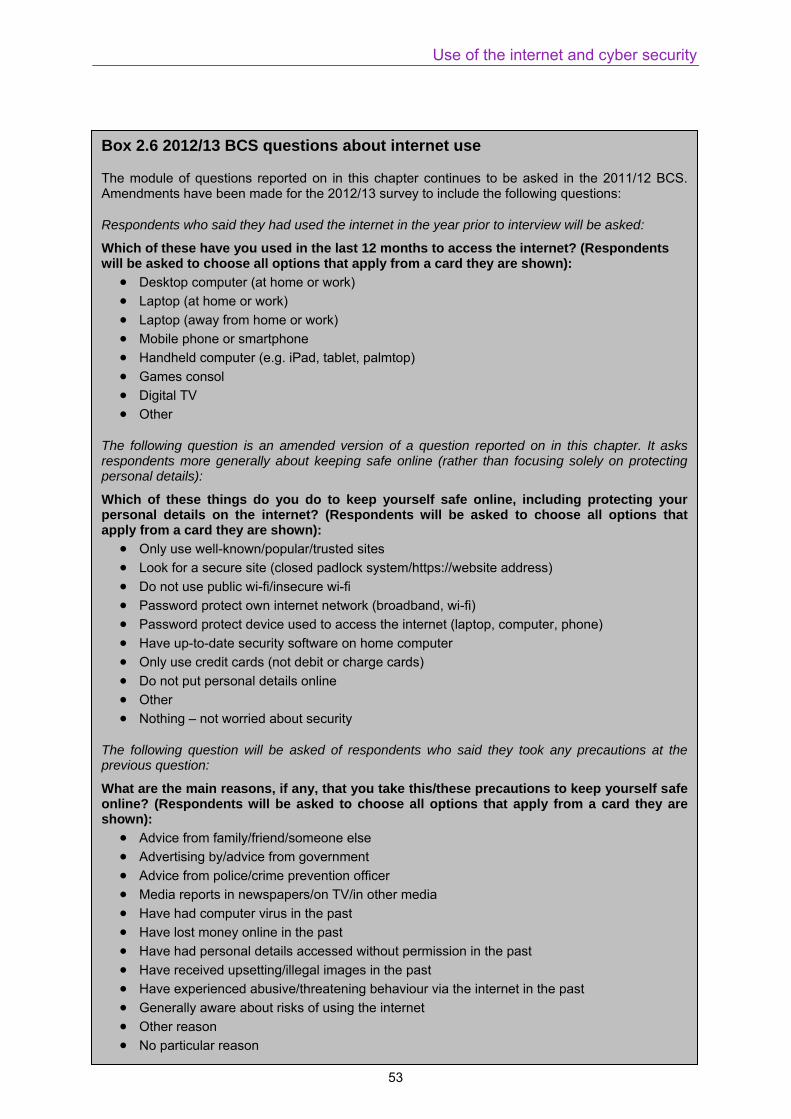
Use of the internet and cyber security
Box 2.6 2012/13 BCS questions about internet use
The module of questions reported on in this chapter continues to be asked in the 2011/12 BCS. Amendments have been made for the 2012/13 survey to include the following questions:
Respondents who said they had used the internet in the year prior to interview will be asked:
Which of these have you used in the last 12 months to access the internet? (Respondents will be asked to choose all options that apply from a card they are shown):
Desktop computer (at home or work)
Laptop (at home or work)
Laptop (away from home or work)
Mobile phone or smartphone
Handheld computer (e.g. iPad, tablet, palmtop)
Games consol
Digital TV
Other
The following question is an amended version of a question reported on in this chapter. It asks respondents more generally about keeping safe online (rather than focusing solely on protecting personal details):
Which of these things do you do to keep yourself safe online, including protecting your personal details on the internet? (Respondents will be asked to choose all options that apply from a card they are shown):
Only use well-known/popular/trusted sites
Look for a secure site (closed padlock system/https://website address)
Do not use public wi-fi/insecure wi-fi
Password protect own internet network (broadband, wi-fi)
Password protect device used to access the internet (laptop, computer, phone)
Have up-to-date security software on home computer
Only use credit cards (not debit or charge cards)
Do not put personal details online
Other
Nothing – not worried about security
The following question will be asked of respondents who said they took any precautions at the previous question:
What are the main reasons, if any, that you take this/these precautions to keep yourself safe online? (Respondents will be asked to choose all options that apply from a card they are shown):
Advice from family/friend/someone else
Advertising by/advice from government
Advice from police/crime prevention officer
Media reports in newspapers/on TV/in other media
Have had computer virus in the past
Have lost money online in the past
Have had personal details accessed without permission in the past
Have received upsetting/illegal images in the past
Have experienced abusive/threatening behaviour via the internet in the past
Generally aware about risks of using the internet
Other reason
No particular reason
53
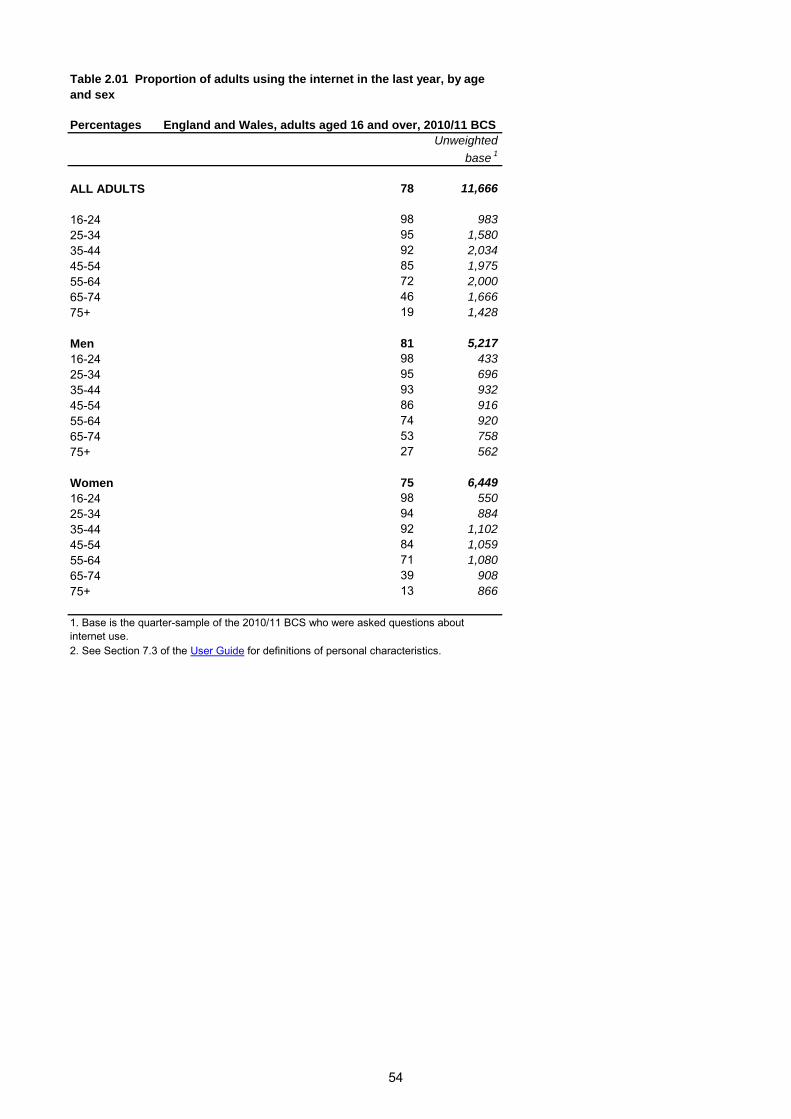
Percentages England and Wales, adults aged 16 and over, 2010/11 BCS
Unweighted
base1
ALL ADULTS 78 11,666
16-24 98 983
25-34 95 1,580
35-44 92 2,034
45-54 85 1,975
55-64 72 2,000
65-74 46 1,666
75+ 19 1,428
Men 81 5,217
16-24 98 433
25-34 95 696
35-44 93 932
45-54 86 916
55-64 74 920
65-74 53 758
75+ 27 562
Women 75 6,449
16-24 98 550
25-34 94 884
35-44 92 1,102
45-54 84 1,059
55-64 71 1,080
65-74 39 908
75+ 13 866
Table 2.01 Proportion of adults using the internet in the last year, by age
and sex
2. See Section 7.3 of the User Guide for definitions of personal characteristics.
1. Base is the quarter-sample of the 2010/11 BCS who were asked questions about
internet use.
54
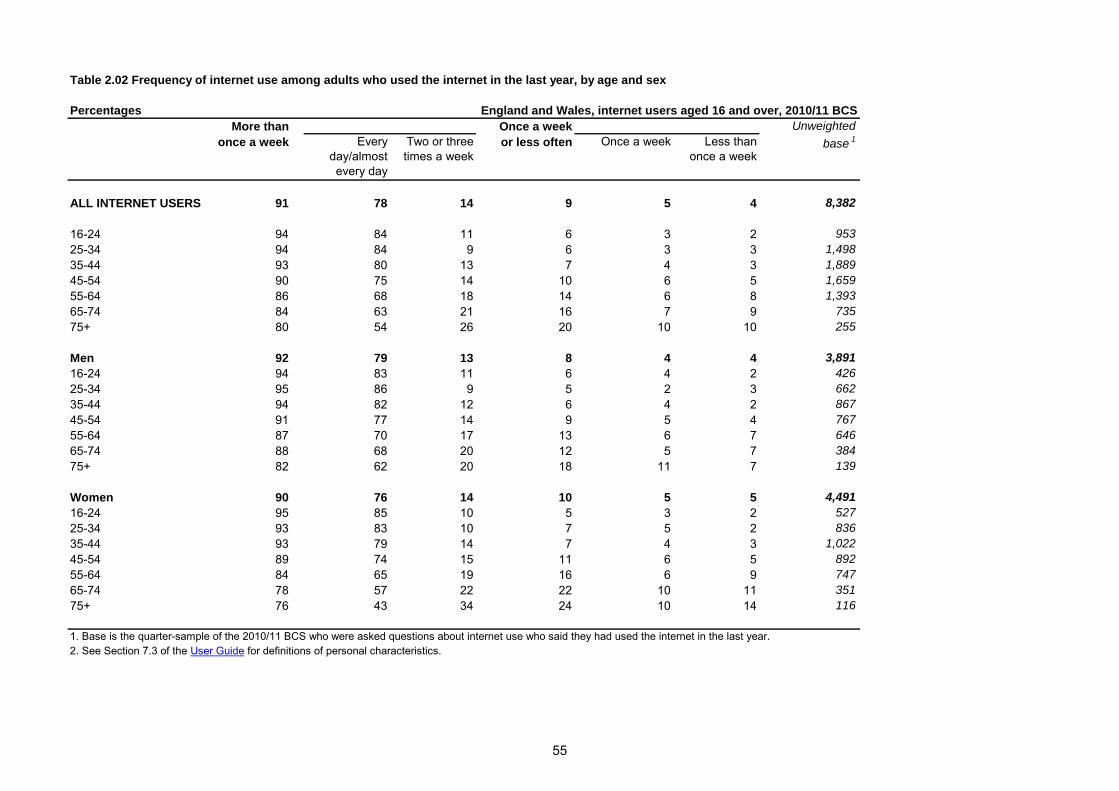
Percentages
Every
day/almost
every day
Two or three
times a week
Once a week Less than
once a week
ALL INTERNET USERS 91 78 14 9 5 4 8,382
16-24 94 84 11 6 3 2 953
25-34 94 84 9 6 3 3 1,498
35-44 93 80 13 7 4 3 1,889
45-54 90 75 14 10 6 5 1,659
55-64 86 68 18 14 6 8 1,393
65-74 84 63 21 16 7 9 735
75+ 80 54 26 20 10 10 255
Men 92 79 13 8 4 4 3,891
16-24 94 83 11 6 4 2 426
25-34 95 86 9 5 2 3 662
35-44 94 82 12 6 4 2 867
45-54 91 77 14 9 5 4 767
55-64 87 70 17 13 6 7 646
65-74 88 68 20 12 5 7 384
75+ 82 62 20 18 11 7 139
Women 90 76 14 10 5 5 4,491
16-24 95 85 10 5 3 2 527
25-34 93 83 10 7 5 2 836
35-44 93 79 14 7 4 3 1,022
45-54 89 74 15 11 6 5 892
55-64 84 65 19 16 6 9 747
65-74 78 57 22 22 10 11 351
75+ 76 43 34 24 10 14 116
2. See Section 7.3 of the User Guide for definitions of personal characteristics.
More than
once a week
Once a week
or less often
Table 2.02 Frequency of internet use among adults who used the internet in the last year, by age and sex
Unweighted
base1
1. Base is the quarter-sample of the 2010/11 BCS who were asked questions about internet use who said they had used the internet in the last year.
England and Wales, internet users aged 16 and over, 2010/11 BCS
55
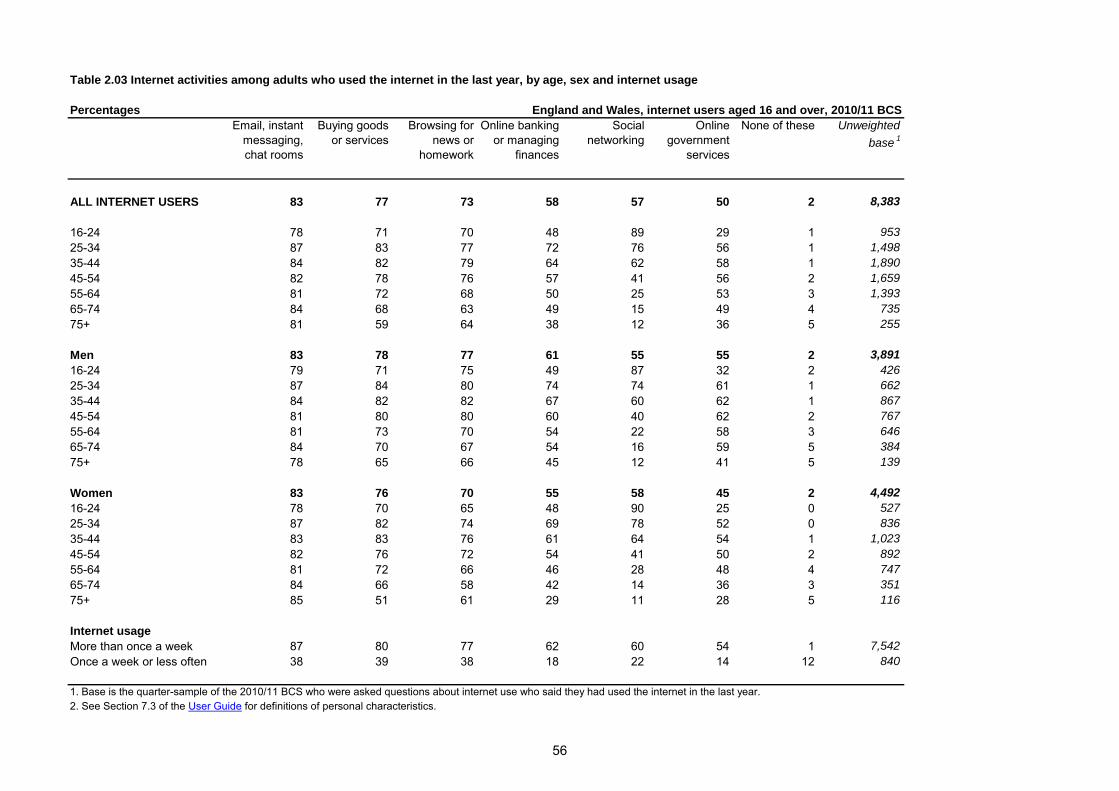
Percentages
ALL INTERNET USERS 83 77 73 58 57 50 2 8,383
16-24 78 71 70 48 89 29 1 953
25-34 87 83 77 72 76 56 1 1,498
35-44 84 82 79 64 62 58 1 1,890
45-54 82 78 76 57 41 56 2 1,659
55-64 81 72 68 50 25 53 3 1,393
65-74 84 68 63 49 15 49 4 735
75+ 81 59 64 38 12 36 5 255
Men 83 78 77 61 55 55 2 3,891
16-24 79 71 75 49 87 32 2 426
25-34 87 84 80 74 74 61 1 662
35-44 84 82 82 67 60 62 1 867
45-54 81 80 80 60 40 62 2 767
55-64 81 73 70 54 22 58 3 646
65-74 84 70 67 54 16 59 5 384
75+ 78 65 66 45 12 41 5 139
Women 83 76 70 55 58 45 2 4,492
16-24 78 70 65 48 90 25 0 527
25-34 87 82 74 69 78 52 0 836
35-44 83 83 76 61 64 54 1 1,023
45-54 82 76 72 54 41 50 2 892
55-64 81 72 66 46 28 48 4 747
65-74 84 66 58 42 14 36 3 351
75+ 85 51 61 29 11 28 5 116
Internet usage
More than once a week 87 80 77 62 60 54 1 7,542
Once a week or less often 38 39 38 18 22 14 12 840
Buying goods
or services
Email, instant
messaging,
chat rooms
England and Wales, internet users aged 16 and over, 2010/11 BCS
2. See Section 7.3 of the User Guide for definitions of personal characteristics.
Table 2.03 Internet activities among adults who used the internet in the last year, by age, sex and internet usage
Unweighted
base1
1. Base is the quarter-sample of the 2010/11 BCS who were asked questions about internet use who said they had used the internet in the last year.
None of theseSocial
networking
Online banking
or managing
finances
Browsing for
news or
homework
Online
government
services
56
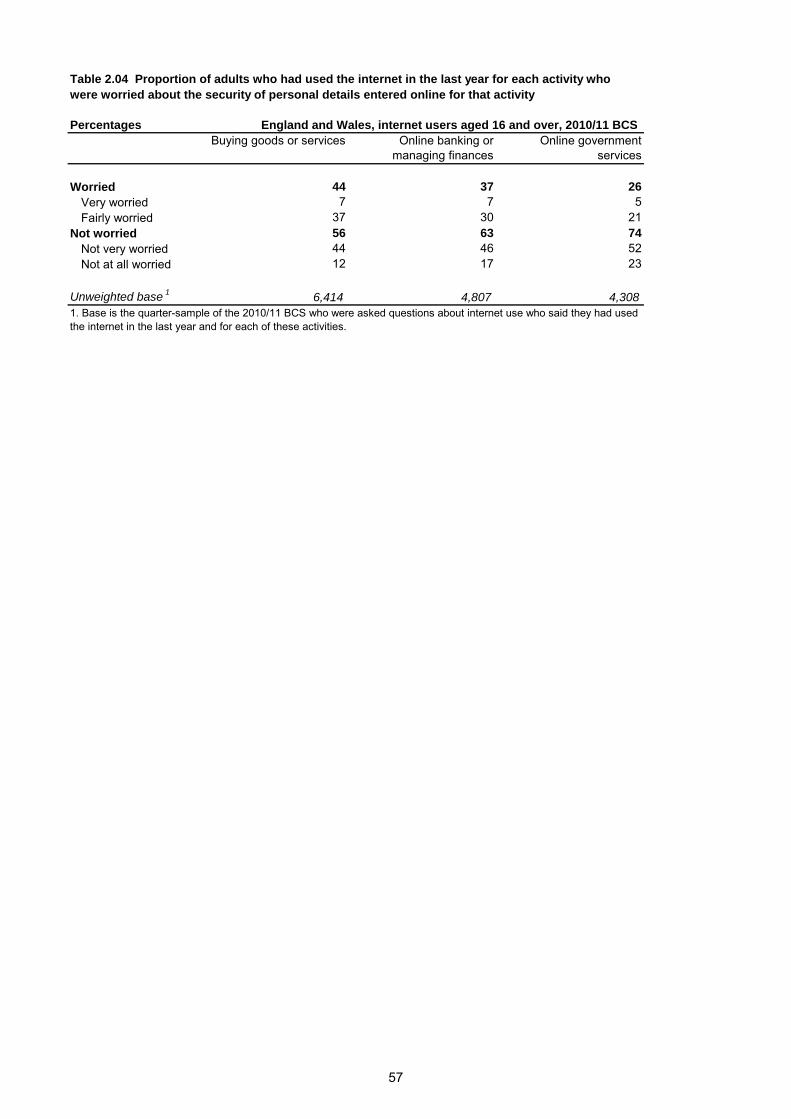
Percentages England and Wales, internet users aged 16 and over, 2010/11 BCS
Buying goods or services Online banking or
managing finances
Online government
services
Worried 44 37 26
Very worried 7 7 5
Fairly worried 37 30 21
Not worried 56 63 74
Not very worried 44 46 52
Not at all worried 12 17 23
Unweighted base1
6,414 4,807 4,308
Table 2.04 Proportion of adults who had used the internet in the last year for each activity who
were worried about the security of personal details entered online for that activity
1. Base is the quarter-sample of the 2010/11 BCS who were asked questions about internet use who said they had used
the internet in the last year and for each of these activities.
57
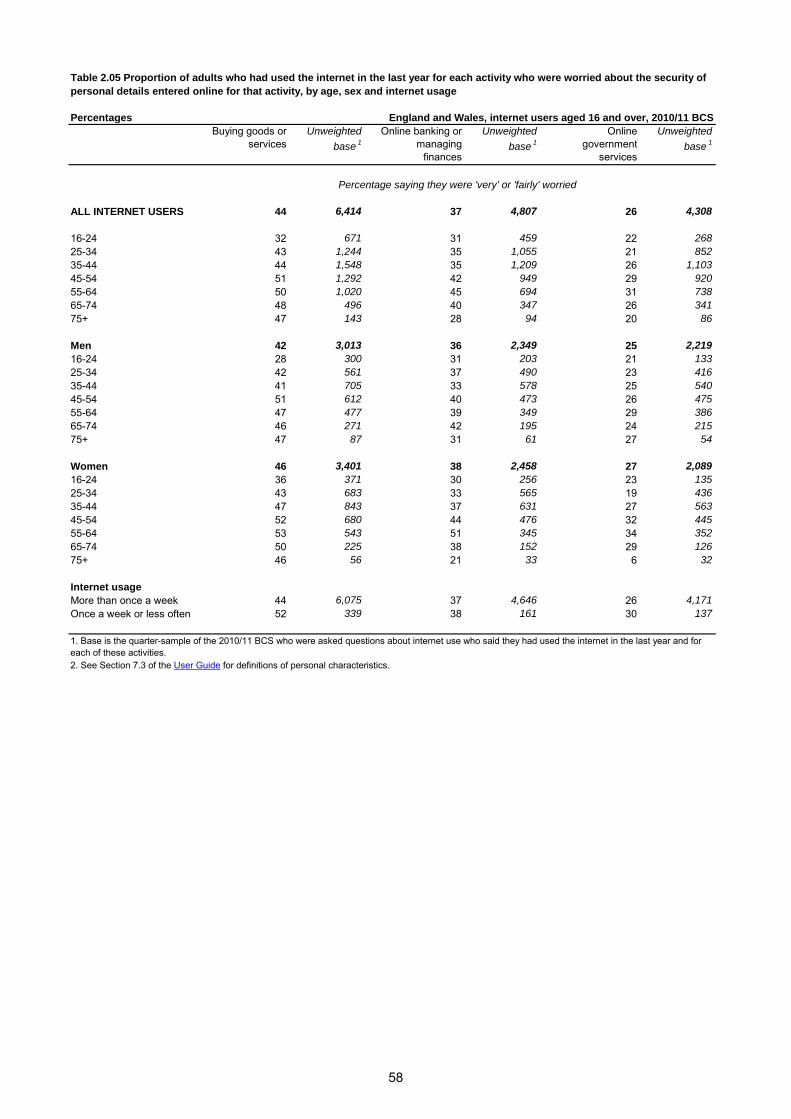
Percentages
Buying goods or
services
Unweighted
base1
Online banking or
managing
finances
Unweighted
base1
Online
government
services
Unweighted
base1
ALL INTERNET USERS 44 6,414 37 4,807 26 4,308
16-24 32 671 31 459 22 268
25-34 43 1,244 35 1,055 21 852
35-44 44 1,548 35 1,209 26 1,103
45-54 51 1,292 42 949 29 920
55-64 50 1,020 45 694 31 738
65-74 48 496 40 347 26 341
75+ 47 143 28 94 20 86
Men 42 3,013 36 2,349 25 2,219
16-24 28 300 31 203 21 133
25-34 42 561 37 490 23 416
35-44 41 705 33 578 25 540
45-54 51 612 40 473 26 475
55-64 47 477 39 349 29 386
65-74 46 271 42 195 24 215
75+ 47 87 31 61 27 54
Women 46 3,401 38 2,458 27 2,089
16-24 36 371 30 256 23 135
25-34 43 683 33 565 19 436
35-44 47 843 37 631 27 563
45-54 52 680 44 476 32 445
55-64 53 543 51 345 34 352
65-74 50 225 38 152 29 126
75+ 46 56 21 33 6 32
Internet usage
More than once a week 44 6,075 37 4,646 26 4,171
Once a week or less often 52 339 38 161 30 137
England and Wales, internet users aged 16 and over, 2010/11 BCS
1. Base is the quarter-sample of the 2010/11 BCS who were asked questions about internet use who said they had used the internet in the last year and for
each of these activities.
2. See Section 7.3 of the User Guide for definitions of personal characteristics.
Table 2.05 Proportion of adults who had used the internet in the last year for each activity who were worried about the security of
personal details entered online for that activity, by age, sex and internet usage
Percentage saying they were 'very' or 'fairly' worried
58
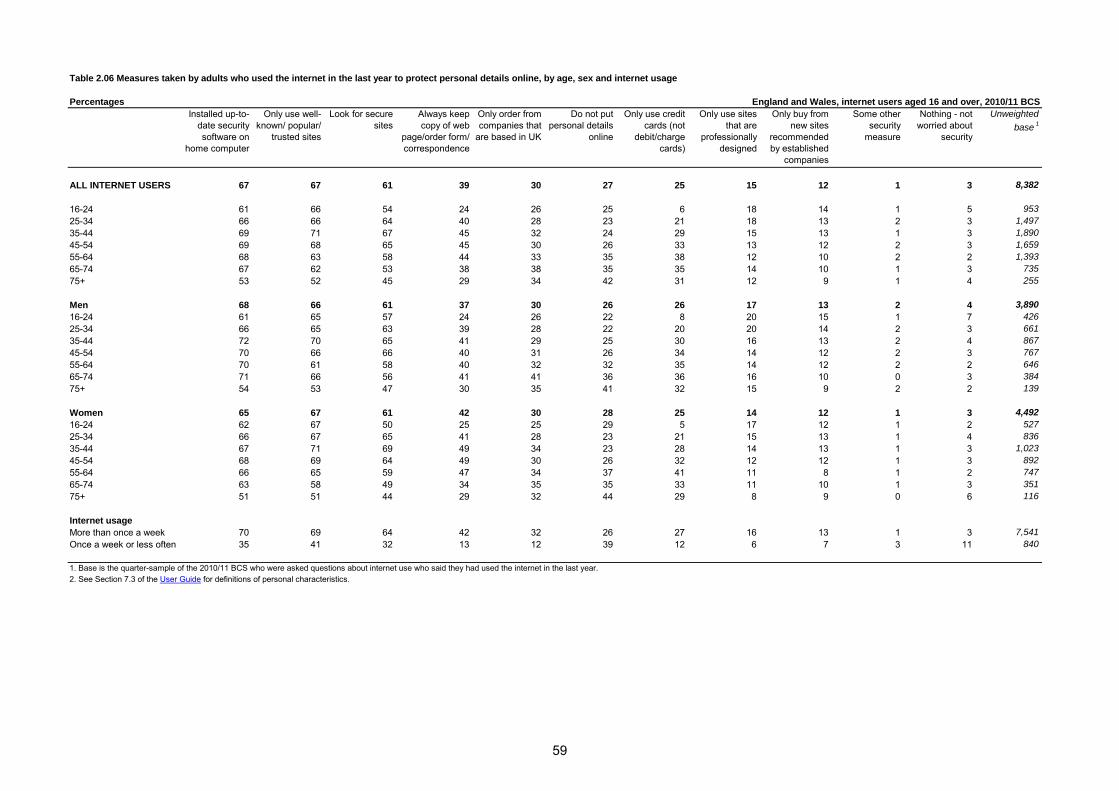
Percentages
ALL INTERNET USERS 67 67 61 39 30 27 25 15 12 1 3 8,382
16-24 61 66 54 24 26 25 6 18 14 1 5 953
25-34 66 66 64 40 28 23 21 18 13 2 3 1,497
35-44 69 71 67 45 32 24 29 15 13 1 3 1,890
45-54 69 68 65 45 30 26 33 13 12 2 3 1,659
55-64 68 63 58 44 33 35 38 12 10 2 2 1,393
65-74 67 62 53 38 38 35 35 14 10 1 3 735
75+ 53 52 45 29 34 42 31 12 9 1 4 255
Men 68 66 61 37 30 26 26 17 13 2 4 3,890
16-24 61 65 57 24 26 22 8 20 15 1 7 426
25-34 66 65 63 39 28 22 20 20 14 2 3 661
35-44 72 70 65 41 29 25 30 16 13 2 4 867
45-54 70 66 66 40 31 26 34 14 12 2 3 767
55-64 70 61 58 40 32 32 35 14 12 2 2 646
65-74 71 66 56 41 41 36 36 16 10 0 3 384
75+ 54 53 47 30 35 41 32 15 9 2 2 139
Women 65 67 61 42 30 28 25 14 12 1 3 4,492
16-24 62 67 50 25 25 29 5 17 12 1 2 527
25-34 66 67 65 41 28 23 21 15 13 1 4 836
35-44 67 71 69 49 34 23 28 14 13 1 3 1,023
45-54 68 69 64 49 30 26 32 12 12 1 3 892
55-64 66 65 59 47 34 37 41 11 8 1 2 747
65-74 63 58 49 34 35 35 33 11 10 1 3 351
75+ 51 51 44 29 32 44 29 8 9 0 6 116
Internet usage
More than once a week 70 69 64 42 32 26 27 16 13 1 3 7,541
Once a week or less often 35 41 32 13 12 39 12 6 7 3 11 840
Do not put
personal details
online
Only order from
companies that
are based in UK
1. Base is the quarter-sample of the 2010/11 BCS who were asked questions about internet use who said they had used the internet in the last year.
2. See Section 7.3 of the User Guide for definitions of personal characteristics.
Some other
security
measure
Only use sites
that are
professionally
designed
Only buy from
new sites
recommended
by established
companies
Table 2.06 Measures taken by adults who used the internet in the last year to protect personal details online, by age, sex and internet usage
England and Wales, internet users aged 16 and over, 2010/11 BCS
Only use well-
known/ popular/
trusted sites
Look for secure
sites
Always keep
copy of web
page/order form/
correspondence
Only use credit
cards (not
debit/charge
cards)
Nothing - not
worried about
security
Unweighted
base1
Installed up-to-
date security
software on
home computer
59
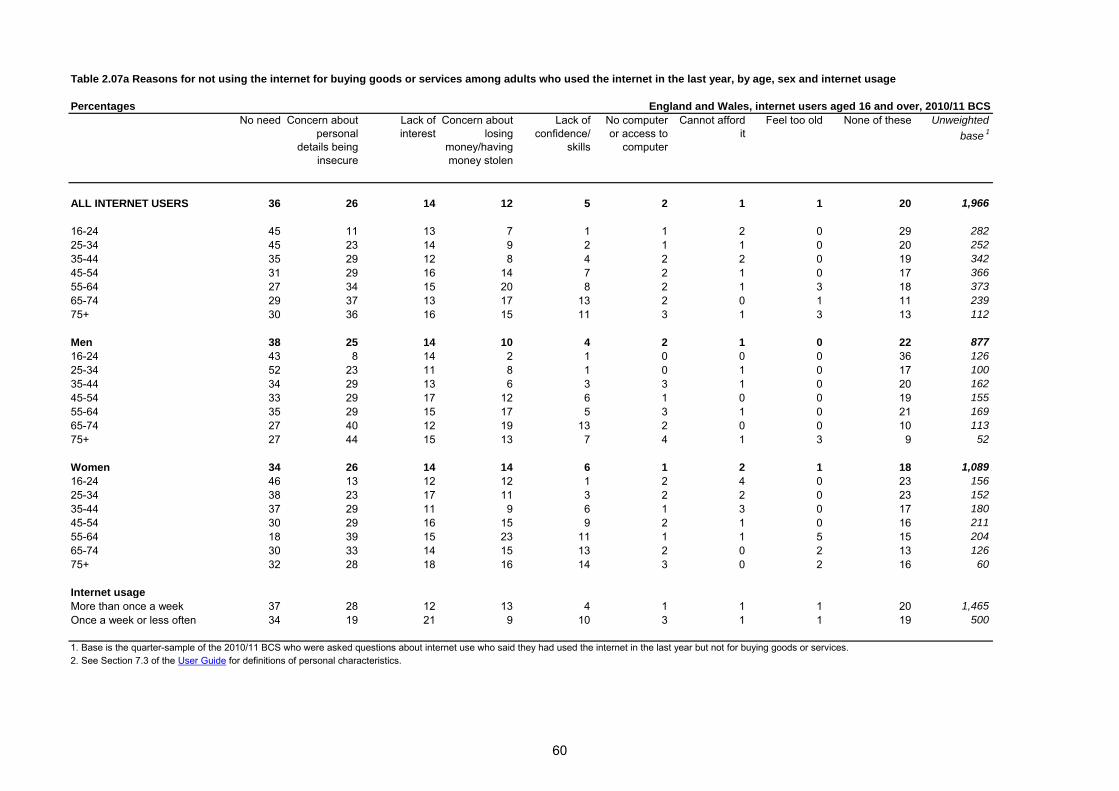
Percentages
ALL INTERNET USERS 36 26 14 12 5 2 1 1 20 1,966
16-24 45 11 13 7 1 1 2 0 29 282
25-34 45 23 14 9 2 1 1 0 20 252
35-44 35 29 12 8 4 2 2 0 19 342
45-54 31 29 16 14 7 2 1 0 17 366
55-64 27 34 15 20 8 2 1 3 18 373
65-74 29 37 13 17 13 2 0 1 11 239
75+ 30 36 16 15 11 3 1 3 13 112
Men 38 25 14 10 4 2 1 0 22 877
16-24 43 8 14 2 1 0 0 0 36 126
25-34 52 23 11 8 1 0 1 0 17 100
35-44 34 29 13 6 3 3 1 0 20 162
45-54 33 29 17 12 6 1 0 0 19 155
55-64 35 29 15 17 5 3 1 0 21 169
65-74 27 40 12 19 13 2 0 0 10 113
75+ 27 44 15 13 7 4 1 3 9 52
Women 34 26 14 14 6 1 2 1 18 1,089
16-24 46 13 12 12 1 2 4 0 23 156
25-34 38 23 17 11 3 2 2 0 23 152
35-44 37 29 11 9 6 1 3 0 17 180
45-54 30 29 16 15 9 2 1 0 16 211
55-64 18 39 15 23 11 1 1 5 15 204
65-74 30 33 14 15 13 2 0 2 13 126
75+ 32 28 18 16 14 3 0 2 16 60
Internet usage
More than once a week 37 28 12 13 4 1 1 1 20 1,465
Once a week or less often 34 19 21 9 10 3 1 1 19 500
1. Base is the quarter-sample of the 2010/11 BCS who were asked questions about internet use who said they had used the internet in the last year but not for buying goods or services.
2. See Section 7.3 of the User Guide for definitions of personal characteristics.
Feel too oldConcern about
personal
details being
insecure
Concern about
losing
money/having
money stolen
None of these Unweighted
base1
Table 2.07a Reasons for not using the internet for buying goods or services among adults who used the internet in the last year, by age, sex and internet usage
England and Wales, internet users aged 16 and over, 2010/11 BCS
Lack of
interest
No need Lack of
confidence/
skills
No computer
or access to
computer
Cannot afford
it
60
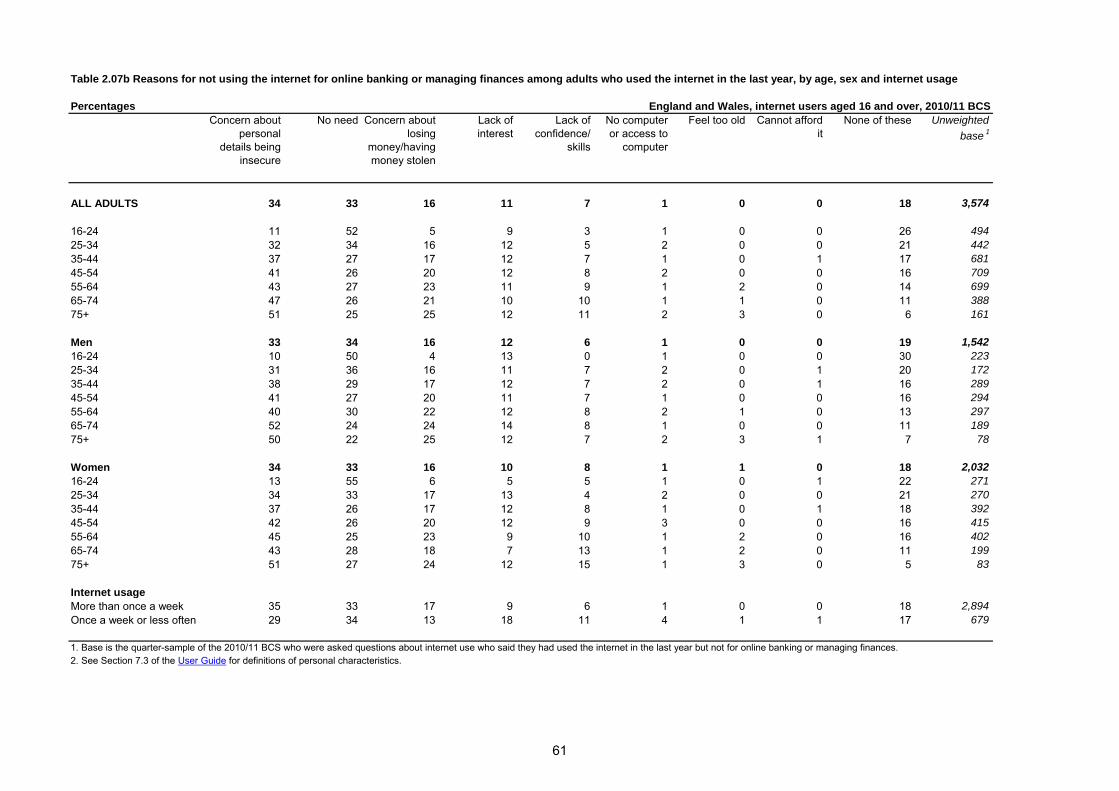
Percentages
ALL ADULTS 34 33 16 11 7 1 0 0 18 3,574
16-24 11 52 5 9 3 1 0 0 26 494
25-34 32 34 16 12 5 2 0 0 21 442
35-44 37 27 17 12 7 1 0 1 17 681
45-54 41 26 20 12 8 2 0 0 16 709
55-64 43 27 23 11 9 1 2 0 14 699
65-74 47 26 21 10 10 1 1 0 11 388
75+ 51 25 25 12 11 2 3 0 6 161
Men 33 34 16 12 6 1 0 0 19 1,542
16-24 10 50 4 13 0 1 0 0 30 223
25-34 31 36 16 11 7 2 0 1 20 172
35-44 38 29 17 12 7 2 0 1 16 289
45-54 41 27 20 11 7 1 0 0 16 294
55-64 40 30 22 12 8 2 1 0 13 297
65-74 52 24 24 14 8 1 0 0 11 189
75+ 50 22 25 12 7 2 3 1 7 78
Women 34 33 16 10 8 1 1 0 18 2,032
16-24 13 55 6 5 5 1 0 1 22 271
25-34 34 33 17 13 4 2 0 0 21 270
35-44 37 26 17 12 8 1 0 1 18 392
45-54 42 26 20 12 9 3 0 0 16 415
55-64 45 25 23 9 10 1 2 0 16 402
65-74 43 28 18 7 13 1 2 0 11 199
75+ 51 27 24 12 15 1 3 0 5 83
Internet usage
More than once a week 35 33 17 9 6 1 0 0 18 2,894
Once a week or less often 29 34 13 18 11 4 1 1 17 679
No need Lack of
confidence/
skills
Unweighted
base1
1. Base is the quarter-sample of the 2010/11 BCS who were asked questions about internet use who said they had used the internet in the last year but not for online banking or managing finances.
2. See Section 7.3 of the User Guide for definitions of personal characteristics.
Concern about
losing
money/having
money stolen
None of theseCannot afford
it
Table 2.07b Reasons for not using the internet for online banking or managing finances among adults who used the internet in the last year, by age, sex and internet usage
Feel too oldConcern about
personal
details being
insecure
Lack of
interest
No computer
or access to
computer
England and Wales, internet users aged 16 and over, 2010/11 BCS
61
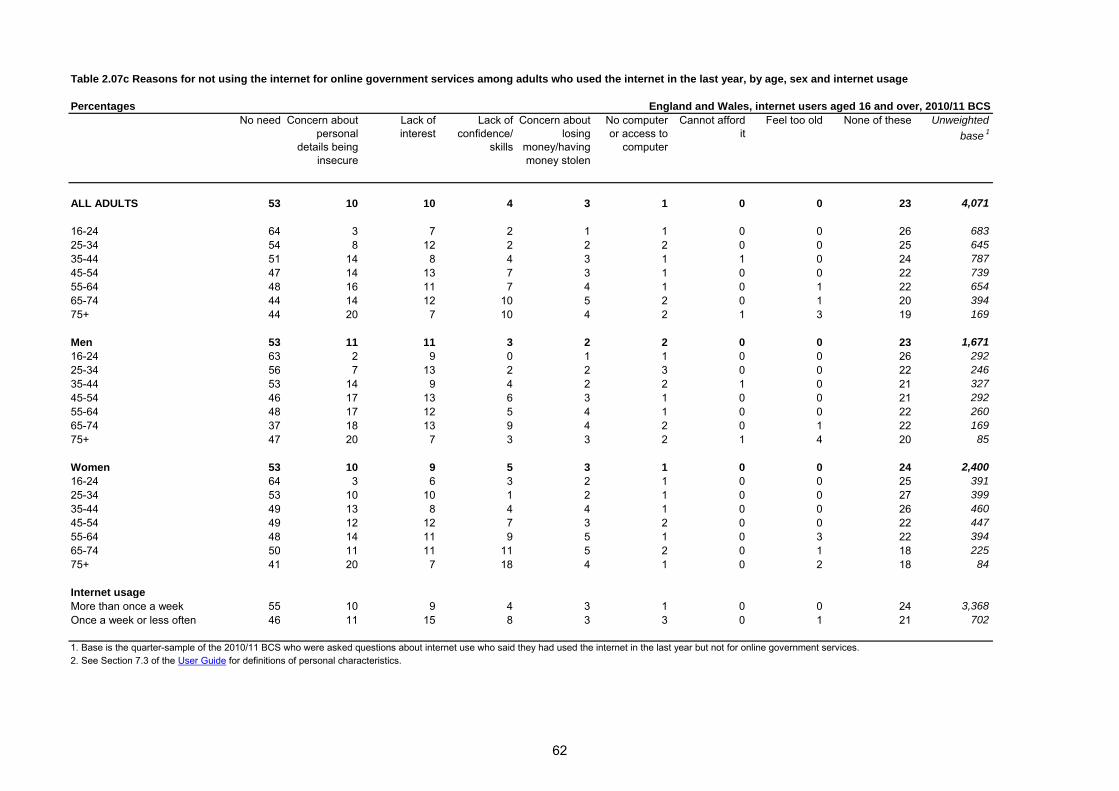
Percentages
ALL ADULTS 53 10 10 4 3 1 0 0 23 4,071
16-24 64 3 7 2 1 1 0 0 26 683
25-34 54 8 12 2 2 2 0 0 25 645
35-44 51 14 8 4 3 1 1 0 24 787
45-54 47 14 13 7 3 1 0 0 22 739
55-64 48 16 11 7 4 1 0 1 22 654
65-74 44 14 12 10 5 2 0 1 20 394
75+ 44 20 7 10 4 2 1 3 19 169
Men 53 11 11 3 2 2 0 0 23 1,671
16-24 63 2 9 0 1 1 0 0 26 292
25-34 56 7 13 2 2 3 0 0 22 246
35-44 53 14 9 4 2 2 1 0 21 327
45-54 46 17 13 6 3 1 0 0 21 292
55-64 48 17 12 5 4 1 0 0 22 260
65-74 37 18 13 9 4 2 0 1 22 169
75+ 47 20 7 3 3 2 1 4 20 85
Women 53 10 9 5 3 1 0 0 24 2,400
16-24 64 3 6 3 2 1 0 0 25 391
25-34 53 10 10 1 2 1 0 0 27 399
35-44 49 13 8 4 4 1 0 0 26 460
45-54 49 12 12 7 3 2 0 0 22 447
55-64 48 14 11 9 5 1 0 3 22 394
65-74 50 11 11 11 5 2 0 1 18 225
75+ 41 20 7 18 4 1 0 2 18 84
Internet usage
More than once a week 55 10 9 4 3 1 0 0 24 3,368
Once a week or less often 46 11 15 8 3 3 0 1 21 702
2. See Section 7.3 of the User Guide for definitions of personal characteristics.
Table 2.07c Reasons for not using the internet for online government services among adults who used the internet in the last year, by age, sex and internet usage
No computer
or access to
computer
Cannot afford
it
Feel too oldConcern about
personal
details being
insecure
Concern about
losing
money/having
money stolen
None of these Unweighted
base1
1. Base is the quarter-sample of the 2010/11 BCS who were asked questions about internet use who said they had used the internet in the last year but not for online government services.
England and Wales, internet users aged 16 and over, 2010/11 BCS
Lack of
interest
No need Lack of
confidence/
skills
62
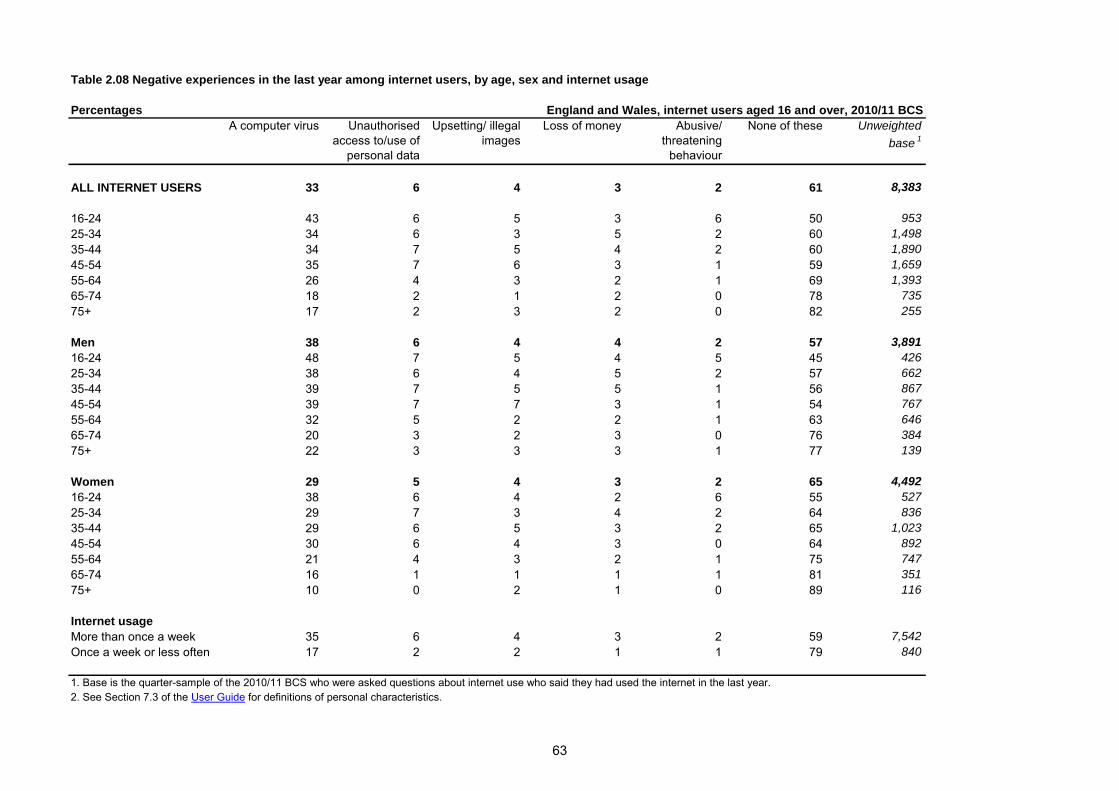
Percentages
ALL INTERNET USERS 33 6 4 3 2 61 8,383
16-24 43 6 5 3 6 50 953
25-34 34 6 3 5 2 60 1,498
35-44 34 7 5 4 2 60 1,890
45-54 35 7 6 3 1 59 1,659
55-64 26 4 3 2 1 69 1,393
65-74 18 2 1 2 0 78 735
75+ 17 2 3 2 0 82 255
Men 38 6 4 4 2 57 3,891
16-24 48 7 5 4 5 45 426
25-34 38 6 4 5 2 57 662
35-44 39 7 5 5 1 56 867
45-54 39 7 7 3 1 54 767
55-64 32 5 2 2 1 63 646
65-74 20 3 2 3 0 76 384
75+ 22 3 3 3 1 77 139
Women 29 5 4 3 2 65 4,492
16-24 38 6 4 2 6 55 527
25-34 29 7 3 4 2 64 836
35-44 29 6 5 3 2 65 1,023
45-54 30 6 4 3 0 64 892
55-64 21 4 3 2 1 75 747
65-74 16 1 1 1 1 81 351
75+ 10 0 2 1 0 89 116
Internet usage
More than once a week 35 6 4 3 2 59 7,542
Once a week or less often 17 2 2 1 1 79 840
Table 2.08 Negative experiences in the last year among internet users, by age, sex and internet usage
England and Wales, internet users aged 16 and over, 2010/11 BCS
A computer virus Loss of money Abusive/
threatening
behaviour
None of these
2. See Section 7.3 of the User Guide for definitions of personal characteristics.
Unauthorised
access to/use of
personal data
Upsetting/ illegal
images
Unweighted
base1
1. Base is the quarter-sample of the 2010/11 BCS who were asked questions about internet use who said they had used the internet in the last year.
63

64
3 Experimental statistics on the experience of crime among children aged 10 to 15
Ivy Lau and Jacqueline Hoare
3.1 SUMMARY
This chapter is based on data collected from 10 to 15 year olds who took part in the 2010/11 British Crime Survey (BCS). Questions were asked of children in England and Wales who had experienced a crime about the circumstances of the incident, any details on the offender(s) and their views of the incident.
The nature of violence
Any differences between the nature of violent incidents experienced by children and adults have been highlighted here, although these naturally reflect the differing lifestyles of children and adults.
The majority of violent incidents experienced by children took place in or around school (56%) whereas for adults most incidents took place on the street (30%).
The vast majority of violent incidents experienced by children took place on a weekday (89%) and during daylight (88%) in contrast with adults who tended to experience violent incidents during the evening or at night (67%).
Violent incidents experienced by children were more likely to involve an offender that was well known to the victim (56%) than incidents experienced by adults (34%).
Around three-fifths of violent incidents among children involved a single offender (61%), and one-fifth (22%) involved four or more offenders, a similar distribution to adult incidents (66% and 19% respectively).
The nature of theft
Around half (46%) of incidents of theft experienced by children occurred in or around school.
Similar to violent incidents, thefts experienced by children were most likely to have occurred during a weekday (85%) and to have taken place during daylight hours (86%).
Incidents of theft were more likely to be perpetrated by a friend than for violent incidents (22% and 7% respectively).
Items most likely to be stolen included mobile phones (24% of incidents) and bicycles (21%).
Variation in violence victimisation rates among children
Boys were around twice as likely as girls to have been a victim of violence (9.5% and 4.1% respectively).
Children with a long-standing illness or disability were more likely to have experienced a violent incident compared with children without an illness or disability (15.0% and 6.1% respectively).
Children who had been bullied in the last 12 months had a much higher violence victimisation rate (20.8%) than those who had not been bullied (3.3%), not unexpectedly as children perceived that three in five violent incidents (62%) were part of a series of bullying.
65
Supplementary Volume 3 to Crime in England and Wales 2010/11
3.2 INTRODUCTION
This chapter is based on data collected from 10 to 15 year olds who took part in the 2010/11 British Crime Survey (BCS). Around 3,850 children took part in the survey after being randomly selected from within households already taking part in the main survey.
All children who were interviewed were asked questions about their experience of crime (details of the questions are published via the Economic and Social Data Service
1). This chapter reports on the
circumstances of violence and theft incidents experienced by 10-to-15-year-old children in the 12 months prior to interview. Victims of such incidents were asked a series of questions relating to their experience including information about the circumstances of the incident, any details on the offender(s) and the child’s view of the nature of the incident.
Estimates of victimisation for 10 to 15 year olds from the 2010/11 BCS have previously been published as experimental statistics (Chaplin et al., 2011). The information included in this publication provides a more detailed picture of children’s experiences of victimisation and thus a greater understanding of the nature of these crimes. The figures presented are restricted to those included in the more focused method of counting crime against children (the ‘Preferred measure’).
2 This takes into
account factors identified as important in determining the severity of an incident and thus includes incidents where:
the offender3 was not known (e.g. stranger, tradesman, pupil from another school); or
the offender3 was known, but aged 16 or over and not a family member (e.g. neighbour, older
friend, teacher); or
the offender3 was known and either a family member or aged under 16 (e.g. parent, sibling,
school-friend) and there was visible injury or theft or damage involving a ‘high value’ item; or
a weapon4 was involved.
The analysis presented in Sections 3.3 and 3.4 about the nature of violence and the nature of theft is based on incidents rather than victims (who may have experienced more than one incident). These data are being published for the first time. In contrast, information presented in section 3.5 on the variation in victimisation rates
5 among children is victim-based data (a victim may experience more
than one incident of crime, but would only be included once). See Section 4 of the British Crime Survey Dataset User Guide
1 (Children aged 10 to 15) for more information on victim- and incident-
based analysis.
Data on the nature of crimes experienced by adults aged 16 or over from the BCS are published annually.
6 Where possible, comparisons are made here to highlight how similar or different
victimisation experiences are for adults and children. Due to the small size of the sample, it is not possible to break down incidents of theft experienced by children into smaller offence groups (theft from the person, for example). Hence it is not possible to compare the nature of theft experienced by children with previously published data on the experience of adult respondents due to the different
1 http://www.esds.ac.uk/findingData/snDescription.asp?sn=6937 2 For more details see Appendix 1 of Chaplin et al. (2011). 3 If there was more than one offender, the incident was included if just one of the offenders matched this criterion. 4 A ‘weapon’ constitutes any item that was considered to be a weapon by the victim; this includes knives, sticks, stones and
bottles. 5 See Section 2.5 of the User Guide for more information. 6 http://www.homeoffice.gov.uk/science-research/research-statistics/crime/crime-statistics/bcs-supplementary-tabs/
66
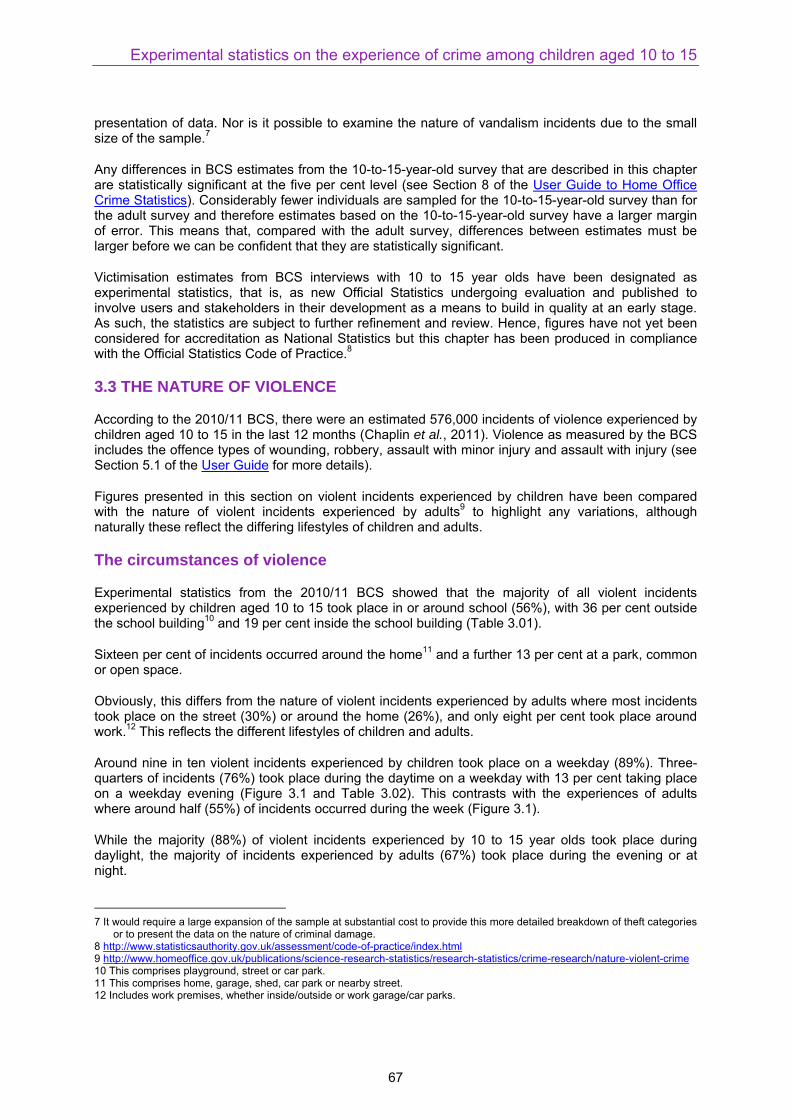
Experimental statistics on the experience of crime among children aged 10 to 15
presentation of data. Nor is it possible to examine the nature of vandalism incidents due to the small size of the sample.
7
Any differences in BCS estimates from the 10-to-15-year-old survey that are described in this chapter are statistically significant at the five per cent level (see Section 8 of the User Guide to Home Office Crime Statistics). Considerably fewer individuals are sampled for the 10-to-15-year-old survey than for the adult survey and therefore estimates based on the 10-to-15-year-old survey have a larger margin of error. This means that, compared with the adult survey, differences between estimates must be larger before we can be confident that they are statistically significant.
Victimisation estimates from BCS interviews with 10 to 15 year olds have been designated as experimental statistics, that is, as new Official Statistics undergoing evaluation and published to involve users and stakeholders in their development as a means to build in quality at an early stage. As such, the statistics are subject to further refinement and review. Hence, figures have not yet been considered for accreditation as National Statistics but this chapter has been produced in compliance with the Official Statistics Code of Practice.
8
3.3 THE NATURE OF VIOLENCE
According to the 2010/11 BCS, there were an estimated 576,000 incidents of violence experienced by children aged 10 to 15 in the last 12 months (Chaplin et al., 2011). Violence as measured by the BCS includes the offence types of wounding, robbery, assault with minor injury and assault with injury (see Section 5.1 of the User Guide for more details).
Figures presented in this section on violent incidents experienced by children have been compared with the nature of violent incidents experienced by adults
9 to highlight any variations, although
naturally these reflect the differing lifestyles of children and adults.
The circumstances of violence
Experimental statistics from the 2010/11 BCS showed that the majority of all violent incidents experienced by children aged 10 to 15 took place in or around school (56%), with 36 per cent outside the school building
10 and 19 per cent inside the school building (Table 3.01).
Sixteen per cent of incidents occurred around the home11
and a further 13 per cent at a park, common or open space.
Obviously, this differs from the nature of violent incidents experienced by adults where most incidents took place on the street (30%) or around the home (26%), and only eight per cent took place around work.
12 This reflects the different lifestyles of children and adults.
Around nine in ten violent incidents experienced by children took place on a weekday (89%). Three-quarters of incidents (76%) took place during the daytime on a weekday with 13 per cent taking place on a weekday evening (Figure 3.1 and Table 3.02). This contrasts with the experiences of adults where around half (55%) of incidents occurred during the week (Figure 3.1).
While the majority (88%) of violent incidents experienced by 10 to 15 year olds took place during daylight, the majority of incidents experienced by adults (67%) took place during the evening or at night.
7 It would require a large expansion of the sample at substantial cost to provide this more detailed breakdown of theft categories
or to present the data on the nature of criminal damage. 8 http://www.statisticsauthority.gov.uk/assessment/code-of-practice/index.html 9 http://www.homeoffice.gov.uk/publications/science-research-statistics/research-statistics/crime-research/nature-violent-crime 10 This comprises playground, street or car park. 11 This comprises home, garage, shed, car park or nearby street. 12 Includes work premises, whether inside/outside or work garage/car parks.
67
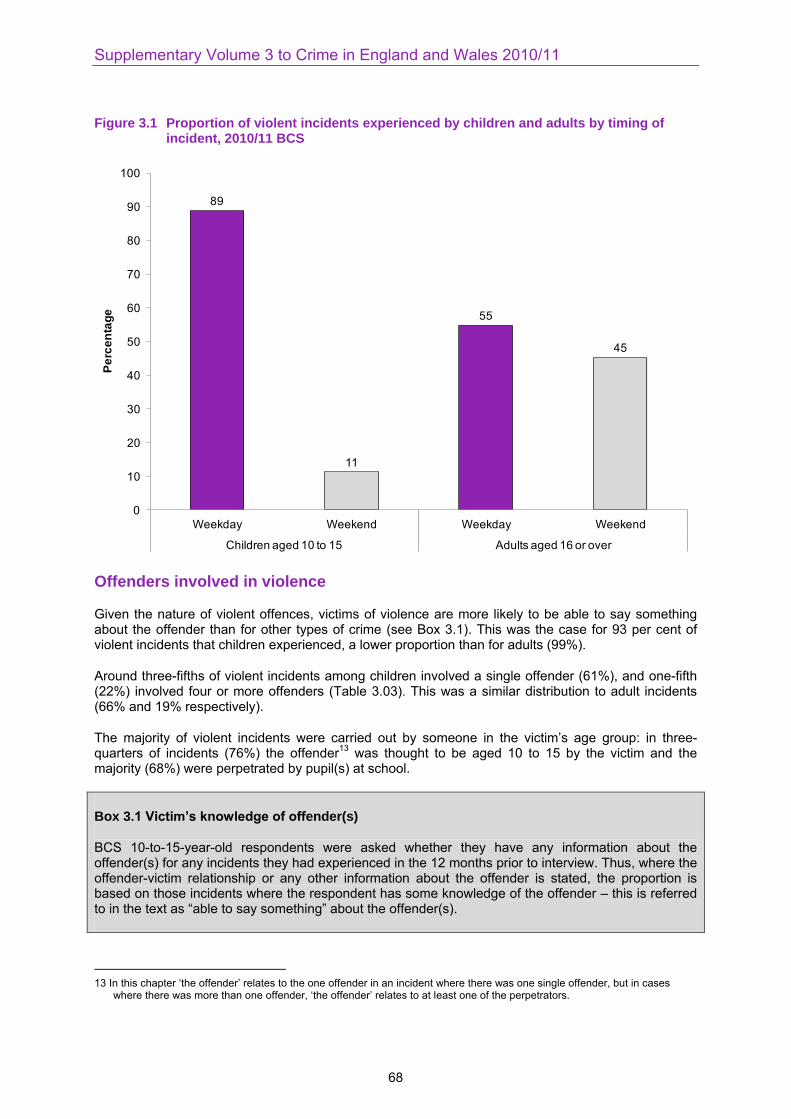
Supplementary Volume 3 to Crime in England and Wales 2010/11
Figure 3.1 Proportion of violent incidents experienced by children and adults by timing of incident, 2010/11 BCS
89
11
55
45
0
10
20
30
40
50
60
70
80
90
100
Weekday Weekend Weekday Weekend
Children aged 10 to 15 Adults aged 16 or over
Pe
rce
nta
ge
Offenders involved in violence
Given the nature of violent offences, victims of violence are more likely to be able to say something about the offender than for other types of crime (see Box 3.1). This was the case for 93 per cent of violent incidents that children experienced, a lower proportion than for adults (99%).
Around three-fifths of violent incidents among children involved a single offender (61%), and one-fifth (22%) involved four or more offenders (Table 3.03). This was a similar distribution to adult incidents (66% and 19% respectively).
The majority of violent incidents were carried out by someone in the victim‟s age group: in three-quarters of incidents (76%) the offender
13 was thought to be aged 10 to 15 by the victim and the
majority (68%) were perpetrated by pupil(s) at school.
Box 3.1 Victim’s knowledge of offender(s)
BCS 10-to-15-year-old respondents were asked whether they have any information about the offender(s) for any incidents they had experienced in the 12 months prior to interview. Thus, where the offender-victim relationship or any other information about the offender is stated, the proportion is based on those incidents where the respondent has some knowledge of the offender – this is referred to in the text as “able to say something” about the offender(s).
13 In this chapter „the offender‟ relates to the one offender in an incident where there was one single offender, but in cases
where there was more than one offender, „the offender‟ relates to at least one of the perpetrators.
68
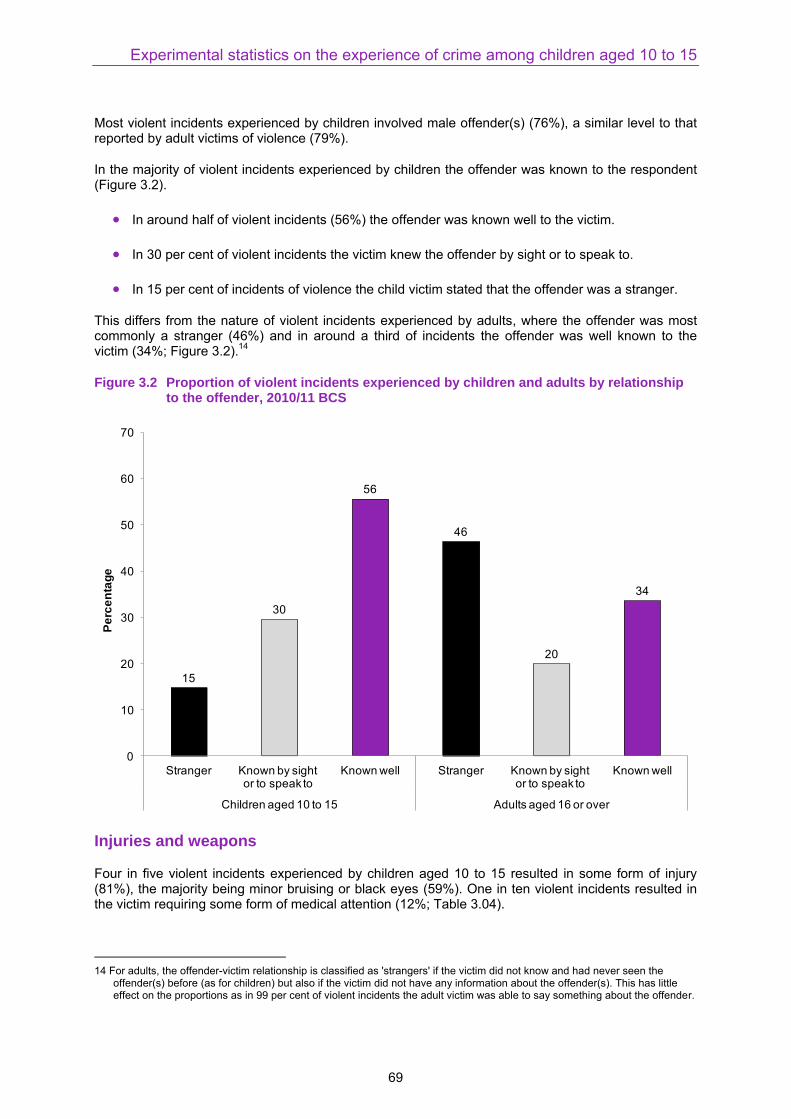
Experimental statistics on the experience of crime among children aged 10 to 15
Most violent incidents experienced by children involved male offender(s) (76%), a similar level to that reported by adult victims of violence (79%).
In the majority of violent incidents experienced by children the offender was known to the respondent (Figure 3.2).
In around half of violent incidents (56%) the offender was known well to the victim.
In 30 per cent of violent incidents the victim knew the offender by sight or to speak to.
In 15 per cent of incidents of violence the child victim stated that the offender was a stranger.
This differs from the nature of violent incidents experienced by adults, where the offender was most commonly a stranger (46%) and in around a third of incidents the offender was well known to the victim (34%; Figure 3.2).
14
Figure 3.2 Proportion of violent incidents experienced by children and adults by relationship to the offender, 2010/11 BCS
15
30
56
46
20
34
0
10
20
30
40
50
60
70
Stranger Known by sight or to speak to
Known well Stranger Known by sight or to speak to
Known well
Children aged 10 to 15 Adults aged 16 or over
Pe
rce
nta
ge
Injuries and weapons
Four in five violent incidents experienced by children aged 10 to 15 resulted in some form of injury (81%), the majority being minor bruising or black eyes (59%). One in ten violent incidents resulted in the victim requiring some form of medical attention (12%; Table 3.04).
14 For adults, the offender-victim relationship is classified as 'strangers' if the victim did not know and had never seen the
offender(s) before (as for children) but also if the victim did not have any information about the offender(s). This has little effect on the proportions as in 99 per cent of violent incidents the adult victim was able to say something about the offender.
69
Supplementary Volume 3 to Crime in England and Wales 2010/11
In just over a half (55%) of violent incidents experienced by adults physical injury was sustained; and a third of incidents resulted in minor bruising or black eyes. This may be a reflection of the differences between children and adults, where adults do not tend to engage in low-level assaults on their peers.
Just under a quarter of violent incidents experienced by 10 to 15 year olds involved the use of a weapon
15 (23%), which was a similar proportion to violent incidents experienced by adults (20%). In
violent incidents among children which involved a weapon, the most common weapon involved was a stick, club or hitting instrument (41%). One-quarter of such incidents involved the use of stones, bricks or concrete and one in nine (11%) involved a knife, screwdriver or stabbing instrument (Table 3.05). Caution should be used when interpreting these estimates of the type of weapon used in violent incidents experienced by children as they are based on a low number of cases. For more information on the type of injury sustained by children from the BCS 10-to-15s survey; see Chapter 3 of ‘Crime in England and Wales 2010/11’ (Chaplin et al., 2011).
Perceptions of violence
Experimental statistics from the 2010/11 BCS showed that 70 per cent of violent incidents experienced by children aged 10 to 15 were not perceived to be a crime by the victim; with 37 per cent perceiving the incident to be ‘wrong, but not a crime’ and 33 per cent perceiving it as ‘just something that happens’ (Table 3.06).
Children perceived that three in five violent incidents (62%) that took place were part of a series of bullying. For more information on the experience of bullying from the BCS children’s survey see Chapter 3 in ‘Supplementary Volume 3 to Crime in England and Wales 2009/10’ (Hoare et al., 2011).
Reporting of violence
Overall, the police came to know about 14 per cent of all violent incidents against 10 to 15 year olds. This is lower than the equivalent figure for adults (41%), which is to be expected considering some of the violence that children experience would likely not be reported to the police and may be dealt with by another authority figure, such as a teacher or parent. Indeed, the majority of violent incidents that occurred in or around school were reported by children to a teacher (85%; Table 3.07).
3.4 THE NATURE OF THEFT
According to the 2010/11 BCS, there were an estimated 275,000 incidents of theft experienced by children aged 10 to 15 in the last 12 months (Chaplin et al., 2011).
Estimates of thefts experienced by children on the BCS are based on (see Section 5.2 of the User Guide for more details):
Personal thefts: including theft from the person (snatch theft, stealth theft and attempts) and other theft of personal property (for example, theft of items the respondent was not carrying or holding at the time of incident).
Household thefts: including theft from inside and outside a dwelling and theft of bicycles where the property stolen or damaged belonged solely to the child respondent.
16
The nature of overall thefts from the 2010/11 BCS 10-to-15s survey is presented here; the separate theft offences are not reported due to low prevalence in some categories. As previously noted (see
15 A ‘weapon’ constitutes any item that was considered to be a weapon by the victim (whether adult or child); this includes
knives, sticks, stones and bottles. 16 This broadens the scope of personal victimisation but may also result in an overlap in theft offences reported on the adult
survey; the extent to which this happens will be evaluated in the future.
70
Experimental statistics on the experience of crime among children aged 10 to 15
Section 3.2), it is not possible to make comparisons with the nature of theft experienced by adults. Instead, comparisons are made with the nature of violence experienced by children.
The circumstances of thefts
Experimental statistics from the 2010/11 BCS showed that 46 per cent of theft incidents experienced by children occurred in or around school, a lower proportion than for violent incidents (56%). However, thefts were more likely to occur inside a school building than violent incidents (34% compared with 19%). Incidents of theft were also more likely to occur in or around the home (27%) compared with violent incidents (16%; Table 3.01).
Similar to violent incidents, incidents of theft experienced by 10 to 15 year olds were most likely to have occurred during a weekday (85% of theft incidents similar to 89% of violent incidents) and to have taken place during daylight hours (86% and 88% respectively; Table 3.02).
Offenders involved in thefts
As expected, compared with violent incidents, victims of theft were much less likely to be able to say something about the perpetrator of the incident (for example, because some thefts were of unattended items). The following analysis therefore relates only to the 44 per cent of incidents where the child was able to say something about the offender (see Box 3.1 and Table 3.03).
Two-thirds (65%) of theft incidents experienced by children aged 10 to 15 involved a single offender, which was a similar proportion to that for violent incidents (61%). However, incidents of theft were less likely to involve four or more offenders compared with incidents of violence (9% and 22% respectively).
In 80 per cent of incidents of theft where the victim was able to say something about the offender, the offender was perceived to be aged 10 to 15, a similar proportion to that for violent incidents (76%). Again this suggests that the majority of offences are carried out by perpetrators in the victim‟s age group.
In 17 per cent of incidents of theft the offender was a stranger, which was similar to violent incidents (16%). However, there was a lower proportion of theft incidents where the offender was known well (44%) compared with violent incidents (56%).
The victim‟s relationship to the offender in incidents of theft generally differed to those in violent incidents. For example, of the incidents where the victim was able to say something about the offender:
Incidents of theft were less likely to be perpetrated by a pupil from the victim‟s own school compared with incidents of violence (54% and 68% respectively).
Incidents of theft were more likely to be perpetrated by a friend than for violent incidents (22% and 7% respectively).
Items stolen
Four in five (79%) incidents of theft (including attempted thefts) experienced by children resulted in an item being stolen. Items most commonly stolen were (Table 3.08):
a mobile phone (24% of incidents);
a bicycle or bicycle parts (21%);
71
Supplementary Volume 3 to Crime in England and Wales 2010/11
cash (16%); and
clothing (12%).
Perceptions of thefts
Incidents of theft experienced by children aged 10 to 15 were perceived in a different way to violent incidents, for example (Table 3.06):
Incidents of thefts were more likely to be perceived as a crime compared with violent incidents (55% and 30% respectively).
Theft incidents were much less likely to be perceived as part of a series of bullying compared with violent incidents (13% compared with 62%).
Reporting of thefts
Despite incidents of theft being more likely to be perceived by children as a crime compared with violent incidents, the reporting rates were similar for the two types of offences (Table 3.07):
Police came to know about 13 per cent of theft incidents experienced by 10 to 15 year olds, similar to the 14 per cent of violent incidents reported to the police.
Eighty-four per cent of theft incidents that occurred in or around school were reported to a teacher as were 85 per cent of violent incidents.
3.5 VARIATION IN VICTIMISATION RATES AMONG CHILDREN
Headline victimisation rates17
for violence, theft and vandalism for 10 to 15 year olds from the 2010/11 BCS have previously been published as experimental statistics (Chaplin et al., 2011). Evidence from the main BCS has repeatedly shown that victimisation rates among adults vary depending on the characteristics of victims (see, for example, Flatley et al., 2010); hence similar analysis has now been carried out on the data collected from children.
This section focuses on the variation in victimisation rates according to personal, household and area characteristics
18 (see Tables 3.09 and 3.10). However, some of these demographic characteristics
may be inter-related so caution is needed in the interpretation of the effect of these different characteristics when viewed in isolation.
In general, caution should also be used when interpreting estimates that are based on a low number of cases. This is notably true for certain characteristics associated with children in this sample, such as having been bullied or living in a flat or in an area of high physical disorder. It should also be noted that tests of statistical significance are related to sample size; it may be that some apparently large differences shown in the tables are not statistically significant and could be due to sampling variation. Only statistically significant differences are highlighted in the text.
17 See Section 2.5 of the User Guide for more information about victimisation (prevalence) rates on the BCS. 18 See Section 7 of the User Guide for more details of these characteristics.
72
Experimental statistics on the experience of crime among children aged 10 to 15
Overall, there was little variation in theft or damage victimisation rates among children according to associated personal, household or area characteristics (although levels of bike theft were higher for boys (1.8%) than for girls (0.6%)). Hence the following commentary considers only variations in violence and overall crime victimisation rates among children.
19
Violence victimisation among children
According to the 2010/11 BCS, 6.9 per cent of children aged 10 to 15 had experienced a violent crime in the last 12 months (Chaplin et al., 2011 and Tables 3.9 and 3.10). Boys were around twice as likely as girls to have been a victim of violence (9.5% and 4.1% respectively). This was also true looking at grouped ages (Table 3.09):
Boys aged 10 to 12 (9.6%) and also boys aged 13 to 15 (9.4%) were each more likely to have been victims of violence than both girls aged 10 to 12 (4.8%) and girls aged 13 to 15 (3.5%).
Around 3.1 per cent of adults had experienced a violent crime in the last year (Chaplin et al., 2011). Similar to the gender difference noted among children, men were twice as likely to be a victim of violent crime as women (4.1% and 2.2% respectively).
20
The pattern by age was less clear, however, as ten year olds had the highest victimisation rate (11.6%) compared with all other ages (for example, 5.7% of 11 year olds) but there were no statistically significant differences between any of the other ages. Considering other personal characteristics of children, experimental statistics from the 2010/11 BCS showed that:
Children with a long-standing illness or disability were more than twice as likely to have experienced a violent incident compared with children without an illness or disability (15.0% and 6.1% respectively).
Children who had been bullied in the last 12 months had a much higher violence victimisation rate (20.8%) than those who had not been bullied (3.3%). This is not unexpected as violence can often form part of the bullying experience. As discussed in Section 3.3, 62 per cent of violent incidents were perceived to be part of a series of bullying.
There was also variation in violence victimisation among children according to some household characteristics (Table 3.10):
Children who lived in a household with one adult were more likely to have experienced a violent incident in the last year (9.4%) compared with children who lived in a household with more than one adult (6.2%).
Children who lived in social-rented property had the highest violence victimisation rate (11.6%) compared with 6.6 per cent of children in private-rented accommodation and 5.2 per cent of those in owner-occupied accommodation.
Children who lived in households with an income of less than £20,000 were more likely to have been a victim of violence (less than £10,000: 12.5%, from £10,000 to less than £20,000: 10.6%) compared with children who lived in households with all higher incomes (for example, £50,000 or more: 5.4%; Figure 3.3).
19 Figures presented here are based on the more focused method of counting crime against children (the Preferred measure)
which takes into account factors identified as important in determining the severity of an incident but will still include incidents of a serious nature even if they took place at school.
20 See http://www.homeoffice.gov.uk/publications/science-research-statistics/research-statistics/crime-research/hosb1011/ for estimates on the proportion of adults who were victims of violence by offence type and personal characteristics in Table 1 of the „Demographic tables – Crime in England and Wales 2010/11‟.
73
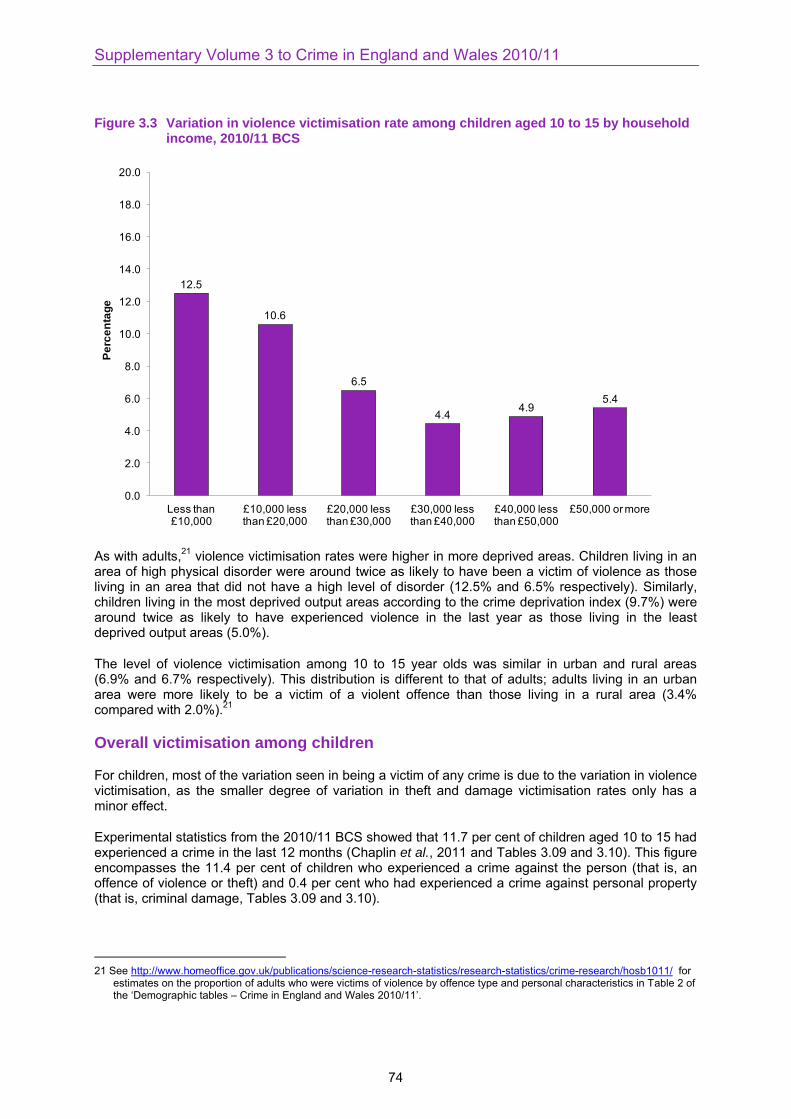
Supplementary Volume 3 to Crime in England and Wales 2010/11
Figure 3.3 Variation in violence victimisation rate among children aged 10 to 15 by household income, 2010/11 BCS
12.5
10.6
6.5
4.44.9
5.4
0.0
2.0
4.0
6.0
8.0
10.0
12.0
14.0
16.0
18.0
20.0
Less than £10,000
£10,000 less than £20,000
£20,000 less than £30,000
£30,000 less than £40,000
£40,000 less than £50,000
£50,000 or more
Pe
rce
nta
ge
As with adults,21
violence victimisation rates were higher in more deprived areas. Children living in an area of high physical disorder were around twice as likely to have been a victim of violence as those living in an area that did not have a high level of disorder (12.5% and 6.5% respectively). Similarly, children living in the most deprived output areas according to the crime deprivation index (9.7%) were around twice as likely to have experienced violence in the last year as those living in the least deprived output areas (5.0%).
The level of violence victimisation among 10 to 15 year olds was similar in urban and rural areas (6.9% and 6.7% respectively). This distribution is different to that of adults; adults living in an urban area were more likely to be a victim of a violent offence than those living in a rural area (3.4% compared with 2.0%).
21
Overall victimisation among children
For children, most of the variation seen in being a victim of any crime is due to the variation in violence victimisation, as the smaller degree of variation in theft and damage victimisation rates only has a minor effect.
Experimental statistics from the 2010/11 BCS showed that 11.7 per cent of children aged 10 to 15 had experienced a crime in the last 12 months (Chaplin et al., 2011 and Tables 3.09 and 3.10). This figure encompasses the 11.4 per cent of children who experienced a crime against the person (that is, an offence of violence or theft) and 0.4 per cent who had experienced a crime against personal property (that is, criminal damage, Tables 3.09 and 3.10).
21 See http://www.homeoffice.gov.uk/publications/science-research-statistics/research-statistics/crime-research/hosb1011/ for
estimates on the proportion of adults who were victims of violence by offence type and personal characteristics in Table 2 of the „Demographic tables – Crime in England and Wales 2010/11‟.
74
Experimental statistics on the experience of crime among children aged 10 to 15
Boys were more likely than girls to have been a victim of any BCS crime (14.6% and 8.6% respectively). There was no variation by age so this held true when looking at grouped ages (Table 3.09):
Boys aged 10 to 12 (14.5%) and also boys aged 13 to 15 (14.7%) were each more likely to have been victims of crime than girls aged 10 to 12 and girls aged 13 to 15 (both 8.6%).
As shown for violence victimisation, rates of overall victimisation were considerably higher among children with a long-standing illness or disability and those who had been bullied in the last year:
Children with a long-standing illness or disability were more likely to have been a victim of crime compared with children without an illness or disability (18.8% and 11.0% respectively).
Children who had been bullied in the last 12 months had a much higher victimisation rate (28.7%) than those who had not been bullied (6.7%).
22
There were similar patterns for crime victimisation overall as shown for violence victimisation when looking at household characteristics (Table 3.10):
Children who lived in a household with one adult were more likely to have experienced a crime in the last year (16.0%) compared with children who lived in a household with more than one adult (10.5%).
Children who lived in social-rented property had the highest victimisation rate (17.4%, compared with 12.0% of children in private-rented accommodation and 9.4% in owner-occupied accommodation).
Children who lived in households with lower incomes were the most likely to have been a victim of crime (for example, less than £10,000: 18.1%, compared with £50,000 or more: 9.3%).
Again, as for violence, there was a similarity in children‟s victimisation rates in urban and rural areas (11.6% and 11.8% respectively). There was also a clear pattern in levels of victimisation according to the crime deprivation index:
Children living in the most deprived areas (according to the crime deprivation index) were most likely to have been a victim of crime (15.1%), higher than the 12.0 per cent of children in the 60 per cent of areas between the most and least deprived areas. These figures were both higher than the 8.6 per cent of children living in the least deprived areas (according to the crime deprivation index).
22 This has already been shown for violence, but holds true for theft as well: 11.3 per cent of children who had been bullied in
the last month had been victims of theft, higher than the 3.7 per cent of children who had not been bullied.
75
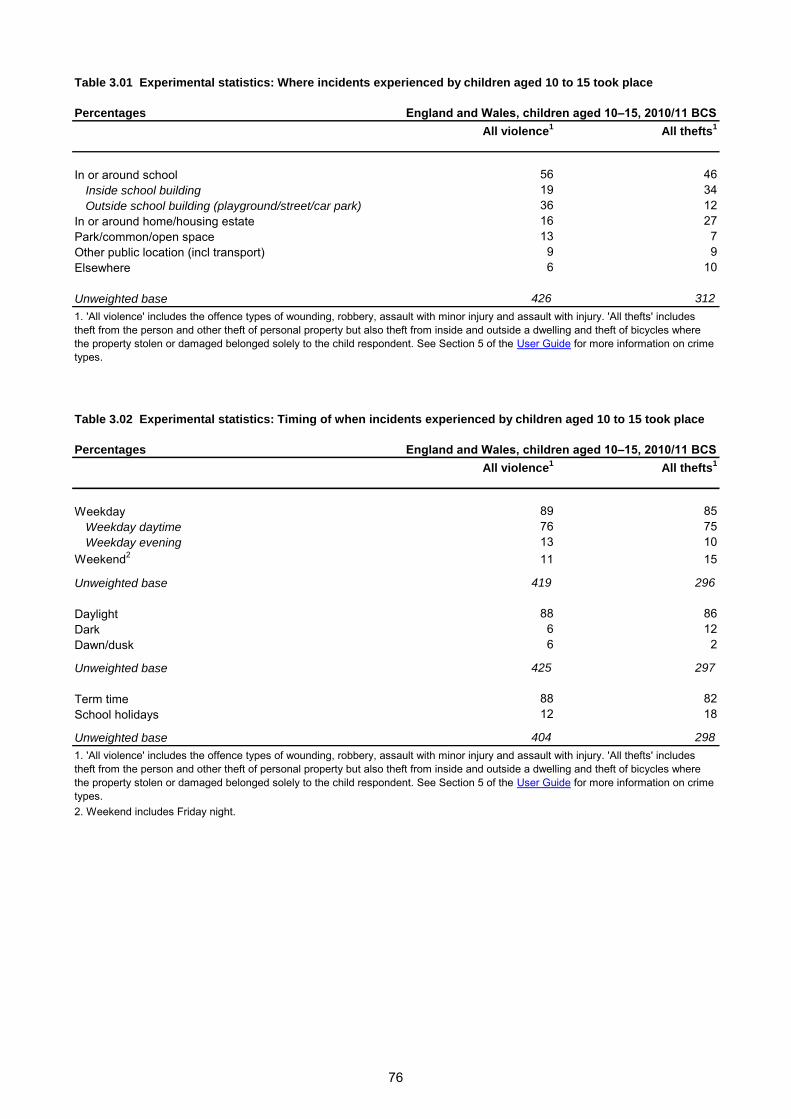
Percentages England and Wales, children aged 10–15, 2010/11 BCS
All violence1
All thefts1
In or around school 56 46
Inside school building 19 34
Outside school building (playground/street/car park) 36 12
In or around home/housing estate 16 27
Park/common/open space 13 7
Other public location (incl transport) 9 9
Elsewhere 6 10
Unweighted base 426 312
Percentages England and Wales, children aged 10–15, 2010/11 BCS
All violence1
All thefts1
Weekday 89 85
Weekday daytime 76 75
Weekday evening 13 10
Weekend2
11 15
Unweighted base 419 296
Daylight 88 86
Dark 6 12
Dawn/dusk 6 2
Unweighted base 425 297
Term time 88 82
School holidays 12 18
Unweighted base 404 298
2. Weekend includes Friday night.
Table 3.01 Experimental statistics: Where incidents experienced by children aged 10 to 15 took place
Table 3.02 Experimental statistics: Timing of when incidents experienced by children aged 10 to 15 took place
1. 'All violence' includes the offence types of wounding, robbery, assault with minor injury and assault with injury. 'All thefts' includes
theft from the person and other theft of personal property but also theft from inside and outside a dwelling and theft of bicycles where
the property stolen or damaged belonged solely to the child respondent. See Section 5 of the User Guide for more information on crime
types.
76
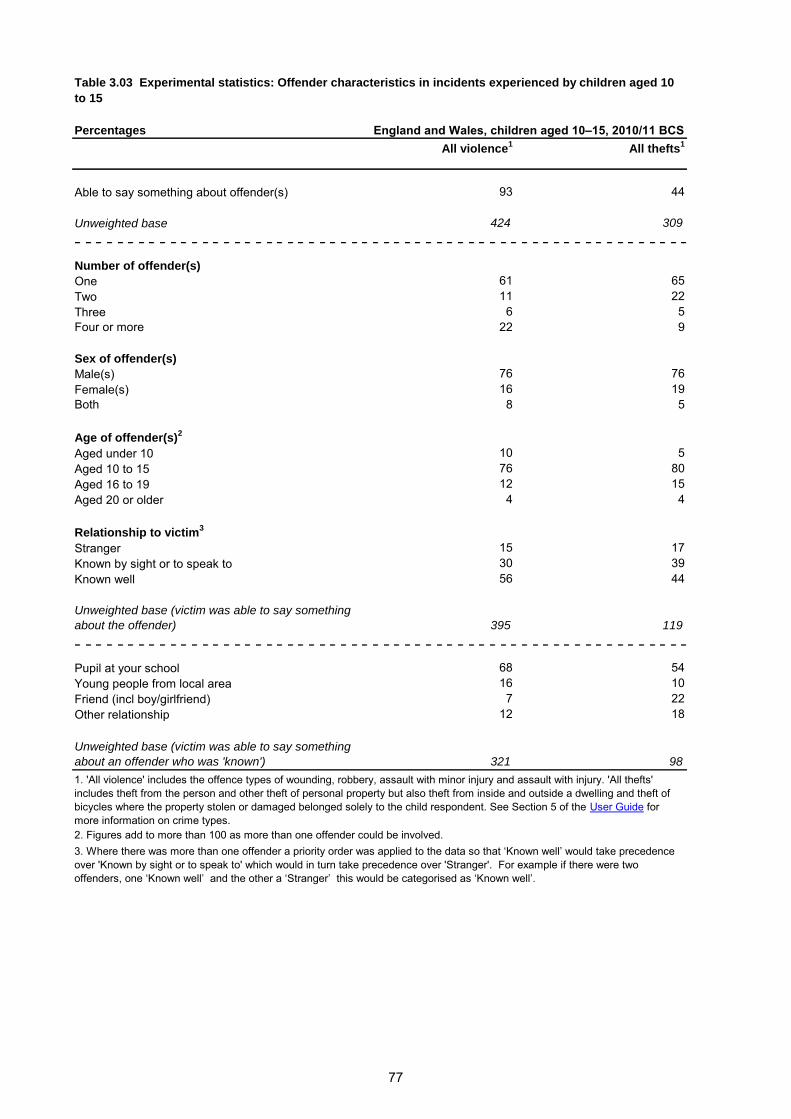
Percentages England and Wales, children aged 10–15, 2010/11 BCS
All violence1
All thefts1
Able to say something about offender(s) 93 44
Unweighted base 424 309
Number of offender(s)
One 61 65
Two 11 22
Three 6 5
Four or more 22 9
Sex of offender(s)
Male(s) 76 76
Female(s) 16 19
Both 8 5
Age of offender(s)2
Aged under 10 10 5
Aged 10 to 15 76 80
Aged 16 to 19 12 15
Aged 20 or older 4 4
Relationship to victim3
Stranger 15 17
Known by sight or to speak to 30 39
Known well 56 44
Unweighted base (victim was able to say something
about the offender) 395 119
Pupil at your school 68 54
Young people from local area 16 10
Friend (incl boy/girlfriend) 7 22
Other relationship 12 18
Unweighted base (victim was able to say something
about an offender who was 'known') 321 98
Table 3.03 Experimental statistics: Offender characteristics in incidents experienced by children aged 10
to 15
1. 'All violence' includes the offence types of wounding, robbery, assault with minor injury and assault with injury. 'All thefts'
includes theft from the person and other theft of personal property but also theft from inside and outside a dwelling and theft of
bicycles where the property stolen or damaged belonged solely to the child respondent. See Section 5 of the User Guide for
more information on crime types.
2. Figures add to more than 100 as more than one offender could be involved.
3. Where there was more than one offender a priority order was applied to the data so that ‘Known well’ would take precedence
over 'Known by sight or to speak to' which would in turn take precedence over 'Stranger'. For example if there were two
offenders, one ‘Known well’ and the other a ‘Stranger’ this would be categorised as ‘Known well’.
77
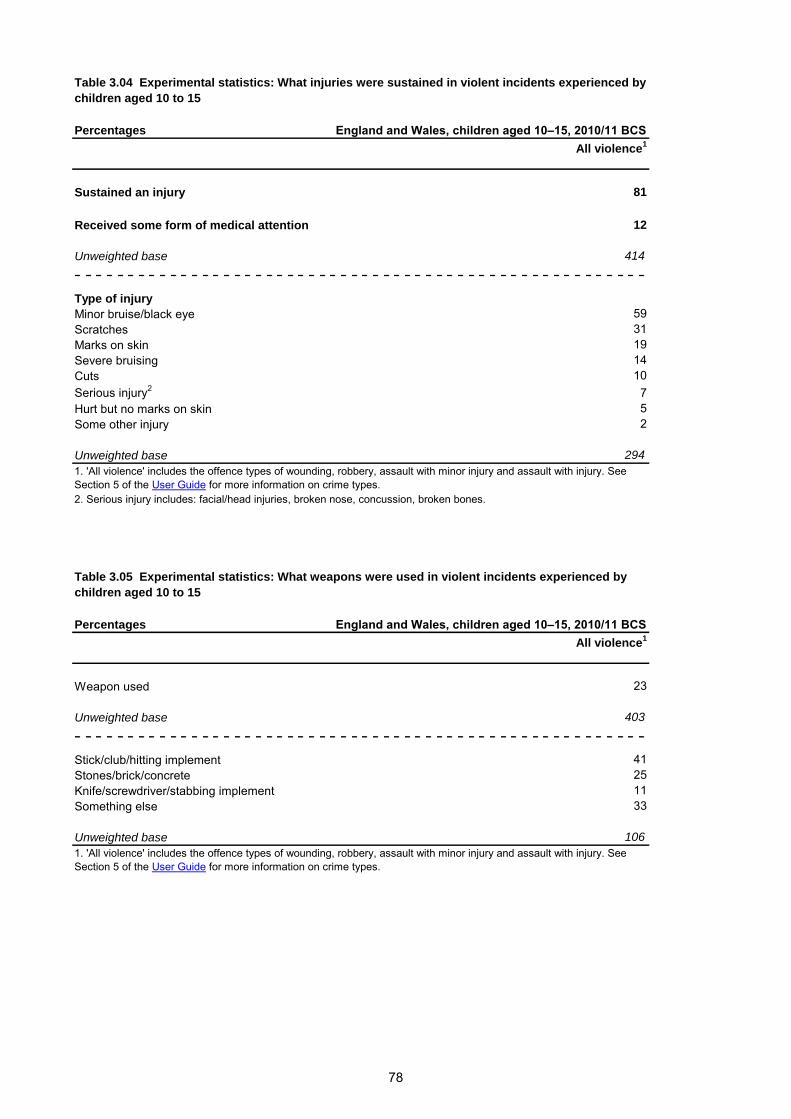
Percentages England and Wales, children aged 10–15, 2010/11 BCS
All violence1
Sustained an injury 81
Received some form of medical attention 12
Unweighted base 414
Type of injury
Minor bruise/black eye 59
Scratches 31
Marks on skin 19
Severe bruising 14
Cuts 10
Serious injury2
7
Hurt but no marks on skin 5
Some other injury 2
Unweighted base 294
Percentages England and Wales, children aged 10–15, 2010/11 BCS
All violence1
Weapon used 23
Unweighted base 403
Stick/club/hitting implement 41
Stones/brick/concrete 25
Knife/screwdriver/stabbing implement 11
Something else 33
Unweighted base 106
1. 'All violence' includes the offence types of wounding, robbery, assault with minor injury and assault with injury. See
Section 5 of the User Guide for more information on crime types.
Table 3.05 Experimental statistics: What weapons were used in violent incidents experienced by
children aged 10 to 15
Table 3.04 Experimental statistics: What injuries were sustained in violent incidents experienced by
children aged 10 to 15
2. Serious injury includes: facial/head injuries, broken nose, concussion, broken bones.
1. 'All violence' includes the offence types of wounding, robbery, assault with minor injury and assault with injury. See
Section 5 of the User Guide for more information on crime types.
78
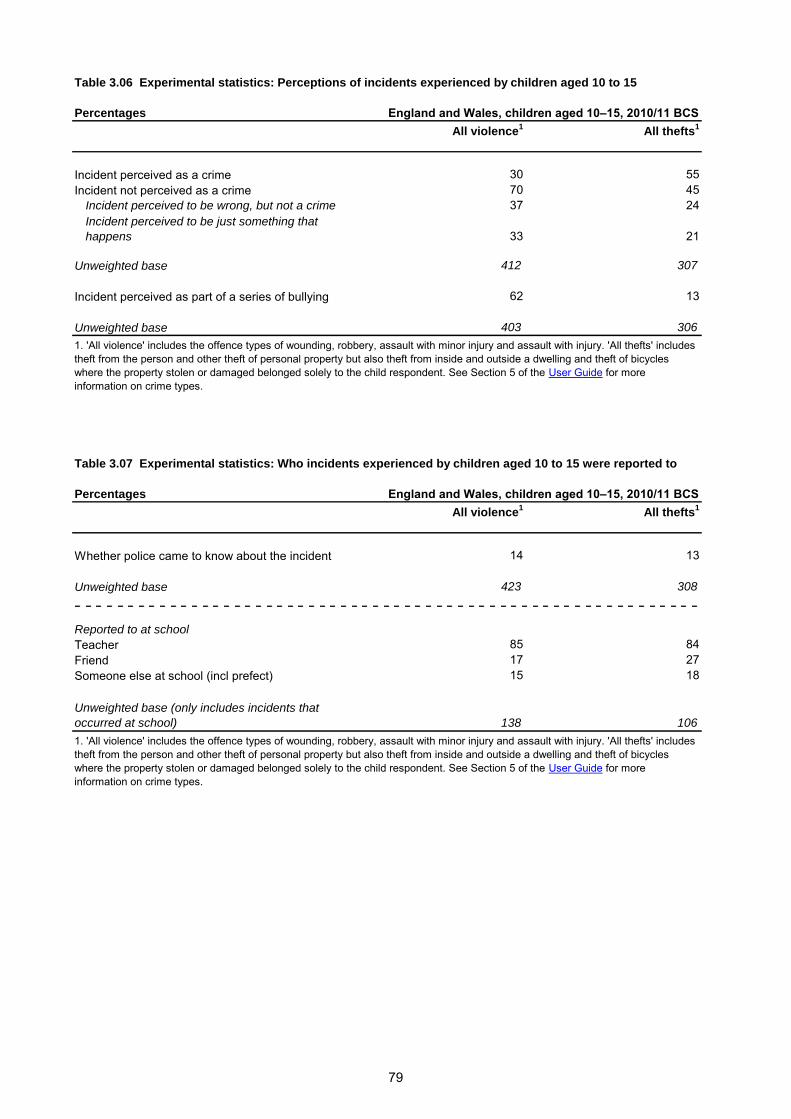
Percentages England and Wales, children aged 10–15, 2010/11 BCS
All violence1
All thefts1
Incident perceived as a crime 30 55
Incident not perceived as a crime 70 45
Incident perceived to be wrong, but not a crime 37 24
Incident perceived to be just something that
happens 33 21
Unweighted base 412 307
Incident perceived as part of a series of bullying 62 13
Unweighted base 403 306
Percentages England and Wales, children aged 10–15, 2010/11 BCS
All violence1
All thefts1
Whether police came to know about the incident 14 13
Unweighted base 423 308
Reported to at school
Teacher 85 84
Friend 17 27
Someone else at school (incl prefect) 15 18
Unweighted base (only includes incidents that
occurred at school) 138 106
Table 3.06 Experimental statistics: Perceptions of incidents experienced by children aged 10 to 15
Table 3.07 Experimental statistics: Who incidents experienced by children aged 10 to 15 were reported to
1. 'All violence' includes the offence types of wounding, robbery, assault with minor injury and assault with injury. 'All thefts' includes
theft from the person and other theft of personal property but also theft from inside and outside a dwelling and theft of bicycles
where the property stolen or damaged belonged solely to the child respondent. See Section 5 of the User Guide for more
information on crime types.
79
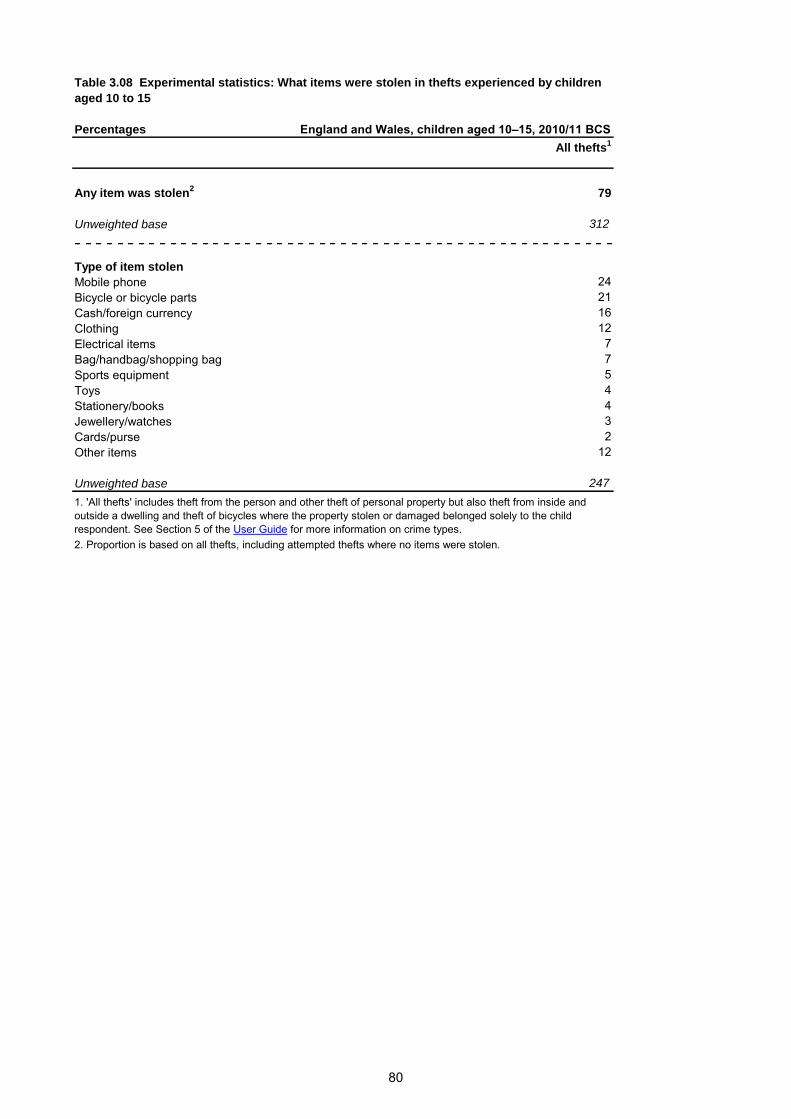
Percentages England and Wales, children aged 10–15, 2010/11 BCS
All thefts1
Any item was stolen2
79
Unweighted base 312
Type of item stolen
Mobile phone 24
Bicycle or bicycle parts 21
Cash/foreign currency 16
Clothing 12
Electrical items 7
Bag/handbag/shopping bag 7
Sports equipment 5
Toys 4
Stationery/books 4
Jewellery/watches 3
Cards/purse 2
Other items 12
Unweighted base 247
2. Proportion is based on all thefts, including attempted thefts where no items were stolen.
Table 3.08 Experimental statistics: What items were stolen in thefts experienced by children
aged 10 to 15
1. 'All thefts' includes theft from the person and other theft of personal property but also theft from inside and
outside a dwelling and theft of bicycles where the property stolen or damaged belonged solely to the child
respondent. See Section 5 of the User Guide for more information on crime types.
80
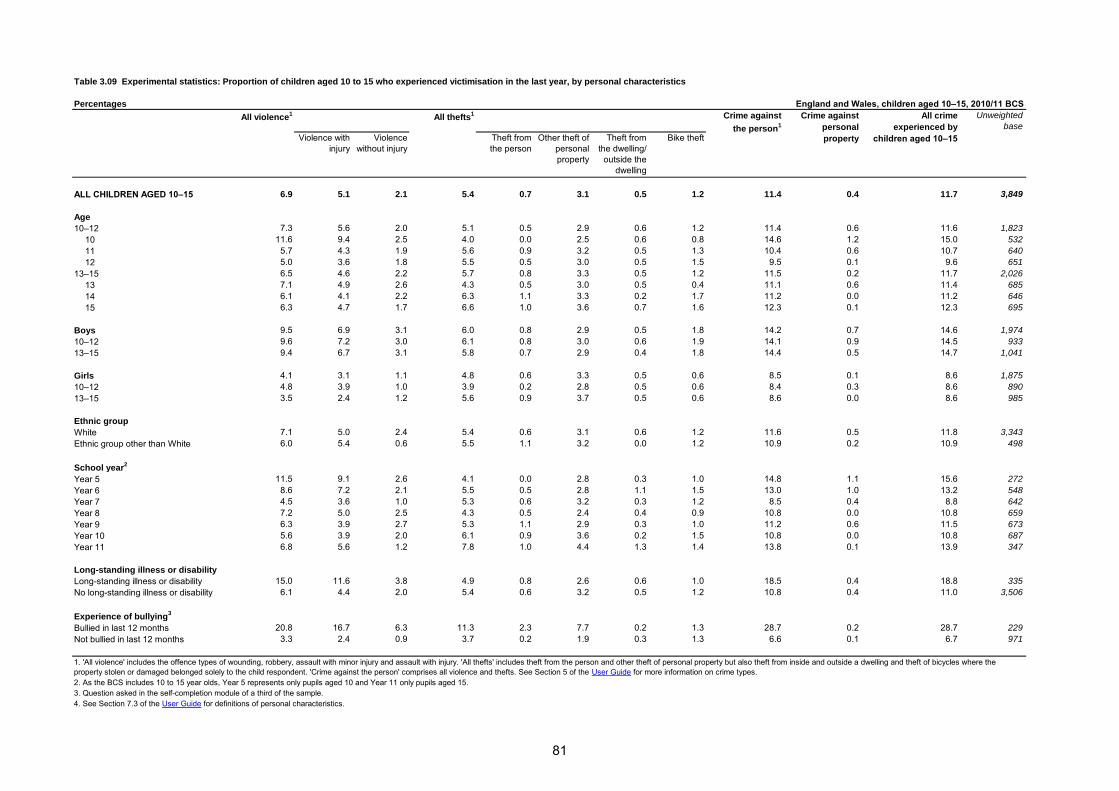
Percentages England and Wales, children aged 10–15, 2010/11 BCS
All violence1
All thefts1
Violence with
injury
Violence
without injury
Theft from
the person
Other theft of
personal
property
Theft from
the dwelling/
outside the
dwelling
Bike theft
ALL CHILDREN AGED 10–15 6.9 5.1 2.1 5.4 0.7 3.1 0.5 1.2 11.4 0.4 11.7 3,849
Age
10–12 7.3 5.6 2.0 5.1 0.5 2.9 0.6 1.2 11.4 0.6 11.6 1,823
10 11.6 9.4 2.5 4.0 0.0 2.5 0.6 0.8 14.6 1.2 15.0 532
11 5.7 4.3 1.9 5.6 0.9 3.2 0.5 1.3 10.4 0.6 10.7 640
12 5.0 3.6 1.8 5.5 0.5 3.0 0.5 1.5 9.5 0.1 9.6 651
13–15 6.5 4.6 2.2 5.7 0.8 3.3 0.5 1.2 11.5 0.2 11.7 2,026
13 7.1 4.9 2.6 4.3 0.5 3.0 0.5 0.4 11.1 0.6 11.4 685
14 6.1 4.1 2.2 6.3 1.1 3.3 0.2 1.7 11.2 0.0 11.2 646
15 6.3 4.7 1.7 6.6 1.0 3.6 0.7 1.6 12.3 0.1 12.3 695
Boys 9.5 6.9 3.1 6.0 0.8 2.9 0.5 1.8 14.2 0.7 14.6 1,974
10–12 9.6 7.2 3.0 6.1 0.8 3.0 0.6 1.9 14.1 0.9 14.5 933
13–15 9.4 6.7 3.1 5.8 0.7 2.9 0.4 1.8 14.4 0.5 14.7 1,041
Girls 4.1 3.1 1.1 4.8 0.6 3.3 0.5 0.6 8.5 0.1 8.6 1,875
10–12 4.8 3.9 1.0 3.9 0.2 2.8 0.5 0.6 8.4 0.3 8.6 890
13–15 3.5 2.4 1.2 5.6 0.9 3.7 0.5 0.6 8.6 0.0 8.6 985
Ethnic group
White 7.1 5.0 2.4 5.4 0.6 3.1 0.6 1.2 11.6 0.5 11.8 3,343
Ethnic group other than White 6.0 5.4 0.6 5.5 1.1 3.2 0.0 1.2 10.9 0.2 10.9 498
School year2
Year 5 11.5 9.1 2.6 4.1 0.0 2.8 0.3 1.0 14.8 1.1 15.6 272
Year 6 8.6 7.2 2.1 5.5 0.5 2.8 1.1 1.5 13.0 1.0 13.2 548
Year 7 4.5 3.6 1.0 5.3 0.6 3.2 0.3 1.2 8.5 0.4 8.8 642
Year 8 7.2 5.0 2.5 4.3 0.5 2.4 0.4 0.9 10.8 0.0 10.8 659
Year 9 6.3 3.9 2.7 5.3 1.1 2.9 0.3 1.0 11.2 0.6 11.5 673
Year 10 5.6 3.9 2.0 6.1 0.9 3.6 0.2 1.5 10.8 0.0 10.8 687
Year 11 6.8 5.6 1.2 7.8 1.0 4.4 1.3 1.4 13.8 0.1 13.9 347
Long-standing illness or disability
Long-standing illness or disability 15.0 11.6 3.8 4.9 0.8 2.6 0.6 1.0 18.5 0.4 18.8 335
No long-standing illness or disability 6.1 4.4 2.0 5.4 0.6 3.2 0.5 1.2 10.8 0.4 11.0 3,506
Experience of bullying3
Bullied in last 12 months 20.8 16.7 6.3 11.3 2.3 7.7 0.2 1.3 28.7 0.2 28.7 229
Not bullied in last 12 months 3.3 2.4 0.9 3.7 0.2 1.9 0.3 1.3 6.6 0.1 6.7 971
1. 'All violence' includes the offence types of wounding, robbery, assault with minor injury and assault with injury. 'All thefts' includes theft from the person and other theft of personal property but also theft from inside and outside a dwelling and theft of bicycles where the
property stolen or damaged belonged solely to the child respondent. 'Crime against the person' comprises all violence and thefts. See Section 5 of the User Guide for more information on crime types.
Table 3.09 Experimental statistics: Proportion of children aged 10 to 15 who experienced victimisation in the last year, by personal characteristics
4. See Section 7.3 of the User Guide for definitions of personal characteristics.
Unweighted
base
3. Question asked in the self-completion module of a third of the sample.
Crime against
the person1
Crime against
personal
property
All crime
experienced by
children aged 10–15
2. As the BCS includes 10 to 15 year olds, Year 5 represents only pupils aged 10 and Year 11 only pupils aged 15.
81
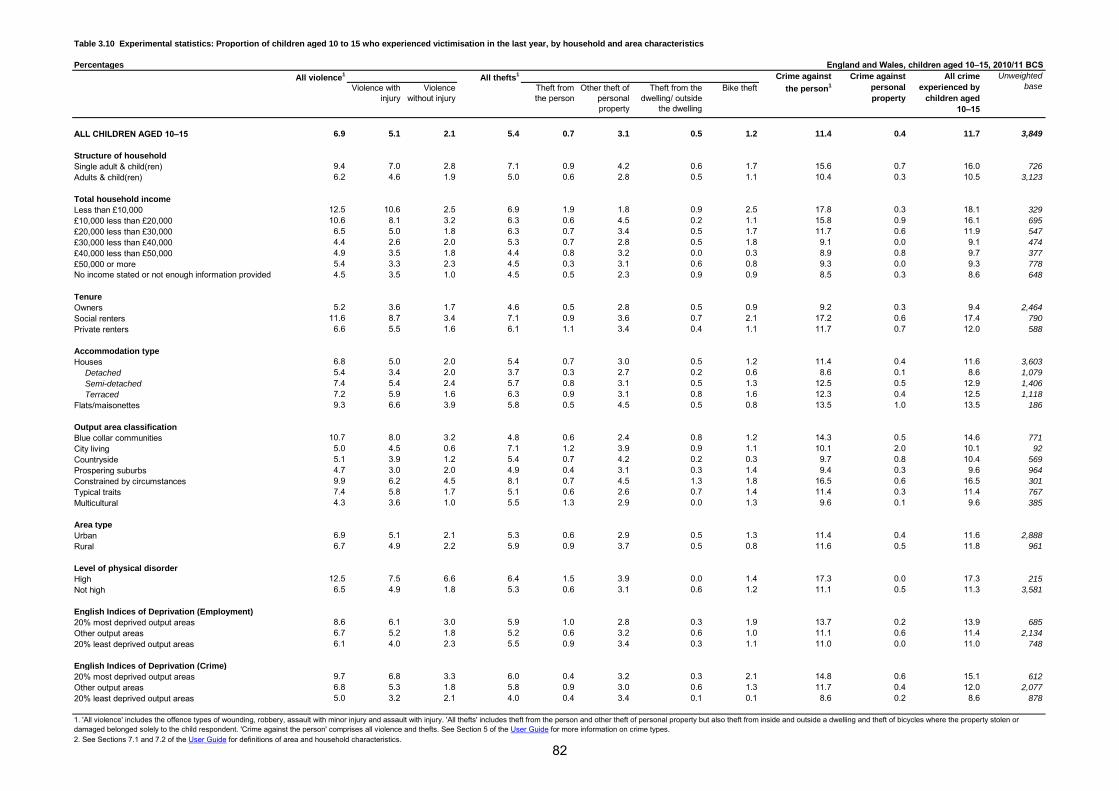
Percentages England and Wales, children aged 10–15, 2010/11 BCS
All violence1
All thefts1
Violence with
injury
Violence
without injury
Theft from
the person
Other theft of
personal
property
Theft from the
dwelling/ outside
the dwelling
Bike theft
ALL CHILDREN AGED 10–15 6.9 5.1 2.1 5.4 0.7 3.1 0.5 1.2 11.4 0.4 11.7 3,849
Structure of household
Single adult & child(ren) 9.4 7.0 2.8 7.1 0.9 4.2 0.6 1.7 15.6 0.7 16.0 726
Adults & child(ren) 6.2 4.6 1.9 5.0 0.6 2.8 0.5 1.1 10.4 0.3 10.5 3,123
Total household income
Less than £10,000 12.5 10.6 2.5 6.9 1.9 1.8 0.9 2.5 17.8 0.3 18.1 329
£10,000 less than £20,000 10.6 8.1 3.2 6.3 0.6 4.5 0.2 1.1 15.8 0.9 16.1 695
£20,000 less than £30,000 6.5 5.0 1.8 6.3 0.7 3.4 0.5 1.7 11.7 0.6 11.9 547
£30,000 less than £40,000 4.4 2.6 2.0 5.3 0.7 2.8 0.5 1.8 9.1 0.0 9.1 474
£40,000 less than £50,000 4.9 3.5 1.8 4.4 0.8 3.2 0.0 0.3 8.9 0.8 9.7 377
£50,000 or more 5.4 3.3 2.3 4.5 0.3 3.1 0.6 0.8 9.3 0.0 9.3 778
No income stated or not enough information provided 4.5 3.5 1.0 4.5 0.5 2.3 0.9 0.9 8.5 0.3 8.6 648
Tenure
Owners 5.2 3.6 1.7 4.6 0.5 2.8 0.5 0.9 9.2 0.3 9.4 2,464
Social renters 11.6 8.7 3.4 7.1 0.9 3.6 0.7 2.1 17.2 0.6 17.4 790
Private renters 6.6 5.5 1.6 6.1 1.1 3.4 0.4 1.1 11.7 0.7 12.0 588
Accommodation type
Houses 6.8 5.0 2.0 5.4 0.7 3.0 0.5 1.2 11.4 0.4 11.6 3,603
Detached 5.4 3.4 2.0 3.7 0.3 2.7 0.2 0.6 8.6 0.1 8.6 1,079
Semi-detached 7.4 5.4 2.4 5.7 0.8 3.1 0.5 1.3 12.5 0.5 12.9 1,406
Terraced 7.2 5.9 1.6 6.3 0.9 3.1 0.8 1.6 12.3 0.4 12.5 1,118
Flats/maisonettes 9.3 6.6 3.9 5.8 0.5 4.5 0.5 0.8 13.5 1.0 13.5 186
Output area classification
Blue collar communities 10.7 8.0 3.2 4.8 0.6 2.4 0.8 1.2 14.3 0.5 14.6 771
City living 5.0 4.5 0.6 7.1 1.2 3.9 0.9 1.1 10.1 2.0 10.1 92
Countryside 5.1 3.9 1.2 5.4 0.7 4.2 0.2 0.3 9.7 0.8 10.4 569
Prospering suburbs 4.7 3.0 2.0 4.9 0.4 3.1 0.3 1.4 9.4 0.3 9.6 964
Constrained by circumstances 9.9 6.2 4.5 8.1 0.7 4.5 1.3 1.8 16.5 0.6 16.5 301
Typical traits 7.4 5.8 1.7 5.1 0.6 2.6 0.7 1.4 11.4 0.3 11.4 767
Multicultural 4.3 3.6 1.0 5.5 1.3 2.9 0.0 1.3 9.6 0.1 9.6 385
Area type
Urban 6.9 5.1 2.1 5.3 0.6 2.9 0.5 1.3 11.4 0.4 11.6 2,888
Rural 6.7 4.9 2.2 5.9 0.9 3.7 0.5 0.8 11.6 0.5 11.8 961
Level of physical disorder
High 12.5 7.5 6.6 6.4 1.5 3.9 0.0 1.4 17.3 0.0 17.3 215
Not high 6.5 4.9 1.8 5.3 0.6 3.1 0.6 1.2 11.1 0.5 11.3 3,581
English Indices of Deprivation (Employment)
20% most deprived output areas 8.6 6.1 3.0 5.9 1.0 2.8 0.3 1.9 13.7 0.2 13.9 685
Other output areas 6.7 5.2 1.8 5.2 0.6 3.2 0.6 1.0 11.1 0.6 11.4 2,134
20% least deprived output areas 6.1 4.0 2.3 5.5 0.9 3.4 0.3 1.1 11.0 0.0 11.0 748
English Indices of Deprivation (Crime)
20% most deprived output areas 9.7 6.8 3.3 6.0 0.4 3.2 0.3 2.1 14.8 0.6 15.1 612
Other output areas 6.8 5.3 1.8 5.8 0.9 3.0 0.6 1.3 11.7 0.4 12.0 2,077
20% least deprived output areas 5.0 3.2 2.1 4.0 0.4 3.4 0.1 0.1 8.6 0.2 8.6 878
All crime
experienced by
children aged
10–15
Table 3.10 Experimental statistics: Proportion of children aged 10 to 15 who experienced victimisation in the last year, by household and area characteristics
2. See Sections 7.1 and 7.2 of the User Guide for definitions of area and household characteristics.
Unweighted
base
Crime against
the person1
Crime against
personal
property
1. 'All violence' includes the offence types of wounding, robbery, assault with minor injury and assault with injury. 'All thefts' includes theft from the person and other theft of personal property but also theft from inside and outside a dwelling and theft of bicycles where the property stolen or
damaged belonged solely to the child respondent. 'Crime against the person' comprises all violence and thefts. See Section 5 of the User Guide for more information on crime types.
82
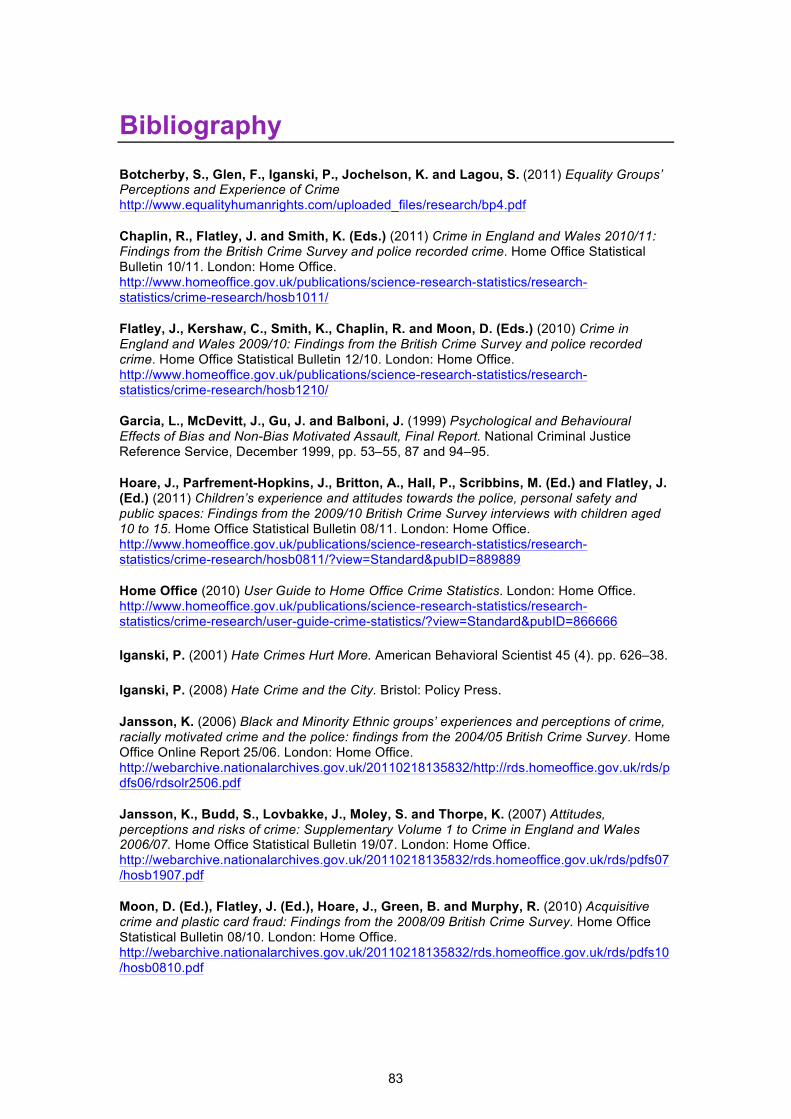
Bibliography
Botcherby, S., Glen, F., Iganski, P., Jochelson, K. and Lagou, S. (2011) Equality Groups’ Perceptions and Experience of Crime http://www.equalityhumanrights.com/uploaded_files/research/bp4.pdf
Chaplin, R., Flatley, J. and Smith, K. (Eds.) (2011) Crime in England and Wales 2010/11: Findings from the British Crime Survey and police recorded crime. Home Office Statistical Bulletin 10/11. London: Home Office. http://www.homeoffice.gov.uk/publications/science-research-statistics/research-statistics/crime-research/hosb1011/
Flatley, J., Kershaw, C., Smith, K., Chaplin, R. and Moon, D. (Eds.) (2010) Crime in England and Wales 2009/10: Findings from the British Crime Survey and police recorded crime. Home Office Statistical Bulletin 12/10. London: Home Office. http://www.homeoffice.gov.uk/publications/science-research-statistics/research-statistics/crime-research/hosb1210/
Garcia, L., McDevitt, J., Gu, J. and Balboni, J. (1999) Psychological and Behavioural Effects of Bias and Non-Bias Motivated Assault, Final Report. National Criminal Justice Reference Service, December 1999, pp. 53–55, 87 and 94–95.
Hoare, J., Parfrement-Hopkins, J., Britton, A., Hall, P., Scribbins, M. (Ed.) and Flatley, J. (Ed.) (2011) Children’s experience and attitudes towards the police, personal safety and public spaces: Findings from the 2009/10 British Crime Survey interviews with children aged 10 to 15. Home Office Statistical Bulletin 08/11. London: Home Office. http://www.homeoffice.gov.uk/publications/science-research-statistics/research-statistics/crime-research/hosb0811/?view=Standard&pubID=889889
Home Office (2010) User Guide to Home Office Crime Statistics. London: Home Office. http://www.homeoffice.gov.uk/publications/science-research-statistics/research-statistics/crime-research/user-guide-crime-statistics/?view=Standard&pubID=866666
Iganski, P. (2001) Hate Crimes Hurt More. American Behavioral Scientist 45 (4). pp. 626–38.
Iganski, P. (2008) Hate Crime and the City. Bristol: Policy Press.
Jansson, K. (2006) Black and Minority Ethnic groups’ experiences and perceptions of crime, racially motivated crime and the police: findings from the 2004/05 British Crime Survey. Home Office Online Report 25/06. London: Home Office. http://webarchive.nationalarchives.gov.uk/20110218135832/http://rds.homeoffice.gov.uk/rds/pdfs06/rdsolr2506.pdf
Jansson, K., Budd, S., Lovbakke, J., Moley, S. and Thorpe, K. (2007) Attitudes, perceptions and risks of crime: Supplementary Volume 1 to Crime in England and Wales 2006/07. Home Office Statistical Bulletin 19/07. London: Home Office. http://webarchive.nationalarchives.gov.uk/20110218135832/rds.homeoffice.gov.uk/rds/pdfs07/hosb1907.pdf
Moon, D. (Ed.), Flatley, J. (Ed.), Hoare, J., Green, B. and Murphy, R. (2010) Acquisitive crime and plastic card fraud: Findings from the 2008/09 British Crime Survey. Home Office Statistical Bulletin 08/10. London: Home Office. http://webarchive.nationalarchives.gov.uk/20110218135832/rds.homeoffice.gov.uk/rds/pdfs10/hosb0810.pdf
83

Supplementary Volume 3 to Crime in England and Wales 2010/2011
Salisbury, H., and Upson, A. (2004) Ethnicity, victimisation and worry about crime: findings from the 2001/02 and 2002/03 British Crime Surveys. Home Office Research Findings 237. London: Home Office. http://webarchive.nationalarchives.gov.uk/20110218135832/http://rds.homeoffice.gov.uk/rds/pdfs04/r237.pdf
Copies of Home Office publications are available from the Home Office Science internet pages: http://homeoffice.gov.uk/science-research/research-statistics/
84