Embed Size (px)
Citation preview
MCA Monitor
Hating on the Hurdle: Reforming the Millennium Challenge Corporation’s Approach to Corruption
Casey Dunning, Jonathan Karver, and Charles KennyMarch 2014
Summary
The Millennium Challenge Corporation is a US agency that provides results-oriented assistance to low- and lower-middle income countries that exhibit strong performance on a number of measures of development. Among these measures is the Worldwide Governance Indicator for control of corruption. A country must score in the top half of its income group on control of corruption to pass the overall selection procedure. This paper examines the empirical underpinning of this “corruption hard hurdle.” It suggests the following: (1) the control of corruption indicator reflects broad perceptions of governance with some noise, risking considerable errors of inclusion and exclusion; (2) the control of corruption indicator is not strongly related to progress in development outcomes, nor are country-level governance indicators strong determinants of aid project performance; and (3) the control of corruption indicator changes slowly over time, with an opaque relationship to reform efforts. The paper suggests abandoning the corruption hard hurdle and using in its place country- and sector-specific indicators of the quality of governance that are amenable to policy reform.
The MCA Monitor provides rigorous policy analysis and research on the operations and effectiveness of the Millennium Challenge Corporation. It is part of CGD’s Rethinking US Development Policy Initiative that tracks efforts to reform aid programs and improve aid effectiveness.
With thanks to participants at a Center for Global Development research-in-progress seminar, a Millennium Challenge Corporation informal meeting on a draft of the paper, Sarah Jane Staats, David Roodman, and Sarah Rose for comments and reactions. All errors and opinions are ours.

1
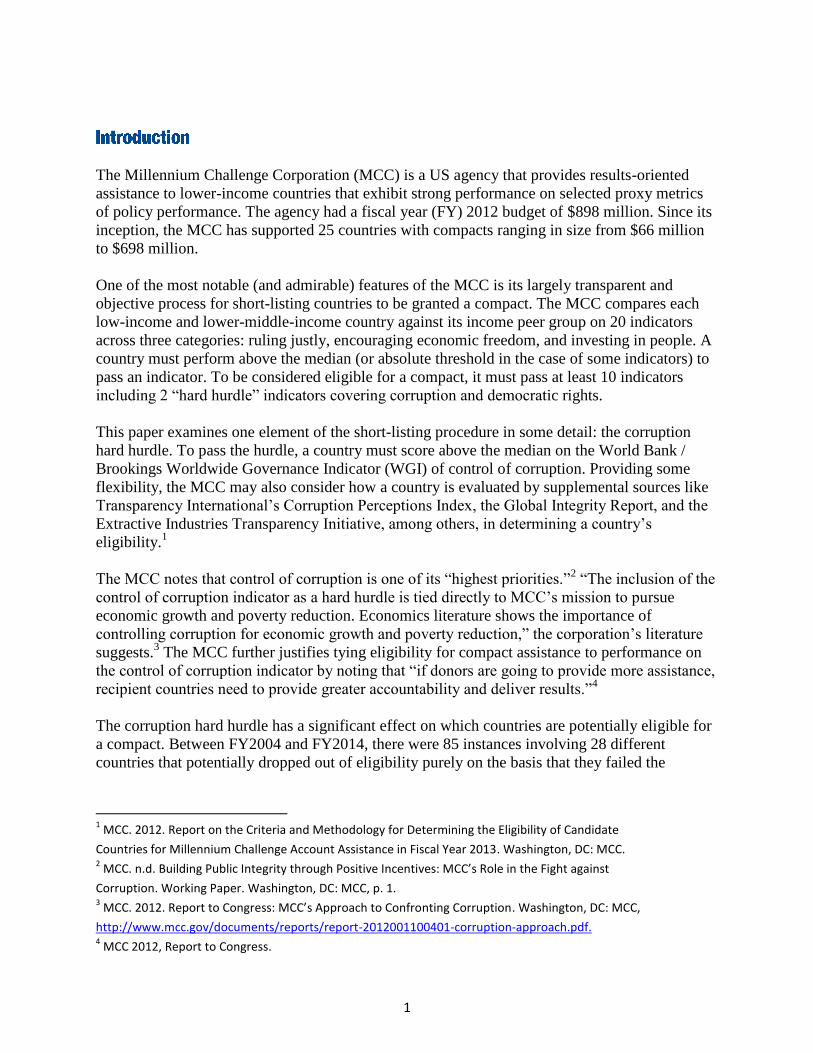
The Millennium Challenge Corporation (MCC) is a US agency that provides results-oriented
assistance to lower-income countries that exhibit strong performance on selected proxy metrics
of policy performance. The agency had a fiscal year (FY) 2012 budget of $898 million. Since its
inception, the MCC has supported 25 countries with compacts ranging in size from $66 million
to $698 million.
One of the most notable (and admirable) features of the MCC is its largely transparent and
objective process for short-listing countries to be granted a compact. The MCC compares each
low-income and lower-middle-income country against its income peer group on 20 indicators
across three categories: ruling justly, encouraging economic freedom, and investing in people. A
country must perform above the median (or absolute threshold in the case of some indicators) to
pass an indicator. To be considered eligible for a compact, it must pass at least 10 indicators
including 2 “hard hurdle” indicators covering corruption and democratic rights.
This paper examines one element of the short-listing procedure in some detail: the corruption
hard hurdle. To pass the hurdle, a country must score above the median on the World Bank /
Brookings Worldwide Governance Indicator (WGI) of control of corruption. Providing some
flexibility, the MCC may also consider how a country is evaluated by supplemental sources like
Transparency International’s Corruption Perceptions Index, the Global Integrity Report, and the
Extractive Industries Transparency Initiative, among others, in determining a country’s
eligibility.1
The MCC notes that control of corruption is one of its “highest priorities.”2 “The inclusion of the
control of corruption indicator as a hard hurdle is tied directly to MCC’s mission to pursue
economic growth and poverty reduction. Economics literature shows the importance of
controlling corruption for economic growth and poverty reduction,” the corporation’s literature
suggests.3 The MCC further justifies tying eligibility for compact assistance to performance on
the control of corruption indicator by noting that “if donors are going to provide more assistance,
recipient countries need to provide greater accountability and deliver results.”4
The corruption hard hurdle has a significant effect on which countries are potentially eligible for
a compact. Between FY2004 and FY2014, there were 85 instances involving 28 different
countries that potentially dropped out of eligibility purely on the basis that they failed the
1 MCC. 2012. Report on the Criteria and Methodology for Determining the Eligibility of Candidate
Countries for Millennium Challenge Account Assistance in Fiscal Year 2013. Washington, DC: MCC. 2 MCC. n.d. Building Public Integrity through Positive Incentives: MCC’s Role in the Fight against
Corruption. Working Paper. Washington, DC: MCC, p. 1. 3 MCC. 2012. Report to Congress: MCC’s Approach to Confronting Corruption. Washington, DC: MCC,
http://www.mcc.gov/documents/reports/report-2012001100401-corruption-approach.pdf. 4 MCC 2012, Report to Congress.
2
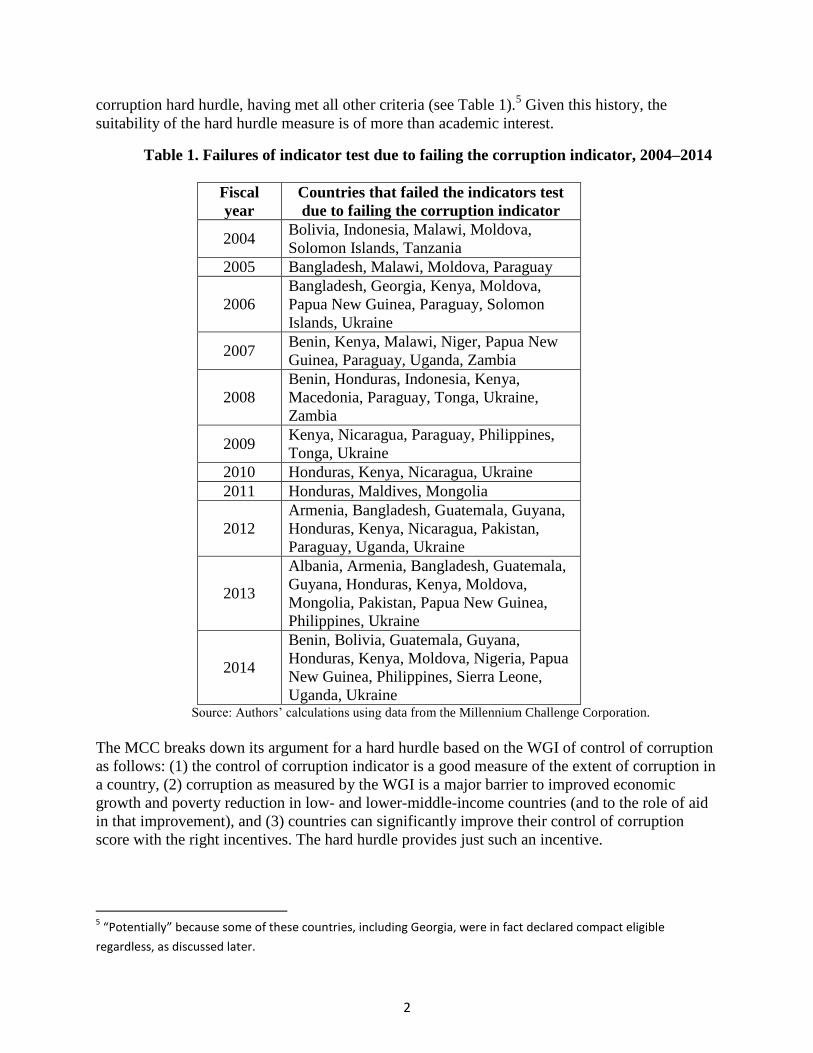
corruption hard hurdle, having met all other criteria (see Table 1).5 Given this history, the
suitability of the hard hurdle measure is of more than academic interest.
Table 1. Failures of indicator test due to failing the corruption indicator, 2004–2014
Fiscal
year
Countries that failed the indicators test
due to failing the corruption indicator
2004 Bolivia, Indonesia, Malawi, Moldova,
Solomon Islands, Tanzania
2005 Bangladesh, Malawi, Moldova, Paraguay
2006
Bangladesh, Georgia, Kenya, Moldova,
Papua New Guinea, Paraguay, Solomon
Islands, Ukraine
2007 Benin, Kenya, Malawi, Niger, Papua New
Guinea, Paraguay, Uganda, Zambia
2008
Benin, Honduras, Indonesia, Kenya,
Macedonia, Paraguay, Tonga, Ukraine,
Zambia
2009 Kenya, Nicaragua, Paraguay, Philippines,
Tonga, Ukraine
2010 Honduras, Kenya, Nicaragua, Ukraine
2011 Honduras, Maldives, Mongolia
2012
Armenia, Bangladesh, Guatemala, Guyana,
Honduras, Kenya, Nicaragua, Pakistan,
Paraguay, Uganda, Ukraine
2013
Albania, Armenia, Bangladesh, Guatemala,
Guyana, Honduras, Kenya, Moldova,
Mongolia, Pakistan, Papua New Guinea,
Philippines, Ukraine
2014
Benin, Bolivia, Guatemala, Guyana,
Honduras, Kenya, Moldova, Nigeria, Papua
New Guinea, Philippines, Sierra Leone,
Uganda, Ukraine Source: Authors’ calculations using data from the Millennium Challenge Corporation.
The MCC breaks down its argument for a hard hurdle based on the WGI of control of corruption
as follows: (1) the control of corruption indicator is a good measure of the extent of corruption in
a country, (2) corruption as measured by the WGI is a major barrier to improved economic
growth and poverty reduction in low- and lower-middle-income countries (and to the role of aid
in that improvement), and (3) countries can significantly improve their control of corruption
score with the right incentives. The hard hurdle provides just such an incentive.
5 “Potentially” because some of these countries, including Georgia, were in fact declared compact eligible
regardless, as discussed later.
3
This paper examines the empirical underpinning of the argument for the hard hurdle. It suggests
the following:
The WGI control of corruption indicator, like all perceptions-based corruption indicators,
does not appear to be a particularly strong measure of the extent of surveyed corruption
in a country. The control of corruption indicator appears to reflect perceptions of an
overarching sense of “the quality of governance,” itself closely related to levels of gross
domestic product (GDP) per capita. The MCC indicators list contains a number of similar
measures. There appears to be little empirical justification either for having so many
indicators that capture the same general perceived quality of governance or for
privileging one of them as a “hard hurdle.”
The WGI control of corruption indicator is not strongly related to progress in
development outcomes, including economic growth, improvements in health, or
educational enrollments. Thus the empirical underpinnings for a belief that control of
corruption as measured by the WGI is a larger, more foundational hurdle to broad-based
development than ill health, poor education, low social capital, or (other) measures of
institutional quality is weak.
The WGI control of corruption indicator changes slowly over time, with an opaque
relationship to reform efforts. It appears difficult for countries to take actions to
significantly improve their scores over the short term. It is unclear, then, that the WGI
control of corruption measure is an “actionable indicator” of the type suitable for
performance incentives.
While the empirical justification for the MCC’s current hard-hurdle approach to corruption may
be weak, MCC’s authorizing legislation suggests the need for a corruption indicator in the mix of
measures that it utilizes to short-list countries and the need to weigh (and be seen to weigh) the
corruption issue particularly heavily. Given these needs, the paper concludes with some
alternative approaches that might achieve this goal with greater efficacy as well as other
approaches the MCC might take to reassure its backers that MCC resources are not diverted to
corruption.6
It should be noted that this paper is not an attack on the WGIs, which have a very useful role in
cross-country research. The paper does suggest that any perceptions-based control of corruption
indicator is ill-used in the current MCC selection process, where the requirement for accuracy
goes beyond the statistical. Our concerns with the WGIs as used in the MCC selection process
largely draw upon observations made by the creators of the indicators themselves.7
6 Note that we do not suggest that staff at the MCC believe that falling in the top half of an income group on
control of corruption ensures compacts will be corruption free, but an underlying rationale behind the MCC selection process is that aid has a bigger impact in countries with stronger policies and institutions. 7 D. Kaufmann and A. Kraay. 2002. Governance Indicators, Aid Allocation and Millennium Challenge Account.
Working paper. Washington, DC: World Bank. D. Kaufmann, A. Kraay, and M. Mastruzzi. 2010. The Worldwide Governance Indicators: Methodology and Analytical Issues. World Bank Policy Research Working Paper No. 5430. Washington, DC: World Bank.
4
Similarly, this paper should not be seen as a general assault on the MCC’s process. Not least, the
indicator-driven approach to selection is a model in comparative transparency when it comes to
the allocation of resources. The paper does suggest that the current selection process may ask
more of development indicators—and especially those around governance—than should be
asked, however.
The Worldwide Governance Indicators (WGIs) of the World Bank and the Brookings Institution
measure six dimensions of governance from 1996 through 2012—voice and accountability,
political stability and absence of violence, government effectiveness, regulatory quality, rule of
law, and control of corruption—using 31 sources of data that combine expert opinion with
surveys of both citizens and businesspeople.8 The authors take individual data sources and assign
them to particular indicator baskets. They then produce a single composite measure using an
unobserved components model.9
The MCC currently applies four WGI indicators in its selection process: control of corruption,
government effectiveness, and rule of law indicators in the “ruling justly” category; and
regulatory quality in the “economic freedom” category. The WGI authors suggest the control of
corruption indicator in particular “captures perceptions of the extent to which public power is
exercised for private gain, including both petty and grand forms of corruption, as well as
‘capture’ of the state by elites and private interests.”10
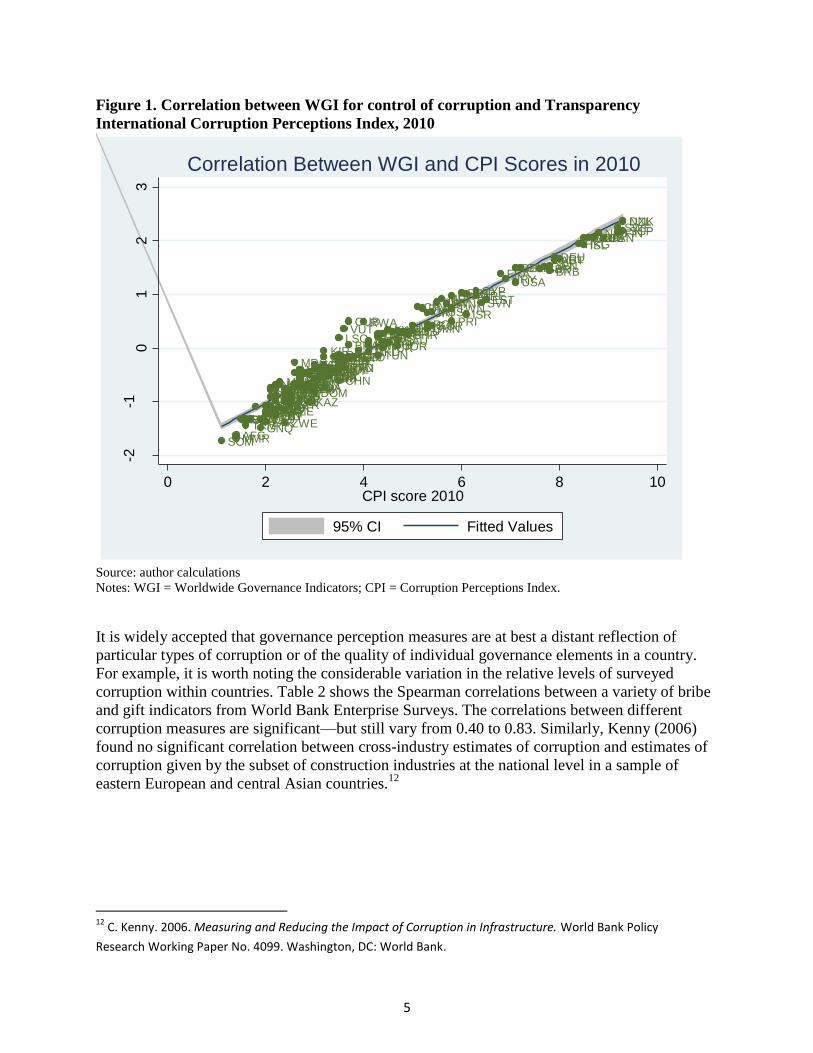
With regard to the corruption measure, there is a relatively high level of correlation with a
separate measure provided by Transparency International: the Corruption Perceptions Index (see
Figure 1).11
At the same time, there is a heavy overlap of source material.
8 Visit http://info.worldbank.org/governance/wgi/index.aspx#home for more detailed information.
9 The model is described in detail in Kaufmann, Kraay, and Mastruzzi 2010.
10 Kaufmann, Kraay, and Mastruzzi 2010, p. 4.
11 Transparency International’s Corruption Perceptions Index is available at
http://www.transparency.org/research/cpi/overview.
5
Figure 1. Correlation between WGI for control of corruption and Transparency
International Corruption Perceptions Index, 2010
Source: author calculations
Notes: WGI = Worldwide Governance Indicators; CPI = Corruption Perceptions Index.
It is widely accepted that governance perception measures are at best a distant reflection of
particular types of corruption or of the quality of individual governance elements in a country.
For example, it is worth noting the considerable variation in the relative levels of surveyed
corruption within countries. Table 2 shows the Spearman correlations between a variety of bribe
and gift indicators from World Bank Enterprise Surveys. The correlations between different
corruption measures are significant—but still vary from 0.40 to 0.83. Similarly, Kenny (2006)
found no significant correlation between cross-industry estimates of corruption and estimates of
corruption given by the subset of construction industries at the national level in a sample of
eastern European and central Asian countries.12
12
C. Kenny. 2006. Measuring and Reducing the Impact of Corruption in Infrastructure. World Bank Policy
Research Working Paper No. 4099. Washington, DC: World Bank.
AFG
AGO
ALB
ARE
ARGARM
AUS
AUT
AZEBDI
BEL
BEN
BFA
BGD
BGR
BHR
BIH
BLR
BOL
BRA
BRB
BRNBTNBWA
CAF
CANCHE
CHL
CHN
CIVCMR
COG
COL
COM
CPVCRI
CUB
CYP
CZE
DEU
DJI
DMA
DNK
DOM
DZA
ECU
EGYERI
ESPEST
ETH
FIN
FRA
GAB
GBR
GEOGHA
GIN
GMB
GNB
GNQ
GRC
GTMGUY
HKG
HND
HRV
HTI
HUN
IDNIND
IRL
IRN
IRQ
ISL
ISR
ITA
JAM
JOR
JPN
KAZKENKGZKHM
KIR
KORKWT
LAOLBN
LBR
LBY
LKA
LSOLTU
LUX
LVAMAC
MAR
MDA
MDG
MDV
MEX
MKD
MLI
MLT
MMR
MNG
MOZ
MRT
MUS
MWI
MYSNAM
NER
NGANIC
NLDNOR
NPL
NZL
OMN
PAK
PANPER
PHL
PNG
POL PRI
PRT
PRY
QAT
ROM
RUS
RWA
SAU
SDN
SEN
SGP
SLB
SLE
SLV
SOM
SRBSTP
SVK
SVN
SWE
SWZ
SYC
SYR
TCD
TGO
THA
TJK
TKM
TMP
TON TTOTUNTUR
TWN
TZA
UGAUKR
URYUSA
UZBVEN
VNM
VUTWSM
YEM
ZAF
ZAR
ZMB
ZWE
-2-1
01
23
WG
I C
on
tro
l of C
orr
up
tion
Sco
re 2
01
0
0 2 4 6 8 10CPI score 2010
95% CI Fitted Values
Correlation Between WGI and CPI Scores in 2010
6
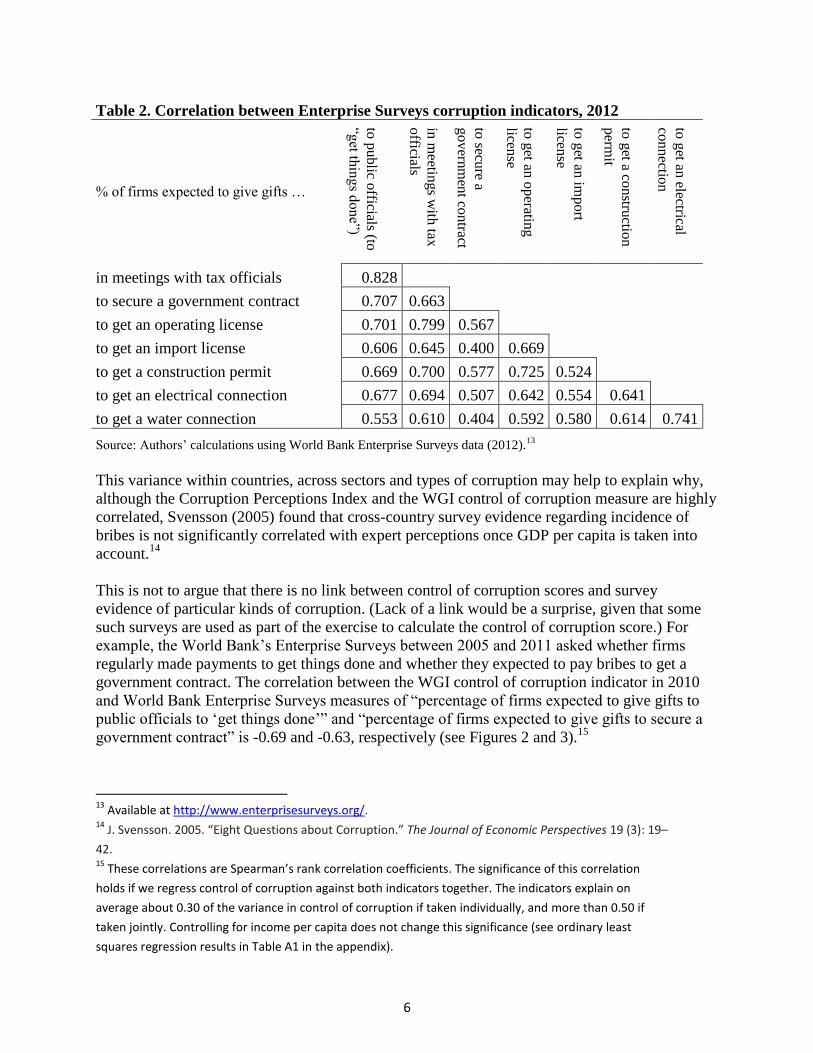
Table 2. Correlation between Enterprise Surveys corruption indicators, 2012
% of firms expected to give gifts …
to p
ublic o
fficials (to
“get th
ing
s do
ne”)
in m
eetings w
ith tax
officials
to secu
re a
go
vern
men
t con
tract
to g
et an o
peratin
g
license
to g
et an im
po
rt
license
to g
et a con
structio
n
perm
it
to g
et an electrical
con
nectio
n
in meetings with tax officials 0.828
to secure a government contract 0.707 0.663
to get an operating license 0.701 0.799 0.567
to get an import license 0.606 0.645 0.400 0.669
to get a construction permit 0.669 0.700 0.577 0.725 0.524
to get an electrical connection 0.677 0.694 0.507 0.642 0.554 0.641
to get a water connection 0.553 0.610 0.404 0.592 0.580 0.614 0.741
Source: Authors’ calculations using World Bank Enterprise Surveys data (2012).13
This variance within countries, across sectors and types of corruption may help to explain why,
although the Corruption Perceptions Index and the WGI control of corruption measure are highly
correlated, Svensson (2005) found that cross-country survey evidence regarding incidence of
bribes is not significantly correlated with expert perceptions once GDP per capita is taken into
account.14
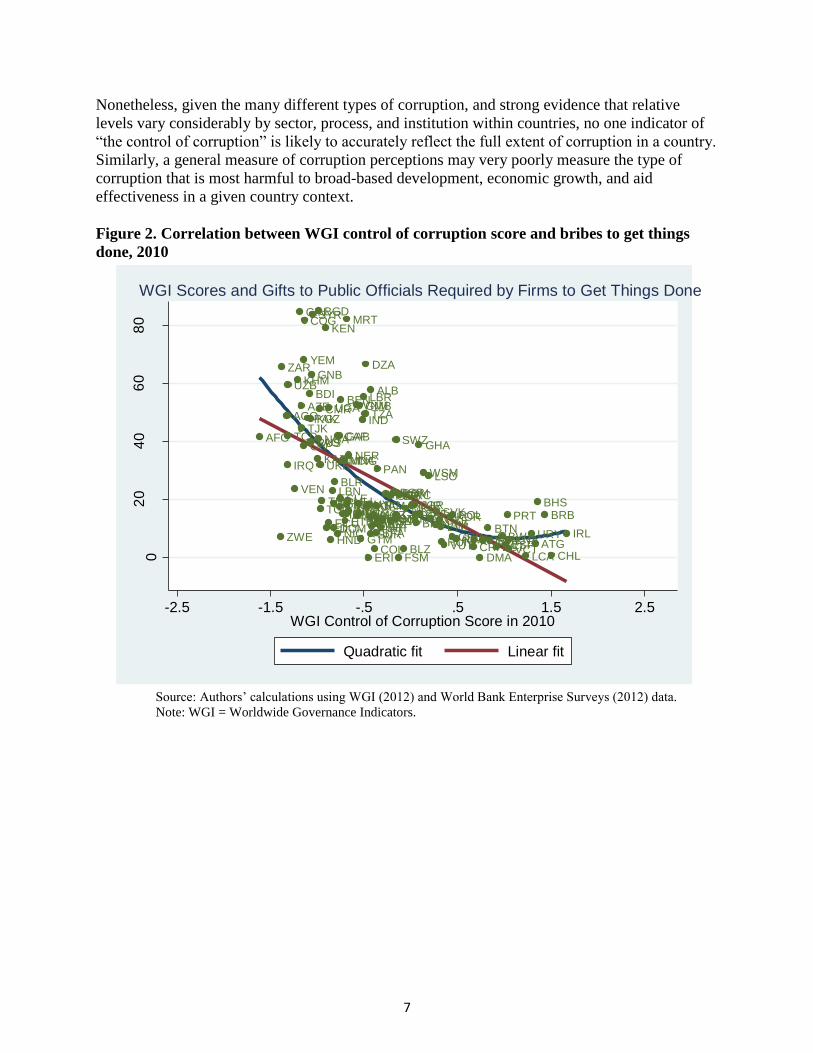
This is not to argue that there is no link between control of corruption scores and survey
evidence of particular kinds of corruption. (Lack of a link would be a surprise, given that some
such surveys are used as part of the exercise to calculate the control of corruption score.) For
example, the World Bank’s Enterprise Surveys between 2005 and 2011 asked whether firms
regularly made payments to get things done and whether they expected to pay bribes to get a
government contract. The correlation between the WGI control of corruption indicator in 2010
and World Bank Enterprise Surveys measures of “percentage of firms expected to give gifts to
public officials to ‘get things done’” and “percentage of firms expected to give gifts to secure a
government contract” is -0.69 and -0.63, respectively (see Figures 2 and 3).15
13
Available at http://www.enterprisesurveys.org/. 14
J. Svensson. 2005. “Eight Questions about Corruption.” The Journal of Economic Perspectives 19 (3): 19–
42. 15
These correlations are Spearman’s rank correlation coefficients. The significance of this correlation
holds if we regress control of corruption against both indicators together. The indicators explain on
average about 0.30 of the variance in control of corruption if taken individually, and more than 0.50 if
taken jointly. Controlling for income per capita does not change this significance (see ordinary least
squares regression results in Table A1 in the appendix).
7
Nonetheless, given the many different types of corruption, and strong evidence that relative
levels vary considerably by sector, process, and institution within countries, no one indicator of
“the control of corruption” is likely to accurately reflect the full extent of corruption in a country.
Similarly, a general measure of corruption perceptions may very poorly measure the type of
corruption that is most harmful to broad-based development, economic growth, and aid
effectiveness in a given country context.
Figure 2. Correlation between WGI control of corruption score and bribes to get things
done, 2010
Source: Authors’ calculations using WGI (2012) and World Bank Enterprise Surveys (2012) data.
Note: WGI = Worldwide Governance Indicators.
AFG
AGO
ALB
ARGARM
ATG
AZEBDI
BEN
BFA
BGD
BGRBHS
BIH
BLR
BLZ
BOL
BRABRB
BTNBWA
CAF
CHL
CIV
CMR
COG
COLCPV
CRI
CZE
DMA
DOM
DZA
ECUEGY
ERIESPEST
ETHFJI
FSM
GAB
GEO
GHA
GIN
GMB
GNB
GRC
GRDGTM
GUY
HND
HRV
HUN
IDN
IND
IRL
IRQ
JAM JOR
KAZ
KEN
KGZ
KHM
KNA
KOR
LAO
LBN
LBR
LCA
LKA
LSO
LTULVAMAR
MDA
MDG
MEX
MKDMLI
MNG
MOZ
MRT
MUS
MWI NAM
NER
NGA
NIC
NPL
PAK
PAN
PERPHL
POL PRTPRY
ROM
RUS
RWA
SENSLE
SLV
SRB
SUR
SVK
SVN
SWZ
SYR
TCD
TGO
TJK
TMP
TONTTOTUR
TZAUGA
UKR
URY
UZB
VCT
VEN
VNM
VUT
WBG
WSM
YEM
ZAF
ZAR
ZMB
ZWE
02
04
06
08
0
% G
ifts
to
get th
ings d
one
-2.5 -1.5 -.5 .5 1.5 2.5WGI Control of Corruption Score in 2010
Quadratic fit Linear fit
WGI Scores and Gifts to Public Officials Required by Firms to Get Things Done

8
Figure 3. WGI control of corruption score and bribes for contracts, 2010
Source: Authors’ calculations using WGI (2012) and World Bank Enterprise Surveys (2012) data.
Note: WGI = Worldwide Governance Indicators.
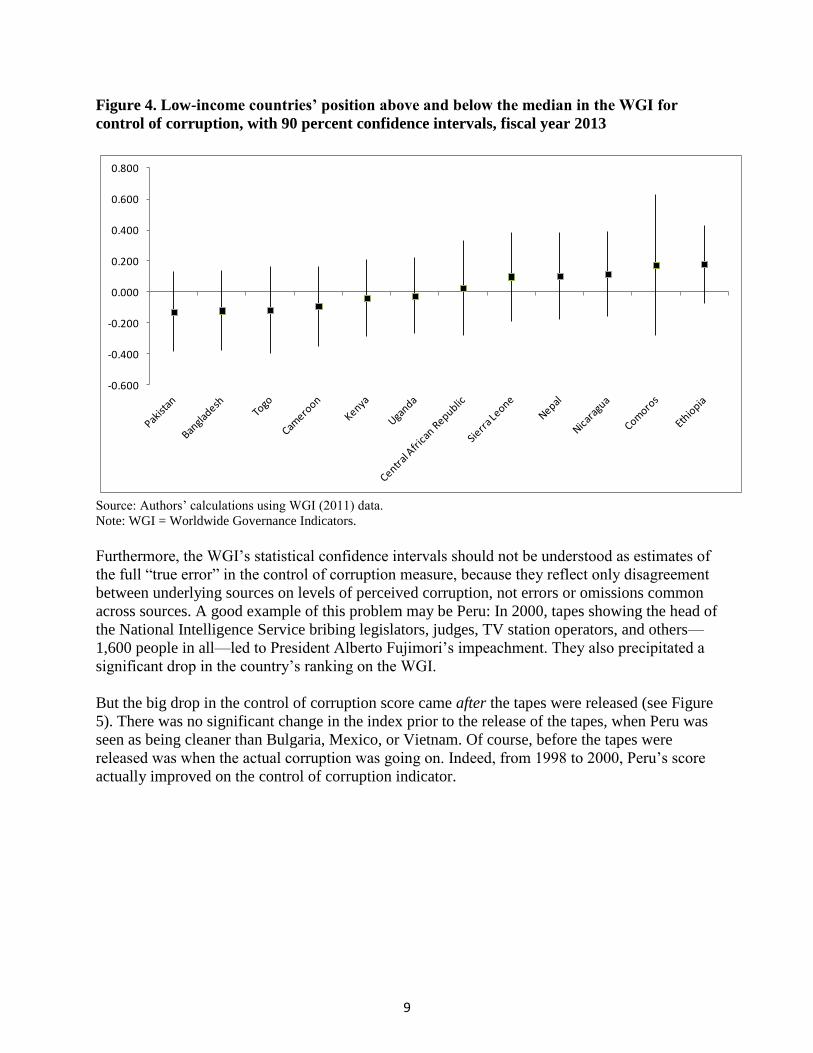
In an important and transparent effort to illustrate and advertise the variance across measures
within its source data, the WGI team provides confidence intervals around all of its estimates,
reflecting the level of divergence between underlying sources as to levels of corruption in a
country. Figure 4 plots normalized FY2013 control of corruption scores, with the 90 percent
confidence intervals for selected low-income countries around the median. The Central African
Republic is the lowest-scoring country that passes the MCC’s corruption hard hurdle, while
Uganda is the highest-scoring country that fails.
The confidence intervals are sufficiently wide to encompass not only the passing score of zero
but also the scores of all the other countries in the graph. However, the MCC’s ranking system
deems six countries to have sufficiently good corruption levels to deserve passing the control of
corruption indicator and six too corrupt to warrant consideration. It is also worth noting that the
lower-bound confidence interval of all of these countries does not rise above the median score
for the low-income country category.
AFG
AGO
ALB
ARG
ARM ATG
AZE
BDI
BEN
BFA
BGD
BGRBHSBIH
BLR
BLZ
BOL
BRABRB
BTN
BWA
CAF
CHL
CIV
CMR
COG
COL
CPVCRI
CZE
DMA
DOM
DZA
ECU
EGY
ERIESP
EST
ETH
FJIFSM
GAB
GEO
GHA
GIN
GMB
GNB
GRC
GRDGTM
GUY
HND
HRVHUN
IDN
IND
IRL
IRQ
JAM JOR
KAZ
KEN
KGZ
KHM
KNA
KOR
LBN
LBR
LCA
LKA LSOLTU
LVA
MAR
MDA
MDG
MEX
MKD
MLI
MNG
MOZ
MRT
MUS
MWINAM
NERNGA
NIC
NPL
PAK
PER
PHL
POL
PRT
PRY
ROM
RUS
RWA
SENSLE
SLVSRB
SUR
SVK
SVN
SWZ
SYR
TCD
TGO
TJK
TMP
TON
TTO
TUR
TZAUGA
UKR
URY
UZB
VCT
VEN
VNM
VUTWBG
WSM
YEM
ZAF
ZAR
ZMB
ZWE
02
04
06
08
01
00
% G
ifts
to
se
cu
re c
on
tra
ct
-2.5 -1.5 -.5 .5 1.5 2.5WGI Control of Corruption Score in 2010
Quadratic fit Linear fit
WGI Scores and Gifts to Public Officials to Secure Government Contract
9
Figure 4. Low-income countries’ position above and below the median in the WGI for
control of corruption, with 90 percent confidence intervals, fiscal year 2013
-0.600
-0.400
-0.200
0.000
0.200
0.400
0.600
0.800
Source: Authors’ calculations using WGI (2011) data.
Note: WGI = Worldwide Governance Indicators.
Furthermore, the WGI’s statistical confidence intervals should not be understood as estimates of
the full “true error” in the control of corruption measure, because they reflect only disagreement
between underlying sources on levels of perceived corruption, not errors or omissions common
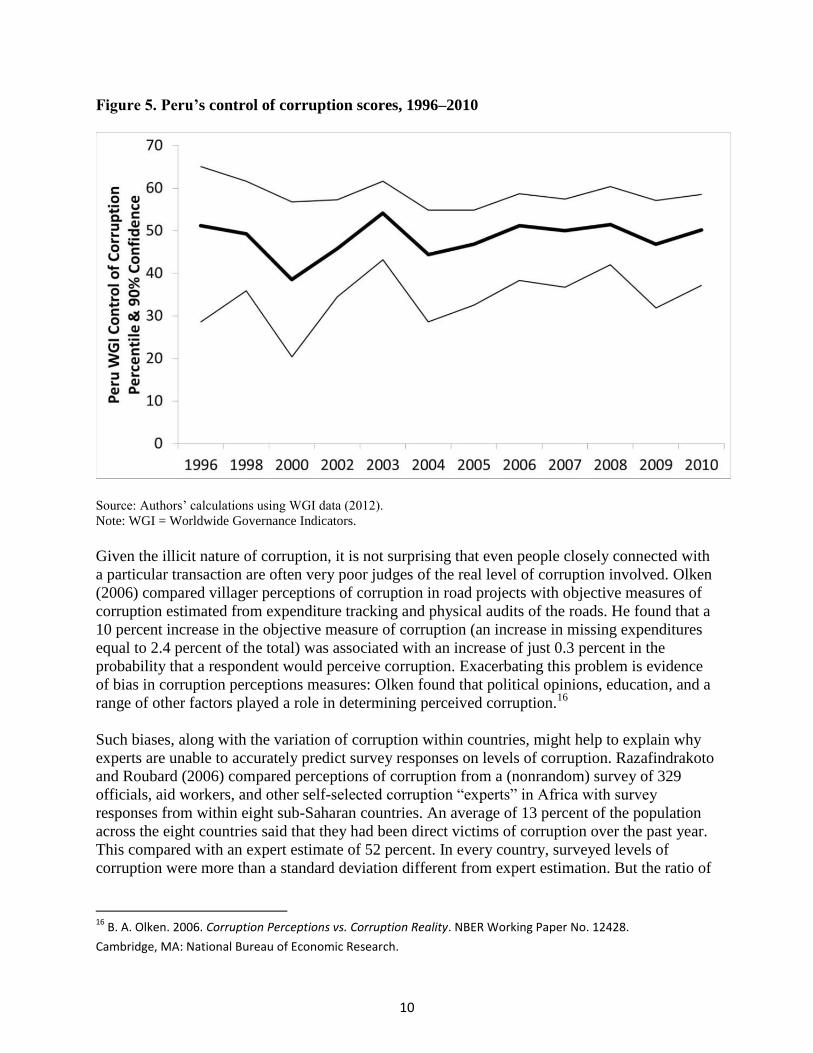
across sources. A good example of this problem may be Peru: In 2000, tapes showing the head of
the National Intelligence Service bribing legislators, judges, TV station operators, and others—
1,600 people in all—led to President Alberto Fujimori’s impeachment. They also precipitated a
significant drop in the country’s ranking on the WGI.
But the big drop in the control of corruption score came after the tapes were released (see Figure
5). There was no significant change in the index prior to the release of the tapes, when Peru was
seen as being cleaner than Bulgaria, Mexico, or Vietnam. Of course, before the tapes were
released was when the actual corruption was going on. Indeed, from 1998 to 2000, Peru’s score
actually improved on the control of corruption indicator.
10
Figure 5. Peru’s control of corruption scores, 1996–2010
Source: Authors’ calculations using WGI data (2012).
Note: WGI = Worldwide Governance Indicators.
Given the illicit nature of corruption, it is not surprising that even people closely connected with
a particular transaction are often very poor judges of the real level of corruption involved. Olken
(2006) compared villager perceptions of corruption in road projects with objective measures of
corruption estimated from expenditure tracking and physical audits of the roads. He found that a
10 percent increase in the objective measure of corruption (an increase in missing expenditures
equal to 2.4 percent of the total) was associated with an increase of just 0.3 percent in the
probability that a respondent would perceive corruption. Exacerbating this problem is evidence
of bias in corruption perceptions measures: Olken found that political opinions, education, and a
range of other factors played a role in determining perceived corruption.16
Such biases, along with the variation of corruption within countries, might help to explain why
experts are unable to accurately predict survey responses on levels of corruption. Razafindrakoto
and Roubard (2006) compared perceptions of corruption from a (nonrandom) survey of 329
officials, aid workers, and other self-selected corruption “experts” in Africa with survey
responses from within eight sub-Saharan countries. An average of 13 percent of the population
across the eight countries said that they had been direct victims of corruption over the past year.
This compared with an expert estimate of 52 percent. In every country, surveyed levels of
corruption were more than a standard deviation different from expert estimation. But the ratio of
16
B. A. Olken. 2006. Corruption Perceptions vs. Corruption Reality. NBER Working Paper No. 12428.
Cambridge, MA: National Bureau of Economic Research.
11
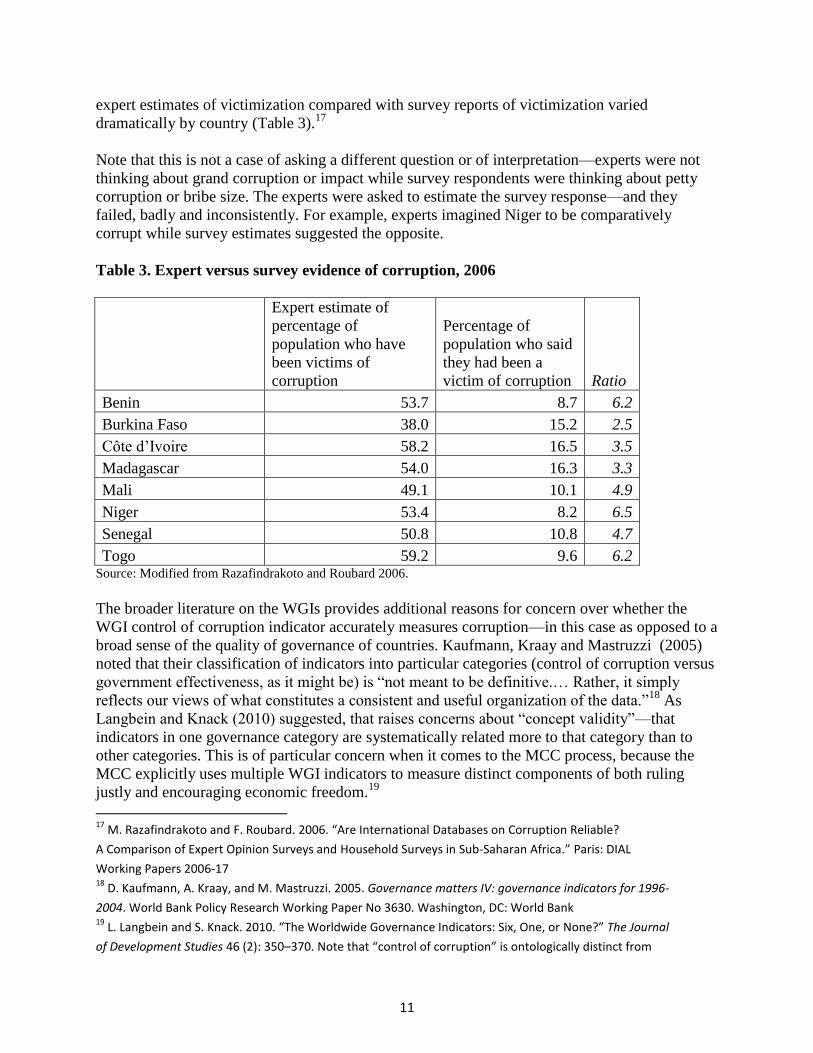
expert estimates of victimization compared with survey reports of victimization varied
dramatically by country (Table 3).17
Note that this is not a case of asking a different question or of interpretation—experts were not
thinking about grand corruption or impact while survey respondents were thinking about petty
corruption or bribe size. The experts were asked to estimate the survey response—and they
failed, badly and inconsistently. For example, experts imagined Niger to be comparatively
corrupt while survey estimates suggested the opposite.
Table 3. Expert versus survey evidence of corruption, 2006
Expert estimate of
percentage of
population who have
been victims of
corruption
Percentage of
population who said
they had been a
victim of corruption Ratio
Benin 53.7 8.7 6.2
Burkina Faso 38.0 15.2 2.5
Côte d’Ivoire 58.2 16.5 3.5
Madagascar 54.0 16.3 3.3
Mali 49.1 10.1 4.9
Niger 53.4 8.2 6.5
Senegal 50.8 10.8 4.7
Togo 59.2 9.6 6.2 Source: Modified from Razafindrakoto and Roubard 2006.
The broader literature on the WGIs provides additional reasons for concern over whether the
WGI control of corruption indicator accurately measures corruption—in this case as opposed to a
broad sense of the quality of governance of countries. Kaufmann, Kraay and Mastruzzi (2005)
noted that their classification of indicators into particular categories (control of corruption versus
government effectiveness, as it might be) is “not meant to be definitive.… Rather, it simply
reflects our views of what constitutes a consistent and useful organization of the data.”18
As
Langbein and Knack (2010) suggested, that raises concerns about “concept validity”—that
indicators in one governance category are systematically related more to that category than to
other categories. This is of particular concern when it comes to the MCC process, because the
MCC explicitly uses multiple WGI indicators to measure distinct components of both ruling
justly and encouraging economic freedom.19
17
M. Razafindrakoto and F. Roubard. 2006. “Are International Databases on Corruption Reliable?
A Comparison of Expert Opinion Surveys and Household Surveys in Sub‐Saharan Africa.” Paris: DIAL
Working Papers 2006-17 18
D. Kaufmann, A. Kraay, and M. Mastruzzi. 2005. Governance matters IV: governance indicators for 1996-
2004. World Bank Policy Research Working Paper No 3630. Washington, DC: World Bank 19
L. Langbein and S. Knack. 2010. “The Worldwide Governance Indicators: Six, One, or None?” The Journal
of Development Studies 46 (2): 350–370. Note that “control of corruption” is ontologically distinct from
12
The issue of how clearly distinct the different category classifications are, in both the WGI and
the MCC, can be illustrated by looking at the case of the Freedom House civil liberties indicator,
which is a source for both the WGI and (independently) the MCC (see Figure 6).
Freedom House suggests that civil liberties are reflected in free expression, organizational rights,
rule of law, and “personal autonomy,” which includes things like property rights and the business
environment. The WGI uses this measure exclusively in its calculations of its voice and
accountability measure. This despite Freedom House’s civil liberties concerns with rule of law,
which might make it a contender for a spot in WGI’s own rule of law category, for example.
Further, Freedom House includes a concern with property rights and the business environment in
its measure of personal autonomy, which suggests that this measure has some bearing on WGI’s
regulatory quality indicator and (therefore) on the MCC’s basket on encouraging economic
freedom.
It is natural to expect rule of law or civil liberties or regulatory quality to be overlapping
concepts. Similarly, control of corruption is linked with regulatory quality, voice and
accountability, and government effectiveness. But that they are complex and overlapping
concepts being measured with some error raises the concern that the indicators are not in fact
able to significantly distinguish differences between the underlying country-level reality related
to each concept (if there is one “underlying country-level reality” in the first place).
“child mortality” as an indicator. Child mortality is the proportion of children who die out of all children
alive over a given period. It relates to a particular, distinct, and well defined-phenomenon (death) of a
particular, distinct, and well-defined group (children). Control of corruption is about an undelineated and
unmeasured set of actions (accountancy, policing, civil society organization oversight, and the like) around
a loosely defined concept (corruption). It is plausible to imagine measuring child mortality precisely, with
effectively no argument over the resulting statistic as a measure of what it seeks to describe. The same is
completely untrue of control of corruption. Still, it should be noted that the charge of “fuzzy
measurement of a fuzzy concept” could be leveled at many other MCC indicators—indeed at the
considerable majority of indicators in both the ruling justly and economic freedom categories. It would be
worth examining what proportion of annual changes in country compact eligibility as a whole are driven
by statistically insignificant changes in such underlying indicators, but that is beyond the scope of this
paper.

13
Figure 6. Sources of MCC indicators
Source: Authors’ calculations.
Notes: MCC = Millennium Challenge Corporation; WGI = Worldwide Governance Indicators.
Existing literature, including studies by Thomas (2009)20
and Langbein and Knack (2010),21
has
raised these category issues as a concern. These authors note that the WGI indicators may be
collectively measuring only one (or at most two) distinct underlying concepts. This idea is
reflected in a very high correlation between the various WGI components. The indicators for
control of corruption and rule of law, those for control of corruption and government
effectiveness, and those for rule of law and government effectiveness are correlated at 0.95,
20
M. A. Thomas. 2009. “What Do the Worldwide Governance Indicators Measure?” European Journal of Development Research 22 (1): 31–54. 21
Langbein and Knack (2010) performed factor analysis and concluded that all six WGI indicators correlate with the first factor with loadings over 75. A variation on the same approach was provided by M. Knoll and P. Zloczysti (2011, The good governance indicators of the millennium challenge account: How many dimensions are really being measured? World Development 40.5: 900-915.), who suggested that all six good governance indicators in previous versions of the Millennium Challenge Account scorecard (four from the WGI and two from Freedom House) can be boiled down to measuring two dimensions: “participation” and “overall quality of governance.” Following a similar approach to that of Langbein and Knack (2010), Tables 4–6 show the results from a factor analysis of the three FY2012 “ruling justly” WGI indicators in 2010 across all countries with data. Results suggest that all of the WGI indicators used by the MCC in this category measure essentially the same thing. Together, they represent one dimension, as evidenced by a single eigenvalue greater than 1 (which measures the amount of variance each factor accounts for) and a strong internal consistency among the indicators (captured by an alpha coefficient greater than or equal to 0.70).
14
while the indicators for government effectiveness and regulatory quality are correlated at 0.96,
according to Thomas (2010).
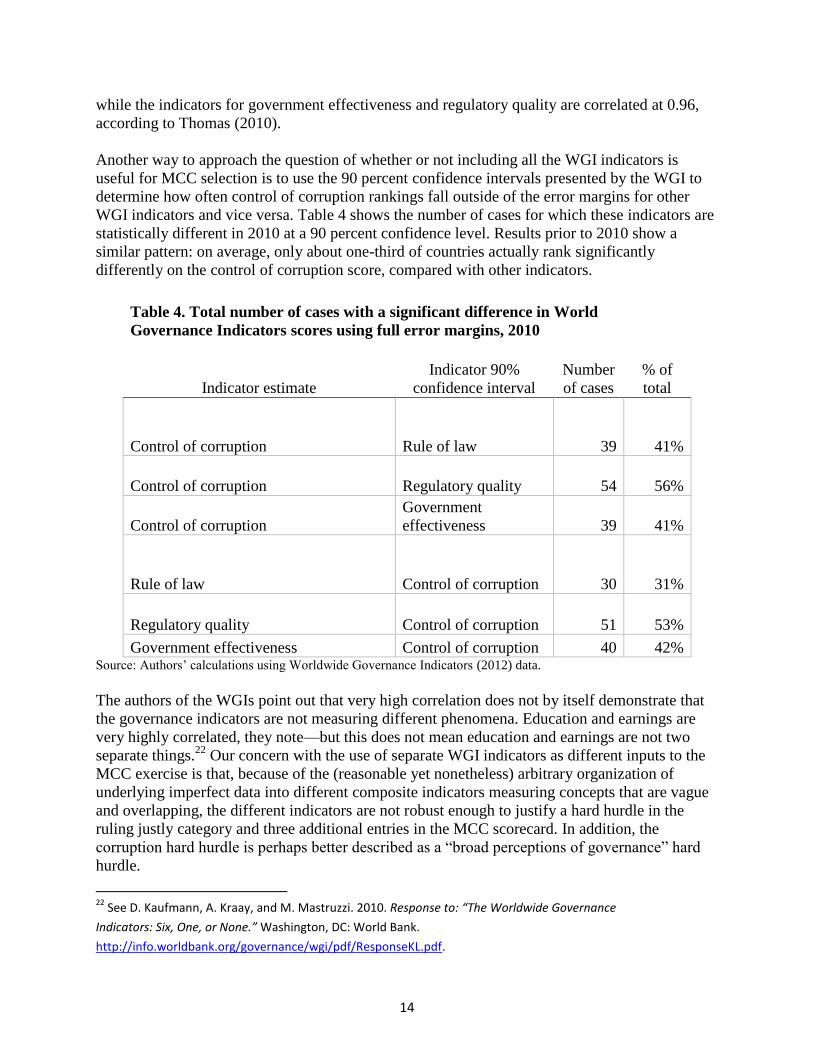
Another way to approach the question of whether or not including all the WGI indicators is
useful for MCC selection is to use the 90 percent confidence intervals presented by the WGI to
determine how often control of corruption rankings fall outside of the error margins for other
WGI indicators and vice versa. Table 4 shows the number of cases for which these indicators are
statistically different in 2010 at a 90 percent confidence level. Results prior to 2010 show a
similar pattern: on average, only about one-third of countries actually rank significantly
differently on the control of corruption score, compared with other indicators.
Table 4. Total number of cases with a significant difference in World
Governance Indicators scores using full error margins, 2010
Indicator estimate
Indicator 90%
confidence interval
Number
of cases
% of
total
Control of corruption Rule of law 39 41%
Control of corruption Regulatory quality 54 56%
Control of corruption
Government
effectiveness 39 41%
Rule of law Control of corruption 30 31%
Regulatory quality Control of corruption 51 53%
Government effectiveness Control of corruption 40 42% Source: Authors’ calculations using Worldwide Governance Indicators (2012) data.
The authors of the WGIs point out that very high correlation does not by itself demonstrate that
the governance indicators are not measuring different phenomena. Education and earnings are
very highly correlated, they note—but this does not mean education and earnings are not two
separate things.22
Our concern with the use of separate WGI indicators as different inputs to the
MCC exercise is that, because of the (reasonable yet nonetheless) arbitrary organization of
underlying imperfect data into different composite indicators measuring concepts that are vague
and overlapping, the different indicators are not robust enough to justify a hard hurdle in the
ruling justly category and three additional entries in the MCC scorecard. In addition, the
corruption hard hurdle is perhaps better described as a “broad perceptions of governance” hard
hurdle.
22
See D. Kaufmann, A. Kraay, and M. Mastruzzi. 2010. Response to: “The Worldwide Governance
Indicators: Six, One, or None.” Washington, DC: World Bank.
http://info.worldbank.org/governance/wgi/pdf/ResponseKL.pdf.
15
These concerns might be considered of only theoretical interest if, nonetheless, the control of
corruption measure were an important determinant of successful MCC compacts. If low control
of corruption scores strongly signaled lower subsequent development performance or less
efficient use of compact resources, the hard hurdle would be justified as a tool (1) to encourage
countries to improve their score and thereby broaden their development prospects and (2) to
avoid waste of MCC resources. In fact, however, the link between control of corruption scores
and development outcomes appears to be weaker than that.
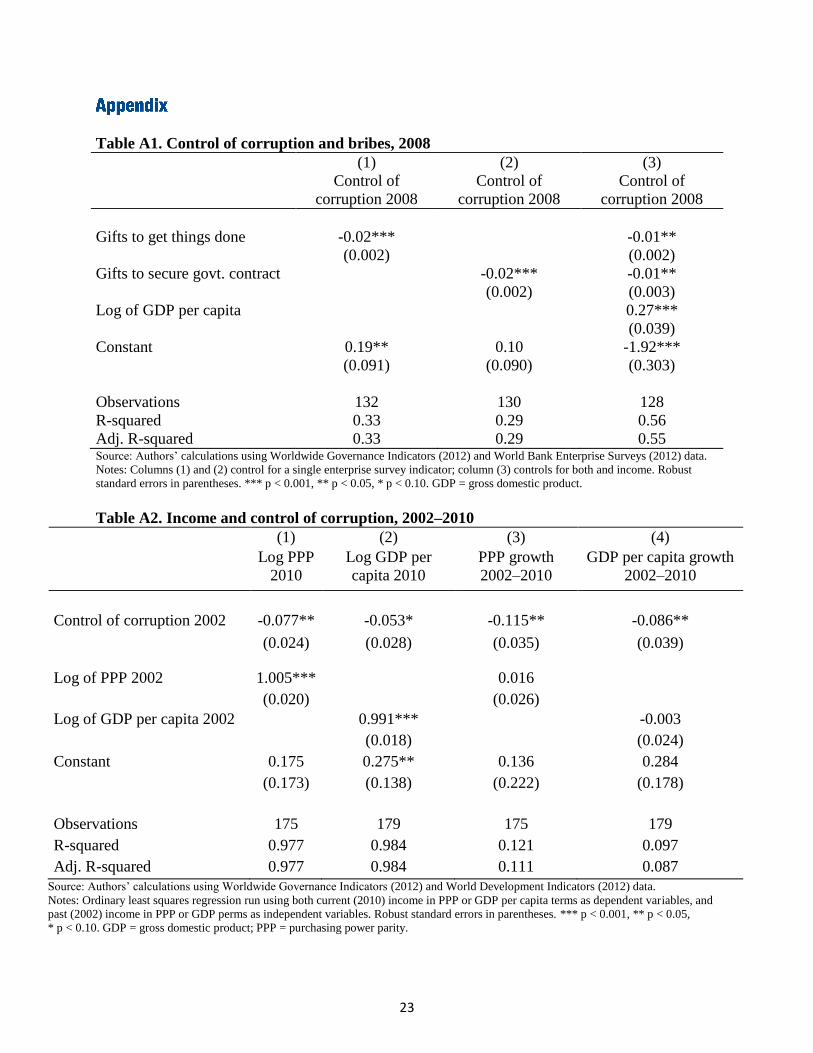
Taking a cross section of countries and comparing current income (2010) with corruption
perceptions in 2002 and income in 2002 (taken as the “start date” for the MCC), the coefficient
on corruption perceptions suggests that more corrupt countries in 2002 have higher incomes in
2010, given income levels in 2002 (see Appendix, Table A2). This relationship holds using log
of income or income per capita (in market or purchasing power parity terms). Taking only the
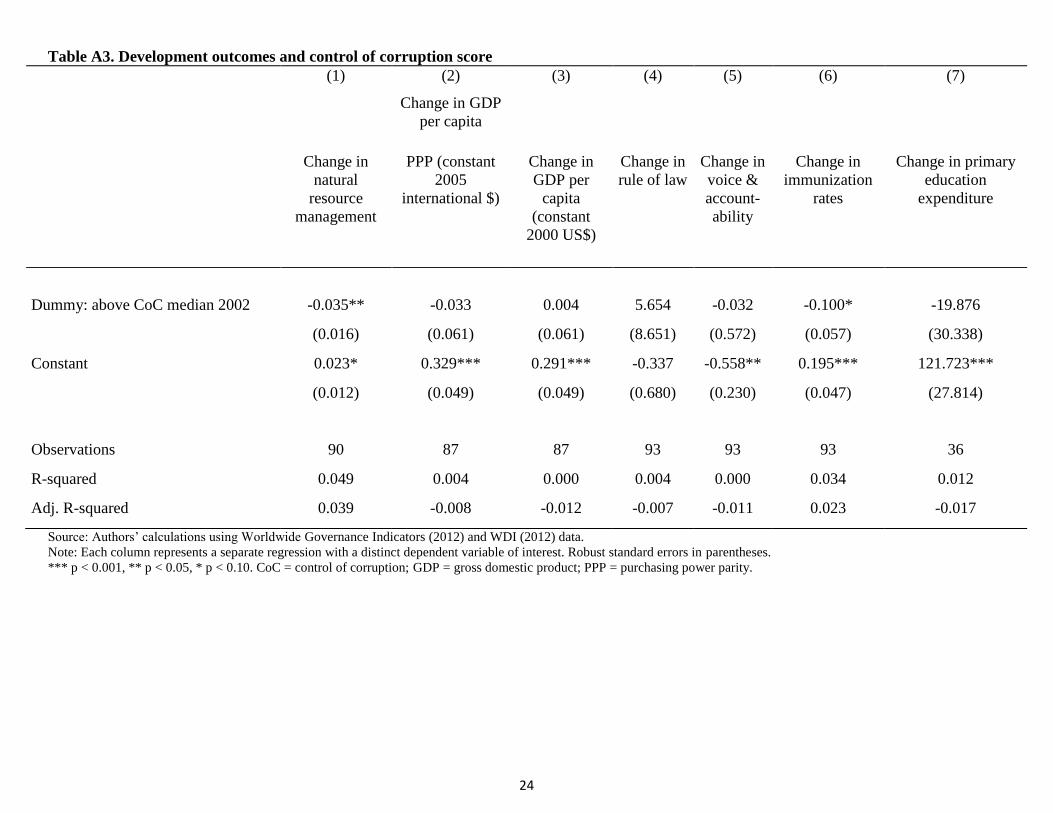
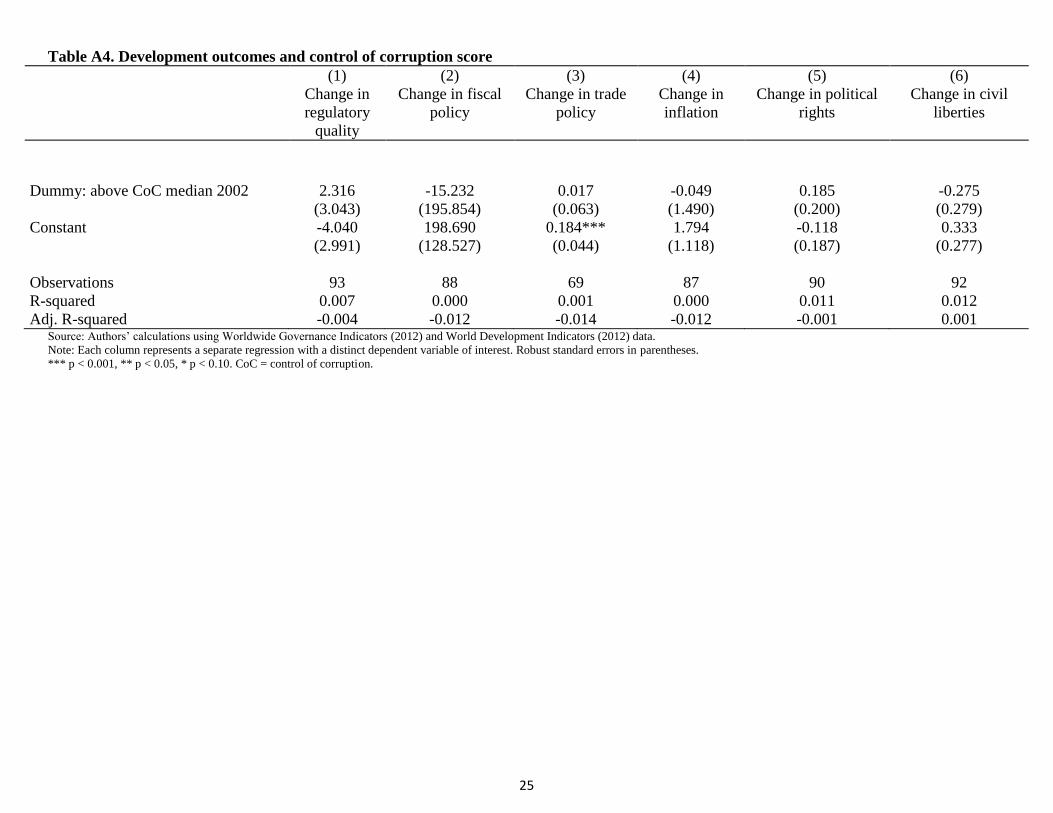
subsample of low- and lower-middle-income countries, and controlling for their control of
corruption position relative to the median, we find that being in the bottom half of the control of
corruption indicator (within a country’s given income bracket) 8 to 10 years ago does not lead to
slower improvement in income per capita growth or the improvement of other MCC
development indicators. The coefficients on a bivariate regression of development outcomes
against a dummy measuring whether or not a country was above or below its income group
median in 2002 are statistically indistinguishable from zero in all cases (see Appendix, Tables
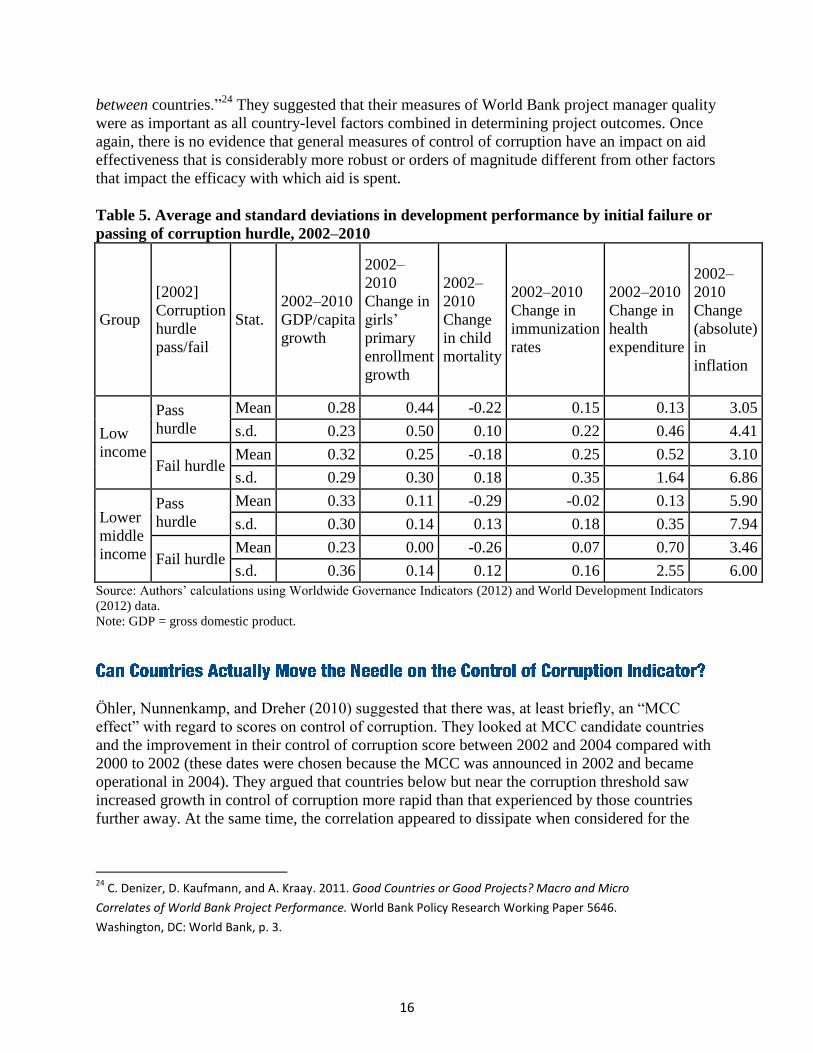
A3 and A4). Table 5 provides a descriptive illustration of this relationship.
There is of course a considerable academic literature that argues for a link between broad-based
corruption perceptions and growth (see, for example, Ugur and Dasgupta 2011).23
The results
presented here cannot stand as a convincing refutation of such a link. They do suggest, however,
that the link is at best partial and dependent on context. Weak governance as measured by a low
control of corruption score may well be a long-term barrier to growth alongside factors such as
low human capital or inadequate infrastructure. Our argument is only that there appears to be
little evidence for control of corruption as overwhelmingly important to development outcomes
in a manner that justifies its hard-hurdle status among MCC indicators as compared with a hard
hurdle for vaccination progress, gender equity, or schooling outcomes, for example.
This analysis does not address the issue of whether MCC resources in particular are likely to be
spent in a more efficient manner in countries with a higher control of corruption score. However,
recent project-level analysis suggests that country-level factors including corruption are not the
overwhelming determinant of project success or failure. Denizer, Kaufmann, and Kraay (2011)
found that overall measures of country policy and institutional strength did correlate with
improved outcomes from World Bank projects, for example, but “roughly 80 percent of the total
variation in project outcomes in our sample occurs across projects within countries, rather than
23
M. Ugur and N. Dasgupta. 2011. Evidence on the Economic Growth Impacts of Corruption in Low-Income
Countries and Beyond: A Systematic Review. London: EPPI-Centre, Social Science Research Unit, Institute
of Education, University of London.
16
between countries.”24
They suggested that their measures of World Bank project manager quality
were as important as all country-level factors combined in determining project outcomes. Once
again, there is no evidence that general measures of control of corruption have an impact on aid
effectiveness that is considerably more robust or orders of magnitude different from other factors
that impact the efficacy with which aid is spent.
Table 5. Average and standard deviations in development performance by initial failure or
passing of corruption hurdle, 2002–2010
Group
[2002]
Corruption
hurdle
pass/fail
Stat.
2002–2010
GDP/capita
growth
2002–
2010
Change in
girls’
primary
enrollment
growth
2002–
2010
Change
in child
mortality
2002–2010
Change in
immunization
rates
2002–2010
Change in
health
expenditure
2002–
2010
Change
(absolute)
in
inflation
Low
income
Pass
hurdle
Mean 0.28 0.44 -0.22 0.15 0.13 3.05
s.d. 0.23 0.50 0.10 0.22 0.46 4.41
Fail hurdle Mean 0.32 0.25 -0.18 0.25 0.52 3.10
s.d. 0.29 0.30 0.18 0.35 1.64 6.86
Lower
middle
income
Pass
hurdle
Mean 0.33 0.11 -0.29 -0.02 0.13 5.90
s.d. 0.30 0.14 0.13 0.18 0.35 7.94
Fail hurdle Mean 0.23 0.00 -0.26 0.07 0.70 3.46
s.d. 0.36 0.14 0.12 0.16 2.55 6.00
Source: Authors’ calculations using Worldwide Governance Indicators (2012) and World Development Indicators
(2012) data.
Note: GDP = gross domestic product.
Öhler, Nunnenkamp, and Dreher (2010) suggested that there was, at least briefly, an “MCC
effect” with regard to scores on control of corruption. They looked at MCC candidate countries
and the improvement in their control of corruption score between 2002 and 2004 compared with
2000 to 2002 (these dates were chosen because the MCC was announced in 2002 and became
operational in 2004). They argued that countries below but near the corruption threshold saw
increased growth in control of corruption more rapid than that experienced by those countries
further away. At the same time, the correlation appeared to dissipate when considered for the
24
C. Denizer, D. Kaufmann, and A. Kraay. 2011. Good Countries or Good Projects? Macro and Micro
Correlates of World Bank Project Performance. World Bank Policy Research Working Paper 5646.
Washington, DC: World Bank, p. 3.
17
1998–2002 and 2002–2006 periods.25
Furthermore, it appears more generally that the control of
corruption indicator is at best weakly “policy actionable” in a way that makes it a suitable tool
for inducing change among potential compact countries.
Broad-based governance indicators are, as a rule, slow to change. To take an extreme case,
Pritchett, Woolcock, and Andrews (2010) argued that it would take 600 years for Haiti to reach
Singapore’s score on the WGI government effectiveness rating by the most generous
interpretation of its rate of progress since independence.26
When combined with large uncertainty
around corruption estimates, this slow rate of change suggests that countries that have moved
into (or out of) eligibility based on their corruption ranking may have done so because of
mismeasurement rather than any underlying change in the actual level of corruption.
Kaufman, Kraay, and Mastruzzi (2013) have suggested that “changes over time in a country’s
score on the WGI reflect a combination of three factors: (1) changes in the underlying source
data, (2) the addition of new data sources for a country that are only available in the more recent
period, and (3) changes in the weights used to aggregate the individual sources. For large and
statistically significant changes over long periods of time, changes in the underlying source data
are most often the most important of these three factors.”27
Overall, they argued, “looking at changes over time over long periods such as a decade, typically
around 8 percent of countries covered will show a significant improvement or decline in the
WGI measures.”28
The two- to four-year lag present in WGI indicators (between initial
measurement of underlying data sources and publication of the WGI report covering a particular
year)29
suggests that considerably less than 8 percent of MCC countries will have seen
statistically significant changes in their control of corruption since the launch of the MCC. And
only if (1) the change is the result of changes in underlying source data rather than weights or
new data, (2) those underlying changes reflect changes in overall corruption as opposed to noise,
and (3) the change in “overall corruption” was something largely determined by policy choice at
the national level, might this small chance of statistically significant decadal change actually
reflect concerted effort by country leaders to reform.
25
H. Öhler, P. Nunnenkamp, and A. Dreher. 2010. Does Conditionality Work? A Test for an Innovative US
Aid Scheme. Kiel Working Papers 1630. Kiel, Germany: Kiel Institute for the World Economy. There are
further concerns with this work—not least that the idea of a corruption hurdle only emerged in late 2002,
giving countries remarkably little time to respond to the potential MCC policy incentive and that, in 2004,
candidate countries were actually graded on the 2002 WGI score. 26
L. Pritchett, M. Woolcock, and M. Andrews. 2010. Capability Traps? The Mechanisms of Persistent
Implementation Failure. CGD Working Paper 234. Washington, DC: Center for Global Development. 27
D. Kaufman, A. Kraay, and M. Mastruzzi. “Worldwide Governance Indicators: Frequently Asked
Questions,” World Bank, last modified 2013, http://info.worldbank.org/governance/wgi/index.aspx#faq. 28
Kaufman, Kraay, and Mastruzzi 2013. 29
The four-year lag springs from two different sources: first, the MCC scorecard for any given year uses
WGI corruption data from two years in the past; second, the WGI data actually represent survey
responses from as much as two years prior to the reporting date.
18
The slow rate of change and large margin of statistical error (leaving aside measurement error) in
the control of corruption indicator suggests that an annual updating exercise based around point
estimates captures far more noise than signal in terms of changes in perceived corruption. Over
the longer term, even were control of corruption highly responsive to policy changes, it suggests
that few countries will be able to improve their scores from statistically significantly below to
statistically significantly above a threshold line.
Looking at MCC candidate countries, Tables 6 and 7 show the countries that crossed the
corruption score threshold between 2004 and 2012. Table 6 examines countries that have passed
the median threshold in each direction between FY2004 and FY2012 using both the FY2004 and
FY2012 sample of low-income countries. Table 7 repeats the exercise but includes only
countries that have moved from a 90 percent confidence of being below (above) the median to a
90 percent confidence of being above (below) the median.

19
Table 6. Threshold crossing for Millennium Challenge Corporation corruption indicators,
standard estimates, 2004–2012
MCC
fiscal year
Income
group
Total
countries
Median
2004
Median
2012
Improving
countries Declining countries
FY2004 Low
income 75 -0.869 -0.711
Bolivia Benin
Georgia Côte D’Ivoire
Liberia Guinea
Malawi Guinea-Bissau
Niger Kyrgyzstan
Serbia Nicaragua
Solomon Islands Sierra Leone
Tanzania Timor-Leste
Zambia Togo
FY2012 Low
income 60 -0.935 -0.782
Bolivia Côte D'Ivoire
Central African
Republic Guinea
Liberia Guinea-Bissau
Malawi Kyrgyzstan
Moldova Nicaragua
Niger Pakistan
Solomon Islands Papua New Guinea
Tanzania Timor-Leste
Zambia Togo
FY2012
Lower
middle
income
30 -0.456 -0.483
El Salvador Egypt
Georgia Fiji
Marshall Islands Guyana
Tonga Kosovo
Vanuatu Syria
Source: Authors’ calculations based on data from the Worldwide Governance Indicators (WGI) control of corruption
indicator (2010). Data used for the MCC scorecard for 2004 and 2012 pertain to WGI data for 2002 and 2010, respectively.
Notes: MCC = Millennium Challenge Corporation. Corruption scores are based on a scale of -2.5 to 2.5.
20
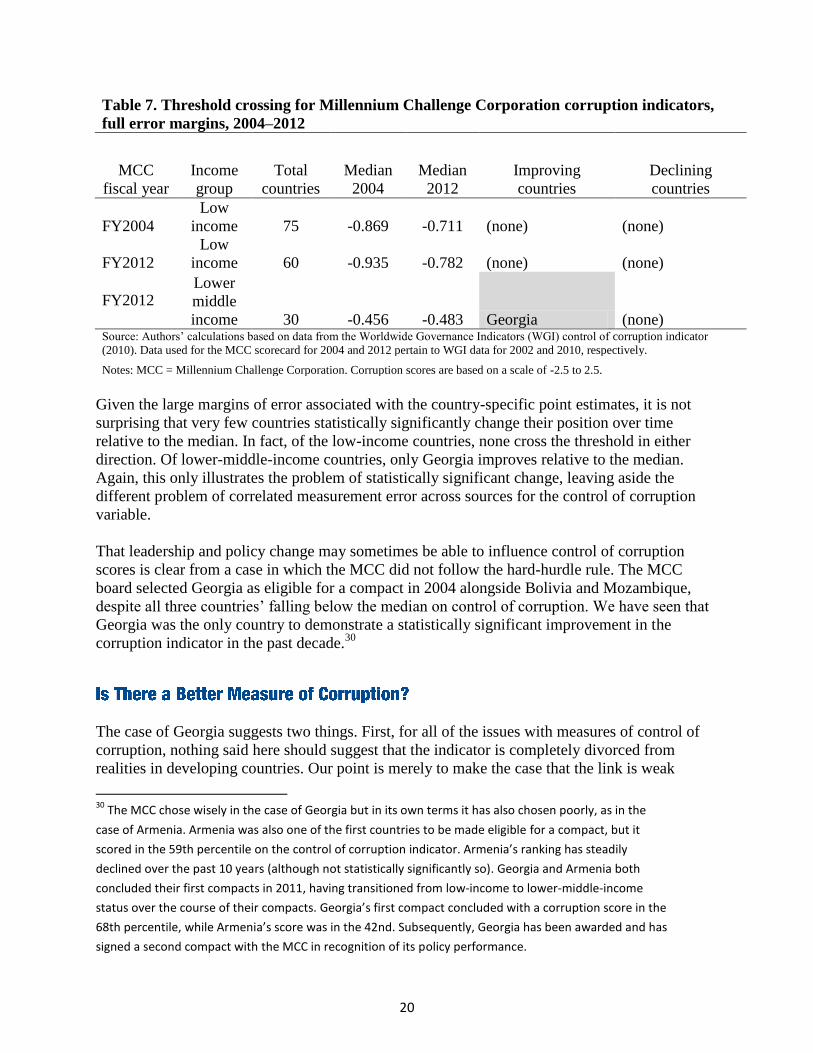
Table 7. Threshold crossing for Millennium Challenge Corporation corruption indicators,
full error margins, 2004–2012
MCC
fiscal year
Income
group
Total
countries
Median
2004
Median
2012
Improving
countries
Declining
countries
FY2004
Low
income 75 -0.869 -0.711 (none) (none)
FY2012
Low
income 60 -0.935 -0.782 (none) (none)
FY2012 Lower
middle
income 30 -0.456 -0.483 Georgia (none) Source: Authors’ calculations based on data from the Worldwide Governance Indicators (WGI) control of corruption indicator
(2010). Data used for the MCC scorecard for 2004 and 2012 pertain to WGI data for 2002 and 2010, respectively.
Notes: MCC = Millennium Challenge Corporation. Corruption scores are based on a scale of -2.5 to 2.5.
Given the large margins of error associated with the country-specific point estimates, it is not
surprising that very few countries statistically significantly change their position over time
relative to the median. In fact, of the low-income countries, none cross the threshold in either
direction. Of lower-middle-income countries, only Georgia improves relative to the median.
Again, this only illustrates the problem of statistically significant change, leaving aside the
different problem of correlated measurement error across sources for the control of corruption
variable.
That leadership and policy change may sometimes be able to influence control of corruption
scores is clear from a case in which the MCC did not follow the hard-hurdle rule. The MCC
board selected Georgia as eligible for a compact in 2004 alongside Bolivia and Mozambique,
despite all three countries’ falling below the median on control of corruption. We have seen that
Georgia was the only country to demonstrate a statistically significant improvement in the
corruption indicator in the past decade.30
The case of Georgia suggests two things. First, for all of the issues with measures of control of
corruption, nothing said here should suggest that the indicator is completely divorced from
realities in developing countries. Our point is merely to make the case that the link is weak
30
The MCC chose wisely in the case of Georgia but in its own terms it has also chosen poorly, as in the
case of Armenia. Armenia was also one of the first countries to be made eligible for a compact, but it
scored in the 59th percentile on the control of corruption indicator. Armenia’s ranking has steadily
declined over the past 10 years (although not statistically significantly so). Georgia and Armenia both
concluded their first compacts in 2011, having transitioned from low-income to lower-middle-income
status over the course of their compacts. Georgia’s first compact concluded with a corruption score in the
68th percentile, while Armenia’s score was in the 42nd. Subsequently, Georgia has been awarded and has
signed a second compact with the MCC in recognition of its policy performance.
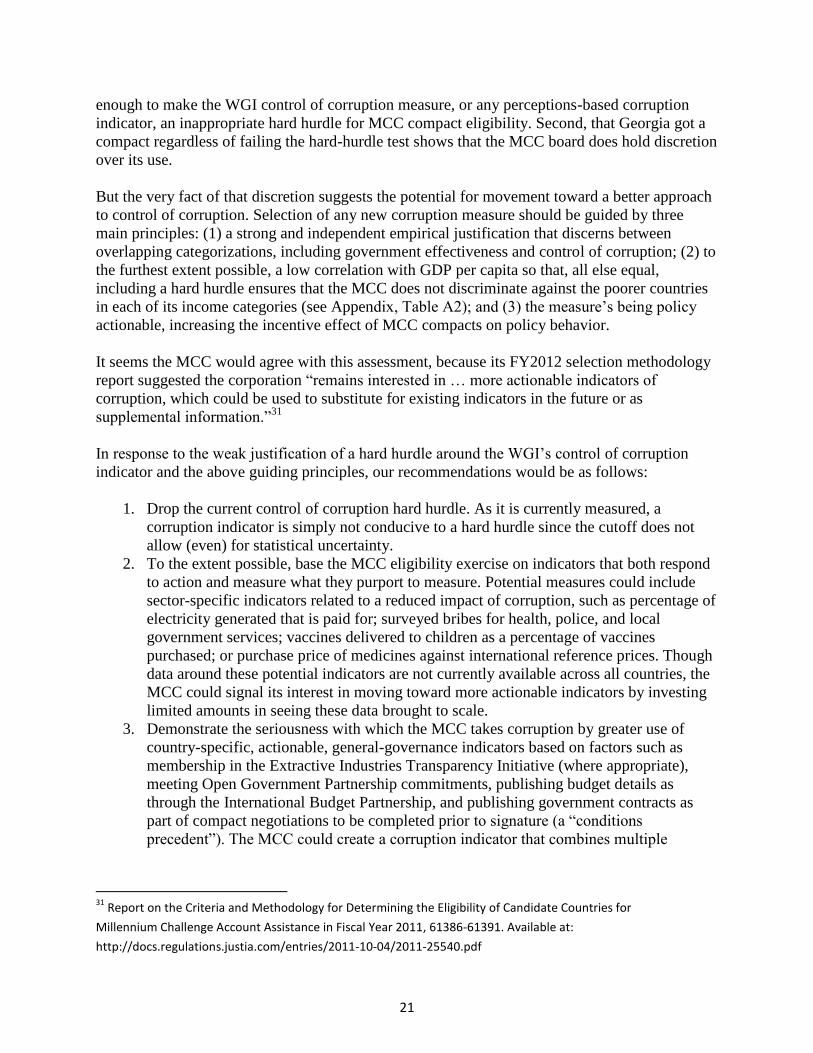
21
enough to make the WGI control of corruption measure, or any perceptions-based corruption
indicator, an inappropriate hard hurdle for MCC compact eligibility. Second, that Georgia got a
compact regardless of failing the hard-hurdle test shows that the MCC board does hold discretion
over its use.
But the very fact of that discretion suggests the potential for movement toward a better approach
to control of corruption. Selection of any new corruption measure should be guided by three
main principles: (1) a strong and independent empirical justification that discerns between
overlapping categorizations, including government effectiveness and control of corruption; (2) to
the furthest extent possible, a low correlation with GDP per capita so that, all else equal,
including a hard hurdle ensures that the MCC does not discriminate against the poorer countries
in each of its income categories (see Appendix, Table A2); and (3) the measure’s being policy
actionable, increasing the incentive effect of MCC compacts on policy behavior.
It seems the MCC would agree with this assessment, because its FY2012 selection methodology
report suggested the corporation “remains interested in … more actionable indicators of
corruption, which could be used to substitute for existing indicators in the future or as
supplemental information.”31
In response to the weak justification of a hard hurdle around the WGI’s control of corruption
indicator and the above guiding principles, our recommendations would be as follows:
1. Drop the current control of corruption hard hurdle. As it is currently measured, a
corruption indicator is simply not conducive to a hard hurdle since the cutoff does not
allow (even) for statistical uncertainty.
2. To the extent possible, base the MCC eligibility exercise on indicators that both respond
to action and measure what they purport to measure. Potential measures could include
sector-specific indicators related to a reduced impact of corruption, such as percentage of
electricity generated that is paid for; surveyed bribes for health, police, and local
government services; vaccines delivered to children as a percentage of vaccines
purchased; or purchase price of medicines against international reference prices. Though
data around these potential indicators are not currently available across all countries, the
MCC could signal its interest in moving toward more actionable indicators by investing
limited amounts in seeing these data brought to scale.
3. Demonstrate the seriousness with which the MCC takes corruption by greater use of
country-specific, actionable, general-governance indicators based on factors such as
membership in the Extractive Industries Transparency Initiative (where appropriate),
meeting Open Government Partnership commitments, publishing budget details as
through the International Budget Partnership, and publishing government contracts as
part of compact negotiations to be completed prior to signature (a “conditions
precedent”). The MCC could create a corruption indicator that combines multiple
31
Report on the Criteria and Methodology for Determining the Eligibility of Candidate Countries for
Millennium Challenge Account Assistance in Fiscal Year 2011, 61386-61391. Available at:
http://docs.regulations.justia.com/entries/2011-10-04/2011-25540.pdf

22
corruption measures into a single index, much as it has done with its indicator for gender
in the economy.
4. Make the prevalence of corruption measurement across multiple current indicators
explicit. All of the MCC’s scorecard indicators across the three categories are linked to
corruption—some explicitly so—and countries are likely to score worse on them if
corruption is acting as a serious constraint on development.
The Worldwide Governance Indicators have a valuable role in research. They are (in the opinion
of the authors) one of the best composite governance indicators available to researchers in terms
of reach and rigor. Nonetheless, even the WGIs are unsuited to the purpose of providing a hard
hurdle, especially on corruption, for the MCC. The corporation should adopt alternative
approaches to ensuring that it appropriately addresses partner countries’ and stakeholders’
concerns about corruption.
23
Table A1. Control of corruption and bribes, 2008
(1) (2) (3)
Control of
corruption 2008
Control of
corruption 2008
Control of
corruption 2008
Gifts to get things done -0.02*** -0.01**
(0.002) (0.002)
Gifts to secure govt. contract -0.02*** -0.01**
(0.002) (0.003)
Log of GDP per capita 0.27***
(0.039)
Constant 0.19** 0.10 -1.92***
(0.091) (0.090) (0.303)
Observations 132 130 128
R-squared 0.33 0.29 0.56
Adj. R-squared 0.33 0.29 0.55 Source: Authors’ calculations using Worldwide Governance Indicators (2012) and World Bank Enterprise Surveys (2012) data.
Notes: Columns (1) and (2) control for a single enterprise survey indicator; column (3) controls for both and income. Robust
standard errors in parentheses. *** p < 0.001, ** p < 0.05, * p < 0.10. GDP = gross domestic product.
Table A2. Income and control of corruption, 2002–2010
(1) (2) (3) (4)
Log PPP
2010
Log GDP per
capita 2010
PPP growth
2002–2010
GDP per capita growth
2002–2010
Control of corruption 2002 -0.077** -0.053* -0.115** -0.086**
(0.024) (0.028) (0.035) (0.039)
Log of PPP 2002 1.005*** 0.016
(0.020) (0.026)
Log of GDP per capita 2002 0.991*** -0.003
(0.018) (0.024)
Constant 0.175 0.275** 0.136 0.284
(0.173) (0.138) (0.222) (0.178)
Observations 175 179 175 179
R-squared 0.977 0.984 0.121 0.097
Adj. R-squared 0.977 0.984 0.111 0.087
Source: Authors’ calculations using Worldwide Governance Indicators (2012) and World Development Indicators (2012) data.
Notes: Ordinary least squares regression run using both current (2010) income in PPP or GDP per capita terms as dependent variables, and
past (2002) income in PPP or GDP perms as independent variables. Robust standard errors in parentheses. *** p < 0.001, ** p < 0.05,
* p < 0.10. GDP = gross domestic product; PPP = purchasing power parity.
24
Table A3. Development outcomes and control of corruption score
(1) (2) (3) (4) (5) (6) (7)
Change in GDP
per capita
Change in
natural
resource
management
PPP (constant
2005
international $)
Change in
GDP per
capita
(constant
2000 US$)
Change in
rule of law
Change in
voice &
account-
ability
Change in
immunization
rates
Change in primary
education
expenditure
Dummy: above CoC median 2002 -0.035** -0.033 0.004 5.654 -0.032 -0.100* -19.876
(0.016) (0.061) (0.061) (8.651) (0.572) (0.057) (30.338)
Constant 0.023* 0.329*** 0.291*** -0.337 -0.558** 0.195*** 121.723***
(0.012) (0.049) (0.049) (0.680) (0.230) (0.047) (27.814)
Observations 90 87 87 93 93 93 36
R-squared 0.049 0.004 0.000 0.004 0.000 0.034 0.012
Adj. R-squared 0.039 -0.008 -0.012 -0.007 -0.011 0.023 -0.017
Source: Authors’ calculations using Worldwide Governance Indicators (2012) and WDI (2012) data.
Note: Each column represents a separate regression with a distinct dependent variable of interest. Robust standard errors in parentheses.
*** p < 0.001, ** p < 0.05, * p < 0.10. CoC = control of corruption; GDP = gross domestic product; PPP = purchasing power parity.
25
Table A4. Development outcomes and control of corruption score
(1) (2) (3) (4) (5) (6)
Change in
regulatory
quality
Change in fiscal
policy
Change in trade
policy
Change in
inflation
Change in political
rights
Change in civil
liberties
Dummy: above CoC median 2002 2.316 -15.232 0.017 -0.049 0.185 -0.275
(3.043) (195.854) (0.063) (1.490) (0.200) (0.279)
Constant -4.040 198.690 0.184*** 1.794 -0.118 0.333
(2.991) (128.527) (0.044) (1.118) (0.187) (0.277)
Observations 93 88 69 87 90 92
R-squared 0.007 0.000 0.001 0.000 0.011 0.012
Adj. R-squared -0.004 -0.012 -0.014 -0.012 -0.001 0.001 Source: Authors’ calculations using Worldwide Governance Indicators (2012) and World Development Indicators (2012) data.
Note: Each column represents a separate regression with a distinct dependent variable of interest. Robust standard errors in parentheses.
*** p < 0.001, ** p < 0.05, * p < 0.10. CoC = control of corruption.