Embed Size (px)
Citation preview

Copyright
by
Lisa Nicole Havel
2014

The Dissertation Committee for Lisa Nicole Havel Certifies that this is the approved
version of the following dissertation:
Habitat selection: How sensory systems influence settlement patterns in larval red drum (Sciaenops ocellatus)
Committee:
Lee A. Fuiman, Supervisor
Alfredo F. Ojanguren
Benjamin D. Walther
Edward J. Buskey
Zhanfei Liu

Habitat selection: How sensory systems influence settlement patterns in larval red drum (Sciaenops ocellatus)
by
Lisa Nicole Havel, B.S.
Dissertation
Presented to the Faculty of the Graduate School of
The University of Texas at Austin
in Partial Fulfillment
of the Requirements
for the Degree of
Doctor of Philosophy
The University of Texas at Austin August 2014

Dedication
This work is dedicated to my parents. Since I was a little girl you have always fully
supported my scientific endeavors. Thank you for the unrelenting encouragement, and
instilling the confidence in me to never settle. I love you with all my heart.

v
Acknowledgements
I wish to thank Lee Fuiman for the opportunity to work under his supervision, and
his patience and guidance over the last six years in helping me complete this project. It
has been an incredible experience and I am truly grateful. I owe the 2008 cohort: Sarah
Wallace, Nathan McTigue, Chenan Zhang, Avier Montalvo, and Rachel Mills, as well as
Wenxian Tan, Billy Ludt, Kellie Hoppe, Candace Peyton, Katie Swanson, Colleen
McCue, Rae Mooney, Tracy Harvey, Tara Connelly, Catalina Cuellar, Philip Bucolo,
John Mohan, Kim Jackson, and Kathryn McTigue my sincerest gratitude for their
intellectual and personal support. I also want to thank my committee members, Alfredo
Ojanguren, Ben Walther, Zhanfei Liu, and Ed Buskey for their constructive feedback. I
greatly appreciate the intellectual contributions from Dennis Higgs, Kirsten Poling,
Christopher Wilson, Cindy Faulk, and Andrew Esbaugh, as well as my current and
former lab members, Shinnosuke Nakayama, Erik Oberg, Kestrel Perez, Eddie Farrell,
Sheena Stachelek, Brooke Coughlan, and Thao Vu. I want to thank Jeff Kaiser from
FAML and Robert Vega from the Coastal Conservation Association/Central Power and
Light Marine Development Center for providing red drum eggs, as well as all of the
students and staff for their assistance throughout the years. Finally, I wish to thank
UTMSI, Dr. and Mrs. John Batterton, the Port Aransas Rod and Reel Club, and the
Graduate School for support on the Lund and Recruitment Fellowship.

vi
Habitat selection: How sensory systems influence settlement patterns in larval red drum (Sciaenops ocellatus)
Lisa Nicole Havel, Ph.D.
The University of Texas at Austin, 2014
Supervisor: Lee A. Fuiman
Settlement is arguably the last stage of high mortality in the life cycle of many
marine fish species with a bipartite life cycle, making the number of larvae that settle
successfully to a benthic habitat a reasonable determinant of future population size.
Habitat selection during settlement is likely an active process, however, much of what we
know about settlement behavior comes from studies in coral reef ecosystems. This
collection of studies examined the ability of estuarine-dependent fish larvae (red drum,
Sciaenops ocellatus) to locate settlement sites based on information received from their
senses, with a focus on the different spatial scales over which larval sensory systems
operate. During the pelagic phase, red drum are exposed to elevated sound levels in the
tidal inlets. This noise caused larvae to reduce their activity in the form of fewer turns,
less time spent swimming, and a lower overall mean speed compared with silent controls.
As red drum approached settlement size, but not at earlier stages, they responded to
olfactory cues associated with seagrass beds, their primary settlement habitat. Activity
increased in the presence of lignin, a compound associated with the cell walls of vascular
plants. Also, settlement-size larvae spent more time in water masses taken from seagrass

vii
beds compared to control sea water, implying a preference for olfactory cues associated
with estuaries. While settlement and post-settlement-size larvae positioned themselves
near the benthos regardless of water column height or substrate color, pre-settlement
larvae moved away from yellow and green (associated with the estuary) but not black
(associated with a deep water column) benthic colors. Additionally, red drum larvae
settled to seagrass and sand at a smaller size than they did to oyster shells, and they
delayed settlement when a suitable benthic habitat was not available. These findings can
be interpreted as evidence for an estuarine-dependent species taking advantage of cues
available to multiple sensory systems in order to actively locate settlement habitats.

viii
Table of Contents
List of Tables ...........................................................................................................x
List of Figures ....................................................................................................... xii
Chapter 1: General Introduction ..............................................................................1
Chapter 2: Effects of acoustic noise on activity of larval and juvenile red drum (Sciaenops ocellatus) ......................................................................................8 ABSTRACT ....................................................................................................8 INTRODUCTION ..........................................................................................9 METHODS ...................................................................................................11 RESULTS .....................................................................................................23 DISCUSSION ...............................................................................................26
Chapter 3: Settlement-size larval red drum (Sciaenops ocellatus) respond to estuarine chemical cues ................................................................................................45 ABSTRACT ..................................................................................................45 INTRODUCTION ........................................................................................46 METHODS ...................................................................................................49 RESULTS .....................................................................................................59 DISCUSSION ...............................................................................................61
Chapter 4: Depth preference in settling red drum (Sciaenops ocellatus) larvae in relation to benthic habitat color and water column depth .............................72 ABSTRACT ..................................................................................................72 INTRODUCTION ........................................................................................73 METHODS ...................................................................................................75 RESULTS .....................................................................................................79 DISCUSSION ...............................................................................................81
Chapter 5: Benthic habitat quality can delay settlement in a subtropical estuarine fish (Sciaenops ocellatus) ....................................................................................91 ABSTRACT ..................................................................................................91 INTRODUCTION ........................................................................................92

ix
METHODS ...................................................................................................95 RESULTS ...................................................................................................102 DISCUSSION .............................................................................................104
Chapter 6: Conclusions ........................................................................................116
References ............................................................................................................120
Vita 141

x
List of Tables
Table 3.1. Results of the taxis experiment. Mean percentage of time (± SE) in the
‘treatment’, ‘negative control’, and ‘no decision’ areas of the Y-maze for
each size class. (n) represents negative control and (c) represents
control. * indicates significantly less times spent in the no decision area;
† indicates significantly more time spent in a treatment area compared
with the control. ................................................................................68
Table 4.1. Significance of pairwise tests for differences in mean distance from the
bottom (cm) as a function of water-column depth and substrate color for
pre-settlement-, settlement-, and post-settlement-size red drum. (s), and
(d) represent shallower and deeper water columns, and (B), (G), and (S)
represent black, green, and sand substrate colors, respectively. Bold
indicates significant difference according to sequential Bonferroni
correction. .........................................................................................86
Table 4.2. Mean distance from the bottom (cm ± SD) for pre-settlement-, settlement-,
and post-settlement-size red drum in shallower (s) and deeper (d) water
columns over green (G), sand (S), and black (B) substrates. ............87
Table 4.3. Differences in activity (SD of mean distance from bottom) as a function of
water-column depth and substrate color for pre-settlement-, settlement-,
and post-settlement-size red drum. (s) and (d) represent shallower and
deeper water columns, and (B), (G), and (S) represent black, green, and
sand substrate colors, respectively. Bold indicates significant difference
according to sequential Bonferroni correction. .................................88

xi
Table 4.4. Mean activity (cm ± SD) for pre-settlement, settlement-, and post-
settlement-size red drum in shallower (s) and deeper (d) water columns
over green (G), sand (S), and black (B) substrates. ..........................89

xii
List of Figures
Fig. 2.1. Schematic diagram (lateral view) of behavioral testing tank (large testing
chamber). See text for details. ..........................................................32
Fig. 2.2. Continuous 3-dimensional sound field for the 500-Hz tone in the large
testing chamber for the (a) low, (b) medium, (c) medium-high, and (d)
high treatments. Speaker is positioned at the top left of each chamber,
and the camera is positioned facing from the right. See text for details.
...........................................................................................................33
Fig. 2.3. Sound levels for four tone treatments in the (a) small testing chamber and
(b) large testing chamber. Letters above each box indicate significant
differences (P < 0.05) between treatments. Sound level in the small
chamber was significantly different from that in the large chamber for all
treatments. Median amplitude and the first and third quartiles
represented by the box, whiskers are 1.5 times the interquartile range,
and closed circles represent outliers. ................................................34
Fig. 2.4. Effect of (a) fish size and (b) sound amplitude on number of turns during
routine swimming. Closed circles represent individuals in the white
noise treatment; open circles represent individuals in the 500-Hz tone
treatment. In (b), median number of turns and first and third quartiles
are represented by the box; whiskers are 1.5 times the interquartile
range. .................................................................................................35

xiii
Fig. 2.5. Effect of (a) fish size and (b) sound amplitude on number of pauses during
routine swimming. In (b), median number of stops and first and third
quartiles are represented by the box, whiskers are 1.5 times the
interquartile range, and closed circles represent outliers. .................36
Fig. 2.6. Effect of (a) fish size and (b) sound amplitude on mean speed during routine
swimming. In (b), median mean speed and first and third quartiles are
represented by the box, whiskers are 1.5 times the interquartile range,
and closed circles represent outliers. ................................................37
Fig. 2.7. Effect of (a) fish size and (b) sound amplitude on activity during routine
swimming. In (b), median average activity and first and third quartiles
are represented by the box, whiskers are 1.5 times the interquartile
range. .................................................................................................38
Fig. 2.8. Effect of median sound amplitude experienced on number of turns at four
sound amplitude levels. Significant effects occurred at the medium (b, P
< 0.05) and medium-high (c, P < 0.01) sound amplitude levels. Slopes
are linear regressions and shaded region show 95% confidence interval.
...........................................................................................................39
Fig. 2.9. Effect of median sound amplitude experienced on number of pauses at four
sound amplitude levels. Significant effects occurred at the medium (b, P
< 0.05) and medium-high (c, P < 0.01) sound amplitude levels. Slopes
are linear regressions and shaded region show 95% confidence interval.
...........................................................................................................40

xiv
Fig. 2.10. Effect of median sound amplitude experienced on mean speed at four
sound amplitude levels. Significant effects occurred at the medium (b, P
< 0.001) and medium-high (c, P < 0.001) sound amplitude levels. Slopes
are linear regressions and shaded region show 95% confidence interval.
...........................................................................................................41
Fig. 2.11. (a) Number of turns and (b) number of stops did not change over median
amplitude experienced when the medium (l), medium-high (p), and
high (n) were combined (P > 0.05), but the (c) mean speed decreased
with an increase in median amplitude (P < 0.01). Slope is a linear
regression and the shaded region is the 95% confidence interval. ...42
Fig. 2.12. Reactive distance as a function of the reactive angle for red drum larvae
successfully capturing Artemia prey. ................................................43
Fig. 2.13. Audiogram for red drum (n = 44) ranging from 15 to 25.5 mm SL. Closed
circles indicate mean values with SE error bars. Dashed lines represent
the maximum and minimum thresholds for each frequency tested. The
mean threshold for red drum at 500 Hz is147.9 dB re 1μPa ±1.14 SE, n
= 12. ..................................................................................................44
Fig. 3.1. Results from kinesis experiment. Swimming speed for larva spanning a
range of sizes in (a) flood tide, (b) ebb tide, (c) control, (d) lignin, (e)
tannic acid, and (f) seagrass water. Black points and regression line
represent treatment, gray points and regression line represent artificial
sea water (negative control). .............................................................69

xv
Fig. 3.2. Results from the kinesis experiment. Mean distance from the bottom was
not significantly affected by size, treatment, or the interaction between
them (ANCOVA, P > 0.05). Median and the first and third quartiles are
represented by the box, diamonds are the mean, whiskers are 1.5 times
the interquartile range. ......................................................................70
Fig. 3.3. Results from the taxis experiment. Preference for treatment (tallies in
treatment area) was (a) greater for lignin compared with channel water
and (b) greater for large larvae than small larvae (P < 0.05, ANOVA
with Tukey post-hoc comparison). Median and the first and third
quartiles are represented by the box, diamonds are the mean, whiskers
are 1.5 times the interquartile range, and closed circles represent outliers.
...........................................................................................................71
Fig. 4.1. Mean distance from the bottom and activity of pre-settlement- (a, b),
settlement- (c, d), and post-settlement-size (e, f) red drum as a function
of water column depth and color. Black represents black, dark gray
represents green, and light gray represents sand substrates. Median and
first and third quartiles are represented by the boxes, and whiskers are
1.5 times the interquartile range with black points representing extreme
points. Significance of statistical comparisons is shown in Tables 1 and
3.........................................................................................................90

xvi
Fig. 5.1. Small field enclosure made of four vertical 1.9-cm diameter × 100-cm long
steel rods and three 1.3-cm steel rods bent into circles (92 cm diameter)
positioned at 11, 27, and 91 cm from the bottom. Gray mesh with 1.3×
1.1 mm (length × width) openings was attached to the bottom two steel
circles. Mesh was also attached to the top steel circle and draped down,
with a rope sewn into the bottom to act as a drawstring. When in the
water, (a) the draped mesh was temporarily attached to the lower screen
to seal the field enclosure, and (b) the drawstring was pulled shut to
separate larvae in the water column from those in the seagrass bed.110
Fig. 5.2. Vertical position in the water column as a function of size for three
substrates: (a) seagrass (n = 98), (b) oyster shells (n = 132), and (c) sand
(n = 138). Each point represents the median vertical position of 31
measurements made during a 5-minute period for an individual fish.111
Fig. 5.3. Variability in median vertical position with fish size. Variability is defined
as the log(absolute value(residuals from the ANCOVA on median
distance from the bottom)). .............................................................112
Fig. 5.4. Probability of settlement as a function of size for seagrass, oyster shells, and
sand. Median size at settlement (50% probability) is 20.5, 12.9, and
15.8 mm SL for fish in oyster shells, seagrass, and sand, respectively.
Shading represents 95% confidence intervals. ................................113
Fig. 5.5. Probability of settlement from the water column to a seagrass bed as a
function of size (p < 0.001). Median size at settlement (50%
probability) is 12.2 mm SL. Points represent individuals collected from
the seagrass bed (settlement probability = 1) and the water column
(settlement probability = 0). ............................................................114

xvii
Fig. 5.6. Probability of settlement from the water column to a seagrass bed as a
function of size in the laboratory vs. field. .....................................115

1
Chapter 1: General Introduction
Dispersal is a process that has considerable impacts on both evolution and
ecology (Johnson & Gaines 1990, Bilton et al. 2001). It dictates not only where an
individual can recruit, but also influences the processes involved after arrival (Nathan &
Muller-Landau 2000). Dispersal sometimes occurs before maturity, which is termed
‘natal dispersal.’ Natal dispersal, as defined by Howard (1960), is “the permanent
movement an individual makes from its birthsite to the place where it reproduces or
would have reproduced had it survived and found a mate.” While disadvantages include
predation, failure to locate a suitable habitat, and the inability to locate a mate, natal
dispersal persists in many kingdoms of life (Stenseth & Lidicker 1992, Bilton et al.
2001). Plants and fungi produce seeds and spores, respectively, to be passively carried
away by animals, wind, or water (Howe & Smallwood 1982). Birds, on the other hand,
may actively leave their natal site to follow prey, subsequently breeding up to thousands
of kilometers from where they hatched (as reviewed in Greenwood & Harvey 1982).
These transfers have many advantages, including finding new resources, avoiding
inbreeding, decreasing competition, leaving unfavorable conditions, increasing genetic
diversity, decreasing chances of extinction, and filling vacant niches (Stenseth & Lidicker
1992, Bilton et al. 2001).
Natal dispersal is much more widespread in the marine environment than on land,
especially in organisms with complex life histories (Nielsen 1998, Bonhomme & Planes
2000). The complex life histories of most marine animals consist of an offshore pelagic

2
larval phase followed by an inshore benthos-associated juvenile and adult phase. These
complex life histories evolve when the niches vary significantly with life stage, and in
order to maximize the benefits gained from each niche, different body plans and genetic
traits are necessary (e.g., Werner 1988, Ebenman 1992). In the marine environment,
predators, prey, and habitat in the open water environment differs greatly from those in
demersal habitats, and marine organisms exploit these differences by shifting
environments (Barrera-Oro 2002, Lopes et al. 2006, Radabaugh et al. 2013). While this
strategy is most pronounced in species that undergo a metamorphosis, a process that
decouples the genetic correlation between life stages, less drastic versions are common
among species that move from offshore to inshore habitats (Ebenman 1992). Dispersal
and settlement can shape density-dependent and density-independent processes in marine
populations, influencing post-settlement survival and recruitment to the adult populations
(Wahle & Steneck 1992, Pile et al. 1996, Gutiérrez 1998).
Larvae of demersal species eventually outgrow the ability to exploit water-column
resources and must leave the pelagic environment (Werner 1988). At this point they are
able to take up a benthic residence and are referred to as “competent” to settle. During
this transitional period, a larva must encounter a suitable habitat during its settlement
window or it will not recruit successfully. While both the pelagic and demersal phases
have been widely studied across many species, much less is known about the transition
between them, in particular, the drivers that influence settlement behavior. Physical
transport most likely plays a large role in dispersal and settlement; however, passive

3
dispersal models have been inadequate for explaining settlement patterns in a variety of
ecosystems (Cowen et al. 2000, Brown et al. 2005, Gallego et al. 2007).
For fishes, the early life stages are arguably the most critical periods in the life
cycle. With a mean mortality rate of 21.3% d-1, less than 0.1% of all marine fish eggs
spawned typically survive through the pelagic larval phase (Houde 1989, Houde 2002).
Mortality risks decrease significantly during development; therefore, events that occur
during the larval phase can result in order-of-magnitude variations in adult population
sizes (Cowan & Shaw 2002).
In addition to high mortality rates, early life is characterized by rapid
improvements in swimming capacity. Though starting life as planktonic organisms, by
the end of the pelagic period many fish species are considered nektonic, capable of
controlling their position in the water column. They can swim faster than ambient water
currents and can sustain these speeds for many hours to days at a time (Stobutzki &
Bellwood 1994, Leis & Carson-Ewart 1997, Fisher et al. 2000). Coral reef fish families
exhibit a 25-fold difference in sustained swimming abilities, but some individuals can
swim for more than 288 h, covering up to 140 km without resting (Stobutzki & Bellwood
1997). This represents swimming speeds equivalent to 3 to 4 body lengths s-1 for
acanthurids and >10 body lengths s-1 for lutjanids (Stobutzki & Bellwood 1997).
Subtropical and temperate species can also be strong swimmers, but not every species is
capable of swimming faster than prevailing currents by the time of settlement (Jenkins &
Welsford 2002, Clark et al. 2005, Faria et al. 2009).

4
Larvae also develop more elaborate and functional sensory systems through
ontogeny. Eyes are functional before first feeding, with cone photoreceptors being
present at hatching or shortly thereafter (Blaxter & Staines 1970, Blaxter 1975, Higgs &
Fuiman 1996), and acuity (resolution) increasing over time (Shand 1993, Pankhurst 1994,
Lara 2001). Rod photoreceptors appear later to provide for vision in low light.
Superficial and lateral line neuromasts are also added gradually during early life,
increasing sensitivity to water movement, and the addition of accessory structures (e.g.,
auditory bullae and swim bladder projections) aid in hearing (Blaxter & Batty 1985,
Harvey et al. 1992, Higgs & Fuiman 1996, Poling & Fuiman 1998, Diaz et al. 2003,
Higgs et al. 2003, Webb et al. 2012). The development of the olfactory system has been
less well-described, but newly hatched cod (Gadus morhua) larvae exhibit a behavioral
response to arginine, indicating a capacity to detect olfactory cues (Døving et al. 1994,
Lara 2008).
These sensory systems operate on different spatial scales. For example, auditory
signals can be detected from greater distances than visual cues (Kingsford et al. 2002).
Because of this, researchers suggest that larvae use multiple cues and different sensory
modalities, either simultaneously or in an order based on spatial transmission, to find
settlement habitat (Kingsford et al. 2002, Huijbers et al. 2012). Based on the areas over
which sensory signals operate, sensory system improvements during development, as
well as changing habitat requirements, it is likely that larval responses to cues will vary
both spatially and temporally. When combining dispersal information with what is
known about development of sensory and locomotor systems, many researchers agree

5
that fish are not passively transported to coastal environments, and instead actively select
benthic habitats to settle (Montgomery et al. 2001, Kingsford et al. 2002).
The role of sensory systems in settlement is most studied in coral reef ecosystems.
Locating suitable habitat may depend on vision, mechanoreception, hearing, and
olfaction; their role in habitat selection, however, is not well understood (Kingsford et al.
2002). Behavioral studies on settlement in reef fishes are becoming more common,
however these findings may not translate to other systems. The coral reef ecosystem has
been characterized as oases of productivity surrounded by an unproductive, desert-like
ocean (Alongi 1997). The long distances over which sound and olfactory plumes are
carried, coupled with predictable environmental conditions, such as tides, currents, and
oligotrophic waters for light transmission, can facilitate transmission of information that
is vital for settlement. Settlement in other marine systems ̶ those with higher turbidity,
shallower depths, or unpredictable environments ̶ could be operating through
fundamentally different processes.
In the Gulf of Mexico, 95% of commercially- and 85% of recreationally-fished
landings (by weight) use estuaries during part of their life cycle (Environmental
Protection Agency 2004). Estuaries are highly productive coastal environments with at
least intermittent connection to the ocean, forming a link between freshwater ecosystems
and the marine environment. They are comprised of a variety of habitats (e.g., seagrass
beds, marshes, and oyster beds), which play a critical role in the life cycles of many
marine organisms. These habitats serve as nursery grounds for fishes and invertebrates
by providing food and refuge until they are ready to move to their adult habitats (Boesch

6
& Turner 1984, Beck et al. 2001, Gillanders et al. 2003). Unlike coral reefs, which
generally experience stable environmental conditions, subtropical estuaries are subject to
dramatic shifts in salinity, temperature, and turbidity. These unpredictable conditions
could result in unreliable settlement cues for fishes in search of nursery habitats.
Red drum (Sciaenops ocellatus) is a particularly appealing species for studying
the settlement process in estuarine fishes. It is a common sport fish and top predator in
the Gulf of Mexico and Western Atlantic waters from North Carolina to Florida
contributing $1.9 billion per year to the recreational fishing industry, and providing over
15,000 jobs in the state of Texas alone (National Marine Fisheries Service 2012). Red
drum spawn offshore or along the coast during late summer and early fall, and eggs and
young larvae spend approximately three weeks in open water and tidal inlets before
reaching bay and estuarine nursery habitats (Holt et al. 1983, Rooker et al. 1998). New
estuarine arrivals are most commonly found around seagrass beds; in areas where
seagrass is not available, larvae associate with marsh-edge habitats and shallow
unvegetated areas (Stunz et al. 2002a). Juvenile and adult red drum distribution has been
well studied, but it is not known whether distributional patterns are the result of to habitat
choice or post-settlement processes, including differential mortality or inter- and
intraspecific competition (Fencil 2009, Nakayama et al. 2009).
The overall objective of this research was to understand settlement behavior in an
estuarine-dependent fish. Experiments were designed to determine both the role that
larval sensory systems play in settlement at different ontogenetic stages and whether red
drum larvae actively choose specific habitats upon arrival in the estuaries. Since

7
settlement is a critical stage in the life cycle of a demersal marine fish, it is hoped that
this study will lead to a better understanding of recruitment variability in estuarine fishes,
and red drum populations, in particular. It will also help elucidate the conditions
necessary for larvae to find settlement sites, which could have important implications for
management of nursery habitat. This project was designed to study the transition from
the spawning to the nursery grounds, with each chapter moving to a progressively smaller
spatial scale. The second chapter focuses on the effects of anthropogenic noise in larval
foraging behavior during the pelagic phase. The third chapter addresses the chemical
cues that red drum might use to locate settlement sites. The influence of water depth and
benthic color on settlement are in the subject of the fourth chapter. The final chapter
determines whether red drum have a preference for benthic substrata, and determines the
size at settlement both in the laboratory and the field. The guiding hypotheses were that
larval red drum rely on a variety of sensory systems to locate settlement sites, that these
sensory systems operate at different spatial scales, and the ability and decision to respond
to settlement cues changes through ontogeny.

8
Chapter 2: Effects of acoustic noise on activity of larval and juvenile red
drum (Sciaenops ocellatus)
ABSTRACT
Anthropogenic noise in the marine environment is increasing in expanse and
intensity due to a surge in human activities, including construction, oil and gas drilling,
military operations, and shipping and boating traffic. For many species in the Gulf of
Mexico, eggs and young larvae travel through tidal inlets from offshore to the bays and,
in the process, are exposed to a large amount of anthropogenic noise, especially from
shipping traffic. To assess the effects of anthropogenic noise on larval fish behavior, the
auditory thresholds of red drum (Sciaenops ocellatus) larvae were determined, then the
behavioral response (mean swimming speed, number of stops, turns, and amount of time
swimming) to five sound treatments (a 500-Hz pure sine tone at four amplitudes and a
white noise treatment) was examined. Larvae decreased their activity when the sound
was on compared to silent controls and spent slightly less time swimming, which resulted
in a slower mean speed. Routine swimming was intermittent and the duration of pauses
increased when in the presence of sound. As noise amplitude increased, mean speed
decreased but there was no change in the number of turns, pauses, or activity. Despite
these changes in routine behavior in response to noise, search area was not significantly
affected because of the antagonistic effects of speed and turning rate.

9
INTRODUCTION
Early life stages are of particular importance to populations as a dispersive
opportunity for most coastal species, and early life survival depends, in part, on larvae
correctly interpreting and responding to important sensory cues in the environment.
Human activities, which are especially common in coastal areas, add sensory cues that
may interfere with an organism’s perception or interpretation of natural cues and disrupt
critical activities in early life. Sensory capabilities (Kingsford et al. 2002) and swimming
performance (Leis 2006, Faria et al. 2009), which enable effective responses, improve
rapidly during early life. At hatching, at least some species of marine fishes possess the
morphology to perceive auditory, visual, hydrodynamic, temperature, pressure, and near-
field vibrational cues, and they exhibit behavioral responses to some of these types of
cues. By the time of settlement, most fish larvae have the ability to respond to chemical,
celestial, and auditory cues, as well (Kingsford et al. 2002 and citations therein). Hearing
and its effects on behavior in young fishes are not well understood, but auditory
thresholds and startle responses to sound have been characterized in some species less
than 10 mm in length (Ishioka et al. 1987, Fuiman et al. 1999, Wright et al. 2009). Most
information on larval hearing has been gathered from morphological studies, and the
pattern of auditory development tends to be highly conserved across fish species (Fuiman
et al. 2004).
Anthropogenic noise in the marine environment has been increasing in expanse
and intensity due to a surge in activities ranging from construction, oil and gas drilling,
military operations, and shipping and boating traffic (Andrew et al. 2002). Shipping

10
alone increased ambient noise levels by up to 12 dB re 1µPa in certain regions from 1958
to 1975, and the gross tonnage of vessels in the world has doubled since then (Ross 1976,
Hildebrand 2009). Additionally, air guns produce sound at 260 dB re 1µPa, and small
outboard boats produce 160 dB re 1µPa at 1 m from the source (Hildebrand 2009), both
of which include frequencies within the hearing range of fishes (reviewed in Popper &
Hastings 2009).
The effects of increasing noise pollution on marine organisms are beginning to
receive attention, but most studies have focused on marine mammals (Hastings 2008).
Results from studies on fishes have been mixed, ranging from lethal to undetectable
(Popper & Hastings 2009, Slabbekoorn et al. 2010). For example, hearing thresholds of
broad whitefish (Coregonus nasus) were not affected after exposure to seismic devices,
but mortality was reported in coho salmon (Oncorhynchus kisutch) exposed to pile-
driving sounds (Popper et al. 2005, Ruggerone et al. 2008). Sublethal physiological
effects of anthropogenic noise include temporary (Scholik & Yan 2002) and permanent
(Caiger et al. 2012) shifts in hearing capacity, as well as increases in cortisol levels
(Smith et al. 2004) and heart rates (Simpson et al. 2005b) and reduced larval growth rate.
The few behavioral studies on fishes have had mixed results as well. Some found that
boat noise affected orientation (Jung & Swearer 2011), schooling behavior (Sarà et al.
2007), and time spent in shelters (Picciulin et al. 2010), while others did not see effects
on swimming activity (Wardle et al. 2001). Lined seahorses (Hippocampus erectus)
become more variable in their behavior and distressed (as indicated by clicking) due to

11
chronic exposure to loud noises (Anderson et al. 2011). The effects of sounds on the
behavior of estuarine fish larvae have not been studied.
Red drum (Sciaenops ocellatus) are a common estuarine-dependent fish in the
Gulf of Mexico that spawn offshore or along the coast during the fall (Beckman 1988,
Hoese & Moore 1998). In Texas, red drum eggs and young larvae travel through the
seven major tidal inlets that connect the Gulf of Mexico with 11 port districts inshore.
Shipping activity in these inlets exceeds 550 million tons of cargo and 500,000 cruise
ship passengers each year (www.texasports.org). From 250 m away, the underwater
amplitude can reach 10 – 20 dB re 1µPa above background levels when a boat or ship
passes through the inlet, with the majority of frequencies falling below 2 kHz (personal
observation). Eggs and young larvae are therefore exposed to potentially adverse
acoustic conditions. This study examines the effects of anthropogenic sound on the
swimming behavior of red drum larvae to sound in order to understand the ecological
consequences of a changing underwater sound environment.
METHODS
The goal of this study was to test the effects of anthropogenic noise on larval red
drum behavior by addressing the following questions: (1) Does anthropogenic noise
affect larval behavior? (2) If so, what is the sound level (amplitude) that elicits a change
in behavior? (3) Does this behavioral change coincide with the hearing thresholds of
larvae? This was accomplished in two experiments. First, foraging-related behavioral

12
responses to relevant anthropogenic sound levels were compared against behavior under
control sound levels. To place the effects on foraging-related behavior in an ecological
context, the reactive distance to prey was quantified through the larval stage and used to
calculate the consequences of sound on foraging rate. Then, hearing thresholds of larvae
were determined using the auditory evoked potential (AEP) to confirm that the larvae are
capable of hearing the sound levels they would be exposed to in nature.
Larval care
For the behavioral experiments, three batches of red drum eggs were collected
from adult broodstock maintained at the University of Texas Fisheries and Mariculture
Laboratory (FAML) in Port Aransas, TX and from the Texas Parks and Wildlife
Department’s Marine Development Center in Corpus Christi, TX. Fish spawned in the
evenings and on the morning following a spawn, eggs were collected and transported by
automobile to the rearing facility at FAML in a covered 15-l bucket filled with 5 l of sea
water. Each spawn was divided into two subsamples of approximately 5,000 viable
(floating) eggs (5 ml) each and placed into a 150-l fiberglass conical tank filled halfway
with sea water. Temperature was maintained at 27°C and water was provided with a
continuous supply of oxygen through an airstone. The photoperiod was 12:12 light:dark.
Salinity was 35 ppt when the eggs were released in the tanks to match the broodstock
water, and lowered to 27 ppt over the course of two weeks by adding deionized water.
Eggs hatched approximately 24 h after fertilization, and feeding began the following day.
For the first 10 d post-hatching, larvae were fed approximately 400,000 Brachionus sp.

13
rotifers per tank enriched for 45 min with Algamac 3000 (Aquafauna Biomarine, Inc.
Hawthorne, CA). On days 11 and 12, approximately 10,000 1-day-old Artemia sp.
nauplii were added to the diet, and from day 13 onward, each tank was provided with
approximately 60,000, 2-day-old Artemia nauplii enriched overnight with Algamac 3000.
Each day, 5 l of water were drained from the bottom of the tank and new water was
added. After 3 weeks in the conical tanks, larvae were transferred to a 500-gallon
cylindrical tank with sand, rocks, oyster shells, and artificial seagrass. This move
simulated the transition from the tidal inlets to the seagrass habitats experienced by wild
red drum. For every experiment, each larva was tested once, sacrificed with an overdose
of tricaine methansulfonate (MS-222) (Western Chemical Inc., Ferndale, WA),
photographed under a dissecting microscope, and measured (standard length, SL) with
ImageJ Analysis (National Institutes of Health, Bethesda, MD).
For the auditory evoked potential and feeding studies, larval rearing protocols
were the same, except for the following adjustments. Until the day of testing, larvae were
held in 150-l conical tanks filled with sea water and kept at 27°C and 35 ppt. The diet
was enriched with Algamac 3050 (Aquafauna Biomarine, Inc. Hawthorne, CA), and
Artemia sp. were enriched and fed to the larvae twice per day instead of once.
Behavioral responses to acoustic stimulus
The effects of sound on spontaneous behavior traits that can be interpreted as
relevant to foraging were examined. Those variables included: (1) activity (percentage
of time spent swimming), (2) mean speed, (3) number of turns taken, and (4) number of

14
pauses. Position within the testing chamber when the sound was on was also evaluated.
Because sound pressure levels (SPL) varied at different locations within the chamber,
recording the fish’s position allowed finer resolution of the sound level it experienced.
Three comparisons of behavior were made: (1) sound on vs. sound off, (2) between
different sound levels, and (3) between individuals within specific treatments.
The effects of a 500-Hz tone at four amplitudes (low, medium, medium-high and
high) and ‘white noise,’ which consisted of the frequency bands 0.1 to 1.0 kHz played at
the same amplitude as the high treatment for the 500-Hz tone, were tested on red drum
over a range of sizes. These treatments were chosen because (1) most hearing generalists
can hear in the frequency range of 100 to <2000 Hz (Popper & Fay 1993), and (2) larval
red drum responded to a 500-Hz tone in previous experiments (Fuiman et al. 1999).
Experiments were conducted in a 40 × 40 × 12.2 cm (length × width × height)
acrylic tank which was filled with water and left to de-gas for 4 d (Fig. 2.1). An
underwater speaker was suspended at the air/water interface on two aluminum planks
(5.6 cm wide, 13.2 cm apart) resting on the top of the tank. One of two testing chambers
was placed inside the tank. The small testing chamber (for individuals ≤ 21 days old) was
thin plastic and 7.9 × 7.9 × 14 cm (length × width × height). The large testing chamber
(for individuals > 21 days old) was glass and 10.4 × 10.4 × 10.4 cm. The large chamber
was placed on a 2.5-cm tall acrylic stand to make the water level inside the testing
chamber the same as that the tank. A mirror (30.5 × 30.5 cm) was placed above the
acrylic tank at a 45° angle to allow the camera to record both a lateral and overhead view
of the fish in the testing chamber.

15
While not an issue for the ‘white noise’ treatment, the continuous tones used in
the experiments produced a standing wave within the tank so that sound pressure levels
varied in different parts of the testing chambers. It was therefore necessary to create an
acoustic map of SPLs within the testing chambers. The SPLs within the testing chambers
were measured for the four 500-Hz tone amplitudes at 27 equally spaced points in the
small chamber and 64 equally spaced points in the large chamber. The receiving
hydrophone was connected to a charge amplifier that both conditioned (low pass filter =
100 Hz, high pass filter = 1kHz) and amplified (30 dB gain) the received signal. The
received signal was then analyzed by an oscilloscope (Teledyne LeCroy Waveace 112,
Thousand Oaks, CA). The oscilloscope provided the root-mean-square (RMS, defined as
the square root of the mean squared sound pressure level over time, Popper & Hastings
2009) voltage for each of the points as the mean of 64 individual waveforms. The final
SPL was obtained as:
SPL = Mh – G + 20 log V
where Mh is the free field voltage sensitivity of a hydrophone (dB re 1 V/µPa), G is the
gain on the charge amplifier (dB), and V is the RMS voltage from the oscilloscope (Au &
Hastings 2008). The sound measurements were then used to derive a continuous 3-
dimensional sound field within each testing chamber. Since the measurements were
taken 1.25 cm away from the chamber walls and floor, a 3-dimensional Kriging model
was used to estimate a continuous sound field between the point measurements
(interpolation) and up to the walls of the tank (extrapolation). A variogram analysis was
used to estimate the spatial structure of the sound field within each tank. For each sound

16
level in each chamber, the spatial autocorrelation was quantified and accounted for by
plotting semivariance over distance within each chamber, and a semivariance model was
fitted for each (e.g. spherical, Gaussian, etc.). The semivariance model was then used to
estimate the range (distance on x-axis where the model stabilizes), sill (y-value at which
the model stabilizes), and nugget (y-intercept) for each sound level, and these estimates
were used as input to an ordinary Kriging model using the “gstat” package (Pebesma
2004) in R (R 2.12.2, The R Foundation for Statistical Computing, http://www.R-
project.org). The advantage of using a 3-dimensional Kriging model over deterministic
spatial interpolation methods is that the Kriging model takes into account the spatial
orientation of the measurements, and correlation between them, and it has the ability to
make accurate predictions beyond the sampling area. The 3-dimensional Kriging resulted
in high accuracy models for each sound level in each tank and were used to obtain
continuous sound estimates for the 3-dimensional positions of the fish, as well as
visualizing the sound field of the entire tank (Fig. 2.2, Paraview 3.0, Kitware, Inc.,
http://www.paraview.org).
Experiments were conducted between February 7 and July 25, 2011 using larvae
from three spawns. There were four testing chambers of each size, which allowed for up
to eight fish to acclimate to the testing chamber at any given time. The testing chambers
were filled with sea water at 27°C and 27 ppt, and all bubbles were removed with a
pipette. An individual larva was transferred from the rearing tank to the testing chamber
and allowed to acclimate for 1 – 2 h in a 27°C water bath. After acclimation, the testing
chamber was transferred from the water bath to the testing tank. A Casio High Speed

17
EXILIM HS EX-FH25 video camera (Casio Computer Company, Ltd., Tokyo, Japan)
was placed 1 m from the testing chamber to record behavior. Once the testing chamber
was placed in the acrylic tank, the larva was left to acclimate for 5 min. After 5 min, the
video camera was turned on, and either no sound was introduced (control), or one of the
five sound treatments was applied. The larva was exposed to this treatment for 2.5 min
after which the sound was terminated (if the initial treatment was a sound) or one of the
five sound treatments was introduced (if the initial treatment was no sound). The larva’s
behavior was recorded for an additional 2.5 min. This time period was chosen in order to
study the reaction larvae would have to a boat passing through the inlet. Small watercraft
are at least 10 dB re 1 µPa louder than background levels for 2 – 3 min (measured from
250 m away at the closest point, personal observation).
The video recordings were converted to stacks of images using QuickTime Pro
(Apple Inc., Cupertino, CA) and filtered from an original 30 frames s-1 to 3 frames s-1 by
saving only every 10th frame. The fish position in each image was tracked manually
using ImageJ software. From these tracks, mean speed (cm s-1), number of turns (defined
as a change in direction of at least 15°), number of pauses (≥ 5 s of no swimming), and
activity (percentage of time spent swimming [time that was not considered a pause]) were
calculated for fish in all treatments. For individuals in the four 500-Hz tone treatments,
the median sound pressure level each fish experienced while the sound was on was also
quantified by comparing their track swam to the Kriging model results.
Reactive distance measurements

18
Reactive distance of red drum (5.4 - 24 mm SL) to the first successful capture of
an Artemia nauplius was measured in order to assess the maximum distance larvae will
travel to attack prey in the absence of a sound stimulus. These measurements were
combined with the swimming paths traveled in the horizontal plane to estimate foraging
rate under various experimental conditions.
Experiments took place between August 8 and 21, 2013, and 61 individuals were
tested. The day before the experiment, red drum larvae were transferred from the rearing
tanks into individual 200 × 80 mm (diameter × height) black glass bowls filled with 500
ml sea water. This allowed for the fish to acclimate to the experiment room while
withholding food for 24 h. Room temperature was controlled to maintain water
temperature between 27 – 28°C.
On the day of testing, an individual larva was transferred from the bowl to a 10 ×
10 × 10 cm glass testing chamber filled with 250 ml of sterilized sea water. After at least
20 min of acclimation, the chamber was placed in the testing arena. The arena was
comprised of the testing chamber situated on a black background with a mirror (30.5 ×
30.5 cm) angled 45° above the chamber for an overhead view. The chamber was
illuminated with both 8 overhead fluorescent light bulbs (32 Watt Ecolux fluorescent
bulbs, General Electric Company, Fairfield, CT) and 150-Watt halogen illuminator
(Model 180, Dolan-Jenner Industries, Boxborough, MA). A Casio High Speed EXILIM
HS EX-FH25 video camera faced the mirror to record larval behavior from above.
Recording began and then Artemia nauplii were pipetted at a concentration of
approximately 25 ml-1 into the container on the opposite side of the chamber from the

19
larva, resulting in a mean Artemia concentration in the testing chamber of 0.1 ml-1. The
fish was recorded for an additional 4.5 min.
Each video recording was converted into a stack of images using QuickTime Pro.
These images were imported into ImageJ and the image immediately before the start of
the fish’s attack on the Artemia was identified. Reactive distance (distance between the
tip of the fish’s head and the Artemia immediately prior to the start of the attack, in cm)
and the reactive angle (the angle between the longitudinal axis of the fish’s body and the
line between the fish’s snout and the prey, 0-180°) were measured using ImageJ.
The X-Y coordinates with the sound on and the sound off (from the overhead
view of the behavioral response to acoustic stimulus experiment) of each individual were
then plotted (using “ggplot” in the R statistical package, R 3.0.2), and the mean reactive
distance was superimposed along the entire path to represent the potential foraging area
and potential foraging rate during the experiment (Wickham 2009). This area was then
measured using ImageJ.
Statistics
All statistics were performed with the R statistical package (R 3.0.2). Differences
in sound pressure levels within each tank were calculated for the four tone treatments
using a Kruskal-Wallis test for both the small and large tank. Post-hoc tests were
performed using the Multiple Comparisons Kruskal-Wallis Test (kruskalmc) in the
“pgirmess” package (Giraudoux 2013).

20
The overall design of the behavioral responses to acoustic stimulus experiment
allowed for testing of three hypotheses: (1) that larvae behave differently with the sound
on vs. off, (2) that larvae behave differently to different SPLs, and (3) that larvae behave
differently to finer differences in SPL, as the SPL varies with location within a chamber.
For the first comparison, a linear mixed effects ANOVA model (“lme4” package of R)
was used to analyze the relationship between the order of treatment (sound first or sound
second) and whether behavior differed when the sound was on or off (Bates et al. 2014).
The fixed effects were order and sound treatment (on/off), with an interaction term, and
the random effect was the individual fish. Homoscedasticity and normality were verified
with visual inspections of residuals, and transformations were applied when assumptions
were not met. Likelihood ratio tests of the full model with each effect were compared
against each model without the effect to obtain P-values. This was performed first on the
white noise treatment (to determine if anthropogenic noise had an effect on behavior),
and then on all five treatments (white noise and the 500-Hz tone at four separate
amplitudes) combined. The linear model confidence intervals were also compared to
determine if size affected the number of turns, pauses, mean speed, and activity
differently with the sound on vs. off.
Analysis of covariance (ANCOVA) was used for the second set of comparisons,
with sound treatment (low, medium, medium-high, high, and noise) as the main effect
and fish size as the covariate. Normality and equality of variance were verified by visual
inspection and a Fligner test (“car” package in R), and when assumptions were not met,
data were transformed (Fox & Weisberg 2011). Most larvae swam constantly (100%

21
activity); therefore a normal distribution could not be achieved for the activity data.
Instead, individuals were sorted by size within each treatment and mean activity level and
mean size were computed for each group of five fish. The last group (largest fish) ranged
from 4 – 7 individuals depending on number left over. The glht (general linear
hypotheses) test in the “multcomp” package was used for post-hoc comparisons among
treatments when appropriate (Hothorn et al. 2008).
Simple linear regression was used to determine the effect of size on the median
sound amplitude the fish experienced (based on position in the chamber). For dependent
variables that were significantly affected by size (ANCOVA), linear regression was used
to determine if median sound amplitude encountered (independent variable) had an effect
on the dependent variable. Assumptions were tested by visual inspection of the data and
transformed when necessary (cubed, log-transformed, or square-root transformed).
Linear regression was used to determine if size had an effect on reactive distance
to prey, and if there was an interaction between reactive distance and reactive angle.
Normality was checked visually. Differences in foraging rate (X-Y area covered with the
sound on vs. off) were determined with a Student’s paired t-test.
Auditory threshold
Auditory thresholds of S. ocellatus larvae (15 – 25.5 mm SL) from three separate
batches of eggs (separate spawning events) were measured as the auditory evoked
potential following the methods of Higgs et al. (2003). Experiments took place August
22—24, 2013 at FAML. All tests were conducted in a 110 × 25 cm (length × diameter)

22
PVC pipe sound chamber positioned horizontally, with a 100 × 15 cm (length × width)
opening at the top. A UW30 underwater speaker (Lubell Labs, Inc. Columbus, OH) was
positioned at the left end of the tank and a fish holder (ring stand holding a plastic pipette
connected perpendicularly to a microscope slide covered in inert clay) was positioned
100 cm away, completely submerged in water. Water depth was 17 cm and temperature
was maintained at 25°C.
An individual fish was placed onto the clay and surrounded with a small rectangle
of mesh that was clipped to the platform to keep the larva in place. This mesh was loose
enough to allow for opercular movements while maintaining the fish in position for
electrode placement. One dead fish was tested as a control reference for background
level comparisons on the software-generated responses. A computer running SigGen and
BioSig software (Tucker-Davis Technologies, TDT, Gainesville, FL) interfaced with a
TDT system evoked potential workstation presented the stimulus and recorded resultant
responses. The stimulus was a tone burst lasting 10 ms at 100, 200, 300, 400, 500, 600,
700 or 800 Hz and presented to the fish through the underwater speaker. The intensity of
each output was calibrated using a hydrophone connected to an amplifier and
oscilloscope each day before the start of experiments to maintain consistent output levels
across each frequency. Each fish was exposed to a stepwise sound intensity change at 5-
dB increments until a minimum AEP response (threshold, defined as the lowest sound
level a clear response could be seen, Higgs et al. 2003) was observed for a given
frequency. A trained observer did this detection visually, as visual and statistical

23
detection methods are equally reliable in threshold estimation (Mann et al. 2001, Brittan-
Powell & Dooling 2004).
Two stainless steel electrodes (Rochester Electromedical Inc., Tampa, FL) were
covered in clear nail polish except for the tip and placed subcutaneously in an individual
larva on the dorsum anterior to the operculum to measure AEP. The reference electrode
was placed in the nasal region on the dorsal side of the fish. The stimulus was presented
200 times at each amplitude, with half of the presentations at 90 degrees phase and half at
270 degrees phase. The responses were averaged to cancel out the effects of the
stimulus, leaving only the AEP for analysis.
RESULTS
Behavioral response to acoustic stimulus
Sound amplitude (mean of the 27 positions measured in each chamber) varied
significantly among the four treatments (P < 0.05) in the small chamber, except that the
medium-high level was not significantly different from the medium or the high level (Fig.
2.3a). In the large tank, all treatments were different from each other (P < 0.05), except
that the medium-high and high levels were not different (Fig. 2.3b). Each sound level in
the small tank was different from the corresponding level in the large tank (P < 0.01).
Larvae in the noise treatment took 0.3 more stops (P < 0.05) and swam 0.27 cm s-
1 less (P = 0.05) when the sound was introduced after the control. This results in 40.5 cm
less distance covered over the course of the trial than in treatments when the sound was

24
introduced second. No other effects were significant on any of the variables. For all of
the treatments combined, there were some significant changes in routine swimming
behavior when the sound was on relative to when the sound was off. Specifically, fish
made 15.7 fewer turns on average and spent 4.5% less time actively swimming when the
sound was on (P < 0.01). Fish swam an average of 0.15 cm s-1 slower with the sound on,
which translates to 22.5 cm less distance traveled over the trial (P < 0.01). No other
effects were statistically significant.
Fish size and sound treatment both affected the number of turns with the sound on
(P < 0.001, Fig. 2.4). The number of turns increased as fish size increased, and the
number of turns was greater in the white noise treatment compared to the four tone
treatments (P < 0.01 except for medium-high vs. noise; P = 0.06). Fish size also affected
the number of pauses and mean speed (P < 0.001, Figs. 2.5 and 2.6), with a decrease in
pauses and an increase in speed with increasing size. The size effect on the number of
turns, pauses, mean speed, and activity when the sound was off was compared with
confidence intervals for the linear regressions, and the effect of fish size was not different
with the sound on vs. the sound off. No other effects were significant (P > 0.05, Fig.
2.7).
The number of turns, number of pauses, and mean speed changed with sound
amplitude in the medium and medium-high treatments. For those two levels, the number
of turns decreased with an increase in sound amplitude encountered within the testing
chamber (slope = -5.67, P < 0.05, R2 = 0.17; slope = -5.28, P < 0.01, R2 = 0.21,
respectively, Fig. 2.8). The number of pauses increased as median sound amplitude

25
encountered increased (medium slope = 0.9, P < 0.05, R2 = 0.13; medium-high slope =
0.12, P < 0.01, R2 = 0.20, Fig. 2.9). Mean speed decreased with increasing sound
amplitude encountered (medium slope = -0.15, P < 0.001, R2 = 0.38; medium-high slope
= -0.12, P < 0.001, R2 = 0.36, respectively, Fig. 2.10). Visual inspection of the data (b, c,
and d in Figs 2.8-2.10) suggested that the slopes for number of turns, pauses, and speed
were the same across the three loudest tones. Combining these three treatments
(medium, medium-high, and high) for each variable, the significant effect of median
amplitude encountered on mean speed remained (slope = -0.10, P < 0.01, R2 = 0.09, Fig.
2.11), but the relationships between median amplitude encountered and number of turns
or pauses were not significant (P > 0.05).
Reactive distance
Reactive distance to prey was measured for all fish that reacted to the Artemia (46
of 61 individuals). Reactive distance ranged from 0.09 to 3.43 cm, with a mean ± SD of
1.21 ± 0.83 cm. There was no significant change in reactive distance with fish size (P >
0.05). Reactive angle ranged from 4.0 – 150.5°, and reactive distance did not vary with
reactive angle (P > 0.05, Fig. 2.12). There were no differences in the horizontal search
area covered with the sound vs. off, with the mean ± SD foraging rate covering 0.19 ±
0.13 cm s-1 (P > 0.05).
Auditory thresholds

26
An audiogram was composed based on AEP responses of 44 fish ranging in size
from 15 to 25.5 mm SL. Auditory thresholds increased from (mean ± SD) 114.0 ± 2.08 to
150.0 ± 2.24 dB re 1µPa over the frequency range of 100 to 600 Hz (Fig. 2.13). The
mean ± SD threshold at 500 Hz for a larval red drum was 147.9 ± 4.0 dB re 1µPa (n = 12)
and the minimum threshold at that frequency was 145 dB re 1µPa.
DISCUSSION
According to the audiograms, red drum larvae were capable of hearing the sound
in the behavioral assays. They changed their behavior in the presence of anthropogenic
noise and 500 Hz tones. They stopped more and had a slower mean swimming speed
when the noise stimulus was presented second, but not first. It is possible that in this
treatment, the effects of sound exposure continue even after the stimulus has ceased,
causing no change in behavior up to 2.5 minutes after the sound was turned off. Plasma
cortisol levels of red drum can remain elevated for hours after a stressful event
(Robertson et al. 1988), so it is likely that they would not resume routine behavior after
sound exposure as well. While red drum larvae might acclimate to anthropogenic noise
over time both in the laboratory and the wild, this suggests that initials reactions to
anthropogenic noise in the environment, such as a boat passing through an inlet, are
quantifiable.
Fish at any size tested turned less, had a lower mean speed, and spent less time
swimming when the sound was on. The same results were also observed within each

27
tank for the medium and medium-high amplitude treatments: larvae that spent more time
in the louder portion of the tank turned less, stopped more, and swam slower. The
absence of such effects on behavior in the low treatment may have been due to
insufficient spatial variation in amplitude, or the sound amplitude might have been below
the auditory threshold for those individuals. The high treatment, on the other hand, might
have been loud enough throughout the tank to have caused the same behavioral response
regardless of a fish’s position.
Fish turned more, stopped less, and swam faster with increasing size, but the
amount of time spent swimming (activity) remained constant, whether the sound was on
or off. Similar increases in routine and critical swimming speeds with increasing size
have been reported in previous studies of red drum (Fuiman et al. 1999, Faria et al. 2009).
Whether the sound was on at all had a greater influence on larval behavior than the SPL
to which the fish was exposed.
Larval red drum hearing sensitivity was greatest (lowest threshold) at 100-200 Hz
and decreased as frequency increased. This pattern is common among fish species,
however these thresholds for larvae were higher than thresholds for wild red drum of later
developmental stages (larger sizes, 205 – 555 mm SL, Horodysky et al. 2008). This
could be due to hatchery conditions, size differences, experimental differences, or a
combination of these. Hatcheries can be up to 50 dB re 1μPa louder than a wild setting,
and chronic exposure to noise can increase the auditory threshold of fishes (Bart et al.
2001, Wysocki & Ladich 2005). In a direct comparison between wild and hatchery-
reared fish, wild juvenile snapper (Pagrus auratus) had a lower auditory threshold than

28
snapper reared under aquaculture conditions (Caiger et al. 2012). However, the sound
amplitudes in our hatchery tanks (~100 dB re 1μPa) were lower than many natural
environments. Literature reports on differences in thresholds with size range from no
change (Higgs et al. 2003) to a decrease with increasing size (Kenyon 1996, Wright et al.
2005). Discrepancies may be due to species-specific hearing specializations, but there
have not been enough studies to draw conclusions (Higgs et al. 2003). It is most likely
that the differences between studies are due to differences in experimental procedures,
and many researchers warn that comparing audiograms across studies should be done
with caution (Popper et al. 1973, Higgs et al. 2003, Wright et al. 2005).
When compared with behavioral assays, audiograms generally underestimate a
fish’s sensitivity by 10 – 30 dB re 1μPa (Gorga et al. 1988, Kenyon et al. 1998). This is
because the electrode, while place subcutaneously on the fish, does not directly touch the
central nervous system, and thus, does not detect the lowest threshold responses to the
stimulus. At 500 Hz, the minimum AEP threshold was 145 dB re 1μPa, therefore the
actual threshold for the fish used in the experiments was 115 – 135 dB re 1μPa. This
indicates that the fish were able to hear the sound treatments in all tanks except possibly
the low treatment, where maximum tank values were 125.3 and 127.3 dB re 1μPa for the
small and large tank, respectively. Consequently, the low treatments might effectively
serve as a no-sound control. The sound pressure levels in this experiment were
comparable to reported anthropogenic levels in the wild. In previous studies, SPL ranged
from 109 – 127 dB re 1μ Pa < 20 m from the sound source, but exceeded 200 dB re 1μPa
close to pile driving activities (Anonymous 2001; Tougaard et al. 2009a, 2009b). In this

29
study, background field measurements were approximately 120 dB re 1μPa, and a
minimum of 250 m from boat traffic resulted in a 20 dB re 1μPa increase in amplitude
(personal observation).
Reactive distances measured in this study differ from those on larval maroon
anemonefish (Premnas biaculeatus, Job & Bellwood 1996) by approximately one order
of magnitude (1.21 cm vs 2.8 mm in red drum vs. anemonefish, Job & Bellwood 1996).
While the anemonefish were younger, reactive distance was measured on competent
(settlement-size) larvae of both species. These differences could either be due to
interspecific variations in behavior or visual morphology, or differences in the
experimental design (e.g. Job & Bellwood [1996] used rotifers at a concentration of 120
ml-1, while we used a concentration of 0.1 Artemia ml-1). The reactive distance did not
change with larval size for red drum, but Job & Bellwood (1996) did find a change with
size for the anemonefish (from 1.7 mm on 3 d post-hatching to 2.8 mm on 10 d post-
hatching).
The lack of differences in the calculated foraging rate (based on routine
swimming speed and reactive distance measurements) with the sound on vs. off despite
significant differences in routine behavior were likely due to the decrease in the number
of turns with the sound on counteracting the decrease in the mean speed over the same
period. Foraging rate is defined by the amount of new area searched per unit of time and
is a function of swimming speed distance traveled, reactive distance, and the number of
turns taken (more turning increases the amount of overlap in the search field and reduces
the volume searched), which affect the probability of encountering a prey item (Fuiman

30
& Magurran 1994). If larvae respond to sound with fewer turns (less overlap in search
volume) and slower speed, these two changes can negate each other, resulting in little
effect on foraging rate. It is possible, however, that there were changes in the vertical
component of routine behavior in response to sound, which we did not quantify when
measuring reactive distance. It is also possible that sound could affect foraging in
behaviors other than encounter rates. For example, feeding frequencies of Mediterranean
damselfish (Chromis chromis) decreased in the presence of boat traffic (Bracciali et al.
2012).
While the rate at which red drum larvae encounter prey on the horizontal plane
was calculated to be unaffected by sound, there were significant effects of sound on
routine behavior. These results could influence survival in ways other than affecting
foraging ability. Anthropogenic noise could interfere with the ability to locate nursery
habitats and complete settlement, which could have implications for recruitment. Many
fish species are attracted to sounds associated with potential settlement habitats (e.g.
Simpson et al. 2004, 2005a; Leis & Lockett 2005) since sound, especially low
frequencies, is a reliable long distance cue for navigation and communication (Bass &
McKibben 2003). The composition of natural ocean noise at frequencies between 50 and
5000 Hz is primarily biologically-generated and within the hearing range of most fishes
(100 – 1000 Hz for most species, Cato 1992, Fay & Popper 1999). Unique coastal
habitats, even within a few kilometers of each other, have particular acoustic signatures,
which could be important for orientation towards specific habitats (Radford et al. 2010).
Literature reports on the effects of anthropogenic sound on orientation and settlement of

31
larval fishes are mixed. Jung & Swearer (2011) found that boat noise might not alter
recruitment patterns in temperate reef fish, yet Holles et al. (2013) found that boat noise
affects directionality of the cardinalfish Apogon doryssa. More studies are needed to
fully understand the implications of anthropogenic noise on navigation and settlement.
This study demonstrates that short-term exposure to anthropogenic sounds at
ecologically relevant amplitudes alters larval fish behavior in subtle ways. Larvae swim
less at all tested sizes in the presence of noise, and though this might not have significant
effects on prey encounter rates, it could affect pelagic larval duration, thus affecting
overall growth and survival. These results are some of the first fine-scale analyses on
behavioral changes with regard to anthropogenic noise, and while additional studies are
warranted, they shed light on potential survival outcomes in larval fishes.

32
Fig. 2.1. Schematic diagram (lateral view) of behavioral testing tank (large testing chamber). See text for details.
camera mirror
speaker
steel supports
stand
large testing chamber

33
Fig. 2.2. Continuous 3-dimensional sound field for the 500-Hz tone in the large testing chamber for the (a) low, (b) medium, (c) medium-high, and (d) high treatments. Speaker is positioned at the top left of each chamber, and the camera is positioned facing from the right. See text for details.

34
Fig. 2.3. Sound levels for four tone treatments in the (a) small testing chamber and (b) large testing chamber. Letters above each box indicate significant differences (P < 0.05) between treatments. Sound level in the small chamber was significantly different from that in the large chamber for all treatments. Median amplitude and the first and third quartiles represented by the box, whiskers are 1.5 times the interquartile range, and closed circles represent outliers.
a
bbc
ca
110
120
130
140
150
Am
plitu
de (d
B re
1 µPa)
a
bc
cb
110
120
130
140
150
low medium med-high highTreatment
Am
plitu
de (d
B re
1 µPa)

35
Fig. 2.4. Effect of (a) fish size and (b) sound amplitude on number of turns during routine swimming. Closed circles represent individuals in the white noise treatment; open circles represent individuals in the 500-Hz tone treatment. In (b), median number of turns and first and third quartiles are represented by the box; whiskers are 1.5 times the interquartile range.
noise
500 Hz tone
a
0
100
200
300
0 5 10 15 20Size (mm SL)
Num
ber o
f tur
ns
*b
0
100
200
300
low medium med-high high noiseTreatment
Num
ber o
f tur
ns

36
Fig. 2.5. Effect of (a) fish size and (b) sound amplitude on number of pauses during routine swimming. In (b), median number of stops and first and third quartiles are represented by the box, whiskers are 1.5 times the interquartile range, and closed circles represent outliers.
a
0
5
10
15
5 10 15 20Size (mm SL)
Num
ber o
f pau
ses
b
0
5
10
15
low medium med-high high noiseTreatment
Num
ber o
f pau
ses

37
Fig. 2.6. Effect of (a) fish size and (b) sound amplitude on mean speed during routine swimming. In (b), median mean speed and first and third quartiles are represented by the box, whiskers are 1.5 times the interquartile range, and closed circles represent outliers.
a
0
1
2
3
4
5
5 10 15 20Size (mm SL)
Mea
n sp
eed
(cm
/s)
b
0
1
2
3
4
5
low medium med-high high noiseTreatment
Mea
n sp
eed
(cm
/s)

38
Fig. 2.7. Effect of (a) fish size and (b) sound amplitude on activity during routine swimming. In (b), median average activity and first and third quartiles are represented by the box, whiskers are 1.5 times the interquartile range.
a
40
60
80
100
5 10 15 20Size (mm SL)
Act
ivity
(% o
f tim
e sw
imm
ing)
b
40
60
80
100
low medium med-high high noiseTreatment
Act
ivity
(% o
f tim
e sw
imm
ing)

39
Fig. 2.8. Effect of median sound amplitude experienced on number of turns at four sound amplitude levels. Significant effects occurred at the medium (b, P < 0.05) and medium-high (c, P < 0.01) sound amplitude levels. Slopes are linear regressions and shaded region show 95% confidence interval.
a
0
50
100
150
200
110 115 120 125
Num
ber o
f tur
ns
b
125 130 135
c
0
50
100
150
200
125 130 135 140Median amplitude (dB re 1 µPa)
Num
ber o
f tur
ns
d
130 135 140 145Median amplitude (dB re 1 µPa)

40
Fig. 2.9. Effect of median sound amplitude experienced on number of pauses at four sound amplitude levels. Significant effects occurred at the medium (b, P < 0.05) and medium-high (c, P < 0.01) sound amplitude levels. Slopes are linear regressions and shaded region show 95% confidence interval.
a
0
2
4
6
8
110 115 120 125
Num
ber o
f pau
ses b
125 130 135
c
0
2
4
6
8
125 130 135 140Median amplitude (dB re 1 µPa)
Num
ber o
f pau
ses d
135 140 145Median amplitude (dB re 1 µPa)

41
Fig. 2.10. Effect of median sound amplitude experienced on mean speed at four sound amplitude levels. Significant effects occurred at the medium (b, P < 0.001) and medium-high (c, P < 0.001) sound amplitude levels. Slopes are linear regressions and shaded region show 95% confidence interval.
a
0
1
2
3
4
5
110 115 120 125
Mea
n sp
eed
(cm
/s) b
125 130 135
c
0
1
2
3
4
5
130 135 140Median amplitude (dB re 1 µPa)
Mea
n sp
eed
(cm
/s) d
135 140 145Median amplitude (dB re 1 µPa)

42
Fig. 2.11. (a) Number of turns and (b) number of stops did not change over median amplitude experienced when the medium (l), medium-high (p), and high (n) were combined (P > 0.05), but the (c) mean speed decreased with an increase in median amplitude (P < 0.01). Slope is a linear regression and the shaded region is the 95% confidence interval.
a
0
50
100
150
200
Num
ber
of tu
rns
b
0
2
4
6
8
Num
ber
of p
ause
s
c
0
2
4
6
8
120 125 130 135 140 145Median amplitude (dB re 1 µPa)
Mea
n sp
eed
(cm
/s)

43
Fig. 2.12. Reactive distance as a function of the reactive angle for red drum larvae successfully capturing Artemia prey.
0
1
2
3
0 50 100 150Reactive angle (degrees)
Rea
ctiv
e di
stan
ce (c
m)

44
Fig. 2.13. Audiogram for red drum (n = 44) ranging from 15 to 25.5 mm SL. Closed circles indicate mean values with SE error bars. Dashed lines represent the maximum and minimum thresholds for each frequency tested. The mean threshold for red drum at 500 Hz is147.9 dB re 1μPa ±1.14 SE, n = 12.
100
120
140
160
0 200 400 600 800Frequency (Hz)
Thre
shol
d (d
B re
1 µPa)

45
Chapter 3: Settlement-size larval red drum (Sciaenops ocellatus)
respond to estuarine chemical cues
ABSTRACT
Planktonic larvae combine directed swimming and functional sensory systems to
locate benthic habitats. Some adult marine fishes use chemical cues for orientation to
specific habitats, but olfactory function for estuarine fish larvae has received little
research attention. This laboratory study quantified behavioral responses of red drum
(Sciaenops ocellatus) larvae to estuarine chemical cues to examine the role of water
chemistry as an orientation cue for locating or remaining in settlement habitat.
Spontaneous activity (kinesis) was measured for pre-settlement-size larvae exposed to
artificial sea water (as a negative control) and one of six treatments (sterilized sea water,
sea water from a channel at ebb tide, sea water from a channel at flood tide, sea water
from seagrass habitat, tannic acid dissolved in sterilized sea water, or lignin dissolved in
sterilized sea water). Larvae that reached a size of competency to settle (approximately
10 mm standard length) swam faster when exposed to lignin dissolved in sterilized sea
water than in other treatments; smaller larvae showed now response. Olfactory
preference (taxis) was tested using a paired choice experiment. Competent larvae
preferred water from seagrass beds to artificial sea water. The observed chemokinesis
and chemotaxis in response to lignin dissolved in sterilized sea water and sea water from

46
a seagrass bed demonstrate that red drum larvae can distinguish and respond to different
water masses and suggest that chemical stimuli from seagrass settlement habitat aid in
orientation and movement to, or retention in suitable settlement sites.
INTRODUCTION
Fish use chemical cues for communication, foraging, mating, predator detection,
avoidance, and navigation (Døving et al. 1994, Hubbard et al. 2003, Belanger et al. 2004,
Gerlach et al. 2007, Dixson et al. 2012). They respond to olfactory cues that range from
simple amino acids to complex mixtures of biologically- and environmentally-produced
molecules, and are sensitive to these compounds at different concentrations (Døving et al.
1994, Gerlach et al. 2007). For example, Atlantic salmon (Salmo salar) respond to
testosterone concentrations in sea water as low as 10-14 mol-1, but much higher
concentrations of alcohols (Moore & Scott 1991, Hara 1994). In general, responses such
as turning rate and speed can strengthen with increasing concentration of a cue (Døving
et al. 1994).
Responses to chemical cues vary among species, chemical compounds, time, and
space. Some chemical cues elicit an innate response (Arvedlund et al. 1999, Miller-Sims
et al. 2011, Dixson et al. 2012) and others are learned over time (Odling-Smee &
Braithwaite 2003). Certain species can distinguish a specific coral reef or a host
anemone based on learning or imprinting, and others innately respond to chemical alarm
cues from confamilial species (Arvedlund et al. 1999, Arvedlund & Kavanagh 2009,
Miller-Sims et al. 2011, Mitchell et al. 2012). Since olfactory imprinting is common in

47
marine fishes (e.g. Hasler & Scholz 1983, Arvedlund et al. 1999) and chemosensory
morphology develops early, olfaction likely functions early in life (Døving et al. 1994,
Kingsford et al. 2002, Lara 2008). However, there have been few studies of the
development of the olfactory system and chemically mediated behavioral responses in
these organisms.
Fishes commonly use chemical cues for orientation, and many studies suggest
olfaction may be the most important cue for locating habitats on both large and small
spatial scales (Baird et al. 1996, Dittman & Quinn 1996, Lecchini et al. 2005). In
Japanese red rockfish (Sebastes inermis), olfaction is more important than vision for
locating specific habitats, and olfaction operates over greater distances than vision in
certain larvae (Lecchini et al. 2005, Mitamura et al. 2005). Settlement-size reef fishes are
capable of discerning different chemical cues associated with benthic habitats, preferring
water located near islands or reefs over water from the open ocean or other unsuitable
habitats (Atema et al. 2002, Dixson et al. 2008). Some species use chemical cues to
distinguish between their natal habitat and a different vicinity, which contributes to
retention of larvae in specific sites (Mitamura et al. 2005, Gerlach et al. 2007). They can
also use olfaction to determine habitat quality. Coppock et al. (2013) found that three
species of reef fishes in Papua New Guinea were attracted to the olfactory cues from live
coral and actively avoid odors from degraded coral. In addition to the chemical
compounds associated with the habitat structure itself (e.g. oyster reefs, seagrass beds,
coral reefs), many settlers respond to predators, prey, and conspecifics in the area
(Sweatman 1985, Lecchini et al. 2005, Døving et al. 2006, Lecchini et al. 2007b).

48
Most research on olfactory settlement cues has been conducted on coral reef
fishes; much less is known about the chemical cues associated with settlement in other
environments. It has been suggested that larvae depend on olfactory cues to locate
estuaries (Boehlert & Mundy 1988), yet few studies have tested the effects of chemical
compounds on settlement behavior. Both Radford et al. (2012) and James et al. (2008)
found that settlement-stage sparid larvae (Rhabdosargus holubi and Pagrus auratus)
orient toward water sourced from their typical nursery habitats. Radford et al. (2012)
also discovered that larvae preferred water collected from seagrass beds to artificial sea
water in which seagrass blades had been soaking, suggesting that chemical compounds
derived from sources other than the seagrass (e.g. conspecifics or prey) are involved in
attracting the larvae to the seagrass beds.
If seagrasses are an important source of chemical information for larvae of other
species, it is possible that their phenolic compounds, which are aromatic molecules that
can leach into the environment as a result of structural damage or senescence (reviewed
by Arnold & Targett 2002), are involved. Seagrasses contain phenols such as condensed
tannins and lignins at concentrations ranging from 3 – 11% and <1 – 5% dry mass (DM),
respectively, and these concentrations can vary greatly across species and over time
(Arnold & Targett 2002). These compounds are also produced by emergent vegetation,
including mangroves and salt marshes, and tannins but not lignins are produced by brown
algae. Salt marsh plants (measured as humic substances, Filip & Alberts 1989) and
mangroves contain even greater concentrations of these compounds than seagrasses
(mangrove tannin concentrations of 8.8 – 40.8% DM, Basak et al. 1998). Terrestrial

49
plants also produce phenolic compounds, and when located near rivers and streams, can
be transported to nearby estuaries as well (Benner & Opsahl 2001). Collectively, these
phenolic sources might serve as a coastal signal to larvae searching for estuarine
settlement sites.
Chemoreception might be especially important for finding settlement habitat in
areas where estuaries do not provide a reliable signal through other physical or
environmental variables. For instance, postlarval and juvenile flounder (Pleuronectes
flesus) prefer water of low salinity (Bos & Thiel 2006), but in regions of the western Gulf
of Mexico where salinity gradients are not only unstable but sometimes result in reverse
estuaries, salinity would not be a dependable signal for navigation. Thus, it is even more
likely that chemoreception would be important for locating nursery habitats within these
estuaries.
The present study tested the hypothesis that larvae of the estuarine dependent fish,
red drum (Sciaenops ocellatus), use olfactory cues to locate and remain in its preferred
nursery habitat, seagrass beds, when they are competent to settle.
METHODS
The hypothesis was tested in laboratory experiments that measured the responses
of larvae to a variety of natural olfactory cues through changes in activity (kinesis) or
preference (taxis). Environmental flow rates were measured in the field to determine an
appropriate velocity to use for the taxis experiment. After analyzing the responses, water

50
samples collected from pre-settlement and settlement habitats were analyzed for specific
chemical (lignin) concentrations that could serve as a reliable estuarine olfactory cue.
Environmental Flow Rates
To determine estuarine flow rates, 20-cm SeaHorse tilt current meters
(OkeanoLog, Woods Hole, MA) were installed in Redfish Bay near Harbor Island, TX
(27° 53’N, 97° 7’W). One tilt current meter was installed above the canopy of a seagrass
(Thalassia testudinum) bed at a depth of approximately 1 m, and another tilt current
meter was installed over bare substrate at a similar depth. The meters were set out at
1600 hours on September 20, 2012 and retrieved the next day at 13:30. The tilts from the
zenith on each of the three planes were converted into horizontal velocity (in cm s-1) with
MATLAB software (Mathworks, Natick, MA).
Study species
Red drum inhabit temperate and subtropical waters from the Gulf of Mexico to
North Carolina in the Western Atlantic (Hoese & Moore 1998). They spawn offshore or
along the coast in late summer and fall, and larvae reach the estuaries in approximately
three weeks (Holt et al. 1983, Rooker et al. 1998). They become competent to settle at 10
mm standard length (SL) and newly settled individuals are most commonly found in
seagrass beds, but will occupy marsh edges or unvegetated bottoms when seagrass is not
available (Stunz et al. 2002a). Red drum remain in the estuaries until they reach maturity

51
(three years for males and five years for females), after which they move offshore during
the spawning season (Pattillo et al. 1997).
Larval Care
Larvae were raised from eggs released from broodstock maintained at the
University of Texas Marine Science Institute’s Fisheries and Mariculture Laboratory
(FAML) in Port Aransas, TX. On the day following a spawn, approximately 5,000 (5 ml)
viable (floating) eggs were placed into 150-l conical tanks filled with UV-sterilized sea
water maintained at 27°C and a salinity of 35 ppt. An airstone was placed into each tank
to provide a continuous supply of oxygen. Larvae were fed approximately 400,000
rotifers (Brachionus sp.) per day enriched with Algamac 3050 (Aqua-fauna Bio-Marine,
Hawthorne, CA) for 45 min during days 1 – 11 posthatching (dph). On days 10 and 11,
larvae were also fed approximately 10,000 1-day-old Artemia sp. nauplii. From 12 dph
until testing, larvae were fed approximately 60,000 2-day-old Artemia sp. nauplii twice
per day enriched with Algamac 3050. The hatchery was kept on a 12:12 light:dark cycle.
Larvae were fed between 0800 and 1000 hours each morning.
Kinesis Experiment
This experiment measured the activity of pre-settlement-size (4-10 mm standard
length, SL) red drum larvae exposed to seven different sources of water. Those sources
included (1) 73-µm filtered natural sea water collected from a seagrass bed and from a
tidal inlet on (2) ebb tide and on (3) flood tide, (4) the water source used for rearing

52
larvae (FAML hatchery water), (5) hatchery water mixed with lignin and (6) hatchery
water mixed with tannic acid, and (7) artificial sea water (Instant Ocean®, Spectrum
Brands Holdings, Madison, WI). Artificial sea water and FAML hatchery water were
used as a negative control and control, respectively. The seagrass treatment water was
collected at the seagrass blade/water interface in a Halodule wrightii bed in Redfish Bay,
and the ebb and flood tide water were collected from the Aransas Pass Ship Channel
adjacent to the Marine Science Institute. Hatchery water was treated after being pumped
in from the Corpus Christi Ship Channel and left in outdoor ponds for 1 – 3 weeks to
allow for particulates to settle out. It was then filtered through a pressurized sand filter
and kept in dark outdoor holding containers for at least one week. The water was UV-
sterilized before use in the hatchery. While the chemical composition of the water was
not tested for this experiment, other olfaction studies have found that processes similar to
these remove biologically active molecules and create water with a consistent chemical
composition (Rittschof et al. 1983, Chiussi et al. 2001). The concentrations of lignin (67
μg l-1) and tannic acid (148 μg l-1) used in the experiments were calculated from the mean
dry weight of a T. testudinum blade (0.092 g blade-1; Mumby et al. 1997), the mean
density of T. testudinum in Redfish Bay (1,698 blade m-2; Rooker et al. 1998), the amount
of tannin and lignin in a seagrass blade (11% and 5% DW, respectively; Arnold &
Targett 2002), the average water depth over T. testudinum in Redfish Bay (0.58 m;
Rooker et al. 1998), and the leaching rate of dissolved organic carbon (DOC) from
seagrass (0.5% DOC leached day-1, Maie et al. 2006). These values do not take into
account degradation (photo- or biogenic), but served as a rough estimate of potential

53
concentrations. The calculated value for lignin was on the same order of magnitude as
previous studies on the nearby Nueces River (10.6 μg l-1; Louchouarn et al. 2000). There
are no published data on tannin concentrations in sea water for the local area.
The evening before testing, larvae were transferred from the hatchery to the
experimental room and kept overnight in individual 600-ml beakers filled with 300 ml of
hatchery water or artificial sea water (negative control treatment only). The overnight
acclimation was to ensure plasma cortisol concentrations (which increase as a stress
response during transfer) returned to basal levels (Robertson et al. 1988). The beakers
were placed in a water bath to maintain water temperatures of 27°C. For the negative
control, lignin, and tannic acid treatments, water samples were mixed and stored in glass
aquaria kept at 27°C with underwater heaters. On the morning of the experiment, water
was collected from various field sources and brought back to the laboratory for same-day
use. These water samples were also stored in glass aquaria and maintained at 27°C with
underwater heaters. On each day of testing, two randomly selected treatments were
tested.
Larvae were tested in a 15 × 10 × 35 cm (length × width × height) glass aquarium
in a window-less room with two 60-W incandescent bulbs placed 60 cm above the tank
30 cm apart. This allowed the observer to remain unseen without visual obstructions for
the fish. The fish was given 5 min to acclimate to the testing chamber, after which its
behavior was recorded for 1 min with a Casio High Speed EXILIM HS EX-FH25 video
camera (Casio Computer Company, Ltd., Tokyo, Japan). This testing period was chosen
to both capture the initial reaction to the treatments and represent at least the first hour of

54
settlement behavior as determined by preliminary time period studies on red drum
settlement. Every fish was sacrificed with an overdose of tricaine methansulfonate (MS-
222) immediately following the trial and photographed under a dissecting microscope for
measurement of SL using ImageJ software (U.S. National Institutes of Health, Bethesda,
MD).
Video recordings were converted to image stacks with QuickTime Pro (Apple,
Inc., Cupertino, CA), and two-dimensional swimming behavior was tracked with ImageJ
software. The original framing rate of the camera was 30 frames s-1, and the fish were
tracked using every tenth frame in the stack (three frames s-1). Mean distance from the
bottom of the tank (cm) and mean speed (cm s-1) were calculated from the tracking data.
Taxis Experiment
Two sets of taxis experiments were conducted to test the olfactory preference for
potential settlement cues in larval red drum. In one set, the experimental design included
two size classes (pre-settlement [5 mm SL] and competent [10 mm SL]) and three water
sources (artificial sea water mixed with 67 µg l-1 lignin, sea water collected from a H.
wrightii seagrass bed in Redfish Bay and sea water collected from the Aransas Pass Ship
Channel on flood tide). In the other set of experiments, competent larvae were tested in
FAML hatchery water mixed with 67 µg l-1 lignin or prey (Artemia sp. nauplii) +
artificial sea water. In all trials, artificial sea water was paired with one of the treatments
(above) as a negative control. The water collected from the seagrass bed, the shipping
channel, and the water with the prey were all filtered through a 73-µm filter before

55
experimentation. Water collected from all field sources was used within 24 h of
collection, and all of the other treatments were prepared at least 12 h before trials.
The experimental setup consisted of a 20 × 4 × 2.5 cm (length × width × height)
plexiglass Y-maze (modified from Gerlach et al. 2007, for similar diagram see
supplemental information in Gerlach et al. 2007; Y-maze used in this study had fine mesh
placed at outflow end) fed by a peristaltic pump and silicone tubing from two 2-l beakers:
one containing one of the treatments and one with the negative control (artificial sea
water). Water flowed at a rate of 90 ml min-1 (linear velocity of 0.167 cm s-1) through the
chamber, and dye tests were performed at the beginning of each day to ensure smooth
flow. A 30.5 × 30.5 cm mirror was placed above the Y-maze at a 45° angle for the
researcher to observe the fish from above. Based on the location where laminar flow
broke down and mixing between the two treatments began, three areas of the Y-maze
were identified: a ‘no decision’ area (40 cm2) at the downstream end of the maze and
treatment and control areas (28 cm2 each) at the upstream end on either side of the
chamber.
Larvae were transferred from the hatchery to the experimental room on the
evening before trials and placed into individual 600-ml beakers filled halfway with
artificial sea water (negative control). The beakers were maintained at a constant 27°C in
a water bath. To test the larvae, an individual was placed into the center of the Y-maze
and allowed to acclimate for 5 min with both treatments flowing. The section of the
maze in which the fish was located (control, treatment, or ‘no decision’) was then
recorded every 10 s for 2 min, after which the treatment and control supply tubes were

56
each moved to the other arm of the maze (i.e., water sources were reversed). This switch
controlled for side bias. The fish were then given another 5 min to acclimate, followed
by recording of their position every 10 s for an additional 2 min. In total, each trial took
15 min (10 min for acclimation, 4 min for testing, 1 min for switching of tubes) and
resulted in 24 observations per individual. Each larva was tested only once and was
sacrificed with an overdose of MS-222 after the trial. A photo of each fish was taken
under a dissecting microscope for size measurements using ImageJ software.
Statistical Analyses
Statistical analyses were performed using the R statistical package (R 3.0.2, The
R Foundation for Statistical Computing, http://www.R-project.org). Analysis of
covariance (ANCOVA) was used in the kinesis experiment to test the effects of water
sample (treatment) on mean swimming speed and mean distance from the bottom of the
experimental aquarium with SL as a covariate. Assumptions of the parametric statistical
methods were tested by graphical representation for normality of residuals and variance
comparisons. Tukey contrasts (using the “multcomp” statistical package) were applied
for post-hoc analyses (Hothorn et al. 2008), and were confirmed by comparing
confidence intervals of linear regressions against SL for each treatment.
For each combination of water treatment and size class in the taxis experiment, a
Pearson’s chi-square test with sequential Bonferroni correction (Rice 1989) was used to
determine whether the time spent by larvae in the ‘no decision’ section of the Y-maze
differed from that expected by chance (uniform distribution), based on area. Since the

57
‘no decision’ area was 41% of the testing chamber, the null expectation was 10 out of a
possible tally of 24. If the chi-square test showed that larvae spent less time in the ‘no
decision’ section than expected, a paired t-test with sequential Bonferroni correction
(Rice 1989) was used to determine whether there was a difference in the time spent in the
treatment vs. the control areas.
A two-factor ANOVA, with size class (pre-settlement and competent) and water
treatment was used to compare time spent in the treatment area from only those water
treatments for which both small and large larvae were tested (lignin + artificial sea water,
seagrass water, and shipping channel water). Visual inspection of the residuals and
variances were performed to ensure assumptions were met. Tukey post-hoc tests were
performed to identify significant differences among treatments.
Lignin Analysis
The concentration of dissolved lignin in water samples collected from seagrass
beds and the tidal inlet was measured for comparison with the lignin treatment used in the
experiments. Water samples (10 – 14 l) were collected from seagrass beds in Redfish
Bay on November 6, 2012 (the end of the spawning season, when seagrass beds are in
decline) and July 29, 2013 (immediately preceding red drum spawning, when seagrasses
have the highest densities and shoot heights, Rooker et al. 1998), and 5 l of water were
collected from the Aransas Pass Ship Channel at 1100 hours on May 31, 2014 (peak of
high tide), and kept frozen until lignin analysis. Samples were filtered through a 0.7-μm
Whatman® glass fiber filter (Sigma-Aldrich, St. Louis, MO) to remove particulates.

58
Solid-phase extraction (SPE) through octadecyl carbon moieties (C18) (Empore, 3M
Company, St. Paul, MN) isolated the dissolved organic matter. Cartridges were
pretreated with 20 ml of methanol and 10 ml of Milli-Q Plus UV water to activate the
discs. Water samples were acidified with 12 N HCl to pH 2 and then pumped through the
cartridges using a peristaltic pump with silicone tubing connected to an Erlenmeyer flask
with headspace. After extraction, the cartridges were rinsed with 7 ml of methanol three
times, and the methanol elution was stored in the freezer until processing.
The eluted samples were evaporated to 2 ml in a Hei-VAP rotary evaporator
(Heidolph Instruments, Schwabach, Germany) and then sparged to dryness with N2 at a
temperature of 80°C in 6 ml square Teflon vials (Savillex Corp., Eden Prairie, MN).
Lignin oxidation and phenolic compound extraction followed the procedure of Sun et al.
(personal communication). The following were added to the vials containing the dry
samples: 0.5 g CuO (Fisher Scientific, Fair Lawn, NJ), 0.1 g Fe(NH4)2(SO4)2.6 H2O
(Acros Organics, Fair Lawn, NJ), 10 mg glucose (Sigma-Aldrich, St. Louis, MO), and 5
ml 2 N NaOH (8%, w/w, sparged with Ar and sonicated for 30 min to remove O2). The
mixture was then sparged for 30 min with Ar and quickly capped to minimize mixing
with air. The capped Teflon vials were heated for 3 h in a 150°C oven. Once cooled, the
internal standard (ethyl vanillin) was added.
HCl (12 N) was added to the oxidized samples to bring acidity to pH 2. The
samples were put in the dark to let particulates settle out, then they were centrifuged
(Model 5810 R, Eppendorf International, Hamburg, Germany) and the supernatant was
saved for further analysis. The samples were pushed through C18 cartridges (Analtech

59
Inc., Newark, DE) treated with 3 ml methanol and water at a flow rate of 4 - 5 ml min-1.
The column was dried with N2 for 5 min, and then 2 ml of ethyl acetate was pushed
through the column to elute the lignin oxidation products. The ethyl acetate was
evaporated with N2 while in a 45°C water bath, and then the dried solvent was dissolved
in 2 ml 10% (v:v) methanol:water and sonicated for 1 min. The solutions were analyzed
by a Shimadzu Prominence HPLC (Shimadzu Scientific Instruments, Columbia, MD) in
an Alltima 5 μm, 250 × 4.6 mm C18 column (Alltech Associates, Inc., Deerfield, IL) at
room temperature with a 150-μl injection volume. The separation was performed
according to methods of Sun et al. (personal communication).
RESULTS
Environmental Flow Rates
Water velocity inside the seagrass bed ranged from 0.2 – 15.3 cm s-1, with a mean
flow of 2.4 ± 0.02 cm s-1. Water velocity over the sandy bottom outside the seagrass bed
ranged from 0.03 – 23.0 cm s-1, with a mean flow of 6.0 ± 0.06 cm s-1.
Kinesis Experiment
Testing was carried out on 193 larvae, with 19 – 43 individuals in each treatment,
ranging in size from 4 – 10 mm SL. According to the overall ANCOVA for swimming
speed, there was a significant size × treatment interaction (P < 0.01), where swimming
speed increased more sharply with SL in the lignin treatment compared to a more gradual
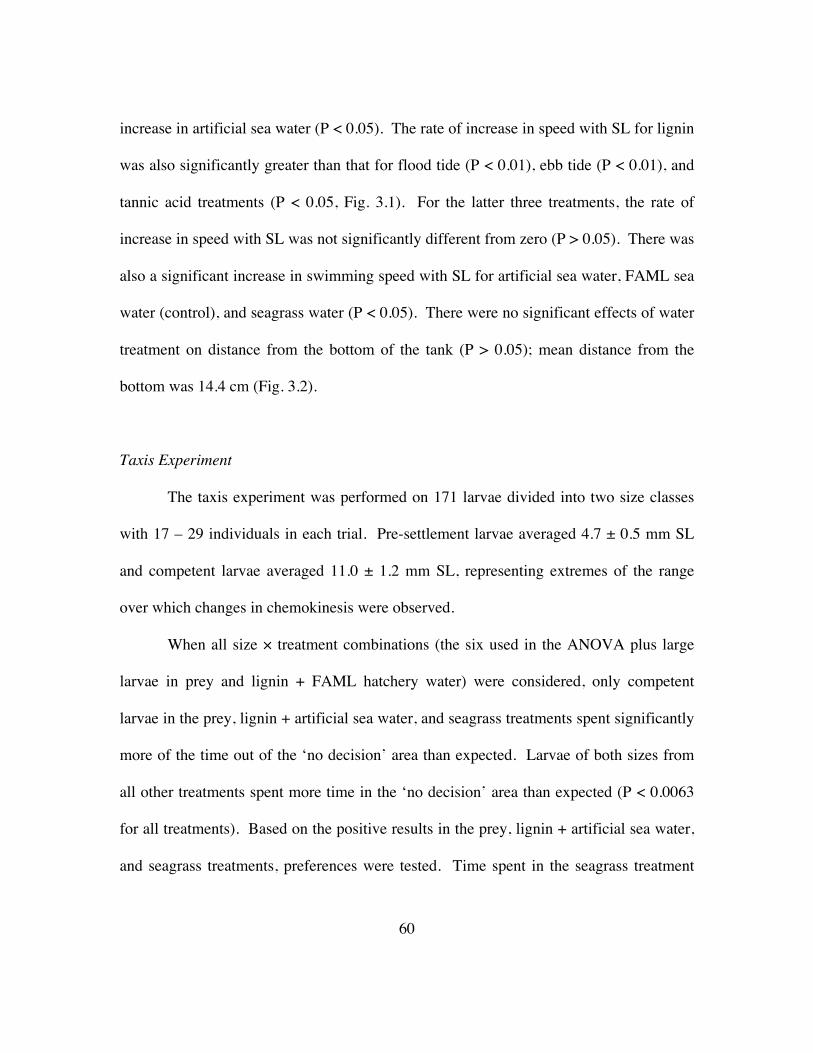
60
increase in artificial sea water (P < 0.05). The rate of increase in speed with SL for lignin
was also significantly greater than that for flood tide (P < 0.01), ebb tide (P < 0.01), and
tannic acid treatments (P < 0.05, Fig. 3.1). For the latter three treatments, the rate of
increase in speed with SL was not significantly different from zero (P > 0.05). There was
also a significant increase in swimming speed with SL for artificial sea water, FAML sea
water (control), and seagrass water (P < 0.05). There were no significant effects of water
treatment on distance from the bottom of the tank (P > 0.05); mean distance from the
bottom was 14.4 cm (Fig. 3.2).
Taxis Experiment
The taxis experiment was performed on 171 larvae divided into two size classes
with 17 – 29 individuals in each trial. Pre-settlement larvae averaged 4.7 ± 0.5 mm SL
and competent larvae averaged 11.0 ± 1.2 mm SL, representing extremes of the range
over which changes in chemokinesis were observed.
When all size × treatment combinations (the six used in the ANOVA plus large
larvae in prey and lignin + FAML hatchery water) were considered, only competent
larvae in the prey, lignin + artificial sea water, and seagrass treatments spent significantly
more of the time out of the ‘no decision’ area than expected. Larvae of both sizes from
all other treatments spent more time in the ‘no decision’ area than expected (P < 0.0063
for all treatments). Based on the positive results in the prey, lignin + artificial sea water,
and seagrass treatments, preferences were tested. Time spent in the seagrass treatment

61
was significantly greater than time spent in the negative control (P < 0.0167) but there
was no preference in prey or lignin + artificial sea water trials (P > 0.05, Table 3.1).
For the trials that included both small and large larvae (lignin + artificial sea
water, seagrass water, and channel water), the size × treatment interaction was not
significant but both size (P < 0.001) and treatment (P < 0.05) had an effect on the amount
of time spent in the treatment area of the Y-maze (Fig. 3.3). Competent larvae spent
more time in the treatment area compared with pre-settlement-size larvae, and larvae
spent more time in the lignin + artificial sea water treatment than the channel water (6.2 ±
6.88 vs. 3.5 ± 5.68 out of a potential score of 24, respectively, P < 0.05).
Lignin Analysis
The lignin concentration in the Aransas Pass Ship Channel was 1.0 μg lignin l-1,
1.1μg l-1 in Redfish Bay in 2012 during seagrass decline, and 1.3 μg l-1 in Redfish Bay in
2013 during the height of seagrass production, assuming 53.1 – 65.6% recovery from the
HPLC analysis.
DISCUSSION
Time spent in an environment is regularly used as a proxy for preference (Atema
et al. 2002, Gerlach et al. 2007, Dixson et al. 2008), so results from the taxis experiment
indicate that settlement-size red drum larvae prefer the olfactory cues of water from the
estuary over those of artificial sea water. Results from both the kinesis and taxis

62
experiments indicate that red drum larvae respond to sea water taken from seagrass beds
and water to which lignin was added at sizes when larvae are competent to settle. Faster
swimming combined with attraction to these water sources would lead competent red
drum to seagrass beds as they swim towards the chemical source. In other words, larvae
should navigate (by either swimming or controlling their water column position to take
advantage of currents) away from the oceanic environment and toward the estuaries,
which contain both allochthonous (terrigenous plants) and autochthonous (seagrass and
marsh plants) sources of lignin (Louchouarn et al. 2000, Mannino & Harvey 2000).
Pre-settlement larvae did not respond to any of the treatments tested, suggesting
either that they respond to these cues in ways other than the behavioral traits measured in
this study, that they perceive the cues but do not or cannot respond to them, or that they
are incapable of detecting olfactory cues and other sensory cues (i.e., treatments not
tested) or modalities (i.e., other senses) are important during this life stage. In the taxis
experiment, pre-settlement larvae spent significantly more time in the ‘no decision’ area
of the testing chamber compared with either the negative control or the treatment areas.
This almost certainly represents a lack of choice by the larvae, since they easily could
have swum against the slow flow in the Y-maze. That flow (0.167 cm s-1) is well below
mean water velocities in a seagrass bed or surrounding bare substrate and similar to the
lowest values measured in those habitats in this study. The maximum sustainable
swimming speed (Ucrit) of red drum larvae, even as small as 4 – 5 mm SL, is
approximately 5 cm s-1 (Faria et al. 2009).

63
Larvae are capable of olfaction at early developmental stages, yet most studies on
the role of olfaction in settlement have limited their observations to competent larvae
(e.g., Huijbers et al. 2008, Leis 2010, Dixson 2011). Both temperate and tropical larvae
have been shown to respond to chemical cues associated with predators or prey shortly
after hatching, however the ontogeny of chemically mediated behavior has not been well
studied (Døving et al. 1994, Dixson et al. 2010). While the olfactory morphology of red
drum larvae has not been studied, behavioral and morphological studies on other species
suggest that it is likely that red drum also have a functional olfactory sense early in
development (Lara 2008, Dixson 2011). Results from the present study show that larvae
do not respond to settlement cues until they are a size at which they are ready to settle
into a benthic habitat (Lara 2008, Dixson 2011). It is not clear whether the response is
innate or learned, since the chemical composition of the control water in which the larvae
were reared is not known, however red drum larvae responded to estuarine-associated
olfactory cues immediately prior to settlement, and probably choose not to respond to
these cue at earlier stages.
Red drum swimming capabilities improve during ontogeny, with average Ucrit
values increasing from 1 to > 22.2 cm s-1 for larvae approximately 2.5 – 18 mm SL (Faria
et al. 2009). Water velocity in the tidal inlet during the spawning season ranges from 5 –
100 cm s-1, with a mean velocity of 35 cm s-1 (Faria et al. 2009). Therefore, it is likely
that young red drum rely on selective tidal stream transport (STST), and settlement-size
larvae use a combination of STST and active swimming to control their spatial position
and navigate towards nursery grounds (Forward et al. 1999, Holt & Holt 2000).

64
Surprisingly, there were no differences in lignin concentration for water samples
collected from the seagrass beds during the annual height of seagrass, seagrass beds in
decline, and the tidal inlet. Levels measured in this study were approximately 10 times
greater than lignin levels in offshore water in the Gulf of Mexico (90.2 ng l-1),
comparable to previous measurements in the same tidal inlet (3.2 μg l-1), and
approximately one order of magnitude less than the nearby Nueces River (10.6 µg l-1,
Louchouarn et al. 2000). While the lignin concentration in the shipping channel matches
previous findings, lignin concentrations in the seagrass bed water were expected to be
higher than they were. This expectation was based on calculations, previous studies on
lignin concentrations in estuaries (Louchouarn et al. 2000, Mannino & Harvey 2000), and
the difference in the quantities of vascular plant in estuaries compared with offshore
environments (Arnold & Targett 2002). Instead, results from this study indicate that the
entire nearshore environment, including the shipping channel, contains a similar lignin
signal. The concentration used in the experiments was 50 times greater than that
measured in the seagrass beds at the peak of production and 4 – 6.3 times greater than
riverine values (Louchouarn et al. 2000, Mannino & Harvey 2000). Caution must be
used when making comparisons between the concentration of lignin (and tannic acid)
used in the experiments and the environmental concentrations. Lignins and tannins are
groups of related molecules comprised of monomers, dimers, and polymers. Up to half
of all phenols in seagrasses can be simple phenolic acids (monomers, Vergeer & Develi
1997). Fish olfactory systems are known to be sensitive to small molecules such as
amino acids (reviewed in Derby & Sorensen 2008), so it is likely that the concentration of

65
phenolic monomers is the relevant reference for larval fishes. Analytical methods for
measuring lignins in seawater require lignin polymers to be hydrolyzed into monomers,
which would result in higher concentrations of monomers than are actually present prior
to analysis. Therefore, the concentrations of lignin monomers in the experiment could
have been of the same magnitude as the actual concentration of lignin monomers in the
environment. The most important conclusion is that larvae responded with both
increased activity and preference to lignin, and further studies are necessary to establish
the specific lignin monomers to which larvae are responding.
Larvae demonstrated a strong response to lignin but not tannin in the kinesis
experiment, despite both substances being produced by nearshore plants. Both are
classes of phenolic compounds, with aromatic properties that could act as potential
olfactory signals (Arnold & Targett 2002). Lignins and condensed tannins are produced
by terrestrial and marine vascular plants, but algae do not produce lignins (though lignins
have been discovered in red algae, Calliarthron cheilosporioides [Martone et al. 2009]).
Tannins, however, (in the form of phlorotannins) are produced by brown algae (Arnold &
Targett 2002). This could make tannins, like salinity, an unreliable cue for settling fishes
to Gulf of Mexico estuaries. The Gulf of Mexico contains millions of tons of brown
algae (Sargassum sp.) that can be found in both nearshore and offshore environments,
which would not provide a signal gradient towards settlement habitats (Gower & King
2009).
Responses to olfactory cues associated with settlement sites have been shown in
other estuarine-dependent species and in those that settle to seagrass beds, however the

66
studies have been limited to quantifying taxis responses in competent individuals
(Huijbers et al. 2008, James et al. 2008, Radford et al. 2012). In laboratory trials,
settlement-stage sparid larvae (Rhabdosargus holubi) spent more time in estuarine and
riverine water compared with sea water controls (James et al. 2008). Radford et al.
(2012) discovered that larval snapper (Pagrus auratus) prefer water collected from
seagrass beds but not water in which seagrass had been soaked, suggesting that snapper
respond to a cue associated with seagrasses other than the seagrass blades (e.g., prey or
conspecifics). In the current study, red drum larvae were found to respond to estuarine
and seagrass cues, but might in fact be responding to contents of the seagrass blades, and
lignin in particular.
Results from this study support recent findings that estuarine vegetation might
produce olfactory cues that competent fish larvae use to locate settlement habitats
(Huijbers et al. 2008, Radford et al. 2012). The results from the kinesis and taxis
experiments (i.e. behavioral responses to lignin and to water from seagrass beds),
combined with the lignin environmental data, indicate that in addition to being important
refuge and foraging areas for newly settled individuals, seagrasses and marsh plants
might be necessary for competent larvae to locate estuaries containing suitable nursery
habitats. Seagrasses and marsh plants are ecosystem engineers, providing services such
as oxygenating surrounding water, stabilizing marine sediments, cycling nutrients, and
providing nursery habitats for many marine vertebrates and invertebrates (Hemminga &
Duarte 2000). Seagrass losses around the globe have risen almost tenfold since the
1970’s, which can be attributed to factors such as increased sedimentation, nutrient

67
loading, invasive species, physical disturbances, fishing and aquaculture practices,
disease, algal blooms, and climate change (Orth et al. 2006). Therefore, even if larvae
are able to occupy other habitats within an estuary (e.g. oyster reefs or unvegetated
bottoms), they might not be able to find these habitats if they rely of seagrass- and marsh
plant-derived olfactory cues for long distance orientation. If larvae do not successfully
settle, the chances of recruiting to the adult population are slim.
This is the first study on the changes in olfactory-related responses to settlement
cues in a subtropical and temperate estuarine-dependent fish species. It demonstrates that
larvae are capable of responding to olfactory cues that emanate from their settlement
habitat when they are competent to settle, and respond to one particular compound within
seagrass but not another. While more research on specific chemical stimuli and
behavioral responses is necessary, this study draws attention to the potentially necessary
role of live seagrasses not only in providing nursery habitats for newly settled larvae, but
in attracting competent larvae toward estuaries prior to settlement.

68
Table 3.1. Results of the taxis experiment. Mean percentage of time (± SE) in the ‘treatment’, ‘negative control’, and ‘no decision’ areas of the Y-maze for each size class. (n) represents negative control and (c) represents control. * indicates significantly less times spent in the no decision area; † indicates significantly more time spent in a treatment area compared with the control.
Treatment Size Time in Time in Time in class no decision negative control treatment channel small 99.8 ± 2.1 1.5 ± 0.9 0.3 ± 0.3 lignin (n) small 72.5 ± 8.1 12.5 ± 5.3 15.2 ± 5.7 seagrass small 86.8 ± 5.9 6.8 ± 4.0 6.4 ± 2.9 prey large 36.8 ± 7.0* 27.9 ± 4.9 35.3 ± 5.6 channel large 53.0 ± 6.0 21.4 ± 3.7 27.0 ± 5.0 lignin (n) large 40.0 ± 8.0* 22.2 ± 5.4 37.7 ± 6.6 lignin (c) large 41.1 ± 5.4 27.7 ± 3.2 31.0 ± 4.2 seagrass large 35.2 ± 5.4* 24.6 ± 3.4 40.8 ± 4.7†

69
Fig. 3.1. Results from kinesis experiment. Swimming speed for larva spanning a range of sizes in (a) flood tide, (b) ebb tide, (c) control, (d) lignin, (e) tannic acid, and (f) seagrass water. Black points and regression line represent treatment, gray points and regression line represent artificial sea water (negative control).
a
0.0
0.3
0.6
0.9
b
c
0.0
0.3
0.6
0.9
Spe
ed (c
m/s
)
d
e
0.0
0.3
0.6
0.9
4 6 8 10Size (mm SL)
f
4 6 8 10Size (mm SL)

70
Fig. 3.2. Results from the kinesis experiment. Mean distance from the bottom was not significantly affected by size, treatment, or the interaction between them (ANCOVA, P > 0.05). Median and the first and third quartiles are represented by the box, diamonds are the mean, whiskers are 1.5 times the interquartile range.
0
10
20
30
negative control control ebb flood lignin tannic acid seagrassTreatment
Mea
n di
stan
ce fr
om th
e bo
ttom
(cm
)

71
Fig. 3.3. Results from the taxis experiment. Preference for treatment (tallies in treatment area) was (a) greater for lignin compared with channel water and (b) greater for large larvae than small larvae (P < 0.05, ANOVA with Tukey post-hoc comparison). Median and the first and third quartiles are represented by the box, diamonds are the mean, whiskers are 1.5 times the interquartile range, and closed circles represent outliers.
a b aba
0
5
10
15
20
25
channel lignin seagrassTreatment
Pre
fere
nce
(cou
nt in
trea
tmen
t)
*b
small largeSize (mm SL)

72
Chapter 4: Depth preference in settling red drum (Sciaenops ocellatus)
larvae in relation to benthic habitat color and water column depth
ABSTRACT
A variety of sensory cues could be operating to aid larval fishes in finding benthic
settlement habitat. Visual cues are thought to be the most important when adequate light
is available, even though they are only effective over short distances. The effects of
substrate color (black, sand, and green) at two water column heights (85 and 33.3 cm)
were tested on settlement behavior (distance from bottom and activity) of red drum,
Sciaenops ocellatus, at pre-settlement, settlement, and post-settlement sizes. There was
no effect of substrate color or water column height on mean distance from bottom or
activity for settlement- and post-settlement-size fish. Pre-settlement larvae in the deeper
water column exhibited greater activity (variability in distance from bottom) than those in
the shallower water column (9.6 ± 7.1 vs. 5.6 ± 4.1 cm, respectively). Pre-settlement
larvae were closer to the bottom in the shallower water column compared with the deeper
water column (18.5 ± 9.1 vs. 44.3 ± 27.6 cm, respectively), since larvae reside close to
the water surface at this stage. Larvae over green and sand substrates were closer to the
bottom in the shallower water column compared to the same color substrate in the deeper
water column (19.4 ± 9.0 vs. 53.1 ± 27.7 cm over green, and 15.1 ± 9.6 vs. 41.4 ± 26.4
cm over sand). However, there was no difference in mean depth over the black substrate

73
for the pre-settlement larvae (21.0 ± 7.9 and 39.1 ± 27.9 cm for shallow and deep,
respectively). These results suggest that presettlement-size larvae modify their behavior
according to benthic visual cues, but are not affected by the same cues after reaching
settlement size. Larvae avoid the lighter colors found in shallow estuaries (green and
sand) at sizes smaller than competency to settle, but do not change their depth in the
presence of dark bottoms, which they would encounter in an offshore environment.
INTRODUCTION
The majority of marine fishes spend their egg and larval stages in the pelagic
environment, and their juvenile and adult stages associated with benthic habitats. The
transition between the pelagic and benthic stages is known as settlement – a period that
can take minutes to weeks depending on the species, habitat requirements, and
environmental conditions (Victor 1982, 1986; McCormick & Makey 1997; White et al.
2013). It is a period of high mortality, leaving new settlers vulnerable to predation and
starvation (Doherty et al. 2004, Fuiman et al. 2010). To maximize their chances of
survival, individuals must seek out or be transported to suitable settlement habitat.
Many fishes settle actively, sensing, orienting, and moving towards habitat cues
by controlling their spatial position through swimming and current selection (Leis &
Carson-Ewart 1999, Armsworth 2000, Kingsford et al. 2002, Montgomery et al. 2006).
Most of what we know about the use of cues by larvae is conjecture, but studies over the
past few decades have begun to resolve some of the signals to which larvae are

74
responding (Kingsford et al. 2002, Dixson et al. 2008, Simpson et al. 2008). There are
multiple potential settlement cues available for late-stage larvae, including olfactory,
auditory (both biogenic and non-biogenic), magnetic, mechanosensory, and visual. It is
also likely that these signals do not operate in isolation, but rather simultaneously or
consecutively (Huijbers et al. 2012). Cues operate over different spatial scales. For
example, magnetic and celestial cues may be transmitted over entire ocean basins, while
particle displacement and acceleration might be detectable over much smaller distances
(Kingsford et al. 2002).
Vision operates effectively over the smallest spatial scale. Even in clear waters, it
is unlikely that fishes would be able to see objects more than 50 m away (Kingsford et al.
2002). Vision is probably most important for discriminating microhabitats once a larva
has settled, and it is the dominant sensory system on small spatial scales (McFarland
1991, Lecchini et al. 2005). The majority of experiments on the use of vision in habitat
selection have been on coral reef fishes, which typically experience clear water and a
variety of substrates in a small area (Lecchini et al. 2007a, McCormick et al. 2010). In
contrast, estuarine fishes are often found in turbid systems that have less variety in
benthic habitat. Little is know about their visual response to different substrates.
This study examined the influence of vision on settlement behavior of a
subtropical and temperate estuarine fish (red drum, Sciaenops ocellatus) using laboratory
experiments. The effects of substrate color and water-column depth on mean vertical
position and activity of S. ocellatus at three early life stages: pre-settlement, settlement,
and post-settlement, were tested to determine both the changes in behavior through

75
ontogeny and the effects of habitat characteristics on settlement. Substrate colors were
chosen to represent the three general colors red drum larvae would encounter when
moving from the pelagic environment (black, to represent a dark, deep water control) to
shallower estuaries: sand (unvegetated) and green (seagrass beds). In addition to the
variety of substrate colors, larvae may also settle from a variety of water depths. Two
depths (33.3 and 85 cm) were chosen to better understand settlement behavior across
realistic estuarine depth gradients (Rooker et al. 1998). It was hypothesized that
settlement-size larvae would be closer to the bottom over green and yellow substrates
compared with black. It was also hypothesized that pre-settlement larvae would be close
to the surface of the water column regardless of benthic color, and post-settlement larvae
would be close to the bottom regardless of bottom color. Activity would be lowest for
post-settlement larvae compared with pre-settlement- and settlement-size larvae since
they have taken up a benthic residence.
METHODS
Study species
Red drum is a common estuarine fish species that inhabits Western Atlantic
temperate and subtropical waters. Off Texas, it spawns in late summer and early fall
offshore or near tidal inlets, and the eggs and larvae spend approximately three weeks
offshore and/or in the inlets before reaching the bays and estuaries (Holt et al. 1983).
Recent arrivals of larvae in the estuary are most commonly associated with seagrass beds,
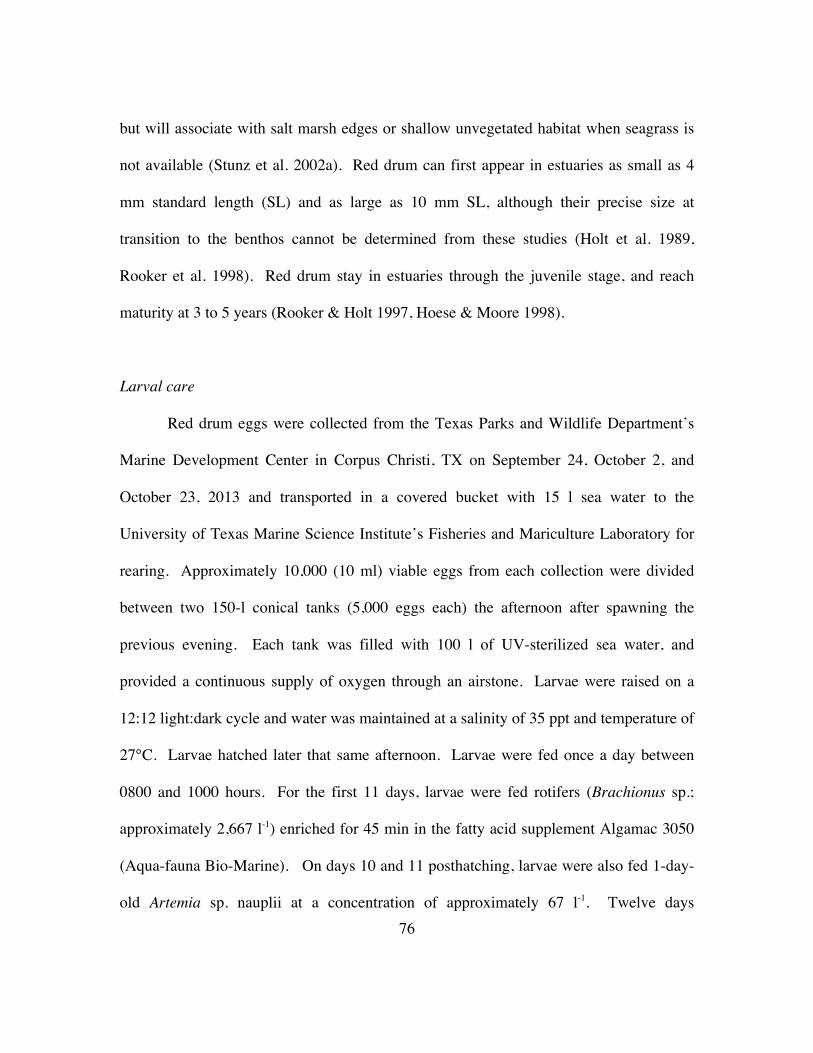
76
but will associate with salt marsh edges or shallow unvegetated habitat when seagrass is
not available (Stunz et al. 2002a). Red drum can first appear in estuaries as small as 4
mm standard length (SL) and as large as 10 mm SL, although their precise size at
transition to the benthos cannot be determined from these studies (Holt et al. 1989,
Rooker et al. 1998). Red drum stay in estuaries through the juvenile stage, and reach
maturity at 3 to 5 years (Rooker & Holt 1997, Hoese & Moore 1998).
Larval care
Red drum eggs were collected from the Texas Parks and Wildlife Department’s
Marine Development Center in Corpus Christi, TX on September 24, October 2, and
October 23, 2013 and transported in a covered bucket with 15 l sea water to the
University of Texas Marine Science Institute’s Fisheries and Mariculture Laboratory for
rearing. Approximately 10,000 (10 ml) viable eggs from each collection were divided
between two 150-l conical tanks (5,000 eggs each) the afternoon after spawning the
previous evening. Each tank was filled with 100 l of UV-sterilized sea water, and
provided a continuous supply of oxygen through an airstone. Larvae were raised on a
12:12 light:dark cycle and water was maintained at a salinity of 35 ppt and temperature of
27°C. Larvae hatched later that same afternoon. Larvae were fed once a day between
0800 and 1000 hours. For the first 11 days, larvae were fed rotifers (Brachionus sp.;
approximately 2,667 l-1) enriched for 45 min in the fatty acid supplement Algamac 3050
(Aqua-fauna Bio-Marine). On days 10 and 11 posthatching, larvae were also fed 1-day-
old Artemia sp. nauplii at a concentration of approximately 67 l-1. Twelve days

77
posthatching (dph), larvae were switched to a diet of 2-day-old Artemia sp. nauplii
(approximately 400 l-1) enriched for 16 h in Algamac 3050. Larvae were tested at three
separate size classes: pre-settlement (4 – 8 cm standard length, SL), settlement (11 – 13
cm SL) and post-settlement (16 – 21 cm SL). These sizes were chosen based on the
experimentally determined settlement size (Chapter 5).
Behavioral Assays
Most studies on the role of vision in the settlement process consist of binary or
multi-choice experiments for coral reef fishes in arenas that are less than two meters in
length (Booth 1992; Lecchini et al. 2005, 2007a; McCormick et al. 2010, Huijbers et al.
2012). This is a reasonable scale; Lecchini et al. (2005) discovered that the coral reef fish
Chromis viridis only responds to substrate less than 75 cm away. However, for estuarine
fishes, having multiple habitats within their field of view is less likely, therefore it is
more appropriate to test the strength of attraction towards one substrate at a time.
Experiments were conducted to determine the effect of water-column depth and
substrate color on mean distance from the bottom and activity of young red drum. On the
experimental days, larvae were transferred from the conical tanks to the experiment
room. They were kept individually in 600-ml beakers filled with 200 ml of sterilized sea
water and placed in a water bath maintained at 27°C for at least three hours to lower
stress (cortisol) levels (Robertson et al. 1988) until testing.
The testing chamber was a cylindrical acrylic tube (25 cm × 95 cm diameter ×
height) filled with sterilized sea water to a depth of either 33.3 or 85 cm. A 1000-W

78
halogen lamp hung 1.2 m above the top of the tank to mimic natural sunlight intensity
(approximately 100,000 lux mean intensity, measured with an SM700 Smart Lux Meter
[Milwaukee Instruments, Rocky Mount, NC] in natural sunlight at sea level) during the
red drum spawning and settlement period on the Texas coast (August to November). A
black (CMYK scale: 72, 66, 74%), olive green (80, 44, 100, 47%), or sand (17, 56, 100,
3%) colored paper was placed underneath the chamber to mimic different colored
substrates red drum might encounter in nature (deep bottom, seagrass, and unvegetated
bottom, respectively). Five-cm increments were marked on the chamber for determining
fish depth. Water temperature was maintained with submersible heaters whenever an
experiment was not taking place, and experiments ran for 2 h, followed by a half hour
break to avoid overheating the surface water with the overhead lamps. These time
periods were sufficient to maintain the surface water temperature under 30°C. There
were two chambers 30 cm apart, which allowed for two fish to be tested at a time (one in
each tank).
To test the fish, an individual was transferred from the beaker to the testing
chamber and allowed to acclimate for 5 min. Its distance from the bottom was recorded
every 10 s for 5 min by noting the nearest 5-cm increment on the chamber. This testing
period was chosen to capture the initial reaction to the treatments, while representing at
least the first hour of settlement behavior as determined by preliminary studies on red
drum settlement. From these data its mean distance from the bottom was computed. The
standard deviation (SD) of its vertical positions over the 5-min period was calculated as a
measure of activity. At the end of the 5-min trial the fish were sacrificed with an

79
overdose of tricaine methansulfonate (MS-222). The SL of pre-settlement fish was
measured under a dissecting microscope using Image Processing and Analysis in Java
software (ImageJ, U.S. National Institutes of Health, Bethesda, MD). The settlement and
post-settlement fish were measured to the nearest mm using a ruler.
Statistical Analyses
Statistical analyses were performed in R (R 3.0.2, The R Foundation for
Statistical Computing, http://www.R-project.org) to determine the effects of color and
depth on activity and mean distance from the bottom. The three size classes (pre-
settlement, settlement, and post-settlement) were analyzed separately. The variances
were unequal between the two depth treatments and could not be equalized with
transformations. Therefore, a nonparametric Kruskal-Wallis one-way ANOVA by rank
was used to test for overall effects of color and water-column depth, followed by a Mann-
Whitney U-Test to test for pairwise differences among colors within each depth (three
comparisons within both the shallower and deeper water-columns) and between water-
column depths within each color (1 comparison for each of the 3 colors). In total, there
were 11 statistical comparisons, which required a sequential Bonferroni correction (Rice
1989) to be considered significant.
RESULTS
There were 139 pre-settlement-, 160 settlement-, and 121 post-settlement-size fish
tested, with 19 to 40 individuals in each treatment. For pre-settlement fish, mean

80
distance from the bottom ± SD was significantly less in the shallower than the deeper
water column (18 ± 9 cm vs. 44 ± 28 cm, respectively, Table 4.1). Substrate color did
not have an overall effect on mean distance from the bottom (37 ± 27. 31 ± 23, 29 ± 24
cm for green, black, and sand, respectively), however water-column depth did affect the
larval distance from the bottom with the green and sand substrate colors but not the black
substrate (Table 4.2, Fig. 4.1).
Water-column depth had a significant effect on activity in pre-settlement fish,
with a mean activity of 5.6 ± 4.1 cm in the shallower water and 9.6 ± 7.1 cm in the deeper
water, respectively (Table 4.3). The effect of bottom color on activity was not significant
and there was no significant effect of color within depth treatments, nor effects of depth
within color treatments (Table 4.3).
Neither water column depth nor substrate color had an effect on mean distance
from the bottom or activity for settlement-size and post-settlement-size fish (Fig. 4.1,
Tables 4.1 and 4.3). The effects of color within depth treatments and the effects of depth
within color treatments were also not significant for both mean distance from the bottom
and activity. Mean distance from the bottom was 8 ± 8 cm and 4 ± 5 cm for the
settlement- and post-settlement-size fish, respectively. Mean activity was 5.8 ± 4.1 cm
and 3.4 ± 4.2 cm for the settlement- and post-settlement–size fish.

81
DISCUSSION
Water-column depth and benthic color did not affect the position or activity of
settlement-, or post-settlement-size fish, as they had low activity levels and were closely
associated with the bottom. This was predicted for post-settlement fish, however the
similar behavior in settlement-sized fish was not expected. The 11 – 13 mm SL range
was chosen for settlement size because of previous studies on settlement size to a sand
substrate. It was discovered that while red drum enter the estuaries at approximately half
that size (Rooker et al. 1998), they do not move out of the water column until 12 – 13
mm SL (see Chapter 5). The fish in the current study displayed less variability around
their preferred depth than predicted, but the settlement results are consistent with
previous work (Chapter 5).
Pre-settlement larvae were influenced by water-column depth; they occupied a
position farther from the bottom (closer to the surface) and were more active in the
deeper water column. Since pre-settlement larvae are pelagic, it makes sense that they
would take advantage of the larger volume of water column associated with the deeper
water. Their pre-settlement niche also explains the observed patterns in their responses to
benthic color. Pre-settlement larvae showed no difference in depth preference when the
substrate was black (control), the treatment they would most closely be exposed to in
nature at this stage of life. However, in the presence of the unvegetated- and seagrass-
associated colors, they moved further from the bottom when the water column allowed it
(in the deep water treatment). This implies that they might not be ready for those shallow
water habitats and avoid associating with them, using benthic color as a cue for

82
positioning themselves in the water column. It would be interesting to see if there is an
intermediate size between pre-settlement and settlement where larvae switch from
avoidance to attraction in the presence of sand and green colors.
This study was performed using water that had been filtered to remove suspended
particles, however estuaries can be more turbid during periods of heavy precipitation,
winds, or riverine discharge. During the 2013 red drum spawning season (August 30 –
November 30), turbidity ranged from 0 – 99 nephelometric turbidity units (NTU) in the
Aransas Pass Ship Channel (pelagic environment), and from 1 – 188 NTU in Aransas
Bay (estuarine settlement site) (data collected by the Mission-Aransas National Estuarine
Research Reserve and obtained from cdmo.baruch.sc.edu). Effects of turbidity on
feeding have been studied extensively (Benfield & Minello 1996, Rowe et al. 2003). For
example, turbidity of 160 NTU has been shown to reduce growth rates in rainbow trout,
Oncorhynchus mykiss, without interfering with feeding rates (Herbert & Richards 1963,
Rowe et al. 2003). This is because turbidity reduces the size of prey the fish will attack,
resulting in less total food intake. Turbidity can affect spatial distribution of adult fishes
and has an effect on settlement behavior at much lower levels for coral reef fishes.
Studies found that < 10 NTU resulted in modifications in the habitat choice by
Pomacentrus moluccensis, and a loss of ability to discern chemosensory habitat cues
(Roberts et al. 1992, Rowe et al. 2001, Wenger et al. 2011, Wenger & McCormick 2013).
The role of turbidity in habitat selection by estuarine fishes is still unclear.
In a study on red drum phototactic behavior, Stearns et al. (1994) found that
despite turbidity in the local environment, downwelling light levels during midday are 35

83
to 350 times the minimum thresholds required for larval red drum feeding at the bottom
of Lydia Ann Channel in Port Aransas, Texas (depth = 8 m). Due to the limitations of
using artificial lighting in the laboratory, caution should be taken when comparing results
to natural conditions. In particular, this study did not attempt to recreate in the laboratory
a natural angular light distribution, and behavioral responses can be different under those
conditions (Swift & Forward 1988). Nevertheless, most of the visible light spectrum is
available in the local environment at the depths tested in this study (Stearns et al. 1994).
Red and blue spectral bands are absorbed more rapidly at depths > 1 m compared with
mid-spectrum wavelengths (green and yellow). The colors used in the current study
represent the mid-spectrum levels, which transmit greater distances into the water column
(Stearns et al. 1994). The water depths used were both shallow enough for the benthic
color to be seen from the surface of the water column but deep enough to represent actual
local estuarine water depths (Stearns et al. 1994, Rooker et al. 1998).
Larval red drum undergo substantial improvements in the visual system during
ontogeny (Fuiman & Delbos 1998, Poling & Fuiman 1998). There is an increase in
visual acuity (resolution), which can explain the increased responsiveness and decreased
response latency to predators through development (Fuiman et al. 1999). Visual acuity is
still poor in individuals first entering the estuaries, and though it is necessary for
effectively escaping predators, sufficient improvements do not coincide with the
movement from offshore to inshore (Poling & Fuiman 1998). Significant improvements
in visual resolution do coincide with settlement, when red drum enter the seagrass beds
(Poling & Fuiman 1998). Visual sensitivity, which is determined by the lowest

84
detectable light intensity, also improves around the time of settlement (Fuiman & Delbos
1998, Poling & Fuiman 1998). Rods appear in the retina around the time larvae enter the
estuaries, and photoreceptor density increases around settlement size. These changes to
the visual system might be necessary when transitioning from well-lit surface waters to
the poorly-lit seagrass beds, where irradiance can be 10% of the levels found outside of
the beds (James & Heck 1994). Prior to this developmental stage, red drum larvae are
capable of visually mediated responses to prey or habitat, but might not be competent to
settle.
Changes to the visual system in relation to settlement have been studied in other
fishes as well. Eye development does not differ greatly among species, though the timing
and rate of change can be correlated with lifestyle (Shand 1997, Lara 2001). For scarids
and labrids that bury themselves in the sediment during settlement, rods only begin to
appear during the burial period (Lara 2001). In these same fishes, retinal organization
and increased acuity also coincide with settlement, and this pattern holds true for P.
moluccensis and Upeneus tragula (Mullidae) as well (Shand 1993, 1994, 1997; Lara
2001). For fishes that do not bury themselves in sediment but have a distinct
metamorphosis, rods first begin appearing during this phase (Blaxter & Staines 1970). It
is therefore possible that the ability to see at low light levels (in structured habitat) is a
factor in competency to settle for many fish species, while color perception is important
starting at an earlier life stage (in the water column, with higher light intensities).
This is one of the first studies to combine the influence of benthic color and
water-column depth on the vertical position and activity of a subtropical and temperate

85
estuarine fish. While color or depth did not influence behavior for settlement- or post-
settlement-size fish, colors associated with an estuarine habitat did evoke a behavioral
response in pre-settlement larvae. Future research could incorporate various turbidity and
light levels to mimic a more realistic environment and determine the time of day that
these larvae might be transitioning to the benthos.

86
Table 4.1. Significance of pairwise tests for differences in mean distance from the bottom (cm) as a function of water-column depth and substrate color for pre-settlement-, settlement-, and post-settlement-size red drum. (s), and (d) represent shallower and deeper water columns, and (B), (G), and (S) represent black, green, and sand substrate colors, respectively. Bold indicates significant difference according to sequential Bonferroni correction.
pre-settlement settlement postsettlement Effect P-value P-value P-value depth <0.001 0.091 0.407
G(s vs. d) <0.001 0.812 0.829 S(s vs. d) <0.001 0.187 0.553 B(s vs. d) 0.012 0.150 0.069
color 0.337 0.318 0.651 s(G vs. S) 0.155 0.596 0.260 s(G vs. B) 0.503 0.069 0.509 s(S vs. B) 0.038 0.508 0.091 d(G vs. S) 0.093 0.391 0.690 d(G vs. B) 0.149 0.851 0.286 d(S vs. B) 0.749 0.395 0.648

87
Table 4.2. Mean distance from the bottom (cm ± SD) for pre-settlement-, settlement-, and post-settlement-size red drum in shallower (s) and deeper (d) water columns over green (G), sand (S), and black (B) substrates.
Color pre-settlement settlement post-settlement s d s d s d G 19 ± 9 53 ± 28 7 ± 6 8 ± 7 3 ± 5 3 ± 3 S 15 ± 10 41 ± 26 10 ± 9 6 ± 7 4 ± 6 5 ± 6 B 21 ± 8 39 ± 28 10 ± 6 9 ± 10 2 ± 3 5 ± 7

88
Table 4.3. Differences in activity (SD of mean distance from bottom) as a function of water-column depth and substrate color for pre-settlement-, settlement-, and post-settlement-size red drum. (s) and (d) represent shallower and deeper water columns, and (B), (G), and (S) represent black, green, and sand substrate colors, respectively. Bold indicates significant difference according to sequential Bonferroni correction.
pre-settlement settlement post-settlement Effect P-value P-value P-value depth < 0.001 0.189 0.375
G(s vs. d) 0.104 0.887 0.760 S(s vs. d) 0.016 0.549 0.480 B(s vs. d) 0.082 0.058 0.039
color 0.080 0.247 0.565 s(G vs. S) 0.025 0.930 0.243 s(G vs. B) 0.117 0.018 0.364 s(S vs. B) 0.422 0.075 0.030 d(G vs. S) 0.170 0.406 0.968 d(G vs. B) 0.337 0.714 0.542 d(S vs. B) 0.823 0.714 0.659

89
Table 4.4. Mean activity (cm ± SD) for pre-settlement, settlement-, and post-settlement-size red drum in shallower (s) and deeper (d) water columns over green (G), sand (S), and black (B) substrates.
Color pre-settlement settlement post-settlement s d s d s d G 7.4 ± 4.8 11.5 ± 7.9 5.3 ± 2.9 6.0 ± 4.8 2.8 ± 2.9 2.9 ± 2.5 S 4.4 ± 2.9 8.2 ± 5.6 5.4 ± 3.7 5.2 ± 5.5 3.6 ± 2.7 4.9 ± 7.1 B 5.2 ± 4.0 9.3 ± 7.5 7.2 ± 3.4 5.8 ± 4.8 1.8 ± 1.9 4.5 ± 5.6

90
Fig. 4.1. Mean distance from the bottom and activity of pre-settlement- (a, b), settlement- (c, d), and post-settlement-size (e, f) red drum as a function of water column depth and color. Black represents black, dark gray represents green, and light gray represents sand substrates. Median and first and third quartiles are represented by the boxes, and whiskers are 1.5 times the interquartile range with black points representing extreme points. Significance of statistical comparisons is shown in Tables 1 and 3.
a
0
20
40
60
80 b
0
10
20
30
c
0
20
40
60
80
Mea
n di
stan
ce fr
om b
otto
m (c
m)
d
0
10
20
30
Act
ivity
(mea
n de
pth
sd)
e
0
20
40
60
80
Shallow DeepDepth
f
0
10
20
30
Shallow DeepDepth

91
Chapter 5: Benthic habitat properties can delay settlement in a
temperate and subtropical estuarine fish (Sciaenops ocellatus)
ABSTRACT
Settlement is arguably the last stage of high mortality in the life cycle of demersal
marine fishes, making the number of larvae that successfully settle to a benthic habitat a
reasonable predictor of future population size. Habitat selection during settlement is
likely an active process, however, much of what we know about settlement processes
comes from research focused exclusively on coral reef ecosystems. This study used
laboratory and field experiments to examine the relationship between larval size and
settlement over various substrates in red drum (Sciaenops ocellatus), a temperate and
subtropical estuarine-dependent species. In the laboratory, vertical position was recorded
every 10 s for larvae spanning a range of sizes (4.3 – 40.0 mm SL) in the presence of
sand, oyster shells, or seagrass to determine median settlement size. Median settlement
size was 12.9 mm SL for seagrass, 15.8 mm SL for sand, and 20.5 mm SL for oyster
shells. To determine settlement size in the wild, vertically partitioned field enclosures
were used to separate and quantify individuals in the water column from those that settled
into the seagrass. Larvae in the water column were smaller than larvae in the seagrass
(9.3 vs. 14.3 mm SL), with a median settlement size of 12.2 mm SL. Previous studies
reported that red drum reach nursery habitats at 6 – 8 mm SL, but this study suggests that

92
they do not use the complex habitats at first. Further, red drum settled at different sizes
to sand, oyster shells, and seagrass. These findings are interpreted as evidence for habitat
preference and active settlement in an estuarine-dependent fish species.
INTRODUCTION
Many marine organisms have bipartite life histories consisting of a pelagic larval
phase followed by demersal juvenile and adult phases. The shift from the pelagic to the
benthic environment, known as settlement, occurs when an individual outgrows the
ability to exploit water-column resources, thus changing to a substrate-associated niche
(Werner 1988). Settlement is usually the last stage of high mortality in the life cycle, at
times exceeding 50% within the first 24 hours of association with the benthos (Doherty et
al. 2004, Fuiman et al. 2010, McCormick & Meekan 2010). Therefore, success or failure
around the time of settlement contributes to the order-of-magnitude variations in adult
population sizes across spatial and temporal scales, which greatly impact fisheries and
local ecology (Cowan & Shaw 2002).
Settling individuals first associate with juvenile habitats after transitioning to the
benthos. Juvenile habitats include all areas occupied by individuals prior to moving to
the adult habitat, usually occurring at the onset of reproduction (Beck et al. 2001). Most
juveniles associate with nursery grounds (though not all nurseries are benthic) or
effective juvenile habitats (EJH), which provide shelter from predators and food for
growth. Habitats are considered nurseries if they produce more juveniles that recruit to

93
the adult population than a different habitat of the same size that also contain juveniles,
and EJH are habitats that contribute a greater proportion of individuals to the adult stock
than the mean level contributed by all juvenile habitats (Beck et al. 2001, Dahlgren et al.
2006). While specific habitats may be critical for the survival of some species, it is more
likely that fishes can use a range of habitats during the juvenile phase (Butler & Jernakoff
1999, Petrik et al. 1999). Wetlands (i.e., salt marshes and mangroves) and seagrass beds
are the most commonly studied nursery habitats, but oyster reefs, rocky substrata, or sand
flats might be occupied by juveniles as well (Orth et al. 1984, Beck et al. 2001, Neahr et
al. 2010).
Settlement is generally considered to be a swift process in order to reduce
mortality risk (Wilbur 1980, Victor 1982, Bell & Westoby 1986). Nevertheless, a few
studies on coral reef fishes have found that the settlement transition can last for several
weeks (Kaufman et al. 1992, McCormick & Makey 1997, Lecchini et al. 2012, White et
al. 2013). These fishes may not have developed juvenile behavior or undergone
metamorphosis and therefore do not immediately utilize the juvenile habitat and recruit to
the juvenile population (here, recruitment is defined as the establishment of an individual
in the juvenile stock, Kaufman et al. 1992).
Bell & Westoby (1986) suggested that while different environments within
nursery grounds could result in varying degrees of fitness for inhabitants, an individual
that is competent to settle should settle onto the first structured substrate it encounters,
regardless of quality. According to this ‘settle-and-stay’ hypothesis, rejecting the first
site would result in an increased risk of predation, since any benthic structure is safer than

94
the water column (Bell & Westoby 1986). Organisms are expected to seek out more
suitable microhabitats within the expanse of substrate after initial settlement, even though
moving across unvegetated areas could also increase predation risk (Bell & Westoby
1986).
Aside from the few studies in coral reef fishes, most studies on habitat preference
during settlement in marine fishes have consisted of observations and collections of
settled individuals (Lubbers et al. 1990, Gray et al. 1996, Nagelkerken et al. 2000,
Jenkins & Hamer 2001, Nuraini et al. 2007, Espino et al. 2011). While these studies are
useful for understanding recruitment, they cannot explain the factors that influenced
settlement and the resulting spatial distribution of juveniles. For example, the
distribution of juveniles in benthic habitats could be the result of individuals actively
searching for a specific habitat during the settlement process, or settling randomly
regardless of habitat, with those in higher quality habitats profiting from greater
resistance to hydrodynamics (i.e. less likely to be flushed out of the system) or lower
post-settlement mortality compared to those in surrounding habitats. The ‘settle-and-
stay” hypothesis predicts a swift transition from the water column to the benthos when an
individual outgrows its ability to exploit water-column resources. If a beneficial
(structured) habitat is available, an individual should settle as soon as it becomes
ontogenetically competent. Settling to an inferior habitat (bare substrate) should take
place only when beneficial habitat is not available, and that would occur at a larger size
because the fish postpones settlement as long as possible to find beneficial habitat.

95
The main objective of this study was to determine if the settle-and-stay hypothesis
proposed by Bell and Westoby (1986) applies to a temperate and subtropical estuarine
fish species, the red drum, Sciaenops ocellatus, as suggested by Stunz et al. (2002b). The
vertical distribution of larvae over a range of sizes was tested both in the field and
laboratory to determine mean size at settlement and settlement behavior over several
potential nursery substrates. These findings fill in a critical gap in the understanding of
marine fish settlement, and have implications for management of estuarine fisheries.
METHODS
Study species
Red drum occur in the Gulf of Mexico and Atlantic waters of North America as
far north as North Carolina (Beckman 1988, Hoese & Moore 1998). Males reach
maturity in three years and females in five years, at about 70 cm fork length (Hoese &
Moore 1998). In Texas waters, they form spawning aggregations offshore or along the
coast during the fall. Eggs and young larvae are brought into estuaries by tidal currents
(Holt et al. 1983, Holt et al. 1989). Larvae spend approximately three weeks in the
pelagic phase before appearing in shallow (0-1.5 m depth) seagrass beds, marsh edges, or
unvegetated bottoms (at about 7 mm SL; Holt et al. 1983, Stunz et al. 2002a, Pérez-
Domínguez 2004). They spend the remainder of their subadult phase in these estuaries
and move offshore as adults in the fall and winter (Pattillo et al. 1997).
Laboratory Study

96
A laboratory experiment was conducted to test the settle-and-stay hypothesis for red
drum larvae by determining settlement size for each of three substrates (sand, seagrass,
and oyster shells). The hypothesis predicts no difference among substrates in size at
settlement. Differences in settlement size among the three substrates would indicate
delayed settlement and the potential for active habitat selection in this species.
Larval Care
Four batches of eggs were collected from captive adults maintained at the Texas
Parks and Wildlife Department’s Marine Development Center in Corpus Christi, TX
(August 19, 29 and September 9, 26 in 2011), and a fifth batch was collected from
captive adults maintained at the University of Texas Marine Science Institute’s Fisheries
and Mariculture Laboratory (FAML) in Port Aransas, TX (October 27, 2011). Spawning
occurred in the evening and eggs were collected the following morning. Samples
collected from the Marine Development Center were transported in a covered bucket with
15-l sea water to FAML for rearing. A subsample of approximately 10,000 (10 ml)
viable (floating) eggs from each spawn was equally divided into two 150-l fiberglass
conical tanks filled with sea water. All water for rearing and experimentation was
maintained at a temperature of 27°C and salinity of 35-40 ppt with a continuous supply of
oxygen through an airstone. The photoperiod was 12:12 light:dark. Larvae hatched the
same afternoon and were fed rotifers (Brachionus sp.) enriched for 45 min in the fatty
acid supplement Algamac 3050 (Aqua-fauna Bio-Marine) from 1 day post hatching (dph)
until 11 dph at a concentration of approximately 2,667 l-1. At 10 and 11 dph, larvae were

97
also fed 1-day-old Artemia sp. nauplii at a concentration of approximately 67 l-1. At 12
dph, the larvae switched to a diet of 2-day-old Artemia sp. nauplii enriched for 16 h in
Algamac 3050 at a concentration of approximately 400 l-1. Feeding took place once a day
between 0800 and 1000 hours.
Experiment procedure
The afternoon before testing, larvae were transferred from the rearing facilities to
the experimental laboratory (approximately 20 m) in a covered 15-l bucket filled with sea
water. This overnight acclimation was implemented to bring stress (plasma cortisol)
levels back to basal levels after transfer (Robertson et al. 1988). The larvae were then put
into individual 1-l beakers filled with 300 ml of sea water and placed in a water bath to
maintain constant temperature. The testing chamber consisted of a glass aquarium 150 ×
31 × 50 cm (length × width × depth) divided into three sections (50 × 31 × 50 cm) by
sturdy black plastic so that three larvae could be tested at one time. The chamber was
filled with filtered sea water (temperature was maintained by two underwater heaters that
were removed during the experimental procedure). The bottom of the tank was covered
by one of three substrate materials: Halodule wrightii (shoalgrass), Crassostrea virginica
(Eastern oyster) shells, or sand (control). H. wrightii and C. virginica reached 14 and 4
cm into the water column from the sandy bottom of the chamber, respectively. Three
sides of each chamber were covered in black plastic and the fourth side was transparent
glass for surveillance. Depth was marked by black lines which extended 4 cm from both
the left and right sides of the tank in 5-cm increments. The room was dark except for two

98
60-Watt incandescent bulbs placed 60 cm above the tank 30 cm apart to allow for the fish
to see its surroundings without seeing the observer. The substrate and water were
changed every four days and the tank was cleaned three times with fresh water. Dry sand
was collected from the local beach in Port Aransas, and the seagrass (including roots,
rhizomes, and surrounding sediment) and oyster shells were collected from Harbor
Island, Texas (27° 53’N, 97° 7’W). The sand and seagrass were used for trials
immediately following collection, and replaced every four days. Oyster shells were
collected at the beginning of the experiment, washed with fresh water three times, and
dried for two days in the sun. They were washed and reused after a four-day span.
Larvae were transferred to the testing chamber by slowly immersing a beaker
containing an individual into each of the three chambers of the tank. The fish were
allowed to acclimate for 5 min, after which their depth was recorded to the nearest 5 cm
every 10 s for an additional 5 min (31 observations total). Five minutes was chosen for
the testing period to capture the intial settlement behavior of the individual as opposed to
post-settlement behavior and because preliminary trials indicated that there were no
differences in vertical distribution between 5 min and 1 h. From these observations the
median distance from the bottom (cm), the variability between individuals in median
distance from the bottom, and whether or not they settled were calculated. After the
experiment each larva was sacrificed with an overdose of tricaine methansulfonate (MS-
222) and photographed under a dissecting microscope and standard length (SL) was
measured using Image Processing and Analysis in Java (ImageJ, U.S. National Institutes
of Health, Bethesda, MD) software.

99
Field Experiment
A field experiment was conducted off Harbor Island, Texas, to determine the
mean settlement size of wild red drum to seagrass beds in situ. Experiments were
conducted six times during the spawning season, from October 6 to November 18, 2010,
between 1300 and 1600 hours. The site is a typical low energy environment with shallow
water and a flat bottom. Substrates transition from sand/mud and H. wrightii in shallower
areas to Thalassia testudinum (turtle grass) in deeper areas. The study site was chosen
because it was both easily accessible and had a steady supply of newly recruited red drum
in previous years (personal observation), which identified it as a suitable settlement
habitat.
Red drum larvae were collected from nearby seagrass beds using an epibenthic
sled (1 × 1 × 20 m; width × height × net length) and then transferred to a 60 × 32 × 25 cm
(length × width × depth) bucket for sorting. Ten larvae were placed in a petri dish and
photographed on shore, and size measurements were taken using ImageJ in the
laboratory. These ten larvae were carried to and placed within one of the three small
field enclosures and left to acclimate for 30 min.
The small field enclosures were designed to separately sample larvae above and
below the seagrass canopy. They were constructed from four vertical 3/4” (1.90 cm)
diameter × 100 cm long steel rods and three 1/2” (1.27 cm) steel rods bent into circles (92
cm diameter) positioned at 11, 27, and 91 cm from the bottom to form a cylindrical

100
structure (Fig. 5.1). Gray mesh with 1.3× 1.1 mm (length × width) openings was attached
to the lower two steel circles, with excess mesh flaring out of the bottom to minimize
escape of larvae from below. Mesh was also fastened to the top iron circle and allowed
to drape down past the middle circle. When in the water, the draped mesh was
temporarily attached to the lower screen to seal the field enclosure. A rope was sewn into
a loop at the bottom of the draped screen to act as a drawstring. These field enclosures
were placed in H. wrightii beds, where the water depth was 20-45 cm above the seagrass
canopy. The drawstring of the enclosure was positioned at the top of the H. wrightii bed,
at the substrate/water column interface such that the upper half enclosed the water
column, while the lower half covered the seagrass bed.
After 30-min acclimation, the temporary attachments on the draped mesh were
removed, the drawstring was pulled, and a net made of gray mesh was set at the air/water
interface to catch any fish in the water column that might have escaped from the
drawstring. Immediately after the upper water column was enclosed, all larvae found
within both halves of the enclosure were collected with dip nets, kept separate, and taken
to shore and photographed (for measurement of SL using ImageJ in the laboratory). Fish
that were not recovered from the field enclosure were excluded from the analyses.
Statistical Analyses
Statistical analyses were performed with the R statistical package (R 3.0.2, The R
Foundation for Statistical Computing, http://www.R-project.org/). In the laboratory
experiment, small fish occupied a position high in the water column and larger fish

101
occupied a position close to the bottom, regardless of substrate type. Piecewise
regressions for vertical position (median distance from the bottom, in cm) against SL
were applied to identify subsets of the data for each treatment to be used for analysis. To
do so, the programs “rgl,” “car,” “Cairo,” and “qpcR” were used (Ritz & Spiess 2008,
Fox & Weisberg 2011, Adler & Murdoch 2012, Urbanek & Horner 2013). The break
point between two linear segments of the piecewise regression separated settled larvae
(SL > break point) from transitioning larvae. The slope of the line for SL < break point
represented the rate of change in vertical position relative to size. Data for transitioning
individuals were used in an analysis of covariance (ANCOVA, treatment = substrate,
covariate = size) to test for differences in settlement rate (slope) among the three
substrates.
To test for a change in variability in vertical position with size, the residuals from
the regressions of vertical position on size for each treatment were used. Because the
residuals were normally distributed with a mean of zero, their absolute value, which was
log-transformed to achieve normality (Fuiman 1993), was then used in another
ANCOVA.
For both ANCOVAs, parametric assumptions were tested by both graphical
representation (normality of residuals) and the Fligner-Killeen test for homogeneity of
variances (P > 0.05). Tukey contrasts were used for post-hoc analyses of the ANCOVAs
if the interaction term was not significant. Differences between slopes of vertical
position vs. SL were compared using confidence intervals when interaction terms were
significant. A logistic regression was applied to the three substrates separately to

102
determine the probability of settlement at a given fish size, where settlement was defined
when a fish’s median distance from the bottom was ≤ 2 cm above the top of the substrate
(therefore settlement was defined as < 16 cm for seagrass, < 6 cm for oyster, and < 4 cm
for sand). This was performed with the “aod” package (Lesnoff & Lancelot 2012).
For the field experiment, a Welch’s t-test was used to test for a size difference in
larvae collected in the water column vs. the seagrass (Ruxton 2006). A logistic
regression (with the “aod” package, Lesnoff & Lancelot 2012) was applied to the
individual fish to determine the probability of settlement for a fish at a given size in the
field enclosures. To determine if there was a difference in settlement size for seagrass
substrate between the laboratory and field experiments, a general linear model was used
(binary dependent variable = settled, treatment = experimental location, covariate = size).
RESULTS
Laboratory Experiment
There were 369 fish tested in the laboratory experiment (98 in seagrass, 132 in
oyster shells, 138 in sand), with sizes ranging from 4.3 to 40.0 mm SL. The overall
piecewise regression models applied to vertical position vs. SL were all significant (P <
0.001), and the breakpoints in SL for seagrass (R2 = 0.38), oyster shells (R2 = 0.43), and
sand (R2 = 0.58) were 25.2, 21.6, and 11.3 mm SL, respectively (Fig. 5.2).
Differences in slopes between substrates indicated that median vertical position in
the water column decreased faster with SL over sand compared to seagrass and oyster

103
shells for transitioning larvae (P < 0.001, Fig. 5.2). Variability between individual in
vertical position generally decreased with increasing SL for the sand and oyster shell
substrates, but more rapidly over sand (slope -0.10 for sand vs. -0.018 for oyster shells, P
< 0.01, Fig. 5.3). Variability in vertical position did not change with size for the seagrass
treatment (P > 0.05, slope = -0.005).
Both size and substrate had highly significant effects on whether an individual
settled (P < 0.001). The responses of fish in the oyster shell habitat were different from
those in the sand and seagrass habitats (P < 0.01), however the individuals in the seagrass
treatment did not exhibit different settlement behavior from those in the sand (P > 0.05,
Fig. 5.4). For a fish of 14.3 mm SL (the mean size of the fish tested in this experiment),
the probability of being settled in the oyster substrate was 0.24, 0.43 on sand, and 0.57 in
seagrass. The predicted median sizes at settlement were 20.5 mm SL in oyster shells,
15.8 mm SL in sand, and 12.9 mm SL in seagrass.
Field Experiment
Water temperature ranged from 19.4 – 28.2°C (average = 24.5) during the
sampling period. There were 273 fish tested in the field experiment, of which 143
(52.4%) were recovered. Eighty fish from the water column and 63 fish from the
seagrass beds were recovered. Mean size of fish recovered from the water column was
smaller than those recovered from the seagrass (9.3 ± 2.53 mm SL vs. 14.3 ± 7.39 mm
SL, P < 0.001, Fig. 5.5).

104
Size had a highly significant effect on settlement (P < 0.001, Fig. 5.5). For every
1-mm increase in SL, the odds of settling to the seagrass beds increased by 1.30. There
was a 50% probability that a fish 12.2 mm SL would be found in the seagrass beds
(median size at settlement).
Laboratory and Field Comparison
Larvae settled to seagrass beds at a similar size in the laboratory and the field (P >
0.05, Figure 5.6). Size was the only significant factor in the model (P < 0.001;
experiment location and the interaction were not significant, P > 0.05).
DISCUSSION
Coral reef environments are overwhelmingly represented in studies of settlement
in fishes (Sale 1980, Victor 1982, Sweatman 1985, Kaufman et al. 1992, Sponaugle &
Grorud-Covert 2006). This work represents the first combined laboratory and field study
of habitat selection during settlement for an estuarine-dependent subtropical and
temperate species (but see Neuman & Able 1998 for a laboratory study). These findings
show that red drum larvae are selective about the habitat to which they settle in that they
delay settlement and extend their pelagic larval duration in the presence of certain
(presumably less favorable) benthic conditions. Explanations for larvae delaying
settlement include increasing their chances of encountering suitable settlement habitat
and possibly expanding their geographic range (Victor 1986, Sponaugle & Cowen 1994,
McCormick 1999, Plaza et al. 2010). Because of this, dispersal models can be improved

105
by considering delays in settlement depending on habitat substrate present (Lacroix et al.
2013).
These results show that larvae transition to different habitats at different
ontogenetic stages depending on the benthic structure. If they followed the ‘settle-and-
stay’ hypothesis, they should have settled to oyster shells and seagrass at the same size,
and to sand at either the same or larger size. The experimental data do not support this,
so this hypothesis as the settlement model for red drum can be rejected.
Settlement behavior of red drum larvae in the presence of a sand substrate
differed from other substrates in several ways. Larvae moved closer to the bottom at a
faster ontogenetic rate over sand, variability among individuals diminished faster with
size, and the probability of being settled at a given size was higher than for seagrass or
oyster substrates. The faster reduction in inter-individual variability demonstrates more
uniform settlement behavior at larger sizes. It is possible that the lack of physical
structure does not allow for variation in vertical position the way that a structured habitat
does; moving up from a sand substrate increases the vulnerability of larger, more visible
individuals.
Results from the field study support the hypothesis that red drum larvae delay
settlement. All individuals had access to suitable habitat, and yet the smaller fish did not
enter the seagrass beds. This could have been due to intraspecific competition within the
enclosures, fear of predators within the structure, or not reaching competency. In a
previous study on juvenile red drum, smaller individuals were found around the edges of
seagrass beds while larger juveniles were located closer to the center (Pérez-Dominguez

106
2004). The author suggested the edges might be a transient habitat for new settlers, or
that there is size-selective mortality within the seagrass beds. The horizontal distribution
pattern could be influenced by the same factors that impacted the vertical distribution
patterns we found. In both studies, red drum sort themselves both horizontally and
vertically according to size, associating more closely with deeper seagrass as they grow.
Approximately 50% of the larvae tested in the field were not successfully recaptured.
This could have been due to escape from the enclosures, predation (either intra- or inter-
specific), or the inability of the researchers to recover all individuals from the seagrass.
Because the contribution of each of these alternatives is not known, analysis was
restricted to the individuals that were recovered.
According to stable isotope analysis, larvae switch from a diet of particulate
organic matter end-members (pelagic and detrital) to a diet with marsh plants and
macroalgae end-members (benthic) at around 6-8 mm SL (Herzka et al. 2002). This
indicates that larvae change their diet relatively rapidly after entering the estuaries, but
the experiments in the current study suggests they might not utilize the substrate fully
until approximately 12.5 mm SL. This size is associated with rapid changes in eye
development that allow for vision in the lower light conditions associated with living in a
shaded benthic habitat (Poling & Fuiman 1998). These changes include an increase in
the eye and lens diameter, and increase in the rod photoreceptor density, and a rapid
increase in the photoreceptor/ganglion summation ratio. Eye development could then be
an ontogenetic milestone that needs to be met before red drum larvae can fully exploit
structured habitats.

107
In this study, larvae moved out of the water column over sand at a faster
ontogenetic rate than they did over seagrass and oyster shells, and they settled at a
smaller size to sand than they did to oyster shells. This could be interpreted as either a
preference for sand over seagrass and oyster shells, or as behavior to increase security
because sand does not provide shelter, and thus they cannot venture far from the bottom.
In contrast, oyster shells and seagrass provide structure that allows individuals to be
bolder and exposing themselves to a greater risk of predation by occupying a higher
position in the water column adjacent to the shelter of a structured habitat. This is
supported by both their movement to the benthos at a larger size and the greater
variability in distance from the bottom at the larger sizes. It is more likely that the larvae
do not prefer sand, but move to a sandy substrate at a smaller size because it is safer than
the water column, but not safe enough to allow for variability in vertical position. The
lack of structure reduces the boldness an individual could otherwise exhibit, reducing
risky behavior by moving closer to the bottom (Wilson et al. 1994). Similar results were
observed in an in situ study on temperate estuarine fishes in Lake Macquarie, New South
Wales, Australia (Trnski 2002). Settlement-size species that settle to unvegetated
substrates (i.e. Pagrus auratus) swam along the bottom of the water column, while the
species that settle to seagrass beds (i.e. Acanthopagrus australis, Rhabdosargus sarba,
and Girella tricuspidata) traveled near the surface of the water column (Trnski 2002).
These observations were attributed to selective tidal stream transport behavior, with the
faster surface currents transporting larvae to seagrass beds nearshore. Previous studies
indicate that when individuals have a choice of substrate, they are more commonly found

108
in structured habitats (Stunz et al. 2002a). Mean densities of new recruits are highest in
seagrass beds compared with oyster shells, marsh beds (Spartina alterniflora), and
unvegetated bottoms. When seagrass beds are not available, red drum are most
commonly found along the marsh edge (Stunz et al. 2002a).
Larvae settle to oyster shells at a larger size than to either sand or seagrass, which
indicates that oyster shells are a less favorable settlement habitat. While both seagrass
and oyster shells provide structure, larvae delayed settlement longer over oyster shells.
In the wild, this could be due to the predators and/or prey associated with each habitat,
the height or complexity of the structure, or possibly the differences in acoustic properties
(Laegdsgaard & Johnson 2001, Gullstrom et al. 2008, Wilson et al. 2013). Oyster reefs
have higher sound pressure levels than surrounding soft-bottom habitats, while sound
transmission travels shorter distances in seagrass beds compared with bare substrate
(Wilson et al. 2013, Lillis et al. 2014). It is possible that new settlers would avoid noisy
habitats and delay settlement for the opportunity to reside in a quieter habitat. Though
predators were not included in this experiment, the oyster shells used in the laboratory
were completely dried before the trials to remove prey prior to the trials. The seagrass,
however, did not go through this process and might have contained some prey. Further
studies are needed to determine the reasons for delayed settlement over oyster shells.
In the natural environment, larvae are likely locating these different microhabitats
using visual, auditory, and chemical cues. These cues operate on different spatial scales,
and operate simultaneously to aid larvae in navigating to settlement habitats (reviewed by
Kingsford et al. 2002). Estuarine-derived chemical signals, which could combine both

109
terrestrial and marine influences, might act as a cue for larvae to orient towards the coast,
and position themselves in the water column to take advantage of particular currents
(Atema et al. 2002, Dixson et al. 2008). Additionally, specific microhabitats generate
different acoustic profiles, potentially aiding in navigation towards suitable settlement
sites (Kennedy et al. 2010, Radford et al. 2010). On the smallest spatial scales, which
were the focus of this study, larvae can rely on vision in addition to their other senses to
select microhabitats (Stearns et al. 1994). Chemical, auditory, and visual cues from
conspecifics, prey, predators, as well as abiotic and biotic characteristics of the habitat
could attract or deter potential settlers (reviewed by Montgomery et al. 2001, Kingsford
et al. 2002).
While this research answers fundamental questions about an important period in
larval fish ecology, it also has implications for fisheries management and conservation.
Seagrass beds around the world are in decline from natural and anthropogenic effects,
including those used by red drum (Short & Wyllie-Echeverria 1996). For instance,
Galveston Bay in Texas has seen an 80% decrease in seagrass area since the 1970s,
resulting in a reduction of structurally complex habitats for postsettlement larvae (Adair
et al. 1994). Therefore, availability of settlement habitat could limit recruitment. This
study shows that red drum larvae prefer seagrass habitat for settlement. A reduction in
preferred habitat could increase predation mortality (both by extending the pelagic larval
duration or increasing susceptiblity over unvegetated bottoms), competition, and reduced
availability of prey.

110
Fig. 5.1. Small field enclosure made of four vertical 1.9-cm diameter × 100-cm long steel rods and three 1.3-cm steel rods bent into circles (92 cm diameter) positioned at 11, 27, and 91 cm from the bottom. Gray mesh with 1.3× 1.1 mm (length × width) openings was attached to the bottom two steel circles. Mesh was also attached to the top steel circle and draped down, with a rope sewn into the bottom to act as a drawstring. When in the water, (a) the draped mesh was temporarily attached to the lower screen to seal the field enclosure, and (b) the drawstring was pulled shut to separate larvae in the water column from those in the seagrass bed.
100
cm
92 cm a b

111
Fig. 5.2. Vertical position in the water column as a function of size for three substrates: (a) seagrass (n = 98), (b) oyster shells (n = 132), and (c) sand (n = 138). Each point represents the median vertical position of 31 measurements made during a 5-minute period for an individual fish.
a0
10
20
30
40
b0
10
20
30
40
Dis
tanc
e fro
m b
otto
m (c
m)
c0
10
20
30
40
0 10 20 30 40Size (mm SL)

112
Fig. 5.3. Variability in median vertical position with fish size. Variability is defined as the log(absolute value(residuals from the ANCOVA on median distance from the bottom)).
a-2
0
2
4
b-2
0
2
4
Ver
tical
dis
tribu
tion
varia
bilit
y
c-2
0
2
4
0 10 20 30Size (mm SL)

113
Fig. 5.4. Probability of settlement as a function of size for seagrass, oyster shells, and sand. Median size at settlement (50% probability) is 20.5, 12.9, and 15.8 mm SL for fish in oyster shells, seagrass, and sand, respectively. Shading represents 95% confidence intervals.
0.00
0.25
0.50
0.75
1.00
10 20 30 40Size (mm SL)
Set
tlem
ent p
roba
bilit
y
SubstrateOysters
Sand
Seagrass

114
Fig. 5.5. Probability of settlement from the water column to a seagrass bed as a function of size (p < 0.001). Median size at settlement (50% probability) is 12.2 mm SL. Points represent individuals collected from the seagrass bed (settlement probability = 1) and the water column (settlement probability = 0).
0.00
0.25
0.50
0.75
1.00
10 20 30Size(mm SL)
Set
tlem
ent p
roba
bilit
y

115
Fig. 5.6. Probability of settlement from the water column to a seagrass bed as a function of size in the laboratory vs. field.
0.25
0.50
0.75
1.00
10 20 30 40Size (mm SL)
Set
tlem
ent p
roba
bilit
y
Location
Field
Laboratory

116
Chapter 6: Conclusions
The studies contained in this dissertation serve as the foundation for
understanding the behavioral response of red drum larvae to settlement cues through
development. This is the first comprehensive examination of settlement behavior in a
temperate and subtropical estuarine-dependent species. From these experiments we now
know that red drum are capable of detecting, deciphering, and responding to auditory,
olfactory, and visual stimuli that promote settlement and survival during their early life
stages. They move less when exposed to anthropogenic noise, and this response might
persist even after the auditory stimulus ceases. They react to both pure tones and white
noise at amplitudes that could occur in their pelagic environment. As shipping and
human activities continue to expand worldwide, understanding the behavioral responses
and subsequent impact on survival is becoming more important. When red drum are
competent to settle, they increase their activity and swim toward olfactory cues
associated with their primary nursery habitat. The research in this dissertation is the first
to identify a specific class of natural compounds that is associated with the settlement of
estuarine-dependent fish, and the first to analyze kinesis and taxis behaviors during
settlement for subtropical/temperate fish. This work also demonstrates that pelagic larvae
can use benthic color to position themselves in the water column. In particular, they
moved away from colors associated with estuarine habitats when given the opportunity,
while depth and activity were not influenced by benthic colors or water column depth

117
when larvae reached settlement and post-settlement-sizes. Lastly, this research is the first
to discover a delay in settlement of a subtropical and temperature species, counter to the
expected rapid settlement to structured habitat once a larva reaches competency
embodied by the settle-and-stay hypothesis. In reality, larvae settle to sand and seagrass
at a smaller size than they do to oyster shells, demonstrating habitat preference.
Studying settlement behavior leads to a better understanding of the factors that
influence recruitment and adult population size. In addition to defining habitat
requirements for maintaining healthy population levels of juvenile fishes, these studies
help identify specific cues that are likely required to direct larval fish to those suitable
nursery sites. This research suggests that drivers associated with locating and selecting
habitat should not be overlooked when designing habitat and fisheries management plans,
as population replenishment might not be possible without reliable sensory signals to
attract settlers. For example, the results in this dissertation research suggest that a steady
supply of lignin should flow from estuaries to maximize recruitment. Lignin is released
from seagrass beds, emergent vegetation, and terrestrial plant material deposited into
riverine sources, therefore productive seagrass beds, healthy salt marsh and mangrove
habitats, and/or a steady supply of freshwater inflow might be necessary for estuarine-
dependent larvae to locate settlement sites. Also, if managers are considering restoring
and protecting settlement habitat for red drum, seagrass restoration should be better than
oyster beds.
The larvae tested in this dissertation were spawned from broodstock or directly
collected from the waters surrounding Port Aransas, Texas. It is unclear from these

118
results whether larvae respond to the same cues in other geographic areas, or whether
these behaviors are local adaptations. Red drum in the northern Gulf of Mexico (from
southern Texas to Tampa, Florida) exhibit a genetic isolation-by-distance effect, with
geographic neighborhood (subpopulation) size spanning 700 – 900 km (Gold & Turner
2002). Within these ranges the available settlement sites range widely. Along the Texas
coast, freshwater inflow decreases from north to south (Texas Department of Water
Resources 1982) and seagrass availability increases from north to south (approximately
200 hectares in Galveston Bays to 46,000 hectares in Lower Laguna Madre, Dunton et al.
2010). While the settlement cues across this region might be different, red drum across
this range are genetically similar. It is therefore unlikely that red drum, at least along the
Texas coast, are locally adapted to respond to different signals. Similar studies on red
drum in other regions, including the eastern Gulf of Mexico and the Atlantic Coast,
would elucidate the extent of local adaptation in settlement behavior across
subpopulations.
These results may be applicable to other subtropical or temperate species that
require estuarine juvenile habitat. Species that use estuarine habitats other than seagrass,
such as the water column (e.g., bay anchovy, Anchoa mitchilli; gulf menhaden,
Brevoortia patronus; scaled sardine, Harengula jaguana) or shell substrates (e.g.,
skilletfish, Gobiesox strumosus; naked goby, Gobiosoma bosc) should be studied to
understand the sensory cues to which they might be responding (Baltz et al. 1993). Since
some signals might change seasonally (e.g., seagrasses proliferate in summer), it would
be valuable to study the signals needed for species that move into estuaries at times other

119
than the fall (e.g., spot, Leiostomus xanthurus, is most abundant in the winter, and
southern flounder, Paralichthys lethostigma, immigrate to estuaries in the late winter and
early spring) (Baltz et al. 1993). Though less widely studied than olfactory, auditory, or
visual cues, other orientation stimuli, such as currents (via rheotaxis) or possibly
geomagnetic fields might aid young fish in locating settlement sites (Kingsford et al.
2002 and citations therein). Additionally, environmental variables (e.g., turbidity and
water flow) can vary both predictably (e.g., diurnal or semidiurnal) and unpredictably,
and future studies should identify how these kinds of variability can enhance or interfere
with estuarine cues. These follow-up studies would clarify the extent to which estuarine
cues are species- or location-specific, or whether they act as a universal signal for all
estuarine-dependent fishes. This will lead to a more comprehensive understanding of
estuarine fish ecology.

120
References
Adair SE, Moore JL, Onuf CP (1994) Distribution and status of submerged vegetation in estuaries of the upper Texas coast. Wetlands 14: 110-121
Adler D, Murdoch D (2012) rgl: 3D visualization device system (OpenGL). R package
version 0.92.892. URL: http://CRAN.R-project.org/package=rgl Alongi DM (1997) Coastal Ecosystem Processes, Vol. 15. CRC Press, Boca Raton, USA Anderson PA, Berzins IK, Fogarty F, Hamlin HJ, Guillette LJ (2011) Sound, stress, and
seahorses: the consequences of a noisy environment to animal health. Aquaculture 311: 129-138
Andrew RK, Howe BM, Mercer JA, Dzieciuch MA (2002) Ocean ambient sound:
comparing the 1960s with the 1990s for a receiver off the California coast. Acoustics Research Letters Online 3: 65-70
Anonymous (2001) San Francisco-Oakland Bay Bridge, East Span Seismic Safety
Project, Pile Installation Demonstration Project, Fisheries Impact Assessment. PIDP EA 01208, Caltrans contract 04A0148, Task Order 205.10.90, PIDP 04-ALA-80-0.0/0.5
Armsworth PR (2000) Modelling the swimming response of late stage larval reef fish to
different stimuli. Marine Ecology-Progress Series 195: 231-247 Arnold TM, Targett NM (2002) Marine tannins: the importance of a mechanistic
framework for predicting ecological roles. Journal of Chemical Ecology 28: 1919-1934
Arvedlund M, Kavanagh K (2009) The senses and environmental cues used by marine
larvae of fish and decapod crustaceans to find tropical coastal ecosystems. In: Nagelkerken I (ed) Ecological Connectivity among Tropical Coastal Ecosystems. Springer, Netherlands. p. 135-184
Arvedlund M, McCormick MI, Fautin DG, Bildsoe M (1999) Host recognition and
possible imprinting in the anemonefish Amphiprion melanopus (Pisces: Pomacentridae). Marine Ecology-Progress Series 188: 207-218
Atema J, Kingsford MJ, Gerlach G (2002) Larval reef fish could use odour for detection,
retention and orientation to reefs. Marine Ecology-Progress Series 214: 151-160

121
Au WWL, Hastings MC (2008) Principles of Marine Bioacoustics. Series: Modern Acoustics and Signal Processing. Springer, New York, USA
Baird RC, Johari H, Jumper GY (1996) Numerical simulation of environmental
modulation of chemical signal structure and odor dispersal in the open ocean. Chemical Senses 21: 121-134
Baltz DM, Rakocinski C, Fleeger JW (1993) Microhabitat use by marsh-edge fishes in a
Louisiana estuary. Environmental Biology of Fishes 36: 109-126 Barrera-Oro E (2002) The role of fish in the Antarctic marine food web: differences
between inshore and offshore waters in the southern Scotia Arc and west Antarctic Peninsula. Antarctic Science 14: 293-309
Bart AN, Clark J, Young J, Zohar Y (2001) Underwater ambient noise measurements in
aquaculture systems: a survey. Aquacultural Engineering 25: 99-110 Basak UC, Das AB, Das P (1998) Seasonal changes in organic constituents in leaves of
nine mangrove species. Marine and Freshwater Research 49: 369-372 Bass AH, McKibben JR (2003) Neural mechanisms and behaviors for acoustic
communication in teleost fish. Progress in Neurobiology 69: 1-26 Bates D, Maechler M, Boker B, Walker S (2014) Lme4: linear mixed-effects models
using Eigen and S4. R package version 1.1.5. URL: http://CRAN.R-project.org/package=lme4
Beck MW, Heck KL, Able KW, Childers DL, Eggleston DB, Gillanders BM, Halpern B,
Hays CG, Hoshino K, Minello TJ, Orth RJ, Sheridan PF, Weinstein MR (2001) The identification, conservation, and management of estuarine and marine nurseries for fish and invertebrates. Bioscience 51: 633-641
Beckman DW, Wilson CA, Stanley AL (1988) Age and growth of red drum, Sciaenops
ocellatus, from offshore waters of the northern Gulf of Mexico. Fishery Bulletin 87: 17-28
Belanger AJ, Arbuckle WJ, Corkum LD, Gammon DB, Li W, Scott AP, Zielinski BS
(2004) Behavioural and electrophysiological responses by reproductive female Neogobius melanostomus to odours released by conspecific males. Journal of Fish Biology 65: 933-946
Bell JD, Westoby M (1986) Abundance of macrofauna in dense seagrass is due to habitat
preference, not predation. Oecologia 68: 205-209

122
Benfield MC, Minello TJ (1996) Relative effects of turbidity and light intensity on
reactive distance and feeding of an estuarine fish. Environmental Biology of Fishes 46: 211-216
Benner R, Opsahl S (2001) Molecular indicators of the sources and transformations of
dissolved organic matter in the Mississippi river plume. Organic Geochemistry 32: 597-611
Bilton DT, Freeland JR, Okamura B (2001) Dispersal in freshwater invertebrates. Annual
Review of Ecology and Systematics 32: 159-181 Blaxter JHS (1975) The eyes of larval fish. In: Ali MA (ed) Vision in Fishes: New
Approaches in Research, Vol. 1. Springer, USA. p. 427-443 Blaxter JHS, Batty RS (1985) The development of the startle responses in herring larvae.
Journal of the Marine Biological Association of the United Kingdom 65: 737-750 Blaxter JHS, Staines M (1970) Pure-cone retinae and retinomotor responses in larval
teleosts. Journal of the Marine Biological Association of the United Kingdom 50: 449-464
Boehlert GW, Mundy BC (1988) Roles of behavioral and physical factors in larval and
juvenile fish recruitment to estuarine nursery areas. American Fisheries Society Symposium 3: 51-67
Boesch DF, Turner RE (1984) Dependence of fishery species on salt marshes: the role of
food and refuge. Estuaries 7: 460-468 Bonhomme F, Planes S (2000) Some evolutionary arguments about what maintains the
pelagic interval in reef fishes. Environmental Biology of Fishes 59: 365-383 Booth DJ (1992) Larval settlement patterns and preferences by domino damselfish
Dascyllus albisella Gill. Journal of Experimental Marine Biology and Ecology 155: 85-104
Bos AR, Thiel R (2006) Influence of salinity on the migration of postlarval and juvenile
flounder Pleuronectes flesus L. in a gradient experiment. Journal of Fish Biology 68: 1411-1420
Bracciali C, Campobello D, Giacoma C, Sarà G (2012) Effects of nautical traffic and
noise on foraging patterns of Mediterranean damselfish (Chromis chromis). PloS one 7: e40582

123
Brittan-Powell EF, Dooling RJ (2004) Development of auditory sensitivity in budgerigars
(Melopsittacus undulatus). The Journal of the Acoustical Society of America 115: 3092-3102
Brown CA, Jackson GA, Holt SA, Holt GJ (2005) Spatial and temporal patterns in
modeled particle transport to estuarine habitat with comparisons to larval fish settlement patterns. Estuarine, Coastal and Shelf Science 64: 33-46
Butler AJ, Jernakoff P (1999) Seagrass in Australia: Strategic Review and Development
of an R&D Plan. CSIRO Publishing, Collingwood, Australia Caiger PE, Montgomery JC, Radford CA (2012) Chronic low-intensity noise exposure
affects the hearing thresholds of juvenile snapper. Marine Ecology-Progress Series 466: 225-232
Cato DH (1992) The biological contribution to the ambient noise in waters near
Australia. Acoustics Australia 20: 76-80 Chiussi R, Díaz H, Rittschof D, Forward Jr. RB (2001) Orientation of the hermit crab
Clibanarius antillensis: effects of visual and chemical cues. Journal of Crustacean Biology 21: 593-605
Clark DL, Leis JM, Hay AC, Trnski T (2005) Swimming ontogeny of larvae of four
temperate marine fishes. Marine Ecology-Progress Series 292: 287-300 Coppock AG, Gardiner NM, Jones GP (2013) Olfactory discrimination in juvenile coral
reef fishes: response to conspecifics and corals. Journal of Experimental Marine Biology and Ecology 443: 21-26
Cowan JH, Jr. Shaw RF (2002) Recruitment. In: Fuiman LA, Werner RG (eds) Fishery
Science: The Unique Contributions of Early Life Stages. Blackwell Publishing, Oxford, UK. p. 88-111
Cowen RK, Lwiza KM, Sponaugle S, Paris CB, Olson DB (2000) Connectivity of marine
populations: open or closed? Science 287: 857-859 Dahlgren CP, Kellison GT, Adams AJ, Gillanders BM, Kendall MS, Layman CA, Ley
JA, Nagelkerken I, Serafy JE (2006) Marine nurseries and effective juvenile habitats: concepts and applications. Marine Ecology-Progress Series 312: 291-295

124
Derby CD, Sorensen PW (2008) Neural processing, perception, and behavioral responses to natural chemical stimuli by fish and crustaceans. Journal of Chemical Ecology 34: 898-914
Diaz JP, Prié-Granié M, Kentouri M, Varsamos S, Connes R (2003) Development of the
lateral line system in the sea bass. Journal of Fish Biology 62: 24-40 Dittman A, Quinn T (1996) Homing in Pacific salmon: mechanisms and ecological basis.
Journal of Experimental Biology 199: 83-91 Dixson DL (2011) Predation risk assessment by larval reef fishes during settlement-site
selection. Coral Reefs 31: 255-261 Dixson DL, Jones GP, Munday PL, Planes S, Pratchett MS, Srinivasan M, Syms C,
Thorrold SR (2008) Coral reef fish smell leaves to find island homes. Proceedings of the Royal Society Series B – Biological Sciences 275: 2831-2839
Dixson DL, Munday PL, Jones GP (2010) Ocean acidification disrupts the innate ability
of fish to detect predator olfactory cues. Ecology Letters 13: 68-75 Dixson DL, Pratchett MS, Munday PL (2012) Reef fishes innately distinguish predators
based on olfactory cues associated with recent prey items rather than individual species. Animal Behaviour 84: 45-51
Doherty PJ, Dufour V, Galzin R, Hixon MA, Meekan MG, Planes S (2004) High
mortality during settlement is a population bottleneck for a tropical surgeonfish. Ecology 85: 2422-2428
Døving KB, Mårstøl M, Andersen JR, Knutsen JA (1994) Experimental evidence of
chemokinesis in newly hatched cod larvae (Gadus morhua L.). Marine Biology 120: 351-358
Døving KB, Stabell OB, Östlund-Nilsson S, Fisher R (2006) Site fidelity and homing in
tropical coral reef cardinalfish: are they using olfactory cues? Chemical Senses 31: 265-272
Dunton K, Pulich W, Mutchler T (2010) A Seagrass Monitoring Program for Texas
Coastal Waters: Multiscale Integration of Landscape Features with Plant and Water Quality Indicators Final Report. Contract No. 0627 to Coastal Bend Bays & Estuaries Program. Corpus Christi, Texas.
Ebenman B (1992) Evolution in organisms that change their niches during the life cycle.
The American Naturalist 139: 990-1021

125
Environmental Protection Agency (EPA) (2004) National Coastal Condition Report II.
EPA-620/R-03/002. Office of Research and Development and Office of Water, Washington, D.C.
Espino F, Tuya F, Brito A, Haroun RJ (2011) Ichthyofauna associated with Cymodocea
nodosa meadows in the Canarian Archipelago (central eastern Atlantic): community structure and nursery role. Ciencias Marinas 37: 157-174
Faria AM, Ojanguren AF, Fuiman LA, Gonçalves EJ (2009) Ontogeny of critical
swimming speed of wild-caught and laboratory-reared red drum Sciaenops ocellatus larvae. Marine Ecology-Progress Series 384: 221-230
Fay RR, Popper AN (1999) Comparative Hearing: Fish and Amphibians, Vol. 11.
Springer-Verlag, New York, USA Fencil, M (2009) Effects of post-settlement habitat use and biotic interactions on survival
of the seagrass-associated fish red drum Sciaenops ocellatus. Dissertation. Department of Marine Science, The University of Texas at Austin, Port Aransas, USA
Filip Z, Alberts JJ (1989) Humic substances isolated from Spartina alterniflora (Loisel.)
following long-term decomposition in sea water. Science of the Total Environment 83: 273-285
Fisher R, Bellwood DR, Job S (2000) Development of swimming abilities in reef fish
larvae. Marine Ecology-Progress Series 202: 163-173 Forward Jr. RB, Reinsel KA, Peters DS, Tankersley RA, Churchill JH, Crowder LB,
Hettler WF, Warlen SM, Green MD (1999) Transport of fish larvae through a tidal inlet. Fisheries Oceanography 8: 153-172
Fox J, Weisberg S (2011) An R Companion to Applied Regression, Second Edition.
Sage, Thousand Oaks, USA Fuiman LA (1993) Development of predator evasion in Atlantic herring, Clupea
harengus L. Animal Behaviour 45: 1101-1116 Fuiman LA, Delbos BC (1998) Developmental changes in visual sensitivity of red drum,
Sciaenops ocellatus. Copeia 936-943

126
Fuiman LA, Higgs DM, Poling KR (2004) Changing structure and function of the ear and lateral line system of fishes during development. Development of Form and Function in Fishes and the Question of Larval Adaptation 40: 117-144
Fuiman LA, Magurran AE (1994) Development of predator defences in fishes. Reviews
in Fish Biology and Fisheries 4: 145-183 Fuiman LA, Meekan MG, McCormick MI (2010) Maladaptive behavior reinforces a
recruitment bottleneck in newly settled fishes. Oecologia 164: 99-108 Fuiman LA, Smith ME, Malley VN (1999) Ontogeny of routine swimming speed and
startle responses in red drum, with a comparison of responses to acoustic and visual stimuli. Journal of Fish Biology 55: 215-226
Gallego A, North EW, Petitgas P (2007) Introduction: status and future of modeling
physical-biological interactions during the early life of fishes. Marine Ecology-Progress Series 347: 122-126
Gerlach G, Atema J, Kingsford MJ, Black KP, Miller-Sims V (2007) Smelling home can
prevent dispersal of reef fish larvae. Proceedings of the National Academy of Sciences of the United States of America 104: 858-863
Gillanders B, Able KW, Brown JA, Eggleston DB, Sheridan PF (2003) Evidence of
connectivity between juvenile and adult habitats for mobile marine fauna: an important component of nurseries. Marine Ecology-Progress Series 247: 281-295
Giraudoux P (2013) Pgirmess: data analysis in ecology. R package version 1.5.8. URL:
http://CRAN.R-project.org/package=pgirmess Gold JR, Turner TF (2002) Population structure of red drum (Sciaenops ocellatus) in the
northern Gulf of Mexico, as inferred from variation in nuclear-encoded microsatellites. Marine Biology 140: 249-265
Gorga MP, Kaminski JR, Beauchaine KA, Jesteadt W (1988) Auditory brainstem
responses to tone bursts in normally hearing subjects. Journal of Speech and Hearing Research 31: 87-97
Gower JFR, King SA (2009) Distribution of floating Sargassum in the Gulf of Mexico
and the Atlantic Ocean mapped using MERIS. International Journal of Remote Sensing 32: 1917-1929

127
Gray CA, McElligott DJ, Chick RC (1996) Intra- and inter-estuary differences in assemblages of fishes associated with shallow seagrass and bare sand. Marine and Freshwater Research 47: 723-735
Greenwood PJ, Harvey PH (1982) The natal and breeding dispersal of birds. Annual
Review of Ecology and Systematics 13: 1-21 Gullstrom M, Bodin M, Nilsson PG, Ohman MC (2008) Seagrass structural complexity
and landscape configuration as determinants of tropical fish assemblage composition. Marine Ecology-Progress Series 363: 241-255
Gutiérrez L (1998) Habitat selection by recruits establishes local patterns of adult
distribution in two species of damselfishes: Stegastes dorsopunicans and S. planifrons. Oecologia 115: 268-277
Hara T (1994) Olfaction and gustation in fish: an overview. Acta Physiologica
Scandinavica 152: 207-217 Harvey R, Blaxter JHS, Hoyt RD (1992) Development of superficial and lateral line
neuromasts in larvae and juveniles of plaice (Pleuronectes platessa) and sole (Solea solea). Journal of the Marine Biological Association of the United Kingdom 72: 651-668
Hasler AD, Scholz AT (1983) Olfactory imprinting and homing in salmon. Investigations
in the Mechanism of the Imprinting Process. Springer, Berlin Heidelberg, Germany
Hastings MC (2008) Coming to terms with the effects of ocean noise on marine animals.
Acoustics Today 4: 22-34 Hemminga MA, Duarte CM (2000) Seagrass Ecology. Cambridge University Press,
Cambridge, UK Herbert D, Richards JM (1963) The growth and survival of fish in some suspensions of
solids of industrial origin. Water, Air, & Soil Pollution 7: 297-302 Herzka SZ, Holt SA, Holt GJ (2002) Characterization of settlement patterns of red drum
Sciaenops ocellatus larvae to estuarine nursery habitat: a stable isotope approach. Marine Ecology-Progress Series 226: 143-156
Higgs DM, Fuiman LA (1996) Ontogeny of visual and mechanosensory structure and
function in Atlantic menhaden Brevoortia tyrannus. Journal of Experimental Biology 199: 2619-2629

128
Higgs DM, Rollo AK, Souza MJ, Popper AN (2003) Development of form and function
in peripheral auditory structures of the zebrafish (Danio rerio). The Journal of the Acoustical Society of America 113: 1145-1154
Hildebrand JA (2009) Anthropogenic and natural sources of ambient noise in the ocean.
Marine Ecology-Progress Series 395: 5-20 Hoese HD, Moore RH (1998) Fishes of the Gulf of Mexico: Texas, Louisiana, and
adjacent waters. Second edition. Texas A&M University Press, College Station, USA
Holles S, Simpson SD, Radford AN, Berten L, Lecchini D (2013) Boat noise disrupts
orientation behaviour in a coral reef fish. Marine Ecology-Progress Series 485: 295-300
Holt GJ, Holt SA (2000) Vertical distribution and the role of physical processes in the
feeding dynamics of two larval sciaenids Sciaenops ocellatus and Cynoscion nebulosus. Marine Ecology-Progress Series 193: 181-190
Holt SA, Holt GJ, Arnold CR (1989) Tidal stream transport of larval fishes into non-
stratified estuaries. Early Life History of Fish 191: 100-104 Holt SA, Kitting CL, Arnold CR (1983) Distribution of young red drum among different
sea-grass meadows. Transactions of the American Fisheries Society 112: 267-271 Horodysky AZ, Brill RW, Fine ML, Musick JA, Latour RJ (2008) Acoustic pressure and
particle motion thresholds in six sciaenid fishes. The Journal of Experimental Biology 211: 1504-1511
Hothorn T, Bretz F, Westfall P (2008) Simultaneous inference in general parametric
models. Biometrical Journal 50: 346-363 Houde ED (1989) Comparative growth, mortality, and energetics of marine fish larvae –
temperature and implied latitudinal effects. Fishery Bulletin 87: 471-495 Houde ED (2002) Mortality. In: Fuiman LA, Werner RG (eds) Fishery Science: The
Unique Contributions of Early Life Stages. Blackwell Publishing, Oxford, UK. p. 64-87
Howard WE (1960) Innate and environmental dispersal of individual vertebrates.
American Midland Naturalist 63: 152-161

129
Howe HF, Smallwood J (1982) Ecology of seed dispersal. Annual Review of Ecology and Systematics 13: 201-228
Hubbard PC, Barata EN, Canario AVM (2003) Olfactory sensitivity of the gilthead
seabream (Sparus auratus L) to conspecific body fluids. Journal of Chemical Ecology 29: 2481-2498
Huijbers CM, Mollee EM, Nagelkerken I (2008) Post-larval French grunts (Haemulon
flavolineatum) distinguish between seagrass, mangrove and coral reef water: implications for recognition of potential nursery habitats. Journal of Experimental Marine Biology and Ecology 357: 134-139
Huijbers CM, Nagelkerken I, Lossbroek PAC, Schulten IE, Siegenthaler A, Holderied
MW, Simpson SD (2012) A test of the senses: fish select novel habitats by responding to multiple cues. Ecology 93: 46-55
Ishioka H, Hatakeyama Y, Sakaguchi S (1987) Development of the startle response to
sound stimuli in the red sea bream, Pagrus major Temminck et Schlegl. Bulletin of the Nansei Regional Fisheries Research Laboratory 21: 17-23
James NC, Cowley PD, Whitfield AK, Kaiser H (2008) Choice chamber experiments to
test the attraction of postflexion Rhabdosargus holubi larvae to water of estuarine and riverine origin. Estuarine, Coastal and Shelf Science 77: 143-149
James PL, Heck KL (1994) The effects of habitat complexity and light intensity on
ambush predation within a simulated seagrass habitat. Journal of Experimental Marine Biology and Ecology 176: 187-200
Jenkins GP, Hamer PA (2001) Spatial variation in the use of seagrass and unvegetated
habitats by post-settlement King George whiting (Percoidei: Sillaginidae) in relation to meiofaunal distribution and macrophyte structure. Marine Ecology-Progress Series 224: 219-229
Jenkins GP, Welsford DC (2002) The swimming abilities of recently settled post-larvae
of Sillaginodes punctata. Journal of Fish Biology 60: 1043-1050 Job SD, Bellwood DR (1996) Visual acuity and feeding in larval Premnas biaculeatus.
Journal of Fish Biology 48: 952-963 Johnson ML, Gaines MS (1990) Evolution of dispersal: theoretical models and empirical
tests using birds and mammals. Annual Review of Ecology and Systematics 21: 449-480

130
Jung CA, Swearer SE (2011) Reactions of temperate reef fish larvae to boat sound. Aquatic Conservation: Marine and Freshwater Ecosystems 21: 389-396
Kaufman L, Ebersole J, Beets J, McIvor CC (1992) A key phase in the recruitment
dynamics of coral reef fishes: post-settlement transition. Environmental Biology of Fishes 34: 109-118
Kennedy EV, Holderied MW, Mair JM, Guzman HM, Simpson SD (2010) Spatial
patterns in reef-generated noise relate to habitats and communities: evidence from a Panamanian case study. Journal of Experimental Marine Biology and Ecology 395: 85-92
Kenyon T (1996) Ontogenetic changes in the auditory sensitivity of damselfishes
(Pomacentridae). Journal of Comparative Physiology A 179: 553-561 Kenyon T, Ladich F, Yan H (1998) A comparative study of hearing ability in fishes: the
auditory brainstem response approach. Journal of Comparative Physiology A 182: 307-318
Kingsford MJ, Leis JM, Shanks A, Lindeman KC, Morgan SG, Pineda J (2002) Sensory
environments, larval abilities and local self-recruitment. Bulletin of Marine Science 70: 309-340
Lacroix G, Maes GE, Bolle LJ, Volckaert FAM (2013) Modelling dispersal dynamics of
the early life stages of a marine flatfish (Solea solea L.). Journal of Sea Research 84: 13-25
Laegdsgaard P, Johnson C (2001) Why do juvenile flatfish utilise mangrove habitats?
Journal of Experimental Marine Biology and Ecology 257: 229-253 Lara MR (2001) Morphology of the eye and visual acuities in the settlement-intervals of
some coral reef fishes (Labridae, Scaridae). Environmental Biology of Fishes 62: 365-378
Lara MR (2008) Development of the nasal olfactory organs in the larvae, settlement-
stages and some adults of 14 species of Caribbean reef fishes (Labridae, Scaridae, Pomacentridae). Marine Biology 154: 51-64
Lecchini D, Carassou L, Frederich B, Nakamura Y, Mills SC, Galzin R (2012) Effects of
alternate reef states on coral reef fish habitat associations. Environmental Biology of Fishes 94:421-429

131
Lecchini D, Osenberg CW, Shima JS, St. Mary CM, Galzin R (2007a) Ontogenetic changes in habitat selection during settlement in a coral reef fish: ecological determinants and sensory mechanisms. Coral Reefs 26: 423 – 432
Lecchini D, Planes S, Galzin R (2007b) The influence of habitat characteristics and
conspecifics on attraction and survival of coral reef fish juveniles. Journal of Experimental Marine Biology and Ecology 341: 85-90
Lecchini D, Shima J, Banaigs B, Galzin R (2005) Larval sensory abilities and
mechanisms of habitat selection of a coral reef fish during settlement. Oecologia 143: 326-334
Leis JM (2006) Are larvae of demersal fishes plankton or nekton? Advances in Marine
Biology, Vol 51, Book 51. Academic Press Ltd-Elsevier Science Ltd, London, UK
Leis JM (2010) Ontogeny of behaviour in larvae of marine demersal fishes.
Ichthyological Research 57: 325-342 Leis JM, Carson-Ewart BM (1997) In situ swimming speeds of the late pelagic larvae of
some Indo-Pacific coral-reef fishes. Marine Ecology-Progress Series 159: 165-174
Leis JM, Carson-Ewart BM (1999) In situ swimming and settlement behaviour of larvae
of an Indo-Pacific coral-reef fish, the coral trout Plectropomus leopardus (Pisces: Serranidae). Marine Biology 134: 51-64
Leis JM, Lockett MM (2005) Localization of reef sounds by settlement-stage larvae of
coral-reef fishes (Pomacentridae). Bulletin of Marine Science 76: 715-724 Lesnoff M, Lancelot R (2012) Aod: analysis of overdispersed data. R package version
1.3. URL: http://CRAN.R-project.org/package=aod Lillis A, Eggleston DB, Bohnenstiehl DR (2014) Estuarine soundscapes: distinct acoustic
characteristics of oyster reefs compared to soft-bottom habitats. Marine Ecology-Progress Series 505: 1-17
Lopes RM, Katsuragawa M, Dias JF, Montú MA, Muelbert JH, Gorri C, Brandini FP
(2006) Zooplankton and ichthyoplankton distribution on the southern Brazilian shelf: an overview. Scientia Marina 70: 189-202

132
Louchouarn P, Opsahl S, Benner R (2000) Isolation and quantification of dissolved lignin from natural waters using solid-phase extraction and GC/MS. Analytical Chemistry 72: 2780-2787
Lubbers L, Boynton WR, Kemp WM (1990) Variations in structure of estuarine fish
communities in relation to abundance of submersed vascular plants. Marine Ecology-Progress Series 65: 1-14
Maie N, Jaffé R, Miyoshi T, Childers DL (2006) Quantitative and qualitative aspects of
dissolved organic carbon leached from senescent plants in oligotrophic wetland. Biogeochemistry 78: 285-314
Mann DA, Higgs DM, Tavolga WN, Souza MJ, Popper AN (2001) Ultrasound detection
by clupeiform fishes. The Journal of the Acoustical Society of America 109: 3048-3054
Mannino A, Harvey HR (2000) Terrigenous dissolved organic matter along an estuarine
gradient and its flux to the coastal ocean. Organic Geochemistry 31: 1611-1625 Martone PT, Estevez JM, Lu F, Ruel K, Denny MW, Somerville C, Ralph J (2009)
Discovery of lignin in seaweed reveals convergent evolution of cell-wall architecture. Current Biology 19: 169-175
McCormick MI (1999) Delayed metamorphosis of a tropical reef fish (Acanthurus
triostegus): a field experiment. Marine Ecology-Progress Series 176: 25-38 McCormick MI, Makey LJ (1997) Post-settlement transition in coral reef fishes:
overlooked complexity in niche shifts. Marine Ecology-Progress Series 153: 247-257
McCormick MI, Meekan MG (2010) The importance of attitude: the influence of
behaviour on survival at an ontogenetic boundary. Marine Ecology-Progress Series 407: 173-185
McCormick MI, Moore JAY, Munday PL (2010) Influence of habitat degradation on fish
replenishment. Coral Reefs 29: 537-546 McFarland WN (1991) The visual world of coral reef fishes. In: Sale PF (ed) The
Ecology of Fishes on Coral Reefs. Academic Press, San Diego, USA. p. 18-38 Miller-Sims VC, Atema J, Gerlach G, Kingsford MJ (2011) How stable are the reef odor
preferences of settling reef fish larvae? Marine and Freshwater Behaviour and Physiology 44: 133-141

133
Mitamura H, Arai N, Sakamoto W, Mitsunaga Y, Tanaka H, Mukai Y, Nakamura K,
Sasaki M, Yoneda Y (2005) Role of olfaction and vision in homing behaviour of black rockfish Sebastes inermis. Journal of Experimental Marine Biology and Ecology 322: 123-134
Mitchell MD, Cowman PF, McCormick MI (2012) Chemical alarm cues are conserved
within the coral reef fish family Pomacentridae. PloS one 7: e47428 Montgomery JC, Jeffs A, Simpson SD, Meekan M, Tindle C (2006) Sound as an
orientation cue for the pelagic larvae of reef fishes and decapod crustaceans. Advances in Marine Biology 51: 143-196
Montgomery JC, Tomlimieri N, Haine OS (2001) Active habitat selection by pre-
settlement reef fishes. Fishes and Fisheries 2: 261-277 Moore A, Scott AP (1991) Testosterone is a potent odorant in precocious male Atlantic
salmon (Salmo salar L.) parr. Philosophical Transactions of the Royal Society Series B – Biological Science 332: 241-244
Mumby PJ, Edwards AJ, Green EP, Anderson CW, Ellis AC, Clark CD (1997) A visual
assessment technique for estimating seagrass standing crop. Aquatic Conservation – Marine and Freshwater Ecosystems 7: 239-251
Nagelkerken I, van der Velde G, Gorissen MW, Meijer GJ, van’t Hof T, den Hartog C
(2000) Importance of mangroves, seagrass beds and shallow coral reef as a nursery for important coral reef fishes, using a visual census technique. Estuarine, Coastal and Shelf Science 51: 31-44
Nakayama S, Ojanguren AF, Fuiman LA (2009) To fight, or not to fight: determinants
and consequences of social behaviour in young red drum (Sciaenops ocellatus). Behaviour 146: 815-830
Nathan R, Muller-Landau HC (2000) Spatial patterns of seed dispersal, their
determinants and consequences for recruitment. Trends in Ecology and Evolution 15: 278-285
National Marine Fisheries Service (2012) Fisheries Economics of the United States,
2011. U.S. Department of Commerce, NOAA Technical Memo. NMFS-F/SPO-128. http://www.st.nmfs.noaa.gov/st5/publication/index.html

134
Neahr TA, Stunz GW, Minello TJ (2010) Habitat use patterns of newly settled spotted seatrout in estuaries of the north-western Gulf of Mexico. Fisheries Management and Ecology 17: 404-413
Neuman MJ, Able KW (1998) Experimental evidence of sediment preference by early
life history stages of windowpane (Scophthalmus aquosus). Journal of Sea Research 40: 33-41
Nielsen C (1998) Origin and evolution of animal life cycles. Biological Reviews 73: 125-
155 Nuraini S, Carballo EC, van Densen WLT, Machiels MAM, Lindeboom HJ, Nagelkerke
LAJ (2007) Utilization of seagrass habitats by juvenile groupers and snappers in Banten Bay, Banten Province, Indonesia. Hydrobiologia 591: 85-98
Odling-Smee L, Braithwaite VA (2003) The role of learning in fish orientation. Fish and
Fisheries 4: 235-246 Orth RJ, Carruthers TJB, Dennison WC, Duarte CM, Fourqurean JW, Heck KL, Hughes
AR, Kendrick GA, Kenworthy WJ, Olyarnik S, Short FT, Waycott M, Williams SL (2006) A global crisis for seagrass ecosystems. Bioscience 56: 987-996
Orth RJ, Heck KL, Vanmontfrans J (1984) Faunal communities in seagrass beds – a
review of the influence of plant structure and prey characteristics on predatory prey relationships. Estuaries 7: 339-350
Pankhurst PM (1994) Age-related changes in the visual acuity of larvae of New Zealand
snapper, Pagrus auratus. Journal of the Marine Biological Association of the United Kingdom 74: 337-349
Patillo ME, Czapla TE, Nelson DM, Monaco ME (1997) Distribution and abundance of
fishes and invertebrates in Gulf of Mexico estuaries, volume 2: species life history summaries. NOAA, NOS Strategic Environmental Assessments Division, Silver Spring, USA
Pebesma EJ (2004) Multivariate geostatistics in S: the gstat package. Computers &
Geosciences 30: 683-691 Pérez-Domínguez R (2004) Effects of nursery-environment condition on habitat use,
growth, survival and endocrine physiology during larval settlement in the red drum (Sciaenops ocellatus). Dissertation. Department of Marine Science, The University of Texas at Austin, Port Aransas, USA

135
Petrik R, Levin PS, Stunz GW, Malone J (1999) Recruitment of Atlantic croaker, Micropogonias undulatus: do postsettlement processes disrupt or reinforce initial patterns of settlement? Fishery Bulletin 97: 954-961
Picciulin M, Sebastianutto L, Codarin A, Farina A, Ferrero EA (2010) In situ behavioural
responses to boat noise exposure of Gobius cruentatus (Gmelin, 1789; fam. Gobiidae) and Chromis chromis (Linnaeus, 1758; fam. Pomacentridae) living in a Marine Protected Area. Journal of Experimental Marine Biology and Ecology 386: 125-132
Pile AJ, Lipcius RN, van Montfrans J, Orth RJ (1996) Density-dependent settler-recruit-
juvenile relationships in blue crabs. Ecological Monographs 66: 277-300 Plaza G, Katayama S, Omori M (2010) Daily patterns of settlement and individual
growth rates of young-of-the-year of the rockfish Sebastes inermis in a Sargassum bed. Fisheries Research 103: 48-55
Poling KR, Fuiman LA (1998) Sensory development and its relation to habitat change in
three species of sciaenids. Brain, Behavior and Evolution 52: 270-284 Popper AN, Chan AT, Clarke NL (1973) An evaluation of methods for behavioral
investigations of teleost audition. Behavior Research Methods & Instrumentation 5: 470-472
Popper AN, Fay RR (1993) Sound detection and processing by fish: critical review and
major research questions (part 1 of 2). Brain, Behavior and Evolution 41: 14-25 Popper AN, Hastings MC (2009) The effects of anthropogenic sources of sound on
fishes. Journal of Fish Biology 75: 455-489 Popper AN, Smith ME, Cott PA, Hanna BW, MacGillivray AO, Austin ME, Mann DA
(2005) Effects of exposure to seismic airgun use on hearing of three fish species. Journal of the Acoustical Society of America 117: 3958-3971
Radabaugh KR, Hollander DJ, Peebles EB (2013) Seasonal δ13C and δ15N isoscapes of
fish populations along a continental shelf trophic gradient. Continental Shelf Research 68: 112-122
Radford CA, Sim-Smith CJ, Jeffs AG (2012) Can larval snapper, Pagrus auratus, smell
their new home? Marine and Freshwater Research 63: 898-904

136
Radford CA, Stanley JA, Tindle CT, Montgomery JC, Jeffs AG (2010) Localised coastal habitats have distinct underwater sound signatures. Marine Ecology-Progress Series 401: 21-29
Rice WR (1989) Analyzing tables of statistical tests. Evolution 43: 223-225 Rittschof D, Williams LG, Brown B, Carriker MR (1983) Chemical attraction of newly
hatched oyster drills. Biological Bulletin 164: 493-505 Ritz C, Spiess AN (2008) qpcR: an R package for sigmoidal model selection in
quantitative real-time polymerase chain reaction analysis. Bioinformatics 24: 1549-1551
Roberts CM, Shepherd ARD, Ormond RFG (1992) Large-scale variation in assemblage
structure of Red Sea butterflyfishes and angelfishes. Journal of Biogeography 19: 239-250
Robertson L, Thomas P, Arnold CR (1988) Plasma cortisol and secondary stress
responses of cultured red drum (Sciaenops ocellatus) to several transportation procedures. Aquaculture 68 115-130
Rooker JR, Holt SA (1997) Utilization of subtropical seagrass meadows by newly settled
red drum Sciaenops ocellatus: patterns of distribution and growth. Marine Ecology-Progress Series 158: 139-149
Rooker JR, Holt SA, Soto MA, Holt GJ (1998) Postsettlement patterns of habitat use by
sciaenid fishes in subtropical seagrass meadows. Estuaries 21: 318-327 Ross D (1976) Mechanics of Underwater Noise. Pergamon Press Inc., New York, USA Rowe DK, Dean TL, Williams E, Smith JP (2003) Effects of turbidity on the ability of
juvenile rainbow trout, Oncorhynchus mykiss, to feed on limnetic and benthic prey in laboratory tanks. New Zealand Journal of Marine and Freshwater Research 37: 45-52
Rowe DK, Nichols S, Kelly GR (2001) Depth distribution and abundance of the common
bully, Gobiomorphus cotidianus (Eleotridae), in three oligotrophic New Zealand lakes, one of which is turbid. Environmental Biology of Fishes 61: 407-418
Ruggerone GT, Goodman SE, Miner R (2008) Behavioral response and survival of
juvenile coho salmon to pile driving sounds. Prepared by Natural Resources Consultants, Inc. and Robert Miner Dynamic Testing, Inc., Seattle, USA. Prepared for Port of Seattle, Seattle, USA

137
Ruxton GD (2006) The unequal variance t-test is an underused alternative to Student’s t-
test and the Mann-Whitney U test. Behavioral Ecology 17: 688-690 Sale PF (1980) Assemblages of fish on patch reefs—predictable or unpredictable?
Environmental Biology of Fishes 5: 243-249 Sarà G, Dean JM, D’Amato D, Buscaino G, Oliveri A, Genovese S, Ferro S, Buffa G, Lo
Martire M, Mazzola S (2007) Effect of boat noise on the behaviour of bluefin tuna Thunnus thynnus in the Mediterranean Sea. Marine Ecology-Progress Series 331: 243-253
Scholik, AR, Yan HY (2002) Effects of boat engine noise on the auditory sensitivity of
the fathead minnow, Pimephales promelas. Environmental Biology of Fishes 63: 203-209
Shand J (1993) Changes in the spectral absorption of cone visual pigments during the
settlement of the goatfish Upeneus tragula: the loss of red sensitivity as a benthic existence begins. Journal of Comparative Physiology A 173: 115-121
Shand J (1994) Changes in the retinal structure during development and settlement of the
goatfish Upeneus tragula. Brain, Behavior and Evolution 43: 51-60 Shand J (1997) Ontogenetic changes in retinal structure and visual acuity: a comparative
study of coral-reef teleosts with differing post-settlement lifestyles. Environmental Biology of Fishes 49: 307-322
Short FT, Wyllie-Echeverria S (1996) Natural and human-induced disturbance of
seagrasses. Environmental Conservation 23: 17-27 Simpson SD, Meekan MG, Jeffs A, Montgomery JC, McCauley RD (2008) Settlement-
stage coral reef fish prefer the higher-frequency invertebrate-generated audible component of reef noise. Animal Behaviour 75: 1861-1868
Simpson SD, Meekan M, Montgomery J, McCauley R, Jeffs A (2005a) Homeward
sound. Science 308: 221-221 Simpson SD, Meekan MG, McCauley RD, Jeffs A (2004) Attraction of settlement-stage
coral reef fishes to reef noise. Marine Ecology-Progress Series 276: 263-268 Simpson SD, Yan HY, Wittenrich ML, Meekan MG (2005b) Response of embryonic
coral reef fishes (Pomacentridae: Amphiprion spp.) to noise. Marine Ecology-Progress Series 287: 201-208
138
Slabbekoorn H, Bouton N, van Opzeeland I, Coers A, ten Cate C, Popper AN (2010) A
noisy spring: the impact of globally rising underwater sound levels on fish. Trends in Ecology & Evolution 25: 419-427
Smith ME, Kane AS, Popper AN (2004) Noise-induced stress response and hearing loss
in goldfish (Carassius auratus). Journal of Experimental Biology 207: 427-435 Sponaugle S, Cowen RK (1994) Larval durations and recruitment patterns of two
Caribbean gobies (Gobiidae): contrasting early life histories in demersal spawners. Marine Biology 120: 133-143
Sponaugle S, Grorud-Covert K (2006) Environmental variability, early life-history traits,
and survival of new coral reef fish recruits. Integrative and Comparative Biology 46: 623-633
Stearns DE, Holt GJ, Forward RB, Pickering PL (1994) Ontogeny of phototactic
behavior in red drum larvae (Sciaenidae, Sciaenops ocellatus). Marine Ecology-Progress Series 104: 1-11
Stenseth NC, Likicker Jr. WC (1992) The study of dispersal: a conceptual guide. In:
Stenseth NC, Lidicker Jr. (eds) Animal Dispersal: Small Mammals as a Model. Chapman & Hall Press, New York. p. 5-20.
Stobutzki IC, Bellwood DR (1994) An analysis of the sustained swimming abilities of
pre- and post-settlement coral reef fishes. Journal of Experimental Marine Biology and Ecology 175: 275-286
Stobutzki IC, Bellwood DR (1997) Sustained swimming abilities of the late pelagic
stages of coral reef fishes. Marine Ecology-Progress Series 149: 35-41 Stunz GW, Minello TJ, Levin PS (2002a) A comparison of early juvenile red drum
densities among various habitat types in Galveston Bay, Texas. Estuaries 25: 76-85
Stunz GW, Minello TJ, Levin PS (2002b) Growth of newly settled red drum Sciaenops
ocellatus in different estuarine habitat types. Marine Ecology-Progress Series 238 227-236
Sweatman HPA (1985) The influence of adults of some coral reef fishes on larval
recruitment. Ecological Monographs 55: 469-485

139
Swift MC, Forward Jr. RB (1988) Absolute light intensity vs. rate of relative change in light intensity: the role of light in the vertical migration of Chaoborus punctipennis larvae. Bulletin of Marine Science 43: 604—619
Texas Department of Water Resources (1982) The Influence of Freshwater Inflows Upon
the Major Bays and Estuaries of the Texas Gulf Coast Executive Summary. Second Edition. LP-115. Texas Department of Water Resources. Austin, Texas.
Tougaard J, Carstensen J, Teilmann J, Skov H, Rasmussen P (2009a) Pile driving zone of
responsivemess extends beyond 20 km for harbor porpoises (Phocoena phocoena (L.)). Journal of the Acoustical Society of America 126: 11-14
Tougaard J, Henriksen OD, Miller LA (2009b) Underwater noise from three types of
offshore wind turbines: estimation of impact zones for harbor porpoises and harbor seals. Journal of the Acoustical Society of America 125: 3766-3773
Trnski T (2002) Behaviour of settlement-stage larvae of fishes with an estuarine juvenile
phase: in situ observations in a warm-temperate estuary. Marine Ecology-Progress Series 242: 205-214
Urbanek S, Horner J (2013) Cairo: R graphics device using cairo graphics library for
creating high-quality bitmap (PNG, JPEG, TIFF), vector (PDF, SVG, PostScript) and display (X11 and Win32) output. R package version 1.5-5. URL: http://CRAN.R-project.org/package=Cairo
Vergeer LHT, Develi A (1997) Phenolic acids in healthy and infected leaves of Zostera
marina and their growth-limiting properties towards Labyrinthula zosterae. Aquatic Biology 58: 65-72
Victor BC (1982) Daily otolith increments and recruitment in two coral-reef wrasses,
Thalassoma bifasciatum and Halichoeres bivittatus. Marine Biology 71:203-208 Victor BC (1986) Delayed metamorphosis with reduced larval growth in a coral reef fish
(Thalassoma bifasciatum). Canadian Journal of Fisheries and Aquatic Sciences 43: 1208-1213
Wahle RA, Steneck RS (1992) Habitat restrictions in early benthic life: experiments on
habitat selection and in situ predation with the American lobster. Journal of Experimental Marine Biology and Ecology 157: 91-114
Wardle CS, Carter TJ, Urquhart GG, Johnstone ADF, Ziolkowski AM, Hampson G,
Mackie D (2001) Effects of seismic air guns on marine fish. Continental Shelf Research 21: 1005-1027

140
Webb JF, Walsh RM, Casper BM, Mann DA, Kelly N, Cicchino N (2012) Development
of the ear, hearing capabilities and laterophysic connection in the spotfin butterflyfish (Chaetodon ocellatus). Environmental Biology of Fishes 95: 275-290
Wenger AS, Johansen JL, Jones GP (2011) Suspended sediment impairs habitat choice
and chemosensory discrimination in two coral reef fishes. Coral Reefs 30: 879-887
Wenger AS, McCormick MI (2013) Determining trigger values of suspended sediment
for behavioral changes in a coral reef fish. Marine Pollution Bulletin 70: 73-80 Werner EE (1988) Size, scaling, and the evolution of complex life cycles. In: Ebenman
B, Persson L (eds) Size-Structured Populations. Springer, Berlin Heidelberg, Germany. p. 60-81
White JR, McCormick MI, Meekan MG (2013) Syndromes or flexibility: behavior during
a life history transition of a coral reef fish. PloS one 8: e84262. Wickham H (2009) Ggplot2: Elegant Graphics for Data Analysis. Springer, New York,
USA Wilbur HM (1980) Complex life cycles. Annual Review of Ecology and Systematics 11:
67-93 Wilson CJ, Wilson PS, Greene CA, Dunton KH (2013) Seagrass meadows provide an
acoustic refuge for estuarine fish. Marine Ecology-Progress Series 472: 117-127 Wilson DS, Clark AB, Coleman K, Dearstyne T (1994) Shyness and boldness in humans
and other animals. Trends in Ecology & Evolution 9: 442-446 Wright KJ, Higgs DM, Belanger AJ, Leis JM (2005) Auditory and olfactory abilities of
pre-settlement larvae and post-settlement juveniles of a coral reef damselfish (Pisces: Pomacentridae). Marine Biology 147: 1425-1434
Wright KJ, Higgs DM, Cato DH, Leis JM (2009) Auditory sensitivity in settlement-stage
larvae of coral reef fishes. Coral Reefs 29: 235-243 Wysocki LE, Ladich F (2005) Hearing in fishes under noise conditions. Journal of the
Association for Research in Otolaryngology 6: 28-36

141
Vita
Lisa Nicole Havel was born in Mt. Kisco, New York, and grew up in New
Fairfield, Connecticut. She graduated from New Fairfield High School in 2004 and
enrolled at the University of Miami that same year. She received the degree of Bachelor
of Science from that institution in May, 2008. In July of 2008, she began her doctoral
degree in the Department of Marine Science at the University of Texas at Austin.
Permanent address: 46 Bear Mountain Rd., Danbury, Connecticut 06811
This dissertation was typed by the author.