Embed Size (px)
Citation preview
8/10/2019 Hawaii charter schools annual report
http://slidepdf.com/reader/full/hawaii-charter-schools-annual-report 1/268
8/10/2019 Hawaii charter schools annual report
http://slidepdf.com/reader/full/hawaii-charter-schools-annual-report 2/268
NEILABERCROMBIE GOVERNOR
CATHERINE
CHAIRPE
STATE OFHAWAII STATE PUBLICCHARTERSCHOOLCOMMISSION
(ʻAHA KULAHOʻĀMANA)http://CharterCommission.Hawaii.Gov
1111 Bishop Street, Suite 516, Honolulu, Hawaii 96813Tel: (808) 586-3775 Fax: (808) 586-3776
DATE: November 26, 2014
TO: The Honorable Donna Mercado Kim, PresidentHawaii State Senate
The Honorable Joseph M. Souki, SpeakerHawaii State House of Representatives
The Honorable Donald G. Horner, ChairpersonHawaii State Board of Education
FROM: Catherine Payne, ChairpersonHawaii State Public Charter School Commission
SUBJECT: The 2014 State Public Charter School Commission Annual Report
The State Public Charter School Commission is pleased to present its annual report for 2014, pursuHRS §302D-7.
In 2012, the Legislature passed, and Governor Abercrombie signed, Act 130, Session Laws of Haw
(“SLH”), which replaced the State’s previous charter school law with Hawaii Revised StatuteChapter 302D. Act 130 created the Commission with a principal focus on accountability-relatedauthorizer functions, including the development and implementation of a rigorous accountability sythat safeguards student and public interests while at the same time valuing the autonomy and flexibof Hawaii’s charter schools. Among other things, the new law directed the Commission to e
f t t ith i ti g d l th i d bli h t h l d
8/10/2019 Hawaii charter schools annual report
http://slidepdf.com/reader/full/hawaii-charter-schools-annual-report 3/268
The Honorable Donna Mercado Kim, Joseph M. Souki, Donald G. HornerNovember 26, 2014Page 2
1. The Commission’s strategic vision for chartering and progress toward achieving that v
2. The academic performance of all operating public charter schools overseen by the Commissaccording to the performance expectations for public charter schools set forth in HRS Chapt302D, including a comparison of the performance of public charter school students with pubschool students statewide;
3. The financial performance of all operating public charter schools overseen by the Commissiaccording to the expectations set forth in HRS Chapter 302D;
4. The status of the Commission’s public charter school portfolio, identify ing all public cschools and applicants in each of the following categories: approved (but not yet open), appr(but withdrawn), not approved, operating, renewed, transferred, revoked, not renewed, orvoluntarily closed;
5. The authorizing functions provided by the Commission to the public charter schools under itpurview, including the Commission’s operating costs and expenses detailed in annual afinancial statements that conform with generally accepted accounting principles;
6. The services purchased from the Commission by the public charter schools under its purview
7. A line-item breakdown of the federal funds received by the Department of Education anddistributed by the Commission to public charter schools under its purview; and
8. Concerns regarding equity and recommendations to improve access to and redistribution offederal funds to public charter schools.
Hawaii state law charges the Commission with the mission of authorizing high-quality public chartschools throughout Hawaii. The Commission is committed to quality in every aspect of charteringfirmly believes that quality authorizing leads to quality schools.
With the completion of the Academic Performance Framework, the last major outstanding piece ofnew structure laid out in HRS Chapter 302D has been realized. With this solid foundation in placerest of the systemic pieces can be further developed or refined.
The Commission remains committed to working with Hawaii’s charter schools and other stak
8/10/2019 Hawaii charter schools annual report
http://slidepdf.com/reader/full/hawaii-charter-schools-annual-report 4/268
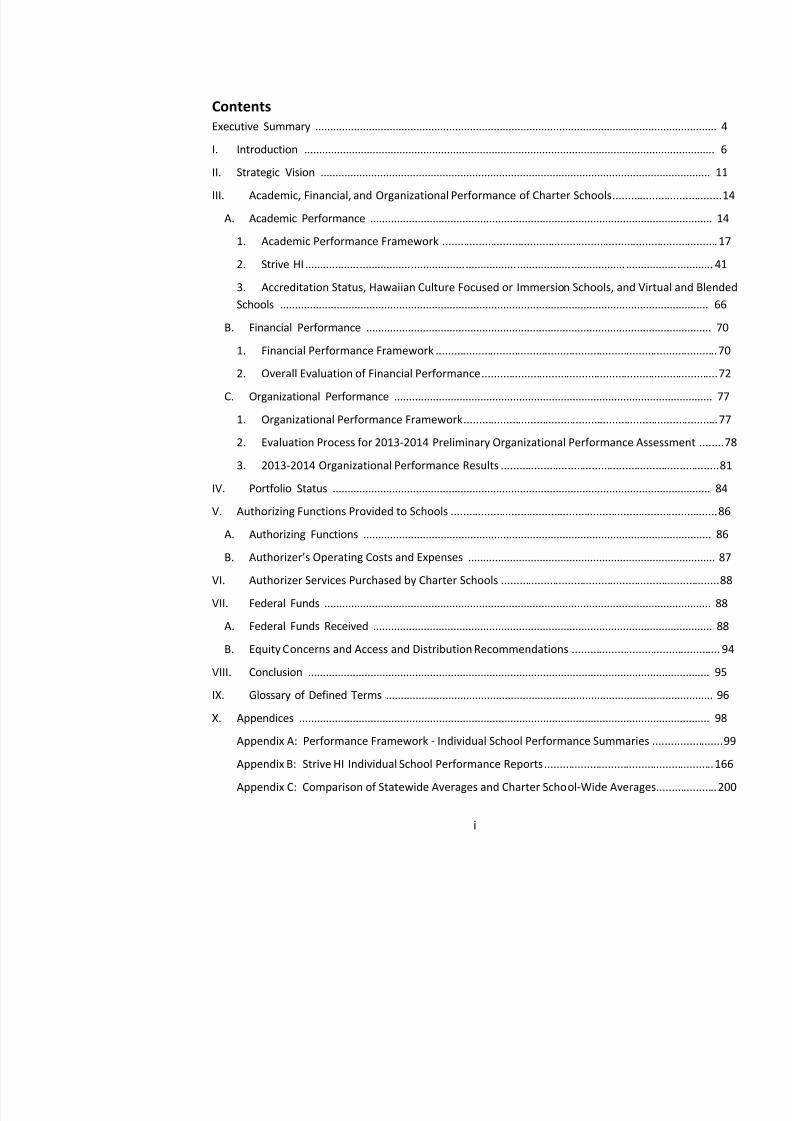
ContentsExecutive Summary ...................................................................................................................................
I. 1BIntroduction .......................................................................................................................................
II. 2BStrategic Vision ................................................................................................................................
III. 3BAcademic, Financial, and Organizational Performance of Charter Schools ...........................
A. 11BAcademic Performance ................................................................................................................
1. 18BAcademic Performance Framework .....................................................................................2. Strive HI ..................................................................................................................................
3. Accreditation Status, Hawaiian Culture Focused or Immersion Schools, and Virtual and Schools ..............................................................................................................................................
B. 12BFinancial Performance .................................................................................................................
1. 25BFinancial Performance Framework .......................................................................................
2. 26BOverall Evaluation of Financial Performance .......................................................................
C. 13BOrganizational Performance ........................................................................................................
1. 27BOrganizational Performance Framework ..............................................................................
2. 28BEvaluation Process for 2013-2014 Preliminary Organizational Performance Assessment
3. 2013-2014 Organizational Performance Results ..................................................................
IV. 4BPortfolio Status ............................................................................................................................
V. 5BAuthorizing Functions Provided to Schools ..................................................................................
A. 14BAuthorizing Functions .................................................................................................................
B. 15BAuthorizer’s Operating Costs and Expenses ........................................................................
VI. 6BAuthorizer Services Purchased by Charter Schools .................................................................
VII. 7BFederal Funds ...............................................................................................................................A. 16BFederal Funds Received ..............................................................................................................
B. 17BEquity Concerns and Access and Distribution Recommendations ..........................................
VIII. 8BConclusion ....................................................................................................................................
8/10/2019 Hawaii charter schools annual report
http://slidepdf.com/reader/full/hawaii-charter-schools-annual-report 5/268
8/10/2019 Hawaii charter schools annual report
http://slidepdf.com/reader/full/hawaii-charter-schools-annual-report 6/268
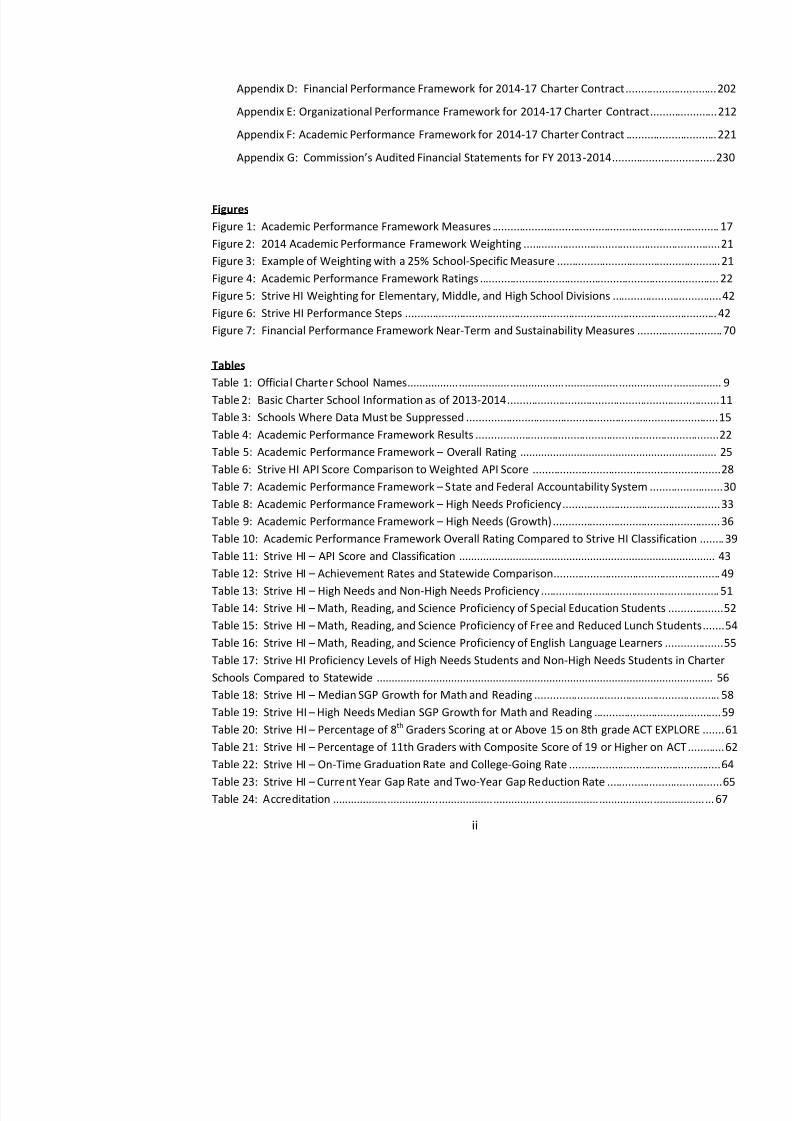
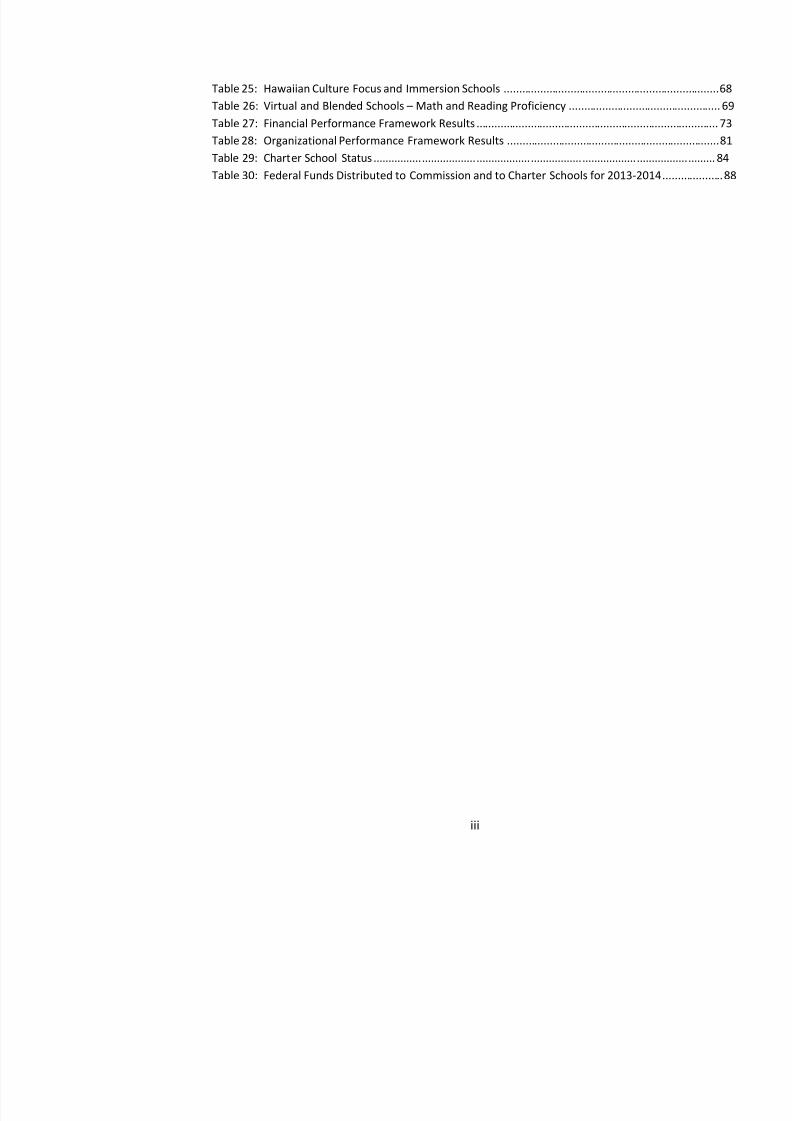
Table 25: Hawaiian Culture Focus and Immersion Schools .................................................................Table 26: Virtual and Blended Schools – Math and Reading Proficiency ......................................
Table 27: Financial Performance Framework Results ..........................................................................Table 28: Organizational Performance Framework Results .................................................................Table 29: Charter School Status .............................................................................................................Table 30: Federal Funds Distributed to Commission and to Charter Schools for 2013-2014 .............
0B0B
8/10/2019 Hawaii charter schools annual report
http://slidepdf.com/reader/full/hawaii-charter-schools-annual-report 7/268
1BExecutive Summary
This Annual Report is the third to be issued by the Commission since its creation in 2012 primarily provides information on Hawaii’s charter school system from the 2013-2014 school Hawaii’s 34 public charter schoo ls currently operate under the auspices of the three-year CharterContract developed and executed during that school year. The Charter Contract incorporates aPerformance Framework under which charter schools are evaluated in three areas: Academic, Finaand Organizational.
In the Academic area, this is the first Annual Report to include results from the ComAcademic Performance Framework, which was finalized during the 2013-2014 school year. TheAcademic Performance Framework is based mostly on data provided by the State’s Strive HPerformance System for all public schools, but it applies that data in some ways that depart significfrom Strive HI. This means that the respective school results under Strive HI and the AcademicPerformance Framework generally tend to be aligned but in some instances differ significantly. As last year’s results, important data caveats should be borne in mind when evaluating results.
In this first run of the Academic Performance Framework, 36% of charter schools met orexceeded the overall standard, while 63% did not meet or fell far below the standard. The fradded emphasis on High Needs Students, and the reality that charter schools currently areunderperforming relative to statewide averages on some outcomes for High Needs Students, appeahave been a significant factor in these results. As measured under Strive HI, charter schools in 2012014 collectively improved, on average, on every measure except two: Reading proficiency and, i
elementary schools, chronic absenteeism, which both remained essentially flat. The rate by whichcharter schools collectively reduced the achievement gap between High Needs Students and their NHigh Needs Students showed particularly impressive progress. Notably, five of the eleven highestperforming public high schools in the state and two of the four highest-performing middle schools,measured by Strive HI, are charter schools.
In the Financial area, charter schools generally were in good financial positions as of June
2014, and appear to have exercised sound stewardship of public funds, but there was a slightdeterioration in their positions from last fiscal year. The 2013-2014 results suggest that the financiprediction in last year’s Annu al Report still holds true: that sustainability challenges lie ahead if flevels remain essentially flat and/or schools cannot realize cost savings. While there was overallimprovement this year in some near-term indicators, schools are starting to struggle to meet the neaterm targets and more are having difficulty meeting standards for the long term sustainability
8/10/2019 Hawaii charter schools annual report
http://slidepdf.com/reader/full/hawaii-charter-schools-annual-report 8/268
placed on Hawaii charter schools and the challenges confronting schools that tend to be lightly stafadministratively, stretched financially, and still transitioning from a previous model of governance
was primarily constituency- and community-based. The results nonetheless highlight some areas thwill require additional attention from schools and the Commission.
In all three areas, Hawaii’s charter sector shows promising sign of improvement, butmuch work remains to be done. The strains of systemic improvement efforts on schools with multi-faceted resource and capacity challenges —however necessary and overdue these efforts are ininterests of Hawaii’s children— are evident. This Annual Report helps detail both the progress an
challenges for consideration by policymakers, parents, schools, and other stakeholders.
8/10/2019 Hawaii charter schools annual report
http://slidepdf.com/reader/full/hawaii-charter-schools-annual-report 9/268
I. 2B1BIntroduction
This Annual Report is the third to be issued by the State Public Charter School Commissio(“Commission”), which was created under Act 130 (“Act 130”), Session Laws of Hawaii (“Sthe State’s new statewide charter school authorizer. The report primarily addresses developmduring the 2013-2014 fiscal and academic year.
Act 130 established a new charter school law for Hawaii, codified in the new Hawaii ReviStatutes (“HRS”) Chapter 302D. Among other things, the new law:
1. Assigned to the Commission the mission of authorizing high-quality charter schoolsthroughout the State and envisioned that the Commission focus primarily on its coreaccountability-related authorizer functions;
2. Mandated that State Public Charter School Contract (“Charter Contract”) be exeach charter school, based on a performance framework for the schools;
3. Required that each charter school be governed and overseen by its own governing boawith a shift in emphasis from a community and constituency-based board model undeprevious law to one that emphasized a more robust governance role and substantive sksets; and
4. Required this Annual Report and dictated its contents.
As of the release of the Commission’s 2013 Annual Report, dated November 21, 201Hawaii public charter schools then in existence had entered into the first Charter Contract, whichincorporated a Performance Framework comprising three substantive areas: Academic, Financial, aOrganizational. At the time of the first Charter Contract’s development and execution, theCommission’s Academic Performance Framework still was a work in progress, as the State’sPerformance System (“Strive HI”), Hawaii’s public school accountability and improvement sincorporated into the Commission ’s Performance Framework, had not yet received federal approrder to allow for the development of the Academic Performance Framework, and to allow theCommission and the schools to gain experience with the other frameworks and Charter Contractprovisions, the first Charter Contract had a term of only one year, and no school faced potentialrevocation of its Charter Contract for inadequate performance under the Academic PerformanceFramework, Financial Performance Framework, and Organizational Performance Framework
8/10/2019 Hawaii charter schools annual report
http://slidepdf.com/reader/full/hawaii-charter-schools-annual-report 10/268
During the 2013-2014 school year, after extensive meetings with the schools, both the AcaPerformance Framework and the current Charter Contract were adopted. The new Charter Contrac
incorporates the new Academic Performance Framework, a more developed OrganizationalPerformance Framework, and the same Financial Performance Framework. 1F
2 The term of thContract is three years for all current schools, but schools that achieve high performance under thePerformance Framework will be eligible for an automatic two-year extension of their contracts, wihaving to go through the contract renewal process.
The Academic Performance Framework incorporates school data from Strive HI, which ap
all public schools including public charter schools, but in some notable ways the Academic PerformFramework applies or weights that data differently. The Commission’s Academic PerformanFramework places strong additional emphasis on academic achievement and growth by High NeedStudents, i.e ., students who are eligible for free and reduced price lunch, students receiving speciaeducation, and students who are English language learners. The framework calculates data for eacthe grade divisions (elementary, middle, and high) served by a multi-division school, rather thancalculating data for just the highest grade division of the school. Schools also are able to propose
School- Specific Measures that, upon Commission review and approval, also will be used to evaluaschool according to its mission and circumstances.
Also, as of last year ’s Annual Report, the Commission had initiated promulgation ofadministrative rules. The formal promulgation process commenced only after the rules had beendiscussed with the charter schools during the drafting stage in 2012. Two chapters were proposed:Chapter 8- 501, entitled “State Public Charter School Commission Rules of Practice and ProcChapter 8- 505, entitled “Applications, Renewals or Nonrenewals, and Revocations.” After apublic hearings in all four of Hawaii’s countie s, the Commission adopted the proposed rules onNovember 13, 2014. As of the writing of this report, the rules are poised for final review by theGovernor.
The 2014 Legislative Session saw the enactment of Act 99, SLH 2014, which among thin
Clarified that, starting with fiscal year 2015, the entire appropriation for the Com
operations will be made separately from, and in addition to, the appropriation made tocharter schools;
Clarified the status of approved charter applicants and established a more phased-in stup period, better positioning newly approved schools to prepare to serve children upo
8/10/2019 Hawaii charter schools annual report
http://slidepdf.com/reader/full/hawaii-charter-schools-annual-report 11/268
Authorized the Commission to reconstitute the governing board of a charter school un
certain exigent circumstances; and
Authorized the Commission to make adjustments in charter school funding allocationbased on a school’s noncompliance with the Charter Contract.
The 2013 application cycle for new charter schools marked another milestone, as it was thentirely Commission-run charter application process. 2F
3 On May 8, 2014, the Commission app
application of Ka‘u Learning Academy, which plans to begin serving children in the 2015 -20year as Hawaii’s thirty-fifth public charter school. This was the only application approved in therevamped 2013 cycle, a reflection of the increased rigor that the Commission has brought to theapplication process. In addition, a school approved in the 2012 application cycle, Mālama HCharter School, had requested and was granted a deferral of its opening date to July 2014. On July2014, the Commission executed a Charter Contract with the school, thus allowing the school to opthe current school year.
Late in fiscal year 2013-2014 , Hālau Lōkahi Charter School (“Halau Lokahi”) was uits financial obligations. The Commission offered a new Charter Contract to Halau Lokahi only onconditions that the school’s governing board and school director resign, the school cons enCommission’s appointment of a new governing board, and the school submit a viable plan frecovery and sustainability through the 2014-2015 fiscal and academic year. Halau Lokahi accepteoffer, and on July 10, 2014, the Commission appointed the new governing board for the school. Athis writing, that governing board has committed itself to the painful task of a drastic restructuring the school’s staff at the end of the first semester.
Other highlights from school year 2013-2014 include the following actions by the Commiand other developments:
Implementation of a comprehensive and administratively manageable monitoring andreporting system for charter schools, known as Epicenter;
Improved communications and transparency through measures such as continuing andadding features to the weekly e- newsletter, “Ka ‘Elele;” for the first time prepamaking available to the public written submittals on Commission agenda items; improthe Commission website (www.chartercommission.gov ), and providing more we
8/10/2019 Hawaii charter schools annual report
http://slidepdf.com/reader/full/hawaii-charter-schools-annual-report 12/268
Orientation sessions to prospective charter applicants to familiarize them not only witapplication process itself but also with the challenges of starting and operating a succe
public charter school and, on the front end, with the Performance Framework under wnew school will be accountable to families and to the public; and
Facilitating the improvement of communications among the charter schools and Stateagencies, including the Department of Education (“ DOE,”) the Hawaii DepartmeResources Development (“DHRD”), Hawaii Employees’ Retirement System (“EHawaii Employer- Union Health Benefits Trust Fund (“EUTF”).
At the end of fiscal year 2012-2013 , the Hawaii Board of Education (“BOE”) appoinD’Olier as a Commissioner to replace Richard Hogeboom, whose term expired on June 30, 2013, reappointed Commissioners Terri Fujii and Peter Hanohano. The other Commissioners serving as 1, 2013 were: Usha Kotner, Curtis Muraoka, Catherine Payne, Karen Street, Roger Takabayashi, aPeter Tomozawa. The Commission elected Ms. Fujii as its new chairperson, replacing Ms. Street. Fujii resigned from the Commission on January 29, 2014, and Ms. Payne was elected as the new
chairperson. On May 20, 2014, the BOE appointed Kalehua Krug to fulfill the remainder of term. Ms. Kotner’s and Mr. Muraoka’s terms expired on June 30, 2014. Mr. Tomozawa’s teexpired, but the BOE reappointed him to another term. Ms. Kotner and Mr. Muraoka subsequentlyhave been replaced by the appointments of Jill Baldemor and Ernest Nishizaki.
In April 2014, the Office of the Auditor of the State of Hawaii issued a report, entitledthe Implementation of the State Auditor’s 2011 Recommendations (Report No. 14-06) , an u
Governor and the Legislature on the implementation of recommendations the Office had issued in iDecember 2011 audit report, entitled Performance Audit of the Hawaii Public Charter School Sys(Report No. 11-03). The 2011 audit report was subtitled “Hawai‘i Charter Schools: AutonoAccountability” and raised some of the concerns that precipitated the enactment of Act 130. update acknowledged that much work remains to be done to improve Hawaii’s charter schoobut concluded that, “the [C]ommission should be commended for the significant progress it has a relatively short time.”
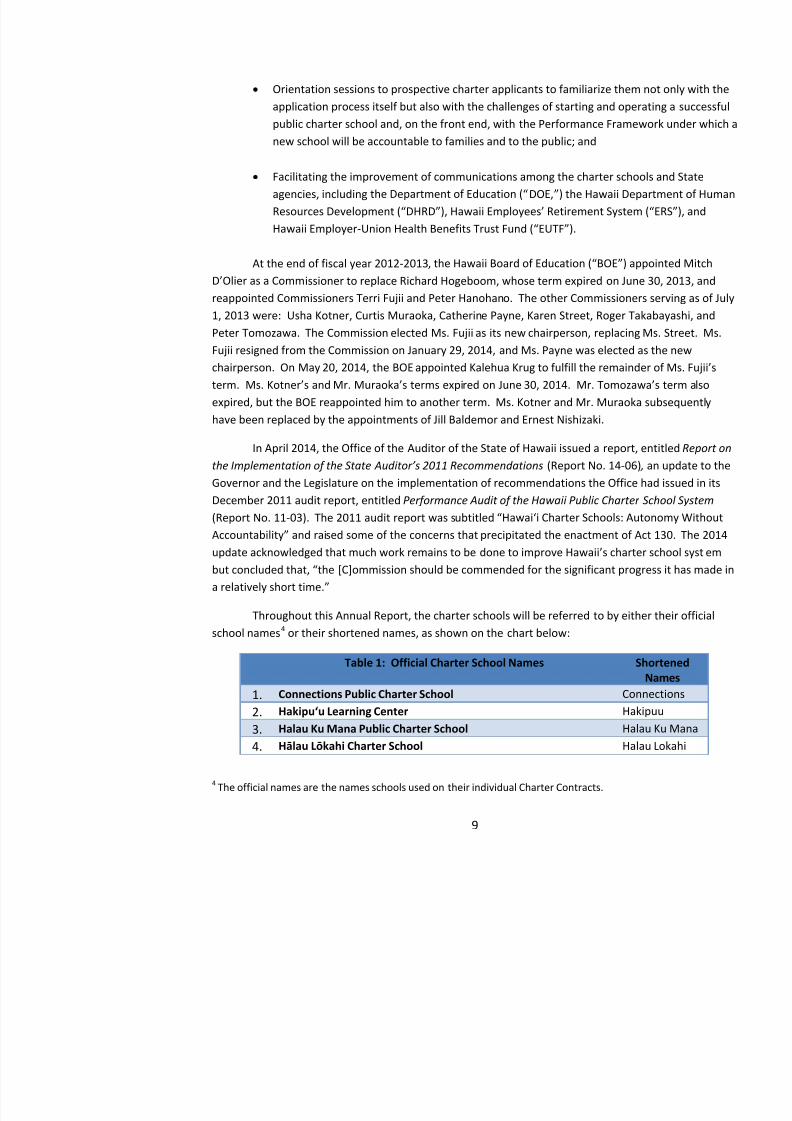
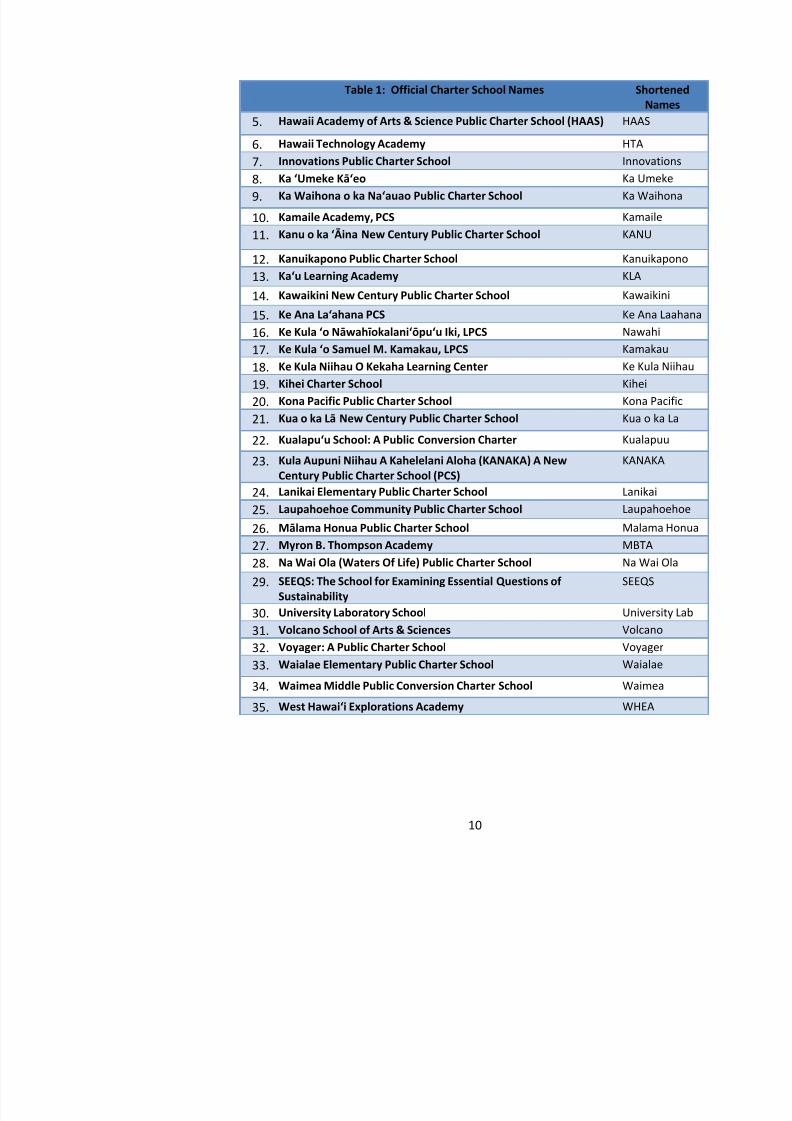
Throughout this Annual Report, the charter schools will be referred to by either their officschool names 3F
4 or their shortened names, as shown on the chart below:
Table 1: Official Charter School Names ShortenedNam
8/10/2019 Hawaii charter schools annual report
http://slidepdf.com/reader/full/hawaii-charter-schools-annual-report 13/268
Table 1: Official Charter School Names ShortenedNam
5. Hawaii Academy of Arts & Science Public Charter School (HAAS) HAAS6. Hawaii Technology Academy HTA7. Innovations Public Charter School Innovatio8. Ka ‘Umeke Kā‘eo Ka Umek9. Ka Waihona o ka Na‘auao Public Charter School Ka Waih
10. Kamaile Academy, PCS Kamaile11. Kanu o ka ‘Āina New Century Public Charter School KANU
12. Kanuikapono Public Charter School Kanuikap13. Ka‘u Learning Academy KLA
14. Kawaikini New Century Public Charter School Kawaikin
15. Ke Ana La‘ahana PCS Ke Ana L16. Ke Kula ‘o Nāwahīokalani‘ōpu‘u Iki, LPCS Nawahi17. Ke Kula ‘o Samuel M. Kamakau, LPCS Kamakau
18. Ke Kula Niihau O Kekaha Learning Center Ke Kula 19. Kihei Charter School Kihei20. Kona Pacific Public Charter School Kona Pac21. Kua o ka Lā New Century Public Charter School Kua o ka
22. Kualapu‘u School: A Public Conversion Charter Kualapuu
23. Kula Aupuni Niihau A Kahelelani Aloha (KANAKA) A NewCentury Public Charter School (PCS)
KANAK
24. Lanikai Elementary Public Charter School Lanikai25. Laupahoehoe Community Public Charter School Laupaho
26. Mālama Honua Public Charter School Malama 27. Myron B. Thompson Academy MBTA28. Na Wai Ola (Waters Of Life) Public Charter School Na Wai O
29. SEEQS: The School for Examining Essential Questions ofSustainability
SEEQS
30. University Laboratory School Universit31. Volcano School of Arts & Sciences Volcano32. Voyager: A Public Charter School Voyager33. Waialae Elementary Public Charter School Waialae
34 Waimea Middle Public Conversion Charter School Waimea
8/10/2019 Hawaii charter schools annual report
http://slidepdf.com/reader/full/hawaii-charter-schools-annual-report 14/268
II. 3B2BStrategic VisionThe authorizer's strategic vision for chartering and progress toward achieving that vision.
The Commission’s statutory mission is to “authorize high -quality public charter schothroughout the State.” 4F5F
6 The strategic vision for the chartering of these high-quality schools is thnot only provide excellent and diverse educational options for Hawaii’s families but that theycontribute meaningfully to the continued improvement of Hawaii’s public education system
The Commission’s development and execution with the existing charter schools of thContract and development of the Performance Framework with academic, financial, and organizatielements represent significant progress toward pursuing the Commission’s mission and strateThe charter application process that the Commission employs is also built around the PerformanceFramework and sets rigorous expectations of charter applications and a high bar for approval of anapplication to a create new charter school. In addition, under the Commission’s new timelinprocess for charter school start-ups, newly approved applicants have twelve months from the approof the application to the opening of the new school, a significantly longer time in which to lay the
groundwork needed for excellence, and an incremental contracting process during the start-up periowill provide new start-ups with improved legal status and some additional supports.
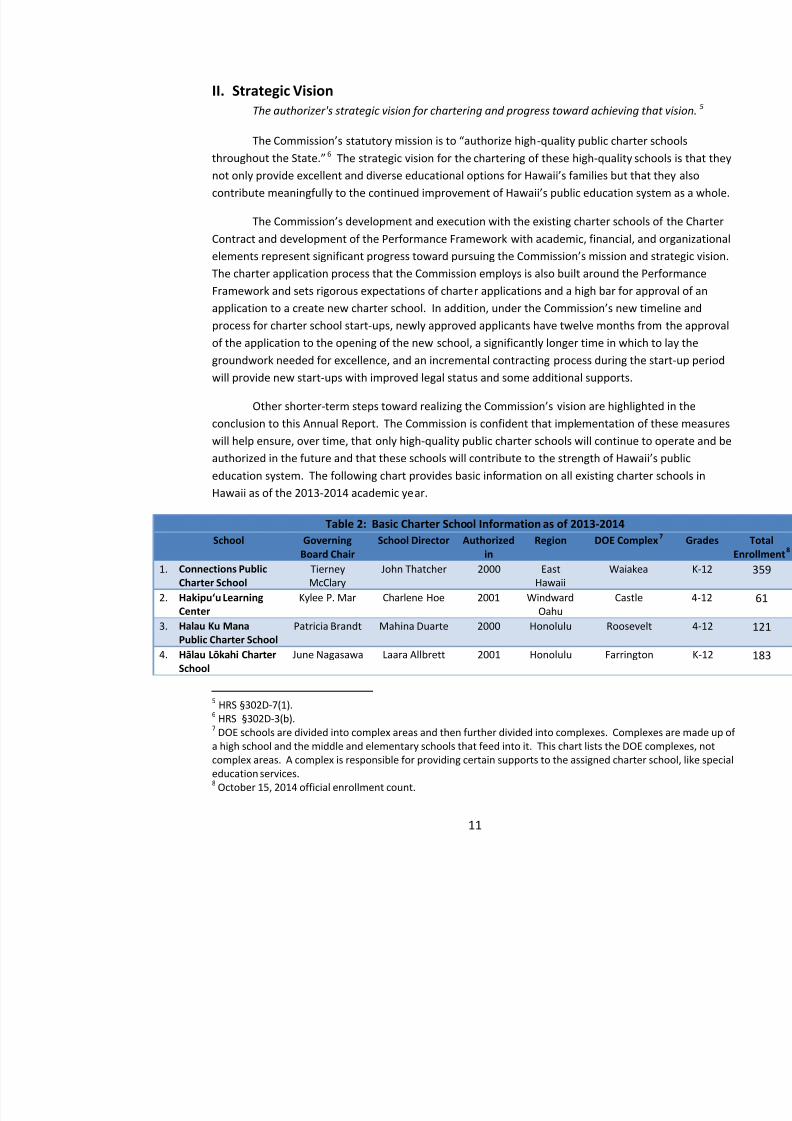
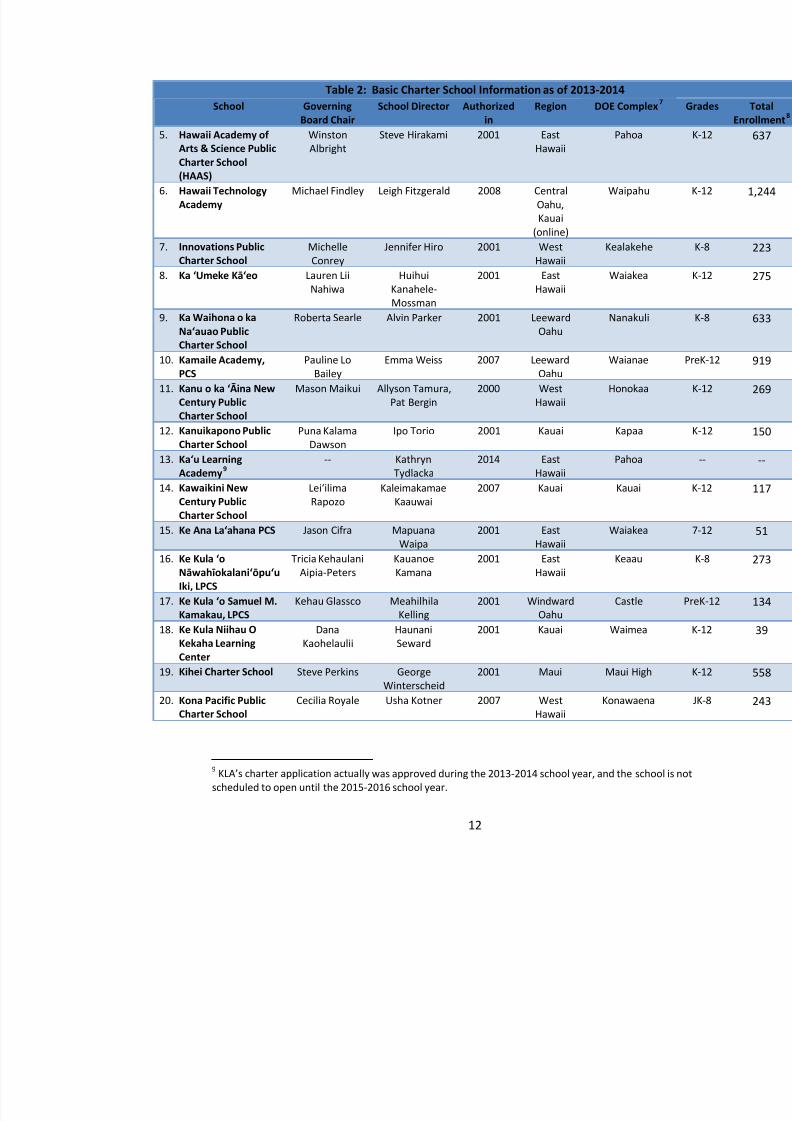
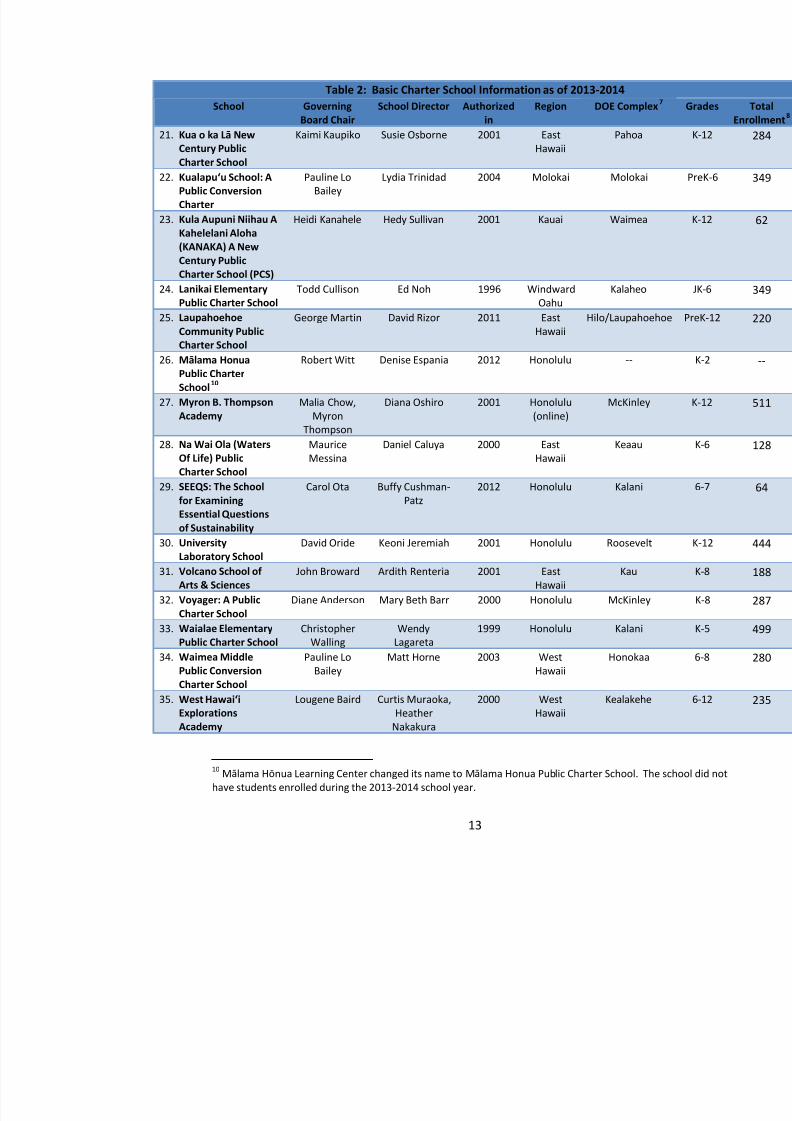
Other shorter- term steps toward realizing the Commission’s vision are highlighted iconclusion to this Annual Report. The Commission is confident that implementation of these measwill help ensure, over time, that only high-quality public charter schools will continue to operate anauthorized in the future and that these schools will contribute to the strength of Hawaii’s pubeducation system. The following chart provides basic information on all existing charter schools inHawaii as of the 2013-2014 academic year.
Table 2: Basic Charter School Information as of 2013-2014 School Governing
Board ChairSchool Director Authorized
inRegion DOE Complex 5F6F
7
1. Connections PublicCharter School
TierneyMcClary
John Thatcher 2000 EastHawaii
Waiakea
2. Hakipu‘u LearningCenter
Kylee P. Mar Charlene Hoe 2001 WindwardOahu
Castle
3. Halau Ku ManaPublic Charter School
Patricia Brandt Mahina Duarte 2000 Honolulu Roosevelt
4. Hālau Lōkahi CharterSchool
June Nagasawa Laara Allbrett 2001 Honolulu Farrington
8/10/2019 Hawaii charter schools annual report
http://slidepdf.com/reader/full/hawaii-charter-schools-annual-report 15/268
Table 2: Basic Charter School Information as of 2013-2014 School Governing
Board Chair
School Director Authorized
in
Region DOE Complex 5F6F
7
5. Hawaii Academy ofArts & Science PublicCharter School(HAAS)
WinstonAlbright
Steve Hirakami 2001 EastHawaii
Pahoa
6. Hawaii TechnologyAcademy
Michael Findley Leigh Fitzgerald 2008 CentralOahu,Kauai
(online)
Waipahu
7. Innovations PublicCharter School
MichelleConrey
Jennifer Hiro 2001 WestHawaii
Kealakehe
8. Ka ‘Umeke Kā‘eo Lauren LiiNahiwa
HuihuiKanahele-Mossman
2001 EastHawaii
Waiakea
9. Ka Waihona o kaNa‘auao PublicCharter School
Roberta Searle Alvin Parker 2001 LeewardOahu
Nanakuli
10. Kamaile Academy,PCS
Pauline LoBailey
Emma Weiss 2007 LeewardOahu
Waianae
11. Kanu o ka ‘Āina NewCentury PublicCharter School
Mason Maikui Allyson Tamura,Pat Bergin
2000 WestHawaii
Honokaa
12. Kanuikapono PublicCharter School
Puna KalamaDawson
Ipo Torio 2001 Kauai Kapaa
13. Ka‘u LearningAcademy 7F8F
9 -- Kathryn
Tydlacka2014 East
HawaiiPahoa
14. Kawaikini NewCentury PublicCharter School
Lei‘ilimaRapozo
KaleimakamaeKaauwai
2007 Kauai Kauai
15. Ke Ana La‘ahana PCS Jason Cifra MapuanaWaipa
2001 EastHawaii
Waiakea
16. Ke Kula ‘oNāwahīokalani‘ōpu‘uIki, LPCS
Tricia KehaulaniAipia-Peters
KauanoeKamana
2001 EastHawaii
Keaau
17. Ke Kula ‘o Samuel M.Kamakau, LPCS
Kehau Glassco MeahilhilaKelling
2001 WindwardOahu
Castle
18. Ke Kula Niihau OKekaha LearningCenter
DanaKaohelaulii
HaunaniSeward
2001 Kauai Waimea
19. Kihei Charter School Steve Perkins GeorgeWinterscheid
2001 Maui Maui High
8/10/2019 Hawaii charter schools annual report
http://slidepdf.com/reader/full/hawaii-charter-schools-annual-report 16/268
Table 2: Basic Charter School Information as of 2013-2014 School Governing
Board Chair
School Director Authorized
in
Region DOE Complex 5F6F
7
21. Kua o ka Lā NewCentury PublicCharter School
Kaimi Kaupiko Susie Osborne 2001 EastHawaii
Pahoa
22. Kualapu‘u School: APublic ConversionCharter
Pauline LoBailey
Lydia Trinidad 2004 Molokai Molokai
23. Kula Aupuni Niihau AKahelelani Aloha
(KANAKA) A NewCentury PublicCharter School (PCS)
Heidi Kanahele Hedy Sullivan 2001 Kauai Waimea
24. Lanikai ElementaryPublic Charter School
Todd Cullison Ed Noh 1996 WindwardOahu
Kalaheo
25. LaupahoehoeCommunity PublicCharter School
George Martin David Rizor 2011 EastHawaii
Hilo/Laupahoehoe
26. Mālama HonuaPublic CharterSchool 8F9F
10
Robert Witt Denise Espania 2012 Honolulu --
27. Myron B. ThompsonAcademy
Malia Chow,Myron
Thompson
Diana Oshiro 2001 Honolulu(online)
McKinley
28. Na Wai Ola (WatersOf Life) PublicCharter School
MauriceMessina
Daniel Caluya 2000 EastHawaii
Keaau
29. SEEQS: The Schoolfor ExaminingEssential Questionsof Sustainability
Carol Ota Buffy Cushman-Patz
2012 Honolulu Kalani
30. UniversityLaboratory School
David Oride Keoni Jeremiah 2001 Honolulu Roosevelt
31. Volcano School ofArts & Sciences
John Broward Ardith Renteria 2001 EastHawaii
Kau
32. Voyager: A PublicCharter School
Diane Anderson Mary Beth Barr 2000 Honolulu McKinley
33. Waialae ElementaryPublic Charter School
ChristopherWalling
WendyLagareta
1999 Honolulu Kalani
34. Waimea MiddlePublic ConversionCharter School
Pauline LoBailey
Matt Horne 2003 WestHawaii
Honokaa
8/10/2019 Hawaii charter schools annual report
http://slidepdf.com/reader/full/hawaii-charter-schools-annual-report 17/268
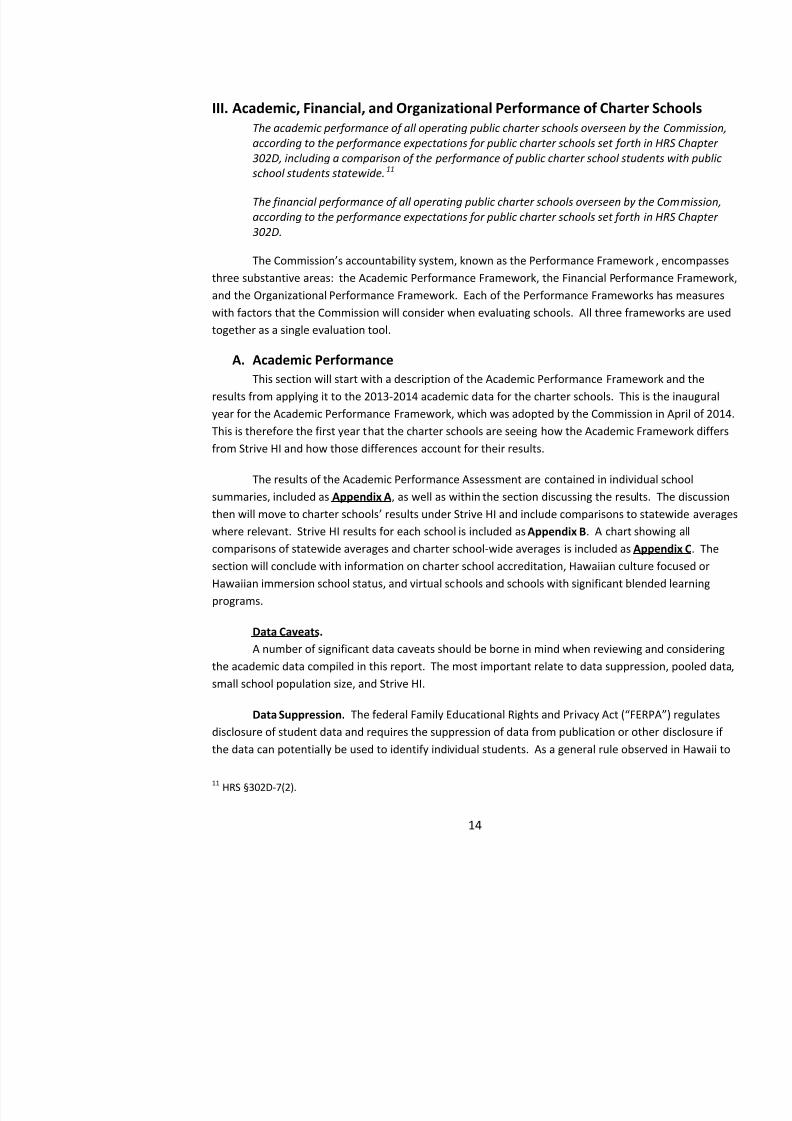
III. 4B3BAcademic, Financial, and Organizational Performance of Charter SchoolsThe academic performance of all operating public charter schools overseen by the Commissionaccording to the performance expectations for public charter schools set forth in HRS Chapter302D, including a comparison of the performance of public charter school students with publicschool students statewide. 9F10F
11
The financial performance of all operating public charter schools overseen by the Commission,according to the performance expectations for public charter schools set forth in HRS Chapter302D.
The Commission’s accountability system, known as the Performance Framework , ethree substantive areas: the Academic Performance Framework, the Financial Performance Frameand the Organizational Performance Framework. Each of the Performance Frameworks has measuwith factors that the Commission will consider when evaluating schools. All three frameworks aretogether as a single evaluation tool.
A. 12B11B
Academic PerformanceThis section will start with a description of the Academic Performance Framework and theresults from applying it to the 2013-2014 academic data for the charter schools. This is the inauguyear for the Academic Performance Framework, which was adopted by the Commission in April oThis is therefore the first year that the charter schools are seeing how the Academic Framework diffrom Strive HI and how those differences account for their results.
The results of the Academic Performance Assessment are contained in individual schoolsummaries, included as Appendix A , as well as within the section discussing the results. The dithen will move to charter schools ’ results under Strive HI and include comparisons to statewide where relevant. Strive HI results for each school is included as Appendix B . A chart showincomparisons of statewide averages and charter school-wide averages is included as Appensection will conclude with information on charter school accreditation, Hawaiian culture focused oHawaiian immersion school status, and virtual schools and schools with significant blended learninprograms.
Data Caveats.A number of significant data caveats should be borne in mind when reviewing and conside
the academic data compiled in this report. The most important relate to data suppression, pooled dsmall school population size, and Strive HI.
8/10/2019 Hawaii charter schools annual report
http://slidepdf.com/reader/full/hawaii-charter-schools-annual-report 18/268
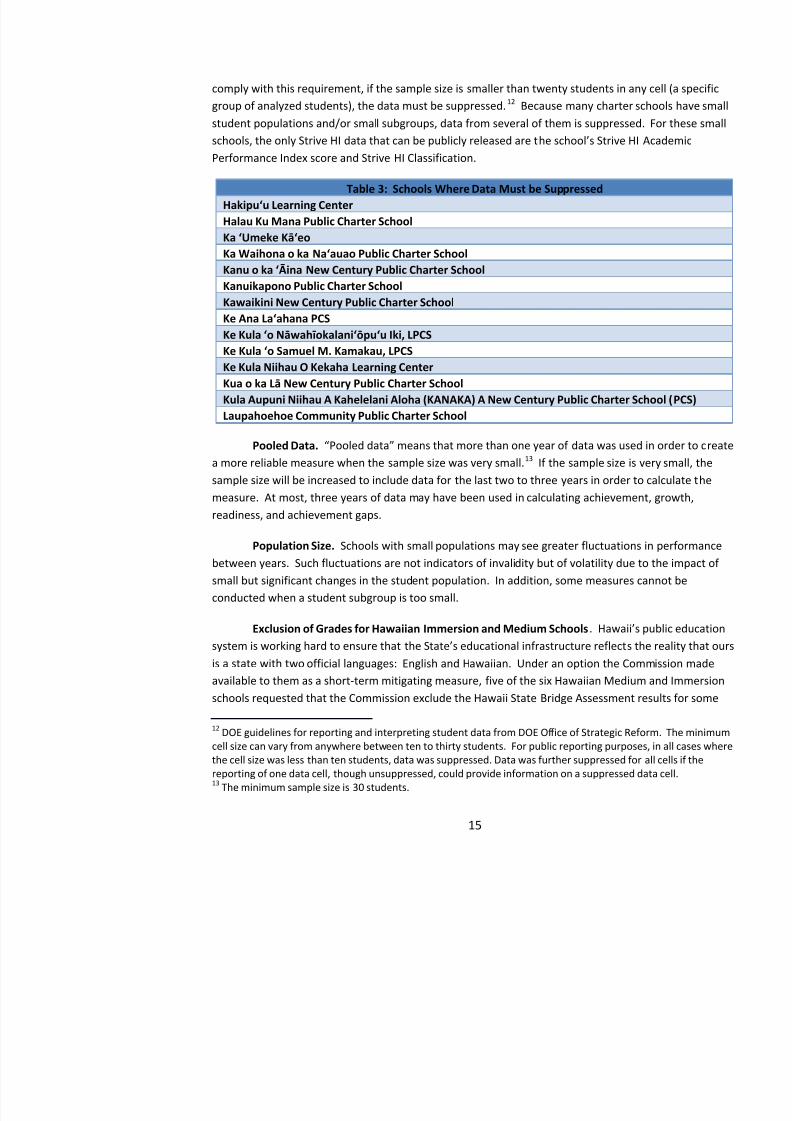
comply with this requirement, if the sample size is smaller than twenty students in any cell (a specigroup of analyzed students), the data must be suppressed. 11F
12 Because many charter schools h
student populations and/or small subgroups, data from several of them is suppressed. For these smschools, the only Strive HI data that can be publicly released are the school’s Strive HI AcadPerformance Index score and Strive HI Classification.
Table 3: Schools Where Data Must be SuppressedHakipu‘u Learning Center Halau Ku Mana Public Charter SchoolKa ‘Umeke Kā‘eo Ka Waihona o ka Na‘auao Public Charter School Kanu o ka ‘Āina New Century Public Charter School Kanuikapono Public Charter SchoolKawaikini New Century Public Charter SchoolKe Ana La‘ahana PCS Ke Kula ‘o Nāwahīokalani‘ōpu‘u Iki, LPCS Ke Kula ‘o Samuel M. Kamakau, LPCS
Ke Kula Niihau O Kekaha Learning CenterKua o ka Lā New Century Public Charter School Kula Aupuni Niihau A Kahelelani Aloha (KANAKA) A New Century Public Charter School (PCSLaupahoehoe Community Public Charter School
Pooled Data. “Pooled data” means that more than one year of data was used in ordea more reliable measure when the sample size was very small. 12F
13 If the sample size is very smsample size will be increased to include data for the last two to three years in order to calculate themeasure. At most, three years of data may have been used in calculating achievement, growth,readiness, and achievement gaps.
Population Size. Schools with small populations may see greater fluctuations in performbetween years. Such fluctuations are not indicators of invalidity but of volatility due to the impact small but significant changes in the student population. In addition, some measures cannot beconducted when a student subgroup is too small.
Exclusion of Grades for Hawaiian Immersion and Medium Schools . Hawaii’s pubsystem is working hard to ensure that the S tate’s educational infrastructure reflect s the reais a state with two official languages: English and Hawaiian. Under an option the Commission maavailable to them as a short-term mitigating measure, five of the six Hawaiian Medium and Immers
8/10/2019 Hawaii charter schools annual report
http://slidepdf.com/reader/full/hawaii-charter-schools-annual-report 19/268
grades from consideration under the Academic Performance Framework because the students in thgrades excluded are taught exclusively or primarily in the Hawaiian language. The Commission
approved the exclusion of results for the following grades from the following schools:
Results from Ka Umeke ’s grades 3, 4, and 5 were excluded;
Results from Kawaikini ’s grades 3, 4, and 5 were excluded;
Results from Kamakau ’s grades 3, 4, 5, and 6 were excluded;
Results from KKNOK’s grades 3, 4, and 5 were excluded; and
Results from Kualapuu ’s students in grades 3 and 4 who are on the schoolimmersion track were excluded.
Strive HI Year-to-Year Comparisons.
Strive HI Academic Performance Index Scores and Classifications. The Strive HI AcademPerformance Index (“ API”) score for a public school is made up of multiple indicators measuringachievement, growth, readiness, and achievement gaps. While Strive HI API scores may shift eachmost Strive HI Classifications will not change in this second year of Strive HI because they are twodesignations. However, schools that attained the criteria for Recognition status only in this past yewill be reclassified as Recognition schools. All school classifications will be re-evaluated after the2015 school year.
Schools Serving Multiple Grade Divisions. Strive HI considers a school ’s grade divisdetermined by the highest grade level the school serves. Because of this, for purposes of the Readincategory under Strive HI, DOE does not require a K-12 school, for example, to participate in the 8tgrade ACT EXPLORE exam and does not measure the elementary grades’ chronic absenteeithe Commission’s Academic Performa nce Framework evaluates multi-division charter schools fgrade division served; therefore charter schools are now required to provide the data for each gradedivision served.
8th Grade ACT EXPLORE and 11th Grade ACT Exams. The 8th grade ACT EXPLOREonly measure for the Strive HI College and Career Readiness indicator for middle or intermediateschools. It measures whether or not a student is on track to be college-ready. Last year, amedian 8th grade ACT EXPLORE Composite score was used to earn points on the Strive HI rubric
8/10/2019 Hawaii charter schools annual report
http://slidepdf.com/reader/full/hawaii-charter-schools-annual-report 20/268
Missing Data. Again, charter schools were required to administer the 8th grade ACT EXPand 11th grade ACT exams for the 2013-2014 school year but not for the previous year; thus, there
more data available this year on these measures. In addition, some measures are missing data in onboth years simply because some schools ’ student populations were too small to conduct the me
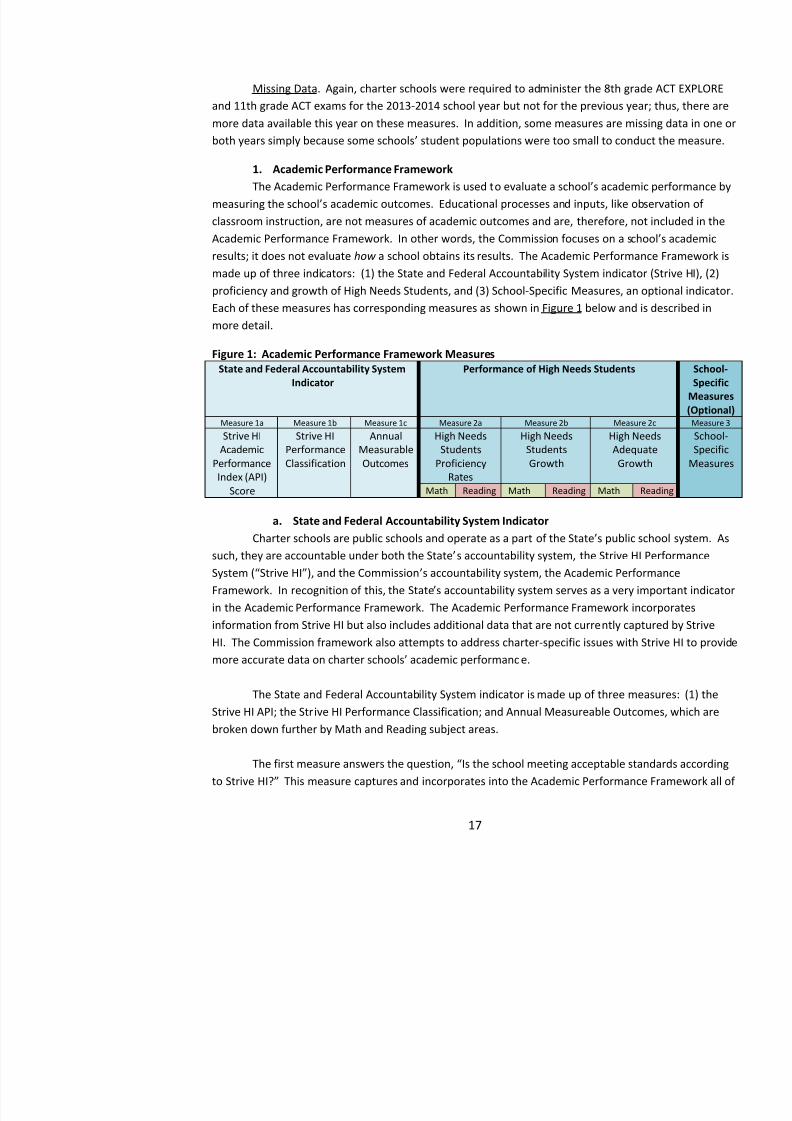
1. 19B18BAcademic Performance FrameworkThe Academic Performance Framework is used to evaluate a school’s academic perf
measuring the school ’s academic outcomes. Educational processes and inputs, like observatclassroom instruction, are not measures of academic outcomes and are, therefore, not included in thAcademic Performance Framework. In other words, the Commission focuses on a s chool’sresults; it does not evaluate how a school obtains its results. The Academic Performance Frammade up of three indicators: (1) the State and Federal Accountability System indicator (Strive HI),proficiency and growth of High Needs Students, and (3) School-Specific Measures, an optional indEach of these measures has corresponding measures as shown in Figure 1 below and is described inmore detail.
Figure 1: Academic Performance Framework MeasuresState and Federal Accountability System
IndicatorPerformance of High Needs Students
Measure 1a Measure 1b Measure 1c Measure 2a Measure 2b Measure 2c
Strive HIAcademic
PerformanceIndex (API)
Score
Strive HIPerformanceClassification
AnnualMeasurableOutcomes
High NeedsStudents
ProficiencyRates
High NeedsStudentsGrowth
High NeedsAdequateGrowth
Math Reading Math Reading Math Reading
a. State and Federal Accountability System Indicator Charter schools are public schools and operate as a part of the State’s public schoo
such, they are accountable under both the State’s accountability system, the Strive HI PerfoSystem (“Strive HI”), and the Commission ’s accountability system, the Academic PerformanFramework. In recognition of this, the State ’s accountability system serves as a very important
in the Academic Performance Framework. The Academic Performance Framework incorporatesinformation from Strive HI but also includes additional data that are not currently captured by StrivHI. The Commission framework also attempts to address charter-specific issues with Strive HI to more accurate data on charter schools’ academic performanc e.
8/10/2019 Hawaii charter schools annual report
http://slidepdf.com/reader/full/hawaii-charter-schools-annual-report 21/268
the data that were in Strive HI. Because Strive HI provides a snapshot of the performance of allstudents, this measures provides a snapshot of all students’ academic performance in this sys
For most charter schools, this measure uses a different API score than that assigned by Strin order to address the charter-specific issue of multi-divisional schools. Most DOE schools are sindivision schools —either elementary, middle, or high schools. Most charter schools, however, are divisional, with many schools offering grades kindergarten through 12 th grade. Strive HI exschool’s performance according to the measures specific to the school’s division, which is the highest grade level served at the school. The Readiness category under Strive HI is calculated
differently for each grade division, and each grade division’s relative weighting of the four caunder Strive HI also differs , even though student achievement results from all of a school’s teare factored into the results that are weighted. Therefore, in some ways a charter school that servegrades K-12, for example, is evaluated as a high school, even if a majority of the school’s poits elementary division.
In order to address this issue, the Commission’s Academic Performance Framework
API score for each grade division that the school serves (elementary, middle, and high) and then wthe API score for each division based on the percentage of the student population in each division. result is an overall Weighted API score.
This method is intended to give a more accurate view of how schools are performing witheach division rather than having the indicator depend solely on the highest grade level served. Becthe overall Weighted API score takes into account the multi-divisional nature of most charter schoo
and acknowledges that the number of students in each division differs, the overall Weighted API scshould provide a more accurate picture of school performance, especially for K-12 charter schoolsthat —as is often the case —serve fewer students in the upper grades than in the lower.
The second measure in the State and Federal Accountability System indicator is the StriveClassification. This measure is used for informational purposes only. Strive HI separates schools ifour classes. The top 5% of schools are classified as “Recognition” schools, the next highest
schools are classified as “Continuous Improvement” schools , the next 10% are classified asschools, and the lowest 5% are “Priority” schools . The Strive HI system then makes additionaavailable to Priority and Focus schools to support their school improvement efforts.
The third measure is Annual Measurable Outcomes. This measure is used for information
8/10/2019 Hawaii charter schools annual report
http://slidepdf.com/reader/full/hawaii-charter-schools-annual-report 22/268
b. High Needs StudentsThe Academic Performance Framework also takes a closer look at how well charter schoo
serve High Needs Students —students who qualify for Free and Reduced Lunch (“FRL”), ELearners (“ELL”), and students who are receiving special education. The Commission assigns a higher priority to a school’s performance in serving High Needs Students than does Strive HI, than considering the school’s performance as to such students only relative to its performancNon-High Needs Students, it looks closely at the results for High Needs Students on their own. Stacademic proficiency and growth are critical indicators of a school’s academic performanceframework gives significant consideration to data that report on High Needs Student proficiency in
state-tested subjects and academic growth over time. Proficiency measures show how well studentperforming in Math and Reading. Growth measures show how effective schools are in impactingstudent learning within the school year. It is important to look at both types of measures together tget a clearer picture of a school’s academic performance and effectiveness for this student subgr
Proficiency rates of High Needs Students are calculated by evaluating the percentage of HNeeds Students who are proficient in Math and Reading on the state assessment. This percentage iscompared to proficiency rates of High Needs S tudents statewide. The performance of a schoNeeds population is compared only to proficiency rates of schools serving the same grades. The mfor this measure uses a percentile ranking to evaluate performance.
Growth of High Needs Students is measured by determining the median Student GrowthPercentile among the High Needs population at a school. The metric for this measure uses a reviseversion of the Strive HI growth scoring model. 13F
14
The Academic Performance Framework also looks at High Needs Adequate Growth. Thimeasure evaluates the growth of the High Needs Students and indicates whether this rate of growthwould lead students to be proficient in three years or by 10 th grade, whichever comes first. Dnot available to conduct this measure this year.
c. School-Specific MeasuresThe Academic Performance Framework includes an optional measure that provides schoo
opportunity to capture the accomplishment of their specific missions. Many charter schools haveeducational missions extending beyond imparting skills and content that are assessed and captured state and federal accountability measures. Allowing these schools to propose School-Specific Mea
14 i di id l d ’ h b i h d
8/10/2019 Hawaii charter schools annual report
http://slidepdf.com/reader/full/hawaii-charter-schools-annual-report 23/268
provides the schools the opportunity to develop best practices and be accountable to the Commissioand the public for measures that capture such a distinctive education focus or purpose. The
Commission evaluates and approves all School-Specific Measures, which must be rigorous, valid, areliable before they can be included in the results for that school.
The 2014-2015 school year is the first year in which School-Specific Measures will be proby schools to be approved for use in the Academic Performance Framework. Schools that have aCommission approved School-Specific Measure will collect student data according to the defined mof their School-Specific Measure. The school collected data will be used in the calculation of Acad
Performance Framework for the 2014-2015 school year. The results of the School-Specific Measuschools that have successfully collected and provided data therefore will be included in neAnnual Report. Currently, several schools are developing measures that attempt to capture studentacademic performance that is aligned to their specific school mission and collecting baseline data tcreate School- Specific Measures. Two of these schools, Kamakau and Volcano, have completeddevelopment of these measures, which have been approved by the Commission for inclusion in 2012015 results.
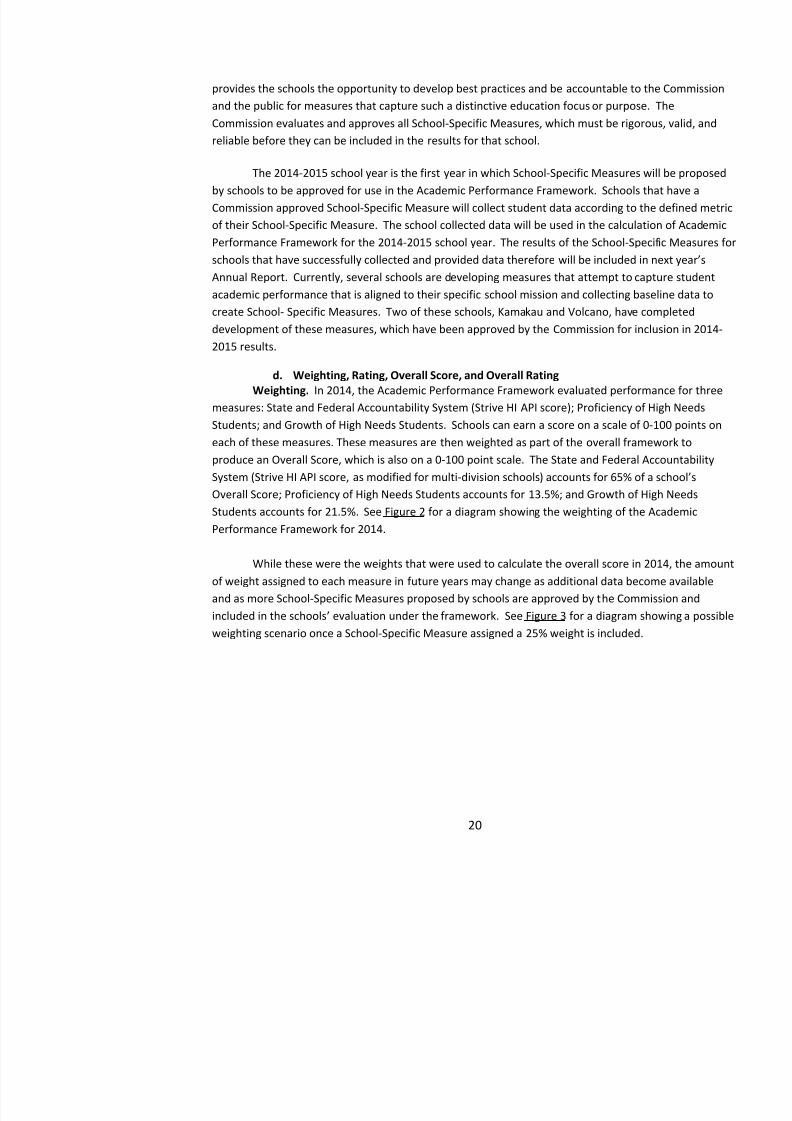
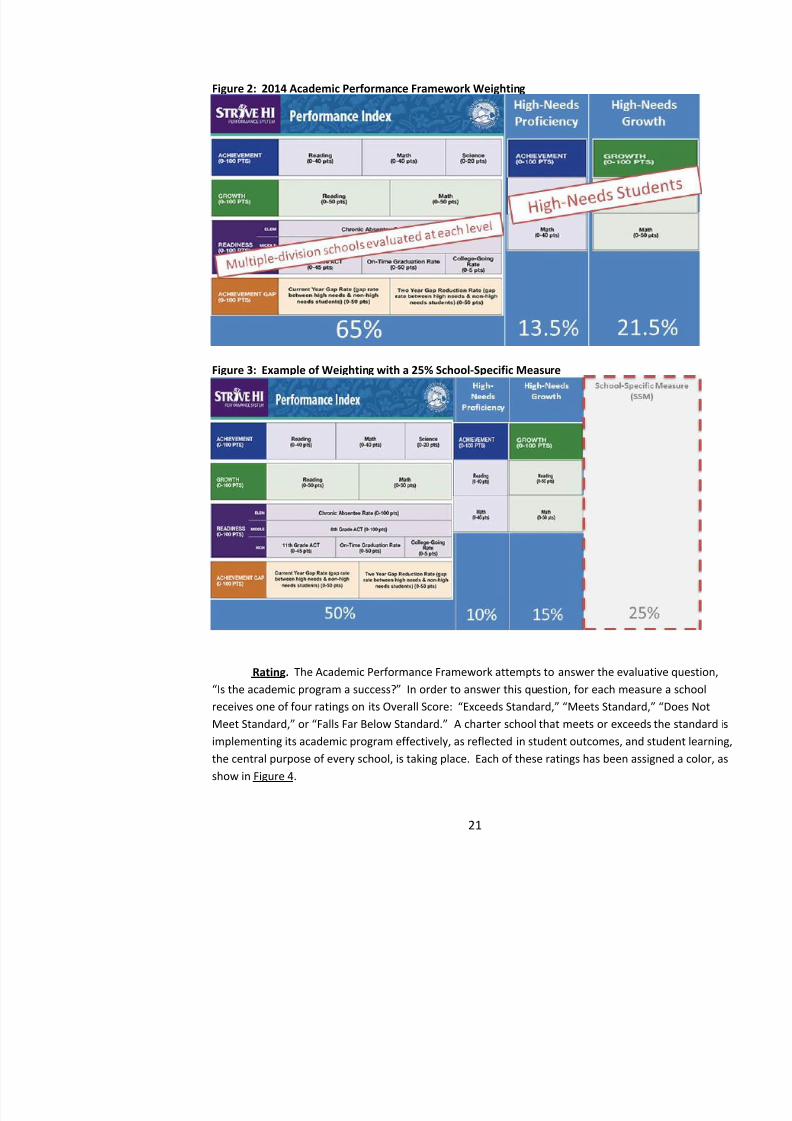
d. Weighting, Rating, Overall Score, and Overall RatingWeighting. In 2014, the Academic Performance Framework evaluated performance for t
measures: State and Federal Accountability System (Strive HI API score); Proficiency of High NeeStudents; and Growth of High Needs Students. Schools can earn a score on a scale of 0-100 pointseach of these measures. These measures are then weighted as part of the overall framework toproduce an Overall Score, which is also on a 0-100 point scale. The State and Federal AccountabilSystem (Strive HI API score, as modified for multi-division schools ) accounts for 65% of a scOverall Score; Proficiency of High Needs Students accounts for 13.5%; and Growth of High NeedsStudents accounts for 21.5%. See Figure 2 for a diagram showing the weighting of the AcademicPerformance Framework for 2014.
While these were the weights that were used to calculate the overall score in 2014, the amof weight assigned to each measure in future years may change as additional data become availableand as more School-Specific Measures proposed by schools are approved by the Commission andincluded in the schools ’ evaluation under the framework. See Figure 3 for a diagram showing a weighting scenario once a School-Specific Measure assigned a 25% weight is included.
8/10/2019 Hawaii charter schools annual report
http://slidepdf.com/reader/full/hawaii-charter-schools-annual-report 24/268
Figure 2: 2014 Academic Performance Framework Weighting
Figure 3: Example of Weighting with a 25% School-Specific Measure
Rating. The Academic Performance Framework attempts to answer the evaluative questi“I th d i ? ” I d t thi ti f h h
8/10/2019 Hawaii charter schools annual report
http://slidepdf.com/reader/full/hawaii-charter-schools-annual-report 25/268
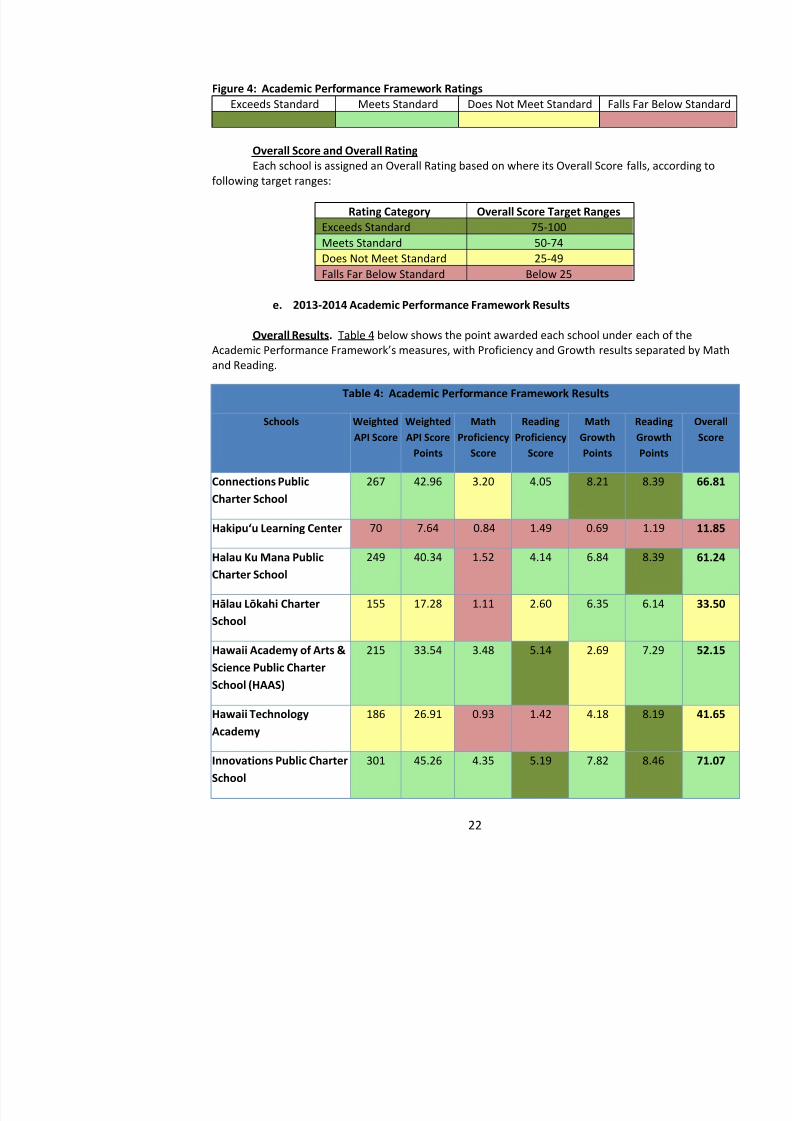
Figure 4: Academic Performance Framework RatingsExceeds Standard Meets Standard Does Not Meet Standard Falls Far Below S
Overall Score and Overall RatingEach school is assigned an Overall Rating based on where its Overall Score falls, accordin
following target ranges:
Rating Category Overall Score Target RangesExceeds Standard 75-100
Meets Standard 50-74Does Not Meet Standard 25-49Falls Far Below Standard Below 25
e. 2013-2014 Academic Performance Framework Results
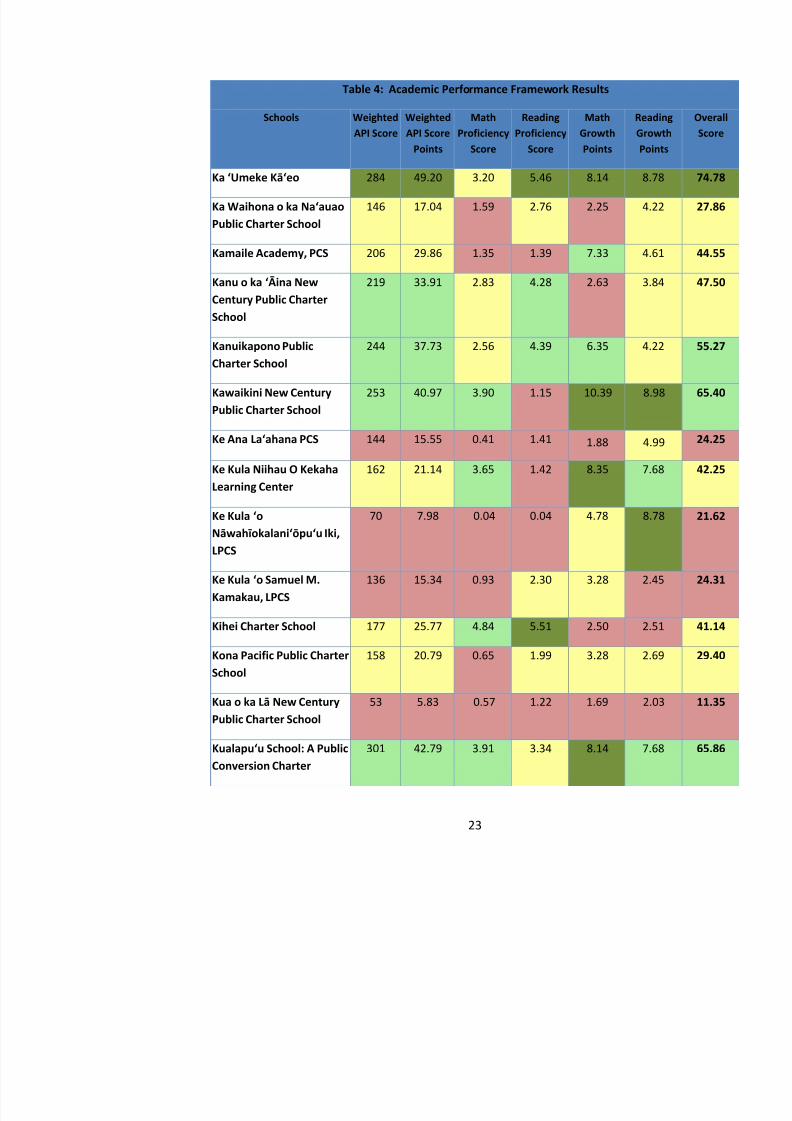
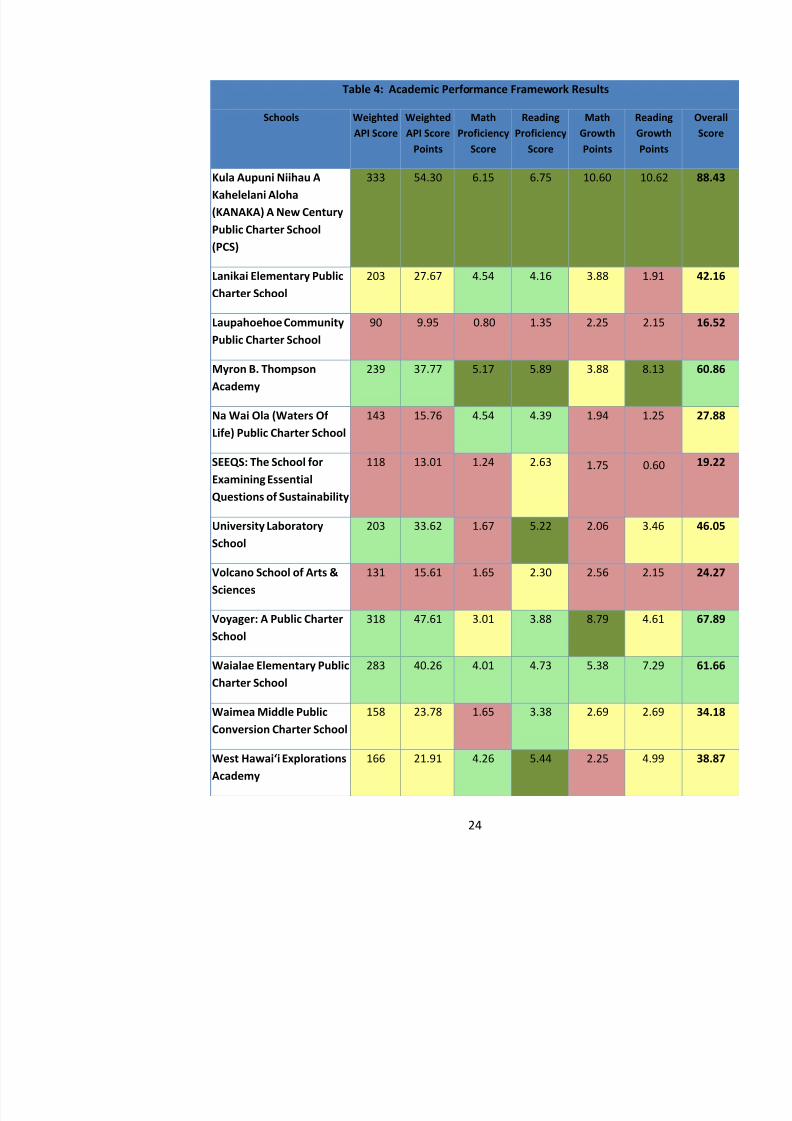
Overall Results. Table 4 below shows the point awarded each school under each of theAcademic Performance Framework’s measures, with Proficiency and Growth results separat
and Reading.
Table 4: Academic Performance Framework Results
Schools WeightedAPI Score
WeightedAPI Score
Points
MathProficiency
Score
ReadingProficiency
Score
MathGrowthPoints
ReadinGrowtPoints
Connections PublicCharter School
267 42.96 3.20 4.05 8.21 8.39
Hakipu‘u Learning Center 70 7.64 0.84 1.49 0.69 1.19
Halau Ku Mana PublicCharter School
249 40.34 1.52 4.14 6.84 8.39
Hālau LōkahiCharterSchool
155 17.28 1.11 2.60 6.35 6.14
Hawaii Academy of Arts &Science Public CharterSchool (HAAS)
215 33.54 3.48 5.14 2.69 7.29
8/10/2019 Hawaii charter schools annual report
http://slidepdf.com/reader/full/hawaii-charter-schools-annual-report 26/268
Table 4: Academic Performance Framework Results
Schools WeightedAPI Score
WeightedAPI Score
Points
MathProficiency
Score
ReadingProficiency
Score
MathGrowthPoints
ReadinGrowtPoints
Ka ‘Umeke Kā‘eo 284 49.20 3.20 5.46 8.14 8.78
Ka Waihona o ka Na‘auaoPublic Charter School
146 17.04 1.59 2.76 2.25 4.22
Kamaile Academy, PCS 206 29.86 1.35 1.39 7.33 4.61
Kanu o ka ‘Āina NewCentury Public CharterSchool
219 33.91 2.83 4.28 2.63 3.84
Kanuikapono Public
Charter School
244 37.73 2.56 4.39 6.35 4.22
Kawaikini New CenturyPublic Charter School
253 40.97 3.90 1.15 10.39 8.98
Ke Ana La‘ahana PCS 144 15.55 0.41 1.41 1.88 4.99
Ke Kula Niihau O Kekaha
Learning Center
162 21.14 3.65 1.42 8.35 7.68
Ke Kula ‘oNāwahīokalani‘ōpu‘u Iki,LPCS
70 7.98 0.04 0.04 4.78 8.78
Ke Kula ‘o Samuel M.Kamakau, LPCS
136 15.34 0.93 2.30 3.28 2.45
Kihei Charter School 177 25.77 4.84 5.51 2.50 2.51
Kona Pacific Public CharterSchool
158 20.79 0.65 1.99 3.28 2.69
8/10/2019 Hawaii charter schools annual report
http://slidepdf.com/reader/full/hawaii-charter-schools-annual-report 27/268
Table 4: Academic Performance Framework Results
Schools WeightedAPI Score
WeightedAPI Score
Points
MathProficiency
Score
ReadingProficiency
Score
MathGrowthPoints
ReadinGrowtPoints
Kula Aupuni Niihau AKahelelani Aloha(KANAKA) A New CenturyPublic Charter School
(PCS)
333 54.30 6.15 6.75 10.60 10.62
Lanikai Elementary PublicCharter School
203 27.67 4.54 4.16 3.88 1.91
Laupahoehoe CommunityPublic Charter School
90 9.95 0.80 1.35 2.25 2.15
Myron B. ThompsonAcademy
239 37.77 5.17 5.89 3.88 8.13
Na Wai Ola (Waters OfLife) Public Charter School
143 15.76 4.54 4.39 1.94 1.25
SEEQS: The School forExamining EssentialQuestions of Sustainability
118 13.01 1.24 2.63 1.75 0.60
University LaboratorySchool
203 33.62 1.67 5.22 2.06 3.46
Volcano School of Arts &Sciences
131 15.61 1.65 2.30 2.56 2.15
Voyager: A Public CharterSchool
318 47.61 3.01 3.88 8.79 4.61
Waialae Elementary PublicCharter School
283 40.26 4.01 4.73 5.38 7.29
8/10/2019 Hawaii charter schools annual report
http://slidepdf.com/reader/full/hawaii-charter-schools-annual-report 28/268
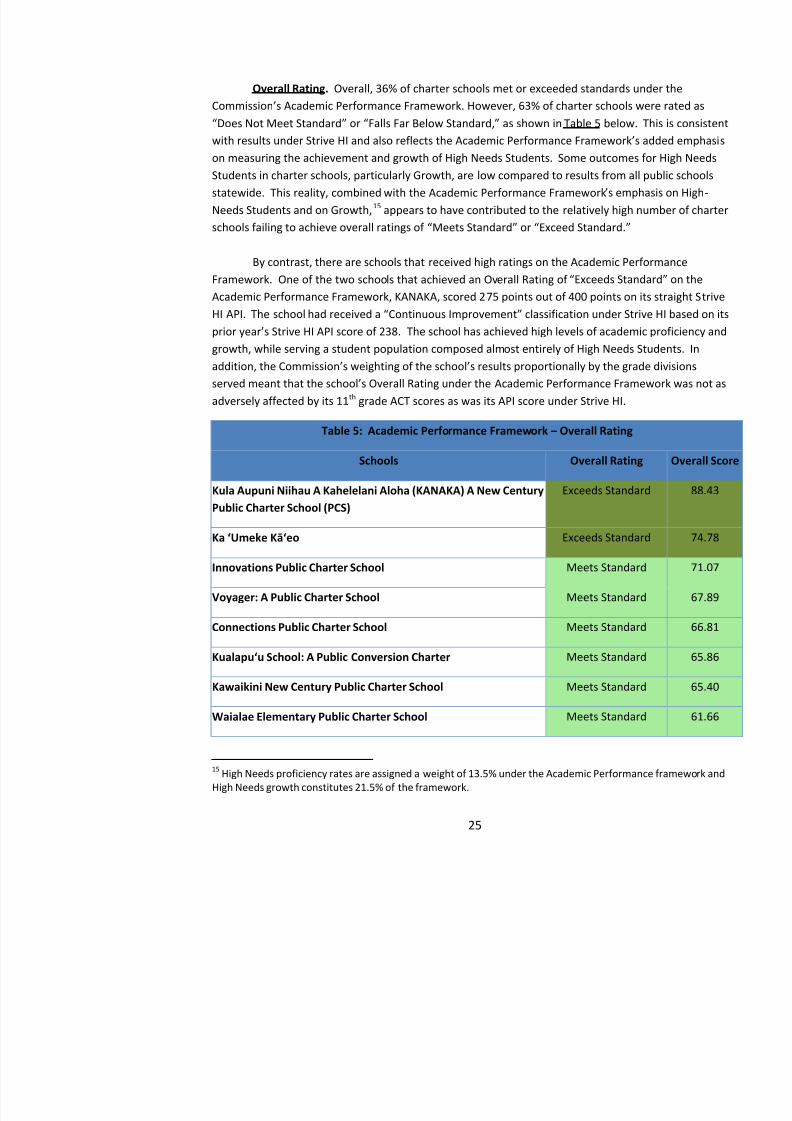
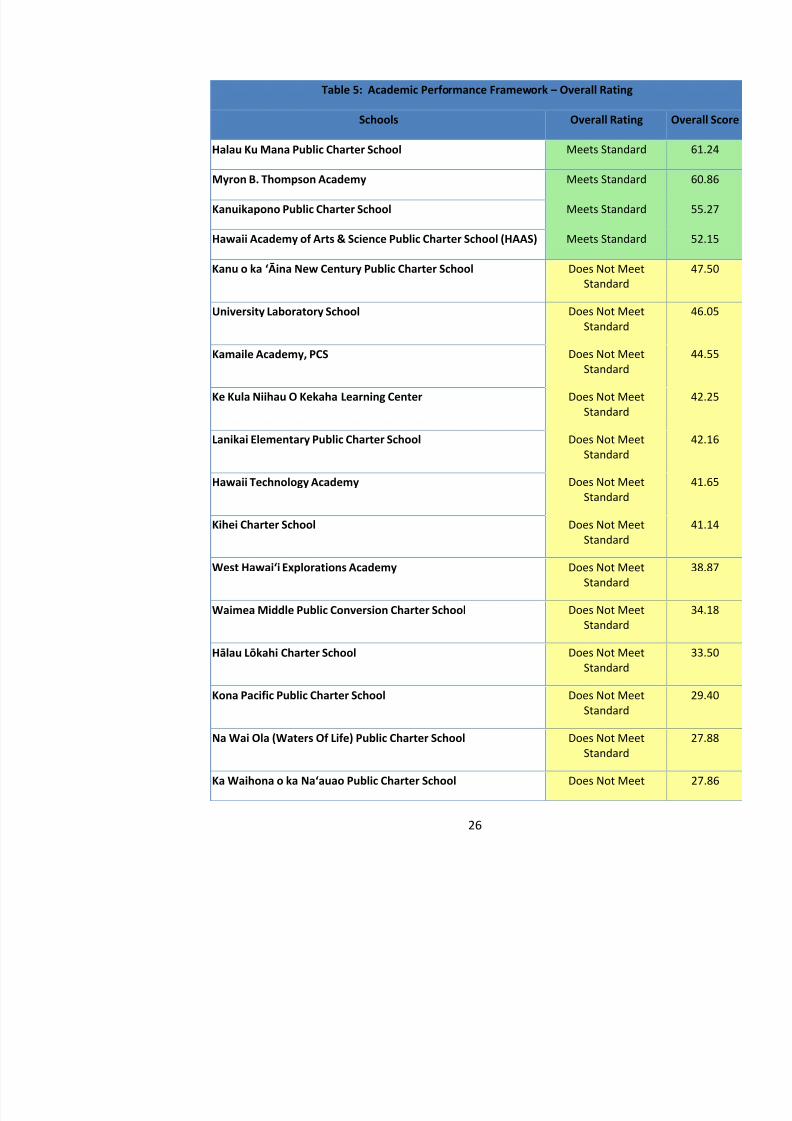
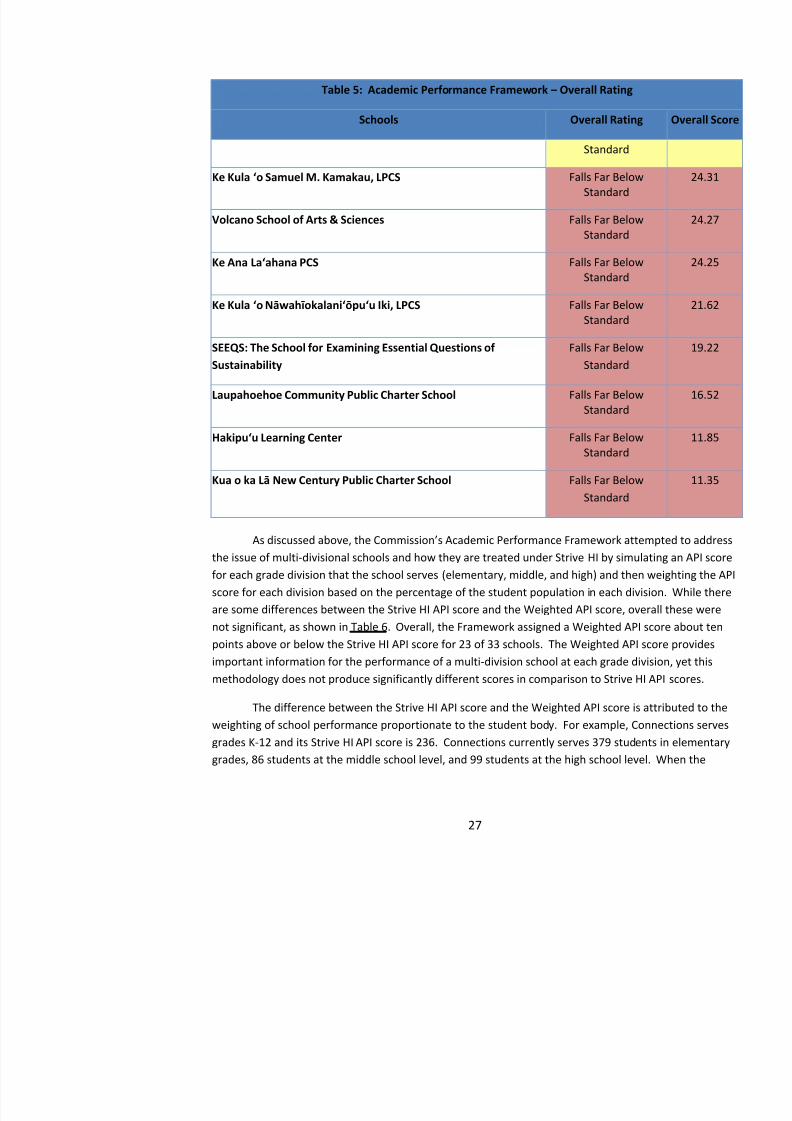
Overall Rating. Overall, 36% of charter schools met or exceeded standards under theCommission ’s Academic Performance Framework. However, 63% of charter schools were rated a
“Does Not Meet Standard ” or “Falls Far Below Standard, ” as shown in Table 5 below. This iswith results under Strive HI and also reflects the Academic Performance Framework’s addeon measuring the achievement and growth of High Needs Students. Some outcomes for High NeeStudents in charter schools, particularly Growth, are low compared to results from all public schoostatewide. This reality, combined with the Academic Performance Framework ’s emphasis Needs Students and on Growth, 14F
15 appears to have contributed to the relatively high number of cschools failing to achieve overall ratings of “Meet s Standard ” or “Exceed Standard.”
By contrast, there are schools that received high ratings on the Academic PerformanceFramework. One of the two schools that achieved an Overall Rating of “Exceeds Standard”Academic Performance Framework, KANAKA, scored 275 points out of 400 points on its straight HI API. The school had received a “Continuous Improvement” classification under Strive HIprior year’s Strive HI API score of 238.The school has achieved high levels of academic proficigrowth, while serving a student population composed almost entirely of High Needs Students. In
addition, the Commission’s weighting of the school’s results proportionally by the grade diviserved meant that the school’s Overall Rating under the Academic Performance Framework adversely affected by its 11 th grade ACT scores as was its API score under Strive HI.
Table 5: Academic Performance Framework – Overall Rating
Schools Overall Rating
Kula Aupuni Niihau A Kahelelani Aloha (KANAKA) A New CenturyPublic Charter School (PCS)
Exceeds Standard
Ka ‘Umeke Kā‘eo Exceeds Standard
Innovations Public Charter School Meets Standard
Voyager: A Public Charter School Meets Standard
Connections Public Charter School Meets Standard
Kualapu‘u School: A Public Conversion Charter Meets Standard
Kawaikini New Century Public Charter School Meets Standard
8/10/2019 Hawaii charter schools annual report
http://slidepdf.com/reader/full/hawaii-charter-schools-annual-report 29/268
Table 5: Academic Performance Framework – Overall Rating
Schools Overall Rating
Halau Ku Mana Public Charter School Meets Standard
Myron B. Thompson Academy Meets Standard
Kanuikapono Public Charter School Meets Standard
Hawaii Academy of Arts & Science Public Charter School (HAAS) Meets Standard
Kanu o ka ‘Āina New Century Public Charter School Does Not MeetStandard
University Laboratory School Does Not MeetStandard
Kamaile Academy, PCS Does Not Meet
Standard
Ke Kula Niihau O Kekaha Learning Center Does Not MeetStandard
Lanikai Elementary Public Charter School Does Not MeetStandard
Hawaii Technology Academy Does Not MeetStandard
Kihei Charter School Does Not MeetStandard
West Hawai‘i Explorations Academy Does Not MeetStandard
Waimea Middle Public Conversion Charter School Does Not MeetStandard
Hālau LōkahiCharter School Does Not MeetStandard
8/10/2019 Hawaii charter schools annual report
http://slidepdf.com/reader/full/hawaii-charter-schools-annual-report 30/268
Table 5: Academic Performance Framework – Overall Rating
Schools Overall Rating
Standard
Ke Kula ‘o Samuel M. Kamakau, LPCS Falls Far BelowStandard
Volcano School of Arts & Sciences Falls Far BelowStandard
Ke Ana La‘ahana PCS Falls Far BelowStandard
Ke Kula ‘o Nāwahīokalani‘ōpu‘u Iki, LPCS Falls Far BelowStandard
SEEQS: The School for Examining Essential Questions of
Sustainability
Falls Far Below
Standard
Laupahoehoe Community Public Charter School Falls Far BelowStandard
Hakipu‘u Learning Center Falls Far BelowStandard
Kua o ka LāNew Century Public Charter School Falls Far BelowStandard
As discussed above, the Commission’s Academic Performance Framework attemptethe issue of multi-divisional schools and how they are treated under Strive HI by simulating an APIfor each grade division that the school serves (elementary, middle, and high) and then weighting thscore for each division based on the percentage of the student population in each division. While th
are some differences between the Strive HI API score and the Weighted API score, overall these wnot significant, as shown in Table 6. Overall, the Framework assigned a Weighted API score aboutpoints above or below the Strive HI API score for 23 of 33 schools. The Weighted API score provimportant information for the performance of a multi-division school at each grade division, yet thimethodology does not produce significantly different scores in comparison to Strive HI API scores
8/10/2019 Hawaii charter schools annual report
http://slidepdf.com/reader/full/hawaii-charter-schools-annual-report 31/268
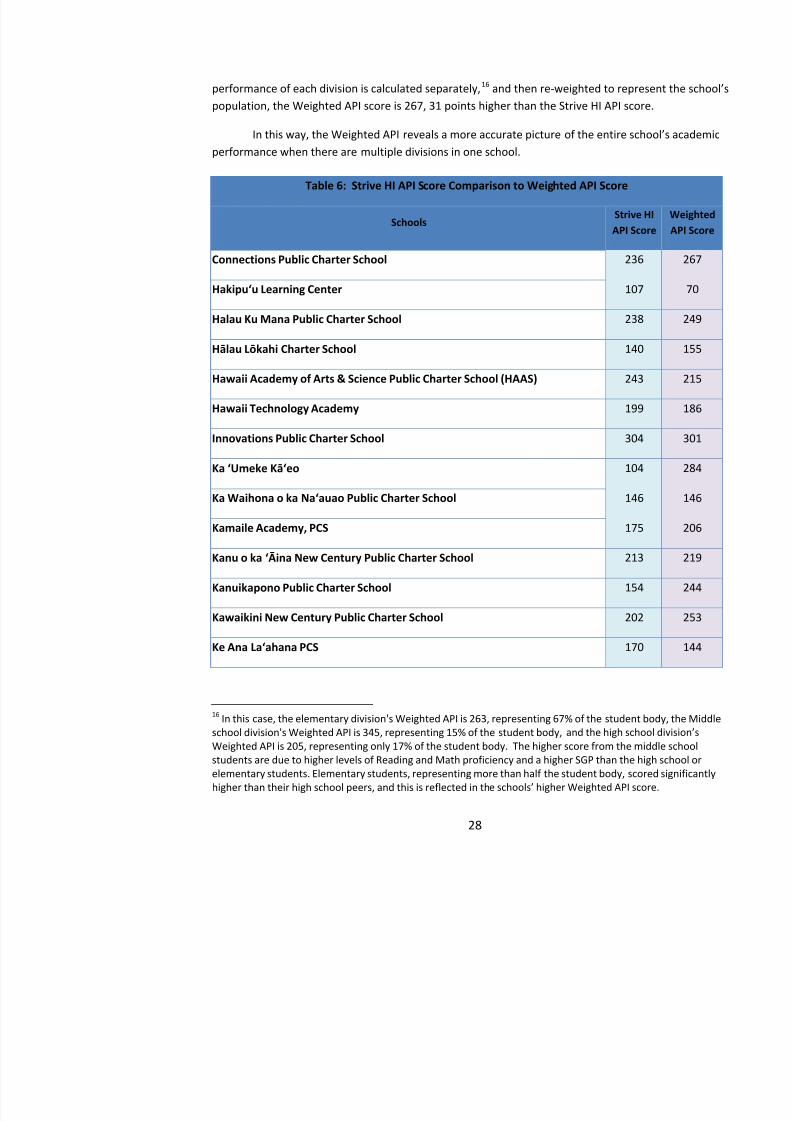
performance of each division is calculated separately, 15F
16 and then re- weighted to represent population, the Weighted API score is 267, 31 points higher than the Strive HI API score.
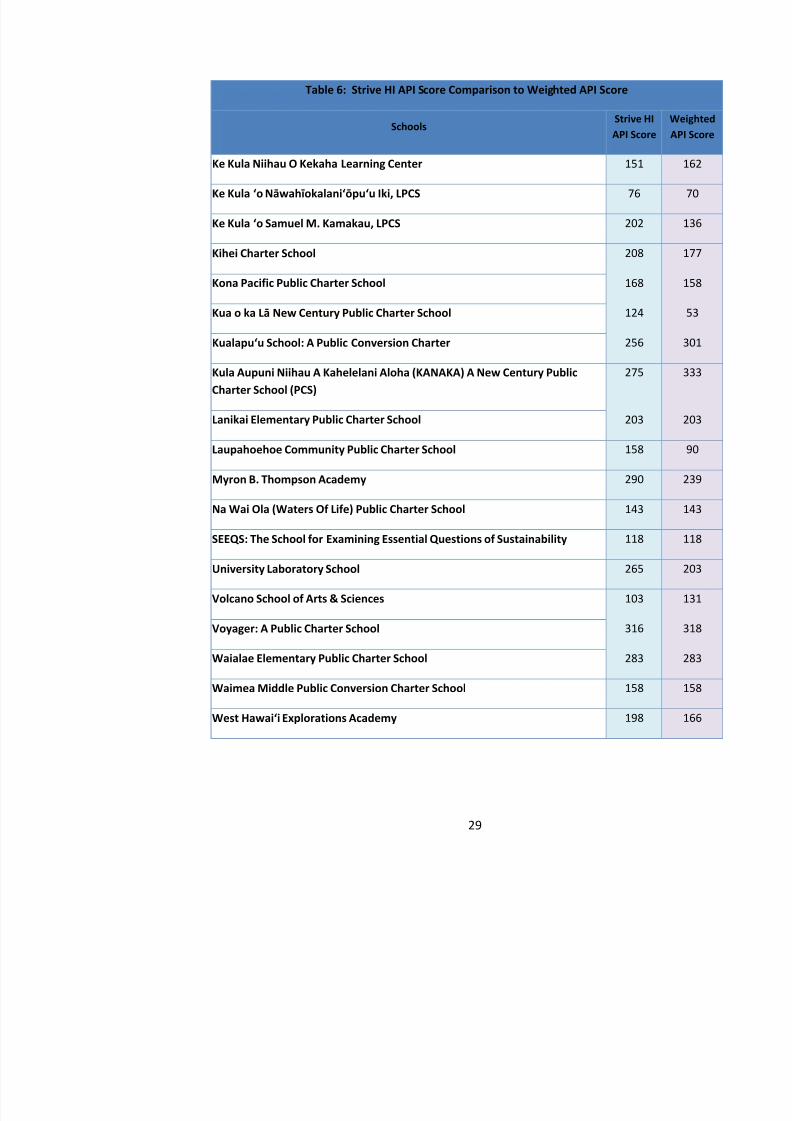
In this way, the Weighted API reveals a more accurate picture of the entire school’s aperformance when there are multiple divisions in one school.
Table 6: Strive HI API Score Comparison to Weighted API Score
Schools Strive HIAPI Score
Connections Public Charter School 236
Hakipu‘u Learning Center 107
Halau Ku Mana Public Charter School 238
Hālau LōkahiCharter School 140
Hawaii Academy of Arts & Science Public Charter School (HAAS) 243
Hawaii Technology Academy 199
Innovations Public Charter School 304
Ka ‘Umeke Kā‘eo 104
Ka Waihona o ka Na‘auao Public Charter School 146
Kamaile Academy, PCS 175
Kanu o ka ‘Āina New Century Public Charter School 213
Kanuikapono Public Charter School 154
Kawaikini New Century Public Charter School 202
Ke Ana La‘ahana PCS 170
8/10/2019 Hawaii charter schools annual report
http://slidepdf.com/reader/full/hawaii-charter-schools-annual-report 32/268
Table 6: Strive HI API Score Comparison to Weighted API Score
Schools Strive HIAPI Score
Ke Kula Niihau O Kekaha Learning Center 151
Ke Kula ‘o Nāwahīokalani‘ōpu‘u Iki, LPCS 76
Ke Kula ‘o Samuel M. Kamakau, LPCS 202
Kihei Charter School 208
Kona Pacific Public Charter School 168
Kua o ka LāNew Century Public Charter School 124
Kualapu‘u School: A Public Conversion Charter 256
Kula Aupuni Niihau A Kahelelani Aloha (KANAKA) A New Century PublicCharter School (PCS)
275
Lanikai Elementary Public Charter School 203
Laupahoehoe Community Public Charter School 158
Myron B. Thompson Academy 290
Na Wai Ola (Waters Of Life) Public Charter School 143
SEEQS: The School for Examining Essential Questions of Sustainability 118
University Laboratory School 265
Volcano School of Arts & Sciences 103
Voyager: A Public Charter School 316
Waialae Elementary Public Charter School 283
Waimea Middle Public Conversion Charter School 158
8/10/2019 Hawaii charter schools annual report
http://slidepdf.com/reader/full/hawaii-charter-schools-annual-report 33/268
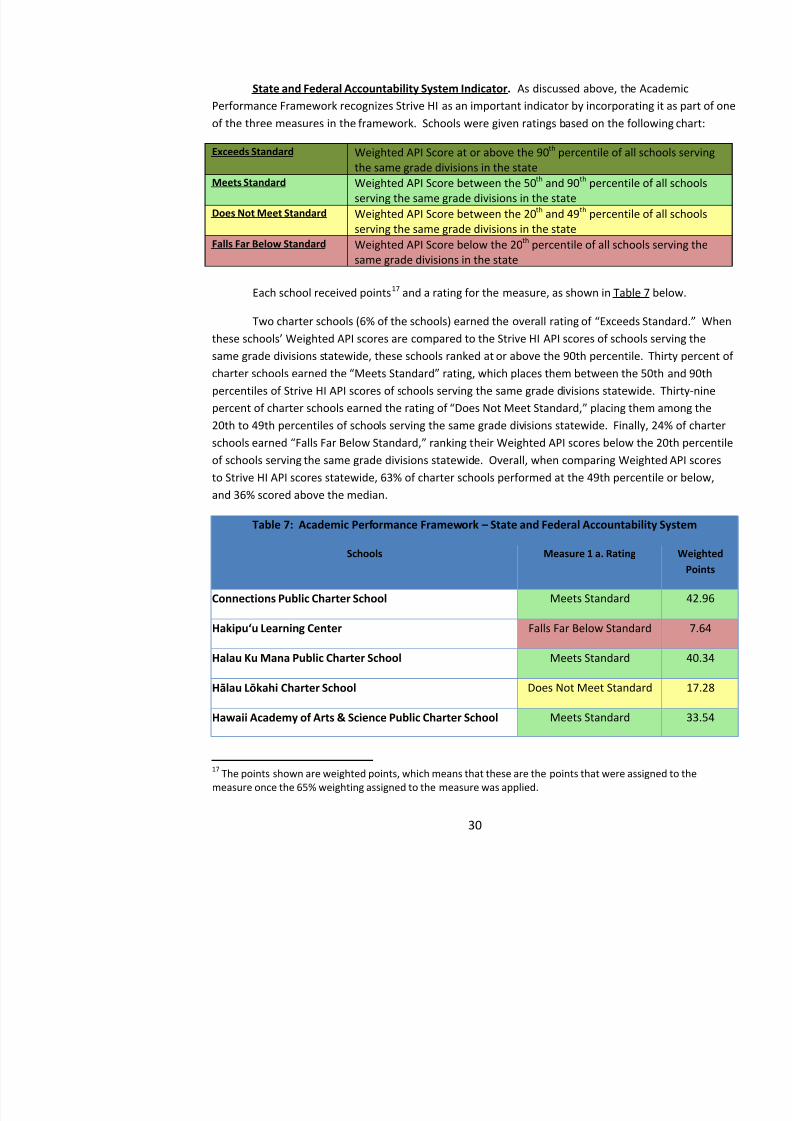
State and Federal Accountability System Indicator. As discussed above, the AcademPerformance Framework recognizes Strive HI as an important indicator by incorporating it as part of the three measures in the framework. Schools were given ratings based on the following chart:
Exceeds Standard Weighted API Score at or above the 90 th percentile of all schoolthe same grade divisions in the state
Meets Standard Weighted API Score between the 50 th and 90 th percentile of all serving the same grade divisions in the state
Does Not Meet Standard Weighted API Score between the 20 th and 49 th percentile of all serving the same grade divisions in the state
Falls Far Below Standard Weighted API Score below the 20 th percentile of all schools servisame grade divisions in the state
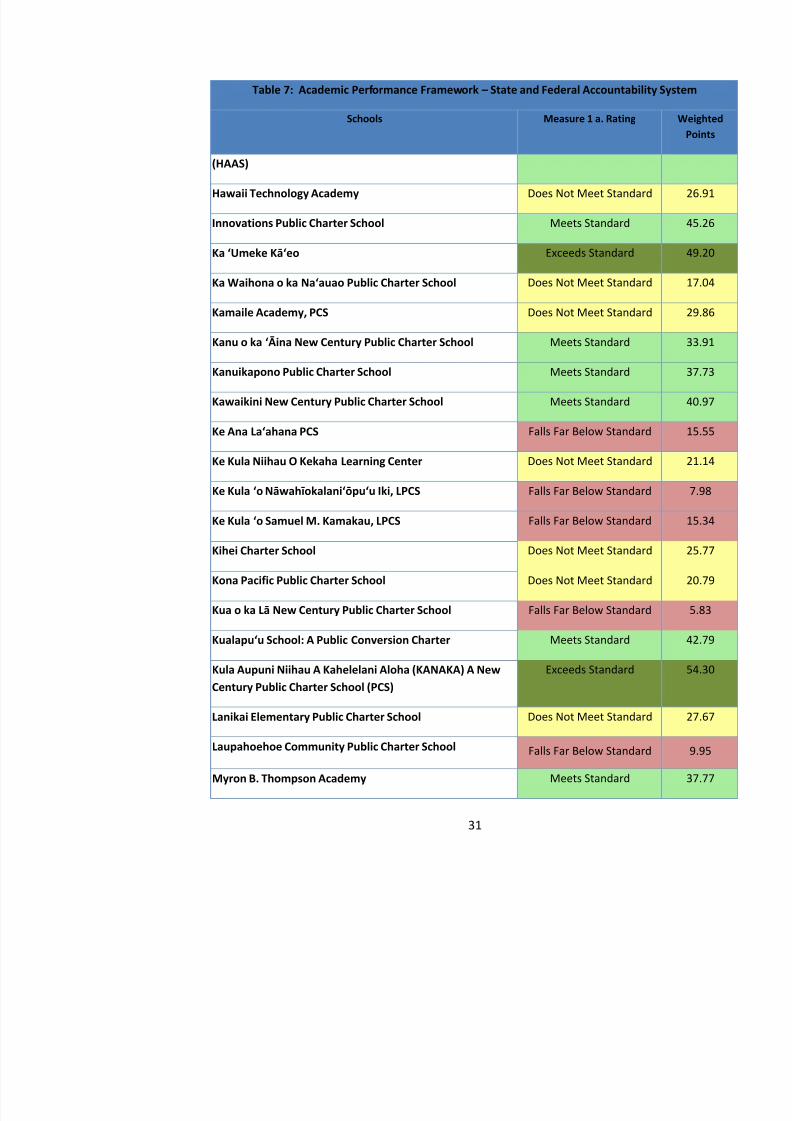
Each school received points 16F
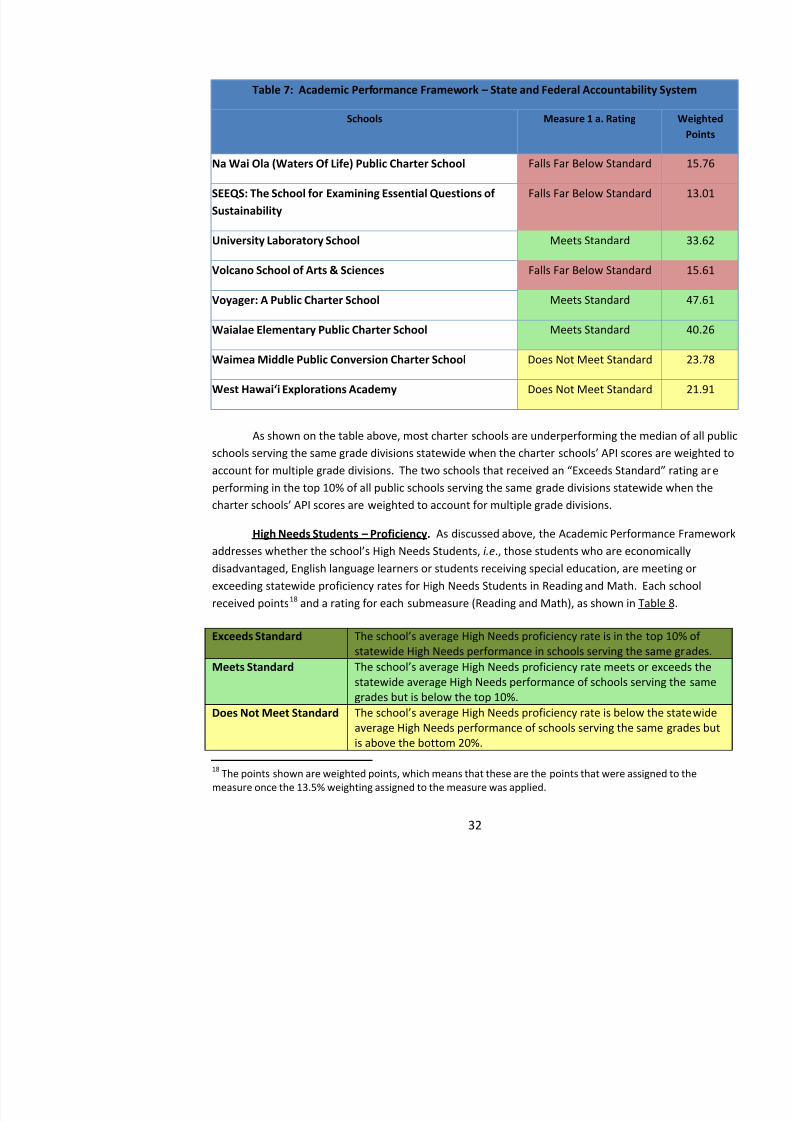
17 and a rating for the measure, as shown in Table 7 below.
Two charter schools (6% of the schools) earned the over all rating of “Exceeds Stanthese schools’ Weighted API scores are compared to the Strive HI API scores of schools servinsame grade divisions statewide, these schools ranked at or above the 90th percentile. Thirty percen
charter schools earned the “Meets Standard ” rating, which places them between the 50th and percentiles of Strive HI API scores of schools serving the same grade divisions statewide. Thirty-npercent of charter schools earned the rating of “Does Not Meet Standard, ” placing them a20th to 49th percentiles of schools serving the same grade divisions statewide. Finally, 24% of chaschools earned “Falls Far Below Standard, ” ranking their Weighted API scores below the 20th of schools serving the same grade divisions statewide. Overall, when comparing Weighted API scoto Strive HI API scores statewide, 63% of charter schools performed at the 49th percentile or below
and 36% scored above the median.
Table 7: Academic Performance Framework – State and Federal Accountability Syste
Schools Measure 1 a. Rating
Connections Public Charter School Meets Standard
Hakipu‘u Learning Center Falls Far Below Standard
Halau Ku Mana Public Charter School Meets Standard
Hālau LōkahiCharter School Does Not Meet Standard
8/10/2019 Hawaii charter schools annual report
http://slidepdf.com/reader/full/hawaii-charter-schools-annual-report 34/268
Table 7: Academic Performance Framework – State and Federal Accountability Syste
Schools Measure 1 a. Rating
(HAAS)
Hawaii Technology Academy Does Not Meet Standard
Innovations Public Charter School Meets Standard
Ka ‘Umeke Kā‘eo Exceeds Standard
Ka Waihona o ka Na‘auao Public Charter School Does Not Meet Standard
Kamaile Academy, PCS Does Not Meet Standard
Kanu o ka ‘Āina New Century Public Charter School Meets Standard
Kanuikapono Public Charter School Meets Standard
Kawaikini New Century Public Charter School Meets Standard
Ke Ana La‘ahana PCS Falls Far Below Standard
Ke Kula Niihau O Kekaha Learning Center Does Not Meet Standard
Ke Kula ‘o Nāwahīokalani‘ōpu‘u Iki, LPCS Falls Far Below Standard
Ke Kula ‘o Samuel M. Kamakau, LPCS Falls Far Below Standard
Kihei Charter School Does Not Meet Standard
Kona Pacific Public Charter School Does Not Meet Standard
Kua o ka LāNew Century Public Charter School Falls Far Below Standard
Kualapu‘u School: A Public Conversion Charter Meets Standard
Kula Aupuni Niihau A Kahelelani Aloha (KANAKA) A NewCentury Public Charter School (PCS)
Exceeds Standard
8/10/2019 Hawaii charter schools annual report
http://slidepdf.com/reader/full/hawaii-charter-schools-annual-report 35/268
Table 7: Academic Performance Framework – State and Federal Accountability Syste
Schools Measure 1 a. Rating
Na Wai Ola (Waters Of Life) Public Charter School Falls Far Below Standard
SEEQS: The School for Examining Essential Questions ofSustainability
Falls Far Below Standard
University Laboratory School Meets Standard
Volcano School of Arts & Sciences Falls Far Below Standard
Voyager: A Public Charter School Meets Standard
Waialae Elementary Public Charter School Meets Standard
Waimea Middle Public Conversion Charter School Does Not Meet Standard
West Hawai‘i Explorations Academy Does Not Meet Standard
As shown on the table above, most charter schools are underperforming the median of all schools serving the same grade divisions statewide when the charter schools’ API scores are account for multiple grade divisions. The two schools that received an “Exceeds Standard” r
performing in the top 10% of all public schools serving the same grade divisions statewide when thcharter schools’ API scores are weighted to account for multiple grade divisions.
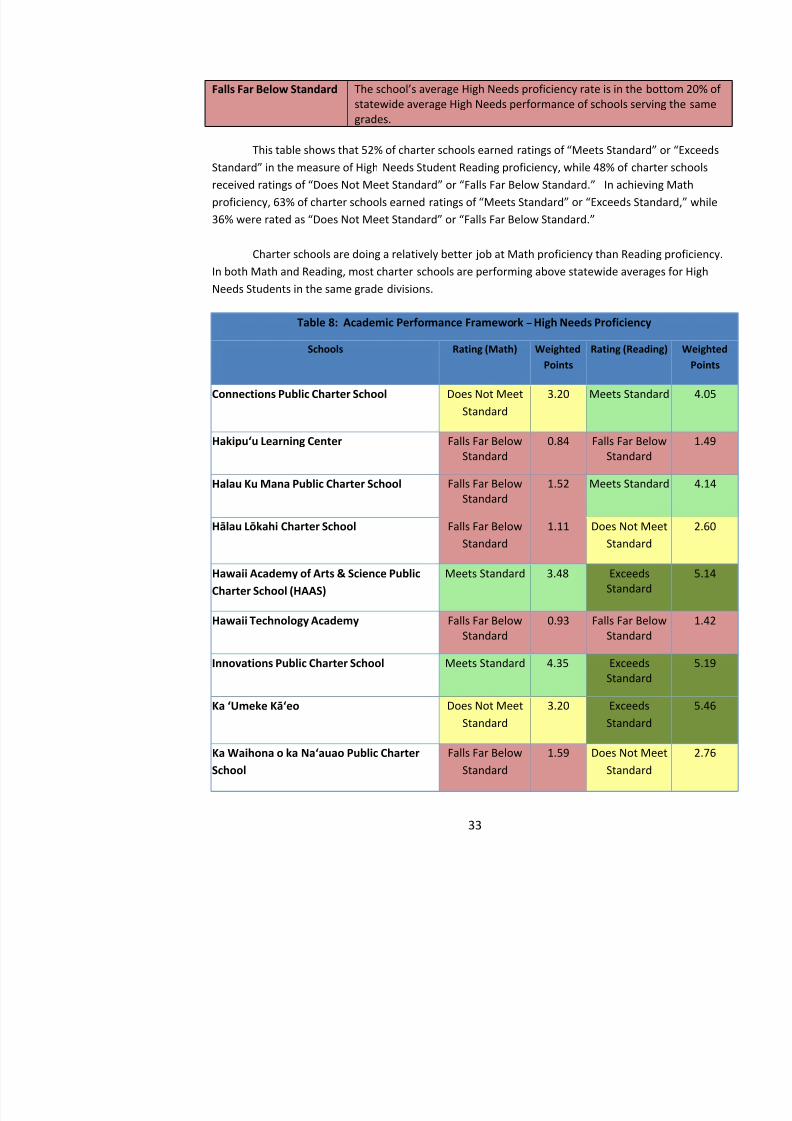
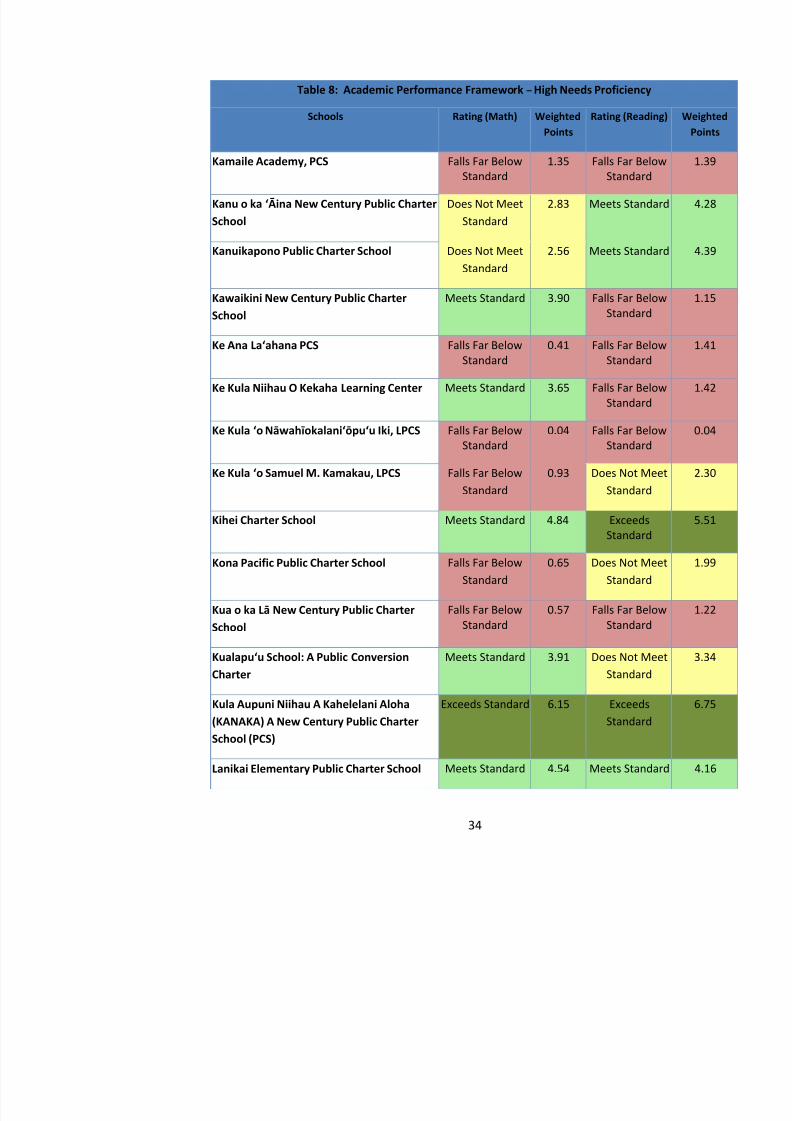
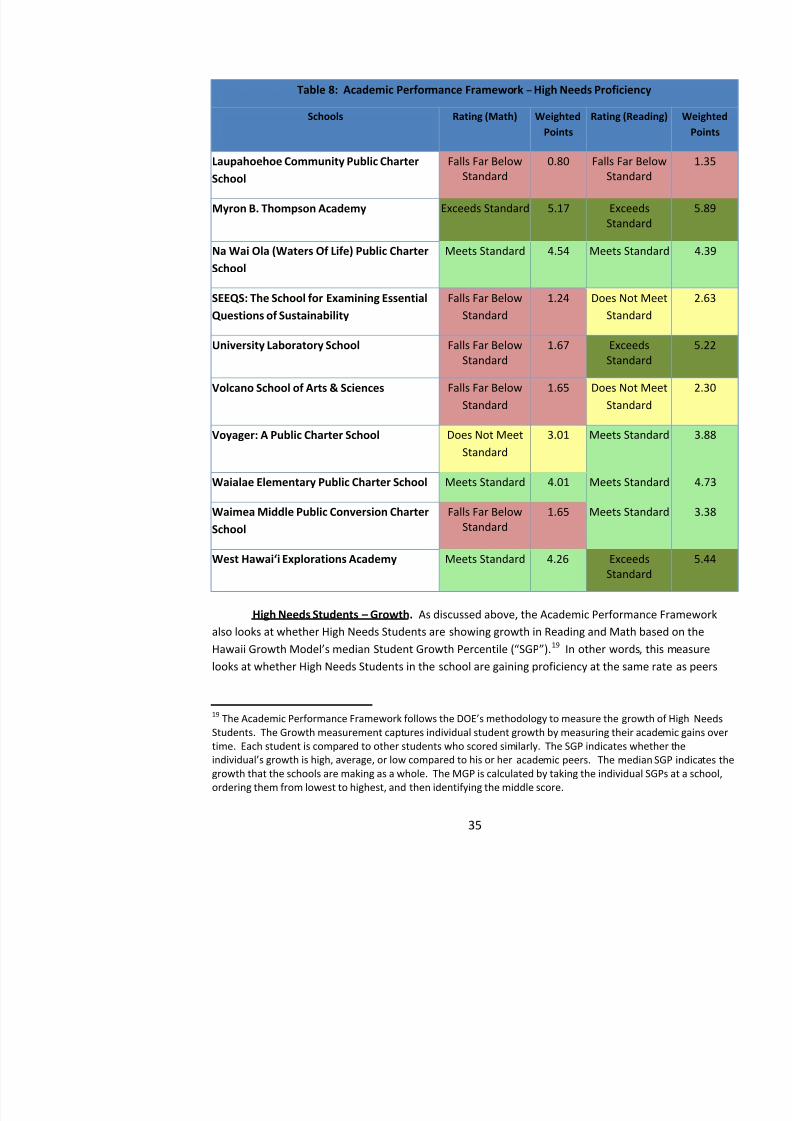
High Needs Students – Proficiency. As discussed above, the Academic Performance Faddresses whether th e school’s High Needs Students, i.e ., those students who are economicaldisadvantaged, English language learners or students receiving special education, are meeting orexceeding statewide proficiency rates for High Needs Students in Reading and Math. Each schoolreceived points 17F
18 and a rating for each submeasure (Reading and Math), as shown in Table 8.
Exceeds Standard The school’s average High Needs proficiency rate is in the top 10%statewide High Needs performance in schools serving the same grad
Meets Standard The school’s average High Needs proficiency rate meets or exceestatewide average High Needs performance of schools serving the s
8/10/2019 Hawaii charter schools annual report
http://slidepdf.com/reader/full/hawaii-charter-schools-annual-report 36/268
8/10/2019 Hawaii charter schools annual report
http://slidepdf.com/reader/full/hawaii-charter-schools-annual-report 37/268
Table 8: Academic Performance Framework – High Needs Proficiency
Schools Rating (Math) Weighted
Points
Rating (Reading)
Kamaile Academy, PCS Falls Far BelowStandard
1.35 Falls Far BelowStandard
Kanu o ka ‘Āina New Century Public CharterSchool
Does Not MeetStandard
2.83 Meets Standard
Kanuikapono Public Charter School Does Not MeetStandard
2.56 Meets Standard
Kawaikini New Century Public CharterSchool
Meets Standard 3.90 Falls Far BelowStandard
Ke Ana La‘ahana PCS Falls Far BelowStandard
0.41 Falls Far BelowStandard
Ke Kula Niihau O Kekaha Learning Center Meets Standard 3.65 Falls Far BelowStandard
Ke Kula ‘o Nāwahīokalani‘ōpu‘u Iki, LPCS Falls Far BelowStandard
0.04 Falls Far BelowStandard
Ke Kula ‘o Samuel M. Kamakau, LPCS Falls Far Below
Standard
0.93 Does Not Meet
Standard
Kihei Charter School Meets Standard 4.84 ExceedsStandard
Kona Pacific Public Charter School Falls Far BelowStandard
0.65 Does Not MeetStandard
Kua o ka LāNew Century Public CharterSchool
Falls Far BelowStandard 0.57 Falls Far BelowStandard
Kualapu‘u School: A Public ConversionCharter
Meets Standard 3.91 Does Not MeetStandard
8/10/2019 Hawaii charter schools annual report
http://slidepdf.com/reader/full/hawaii-charter-schools-annual-report 38/268
Table 8: Academic Performance Framework – High Needs Proficiency
Schools Rating (Math) Weighted
Points
Rating (Reading)
Laupahoehoe Community Public CharterSchool
Falls Far BelowStandard
0.80 Falls Far BelowStandard
Myron B. Thompson Academy Exceeds Standard 5.17 ExceedsStandard
Na Wai Ola (Waters Of Life) Public CharterSchool
Meets Standard 4.54 Meets Standard
SEEQS: The School for Examining EssentialQuestions of Sustainability
Falls Far BelowStandard
1.24 Does Not MeetStandard
University Laboratory School Falls Far BelowStandard
1.67 ExceedsStandard
Volcano School of Arts & Sciences Falls Far BelowStandard
1.65 Does Not MeetStandard
Voyager: A Public Charter School Does Not MeetStandard
3.01 Meets Standard
Waialae Elementary Public Charter School Meets Standard 4.01 Meets Standard
Waimea Middle Public Conversion CharterSchool
Falls Far BelowStandard
1.65 Meets Standard
West Hawai‘i Explorations Academy Meets Standard 4.26 ExceedsStandard
High Needs Students – Growth. As discussed above, the Academic Performance Framalso looks at whether High Needs Students are showing growth in Reading and Math based on theHawaii Growth Model’s median Student Growth Percentile ( “SGP”). 18F
19 In other words, this mlooks at whether High Needs Students in the school are gaining proficiency at the same rate as pee
8/10/2019 Hawaii charter schools annual report
http://slidepdf.com/reader/full/hawaii-charter-schools-annual-report 39/268
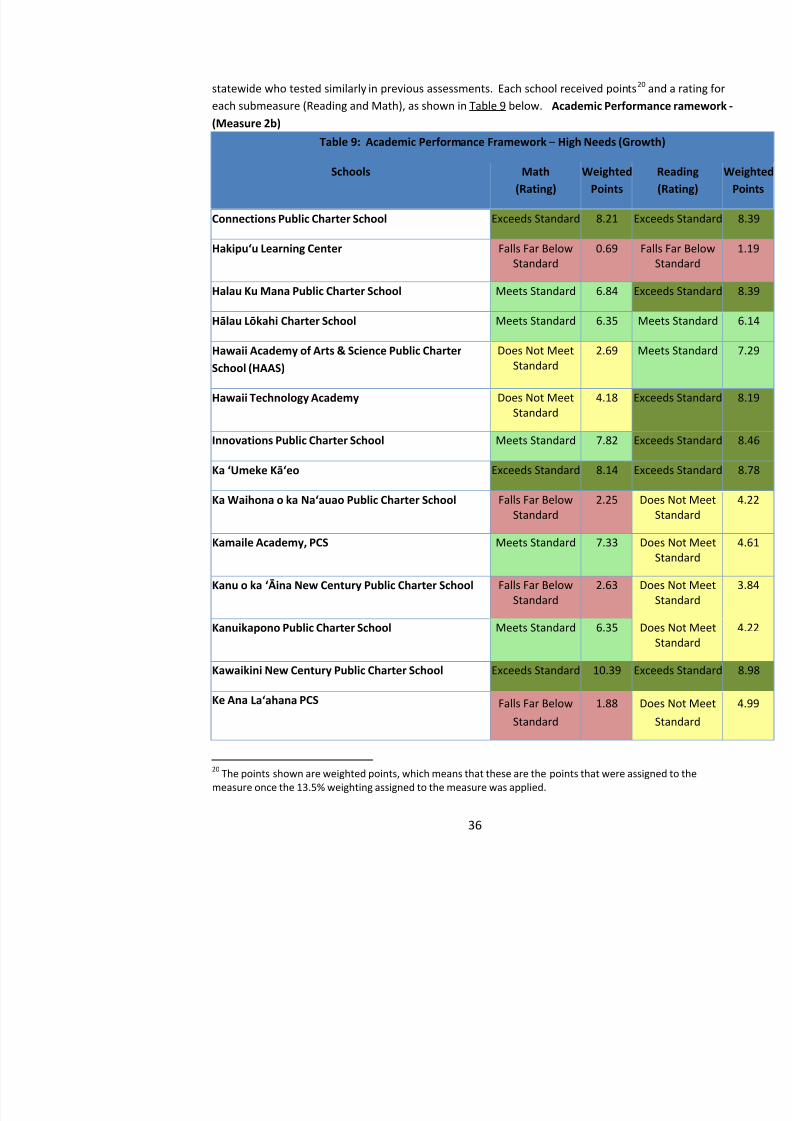
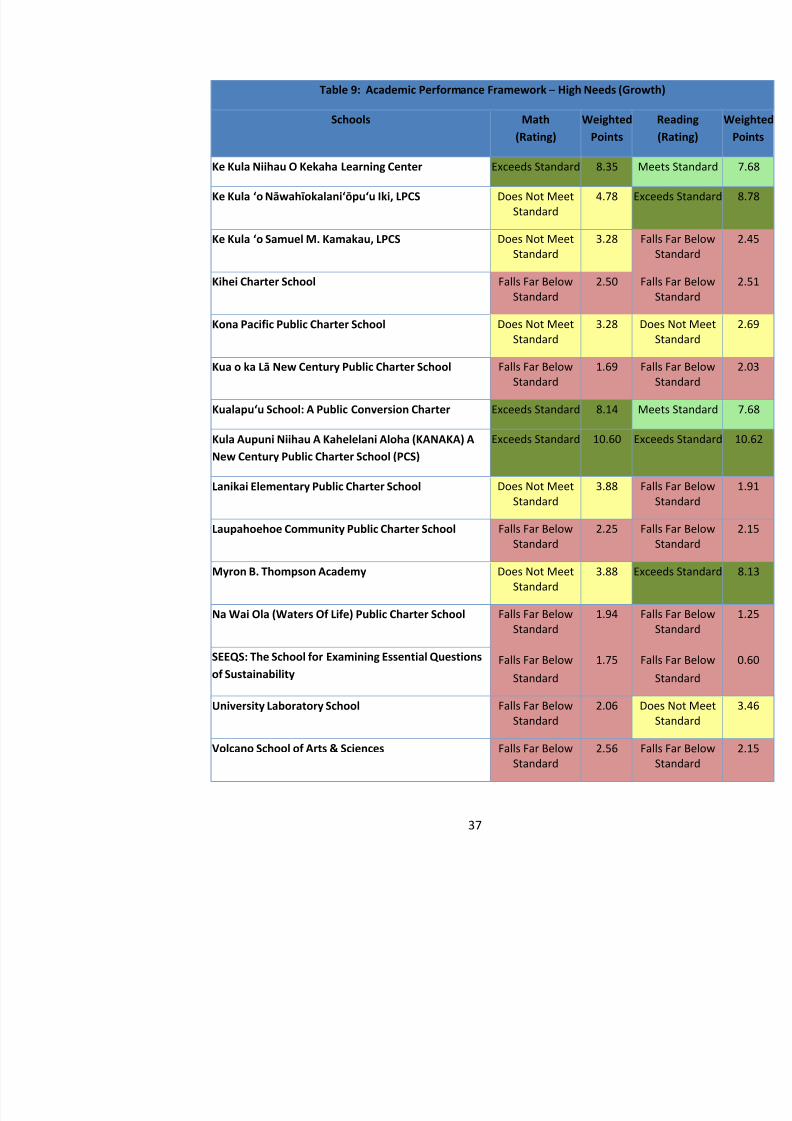
statewide who tested similarly in previous assessments. Each school received points 19F
20 andeach submeasure (Reading and Math), as shown in Table 9 below. Academic Performance r(Measure 2b)
Table 9: Academic Performance Framework – High Needs (Growth)
Schools Math(Rating)
WeightedPoints
R(R
Connections Public Charter School Exceeds Standard 8.21 Exceeds
Hakipu‘u Learning Center Falls Far BelowStandard 0.69 Falls St
Halau Ku Mana Public Charter School Meets Standard 6.84 Exceeds
Hālau LōkahiCharter School Meets Standard 6.35 Meets S
Hawaii Academy of Arts & Science Public Charter
School (HAAS)
Does Not MeetStandard
2.69 Meets
Hawaii Technology Academy Does Not MeetStandard
4.18 Exceed
Innovations Public Charter School Meets Standard 7.82 Exceeds
Ka ‘Umeke Kā‘eo Exceeds Standard 8.14 Exceeds
Ka Waihona o ka Na‘auao Public Charter School Falls Far BelowStandard
2.25 Does St
Kamaile Academy, PCS Meets Standard 7.33 Does NSt
Kanu o ka ‘Āina New Century Public Charter School Falls Far BelowStandard
2.63 Does St
Kanuikapono Public Charter School Meets Standard 6.35 Does NSt
Kawaikini New Century Public Charter School Exceeds Standard 10.39 Exceeds
8/10/2019 Hawaii charter schools annual report
http://slidepdf.com/reader/full/hawaii-charter-schools-annual-report 40/268
Table 9: Academic Performance Framework – High Needs (Growth)
Schools Math(Rating)
WeightedPoints
R(R
Ke Kula Niihau O Kekaha Learning Center Exceeds Standard 8.35 Meets S
Ke Kula ‘o Nāwahīokalani‘ōpu‘u Iki, LPCS Does Not MeetStandard
4.78 Exceed
Ke Kula ‘o Samuel M. Kamakau, LPCS Does Not Meet
Standard
3.28 Falls
St
Kihei Charter School Falls Far BelowStandard
2.50 Falls St
Kona Pacific Public Charter School Does Not MeetStandard
3.28 Does St
Kua o ka LāNew Century Public Charter School Falls Far BelowStandard
1.69 Falls St
Kualapu‘u School: A Public Conversion Charter Exceeds Standard 8.14 Meets S
Kula Aupuni Niihau A Kahelelani Aloha (KANAKA) ANew Century Public Charter School (PCS)
Exceeds Standard 10.60 Exceeds
Lanikai Elementary Public Charter School Does Not MeetStandard
3.88 Falls St
Laupahoehoe Community Public Charter School Falls Far BelowStandard
2.25 Falls St
Myron B. Thompson Academy Does Not MeetStandard
3.88 Exceed
Na Wai Ola (Waters Of Life) Public Charter School Falls Far BelowStandard
1.94 Falls St
SEEQS: The School for Examining Essential Questionsof Sustainability
Falls Far BelowStandard
1.75 Falls St
8/10/2019 Hawaii charter schools annual report
http://slidepdf.com/reader/full/hawaii-charter-schools-annual-report 41/268
Table 9: Academic Performance Framework – High Needs (Growth)
Schools Math
(Rating) Weighted
Points R
(R
Voyager: A Public Charter School Exceeds Standard 8.79 Does NSt
Waialae Elementary Public Charter School Meets Standard 5.38 Meets S
Waimea Middle Public Conversion Charter School Does Not Meet
Standard
2.69 Does
St
West Hawai‘i Explorations Academy Falls Far BelowStandard
2.25 Does St
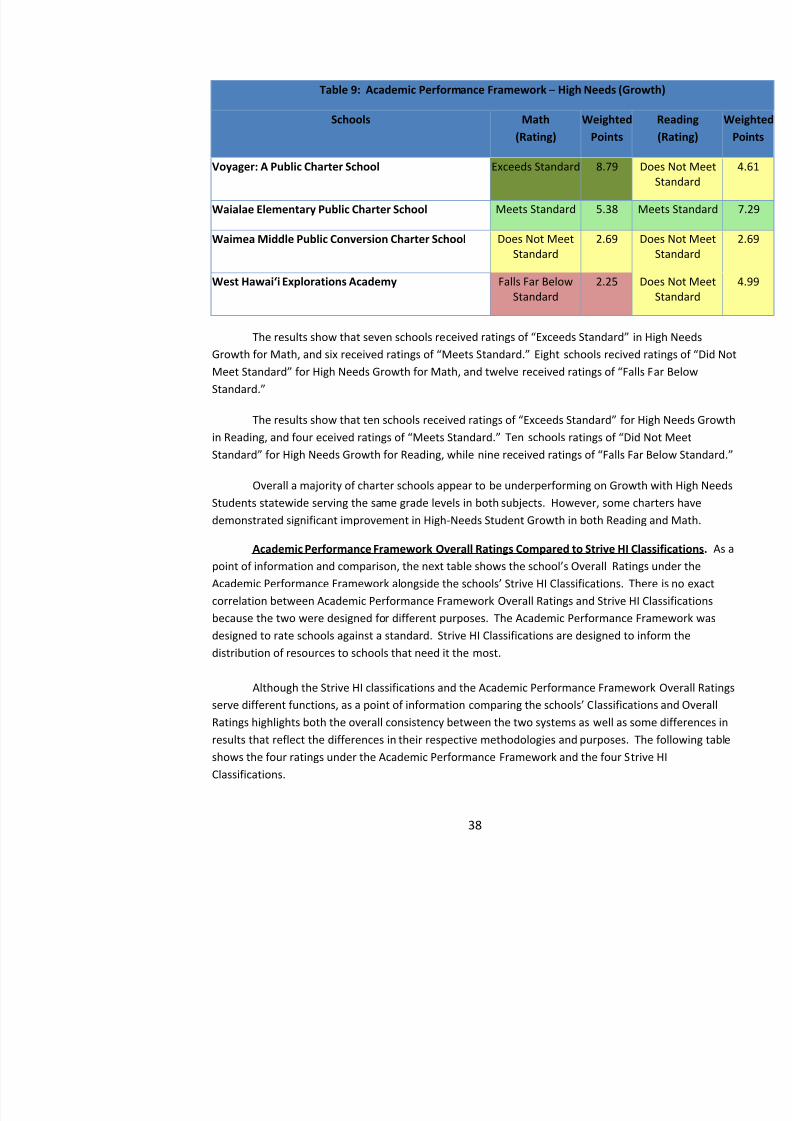
The results show that seven schools re ceived ratings of “Exceeds Standard” in HighGrowth for Math, and six received ratings of “Meets S tandard. ” Eight schools recived ratin
Meet Standard” for High Needs Growth for Math, and twelve received ratings of “Falls FarStandard. ”
The results show that ten schools received ratings of “Exceeds Standard” for High in Reading, and four eceived ratings of “Meets Standard.” Ten schools ratings of “Did NotStandard” for High Needs Growth for Reading, while nine re ceived ratings of “Falls Far Bel
Overall a majority of charter schools appear to be underperforming on Growth with High Students statewide serving the same grade levels in both subjects. However, some charters havedemonstrated significant improvement in High-Needs Student Growth in both Reading and Math.
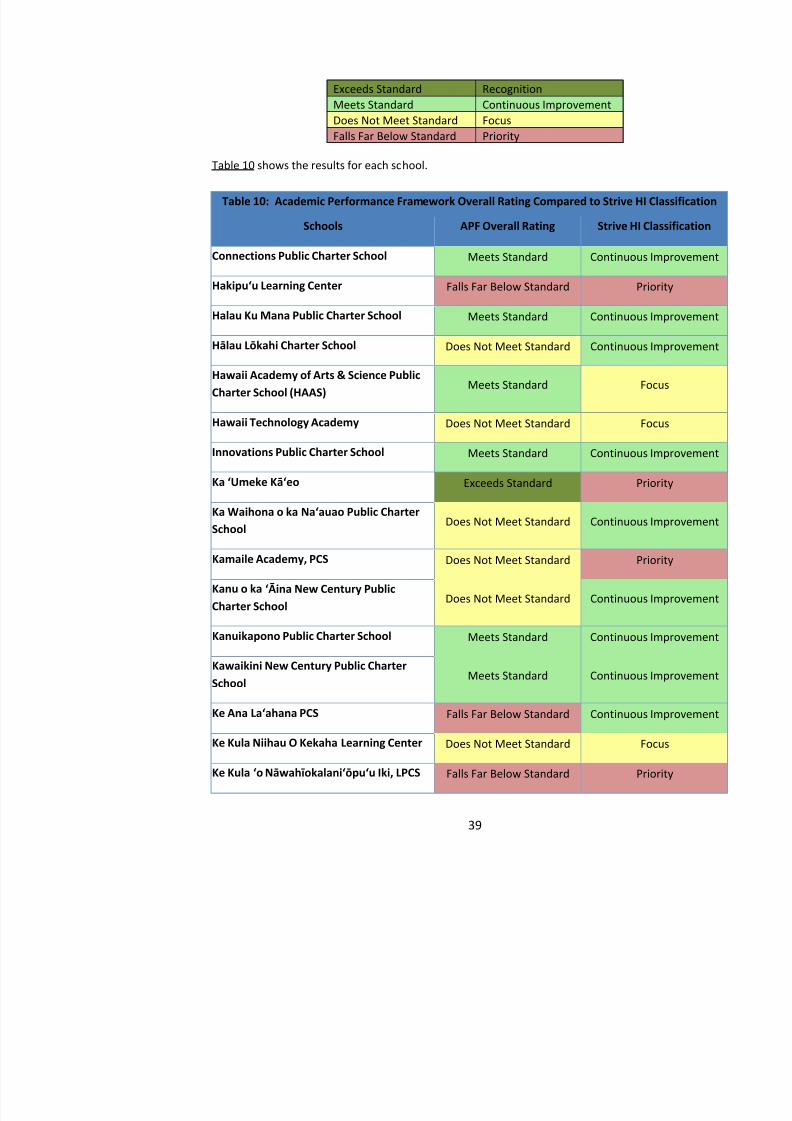
Academic Performance Framework Overall Ratings Compared to Strive HI Classificatipoint of information and comparison, the next table shows the school’s Overall Ratings undAcademic Performance Framework al ongside the schools’ Strive HI Classifications. There is correlation between Academic Performance Framework Overall Ratings and Strive HI Classificatio
because the two were designed for different purposes. The Academic Performance Framework wadesigned to rate schools against a standard. Strive HI Classifications are designed to inform thedistribution of resources to schools that need it the most.
Although the Strive HI classifications and the Academic Performance Framework Overall
8/10/2019 Hawaii charter schools annual report
http://slidepdf.com/reader/full/hawaii-charter-schools-annual-report 42/268
Exceeds Standard RecognitionMeets Standard Continuous ImprovementDoes Not Meet Standard FocusFalls Far Below Standard Priority
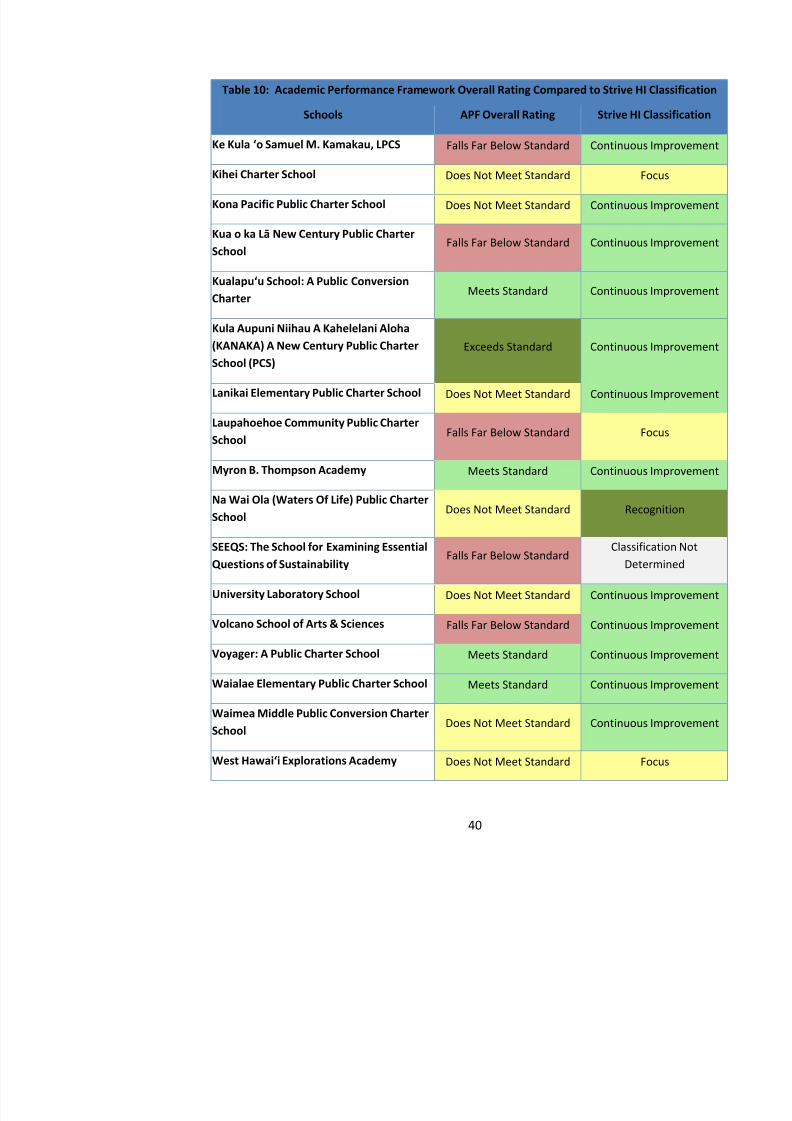
Table 10 shows the results for each school.
Table 10: Academic Performance Framework Overall Rating Compared to Strive HI Classification
Schools APF Overall Rating Strive HI Class
Connections Public Charter School Meets Standard Continuous Impro
Hakipu‘u Learning Center Falls Far Below Standard Priority
Halau Ku Mana Public Charter School Meets Standard Continuous Impro
Hālau Lōkahi Charter School Does Not Meet Standard Continuous Improv
Hawaii Academy of Arts & Science PublicCharter School (HAAS)
Meets Standard Focus
Hawaii Technology Academy Does Not Meet Standard Focus
Innovations Public Charter School Meets Standard Continuous Impro
Ka ‘Umeke Kā‘eo Exceeds Standard Priority
Ka Waihona o ka Na‘auao Public CharterSchool
Does Not Meet Standard Continuous Improv
Kamaile Academy, PCS Does Not Meet Standard Priority
Kanu o ka ‘Āina New Century PublicCharter School
Does Not Meet Standard Continuous Improv
Kanuikapono Public Charter School Meets Standard Continuous Impro
Kawaikini New Century Public CharterSchool
Meets Standard Continuous Impro
8/10/2019 Hawaii charter schools annual report
http://slidepdf.com/reader/full/hawaii-charter-schools-annual-report 43/268
Table 10: Academic Performance Framework Overall Rating Compared to Strive HI Classification
Schools APF Overall Rating Strive HI Class
Ke Kula ‘o Samuel M. Kamakau, LPCS Falls Far Below Standard Continuous Impro
Kihei Charter School Does Not Meet Standard Focus
Kona Pacific Public Charter School Does Not Meet Standard Continuous Improv
Kua o ka LāNew Century Public Charter
SchoolFalls Far Below Standard Continuous Impro
Kualapu‘u School: A Public ConversionCharter
Meets Standard Continuous Impro
Kula Aupuni Niihau A Kahelelani Aloha(KANAKA) A New Century Public CharterSchool (PCS)
Exceeds Standard Continuous Impro
Lanikai Elementary Public Charter School Does Not Meet Standard Continuous Improv
Laupahoehoe Community Public CharterSchool
Falls Far Below Standard Focus
Myron B. Thompson Academy Meets Standard Continuous Impro
Na Wai Ola (Waters Of Life) Public CharterSchool
Does Not Meet Standard Recognitio
SEEQS: The School for Examining EssentialQuestions of Sustainability
Falls Far Below StandardClassificati
Determi
University Laboratory School Does Not Meet Standard Continuous Improv
Volcano School of Arts & Sciences Falls Far Below Standard Continuous Impro
Voyager: A Public Charter School Meets Standard Continuous Impro
Waialae Elementary Public Charter School Meets Standard Continuous Impro
8/10/2019 Hawaii charter schools annual report
http://slidepdf.com/reader/full/hawaii-charter-schools-annual-report 44/268
Generally speaking, the Strive HI Classifications are not dramatically misaligned with theAcademic Performance Framework Overall Ratings. This is not surprising because of the significathat the Academic Performance Framework relies on Strive HI data.
However, several s chools’ Academic Performance Framework Overall Ratings differedsignificantly from their Strive HI Classifications. Among the explanations for these differences are
Strive HI Classifications were determined during the 2012-2013 school year, while thAcademic Performance Framework ratings were established during the 2013-2014 scyear;
Strive HI Classifications are intended to highlight the highest and lowest performing sso that 75-85% of schools are classified under Strive HI in Continuous Improvement;
Strive HI has automatic triggers which result in an automatic Focus or Priority classifbased on one indicator ( e.g. , low graduation rate) even if the school’s overall inwould not otherwise place it in that classification;
Because the Academic Performance Framework so heavily emphasizes achievement growth of High Needs populations, schools’ results on these measures could accOverall Ratings that present a contrast to these schools ’ Strive HI Classification
As described in Section III.A, regarding data caveats, the Commission allowed Hawamedium and immersion schools to request that the Commission exclude the Hawaii S
Bridge Assessment results for some early grades from consideration under the AcademPerformance Framework because students in those grades are taught exclusively orprimarily in the Hawaiian language, and the exclusion of the results could yield a highlower rating under the Academic Performance Framework and account for somedifferences.
2. 20BStrive HIThe DOE released the first performance reports under Strive HI for the 2012-2013 school
July of 2013. The 2013-2014 school year is the second year of Strive HI results. Because some chhave been made to Strive HI, there are certain considerations that should be made when interpretinthis year’s data and making year -to-year comparisons.
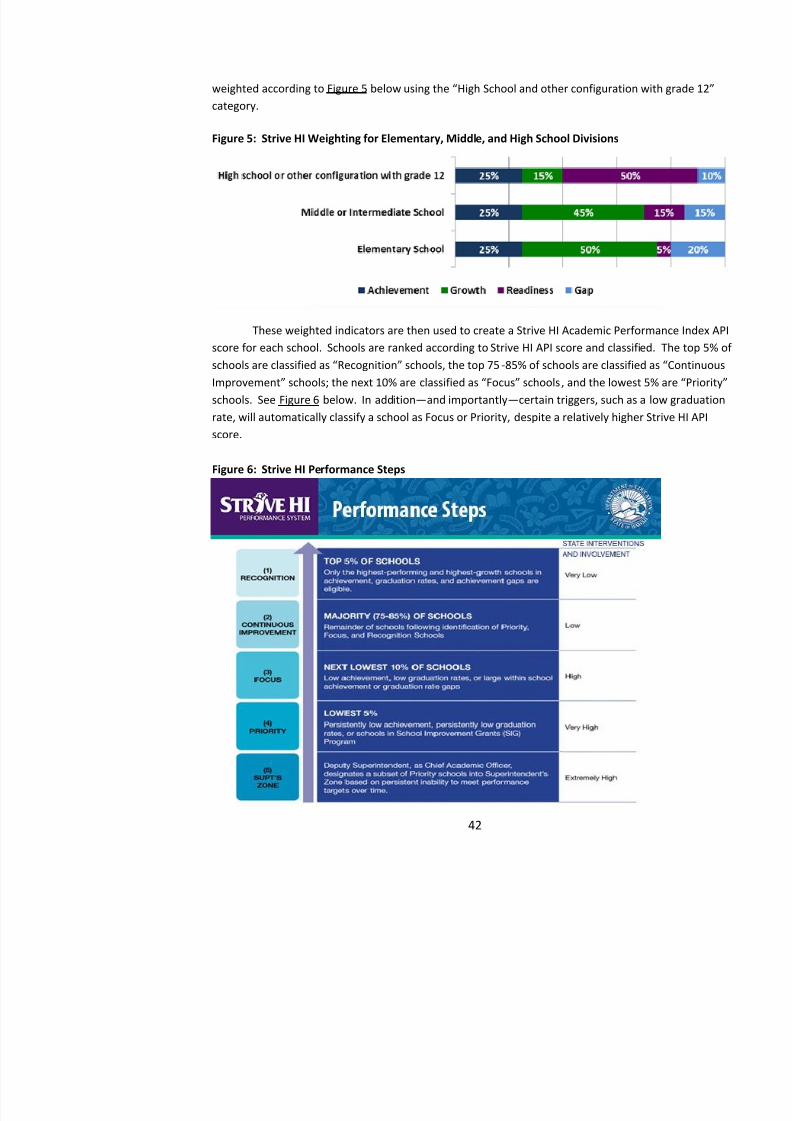
8/10/2019 Hawaii charter schools annual report
http://slidepdf.com/reader/full/hawaii-charter-schools-annual-report 45/268
weighted according to Figure 5 below using the “High School and other configuration with category.
Figure 5: Strive HI Weighting for Elementary, Middle, and High School Divisions
These weighted indicators are then used to create a Strive HI Academic Performance Indescore for each school. Schools are ranked according to Strive HI API score and classified. The topschools are classified as “Recognition” schools, the top 75 -85% of schools are classified as Improvement” schools; the next 10% are classified as “Focus” schools , and the lowest 5% aschools. See Figure 6 below. In addition —and importantly —certain triggers, such as a low grate, will automatically classify a school as Focus or Priority, despite a relatively higher Strive HI Ascore.
Figure 6: Strive HI Performance Steps
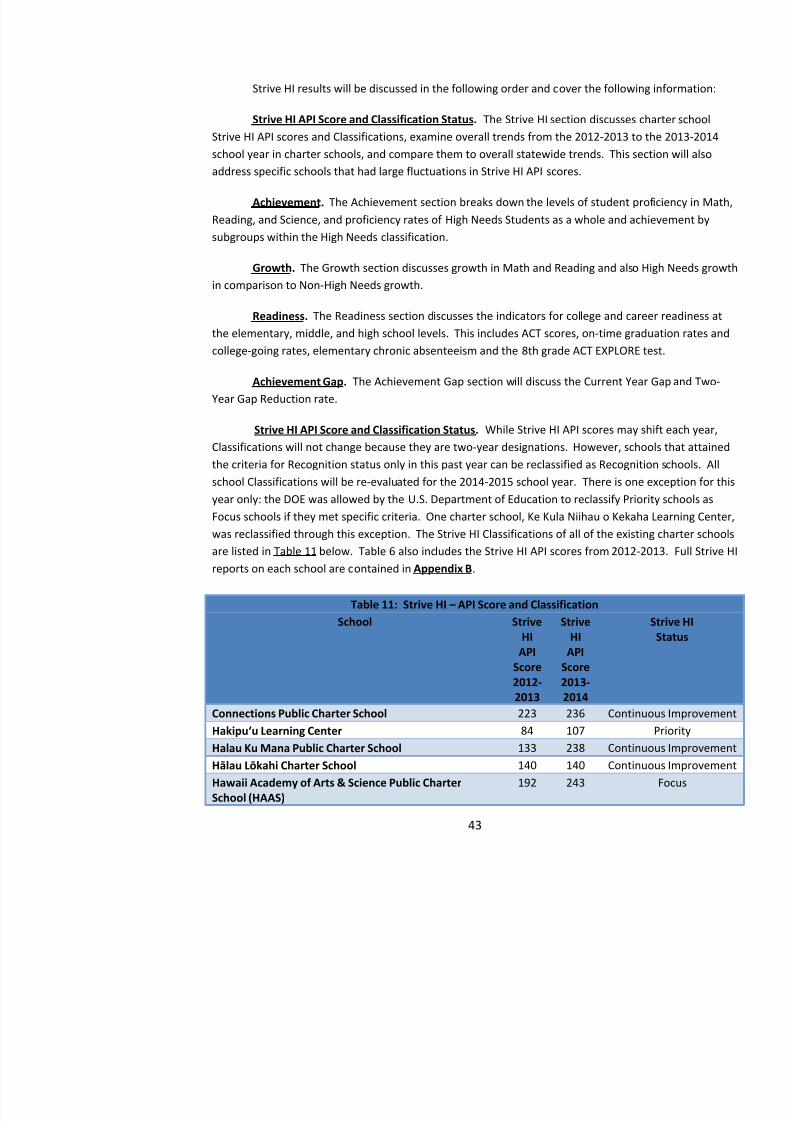
8/10/2019 Hawaii charter schools annual report
http://slidepdf.com/reader/full/hawaii-charter-schools-annual-report 46/268
Strive HI results will be discussed in the following order and cover the following informat
Strive HI API Score and Classification Status. The Strive HI section discusses charter
Strive HI API scores and Classifications, examine overall trends from the 2012-2013 to the 2013-2school year in charter schools, and compare them to overall statewide trends. This section will alsoaddress specific schools that had large fluctuations in Strive HI API scores.
Achievement. The Achievement section breaks down the levels of student proficiency iReading, and Science, and proficiency rates of High Needs Students as a whole and achievement bsubgroups within the High Needs classification.
Growth. The Growth section discusses growth in Math and Reading and also High Needin comparison to Non-High Needs growth.
Readiness. The Readiness section discusses the indicators for college and career readinethe elementary, middle, and high school levels. This includes ACT scores, on-time graduation ratecollege-going rates, elementary chronic absenteeism and the 8th grade ACT EXPLORE test.
Achievement Gap. The Achievement Gap section will discuss the Current Year Gap andYear Gap Reduction rate.
Strive HI API Score and Classification Status. While Strive HI API scores may shift eClassifications will not change because they are two-year designations. However, schools that attathe criteria for Recognition status only in this past year can be reclassified as Recognition schools. school Classifications will be re-evaluated for the 2014-2015 school year. There is one exception f
year only: the DOE was allowed by the U.S. Department of Education to reclassify Priority schoolsFocus schools if they met specific criteria. One charter school, Ke Kula Niihau o Kekaha Learningwas reclassified through this exception. The Strive HI Classifications of all of the existing charter are listed in Table 11 below. Table 6 also includes the Strive HI API scores from 2012-2013. Full reports on each school are contained in Appendix B .
Table 11: Strive HI – API Score and ClassificationSchool Strive
HIAPI
Score2012-
StriveHI
APIScore2013-
StrS
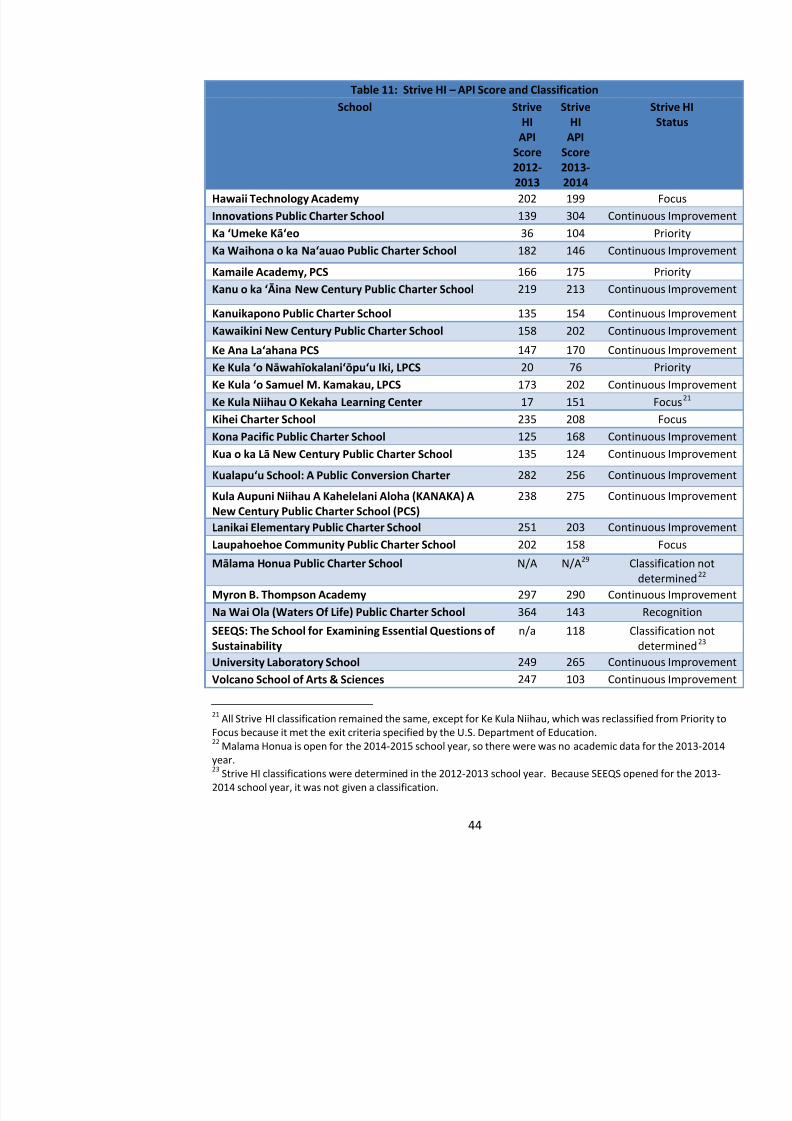
8/10/2019 Hawaii charter schools annual report
http://slidepdf.com/reader/full/hawaii-charter-schools-annual-report 47/268
Table 11: Strive HI – API Score and ClassificationSchool Strive
HIAPI
Score2012-2013
StriveHI
APIScore2013-2014
StrS
Hawaii Technology Academy 202 199 FoInnovations Public Charter School 139 304 Continuous IKa ‘Umeke Kā‘eo 36 104 Pri
Ka Waihona o ka Na‘auao Public Charter School 182 146 Continuous IKamaile Academy, PCS 166 175 PriKanu o ka ‘Āina New Century Public Charter School 219 213 Continuous I
Kanuikapono Public Charter School 135 154 Continuous IKawaikini New Century Public Charter School 158 202 Continuous I
Ke Ana La‘ahana PCS 147 170 Continuous IKe Kula ‘o Nāwahīokalani‘ōpu‘u Iki, LPCS 20 76 PriKe Kula ‘o Samuel M. Kamakau, LPCS 173 202 Continuous IKe Kula Niihau O Kekaha Learning Center 17 151 FoKihei Charter School 235 208 FoKona Pacific Public Charter School 125 168 Continuous IKua o ka Lā New Century Public Charter School 135 124 Continuous I
Kualapu‘u School: A Public Conversion Charter 282 256 Continuous I
Kula Aupuni Niihau A Kahelelani Aloha (KANAKA) ANew Century Public Charter School (PCS)
238 275 Continuous I
Lanikai Elementary Public Charter School 251 203 Continuous ILaupahoehoe Community Public Charter School 202 158 Fo
Mālama Honua Public Charter School N/A N/A29 Classifideterm
Myron B. Thompson Academy 297 290 Continuous I
Na Wai Ola (Waters Of Life) Public Charter School 364 143 RecoSEEQS: The School for Examining Essential Questions ofSustainability
n/a 118 Classificdeterm
University Laboratory School 249 265 Continuous IVolcano School of Arts & Sciences 247 103 Continuous I
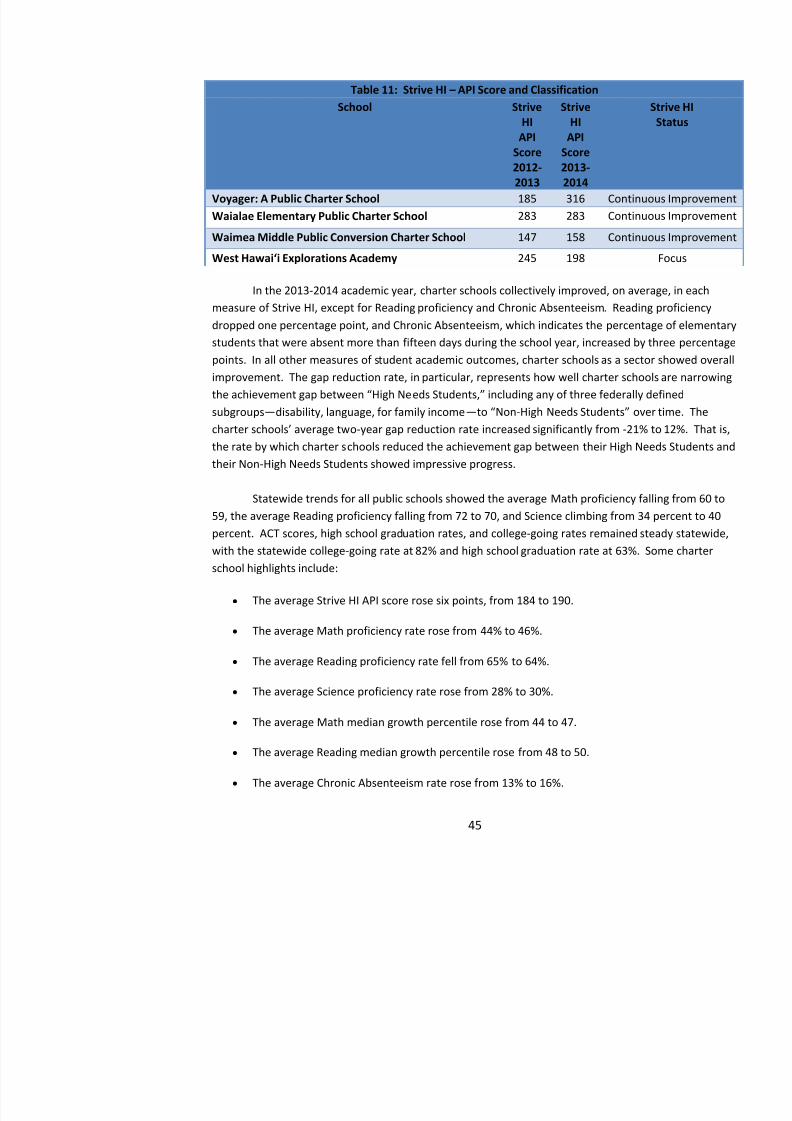
8/10/2019 Hawaii charter schools annual report
http://slidepdf.com/reader/full/hawaii-charter-schools-annual-report 48/268
Table 11: Strive HI – API Score and ClassificationSchool Strive
HIAPI
Score2012-2013
StriveHI
APIScore2013-2014
StrS
Voyager: A Public Charter School 185 316 Continuous IWaialae Elementary Public Charter School 283 283 Continuous I
Waimea Middle Public Conversion Charter School 147 158 Continuous I
West Hawai‘i Explorations Academy 245 198 Fo
In the 2013-2014 academic year, charter schools collectively improved, on average, in eacmeasure of Strive HI, except for Reading proficiency and Chronic Absenteeism. Reading proficiendropped one percentage point, and Chronic Absenteeism, which indicates the percentage of elemenstudents that were absent more than fifteen days during the school year, increased by three percentapoints. In all other measures of student academic outcomes, charter schools as a sector showed ov
improvement. The gap reduction rate, in particular, represents how well charter schools are narrowthe achievement gap between “High Needs Students,” including any of three federally definesubgroups —disability, language, for family income —to “Non-High Needs Students” over ticharter schools’ average tw o-year gap reduction rate increased significantly from -21% to 12%. the rate by which charter schools reduced the achievement gap between their High Needs Studentstheir Non-High Needs Students showed impressive progress.
Statewide trends for all public schools showed the average Math proficiency falling from 59, the average Reading proficiency falling from 72 to 70, and Science climbing from 34 percent topercent. ACT scores, high school graduation rates, and college-going rates remained steady statewwith the statewide college-going rate at 82% and high school graduation rate at 63%. Some charteschool highlights include:
The average Strive HI API score rose six points, from 184 to 190.
The average Math proficiency rate rose from 44% to 46%.
The average Reading proficiency rate fell from 65% to 64%.
8/10/2019 Hawaii charter schools annual report
http://slidepdf.com/reader/full/hawaii-charter-schools-annual-report 49/268
The average percentage of students scoring above 19 on the 11th grade ACT increased fro21% to 25%.
The average graduation rate increased from 66% to 69%.
The average two year gap reduction rate increased from -21% to 12%.
Notably, five of the eleven highest performing public high schools in the state, as measurethe Strive HI API score, are charter schools: Myron B. Thompson Academy, Kula Aupuni Niihau Kahelelani Aloha (KANAKA) A New Century Public Charter School, University Laboratory SchoAcademy of Arts and Science Public Charter School (HAAS), and Halau Ku Mana Public Charter
Also noteworthy is the fact that two of the four highest-performing middle schools in the sas measured by the Strive HI API score, are charter schools: Voyager: A Public Charter School anInnovations Public Charter School.
a. Year-to-Year Comparisons of Significant Fluctuations in Strive HI API Scores
The following schools showed significant fluctuations in Strive HI API scores from the 20school year to the 2013-2014 school year. These schools are discussed below and are organized byStrive HI Classification.
Recognition. Na Wai Ola (Waters of Life) Public Charter School is the only charter schocurrently classified as a “Recognition” school under Strive HI. This year, the school’s Strivefell from 364 to 143. In 2013-2013, the school was classified as a Recognition school for demonst
high levels of achievement and growth. At that time, the school served grades K-8 and thus wasevaluated under Strive HI as a middle school. In 2013-2014 the school served grades K-6 and wasevaluated as an elementary school. This could have affected its Strive HI API score because as anelementary school this year, its Readiness measure was weighted at 5%, and the only factor measurwas Chronic Absenteeism. As a middle school, its Readiness measure was weighted at 15%, and tfactor measured was student results on the 8 th grade ACT EXPLORE assessment. These are different measurements and weights. While proficiency rates remained relatively constant, Mathgrowth fell from 77 to 31, and Reading growth from 69 to 26. This measure, combined with a ChrAbsenteeism rate of 39%, which was calculated for the first time now that the schools servedelementary gardes only, accounts for much of the change in the Strive HI API scores.
f h h h l l f d
8/10/2019 Hawaii charter schools annual report
http://slidepdf.com/reader/full/hawaii-charter-schools-annual-report 50/268
the gap rate between High Needs Student achievement and Non-High Needs Studachievement.
Lanikai Elementary PCS’sStrive HI API score decreased from 251 points to 203Points were lost due to a decrease in Reading growth.
Volcano School of Arts & Science’s Strive HI API score decreased by 144 poinschool’s scores for Math profici ency, Reading proficiency, and Growth all decrcompared to the 2012-2013 school year.
Voyager: A Public Charter School’s Strive HI API score increased by 131 pimproved significantly, as did Science proficiency.
Halau Ku Mana Public Charter School’s Strive HI API score increased by 1238 due to increased proficiency rates in Math, Reading, and Science and increasGrowth.
Focus. Schools with Strive HI API scores that fall in the next bottom 10% of all public scthe state after the lowest- scoring 5% of schools are classified as “Priority” schools are clas“Focus” schools. Schools also can fall into this classification automatically, even if their API scorehigher than this range, because of “automatic triggers” such as low achievement, low graduaor large within-school achievement or graduation rate gaps. Focus schools receive more stateinterventions and involvement. Significant changes for schools classified as “Focus” from t
year to the 2013-2014 school year include:
Hawaii Academy of Arts & Sci ence Public Charter School’s Strive HI API score 192 to 243. The school improved in each measure and is performing above average fpublic high schools. The school was classified as a Focus school due to a low graduaof 68% but has increased its graduation rate to 85% for the 2013-2014 school year.
Ke Kula Ni̒ ihau o Kekaha Learning Center’s Strive HI API score increased from151. Last year, the school was missing data for the college-going rate, current gap rattwo-year gap reduction rate. This year, data are unavailable for the current gap rate atwo-year gap reduction rate due to a small student population. 23F
24 The data are unavailable for the college-going rate measure The school was classified as a Priorit
d l d l h h l h
8/10/2019 Hawaii charter schools annual report
http://slidepdf.com/reader/full/hawaii-charter-schools-annual-report 51/268
due to a low Strive HI API score and Title I status. Because the school met the exit cspecified by the U.S. Department of Education after Strive HI’s first year of impthe school was reclassified as a Focus school for the 2013-2014 school year. This typreclassification only applied to schools classified as Priority in the 2012-2013 school ythat met the Priority status exit criteria in the 2013-2014 school year.
Kihei Charter School’s Strive HI API fell from 235 to 208.Kihei gained points in tReadiness measure but lost points in Growth and the Achievement Gap measures. Layear, the school did not have 11th grade ACT data; this year, 55% of students scored acomposite score of 19 or higher. The school was classified as a Focus school due to agraduation rate of 51%; the graduation rate has increased to 64% for the 2013-2014 scyear.
Laupahoehoe Community Public Charter School’s Strive HI API score fell from158. This year, the school is missing data for the two-year gap reduction rate measurto a small student population; 25F
26 last year the school had data for each measure. Thgap rate is 56%, which is large and means that there is a considerable gap betweenachievement of Non-High Needs and High Needs students. Proficiency in Math fell f40% to 29%, Reading proficiency from 63% to 50%, but Science proficiency increase28% to 29%.
West Hawai ʻi Explorations Academy’s Strive HI API score fell from 245 to 198school did not have data for the two-year gap reduction measure. Th is year, ttwo-year gap reduction rate is 4%. This means that the school is closing its achievemover time. Proficiency rates stayed relatively constant. The percentage of 11demonstrating college readiness by scoring 19 or higher on the ACT fell from 75% to
Priority. Schools with t he lowest 5% of API scores in the state are classified as “PriSchools also will automatically be classified as “Priority ” if they have persistently low achievemhigh school graduation rate, or are participating in the federal School Improvement Grants (program. Priority schools are eligible to receive higher levels of support and intervention. Four chschools currently have a “Priority ” classification. While all four increased their Strive API scorthe 2013-2014 school year, two made significant increases:
K ‘U k K ʻ ’ St i HI API i d f 35 t 104 d t i
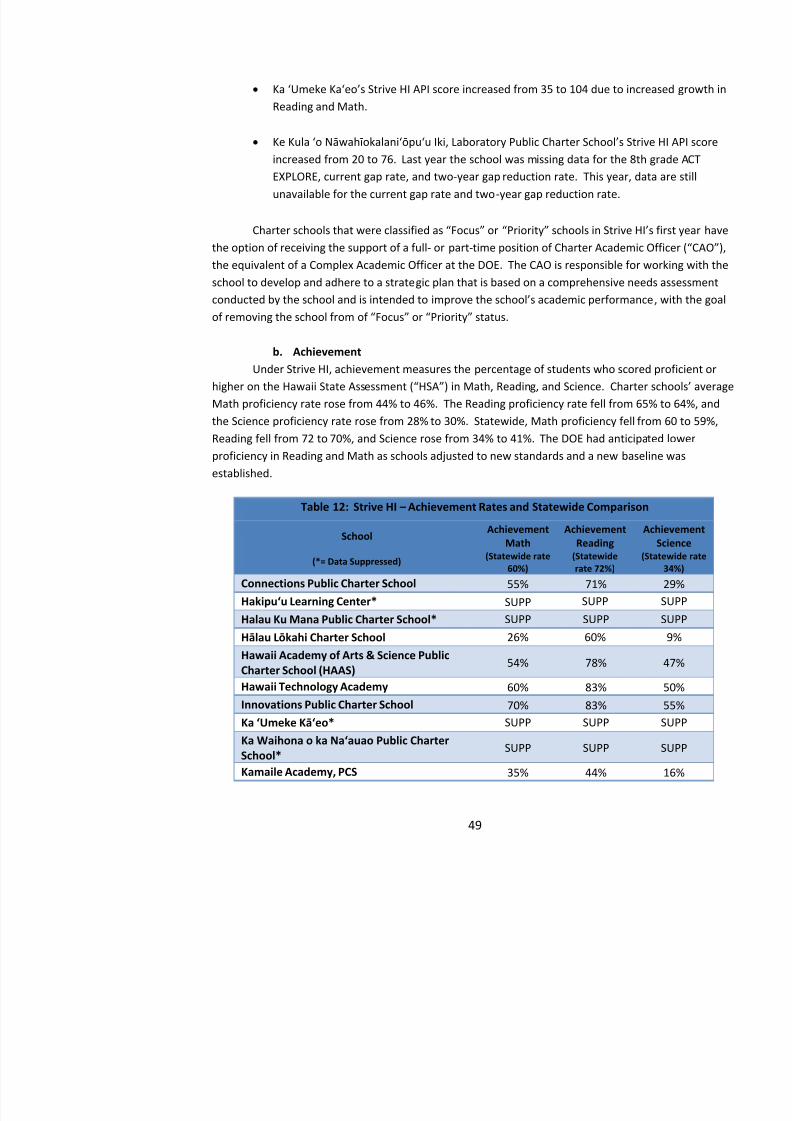
8/10/2019 Hawaii charter schools annual report
http://slidepdf.com/reader/full/hawaii-charter-schools-annual-report 52/268
Ka ‘Umeke Kaʻeo’s Strive HI API score increased from 35 to 104 due to increasReading and Math.
Ke Kula ʻo Nāwah ī okalani ʻōpu ʻu Iki, Laboratory Public Charter School’s Strive increased from 20 to 76. Last year the school was missing data for the 8th grade ACTEXPLORE, current gap rate, and two-year gap reduction rate. This year, data are stilunavailable for the current gap rate and two-year gap reduction rate.
Charter schools that were classified as “Focus” or “Priority” schools in Strive HI’s fithe option of receiving the support of a full- or part- time position of Charter Academic Offithe equivalent of a Complex Academic Officer at the DOE. The CAO is responsible for working wschool to develop and adhere to a strategic plan that is based on a comprehensive needs assessmentconducted by the school and is intended to improve the school’s academic performance , wof removing the school from of “Focus” or “Priority” status.
b. Achievement Under Strive HI, achievement measures the percentage of students who scored proficient o
higher on the Hawaii State Assessment (“HSA”) in Math, Reading, and Science. Charter schMath proficiency rate rose from 44% to 46%. The Reading proficiency rate fell from 65% to 64%the Science proficiency rate rose from 28% to 30%. Statewide, Math proficiency fell from 60 to 5Reading fell from 72 to 70%, and Science rose from 34% to 41%. The DOE had anticipated lowerproficiency in Reading and Math as schools adjusted to new standards and a new baseline wasestablished.
Table 12: Strive HI – Achievement Rates and Statewide Comparison
School
(*= Data Suppressed)
AchievementMath
(Statewide rate60%)
AchievementReading
(Statewiderate 72%)
AchiS
(State
Connections Public Charter School 55% 71% Hakipu‘u Learning Center* SUPP SUPP
Halau Ku Mana Public Charter School* SUPP SUPP Hālau Lōkahi Charter School 26% 60% Hawaii Academy of Arts & Science PublicCharter School (HAAS)
54% 78%
Hawaii Technology Academy 60% 83%
T bl 12 St i HI A hi t R t d St t id C i
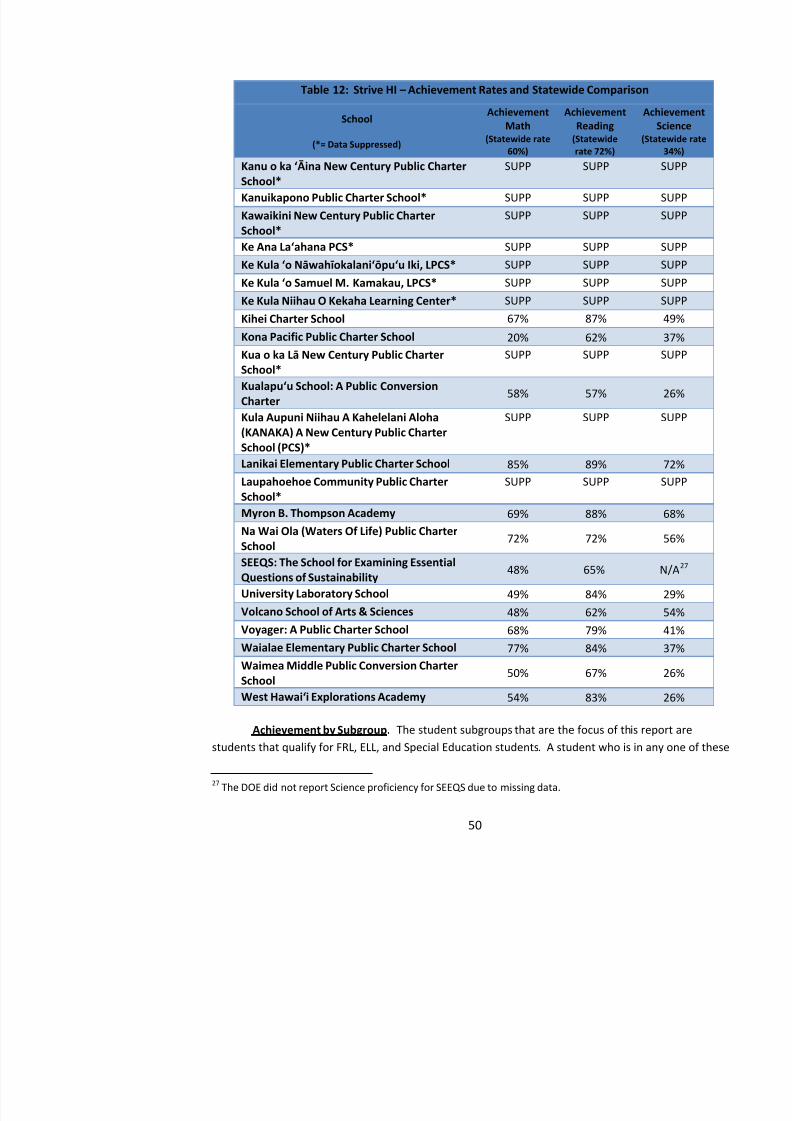
8/10/2019 Hawaii charter schools annual report
http://slidepdf.com/reader/full/hawaii-charter-schools-annual-report 53/268
Table 12: Strive HI – Achievement Rates and Statewide Comparison
School
(*= Data Suppressed)
AchievementMath
(Statewide rate60%)
AchievementReading
(Statewiderate 72%)
AchiS
(State
Kanu o ka ‘Āina New Century Public CharterSchool*
SUPP SUPP
Kanuikapono Public Charter School* SUPP SUPP Kawaikini New Century Public CharterSchool*
SUPP SUPP
Ke Ana La‘ahana PCS* SUPP SUPP Ke Kula ‘o Nāwahīokalani‘ōpu‘u Iki, LPCS* SUPP SUPP Ke Kula ‘o Samuel M. Kamakau, LPCS* SUPP SUPP Ke Kula Niihau O Kekaha Learning Center* SUPP SUPP Kihei Charter School 67% 87% Kona Pacific Public Charter School 20% 62% Kua o ka Lā New CenturyPublic CharterSchool*
SUPP SUPP
Kualapu‘u School: A Public ConversionCharter
58% 57%
Kula Aupuni Niihau A Kahelelani Aloha(KANAKA) A New Century Public CharterSchool (PCS)*
SUPP SUPP
Lanikai Elementary Public Charter School 85% 89% Laupahoehoe Community Public Charter
School*
SUPP SUPP
Myron B. Thompson Academy 69% 88% Na Wai Ola (Waters Of Life) Public CharterSchool
72% 72%
SEEQS: The School for Examining EssentialQuestions of Sustainability
48% 65% N
University Laboratory School 49% 84% Volcano School of Arts & Sciences 48% 62% Voyager: A Public Charter School 68% 79% Waialae Elementary Public Charter School 77% 84% Waimea Middle Public Conversion CharterSchool
50% 67%
subgroups is considered a “ High Needs Student ” All students who do not fall into any of th
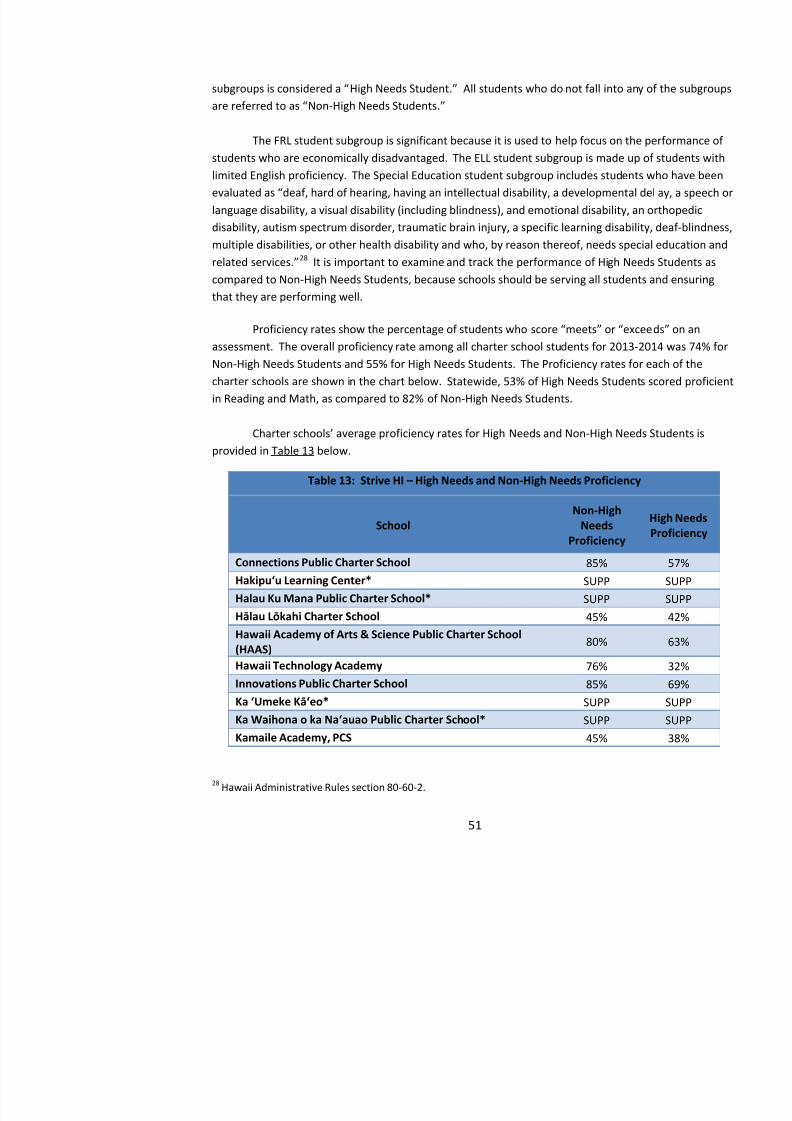
8/10/2019 Hawaii charter schools annual report
http://slidepdf.com/reader/full/hawaii-charter-schools-annual-report 54/268
subgroups is considered a High Needs Student . All students who do not fall into any of thare referred to as “ Non-High Needs Students .”
The FRL student subgroup is significant because it is used to help focus on the performanstudents who are economically disadvantaged. The ELL student subgroup is made up of students wlimited English proficiency. The Special Education student subgroup includes students who have bevaluated as “deaf, hard of hearing, having an intellectual disability, a developmental del alanguage disability, a visual disability (including blindness), and emotional disability, an orthopedicdisability, autism spectrum disorder, traumatic brain injury, a specific learning disability, deaf-blindmultiple disabilities, or other health disability and who, by reason thereof, needs special education
related services.” 27F
28 It is important to examine and track the performance of High Needs Studentscompared to Non-High Needs Students, because schools should be serving all students and ensurinthat they are performing well.
Proficiency rates show the percentage of students who score “meets” or “exceeds” oassessment. The overall proficiency rate among all charter school students for 2013-2014 was 74%Non-High Needs Students and 55% for High Needs Students. The Proficiency rates for each of the
charter schools are shown in the chart below. Statewide, 53% of High Needs Students scored profiin Reading and Math, as compared to 82% of Non-High Needs Students.
Charter schools’ average proficiency rates for High Needs and Non-High Needs Studentprovided in Table 13 below.
Table 13: Strive HI – High Needs and Non-High Needs Proficiency
SchoolNon-High
NeedsProficiency
HigPro
Connections Public Charter School 85% Hakipu‘u Learning Center* SUPP Halau Ku Mana Public Charter School* SUPP
Hālau Lōkahi Charter School 45% Hawaii Academy of Arts & Science Public Charter School(HAAS)
80%
Hawaii Technology Academy 76% Innovations Public Charter School 85%
Table 13: Strive HI – High Needs and Non-High Needs Proficiency
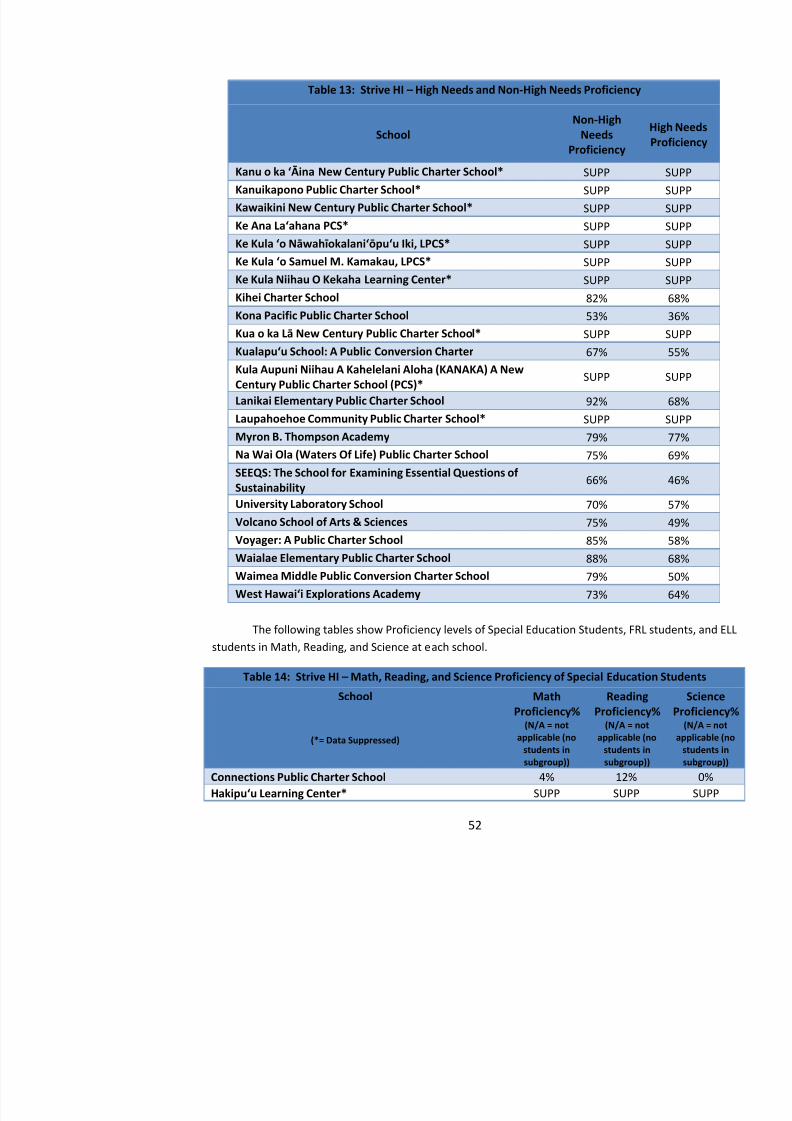
8/10/2019 Hawaii charter schools annual report
http://slidepdf.com/reader/full/hawaii-charter-schools-annual-report 55/268
Table 13: Strive HI High Needs and Non High Needs Proficiency
School
Non-High
NeedsProficiency
HigPro
Kanu o ka ‘Āina New Century Public Charter School* SUPP Kanuikapono Public Charter School* SUPP Kawaikini New Century Public Charter School* SUPP Ke Ana La‘ahana PCS* SUPP Ke Kula ‘o Nāwahīokalani‘ōpu‘u Iki, LPCS* SUPP
Ke Kula ‘o Samuel M. Kamakau, LPCS* SUPP Ke Kula Niihau O Kekaha Learning Center* SUPP Kihei Charter School 82% Kona Pacific Public Charter School 53% Kua o ka Lā New Century Public Charter School* SUPP Kualapu‘u School: A Public Conversion Charter 67% Kula Aupuni Niihau A Kahelelani Aloha (KANAKA) A NewCentury Public Charter School (PCS)* SUPP Lanikai Elementary Public Charter School 92% Laupahoehoe Community Public Charter School* SUPP Myron B. Thompson Academy 79% Na Wai Ola (Waters Of Life) Public Charter School 75% SEEQS: The School for Examining Essential Questions ofSustainability
66%
University Laboratory School 70% Volcano School of Arts & Sciences 75% Voyager: A Public Charter School 85% Waialae Elementary Public Charter School 88% Waimea Middle Public Conversion Charter School 79% West Hawai‘i Explorations Academy 73%
The following tables show Proficiency levels of Special Education Students, FRL studentsstudents in Math, Reading, and Science at each school.
Table 14: Strive HI – Math, Reading, and Science Proficiency of Special Education Student
Table 14: Strive HI – Math, Reading, and Science Proficiency of Special Education Student
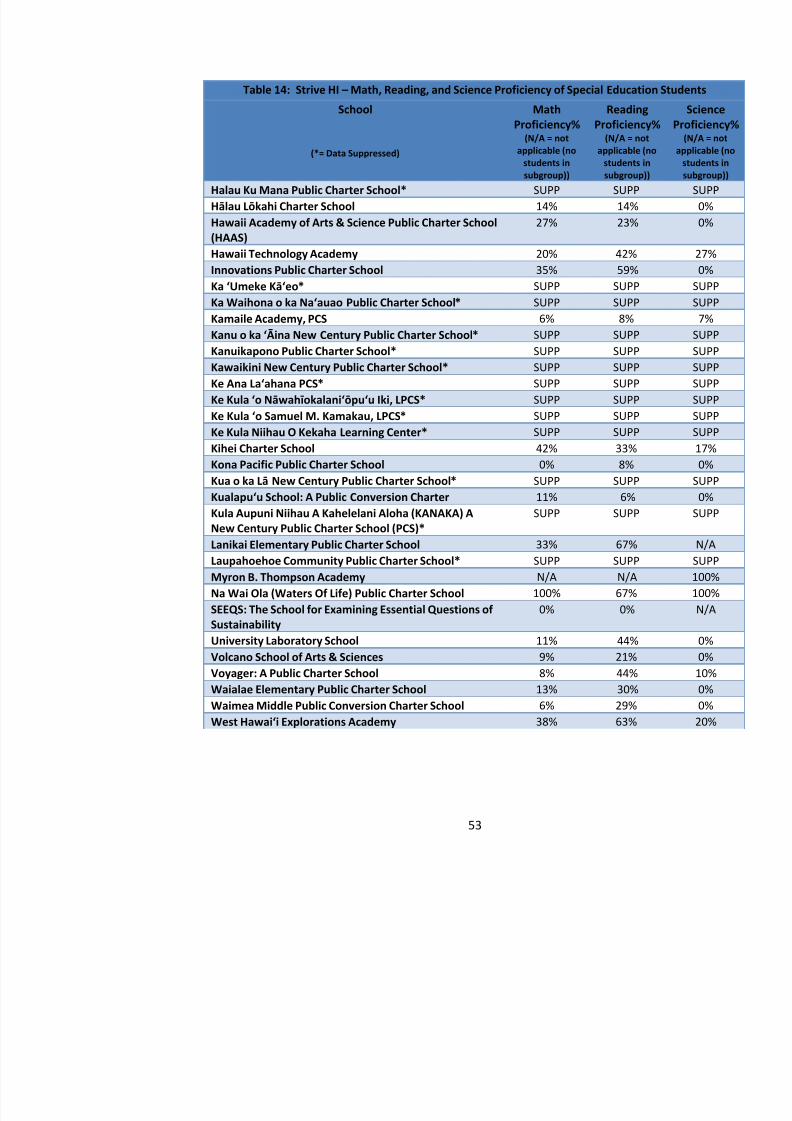
8/10/2019 Hawaii charter schools annual report
http://slidepdf.com/reader/full/hawaii-charter-schools-annual-report 56/268
Table 14: Strive HI Math, Reading, and Science Proficiency of Special Education Student
School
(*= Data Suppressed)
MathProficiency%
(N/A = notapplicable (no
students insubgroup))
ReadingProficiency%
(N/A = notapplicable (no
students insubgroup))
Halau Ku Mana Public Charter School* SUPP SUPP Hālau Lōkahi Charter School 14% 14% Hawaii Academy of Arts & Science Public Charter School(HAAS)
27% 23%
Hawaii Technology Academy 20% 42% Innovations Public Charter School 35% 59% Ka ‘Umeke Kā‘eo* SUPP SUPP Ka Waihona o ka Na‘auao Public Charter School* SUPP SUPP Kamaile Academy, PCS 6% 8% Kanu o ka ‘Āina New Century Public Charter School* SUPP SUPP Kanuikapono Public Charter School* SUPP SUPP Kawaikini New Century Public Charter School* SUPP SUPP Ke Ana La‘ahana PCS* SUPP SUPP Ke Kula ‘o Nāwahīokalani‘ōpu‘u Iki, LPCS* SUPP SUPP Ke Kula ‘o Samuel M. Kamakau, LPCS* SUPP SUPP Ke Kula Niihau O Kekaha Learning Center* SUPP SUPP Kihei Charter School 42% 33% Kona Pacific Public Charter School 0% 8% Kua o ka Lā New Century Public Charter School* SUPP SUPP
Kualapu‘u School: A Public Conversion Charter 11% 6% Kula Aupuni Niihau A Kahelelani Aloha (KANAKA) ANew Century Public Charter School (PCS)*
SUPP SUPP
Lanikai Elementary Public Charter School 33% 67% Laupahoehoe Community Public Charter School* SUPP SUPP Myron B. Thompson Academy N/A N/A Na Wai Ola (Waters Of Life) Public Charter School 100% 67% SEEQS: The School for Examining Essential Questions ofSustainability
0% 0%
University Laboratory School 11% 44% Volcano School of Arts & Sciences 9% 21% Voyager: A Public Charter School 8% 44% W i l El t P bli Ch t S h l 13% 30%
Table 15: Strive HI – Math, Reading, and Science Proficiency of Free and Reduced Lunch Stude
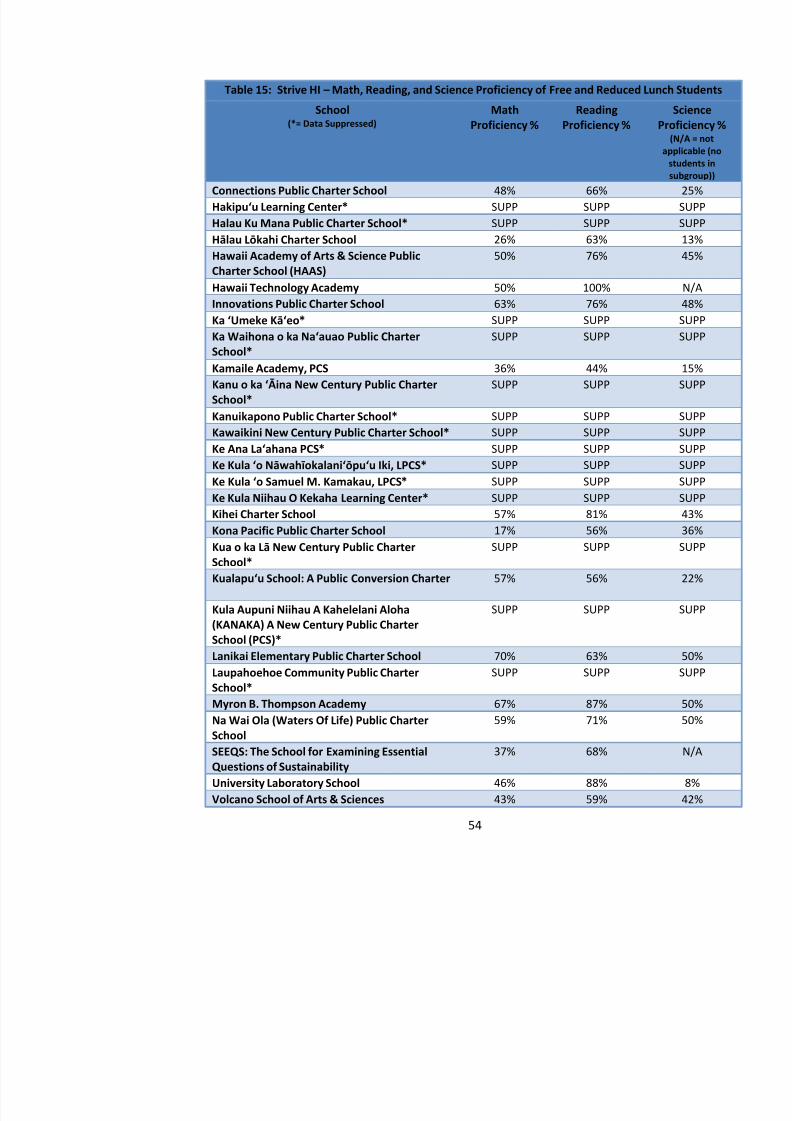
8/10/2019 Hawaii charter schools annual report
http://slidepdf.com/reader/full/hawaii-charter-schools-annual-report 57/268
, g, y
School(*= Data Suppressed)
MathProficiency %
ReadingProficiency % P
Connections Public Charter School 48% 66% Hakipu‘u Learning Center* SUPP SUPP Halau Ku Mana Public Charter School* SUPP SUPP Hālau Lōkahi Charter School 26% 63%
Hawaii Academy of Arts & Science PublicCharter School (HAAS)
50% 76%
Hawaii Technology Academy 50% 100% Innovations Public Charter School 63% 76% Ka ‘Umeke Kā‘eo* SUPP SUPP Ka Waihona o ka Na‘auao Public CharterSchool*
SUPP SUPP
Kamaile Academy, PCS 36% 44% Kanu o ka ‘Āina New Century Public CharterSchool*
SUPP SUPP
Kanuikapono Public Charter School* SUPP SUPP Kawaikini New Century Public Charter School* SUPP SUPP Ke Ana La‘ahana PCS* SUPP SUPP Ke Kula ‘o Nāwahīokalani‘ōpu‘u Iki, LPCS* SUPP SUPP Ke Kula ‘o Samuel M. Kamakau, LPCS* SUPP SUPP
Ke Kula Niihau O Kekaha Learning Center* SUPP SUPP Kihei Charter School 57% 81% Kona Pacific Public Charter School 17% 56% Kua o ka Lā New Century Public CharterSchool*
SUPP SUPP
Kualapu‘u School: A Public Conversion Charter 57% 56%
Kula Aupuni Niihau A Kahelelani Aloha(KANAKA) A New Century Public CharterSchool (PCS)*
SUPP SUPP
Lanikai Elementary Public Charter School 70% 63% Laupahoehoe Community Public CharterSchool*
SUPP SUPP
Table 15: Strive HI – Math, Reading, and Science Proficiency of Free and Reduced Lunch Stude
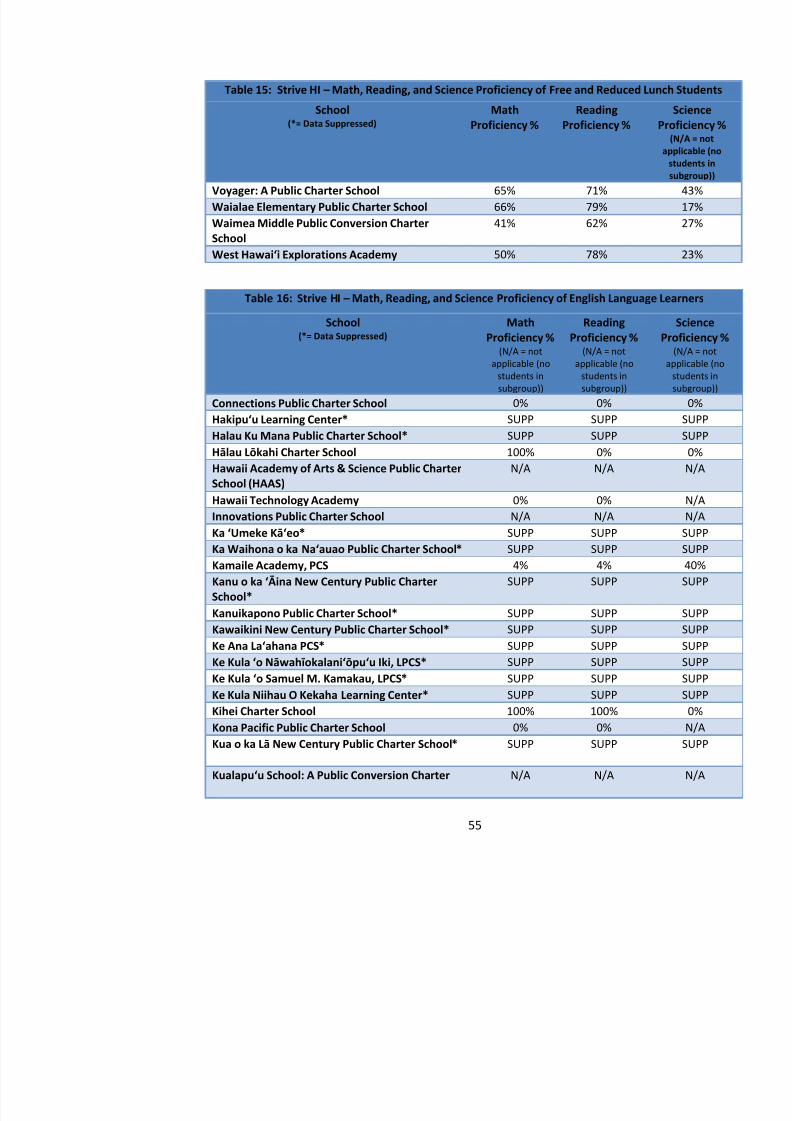
8/10/2019 Hawaii charter schools annual report
http://slidepdf.com/reader/full/hawaii-charter-schools-annual-report 58/268
School(*= Data Suppressed)
MathProficiency %
ReadingProficiency % P
Voyager: A Public Charter School 65% 71% Waialae Elementary Public Charter School 66% 79% Waimea Middle Public Conversion CharterSchool
41% 62%
West Hawai‘i Explorations Academy 50% 78%
Table 16: Strive HI – Math, Reading, and Science Proficiency of English Language Learner
School(*= Data Suppressed)
MathProficiency %
(N/A = notapplicable (no
students insubgroup))
ReadingProficiency %
(N/A = notapplicable (no
students insubgroup))
P
Connections Public Charter School 0% 0% Hakipu‘u Learning Center* SUPP SUPP Halau Ku Mana Public Charter School* SUPP SUPP Hālau Lōkahi Charter School 100% 0% Hawaii Academy of Arts & Science Public CharterSchool (HAAS)
N/A N/A
Hawaii Technology Academy 0% 0% Innovations Public Charter School N/A N/A Ka ‘Umeke Kā‘eo* SUPP SUPP Ka Waihona o ka Na‘auao Public Charter School* SUPP SUPP Kamaile Academy, PCS 4% 4% Kanu o ka ‘Āina New Century Public CharterSchool*
SUPP SUPP
Kanuikapono Public Charter School* SUPP SUPP Kawaikini New Century Public Charter School* SUPP SUPP Ke Ana La‘ahana PCS* SUPP SUPP Ke Kula ‘o Nāwahīokalani‘ōpu‘u Iki, LPCS* SUPP SUPP Ke Kula ‘o Samuel M. Kamakau, LPCS* SUPP SUPP
Table 16: Strive HI – Math, Reading, and Science Proficiency of English Language Learner
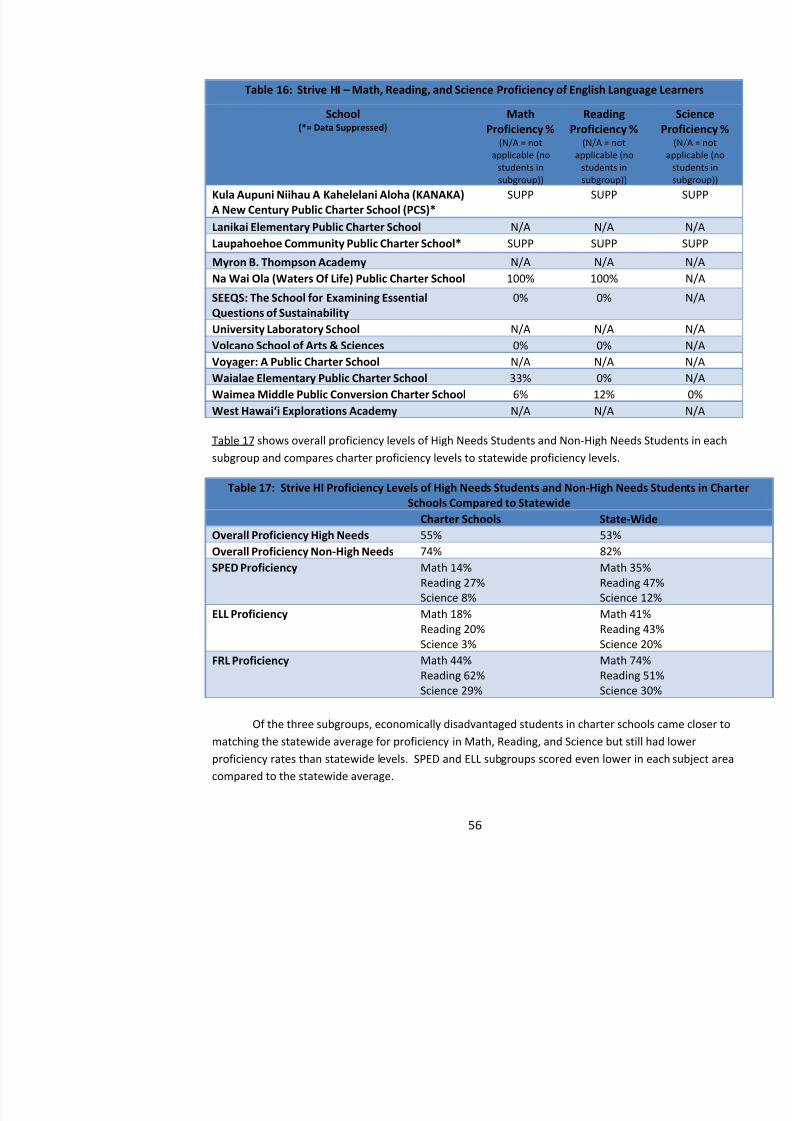
8/10/2019 Hawaii charter schools annual report
http://slidepdf.com/reader/full/hawaii-charter-schools-annual-report 59/268
School(*= Data Suppressed)
MathProficiency %
(N/A = notapplicable (no
students insubgroup))
ReadingProficiency %
(N/A = notapplicable (no
students insubgroup))
P
Kula Aupuni Niihau A Kahelelani Aloha (KANAKA)A New Century Public Charter School (PCS)*
SUPP SUPP
Lanikai Elementary Public Charter School N/A N/A Laupahoehoe Community Public Charter School* SUPP SUPP
Myron B. Thompson Academy N/A N/A Na Wai Ola (Waters Of Life) Public Charter School 100% 100%
SEEQS: The School for Examining EssentialQuestions of Sustainability
0% 0%
University Laboratory School N/A N/A Volcano School of Arts & Sciences 0% 0% Voyager: A Public Charter School N/A N/A
Waialae Elementary Public Charter School 33% 0% Waimea Middle Public Conversion Charter School 6% 12% West Hawai‘i Explorations Academy N/A N/A
Table 17 shows overall proficiency levels of High Needs Students and Non-High Needs Students insubgroup and compares charter proficiency levels to statewide proficiency levels.
Table 17: Strive HI Proficiency Levels of High Needs Students and Non-High Needs Students in Schools Compared to Statewide
Charter Schools State-WideOverall Proficiency High Needs 55% 53%Overall Proficiency Non-High Needs 74% 82%SPED Proficiency Math 14%
Reading 27%Science 8%
Math 35%Reading 47%Science 12%
ELL Proficiency Math 18%Reading 20%Science 3%
Math 41%Reading 43%Science 20%
FRL Proficiency Math 44%Reading 62%S i 29%
Math 74%Reading 51%S i 30%
When comparing the subgroup proficiency scores to the overall proficiency scores, it is
8/10/2019 Hawaii charter schools annual report
http://slidepdf.com/reader/full/hawaii-charter-schools-annual-report 60/268
important to remember that some students may fall into more than one subgroup. For example, astudent may be in the ELL subgroup and also qualify for free or reduced price lunch. In that situat
the stu dent’s score would be counted in each subgroup. As a result, the overall High Needs rate may not appear to be accurate when compared to the subgroup proficiency rates. That is becauthe rate is determined by using two different denominators. The subgroup rate looks at the percentproficient out of the subgroup, and the overall High Needs proficiency rate uses a denominator of tcombined group.
The overall Proficiency rate of High Needs Students in charter schools is 55%, as compare
53% statewide. However, when analyzing the subgroup proficiency rates individually, the charter performance shows significant deficits when compared to schools statewide. The AcademicPerformance Framework places a greater emphasis on examining the academic achievement of HigNeeds students both on their own and relative to how each school serves Non-High Needs Students
c. Growth Strive HI uses the Hawaii Growth Model to measure how well a school is improving
Reading and Math scores over time. The Hawaii Growth Model measures an individual stuby measuring the student’s progress in academic achievement. For individual students, the StGrowth Percentile (“SGP”) compares the performance of an individual student to her or hipeers. The SGP indicates either an individual student’s growth is high, average, or low compacademic peers of the student. An academic peer is considered the student who has historicallyperformed similarly to the student. At the school level, the median SGP of all students is used todeter mine the school’s score in the G rowth indicator. The median SGP is calculated by taking individual students’ SGPs at a school, ordering them from lowest to highest, and then idenmiddle score. The median SGP indicates the growth that the school’s students are making as
The Hawaii Growth Model sets the median SGP at 52 for Reading and 52 for Math. The median SGP in Reading for charter schools is 50, and the average median SGP in Math is 47. Fiftecharter schools had suppressed data. Twelve fell below the median in Math, and 10 fell below themedian in Reading.
Strive HI categorizes student growth percentile scores into low, typical and high categorieScores below the 35 th percentile is categorized as low, scores between the 35 th and 65 th arscores above the 65 th percentile are categorized as high. When examining the median student grpercentile for each school, median student growth percentile above the 50 th percentile indi
The median SGP for each charter school is indicated in Table 18 below.
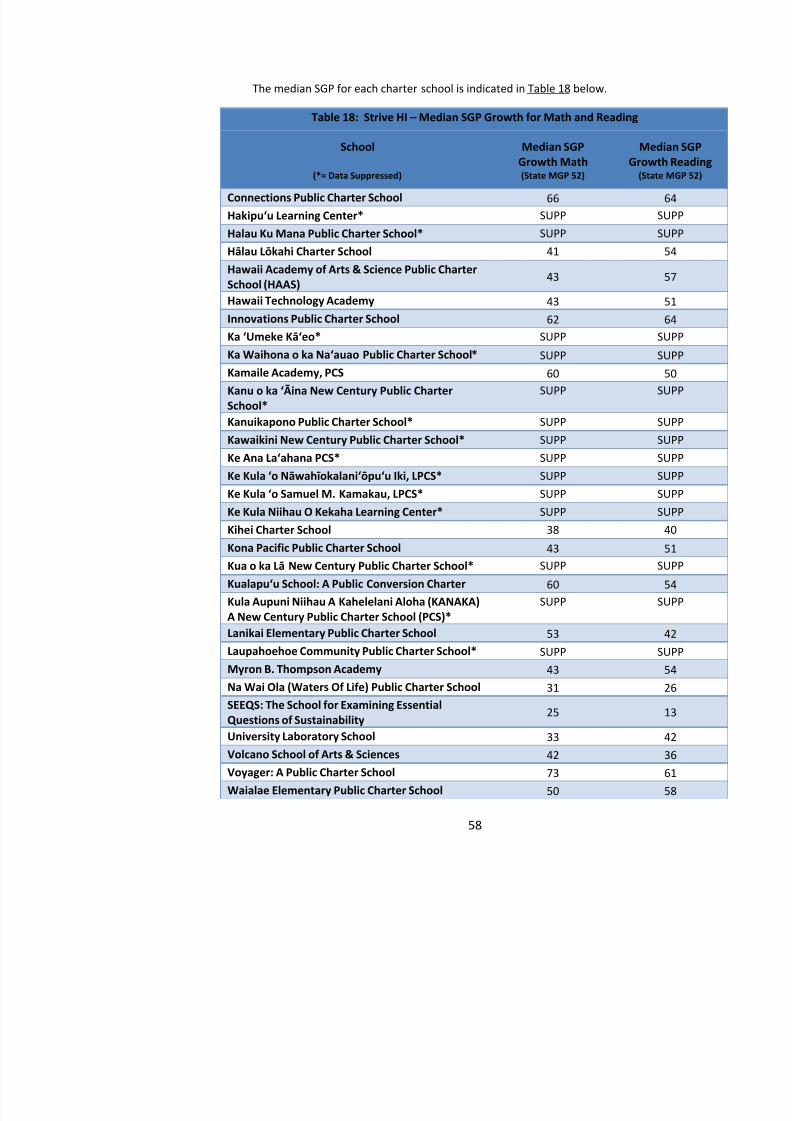
8/10/2019 Hawaii charter schools annual report
http://slidepdf.com/reader/full/hawaii-charter-schools-annual-report 61/268
Table 18: Strive HI – Median SGP Growth for Math and Reading
School
(*= Data Suppressed)
Median SGPGrowth Math(State MGP 52)
MediGrowth
(State
Connections Public Charter School 66 Hakipu‘u Learning Center* SUPP SHalau Ku Mana Public Charter School* SUPP SHālau Lōkahi Charter School 41 Hawaii Academy of Arts & Science Public CharterSchool (HAAS)
43
Hawaii Technology Academy 43 Innovations Public Charter School 62 Ka ‘Umeke Kā‘eo* SUPP SKa Waihona o ka Na‘auao Public Charter School* SUPP SKamaile Academy, PCS 60 Kanu o ka ‘Āina New Century Public CharterSchool*
SUPP S
Kanuikapono Public Charter School* SUPP SKawaikini New Century Public Charter School* SUPP SKe Ana La‘ahana PCS* SUPP SKe Kula ‘o Nāwahīokalani‘ōpu‘u Iki, LPCS* SUPP SKe Kula ‘o Samuel M. Kamakau, LPCS* SUPP SKe Kula Niihau O Kekaha Learning Center* SUPP SKihei Charter School 38 Kona Pacific Public Charter School 43 Kua o ka Lā New Century Public Charter School* SUPP SKualapu‘u School: A Public Conversion Charter 60 Kula Aupuni Niihau A Kahelelani Aloha (KANAKA)
A New Century Public Charter School (PCS)*
SUPP S
Lanikai Elementary Public Charter School 53 Laupahoehoe Community Public Charter School* SUPP SMyron B. Thompson Academy 43 Na Wai Ola (Waters Of Life) Public Charter School 31
Table 18: Strive HI – Median SGP Growth for Math and Reading
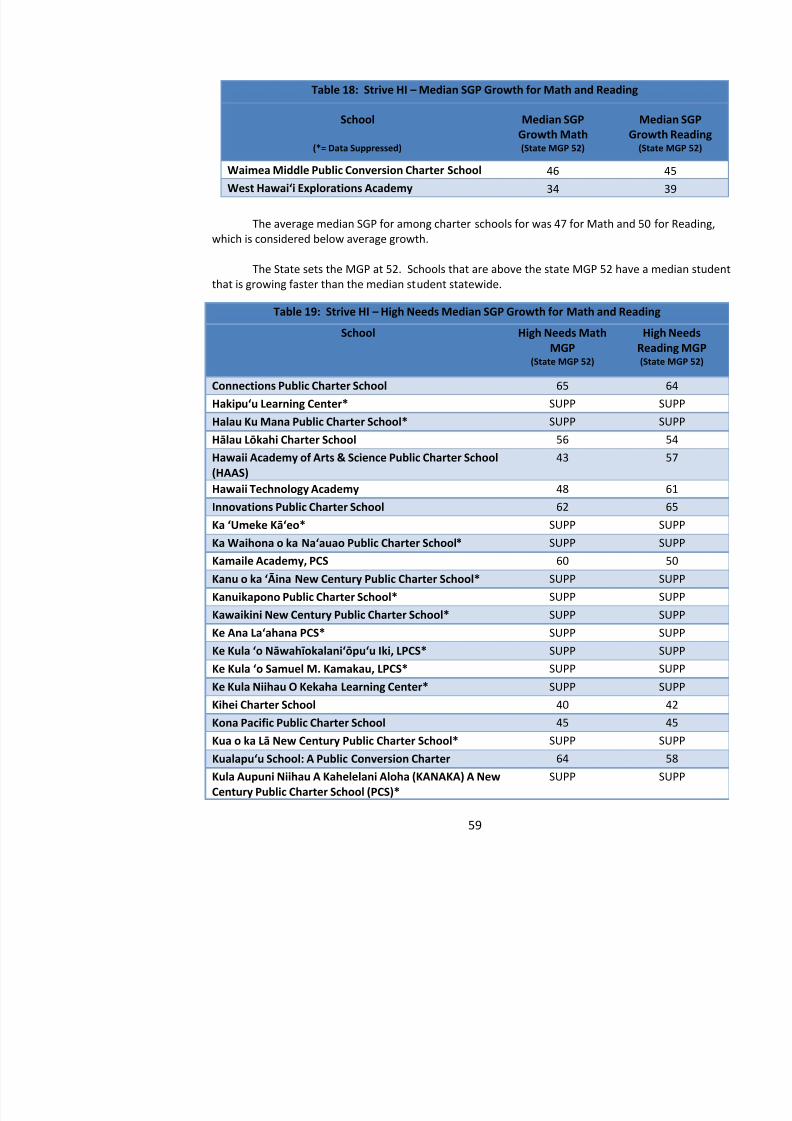
8/10/2019 Hawaii charter schools annual report
http://slidepdf.com/reader/full/hawaii-charter-schools-annual-report 62/268
School
(*= Data Suppressed)
Median SGP
Growth Math(State MGP 52)
Medi
Growth(State
Waimea Middle Public Conversion Charter School 46 West Hawai‘i Explorations Academy 34
The average median SGP for among charter schools for was 47 for Math and 50 for Readiwhich is considered below average growth.
The State sets the MGP at 52. Schools that are above the state MGP 52 have a median stuthat is growing faster than the median student statewide.
Table 19: Strive HI – High Needs Median SGP Growth for Math and Reading
School High Needs MathMGP
(State MGP 52)
HighReadi(State
Connections Public Charter School 65 Hakip u‘u Learning Center* SUPP SHalau Ku Mana Public Charter School* SUPP SHālau Lōkahi Charter School 56 Hawaii Academy of Arts & Science Public Charter School(HAAS)
43
Hawaii Technology Academy 48 Innovations Public Charter School 62 Ka ‘Umeke Kā‘eo* SUPP SKa Waihona o ka Na‘auao Public Charter School* SUPP SKamaile Academy, PCS 60 Kanu o ka ‘Āina New Century Public Charter School* SUPP SKanuikapono Public Charter School* SUPP SKawaikini New Century Public Charter School* SUPP SKe Ana La‘ahana PCS* SUPP SKe Kula ‘o Nāwahīokalani‘ōpu‘u Iki, LPCS* SUPP SKe Kula ‘o Samuel M. Kamakau, LPCS* SUPP SKe Kula Niihau O Kekaha Learning Center* SUPP S
Table 19: Strive HI – High Needs Median SGP Growth for Math and Reading
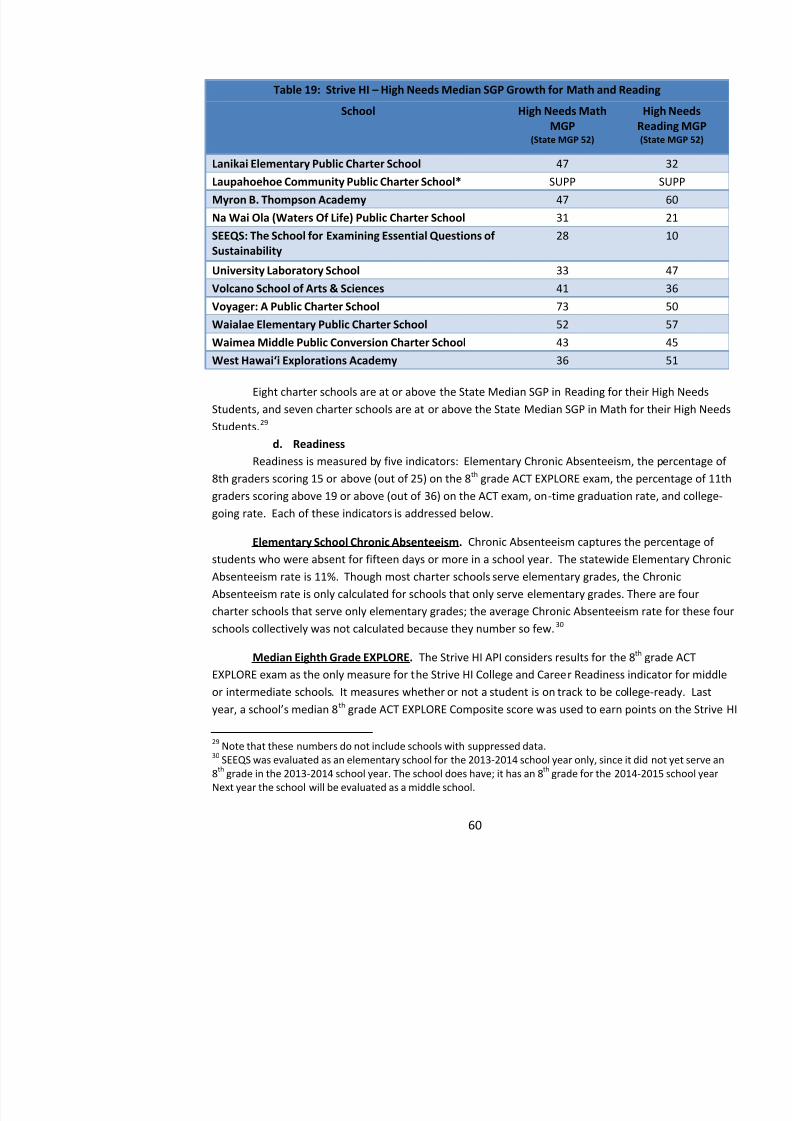
8/10/2019 Hawaii charter schools annual report
http://slidepdf.com/reader/full/hawaii-charter-schools-annual-report 63/268
School High Needs MathMGP
(State MGP 52)
HighReadi(State
Lanikai Elementary Public Charter School 47 Laupahoehoe Community Public Charter School* SUPP SMyron B. Thompson Academy 47 Na Wai Ola (Waters Of Life) Public Charter School 31 SEEQS: The School for Examining Essential Questions ofSustainability
28
University Laboratory School 33 Volcano School of Arts & Sciences 41 Voyager: A Public Charter School 73 Waialae Elementary Public Charter School 52 Waimea Middle Public Conversion Charter School 43 West Hawai‘i Explorations Academy 36
Eight charter schools are at or above the State Median SGP in Reading for their High NeeStudents, and seven charter schools are at or above the State Median SGP in Math for their High NStudents. 28F
29 d. Readiness
Readiness is measured by five indicators: Elementary Chronic Absenteeism, the percenta8th graders scoring 15 or above (out of 25) on the 8 th grade ACT EXPLORE exam, the percen
graders scoring above 19 or above (out of 36) on the ACT exam, on-time graduation rate, and collegoing rate. Each of these indicators is addressed below.
Elementary School Chronic Absenteeism. Chronic Absenteeism captures the percentastudents who were absent for fifteen days or more in a school year. The statewide Elementary ChrAbsenteeism rate is 11%. Though most charter schools serve elementary grades, the ChronicAbsenteeism rate is only calculated for schools that only serve elementary grades. There are fourcharter schools that serve only elementary grades; the average Chronic Absenteeism rate for these schools collectively was not calculated because they number so few. 29F
30
Median Eighth Grade EXPLORE. The Strive HI API considers results for the 8 th gradEXPLORE exam as the only measure for the Strive HI College and Career Readiness indicator for
rubric. This measure is now calculated by multiplying the percent of students scoring a composite at or above 15 on the 8 th grade ACT EXPLORE by the total possible points in the measure Cha
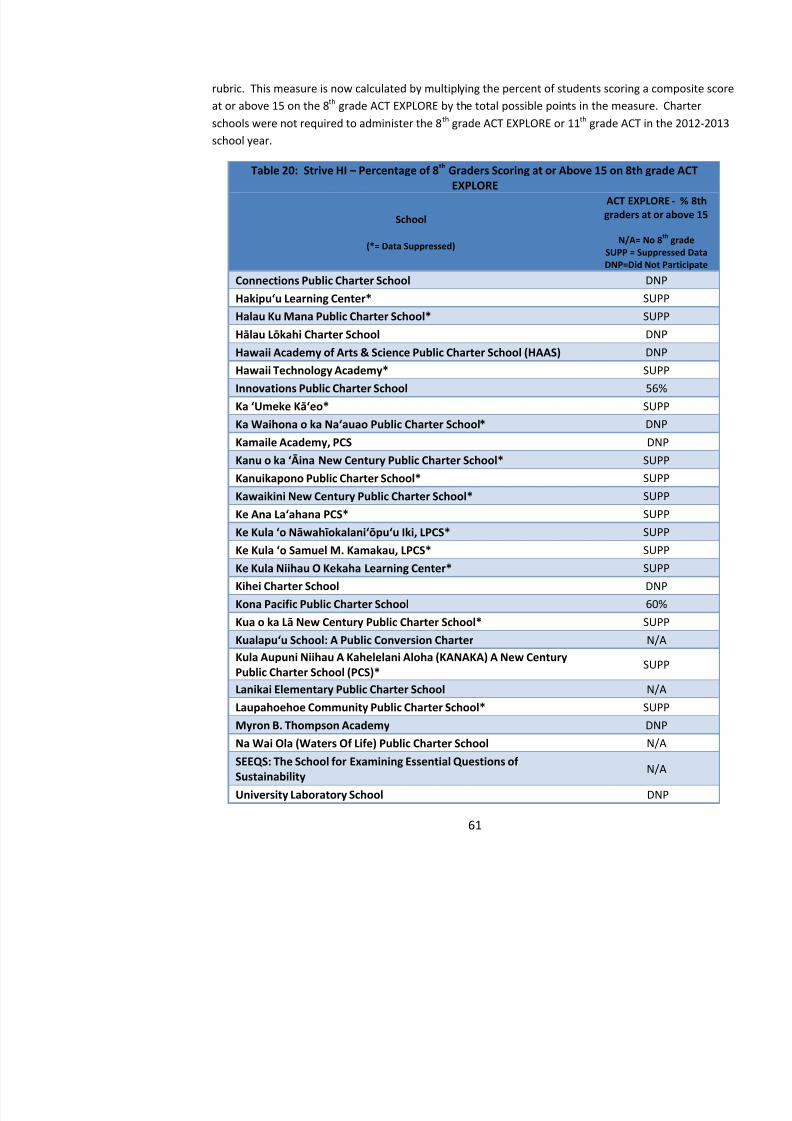
8/10/2019 Hawaii charter schools annual report
http://slidepdf.com/reader/full/hawaii-charter-schools-annual-report 64/268
at or above 15 on the 8 grade ACT EXPLORE by the total possible points in the measure. Chaschools were not required to administer the 8 th grade ACT EXPLORE or 11th grade ACT in th
school year.
Table 20: Strive HI – Percentage of 8 th Graders Scoring at or Above 15 on 8th grade ACEXPLORE
School
(*= Data Suppressed)
ACT EXPLOgraders at or ab
N/A= No 8SUPP = SuppreDNP=Did Not P
Connections Public Charter School DNHakipu‘u Learning Center* SUPHalau Ku Mana Public Charter School* SUPHālau Lōkahi Charter School DNHawaii Academy of Arts & Science Public Charter School (HAAS) DNHawaii Technology Academy* SUPInnovations Public Charter School 56%Ka ‘Umeke Kā‘eo* SUPKa Waihona o ka Na‘auao Public Charter School* DNKamaile Academy, PCS DNKanu o ka ‘Āina New Century Public Charter School* SUPKanuikapono Public Charter School* SUP
Kawaikini New Century Public Charter School* SUPKe Ana La‘ahana PCS* SUPKe Kula ‘o Nāwahīokalani‘ōpu‘u Iki, LPCS* SUPKe Kula ‘o Samuel M. Kamakau, LPCS* SUPKe Kula Niihau O Kekaha Learning Center* SUPKihei Charter School DNKona Pacific Public Charter School 60%
Kua o ka Lā New Century Public Charter School* SUPKualapu‘u School: A Public Conversion Charter N/AKula Aupuni Niihau A Kahelelani Aloha (KANAKA) A New CenturyPublic Charter School (PCS)*
SUP
L ik i El t P bli Ch t S h l N/A
Table 20: Strive HI – Percentage of 8 th Graders Scoring at or Above 15 on 8th grade ACEXPLORE
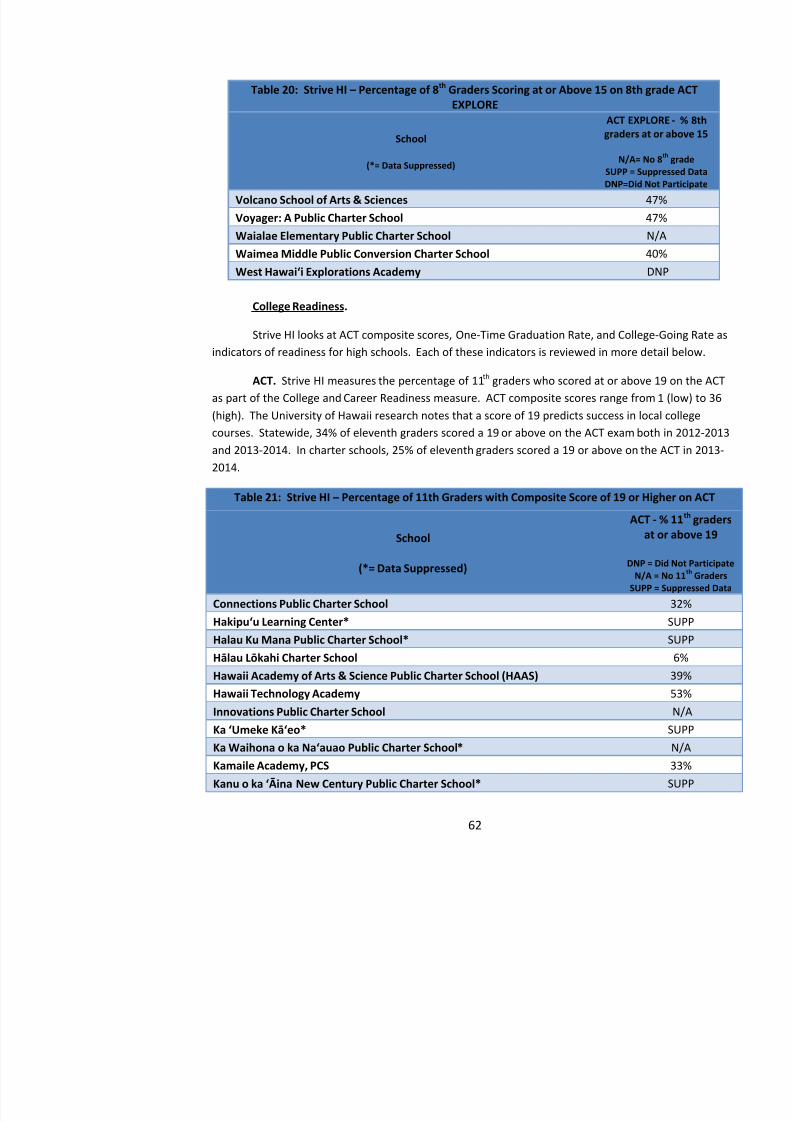
8/10/2019 Hawaii charter schools annual report
http://slidepdf.com/reader/full/hawaii-charter-schools-annual-report 65/268
School
(*= Data Suppressed)
ACT EXPLOgraders at or ab
N/A= No 8SUPP = SuppreDNP=Did Not P
Volcano School of Arts & Sciences 47%Voyager: A Public Charter School 47%Waialae Elementary Public Charter School N/AWaimea Middle Public Conversion Charter School 40%West Hawai‘i Explorations Academy DN
College Readiness.
Strive HI looks at ACT composite scores, One-Time Graduation Rate, and College-Goingindicators of readiness for high schools. Each of these indicators is reviewed in more detail below.
ACT. Strive HI measures the percentage of 11th
graders who scored at or above 19 onas part of the College and Career Readiness measure. ACT composite scores range from 1 (low) to(high). The University of Hawaii research notes that a score of 19 predicts success in local collegecourses. Statewide, 34% of eleventh graders scored a 19 or above on the ACT exam both in 2012-and 2013-2014. In charter schools, 25% of eleventh graders scored a 19 or above on the ACT in 22014.
Table 21: Strive HI – Percentage of 11th Graders with Composite Score of 19 or Higher on AC
School
(*= Data Suppressed)
ACT - %at or
DNP = DiN/A = N
SUPP = S
Connections Public Charter School
Hakipu‘u Learning Center*Halau Ku Mana Public Charter School*Hālau Lōkahi Charter School Hawaii Academy of Arts & Science Public Charter School (HAAS)
Table 21: Strive HI – Percentage of 11th Graders with Composite Score of 19 or Higher on AC
ACT %
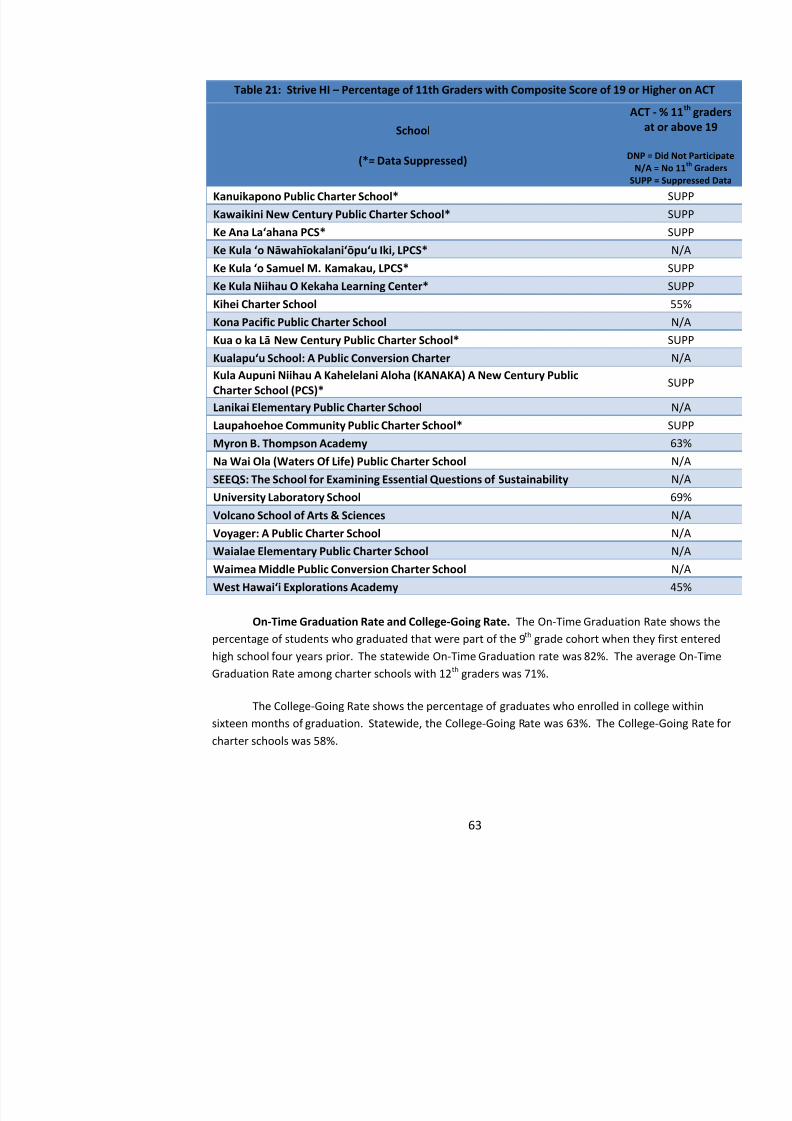
8/10/2019 Hawaii charter schools annual report
http://slidepdf.com/reader/full/hawaii-charter-schools-annual-report 66/268
School
(*= Data Suppressed)
ACT - %at or
DNP = DiN/A = N
SUPP = S
Kanuikapono Public Charter School*Kawaikini New Century Public Charter School*Ke Ana La‘ahana PCS* Ke Kula ‘o Nāwahīokalani‘ōpu‘u Iki, LPCS* Ke Kula ‘o Samuel M. Kamakau, LPCS* Ke Kula Niihau O Kekaha Learning Center*Kihei Charter SchoolKona Pacific Public Charter SchoolKua o ka Lā New Century Public Charter School* Kualapu‘u School: A Public Conversion CharterKula Aupuni Niihau A Kahelelani Aloha (KANAKA) A New Century PublicCharter School (PCS)*Lanikai Elementary Public Charter SchoolLaupahoehoe Community Public Charter School*Myron B. Thompson AcademyNa Wai Ola (Waters Of Life) Public Charter SchoolSEEQS: The School for Examining Essential Questions of Sustainability
University Laboratory SchoolVolcano School of Arts & SciencesVoyager: A Public Charter SchoolWaialae Elementary Public Charter SchoolWaimea Middle Public Conversion Charter SchoolWest Hawai‘i Explorations Academy
On-Time Graduation Rate and College-Going Rate. The On-Time Graduation Rate spercentage of students who graduated that were part of the 9 th grade cohort when they firsthigh school four years prior. The statewide On-Time Graduation rate was 82%. The average On-TGraduation Rate among charter schools with 12 th graders was 71%.
Table 22: Strive HI – On-Time Graduation Rate and College-Going Rate
O Ti C ll G
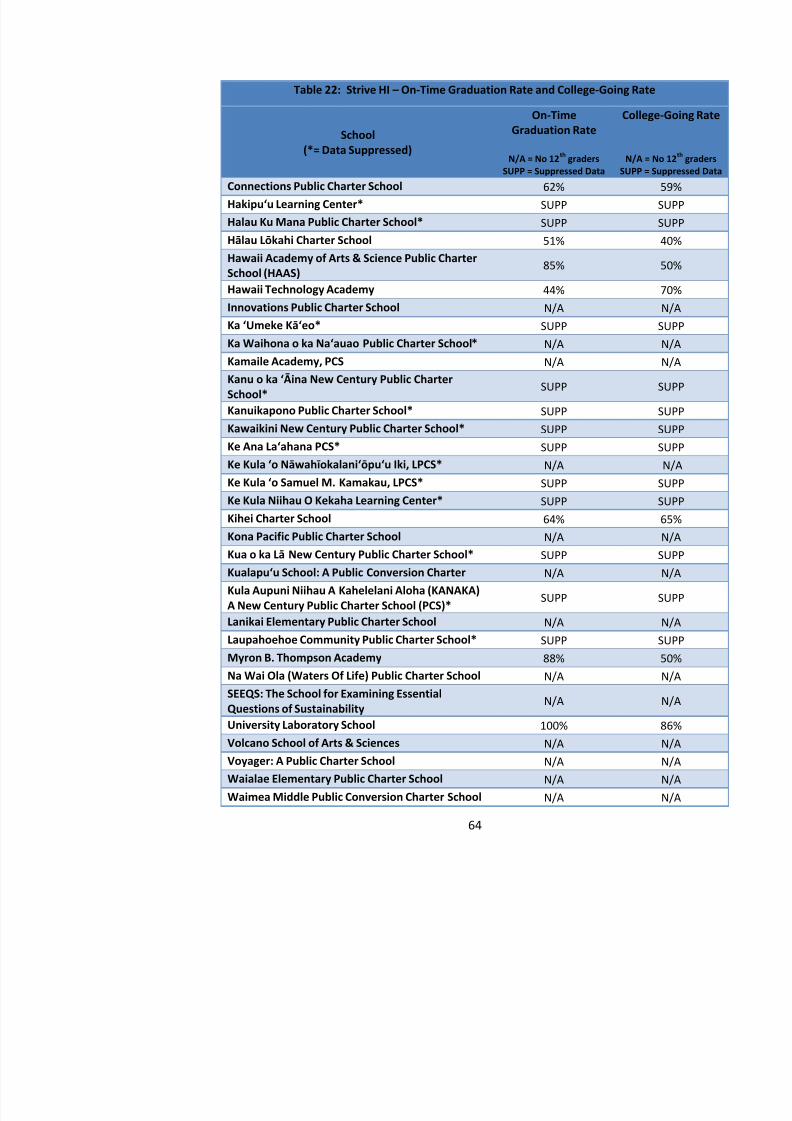
8/10/2019 Hawaii charter schools annual report
http://slidepdf.com/reader/full/hawaii-charter-schools-annual-report 67/268
School(*= Data Suppressed)
On-TimeGraduation Rate
N/A = No 12 th gradersSUPP = Suppressed Data
College-G
N/A = No SUPP = Sup
Connections Public Charter School 62% 5Hakipu‘u Learning Center* SUPP SHalau Ku Mana Public Charter School* SUPP SHālau Lōkahi Charter School 51% 4
Hawaii Academy of Arts & Science Public CharterSchool (HAAS) 85% 5
Hawaii Technology Academy 44% 7Innovations Public Charter School N/A NKa ‘Umeke Kā‘eo* SUPP SKa Waihona o ka Na‘auao Public Charter School* N/A NKamaile Academy, PCS N/A N
Kanu o ka ‘Āina New Century Public CharterSchool* SUPP S
Kanuikapono Public Charter School* SUPP SKawaikini New Century Public Charter School* SUPP SKe Ana La‘ahana PCS* SUPP SKe Kula ‘o Nāwahīokalani‘ōpu‘u Iki, LPCS* N/A Ke Kula ‘o Samuel M. Kamakau, LPCS* SUPP S
Ke Kula Niihau O Kekaha Learning Center* SUPP SKihei Charter School 64% 6Kona Pacific Public Charter School N/A NKua o ka Lā New Century Public Charter School* SUPP SKualapu‘u School: A Public Conversion Charter N/A NKula Aupuni Niihau A Kahelelani Aloha (KANAKA)A New Century Public Charter School (PCS)*
SUPP S
Lanikai Elementary Public Charter School N/A NLaupahoehoe Community Public Charter School* SUPP SMyron B. Thompson Academy 88% 5Na Wai Ola (Waters Of Life) Public Charter School N/A N
Table 22: Strive HI – On-Time Graduation Rate and College-Going Rate
On Time College G
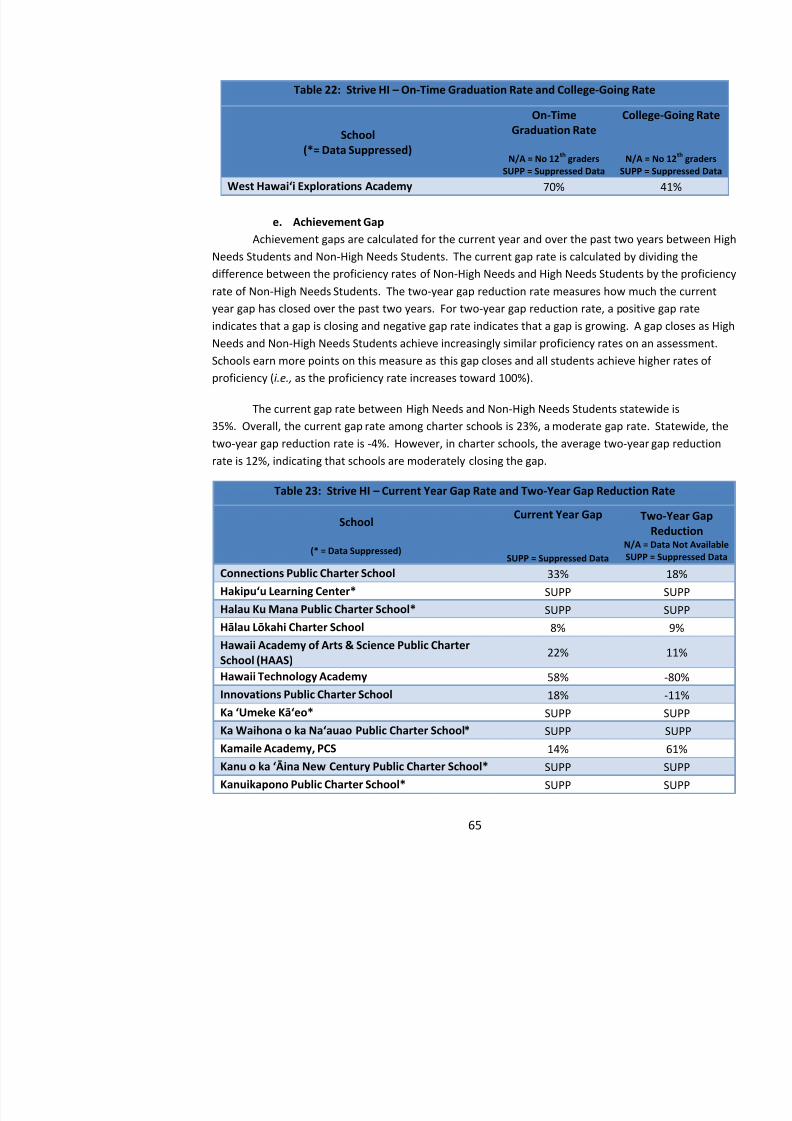
8/10/2019 Hawaii charter schools annual report
http://slidepdf.com/reader/full/hawaii-charter-schools-annual-report 68/268
School(*= Data Suppressed)
On-TimeGraduation Rate
N/A = No 12 th gradersSUPP = Suppressed Data
College-G
N/A = No SUPP = Sup
West Hawai‘i Explorations Academy 70% 4
e. Achievement Gap Achievement gaps are calculated for the current year and over the past two years between
Needs Students and Non-High Needs Students. The current gap rate is calculated by dividing thedifference between the proficiency rates of Non-High Needs and High Needs Students by the profirate of Non-High Needs Students. The two-year gap reduction rate measures how much the currenyear gap has closed over the past two years. For two-year gap reduction rate, a positive gap rateindicates that a gap is closing and negative gap rate indicates that a gap is growing. A gap closes aNeeds and Non-High Needs Students achieve increasingly similar proficiency rates on an assessmeSchools earn more points on this measure as this gap closes and all students achieve higher rates of
proficiency ( i.e., as the proficiency rate increases toward 100%).
The current gap rate between High Needs and Non-High Needs Students statewide is35%. Overall, the current gap rate among charter schools is 23%, a moderate gap rate. Statewide,two-year gap reduction rate is -4%. However, in charter schools, the average two-year gap reductirate is 12%, indicating that schools are moderately closing the gap.
Table 23: Strive HI – Current Year Gap Rate and Two-Year Gap Reduction Rate
School
(* = Data Suppressed)
Current Year Gap
SUPP = Suppressed Data
Two-Re
N/A = DatSUPP = S
Connections Public Charter School 33% Hakipu‘u Learning Center* SUPP Halau Ku Mana Public Charter School* SUPP
Hālau Lōkahi Charter School 8% Hawaii Academy of Arts & Science Public CharterSchool (HAAS)
22%
Hawaii Technology Academy 58%
Table 23: Strive HI – Current Year Gap Rate and Two-Year Gap Reduction Rate
Current Year Gap Two-
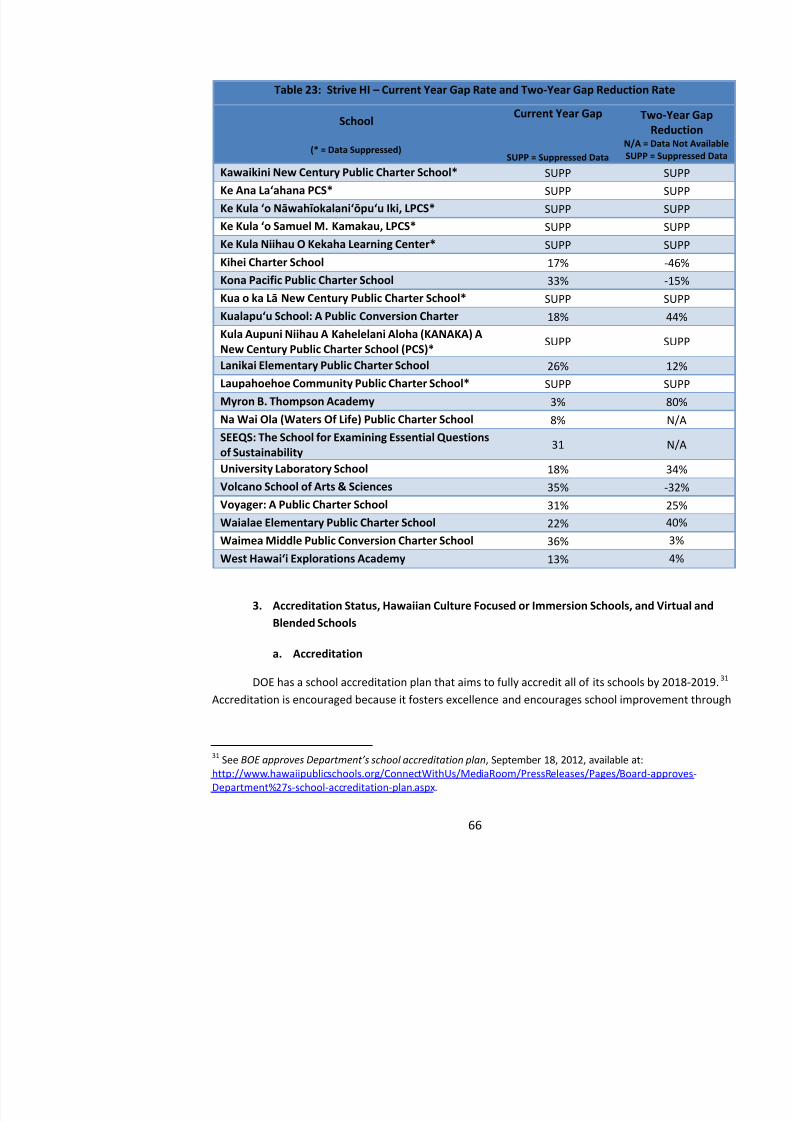
8/10/2019 Hawaii charter schools annual report
http://slidepdf.com/reader/full/hawaii-charter-schools-annual-report 69/268
School
(* = Data Suppressed)
Current Year Gap
SUPP = Suppressed Data
Two-Re
N/A = DatSUPP = S
Kawaikini New Century Public Charter School* SUPP Ke Ana La‘ahana PCS* SUPP Ke Kula ‘o Nāwahīokalani‘ōpu‘u Iki, LPCS* SUPP Ke Kula ‘o Samuel M. Kamakau, LPCS* SUPP Ke Kula Niihau O Kekaha Learning Center* SUPP
Kihei Charter School 17% Kona Pacific Public Charter School 33% Kua o ka Lā New Century Public Charter School* SUPP Kualapu‘u School: A Public Conversion Charter 18% Kula Aupuni Niihau A Kahelelani Aloha (KANAKA) ANew Century Public Charter School (PCS)*
SUPP
Lanikai Elementary Public Charter School 26%
Laupahoehoe Community Public Charter School* SUPP Myron B. Thompson Academy 3% Na Wai Ola (Waters Of Life) Public Charter School 8% SEEQS: The School for Examining Essential Questionsof Sustainability
31
University Laboratory School 18% Volcano School of Arts & Sciences 35%
Voyager: A Public Charter School 31% Waialae Elementary Public Charter School 22%Waimea Middle Public Conversion Charter School 36%West Hawai‘i Explorations Academy 13%
3. 21BAccreditation Status, Hawaiian Culture Focused or Immersion Schools, and Virtual and
Blended Schools
a. Accreditation
DOE has a school accreditation plan that aims to fully accredit all of its schools by 2018-2
a process of continual evaluation. 21F31F
32 It also recognizes that schools must meet an acceptable levquality. 22F32F
33
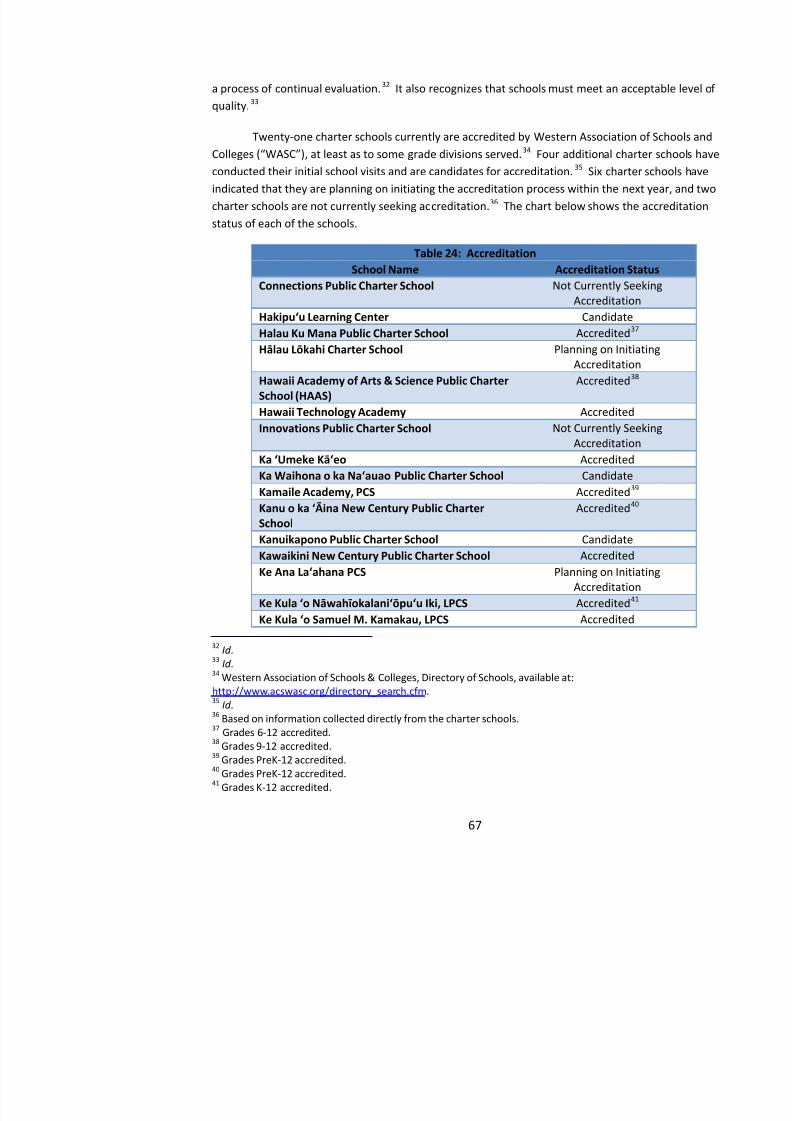
8/10/2019 Hawaii charter schools annual report
http://slidepdf.com/reader/full/hawaii-charter-schools-annual-report 70/268
Twenty-one charter schools currently are accredited by Western Association of Schools anColleges (“WASC”), at least as to some grade divisions served. 23F33F
34 Four additional charter schoconducted their initial school visits and are candidates for accreditation. 24F34F
35 Six charter schoindicated that they are planning on initiating the accreditation process within the next year, and twocharter schools are not currently seeking accreditation. 25F35F
36 The chart below shows the accredistatus of each of the schools.
Table 24: AccreditationSchool Name Accreditation Status
Connections Public Charter School Not Currently SeekingAccreditation
Hakipu‘u Learning Center CandidateHalau Ku Mana Public Charter School Accredited 36F
37 Hālau Lōkahi Charter School Planning on Initiating
Accreditation
Hawaii Academy of Arts & Science Public CharterSchool (HAAS)
Accredited37F
38
Hawaii Technology Academy AccreditedInnovations Public Charter School Not Currently Seeking
AccreditationKa ‘Umeke Kā‘eo AccreditedKa Waihona o ka Na‘auao Public Charter School CandidateKamaile Academy, PCS Accredited 38F
39 Kanu o ka ‘Āina New Century Public CharterSchool
Accredited 39F
40
Kanuikapono Public Charter School CandidateKawaikini New Century Public Charter School AccreditedKe Ana La‘ahana PCS Planning on Initiating
AccreditationKe Kula ‘o Nāwahīokalani‘ōpu‘u Iki, LPCS Accredited 40F
41
Ke Kula ‘o Samuel M. Kamakau, LPCS Accredited32 Id .33 Id .34 Western Association of Schools & Colleges, Directory of Schools, available at:
Table 24: AccreditationSchool Name Accreditation Status
K K l Niih O K k h L i C A dit d
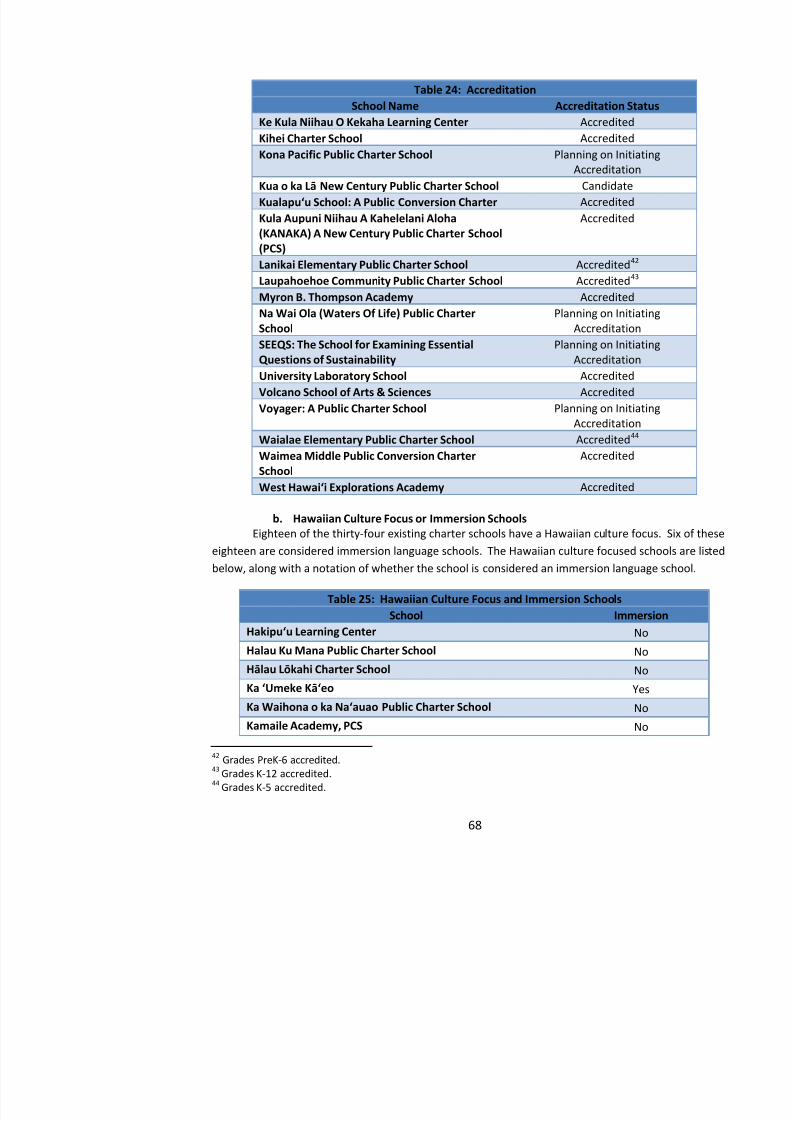
8/10/2019 Hawaii charter schools annual report
http://slidepdf.com/reader/full/hawaii-charter-schools-annual-report 71/268
Ke Kula Niihau O Kekaha Learning Center Accredited
Kihei Charter School AccreditedKona Pacific Public Charter School Planning on Initiating
AccreditationKua o ka Lā New Century Public Charter School CandidateKualapu‘u School: A Public Conversion Charter AccreditedKula Aupuni Niihau A Kahelelani Aloha(KANAKA) A New Century Public Charter School(PCS)
Accredited
Lanikai Elementary Public Charter School Accredited 41F42 Laupahoehoe Community Public Charter School Accredited 42F
43 Myron B. Thompson Academy AccreditedNa Wai Ola (Waters Of Life) Public CharterSchool
Planning on InitiatingAccreditation
SEEQS: The School for Examining EssentialQuestions of Sustainability
Planning on InitiatingAccreditation
University Laboratory School AccreditedVolcano School of Arts & Sciences AccreditedVoyager: A Public Charter School Planning on Initiating
AccreditationWaialae Elementary Public Charter School Accredited 43F
44 Waimea Middle Public Conversion CharterSchool
Accredited
West Hawai‘i Explorations Academy Accredited
b. Hawaiian Culture Focus or Immersion SchoolsEighteen of the thirty-four existing charter schools have a Hawaiian culture focus. Six of
eighteen are considered immersion language schools. The Hawaiian culture focused schools are libelow, along with a notation of whether the school is considered an immersion language school.
Table 25: Hawaiian Culture Focus and Immersion SchoolsSchool Immersion
Hakipu‘u Learning Center NoHalau Ku Mana Public Charter School NoHālau Lōkahi Charter School NoKa ‘Umeke Kā‘eo Y
Table 25: Hawaiian Culture Focus and Immersion SchoolsSchool Immersion
Kanu o ka ‘Āina New Century Public Charter School N
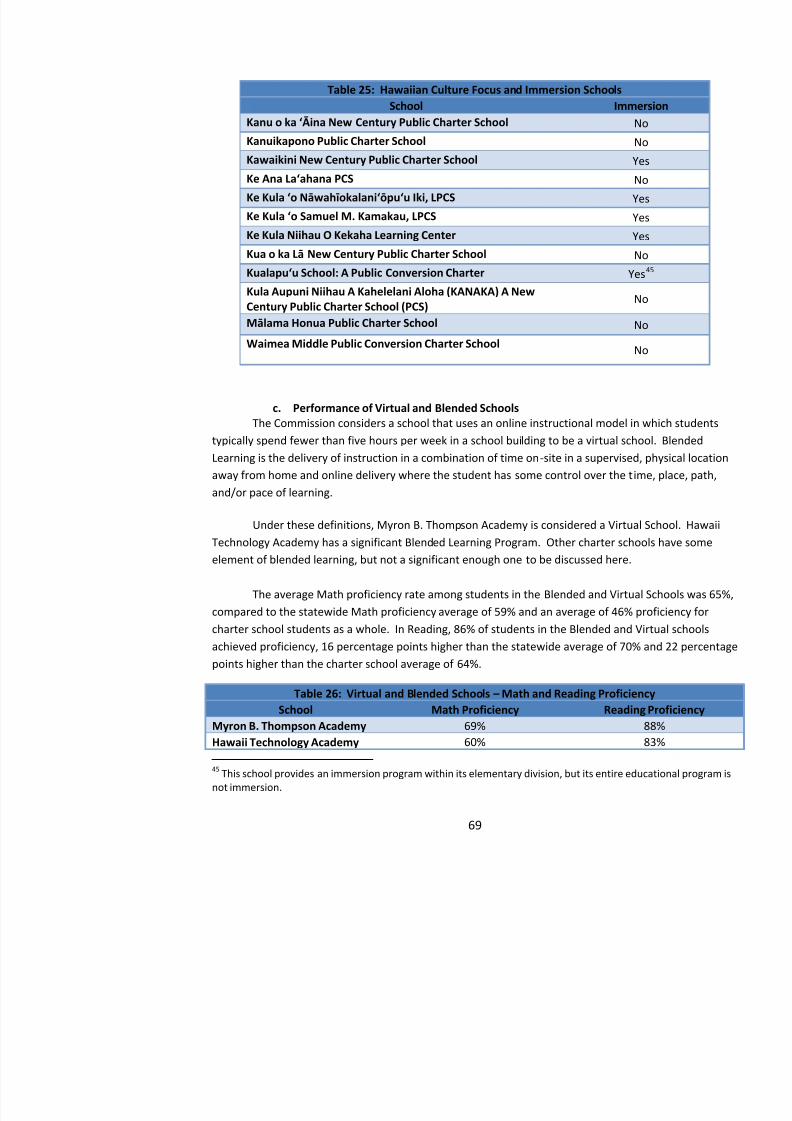
8/10/2019 Hawaii charter schools annual report
http://slidepdf.com/reader/full/hawaii-charter-schools-annual-report 72/268
Kanu o ka Āina New Century Public Charter School No
Kanuikapono Public Charter School NoKawaikini New Century Public Charter School YesKe Ana La‘ahana PCS NoKe Kula ‘o Nāwahīokalani‘ōpu‘u Iki, LPCS YesKe Kula ‘o Samuel M. Kamakau, LPCS YesKe Kula Niihau O Kekaha Learning Center YesKua o ka Lā New Century Public Charter School NoKualapu‘u School: A Public ConversionCharter Yes 44F
45 Kula Aupuni Niihau A Kahelelani Aloha (KANAKA) A NewCentury Public Charter School (PCS)
No
Mālama Honua Public Charter School No
Waimea Middle Public Conversion Charter School No
c. Performance of Virtual and Blended Schools The Commission considers a school that uses an online instructional model in which stude
typically spend fewer than five hours per week in a school building to be a virtual school. BlendedLearning is the delivery of instruction in a combination of time on-site in a supervised, physical locaway from home and online delivery where the student has some control over the time, place, pathand/or pace of learning.
Under these definitions, Myron B. Thompson Academy is considered a Virtual School. HTechnology Academy has a significant Blended Learning Program. Other charter schools have somelement of blended learning, but not a significant enough one to be discussed here.
The average Math proficiency rate among students in the Blended and Virtual Schools wacompared to the statewide Math proficiency average of 59% and an average of 46% proficien
charter school students as a whole. In Reading, 86% of students in the Blended and Virtual schoolachieved proficiency, 16 percentage points higher than the statewide average of 70% and 22 percenpoints higher than the charter school average of 64%.
In conclusion, the collective academic performance of students in charter schools improvefrom the 2012-2013 school year, on average, in every measure of Strive HI, except for Readingproficiency and elementary school Chronic Absenteeism However these improved proficiency ra
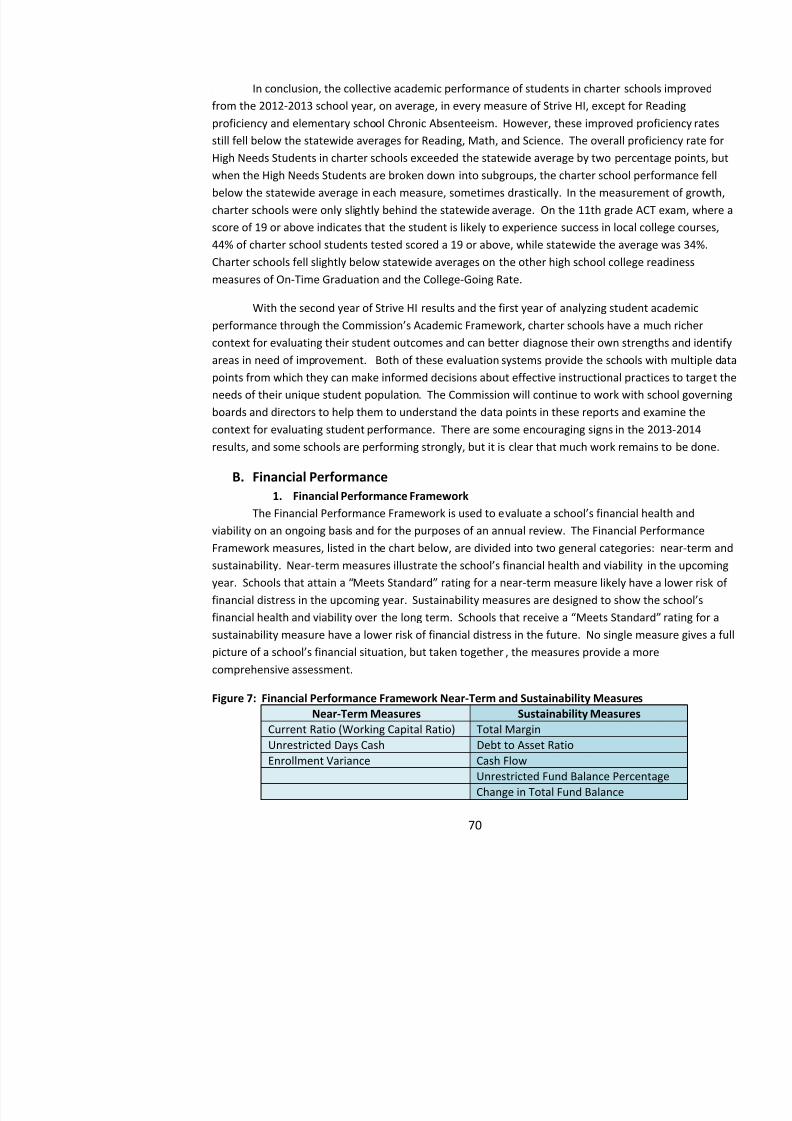
8/10/2019 Hawaii charter schools annual report
http://slidepdf.com/reader/full/hawaii-charter-schools-annual-report 73/268
proficiency and elementary school Chronic Absenteeism. However, these improved proficiency ra
still fell below the statewide averages for Reading, Math, and Science. The overall proficiency ratHigh Needs Students in charter schools exceeded the statewide average by two percentage points, bwhen the High Needs Students are broken down into subgroups, the charter school performance felbelow the statewide average in each measure, sometimes drastically. In the measurement of growtcharter schools were only slightly behind the statewide average. On the 11th grade ACT exam, whscore of 19 or above indicates that the student is likely to experience success in local college cours44% of charter school students tested scored a 19 or above, while statewide the average was 34%.
Charter schools fell slightly below statewide averages on the other high school college readinessmeasures of On-Time Graduation and the College-Going Rate.
With the second year of Strive HI results and the first year of analyzing student academicperformance through the Commission’s Academic Framework, charter schools have a much context for evaluating their student outcomes and can better diagnose their own strengths and identareas in need of improvement. Both of these evaluation systems provide the schools with multiplepoints from which they can make informed decisions about effective instructional practices to targeneeds of their unique student population. The Commission will continue to work with school goveboards and directors to help them to understand the data points in these reports and examine thecontext for evaluating student performance. There are some encouraging signs in the 2013-2014results, and some schools are performing strongly, but it is clear that much work remains to be don
B. 13B12BFinancial Performance1. 22B25BFinancial Performance Framework
The Financial Performance Framework is used to evaluate a school’s financial healthviability on an ongoing basis and for the purposes of an annual review. The Financial PerformanceFramework measures, listed in the chart below, are divided into two general categories: near-term sustainability. Near- term measures illustrate the school’s financial health and viability in thyear. Schools that attain a “Meets Standard” rating for a near -term measure likely have a lowfinancial distress in the upcoming year. Sustainability measures are designed to show the schfinancial health and viability over the long term. Schools that receive a “Meets Standard” rasustainability measure have a lower risk of financial distress in the future. No single measure givespicture of a school’s financial situation, but taken together , the measures provide a morecomprehensive assessment.
The Commission’s Financial Performance Framework has a two -tiered review proceswhich schools receive a preliminary rating and a final rating. The preliminary rating indicates wheon its face the school has met the standard If a school has not met standard the Commission cond
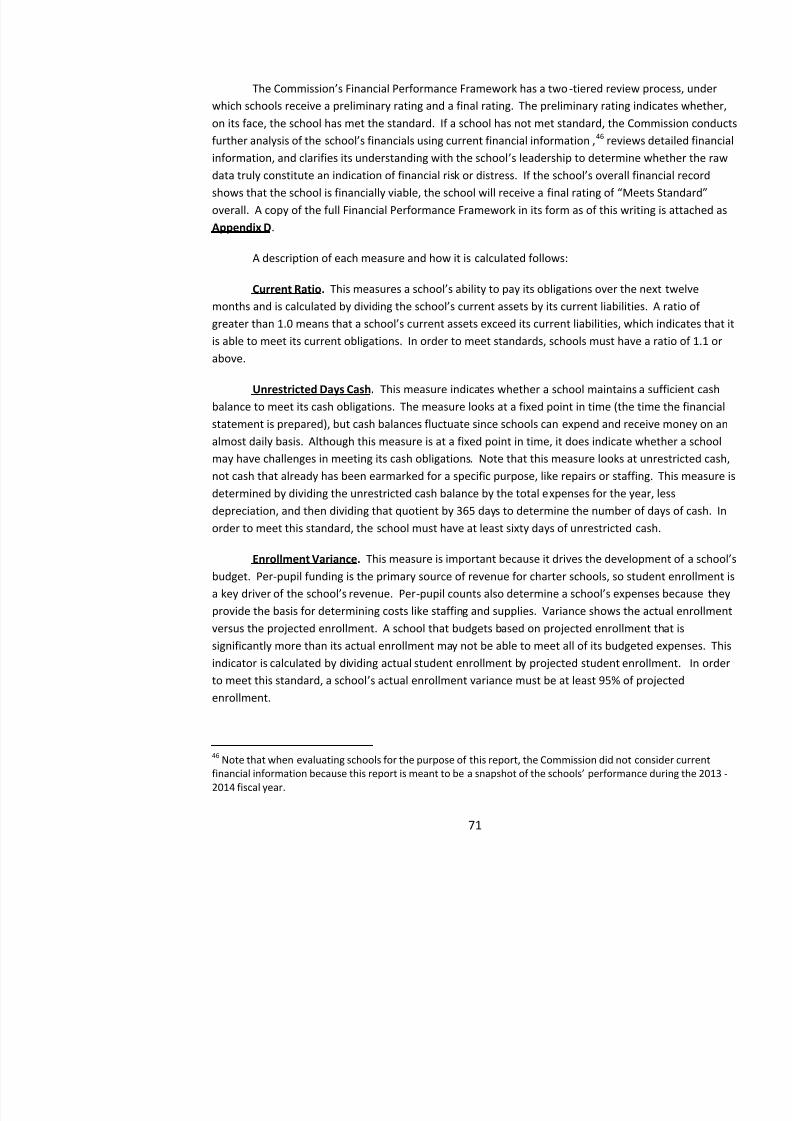
8/10/2019 Hawaii charter schools annual report
http://slidepdf.com/reader/full/hawaii-charter-schools-annual-report 74/268
on its face, the school has met the standard. If a school has not met standard, the Commission cond
further analysis of the school’s financials using current financial information ,45F
46
reviews detainformation, and clarifies its understanding with the school ’s leadership to determine whethedata truly constitute an indication of financial risk or distress. If the school’s overall financishows that the school is financially viable, the school will receive a final rating of “Meets Stoverall. A copy of the full Financial Performance Framework in its form as of this writing is attachAppendix D .
A description of each measure and how it is calculated follows:
Current Ratio. This measures a school’s ability to pay its obligations over the next tmonths and is calculated by dividing the school’s current assets by its current liabilities. A ragreater than 1.0 means that a school’s c urrent assets exceed its current liabilities, which indicatis able to meet its current obligations. In order to meet standards, schools must have a ratio of 1.1 above.
Unrestricted Days Cash. This measure indicates whether a school maintains a sufficienbalance to meet its cash obligations. The measure looks at a fixed point in time (the time the finanstatement is prepared), but cash balances fluctuate since schools can expend and receive money on almost daily basis. Although this measure is at a fixed point in time, it does indicate whether a schmay have challenges in meeting its cash obligations. Note that this measure looks at unrestricted cnot cash that already has been earmarked for a specific purpose, like repairs or staffing. This measdetermined by dividing the unrestricted cash balance by the total expenses for the year, lessdepreciation, and then dividing that quotient by 365 days to determine the number of days of cash. order to meet this standard, the school must have at least sixty days of unrestricted cash.
Enrollment Variance. This measure is important because it drives the development budget. Per-pupil funding is the primary source of revenue for charter schools, so student enrollmea key driver of the school’s revenue. Per -pupil counts also determine a school’s expenses beprovide the basis for determining costs like staffing and supplies. Variance shows the actual enroll
versus the projected enrollment. A school that budgets based on projected enrollment that issignificantly more than its actual enrollment may not be able to meet all of its budgeted expenses. indicator is calculated by dividing actual student enrollment by projected student enrollment. In oto meet this standard, a school ’s actual enrollment variance must be at least 95% of projected
Total Margin. This measures whether a school is living within its available resources in particular year. The intent of this measure is not for the schools to be profitable , but “it ischarter schools to build a reserve to support growth or sustain the school in an uncertain funding
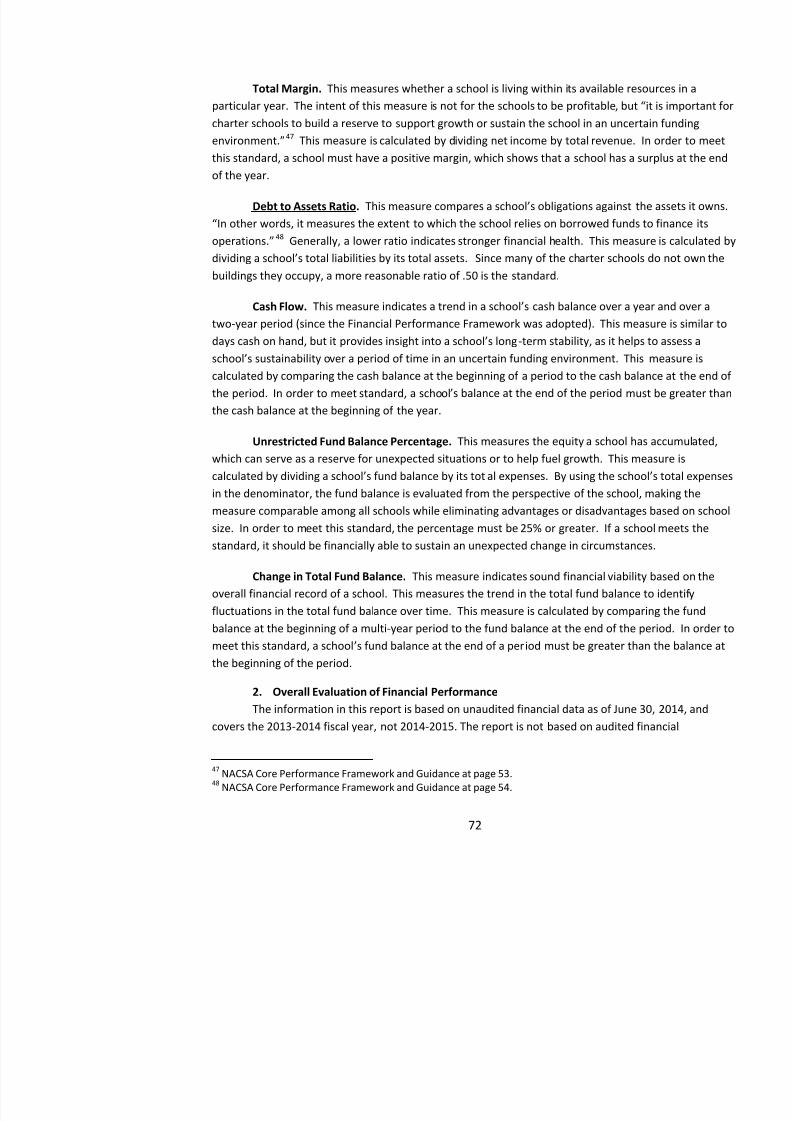
8/10/2019 Hawaii charter schools annual report
http://slidepdf.com/reader/full/hawaii-charter-schools-annual-report 75/268
charter schools to build a reserve to support growth or sustain the school in an uncertain funding
environment.”1046F
47
This measure is calculated by dividing net income by total revenue. In order tothis standard, a school must have a positive margin, which shows that a school has a surplus at the of the year.
Debt to Assets Ratio. This measure compares a school’s obligations against the as“In other words, it measures the extent to which the school relies on borrowed funds to finance itoperations.” 110F47F
48 Generally, a lower ratio indicates stronger financial health. This measure is calcul
dividing a school’s total liabilities by its total assets. Since many of the charter schools do not buildings they occupy, a more reasonable ratio of .50 is the standard.
Cash Flow. This measure indicates a trend in a school’s cash balance over a year andtwo-year period (since the Financial Performance Framework was adopted). This measure is simildays cash on hand, but it provides insight into a school’s long -term stability, as it helps to asseschool’s sustainability over a period of time in an uncertain funding environment. This mecalculated by comparing the cash balance at the beginning of a period to the cash balance at the endthe period. In order to meet standard, a school ’s balance at the end of the period must be the cash balance at the beginning of the year.
Unrestricted Fund Balance Percentage. This measures the equity a school has accumwhich can serve as a reserve for unexpected situations or to help fuel growth. This measure iscalculated by dividing a school’s fund balance by its tot al expenses. By using the school’s tin the denominator, the fund balance is evaluated from the perspective of the school, making themeasure comparable among all schools while eliminating advantages or disadvantages based on schsize. In order to meet this standard, the percentage must be 25% or greater. If a school meets thestandard, it should be financially able to sustain an unexpected change in circumstances.
Change in Total Fund Balance. This measure indicates sound financial viability based overall financial record of a school. This measures the trend in the total fund balance to identifyfluctuations in the total fund balance over time. This measure is calculated by comparing the fund
balance at the beginning of a multi-year period to the fund balance at the end of the period. In ordemeet this standard, a school ’s fund balance at the end of a period must be greater than the bthe beginning of the period.
information because the deadline for charter school annual audits was November 15, 2014, which wtoo close to the deadline for submittal of this report for the audits to be analyzed and included.
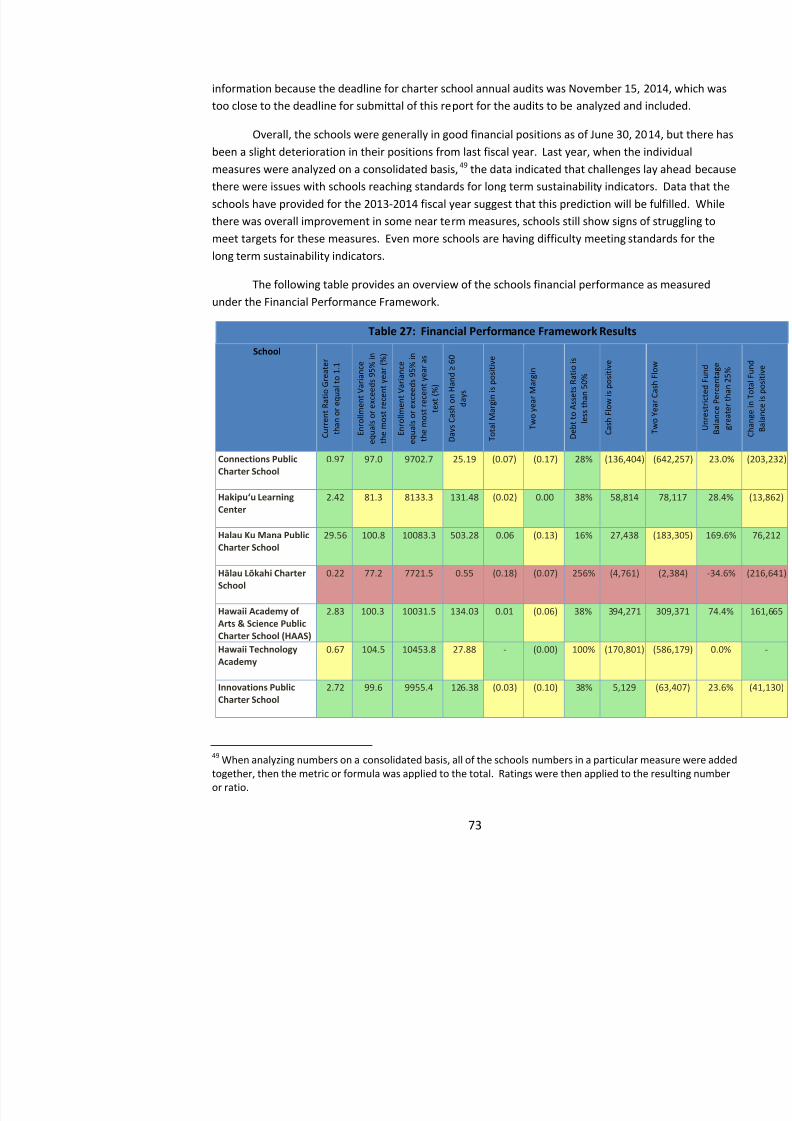
8/10/2019 Hawaii charter schools annual report
http://slidepdf.com/reader/full/hawaii-charter-schools-annual-report 76/268
Overall, the schools were generally in good financial positions as of June 30, 2014, but thebeen a slight deterioration in their positions from last fiscal year. Last year, when the individualmeasures were analyzed on a consolidated basis, 111F48F
49 the data indicated that challenges lay aheadthere were issues with schools reaching standards for long term sustainability indicators. Data thatschools have provided for the 2013-2014 fiscal year suggest that this prediction will be fulfilled. Wthere was overall improvement in some near term measures, schools still show signs of struggling tmeet targets for these measures. Even more schools are having difficulty meeting standards for thelong term sustainability indicators.
The following table provides an overview of the schools financial performance as measureunder the Financial Performance Framework.
Table 27: Financial Performance Framework Results
School
C u r r e n t R a t i o G r e a t e r
t h a n o r e q u a l t o 1
. 1
E n r o
l l m e n t V a r i a n c e
e q u a l s o r e x c e e d s 9 5 % i n
t h e m o s t r e c e n t y e a r
( % )
E n r o
l l m e n t V a r i a n c e
e q u a l s o r e x c e e d s 9 5 % i n
t h e m o s t r e c e n t y e a r a s
t e x t
( % )
D a y s C a s
h o n H a n
d ≥ 6 0
d a y s
T o t a l M a r g i n i s p o s i t i v e
T w o y e a r M a r g i n
D e
b t t o A s s e t s R a t i o i s
l e s s t h a n 5 0 %
C a s h F l o w i s p o s i t i v e
T w o Y e a r C a s h
F l o w
Connections PublicCharter School
0.97 97.0 9702.7 25.19 (0.07) (0.17) 28% (136,404) (642,2
Hakipu‘u LearningCenter
2.42 81.3 8133.3 131.48 (0.02) 0.00 38% 58,814 78,11
Halau Ku Mana PublicCharter School
29.56 100.8 10083.3 503.28 0.06 (0.13) 16% 27,438 (183,3
Hālau Lōkahi CharterSchool
0.22 77.2 7721.5 0.55 (0.18) (0.07) 256% (4,761) (2,38
Hawaii Academy of
Arts & Science PublicCharter School (HAAS)
2.83 100.3 10031.5 134.03 0.01 (0.06) 38% 394,271 309,3
Hawaii TechnologyAcademy
0.67 104.5 10453.8 27.88 - (0.00) 100% (170,801) (586,1
Innovations Public 2 72 99 6 9955 4 126 38 (0 03) (0 10) 38% 5 129 (63 40
Table 27: Financial Performance Framework Results
School
a t e r
1 . 1
n c e
9 5 % i n
a r ( % )
n c e
9 5 % i n
a r a s
≥ 6 0
s i t i v e
i n t i o i s
i t i v el o
w
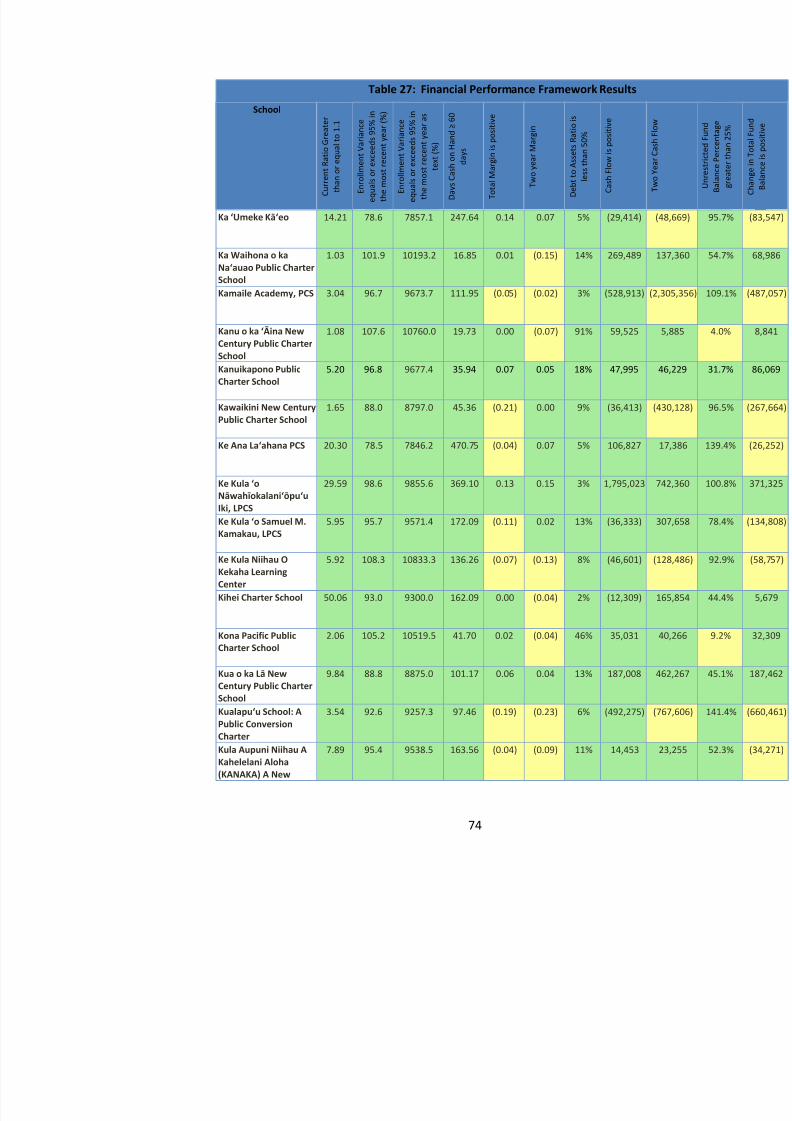
8/10/2019 Hawaii charter schools annual report
http://slidepdf.com/reader/full/hawaii-charter-schools-annual-report 77/268
C u r r e n t R a t i o G r e a
t h a n o r e q u a l t o 1
E n r o
l l m e n t V a r i a n
e q u a
l s o r e x c e e d s 9
t h e m o s t r e c e n t y e a
E n r o
l l m e n t V a r i a n
e q u a
l s o r e x c e e d s 9
t h e m o s t r e c e n t
y e
t e x t
( % )
D a y s C a s
h o n H a
n d
d a y s
T o t a l M a r g i n i s p o s
T w o y e a r M a r g i
D e
b t t o A s s e t s R a t
l e s s t h a n 5 0 %
C a s h F l o w i s p o s it
T w o Y e a r C a s
h F l
Ka ‘Umeke Kā‘eo 14.21 78.6 7857.1 247.64 0.14 0.07 5% (29,414) (48,66
Ka Waihona o kaNa‘auao Public CharterSchool
1.03 101.9 10193.2 16.85 0.01 (0.15) 14% 269,489 137,3
Kamaile Academy, PCS 3.04 96.7 9673.7 111.95 (0.05) (0.02) 3% (528,913) (2,305,3
Kanu o ka ‘Āina NewCentury Public CharterSchool
1.08 107.6 10760.0 19.73 0.00 (0.07) 91% 59,525 5,88
Kanuikapono Public
Charter School
5.20 96.8 9677.4 35.94 0.07 0.05 18% 47,995 46,
Kawaikini New CenturyPublic Charter School
1.65 88.0 8797.0 45.36 (0.21) 0.00 9% (36,413) (430,1
Ke Ana La‘ahana PCS 20.30 78.5 7846.2 470.75 (0.04) 0.07 5% 106,827 17,38
Ke Kula ‘oNāwahīokalani‘ōpu‘uIki, LPCS
29.59 98.6 9855.6 369.10 0.13 0.15 3% 1,795,023 742,3
Ke Kula ‘o Samuel M.Kamakau, LPCS
5.95 95.7 9571.4 172.09 (0.11) 0.02 13% (36,333) 307,6
Ke Kula Niihau OKekaha LearningCenter
5.92 108.3 10833.3 136.26 (0.07) (0.13) 8% (46,601) (128,4
Kihei Charter School 50.06 93.0 9300.0 162.09 0.00 (0.04) 2% (12,309) 165,8
Kona Pacific PublicCharter School
2.06 105.2 10519.5 41.70 0.02 (0.04) 46% 35,031 40,26
Kua o ka Lā NewCentury Public Charter
9.84 88.8 8875.0 101.17 0.06 0.04 13% 187,008 462,2
Table 27: Financial Performance Framework Results
School
e a t e r
1 . 1
n c e
9 5 % i n
a r ( % )
n c e
9 5 % i n
e a r a s
d ≥ 6 0
s i t i v e
g i n t i o i s
i t i v e
F l o w
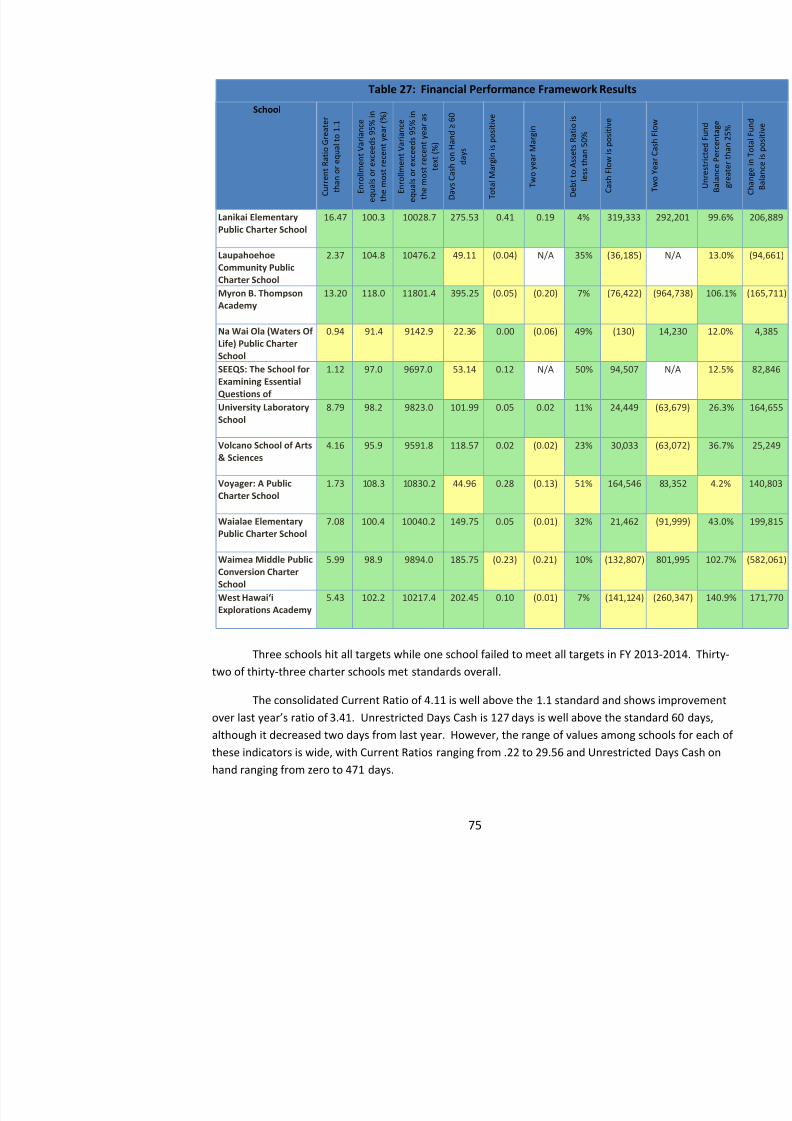
8/10/2019 Hawaii charter schools annual report
http://slidepdf.com/reader/full/hawaii-charter-schools-annual-report 78/268
C u r r e n t R a t i o G
r e
t h a n o r e q u a l t o
E n r o
l l m e n t V a r i a
e q u a
l s o r e x c e e d s 9
t h e m o s t r e c e n t y e
E n r o
l l m e n t V a r i a
e q u a
l s o r e x c e e d s 9
t h e m o s t r e c e n t
y e
t e x t
( % )
D a y s C a s
h o n H a
n d
d a y s
T o t a l M a r g i n i s p o
T w o y e a r M a r g
D e
b t t o A s s e t s R a
l e s s t h a n 5 0 %
C a s h F l o w i s p o s i
T w o Y e a r C a s
h F
Lanikai ElementaryPublic Charter School
16.47 100.3 10028.7 275.53 0.41 0.19 4% 319,333 292,20
LaupahoehoeCommunity PublicCharter School
2.37 104.8 10476.2 49.11 (0.04) N/A 35% (36,185) N/A
Myron B. ThompsonAcademy
13.20 118.0 11801.4 395.25 (0.05) (0.20) 7% (76,422) (964,7
Na Wai Ola (Waters OfLife) Public CharterSchool
0.94 91.4 9142.9 22.36 0.00 (0.06) 49% (130) 14,2
SEEQS: The School for
Examining EssentialQuestions of
1.12 97.0 9697.0 53.14 0.12 N/A 50% 94,507 N/A
University LaboratorySchool
8.79 98.2 9823.0 101.99 0.05 0.02 11% 24,449 (63,67
Volcano School of Arts& Sciences
4.16 95.9 9591.8 118.57 0.02 (0.02) 23% 30,033 (63,07
Voyager: A PublicCharter School
1.73 108.3 10830.2 44.96 0.28 (0.13) 51% 164,546 83,35
Waialae ElementaryPublic Charter School
7.08 100.4 10040.2 149.75 0.05 (0.01) 32% 21,462 (91,99
Waimea Middle PublicConversion CharterSchool
5.99 98.9 9894.0 185.75 (0.23) (0.21) 10% (132,807) 801,9
West Hawai‘iExplorations Academy
5.43 102.2 10217.4 202.45 0.10 (0.01) 7% (141,124) (260,3
Three schools hit all targets while one school failed to meet all targets in FY 2013-2014. Ttwo of thirty-three charter schools met standards overall.
The consolidated Total Margin for charter schools is 0%, or break-even for this year. Thisimprovement over last year’s consolidated margin of -3% but is cause for concern. The medianMargins across all schools is 0%. One conclusion that may be reached is that the schools, as a who
8/10/2019 Hawaii charter schools annual report
http://slidepdf.com/reader/full/hawaii-charter-schools-annual-report 79/268
managing their operations on a break-even basis. If the margins continue at this level, schools willunable to create and maintain reserves in the coming years, posing significant challenges and risks.
Total Margin directly impacts the Change in Total Fund Balance since the Total Fund Balameasure of the reserves that the school has built over time. If a school’s Total Margin is posiyear (meaning it has a surplus at the end of the year), the school can use this surplus to build its TotFund Balance. Negative Total Margins decrease the Total Fund Balance, while positive Total Margincrease the Total Fund Balance. When analyzed on a consolidated basis, the current Total FundBalance is a negative number: -$1,075,155. This is an improvement over las t year’s changebalance of -$2,175,280. The possible explanations for this continued negative number include (1) despite a consolidated margin of 0%, some schools operated at a loss, and/or (2) that schools investtheir physical facilities to the point of impacting this measure. 112F49F
50 The consolidated Change inBalance of -$1,075,155 represents .67% of revenues. This is consistent with the consolidated TotalMargin for all charter schools of 0% and suggests that the schools effectively operated at break-eve
The Total Margin also directly influences Cash Flow for the year, since Cash Flow is thecomparison of inflows (revenues and receipts) and out flows (expenses and payments) over a periotime. On a consolidated basis, the net Cash Flow for the fiscal year was $1,774,441, which represeincrease in cash of approximately 7% across the charter schools. This particular measure is reassurbecause it indicates schools were able to build reserves, at least for this year.
In conclusion, charter schools appear to have exercised sound stewardship of State funds.
schools are on solid footing for FY15, while some schools show signs of struggling with increasedoperating costs while trying to maintain the quality of their programs. Overall, schools met the neaterm measures. However, meeting the longer term sustainability measures presented more of achallenge for most schools. This reinforces the concern that the charter schools may not be on firmfinancial footing for the long term if current levels of available funding remain essentially flat in coyears and/or if schools are unable to realize cost savings.
One school, Hālau Lōkahi Public Charter School,actually became financially insolvent2014, when it could not meet its payroll and other operational cost obligations. The financial evalufor this school as of June 30, 2013, had found that the school was not meeting standard, with seventhe eight measures either below standard or far belo w standard. The school’s poor financit d th d d b 23% d ti i ll t f thi d t th
enrollment. That governing board has been replaced, and the school has been placed under monthlfinancial monitoring for the fiscal year 2014-2015.
As the Commission has implemented the Financial Performance Framework it has becom
8/10/2019 Hawaii charter schools annual report
http://slidepdf.com/reader/full/hawaii-charter-schools-annual-report 80/268
As the Commission has implemented the Financial Performance Framework, it has becomevident that receiving consistent and quality data from the schools is essential. Data analysis has pto be a challenge when the data submitted by the schools is inconsistent. To address this issue, theCommission continues to explore the possibility of standardizing a chart of accounts for all schoolsTaking this step would ensure that all schools use the same accounts consistently to reflect the saminformation, but accomplishing this could present difficulties for the schools. Under the terms of thCharter Contract, this will occur only with input from the schools.
The financial performance of the individual charter schools is contained in their individualperformance summaries, attached to this report as Appendix A . The individual school reporadditional notes showing how , under the Commission’s two -tiered review process, some schohave been given a rating of “Meets Standard” on a measure even if the data on that measure doon its face, meet the standard.
C. 14B13BOrganizational Performance
1. 24B27BOrganizational Performance FrameworkThe purpose of the Organizational Performance Framework is to communicate to the char
schools and the public the compliance-related standards the schools must meet and to help hold schaccountable for doing so. Compliance with state and federal law, administrative rules, and contractrequirements (such as the Charter Contract, collective bargaining agreements, and any supplementaagreements to the collective bargaining master agreements) is included in the OrganizationalPerformance Framework.
The Organizational Performance Framework currently is divided into six categories: EduProgram, Financial Management and Oversight, Governance and Reporting, Students and EmployeSchool Environment, and Additional Obligations. Each of these categories has measures used toevaluate schools. For example, under Education Program there are four measures. The first measuunder Education Program is, “ Is the school implementing the material elements of its EducationProgram as defined in the Charter C ontract?” A school is assigned a rating for each of the m
Meets Standard, Does Not Meet Standard, or Falls Far Below Standard. A copy of the full OrganizPerformance Framework in its current form is attached as Appendix E .
Each of the six categories evaluates a different aspect of the school’s organizationalperformance as described below
Financial Management and Oversight. This section is used to set expectations for management and oversight of its finances. This is distinguishable from the Financial PerformanceFramewor k, which is used to analyze a school’s actual financial performance , or the results
52
8/10/2019 Hawaii charter schools annual report
http://slidepdf.com/reader/full/hawaii-charter-schools-annual-report 81/268
practices evaluated here.114F51F
52
Governance and Reporting. This section sets forth the expectations for the governcompliance with governance-related la ws and the governing board’s own bylaws and policisection also includes an indicator to evaluate the extent to which the governing board oversees theindividuals or organizations to which it delegates the duties of implementing the school’s pro
Students and Employees. This section measures compliance with a number of laws rel
students and employees. These include the rights of students and employees as well as operationalrequirements like teacher licensing and background checks. 116F53F
54
School Environment. This section addresses the charter school’s facility, transportahealth services, among other things. 117F54F
55
Additional Obligations. This section is meant to be a catch-all section for measures tharepresent t he authorizer’s relatively lower priority requirements and any requirements that wereestablished after the Organizational Performance Framework was adopted into the Charter Contrac
2. 25B28BEvaluation Process for 2013-2014 Preliminary Organizational Performance AssessmentThe intent of the Organizational Performance Framework is to implement an accountabilit
system that effectively monitors and assesses charter school compliance with federal, state, andcontractual requirements and addresses organizational capacity, while recognizing the autonomy ofschools and working towards minimizing their administrative and reporting burden. As a practical
matter, the Organizational Performance Framework cannot specifically address every compliancerequirement; rather, it serves as the starting point for compliance, as it helps explain why charterschools must comply with certain key legal and contractual requirements. For example, the CharteContract (Sections 6.1 and 11.4) requires schools to submit their policies on student conduct anddiscipline. The Organizational Performance Framework takes that contractual requirement and useto measure whether the school is protecting the rights of all students.
The Commission has been intentionally implementing the Organizational PerformanceFramework in an incremental manner to give its staff and the charter schools time to put necessarysystems in place and to address challenges in a thoughtful and practical manner, while at the same tbalancing the importance of compliance with the charter schools ’ ability to continue to fulfil
measurement of whether charter schools were complying with governance requirements: whether tcharter school provided a board member roster to the Commission and whether the schools were incompliance with statutory conflict of interest provisions as to governing board chairpersons. Durin
8/10/2019 Hawaii charter schools annual report
http://slidepdf.com/reader/full/hawaii-charter-schools-annual-report 82/268
2013-2014 school year, the Commission conducted the Preliminary Organizational PerformanceAssessment (“POPA”), which expanded on the 2012-2013 school year assessment and took measufrom five categories —all except the catch-all category, Additional Obligations. The POPA was tstep in the development of a fair and effective monitoring and compliance system that recognizesschool autonomy while assuring stakeholders that charter schools are meeting their legal andcontractual obligations.
The POPA was formative in nature. It was designed to help the Commission determine wcharter schools were meeting basic requirements captured in the Organizational PerformanceFramework and to learn which requirements posed challenges to charter schools, why such challenexisted, and what the schools, the Commission, or other organizations could do to address thesechallenges. Charter schools were primarily assessed on their ability to submit required informationtimely basis; in other words, this was not a qualitative assessment. Partially based on the data gaththrough the POPA, the Commission will be focusing special efforts during the 2014-2015 school ye
teacher licensure and admission and enrollment policies and practices. The Commission hopes toinclude this additional information in its 2015 Annual Report to continue to build on the implementwork already done on the Organizational Performance Framework. Charter school performance onPOPA and feedback from schools also helped inform revisions to the Charter Contract and to thePerformance Frameworks themselves.
The POPA selected key compliance measures from each of the five major categories. Thefocused on the timely submittal of key information, but there were some items that were reviewed tdetermine compliance. The key compliance measures and the categories are as follows:
1. Education Program. Charter schools were assessed on the timely submittal of: EssentiaTerms 119F56F
57 to the Commission, required special education information to the DOE, and an Eto the Commission.
2. Financial Management and Oversight. Charter schools were assessed on the timely suof quarterly financial statements, annual audits, and annual budgets to the Commission.
3. Governance and Reporting. Charter schools were assessed on whether statutory confliinterest requirements for governing board membership were fulfilled whether public post
4. Students and Employees. Charter schools were assessed on timely submittal of policiestudent conduct and discipline, conflict resolution, complaints, admissions, and personnel;timely submittal of a 100% Highly Qualified Teacher (“HQT”) School Plan; the condu
8/10/2019 Hawaii charter schools annual report
http://slidepdf.com/reader/full/hawaii-charter-schools-annual-report 83/268
required employee background checks; and timely submittal of a plan for a teacher evaluasystem.
5. School Environment. Charter schools were assessed on whether Certificates of Occupaall necessary building permits were timely submitted; whether each school met county FirDepartment requirements for school inspections and fire drills; whether a safety/emergencplan was timely submitted; whether each school met State Department of Health immunizrequirements; and whether each school notified parents of student privacy rights.
6. Additional Obligations. Charter schools were not assessed on any measures in this cate
The ratings for items in this assessment were:
Meets StandardSchools received a rating of “Meets Standard” if Commission received the required
by the end of the POPA review period, if applicable, or was approved for an extension,school either had no unaddressed Notices of Deficiency pertaining to the measureschool was addressing a Notice of Deficiency 120F57F
58 through a Corrective Action Plan that approved by the Commission.
Does Not Meet StandardSchools received a rating of “ Does Not Meet S tandard” if required documentation wa
after the POPA review period. In addition, for certain tasks, such as the posting of governboard meeting agendas and minutes, a school received a rating of “Does Not Meet the school did not meet the requirements set forth in law. 121F58F
59 As to the required finastatements, due to the shortened evaluation period, only schools with more than one latefinancial requirement received a rating of “ Does Not Meet S tandard.”
Falls Far Below Standard
Schools received a rating of “ Falls Far Below Standard” if the Commission never recinformation, and the school did not receive an extension, or if the school had any unNotices of Deficiency pertaining to the measure.
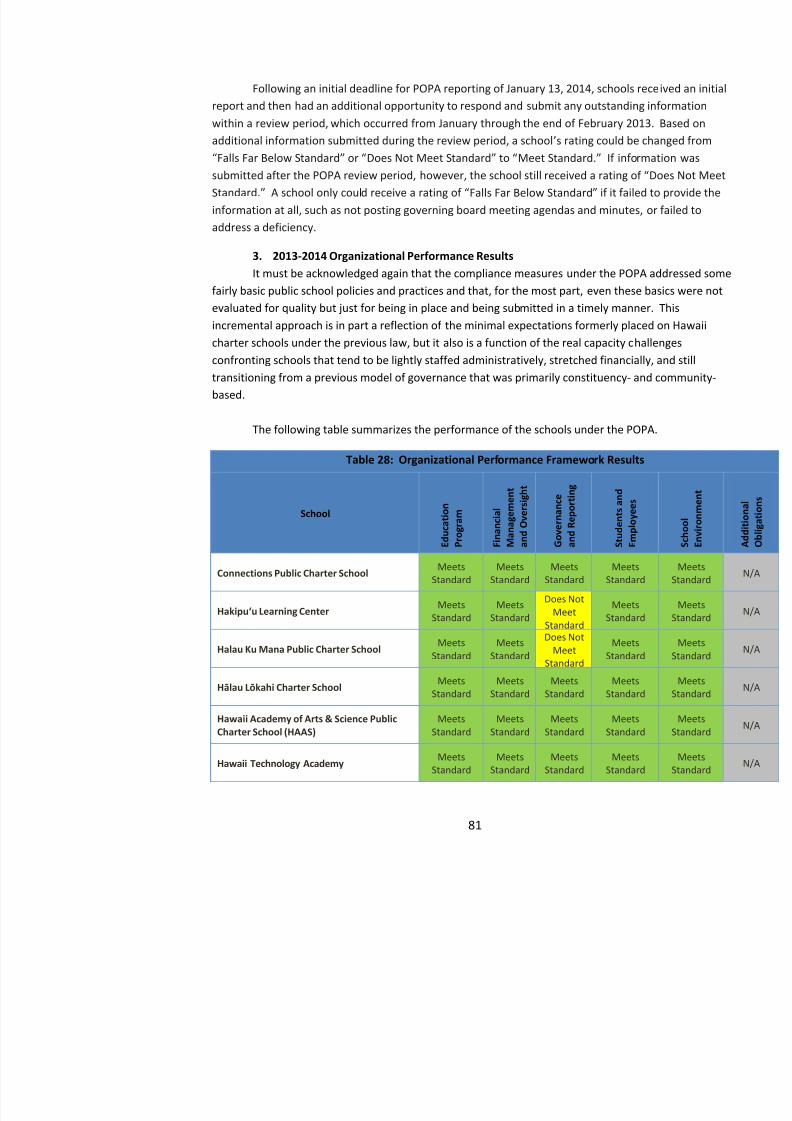
8/10/2019 Hawaii charter schools annual report
http://slidepdf.com/reader/full/hawaii-charter-schools-annual-report 84/268
Table 28: Organizational Performance Framework Results
o n
a le m
e n t
e r s i g h t
a n c e
o r t i n g
t s a n
d
e e s
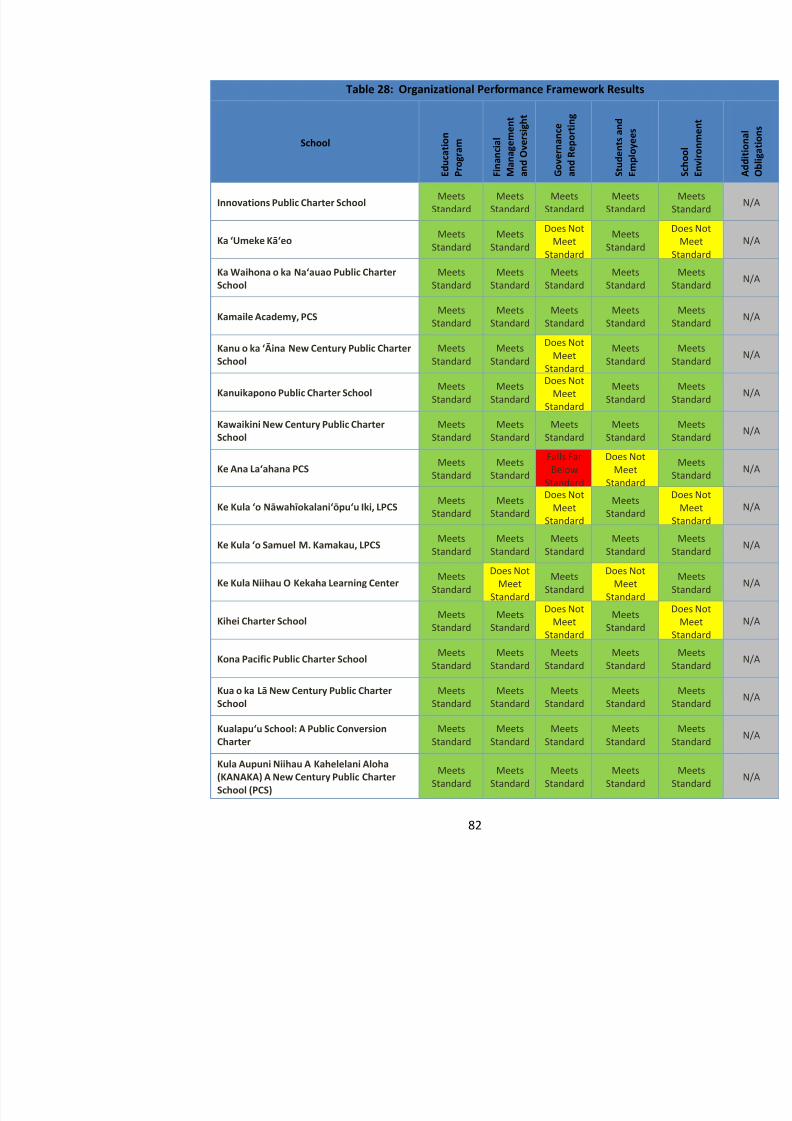
8/10/2019 Hawaii charter schools annual report
http://slidepdf.com/reader/full/hawaii-charter-schools-annual-report 85/268
School
E d u c a t i
P r o g r a m
F i n a n c i
M a n a g e
a n d O v
G o v e r n
a n d R e p
S t u d e n
E m p
l o y
Innovations Public Charter SchoolMeets
StandardMeets
StandardMeets
StandardMeets
Standard
Ka ‘Umeke Kā‘eo MeetsStandard
MeetsStandard
Does NotMeet
Standard
MeetsStandard
Ka Waihona o ka Na‘auao Public CharterSchool
MeetsStandard
MeetsStandard
MeetsStandard
MeetsStandard
Kamaile Academy, PCSMeets
StandardMeets
StandardMeets
StandardMeets
Standard
Kanu o ka ‘Āina New Century Public CharterSchool
MeetsStandard
MeetsStandard
Does NotMeet
Standard
MeetsStandard
Kanuikapono Public Charter School MeetsStandard
MeetsStandard
Does NotMeet
StandardMeets
Standard
Kawaikini New Century Public CharterSchool
MeetsStandard
MeetsStandard
MeetsStandard
MeetsStandard
Ke Ana La‘ahana PCS MeetsStandard
MeetsStandard
Falls FarBelow
Standard
Does NotMeet
Standard
Ke Kula ‘o Nāwahīokalani‘ōpu‘u Iki, LPCS Meets
StandardMeets
Standard
Does Not
MeetStandard
MeetsStandard
Ke Kula ‘o Samuel M. Kamakau, LPCS MeetsStandard
MeetsStandard
MeetsStandard
MeetsStandard
Ke Kula Niihau O Kekaha Learning CenterMeets
Standard
Does NotMeet
Standard
MeetsStandard
Does NotMeet
Standard
Kihei Charter SchoolMeets
Standard
Meets
Standard
Does NotMeet
Standard
Meets
Standard
Kona Pacific Public Charter SchoolMeets
StandardMeets
StandardMeets
StandardMeets
Standard
K k Lā N C P bli Ch
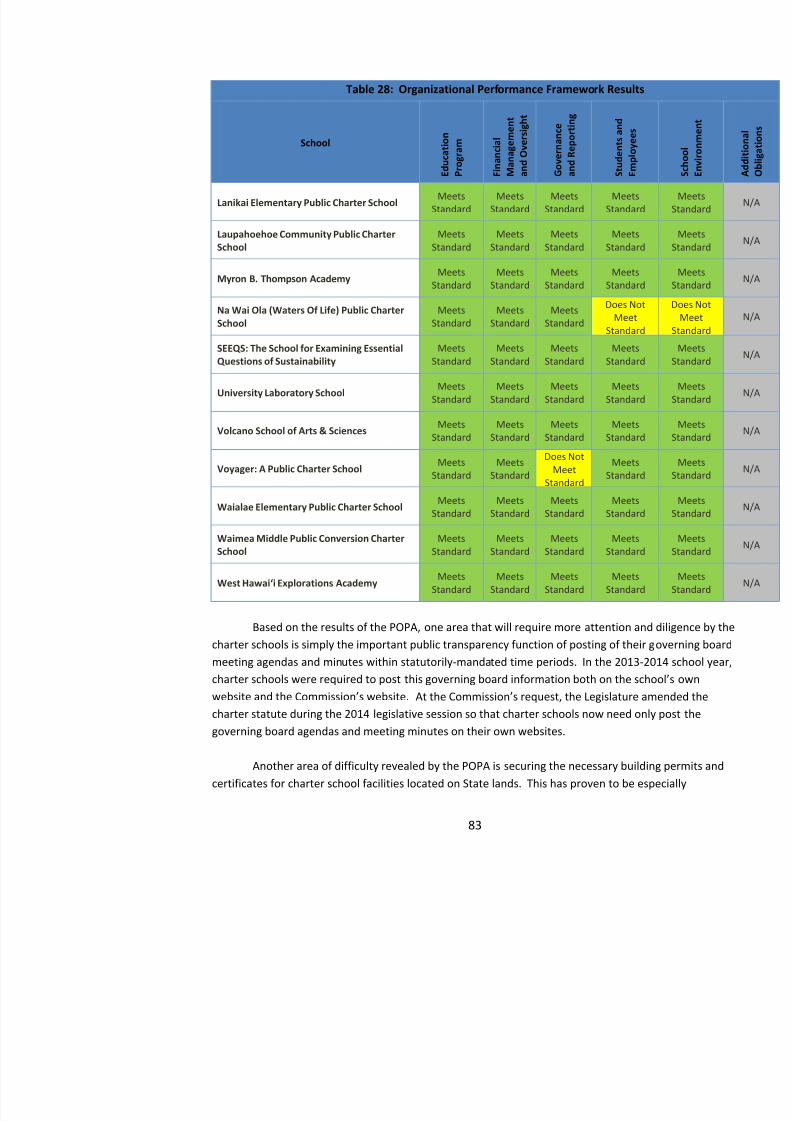
8/10/2019 Hawaii charter schools annual report
http://slidepdf.com/reader/full/hawaii-charter-schools-annual-report 86/268
challenging for charter schools that are using older State facilities, as it requires the collaboration ocharter schools, the Commission, and various other State agencies.
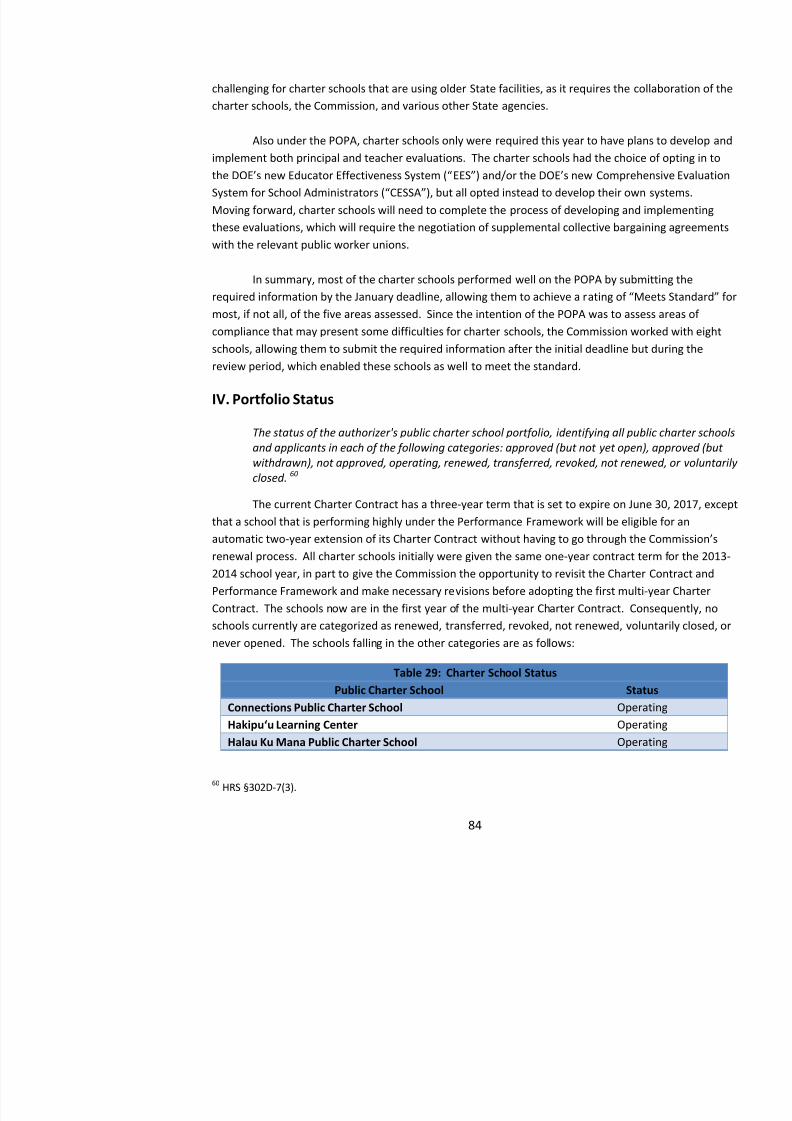
8/10/2019 Hawaii charter schools annual report
http://slidepdf.com/reader/full/hawaii-charter-schools-annual-report 87/268
Also under the POPA, charter schools only were required this year to have plans to develoimplement both principal and teacher evaluations. The charter schools had the choice of opting in the DOE’s new Educator Effectiveness System (“ EES”) and/or the DOE’s new ComprehensivSystem for School Administrators (“CESSA”), but all opted instead to develop their own sysMoving forward, charter schools will need to complete the process of developing and implementinthese evaluations, which will require the negotiation of supplemental collective bargaining agreemewith the relevant public worker unions.
In summary, most of the charter schools performed well on the POPA by submitting therequired information by the January deadline, allowing them to achieve a rating of “Meets most, if not all, of the five areas assessed. Since the intention of the POPA was to assess areas ofcompliance that may present some difficulties for charter schools, the Commission worked with eigschools, allowing them to submit the required information after the initial deadline but during thereview period, which enabled these schools as well to meet the standard.
IV. 5B4BPortfolio Status
The status of the authorizer's public charter school portfolio, identifying all public charter schooand applicants in each of the following categories: approved (but not yet open), approved (butwithdrawn), not approved, operating, renewed, transferred, revoked, not renewed, or voluntarilyclosed.
122F59F
60
The current Charter Contract has a three-year term that is set to expire on June 30, 2017, ethat a school that is performing highly under the Performance Framework will be eligible for anautomatic two-year extension of its Charter Contract without havi ng to go through the Comrenewal process. All charter schools initially were given the same one-year contract term for the 22014 school year, in part to give the Commission the opportunity to revisit the Charter Contract anPerformance Framework and make necessary revisions before adopting the first multi-year CharterContract. The schools now are in the first year of the multi-year Charter Contract. Consequently,
schools currently are categorized as renewed, transferred, revoked, not renewed, voluntarily closednever opened. The schools falling in the other categories are as follows:
Table 29: Charter School StatusP bli Ch S h l S
Table 29: Charter School StatusPublic Charter School Status
Hālau Lōkahi Charter School Operating
H ii A d f A & S i P bli Ch S h l O i
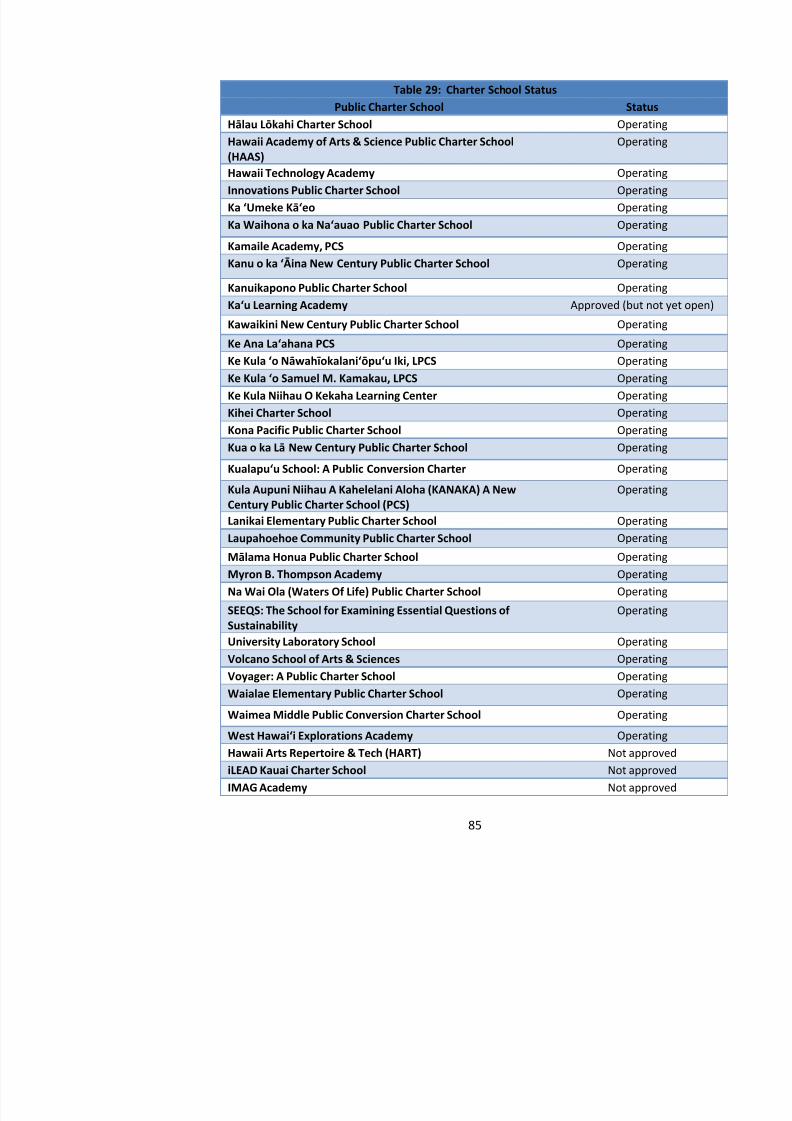
8/10/2019 Hawaii charter schools annual report
http://slidepdf.com/reader/full/hawaii-charter-schools-annual-report 88/268
Hawaii Academy of Arts & Science Public Charter School(HAAS) Operating
Hawaii Technology Academy OperatingInnovations Public Charter School OperatingKa ‘Umeke Kā‘eo OperatingKa Waihona o ka Na‘auao Public Charter School Operating
Kamaile Academy, PCS Operating
Kanu o ka ‘Āina New Century Public Charter School OperatingKanuikapono Public Charter School OperatingKa‘u Learning Academy Approved (but not y
Kawaikini New Century Public Charter School Operating
Ke Ana La‘ahana PCS OperatingKe Kula ‘o Nāwahīokalani‘ōpu‘u Iki, LPCS OperatingKe Kula ‘o Samuel M. Kamakau, LPCS OperatingKe Kula Niihau O Kekaha Learning Center OperatingKihei Charter School OperatingKona Pacific Public Charter School OperatingKua o ka Lā New Century Public Charter School Operating
Kualapu‘u School: A Public Conversion Charter Operating
Kula Aupuni Niihau A Kahelelani Aloha (KANAKA) A New
Century Public Charter School (PCS)
Operating
Lanikai Elementary Public Charter School OperatingLaupahoehoe Community Public Charter School Operating
Mālama Honua Public Charter School OperatingMyron B. Thompson Academy OperatingNa Wai Ola (Waters Of Life) Public Charter School Operating
SEEQS: The School for Examining Essential Questions of
Sustainability
Operating
University Laboratory School OperatingVolcano School of Arts & Sciences OperatingVoyager: A Public Charter School Operating
Table 29: Charter School StatusPublic Charter School Status
Montessori of O‘ahu Public Charter School Not approve
North Shore Middle School N t
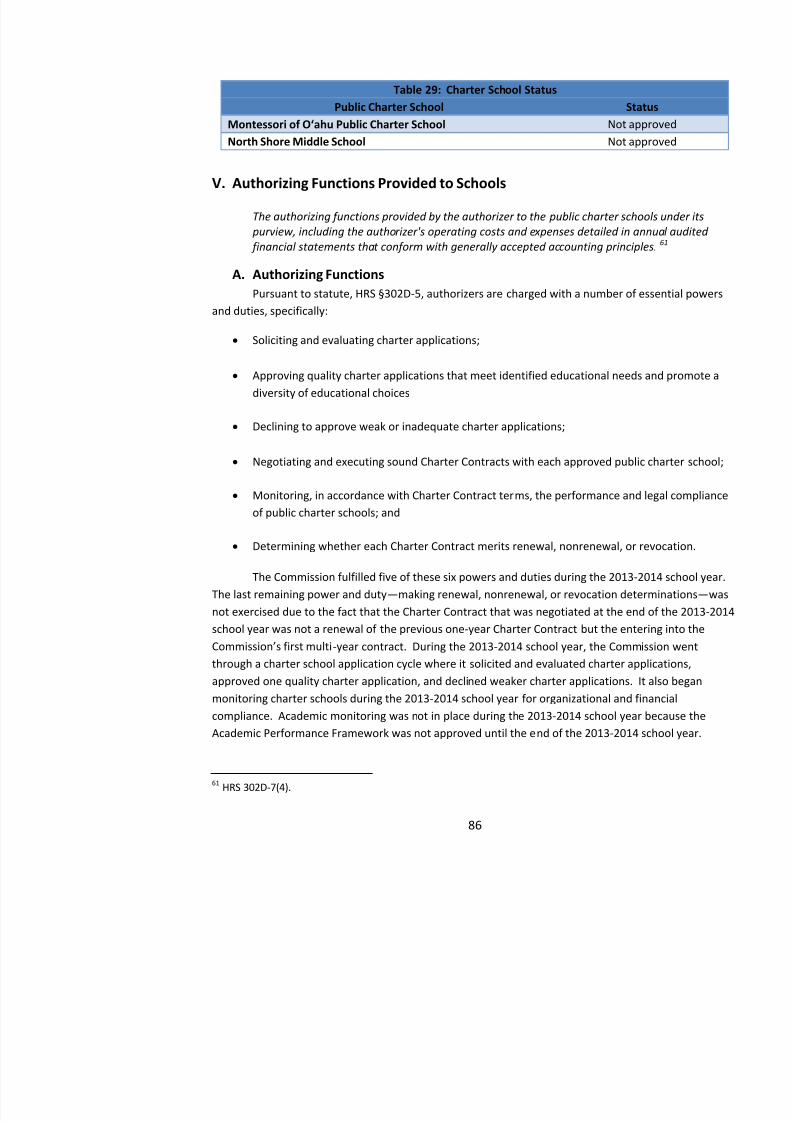
8/10/2019 Hawaii charter schools annual report
http://slidepdf.com/reader/full/hawaii-charter-schools-annual-report 89/268
North Shore Middle School Not approve
V. 6B5BAuthorizing Functions Provided to Schools
The authorizing functions provided by the authorizer to the public charter schools under its purview, including the authorizer's operating costs and expenses detailed in annual audited financial statements that conform with generally accepted accounting principles.
123F60F
6
A. 15B14BAuthorizing FunctionsPursuant to statute, HRS §302D-5, authorizers are charged with a number of essential pow
and duties, specifically:
Soliciting and evaluating charter applications;
Approving quality charter applications that meet identified educational needs and promote
diversity of educational choices
Declining to approve weak or inadequate charter applications;
Negotiating and executing sound Charter Contracts with each approved public charter sch
Monitoring, in accordance with Charter Contract terms, the performance and legal compli
of public charter schools; and
Determining whether each Charter Contract merits renewal, nonrenewal, or revocation.
The Commission fulfilled five of these six powers and duties during the 2013-2014 schoolThe last remaining power and duty —making renewal, nonrenewal, or revocation determinationnot exercised due to the fact that the Charter Contract that was negotiated at the end of the 2013-20
school year was not a renewal of the previous one-year Charter Contract but the entering into theCommission’s first multi-year contract. During the 2013-2014 school year, the Commission wenthrough a charter school application cycle where it solicited and evaluated charter applications,approved one quality charter application, and declined weaker charter applications. It also began
The Commission, as an authorizer, is also statutorily charged with:
Acting as the point of contact between the DOE and charter schools;
Being responsible for and ensuring the compliance of a charter school with all applicable s
8/10/2019 Hawaii charter schools annual report
http://slidepdf.com/reader/full/hawaii-charter-schools-annual-report 90/268
Being responsible for and ensuring the compliance of a charter school with all applicable sand federal laws, including reporting requirements;
Being responsible for the receipt of applicable federal funds from DOE and the distributiofunds to the charter schools; and
Being responsible for the receipt and distribution of per-pupil funding from the DepartmenBudget and Finance. 124F61F
62
In addition to fulfilling its statutorily charged duties, the Commission also provides humanresources support for schools that do not purchase payroll and human resources from DOE, providefederal program support, acts as a point of contact between other State agencies (such as theDepartment of Human Resources Development, the Hawaii Employees’ Retirement System,Hawaii Employer-Union Health Benefits Trust Fund), serves as a point of contact for charter schoosector-wide issues relating to unions, and provides information systems support for schools, among
other functions. The Commission is evaluating the functions it provides to charter schools anddetermining whether and to what degree any of these functions conflict with the Commissiauthorizer. The Commission has continued to provide many functions, such as payroll and humanresources support so that charter schools could continue to operate seamlessly. However, theCommission is exploring ways to increase capacity in the schools to ensure that schools or other thparties can assume some of these necessary non-authorizer functions.
B. 16B15B
Authorizer’s Operating Costs and Expenses Attached as Appendix G is the Commission’s 2013-2014 financial audit report, which
with generally accepted accounting principles. The Commission’s audit report was prepareJennings, CPA, Inc. The financial audit resulted in net operating loss of $615,576. This loss includdistribution to schools of approximately $477,000 of budget savings the Commission realized fromaccumulated Charter School Administrative Office (“CSAO”) funding and approximately $120expenses for transitioning the CSAO into Commission staff. 62F
63
This year’s audit resulted in a finding regarding compliance with U.S. Office of ManBudget Circular A 133 that, as a pass through entity, the Commission issue a management decisionaudit decisions on audit findings within six months after receipt of the sub-reci pient’s (cha
VI. 7B6BAuthorizer Services Purchased by Charter Schools
The services purchased from the authorizer by the public charter schools under its purview.
No services were purchased from the Commission by charter schools in the 2013-2014 fis
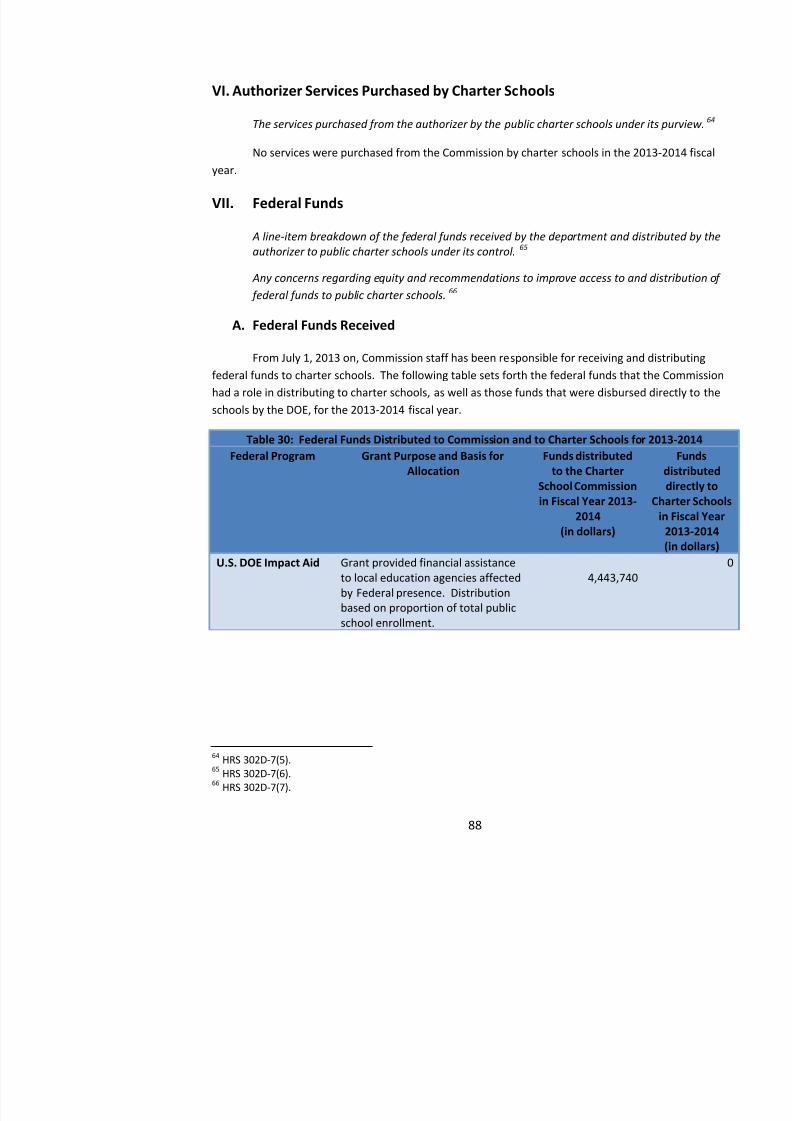
8/10/2019 Hawaii charter schools annual report
http://slidepdf.com/reader/full/hawaii-charter-schools-annual-report 91/268
No services were purchased from the Commission by charter schools in the 2013-2014 fisyear.
VII. 8B7BFederal Funds
A line-item breakdown of the federal funds received by the department and distributed by theauthorizer to public charter schools under its control.
126F64F
65
Any concerns regarding equity and recommendations to improve access to and distribution of federal funds to public charter schools.
127F65F
66
A. 17B16BFederal Funds Received
From July 1, 2013 on, Commission staff has been responsible for receiving and distributinfederal funds to charter schools. The following table sets forth the federal funds that the Commissi
had a role in distributing to charter schools, as well as those funds that were disbursed directly to thschools by the DOE, for the 2013-2014 fiscal year.
Table 30: Federal Funds Distributed to Commission and to Charter Schools for 2013-2014Federal Program Grant Purpose and Basis for
AllocationFunds distributed
to the CharterSchool Commissionin Fiscal Year 2013-
2014(in dollars)
Chin
U.S. DOE Impact Aid Grant provided financial assistanceto local education agencies affectedby Federal presence. Distributionbased on proportion of total publicschool enrollment.
4,443,740
Table 30: Federal Funds Distributed to Commission and to Charter Schools for 2013-2014Federal Program Grant Purpose and Basis for
AllocationFunds distributed
to the CharterSchool Commissionin Fiscal Year 2013- Ch
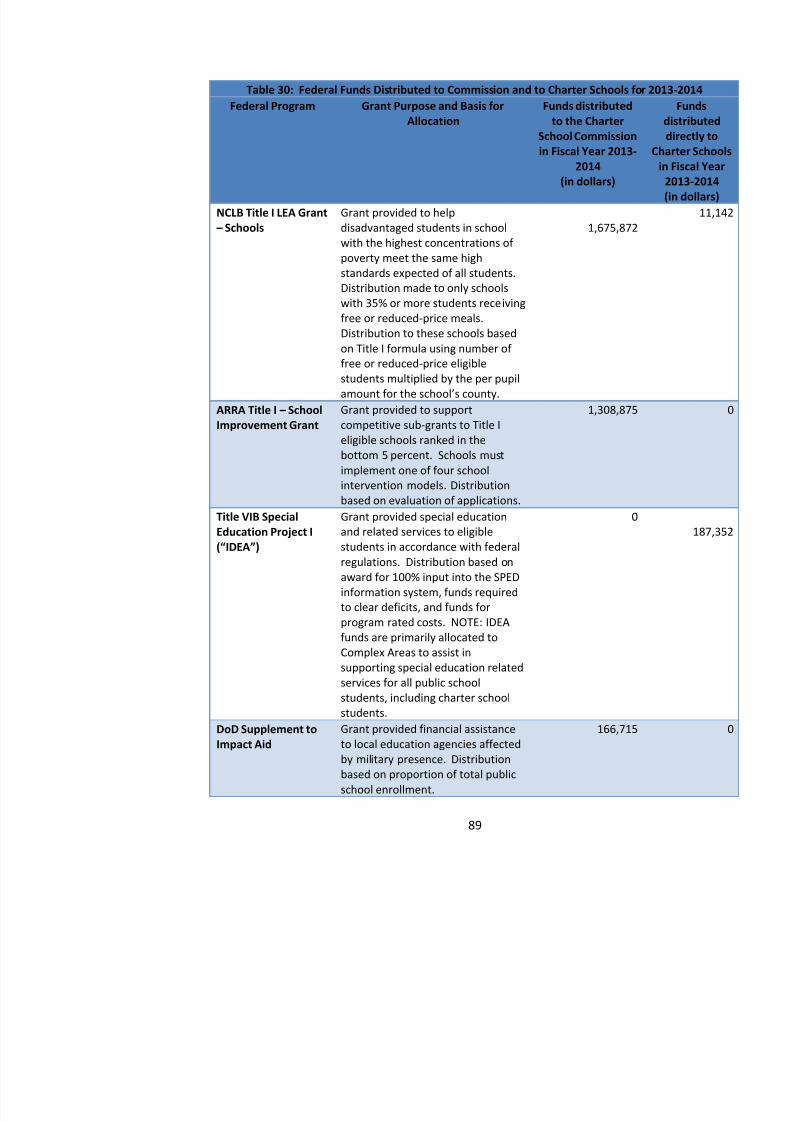
8/10/2019 Hawaii charter schools annual report
http://slidepdf.com/reader/full/hawaii-charter-schools-annual-report 92/268
in Fiscal Year 20132014
(in dollars)
Chin
NCLB Title I LEA Grant – Schools
Grant provided to helpdisadvantaged students in schoolwith the highest concentrations ofpoverty meet the same highstandards expected of all students.Distribution made to only schoolswith 35% or more students receivingfree or reduced-price meals.Distribution to these schools basedon Title I formula using number offree or reduced-price eligiblestudents multiplied by the per pupilamount for the school’s county.
1,675,872
ARRA Title I – SchoolImprovement Grant
Grant provided to supportcompetitive sub-grants to Title Ieligible schools ranked in thebottom 5 percent. Schools mustimplement one of four schoolintervention models. Distributionbased on evaluation of applications.
1,308,875
Title VIB SpecialEducation Project I(“IDEA”)
Grant provided special educationand related services to eligiblestudents in accordance with federalregulations. Distribution based onaward for 100% input into the SPEDinformation system, funds requiredto clear deficits, and funds forprogram rated costs. NOTE: IDEAfunds are primarily allocated toComplex Areas to assist insupporting special education relatedservices for all public school
0
Table 30: Federal Funds Distributed to Commission and to Charter Schools for 2013-2014Federal Program Grant Purpose and Basis for
AllocationFunds distributed
to the CharterSchool Commissionin Fiscal Year 2013- Ch
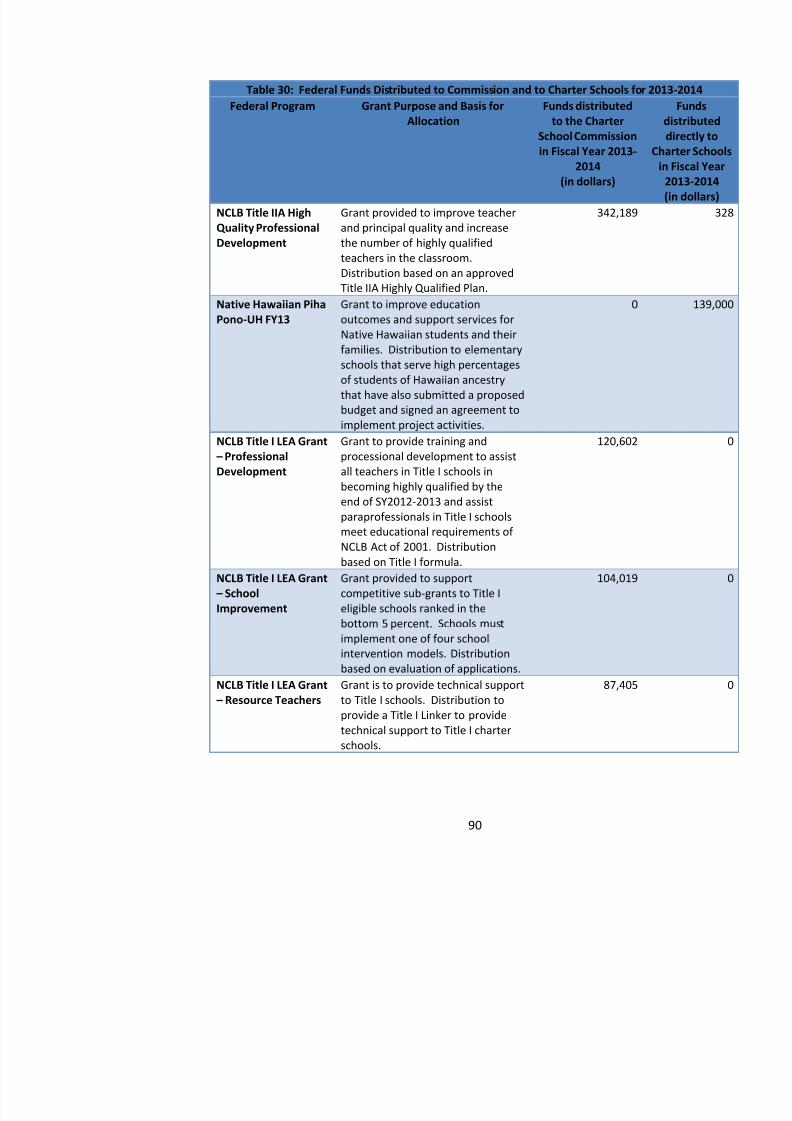
8/10/2019 Hawaii charter schools annual report
http://slidepdf.com/reader/full/hawaii-charter-schools-annual-report 93/268
2014(in dollars)
in
NCLB Title IIA HighQuality ProfessionalDevelopment
Grant provided to improve teacherand principal quality and increasethe number of highly qualifiedteachers in the classroom.Distribution based on an approvedTitle IIA Highly Qualified Plan.
342,189
Native Hawaiian PihaPono-UH FY13
Grant to improve educationoutcomes and support services forNative Hawaiian students and theirfamilies. Distribution to elementaryschools that serve high percentagesof students of Hawaiian ancestrythat have also submitted a proposedbudget and signed an agreement toimplement project activities.
0
NCLB Title I LEA Grant – ProfessionalDevelopment
Grant to provide training andprocessional development to assistall teachers in Title I schools inbecoming highly qualified by theend of SY2012-2013 and assistparaprofessionals in Title I schoolsmeet educational requirements ofNCLB Act of 2001. Distributionbased on Title I formula.
120,602
NCLB Title I LEA Grant – SchoolImprovement
Grant provided to supportcompetitive sub-grants to Title Ieligible schools ranked in thebottom 5 percent. Schools mustimplement one of four schoolintervention models. Distributionbased on evaluation of applications.
104,019
NCLB Title I LEA Grant Grant is to provide technical support 87 405
Table 30: Federal Funds Distributed to Commission and to Charter Schools for 2013-2014Federal Program Grant Purpose and Basis for
AllocationFunds distributed
to the CharterSchool Commissionin Fiscal Year 2013- Ch
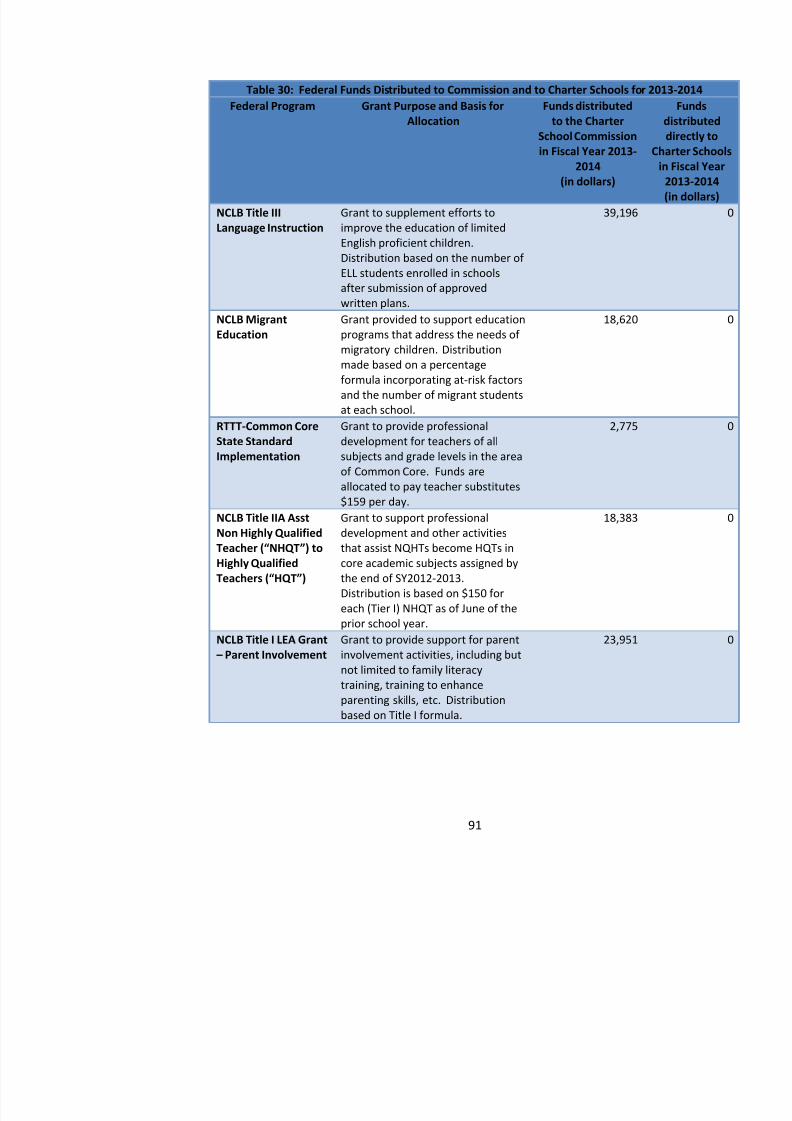
8/10/2019 Hawaii charter schools annual report
http://slidepdf.com/reader/full/hawaii-charter-schools-annual-report 94/268
2014(in dollars)
in
NCLB Title IIILanguage Instruction
Grant to supplement efforts toimprove the education of limitedEnglish proficient children.Distribution based on the number ofELL students enrolled in schoolsafter submission of approvedwritten plans.
39,196
NCLB MigrantEducation
Grant provided to support educationprograms that address the needs ofmigratory children. Distributionmade based on a percentageformula incorporating at-risk factorsand the number of migrant studentsat each school.
18,620
RTTT-Common CoreState StandardImplementation
Grant to provide professionaldevelopment for teachers of allsubjects and grade levels in the areaof Common Core. Funds areallocated to pay teacher substitutes$159 per day.
2,775
NCLB Title IIA AsstNon Highly QualifiedTeacher ( “NHQT”) toHighly QualifiedTeachers ( “HQT”)
Grant to support professionaldevelopment and other activitiesthat assist NQHTs become HQTs incore academic subjects assigned bythe end of SY2012-2013.Distribution is based on $150 foreach (Tier I) NHQT as of June of theprior school year.
18,383
NCLB Title I LEA Grant – Parent Involvement
Grant to provide support for parentinvolvement activities, including butnot limited to family literacytraining training to enhance
23,951
Table 30: Federal Funds Distributed to Commission and to Charter Schools for 2013-2014Federal Program Grant Purpose and Basis for
AllocationFunds distributed
to the CharterSchool Commissionin Fiscal Year 2013- Ch
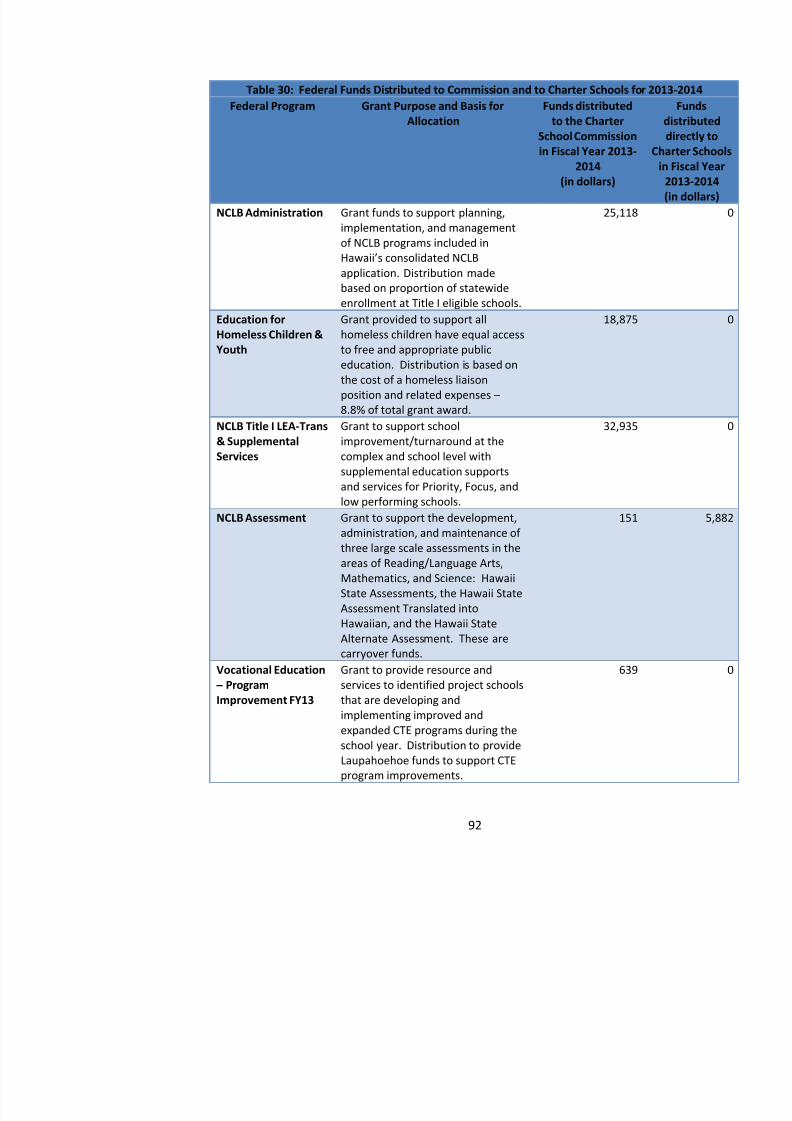
8/10/2019 Hawaii charter schools annual report
http://slidepdf.com/reader/full/hawaii-charter-schools-annual-report 95/268
2014(in dollars)
in
NCLB Administration Grant funds to support planning,implementation, and managementof NCLB programs included inHawaii’s consolidated NCLBapplication. Distribution madebased on proportion of statewideenrollment at Title I eligible schools.
25,118
Education forHomeless Children &Youth
Grant provided to support allhomeless children have equal accessto free and appropriate publiceducation. Distribution is based onthe cost of a homeless liaisonposition and related expenses – 8.8% of total grant award.
18,875
NCLB Title I LEA-Trans& SupplementalServices
Grant to support schoolimprovement/turnaround at thecomplex and school level withsupplemental education supportsand services for Priority, Focus, andlow performing schools.
32,935
NCLB Assessment Grant to support the development,administration, and maintenance ofthree large scale assessments in theareas of Reading/Language Arts,Mathematics, and Science: HawaiiState Assessments, the Hawaii StateAssessment Translated intoHawaiian, and the Hawaii StateAlternate Assessment. These arecarryover funds.
151
Vocational Education– Program
Grant to provide resource andservices to identified project schools
639
Table 30: Federal Funds Distributed to Commission and to Charter Schools for 2013-2014Federal Program Grant Purpose and Basis for
AllocationFunds distributed
to the CharterSchool Commission
in Fiscal Year 2013-2014
Chi
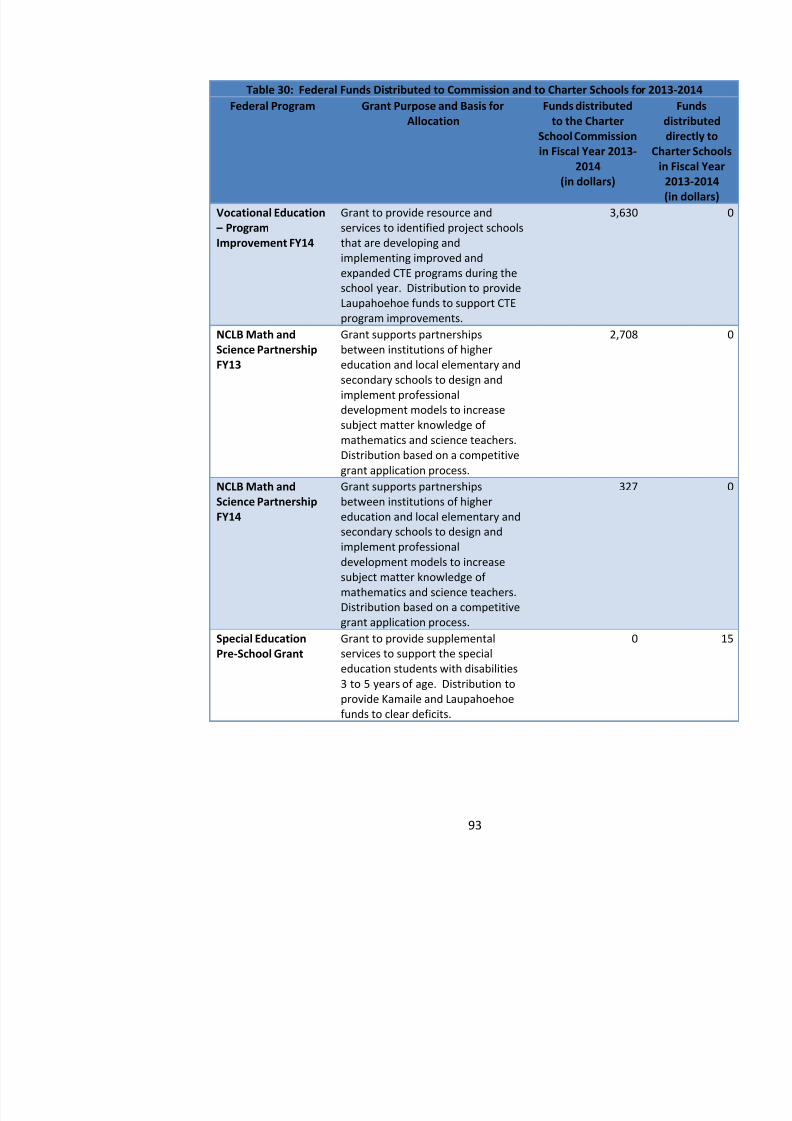
8/10/2019 Hawaii charter schools annual report
http://slidepdf.com/reader/full/hawaii-charter-schools-annual-report 96/268
2014(in dollars)
in
Vocational Education – ProgramImprovement FY14
Grant to provide resource andservices to identified project schoolsthat are developing andimplementing improved andexpanded CTE programs during theschool year. Distribution to provideLaupahoehoe funds to support CTEprogram improvements.
3,630
NCLB Math andScience PartnershipFY13
Grant supports partnershipsbetween institutions of highereducation and local elementary andsecondary schools to design andimplement professionaldevelopment models to increasesubject matter knowledge ofmathematics and science teachers.Distribution based on a competitivegrant application process.
2,708
NCLB Math andScience PartnershipFY14
Grant supports partnershipsbetween institutions of highereducation and local elementary andsecondary schools to design andimplement professionaldevelopment models to increasesubject matter knowledge ofmathematics and science teachers.Distribution based on a competitivegrant application process.
327
Special EducationPre-School Grant
Grant to provide supplementalservices to support the specialeducation students with disabilities3 to 5 years of age. Distribution to
0
Table 30: Federal Funds Distributed to Commission and to Charter Schools for 2013-2014Federal Program Grant Purpose and Basis for
AllocationFunds distributed
to the CharterSchool Commission
in Fiscal Year 2013-2014
Chi
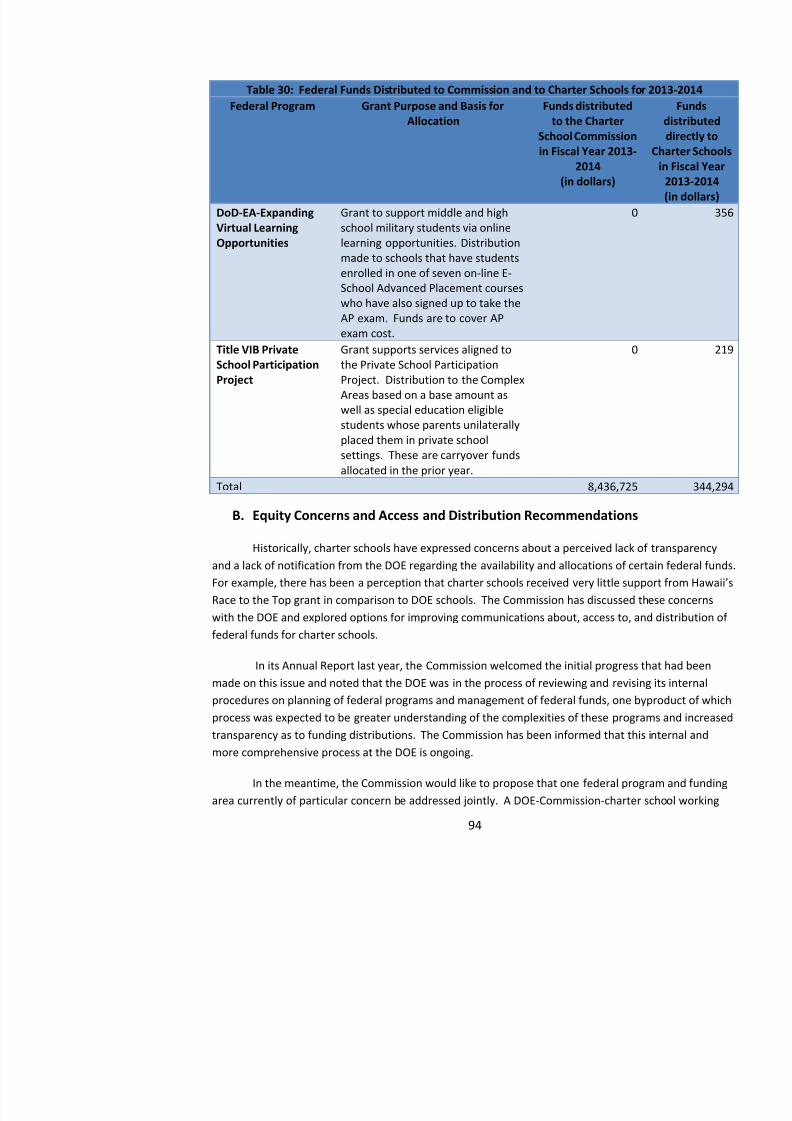
8/10/2019 Hawaii charter schools annual report
http://slidepdf.com/reader/full/hawaii-charter-schools-annual-report 97/268
2014(in dollars)
in
DoD-EA-ExpandingVirtual LearningOpportunities
Grant to support middle and highschool military students via onlinelearning opportunities. Distributionmade to schools that have studentsenrolled in one of seven on-line E-School Advanced Placement courseswho have also signed up to take theAP exam. Funds are to cover APexam cost.
0
Title VIB PrivateSchool ParticipationProject
Grant supports services aligned tothe Private School ParticipationProject. Distribution to the ComplexAreas based on a base amount aswell as special education eligiblestudents whose parents unilaterallyplaced them in private schoolsettings. These are carryover fundsallocated in the prior year.
0
Total 8,436,725
B. 18B17BEquity Concerns and Access and Distribution Recommendations
Historically, charter schools have expressed concerns about a perceived lack of transparenand a lack of notification from the DOE regarding the availability and allocations of certain federalFor example, there has been a perception that charter schools received very little support fromRace to the Top grant in comparison to DOE schools. The Commission has discussed these concerwith the DOE and explored options for improving communications about, access to, and distributio
federal funds for charter schools.
In its Annual Report last year, the Commission welcomed the initial progress that had beemade on this issue and noted that the DOE was in the process of reviewing and revising its internal
group already has commenced work on updating informational guidance and resources on specialeducation in charter schools. The group has discussed addressing in its work the process by whichspecial education positions and other resources are allocated to all public schools, DOE and charterCommission would recommend that the working group be tasked with this function and be providewhatever information and support from the DOE, the Commission, and the charter schools as may
8/10/2019 Hawaii charter schools annual report
http://slidepdf.com/reader/full/hawaii-charter-schools-annual-report 98/268
needed to fulfill this task. If appropriate, the group would make recommendations for improving thprocess or for improving the transparency and understanding of that process.
If this approach to clarification of this program area proves successful, it could serve as a mfor clarifying other federal programs on a case-by-case basis.
VIII. 9B8BConclusion
Events during and since the 2013-2014 school year have continued to highlight both thesuccesses and strengths of Hawaii ’s charter school system as well as its continued challengeweaknesses. Difficult but relatively rapid progress continues to be made, despite some setbacks, torealizing the vision of Act 130 for a vigorous and accountable chartering system.
Among the Commission’s priorities during the 2014 -2015 fiscal year are:
Continuing to gain experience with, and refining as necessary, the Academic, Organizand Financial Performance Frameworks;
Engaging with the DOE in discussions over potential revisions to Strive HI and the ondevelopment of an educational infrastructure that fully reflects the fact that Hawaii haofficial languages;
Developing the process and criteria for automatic extensions of Charter Contracts andcontract renewal;
Successfully implementing the new charter school start-up process, as well as a revisephased application process;
Continuing to improve the public transparency of charter schools and the Commission
Exploring with other stakeholders ways to address capacity challenges among the chai l l i i i f h C i i ’
Improving engagement with charter school governing boards in recognition of theirincreased importance to accountability and school capacity under Act 130;
Reviewing and approving the admissions and enrollment policies and practices of all schools;
8/10/2019 Hawaii charter schools annual report
http://slidepdf.com/reader/full/hawaii-charter-schools-annual-report 99/268
Working with the Hawaii Teacher Standards Board to address teacher licensure issuescharter schools; and
Collaborating with the charter schools, other State agencies, and stakeholders to ensurthat compliance requirements are properly communicated in a timely manner and tominimize duplicative reporting requirements.
As these and other measures are taken to build upon the difficult work already completed,Commission looks forward to being able to report continued improvement in the outcomes detailedits annual reports in the years to come.
IX. 10B9BGlossary of Defined Terms
Term DefinitionAcademic Performance Framework The framework described in Section III.A.1.ACT The 11 th grade assessment mandated by Strive HI to
determine college readiness.Act 130 Act 130 of the 2012 Session Laws of HawaiiARRA Federal American Recovery and Reinvestment Act of
2009Blended School A school where the education of a student occurs inboth an online environment and brick and mortarsetting.
BOE State of Hawaii Board of EducationCharter Contract State Public Charter School ContractCommission State Public Charter School CommissionCSAO Charter School Administrative Office
DOE State of Hawaii Department of EducationELL English Language Learners, a student subgroup that is
made up of students with limited English proficiency.ESEA Federal Elementary and Secondary Education Act of
Term DefinitionFERPA Family Educational Rights and Privacy Act, a federal la
that protects the privacy of student education recordsand applies to all schools that receive funds under an
applicable program of the U.S. Department of EducatioFinancial Performance Framework The framework described in Section III B 1
8/10/2019 Hawaii charter schools annual report
http://slidepdf.com/reader/full/hawaii-charter-schools-annual-report 100/268
Financial Performance Framework The framework described in Section III.B.1.FRL Free and Reduced Lunch, a student subgroup that is
made up of economically disadvantaged students.High Needs Students Students that are classified as FRL, ELL or special
education.HQT Highly Qualified TeacherHRS Hawaii Revised StatutesHSA Hawaii State AssessmentHSTA Hawaii State Teachers AssociationLDS Longitudinal Data SystemIDEA Federal Individuals with Disabilities Education ActLEA Local Education AgencyNACSA National Association of Charter School AuthorizersNCLB No Child Left Behind
NHQT Non-Highly Qualified TeacherNon-High Needs Students Students that are not classified as High-Needs.Organizational PerformanceFramework
The framework described in Section III.C.1.
Performance Framework The Commission’s accountability system, consistingthe Academic Performance Framework, FinancialPerformance Framework, and OrganizationalPerformance Framework.
PLAN A test taken in the 10 th grade to measure academicprogress in high school.
School-Specific Measures School- specific indicators to measure the school’sacademic performance
SGP Student Growth Percentile, growth measure used tocompare students to their academic peers.
SIG School Improvement Grant, grants awarded by the U.SDepartment of Education to make grants to localeducational agencies that “demonstrate the greatestneed for the funds and the strongest commitment to usethe funds to provide adequate resources in order toraise substantially the achievement of students in their
Term DefinitionTask Force The charter school governance, accountability, and
authority task force.UPW United Public Workers
Virtual School A school where the students enrolled in the schoolcomplete their curriculum online, in a web-based
8/10/2019 Hawaii charter schools annual report
http://slidepdf.com/reader/full/hawaii-charter-schools-annual-report 101/268
complete their curriculum online, in a web basedenvironment rather than attending school in a brick-andmortar setting.
WASC Western Association of Schools and Colleges
X. 11B10B
AppendicesAppendix A: Performance Framework - Individual School Performance SummariesAppendix B: Strive HI Individual School Performance ReportsAppendix C: Comparison of Statewide Averages and Charter School-Wide AveragesAppendix D: Financial Performance Framework for 2014-2017 Charter ContractAppendix E: Organizational Performance Framework for 2014-2017 Charter ContractAppendix F: Academic Performance Framework for 2014-2017 Charter ContractAppendix G: Commission ’s Audited Financial Statements for FY 2013-2014
27BGI
28B29B
29BAppendix A: Performance Framework - Individual School Performance Summaries
8/10/2019 Hawaii charter schools annual report
http://slidepdf.com/reader/full/hawaii-charter-schools-annual-report 102/268
Connections Public Charter SchoolHawaii State Public Charter School Commission – Annual Report 2014
Mission: Our mission is to create an ‘ohana which is conducive to the recognition and development of individual talents. Thematexperiential learning experiences are provided which focus on how students construct knowledge using creative and critical thinking. the development of the ability to recognize and differentiate a quality result or product is offered. Classroom experiences are connectelife experiences so that students can grow in the understanding of themselves in relation to their community and the world.
Notes: None
Board Chairperson(s): Tierney McClary Total Enrollment: 359 Strive HI API Score: 23
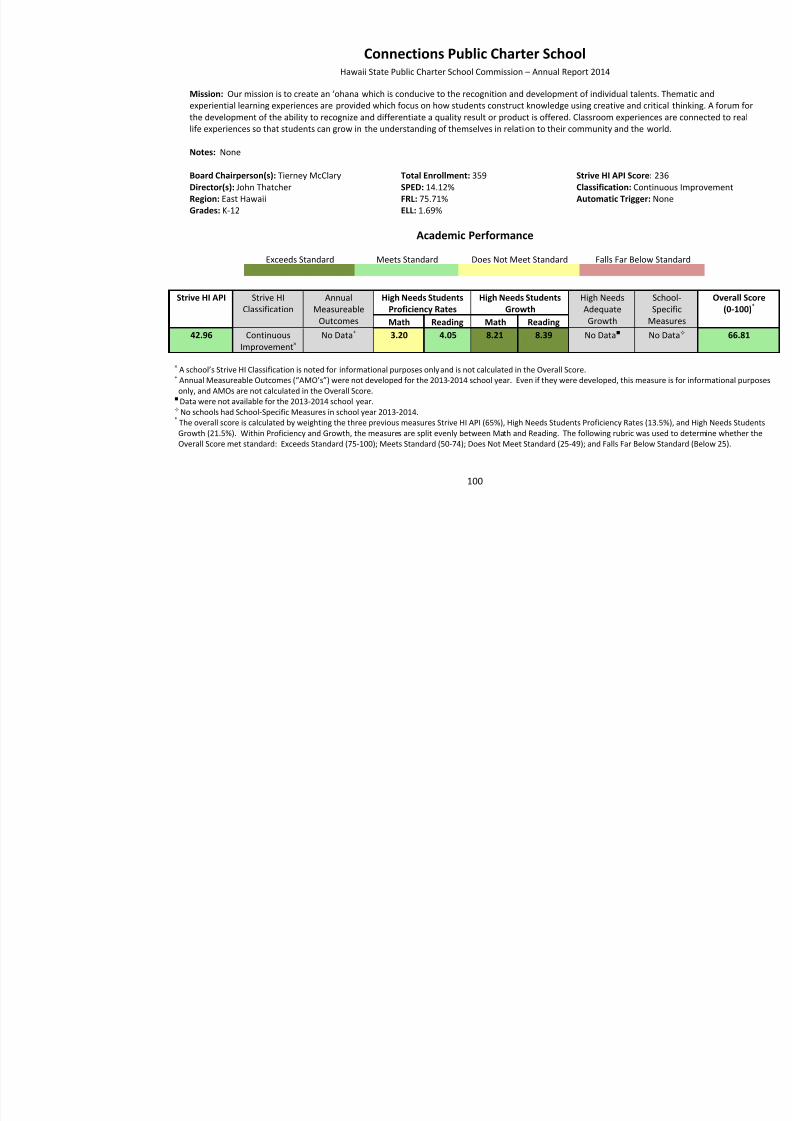
8/10/2019 Hawaii charter schools annual report
http://slidepdf.com/reader/full/hawaii-charter-schools-annual-report 103/268
100
Board Chairperson(s): Tierney McClaryDirector(s): John ThatcherRegion: East HawaiiGrades: K-12
Total Enrollment: 359SPED: 14.12%FRL: 75.71%ELL: 1.69%
Strive HI API Score: 23Classification: ContinuAutomatic Trigger: No
Academic Performance
Exceeds Standard Meets Standard Does Not Meet Standard Falls Far Below Standard
Strive HI API Strive HIClassification
AnnualMeasureable
Outcomes
High Needs StudentsProficiency Rates
High Needs StudentsGrowth
High NeedsAdequateGrowth
SchSpe
MeaMath Reading Math Reading42.96 Continuous
Improvement × No Data + 3.20 4.05 8.21 8.39 No Data No D
× A school’s Strive HI Classification is noted for informational purposes onlyand is not calculated in the Overall Score.+ Annual Measureable Outcomes (“AMO’s”) were not developed for the 2013 -2014 school year. Even if they were developed, this measure is fo
only, and AMOs are not calculated in the Overall Score. Data were not available for the 2013-2014 school year. No schools had School-Specific Measures in school year 2013-2014.
* The overall score is calculated by weighting the three previous measures Strive HI API (65%), High Needs Students Proficiency Rates (13.5%), and HGrowth (21.5%). Within Proficiency and Growth, the measures are split evenly between Math and Reading. The following rubric was used to determiOverall Score met standard: Exceeds Standard (75-100); Meets Standard (50-74); Does Not Meet Standard (25-49); and Falls Far Below Standard (Be
Financial Performance
Meets Target Does Not Meet Target Falls Far Below Target
Current Ratio
Greater than orequal to 1.1
Enrollment
Variance equals orexceeds 95% inthe most recent
Days Cash on
Hand 60 dayscash on hand
Total
Margin ispositive
Debt to Assets
Ratio is less than.50
Cash
Flow ispositive
Unrestricted Fund
BalancePercentage
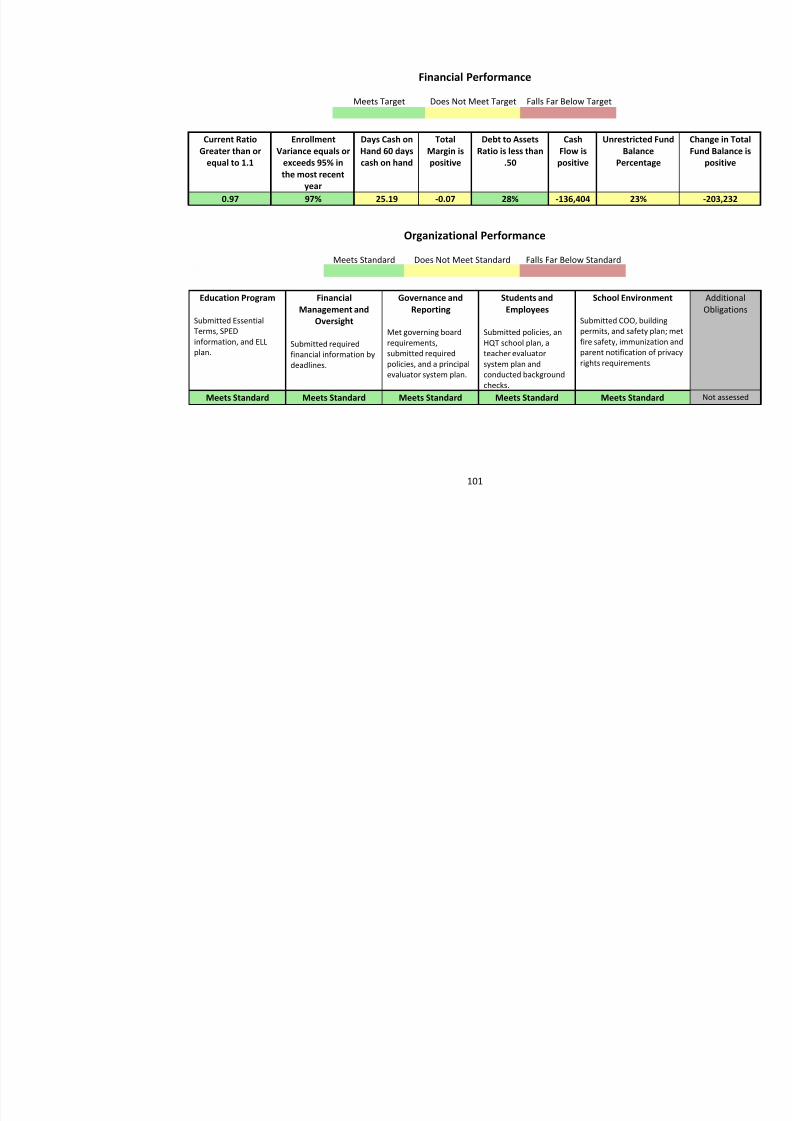
8/10/2019 Hawaii charter schools annual report
http://slidepdf.com/reader/full/hawaii-charter-schools-annual-report 104/268
101
the most recentyear
0.97 97% 25.19 -0.07 28% -136,404 23%
Organizational Performance
Meets Standard Does Not Meet Standard Falls Far Below Standard
Education Program
Submitted EssentialTerms, SPEDinformation, and ELLplan.
FinancialManagement and
Oversight
Submitted requiredfinancial information bydeadlines.
Governance andReporting
Met governing boardrequirements,submitted requiredpolicies, and a principalevaluator system plan.
Students andEmployees
Submitted policies, anHQT school plan, ateacher evaluatorsystem plan andconducted backgroundchecks.
School Environment
Submitted COO, buildingpermits, and safety plan; mfire safety, immunization parent notification of privrights requirements.
Meets Standard Meets Standard Meets Standard Meets Standard Meets Standard
Hakipu‘u Learning Center Hawaii State Public Charter School Commission – Annual Report 2014
Mission: Hakipu’u Learning Center (HLC)- an innovative, community-based school rooted in the traditional wisdom of Hawai`i - ustudentcentered, place and project based approach to build an ‘ohana of lifelong learners who apply critical thinking, creatisolving skills to achieve success now and into the future.
Board Chairperson(s): Kylee P. Mar
Director(s): Charlene HoeRegion: Windward OahuGrades: 4-12
Total Enrollment: 61
SPED: 11.76%FRL: 52.94%ELL: 0%
Strive HI API Score: 10
Classification: PriorityAutomatic Trigger: Lo
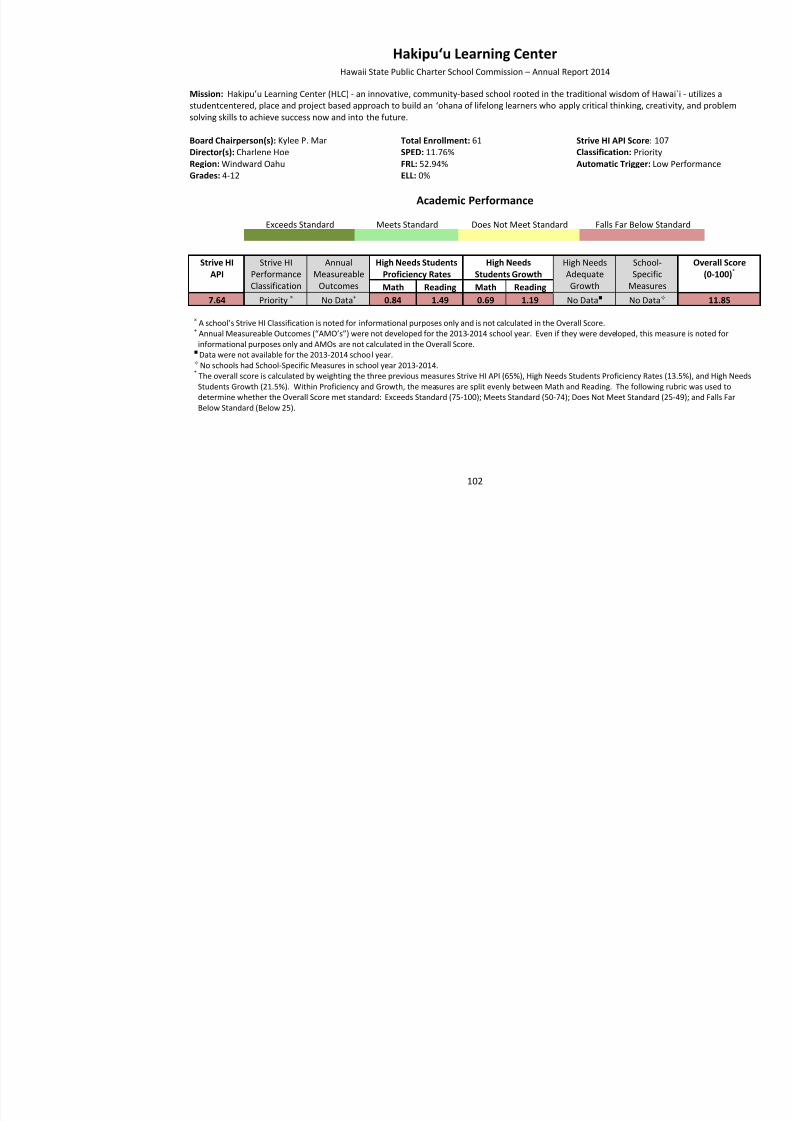
8/10/2019 Hawaii charter schools annual report
http://slidepdf.com/reader/full/hawaii-charter-schools-annual-report 105/268
102
Academic Performance
Exceeds Standard Meets Standard Does Not Meet Standard Falls Far Below Standard
Strive HI
API
Strive HI
PerformanceClassification
Annual
MeasureableOutcomes
High Needs Students
Proficiency Rates
High Needs
Students Growth
High Needs
AdequateGrowth
School-
SpecificMeasuresMath Reading Math Reading
7.64 Priority × No Data + 0.84 1.49 0.69 1.19 No Data No Data
× A school’s Strive HI Classification is noted for informational purposes only and is not calculated in the Overall Score.+ Annual Measureable Outcomes (“AMO’s”) were not developed for the 2013 -2014 school year. Even if they were developed, this measurinformational purposes only and AMOs are not calculated in the Overall Score. Data were not available for the 2013-2014 school year. No schools had School-Specific Measures in school year 2013-2014.
* The overall score is calculated by weighting the three previous measures Strive HI API (65%), High Needs Students Proficiency Rates (13.5%), Students Growth (21.5%). Within Proficiency and Growth, the measures are split evenly between Math and Reading. The following rubric was determine whether the Overall Score met standard: Exceeds Standard (75-100); Meets Standard (50-74); Does Not Meet Standard (25-49); and FBelow Standard (Below 25).
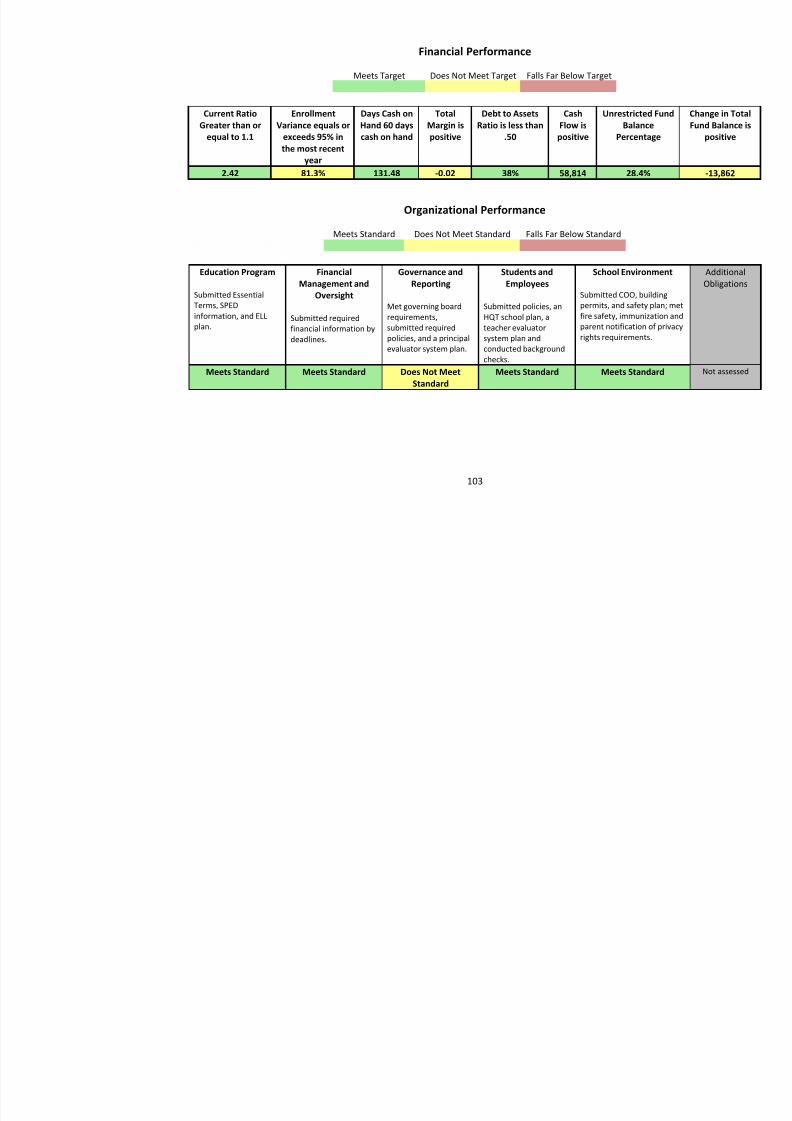
8/10/2019 Hawaii charter schools annual report
http://slidepdf.com/reader/full/hawaii-charter-schools-annual-report 106/268
Halau Ku Mana Public Charter SchoolHawaii State Public Charter School Commission – Annual Report 2014
Mission: Ho‘okumu – Foster a sense of esteem, stewardship and kuleana to th e ‘aina, our communities and ourselves, throancestral knowledges and practices of Hawai‘i and the academic skills necessary to excel in the 21st century. Ho‘okele – Explore and inquire in ways that build upon our ancestral wisdom and bridge to other communities and cultures in a harmmanner, thus moving toward our highest personal and community goals.Ho‘omana – Provide sustenance and empowerment for ourselves and our communities by striving for high academic, cultural, social
environmental, and economic standards, thus nourishing all piko (centers) – cognitive, emotional, spiritual, and physical.
Notes: None
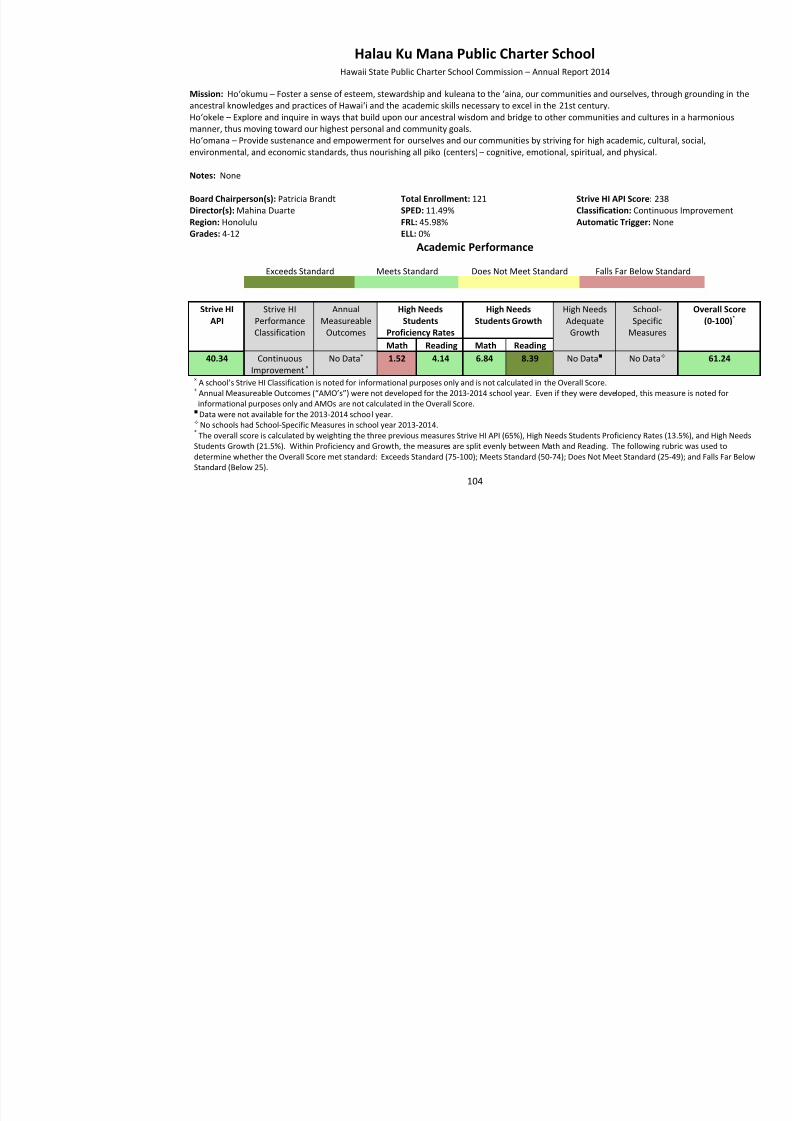
8/10/2019 Hawaii charter schools annual report
http://slidepdf.com/reader/full/hawaii-charter-schools-annual-report 107/268
104
Board Chairperson(s): Patricia BrandtDirector(s): Mahina DuarteRegion: HonoluluGrades: 4-12
Total Enrollment: 121SPED: 11.49%FRL: 45.98%ELL: 0%
Strive HI API Score: 23Classification: ContinuAutomatic Trigger: No
Academic Performance
Exceeds Standard Meets Standard Does Not Meet Standard Falls Far Below Standard
Strive HIAPI
Strive HIPerformanceClassification
AnnualMeasureable
Outcomes
High NeedsStudents
Proficiency Rates
High NeedsStudents Growth
High NeedsAdequateGrowth
School-Specific
MeasuresMath Reading Math Reading
40.34 ContinuousImprovement ×
No Data + 1.52 4.14 6.84 8.39 No Data No Data
× A school’s Strive HI Classification is noted for informational purposes only and is not calculated in the Overall Score. +
Annual Measureable Outcomes (“AMO’s”) were not developed for the 201 3-2014 school year. Even if they were developed, this measurinformational purposes only and AMOs are not calculated in the Overall Score. Data were not available for the 2013-2014 school year. No schools had School-Specific Measures in school year 2013-2014.
* The overall score is calculated by weighting the three previous measures Strive HI API (65%), High Needs Students Proficiency Rates (13.5%), Students Growth (21.5%). Within Proficiency and Growth, the measures are split evenly between Math and Reading. The following rubric was udetermine whether the Overall Score met standard: Exceeds Standard (75-100); Meets Standard (50-74); Does Not Meet Standard (25-49); and FaStandard (Below 25).
Financial Performance
Meets Target Does Not Meet Target Falls Far Below Target
Current RatioGreater than or
equal to 1.1
EnrollmentVariance equals or
exceeds 95% in
the most recentyear
Days Cash onHand 60 dayscash on hand
TotalMargin ispositive
Debt to AssetsRatio is less than
.50
CashFlow ispositive
Unrestricted FundBalance
Percentage
29.56 100.8% 503.28 0.06 16% 27,438 169.6%

8/10/2019 Hawaii charter schools annual report
http://slidepdf.com/reader/full/hawaii-charter-schools-annual-report 108/268
105
Organizational Performance
Meets Standard Does Not Meet Standard Falls Far Below Standard
Education Program
Submitted EssentialTerms, SPEDinformation, and ELLplan.
FinancialManagement and
Oversight
Submitted requiredfinancial information bydeadlines.
Governance andReporting
Met governing boardrequirements,submitted requiredpolicies, and a principalevaluator system plan.
Students andEmployees
Submitted policies, anHQT school plan, ateacher evaluatorsystem plan andconducted backgroundchecks.
School Environment
Submitted COO, buildingpermits, and safety plan; mfire safety, immunization parent notification of privrights requirements.
Meets Standard Meets Standard Does Not MeetStandard
Meets Standard Meets Standard
Hālau Lōkahi Charter School Hawaii State Public Charter School Commission – Annual Report 2014
Mission: The mission of Halau Lokahi is to provide a means to personal sovereignty through the use of the principles of Lokahi, accself-responsibili ty. We call this commitment: “Learning to be self responsibly free”
Notes: None
Board Chairperson(s): June NagasawaDirector(s): Laara AllbrettRegion: HonoluluG d K 12
Total Enrollment: 183SPED: 8.24%FRL: 50.59%ELL 1 18%
Strive HI API Score: 14Classification: ContinuAutomatic Trigger: No
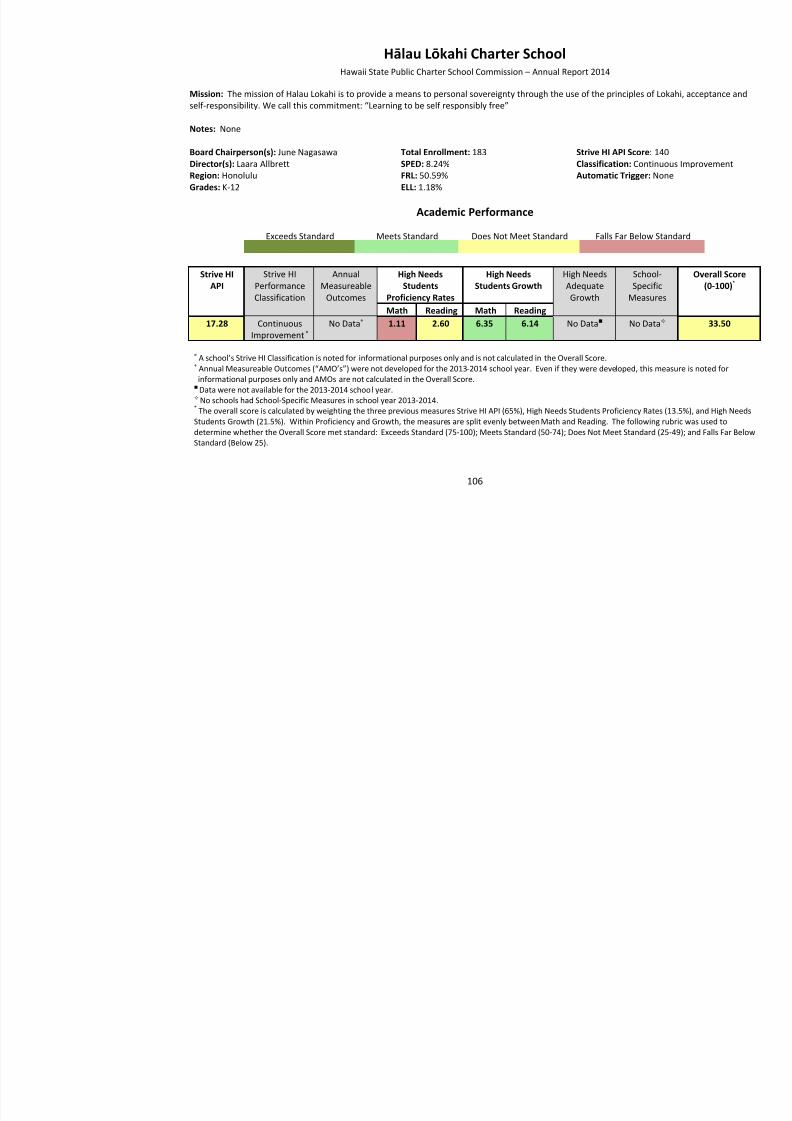
8/10/2019 Hawaii charter schools annual report
http://slidepdf.com/reader/full/hawaii-charter-schools-annual-report 109/268
106
Grades: K-12 ELL: 1.18%
Academic Performance
Exceeds Standard Meets Standard Does Not Meet Standard Falls Far Below Standard
Strive HIAPI
Strive HIPerformanceClassification
AnnualMeasureable
Outcomes
High NeedsStudents
Proficiency Rates
High NeedsStudents Growth
High NeedsAdequateGrowth
School-Specific
MeasuresMath Reading Math Reading
17.28 ContinuousImprovement ×
No Data + 1.11 2.60 6.35 6.14 No Data No Data
× A school’s Strive HI Classification is noted for informational purposes only and is not calculated in the Overall Score. + Annual Measureable Outcomes (“AMO’s”) were not developed for the 2013 -2014 school year. Even if they were developed, this measurinformational purposes only and AMOs are not calculated in the Overall Score. Data were not available for the 2013-2014 school year. No schools had School-Specific Measures in school year 2013-2014.
* The overall score is calculated by weighting the three previous measures Strive HI API (65%), High Needs Students Proficiency Rates (13.5%), Students Growth (21.5%). Within Proficiency and Growth, the measures are split evenly between Math and Reading. The following rubric was udetermine whether the Overall Score met standard: Exceeds Standard (75-100); Meets Standard (50-74); Does Not Meet Standard (25-49); and FaStandard (Below 25).
Financial Performance
Meets Target Does Not Meet Target Falls Far Below Target
Current RatioGreater than or
equal to 1.1
EnrollmentVariance equals or
exceeds 95% inthe most recent
year
Days Cash onHand 60 dayscash on hand
TotalMargin ispositive
Debt to AssetsRatio is less than
.50
CashFlow ispositive
Unrestricted FundBalance
Percentage
0.22 77.2% 0.55 -0.18 256% -4,761 -34.6%
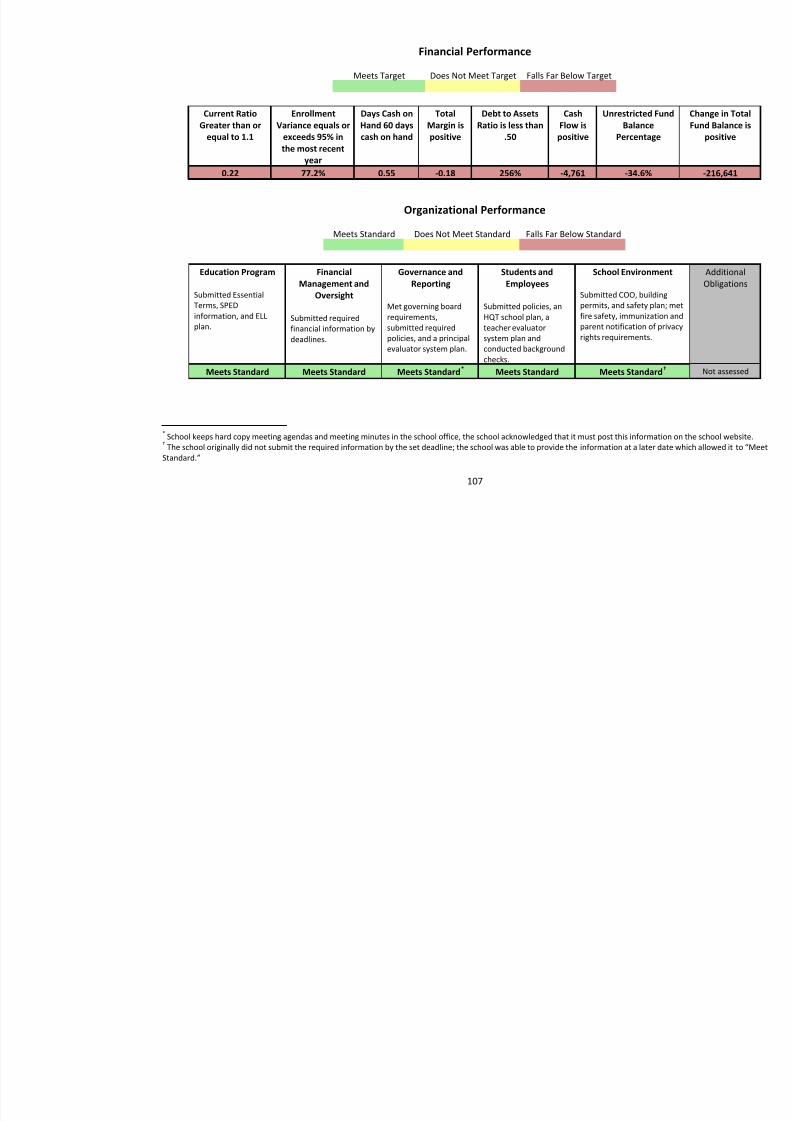
8/10/2019 Hawaii charter schools annual report
http://slidepdf.com/reader/full/hawaii-charter-schools-annual-report 110/268
107
Organizational Performance
Meets Standard Does Not Meet Standard Falls Far Below Standard
Education Program
Submitted EssentialTerms, SPEDinformation, and ELLplan.
FinancialManagement andOversight
Submitted requiredfinancial information bydeadlines.
Governance andReporting
Met governing boardrequirements,submitted requiredpolicies, and a principalevaluator system plan.
Students andEmployees
Submitted policies, anHQT school plan, ateacher evaluatorsystem plan andconducted backgroundchecks.
School Environment
Submitted COO, buildingpermits, and safety plan; mfire safety, immunization parent notification of privrights requirements.
Meets Standard Meets Standard Meets Standard 66F
* Meets Standard Meets Standard
* School keeps hard copy meeting agendas and meeting minutes in the school office, the school acknowledged that it must post this information on the scho† The school originally did not submit the required information by the set deadline; the school was able to provide the information at a later dateStandard.”
Hawaii Academy of Arts & Science Public Charter School (HAAS)
Hawaii State Public Charter School Commission – Annual Report 2014
Mission: The mission of Hawaii Academy of Arts and Science is to provide every student an education where learning needs are meimplementing flexible and effective teaching strategies which target the full range of learning styles.
Notes: None
Board Chairperson(s): Winston AlbrightDirector(s): Steve HirakamiRegion: East Hawaii
Total Enrollment: 637SPED: 8.19%FRL: 79.52%
Strive HI API Score: 24Classification: FocusAutomatic Trigger: Lo
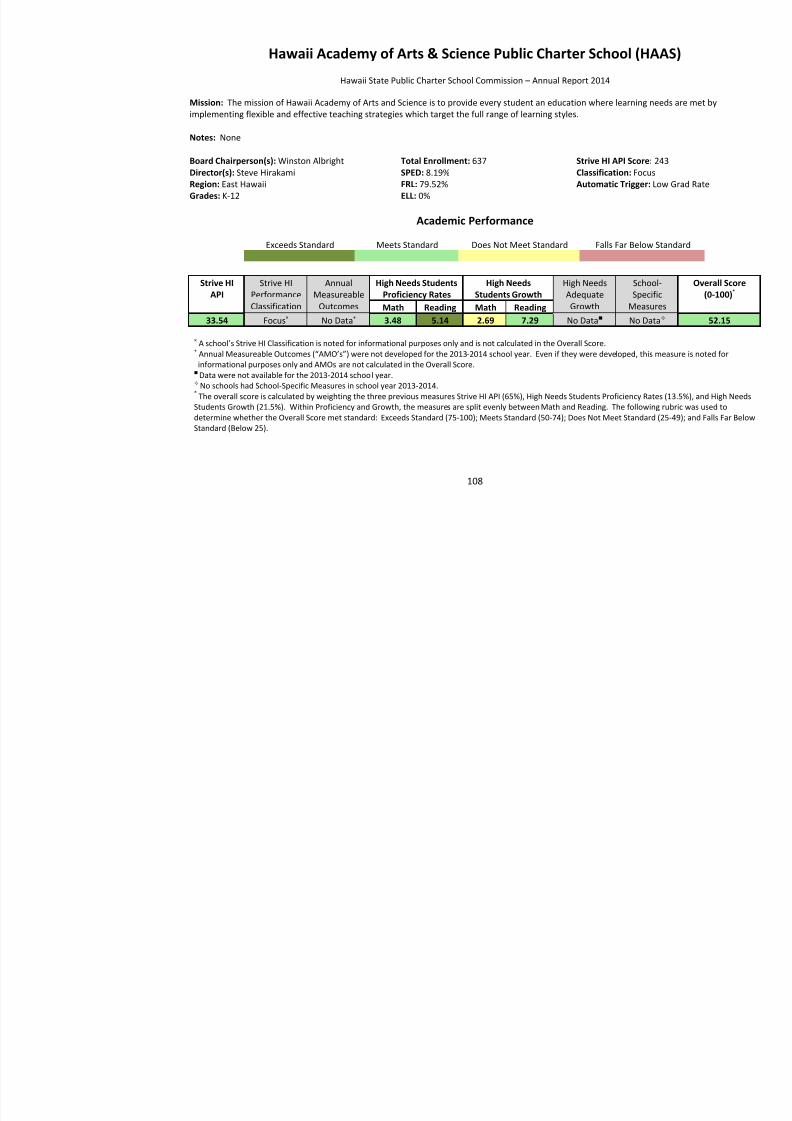
8/10/2019 Hawaii charter schools annual report
http://slidepdf.com/reader/full/hawaii-charter-schools-annual-report 111/268
108
Grades: K-12 ELL: 0%
Academic Performance
Exceeds Standard Meets Standard Does Not Meet Standard Falls Far Below Standard
Strive HIAPI
Strive HIPerformanceClassification
AnnualMeasureable
Outcomes
High Needs StudentsProficiency Rates
High NeedsStudents Growth
High NeedsAdequateGrowth
School-Specific
MeasuresMath Reading Math Reading33.54 Focus × No Data + 3.48 5.14 2.69 7.29 No Data No Data
× A school’s Strive HI Classificationis noted for informational purposes only and is not calculated in the Overall Score.+ Annual Measureable Outcomes (“AMO’s”) were not developed for the 2013 -2014 school year. Even if they were developed, this measurinformational purposes only and AMOs are not calculated in the Overall Score. Data were not available for the 2013-2014 school year. No schools had School-Specific Measures in school year 2013-2014.
* The overall score is calculated by weighting the three previous measures Strive HI API (65%), High Needs Students Proficiency Rates (13.5%), Students Growth (21.5%). Within Proficiency and Growth, the measures are split evenly between Math and Reading. The following rubric was udetermine whether the Overall Score met standard: Exceeds Standard (75-100); Meets Standard (50-74); Does Not Meet Standard (25-49); and FaStandard (Below 25).
Financial Performance
Meets Target Does Not Meet Target Falls Far Below Target
Current RatioGreater than or
equal to 1.1
EnrollmentVariance equals or
exceeds 95% inthe most recent
year
Days Cash onHand 60 dayscash on hand
TotalMargin ispositive
Debt to AssetsRatio is less than
.50
CashFlow ispositive
Unrestricted FundBalance
Percentage
2.83 100.3% 134.03 0.01 38% 394,271 74.4%
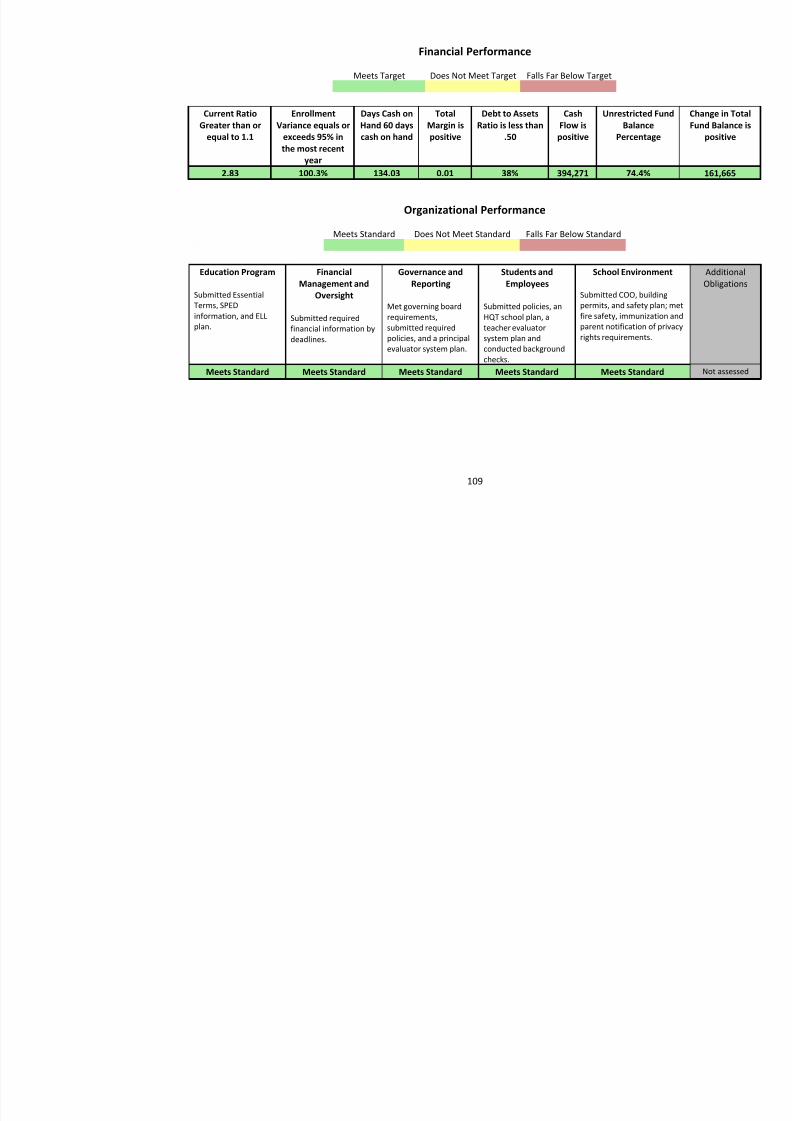
8/10/2019 Hawaii charter schools annual report
http://slidepdf.com/reader/full/hawaii-charter-schools-annual-report 112/268
109
Organizational Performance
Meets Standard Does Not Meet Standard Falls Far Below Standard
Education Program
Submitted EssentialTerms, SPEDinformation, and ELLplan.
FinancialManagement andOversight
Submitted requiredfinancial information bydeadlines.
Governance andReporting
Met governing boardrequirements,submitted requiredpolicies, and a principalevaluator system plan.
Students andEmployees
Submitted policies, anHQT school plan, ateacher evaluatorsystem plan andconducted backgroundchecks.
School Environment
Submitted COO, buildingpermits, and safety plan; mfire safety, immunization parent notification of privrights requirements.
Meets Standard Meets Standard Meets Standard Meets Standard Meets Standard
Hawaii Technology AcademyHawaii State Public Charter School Commission – Annual Report 2014
Mission: Hawaii Technology Academy is a state-wide kindergarten through grade 12 public charter school that partners educators, fa(learning coaches) and students through differentiated curriculum and delivery methods. HTA is committed to providing the highest eda diverse population, taking pride in being the right fit for the right student at the right time. With mobility and flexibility woven into ethe data driven individualized learning plans (ILPs), sustainable student success, facilitated by faculty and family, creates value in the community and world.
Notes: None
Board Chairperson(s): Michael Findley Total Enrollment: 1,244 Strive HI API Score: 19
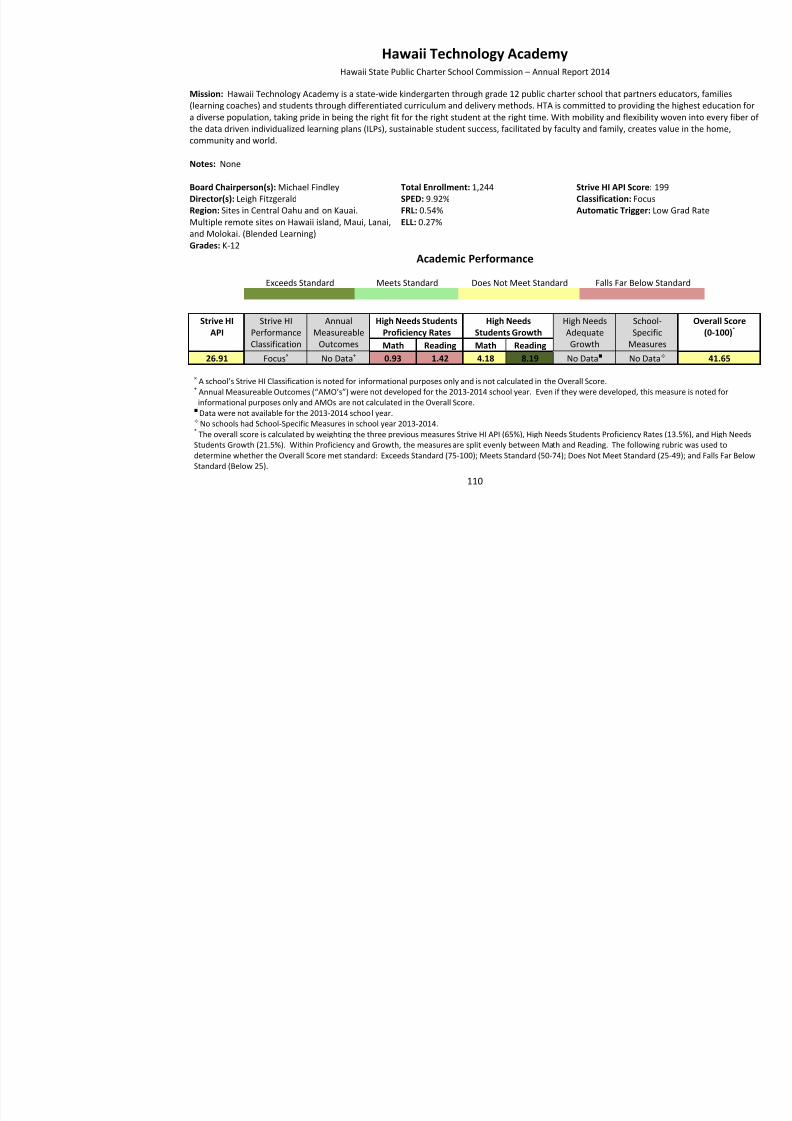
8/10/2019 Hawaii charter schools annual report
http://slidepdf.com/reader/full/hawaii-charter-schools-annual-report 113/268
110
Director(s): Leigh FitzgeraldRegion: Sites in Central Oahu and on Kauai.Multiple remote sites on Hawaii island, Maui, Lanai,and Molokai. (Blended Learning)Grades: K-12
SPED: 9.92%FRL: 0.54%ELL: 0.27%
Classification: FocusAutomatic Trigger: Lo
Academic Performance
Exceeds Standard Meets Standard Does Not Meet Standard Falls Far Below Standard
Strive HIAPI
Strive HIPerformanceClassification
AnnualMeasureable
Outcomes
High Needs StudentsProficiency Rates
High NeedsStudents Growth
High NeedsAdequateGrowth
School-Specific
MeasuresMath Reading Math Reading26.91 Focus × No Data + 0.93 1.42 4.18 8.19 No Data No Data
× A school’s Strive HI Classification is noted for informational purposes only and is not calculated in the Overall Score. +
Annual Measureable Outcomes (“AMO’s”) were not developed for the 2013-2014 school year. Even if they were developed, this measure isinformational purposes only and AMOs are not calculated in the Overall Score. Data were not available for the 2013-2014 school year. No schools had School-Specific Measures in school year 2013-2014.
* The overall score is calculated by weighting the three previous measures Strive HI API (65%), High Needs Students Proficiency Rates (13.5%), Students Growth (21.5%). Within Proficiency and Growth, the measures are split evenly between Math and Reading. The following rubric was udetermine whether the Overall Score met standard: Exceeds Standard (75-100); Meets Standard (50-74); Does Not Meet Standard (25-49); and FaStandard (Below 25).
Financial Performance
Meets Target Does Not Meet Target Falls Far Below Target
Current Ratio
Greater than orequal to 1.1
Enrollment
Variance equals orexceeds 95% inthe most recent
year
Days Cash on
Hand 60 dayscash on hand
Total
Margin ispositive
Debt to Assets
Ratio is less than.50
Cash
Flow ispositive
Unrestricted Fund
BalancePercentage
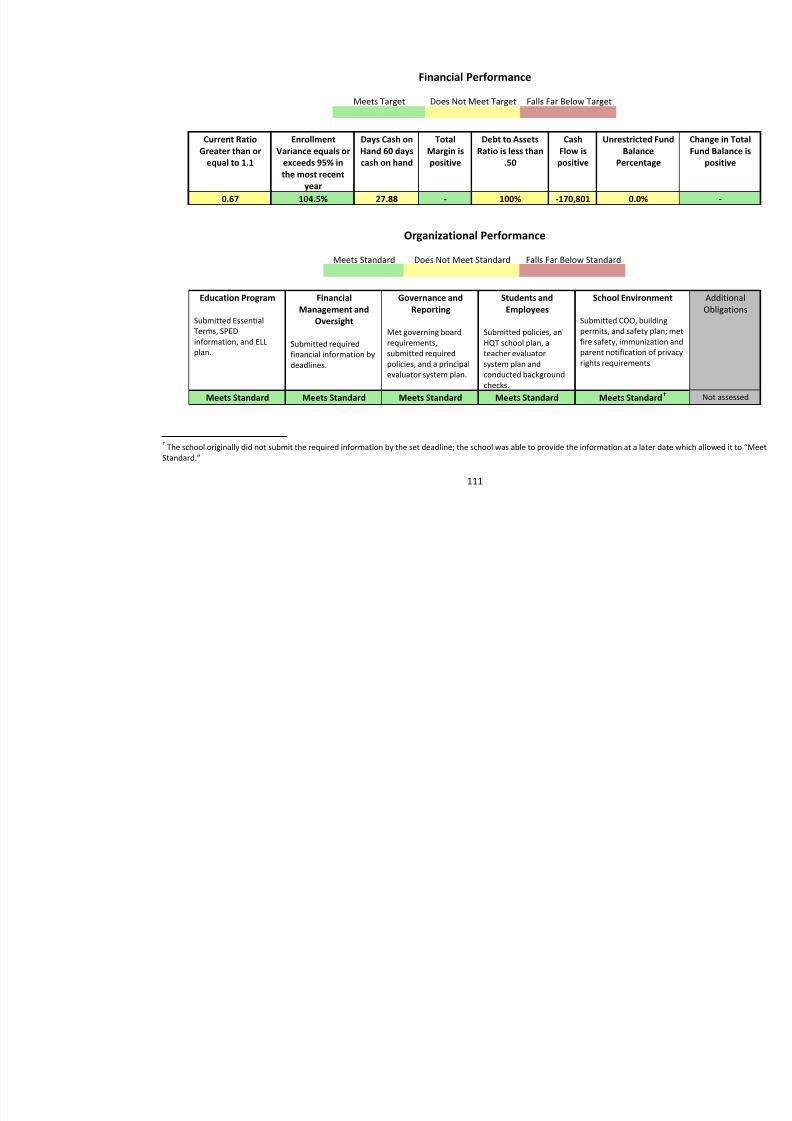
8/10/2019 Hawaii charter schools annual report
http://slidepdf.com/reader/full/hawaii-charter-schools-annual-report 114/268
111
0.67 104.5% 27.88 - 100% -170,801 0.0%
Organizational Performance
Meets Standard Does Not Meet Standard Falls Far Below Standard
Education Program
Submitted EssentialTerms, SPEDinformation, and ELLplan.
FinancialManagement and
Oversight
Submitted requiredfinancial information bydeadlines.
Governance andReporting
Met governing boardrequirements,submitted requiredpolicies, and a principalevaluator system plan.
Students andEmployees
Submitted policies, anHQT school plan, ateacher evaluatorsystem plan andconducted backgroundchecks.
School Environment
Submitted COO, buildingpermits, and safety plan; mfire safety, immunization parent notification of privrights requirements.
Meets Standard Meets Standard Meets Standard Meets Standard Meets Standard
† The school originally did not submit the required information by the set deadline; the school was able to provide the information at a later date which allowStandard.”
Innovations Public Charter SchoolHawaii State Public Charter School Commission – Annual Report 2014
Mission: The mission of Innovations Public Charter School is to provide the highest quality education to the children of West Hawaiinnovative teaching techniques that meet the needs of every learner.
Notes: None
Board Chairperson(s): Michelle ConreyDirector(s): Jennifer HiroRegion: West HawaiiGrades: K-8
Total Enrollment: 223SPED: 11.11%FRL: 50.98%ELL: 0%
Strive HI API Score: 30Classification: ContinuAutomatic Trigger: No
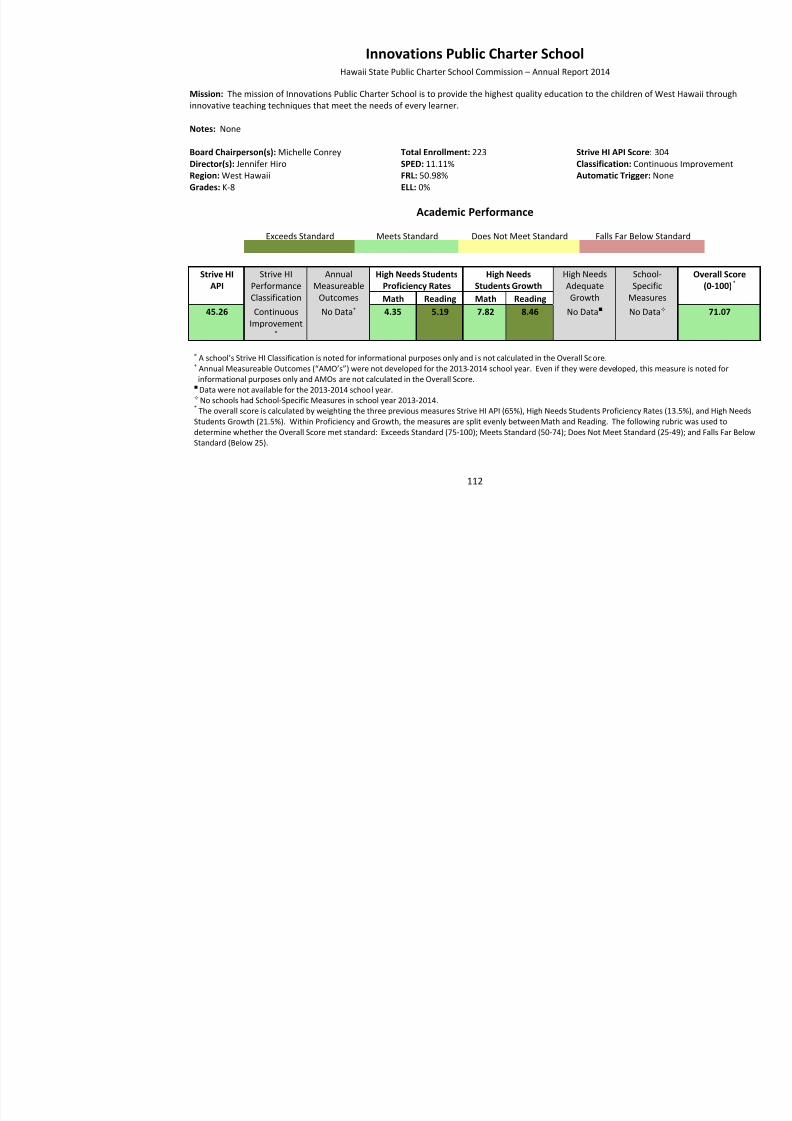
8/10/2019 Hawaii charter schools annual report
http://slidepdf.com/reader/full/hawaii-charter-schools-annual-report 115/268
112
Academic Performance
Exceeds Standard Meets Standard Does Not Meet Standard Falls Far Below Standard
Strive HIAPI
Strive HIPerformanceClassification
AnnualMeasureable
Outcomes
High Needs StudentsProficiency Rates
High NeedsStudents Growth
High NeedsAdequateGrowth
School-Specific
MeasuresMath Reading Math Reading45.26 Continuous
Improvement×
No Data + 4.35 5.19 7.82 8.46 No Data No Data
× A schoo l’s Strive HI Classification is noted for informational purposes only and is not calculated in the Overall Score. + Annual Measureable Outcomes (“AMO’s”) were not developed for the 2013 -2014 school year. Even if they were developed, this measurinformational purposes only and AMOs are not calculated in the Overall Score. Data were not available for the 2013-2014 school year. No schools had School-Specific Measures in school year 2013-2014.
* The overall score is calculated by weighting the three previous measures Strive HI API (65%), High Needs Students Proficiency Rates (13.5%), Students Growth (21.5%). Within Proficiency and Growth, the measures are split evenly between Math and Reading. The following rubric was udetermine whether the Overall Score met standard: Exceeds Standard (75-100); Meets Standard (50-74); Does Not Meet Standard (25-49); and FaStandard (Below 25).
Financial Performance
Meets Target Does Not Meet Target Falls Far Below Target
Current RatioGreater than or
equal to 1.1
EnrollmentVariance equals or
exceeds 95% inthe most recent
year
Days Cash onHand 60 dayscash on hand
TotalMargin ispositive
Debt to AssetsRatio is less than
.50
CashFlow ispositive
Unrestricted FundBalance
Percentage
2.72 99.6% 126.38 -0.03 38% 5,129 23.6%
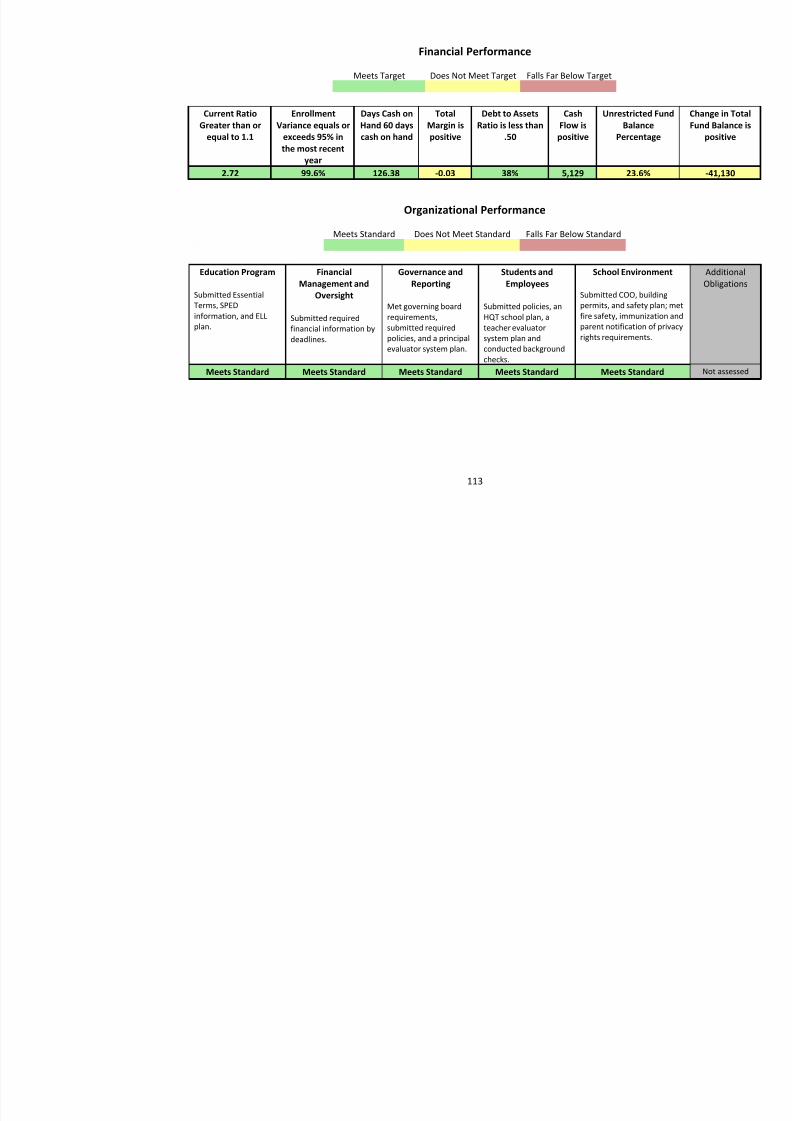
8/10/2019 Hawaii charter schools annual report
http://slidepdf.com/reader/full/hawaii-charter-schools-annual-report 116/268
113
Organizational Performance
Meets Standard Does Not Meet Standard Falls Far Below Standard
Education Program
Submitted EssentialTerms, SPEDinformation, and ELLplan.
FinancialManagement andOversight
Submitted requiredfinancial information bydeadlines.
Governance andReporting
Met governing boardrequirements,submitted requiredpolicies, and a principalevaluator system plan.
Students andEmployees
Submitted policies, anHQT school plan, ateacher evaluatorsystem plan andconducted backgroundchecks.
School Environment
Submitted COO, buildingpermits, and safety plan; mfire safety, immunization parent notification of privrights requirements.
Meets Standard Meets Standard Meets Standard Meets Standard Meets Standard
Ka ‘Umeke Kā‘eo Hawaii State Public Charter School Commission – Annual Report 2014
Mission: I ulu i ke kuamo‘o, I mana i ka ‘ōiwi, I kā‘eo no ka hanauna hou (Inspired by our past, Empowered by our identity, future)
Notes: This school opted to exclude grades 3-5 from the 2014 Academic Performance Assessment. This option was available only fomedium and immersion schools.
Board Chairperson(s): Lauren Lii NahiwaDirector(s): Huihui Kanahele-MossmanRegion: East HawaiiGrades: K-12
Total Enrollment: 275SPED: 9.29%FRL: 73.57%ELL:0%
Strive HI API Score: 10Classification: PriorityAutomatic Trigger: Lo
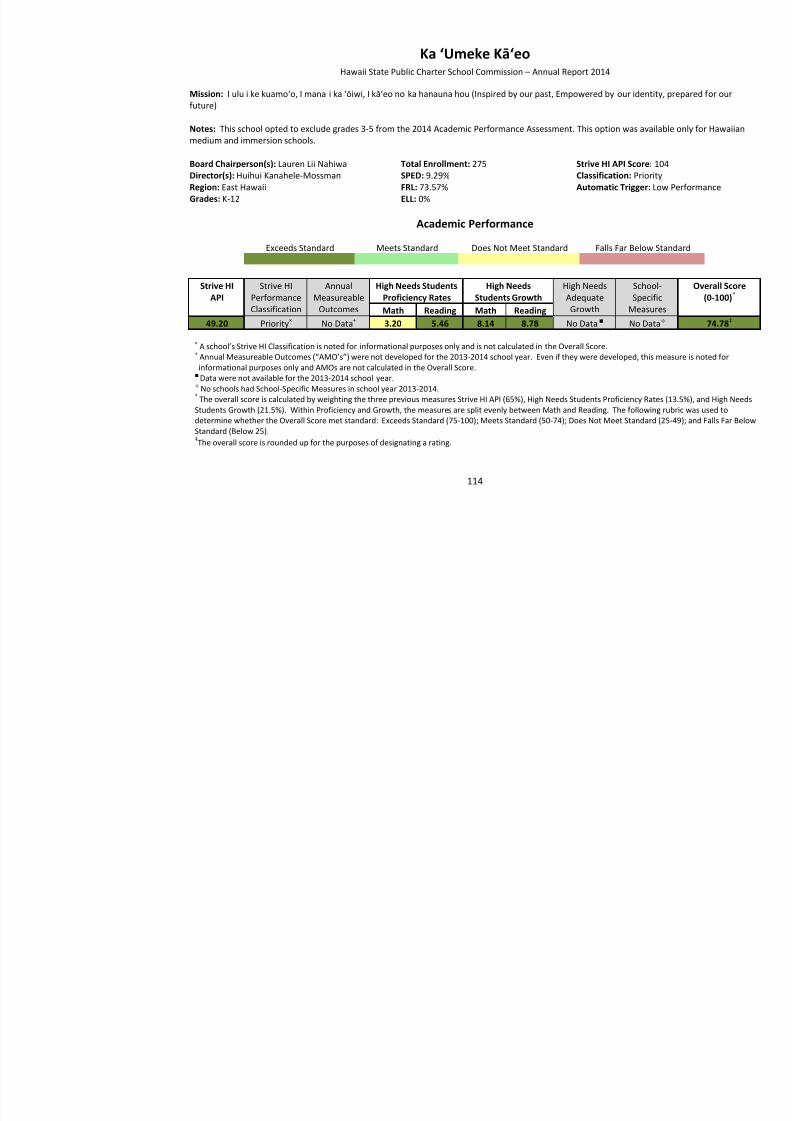
8/10/2019 Hawaii charter schools annual report
http://slidepdf.com/reader/full/hawaii-charter-schools-annual-report 117/268
114
Grades: K-12 ELL: 0%
Academic Performance
Exceeds Standard Meets Standard Does Not Meet Standard Falls Far Below Standard
Strive HIAPI
Strive HIPerformanceClassification
AnnualMeasureable
Outcomes
High Needs StudentsProficiency Rates
High NeedsStudents Growth
High NeedsAdequateGrowth
School-Specific
MeasuresMath Reading Math Reading49.20 Priority × No Data + 3.20 5.46 8.14 8.78 No Data No Data
× A school’s Strive HI Classification is noted for informational purposes only and is not calculated in the Overall Score. + Annual Measureable Outcomes (“AMO’s”) were not developed for the 2013-2014 school year. Even if they were developed, this measure iinformational purposes only and AMOs are not calculated in the Overall Score. Data were not available for the 2013-2014 school year. No schools had School-Specific Measures in school year 2013-2014.
* The overall score is calculated by weighting the three previous measures Strive HI API (65%), High Needs Students Proficiency Rates (13.5%), Students Growth (21.5%). Within Proficiency and Growth, the measures are split evenly between Math and Reading. The following rubric was udetermine whether the Overall Score met standard: Exceeds Standard (75-100); Meets Standard (50-74); Does Not Meet Standard (25-49); and FStandard (Below 25).‡The overall score is rounded up for the purposes of designating a rating.
Financial Performance
Meets Target Does Not Meet Target Falls Far Below Target
Current RatioGreater than or
equal to 1.1
EnrollmentVariance equals or
exceeds 95% inthe most recent
year
Days Cash onHand 60 dayscash on hand
TotalMargin ispositive
Debt to AssetsRatio is less than
.50
CashFlow ispositive
Unrestricted FundBalance
Percentage
14.21 78.6% 247.64 0.14 5% -29,414 95.7%
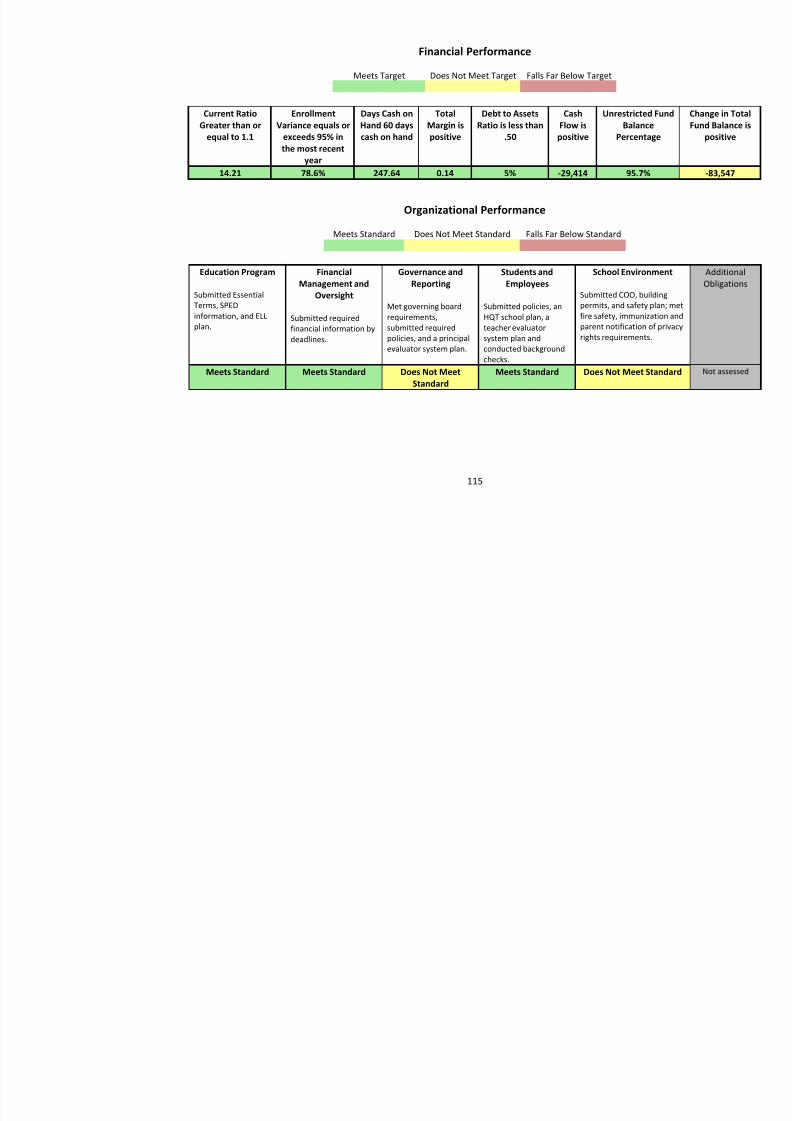
8/10/2019 Hawaii charter schools annual report
http://slidepdf.com/reader/full/hawaii-charter-schools-annual-report 118/268
115
Organizational Performance
Meets Standard Does Not Meet Standard Falls Far Below Standard
Education Program
Submitted EssentialTerms, SPEDinformation, and ELLplan.
FinancialManagement and
Oversight
Submitted requiredfinancial information bydeadlines.
Governance andReporting
Met governing boardrequirements,submitted requiredpolicies, and a principalevaluator system plan.
Students andEmployees
Submitted policies, anHQT school plan, ateacher evaluatorsystem plan andconducted backgroundchecks.
School Environment
Submitted COO, buildingpermits, and safety plan; mfire safety, immunization parent notification of privrights requirements.
Meets Standard Meets Standard Does Not MeetStandard
Meets Standard Does Not Meet Standard
Ka Waihona o ka Na‘auao Public Charter School
Hawaii State Public Charter School Commission – Annual Report 2014
Mission: Ka Waihona o ka Na'auao creates socially responsible, resilient and resourceful young men and women, by providing an enacademic excellence, social confidence and cultural awareness.
Notes: None
Board Chairperson(s): Roberta SearleDirector(s): Alvin ParkerRegion: Leeward OahuGrades: K-8
Total Enrollment: 633SPED: 7.11%FRL: 67.65%ELL: 0%
Strive HI API Score: 14Classification: ContinuAutomatic Trigger: No
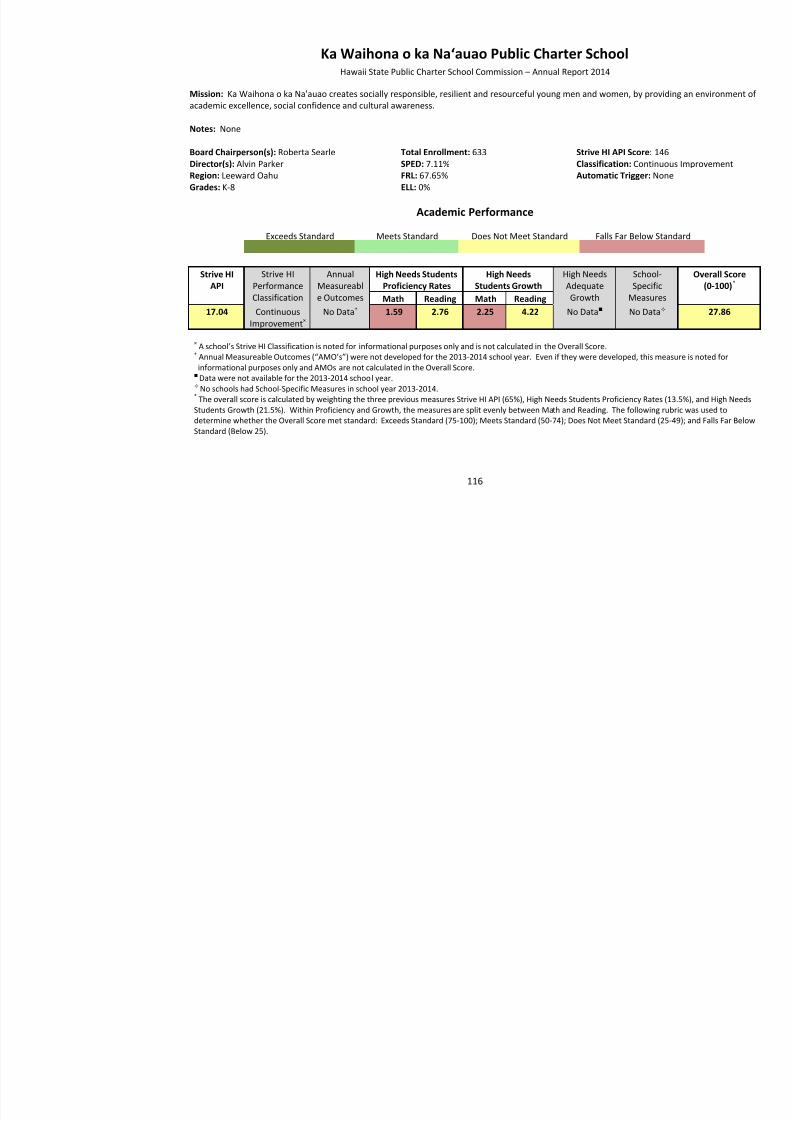
8/10/2019 Hawaii charter schools annual report
http://slidepdf.com/reader/full/hawaii-charter-schools-annual-report 119/268
116
Academic Performance
Exceeds Standard Meets Standard Does Not Meet Standard Falls Far Below Standard
Strive HIAPI Strive HIPerformanceClassification
AnnualMeasureable Outcomes
High Needs StudentsProficiency Rates High NeedsStudents Growth High NeedsAdequateGrowth
School-SpecificMeasuresMath Reading Math Reading
17.04 ContinuousImprovement ×
No Data + 1.59 2.76 2.25 4.22 No Data No Data
× A school’s Strive HI Classification is noted for informational purposes only and is not calculated in the Overall Score. + Annual Measureable Outcomes (“AMO’s”) were not developed for the 2013-2014 school year. Even if they were developed, this measure isinformational purposes only and AMOs are not calculated in the Overall Score. Data were not available for the 2013-2014 school year. No schools had School-Specific Measures in school year 2013-2014.
* The overall score is calculated by weighting the three previous measures Strive HI API (65%), High Needs Students Proficiency Rates (13.5%), Students Growth (21.5%). Within Proficiency and Growth, the measures are split evenly between Math and Reading. The following rubric was udetermine whether the Overall Score met standard: Exceeds Standard (75-100); Meets Standard (50-74); Does Not Meet Standard (25-49); and FaStandard (Below 25).
Financial Performance
Meets Target Does Not Meet Target Falls Far Below Target
Current RatioGreater than or
equal to 1.1
EnrollmentVariance equals or
exceeds 95% inthe most recent
year
Days Cash onHand 60 dayscash on hand
TotalMargin ispositive
Debt to AssetsRatio is less than
.50
CashFlow ispositive
Unrestricted FundBalance
Percentage
1.03 101.9% 16.85 0.01 14% 269,489 54.7%
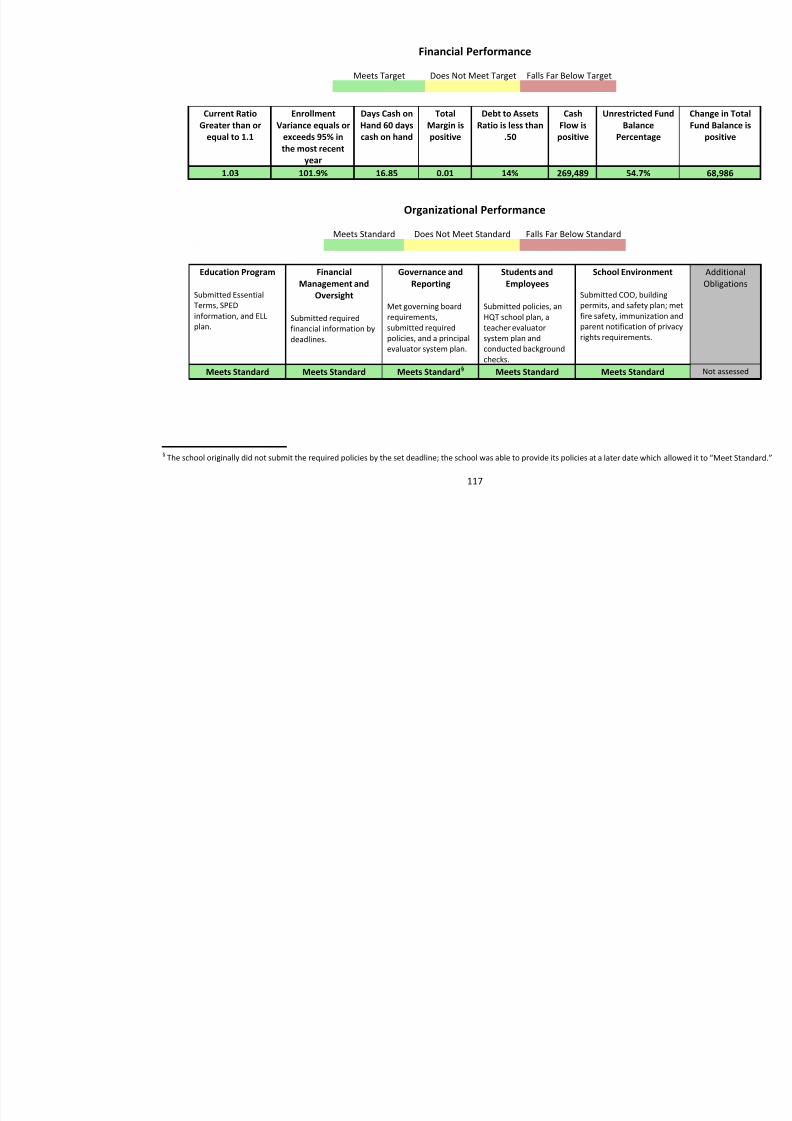
8/10/2019 Hawaii charter schools annual report
http://slidepdf.com/reader/full/hawaii-charter-schools-annual-report 120/268
117
Organizational Performance
Meets Standard Does Not Meet Standard Falls Far Below Standard
Education Program
Submitted EssentialTerms, SPEDinformation, and ELLplan.
FinancialManagement and
Oversight
Submitted requiredfinancial information bydeadlines.
Governance andReporting
Met governing boardrequirements,submitted requiredpolicies, and a principalevaluator system plan.
Students andEmployees
Submitted policies, anHQT school plan, ateacher evaluatorsystem plan andconducted backgroundchecks.
School Environment
Submitted COO, buildingpermits, and safety plan; mfire safety, immunization parent notification of privrights requirements.
Meets Standard Meets Standard Meets Standard 69F
§ Meets Standard Meets Standard
§ The school originally did not submit the required policies by the set deadline; the school was able to provide its policies a t a later date which a
Kamaile Academy, PCS
Hawaii State Public Charter School Commission – Annual Report 2014
Mission: To prepare self-directed, self-aware, college-ready learners who will embrace the challenge of obstacles, experience the pridperseverance and accomplishment, and demonstrate the st rength of ‘ohana and community.” Rationale: The school commubelieves that this school must foster in each child, from pre-school through 12th grade, an intrinsic drive toward achievement and betteenabling youth to be become self-directed learners. Throughout this process of growth, the school also seeks to instill in each child a seher or his own academic, social, emotional, and physical growth. In a community that has experienced years of academic underachievereadiness has become the clear marker by which teachers, staff, and families will measure the school’s success. While all ofthere are daunting challenges in the community. Rather than trying to separate the child from this environment, the school looks to devability of students to embrace the obstacles in life as opportunities for growth. In this way, each child experiences the pride that comes perseverance and eventual success. All the while, Kamaile Academy promotes the strength and support that can be found in family andKeeping with the metaphor, the hope is to see students follow the path of the traditional Polynesian navigators —disciplined
f f f
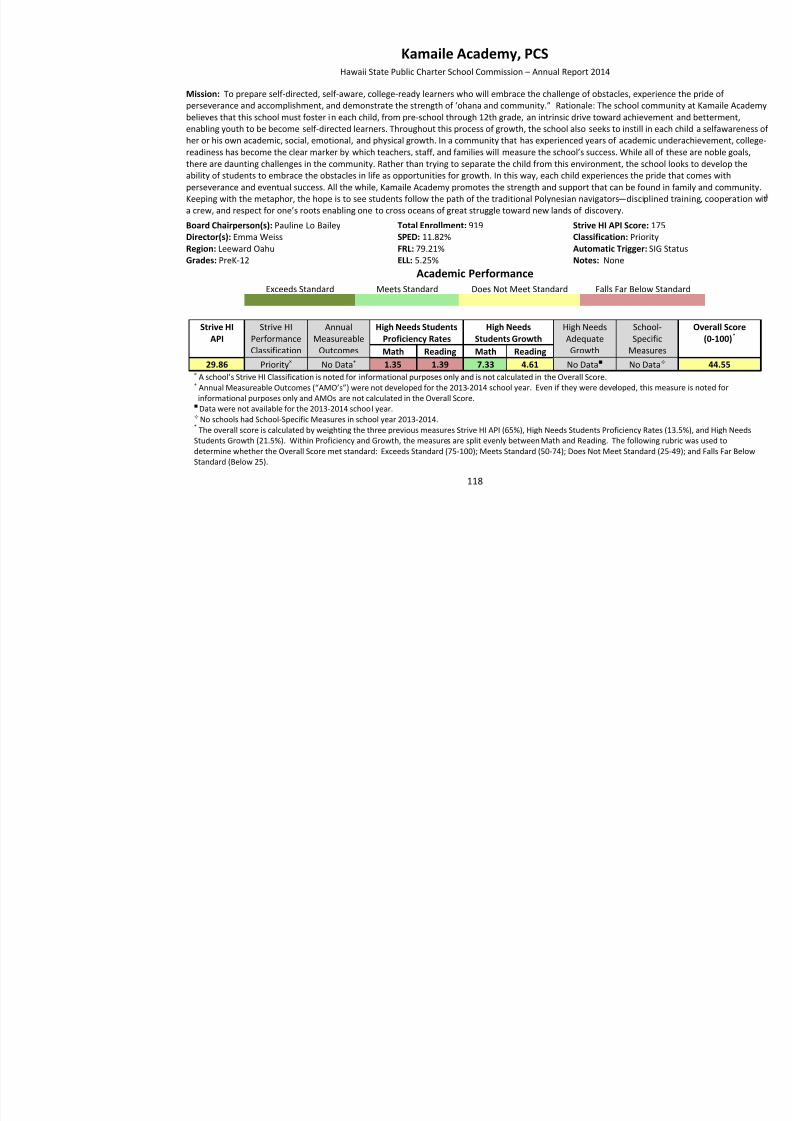
8/10/2019 Hawaii charter schools annual report
http://slidepdf.com/reader/full/hawaii-charter-schools-annual-report 121/268
118
a crew, and respect for one’s roots enabling one to cross oceans of great struggle toward new lands of discovery.
Board Chairperson(s): Pauline Lo BaileyDirector(s): Emma WeissRegion: Leeward OahuGrades: PreK-12
Total Enrollment: 919SPED: 11.82%FRL: 79.21%ELL: 5.25%
Strive HI API Score: 175Classification: PriorityAutomatic Trigger: SIGNotes: None
Academic PerformanceExceeds Standard Meets Standard Does Not Meet Standard Falls Far Below Standard
Strive HIAPI
Strive HIPerformanceClassification
AnnualMeasureable
Outcomes
High Needs StudentsProficiency Rates
High NeedsStudents Growth
High NeedsAdequateGrowth
School-Specific
MeasuresMath Reading Math Reading29.86 Priority × No Data + 1.35 1.39 7.33 4.61 No Data No Data
× A school’s Strive HI Classification is noted for informational purposes only and is not calculated in the Overall Score. + Annual Measureable Outcomes (“AMO’s”) were not developed for the 2013 -2014 school year. Even if they were developed, this measur
informational purposes only and AMOs are not calculated in the Overall Score. Data were not available for the 2013-2014 school year. No schools had School-Specific Measures in school year 2013-2014.
* The overall score is calculated by weighting the three previous measures Strive HI API (65%), High Needs Students Proficiency Rates (13.5%), Students Growth (21.5%). Within Proficiency and Growth, the measures are split evenly between Math and Reading. The following rubric was udetermine whether the Overall Score met standard: Exceeds Standard (75-100); Meets Standard (50-74); Does Not Meet Standard (25-49); and FaStandard (Below 25).
Financial Performance
Meets Target Does Not Meet Target Falls Far Below Target
Current RatioGreater than or
equal to 1.1
EnrollmentVariance equals or
exceeds 95% inthe most recent
year
Days Cash onHand 60 dayscash on hand
TotalMargin ispositive
Debt to AssetsRatio is less than
.50
CashFlow ispositive
Unrestricted FundBalance
Percentage
3.04 96.7% 111.95 -0.05 3% -528,913 109.1%
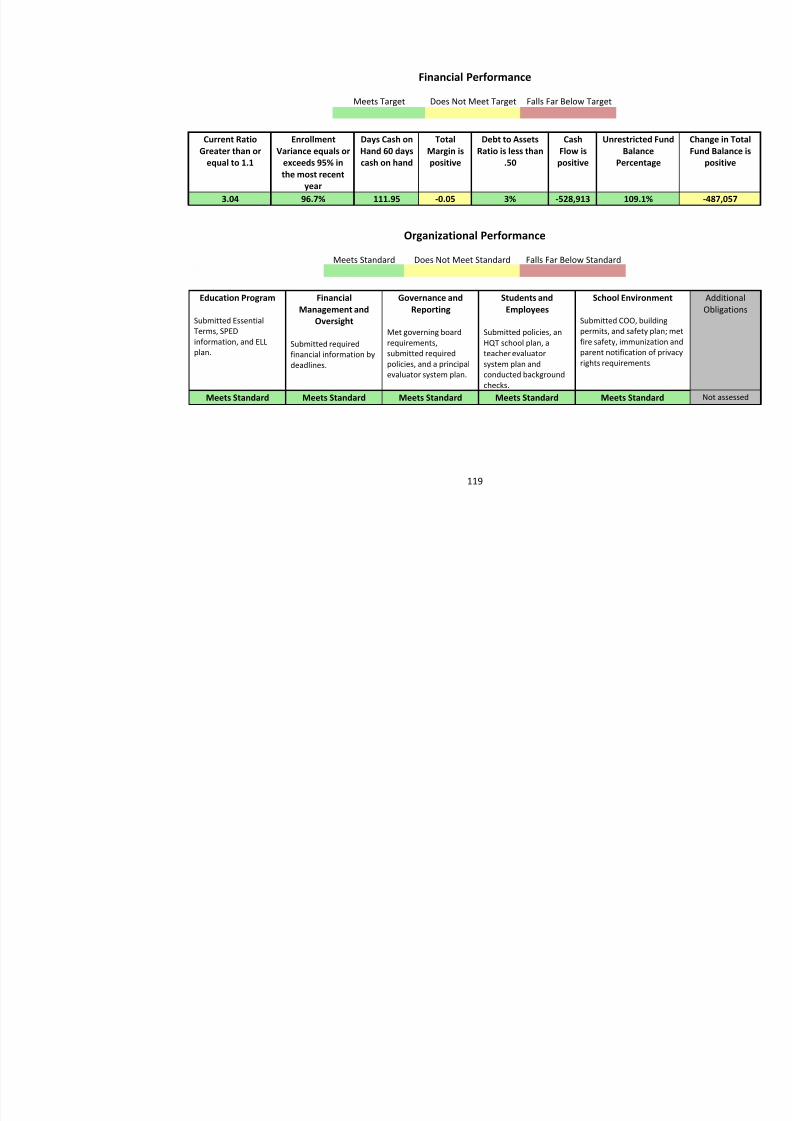
8/10/2019 Hawaii charter schools annual report
http://slidepdf.com/reader/full/hawaii-charter-schools-annual-report 122/268
119
Organizational Performance
Meets Standard Does Not Meet Standard Falls Far Below Standard
Education Program
Submitted EssentialTerms, SPEDinformation, and ELLplan.
FinancialManagement and
Oversight
Submitted requiredfinancial information bydeadlines.
Governance andReporting
Met governing boardrequirements,submitted requiredpolicies, and a principalevaluator system plan.
Students andEmployees
Submitted policies, anHQT school plan, ateacher evaluatorsystem plan andconducted backgroundchecks.
School Environment
Submitted COO, buildingpermits, and safety plan; mfire safety, immunization parent notification of privrights requirements.
Meets Standard Meets Standard Meets Standard Meets Standard Meets Standard
Kanu o ka ‘Āina New Century Public Charter School
Hawaii State Public Charter School Commission – Annual Report 2014
Mission: Kanu's mission is to kūlia I ka nu'u, or strive for the highest. A philosophy of excellence guides KANU as we colleimplement and continuously evaluate a quality, culturally-driven, intergenerational Hawaiian model of education with Aloha.
Notes: None
Board Chairperson(s): Mason MaikuiDirector(s): Allyson Tamura, Pat BerginRegion: West HawaiiGrades: K-12
Total Enrollment: 269SPED: 8.53%FRL: 54.26%ELL: 0.78%
Strive HI API Score: 21Classification: ContinuAutomatic Trigger: No
A d i P f
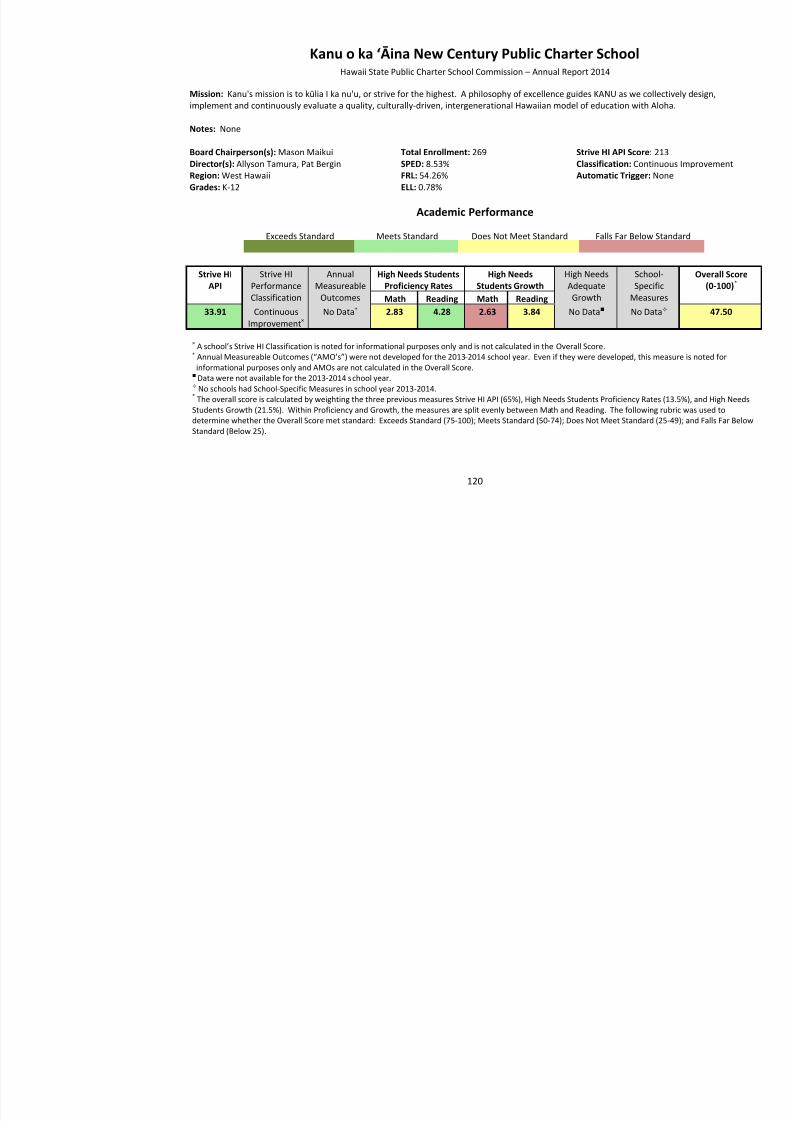
8/10/2019 Hawaii charter schools annual report
http://slidepdf.com/reader/full/hawaii-charter-schools-annual-report 123/268
120
Academic Performance
Exceeds Standard Meets Standard Does Not Meet Standard Falls Far Below Standard
Strive HIAPI Strive HIPerformanceClassification
AnnualMeasureableOutcomes
High Needs StudentsProficiency Rates High NeedsStudents Growth High NeedsAdequateGrowth
School-SpecificMeasuresMath Reading Math Reading
33.91 ContinuousImprovement ×
No Data + 2.83 4.28 2.63 3.84 No Data No Data
× A school’s Strive HI Classification is noted for informational purposes only and is not calculated in the Overall Score. + Annual Measureable Outcomes (“AMO’s”) were not developed for the 2013 -2014 school year. Even if they were developed, this measureinformational purposes only and AMOs are not calculated in the Overall Score. Data were not available for the 2013-2014 school year. No schools had School-Specific Measures in school year 2013-2014.
* The overall score is calculated by weighting the three previous measures Strive HI API (65%), High Needs Students Proficiency Rates (13.5%), a
Students Growth (21.5%). Within Proficiency and Growth, the measures are split evenly between Math and Reading. The following rubric was udetermine whether the Overall Score met standard: Exceeds Standard (75-100); Meets Standard (50-74); Does Not Meet Standard (25-49); and FaStandard (Below 25).
Financial Performance
Meets Target Does Not Meet Target Falls Far Below Target
Current RatioGreater than or
equal to 1.1
EnrollmentVariance equals or
exceeds 95% inthe most recent
year
Days Cash onHand 60 dayscash on hand
TotalMargin ispositive
Debt to AssetsRatio is less than
.50
CashFlow ispositive
Unrestricted FundBalance
Percentage
1.08 107.6% 19.73 0.00 91% 59,525 4%
Organizational Performance
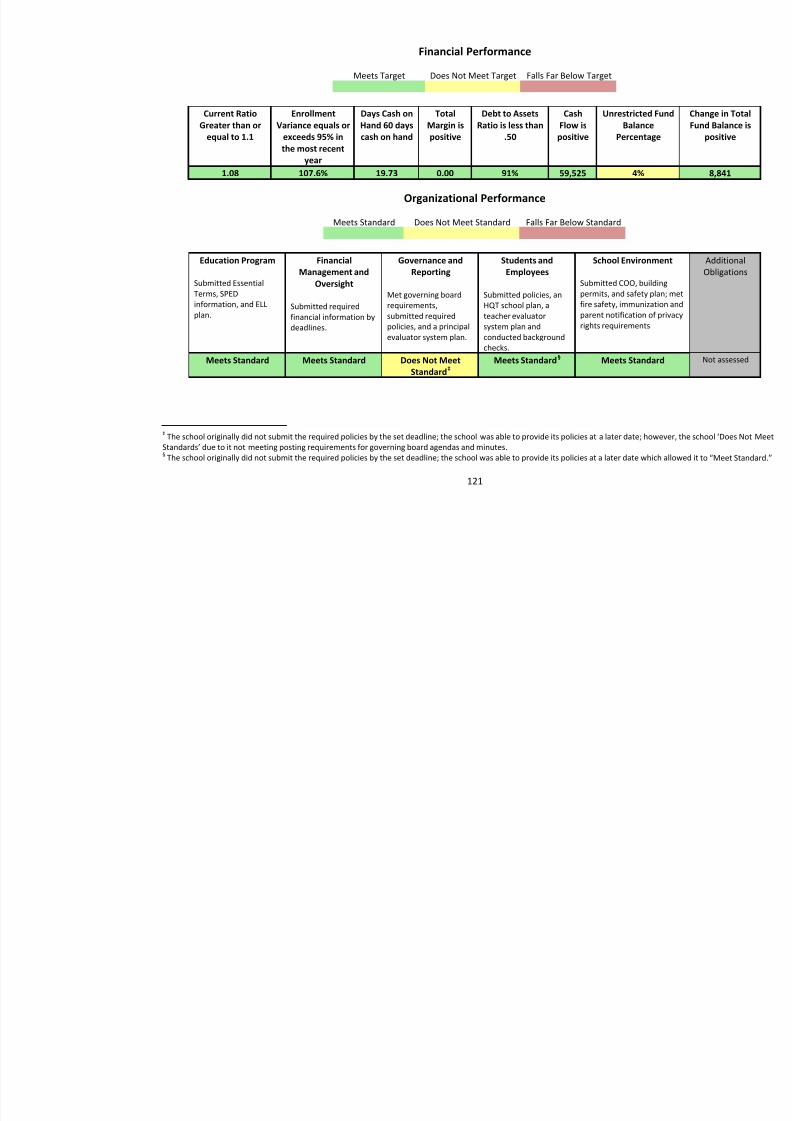
8/10/2019 Hawaii charter schools annual report
http://slidepdf.com/reader/full/hawaii-charter-schools-annual-report 124/268
121
Meets Standard Does Not Meet Standard Falls Far Below Standard
Education Program
Submitted EssentialTerms, SPEDinformation, and ELLplan.
FinancialManagement and
Oversight
Submitted requiredfinancial information bydeadlines.
Governance andReporting
Met governing boardrequirements,submitted requiredpolicies, and a principalevaluator system plan.
Students andEmployees
Submitted policies, anHQT school plan, ateacher evaluatorsystem plan andconducted backgroundchecks.
School Environment
Submitted COO, buildingpermits, and safety plan; mfire safety, immunization parent notification of privrights requirements.
Meets Standard Meets Standard Does Not MeetStandard 70F
‡ Meets Standard 71F
§ Meets Standard
‡ The school originally did not submit the required policies by the set deadline; the school was able to provide its policies at a later date; howeverStandards’ due to it not meeting posting requirements for governing board agendas and minutes. § The school originally did not submit the required policies by the set deadline; the school was able to provide its policies at a later date which allowed it
Kanuikapono Public Charter School
Hawaii State Public Charter School Commission – Annual Report 2014
Mission: To nurture lifelong learners able to embrace the world of our ancestors and the 21st century; skilled and community mindedaloha and respect for self, family, and the environment.
Notes: None
Board Chairperson(s): Puna Kalama DawsonDirector(s): Ipo TorioRegion: KauaiGrades: K-12
Total Enrollment: 150SPED: 7.06%FRL: 55.29%ELL: 0%
Strive HI API Score: 15Classification: ContinuAutomatic Trigger: No
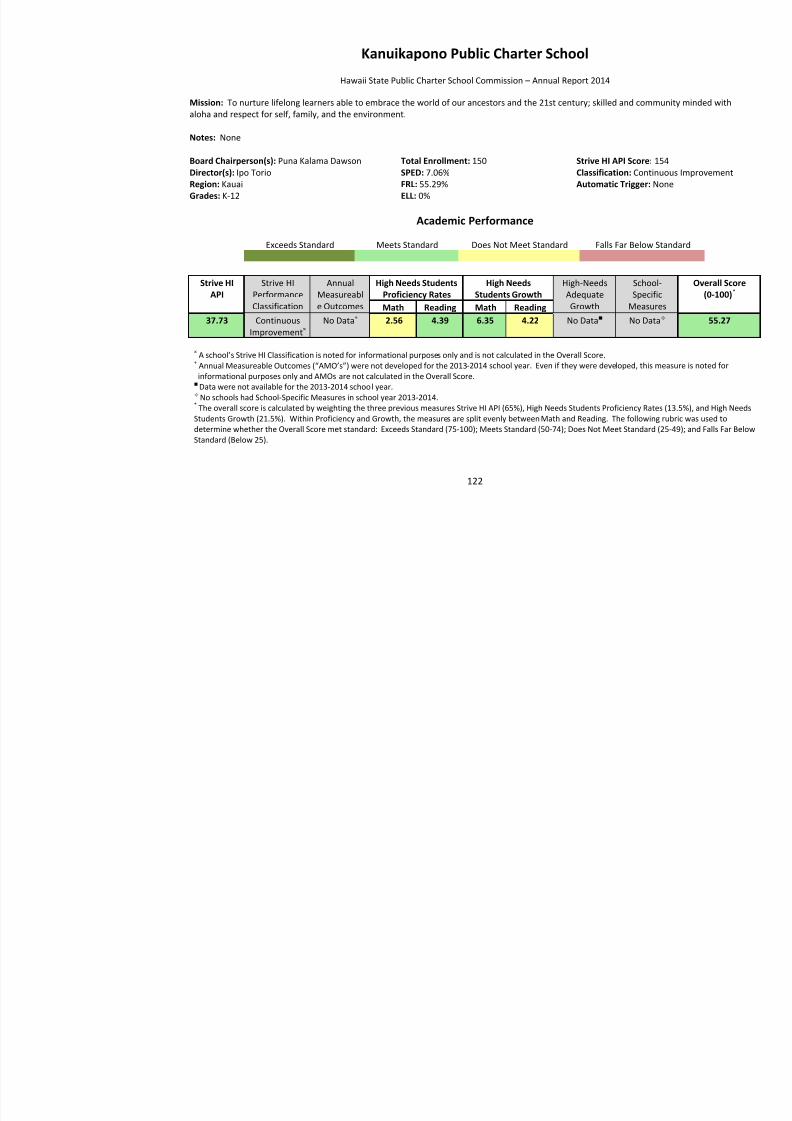
8/10/2019 Hawaii charter schools annual report
http://slidepdf.com/reader/full/hawaii-charter-schools-annual-report 125/268
122
Academic Performance
Exceeds Standard Meets Standard Does Not Meet Standard Falls Far Below Standard
Strive HIAPI
Strive HIPerformanceClassification
AnnualMeasureable Outcomes
High Needs StudentsProficiency Rates
High NeedsStudents Growth
High-NeedsAdequateGrowth
School-Specific
MeasuresMath Reading Math Reading37.73 Continuous
Improvement × No Data + 2.56 4.39 6.35 4.22 No Data No Data
× A school’s Strive HI Classification is noted for informational purposes only and is not calculated in the Overall Score.+ Annual Measureable Outcomes (“AMO’s”) were not developed for the 2013 -2014 school year. Even if they were developed, this measurinformational purposes only and AMOs are not calculated in the Overall Score. Data were not available for the 2013-2014 school year.
No schools had School-Specific Measures in school year 2013-2014.* The overall score is calculated by weighting the three previous measures Strive HI API (65%), High Needs Students Proficiency Rates (13.5%), Students Growth (21.5%). Within Proficiency and Growth, the measures are split evenly between Math and Reading. The following rubric was udetermine whether the Overall Score met standard: Exceeds Standard (75-100); Meets Standard (50-74); Does Not Meet Standard (25-49); and FaStandard (Below 25).
Financial Performance
Meets Target Does Not Meet Target Falls Far Below Target
Current RatioGreater than or
equal to 1.1
EnrollmentVariance equals or
exceeds 95% inthe most recent
year
Days Cash onHand 60 dayscash on hand
TotalMargin ispositive
Debt to AssetsRatio is less than
.50
CashFlow ispositive
Unrestricted FundBalance
Percentage
5.20 96.8% 35.94 0.07 18% 47,995 31.7%
Organizational Performance
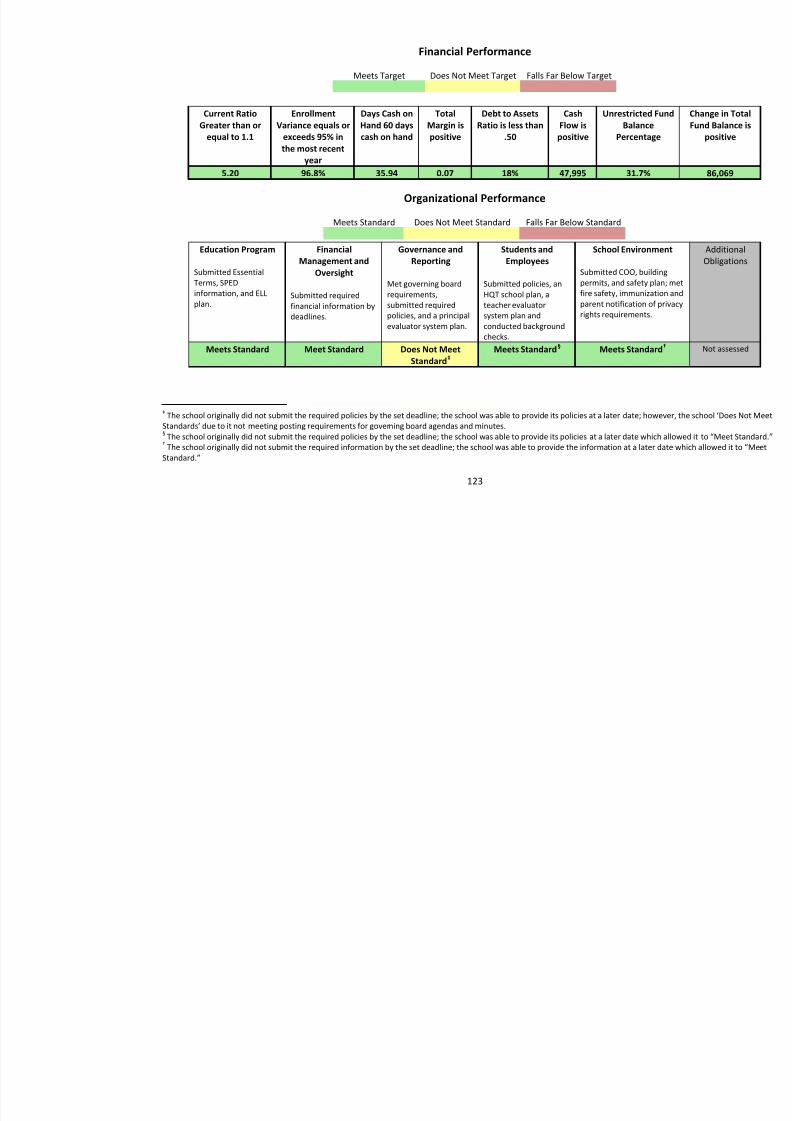
8/10/2019 Hawaii charter schools annual report
http://slidepdf.com/reader/full/hawaii-charter-schools-annual-report 126/268
123
Meets Standard Does Not Meet Standard Falls Far Below Standard
Education Program
Submitted EssentialTerms, SPEDinformation, and ELLplan.
FinancialManagement and
Oversight
Submitted requiredfinancial information bydeadlines.
Governance andReporting
Met governing boardrequirements,submitted requiredpolicies, and a principalevaluator system plan.
Students andEmployees
Submitted policies, anHQT school plan, ateacher evaluatorsystem plan andconducted backgroundchecks.
School Environment
Submitted COO, buildingpermits, and safety plan; mfire safety, immunization parent notification of privrights requirements.
Meets Standard Meet Standard Does Not MeetStandard 72F
‡ Meets Standard 73F
§ Meets Standard
‡ The school originally did not submit the required policies by the set deadline; the school was able to provid e its policies at a later date; howevStandards’ due to it not meeting posting requirements for gover ning board agendas and minutes.§ The school originally did not submit the required policies by the set deadline; the school w as able to provide its policies at a later date which a† The school originally did not submit the required information by the set deadline; the school was able to provide the informa tion at a later daStandard.”
Kawaikini New Century Public Charter SchoolHawaii State Public Charter School Commission – Annual Report 2014
Mission: Through the medium of the Hawaiian language, Kawaikini New Century Public Charter School will create a supportive leaenvironment where indigenous cultural knowledge is valued, applied, and perpetuated.
Notes: This school opted to exclude grades 3-5 from the 2014 Academic Performance Assessment. This option was available only fo
medium and immersion schools.
Board Chairperson(s): Lei‘ilima Rapozo Director(s): Kaleimakamae KaauwaiRegion: KauaiGrades: K 12
Total Enrollment: 117SPED: 5.36%FRL: 73.21%ELL:0%
Strive HI API Score: 20Classification: ContinuAutomatic Trigger: No
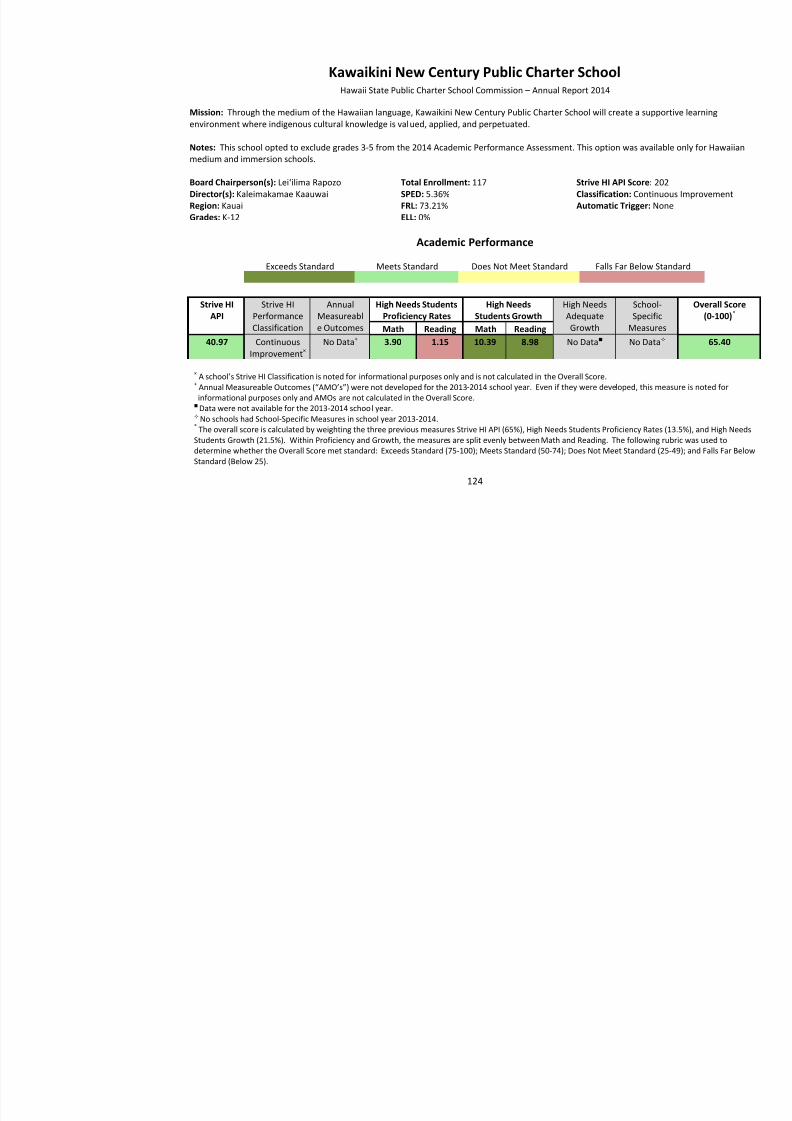
8/10/2019 Hawaii charter schools annual report
http://slidepdf.com/reader/full/hawaii-charter-schools-annual-report 127/268
124
Grades: K-12 ELL: 0%
Academic Performance
Exceeds Standard Meets Standard Does Not Meet Standard Falls Far Below Standard
Strive HIAPI
Strive HIPerformanceClassification
AnnualMeasureable Outcomes
High Needs StudentsProficiency Rates
High NeedsStudents Growth
High NeedsAdequateGrowth
School-Specific
MeasuresMath Reading Math Reading40.97 Continuous
Improvement × No Data + 3.90 1.15 10.39 8.98 No Data No Data
× A school’s Strive HI Classification is noted for informational purposes only and is not calculated in the Overall Score. + Annual Measureable Outcomes (“AMO’s”) were not developed for the 2013 -2014 school year. Even if they were developed, this measur
informational purposes only and AMOs are not calculated in the Overall Score. Data were not available for the 2013-2014 school year. No schools had School-Specific Measures in school year 2013-2014.
* The overall score is calculated by weighting the three previous measures Strive HI API (65%), High Needs Students Proficiency Rates (13.5%), Students Growth (21.5%). Within Proficiency and Growth, the measures are split evenly between Math and Reading. The following rubric was udetermine whether the Overall Score met standard: Exceeds Standard (75-100); Meets Standard (50-74); Does Not Meet Standard (25-49); and FaStandard (Below 25).
Financial Performance
Meets Target Does Not Meet Target Falls Far Below Target
Current RatioGreater than or
equal to 1.1
EnrollmentVariance equals or
exceeds 95% inthe most recentyear
Days Cash onHand 60 days
cash on hand
TotalMargin is
positive
Debt to AssetsRatio is less than
.50
CashFlow is
positive
Unrestricted FundBalance
Percentage
1.65 88% 45.36 -0.21 9% -36,413 96.5%
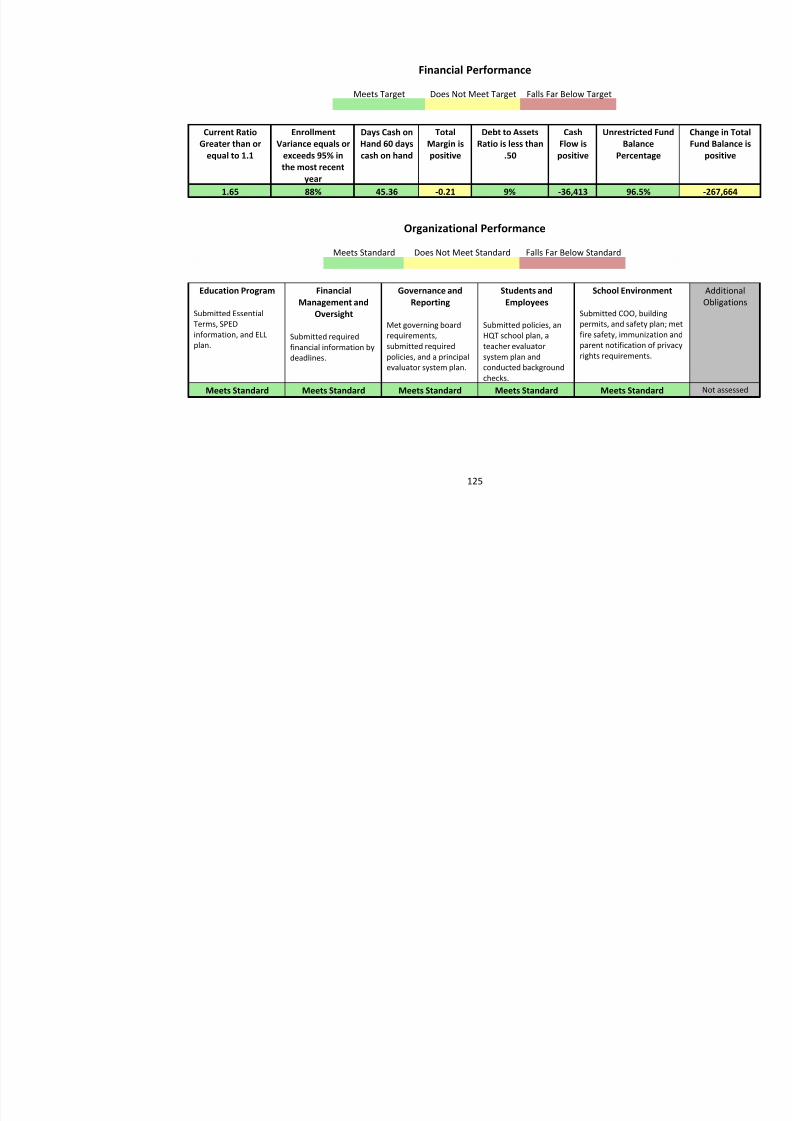
8/10/2019 Hawaii charter schools annual report
http://slidepdf.com/reader/full/hawaii-charter-schools-annual-report 128/268
125
Organizational Performance
Meets Standard Does Not Meet Standard Falls Far Below Standard
Education Program
Submitted EssentialTerms, SPEDinformation, and ELLplan.
FinancialManagement and
Oversight
Submitted requiredfinancial information bydeadlines.
Governance andReporting
Met governing boardrequirements,submitted requiredpolicies, and a principalevaluator system plan.
Students andEmployees
Submitted policies, anHQT school plan, ateacher evaluatorsystem plan andconducted backgroundchecks.
School Environment
Submitted COO, buildingpermits, and safety plan; mfire safety, immunization aparent notification of privrights requirements.
Meets Standard Meets Standard Meets Standard Meets Standard Meets Standard
Ke Ana La‘ahana PCS Hawaii State Public Charter School Commission – Annual Report 2014
Mission: To recognize, nurture, and foster cultural identity and cultural awareness in an environment that has historical connections alineal linkage to student. Students engage in critical thinking and demonstrate complete mastery of the academia for the future as aresult of this educational program that is driven by family, community, and culture.
Notes: None
Board Chairperson(s): Jason CifraDirector(s): Mapuana WaipaRegion: East HawaiiGrades: 7-12
Total Enrollment: 51SPED: 15.38%FRL: 88.46%ELL: 0%
Strive HI API Score: 17Classification: ContinuAutomatic Trigger: No
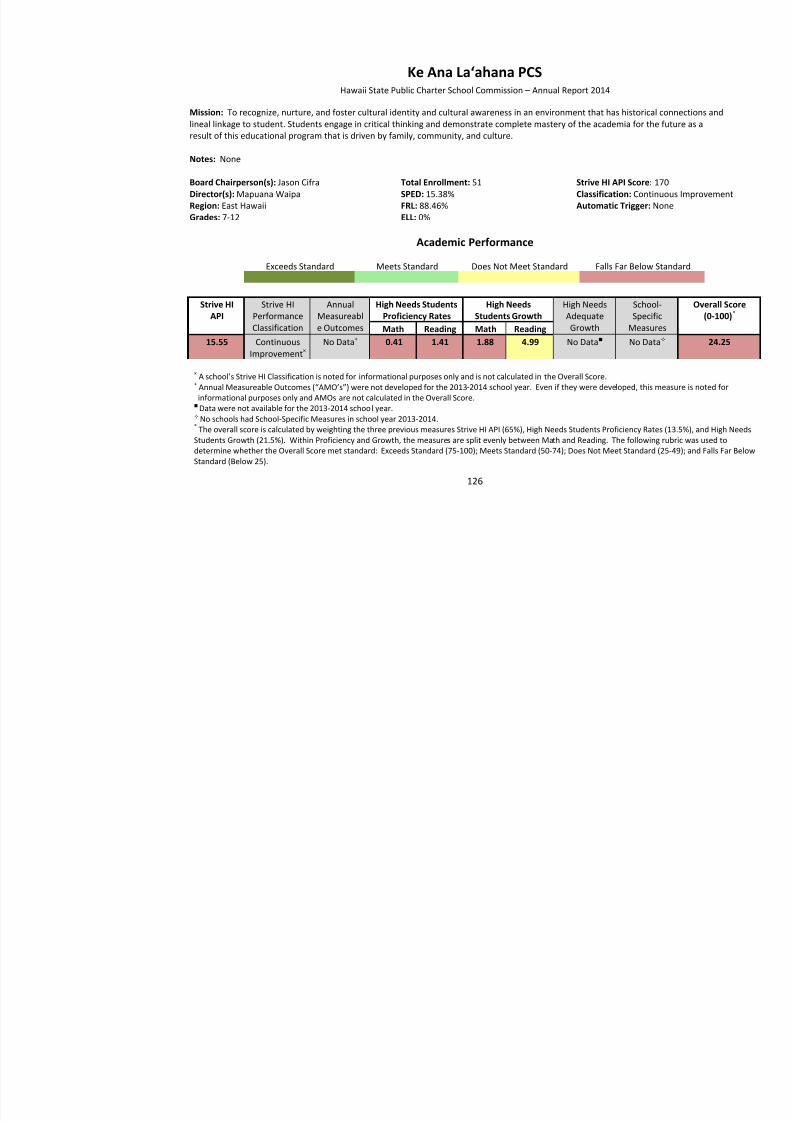
8/10/2019 Hawaii charter schools annual report
http://slidepdf.com/reader/full/hawaii-charter-schools-annual-report 129/268
126
Academic Performance
Exceeds Standard Meets Standard Does Not Meet Standard Falls Far Below Standard
Strive HIAPI
Strive HIPerformanceClassification
AnnualMeasureable Outcomes
High Needs StudentsProficiency Rates
High NeedsStudents Growth
High NeedsAdequateGrowth
School-Specific
MeasuresMath Reading Math Reading15.55 Continuous
Improvement × No Data + 0.41 1.41 1.88 4.99 No Data No Data
× A school’s Strive HI Classification is noted for informational purposes only and is not calculated in the Overall Score. + Annual Measureable Outcomes (“AMO’s”) were not developed for the 2013 -2014 school year. Even if they were developed, this measur
informational purposes only and AMOs are not calculated in the Overall Score. Data were not available for the 2013-2014 school year. No schools had School-Specific Measures in school year 2013-2014.
* The overall score is calculated by weighting the three previous measures Strive HI API (65%), High Needs Students Proficiency Rates (13.5%), Students Growth (21.5%). Within Proficiency and Growth, the measures are split evenly between Math and Reading. The following rubric was udetermine whether the Overall Score met standard: Exceeds Standard (75-100); Meets Standard (50-74); Does Not Meet Standard (25-49); and FaStandard (Below 25).
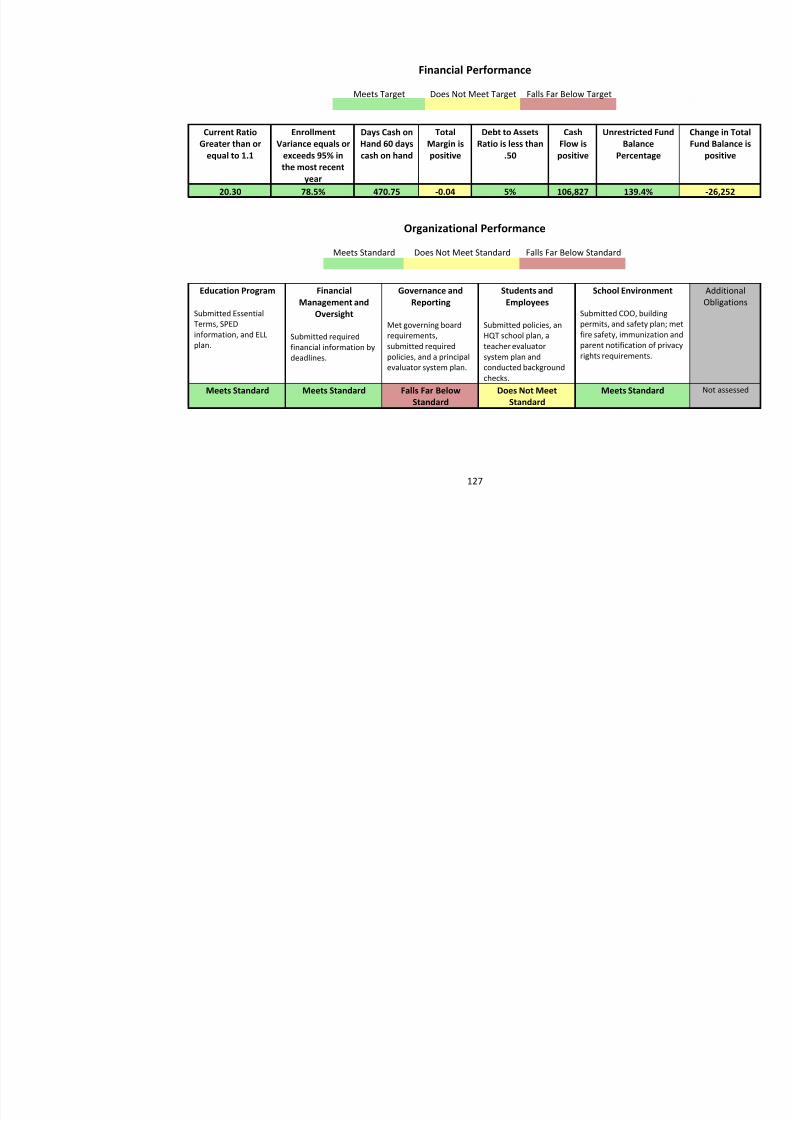
8/10/2019 Hawaii charter schools annual report
http://slidepdf.com/reader/full/hawaii-charter-schools-annual-report 130/268
Ke Kula ‘o Nāwahīokalani‘ōpu‘u Iki, LPCS Hawaii State Public Charter School Commission – Annual Report 2014
Mission: Educational Mission – Students of Ke Kula ʻO Nāwahīokalaniʻōpuʻu are educated upon a culturally Hawaiian foundis the basis upon which students are impelled to:• Bring honor to ancestors • Seek and attain knowledge to sustain family
• Contribute to the well -being and flourishing of the Hawaiian language and culture; and• Contribute to the quality of life in Hawaiʻi. School Mission – Ke Kula ʻO Nāwahīokalaniʻōpuʻu is committed to securing a school community built upon culturally rootedlove of spirituality, love of family, love of language, love of knowledge, love of land, love of fellow man, and love of all people.
Board Chairperson(s): Tricia Kehaulani Aipia-Peters Total Enrollment: 273 Strive HI API Score: 76
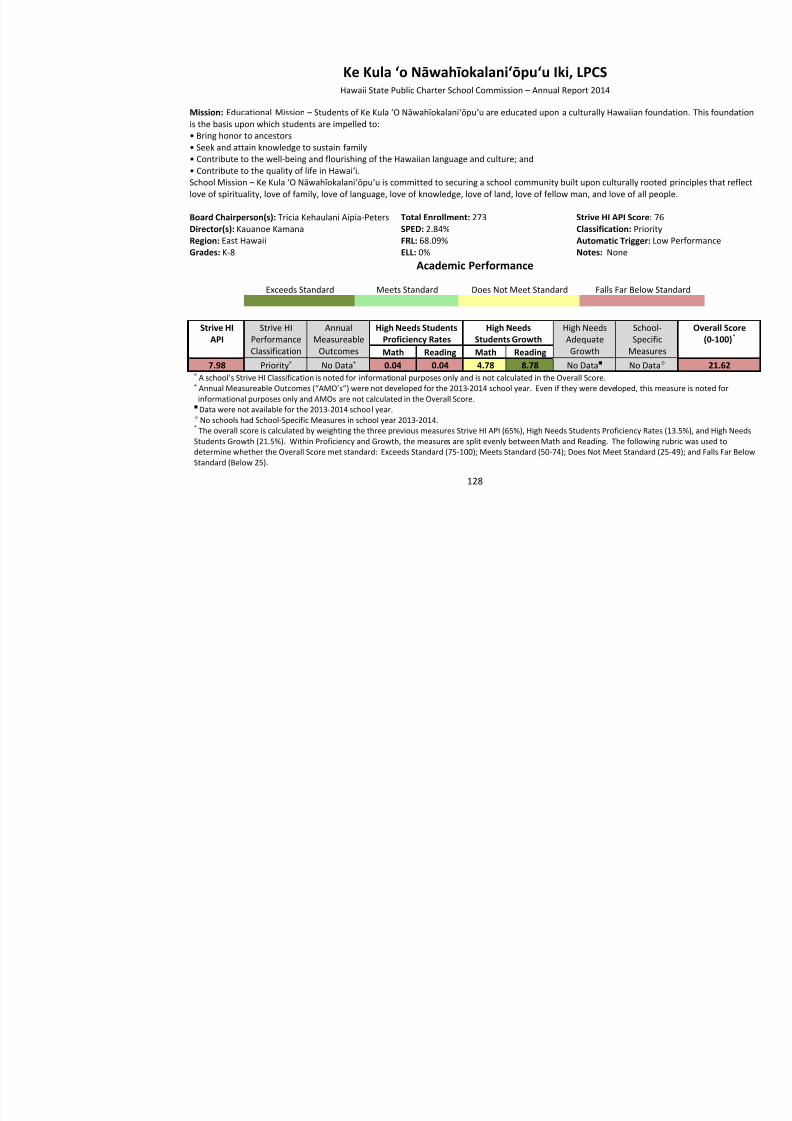
8/10/2019 Hawaii charter schools annual report
http://slidepdf.com/reader/full/hawaii-charter-schools-annual-report 131/268
128
Director(s): Kauanoe KamanaRegion: East HawaiiGrades: K-8
SPED: 2.84%FRL: 68.09%ELL: 0%
Classification: PriorityAutomatic Trigger: LoNotes: None
Academic Performance
Exceeds Standard Meets Standard Does Not Meet Standard Falls Far Below Standard
Strive HIAPI
Strive HIPerformanceClassification
AnnualMeasureable
Outcomes
High Needs StudentsProficiency Rates
High NeedsStudents Growth
High NeedsAdequateGrowth
School-Specific
MeasuresMath Reading Math Reading7.98 Priority × No Data + 0.04 0.04 4.78 8.78 No Data No Data
× A school’s Strive HI Classification is noted for informational purposes only and is not calculated in the Overall Score.+ Annual Measureable Outcomes (“AMO’s”) were not developed for the 2013 -2014 school year. Even if they were developed, this measur
informational purposes only and AMOs are not calculated in the Overall Score. Data were not available for the 2013-2014 school year. No schools had School-Specific Measures in school year 2013-2014.
* The overall score is calculated by weighting the three previous measures Strive HI API (65%), High Needs Students Proficiency Rates (13.5%), Students Growth (21.5%). Within Proficiency and Growth, the measures are split evenly between Math and Reading. The following rubric was udetermine whether the Overall Score met standard: Exceeds Standard (75-100); Meets Standard (50-74); Does Not Meet Standard (25-49); and FaStandard (Below 25).
Financial Performance
Meets Target Does Not Meet Target Falls Far Below Target
Current Ratio
Greater than orequal to 1.1
Enrollment
Variance equals orexceeds 95% inthe most recent
year
Days Cash on
Hand 60 dayscash on hand
Total
Margin ispositive
Debt to Assets
Ratio is less than.50
Cash
Flow ispositive
Unrestricted Fund
BalancePercentage
29.59 98.6% 369.10 0.13 3% 1,795,023 100.8%
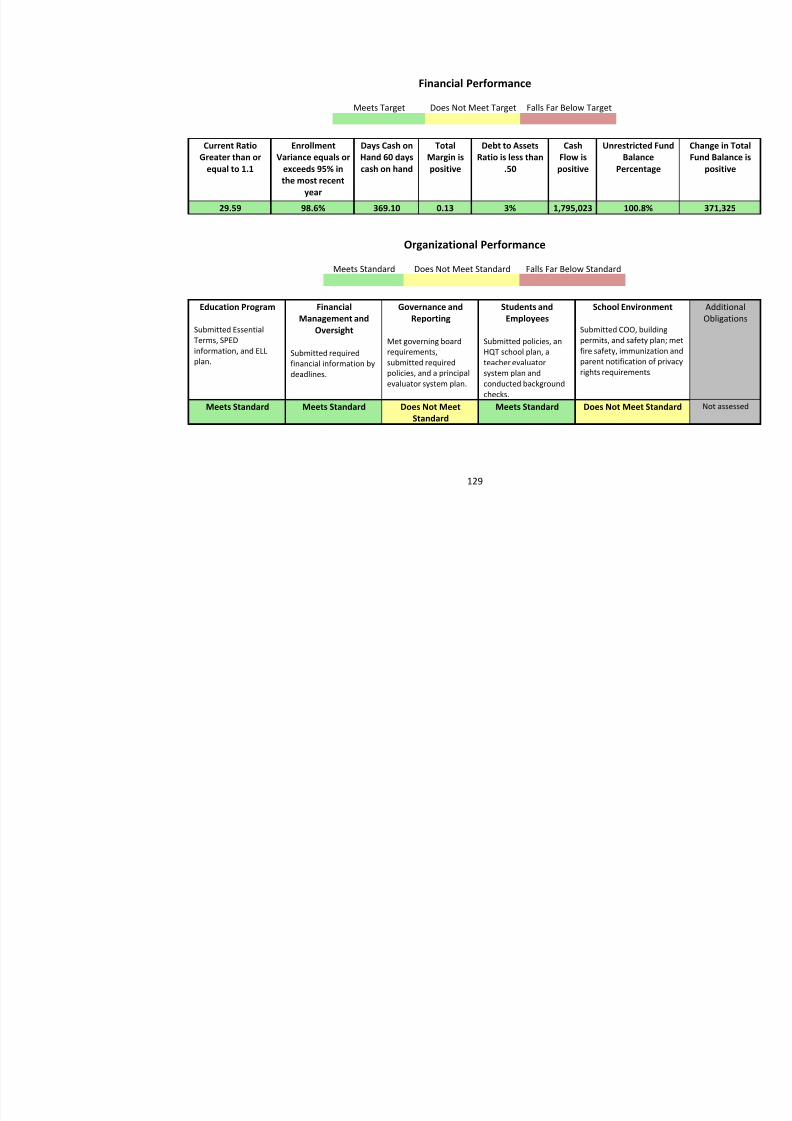
8/10/2019 Hawaii charter schools annual report
http://slidepdf.com/reader/full/hawaii-charter-schools-annual-report 132/268
129
Organizational Performance
Meets Standard Does Not Meet Standard Falls Far Below Standard
Education Program
Submitted EssentialTerms, SPEDinformation, and ELLplan.
FinancialManagement and
Oversight
Submitted requiredfinancial information bydeadlines.
Governance andReporting
Met governing boardrequirements,submitted requiredpolicies, and a principalevaluator system plan.
Students andEmployees
Submitted policies, anHQT school plan, ateacher evaluatorsystem plan andconducted backgroundchecks.
School Environment
Submitted COO, buildingpermits, and safety plan; mfire safety, immunization parent notification of privrights requirements.
Meets Standard Meets Standard Does Not MeetStandard
Meets Standard Does Not Meet Standard
Ke Kula ‘o Samuel M. Kamakau, LPCS Hawaii State Public Charter School Commission – Annual Report 2014
Mission: ‘O ko mākou ala nu‘ukia ka mālama ‘ana i honua mauli ola i waiwai i ka ‘ike a me ka lawena aloha o nā kūpuna i mo ka lanakila.Our mission is to foster success for all members of our learning community by providing a culturally healthy and responsive learning
Notes: This school opted to exclude grades 3-6 from the 2014 Academic Performance Assessment. This option was available only fomedium and immersion schools.
Board Chairperson(s): Kehau GlasscoDirector(s): Meahilhila KellingRegion: Windward OahuG d P K 12
Total Enrollment: 134SPED: 0%FRL: 60%ELL 0%
Strive HI API Score: 20Classification: ContinuAutomatic Trigger: No
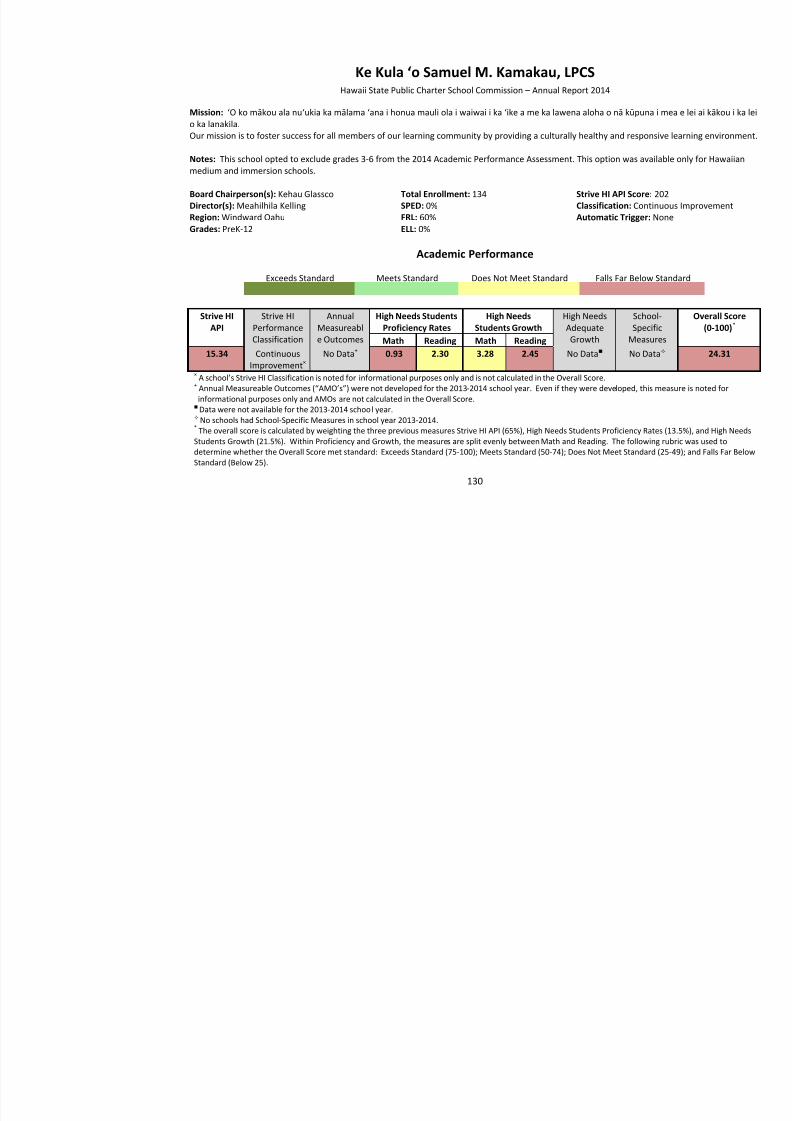
8/10/2019 Hawaii charter schools annual report
http://slidepdf.com/reader/full/hawaii-charter-schools-annual-report 133/268
130
Grades: PreK-12 ELL: 0%
Academic Performance
Exceeds Standard Meets Standard Does Not Meet Standard Falls Far Below Standard
Strive HIAPI
Strive HIPerformanceClassification
AnnualMeasureable Outcomes
High Needs StudentsProficiency Rates
High NeedsStudents Growth
High NeedsAdequateGrowth
School-Specific
MeasuresMath Reading Math Reading15.34 Continuous
Improvement × No Data + 0.93 2.30 3.28 2.45 No Data No Data
× A school’s Strive HI Classification is noted for informational purposes only and is not calculated in the Overall Score.+ Annual Measureable Outcomes (“AMO’s”) were not developed for the 2013 -2014 school year. Even if they were developed, this measur
informational purposes only and AMOs are not calculated in the Overall Score. Data were not available for the 2013-2014 school year. No schools had School-Specific Measures in school year 2013-2014.
* The overall score is calculated by weighting the three previous measures Strive HI API (65%), High Needs Students Proficiency Rates (13.5%), Students Growth (21.5%). Within Proficiency and Growth, the measures are split evenly between Math and Reading. The following rubric was udetermine whether the Overall Score met standard: Exceeds Standard (75-100); Meets Standard (50-74); Does Not Meet Standard (25-49); and FaStandard (Below 25).
Financial Performance
Meets Target Does Not Meet Target Falls Far Below Target
Current RatioGreater than or
equal to 1.1
EnrollmentVariance equals or
exceeds 95% inthe most recent
year
Days Cash onHand 60 dayscash on hand
TotalMargin ispositive
Debt to AssetsRatio is less than
.50
CashFlow ispositive
Unrestricted FundBalance
Percentage
5.95 95.7% 172.09 -0.11 13% -36,333 78.4%
Organizational Performance

8/10/2019 Hawaii charter schools annual report
http://slidepdf.com/reader/full/hawaii-charter-schools-annual-report 134/268
131
Organizational Performance
Meets Standard Does Not Meet Standard Falls Far Below Standard
Education Program
Submitted EssentialTerms, SPEDinformation, and ELLplan.
FinancialManagement and
Oversight
Submitted requiredfinancial information bydeadlines.
Governance andReporting
Met governing boardrequirements,submitted requiredpolicies, and a principalevaluator system plan.
Students andEmployees
Submitted policies, anHQT school plan, ateacher evaluatorsystem plan andconducted backgroundchecks.
School Environment
Submitted COO, buildingpermits, and safety plan; mfire safety, immunization parent notification of privrights requirements.
Meets Standard Meets Standard Meets Standard Meets Standard Meets Standard
Ke Kula Niihau O Kekaha Learning CenterHawaii State Public Charter School Commission – Annual Report 2014
Mission: Ke Kula Niihau O Kekaha will perpetuate and strengthen the language and culture of Niihau among the children and youthcommunity living on Kauai, as well as meet the special needs of this community by providing an education which results in a positivetoward a lifelong search for knowledge and preparing students fo r success in today’s world of rapid change and technology
Notes: This school opted to exclude grades 3-5 from the 2014 Academic Performance Assessment. This option was available only fomedium and immersion schools.
Board Chairperson(s): Dana KaohelauliiDirector(s): Haunani SewardRegion: KauaiGrades: K-12
Total Enrollment: 39SPED: 0%FRL: 100%ELL:100%
Strive HI API Score: 15Classification: FocusAutomatic Trigger: Lo
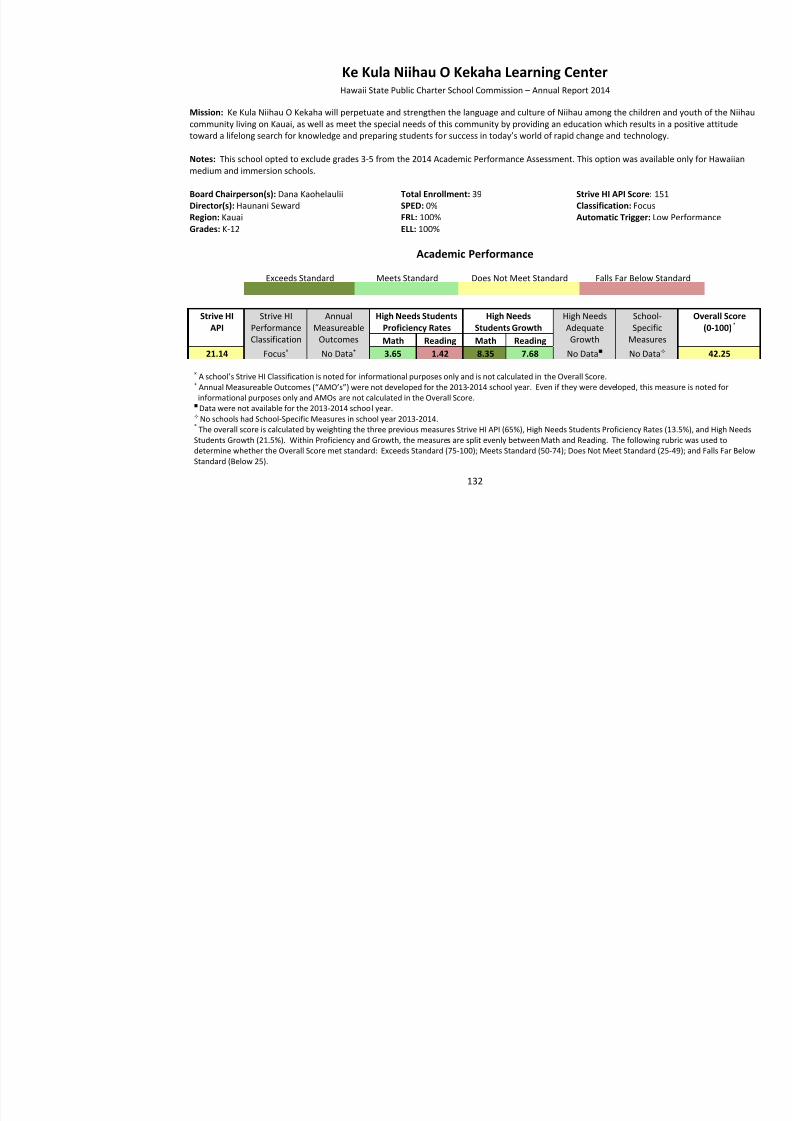
8/10/2019 Hawaii charter schools annual report
http://slidepdf.com/reader/full/hawaii-charter-schools-annual-report 135/268
132
Grades: K 12 ELL: 100%
Academic Performance
Exceeds Standard Meets Standard Does Not Meet Standard Falls Far Below Standard
Strive HIAPI
Strive HIPerformanceClassification
AnnualMeasureable
Outcomes
High Needs StudentsProficiency Rates
High NeedsStudents Growth
High NeedsAdequateGrowth
School-Specific
MeasuresMath Reading Math Reading21.14 Focus × No Data + 3.65 1.42 8.35 7.68 No Data No Data
× A school’s Strive HI Classification is noted for informational purposes only and is not calculated in the Overall Score. + Annual Measureable Outcomes (“AMO’s”) were not developed for the 2013 -2014 school year. Even if they were developed, this measurinformational purposes only and AMOs are not calculated in the Overall Score. Data were not available for the 2013-2014 school year. No schools had School-Specific Measures in school year 2013-2014.
* The overall score is calculated by weighting the three previous measures Strive HI API (65%), High Needs Students Proficiency Rates (13.5%), Students Growth (21.5%). Within Proficiency and Growth, the measures are split evenly between Math and Reading. The following rubric was udetermine whether the Overall Score met standard: Exceeds Standard (75-100); Meets Standard (50-74); Does Not Meet Standard (25-49); and FaStandard (Below 25).
Financial Performance
Meets Target Does Not Meet Target Falls Far Below Target
Current RatioGreater than or
equal to 1.1
EnrollmentVariance equals or
exceeds 95% inthe most recent
year
Days Cash onHand 60 dayscash on hand
TotalMargin ispositive
Debt to AssetsRatio is less than
.50
CashFlow ispositive
Unrestricted FundBalance
Percentage
5.92 108.3% 136.26 -0.07 8% -46,601 92.9%
Organizational Performance
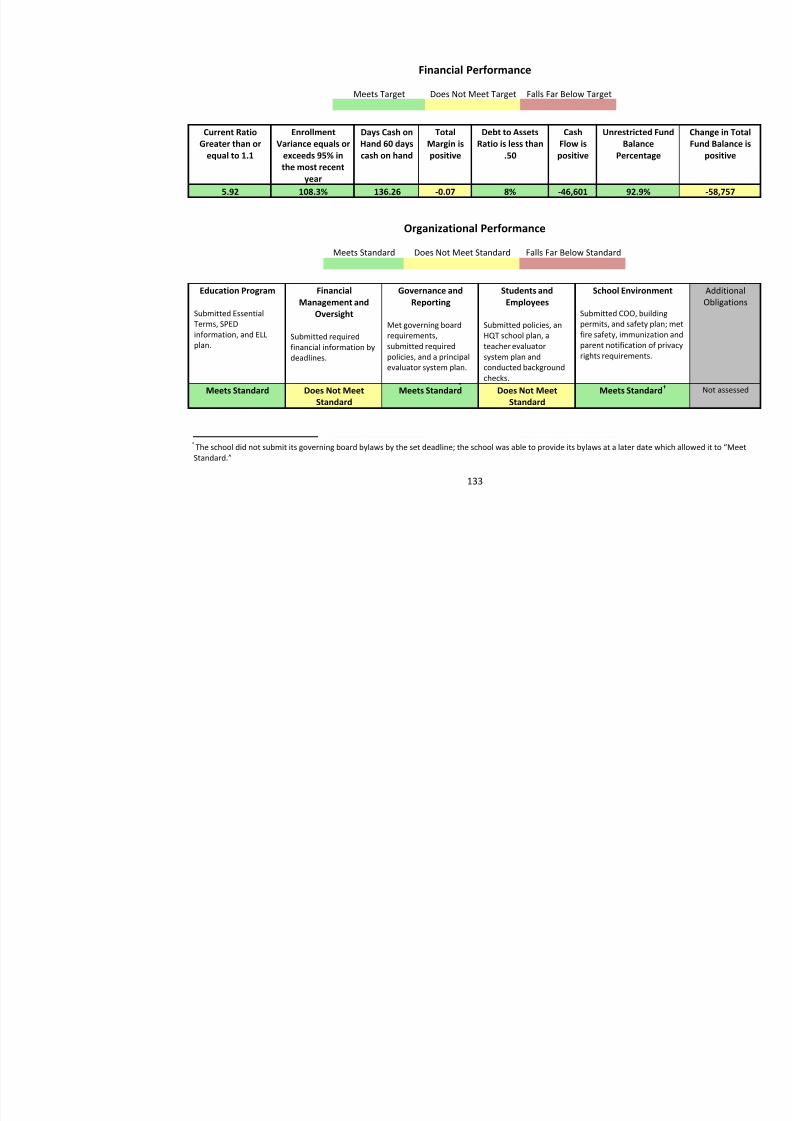
8/10/2019 Hawaii charter schools annual report
http://slidepdf.com/reader/full/hawaii-charter-schools-annual-report 136/268
133
g
Meets Standard Does Not Meet Standard Falls Far Below Standard
Education Program
Submitted EssentialTerms, SPEDinformation, and ELLplan.
FinancialManagement and
Oversight
Submitted requiredfinancial information bydeadlines.
Governance andReporting
Met governing boardrequirements,submitted requiredpolicies, and a principalevaluator system plan.
Students andEmployees
Submitted policies, anHQT school plan, ateacher evaluatorsystem plan andconducted backgroundchecks.
School Environment
Submitted COO, buildingpermits, and safety plan; mfire safety, immunization parent notification of privrights requirements.
Meets Standard Does Not Meet
Standard
Meets Standard 75F Does Not Meet
Standard
Meets Standard
͌ The school did not submit its governing board bylaws by the set deadline; the school was able to provide its bylaws at a later date whichStandard.”
Kihei Charter SchoolHawaii State Public Charter School Commission – Annual Report 2014
Mission: Mission: To conceptualize, organize, and build innovative learning environments with custom designed educational programprepare students for a satisfying and productive l ife in the 21st Century.
Notes: None
Board Chairperson(s): Steve PerkinsDirector(s): George WinterscheidRegion: MauiGrades: K-12
Total Enrollment: 558SPED: 4.18%FRL: 31.71%ELL: 0.35%
Strive HI API Score: 20Classification: FocusAutomatic Trigger: Lo
Academic Performance
Exceeds Standard Meets Standard Does Not Meet Standard Falls Far Below Standard
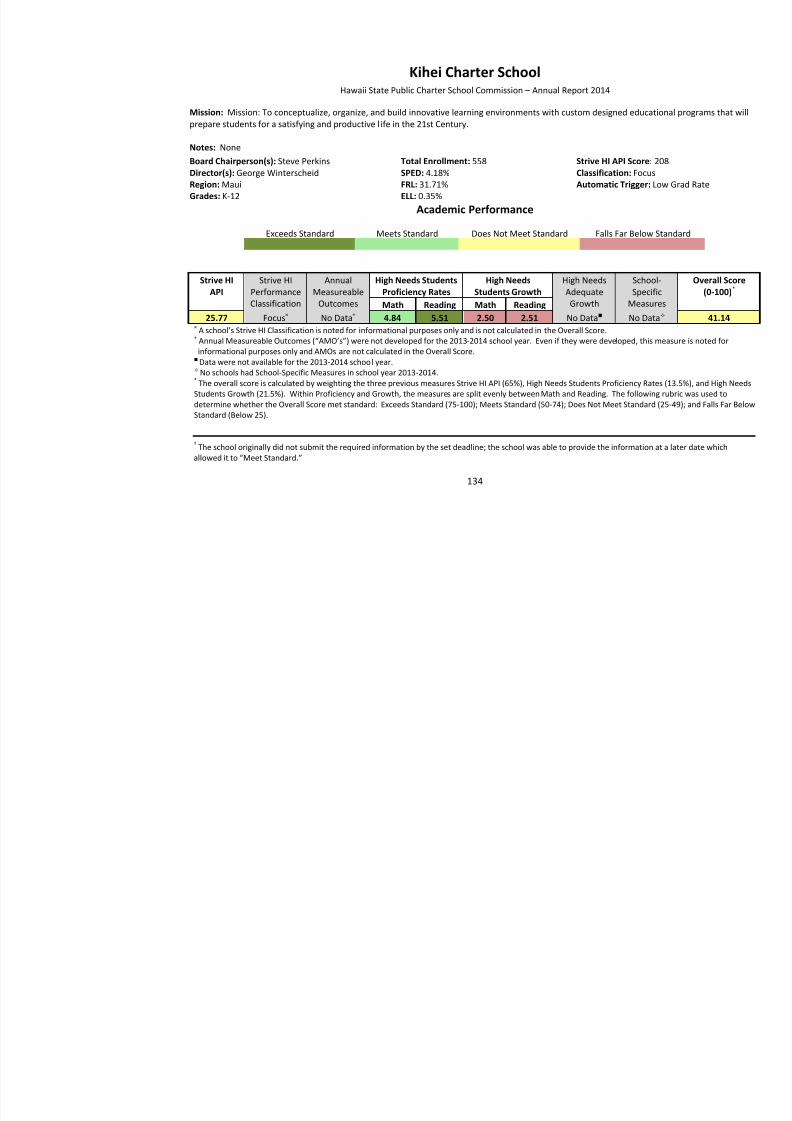
8/10/2019 Hawaii charter schools annual report
http://slidepdf.com/reader/full/hawaii-charter-schools-annual-report 137/268
134
Exceeds Standard Meets Standard Does Not Meet Standard Falls Far Below Standard
Strive HIAPI Strive HIPerformanceClassification
AnnualMeasureableOutcomes
High Needs StudentsProficiency Rates High NeedsStudents Growth High NeedsAdequateGrowth
School-SpecificMeasuresMath Reading Math Reading
25.77 Focus × No Data + 4.84 5.51 2.50 2.51 No Data No Data× A school’s Strive HI Classification is noted for informational purposes only and is not calculated in the Overall Score. + Annual Measureable Outcomes (“AMO’s”) were not developed for the 2013 -2014 school year. Even if they were developed, this measurinformational purposes only and AMOs are not calculated in the Overall Score. Data were not available for the 2013-2014 school year. No schools had School-Specific Measures in school year 2013-2014.
* The overall score is calculated by weighting the three previous measures Strive HI API (65%), High Needs Students Proficiency Rates (13.5%), Students Growth (21.5%). Within Proficiency and Growth, the measures are split evenly between Math and Reading. The following rubric was u
determine whether the Overall Score met standard: Exceeds Standard (75-100); Meets Standard (50-74); Does Not Meet Standard (25-49); and FaStandard (Below 25).
† The school originally did not submit the required information by the set deadline; the school was able to provide the information at a later date wallowed it to “Meet Standard.”
Financial Performance
Meets Target Does Not Meet Target Falls Far Below Target
Current RatioGreater than or
equal to 1.1
EnrollmentVariance equals or
exceeds 95% inthe most recent
year
Days Cash onHand 60 dayscash on hand
TotalMargin ispositive
Debt to AssetsRatio is less than
.50
CashFlow ispositive
Unrestricted FundBalance
Percentage
50.06 93% 162.09 0.00 2% -12,309 44.4%
Organizational Performance
Meets Standard Does Not Meet Standard Falls Far Below Standard
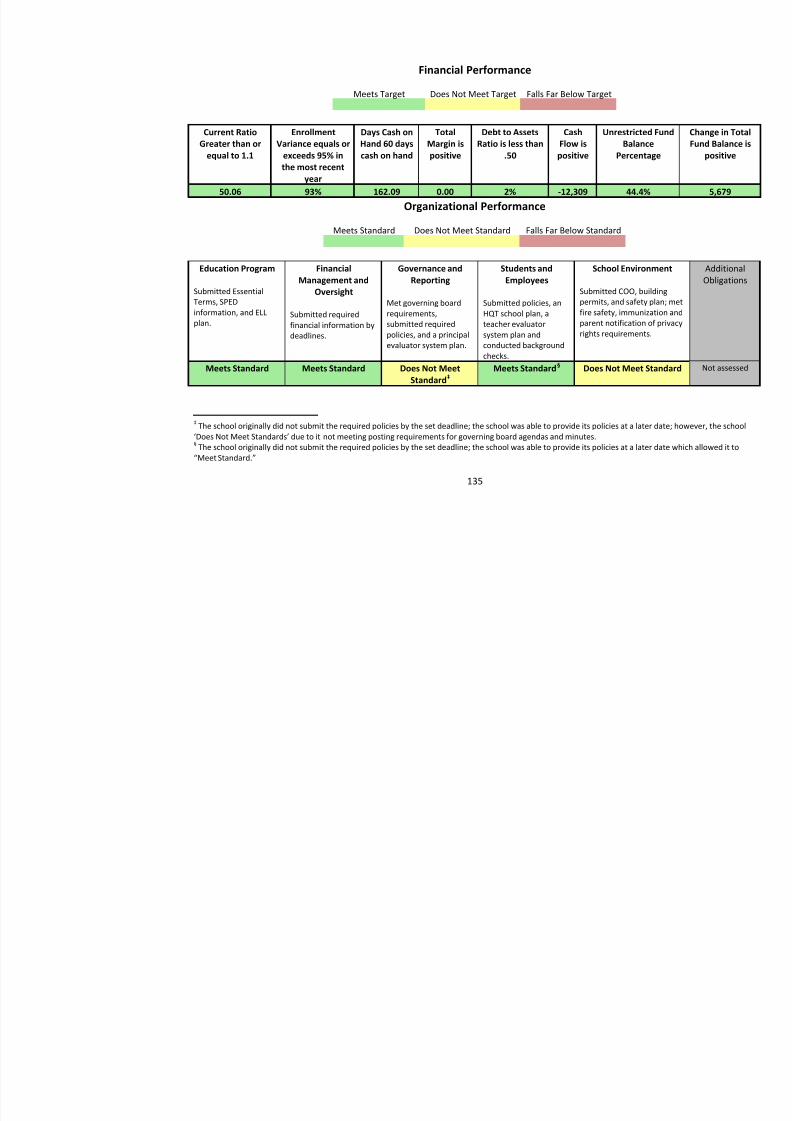
8/10/2019 Hawaii charter schools annual report
http://slidepdf.com/reader/full/hawaii-charter-schools-annual-report 138/268
135
Education Program
Submitted EssentialTerms, SPEDinformation, and ELLplan.
Financial
Management andOversight
Submitted requiredfinancial information bydeadlines.
Governance and
Reporting
Met governing boardrequirements,submitted requiredpolicies, and a principalevaluator system plan.
Students and
Employees
Submitted policies, anHQT school plan, ateacher evaluatorsystem plan andconducted backgroundchecks.
School Environment
Submitted COO, buildingpermits, and safety plan; mfire safety, immunization aparent notification of privrights requirements.
Meets Standard Meets Standard Does Not MeetStandard 77F
‡ Meets Standard 78F
§ Does Not Meet Standar
‡ The school originally did not submit the required policies by the set deadline; the school was able to provide its policies at a later date; however, ‘Does Not Meet Standards’ due to it not meeting posting requirements for governing board agendas and minutes. § The school originally did not submit the required policies by the set deadline; the school was able to provide its policies at a later date which allo“Meet Standard.”
Kona Pacific Public Charter SchoolHawaii State Public Charter School Commission – Annual Report 2014
Mission: The mission of KPPCS is to educate the whole child, in order to cultivate in young people the skills, knowledge, and valuesreach their highest potential.
Notes: None
Board Chairperson(s): Cecilia RoyaleDirector(s): Usha KotnerRegion: West HawaiiGrades: JK-8
Total Enrollment: 243SPED: 11.4%FRL: 69.3%ELL: 0.88%
Strive HI API Score: 16Classification: ContinuAutomatic Trigger: No
Academic Performance
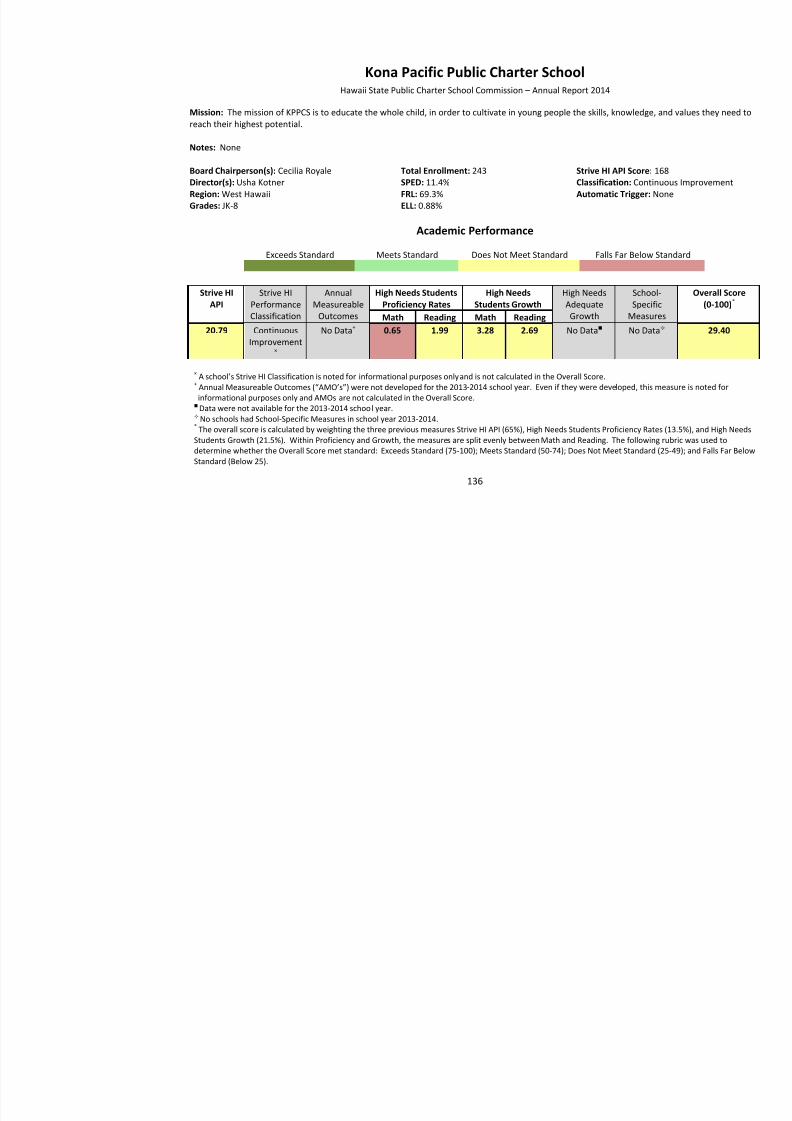
8/10/2019 Hawaii charter schools annual report
http://slidepdf.com/reader/full/hawaii-charter-schools-annual-report 139/268
136
Exceeds Standard Meets Standard Does Not Meet Standard Falls Far Below Standard
Strive HIAPI
Strive HIPerformanceClassification
AnnualMeasureable
Outcomes
High Needs StudentsProficiency Rates
High NeedsStudents Growth
High NeedsAdequateGrowth
School-Specific
MeasuresMath Reading Math Reading20.79 Continuous
Improvement×
No Data + 0.65 1.99 3.28 2.69 No Data No Data
× A school’s Strive HI Classification is noted for informational purposes only and is not calculated in the Overall Score.+ Annual Measureable Outcomes (“AMO’s”) were not developed for the 2013 -2014 school year. Even if they were developed, this measurinformational purposes only and AMOs are not calculated in the Overall Score. Data were not available for the 2013-2014 school year. No schools had School-Specific Measures in school year 2013-2014.
* The overall score is calculated by weighting the three previous measures Strive HI API (65%), High Needs Students Proficiency Rates (13.5%), Students Growth (21.5%). Within Proficiency and Growth, the measures are split evenly between Math and Reading. The following rubric was udetermine whether the Overall Score met standard: Exceeds Standard (75-100); Meets Standard (50-74); Does Not Meet Standard (25-49); and FaStandard (Below 25).
Financial Performance
Meets Target Does Not Meet Target Falls Far Below Target
Current RatioGreater than or
equal to 1.1
EnrollmentVariance equals or
exceeds 95% inthe most recent
year
Days Cash onHand 60 dayscash on hand
TotalMargin ispositive
Debt to AssetsRatio is less than
.50
CashFlow ispositive
Unrestricted FundBalance
Percentage
2.06 105.2% 41.70 0.02 46% 35,031 9.2%
O i ti l P f
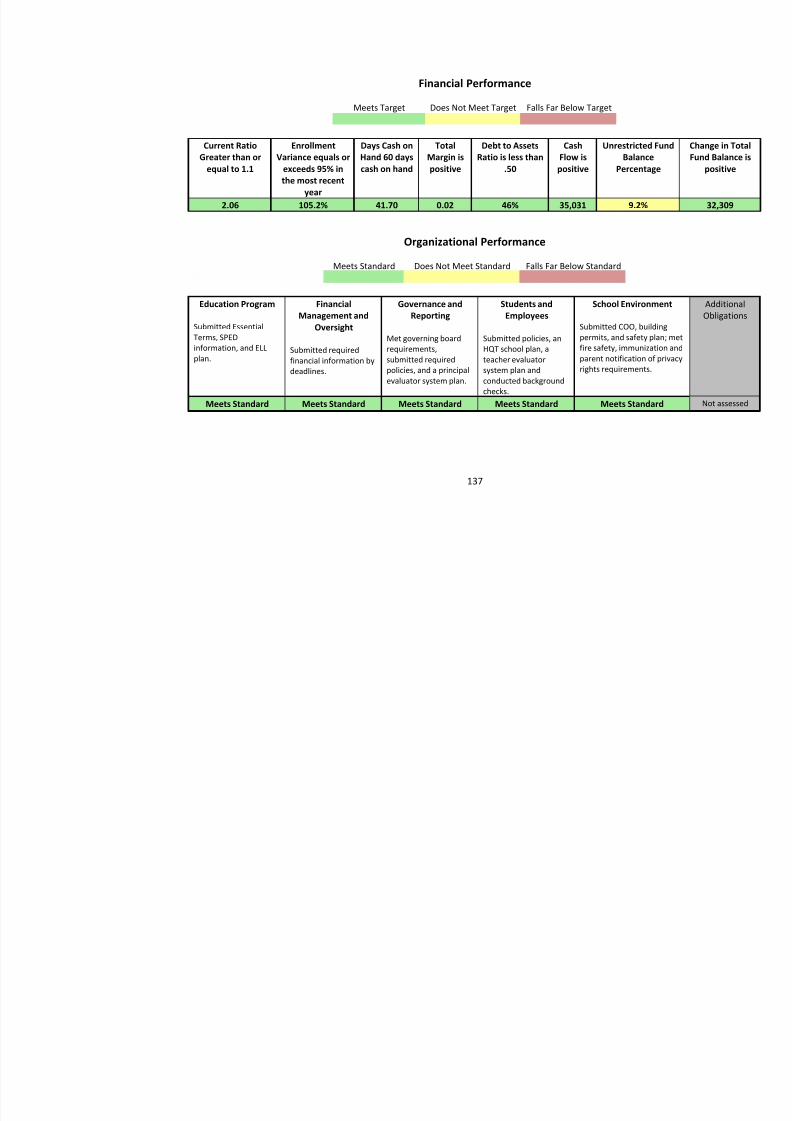
8/10/2019 Hawaii charter schools annual report
http://slidepdf.com/reader/full/hawaii-charter-schools-annual-report 140/268
137
Organizational Performance
Meets Standard Does Not Meet Standard Falls Far Below Standard
Education Program
Submitted EssentialTerms, SPEDinformation, and ELLplan.
FinancialManagement and
Oversight
Submitted requiredfinancial information bydeadlines.
Governance andReporting
Met governing boardrequirements,submitted requiredpolicies, and a principalevaluator system plan.
Students andEmployees
Submitted policies, anHQT school plan, ateacher evaluatorsystem plan andconducted backgroundchecks.
School Environment
Submitted COO, buildingpermits, and safety plan; mfire safety, immunization aparent notification of privrights requirements.
Meets Standard Meets Standard Meets Standard Meets Standard Meets Standard
Kua o ka Lā New Century Public Charter School Hawaii State Public Charter School Commission – Annual Report 2014
Mission: To provide Ka Pae 'Aina o Hawai`i with the knowledge and skills, through Hawaiian values and place-based educational opthat prepare receptive, responsive, and self-sustaining individuals that live "ke ala pono" (positive pilina 'aina, pilina kanaka, and pilin
Notes: None
Board Chairperson(s): Kaimi KaupikoDirector(s): Susie OsborneRegion: East HawaiiGrades: K-12
Total Enrollment: 284SPED: 11.2%FRL: 64.8%ELL: 1.6%
Strive HI API Score: 12Classification: ContinuAutomatic Trigger: No
Academic Performance
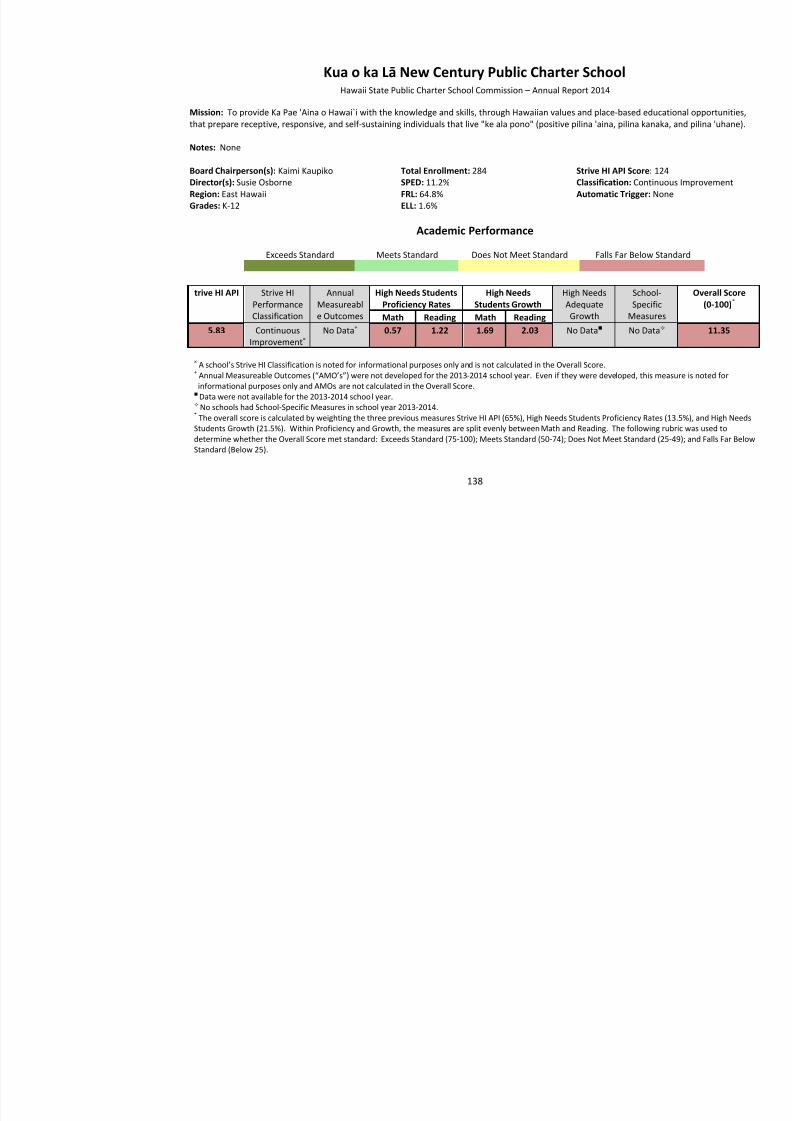
8/10/2019 Hawaii charter schools annual report
http://slidepdf.com/reader/full/hawaii-charter-schools-annual-report 141/268
138
Exceeds Standard Meets Standard Does Not Meet Standard Falls Far Below Standard
trive HI API Strive HIPerformanceClassification
AnnualMeasureable Outcomes
High Needs StudentsProficiency Rates
High NeedsStudents Growth
High NeedsAdequateGrowth
School-Specific
MeasuresMath Reading Math Reading5.83 Continuous
Improvement × No Data + 0.57 1.22 1.69 2.03 No Data No Data
× A school’s Strive HI Classification is noted for informational purposes only and is not calculated in the Overall Score.+ Annual Measureable Outcomes (“AMO’s”) were not developed for the 2013 -2014 school year. Even if they were developed, this measurinformational purposes only and AMOs are not calculated in the Overall Score. Data were not available for the 2013-2014 school year. No schools had School-Specific Measures in school year 2013-2014.
* The overall score is calculated by weighting the three previous measures Strive HI API (65%), High Needs Students Proficiency Rates (13.5%), Students Growth (21.5%). Within Proficiency and Growth, the measures are split evenly between Math and Reading. The following rubric was udetermine whether the Overall Score met standard: Exceeds Standard (75-100); Meets Standard (50-74); Does Not Meet Standard (25-49); and FaStandard (Below 25).
Financial Performance
Meets Target Does Not Meet Target Falls Far Below Target
Current RatioGreater than or
equal to 1.1
EnrollmentVariance equals or
exceeds 95% inthe most recent
year
Days Cash onHand 60 dayscash on hand
TotalMargin ispositive
Debt to AssetsRatio is less than
.50
CashFlow ispositive
Unrestricted FundBalance
Percentage
9.84 88.8% 101.17 0.06 13% 187,008 45.1%
Organizational Performance
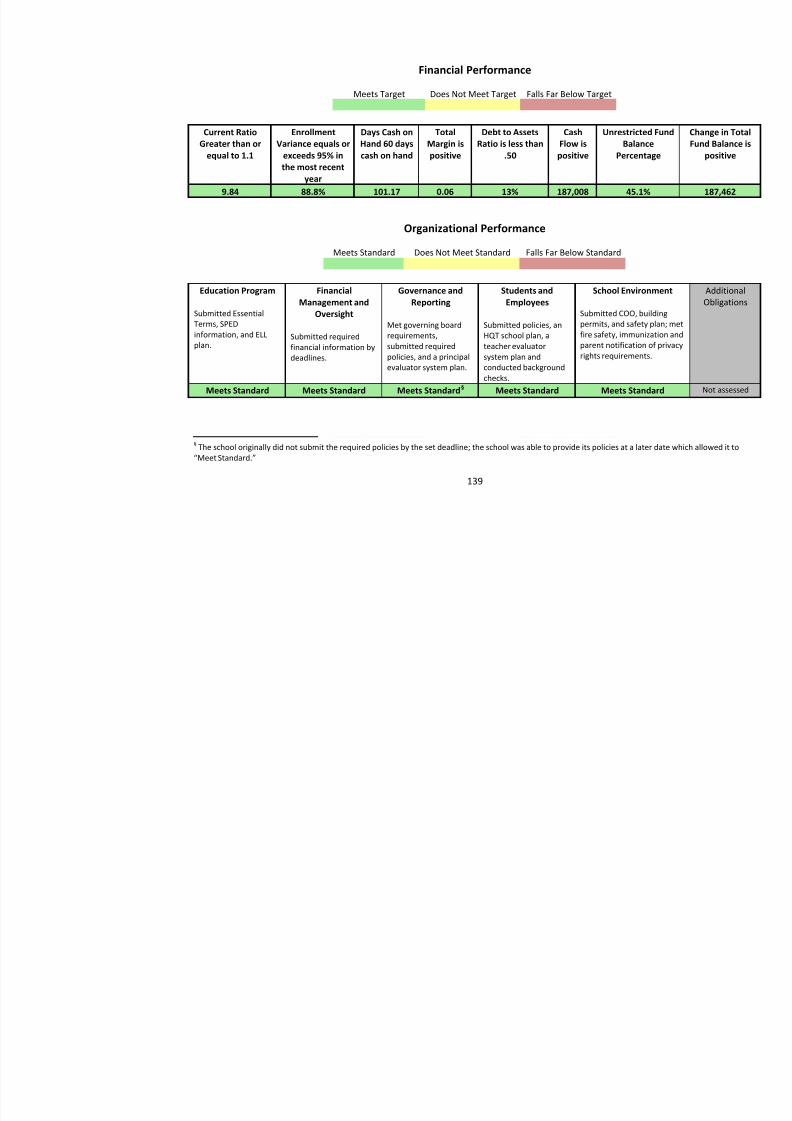
8/10/2019 Hawaii charter schools annual report
http://slidepdf.com/reader/full/hawaii-charter-schools-annual-report 142/268
139
Meets Standard Does Not Meet Standard Falls Far Below Standard
Education Program
Submitted EssentialTerms, SPEDinformation, and ELLplan.
FinancialManagement and
Oversight
Submitted requiredfinancial information bydeadlines.
Governance andReporting
Met governing boardrequirements,submitted requiredpolicies, and a principalevaluator system plan.
Students andEmployees
Submitted policies, anHQT school plan, ateacher evaluatorsystem plan andconducted backgroundchecks.
School Environment
Submitted COO, buildingpermits, and safety plan; mfire safety, immunization parent notification of privrights requirements.
Meets Standard Meets Standard Meets Standard 79F
§ Meets Standard Meets Standard
§ The school originally did not submit the required policies by the set deadline; the school was able to provide its policies at a later date which allo“Meet Standard.”
Kualapu‘u School: A Public Conversion Charter Hawaii State Public Charter School Commission – Annual Report 2014
Mission: “To build a strong foundation for lifelong learning s o with proper nurturing our keiki will be able to discover and grow,confidence, and, like the ‘uala, withstand adversity and thrive in an ever -changing world.”
Notes: This school opted to exclude grades 3-4 from the 2014 Academic Performance Assessment. This option was available only fo
medium and immersion schools.
Board Chairperson(s): Pauline Lo BaileyDirector(s): Lydia TrinidadRegion: MolokaiGrades: PreK-6
Total Enrollment: 349SPED: 9.33%FRL: 83.42%ELL: 0%
Strive HI API Score: 25Classification: ContinuAutomatic Trigger: No
Academic Performance
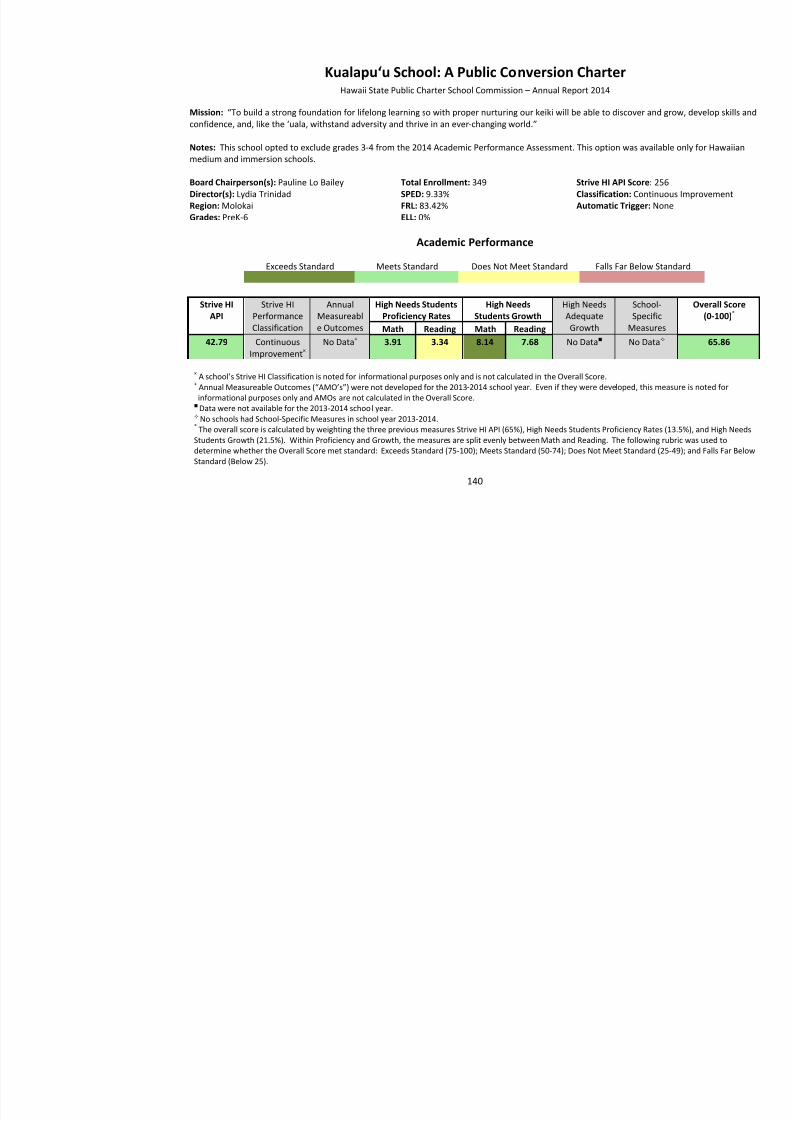
8/10/2019 Hawaii charter schools annual report
http://slidepdf.com/reader/full/hawaii-charter-schools-annual-report 143/268
140
Academic Performance
Exceeds Standard Meets Standard Does Not Meet Standard Falls Far Below Standard
Strive HIAPI
Strive HIPerformanceClassification
AnnualMeasureable Outcomes
High Needs StudentsProficiency Rates
High NeedsStudents Growth
High NeedsAdequateGrowth
School-Specific
MeasuresMath Reading Math Reading42.79 Continuous
Improvement × No Data + 3.91 3.34 8.14 7.68 No Data No Data
× A school’s Strive HI Classification is noted for informational purposes only and is not calculated in the Overall Score. + Annual Measureable Outcomes (“AMO’s”) were not developed for the 2013 -2014 school year. Even if they were developed, this measurinformational purposes only and AMOs are not calculated in the Overall Score. Data were not available for the 2013-2014 school year. No schools had School-Specific Measures in school year 2013-2014.
* The overall score is calculated by weighting the three previous measures Strive HI API (65%), High Needs Students Proficiency Rates (13.5%), Students Growth (21.5%). Within Proficiency and Growth, the measures are split evenly between Math and Reading. The following rubric was udetermine whether the Overall Score met standard: Exceeds Standard (75-100); Meets Standard (50-74); Does Not Meet Standard (25-49); and FaStandard (Below 25).
Financial Performance
Meets Target Does Not Meet Target Falls Far Below Target
Current RatioGreater than or
equal to 1.1
EnrollmentVariance equals or
exceeds 95% inthe most recent
year
Days Cash onHand 60 dayscash on hand
TotalMargin ispositive
Debt to AssetsRatio is less than
.50
CashFlow ispositive
Unrestricted FundBalance
Percentage
3.54 92.6% 97.46 -0.19 6% -492,275 141.4%
Organizational Performance

8/10/2019 Hawaii charter schools annual report
http://slidepdf.com/reader/full/hawaii-charter-schools-annual-report 144/268
141
Meets Standard Does Not Meet Standard Falls Far Below Standard
Education Program
Submitted EssentialTerms, SPEDinformation, and ELLplan.
FinancialManagement and
Oversight
Submitted requiredfinancial information bydeadlines.
Governance andReporting
Met governing boardrequirements,submitted requiredpolicies, and a principalevaluator system plan.
Students andEmployees
Submitted policies, anHQT school plan, ateacher evaluatorsystem plan andconducted backgroundchecks.
School Environment
Submitted COO, buildingpermits, and safety plan; mfire safety, immunization aparent notification of privrights requirements.
Meets Standard Meets Standard Meets Standard Meets Standard Meets Standard
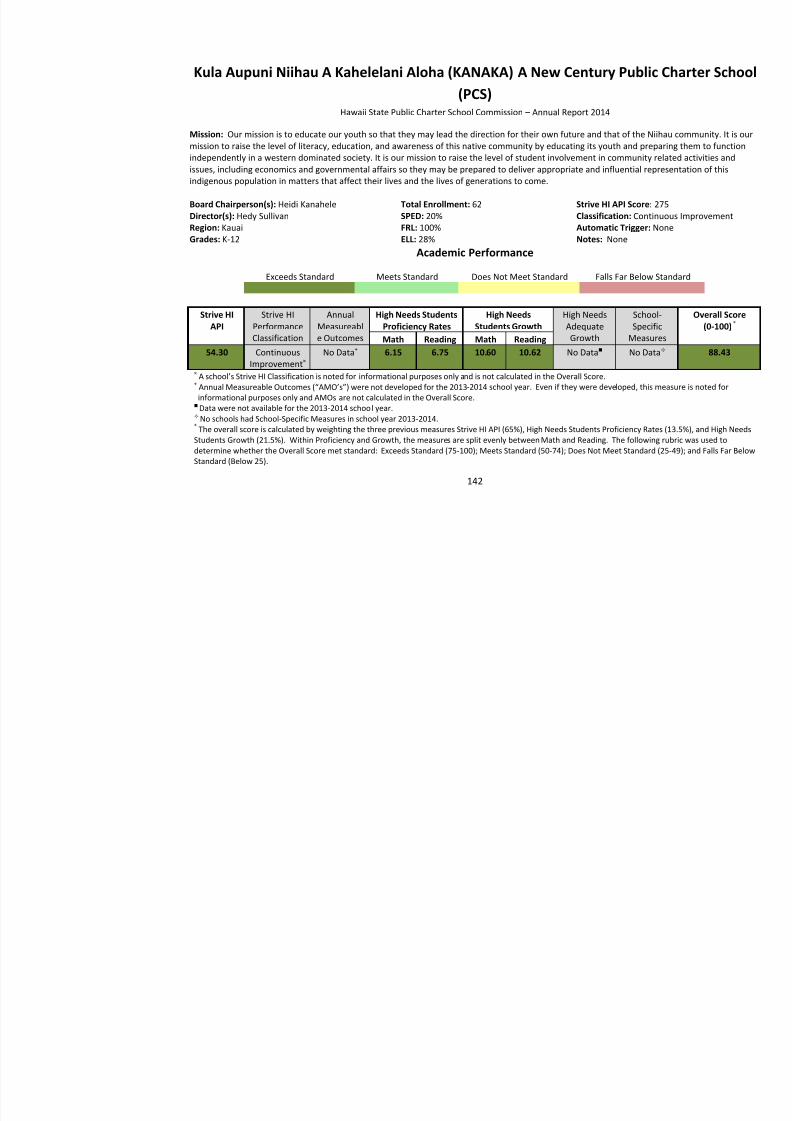
8/10/2019 Hawaii charter schools annual report
http://slidepdf.com/reader/full/hawaii-charter-schools-annual-report 145/268
Financial Performance
Meets Target Does Not Meet Target Falls Far Below Target
Current RatioGreater than or
equal to 1.1
EnrollmentVariance equals or
exceeds 95% inthe most recent
year
Days Cash onHand 60 dayscash on hand
TotalMargin ispositive
Debt to AssetsRatio is less than
.50
CashFlow ispositive
Unrestricted FundBalance
Percentage
7.89 95.4% 163.56 -0.04 11% 14,453 52.3%
Organizational Performance
M S d d D N M S d d F ll F B l S d d

8/10/2019 Hawaii charter schools annual report
http://slidepdf.com/reader/full/hawaii-charter-schools-annual-report 146/268
143
Meets Standard Does Not Meet Standard Falls Far Below Standard
Education Program
Submitted EssentialTerms, SPEDinformation, and ELLplan.
FinancialManagement and
Oversight
Submitted requiredfinancial information bydeadlines.
Governance andReporting
Met governing boardrequirements,submitted requiredpolicies, and a principalevaluator system plan.
Students andEmployees
Submitted policies, anHQT school plan, ateacher evaluatorsystem plan andconducted backgroundchecks.
School Environment
Submitted COO, buildingpermits, and safety plan; mfire safety, immunization parent notification of privrights requirements.
Meets Standard Meets Standard Meets Standard Meets Standard Meets Standard
Lanikai Elementary Public Charter SchoolHawaii State Public Charter School Commission – Annual Report 2014
Mission: At Lanikai School our mission, through combined efforts of staff, parents, students and community, is:To focus on the whole child by offering an integrated and challenging curriculum that reaches across the disciplines, which includes PWellness, Technology and an emphasis on The Arts.To empower students to meet academic challenges with enthusiasm and a willingness to solve real -world problems.To create an atmosphere of cooperation, with respect for individual differences, the community and cultural values.To develop children who are confident and creative builders of their future.
Notes: None
Board Chairperson(s): Todd CullisonDirector(s): Ed NohRegion: Windward OahuGrades: JK-6
Total Enrollment: 349SPED: 5%FRL: 15%ELL: 0%
Strive HI API Score: 20Classification: ContinuAutomatic Trigger: No
Academic Performance
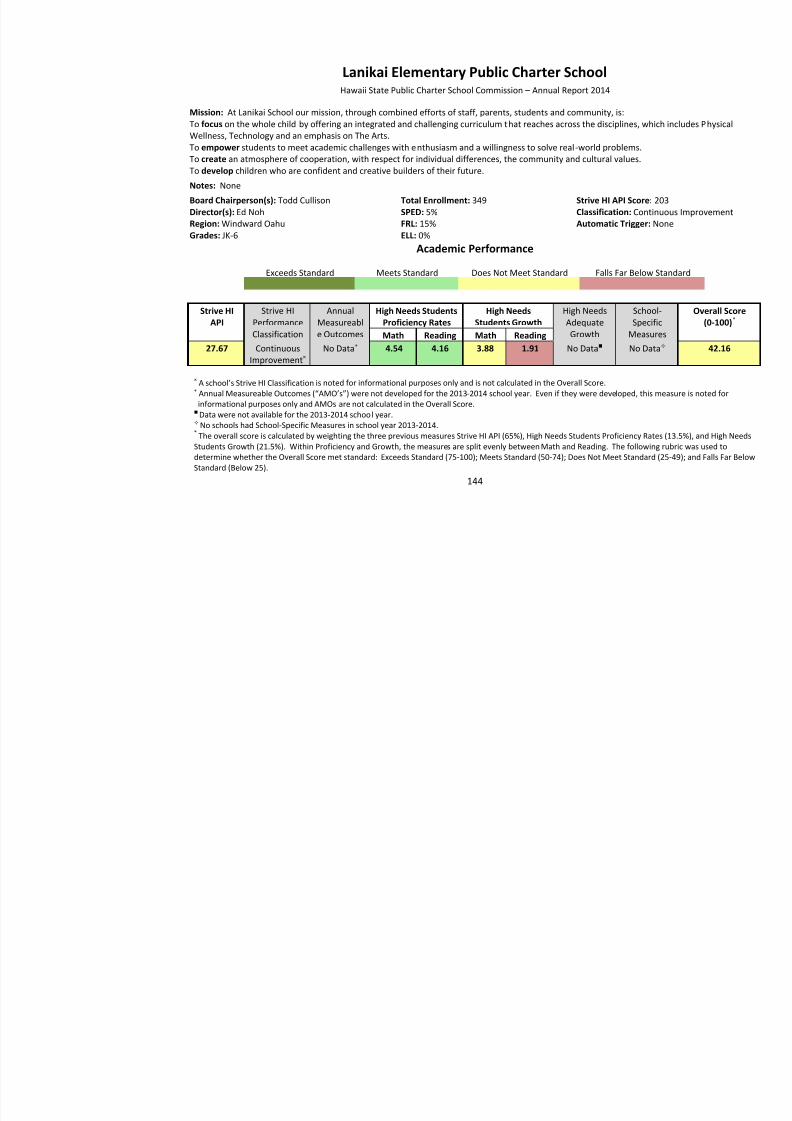
8/10/2019 Hawaii charter schools annual report
http://slidepdf.com/reader/full/hawaii-charter-schools-annual-report 147/268
144
Academic Performance
Exceeds Standard Meets Standard Does Not Meet Standard Falls Far Below Standard
Strive HIAPI
Strive HIPerformanceClassification
AnnualMeasureable Outcomes
High Needs StudentsProficiency Rates
High NeedsStudents Growth
High NeedsAdequateGrowth
School-Specific
MeasuresMath Reading Math Reading27.67 Continuous
Improvement × No Data + 4.54 4.16 3.88 1.91 No Data No Data
× A school’s Strive HI Classification is noted for informational purposes only and is not calculated in the Overall Score.+ Annual Measureable Outcomes (“AMO’s”) were not developed for the 2013 -2014 school year. Even if they were developed, this measur
informational purposes only and AMOs are not calculated in the Overall Score. Data were not available for the 2013-2014 school year. No schools had School-Specific Measures in school year 2013-2014.
* The overall score is calculated by weighting the three previous measures Strive HI API (65%), High Needs Students Proficiency Rates (13.5%), Students Growth (21.5%). Within Proficiency and Growth, the measures are split evenly between Math and Reading. The following rubric was udetermine whether the Overall Score met standard: Exceeds Standard (75-100); Meets Standard (50-74); Does Not Meet Standard (25-49); and FaStandard (Below 25).
Financial Performance
Meets Target Does Not Meet Target Falls Far Below Target
Current RatioGreater than or
equal to 1.1
EnrollmentVariance equals or
exceeds 95% inthe most recent
year
Days Cash onHand 60 dayscash on hand
TotalMargin ispositive
Debt to AssetsRatio is less than
.50
CashFlow ispositive
Unrestricted FundBalance
Percentage
16.47 100.3% 275.53 0.41 4% 319,333 99.6%
Organizational Performance
Meets Standard Does Not Meet Standard Falls Far Below Standard

8/10/2019 Hawaii charter schools annual report
http://slidepdf.com/reader/full/hawaii-charter-schools-annual-report 148/268
145
Meets Standard Does Not Meet Standard Falls Far Below Standard
Education Program
Submitted EssentialTerms, SPEDinformation, and ELLplan.
FinancialManagement and
Oversight
Submitted requiredfinancial information bydeadlines.
Governance andReporting
Met governing boardrequirements,submitted requiredpolicies, and a principalevaluator system plan.
Students andEmployees
Submitted policies, anHQT school plan, ateacher evaluatorsystem plan andconducted backgroundchecks.
School Environment
Submitted COO, buildingpermits, and safety plan; mfire safety, immunization parent notification of privrights requirements.
Meets Standard Meets Standard Meets Standard Meets Standard Meets Standard
Laupahoehoe Community Public Charter SchoolHawaii State Public Charter School Commission – Annual Report 2014
Mission: To emphasize hands on learning and academic success where every student is known and valued, using community partnerresources while instilling traditional cultural values.
Notes: None
Board Chairperson(s): George MartinDirector(s): David RizorRegion: East HawaiiGrades: PreK-12
Total Enrollment: 220SPED: 23.64%FRL: 74.55%ELL: 7.27%
Strive HI API Score: 15Classification: FocusAutomatic Trigger: Lar
Academic Performance
Exceeds Standard Meets Standard Does Not Meet Standard Falls Far Below Standard
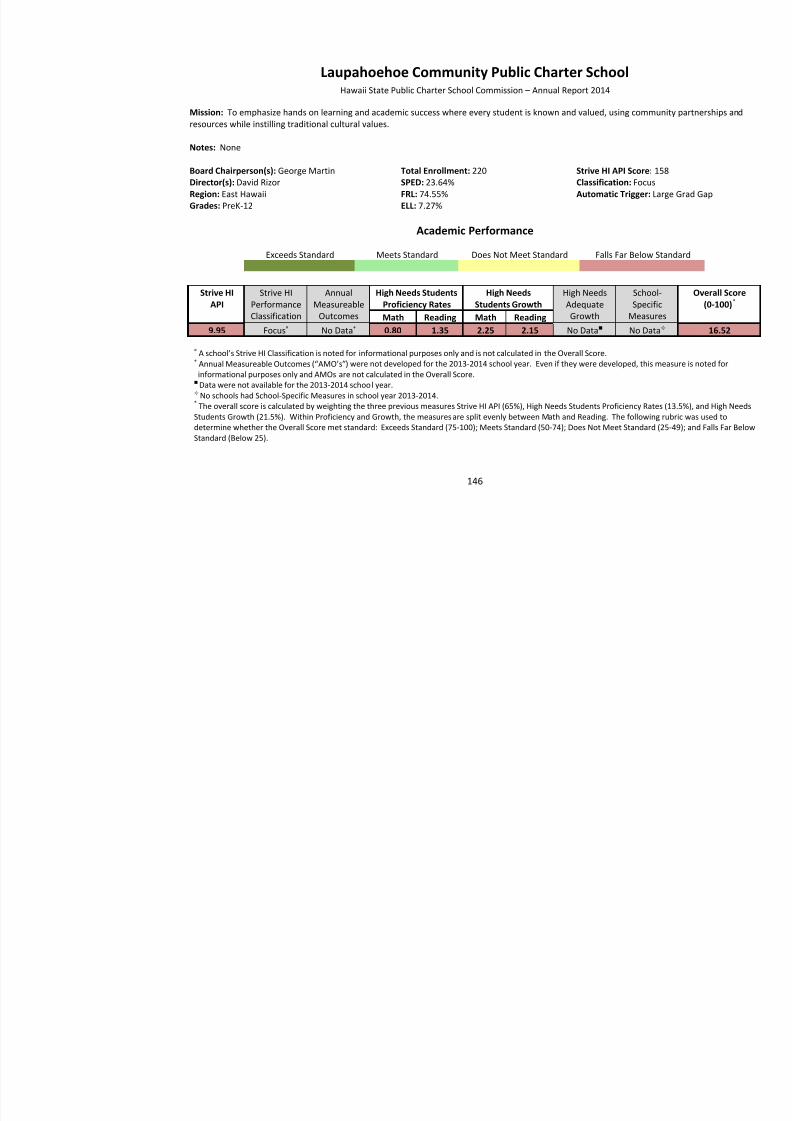
8/10/2019 Hawaii charter schools annual report
http://slidepdf.com/reader/full/hawaii-charter-schools-annual-report 149/268
146
Exceeds Standard Meets Standard Does Not Meet Standard Falls Far Below Standard
Strive HIAPI
Strive HIPerformanceClassification
AnnualMeasureable
Outcomes
High Needs StudentsProficiency Rates
High NeedsStudents Growth
High NeedsAdequateGrowth
School-Specific
MeasuresMath Reading Math Reading9.95 Focus × No Data + 0.80 1.35 2.25 2.15 No Data No Data
× A school’s Strive HI Classification is noted for informational purposes only and is not calculated in the Overall Score. + Annual Measureable Outcomes (“AMO’s”) were not developed for the 2013-2014 school year. Even if they were developed, this measure is informational purposes only and AMOs are not calculated in the Overall Score. Data were not available for the 2013-2014 school year. No schools had School-Specific Measures in school year 2013-2014.
*
The overall score is calculated by weighting the three previous measures Strive HI API (65%), High Needs Students Proficiency Rates (13.5%), Students Growth (21.5%). Within Proficiency and Growth, the measures are split evenly between Math and Reading. The following rubric was udetermine whether the Overall Score met standard: Exceeds Standard (75-100); Meets Standard (50-74); Does Not Meet Standard (25-49); and FaStandard (Below 25).
Financial Performance
Meets Target Does Not Meet Target Falls Far Below Target
Current RatioGreater than or
equal to 1.1
EnrollmentVariance equals or
exceeds 95% in
the most recentyear
Days Cash onHand 60 dayscash on hand
TotalMargin ispositive
Debt to AssetsRatio is less than
.50
CashFlow ispositive
Unrestricted FundBalance
Percentage
2.37 104.8% 49.11 -0.04 35% -36,185 13%
Organizational Performance
Meets Standard Does Not Meet Standard Falls Far Below Standard
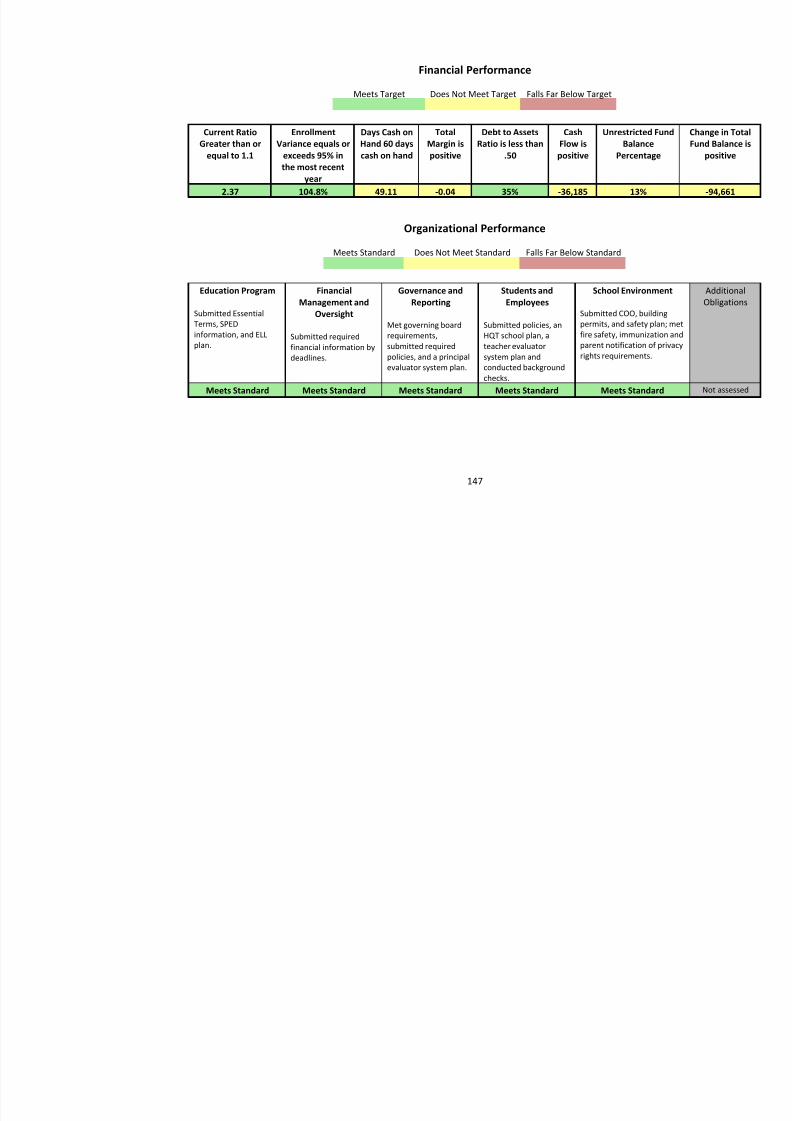
8/10/2019 Hawaii charter schools annual report
http://slidepdf.com/reader/full/hawaii-charter-schools-annual-report 150/268
147
Education Program
Submitted EssentialTerms, SPEDinformation, and ELLplan.
FinancialManagement and
Oversight
Submitted requiredfinancial information bydeadlines.
Governance andReporting
Met governing boardrequirements,submitted requiredpolicies, and a principalevaluator system plan.
Students andEmployees
Submitted policies, anHQT school plan, ateacher evaluatorsystem plan andconducted backgroundchecks.
School Environment
Submitted COO, buildingpermits, and safety plan; mfire safety, immunization parent notification of privrights requirements.
Meets Standard Meets Standard Meets Standard Meets Standard Meets Standard
Myron B. Thompson AcademyHawaii State Public Charter School Commission – Annual Report 2014
Mission: The mission of Myron B. Thompson Academy is to provide a rigorous, engaging learning environment in which all learnerresponsibility for their learning, work together, are involved in complex problem solving, recognize and produce quality work and comeffectively.
Notes: None
Board Chairperson(s): Malia Chow, MyronThompsonDirector(s): Diana OshiroRegion: Honolulu (online)Grades: K-12
Total Enrollment: 511SPED: 0%FRL: 21.43%ELL: 0%
Strive HI API Score: 29Classification: ContinuAutomatic Trigger: No
Academic Performance
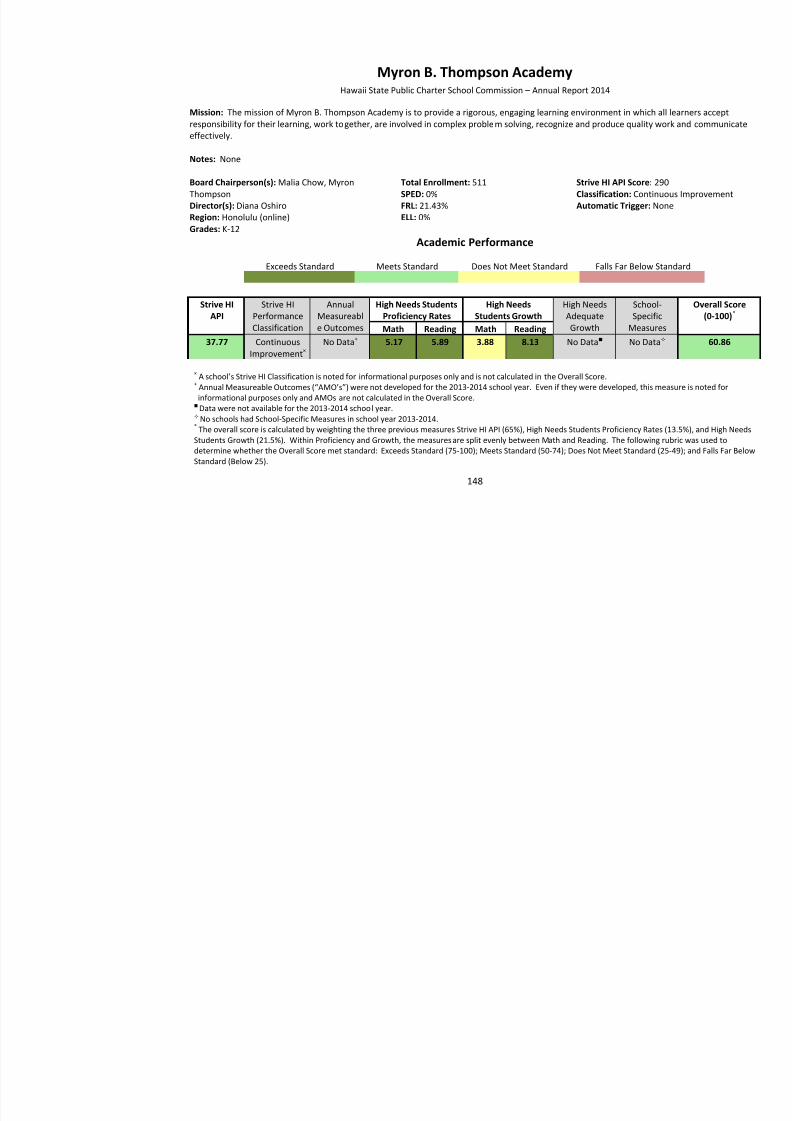
8/10/2019 Hawaii charter schools annual report
http://slidepdf.com/reader/full/hawaii-charter-schools-annual-report 151/268
148
Exceeds Standard Meets Standard Does Not Meet Standard Falls Far Below Standard
Strive HIAPI
Strive HIPerformanceClassification
AnnualMeasureable Outcomes
High Needs StudentsProficiency Rates
High NeedsStudents Growth
High NeedsAdequateGrowth
School-Specific
MeasuresMath Reading Math Reading37.77 Continuous
Improvement × No Data + 5.17 5.89 3.88 8.13 No Data No Data
× A school’s Strive HI Classification is noted for informational purposes only and is not calculated in the Overall Score. + Annual Measureable Outcomes (“AMO’s”) were not developed for the 2013-2014 school year. Even if they were developed, this measure isinformational purposes only and AMOs are not calculated in the Overall Score. Data were not available for the 2013-2014 school year. No schools had School-Specific Measures in school year 2013-2014.
* The overall score is calculated by weighting the three previous measures Strive HI API (65%), High Needs Students Proficiency Rates (13.5%), Students Growth (21.5%). Within Proficiency and Growth, the measures are split evenly between Math and Reading. The following rubric was udetermine whether the Overall Score met standard: Exceeds Standard (75-100); Meets Standard (50-74); Does Not Meet Standard (25-49); and FaStandard (Below 25).
Financial Performance
Meets Target Does Not Meet Target Falls Far Below Target
Current RatioGreater than or
equal to 1.1
EnrollmentVariance equals or
exceeds 95% in
the most recentyear
Days Cash onHand 60 dayscash on hand
TotalMargin ispositive
Debt to AssetsRatio is less than
.50
CashFlow ispositive
Unrestricted FundBalance
Percentage
13.20 118.0% 395.25 -0.05 7% -76,422 106.1%
Organizational Performance
Meets Standard Does Not Meet Standard Falls Far Below Standard
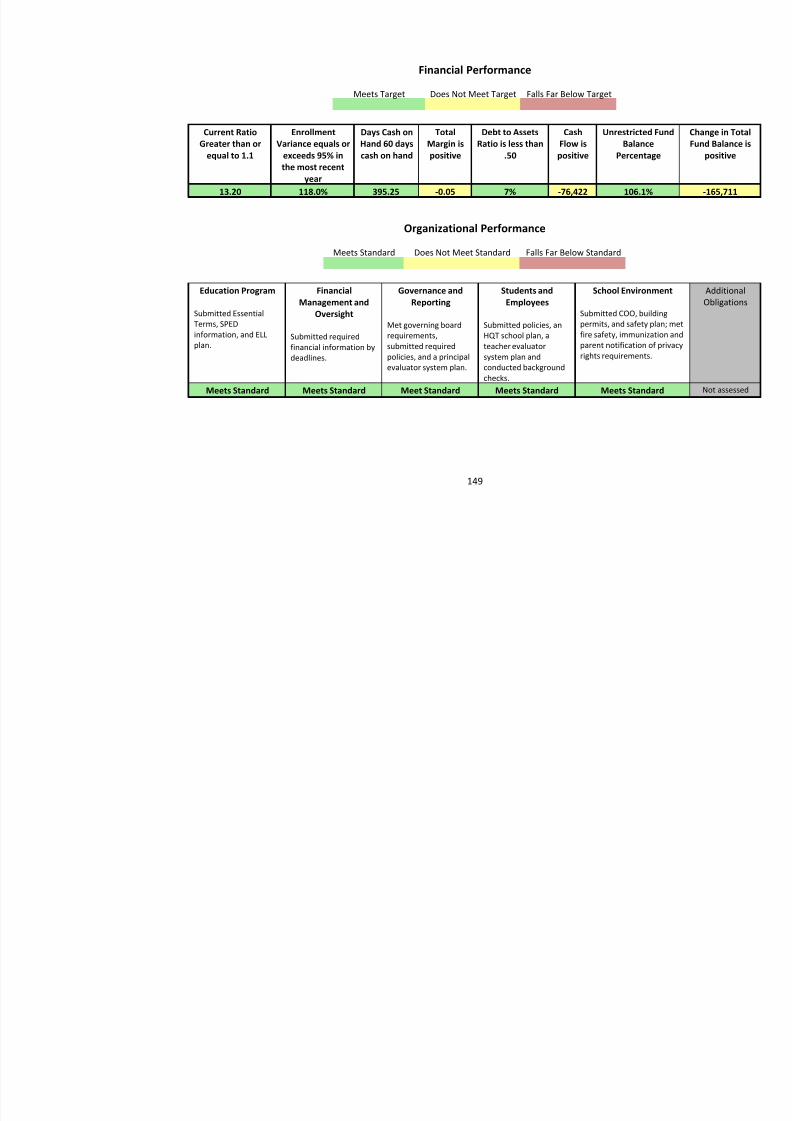
8/10/2019 Hawaii charter schools annual report
http://slidepdf.com/reader/full/hawaii-charter-schools-annual-report 152/268
149
Education Program
Submitted EssentialTerms, SPEDinformation, and ELLplan.
FinancialManagement and
Oversight
Submitted requiredfinancial information bydeadlines.
Governance andReporting
Met governing boardrequirements,submitted requiredpolicies, and a principalevaluator system plan.
Students andEmployees
Submitted policies, anHQT school plan, ateacher evaluatorsystem plan andconducted backgroundchecks.
School Environment
Submitted COO, buildingpermits, and safety plan; mfire safety, immunization parent notification of privrights requirements.
Meets Standard Meets Standard Meet Standard Meets Standard Meets Standard
Na Wai Ola (Waters Of Life) Public Charter SchoolHawaii State Public Charter School Commission – Annual Report 2014
Mission: Our mission is to provide a first class private school education in a nurturing environment which insures academic success students at a Public School Price.
Notes: None
Board Chairperson(s): Maurice MessinaDirector(s): Daniel CaluyaRegion: East HawaiiGrades: K-6
Total Enrollment: 128SPED: 6.25%FRL: 35.42%ELL: 2.08%
Strive HI API Score: 14Classification: RecogniAutomatic Trigger: No
Academic Performance
Exceeds Standard Meets Standard Does Not Meet Standard Falls Far Below Standard
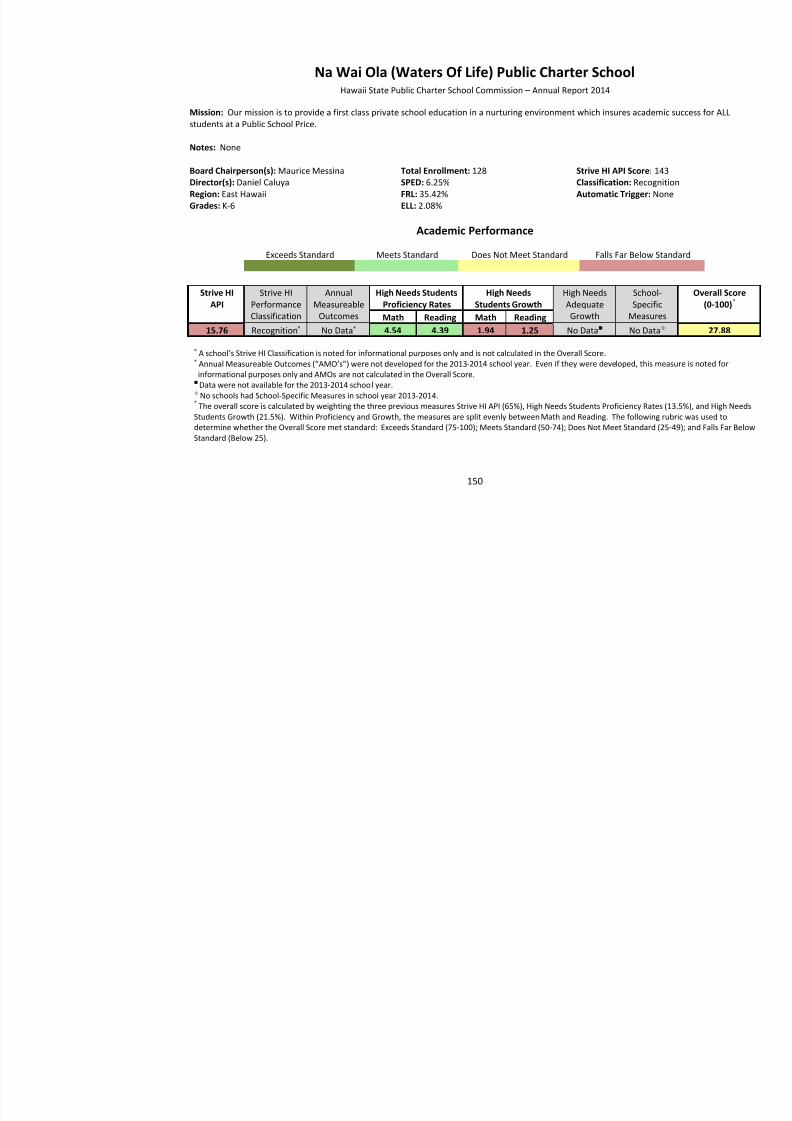
8/10/2019 Hawaii charter schools annual report
http://slidepdf.com/reader/full/hawaii-charter-schools-annual-report 153/268
150
Strive HIAPI
Strive HIPerformanceClassification
AnnualMeasureable
Outcomes
High Needs StudentsProficiency Rates
High NeedsStudents Growth
High NeedsAdequateGrowth
School-Specific
MeasuresMath Reading Math Reading15.76 Recognition × No Data + 4.54 4.39 1.94 1.25 No Data No Data
× A school’s Strive HI Classification is noted for informational purposes only and is not calculated in the Overall Score.+ Annual Measureable Outcomes (“AMO’s”) were not developed for the 2013 -2014 school year. Even if they were developed, this measurinformational purposes only and AMOs are not calculated in the Overall Score. Data were not available for the 2013-2014 school year. No schools had School-Specific Measures in school year 2013-2014.
*
The overall score is calculated by weighting the three previous measures Strive HI API (65%), High Needs Students Proficiency Rates (13.5%), Students Growth (21.5%). Within Proficiency and Growth, the measures are split evenly between Math and Reading. The following rubric was udetermine whether the Overall Score met standard: Exceeds Standard (75-100); Meets Standard (50-74); Does Not Meet Standard (25-49); and FaStandard (Below 25).
Financial PerformanceMeets Target Does Not Meet Target Falls Far Below Target
Current RatioGreater than or
equal to 1.1
EnrollmentVariance equals or
exceeds 95% inthe most recent
year
Days Cash onHand 60 dayscash on hand
TotalMargin ispositive
Debt to AssetsRatio is less than
.50
CashFlow ispositive
Unrestricted FundBalance
Percentage
0.94 91.4% 22.36 0.00 49% -130 12%
Organizational Performance
Meets Standard Does Not Meet Standard Falls Far Below Standard
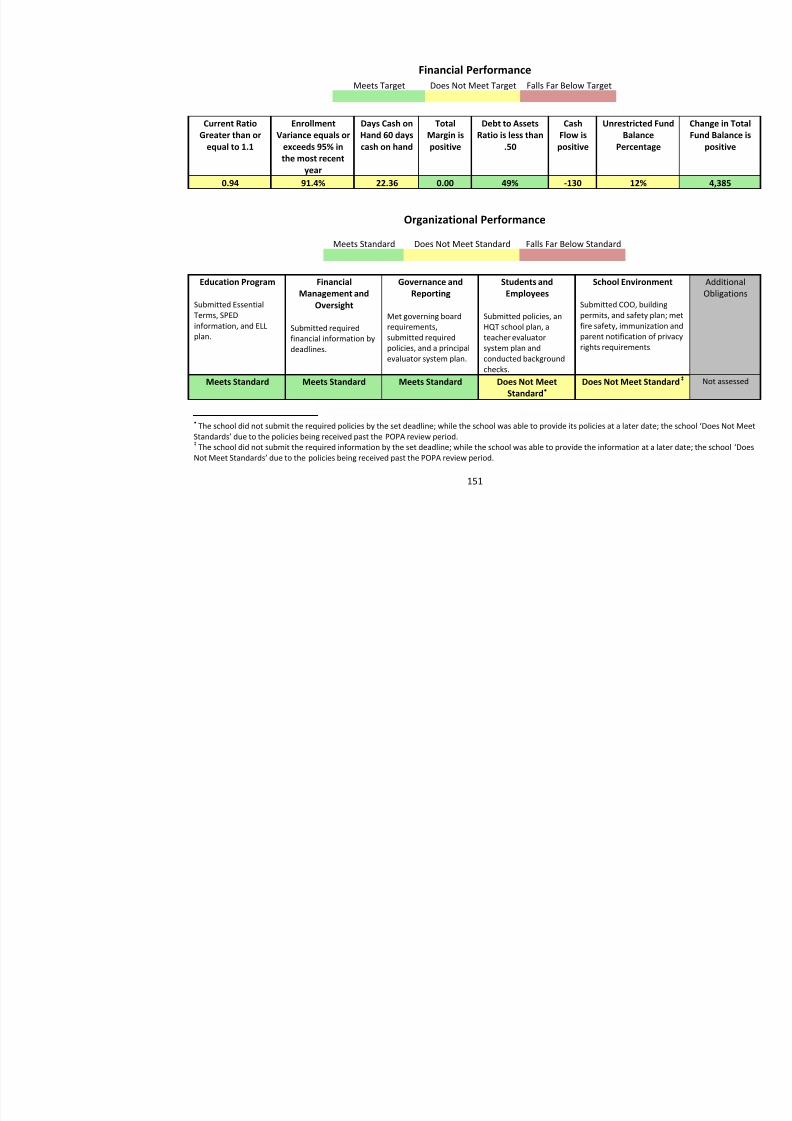
8/10/2019 Hawaii charter schools annual report
http://slidepdf.com/reader/full/hawaii-charter-schools-annual-report 154/268
151
Education Program
Submitted EssentialTerms, SPEDinformation, and ELLplan.
FinancialManagement and
Oversight
Submitted requiredfinancial information bydeadlines.
Governance andReporting
Met governing boardrequirements,submitted requiredpolicies, and a principalevaluator system plan.
Students andEmployees
Submitted policies, anHQT school plan, ateacher evaluatorsystem plan andconducted backgroundchecks.
School Environment
Submitted COO, buildingpermits, and safety plan; mfire safety, immunization parent notification of privrights requirements.
Meets Standard Meets Standard Meets Standard Does Not MeetStandard 80F
• Does Not Meet Standar
• The school did not submit the required policies by the set deadline; while the school was able to provide its policies at a later date; the schoolStandards’ due to the policies being received past the POPA review period. ‡ The school did not submit the required information by the set deadline; while the school was able to provide the information at a latNot Meet Standards’ due to the policies being received past the POPA review period.
SEEQS: The School for Examining Essential Questions of SustainabilityHawaii State Public Charter School Commission – Annual Report 2014
Mission: The diverse community of SEEQS fosters a joy of learning through collaborative and interdisciplinary investigation of queto Hawaiʻi’s future. SEEQS graduates are stewards of planet Earth and healthy, effective citizens of the world.
Notes: SEEQS was in its first year of operation in 2013-2014.
Board Chairperson(s): Carol OtaDirector(s): Buffy Cushman-PatzRegion: HonoluluGrades: 6-7
Total Enrollment: 64SPED: 9.62%FRL: 36.54%ELL: 1.92%
Strive HI API Score: 11Classification: ClassificAutomatic Trigger: No
Academic Performance
Exceeds Standard Meets Standard Does Not Meet Standard Falls Far Below Standard
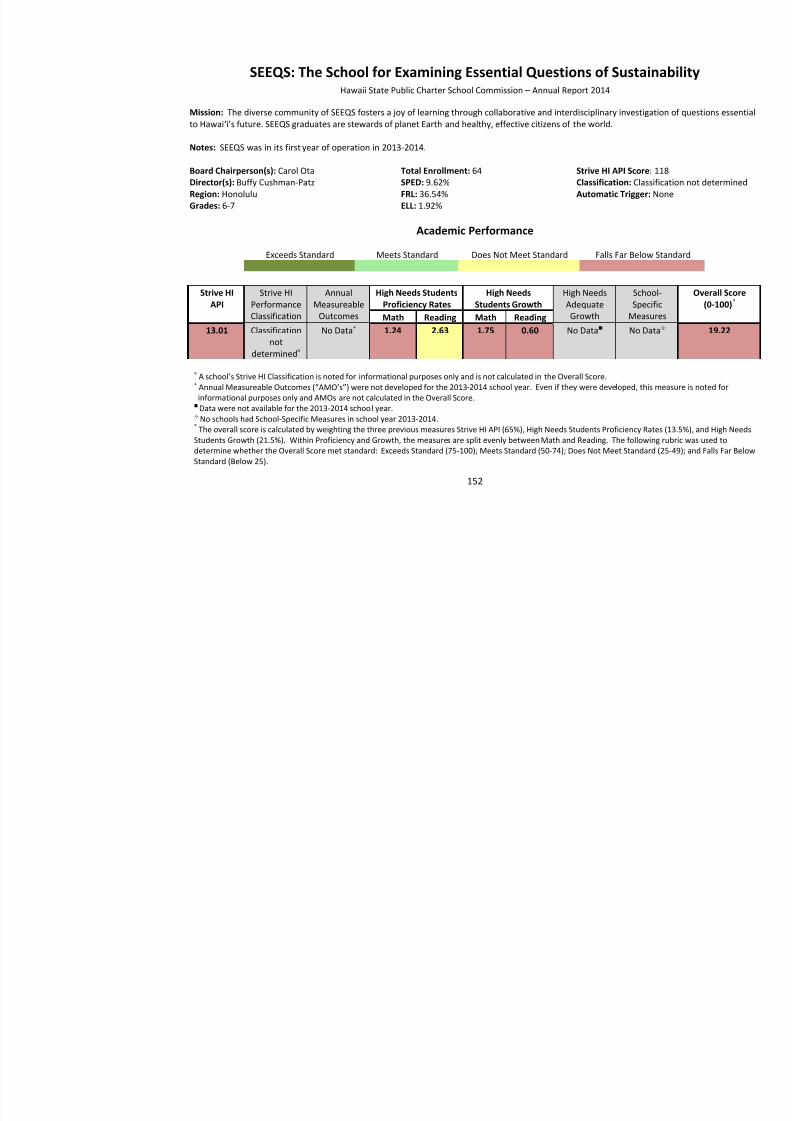
8/10/2019 Hawaii charter schools annual report
http://slidepdf.com/reader/full/hawaii-charter-schools-annual-report 155/268
152
Strive HIAPI
Strive HIPerformanceClassification
AnnualMeasureable
Outcomes
High Needs StudentsProficiency Rates
High NeedsStudents Growth
High NeedsAdequateGrowth
School-Specific
MeasuresMath Reading Math Reading13.01 Classification
notdetermined ×
No Data + 1.24 2.63 1.75 0.60 No Data No Data
× A school’s Strive HI Classification is noted for informational purposes only and is not calculated in the Overall Score. + Annual Measureable Outcomes (“AMO’s”) were not developed for the 2013 -2014 school year. Even if they were developed, this measurinformational purposes only and AMOs are not calculated in the Overall Score. Data were not available for the 2013-2014 school year. No schools had School-Specific Measures in school year 2013-2014.
* The overall score is calculated by weighting the three previous measures Strive HI API (65%), High Needs Students Proficiency Rates (13.5%), Students Growth (21.5%). Within Proficiency and Growth, the measures are split evenly between Math and Reading. The following rubric was udetermine whether the Overall Score met standard: Exceeds Standard (75-100); Meets Standard (50-74); Does Not Meet Standard (25-49); and FaStandard (Below 25).
Financial Performance
Meets Target Does Not Meet Target Falls Far Below Target
Current RatioGreater than or
equal to 1.1
EnrollmentVariance equals or
exceeds 95% in
the most recentyear
Days Cash onHand 60 dayscash on hand
TotalMargin ispositive
Debt to AssetsRatio is less than
.50
CashFlow ispositive
Unrestricted FundBalance
Percentage
1.12 97% 53.14 0.12 50% 94,507 12.5%
Organizational Performance
Meets Standard Does Not Meet Standard Falls Far Below Standard

8/10/2019 Hawaii charter schools annual report
http://slidepdf.com/reader/full/hawaii-charter-schools-annual-report 156/268
153
Education Program
Submitted EssentialTerms, SPEDinformation, and ELLplan.
FinancialManagement and
Oversight
Submitted requiredfinancial information bydeadlines.
Governance andReporting
Met governing boardrequirements,submitted requiredpolicies, and a principalevaluator system plan.
Students andEmployees
Submitted policies, anHQT school plan, ateacher evaluatorsystem plan andconducted backgroundchecks.
School Environment
Submitted COO, buildingpermits, and safety plan; mfire safety, immunization parent notification of privrights requirements.
Meets Standard Meets Standard Meets Standard Meets Standard Meets Standard
University Laboratory SchoolHawaii State Public Charter School Commission – Annual Report 2014
Mission: The school serves two interlocking missions: to design and deliver the best possible education to its students, and to serve teducational research and development community as an inventing and testing ground for high quality educational programs.
Notes: None
Board Chairperson(s): David OrideDirector(s): Keoni JeremiahRegion: HonoluluGrades: K-12
Total Enrollment: 444SPED: 7.22%FRL: 19.27%ELL: 0%
Strive HI API Score: 26Classification: ContinuAutomatic Trigger: No
Academic Performance
Exceeds Standard Meets Standard Does Not Meet Standard Falls Far Below Standard
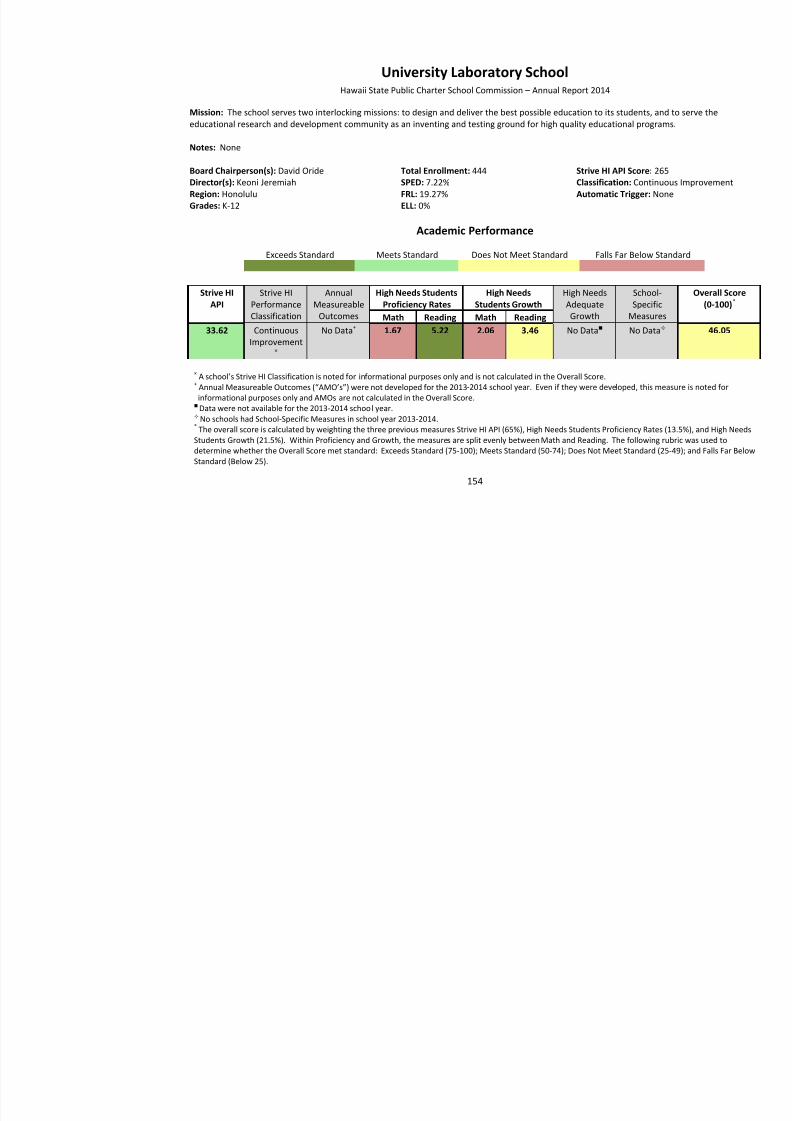
8/10/2019 Hawaii charter schools annual report
http://slidepdf.com/reader/full/hawaii-charter-schools-annual-report 157/268
154
Strive HIAPI
Strive HIPerformanceClassification
AnnualMeasureable
Outcomes
High Needs StudentsProficiency Rates
High NeedsStudents Growth
High NeedsAdequateGrowth
School-Specific
MeasuresMath Reading Math Reading33.62 Continuous
Improvement×
No Data + 1.67 5.22 2.06 3.46 No Data No Data
× A school’s Strive HI Classification is noted for informational purposes only and is not calculated in the Overall Score.+ Annual Measureable Outcomes (“AMO’s”) were not developed for the 2013 -2014 school year. Even if they were developed, this measurinformational purposes only and AMOs are not calculated in the Overall Score.
Data were not available for the 2013-2014 school year. No schools had School-Specific Measures in school year 2013-2014.* The overall score is calculated by weighting the three previous measures Strive HI API (65%), High Needs Students Proficiency Rates (13.5%), Students Growth (21.5%). Within Proficiency and Growth, the measures are split evenly between Math and Reading. The following rubric was udetermine whether the Overall Score met standard: Exceeds Standard (75-100); Meets Standard (50-74); Does Not Meet Standard (25-49); and FaStandard (Below 25).
Financial Performance
Meets Target Does Not Meet Target Falls Far Below Target
Current RatioGreater than or
equal to 1.1
EnrollmentVariance equals or
exceeds 95% in
the most recentyear
Days Cash onHand 60 dayscash on hand
TotalMargin ispositive
Debt to AssetsRatio is less than
.50
CashFlow ispositive
Unrestricted FundBalance
Percentage
8.79 98.2% 101.99 0.05 11% 24,449 26.3%
Organizational Performance
Meets Standard Does Not Meet Standard Falls Far Below Standard

8/10/2019 Hawaii charter schools annual report
http://slidepdf.com/reader/full/hawaii-charter-schools-annual-report 158/268
155
Education Program
Submitted EssentialTerms, SPEDinformation, and ELLplan.
FinancialManagement and
Oversight
Submitted requiredfinancial information bydeadlines.
Governance andReporting
Met governing boardrequirements,submitted requiredpolicies, and a principalevaluator system plan.
Students andEmployees
Submitted policies, anHQT school plan, ateacher evaluatorsystem plan andconducted backgroundchecks.
School Environment
Submitted COO, buildingpermits, and safety plan; mfire safety, immunization parent notification of privrights requirements.
Meets Standard Meets Standard Meets Standard Meets Standard Meets Standard
Volcano School of Arts & SciencesHawaii State Public Charter School Commission – Annual Report 2014
Mission: The mission of the Volcano School of Arts & Sciences is to: Focus on the unique ecosystems and geology of the Volcano aresponsibility for nature and the environment; Involve the community in ongoing partnership; provide a solid academic foundation forencourage creative problem-solving and critical thinking; provide avenues for creative expressions; teach practical life skills; offer a rmulticultural program; nurture respect and understanding of Hawaiian culture; foster social responsibility and respect for others; impalove of learning; serve the Volcano community; celebrate learning success of all children; all in a safe and supportive “learninenvironment. Board Chairperson(s): John BrowardDirector(s): Ardith RenteriaRegion: East HawaiiGrades: K-8
Total Enrollment: 188SPED: 21.62%FRL: 73.87%ELL: 0.9%
Strive HI API Score: 10Classification: ContinuAutomatic Trigger: NoNotes: None
Academic Performance
Exceeds Standard Meets Standard Does Not Meet Standard Falls Far Below Standard
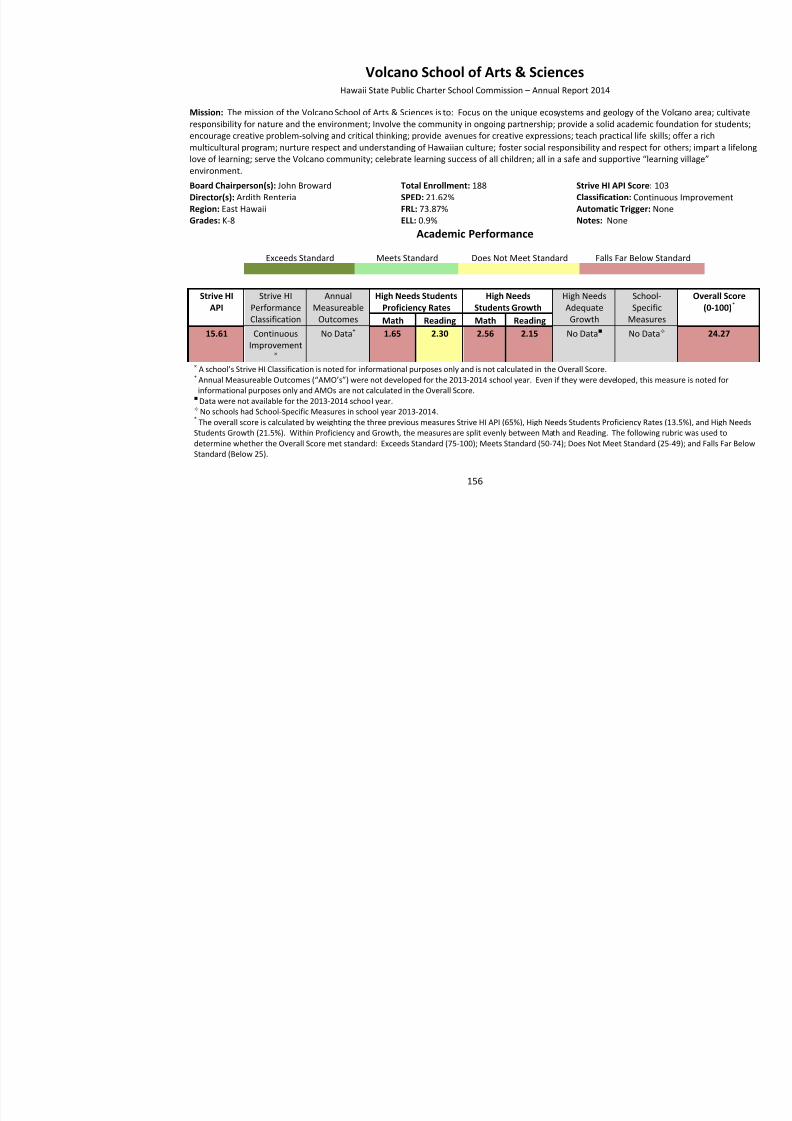
8/10/2019 Hawaii charter schools annual report
http://slidepdf.com/reader/full/hawaii-charter-schools-annual-report 159/268
156
Strive HIAPI
Strive HIPerformanceClassification
AnnualMeasureable
Outcomes
High Needs StudentsProficiency Rates
High NeedsStudents Growth
High NeedsAdequateGrowth
School-Specific
MeasuresMath Reading Math Reading15.61 Continuous
Improvement×
No Data + 1.65 2.30 2.56 2.15 No Data No Data
× A school’s Strive HI Classification is noted for informational purposes only and is not calculated in the Overall Score. + Annual Measureable O utcomes (“AMO’s”) were not developed for the 2013 -2014 school year. Even if they were developed, this measurinformational purposes only and AMOs are not calculated in the Overall Score. Data were not available for the 2013-2014 school year. No schools had School-Specific Measures in school year 2013-2014.
* The overall score is calculated by weighting the three previous measures Strive HI API (65%), High Needs Students Proficiency Rates (13.5%), Students Growth (21.5%). Within Proficiency and Growth, the measures are split evenly between Math and Reading. The following rubric was udetermine whether the Overall Score met standard: Exceeds Standard (75-100); Meets Standard (50-74); Does Not Meet Standard (25-49); and FaStandard (Below 25).
Financial Performance
Meets Target Does Not Meet Target Falls Far Below Target
Current RatioGreater than or
equal to 1.1
EnrollmentVariance equals or
exceeds 95% in
the most recentyear
Days Cash onHand 60 dayscash on hand
TotalMargin ispositive
Debt to AssetsRatio is less than
.50
CashFlow ispositive
Unrestricted FundBalance
Percentage
4.16 95.9% 118.57 0.02 23% 30,033 36.7%
Organizational Performance
Meets Standard Does Not Meet Standard Falls Far Below Standard

8/10/2019 Hawaii charter schools annual report
http://slidepdf.com/reader/full/hawaii-charter-schools-annual-report 160/268
157
Education Program
Submitted EssentialTerms, SPEDinformation, and ELLplan.
FinancialManagement and
Oversight
Submitted requiredfinancial information bydeadlines.
Governance andReporting
Met governing boardrequirements,submitted requiredpolicies, and a principalevaluator system plan.
Students andEmployees
Submitted policies, anHQT school plan, ateacher evaluatorsystem plan andconducted backgroundchecks.
School Environment
Submitted COO, buildingpermits, and safety plan; mfire safety, immunization aparent notification of privrights requirements.
Meets Standard Meets Standard Meets Standard Meets Standard Meets Standard
Voyager: A Public Charter SchoolHawaii State Public Charter School Commission – Annual Report 2014
Mission: The mission of Voyager: A Public Charter School is to transform education in Hawaii by demonstrating that Hawaii educatwith a diverse population of our community’s children can achieve high expectations as articulated in the Hawaii Content andStandards and Common Core State Standards. Voyager uses state of the art methods founded on ancient principles and the latest scientknowledge to help every student achieve and perform beyond expectations. Voyager forms and utilizes a variety of partnerships to shaphilosophy and methods with other public schools.
Notes: None
Board Chairperson(s): Diane AndersonDirector(s): Mary Beth BarrRegion: HonoluluGrades: K-8
Total Enrollment: 287SPED: 15.63%FRL: 31.88%ELL: 0%
Strive HI API Score: 31Classification: ContinuAutomatic Trigger: No
Academic Performance
E d St d d M t St d d D N t M t St d d F ll F B l St d d
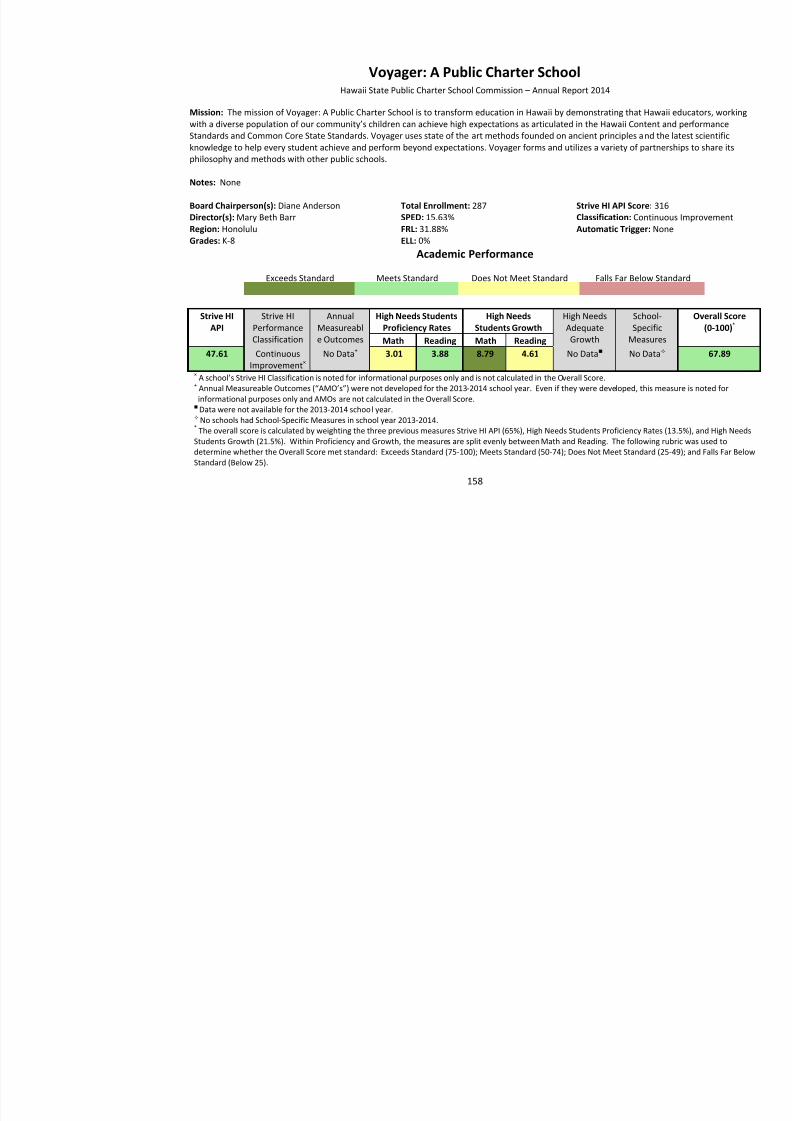
8/10/2019 Hawaii charter schools annual report
http://slidepdf.com/reader/full/hawaii-charter-schools-annual-report 161/268
158
Exceeds Standard Meets Standard Does Not Meet Standard Falls Far Below Standard
Strive HIAPI
Strive HIPerformanceClassification
AnnualMeasureable Outcomes
High Needs StudentsProficiency Rates
High NeedsStudents Growth
High NeedsAdequateGrowth
School-Specific
MeasuresMath Reading Math Reading47.61 Continuous
Improvement × No Data + 3.01 3.88 8.79 4.61 No Data No Data
× A school’s Strive HI Classification is noted for informational purposes only and is not calculated in the Overall Score.+ Annual Measureable Outcomes (“AMO’s”) were not developed for the 2013 -2014 school year. Even if they were developed, this measurinformational purposes only and AMOs are not calculated in the Overall Score.
Data were not available for the 2013-2014 school year. No schools had School-Specific Measures in school year 2013-2014.* The overall score is calculated by weighting the three previous measures Strive HI API (65%), High Needs Students Proficiency Rates (13.5%), Students Growth (21.5%). Within Proficiency and Growth, the measures are split evenly between Math and Reading. The following rubric was udetermine whether the Overall Score met standard: Exceeds Standard (75-100); Meets Standard (50-74); Does Not Meet Standard (25-49); and FaStandard (Below 25).
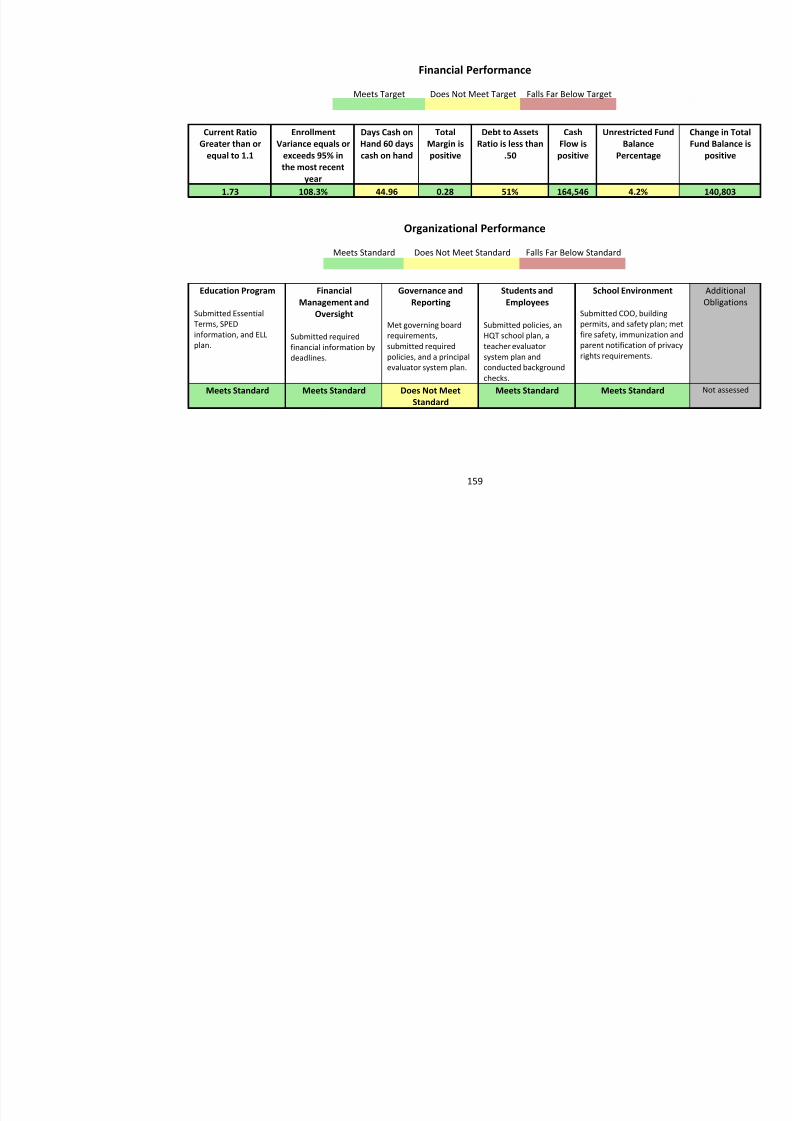
8/10/2019 Hawaii charter schools annual report
http://slidepdf.com/reader/full/hawaii-charter-schools-annual-report 162/268
Waialae Elementary Public Charter SchoolHawaii State Public Charter School Commission – Annual Report 2014
Mission: Waialae Public Charter school is a student-centered school that honors the whole child. It is committed to nurturing a commlearners who strive for excellence and innovation, empowering all members of the community to actively engage in a democratic soci
Notes: None
Board Chairperson(s): Christopher WallingDirector(s): Wendy LagaretaRegion: HonoluluGrades: K-5
Total Enrollment: 499SPED: 7.76%FRL: 25.43%ELL: 1.72%
Strive HI API Score: 28Classification: ContinuAutomatic Trigger: No
Academic Performance
Exceeds Standard Meets Standard Does Not Meet Standard Falls Far Below Standard
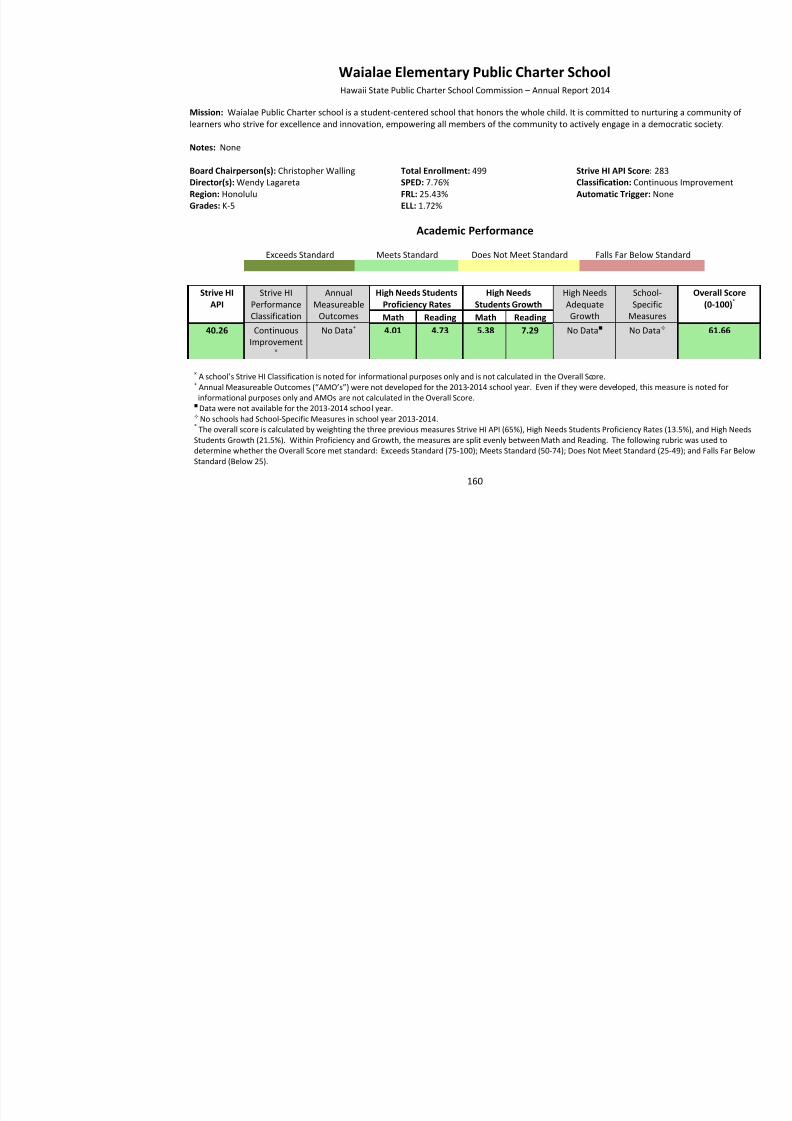
8/10/2019 Hawaii charter schools annual report
http://slidepdf.com/reader/full/hawaii-charter-schools-annual-report 163/268
160
Strive HIAPI
Strive HIPerformanceClassification
AnnualMeasureable
Outcomes
High Needs StudentsProficiency Rates
High NeedsStudents Growth
High NeedsAdequateGrowth
School-Specific
MeasuresMath Reading Math Reading40.26 Continuous
Improvement×
No Data + 4.01 4.73 5.38 7.29 No Data No Data
× A school’s Strive HI Classification is noted for informational purposes only and is not calculated in the Overall Score.+ Annual Measureable Outcomes (“AMO’s”) were not developed for the 2013 -2014 school year. Even if they were developed, this measurinformational purposes only and AMOs are not calculated in the Overall Score.
Data were not available for the 2013-2014 school year. No schools had School-Specific Measures in school year 2013-2014.* The overall score is calculated by weighting the three previous measures Strive HI API (65%), High Needs Students Proficiency Rates (13.5%), Students Growth (21.5%). Within Proficiency and Growth, the measures are split evenly between Math and Reading. The following rubric was udetermine whether the Overall Score met standard: Exceeds Standard (75-100); Meets Standard (50-74); Does Not Meet Standard (25-49); and FaStandard (Below 25).
Financial Performance
Meets Target Does Not Meet Target Falls Far Below Target
Current RatioGreater than or
equal to 1.1
EnrollmentVariance equals or
exceeds 95% in
the most recentyear
Days Cash onHand 60 dayscash on hand
TotalMargin ispositive
Debt to AssetsRatio is less than
.50
CashFlow ispositive
Unrestricted FundBalance
Percentage
7.08 100.4% 149.75 0.05 32% 21,462 43%
Organizational Performance
Meets Standard Does Not Meet Standard Falls Far Below Standard

8/10/2019 Hawaii charter schools annual report
http://slidepdf.com/reader/full/hawaii-charter-schools-annual-report 164/268
161
Education Program
Submitted EssentialTerms, SPEDinformation, and ELLplan.
FinancialManagement and
Oversight
Submitted requiredfinancial information bydeadlines.
Governance andReporting
Met governing boardrequirements,submitted requiredpolicies, and a principalevaluator system plan.
Students andEmployees
Submitted policies, anHQT school plan, ateacher evaluatorsystem plan andconducted backgroundchecks.
School Environment
Submitted COO, buildingpermits, and safety plan; mfire safety, immunization parent notification of privrights requirements.
Meets Standard Meets Standard Meets Standard Meets Standard Meets Standard
Waimea Middle Public Conversion Charter SchoolHawaii State Public Charter School Commission – Annual Report 2014
Mission: It is the mission of Waimea Middle School to provide our students with a quality standards-based education in a creative, cand nurturing environment that results in the maximum development of each child through the cooperative efforts of the entire commu
Notes: None
Board Chairperson(s): Pauline Lo BaileyDirector(s): Matt HorneRegion: West HawaiiGrades: 6-8
Total Enrollment: 280SPED: 12.08%FRL: 66.79%ELL: 6.79%
Strive HI API Score: 15Classification: ContinuAutomatic Trigger: No
Academic Performance
Exceeds Standard Meets Standard Does Not Meet Standard Falls Far Below Standard
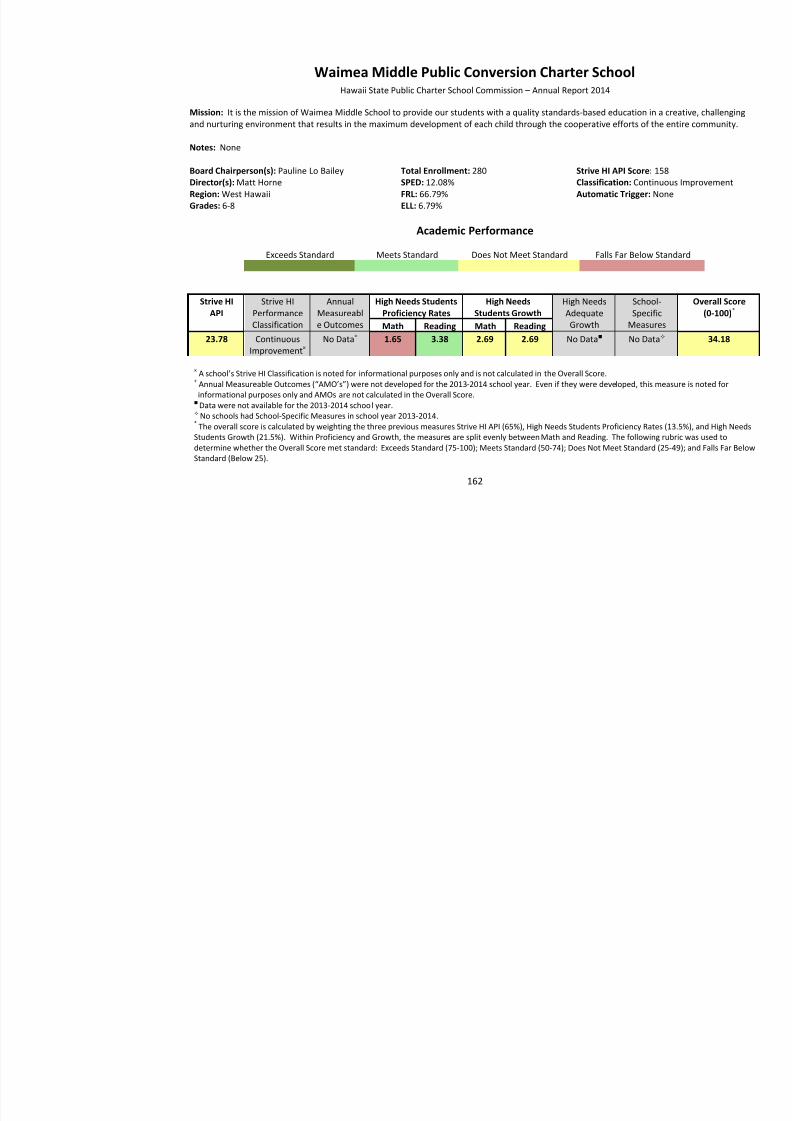
8/10/2019 Hawaii charter schools annual report
http://slidepdf.com/reader/full/hawaii-charter-schools-annual-report 165/268
162
Strive HIAPI
Strive HIPerformanceClassification
AnnualMeasureable Outcomes
High Needs StudentsProficiency Rates
High NeedsStudents Growth
High NeedsAdequateGrowth
School-Specific
MeasuresMath Reading Math Reading23.78 Continuous
Improvement × No Data + 1.65 3.38 2.69 2.69 No Data No Data
× A school’s Strive HI Classification is noted for informational purposes only and is not calculated in the Overall Score. + Annua l Measureable Outcomes (“AMO’s”) were not developed for the 2013 -2014 school year. Even if they were developed, this measurinformational purposes only and AMOs are not calculated in the Overall Score. Data were not available for the 2013-2014 school year. No schools had School-Specific Measures in school year 2013-2014.
* The overall score is calculated by weighting the three previous measures Strive HI API (65%), High Needs Students Proficiency Rates (13.5%), Students Growth (21.5%). Within Proficiency and Growth, the measures are split evenly between Math and Reading. The following rubric was udetermine whether the Overall Score met standard: Exceeds Standard (75-100); Meets Standard (50-74); Does Not Meet Standard (25-49); and FaStandard (Below 25).
Financial Performance
Meets Target Does Not Meet Target Falls Far Below Target
Current RatioGreater than or
equal to 1.1
EnrollmentVariance equals or
exceeds 95% in
the most recentyear
Days Cash onHand 60 dayscash on hand
TotalMargin ispositive
Debt to AssetsRatio is less than
.50
CashFlow ispositive
Unrestricted FundBalance
Percentage
5.99 98.9% 185.75 -0.23 10% -132,807 102.7%
Organizational Performance
Meets Standard Does Not Meet Standard Falls Far Below Standard
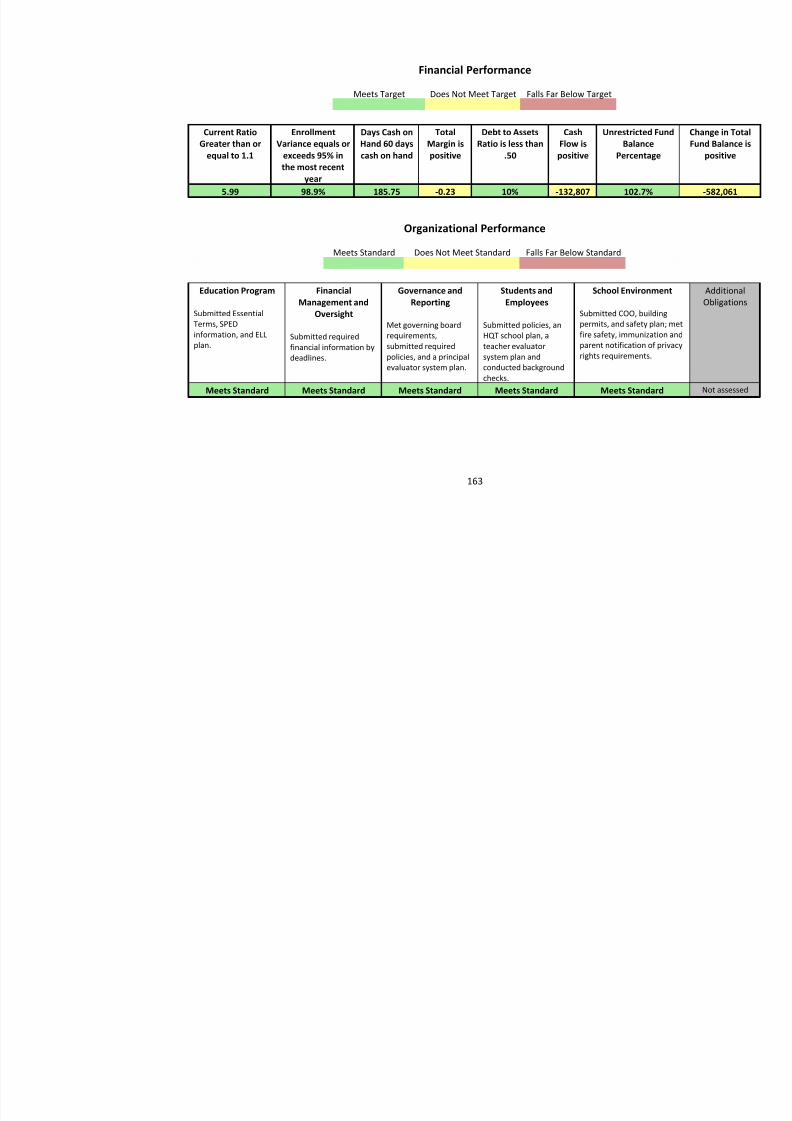
8/10/2019 Hawaii charter schools annual report
http://slidepdf.com/reader/full/hawaii-charter-schools-annual-report 166/268
163
Education Program
Submitted EssentialTerms, SPEDinformation, and ELLplan.
FinancialManagement and
Oversight
Submitted requiredfinancial information bydeadlines.
Governance andReporting
Met governing boardrequirements,submitted requiredpolicies, and a principalevaluator system plan.
Students andEmployees
Submitted policies, anHQT school plan, ateacher evaluatorsystem plan andconducted backgroundchecks.
School Environment
Submitted COO, buildingpermits, and safety plan; mfire safety, immunization aparent notification of privrights requirements.
Meets Standard Meets Standard Meets Standard Meets Standard Meets Standard
West Hawai‘i Explorations Academy Hawaii State Public Charter School Commission – Annual Report 2014
Mission: To provide learning opportunities through integrative, hands-on, selfselected projects related to authentic, real world proble
Notes: None
Board Chairperson(s): Lougene Baird
Director(s): Curtis Muraoka, Heather NakakuraRegion: West HawaiiGrades: 6-12
Total Enrollment: 235
SPED: 6.67%FRL: 41.67%ELL: 0%
Strive HI API Score: 19
Classification: FocusAutomatic Trigger: Lar
Academic Performance
Exceeds Standard Meets Standard Does Not Meet Standard Falls Far Below Standard
Strive HI Strive HI Annual High Needs Students High Needs High Needs School-
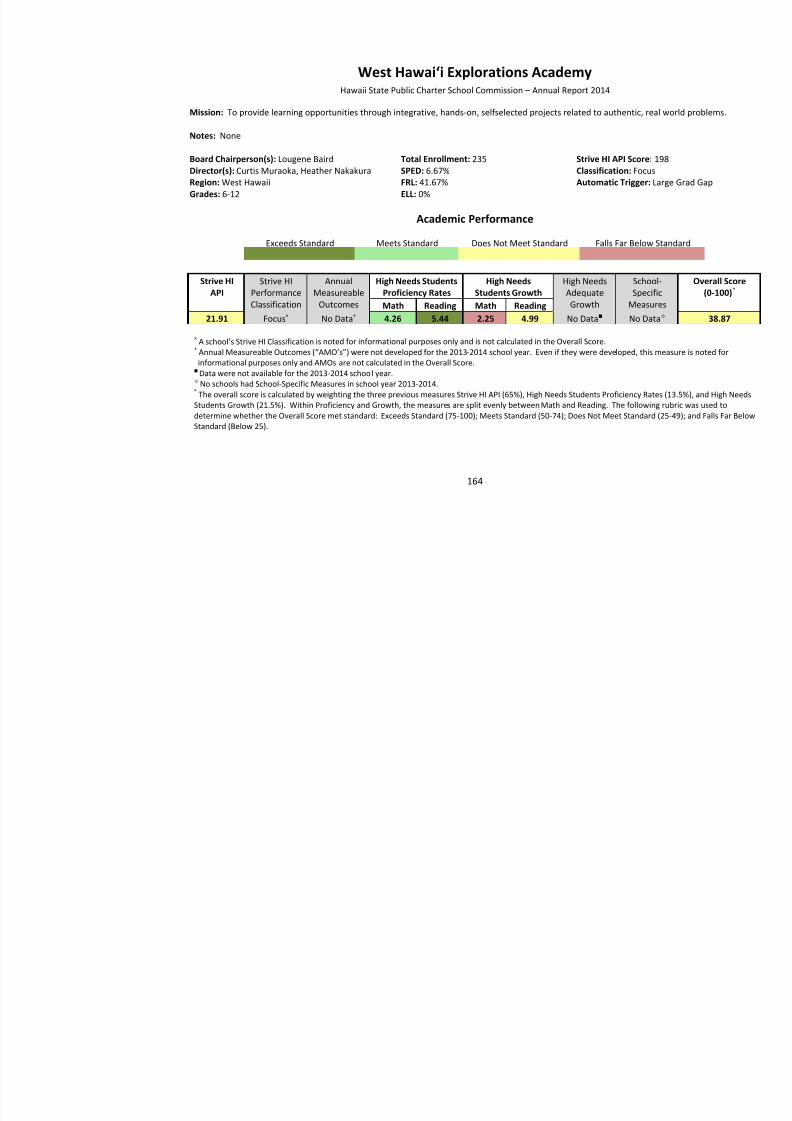
8/10/2019 Hawaii charter schools annual report
http://slidepdf.com/reader/full/hawaii-charter-schools-annual-report 167/268
164
API PerformanceClassification
MeasureableOutcomes
Proficiency Rates Students Growth AdequateGrowth
SpecificMeasuresMath Reading Math Reading
21.91 Focus × No Data + 4.26 5.44 2.25 4.99 No Data No Data
× A school’s Strive HI Classification is noted for informational purposes only and is not calculated in the Overall Score.+ Annual Measureable Outcomes (“AMO’s”) were not developed for the 2013 -2014 school year. Even if they were developed, this measurinformational purposes only and AMOs are not calculated in the Overall Score. Data were not available for the 2013-2014 school year. No schools had School-Specific Measures in school year 2013-2014.
* The overall score is calculated by weighting the three previous measures Strive HI API (65%), High Needs Students Proficiency Rates (13.5%), Students Growth (21.5%). Within Proficiency and Growth, the measures are split evenly between Math and Reading. The following rubric was udetermine whether the Overall Score met standard: Exceeds Standard (75-100); Meets Standard (50-74); Does Not Meet Standard (25-49); and FaStandard (Below 25).
Financial Performance
Meets Target Does Not Meet Target Falls Far Below Target
Current RatioGreater than or
equal to 1.1
EnrollmentVariance equals or
exceeds 95% in
the most recentyear
Days Cash onHand 60 dayscash on hand
TotalMargin ispositive
Debt to AssetsRatio is less than
.50
CashFlow ispositive
Unrestricted FundBalance
Percentage
5.43 102.2% 202.45 0.10 7% -141,124 140.9%
Organizational Performance
Meets Standard Does Not Meet Standard Falls Far Below Standard
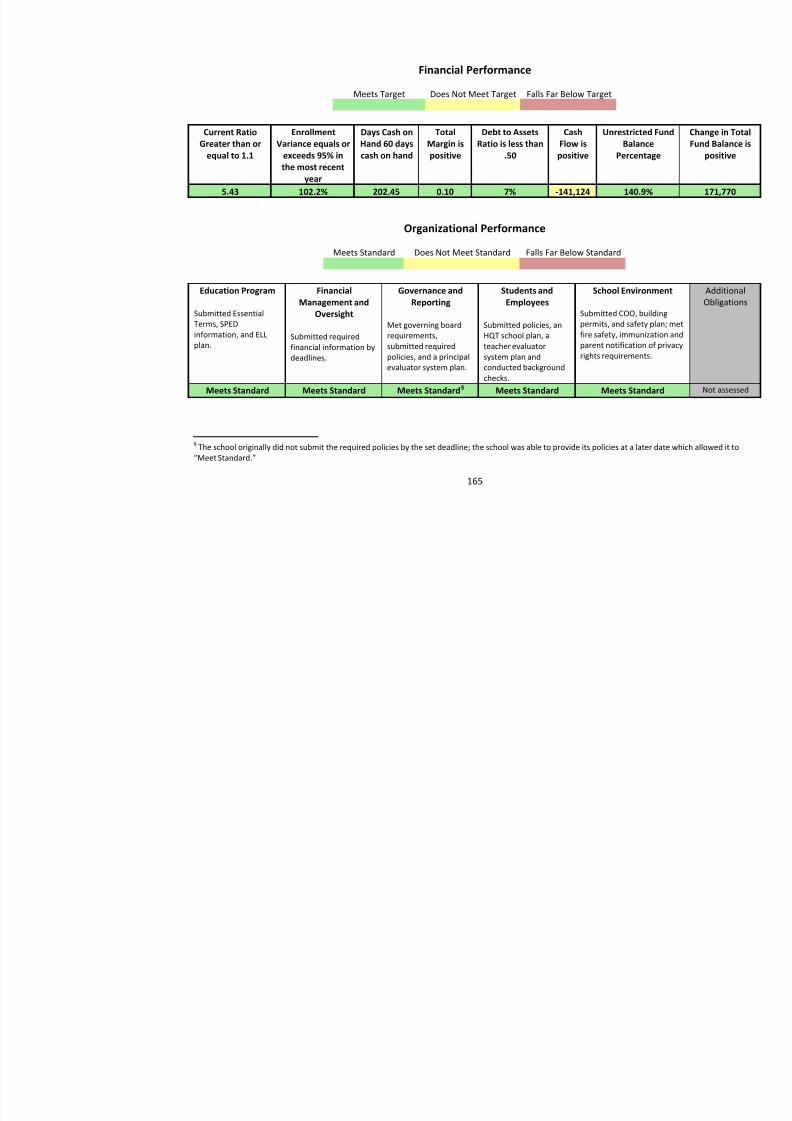
8/10/2019 Hawaii charter schools annual report
http://slidepdf.com/reader/full/hawaii-charter-schools-annual-report 168/268
165
Education Program
Submitted EssentialTerms, SPEDinformation, and ELLplan.
FinancialManagement and
Oversight
Submitted requiredfinancial information bydeadlines.
Governance andReporting
Met governing boardrequirements,submitted requiredpolicies, and a principalevaluator system plan.
Students andEmployees
Submitted policies, anHQT school plan, ateacher evaluatorsystem plan andconducted backgroundchecks.
School Environment
Submitted COO, buildingpermits, and safety plan; mfire safety, immunization parent notification of privrights requirements.
Meets Standard Meets Standard Meets Standard 82F
§ Meets Standard Meets Standard
§ The school originally did not submit the required policies by the set deadline; the school was able to provide its policies at a later date which allo“Meet Standard.”
30B30BAppendix B: Strive HI Individual School Performance Reports
8/10/2019 Hawaii charter schools annual report
http://slidepdf.com/reader/full/hawaii-charter-schools-annual-report 169/268
Hawaii Public Schools School Year 2013−2014 Strive HI School Performance Report
Connections NCPCS 23School Year 2013−2014: Continuous ImprovementSchool Year 2012−2013: Continuous Improvement
Raw Value Weighted Points
A c h i e v e m e n t
G r o w t h
22
28
6
30
30
55%
71%
29%
66
64
Math Proficiency
Reading Proficiency
Science Proficiency
Math Growth
Reading Growth
11th Grade ACT
56 ptsof
100 pts
60 ptsof
60 pts
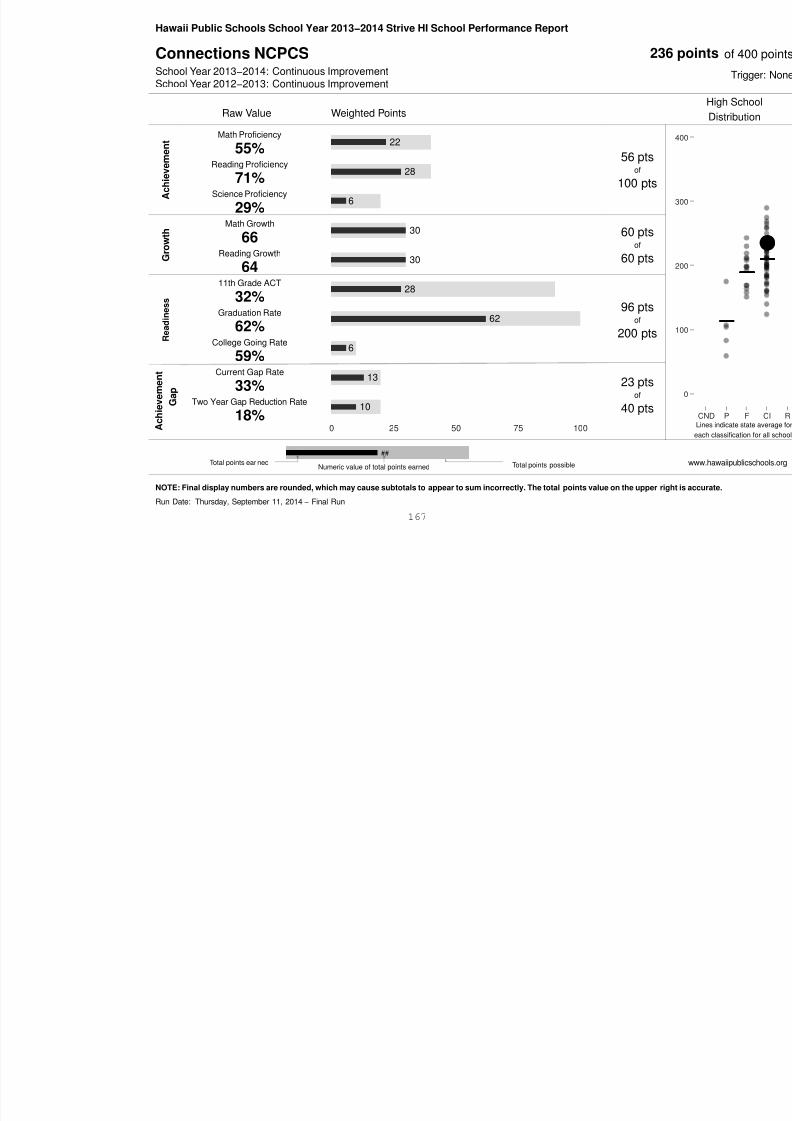
8/10/2019 Hawaii charter schools annual report
http://slidepdf.com/reader/full/hawaii-charter-schools-annual-report 170/268
R e a d i n e s s
A c h i e v e m e n t
G a p
28
62
6
13
10
0 25 50 75 100
32%
62%
59%
33%
18%
Graduation Rate
College Going Rate
Current Gap Rate
Two Year Gap Reduction Rate
96 ptsof
200 pts
23 ptsof
40 pts
##
Numeric value of total points earned Total points possibleTotal points ear ned
NOTE: Final display numbers are rounded, which may cause subtotals to appear to sum incorrectly. The total points value on the upper right is accurate.
Run Date: Thursday, September 11, 2014 − Final Run
167
Hawaii Public Schools School Year 2013-14 Strive HI School Performance Report
Hakipu‘u Learning Center 107School Year 2013-14: PrioritySchool Year 2012-13: Priority
Raw Value Weighted Points High Scho
A c h i e v e
m e n t
Math Proficiency--%*
Reading Proficiency--%*
Science Proficiency--%*
--*
-- pts*
of100 pts
400 -
300 -
G r o w t h
Math Growth--*
Reading Growth--*
--*-- pts*
of60 pts
200 -
h
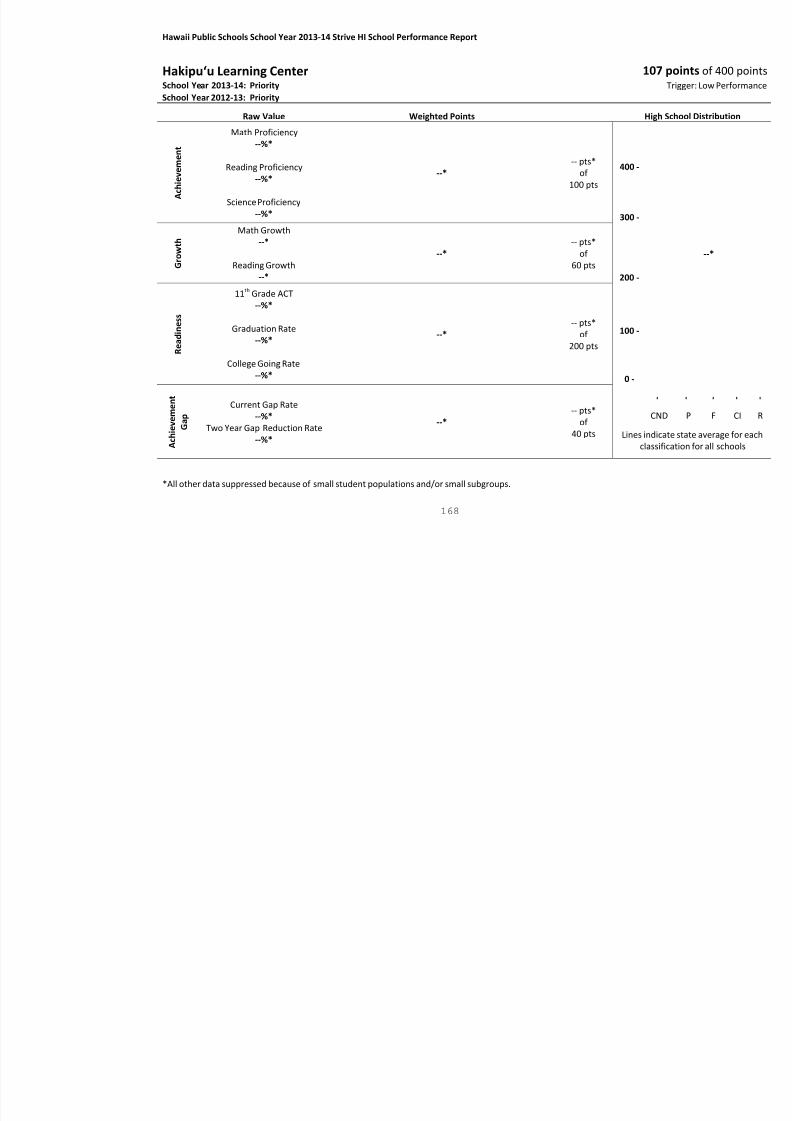
8/10/2019 Hawaii charter schools annual report
http://slidepdf.com/reader/full/hawaii-charter-schools-annual-report 171/268
*All other data suppressed because of small student populations and/or small subgroups.
R e a
d i n e s s
11 th Grade ACT--%*
Graduation Rate--%*
College Going Rate--%*
--*-- pts*
of200 pts
100 -
0 -
A c h i e v e m
e n t
G a p
Current Gap Rate--%*
Two Year Gap Reduction Rate--%*
--* -- pts*of40 pts
-
CN
Lines indicaclassif
168
Hawaii Public Schools School Year 2013-14 Strive HI School Performance Report
Halau Ku Mana Public Charter School 238School Year 2013-14: Continuous ImprovementSchool Year 2012-13: Continuous Improvement
Raw Value Weighted Points High Scho
A c h i e v e m e n t
Math Proficiency--%*
Reading Proficiency--%*
Science Proficiency--%*
--*
-- pts*
of100 pts
400 -
300 -
G r o w t h
Math Growth--*
Reading Growth--*
--*-- pts*
of60 pts
200 -
11 th G d ACT
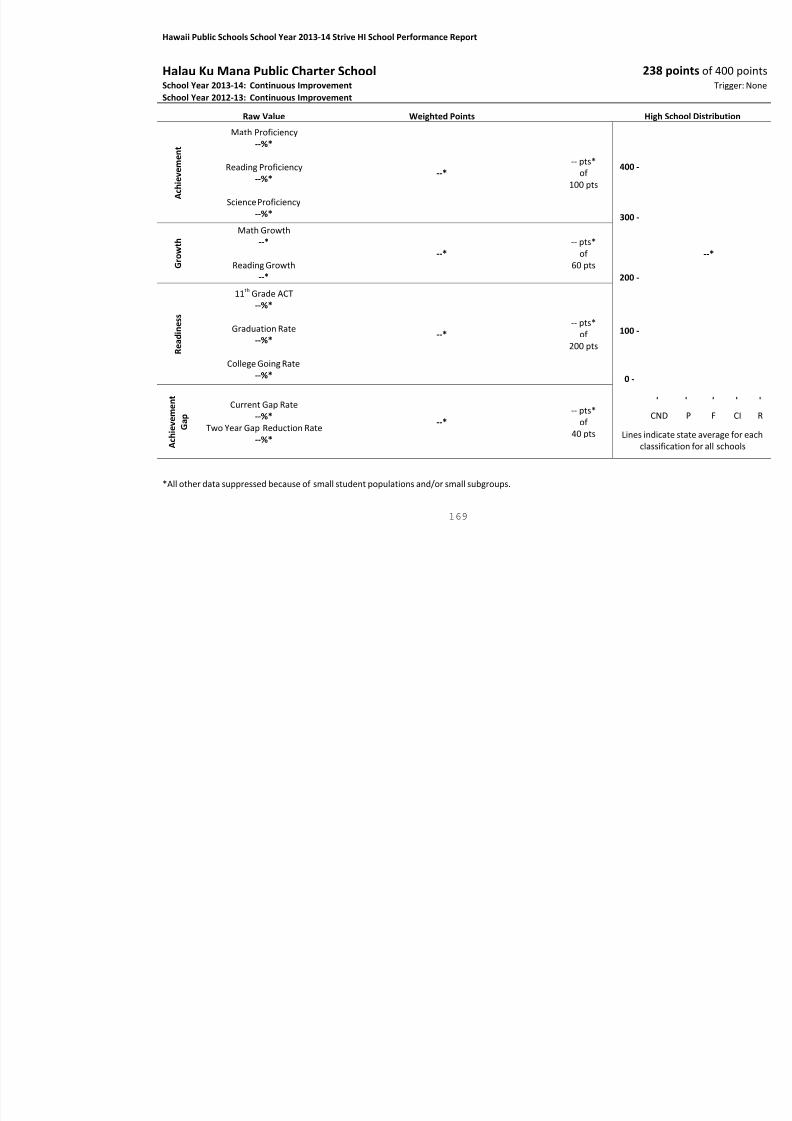
8/10/2019 Hawaii charter schools annual report
http://slidepdf.com/reader/full/hawaii-charter-schools-annual-report 172/268
*All other data suppressed because of small student populations and/or small subgroups.
R e a
d i n e s s
11 th Grade ACT--%*
Graduation Rate--%*
College Going Rate--%*
--*-- pts*
of200 pts
100 -
0 -
A c h i e v e m
e n t
G a p
Current Gap Rate--%*
Two Year Gap Reduction Rate--%*
--* -- pts*of40 pts
-
CN
Lines indicaclassif
169
Hawaii Public Schools School Year 2013−2014 Strive HI Performance Snapshot
Halau Lokahi PCS 14School Year 2013−2014: Continuous ImprovementSchool Year 2012−2013: Continuous Improvement
Raw Value Weighted Points
A c h i e v e m e n t
G r o w t h
10
24
2
0
15
5
26%
60%
9%
41
54
6%
Math Proficiency
Reading Proficiency
Science Proficiency
Math Growth
Reading Growth
11th Grade ACT
36 ptsof
100 pts
15 ptsof
60 pts
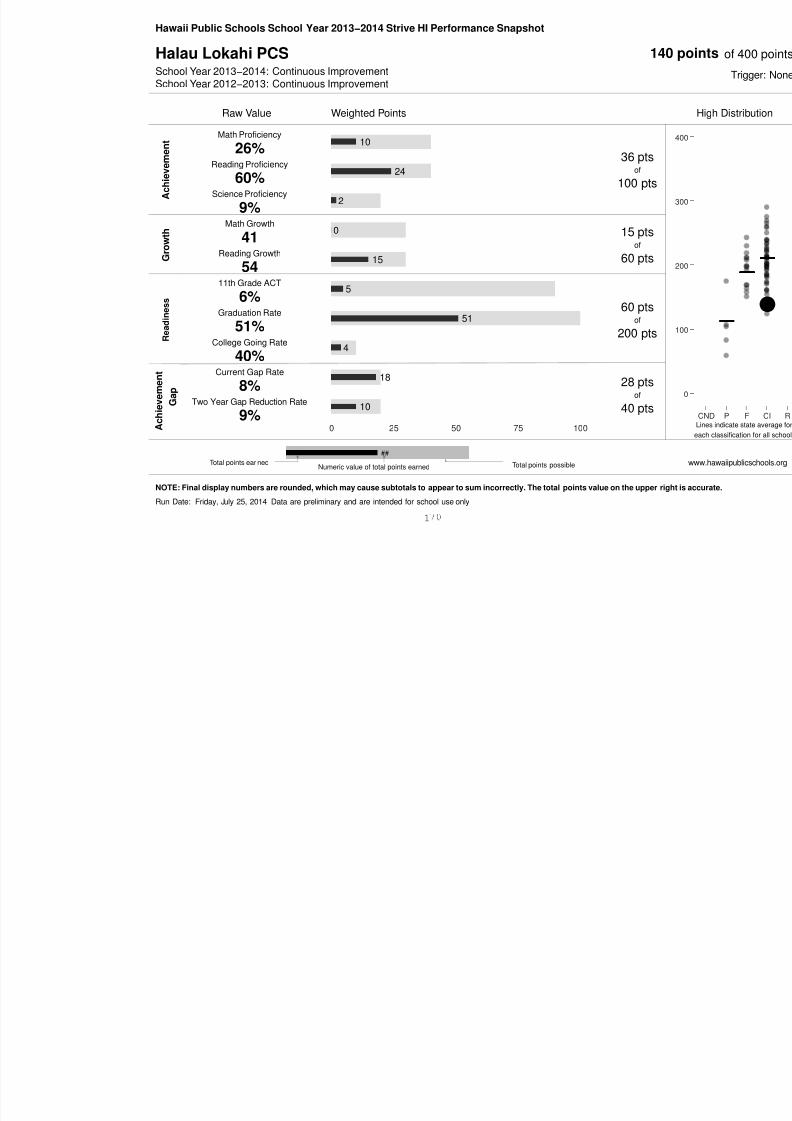
8/10/2019 Hawaii charter schools annual report
http://slidepdf.com/reader/full/hawaii-charter-schools-annual-report 173/268
R e a d i n e s s
A c h i e v e m e n t
G a p
5
51
4
18
10
0 25 50 75 100
6%
51%
40%
8%
9%
Graduation Rate
College Going Rate
Current Gap Rate
Two Year Gap Reduction Rate
60 ptsof
200 pts
28 ptsof
40 pts
##
Numeric value of total points earned Total points possibleTotal points ear ned
NOTE: Final display numbers are rounded, which may cause subtotals to appear to sum incorrectly. The total points value on the upper right is accurate.
Run Date: Friday, July 25, 2014 Data are preliminary and are intended for school use only
1
Hawaii Public Schools School Year 2013−2014 Strive HI Performance Snapshot
Hawaii Academy of Arts and Science PCS 24School Year 2013−2014: FocusSchool Year 2012−2013: Focus
Raw Value Weighted Points
A c h i e v e m e n t
G r o w t h
s
22
31
9
9
21
35
54%
78%
47%
43
57
39%
Math Proficiency
Reading Proficiency
Science Proficiency
Math Growth
Reading Growth
11th Grade ACT
62 ptsof
100 pts
30 ptsof
60 pts
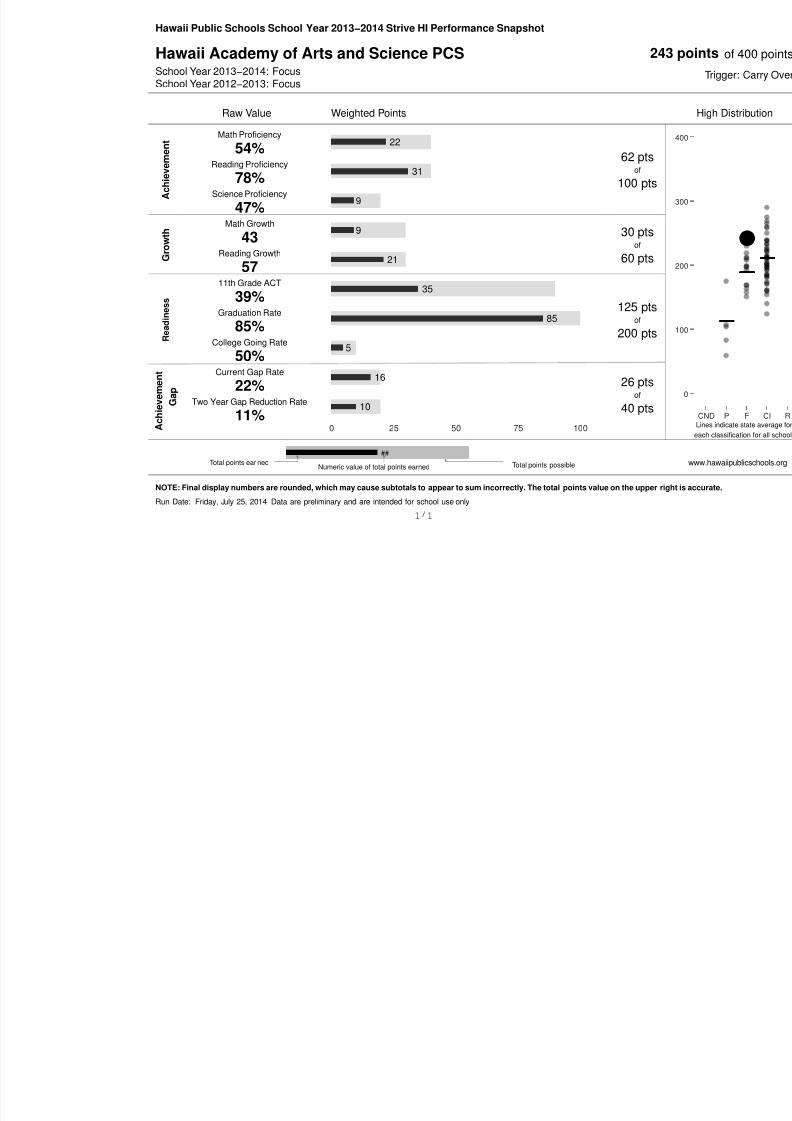
8/10/2019 Hawaii charter schools annual report
http://slidepdf.com/reader/full/hawaii-charter-schools-annual-report 174/268
R e a d i n e s s
A c h i e v e m e n t
G a p
35
85
5
16
10
0 25 50 75 100
39%
85%
50%
22%
11%
Graduation Rate
College Going Rate
Current Gap Rate
Two Year Gap Reduction Rate
125 ptsof
200 pts
26 ptsof
40 pts
##
Numeric value of total points earned Total points possibleTotal points ear ned
NOTE: Final display numbers are rounded, which may cause subtotals to appear to sum incorrectly. The total points value on the upper right is accurate.
Run Date: Friday, July 25, 2014 Data are preliminary and are intended for school use only
1 1
Hawaii Public Schools School Year 2013−2014 Strive HI Performance Snapshot
Hawaii Technology Academy PCS 19School Year 2013−2014: FocusSchool Year 2012−2013: Focus
Raw Value Weighted Points
A c h i e v
e m e n t
G r o w t h
s
24
33
10
9
15
48
60%
83%
50%
43
51
53%
Math Proficiency
Reading Proficiency
Science Proficiency
Math Growth
Reading Growth
11th Grade ACT
67 ptsof
100 pts
24 ptsof
60 pts
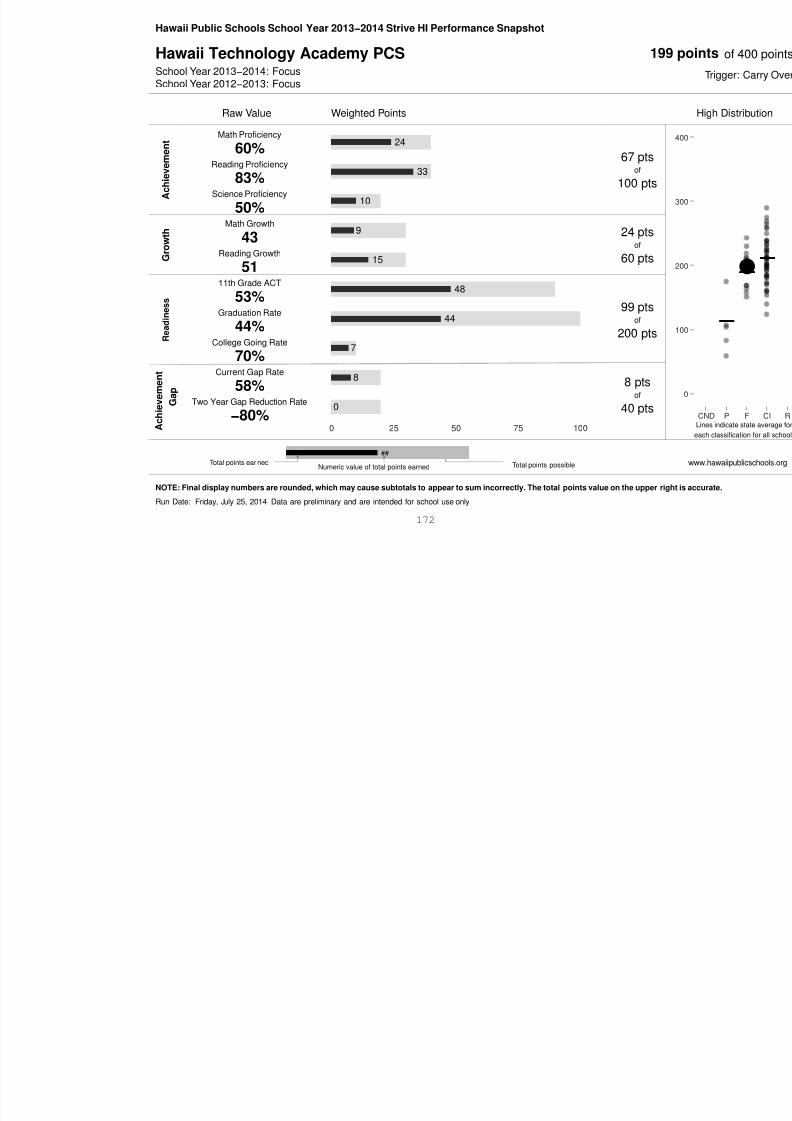
8/10/2019 Hawaii charter schools annual report
http://slidepdf.com/reader/full/hawaii-charter-schools-annual-report 175/268
R e a d i n e s s
A c h i e v e m e n t
G a p
48
44
7
8
0
0 25 50 75 100
53%
44%
70%
58%
−80%
Graduation Rate
College Going Rate
Current Gap Rate
Two Year Gap Reduction Rate
99 ptsof
200 pts
8 ptsof
40 pts
##
Numeric value of total points earned Total points possibleTotal points ear ned
NOTE: Final display numbers are rounded, which may cause subtotals to appear to sum incorrectly. The total points value on the upper right is accurate.
Run Date: Friday, July 25, 2014 Data are preliminary and are intended for school use only
172
Hawaii Public Schools School Year 2013−2014 Strive HI Performance Snapshot
Innovations PCS 30School Year 2013−2014: Continuous ImprovementSchool Year 2012−2013: Continuous Improvement
A c h i e v e m
e n t
G r o w t h
33
39
13
74
106
70%
83%
55%
62
64
Math Proficiency
Reading Proficiency
Science Proficiency
Math Growth
Reading Growth
72 ptsof
100 pts
153 ptsof
180 pts
85 ptsof
118 pts
180 ptsof
212 pts
Raw Value Weighted PointsUnadjusted
Points
Adjusted forMissing
Indicators
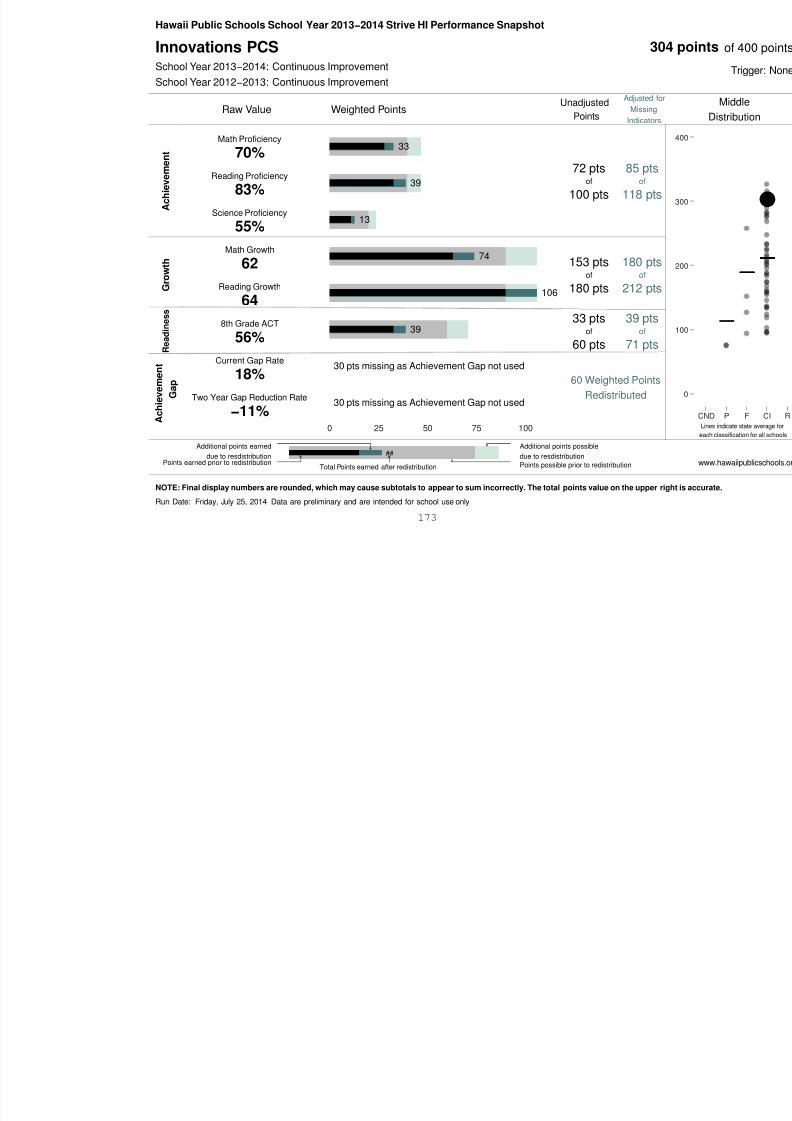
8/10/2019 Hawaii charter schools annual report
http://slidepdf.com/reader/full/hawaii-charter-schools-annual-report 176/268
R e a d i n e s s
A c h i e v e m e n t
G a p
39
30 pts missing as Achievement Gap not used
30 pts missing as Achievement Gap not used
0 25 50 75 100
64
56%
18%
−11%
8th Grade ACT
Current Gap Rate
Two Year Gap Reduction Rate
180 pts
33 ptsof
60 pts
212 pts
39 ptsof
71 pts
60 Weighted PointsRedistributed
##
Total Points earned after redistribution
Additional points possibledue to resdistributionPoints possible prior to redistributionPoints earned prior to redistribution
Additional points earneddue to resdistribution
NOTE: Final display numbers are rounded, which may cause subtotals to appear to sum incorrectly. The total points value on the upper right is accurate.
Run Date: Friday, July 25, 2014 Data are preliminary and are intended for school use only
173
Hawaii Public Schools School Year 2013-14 Strive HI School Performance Report
Ka ‘Umeke Kā‘eo 104School Year 2013-14: PrioritySchool Year 2012-13: Priority
Raw Value Weighted Points High Scho
A c h i e v e m e n t
Math Proficiency--%*
Reading Proficiency--%*
Science Proficiency--%*
--*
-- pts*
of100 pts
400 -
300 -
G r o w t h
Math Growth--*
Reading Growth--*
--*-- pts*
of60 pts
200 -
11th
Grade ACT%*
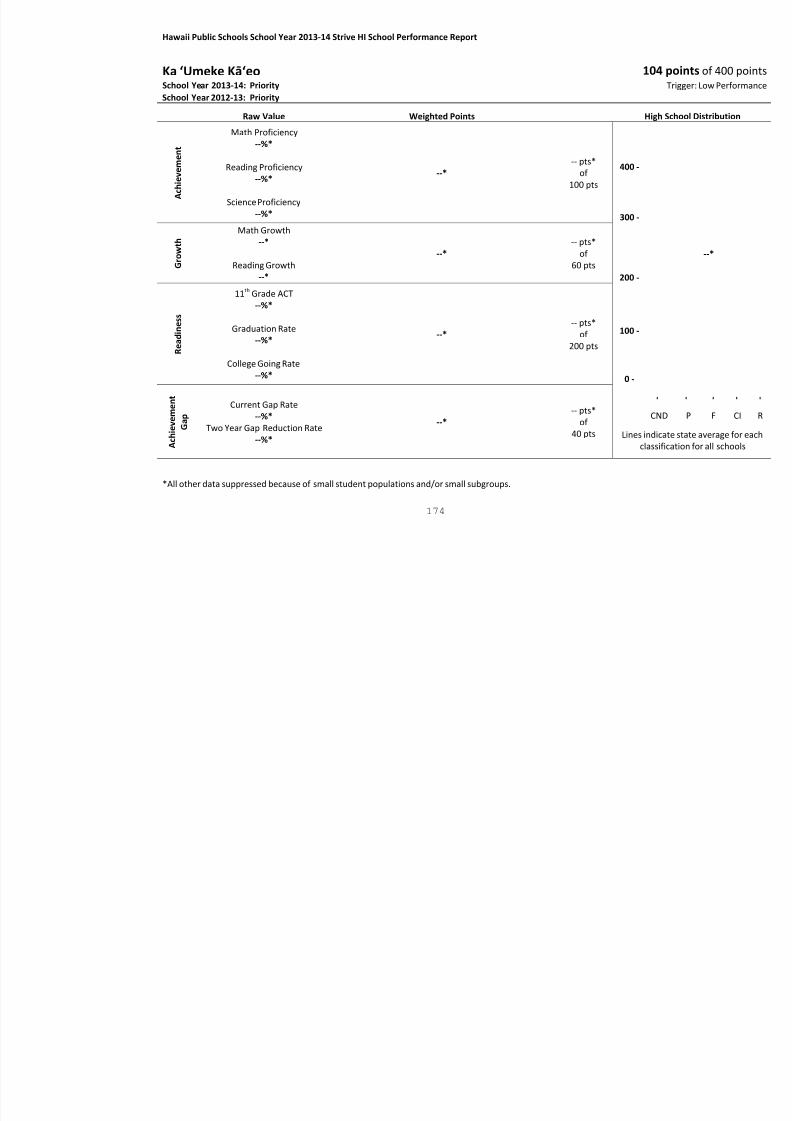
8/10/2019 Hawaii charter schools annual report
http://slidepdf.com/reader/full/hawaii-charter-schools-annual-report 177/268
*All other data suppressed because of small student populations and/or small subgroups.
R e a
d i n e s s
--%*
Graduation Rate--%*
College Going Rate--%*
--*-- pts*
of200 pts
100 -
0 -
A c h i e v e m
e n t
G a p
Current Gap Rate
--%* Two Year Gap Reduction Rate
--%*
--*-- pts*
of40 pts
-
CN
Lines indicaclassif
174
Hawaii Public Schools School Year 2013-14 Strive HI School Performance Report
Ka Waihona o ka Na‘auao Public Charter School 146 School Year 2013-14: Continuous ImprovementSchool Year 2012-13: Continuous Improvement
Raw Value Weighted Points High Scho
A c h i e v e m e n t
Math Proficiency--%*
Reading Proficiency--%*
Science Proficiency--%*
--*
-- pts*
of100 pts
400 -
300 -
G r o w t h
Math Growth--*
Reading Growth--*
--*-- pts*
of60 pts
200 -
11th
Grade ACT%*
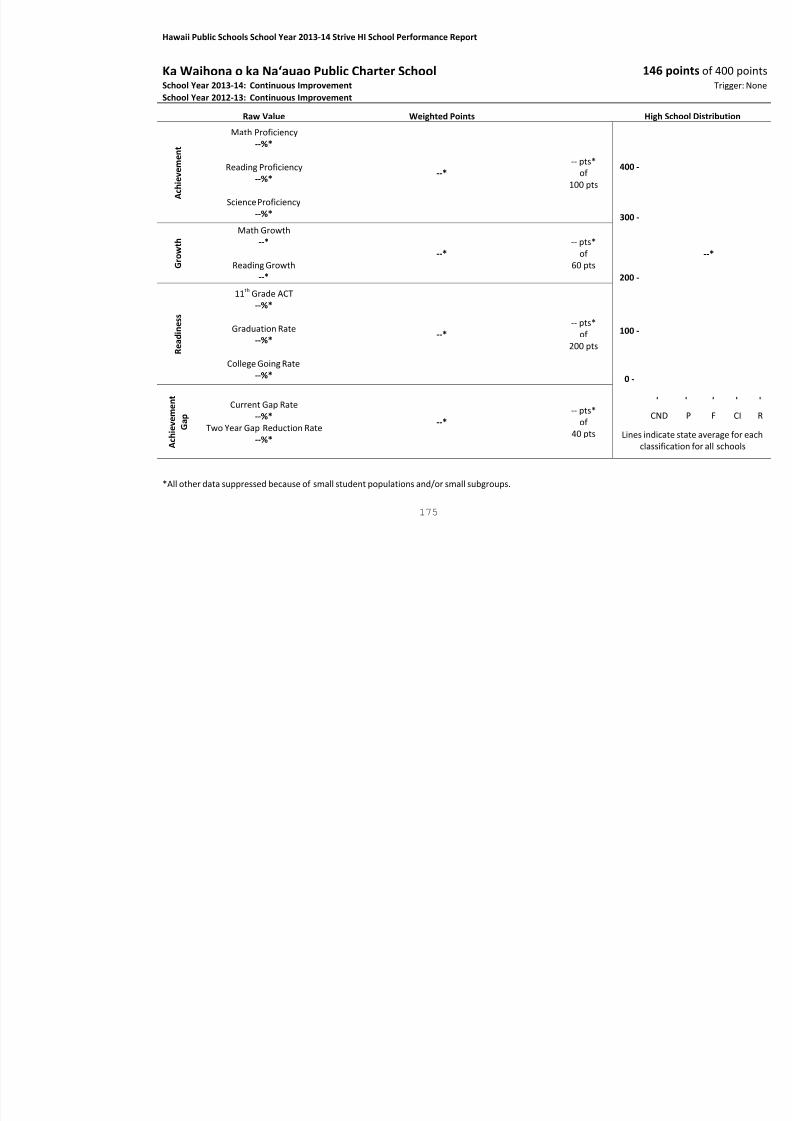
8/10/2019 Hawaii charter schools annual report
http://slidepdf.com/reader/full/hawaii-charter-schools-annual-report 178/268
*All other data suppressed because of small student populations and/or small subgroups.
R e a
d i n e s s
--%
Graduation Rate--%*
College Going Rate--%*
--*-- pts*
of200 pts
100 -
0 -
A c h i e v e m
e n t
G a p
Current Gap Rate
--%* Two Year Gap Reduction Rate
--%*
--*-- pts*
of40 pts
-
CN
Lines indicaclassif
175
Hawaii Public Schools School Year 2013−2014 Strive HI Performance Snapshot
Kamaile Academy PCS 17School Year 2013−2014: PrioritySchool Year 2012−2013: Priority
A c h i e v e m e n t
G r o w t h
e s s
14
18
3
21
15
67
35%
44%
16%
60
50
33%
Math Proficiency
Reading Proficiency
Science Proficiency
Math Growth
Reading Growth
11th Grade ACT
35 ptsof
100 pts
36 ptsof
60 pts
67 pts
35 ptsof
100 pts
36 ptsof
60 pts
67 pts
Raw Value Weighted PointsUnadjusted
Points
Adjusted forMissing
Indicators
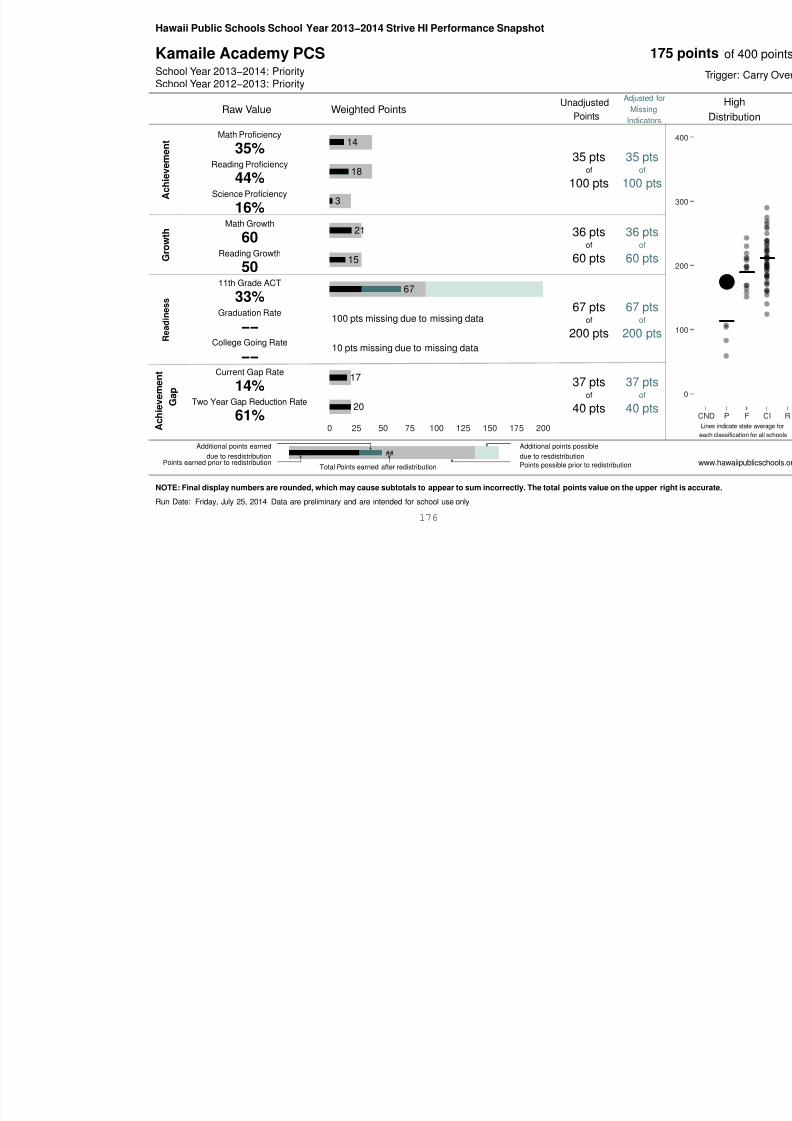
8/10/2019 Hawaii charter schools annual report
http://slidepdf.com/reader/full/hawaii-charter-schools-annual-report 179/268
R e a d i n e
A c h i e v e m e n t
G a p
100 pts missing due to missing data
10 pts missing due to missing data
17
20
0 25 50 75 100 125 150 175 200
−−
−−
14%
61%
Graduation Rate
College Going Rate
Current Gap Rate
Two Year Gap Reduction Rate
67 ptsof
200 pts
37 ptsof
40 pts
67 ptsof
200 pts
37 ptsof
40 pts
##
Total Points earned after redistribution
Additional points possibledue to resdistributionPoints possible prior to redistributionPoints earned prior to redistribution
Additional points earneddue to resdistribution
NOTE: Final display numbers are rounded, which may cause subtotals to appear to sum incorrectly. The total points value on the upper right is accurate.
Run Date: Friday, July 25, 2014 Data are preliminary and are intended for school use only
176
Hawaii Public Schools School Year 2013-14 Strive HI School Performance Report
Kanu o ka ‘Āina New Century Public Charter School 213 School Year 2013-14: Continuous ImprovementSchool Year 2012-13: Continuous Improvement
Raw Value Weighted Points High Scho
A c h i e v e m e n t
Math Proficiency--%*
Reading Proficiency--%*
Science Proficiency--%*
--*
-- pts*
of100 pts
400 -
300 -
G r o w t h
Math Growth--*
Reading Growth--*
--*-- pts*
of60 pts
200 -
11th
Grade ACT--%*

8/10/2019 Hawaii charter schools annual report
http://slidepdf.com/reader/full/hawaii-charter-schools-annual-report 180/268
*All other data suppressed because of small student populations and/or small subgroups.
R e a
d i n e s s
Graduation Rate--%*
College Going Rate--%*
--*-- pts*
of200 pts
100 -
0 -
A c h i e v e m
e n t
G a p
Current Gap Rate
--%* Two Year Gap Reduction Rate
--%*
--*-- pts*
of40 pts
-
CN
Lines indicaclassif
1
Hawaii Public Schools School Year 2013-14 Strive HI School Performance Report
Kanuikapono Public Charter School 154School Year 2013-14: Continuous ImprovementSchool Year 2012-13: Continuous Improvement
Raw Value Weighted Points High Scho
A c h i e v e m e n t
Math Proficiency--%*
Reading Proficiency--%*
Science Proficiency--%*
--*
-- pts*
of100 pts
400 -
300 -
G r o w t h
Math Growth--*
Reading Growth--*
--*-- pts*
of60 pts
200 -
11th
Grade ACT--%*

8/10/2019 Hawaii charter schools annual report
http://slidepdf.com/reader/full/hawaii-charter-schools-annual-report 181/268
*All other data suppressed because of small student populations and/or small subgroups.
R e a
d i n e s s
Graduation Rate--%*
College Going Rate--%*
--*-- pts*
of200 pts
100 -
0 -
A c h i e v e m e n t
G a p
Current Gap Rate
--%* Two Year Gap Reduction Rate
--%*
--*-- pts*
of40 pts
-
CN
Lines indicaclassif
178
Hawaii Public Schools School Year 2013-14 Strive HI School Performance Report
Kawaikini New Century Public Charter School 202School Year 2013-14: Continuous ImprovementSchool Year 2012-13: Continuous Improvement
Raw Value Weighted Points High Scho
A c h i e v e m e n t
Math Proficiency--%*
Reading Proficiency--%*
Science Proficiency--%*
--*
-- pts*
of100 pts
400 -
300 -
G r o w t h
Math Growth--*
Reading Growth--*
--*-- pts*
of60 pts
200 -
11th
Grade ACT--%*
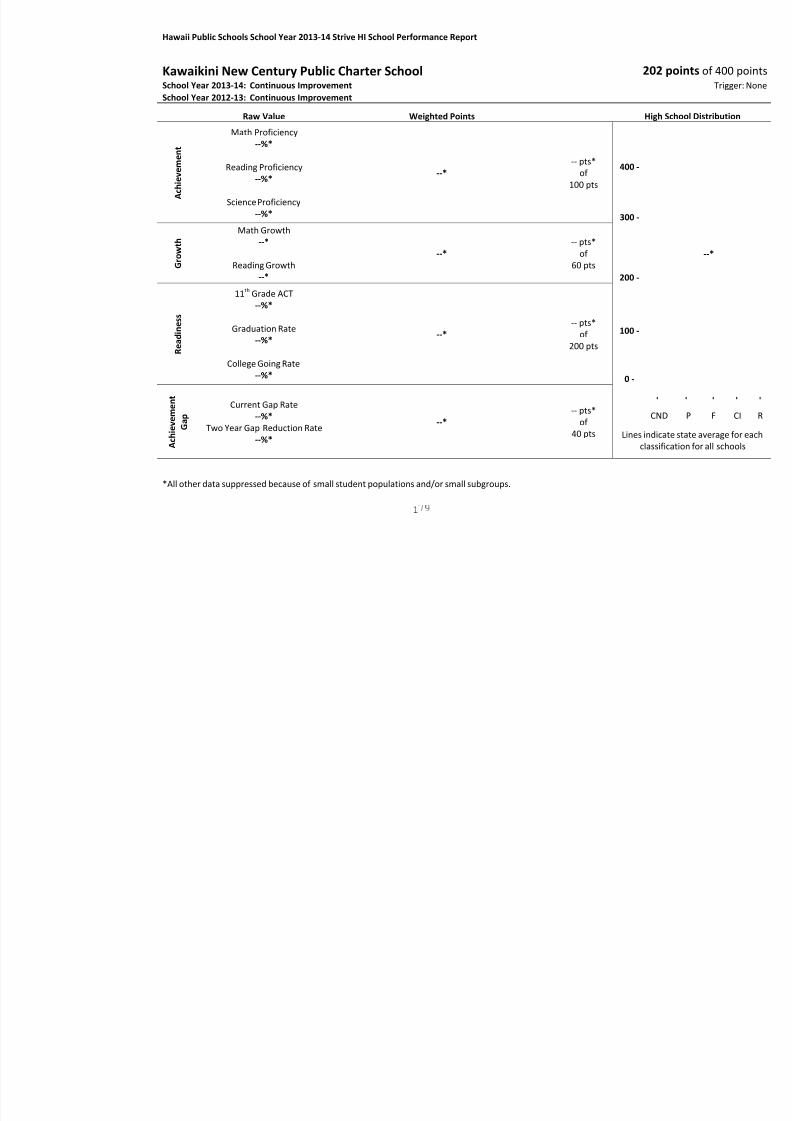
8/10/2019 Hawaii charter schools annual report
http://slidepdf.com/reader/full/hawaii-charter-schools-annual-report 182/268
*All other data suppressed because of small student populations and/or small subgroups.
R e a
d i n e s s
Graduation Rate--%*
College Going Rate--%*
--*-- pts*
of200 pts
100 -
0 -
A c h i e v e m e n t
G a p
Current Gap Rate
--%* Two Year Gap Reduction Rate
--%*
--*-- pts*
of40 pts
-
CNLines indica
classif
1
Hawaii Public Schools School Year 2013-14 Strive HI School Performance Report
Ke Ana La‘ahana PCS 170School Year 2013-14: Continuous ImprovementSchool Year 2012-13: Continuous Improvement
Raw Value Weighted Points High Scho
A c h i e v e m e n t
Math Proficiency--%*
Reading Proficiency--%*
Science Proficiency--%*
--*
-- pts*
of100 pts
400 -
300 -
G r o w t h
Math Growth--*
Reading Growth--*
--*-- pts*
of60 pts
200 -
s
11th
Grade ACT--%*
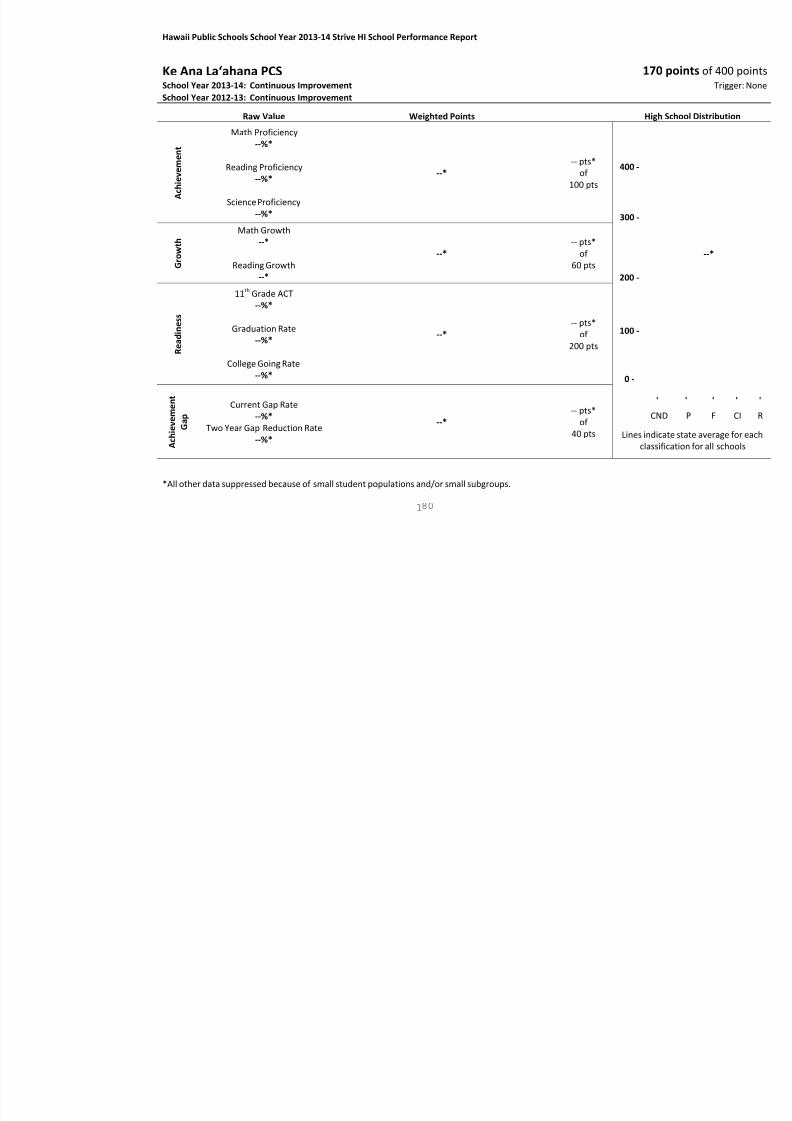
8/10/2019 Hawaii charter schools annual report
http://slidepdf.com/reader/full/hawaii-charter-schools-annual-report 183/268
*All other data suppressed because of small student populations and/or small subgroups.
R e a
d i n e s s
Graduation Rate--%*
College Going Rate--%*
--*-- pts*
of200 pts
100 -
0 -
A c h i e v e m e n t
G a p
Current Gap Rate
--%* Two Year Gap Reduction Rate
--%*
--*-- pts*
of40 pts
-
CNLines indica
classif
1
Hawaii Public Schools School Year 2013-14 Strive HI School Performance Report
Ke Kula ‘o Nāwahīokalani‘ōpu‘u Iki, LPCS 76School Year 2013-14: PrioritySchool Year 2012-13: Priority
Raw Value Weighted Points High Scho
A c h i e v e m e n t
Math Proficiency--%*
Reading Proficiency--%*
Science Proficiency--%*
--*
-- pts*
of100 pts
400 -
300 -
G r o w t h
Math Growth--*
Reading Growth--*
--*-- pts*
of60 pts
200 -
s
11th
Grade ACT--%*
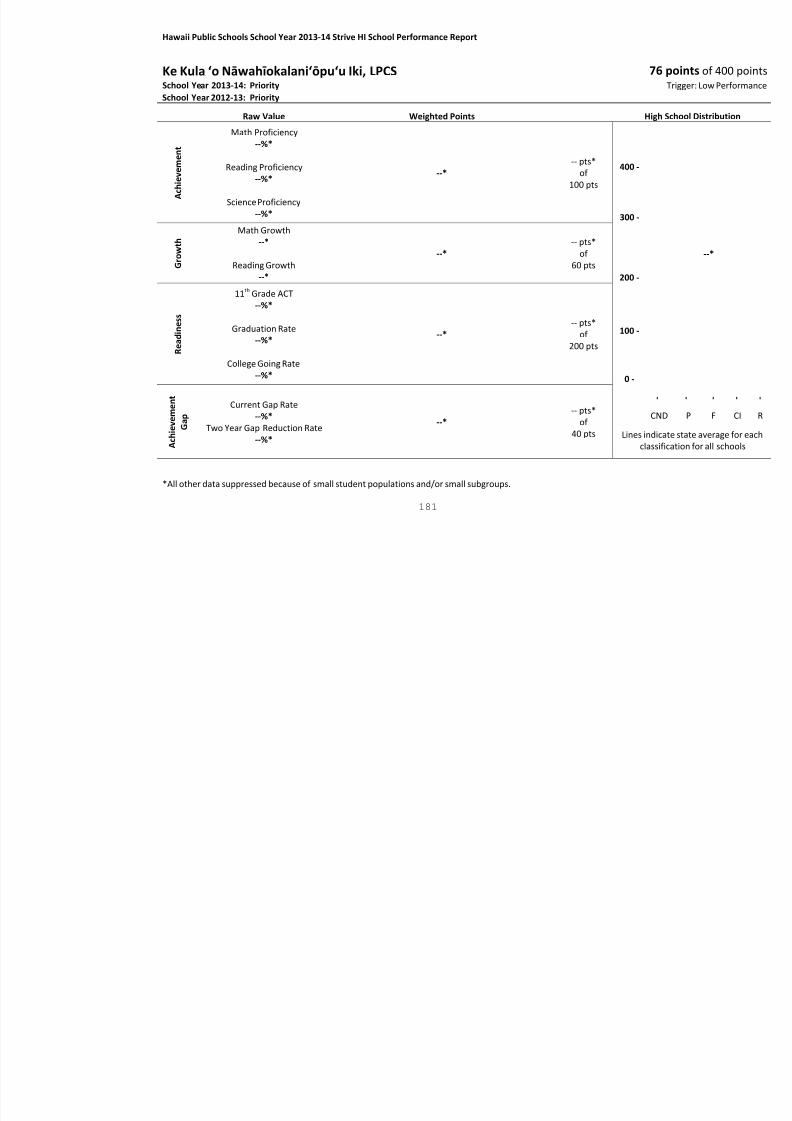
8/10/2019 Hawaii charter schools annual report
http://slidepdf.com/reader/full/hawaii-charter-schools-annual-report 184/268
*All other data suppressed because of small student populations and/or small subgroups.
R e a
d i n e s s
Graduation Rate--%*
College Going Rate--%*
--*-- pts*
of200 pts
100 -
0 -
A c h i e v e m e n t
G a p
Current Gap Rate
--%* Two Year Gap Reduction Rate
--%*
--*-- pts*
of40 pts
-
CNLines indica
classif
181
Hawaii Public Schools School Year 2013-14 Strive HI School Performance Report
Ke Kula ‘o Samuel M. Kamakau, LPCS 202School Year 2013-14: Continuous ImprovementSchool Year 2012-13: Continuous Improvement
Raw Value Weighted Points High Scho
A c h i e v e m e n t
Math Proficiency--%*
Reading Proficiency--%*
Science Proficiency--%*
--*
-- pts*
of100 pts
400 -
300 -
G r o w t h
Math Growth--*
Reading Growth--*
--*-- pts*
of60 pts
200 -
s s
11th
Grade ACT--%*

8/10/2019 Hawaii charter schools annual report
http://slidepdf.com/reader/full/hawaii-charter-schools-annual-report 185/268
*All other data suppressed because of small student populations and/or small subgroups.
R e a
d i n e s
Graduation Rate--%*
College Going Rate--%*
--*-- pts*
of200 pts
100 -
0 -
A c h i e v e m e n t
G a p
Current Gap Rate
--%* Two Year Gap Reduction Rate
--%*
--*-- pts*
of40 pts
-
CNLines indica
classif
1
Hawaii Public Schools School Year 2013-14 Strive HI School Performance Report
Ke Kula Niihau O Kekaha Learning Center 151School Year 2013-14: FocusSchool Year 2012-13: Priority
Raw Value Weighted Points High Scho
A c h i e v e m e n t
Math Proficiency--%*
Reading Proficiency--%*
Science Proficiency--%*
--*
-- pts*
of100 pts
400 -
300 -
G r o w t h
Math Growth--*
Reading Growth--*
--*-- pts*
of60 pts
200 -
s s
11th
Grade ACT--%*

8/10/2019 Hawaii charter schools annual report
http://slidepdf.com/reader/full/hawaii-charter-schools-annual-report 186/268
*All other data suppressed because of small student populations and/or small subgroups.
R e a
d i n e s
Graduation Rate--%*
College Going Rate--%*
--*-- pts*
of200 pts
100 -
0 -
A c h i e v e m e n t
G a p
Current Gap Rate
--%* Two Year Gap Reduction Rate
--%*
--*-- pts*
of40 pts
-
CNLines indica
classif
1
Hawaii Public Schools School Year 2013−2014 Strive HI Performance Snapshot
Kihei Charter School 20School Year 2013−2014: FocusSchool Year 2012−2013: Focus
Raw Value Weighted Points
A c h i e v e m e n t
G r o w t h
d i n e s s
27
35
10
0
0
50
64
67%
87%
49%
38
40
55%
Math Proficiency
Reading Proficiency
Science Proficiency
Math Growth
Reading Growth
11th Grade ACT
Graduation Rate
71 ptsof
100 pts
0 ptsof
60 pts
120 ptsof
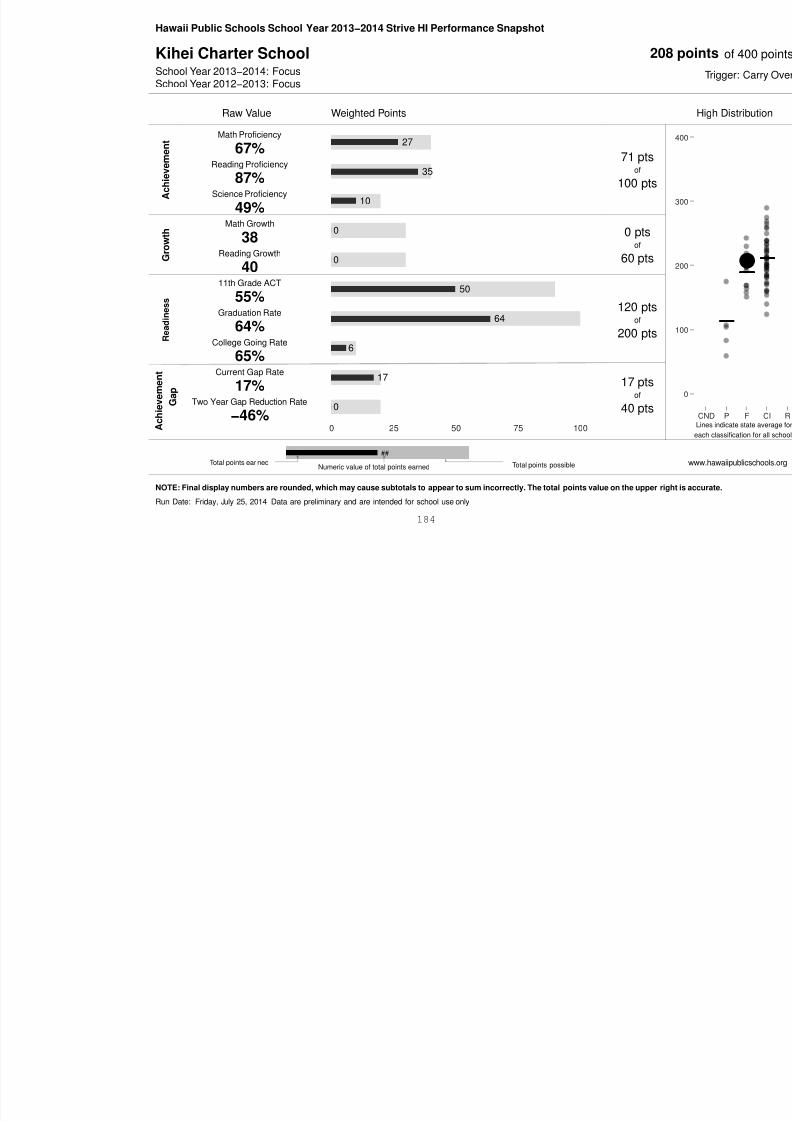
8/10/2019 Hawaii charter schools annual report
http://slidepdf.com/reader/full/hawaii-charter-schools-annual-report 187/268
R e a d
A c h i e v e m e n t
G a p
64
6
17
0
0 25 50 75 100
64%
65%
17%
−46%
College Going Rate
Current Gap Rate
Two Year Gap Reduction Rate
of
200 pts
17 ptsof
40 pts
##
Numeric value of total points earned Total points possibleTotal points ear ned
NOTE: Final display numbers are rounded, which may cause subtotals to appear to sum incorrectly. The total points value on the upper right is accurate.
Run Date: Friday, July 25, 2014 Data are preliminary and are intended for school use only
184
Hawaii Public Schools School Year 2013−2014 Strive HI Performance Snapshot
Kona Pacific PCS 16School Year 2013−2014: Continuous ImprovementSchool Year 2012−2013: Continuous Improvement
Raw Value Weighted Points
A c h i e v e m e n t
G r o w t h
e s s
8
25
7
27
45
20%
62%
37%
43
51
Math Proficiency
Reading Proficiency
Science Proficiency
Math Growth
Reading Growth
8th Grade ACT
40 ptsof
100 pts
72 ptsof
180 pts
36 pts
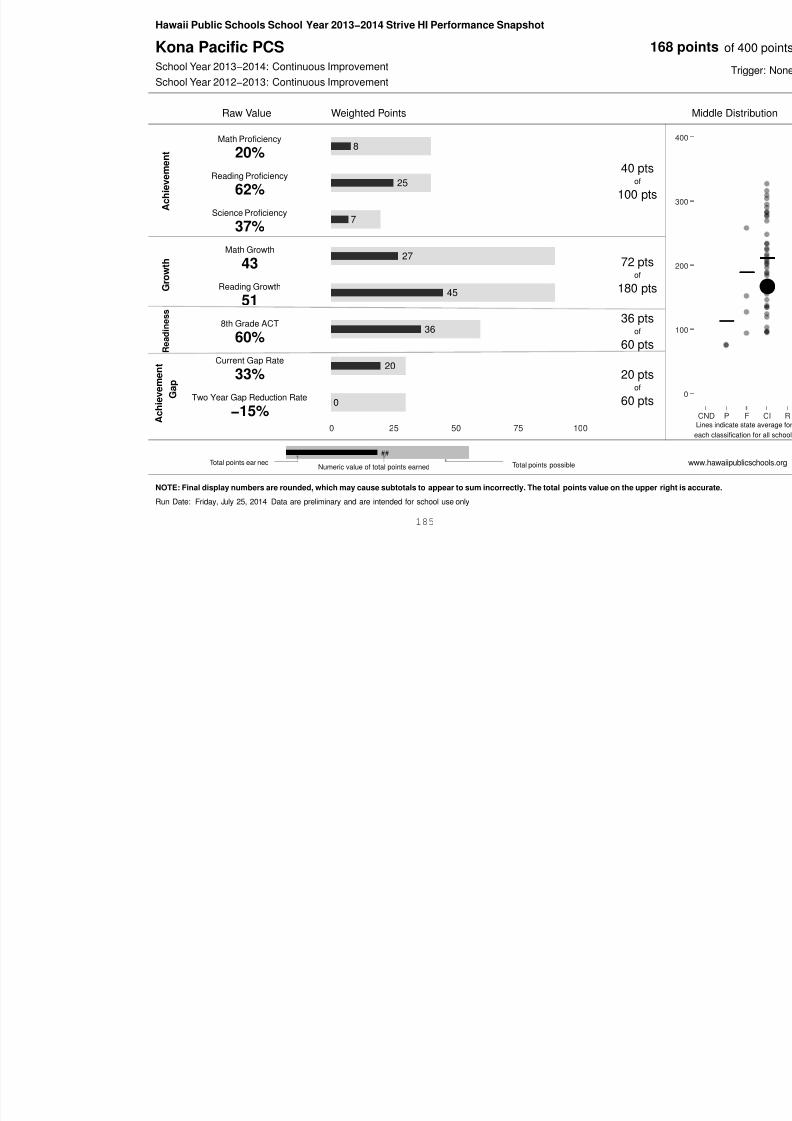
8/10/2019 Hawaii charter schools annual report
http://slidepdf.com/reader/full/hawaii-charter-schools-annual-report 188/268
R e a d i n
A c h i e v e m e n t
G a p
36
20
0
0 25 50 75 100
60%
33%
−15%
8th Grade ACT
Current Gap Rate
Two Year Gap Reduction Rate
pof
60 pts
20 ptsof
60 pts
##
Numeric value of total points earned Total points possibleTotal points ear ned
NOTE: Final display numbers are rounded, which may cause subtotals to appear to sum incorrectly. The total points value on the upper right is accurate.
Run Date: Friday, July 25, 2014 Data are preliminary and are intended for school use only
185
Hawaii Public Schools School Year 2013-14 Strive HI School Performance Report
Kua o ka Lā New Century Public Charter School 124School Year 2013-14: Continuous ImprovementSchool Year 2012-13: Continuous Improvement
Raw Value Weighted Points High Scho
A c h i e v e m e n t
Math Proficiency--%*
Reading Proficiency
--%*
Science Proficiency--%*
--*
-- pts*
of100 pts
400 -
300 -
G r o w t h
Math Growth--*
Reading Growth--*
--*-- pts*
of60 pts
200 -
e s s
11 th Grade ACT--%*
-- pts*

8/10/2019 Hawaii charter schools annual report
http://slidepdf.com/reader/full/hawaii-charter-schools-annual-report 189/268
*All other data suppressed because of small student populations and/or small subgroups.
R e a
d i n
eGraduation Rate
--%*
College Going Rate--%*
--* ptsof
200 pts
100 -
0 -
A c h i e v e m e n t
G a p
Current Gap Rate
--%* Two Year Gap Reduction Rate--%*
--*-- pts*
of40 pts
-
CNLines indica
classif
186
Hawaii Public Schools School Year 2013−2014 Strive HI Performance Snapshot
Kualapuu Elementary PCCS 25School Year 2013−2014: Continuous ImprovementSchool Year 2012−2013: Continuous Improvement
Raw Value Weighted Points
A c h i e v e m e n t
G r o w t h
in e s s
23
23
5
70
50
12
58%
57%
26%
60
54
Math Proficiency
Reading Proficiency
Science Proficiency
Math Growth
Reading Growth
Chronic Absenteeism
51 ptsof
100 pts
120 ptsof
200 pts
12 pts
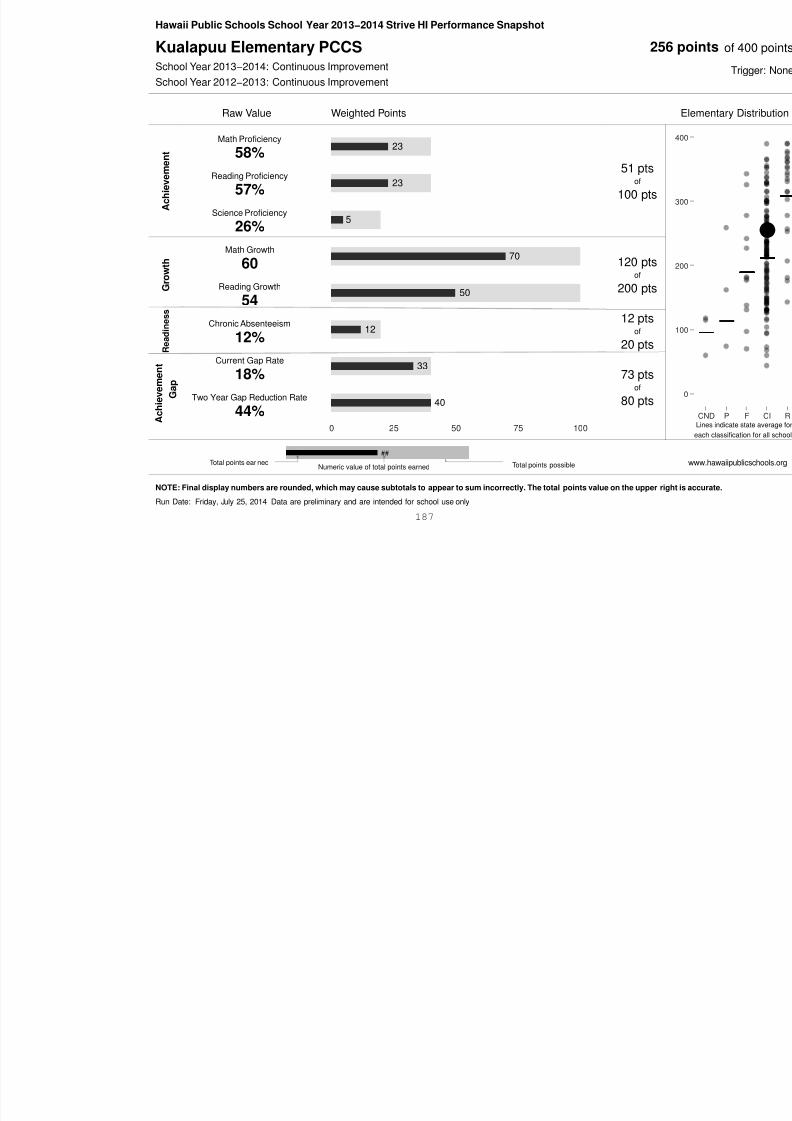
8/10/2019 Hawaii charter schools annual report
http://slidepdf.com/reader/full/hawaii-charter-schools-annual-report 190/268
R e a d i n
A c h i e v e m e n t
G a p
12
33
40
0 25 50 75 100
12%
18%
44%
C o c bse tee s
Current Gap Rate
Two Year Gap Reduction Rate
of
20 pts
73 ptsof
80 pts
##
Numeric value of total points earned Total points possibleTotal points ear ned
NOTE: Final display numbers are rounded, which may cause subtotals to appear to sum incorrectly. The total points value on the upper right is accurate.
Run Date: Friday, July 25, 2014 Data are preliminary and are intended for school use only
187
Hawaii Public Schools School Year 2013-14 Strive HI School Performance Report
Kula Aupuni Niihau A Kahelelani Aloha (KANAKA) A New CenturyPublic Charter School (PCS)
275
School Year 2013-14: Continuous ImprovementSchool Year 2012-13: Continuous Improvement
Raw Value Weighted Points High Scho
A c h i e v e m e n t
Math Proficiency--%*
Reading Proficiency--%*
Science Proficiency--%*
--*-- pts*
of100 pts
400 -
300 -
G r o w t h
Math Growth--*
Reading Growth--*
--*-- pts*
of60 pts
200 -
11 th Grade ACT--%*
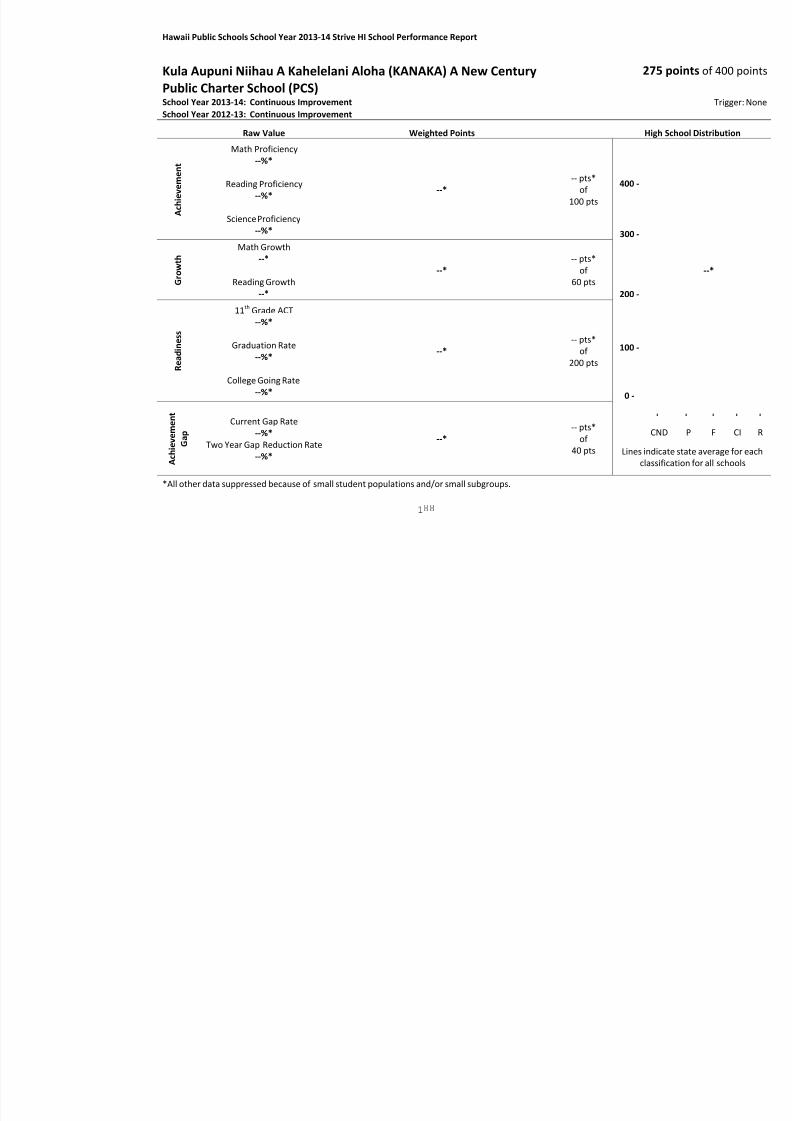
8/10/2019 Hawaii charter schools annual report
http://slidepdf.com/reader/full/hawaii-charter-schools-annual-report 191/268
*All other data suppressed because of small student populations and/or small subgroups.
R e a
d i n e s s
Graduation Rate--%*
College Going Rate--%*
--*-- pts*
of200 pts
100 -
0 -
A c h i e v e m e n t
G a p
Current Gap Rate--%*
Two Year Gap Reduction Rate--%*
--*-- pts*
of40 pts
-
CN
Lines indicaclassif
1
Hawaii Public Schools School Year 2013−2014 Strive HI Performance Snapshot
Lanikai Elementary PCS 20School Year 2013−2014: Continuous ImprovementSchool Year 2012−2013: Continuous Improvement
Raw Value Weighted Points
A c h i e v e m e n t
G r o w t h
i n e s s
34
36
14
50
0
20
85%
89%
72%
53
42
Math Proficiency
Reading Proficiency
Science Proficiency
Math Growth
Reading Growth
Chronic Absenteeism
84 ptsof
100 pts
50 ptsof
200 pts
20 ptsf
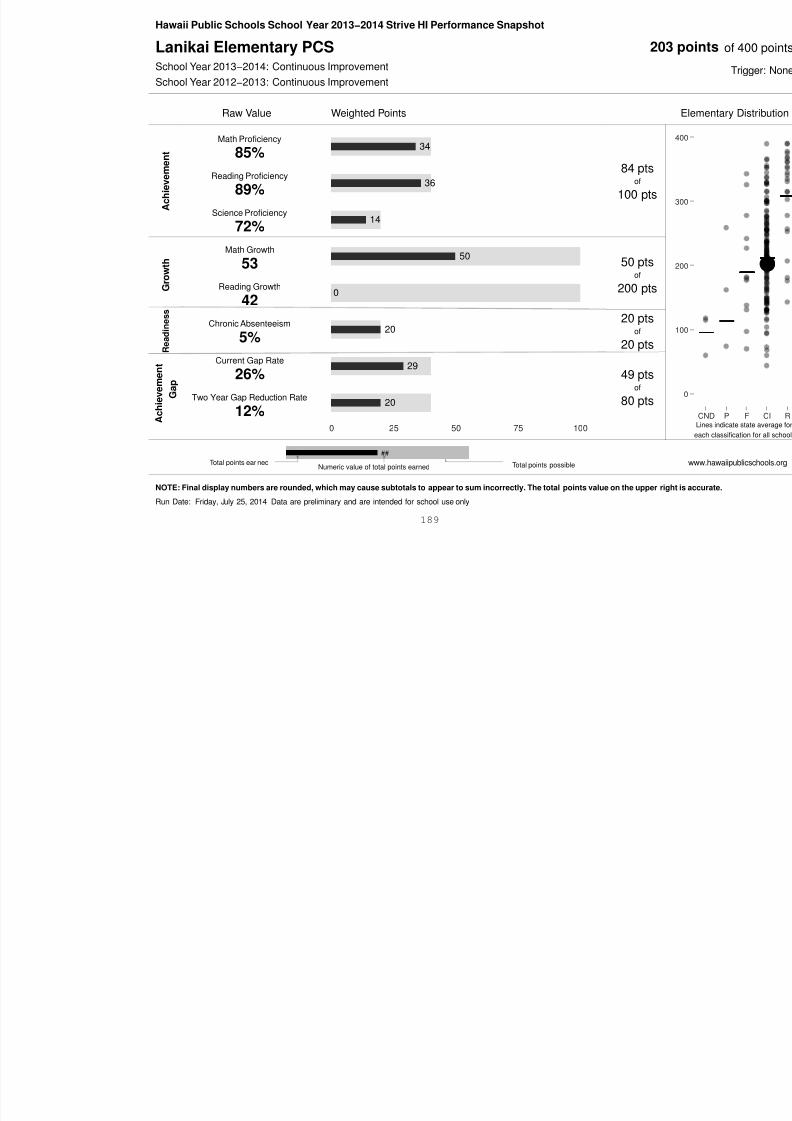
8/10/2019 Hawaii charter schools annual report
http://slidepdf.com/reader/full/hawaii-charter-schools-annual-report 192/268
R e a d
A c h i e v e m e n t
G a p
20
29
20
0 25 50 75 100
5%
26%
12%
Current Gap Rate
Two Year Gap Reduction Rate
of
20 pts
49 ptsof
80 pts
##
Numeric value of total points earned Total points possibleTotal points ear ned
NOTE: Final display numbers are rounded, which may cause subtotals to appear to sum incorrectly. The total points value on the upper right is accurate.
Run Date: Friday, July 25, 2014 Data are preliminary and are intended for school use only
189
Hawaii Public Schools School Year 2013-14 Strive HI School Performance Report
Laupahoehoe Community Public Charter School 158School Year 2013-14: FocusSchool Year 2012-13: Focus
Raw Value Weighted Points High Scho
A c h i e v e m e n t
Math Proficiency--%*
Reading Proficiency
--%*
Science Proficiency--%*
--*-- pts*
of100 pts
400 -
300 -
G r o w t h
Math Growth--*
Reading Growth--*
--*-- pts*
of60 pts
200 -
i n e s s
11 th Grade ACT--%*
Graduation Rate*
-- pts*f 100 -
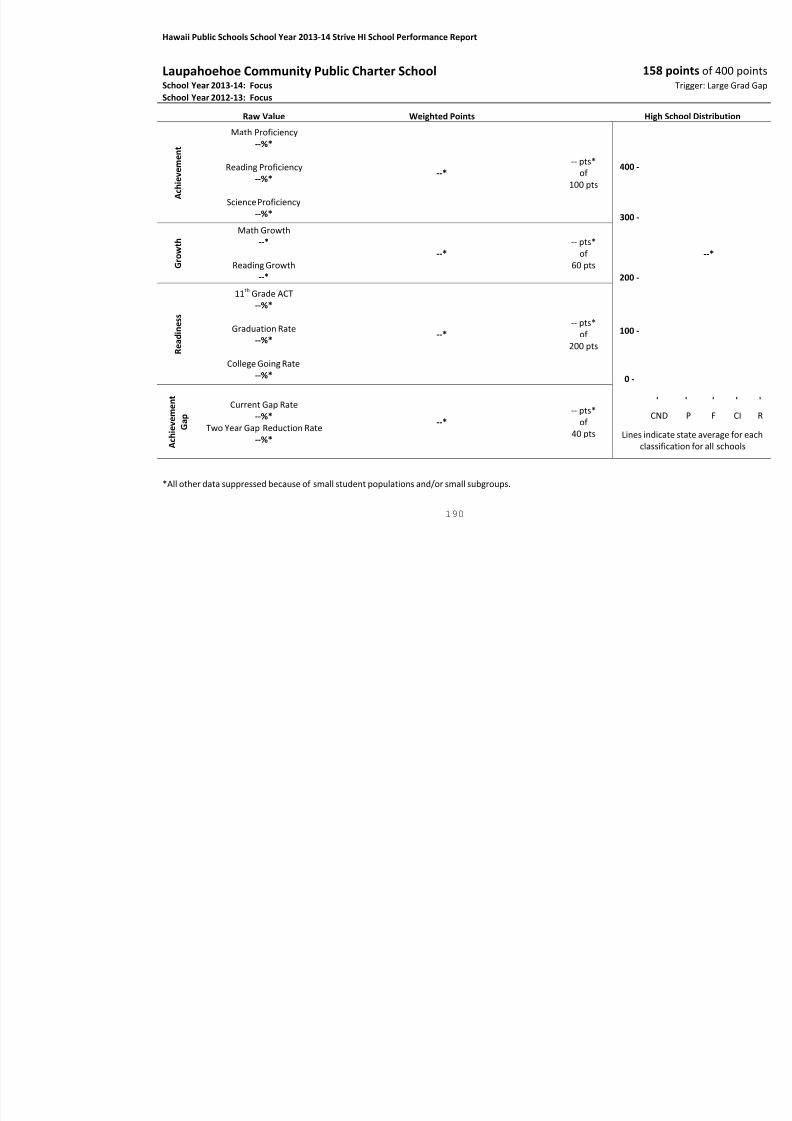
8/10/2019 Hawaii charter schools annual report
http://slidepdf.com/reader/full/hawaii-charter-schools-annual-report 193/268
*All other data suppressed because of small student populations and/or small subgroups.
R e a
d i
--%*
College Going Rate--%*
--* of200 pts
100 -
0 -
A c h i e v e m e n t
G a p
Current Gap Rate
--%* Two Year Gap Reduction Rate--%*
--*
-- pts*of
40 pts
-
CN
Lines indicaclassif
190
Hawaii Public Schools School Year 2013−2014 Strive HI Performance Snapshot
Myron B. Thompson Academy PCS 29School Year 2013−2014: Continuous ImprovementSchool Year 2012−2013: Continuous Improvement
Raw Value Weighted Points
A c h i e v e m e n t
G r o w t h
e a d i n e s s
28
35
14
9
15
57
88
69%
88%68%
43
54
63%88%
Math Proficiency
Reading Proficiency
Science Proficiency
Math Growth
Reading Growth
11th Grade ACT
Graduation Rate
77 ptsof
100 pts
24 ptsof
60 pts
150 ptsof
200 pts
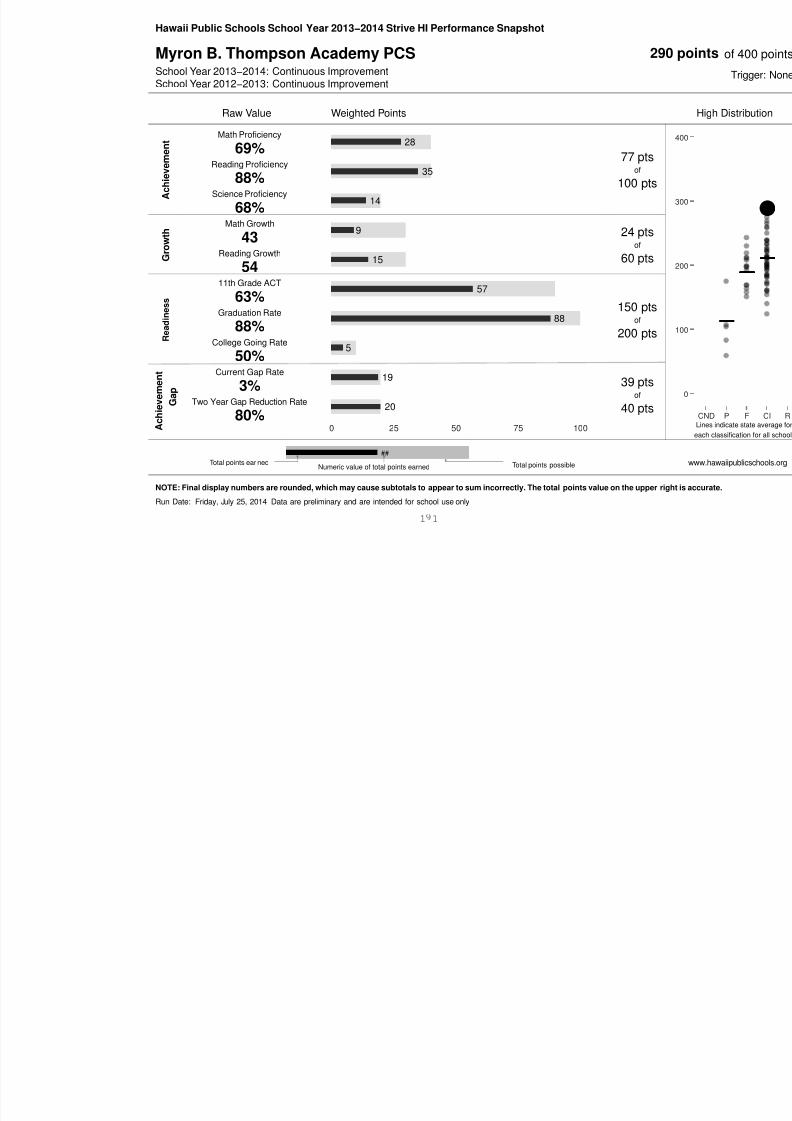
8/10/2019 Hawaii charter schools annual report
http://slidepdf.com/reader/full/hawaii-charter-schools-annual-report 194/268
Re
A c h i e v e m e n t
G a p
5
19
20
0 25 50 75 100
50%
3%
80%
College Going Rate
Current Gap Rate
Two Year Gap Reduction Rate
200 pts
39 ptsof
40 pts
##
Numeric value of total points earned Total points possibleTotal points ear ned
NOTE: Final display numbers are rounded, which may cause subtotals to appear to sum incorrectly. The total points value on the upper right is accurate.
Run Date: Friday, July 25, 2014 Data are preliminary and are intended for school use only
1 1
Hawaii Public Schools School Year 2013−2014 Strive HI Performance Snapshot
Na Wai Ola Public Charter School 14School Year 2013−2014: RecognitionSchool Year 2012−2013: Recognition
A c h i e v e
m e n t
G r o w t h
d i n e s s
29
29
11
0
0
0
72%
72%
56%
31
26
39%
Math Proficiency
Reading Proficiency
Science Proficiency
Math Growth
Reading Growth
Chronic Absenteeism
69 ptsof
100 pts
0 ptsof
200 pts
0 ptsof
69 ptsof
100 pts
0 ptsof
200 pts
0 ptsof
Raw Value Weighted PointsUnadjusted
Points
Adjusted forMissing
Indicators
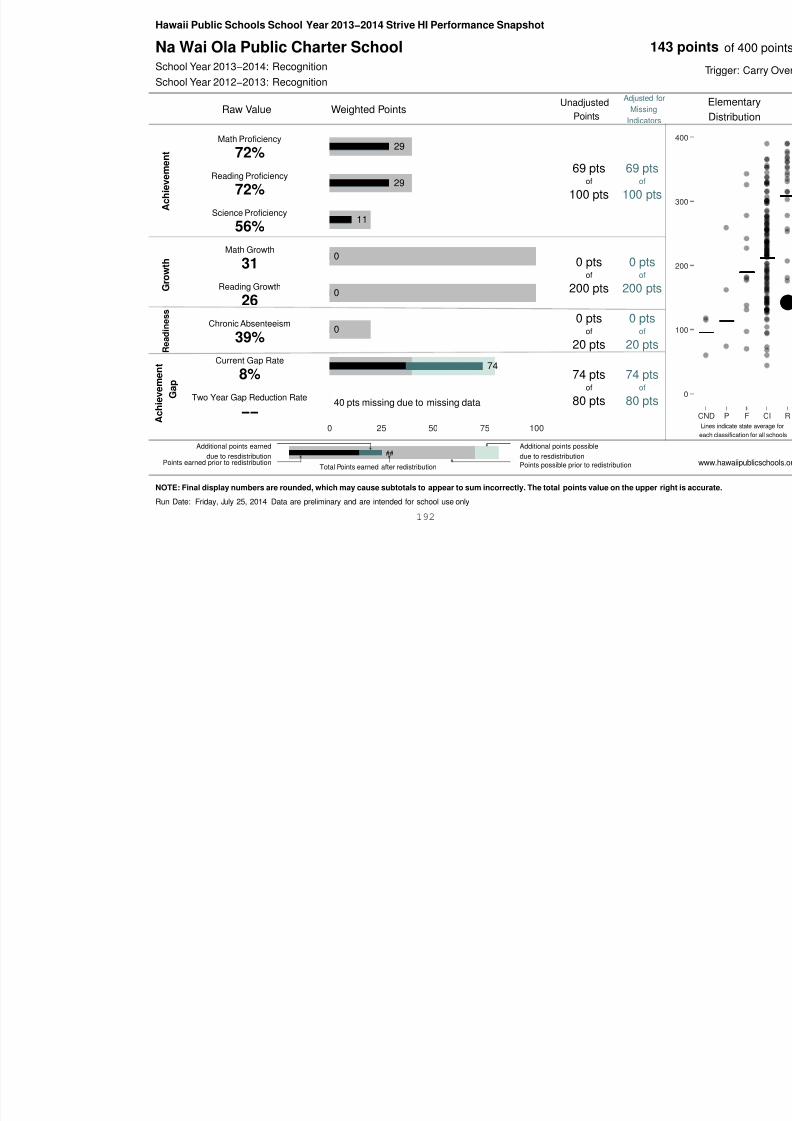
8/10/2019 Hawaii charter schools annual report
http://slidepdf.com/reader/full/hawaii-charter-schools-annual-report 195/268
R e a
A
c h i e v e m e n t
G a p
74
40 pts missing due to missing data
0 25 50 75 100
39%
8%
−−
Current Gap Rate
Two Year Gap Reduction Rate
20 pts
74 ptsof
80 pts
20 pts
74 ptsof
80 pts
##
Total Points earned after redistribution
Additional points possibledue to resdistributionPoints possible prior to redistributionPoints earned prior to redistribution
Additional points earneddue to resdistribution
NOTE: Final display numbers are rounded, which may cause subtotals to appear to sum incorrectly. The total points value on the upper right is accurate.
Run Date: Friday, July 25, 2014 Data are preliminary and are intended for school use only
192
Hawaii Public Schools School Year 2013−2014 Strive HI Performance Snapshot
School for Examining Essential Questions of Sustainability 11School Year 2013−2014: Classification Not DeterminedSchool Year 2012−2013:
A c h i e v e m e n t
G r o w t h
a d i n e s s
25
34
20 pts missing due to missing data
0
0
20 pts missing due to missing data
48%
65%
−−
25
13
Math Proficiency
Reading Proficiency
Science Proficiency
Math Growth
Reading Growth
Chronic Absenteeism
57 ptsof
100 pts
0 ptsof
200 pts
60 ptsof
105 pts
0 ptsof
211 pts
20 Weighted PointsR di t ib t d
Raw Value Weighted PointsUnadjusted
Points
Adjusted forMissing
Indicators
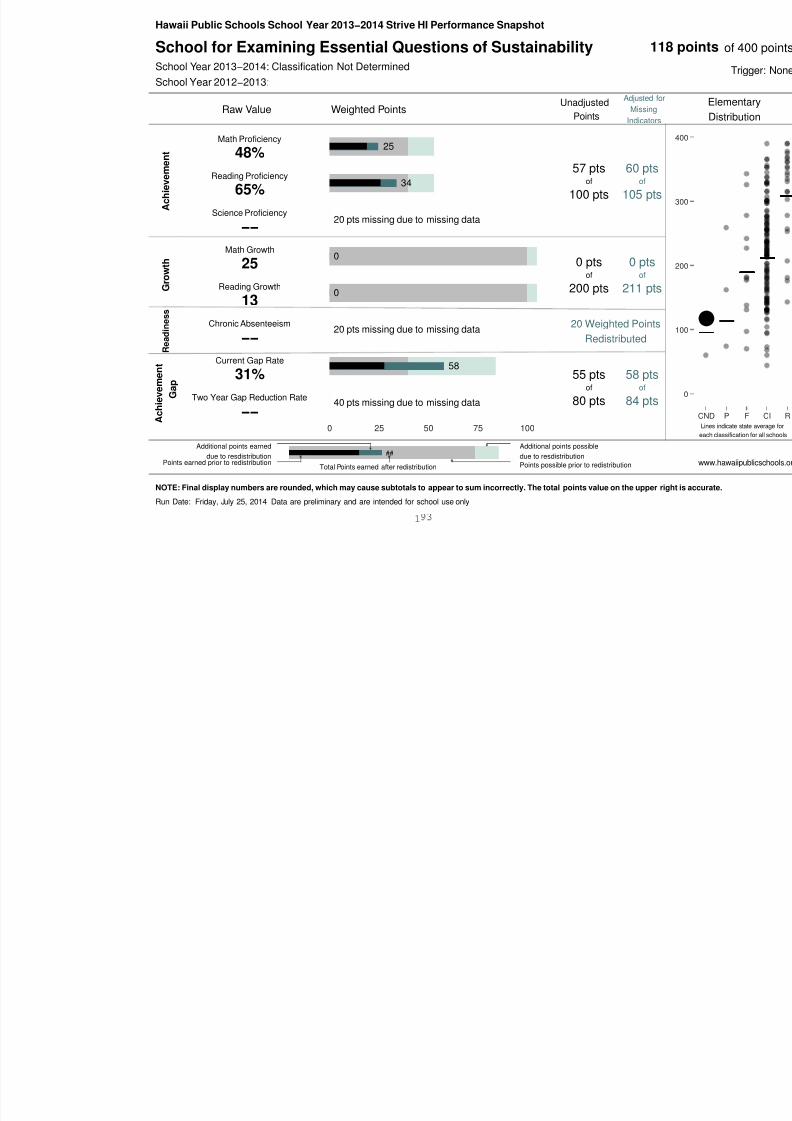
8/10/2019 Hawaii charter schools annual report
http://slidepdf.com/reader/full/hawaii-charter-schools-annual-report 196/268
R e a
A
c h i e v e m e n t
G a p
58
40 pts missing due to missing data
0 25 50 75 100
−−
31%
−−
Current Gap Rate
Two Year Gap Reduction Rate
55 ptsof
80 pts
Redistributed
58 ptsof
84 pts
##
Total Points earned after redistribution
Additional points possibledue to resdistributionPoints possible prior to redistributionPoints earned prior to redistribution
Additional points earneddue to resdistribution
NOTE: Final display numbers are rounded, which may cause subtotals to appear to sum incorrectly. The total points value on the upper right is accurate.
Run Date: Friday, July 25, 2014 Data are preliminary and are intended for school use only
1
Hawaii Public Schools School Year 2013−2014 Strive HI Performance Snapshot
University Laboratory School 26School Year 2013−2014: Continuous ImprovementSchool Year 2012−2013: Continuous Improvement
Raw Value Weighted Points
A c h i e v e m e n t
G r o w t h
R e a d i n e s s
19
34
6
0
0
62
100
49%
84%29%
33
42
69%100%
Math Proficiency
Reading Proficiency
Science Proficiency
Math Growth
Reading Growth
11th Grade ACT
Graduation Rate
59 ptsof
100 pts
0 ptsof
60 pts
170 ptsof
200 pts
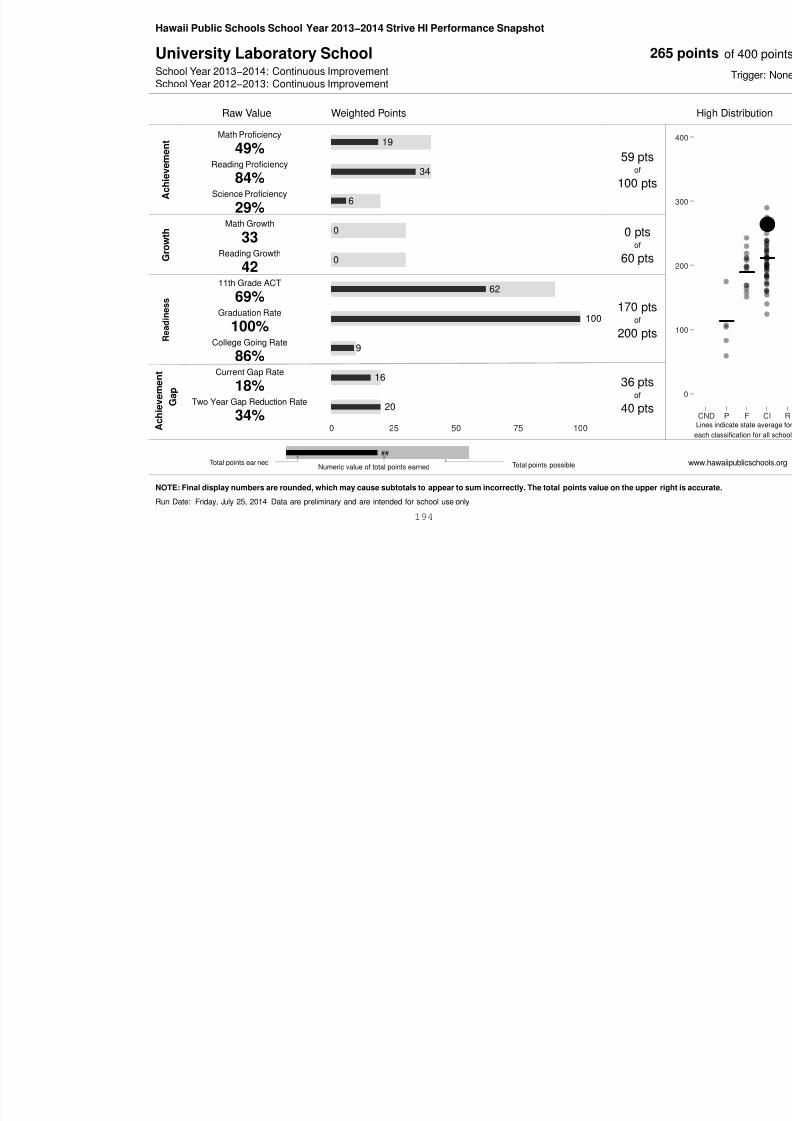
8/10/2019 Hawaii charter schools annual report
http://slidepdf.com/reader/full/hawaii-charter-schools-annual-report 197/268
R
A c h i e v e m e n t
G a p
9
16
20
0 25 50 75 100
86%
18%
34%
College Going Rate
Current Gap Rate
Two Year Gap Reduction Rate
p
36 ptsof
40 pts
##
Numeric value of total points earned Total points possibleTotal points ear ned
NOTE: Final display numbers are rounded, which may cause subtotals to appear to sum incorrectly. The total points value on the upper right is accurate.
Run Date: Friday, July 25, 2014 Data are preliminary and are intended for school use only
194
Hawaii Public Schools School Year 2013−2014 Strive HI Performance Snapshot
Volcano School of Arts and Sciences A Community PCS 10School Year 2013−2014: Continuous ImprovementSchool Year 2012−2013: Continuous Improvement
Raw Value Weighted Points
A c h i e v e m e n t
G r o w t h
a d i n e s s
19
25
11
0
0
28
48%
62%
54%
42
36
47%
Math Proficiency
Reading Proficiency
Science Proficiency
Math Growth
Reading Growth
8th Grade ACT
55 ptsof
100 pts
0 ptsof
180 pts
28 ptsof
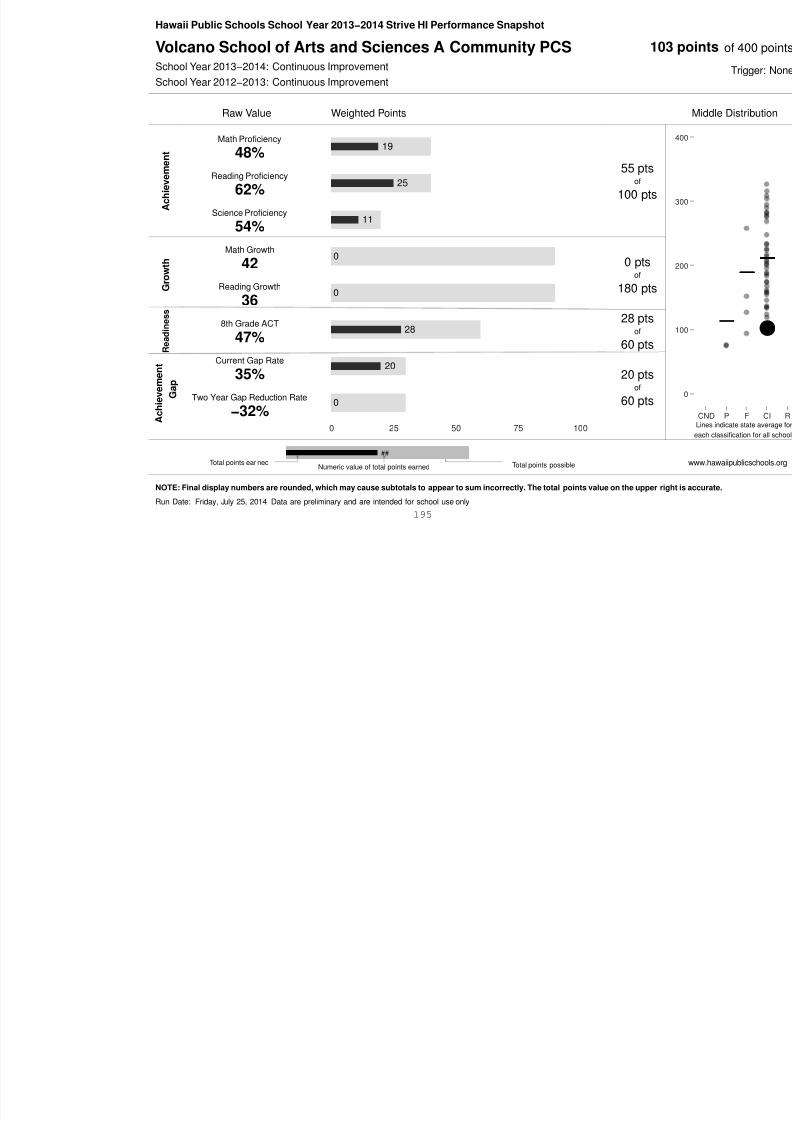
8/10/2019 Hawaii charter schools annual report
http://slidepdf.com/reader/full/hawaii-charter-schools-annual-report 198/268
R e
A
c h i e v e m e n t
G a p
20
0
0 25 50 75 100
47%
35%
−32%
Current Gap Rate
Two Year Gap Reduction Rate
60 pts
20 ptsof
60 pts
##
Numeric value of total points earned Total points possibleTotal points ear ned
NOTE: Final display numbers are rounded, which may cause subtotals to appear to sum incorrectly. The total points value on the upper right is accurate.
Run Date: Friday, July 25, 2014 Data are preliminary and are intended for school use only195
Hawaii Public Schools School Year 2013−2014 Strive HI Performance Snapshot
Voyager PCS 31School Year 2013−2014: Continuous ImprovementSchool Year 2012−2013: Continuous Improvement
Raw Value Weighted Points
A c h i e v e m e n t
G r o w t h
e a d i n e s s
27
32
8
90
90
28
68%
79%
41%
73
61
47%
Math Proficiency
Reading Proficiency
Science Proficiency
Math Growth
Reading Growth
8th Grade ACT
67 ptsof
100 pts
180 ptsof
180 pts
28 ptsof
60 t
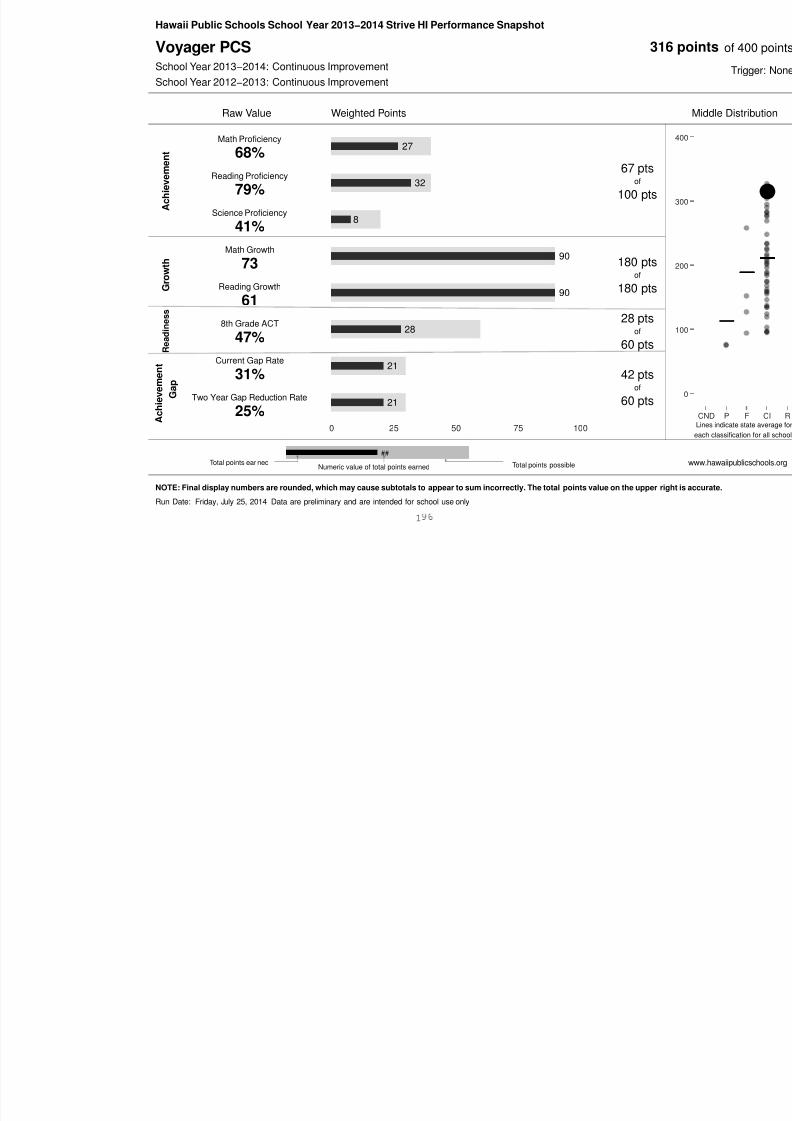
8/10/2019 Hawaii charter schools annual report
http://slidepdf.com/reader/full/hawaii-charter-schools-annual-report 199/268
R e
A
c h i e v e m e n t
G a p
21
21
0 25 50 75 100
47%
31%
25%
Current Gap Rate
Two Year Gap Reduction Rate
60 pts
42 ptsof
60 pts
##
Numeric value of total points earned Total points possibleTotal points ear ned
NOTE: Final display numbers are rounded, which may cause subtotals to appear to sum incorrectly. The total points value on the upper right is accurate.
Run Date: Friday, July 25, 2014 Data are preliminary and are intended for school use only
1
Hawaii Public Schools School Year 2013−2014 Strive HI School Performance Report
Wai`alae Elementary PCS 28School Year 2013−2014: Continuous ImprovementSchool Year 2012−2013: Continuous Improvement
Raw Value Weighted Points
A c h i e v e m e n t
G r o w t h
e a d i n e s s
31
34
7
50
70
20
77%
84%
37%
50
58
7%
Math Proficiency
Reading Proficiency
Science Proficiency
Math Growth
Reading Growth
Chronic Absenteeism
72 ptsof
100 pts
120 ptsof
200 pts
20 ptsof
20 pts

8/10/2019 Hawaii charter schools annual report
http://slidepdf.com/reader/full/hawaii-charter-schools-annual-report 200/268
R e
A
c h i e v e m e n t
G a p
31
40
0 25 50 75 100
22%
40%
Current Gap Rate
Two Year Gap Reduction Rate
20 pts
71 ptsof
80 pts
##
Numeric value of total points earned Total points possibleTotal points ear ned
NOTE: Final display numbers are rounded, which may cause subtotals to appear to sum incorrectly. The total points value on the upper right is accurate.
Run Date: Thursday, September 11, 2014 − Final Run
197
Hawaii Public Schools School Year 2013−2014 Strive HI Performance Snapshot
Waimea Middle PCCS 15School Year 2013−2014: Continuous ImprovementSchool Year 2012−2013: Continuous Improvement
Raw Value Weighted Points
A c h i e v e m e n t
G r o w t h
e a d i n e s s
20
27
5
27
27
24
50%
67%
26%
46
45
40%
Math Proficiency
Reading Proficiency
Science Proficiency
Math Growth
Reading Growth
8th Grade ACT
52 ptsof
100 pts
54 ptsof
180 pts
24 ptsof
60 pts
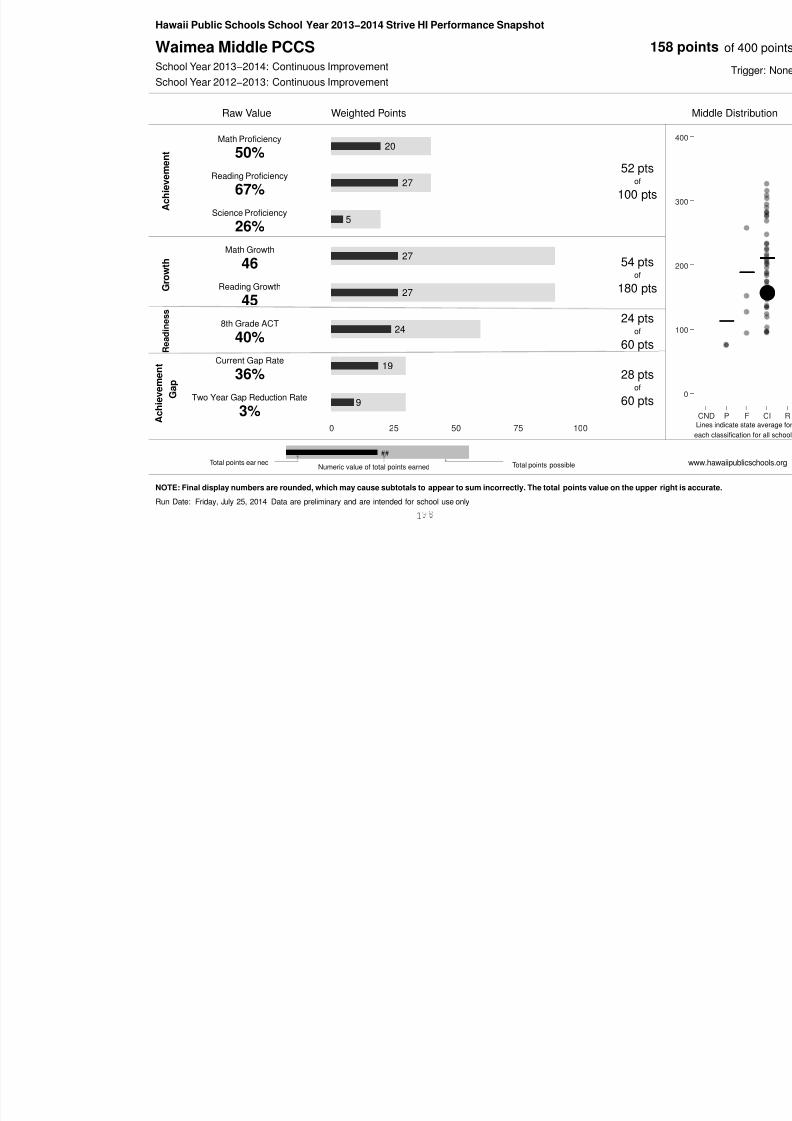
8/10/2019 Hawaii charter schools annual report
http://slidepdf.com/reader/full/hawaii-charter-schools-annual-report 201/268
R
A
c h i e v e m e n t
G a p
19
9
0 25 50 75 100
36%
3%
Current Gap Rate
Two Year Gap Reduction Rate
60 pts
28 ptsof
60 pts
##
Numeric value of total points earned Total points possibleTotal points ear ned
NOTE: Final display numbers are rounded, which may cause subtotals to appear to sum incorrectly. The total points value on the upper right is accurate.
Run Date: Friday, July 25, 2014 Data are preliminary and are intended for school use only
1
Hawaii Public Schools School Year 2013−2014 Strive HI Performance Snapshot
West Hawaii Explorations Academy PCS 19School Year 2013−2014: FocusSchool Year 2012−2013: Focus
Raw Value Weighted Points
A c h i e v e m e n t
G r o w t h
R e a d i n e s s
22
33
5
0
0
40
70
4
54%
83%26%
34
39
45%70%
Math Proficiency
Reading Proficiency
Science Proficiency
Math Growth
Reading Growth
11th Grade ACT
Graduation Rate
College Going Rate
60 ptsof
100 pts
0 ptsof
60 pts
114 ptsof
200 pts
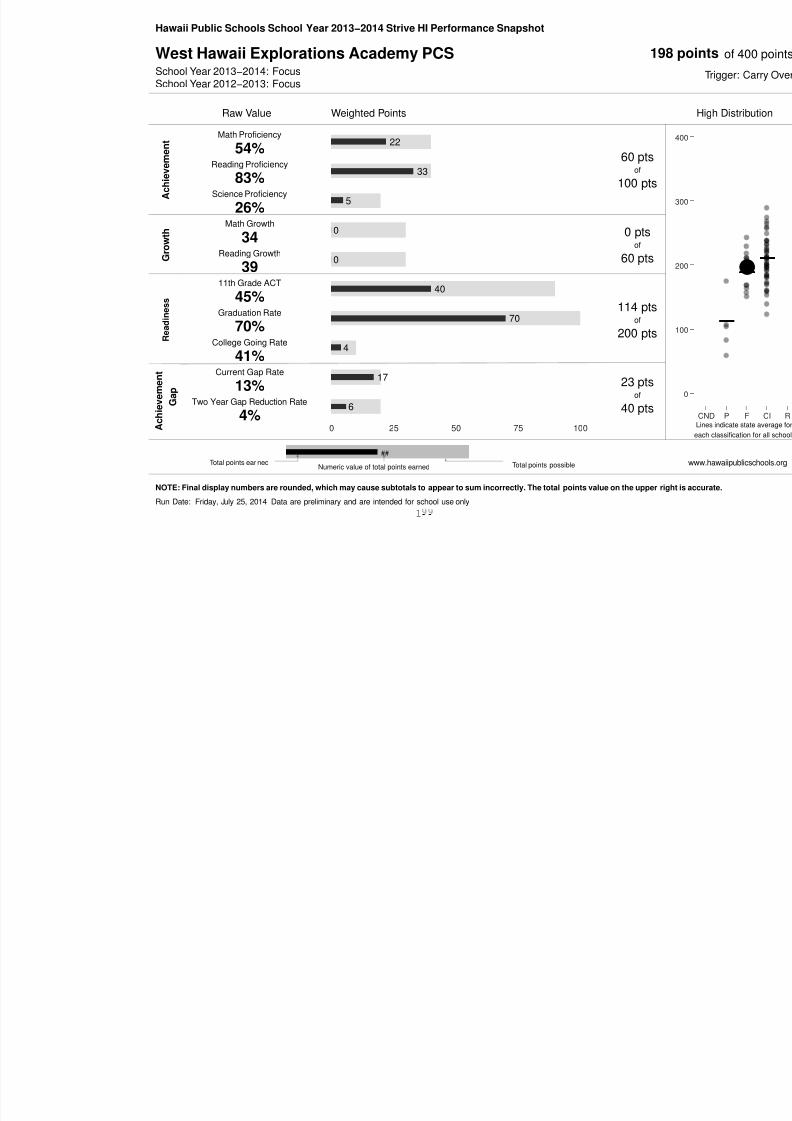
8/10/2019 Hawaii charter schools annual report
http://slidepdf.com/reader/full/hawaii-charter-schools-annual-report 202/268
A c h i e v e m e n t
G a p
4
17
6
0 25 50 75 100
41%
13%
4%
Current Gap Rate
Two Year Gap Reduction Rate
23 ptsof
40 pts
##
Numeric value of total points earned Total points possibleTotal points ear ned
NOTE: Final display numbers are rounded, which may cause subtotals to appear to sum incorrectly. The total points value on the upper right is accurate.
Run Date: Friday, July 25, 2014 Data are preliminary and are intended for school use only1
31BAppendix C: Comparison of Statewide Averages and Charter School-Wide Averages
8/10/2019 Hawaii charter schools annual report
http://slidepdf.com/reader/full/hawaii-charter-schools-annual-report 203/268
Comparison of Statewide Averages and Charter School-Wide Averages
Statewide Charter SchooACHIEVEMENTMath Proficiency (%) 59 46
Reading Proficiency (%) 70 64Science Proficiency (%) 41 30SUBGROUP ACHIEVEMENT:
FRLMath FRL Proficiency (%) 74 44Reading FRL Proficiency (%) 51 62Science FRL Proficiency (%) 30 29
ELLMath ELL Proficiency (%) 41 18Reading ELL Proficiency (%) 43 20Science ELL Proficiency (%) 20 3
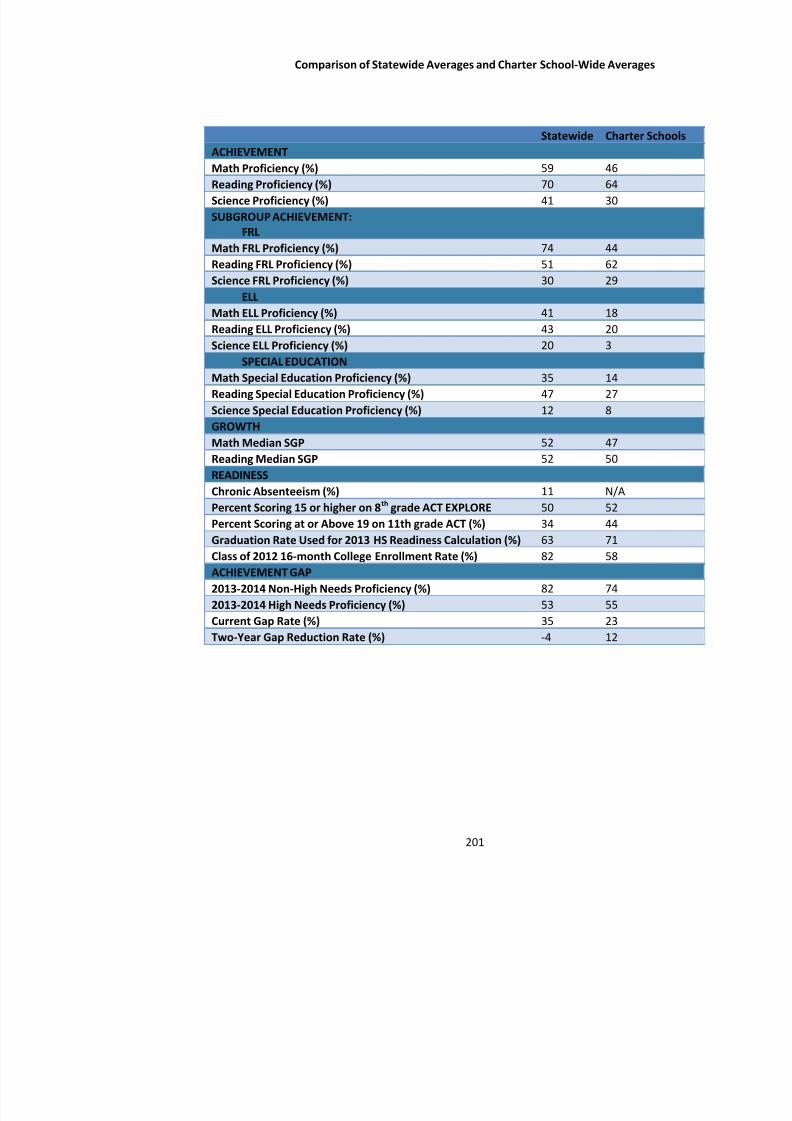
8/10/2019 Hawaii charter schools annual report
http://slidepdf.com/reader/full/hawaii-charter-schools-annual-report 204/268
y ( )SPECIAL EDUCATION
Math Special Education Proficiency (%) 35 14Reading Special Education Proficiency (%) 47 27Science Special Education Proficiency (%) 12 8
GROWTHMath Median SGP 52 47Reading Median SGP 52 50READINESSChronic Absenteeism (%) 11 N/APercent Scoring 15 or higher on 8 th grade ACT EXPLORE 50 52Percent Scoring at or Above 19 on 11th grade ACT (%) 34 44
Graduation Rate Used for 2013 HS Readiness Calculation (%) 63 71Class of 2012 16-month College Enrollment Rate (%) 82 58ACHIEVEMENT GAP2013-2014 Non-High Needs Proficiency (%) 82 742013-2014 High Needs Proficiency (%) 53 55Current Gap Rate (%) 35 23Two-Year Gap Reduction Rate (%) -4 12
32B31BAppendix D: Financial Performance Framework for 2014-17 Charter Contract
8/10/2019 Hawaii charter schools annual report
http://slidepdf.com/reader/full/hawaii-charter-schools-annual-report 205/268
FINANCIAL PERFORMANCE FRAMEWORK
The Financial Performance Framework is an accountability tool that provides the Commission with data necassess the financial health and viability of charter schools in its portfolio on an ongoing basis and for the puan annual review. The framework summarizes a charter school ’s current financial health while taking school ’s financial trends over a period of three years. The measures are designed to be complementary. No measure gives a full picture of the financial situation of a school. Taken together, however, the measures prov
comprehensive assessment of the school ’s financial health and viability based on a school ’s historicfinancial situation, and future viability.
Within each annual reporting period, the Financial Performance Framework provides for an initial review and a assessment that together produce two ratings: a Preliminary Rating and a Final Rating. The Preliminary Rating whether the school has met the standard for financial viability based on the Commission’s initial revieinformation, which, for an annual review, will be drawn from the school’s audited financials. The Final Commission’s revised assessment based on more curren t financial information and/or more detailed examschool’s financial position, as needed.
Preliminary Ratings
8/10/2019 Hawaii charter schools annual report
http://slidepdf.com/reader/full/hawaii-charter-schools-annual-report 206/268
The Preliminary Rating is either Meets Target or Pending Further Analysis . The Meets rating means thatcontained in the financials under review indicates that the school is meeting or exceeding the target for the standquestion. The Pending rating means that the school is not meeting the target based on the financials under revi
that misses the target on any one measure may or may not be at financial risk. It may be in immedifinancially trending negatively, both or neither. There are two types of additional information that the Commneed before assigning a Final Rating. The first is more current information. When conducting a year-end ea school’s financials, the Commission will be reviewing audit numbers that are typically at least foutime the audit has been finalized. The Commission’s further an alysis will often include review of curfinancials. The second is more detailed information about the school’s financial position to assess ththe failure to meet the target. For example, a school might make a strategic long-term financial decision th
it missing a target in the near term. The Commission’s follow -up will consider the more current and minformation to determine whether the Preliminary Rating is still applicable and the degree to which it is, inindication of financial risk or distress.
Final Ratings
The Final Rating is Meets Target , Does Not Meet Target, or Falls Far Below Target .
Meets TargetAMeets rating i ndicates sound financial viability based on the overall financial record. Either the school h
Not Meet rating means that even based on more current financial information, the school is not currently target or concerns previously identified, although not currently manifested, have been of a depth or duratiowarrants continued attention.
Falls Far Below Target
A Falls Far Below rating indicates that upon further review following a preliminary Pending rating,identifies significant financial risk and has concerns about financial viability such that heightened monitoriintervention are necessary. The school’s rating will be based on both the most recent audited financicurrent unaudited financials. The Commission will also consider any relevant context for the schoolthat informs the causes of the school’s substantial shortcomings for the area in question. Appropriatand/intervention will be determined, in part, by how the rating on the standard in question fits withoverall performance on the framework.
NEAR TERM INDICATORS
1.a. Current Ratio (Working Capital Ratio): Current Assets divided by Current Liabilities
P li i R ti g Fi l R ti g (F ll i g Additi l A l
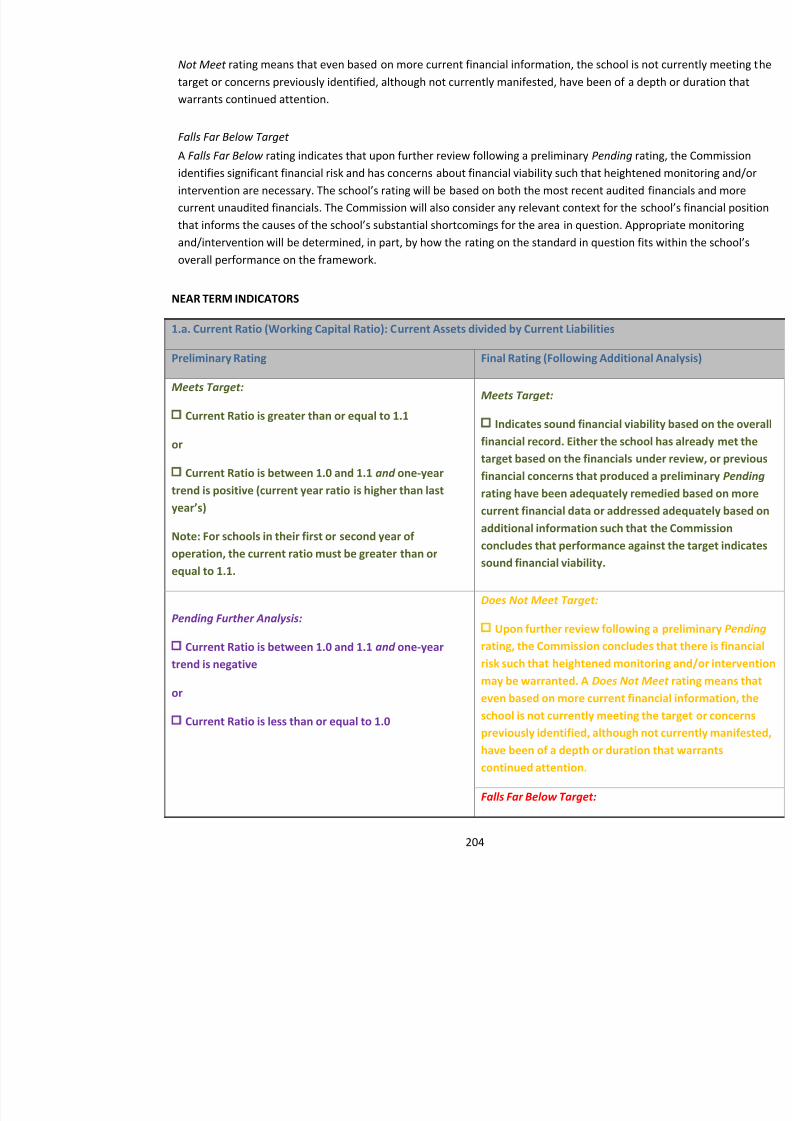
8/10/2019 Hawaii charter schools annual report
http://slidepdf.com/reader/full/hawaii-charter-schools-annual-report 207/268
Preliminary Rating Final Rating (Following Additional Anal
Meets Target:
Current Ratio is greater than or equal to 1.1
or
Current Ratio is between 1.0 and 1.1 and one-yeartrend is positive (current year ratio is higher than lastyear’s)
Note: For schools in their first or second year ofoperation, the current ratio must be greater than orequal to 1.1.
Meets Target:
Indicates sound financial viability basfinancial record. Either the school has alrtarget based on the financials under reviefinancial concerns that produced a prelimrating have been adequately remedied bacurrent financial data or addressed adequadditional information such that the Com
concludes that performance against the tasound financial viability.
Pending Further Analysis:
Current Ratio is between 1.0 and 1.1 and one-year
trend is negative
Does Not Meet Target:
Upon further review following a prelirating, the Commission concludes that th
risk such that heightened monitoring andmay be warranted. A Does Not Meet
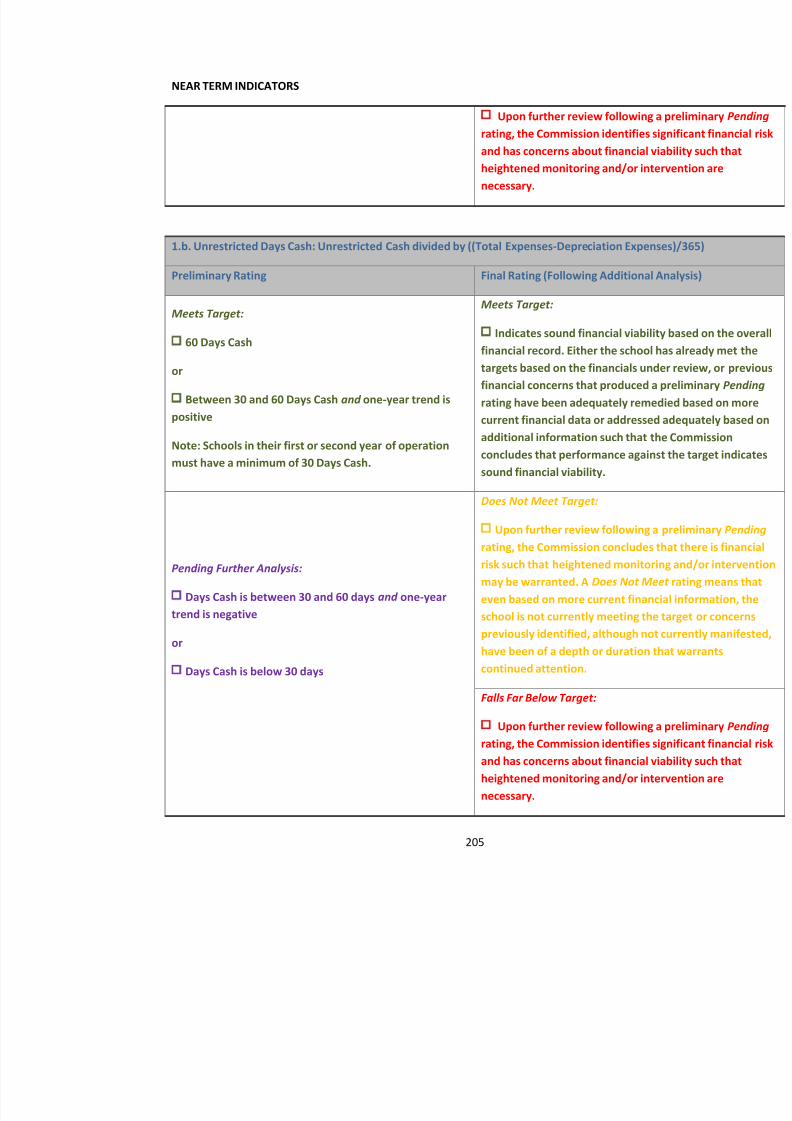
8/10/2019 Hawaii charter schools annual report
http://slidepdf.com/reader/full/hawaii-charter-schools-annual-report 208/268
1.c. Enrollment Variance: Actual Enrollment divided by Enrollment Projection in Charter School Board-ApproBudget
Preliminary Rating Final Rating (Following Additional Analys
Meets Target:
Enrollment Variance equals or exceeds 95% in themost recent year
Meets Target:
Indicates sound financial viability bas
financial record. Either the school has alrtarget based on the financials under reviefinancial concerns that produced a prelimrating have been adequately remedied bacurrent financial data or addressed adequadditional information such that the Comconcludes that performance against the tasound financial viability.
Does Not Meet Target:
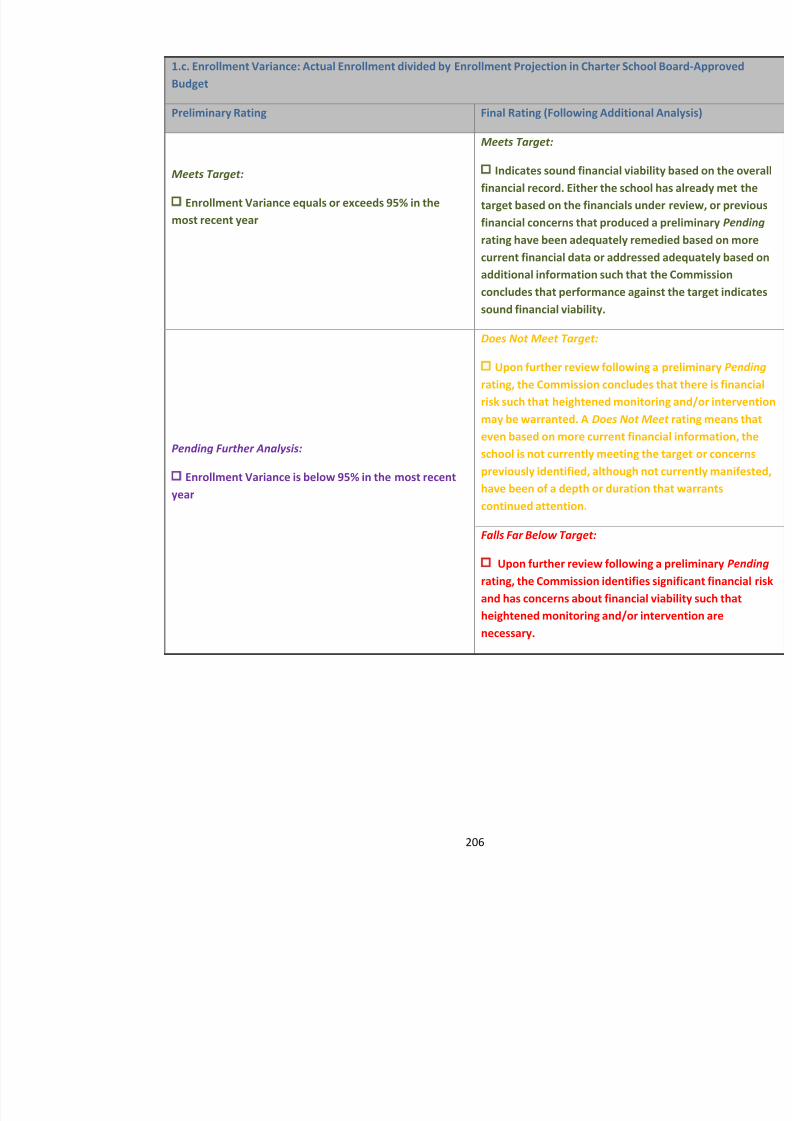
8/10/2019 Hawaii charter schools annual report
http://slidepdf.com/reader/full/hawaii-charter-schools-annual-report 209/268
Pending Further Analysis:
Enrollment Variance is below 95% in the most recentyear
Upon further review following a prelirating, the Commission concludes that thrisk such that heightened monitoring andmay be warranted. A Does Not Meet even based on more current financial infoschool is not currently meeting the targetpreviously identified, although not currenhave been of a depth or duration that warcontinued attention.
Falls Far Below Target:
Upon further review following a prelrating, the Commission identifies significand has concerns about financial viabilityheightened monitoring and/or interventionecessary.
2. SUSTAINABILITY INDICATORS
2.a. Total Margin: Net Income divided by Total Revenue
Aggregated Total Margin: Total 3 Year Net Income divided by Total 3 Year Revenues
Preliminary Rating Final Rating (Following Additional Anal
Meets Target:
Aggregated Three-Year Total Margin is positive and themost recent year Total Margin is positive
or
Aggregated Three-Year Total Margin is greater than -1.5%, the trend is positive for the last two years, and themost recent year Total Margin is positive
Meets Target:
Indicates sound financial viability basfinancial record. Either the school has alrtarget based on the financials under reviefinancial concerns that produced a prelimrating have been adequately remedied bacurrent financial data or addressed adequadditional information such that the Comconcludes that performance against the ta
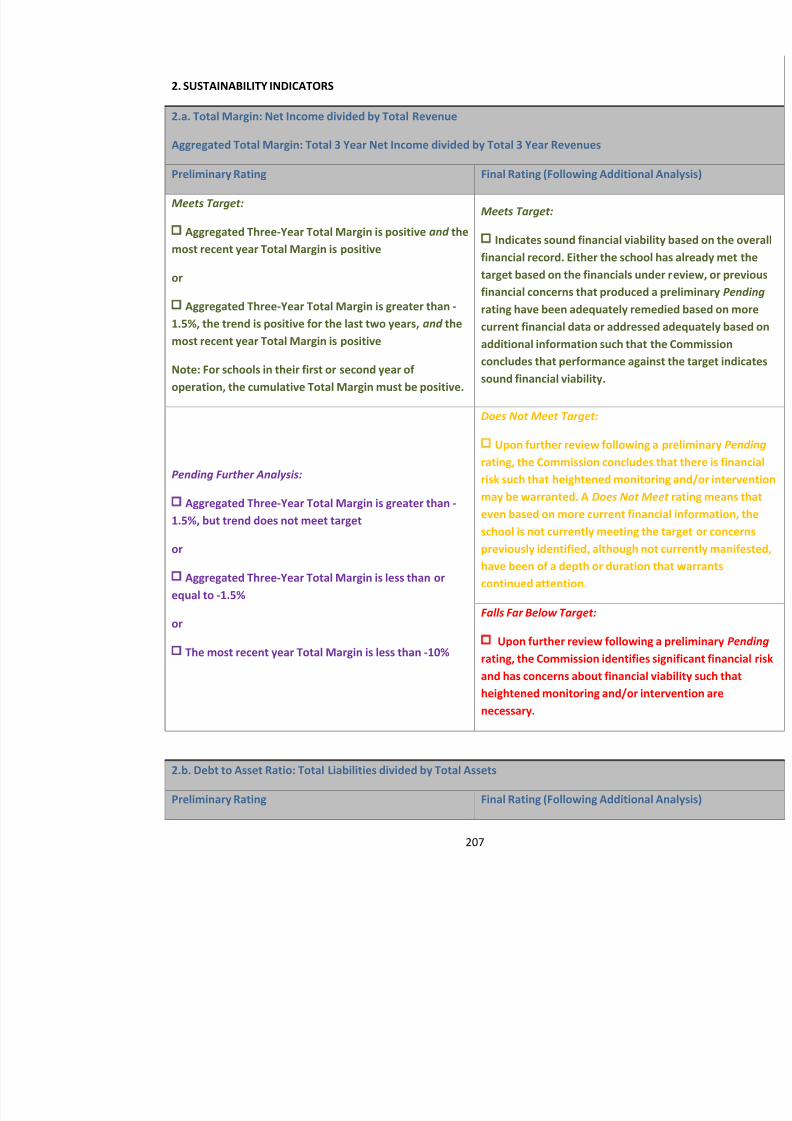
8/10/2019 Hawaii charter schools annual report
http://slidepdf.com/reader/full/hawaii-charter-schools-annual-report 210/268
Note: For schools in their first or second year ofoperation, the cumulative Total Margin must be positive.
concludes that performance against the tasound financial viability.
Pending Further Analysis:
Aggregated Three-Year Total Margin is greater than -1.5%, but trend does not meet target
or
Aggregated Three-Year Total Margin is less than orequal to -1.5%
or
The most recent year Total Margin is less than -10%
Does Not Meet Target:
Upon further review following a prelirating, the Commission concludes that thrisk such that heightened monitoring andmay be warranted. A Does Not Meet even based on more current financial infoschool is not currently meeting the target
previously identified, although not currenhave been of a depth or duration that warcontinued attention.
Falls Far Below Target:
Upon further review following a prelrating, the Commission identifies significand has concerns about financial viability
Meets Target:
Debt to Asset Ratio is less than 0.50
Meets Target:
Indicates sound financial viability basfinancial record. Either the school has alrtarget based on the financials under reviefinancial concerns that produced a prelimrating have been adequately remedied ba
current financial data or addressed adequadditional information such that the Comconcludes that performance against the tasound financial viability.
Does Not Meet Target:
Upon further review following a preli
rating, the Commission concludes that thrisk such that heightened monitoring andmay be warranted. A Does Not Meet even based on more current financial info
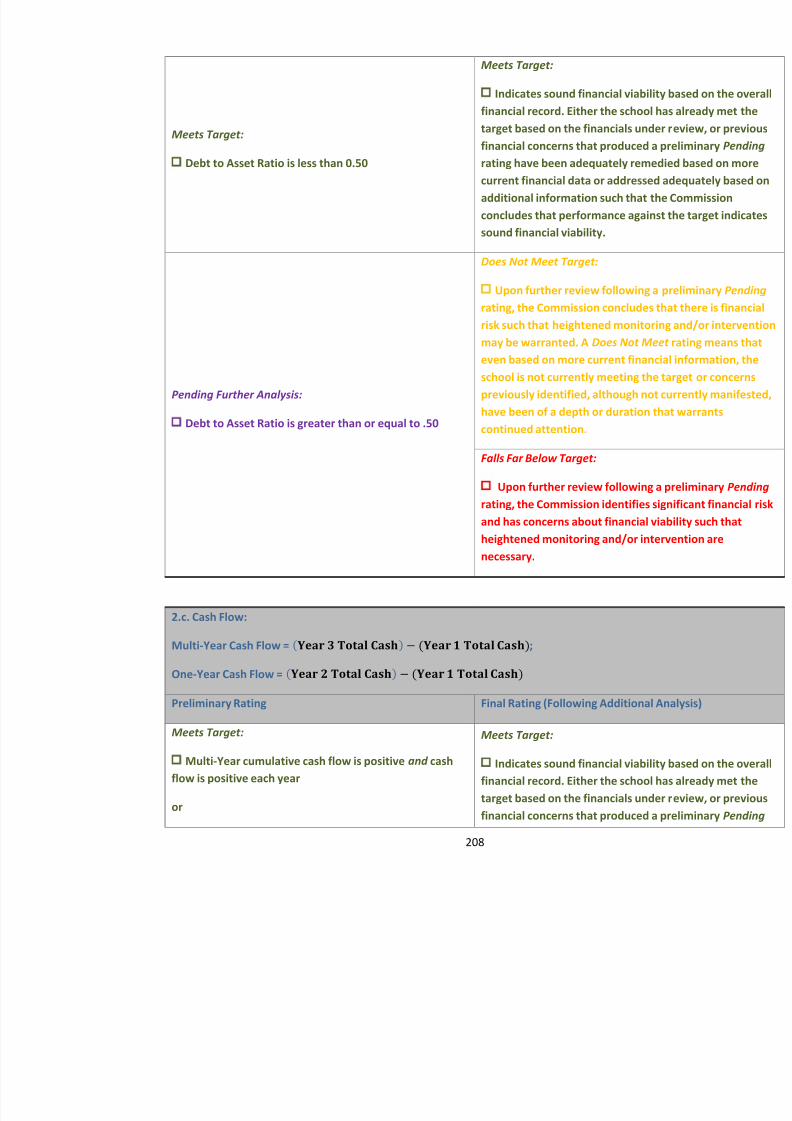
8/10/2019 Hawaii charter schools annual report
http://slidepdf.com/reader/full/hawaii-charter-schools-annual-report 211/268
Pending Further Analysis:
Debt to Asset Ratio is greater than or equal to .50
even based on more current financial infoschool is not currently meeting the targetpreviously identified, although not currenhave been of a depth or duration that war
continued attention.
Falls Far Below Target:
Upon further review following a prelrating, the Commission identifies significand has concerns about financial viabilityheightened monitoring and/or interventionecessary.
2.c. Cash Flow:
Multi-Year Cash Flow = ( ) − ( );
One-Year Cash Flow = ( ) − ( )
Multi-year and most recent year cash flows are
positive
Note: Schools in their first or second year of operationmust have positive cash flow.
rating have been adequately remedied bacurrent financial data or addressed adequadditional information such that the Comconcludes that performance against the tasound financial viability.
Pending Further Analysis:
Multi-Year cumulative cash flow is positive, but trenddoes not meet target
or
Does Not Meet Target:
Upon further review following a prelirating, the Commission concludes that thrisk such that heightened monitoring andmay be warranted. A Does Not Meet even based on more current financial info
school is not currently meeting the targetpreviously identified, although not currenhave been of a depth or duration that warcontinued attention.
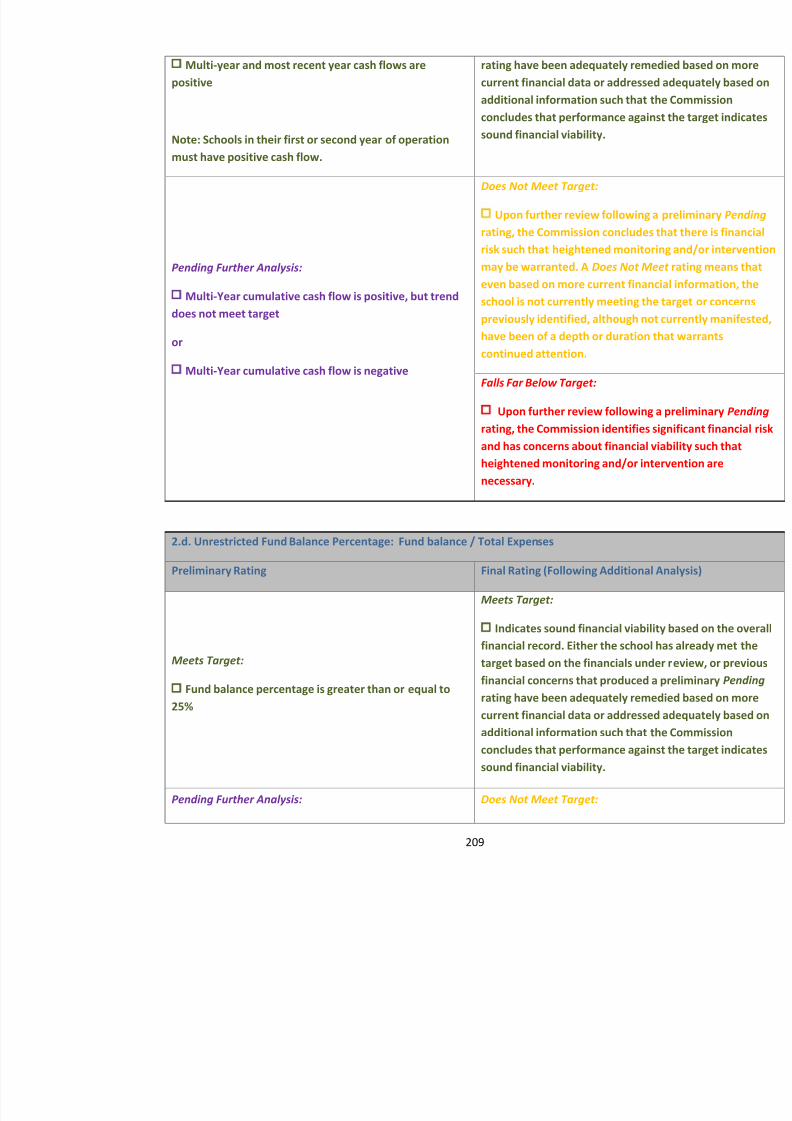
8/10/2019 Hawaii charter schools annual report
http://slidepdf.com/reader/full/hawaii-charter-schools-annual-report 212/268
Multi-Year cumulative cash flow is negative Falls Far Below Target:
Upon further review following a prel
rating, the Commission identifies significand has concerns about financial viabilityheightened monitoring and/or interventionecessary.
2.d. Unrestricted Fund Balance Percentage: Fund balance / Total Expenses
Preliminary Rating Final Rating (Following Additional Anal
Meets Target:
F d b l t i t th l t
Meets Target:
Indicates sound financial viability basfinancial record. Either the school has alr
target based on the financials under reviefinancial concerns that produced a prelim
2.e. Change in Total Fund Balance:
M lti Ye r ( ) ( )
Fund balance percentage is less than 25% Upon further review following a prelirating, the Commission concludes that thrisk such that heightened monitoring andmay be warranted. A Does Not Meet even based on more current financial infoschool is not currently meeting the targetpreviously identified, although not curren
have been of a depth or duration that warcontinued attention.
Falls Far Below Target:
Upon further analysis, the schoolcomponent signals a significant financial r
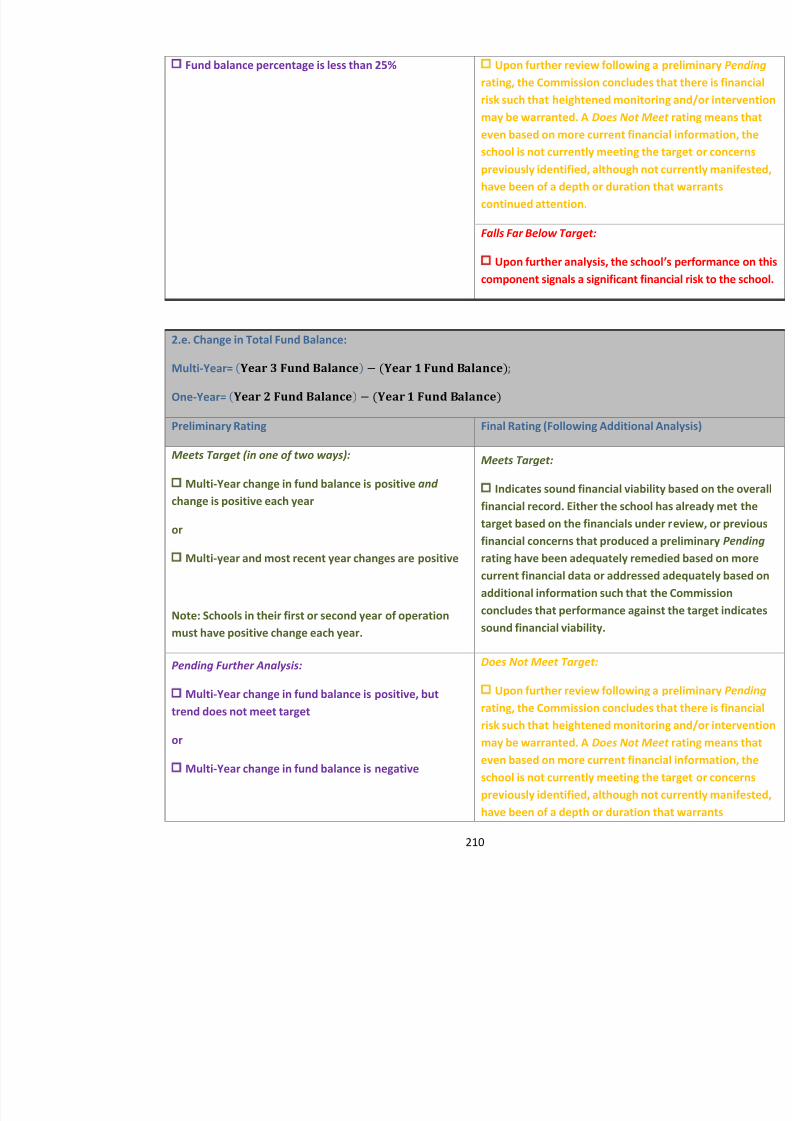
8/10/2019 Hawaii charter schools annual report
http://slidepdf.com/reader/full/hawaii-charter-schools-annual-report 213/268
Multi-Year= ( ) − ( ) ;
One-Year= ( ) − ( )
Preliminary Rating Final Rating (Following Additional Anal
Meets Target (in one of two ways):
Multi-Year change in fund balance is positive and change is positive each year
or
Multi-year and most recent year changes are positive
Note: Schools in their first or second year of operationmust have positive change each year.
Meets Target:
Indicates sound financial viability basfinancial record. Either the school has alrtarget based on the financials under reviefinancial concerns that produced a prelimrating have been adequately remedied bacurrent financial data or addressed adequadditional information such that the Comconcludes that performance against the tasound financial viability.
Pending Further Analysis:Does Not Meet Target:
U f h i f ll i li
continued attention.
Falls Far Below Target:
Upon further review following a prelrating, the Commission identifies signific
and has concerns about financial viabilityheightened monitoring and/or interventionecessary.
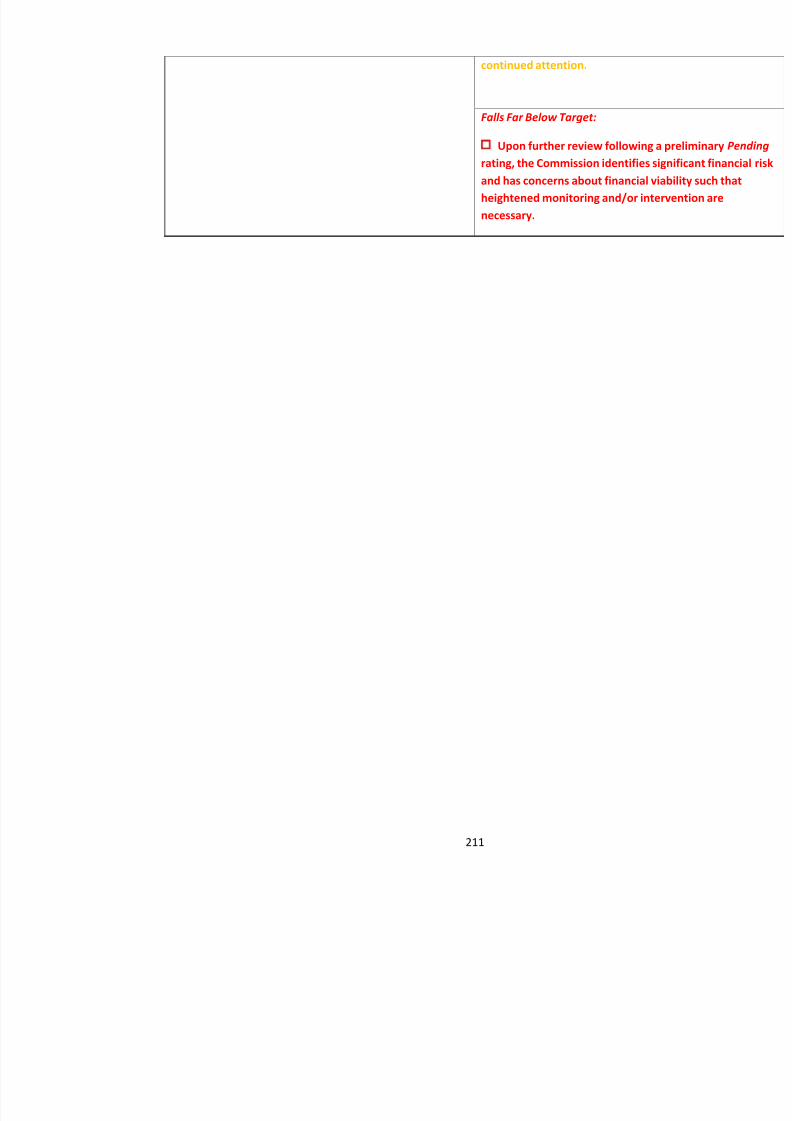
8/10/2019 Hawaii charter schools annual report
http://slidepdf.com/reader/full/hawaii-charter-schools-annual-report 214/268
33BAppendix E: Organizational Performance Framework for 2014-17 Charter Contract
8/10/2019 Hawaii charter schools annual report
http://slidepdf.com/reader/full/hawaii-charter-schools-annual-report 215/268
ORGANIZATIONAL PERFORMANCE FRAMEWORK
The purpose of the Organizational Performance Framework is to communicate to the charter school and pubcompliance-related standards, which the charter school must meet. The Organizational Framework includesstandards that the charter school is already required to meet through state and federal law, rules or the chartecontract.
For each measure a school receives one of three ratings. For the purposes of defining organizational pe
accountability, “material” means w hether the information would be relevant and significant to decisions whether to renew, non-renew, or revoke a charter contract.
NACSA Principles & Standards (2012) states that,
“A Quality Authorizer implements an accountability system that effectively streamlines federal,state, and local…compliance requirements while protecting schools’ legally entitled autonomy andminimizing schools’ administrative and reporting burdens” (p. 16).
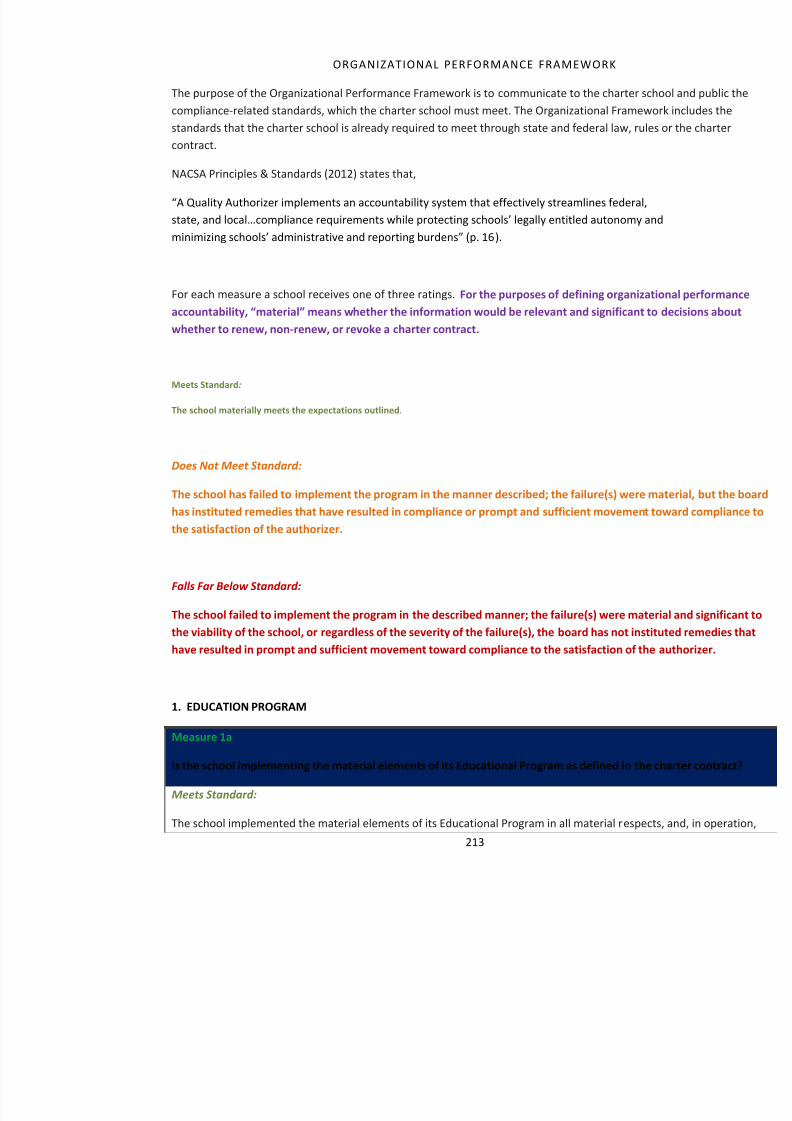
8/10/2019 Hawaii charter schools annual report
http://slidepdf.com/reader/full/hawaii-charter-schools-annual-report 216/268
Meets Standard :
The school materially meets the expectations outlined.
Does Not Meet Standard:
The school has failed to implement the program in the manner described; the failure(s) were material, but the bhas instituted remedies that have resulted in compliance or prompt and sufficient movement toward compliancthe satisfaction of the authorizer.
Falls Far Below Standard:
The school failed to implement the program in the described manner; the failure(s) were material and significathe viability of the school, or regardless of the severity of the failure(s), the board has not instituted remedies thhave resulted in prompt and sufficient movement toward compliance to the satisfaction of the authorizer.
the education program reflects the essential terms as defined in the charter contract, or the school has obtainapproval for a modification to the essential terms.
Measure 1b
Is the school complying with applicable education requirements?
Meets Standard:
The school materially complies with applicable laws, rules, regulations and provisions of the charter contraceducation requirements, including but not limited to:
Academic standards, including Common Core
Graduation requirements
State assessment and student testing
Implementation of mandated programming as a result of state or federal funding, including Title I and Title
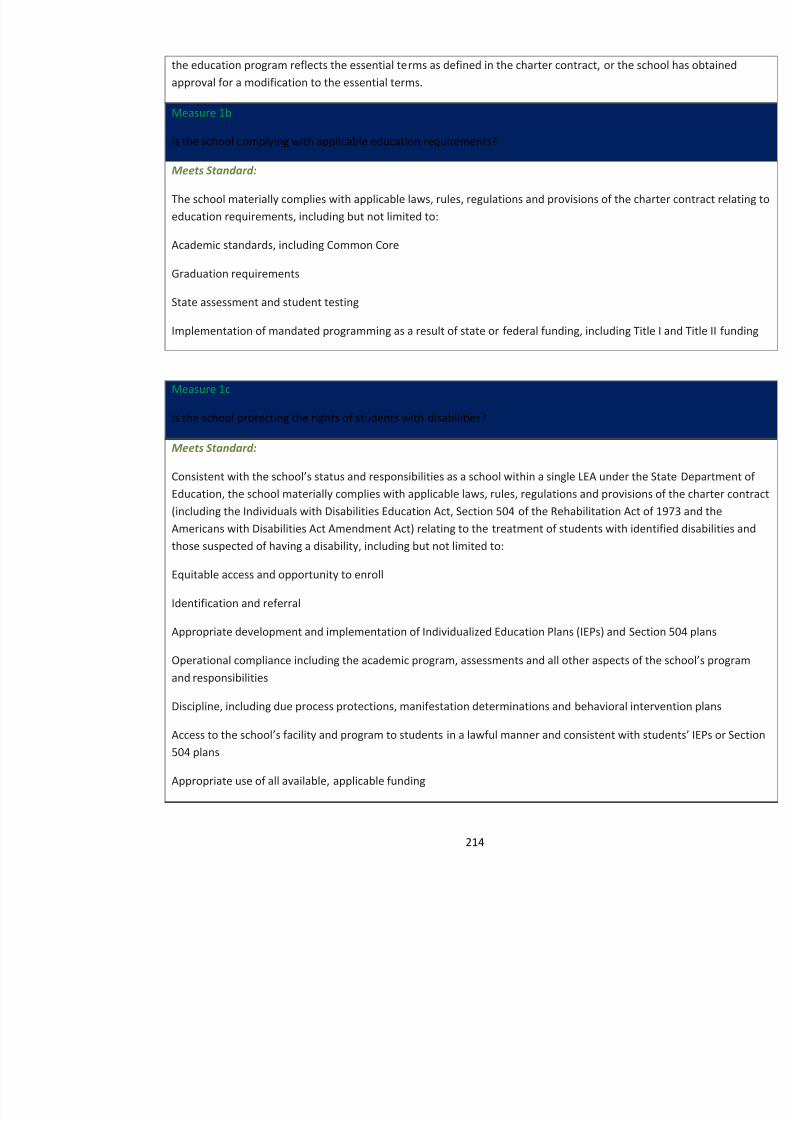
8/10/2019 Hawaii charter schools annual report
http://slidepdf.com/reader/full/hawaii-charter-schools-annual-report 217/268
Measure 1c
Is the school protecting the rights of students with disabilities?
Meets Standard:
Consistent with the school’s status and responsibilities as a school within a single LEA under the StatEducation, the school materially complies with applicable laws, rules, regulations and provisions of the char(including the Individuals with Disabilities Education Act, Section 504 of the Rehabilitation Act of 1973 anAmericans with Disabilities Act Amendment Act) relating to the treatment of students with identified disab
those suspected of having a disability, including but not limited to:
Equitable access and opportunity to enroll
Identification and referral
Appropriate development and implementation of Individualized Education Plans (IEPs) and Section 504 pla
Operational compliance including the academic program, assessments and all other aspects of the schand responsibilities
Measure 1d
Is the school protecting the rights of English Language Learner (ELL) students?
Meets Standard:
The school materially complies with applicable laws, rules, regulations and provisions of the charter contracELL requirements (including Title III of the Elementary and Secondary Education Act [ESEA] and U.S. De
Education authorities), including but not limited to:
Equitable access and opportunity to enroll
Required policies related to the service of ELL students
Proper steps for identification of students in need of ELL services
Appropriate and equitable delivery of services to identified studentsAppropriate accommodations on assessments
Exiting of students from ELL services
8/10/2019 Hawaii charter schools annual report
http://slidepdf.com/reader/full/hawaii-charter-schools-annual-report 218/268
Ongoing monitoring of exited students
2. FINANCIAL MANAGEMENT AND OVERSIGHT
Measure 2a
Is the school meeting financial reporting and compliance requirements?
Meets Standard:
The school materially complies with applicable laws, rules, regulations and provisions of the charter contracfinancial reporting requirements, including but not limited to:
Complete and on-time submission of financial reports, including annual budget, revised budgets (if applicabfinancial reports as required by the authorizer and any reporting requirements if the board contracts with an Service Provider (ESP)
On-time submission and completion of the annual independent audit and corrective action plans, if applicab
Is the school following Generally Accepted Accounting Principles (GAAP)?
Meets Standard:
The school materially complies with applicable laws, rules, regulations and provisions of the charter contracfinancial management and oversight expectations as evidenced by an annual independent audit, including bulimited to:
An unqualified audit opinion
An audit devoid of significant findings and conditions, material weaknesses or significant internal control w
An audit that does not include a going concern disclosure in the notes or an explanatory paragraph within threport
3. GOVERNANCE AND REPORTING
Measure 3a
Is the school complying with governance requirements?
8/10/2019 Hawaii charter schools annual report
http://slidepdf.com/reader/full/hawaii-charter-schools-annual-report 219/268
Is the school complying with governance requirements?
Meets Standard:
The school materially complies with applicable laws, rules, regulations and provisions of the charter contracgovernance by its board, including but not limited to:
Governing board composition and membership requirements pursuant to Ch. 302D, HRS
Governing board policies
Governing board reporting requirements
Procurement policies
State Ethics Code (Ch. 84, HRS), including conflict of interest policy
Measure 3b
Is the school holding management accountable?
Meets Standard:
may not be agreed to under a written performance agreement
Measure 3c
Is the school complying with data and reporting requirements?
Meets Standard:
The school materially complies with applicable laws, rules, regulations and provisions of the charter contracrelevant reporting requirements to the State Public Charter School Commission, State Department of EducaState Education Agency (SEA) and sole Local Education Agency (LEA) and/or federal authorities, includinlimited to:
Compliance with minimum educational data reporting standards established by the BOE
Maintaining and reporting accurate enrollment and attendance data
Maintaining and reporting accurate personnel data
Annual reporting and immediate notice requirements
8/10/2019 Hawaii charter schools annual report
http://slidepdf.com/reader/full/hawaii-charter-schools-annual-report 220/268
Additional information requested by the State Public Charter School Commission
4. STUDENTS AND EMPLOYEES
Measure 4a
Is the school protecting the rights of all students?
Meets Standard:
The school materially complies with applicable laws, rules, regulations and provisions of the charter contracthe rights of students, including but not limited to:
Compliance with admissions, enrollment and dismissal requirements (including nondiscrimination and rightor maintain enrollment)
The collection and protection of student information (that could be used in discriminatory ways or otherwise
to law)
Measure 4b
Is the school meeting teacher and other staff requirements?
Meets Standard:
The school materially complies with applicable laws, rules, regulations, and provisions of the charter contrathe State licensing requirements and federal Highly Qualified Teacher and Paraprofessional requirements wi
of the Elementary and Secondary Education Act, hiring of qualified non-instructional staff, criminal history checks and teacher/principal evaluations.
Measure 4c
Is the school respecting employee rights?
Meets Standard:
The school materially complies with applicable laws, rules, regulations and provisions of the charter contracemployment considerations, including those relating to state employment law, the Family Medical Leave AcAmericans with Disabilities Act and nondiscrimination. The school follows collective bargaining requireme
8/10/2019 Hawaii charter schools annual report
http://slidepdf.com/reader/full/hawaii-charter-schools-annual-report 221/268
5. SCHOOL ENVIRONMENT
Measure 5a
Is the school complying with facilities and transportation requirements?
Meets Standard:
The school materially complies with applicable laws, rules, regulations and provisions of the charter contrac
the school facilities, grounds and transportation, including but not limited to:
Compliance with building, zoning, fire health and safety codes
Fire inspections and related records
Viable certificate of occupancy or other required building use authorization
Compliance with DOE requirements for schools occupying DOE facilities
S d i
Meets Standard:
The school materially complies with applicable laws, rules, regulations and provisions of the charter contrachealth and safety, including but not limited to:
Health clearances and immunizations
Prohibiting smoking on campus
Appropriate student health services
Safety plan
Measure 5c
Is the school handling information appropriately?
Meets Standard:
The school materially complies with applicable laws, rules, regulations and provisions of the charter contracthe handling of information, including but not limited to:
8/10/2019 Hawaii charter schools annual report
http://slidepdf.com/reader/full/hawaii-charter-schools-annual-report 222/268
Maintaining the security of and providing access to student records under the Family Educational Rights anAct and other applicable authorities
Complying with the Uniform Information Practices Act and other applicable authorities
Transferring of student records
Proper and secure maintenance of testing materials
6. ADDITIONAL OBLIGATIONS
Measure 6a
Is the school complying with all other obligations?
Meets Standard:
The school materially complies with all other legal, statutory, regulatory or contractual requirements containcharter contract that are not otherwise explicitly stated herein, including but not limited to requirements fromfollowing sources:
Revisions to state charter law
Consent decrees
Intervention requirements by the Commission
Requirements by other entities to which the charter school is accountable (e.g., Hawaii Department of Educ
8/10/2019 Hawaii charter schools annual report
http://slidepdf.com/reader/full/hawaii-charter-schools-annual-report 223/268
34B
Appendix F: Academic Performance Framework for 2014-17 Charter Contract
8/10/2019 Hawaii charter schools annual report
http://slidepdf.com/reader/full/hawaii-charter-schools-annual-report 224/268
ACADEMIC PERFORMANCE FRAMEWORK
The Academic Performance Framework includes measures that allow the Commission to evaluate thperformance or outcomes and was developed in accordance to the Hawaii Charter Schools Act (2012 Haw.Act 130, §16 at 41-43.). This section answers the evaluative question: Is the academic program a success? school that meets the standards in this area is implementing its academic program effectively, and student lethe central purpose of every school —is taking place.
For each measure, a school receives one of four ratings: “Exceeds Standard,” “Meets Standard,” “Standard ,” or “Falls Far Below Standard.”
Standard Goals: State and federal accountability system
The Strive HI Academic Performance Index (API) is based on school performance in four categories:
Student proficiency
Student growth
College and career readiness:
Elementary schools: Attendance
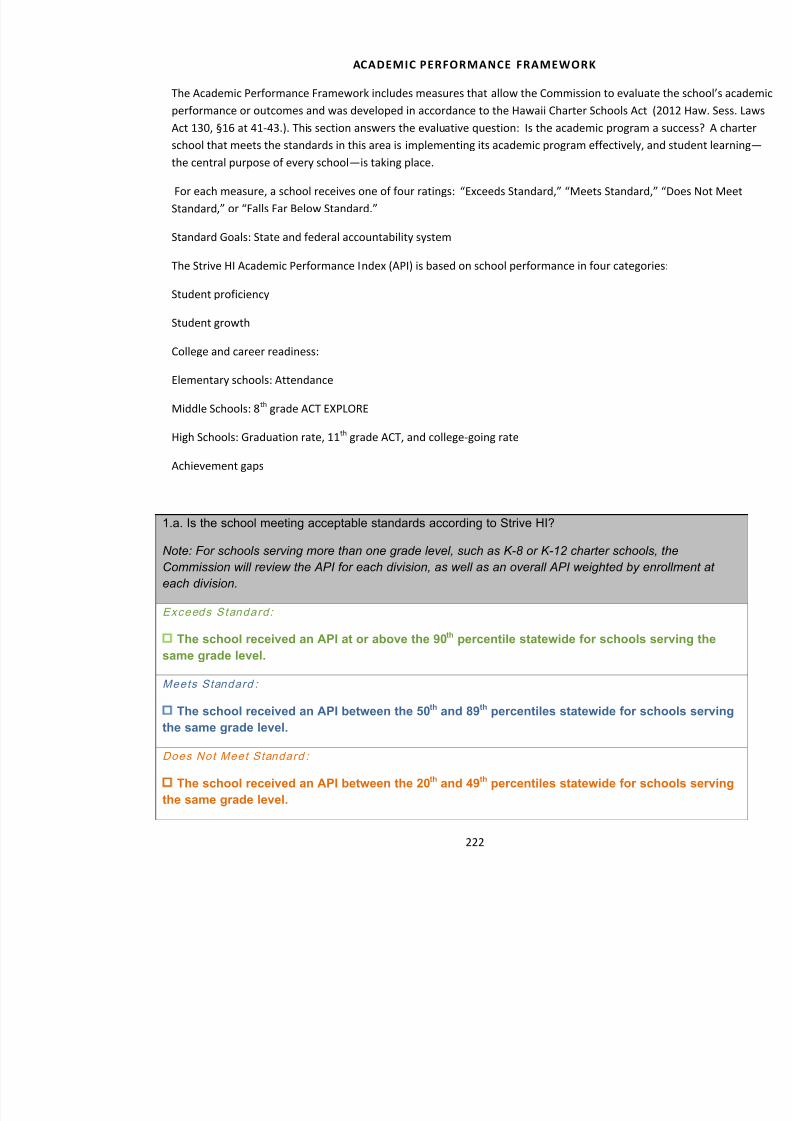
8/10/2019 Hawaii charter schools annual report
http://slidepdf.com/reader/full/hawaii-charter-schools-annual-report 225/268
Middle Schools: 8 th grade ACT EXPLORE
High Schools: Graduation rate, 11 th grade ACT, and college-going rate
Achievement gaps
1.a. Is the school meeting acceptable standards according to Strive HI?
Note: For schools serving more than one grade level, such as K-8 or K-12 charter schools, theCommission will review the API for each division, as well as an overall API weighted by enrollment ateach division.
Exceeds S tandard :
The school received an API at or above the 90 th percentile statewide for schools serving thesame grade level.
Meets Standard :
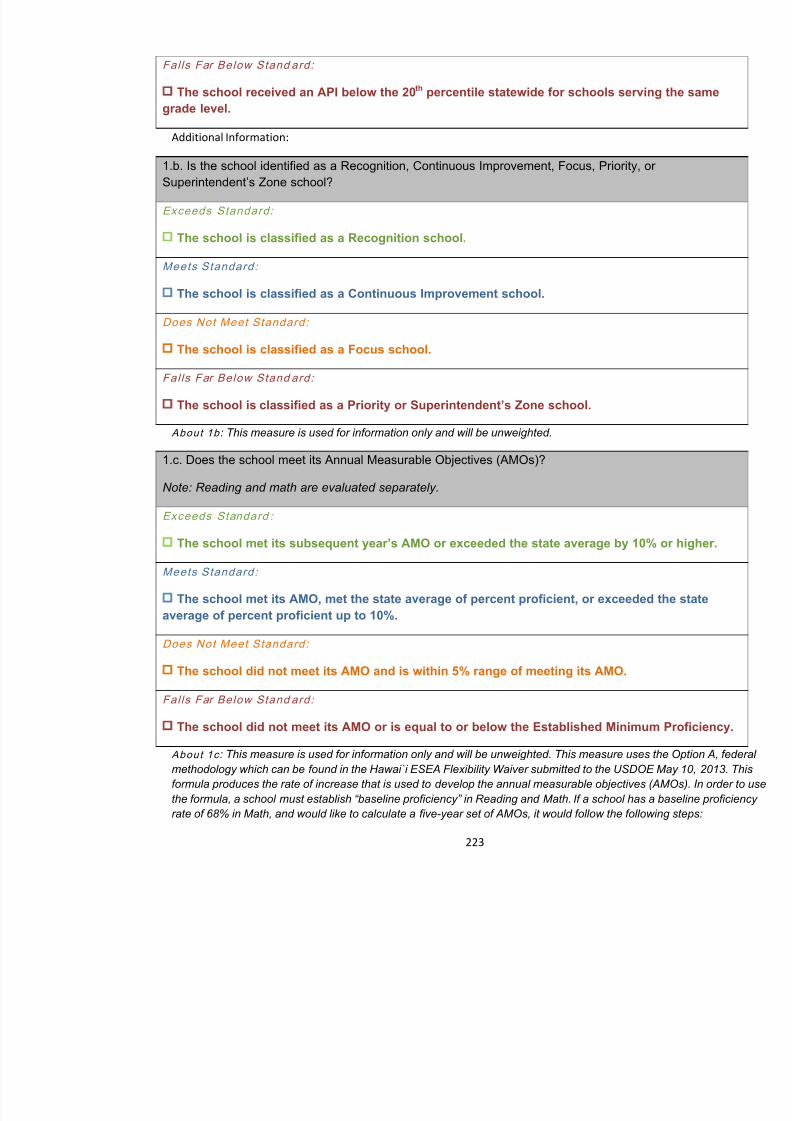
8/10/2019 Hawaii charter schools annual report
http://slidepdf.com/reader/full/hawaii-charter-schools-annual-report 226/268
AMO formula: Yearly Increase = ((1-Baseline Proficiency)*0.5)/5)Baseline proficiency = 68% (.68)Yearly Increase = ((1-.68)*0.5)/5)Yearly Increase = ((.32)*0.5)/5)Yearly increase = ((.16)/5)Yearly increase = .032
The school is expected to increase its rate of proficiency by 3.2% (.032) each year.
1 st Year AMO = .68 + .032 = .712 (71.2%)2 nd Year AMO = .712 + .032 = .744 (74.4%)3 rd Year AMO = .744 + .032 = .776 (77.6%)4 th Year AMO = .776 + .032 = .808 (80.8%)5 th Year AMO = .808 + .032 = .84 (84%)
This metric uses the state average additionally. A school that meets or exceeds the state average meets or exceeds thistandard even if it does not meet its AMO.
This metric uses the Established Minimum Proficiency as a floor. A school that does not at least meet the EstablishedMinimum Proficiency will be evaluated as Falls Far Below Standard for this measure.
2 Standard Goals: Performance of High-Needs Students
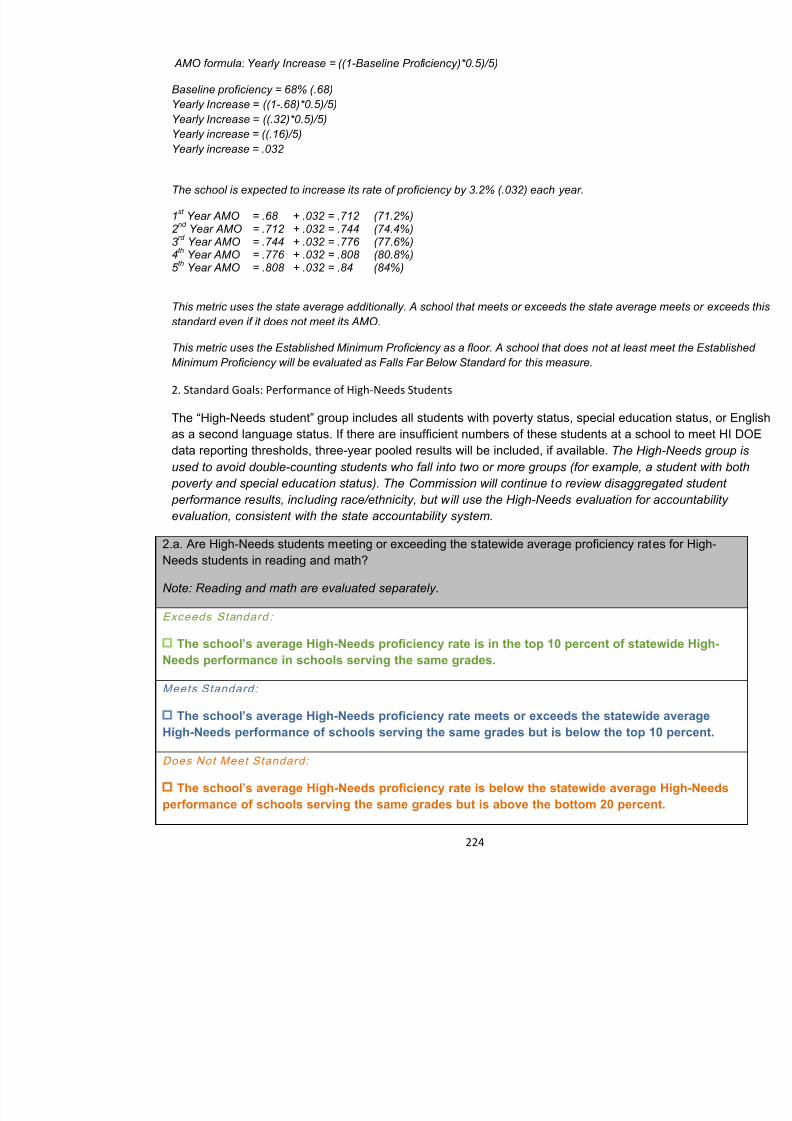
8/10/2019 Hawaii charter schools annual report
http://slidepdf.com/reader/full/hawaii-charter-schools-annual-report 227/268
2. Standard Goals: Performance of High-Needs Students
The “High -Needs student” group includes all students with poverty status, special education status, oras a second language status. If there are insufficient numbers of these students at a school to meet HI DOEdata reporting thresholds, three-year pooled results will be included, if available. The High-Nused to avoid double-counting students who fall into two or more groups (for example, a student with bot
poverty and special education status). The Commission will continue to review disaggregated student performance results, including race/ethnicity, but will use the High-Needs evaluation for accountabilityevaluation, consistent with the state accountability system.
2.a . Are High-Needs students meeting or exceeding the statewide average proficiency rates for High-Needs students in reading and math?
Note: Reading and math are evaluated separately.
Exceeds Standard :
The school ’s average High-Needs proficiency rate is in the top 10 percent of statewide High-Needs performance in schools serving the same grades.
M t St d d
Fal ls Far Below Stand ard:
The school ’s average High-Needs proficiency rate is in the bottom 20 percent of statewide High-Needs performance of schools serving the same grades.
About 2a : This measure compares proficiency of a school’s High -Needs students against statewide averarates of all High- Needs students. The performance of school’s High -Needs population is compared only tschools serving the same grades. The metric uses a percentile ranking to evaluate performance.
2.b. Are High-Needs students showing growth in reading and math based on the Hawaii Growth Modelmedian growth percentiles (MGPs)?
Note: Reading and math are evaluated separately.
Exceeds S tandard :
Reading: High-Needs MGP is greater than 58.
Math: High-Needs MGP is greater than 62.
Meets Standard :
Reading: High-Needs MGP is between 52 and 58.
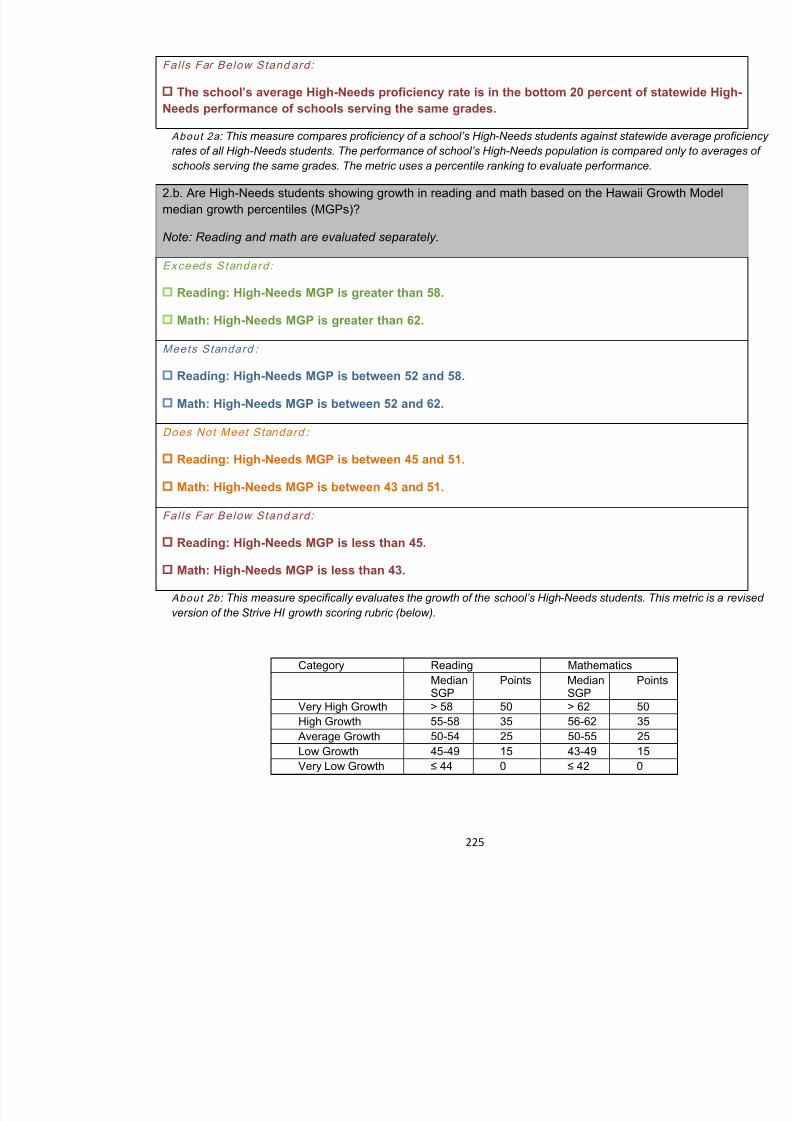
8/10/2019 Hawaii charter schools annual report
http://slidepdf.com/reader/full/hawaii-charter-schools-annual-report 228/268
Math: High-Needs MGP is between 52 and 62.
Does Not Meet Standard :
Reading: High-Needs MGP is between 45 and 51.
Math: High-Needs MGP is between 43 and 51.
Fal ls Far Below Stand ard:
Reading: High-Needs MGP is less than 45.
Math: High-Needs MGP is less than 43.
About 2b : This measure specifically evaluates the growth of the school’s High -Needs students. This mversion of the Strive HI growth scoring rubric (below).
Category Reading MathematicsMedian Points Median Points
2.c. Are High-Needs students showing adequate growth to proficiency in reading and math based on theHawaii Growth Model’ s adequate growth percentile (AGP)?
Note : Adequa te Growth Pe rcen t i l e (AGP) wi l l be inc luded in the A cademic Pe r fo rmanceFramewo rk w hen they are avai lable f rom HI DOE.
Exceeds S tandard :
TBD
Meets Standard :
TBD
Does Not Meet Standard :
TBD
Fal ls Far Below Stand ard:
TBD
About 2c : Currently, the data do not exist to calculate AGP. This measure acts as a placeholder.
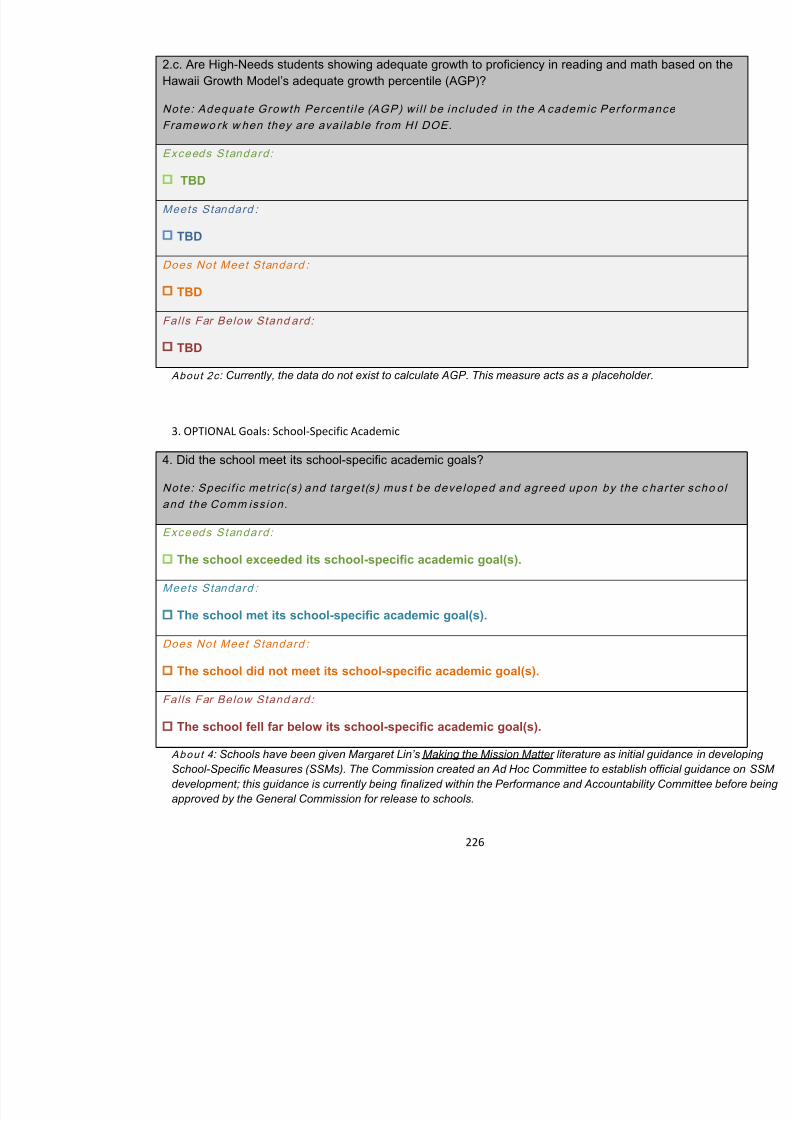
8/10/2019 Hawaii charter schools annual report
http://slidepdf.com/reader/full/hawaii-charter-schools-annual-report 229/268
3. OPTIONAL Goals: School-Specific Academic
4. Did the school meet its school-specific academic goals?
Note : Spec i f i c me t r i c ( s ) and t a rge t (s ) mus t be deve loped and agreed upon by the c ha r t er scho o land the Comm iss ion .
Exceeds S tandard :
The school exceeded its school-specific academic goal(s).
Meets Standard :
The school met its school-specific academic goal(s).
Does Not Meet Standard :
The school did not meet its school-specific academic goal(s).
Weighting Plan with 25% Weighted School-Specific Measures
Indicator OverallWeight byIndicator
Effective Weight by Gradeand Measure
ES MS H
1. API
Proficiency
50%
12.5% 12.5% 1
Student Growth 25.0% 22.5% 7
Readiness 2.5% 7.5% 2
A hi t G 10 0% 7 5% 5
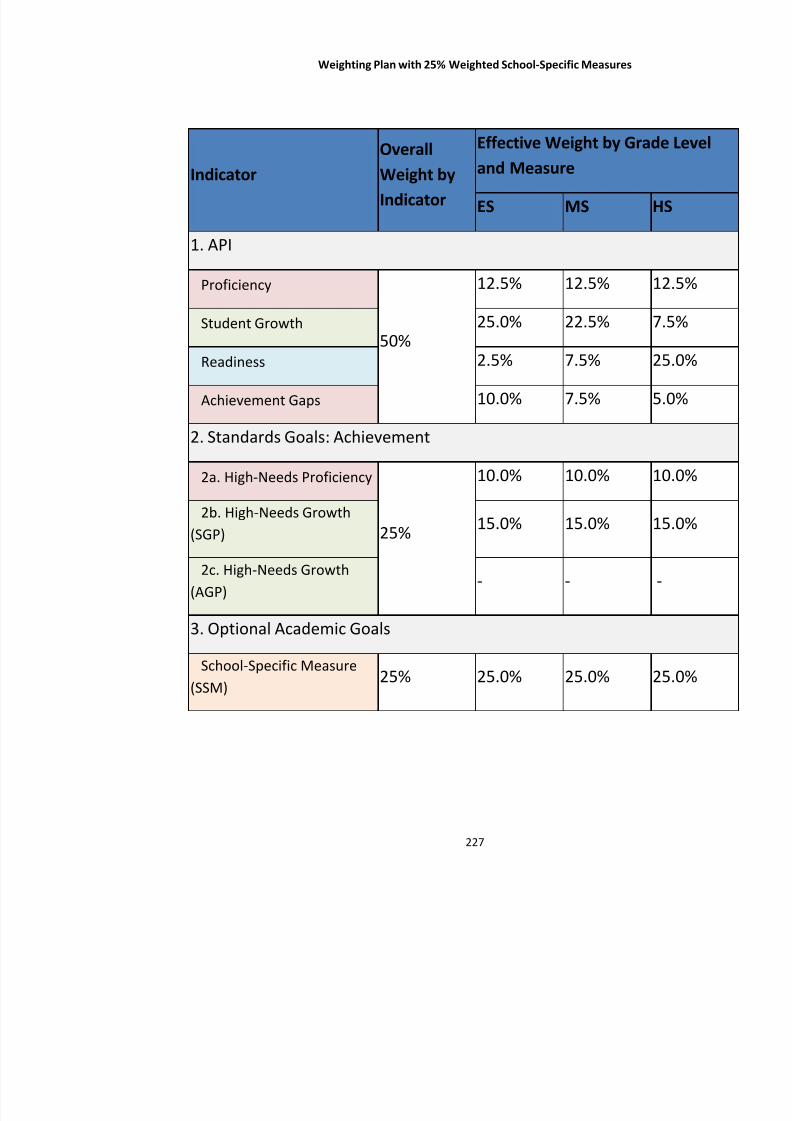
8/10/2019 Hawaii charter schools annual report
http://slidepdf.com/reader/full/hawaii-charter-schools-annual-report 230/268
Achievement Gaps 10.0% 7.5% 5
2. Standards Goals: Achievement
2a. High-Needs Proficiency
25%
10.0% 10.0% 10
2b. High-Needs Growth(SGP) 15.0% 15.0% 1
2c. High-Needs Growth(AGP) - - -
3. Optional Academic Goals
School-Specific Measure(SSM) 25% 25.0% 25.0% 2
Weighting Plan with 10% Weighted School-Specific Measures
Indicator
Overall
Weight byIndicator
Effective Weight by Gra
and Measure ES MS H
1. API
Proficiency
60%
15.0% 15.0% 1
Student Growth 30.0% 27.0% 9
Readiness 3.0% 9.0% 3
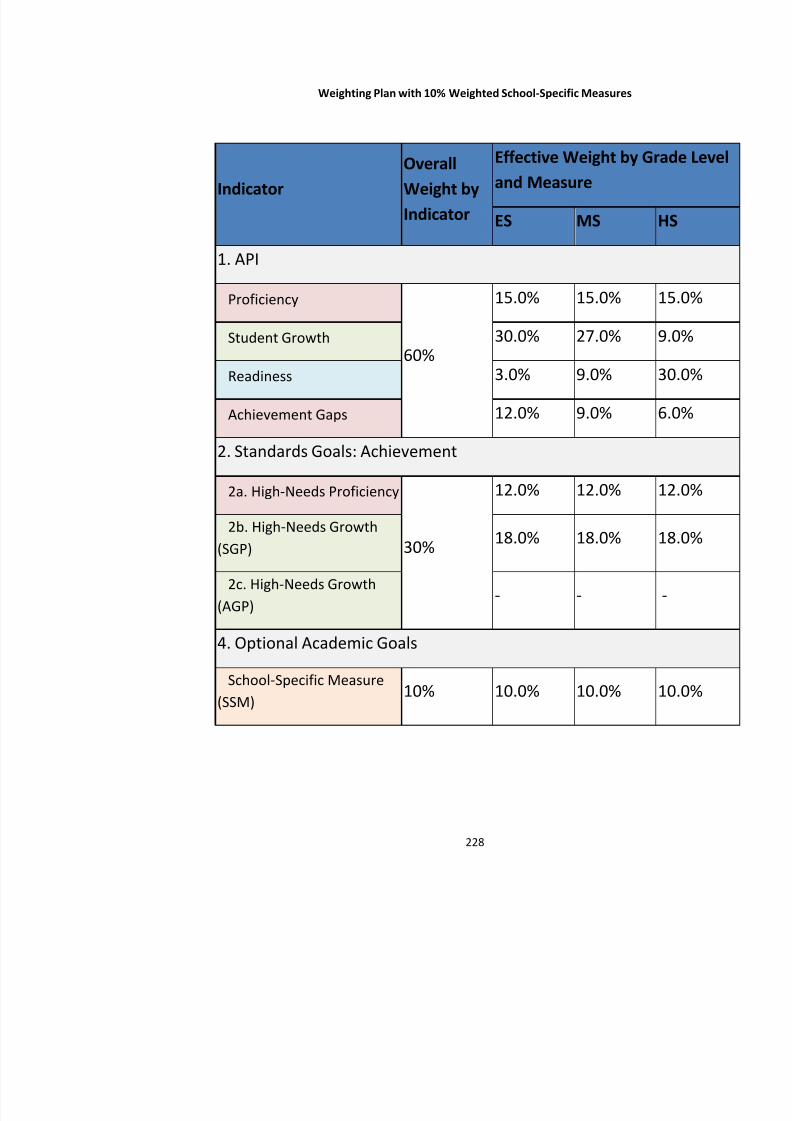
8/10/2019 Hawaii charter schools annual report
http://slidepdf.com/reader/full/hawaii-charter-schools-annual-report 231/268
Achievement Gaps 12.0% 9.0% 6
2. Standards Goals: Achievement
2a. High-Needs Proficiency
30%
12.0% 12.0% 1
2b. High-Needs Growth
(SGP) 18.0% 18.0% 1
2c. High-Needs Growth(AGP) - -
4. Optional Academic Goals
School-Specific Measure 10% 10 0% 10 0% 1
Weighting Plan for 0% School-Specific Measures
Indicator
Overall
Weight byIndicator
Effective Weight by Graand Measure
ES MS H
1. API
Proficiency
65%
16.25% 16.25% 1
Student Growth 32.5% 29.5% 9
Readiness 3.25% 9.75% 3
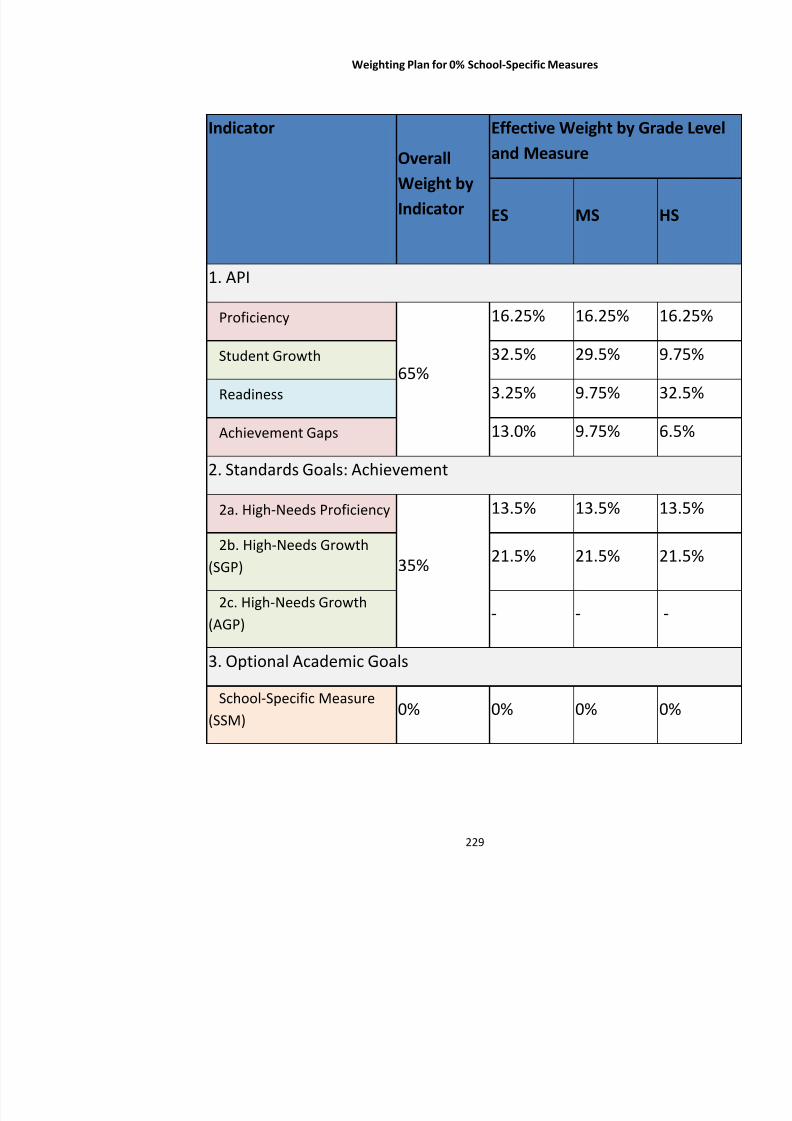
8/10/2019 Hawaii charter schools annual report
http://slidepdf.com/reader/full/hawaii-charter-schools-annual-report 232/268
Achievement Gaps 13.0% 9.75% 62. Standards Goals: Achievement
2a. High-Needs Proficiency
35%
13.5% 13.5% 1
2b. High-Needs Growth(SGP) 21.5% 21.5% 2
2c. High-Needs Growth(AGP) - -
3. Optional Academic Goals
35B33BAppendix G: Commission ’s Audited Financial Statements for FY 2013-20
8/10/2019 Hawaii charter schools annual report
http://slidepdf.com/reader/full/hawaii-charter-schools-annual-report 233/268
8/10/2019 Hawaii charter schools annual report
http://slidepdf.com/reader/full/hawaii-charter-schools-annual-report 234/268
231
8/10/2019 Hawaii charter schools annual report
http://slidepdf.com/reader/full/hawaii-charter-schools-annual-report 235/268
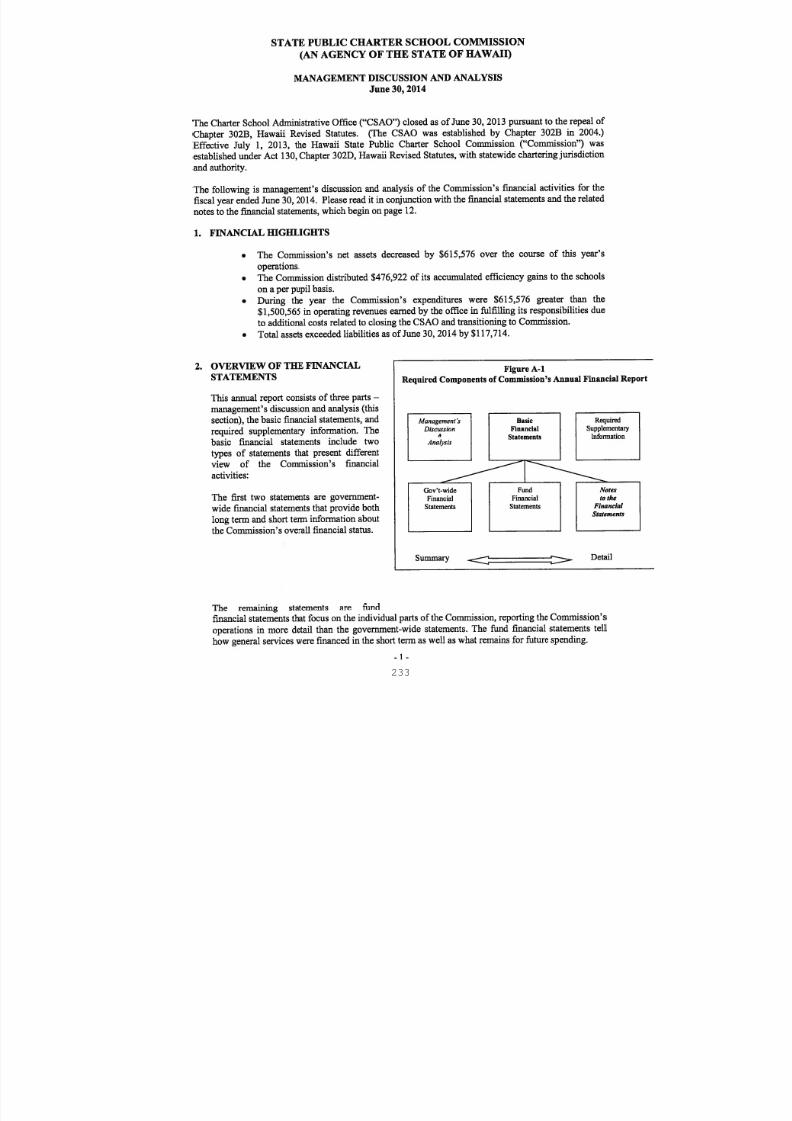
8/10/2019 Hawaii charter schools annual report
http://slidepdf.com/reader/full/hawaii-charter-schools-annual-report 236/268
233
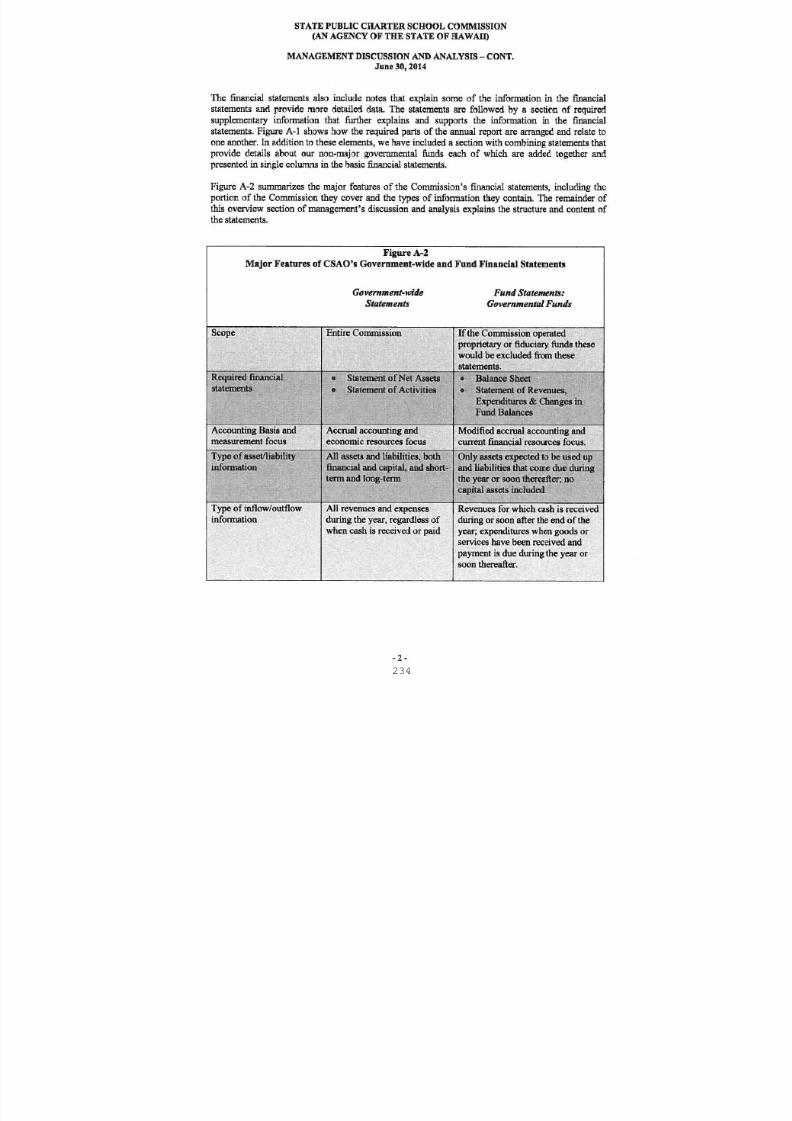
8/10/2019 Hawaii charter schools annual report
http://slidepdf.com/reader/full/hawaii-charter-schools-annual-report 237/268
234
8/10/2019 Hawaii charter schools annual report
http://slidepdf.com/reader/full/hawaii-charter-schools-annual-report 238/268
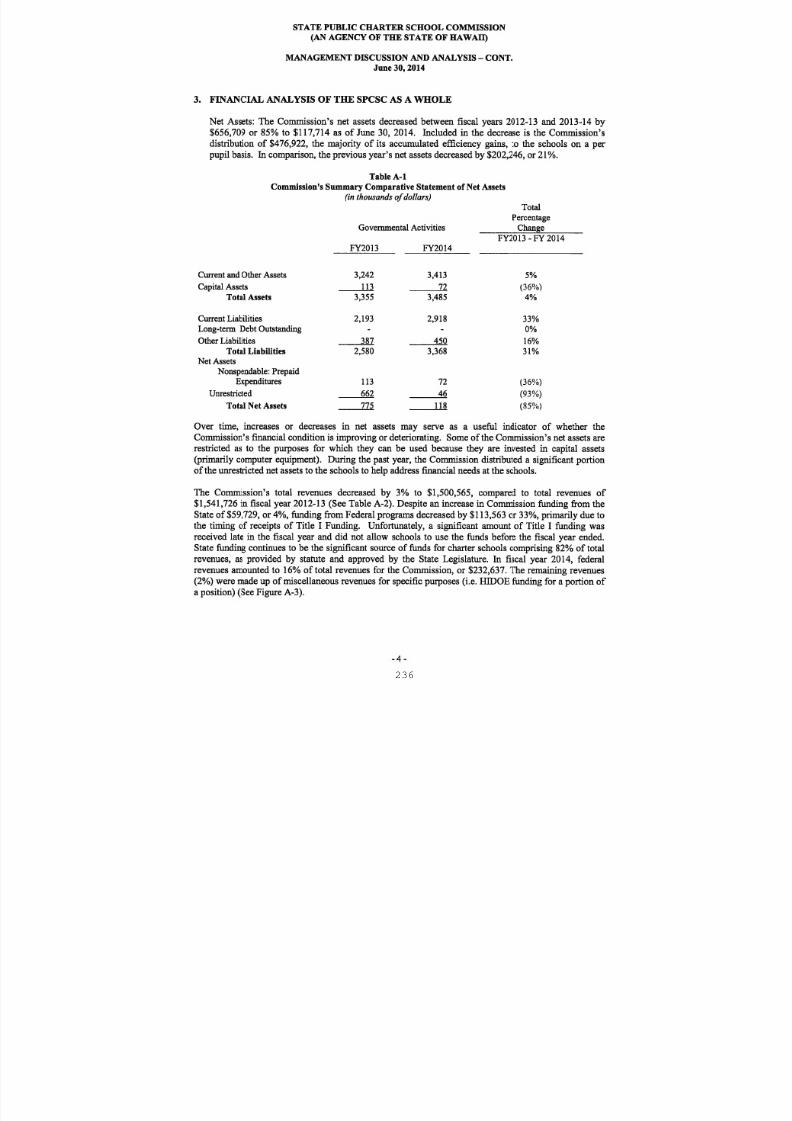
8/10/2019 Hawaii charter schools annual report
http://slidepdf.com/reader/full/hawaii-charter-schools-annual-report 239/268
236
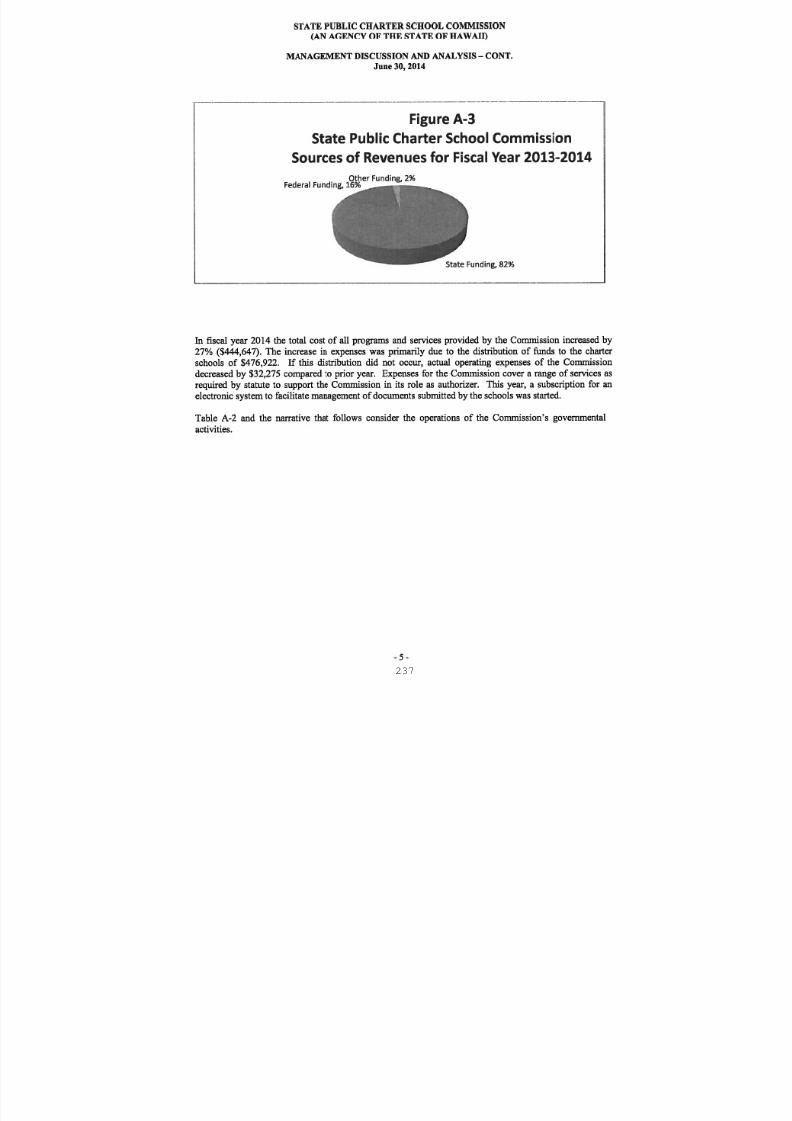
8/10/2019 Hawaii charter schools annual report
http://slidepdf.com/reader/full/hawaii-charter-schools-annual-report 240/268
237
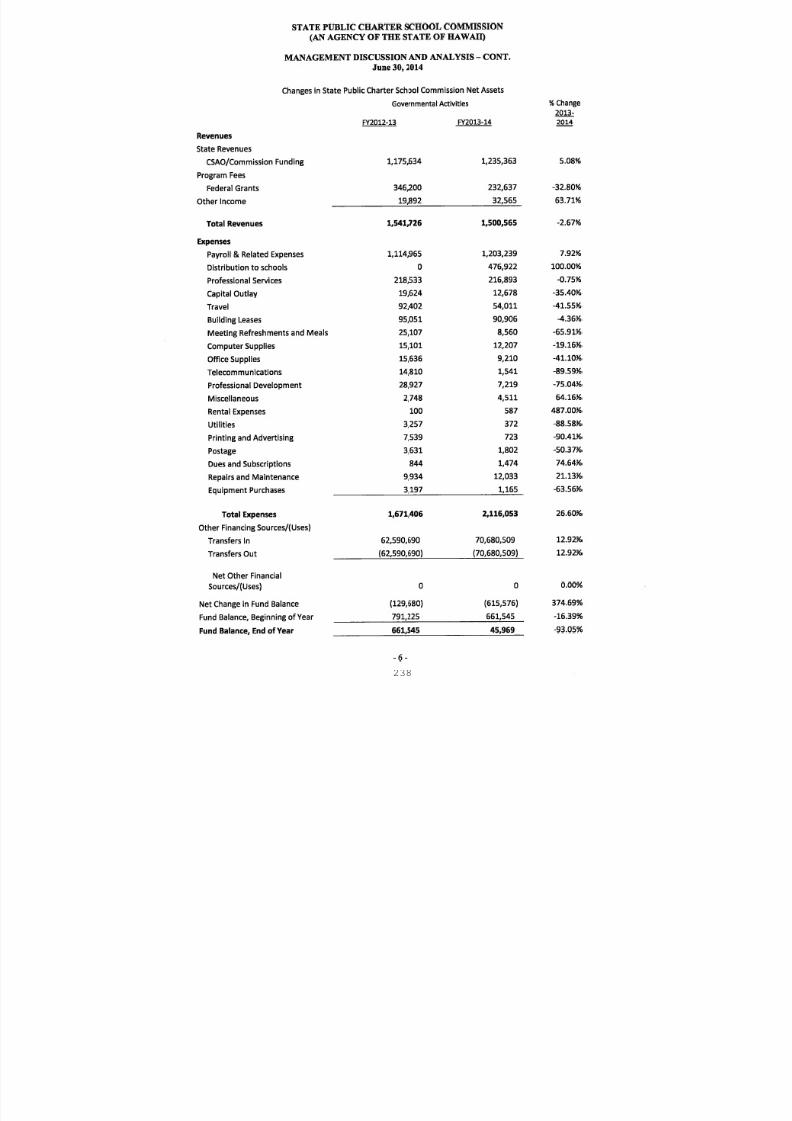
8/10/2019 Hawaii charter schools annual report
http://slidepdf.com/reader/full/hawaii-charter-schools-annual-report 241/268
8/10/2019 Hawaii charter schools annual report
http://slidepdf.com/reader/full/hawaii-charter-schools-annual-report 242/268
8/10/2019 Hawaii charter schools annual report
http://slidepdf.com/reader/full/hawaii-charter-schools-annual-report 243/268
240
8/10/2019 Hawaii charter schools annual report
http://slidepdf.com/reader/full/hawaii-charter-schools-annual-report 244/268
241
8/10/2019 Hawaii charter schools annual report
http://slidepdf.com/reader/full/hawaii-charter-schools-annual-report 245/268
8/10/2019 Hawaii charter schools annual report
http://slidepdf.com/reader/full/hawaii-charter-schools-annual-report 246/268
243
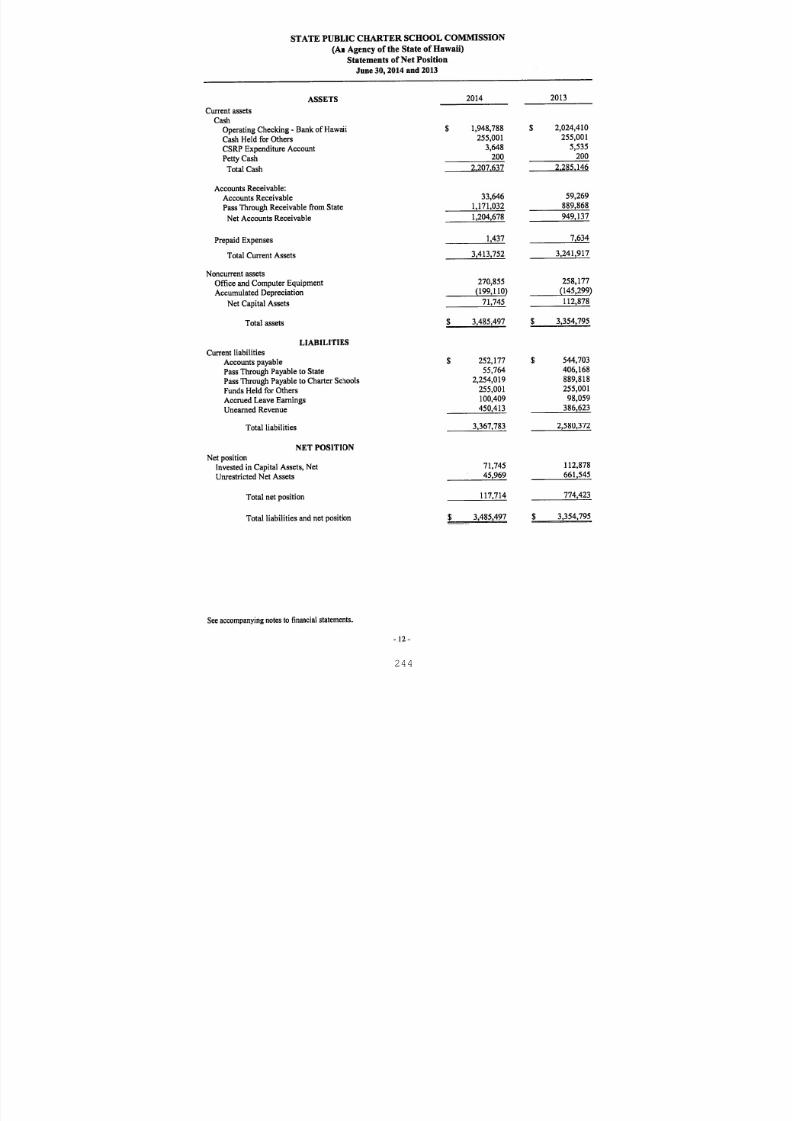
8/10/2019 Hawaii charter schools annual report
http://slidepdf.com/reader/full/hawaii-charter-schools-annual-report 247/268
244
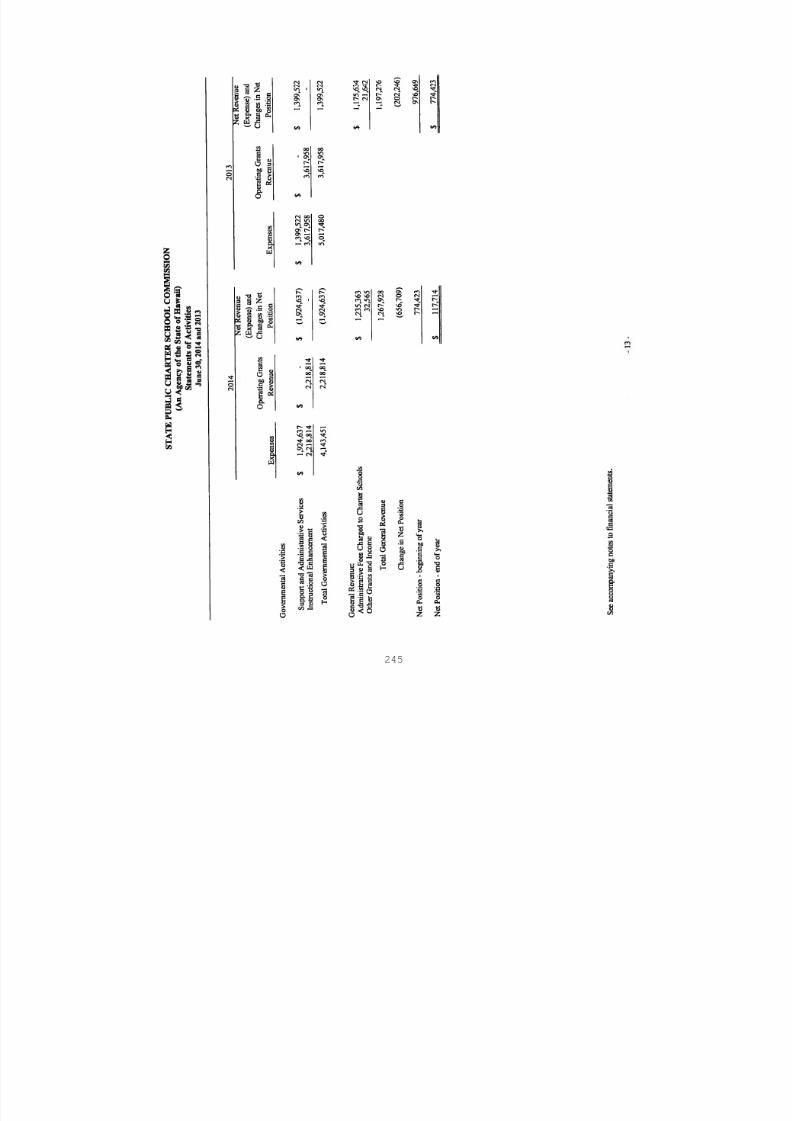
8/10/2019 Hawaii charter schools annual report
http://slidepdf.com/reader/full/hawaii-charter-schools-annual-report 248/268
245
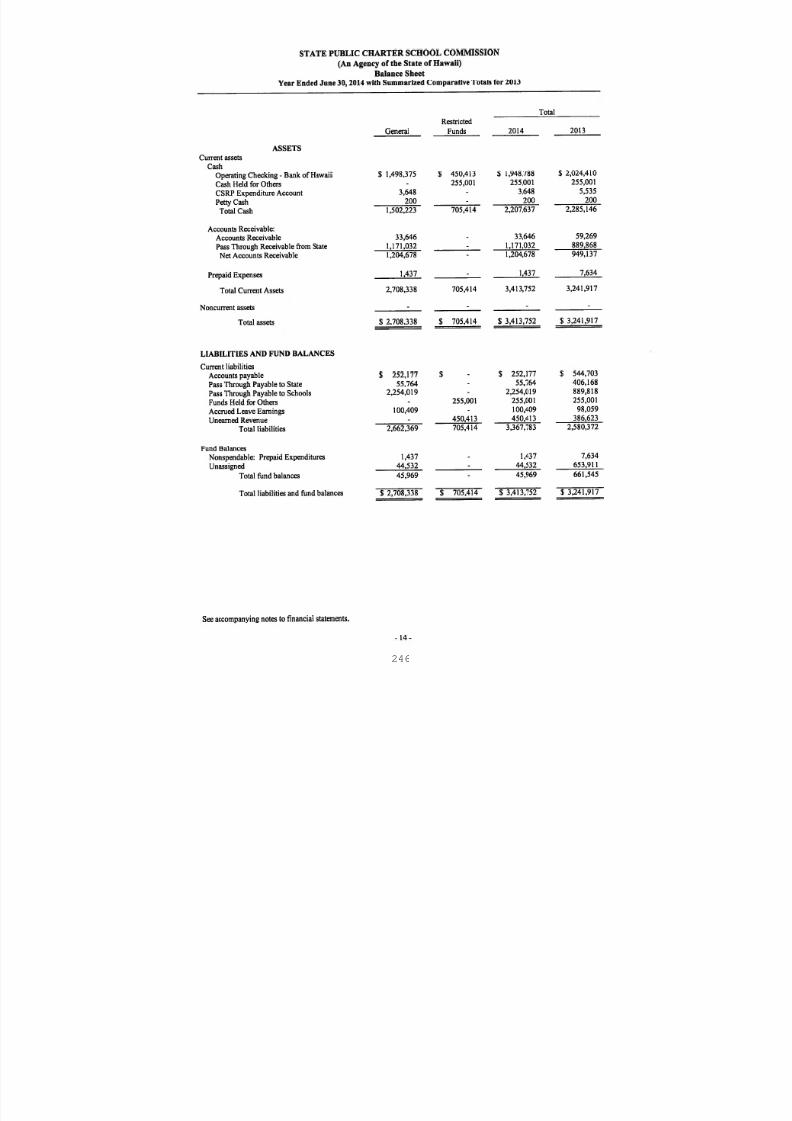
8/10/2019 Hawaii charter schools annual report
http://slidepdf.com/reader/full/hawaii-charter-schools-annual-report 249/268
246
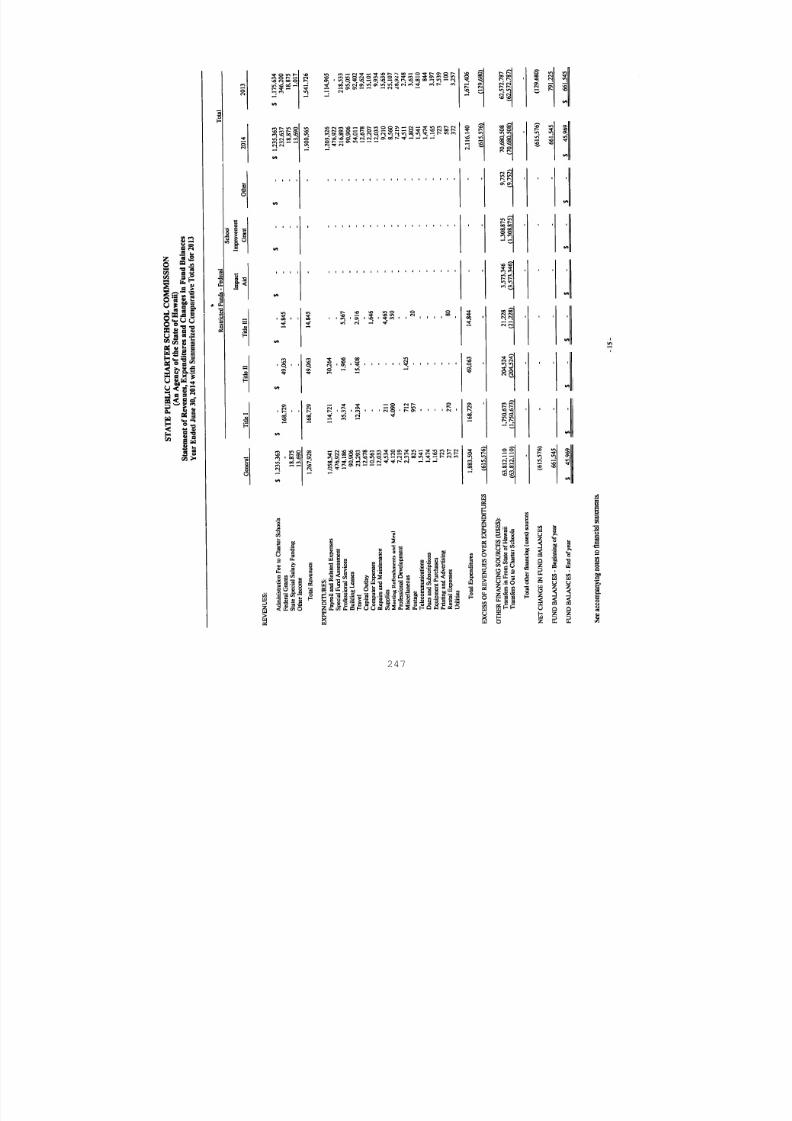
8/10/2019 Hawaii charter schools annual report
http://slidepdf.com/reader/full/hawaii-charter-schools-annual-report 250/268
247
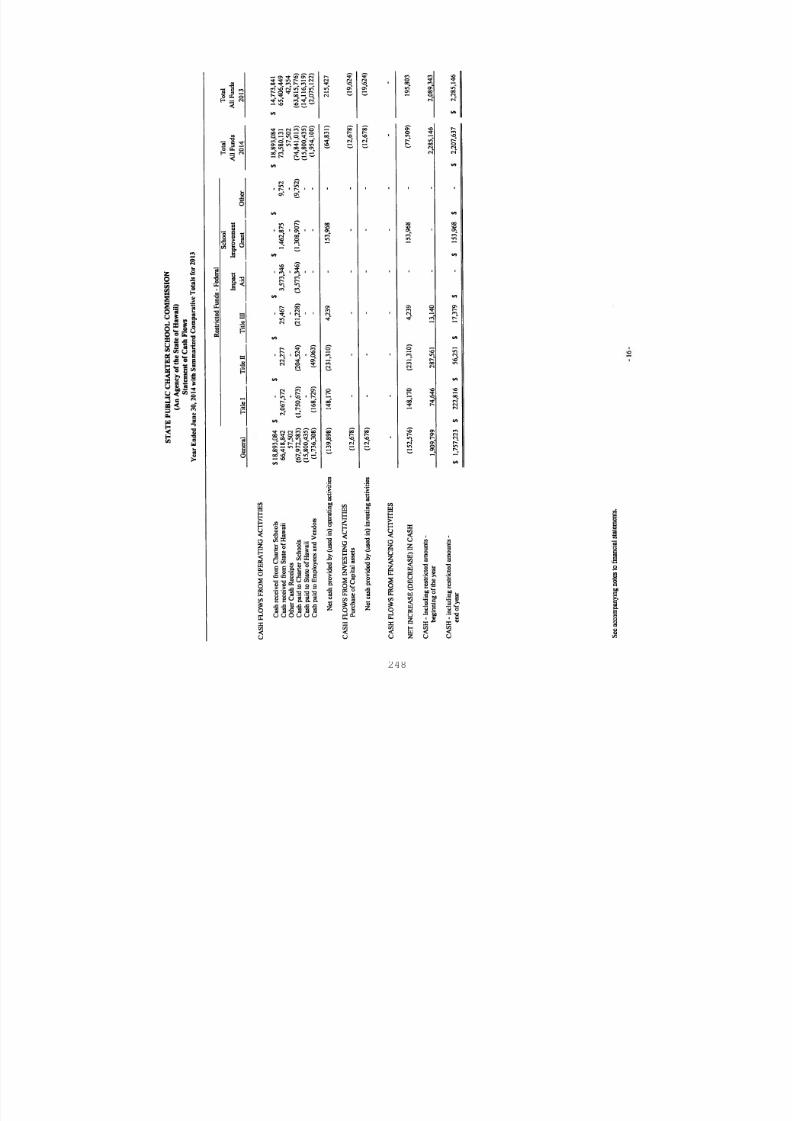
8/10/2019 Hawaii charter schools annual report
http://slidepdf.com/reader/full/hawaii-charter-schools-annual-report 251/268
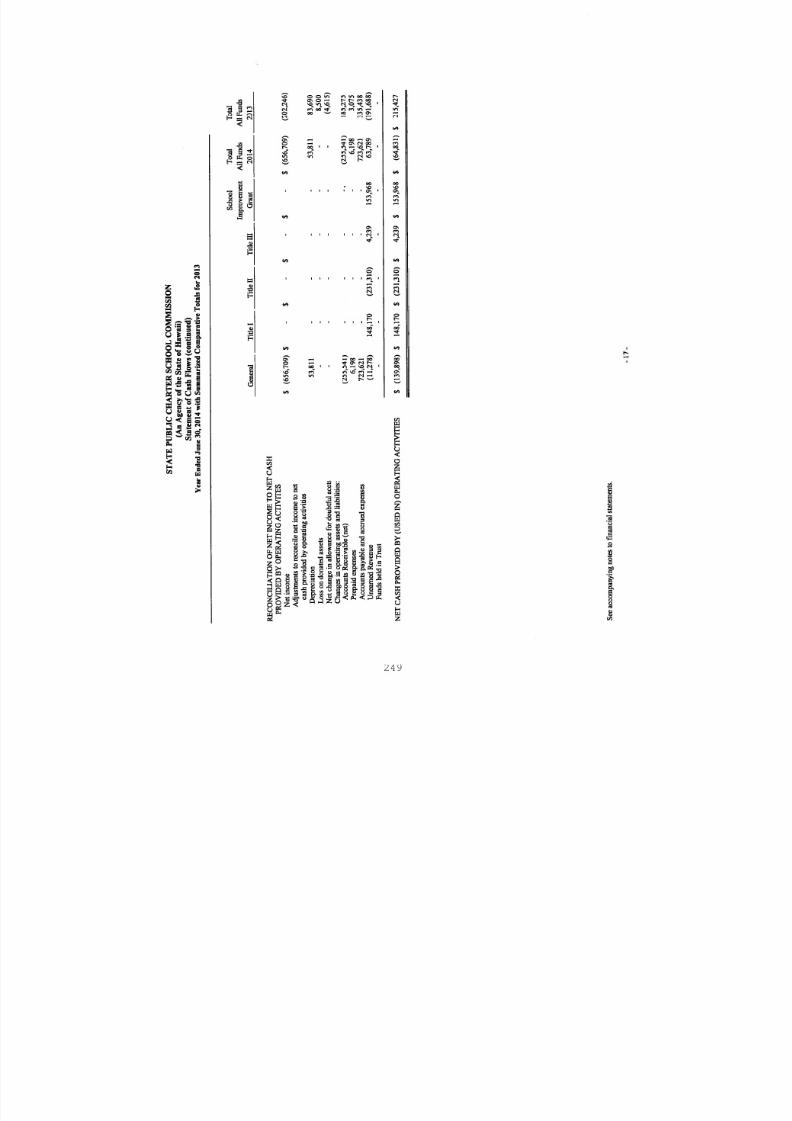
8/10/2019 Hawaii charter schools annual report
http://slidepdf.com/reader/full/hawaii-charter-schools-annual-report 252/268
8/10/2019 Hawaii charter schools annual report
http://slidepdf.com/reader/full/hawaii-charter-schools-annual-report 253/268
8/10/2019 Hawaii charter schools annual report
http://slidepdf.com/reader/full/hawaii-charter-schools-annual-report 254/268
1
8/10/2019 Hawaii charter schools annual report
http://slidepdf.com/reader/full/hawaii-charter-schools-annual-report 255/268
252
8/10/2019 Hawaii charter schools annual report
http://slidepdf.com/reader/full/hawaii-charter-schools-annual-report 256/268
8/10/2019 Hawaii charter schools annual report
http://slidepdf.com/reader/full/hawaii-charter-schools-annual-report 257/268
254
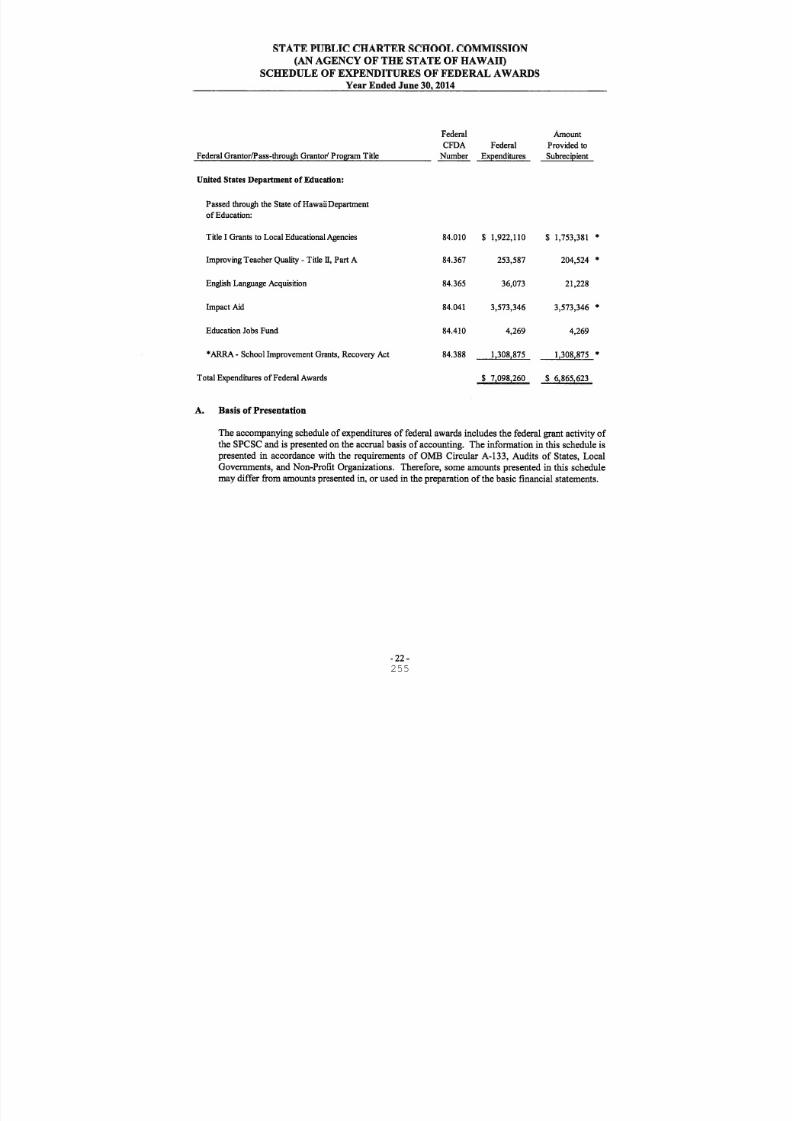
8/10/2019 Hawaii charter schools annual report
http://slidepdf.com/reader/full/hawaii-charter-schools-annual-report 258/268
255

8/10/2019 Hawaii charter schools annual report
http://slidepdf.com/reader/full/hawaii-charter-schools-annual-report 259/268
256
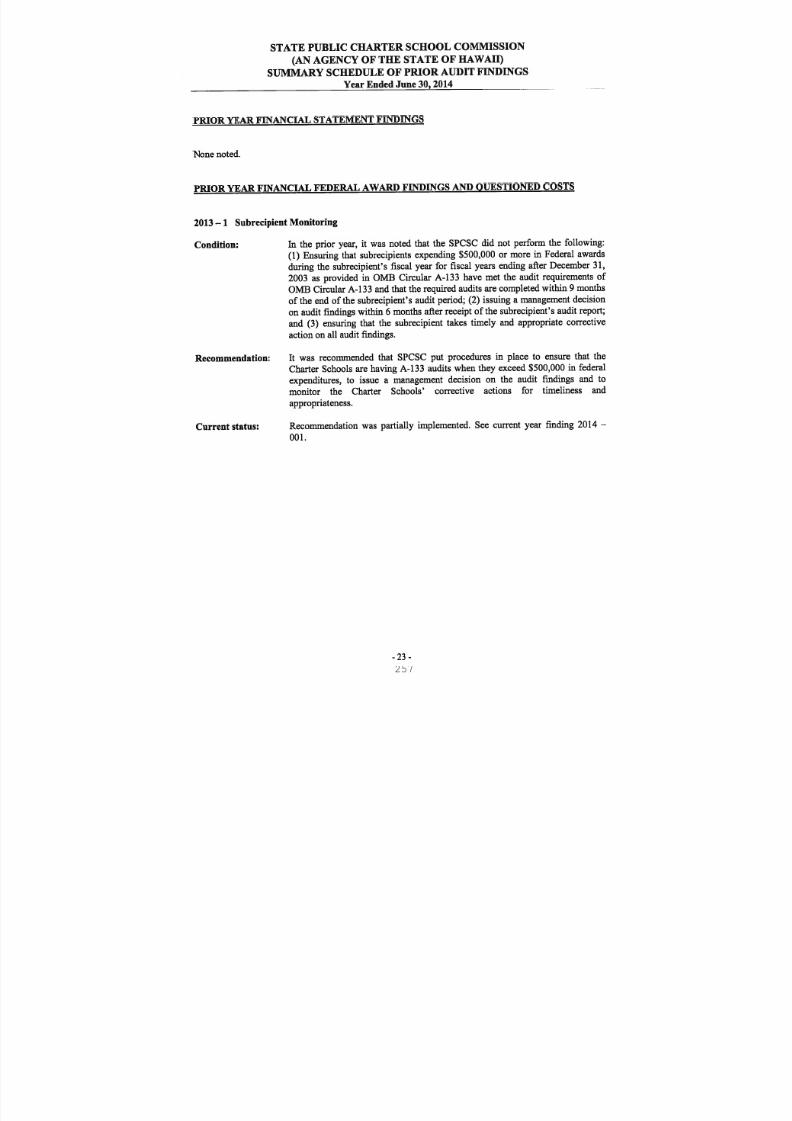
8/10/2019 Hawaii charter schools annual report
http://slidepdf.com/reader/full/hawaii-charter-schools-annual-report 260/268
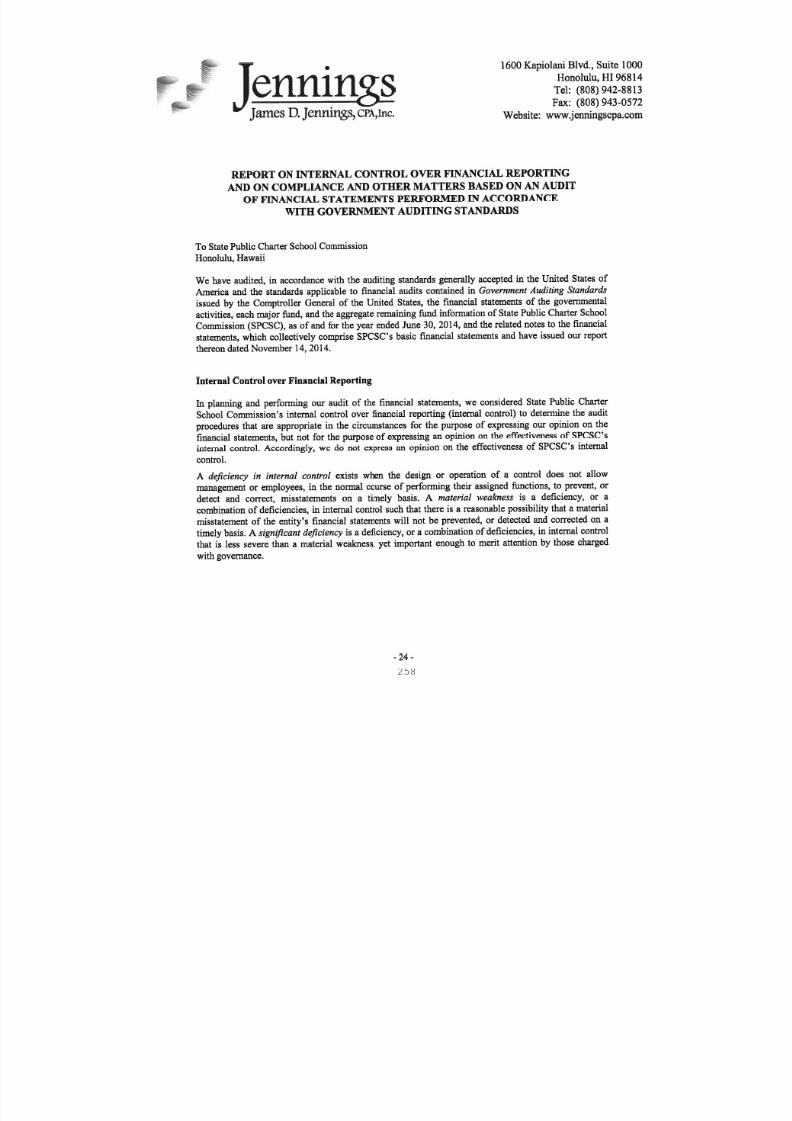
8/10/2019 Hawaii charter schools annual report
http://slidepdf.com/reader/full/hawaii-charter-schools-annual-report 261/268
8/10/2019 Hawaii charter schools annual report
http://slidepdf.com/reader/full/hawaii-charter-schools-annual-report 262/268
259
8/10/2019 Hawaii charter schools annual report
http://slidepdf.com/reader/full/hawaii-charter-schools-annual-report 263/268
260
8/10/2019 Hawaii charter schools annual report
http://slidepdf.com/reader/full/hawaii-charter-schools-annual-report 264/268
261
8/10/2019 Hawaii charter schools annual report
http://slidepdf.com/reader/full/hawaii-charter-schools-annual-report 265/268
262
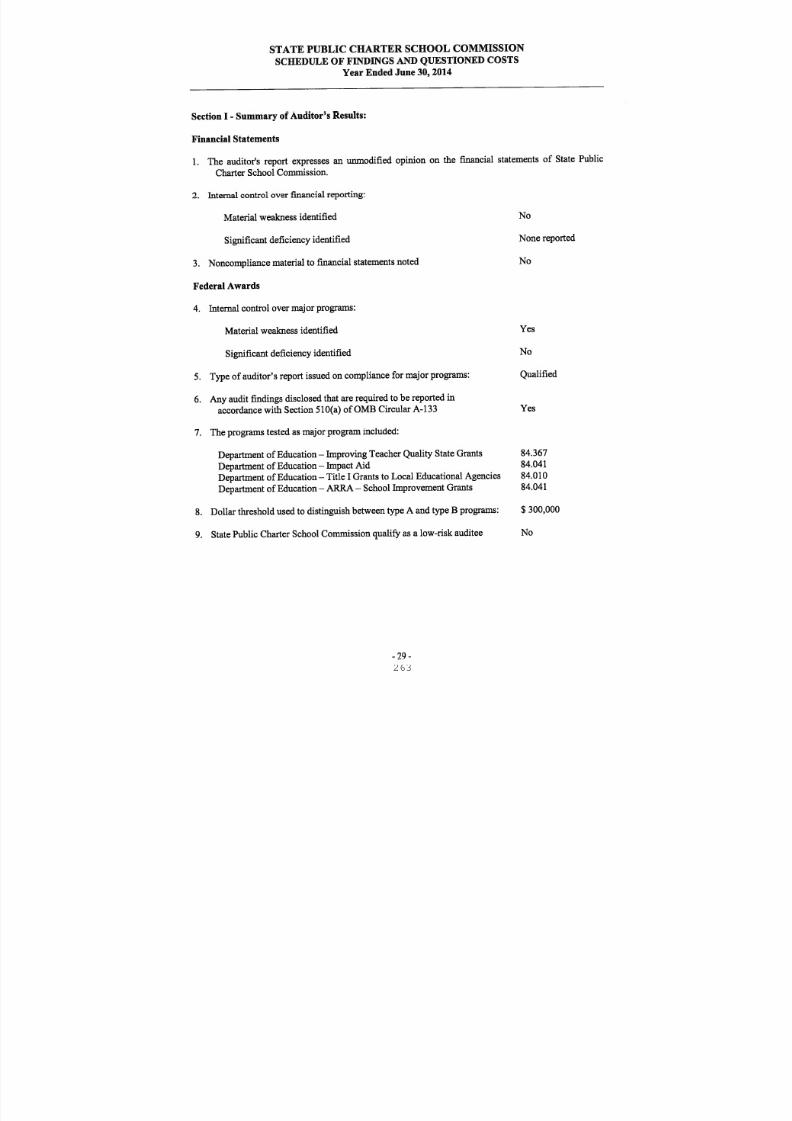
8/10/2019 Hawaii charter schools annual report
http://slidepdf.com/reader/full/hawaii-charter-schools-annual-report 266/268
8/10/2019 Hawaii charter schools annual report
http://slidepdf.com/reader/full/hawaii-charter-schools-annual-report 267/268
8/10/2019 Hawaii charter schools annual report
http://slidepdf.com/reader/full/hawaii-charter-schools-annual-report 268/268