Embed Size (px)
Citation preview
5-20
HAWAII COMMERCIAL BUILDING GUIDELINES FOR ENERGY EFFICIENCY ENERGY-EFFICIENT WINDOWS
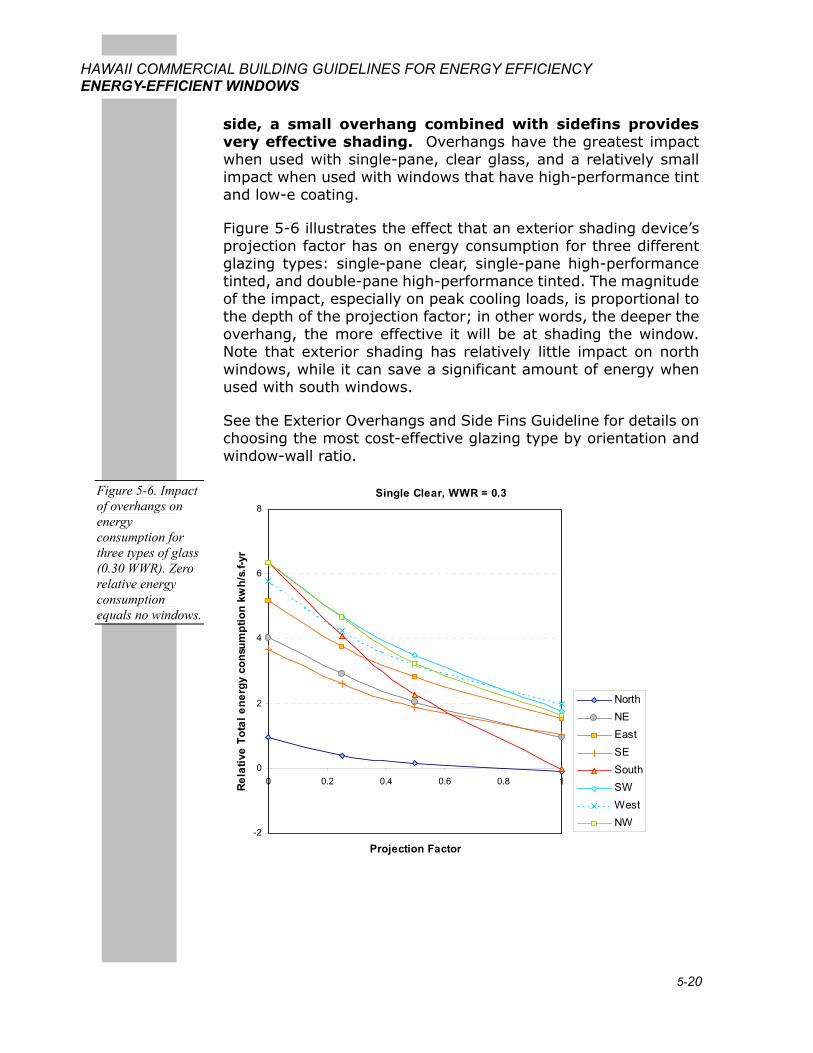
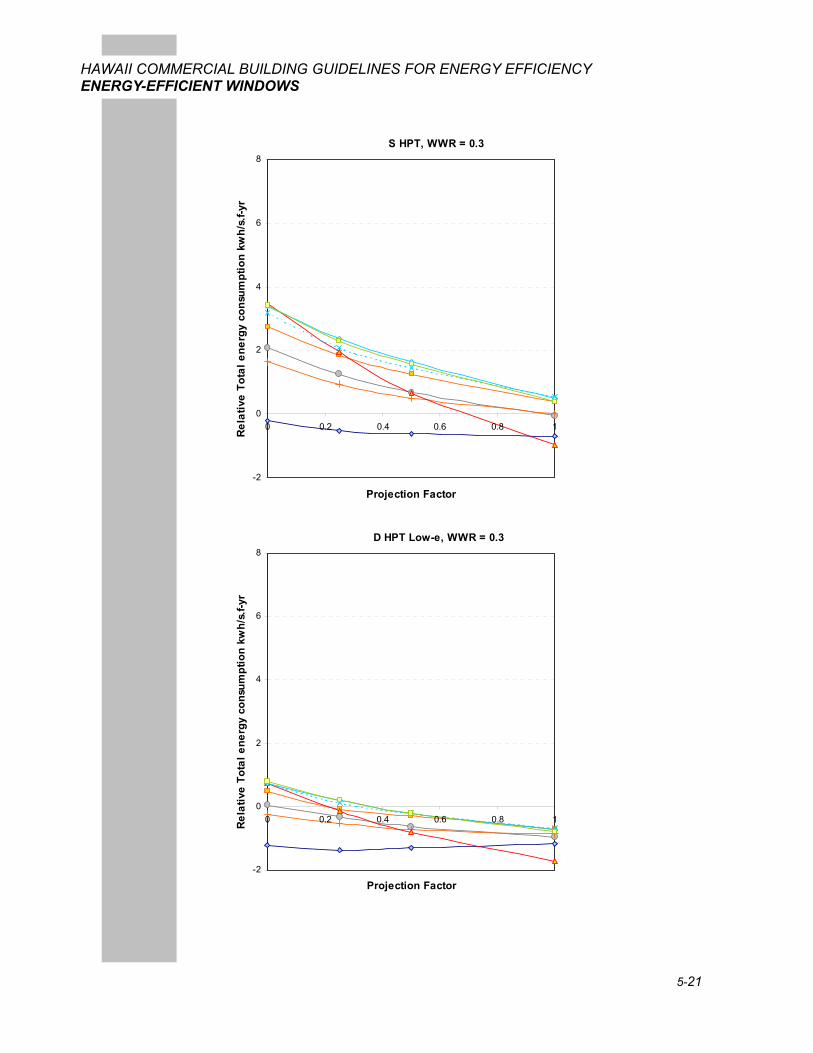
side, a small overhang combined with sidefins provides very effective shading. Overhangs have the greatest impact when used with single-pane, clear glass, and a relatively small impact when used with windows that have high-performance tint and low-e coating.
Figure 5-6 illustrates the effect that an exterior shading device’s projection factor has on energy consumption for three different glazing types: single-pane clear, single-pane high-performance tinted, and double-pane high-performance tinted. The magnitude of the impact, especially on peak cooling loads, is proportional to the depth of the projection factor; in other words, the deeper the overhang, the more effective it will be at shading the window. Note that exterior shading has relatively little impact on north windows, while it can save a significant amount of energy when used with south windows.
See the Exterior Overhangs and Side Fins Guideline for details on choosing the most cost-effective glazing type by orientation and window-wall ratio.
Single Clear, WWR = 0.3
-2
0
2
4
6
8
0 0.2 0.4 0.6 0.8 1
Projection Factor
Rel
ativ
e To
tal e
nerg
y co
nsum
ptio
n kw
h/s.
f-yr
NorthNEEastSESouthSWWestNW
Figure 5-6. Impact of overhangs on energy consumption for three types of glass (0.30 WWR). Zero relative energy consumption equals no windows.
5-21
HAWAII COMMERCIAL BUILDING GUIDELINES FOR ENERGY EFFICIENCY ENERGY-EFFICIENT WINDOWS
S HPT, WWR = 0.3
-2
0
2
4
6
8
0 0.2 0.4 0.6 0.8 1
Projection Factor
Rel
ativ
e To
tal e
nerg
y co
nsum
ptio
n kw
h/s.
f-yr
D HPT Low-e, WWR = 0.3
-2
0
2
4
6
8
0 0.2 0.4 0.6 0.8 1
Projection Factor
Rel
ativ
e To
tal e
nerg
y co
nsum
ptio
n kw
h/s.
f-yr
5-22
HAWAII COMMERCIAL BUILDING GUIDELINES FOR ENERGY EFFICIENCY ENERGY-EFFICIENT WINDOWS
Energy Impact of Interior Shading
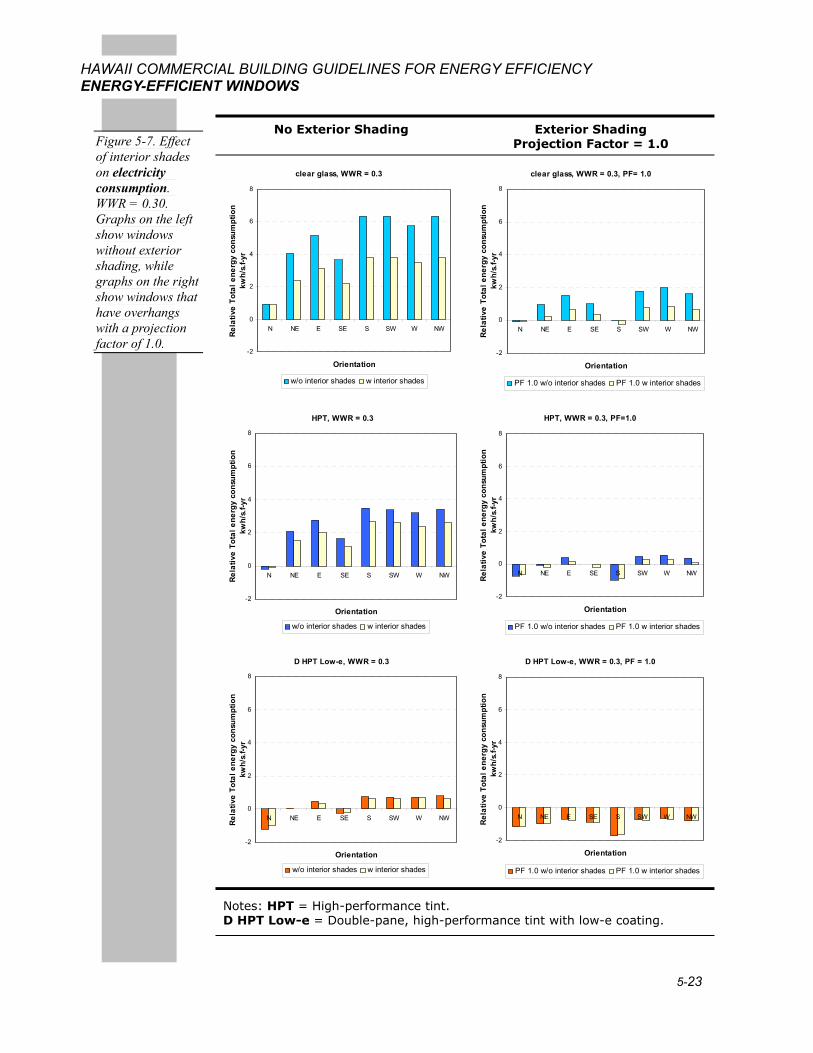
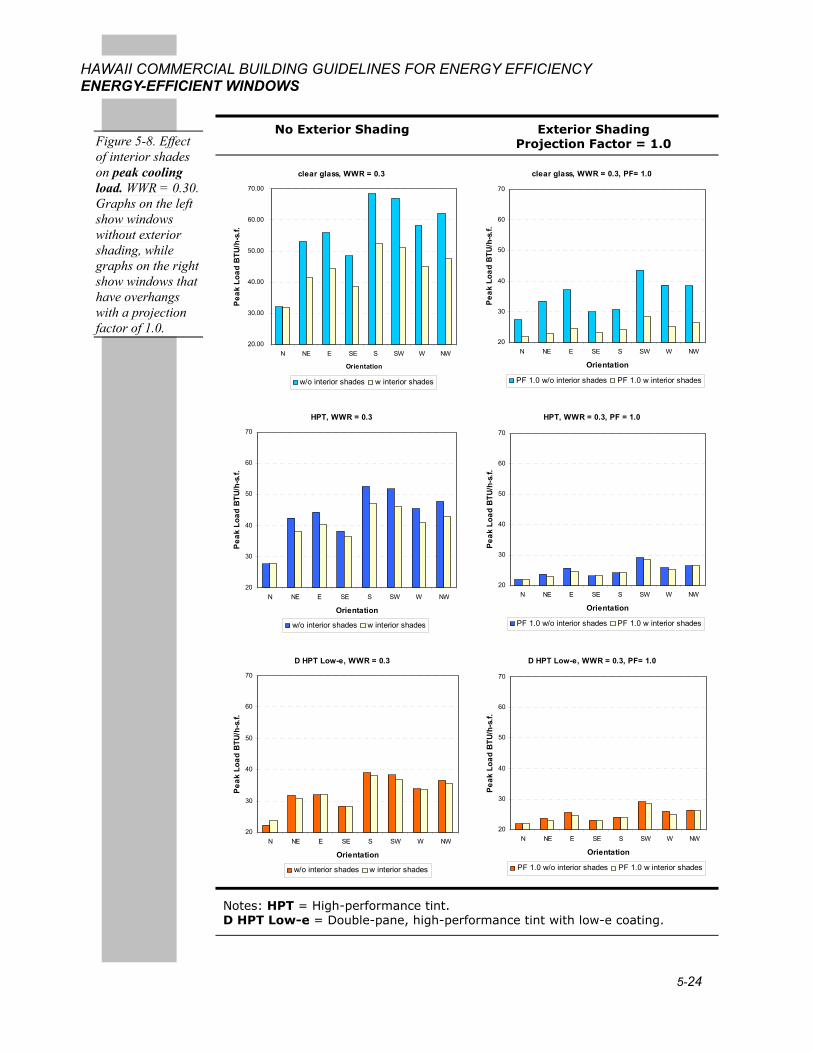
Interior shades reduce energy consumption and peak load by blocking excess solar heat gain, although exterior shades are much more effective at blocking heat gain. Interior shades are appropriate for glare control and for east or west orientations where exterior shades may not be able to provide complete protection from the sun. Interior shades generally aren’t necessary on a building’s north side. If windows have fairly deep overhangs, interior shades don’t provide much additional protection from solar heat gain.
When low SHGC glass is used, interior shades may not be useful. As with exterior shading devices, interior shades have the greatest impact on energy consumption when single-pane clear glazing is used and less of an impact when high-performance glazing is used. Figure 5-7 and Figure 5-8 illustrate the impacts of interior shades on relative electricity consumption and peak cooling load.
5-23
HAWAII COMMERCIAL BUILDING GUIDELINES FOR ENERGY EFFICIENCY ENERGY-EFFICIENT WINDOWS
No Exterior Shading Exterior Shading Projection Factor = 1.0
clear glass, WWR = 0.3
-2
0
2
4
6
8
N NE E SE S SW W NW
Orientation
Rela
tive
Tota
l ene
rgy
cons
umpt
ion
kwh/
s.f-y
r
w/o interior shades w interior shades
clear glass, WWR = 0.3, PF= 1.0
-2
0
2
4
6
8
N NE E SE S SW W NW
Orientation
Rela
tive
Tota
l ene
rgy
cons
umpt
ion
kwh/
s.f-y
r
PF 1.0 w/o interior shades PF 1.0 w interior shades
HPT, WWR = 0.3
-2
0
2
4
6
8
N NE E SE S SW W NW
Orientation
Rela
tive
Tota
l ene
rgy
cons
umpt
ion
kwh/
s.f-y
r
w/o interior shades w interior shades
HPT, WWR = 0.3, PF=1.0
-2
0
2
4
6
8
N NE E SE S SW W NW
Orientation
Rel
ativ
e To
tal e
nerg
y co
nsum
ptio
n kw
h/s.
f-yr
PF 1.0 w/o interior shades PF 1.0 w interior shades
D HPT Low-e, WWR = 0.3
-2
0
2
4
6
8
N NE E SE S SW W NW
Orientation
Rela
tive
Tota
l ene
rgy
cons
umpt
ion
kwh/
s.f-y
r
w/o interior shades w interior shades
D HPT Low-e, WWR = 0.3, PF = 1.0
-2
0
2
4
6
8
N NE E SE S SW W NW
Orientation
Rel
ativ
e To
tal e
nerg
y co
nsum
ptio
n kw
h/s.
f-yr
PF 1.0 w/o interior shades PF 1.0 w interior shades
Notes: HPT = High-performance tint. D HPT Low-e = Double-pane, high-performance tint with low-e coating.
Figure 5-7. Effect of interior shades on electricity consumption. WWR = 0.30. Graphs on the left show windows without exterior shading, while graphs on the right show windows that have overhangs with a projection factor of 1.0.
5-24
HAWAII COMMERCIAL BUILDING GUIDELINES FOR ENERGY EFFICIENCY ENERGY-EFFICIENT WINDOWS
No Exterior Shading Exterior Shading Projection Factor = 1.0
clear glass, WWR = 0.3
20.00
30.00
40.00
50.00
60.00
70.00
N NE E SE S SW W NW
Orientation
Pea
k Lo
ad B
TU/h
-s.f.
w/o interior shades w interior shades
clear glass, WWR = 0.3, PF= 1.0
20
30
40
50
60
70
N NE E SE S SW W NW
Orientation
Peak
Loa
d B
TU/h
-s.f.
PF 1.0 w/o interior shades PF 1.0 w interior shades
HPT, WWR = 0.3
20
30
40
50
60
70
N NE E SE S SW W NW
Orientation
Pea
k Lo
ad B
TU/h
-s.f.
w/o interior shades w interior shades
HPT, WWR = 0.3, PF = 1.0
20
30
40
50
60
70
N NE E SE S SW W NW
Orientation
Peak
Loa
d BT
U/h
-s.f.
PF 1.0 w/o interior shades PF 1.0 w interior shades
D HPT Low-e, WWR = 0.3
20
30
40
50
60
70
N NE E SE S SW W NW
Orientation
Peak
Loa
d B
TU/h
-s.f.
w/o interior shades w interior shades
D HPT Low-e, WWR = 0.3, PF= 1.0
20
30
40
50
60
70
N NE E SE S SW W NW
Orientation
Peak
Loa
d BT
U/h-
s.f.
PF 1.0 w/o interior shades PF 1.0 w interior shades
Notes: HPT = High-performance tint. D HPT Low-e = Double-pane, high-performance tint with low-e coating.
Figure 5-8. Effect of interior shades on peak cooling load. WWR = 0.30. Graphs on the left show windows without exterior shading, while graphs on the right show windows that have overhangs with a projection factor of 1.0.
5-25
HAWAII COMMERCIAL BUILDING GUIDELINES FOR ENERGY EFFICIENCY ENERGY-EFFICIENT WINDOWS
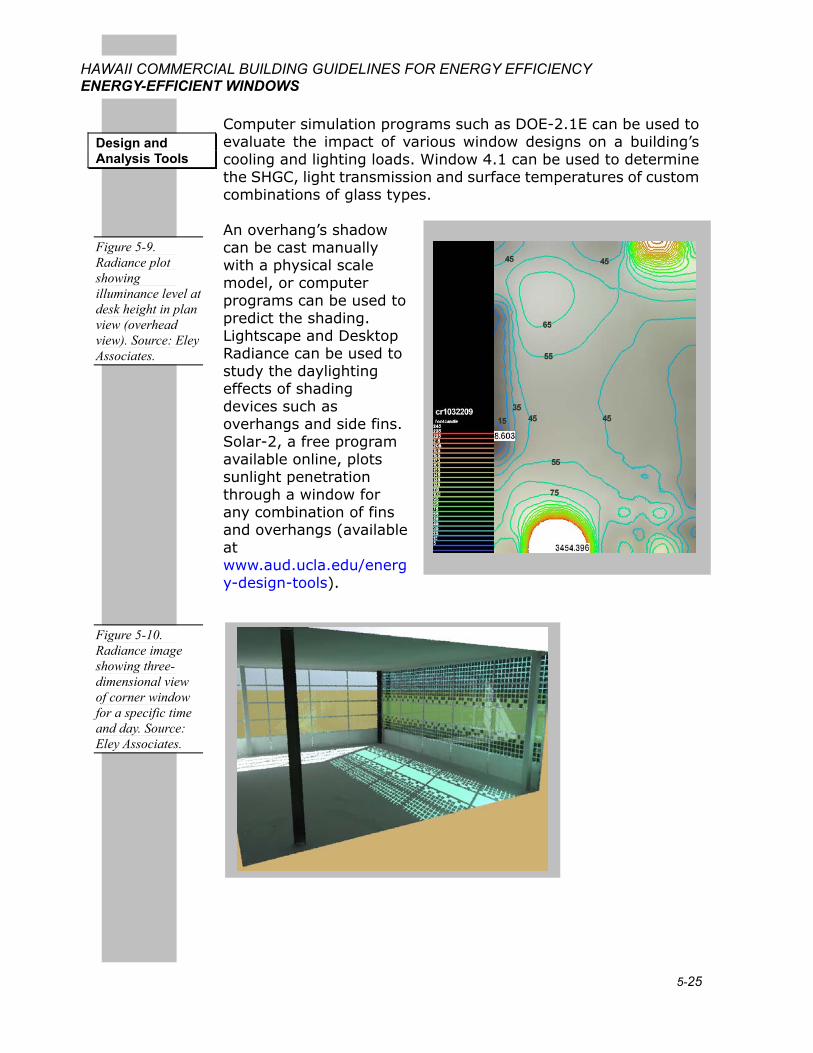
Computer simulation programs such as DOE-2.1E can be used to evaluate the impact of various window designs on a building’s cooling and lighting loads. Window 4.1 can be used to determine the SHGC, light transmission and surface temperatures of custom combinations of glass types. An overhang’s shadow can be cast manually with a physical scale model, or computer programs can be used to predict the shading. Lightscape and Desktop Radiance can be used to study the daylighting effects of shading devices such as overhangs and side fins. Solar-2, a free program available online, plots sunlight penetration through a window for any combination of fins and overhangs (available at www.aud.ucla.edu/energy-design-tools).
Design and Analysis Tools
Figure 5-9. Radiance plot showing illuminance level at desk height in plan view (overhead view). Source: Eley Associates.
Figure 5-10. Radiance image showing three-dimensional view of corner window for a specific time and day. Source: Eley Associates.
5-26
HAWAII COMMERCIAL BUILDING GUIDELINES FOR ENERGY EFFICIENCY ENERGY-EFFICIENT WINDOWS
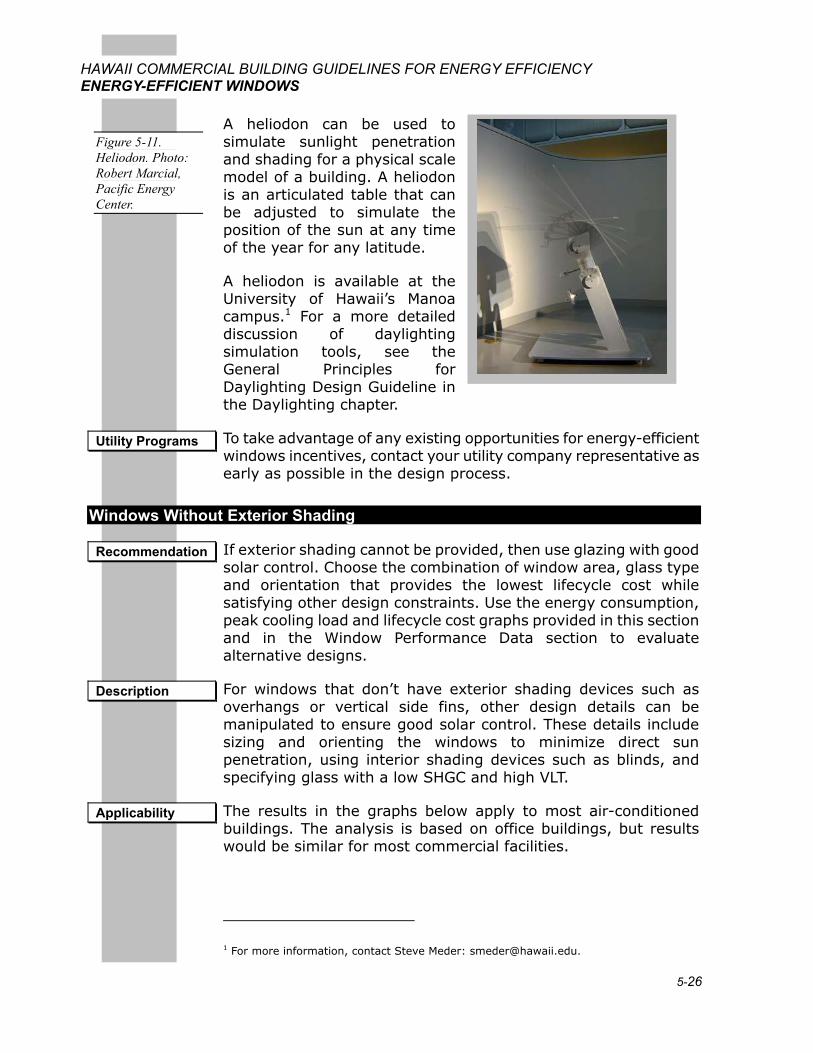
A heliodon can be used to simulate sunlight penetration and shading for a physical scale model of a building. A heliodon is an articulated table that can be adjusted to simulate the position of the sun at any time of the year for any latitude.
A heliodon is available at the University of Hawaii’s Manoa campus.1 For a more detailed discussion of daylighting simulation tools, see the General Principles for Daylighting Design Guideline in the Daylighting chapter.
To take advantage of any existing opportunities for energy-efficient windows incentives, contact your utility company representative as early as possible in the design process.
Windows Without Exterior Shading
If exterior shading cannot be provided, then use glazing with good solar control. Choose the combination of window area, glass type and orientation that provides the lowest lifecycle cost while satisfying other design constraints. Use the energy consumption, peak cooling load and lifecycle cost graphs provided in this section and in the Window Performance Data section to evaluate alternative designs.
For windows that don’t have exterior shading devices such as overhangs or vertical side fins, other design details can be manipulated to ensure good solar control. These details include sizing and orienting the windows to minimize direct sun penetration, using interior shading devices such as blinds, and specifying glass with a low SHGC and high VLT.
The results in the graphs below apply to most air-conditioned buildings. The analysis is based on office buildings, but results would be similar for most commercial facilities.
1 For more information, contact Steve Meder: [email protected].
Figure 5-11. Heliodon. Photo: Robert Marcial, Pacific Energy Center.
Utility Programs
Recommendation
Description
Applicability
5-27
HAWAII COMMERCIAL BUILDING GUIDELINES FOR ENERGY EFFICIENCY ENERGY-EFFICIENT WINDOWS
The Hawaii Model Energy Code sets maximum heat gain limits for windows in new buildings (see the Codes and Standards section in the General Principles of Window Design Guideline).
See the General Principles of Window Design Guideline above for a description of the benefits of energy-efficient windows.
Clear glass is generally the least expensive type of glass; solar control options add some cost. Approximate incremental costs are listed in Table 5-1.
The lifecycle cost of window design options is described in the Design Details section below.
Refer to the Energy-efficient Windows Overview and the General Principles of Window Design Guideline above.
The following graphs show the energy consumption and lifecycle cost impacts of window design options.
While these graphs may not provide a simple answer to the question of how to optimize a window design, they can be used to evaluate the relative cost impacts of various options.
If the WWR for each orientation cannot be changed, consider choosing the appropriate glazing type based on the lowest lifecycle cost from the following graphs. On the other hand, if the glazing type cannot be changed, you can use the electricity consumption graphs to determine which WWR offers the lowest energy consumption.
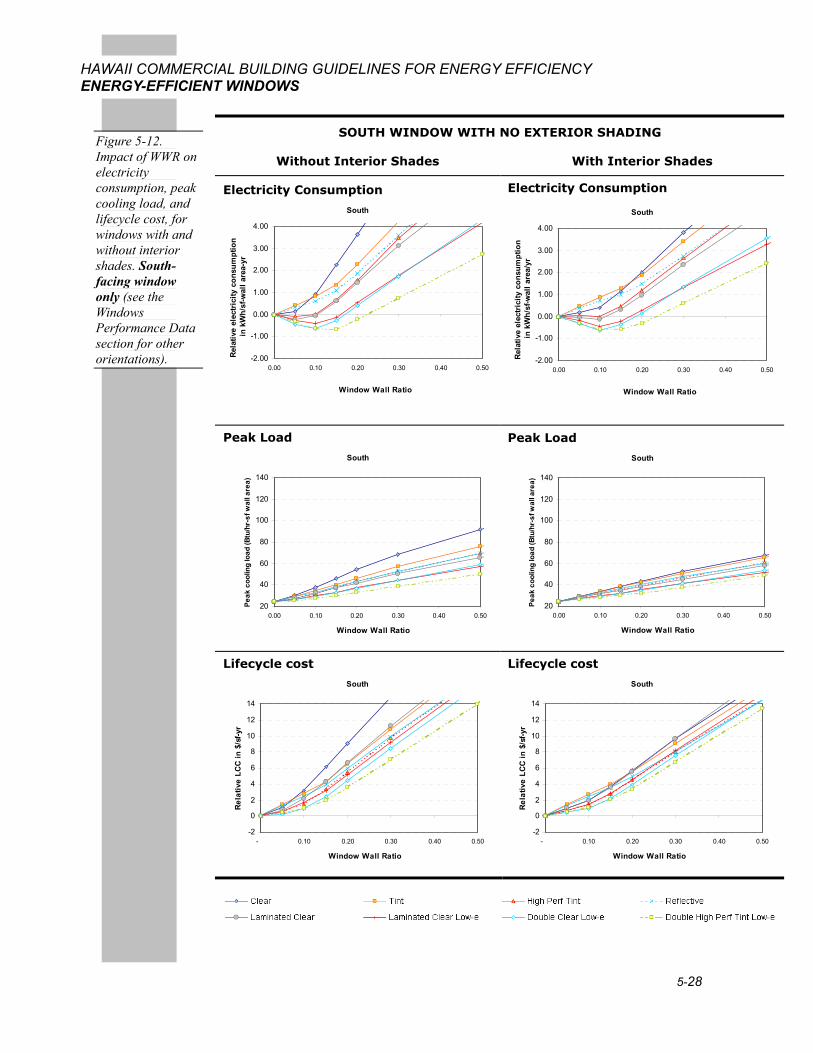
The window performance graphs shown in Figure 5-12 are for south-facing windows only. For other orientations, see the Windows Performance Data section.
Codes and Standards
Benefits
Costs
Cost Effectiveness
Integrated Design Implications
Design Details
5-28
HAWAII COMMERCIAL BUILDING GUIDELINES FOR ENERGY EFFICIENCY ENERGY-EFFICIENT WINDOWS
SOUTH WINDOW WITH NO EXTERIOR SHADING
Without Interior Shades With Interior Shades
Electricity Consumption
South
-2.00
-1.00
0.00
1.00
2.00
3.00
4.00
0.00 0.10 0.20 0.30 0.40 0.50
Window Wall Ratio
Rel
ativ
e el
ectr
icity
con
sum
ptio
n in
kW
h/sf
-wal
l are
a-yr
Electricity Consumption
South
-2.00
-1.00
0.00
1.00
2.00
3.00
4.00
0.00 0.10 0.20 0.30 0.40 0.50
Window Wall Ratio
Rel
ativ
e el
ectr
icity
con
sum
ptio
n in
kW
h/sf
-wal
l are
a/yr
Peak Load
South
20
40
60
80
100
120
140
0.00 0.10 0.20 0.30 0.40 0.50
Window Wall Ratio
Peak
coo
ling
load
(Btu
/hr-
sf w
all a
rea)
Peak Load
South
20
40
60
80
100
120
140
0.00 0.10 0.20 0.30 0.40 0.50
Window Wall Ratio
Peak
coo
ling
load
(Btu
/hr-
sf w
all a
rea)
Lifecycle cost
South
-2
0
2
4
6
8
10
12
14
- 0.10 0.20 0.30 0.40 0.50
Window Wall Ratio
Rel
ativ
e LC
C in
$/s
f-yr
Lifecycle cost
South
-2
0
2
4
6
8
10
12
14
- 0.10 0.20 0.30 0.40 0.50
Window Wall Ratio
Rel
ativ
e LC
C in
$/s
f-yr
Figure 5-12. Impact of WWR on electricity consumption, peak cooling load, and lifecycle cost, for windows with and without interior shades. South-facing window only (see the Windows Performance Data section for other orientations).
5-29
HAWAII COMMERCIAL BUILDING GUIDELINES FOR ENERGY EFFICIENCY ENERGY-EFFICIENT WINDOWS
Exterior Overhangs and Side Fins
Use exterior shading devices such as overhangs and side fins to block the direct penetration of sun into a space and to reduce heat gain.
Exterior shading is most effective on the south side of a building.
For south facades, horizontal overhangs work better than fins, while east and west facades can use horizontal overhangs, vertical fins or a combination of the two. On the north side, a small overhang combined with sidefins is very effective.
Exterior shading makes more of a difference when used with clear glass; it has much less of an impact when used with solar-control glazing.
Consider the daylighting impacts of exterior shading. Elements such as lightshelves can provide shading while also improving daylighting performance. See the Daylighting Guidelines for details on lightshelf design.
Horizontal overhangs, vertical side fins or a combination of these two devices are recommended on the outside of buildings to shade windows and block the direct penetration of sun into a space. Other exterior shading options such as louvers may also be used. While both exterior and interior shading devices help reduce glare and improve visual comfort for the people inside a building, exterior shading devices offer the additional advantage of stopping heat gain before it enters the building.
Exterior shading is recommended for windows on all commercial buildings. It will be most cost effective when used with low-rise buildings such as schools and offices, where roof overhangs can provide some or all of the shade. Exterior shading is typically more costly in high-rise buildings, but the same design recommendations apply.
The Hawaii Model Energy Code provides compliance credit for overhangs and side fins.
Exterior shading devices enhance visual comfort by reducing glare inside a space. If properly designed, they can significantly reduce the cooling load by blocking the sun’s heat from entering the building, while still allowing adequate daylight penetration.
Recommendation
Description
Applicability
Codes and Standards
Benefits
5-30
HAWAII COMMERCIAL BUILDING GUIDELINES FOR ENERGY EFFICIENCY ENERGY-EFFICIENT WINDOWS
With new construction, the use of solar shading devices often means that the size of the air conditioning system can be reduced. These equipment savings may offset the cost of the shading devices. In addition, fully shaded windows may mean that less expensive glazing can be used.
Exterior shading may or may not be cost effective when looked at strictly in terms of energy efficiency. However, there are many other benefits, such as improved visual and thermal comfort near windows and the corresponding increase in usable interior space.
Exterior shading, window orientation and area, and glazing type need to be carefully integrated with the building design to maximize daylight while reducing solar heat gain. For more information, refer to the Integrated Design Implications section of the General Principles of Window Design Guidelines above.
In Hawaii, exterior window shades are almost always desirable. However, it is difficult to shade east and west orientations from the early morning and late afternoon sun. In some cases, it may be preferable to use a combination of exterior and interior shades. If exterior shading devices are used with high-performance glazing, interior shades are usually not needed. Interior shades are more effective with glazing types that have a relatively high SHGC.
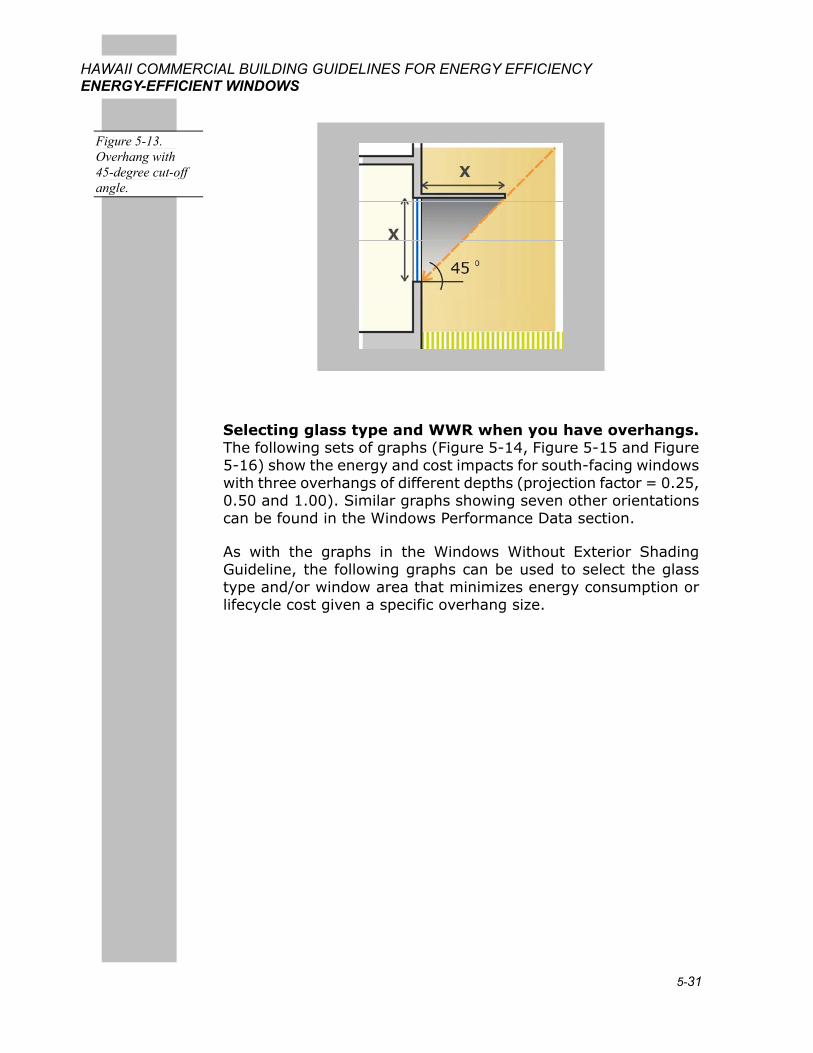
Cut-off angle. The cut-off angle should be designed to minimize or completely eliminate direct solar penetration. The cut-off angle is the angle formed by a straight line from the edge of the overhang to the bottom of the window (or the inner edge of the next lower overhang in the case of multiple overhangs) and the horizontal plane. In the case of side fins, it is the angle formed by the straight line connecting the outer edge of the fin to the opposite edge of the window (or the inner edge of the next fin in the case of multiple fins) and the normal to the window.
Costs
Cost Effectiveness
Integrated Design Implications
Design Details
5-31
HAWAII COMMERCIAL BUILDING GUIDELINES FOR ENERGY EFFICIENCY ENERGY-EFFICIENT WINDOWS
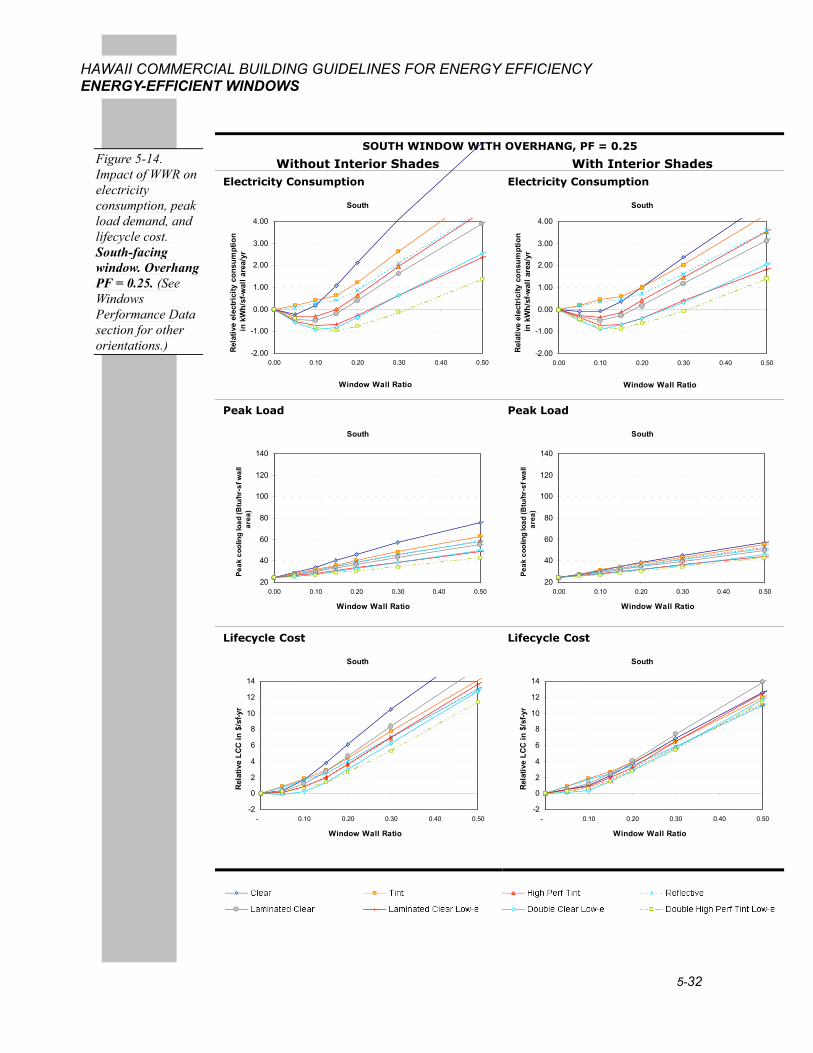
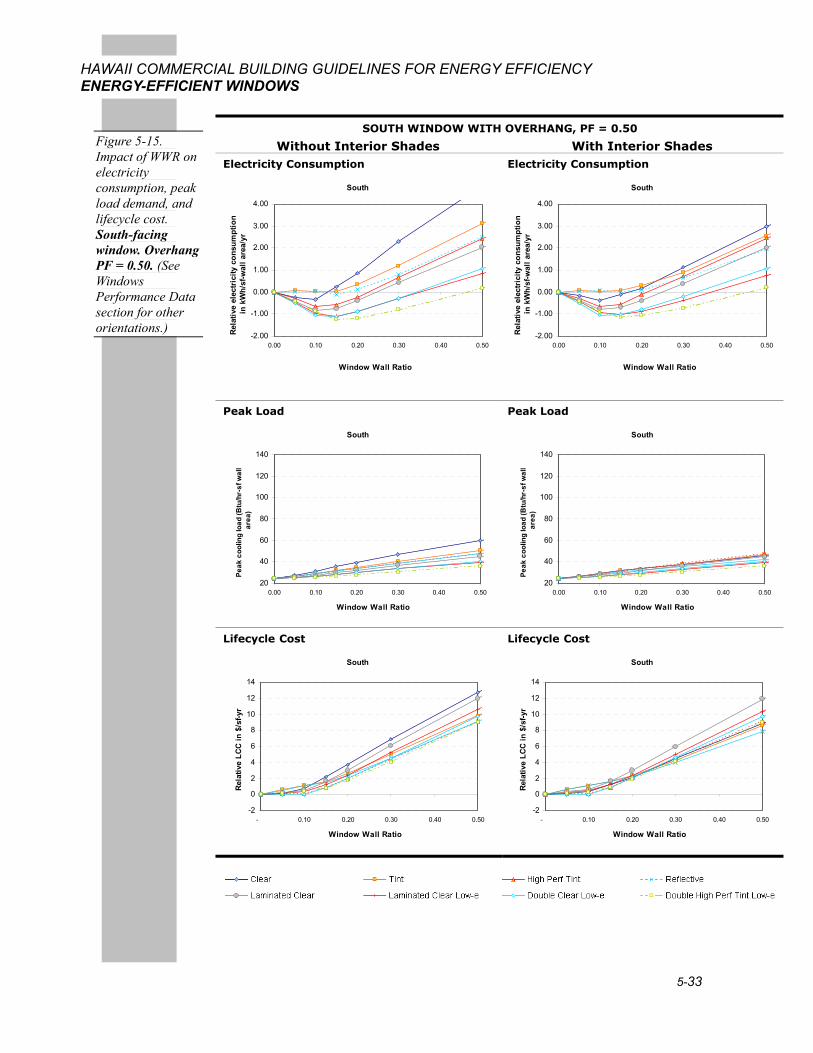
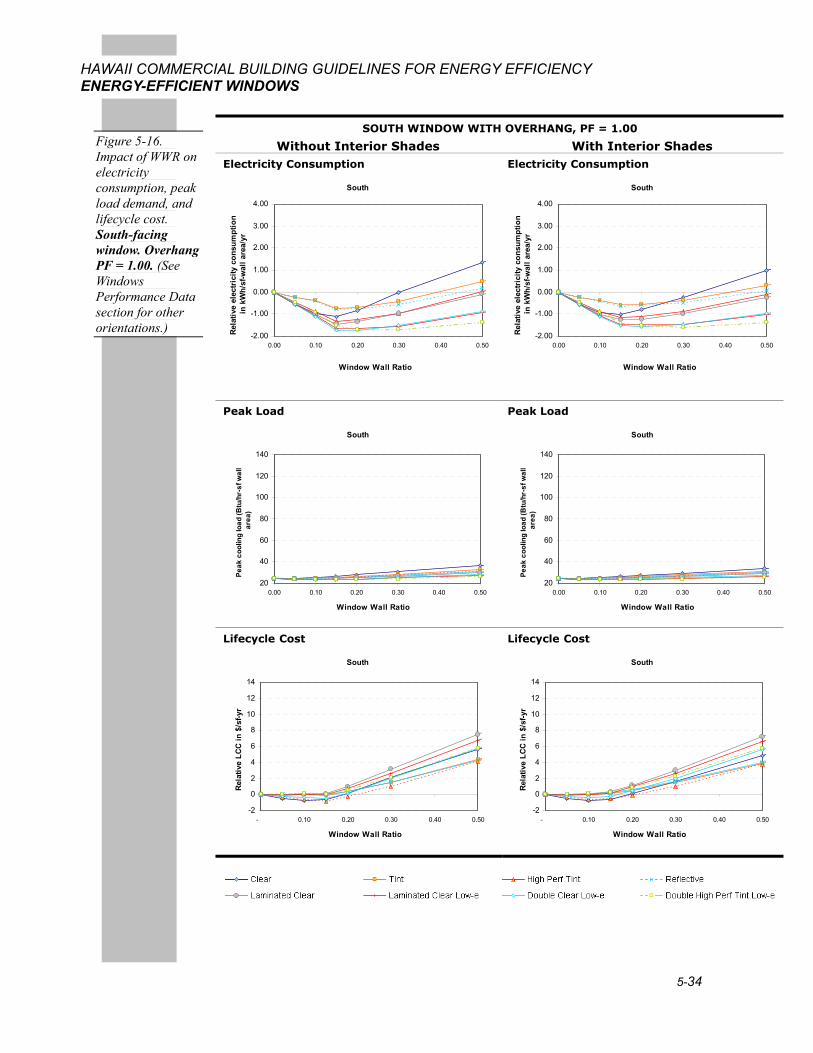
Selecting glass type and WWR when you have overhangs. The following sets of graphs (Figure 5-14, Figure 5-15 and Figure 5-16) show the energy and cost impacts for south-facing windows with three overhangs of different depths (projection factor = 0.25, 0.50 and 1.00). Similar graphs showing seven other orientations can be found in the Windows Performance Data section.
As with the graphs in the Windows Without Exterior Shading Guideline, the following graphs can be used to select the glass type and/or window area that minimizes energy consumption or lifecycle cost given a specific overhang size.
Figure 5-13. Overhang with 45-degree cut-off angle.
5-32
HAWAII COMMERCIAL BUILDING GUIDELINES FOR ENERGY EFFICIENCY ENERGY-EFFICIENT WINDOWS
SOUTH WINDOW WITH OVERHANG, PF = 0.25
Without Interior Shades With Interior Shades Electricity Consumption
South
-2.00
-1.00
0.00
1.00
2.00
3.00
4.00
0.00 0.10 0.20 0.30 0.40 0.50
Window Wall Ratio
Rel
ativ
e el
ectr
icity
con
sum
ptio
n in
kW
h/sf
-wal
l are
a/yr
Electricity Consumption
South
-2.00
-1.00
0.00
1.00
2.00
3.00
4.00
0.00 0.10 0.20 0.30 0.40 0.50
Window Wall Ratio
Rel
ativ
e el
ectr
icity
con
sum
ptio
n in
kW
h/sf
-wal
l are
a/yr
Peak Load
South
20
40
60
80
100
120
140
0.00 0.10 0.20 0.30 0.40 0.50
Window Wall Ratio
Peak
coo
ling
load
(Btu
/hr-
sf w
all
area
)
Peak Load
South
20
40
60
80
100
120
140
0.00 0.10 0.20 0.30 0.40 0.50
Window Wall Ratio
Peak
coo
ling
load
(Btu
/hr-
sf w
all
area
)
Lifecycle Cost
South
-2
0
2
4
6
8
10
12
14
- 0.10 0.20 0.30 0.40 0.50
Window Wall Ratio
Rel
ativ
e LC
C in
$/s
f-yr
Lifecycle Cost
South
-2
0
2
4
6
8
10
12
14
- 0.10 0.20 0.30 0.40 0.50
Window Wall Ratio
Rel
ativ
e LC
C in
$/s
f-yr
Figure 5-14. Impact of WWR on electricity consumption, peak load demand, and lifecycle cost. South-facing window. Overhang PF = 0.25. (See Windows Performance Data section for other orientations.)
5-33
HAWAII COMMERCIAL BUILDING GUIDELINES FOR ENERGY EFFICIENCY ENERGY-EFFICIENT WINDOWS
SOUTH WINDOW WITH OVERHANG, PF = 0.50
Without Interior Shades With Interior Shades Electricity Consumption
South
-2.00
-1.00
0.00
1.00
2.00
3.00
4.00
0.00 0.10 0.20 0.30 0.40 0.50
Window Wall Ratio
Rel
ativ
e el
ectr
icity
con
sum
ptio
n in
kW
h/sf
-wal
l are
a/yr
Electricity Consumption
South
-2.00
-1.00
0.00
1.00
2.00
3.00
4.00
0.00 0.10 0.20 0.30 0.40 0.50
Window Wall Ratio
Rel
ativ
e el
ectr
icity
con
sum
ptio
n in
kW
h/sf
-wal
l are
a/yr
Peak Load
South
20
40
60
80
100
120
140
0.00 0.10 0.20 0.30 0.40 0.50
Window Wall Ratio
Peak
coo
ling
load
(Btu
/hr-
sf w
all
area
)
Peak Load
South
20
40
60
80
100
120
140
0.00 0.10 0.20 0.30 0.40 0.50
Window Wall Ratio
Peak
coo
ling
load
(Btu
/hr-
sf w
all
area
)
Lifecycle Cost
South
-2
0
2
4
6
8
10
12
14
- 0.10 0.20 0.30 0.40 0.50
Window Wall Ratio
Rel
ativ
e LC
C in
$/s
f-yr
Lifecycle Cost
South
-2
0
2
4
6
8
10
12
14
- 0.10 0.20 0.30 0.40 0.50
Window Wall Ratio
Rel
ativ
e LC
C in
$/s
f-yr
Figure 5-15. Impact of WWR on electricity consumption, peak load demand, and lifecycle cost. South-facing window. Overhang PF = 0.50. (See Windows Performance Data section for other orientations.)
5-34
HAWAII COMMERCIAL BUILDING GUIDELINES FOR ENERGY EFFICIENCY ENERGY-EFFICIENT WINDOWS
SOUTH WINDOW WITH OVERHANG, PF = 1.00
Without Interior Shades With Interior Shades Electricity Consumption
South
-2.00
-1.00
0.00
1.00
2.00
3.00
4.00
0.00 0.10 0.20 0.30 0.40 0.50
Window Wall Ratio
Rel
ativ
e el
ectr
icity
con
sum
ptio
n in
kW
h/sf
-wal
l are
a/yr
Electricity Consumption
South
-2.00
-1.00
0.00
1.00
2.00
3.00
4.00
0.00 0.10 0.20 0.30 0.40 0.50
Window Wall Ratio
Rel
ativ
e el
ectr
icity
con
sum
ptio
n in
kW
h/sf
-wal
l are
a/yr
Peak Load
South
20
40
60
80
100
120
140
0.00 0.10 0.20 0.30 0.40 0.50
Window Wall Ratio
Peak
coo
ling
load
(Btu
/hr-
sf w
all
area
)
Peak Load
South
20
40
60
80
100
120
140
0.00 0.10 0.20 0.30 0.40 0.50
Window Wall Ratio
Peak
coo
ling
load
(Btu
/hr-
sf w
all
area
)
Lifecycle Cost
South
-2
0
2
4
6
8
10
12
14
- 0.10 0.20 0.30 0.40 0.50
Window Wall Ratio
Rel
ativ
e LC
C in
$/s
f-yr
Lifecycle Cost
South
-2
0
2
4
6
8
10
12
14
- 0.10 0.20 0.30 0.40 0.50
Window Wall Ratio
Rel
ativ
e LC
C in
$/s
f-yr
Figure 5-16. Impact of WWR on electricity consumption, peak load demand, and lifecycle cost. South-facing window. Overhang PF = 1.00. (See Windows Performance Data section for other orientations.)
5-35
HAWAII COMMERCIAL BUILDING GUIDELINES FOR ENERGY EFFICIENCY ENERGY-EFFICIENT WINDOWS
To reduce solar gain and eliminate glare, windows should ideally be shaded during all daylight hours in Hawaii. However, trying to accomplish this can lead to some impractical overhang and fin designs when the sun is low in the sky, particularly for east and west orientations during the early morning and late afternoon.
The overhang and fin designs recommended in this section have been developed to balance an ideal design with one that may be more practical. The following assumptions underlie these recommended designs:
Solar gain is less of a concern during late December and early January because daytime outdoor air temperatures are lower than at other times of the year. Exterior shade designs shown below provide only partial shade during this period.
Interior shades can be used to eliminate glare during winter when necessary.
Normal occupancy hours for a typical commercial building are assumed to be 8 AM to 5 PM. The exterior shade designs shown below will shade the windows completely during these hours for most of the year, except during the period described above.
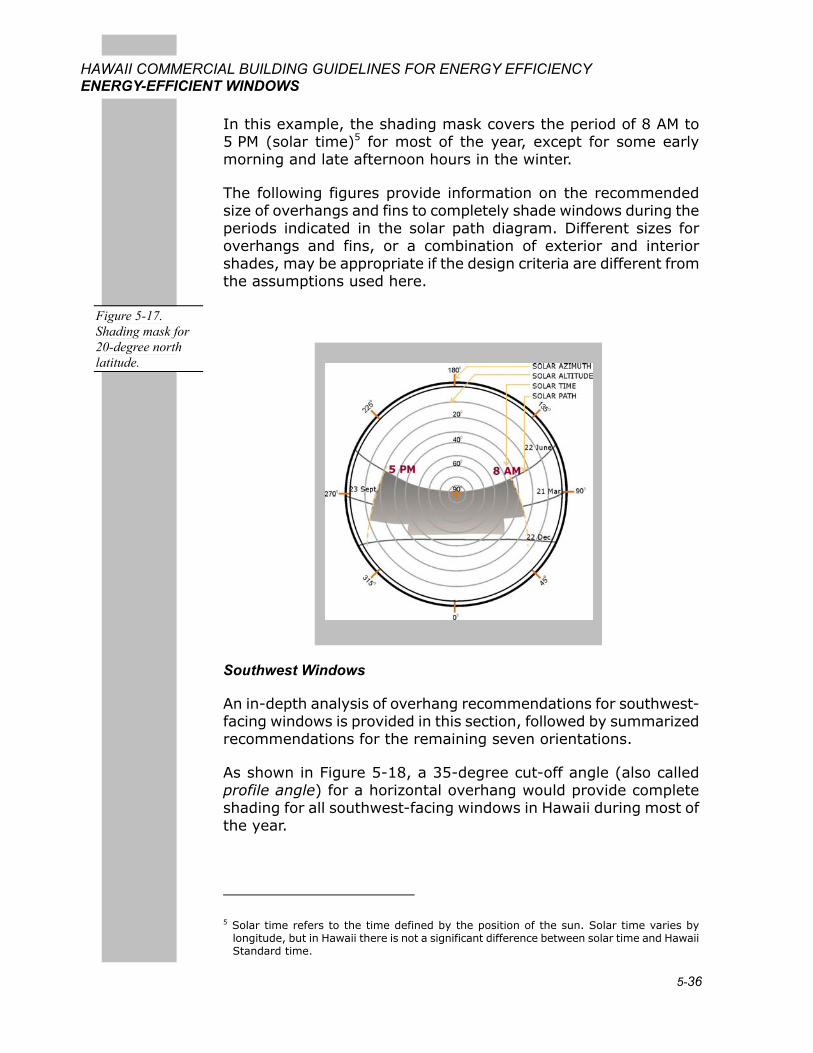
Figure 5-17 shows the solar path diagram for 20 deg N latitude (for Hawaii). The altitude2 and azimuth3 of the sun can be determined using this solar path diagram4. Figure 5-18 and Figure 5-19 show shading devices that were designed based on this solar path diagram. A shading mask, indicated by dark gray shading in the solar path diagrams, marks the time of year and time of day when shading is desired (based on the assumptions described above).
2 The angle between the rays of the sun and a horizontal plane.
3 The angle of the sun from true south.
4 A solar path diagram shows the position of the sun (solar altitude and solar azimuth) for all hours through the year for a specific latitude. Solar paths are typically available for latitudes at an increment of 4 degrees. Solar path diagrams can be used to design effective shading devices.
Sizing Overhangs and Fins for Ample Shading
5-36
HAWAII COMMERCIAL BUILDING GUIDELINES FOR ENERGY EFFICIENCY ENERGY-EFFICIENT WINDOWS
In this example, the shading mask covers the period of 8 AM to 5 PM (solar time)5 for most of the year, except for some early morning and late afternoon hours in the winter.
The following figures provide information on the recommended size of overhangs and fins to completely shade windows during the periods indicated in the solar path diagram. Different sizes for overhangs and fins, or a combination of exterior and interior shades, may be appropriate if the design criteria are different from the assumptions used here.
Southwest Windows
An in-depth analysis of overhang recommendations for southwest-facing windows is provided in this section, followed by summarized recommendations for the remaining seven orientations.
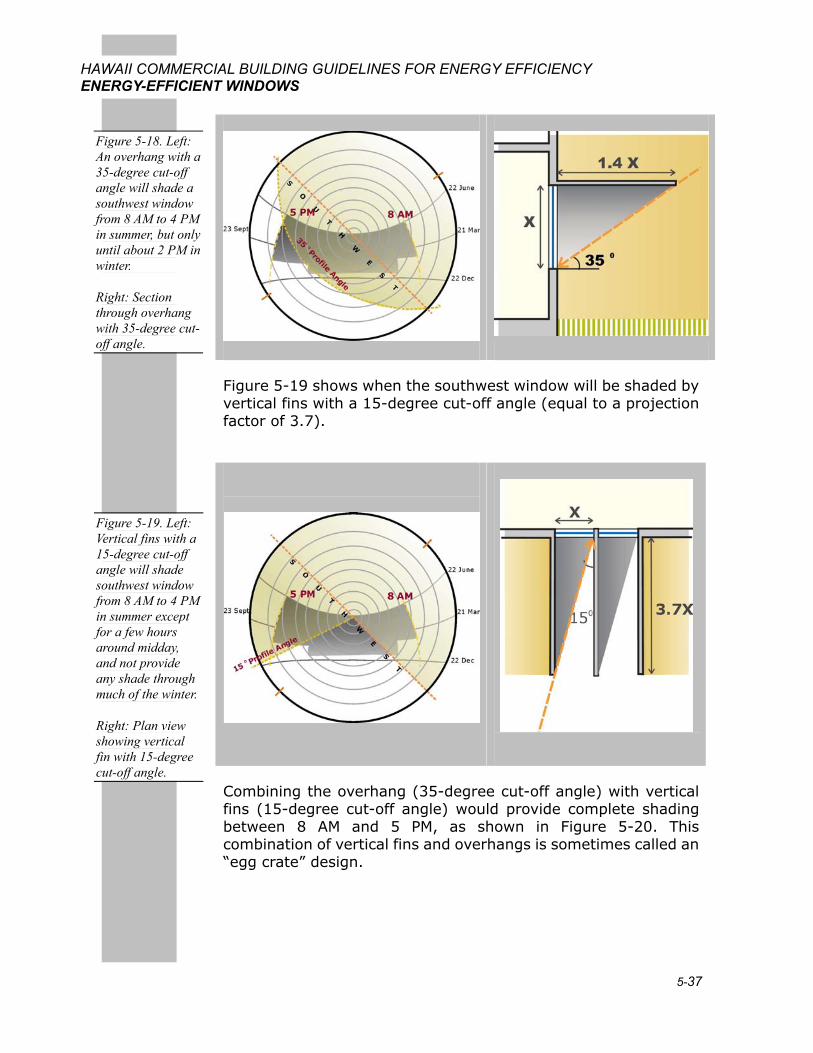
As shown in Figure 5-18, a 35-degree cut-off angle (also called profile angle) for a horizontal overhang would provide complete shading for all southwest-facing windows in Hawaii during most of the year.
5 Solar time refers to the time defined by the position of the sun. Solar time varies by longitude, but in Hawaii there is not a significant difference between solar time and Hawaii Standard time.
Figure 5-17. Shading mask for 20-degree north latitude.
5-37
HAWAII COMMERCIAL BUILDING GUIDELINES FOR ENERGY EFFICIENCY ENERGY-EFFICIENT WINDOWS
Figure 5-19 shows when the southwest window will be shaded by vertical fins with a 15-degree cut-off angle (equal to a projection factor of 3.7).
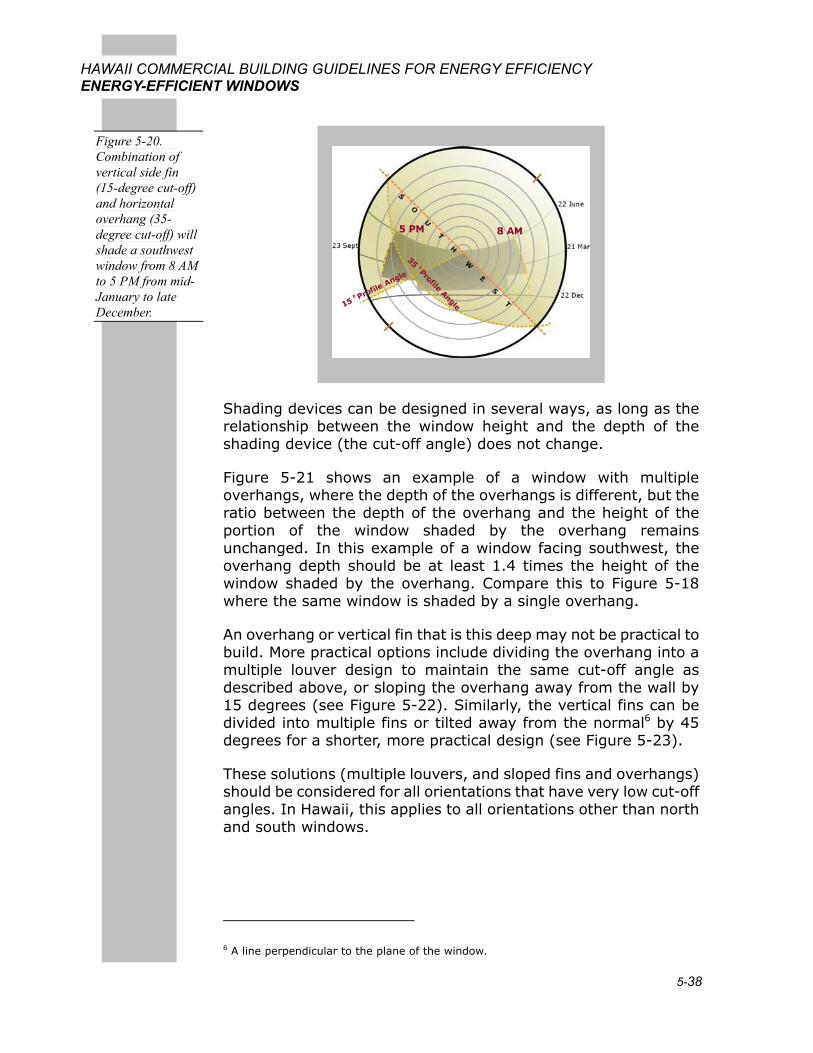
Combining the overhang (35-degree cut-off angle) with vertical fins (15-degree cut-off angle) would provide complete shading between 8 AM and 5 PM, as shown in Figure 5-20. This combination of vertical fins and overhangs is sometimes called an “egg crate” design.
Figure 5-18. Left: An overhang with a 35-degree cut-off angle will shade a southwest window from 8 AM to 4 PM in summer, but only until about 2 PM in winter.
Right: Section through overhang with 35-degree cut-off angle.
Figure 5-19. Left: Vertical fins with a 15-degree cut-off angle will shade southwest window from 8 AM to 4 PM in summer except for a few hours around midday, and not provide any shade through much of the winter.
Right: Plan view showing vertical fin with 15-degree cut-off angle.
5-38
HAWAII COMMERCIAL BUILDING GUIDELINES FOR ENERGY EFFICIENCY ENERGY-EFFICIENT WINDOWS
Shading devices can be designed in several ways, as long as the relationship between the window height and the depth of the shading device (the cut-off angle) does not change.
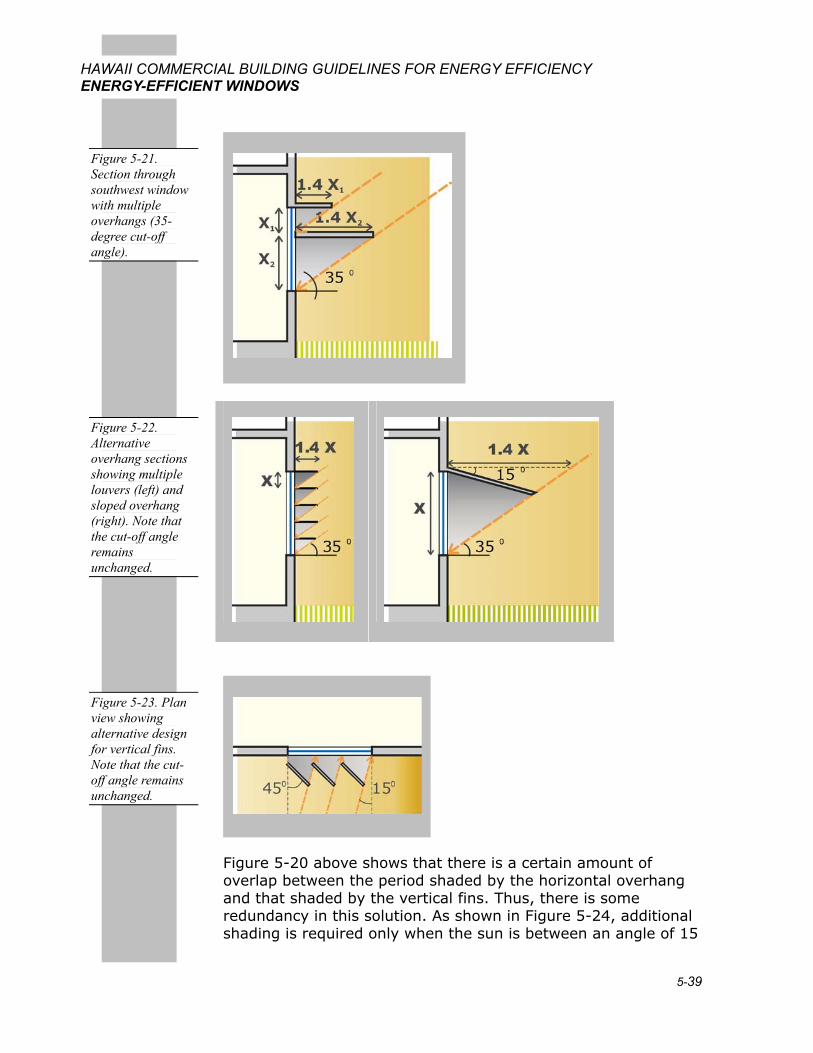
Figure 5-21 shows an example of a window with multiple overhangs, where the depth of the overhangs is different, but the ratio between the depth of the overhang and the height of the portion of the window shaded by the overhang remains unchanged. In this example of a window facing southwest, the overhang depth should be at least 1.4 times the height of the window shaded by the overhang. Compare this to Figure 5-18 where the same window is shaded by a single overhang.
An overhang or vertical fin that is this deep may not be practical to build. More practical options include dividing the overhang into a multiple louver design to maintain the same cut-off angle as described above, or sloping the overhang away from the wall by 15 degrees (see Figure 5-22). Similarly, the vertical fins can be divided into multiple fins or tilted away from the normal6 by 45 degrees for a shorter, more practical design (see Figure 5-23).
These solutions (multiple louvers, and sloped fins and overhangs) should be considered for all orientations that have very low cut-off angles. In Hawaii, this applies to all orientations other than north and south windows.
6 A line perpendicular to the plane of the window.
Figure 5-20. Combination of vertical side fin (15-degree cut-off) and horizontal overhang (35-degree cut-off) will shade a southwest window from 8 AM to 5 PM from mid-January to late December.
5-39
HAWAII COMMERCIAL BUILDING GUIDELINES FOR ENERGY EFFICIENCY ENERGY-EFFICIENT WINDOWS
Figure 5-20 above shows that there is a certain amount of overlap between the period shaded by the horizontal overhang and that shaded by the vertical fins. Thus, there is some redundancy in this solution. As shown in Figure 5-24, additional shading is required only when the sun is between an angle of 15
Figure 5-21. Section through southwest window with multiple overhangs (35-degree cut-off angle).
Figure 5-22. Alternative overhang sections showing multiple louvers (left) and sloped overhang (right). Note that the cut-off angle remains unchanged.
Figure 5-23. Plan view showing alternative design for vertical fins. Note that the cut-off angle remains unchanged.
5-40
HAWAII COMMERCIAL BUILDING GUIDELINES FOR ENERGY EFFICIENCY ENERGY-EFFICIENT WINDOWS
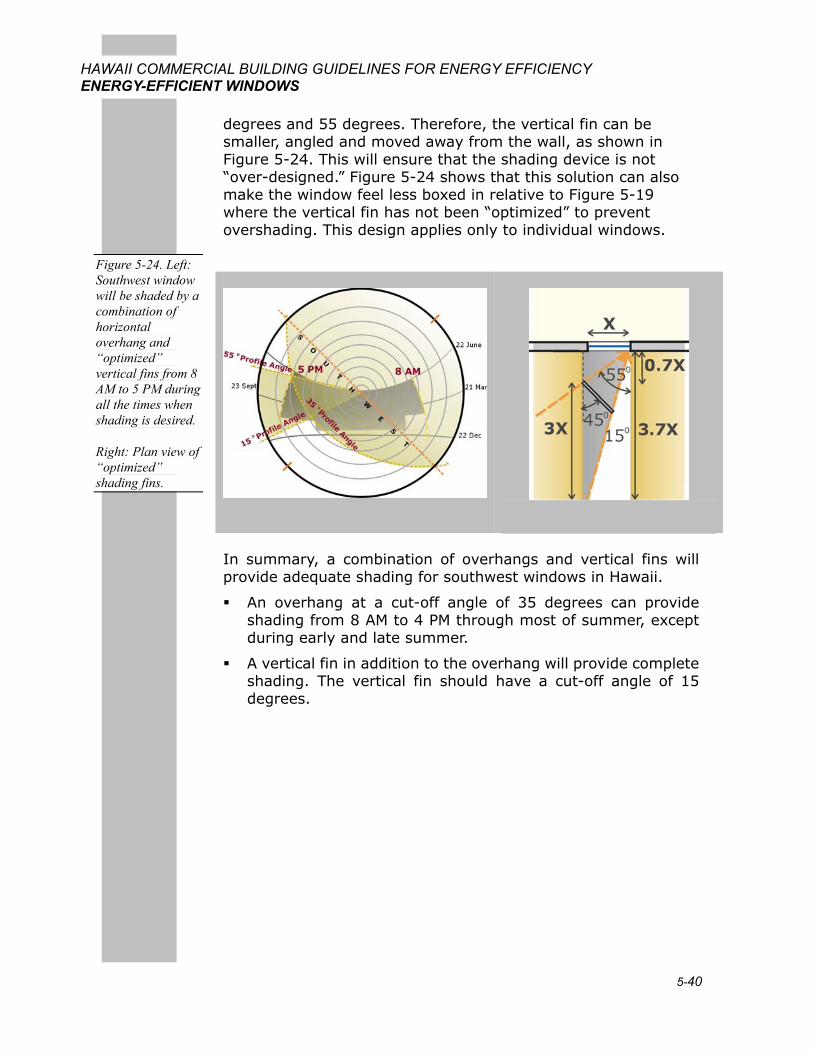
degrees and 55 degrees. Therefore, the vertical fin can be smaller, angled and moved away from the wall, as shown in Figure 5-24. This will ensure that the shading device is not “over-designed.” Figure 5-24 shows that this solution can also make the window feel less boxed in relative to Figure 5-19 where the vertical fin has not been “optimized” to prevent overshading. This design applies only to individual windows.
In summary, a combination of overhangs and vertical fins will provide adequate shading for southwest windows in Hawaii.
An overhang at a cut-off angle of 35 degrees can provide shading from 8 AM to 4 PM through most of summer, except during early and late summer.
A vertical fin in addition to the overhang will provide complete shading. The vertical fin should have a cut-off angle of 15 degrees.
Figure 5-24. Left: Southwest window will be shaded by a combination of horizontal overhang and “optimized” vertical fins from 8 AM to 5 PM during all the times when shading is desired.
Right: Plan view of “optimized” shading fins.
5-41
HAWAII COMMERCIAL BUILDING GUIDELINES FOR ENERGY EFFICIENCY ENERGY-EFFICIENT WINDOWS
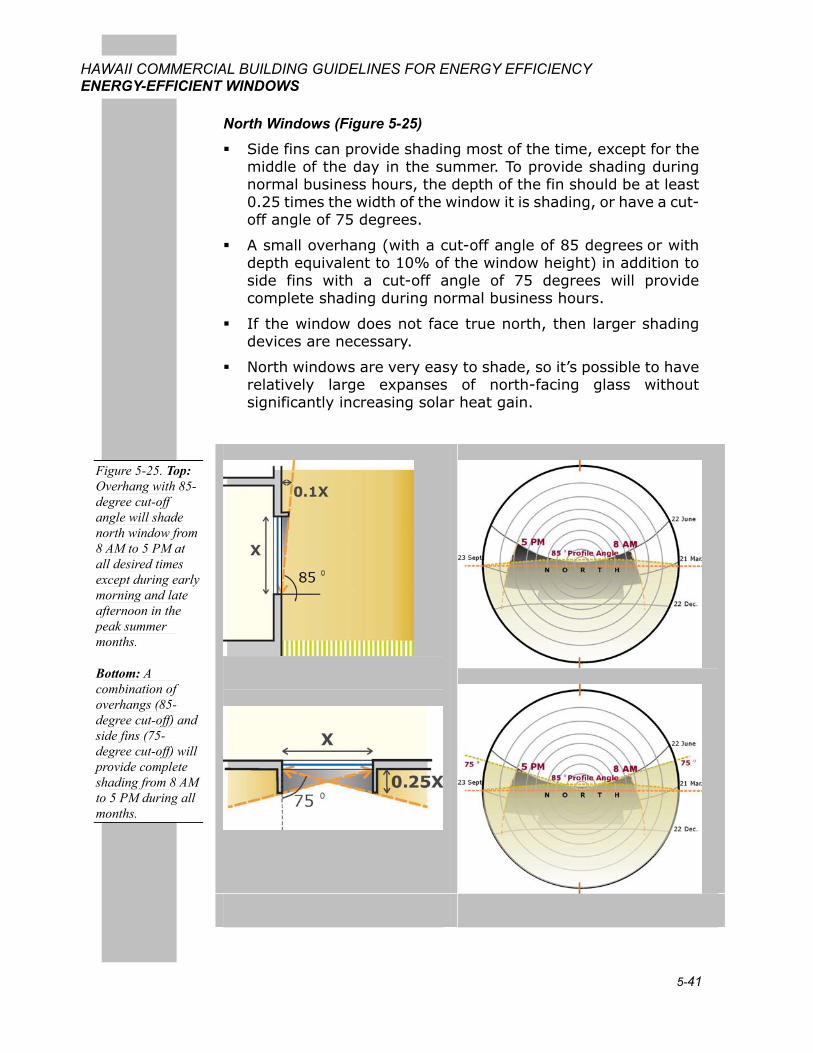
North Windows (Figure 5-25)
Side fins can provide shading most of the time, except for the middle of the day in the summer. To provide shading during normal business hours, the depth of the fin should be at least 0.25 times the width of the window it is shading, or have a cut-off angle of 75 degrees.
A small overhang (with a cut-off angle of 85 degrees or with depth equivalent to 10% of the window height) in addition to side fins with a cut-off angle of 75 degrees will provide complete shading during normal business hours.
If the window does not face true north, then larger shading devices are necessary.
North windows are very easy to shade, so it’s possible to have relatively large expanses of north-facing glass without significantly increasing solar heat gain.
Figure 5-25. Top: Overhang with 85-degree cut-off angle will shade north window from 8 AM to 5 PM at all desired times except during early morning and late afternoon in the peak summer months.
Bottom: A combination of overhangs (85-degree cut-off) and side fins (75-degree cut-off) will provide complete shading from 8 AM to 5 PM during all months.
5-42
HAWAII COMMERCIAL BUILDING GUIDELINES FOR ENERGY EFFICIENCY ENERGY-EFFICIENT WINDOWS
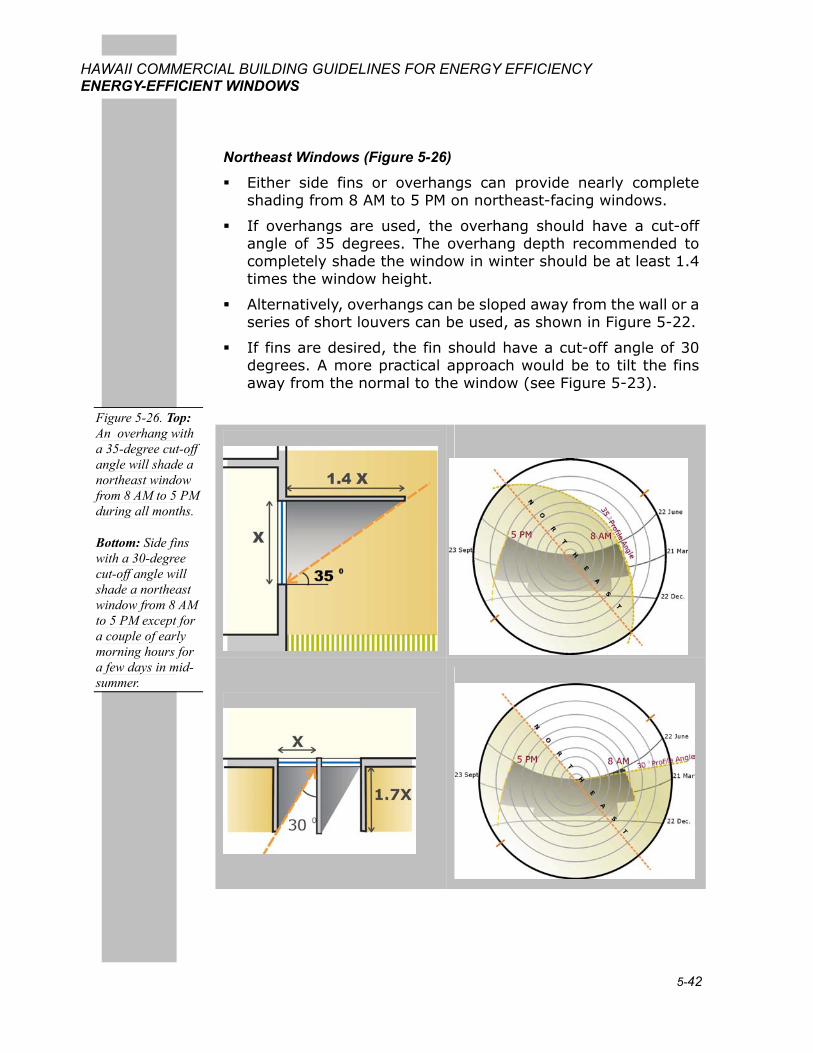
Northeast Windows (Figure 5-26)
Either side fins or overhangs can provide nearly complete shading from 8 AM to 5 PM on northeast-facing windows.
If overhangs are used, the overhang should have a cut-off angle of 35 degrees. The overhang depth recommended to completely shade the window in winter should be at least 1.4 times the window height.
Alternatively, overhangs can be sloped away from the wall or a series of short louvers can be used, as shown in Figure 5-22.
If fins are desired, the fin should have a cut-off angle of 30 degrees. A more practical approach would be to tilt the fins away from the normal to the window (see Figure 5-23).
Figure 5-26. Top: An overhang with a 35-degree cut-off angle will shade a northeast window from 8 AM to 5 PM during all months.
Bottom: Side fins with a 30-degree cut-off angle will shade a northeast window from 8 AM to 5 PM except for a couple of early morning hours for a few days in mid-summer.
5-43
HAWAII COMMERCIAL BUILDING GUIDELINES FOR ENERGY EFFICIENCY ENERGY-EFFICIENT WINDOWS
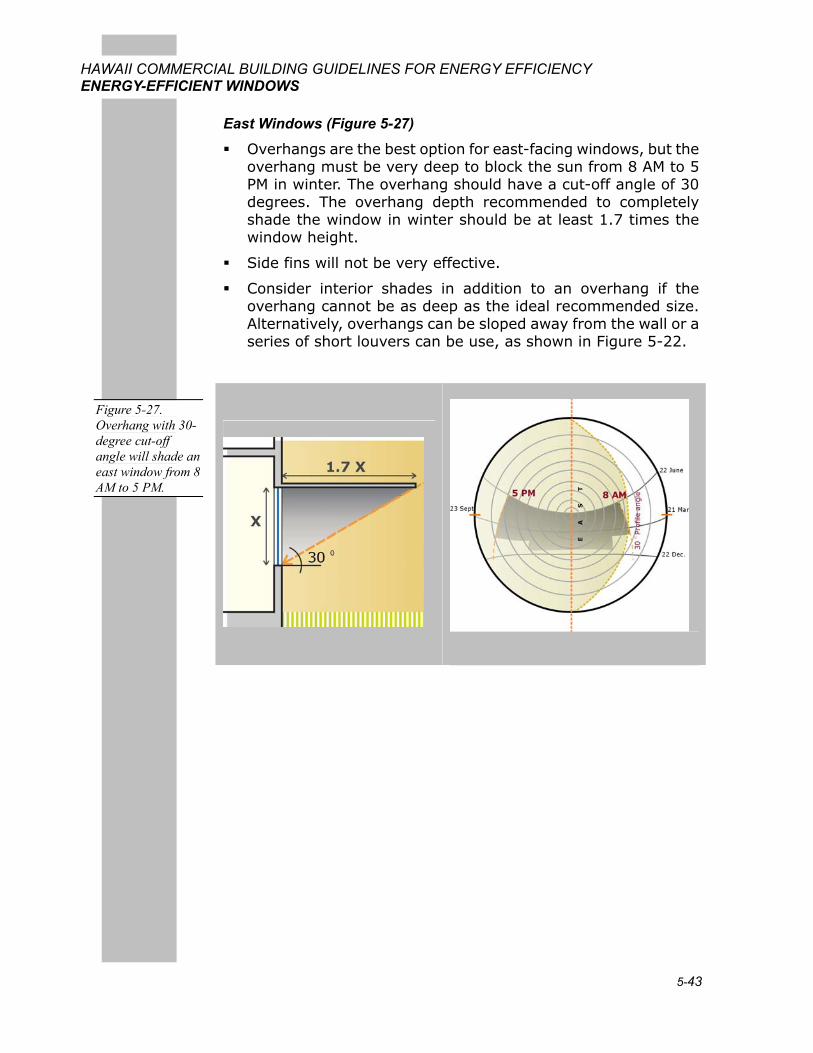
East Windows (Figure 5-27)
Overhangs are the best option for east-facing windows, but the overhang must be very deep to block the sun from 8 AM to 5 PM in winter. The overhang should have a cut-off angle of 30 degrees. The overhang depth recommended to completely shade the window in winter should be at least 1.7 times the window height.
Side fins will not be very effective.
Consider interior shades in addition to an overhang if the overhang cannot be as deep as the ideal recommended size. Alternatively, overhangs can be sloped away from the wall or a series of short louvers can be use, as shown in Figure 5-22.
Figure 5-27. Overhang with 30-degree cut-off angle will shade an east window from 8 AM to 5 PM.
5-44
HAWAII COMMERCIAL BUILDING GUIDELINES FOR ENERGY EFFICIENCY ENERGY-EFFICIENT WINDOWS
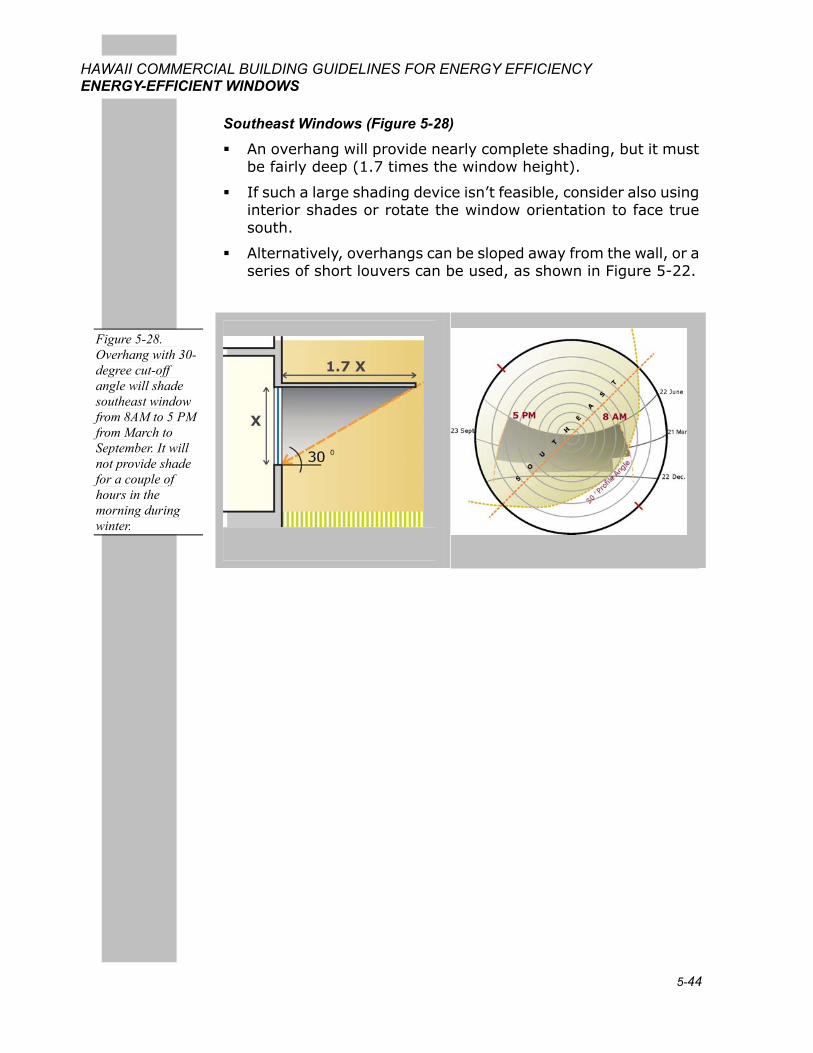
Southeast Windows (Figure 5-28)
An overhang will provide nearly complete shading, but it must be fairly deep (1.7 times the window height).
If such a large shading device isn’t feasible, consider also using interior shades or rotate the window orientation to face true south.
Alternatively, overhangs can be sloped away from the wall, or a series of short louvers can be used, as shown in Figure 5-22.
Figure 5-28. Overhang with 30-degree cut-off angle will shade southeast window from 8AM to 5 PM from March to September. It will not provide shade for a couple of hours in the morning during winter.
5-45
HAWAII COMMERCIAL BUILDING GUIDELINES FOR ENERGY EFFICIENCY ENERGY-EFFICIENT WINDOWS
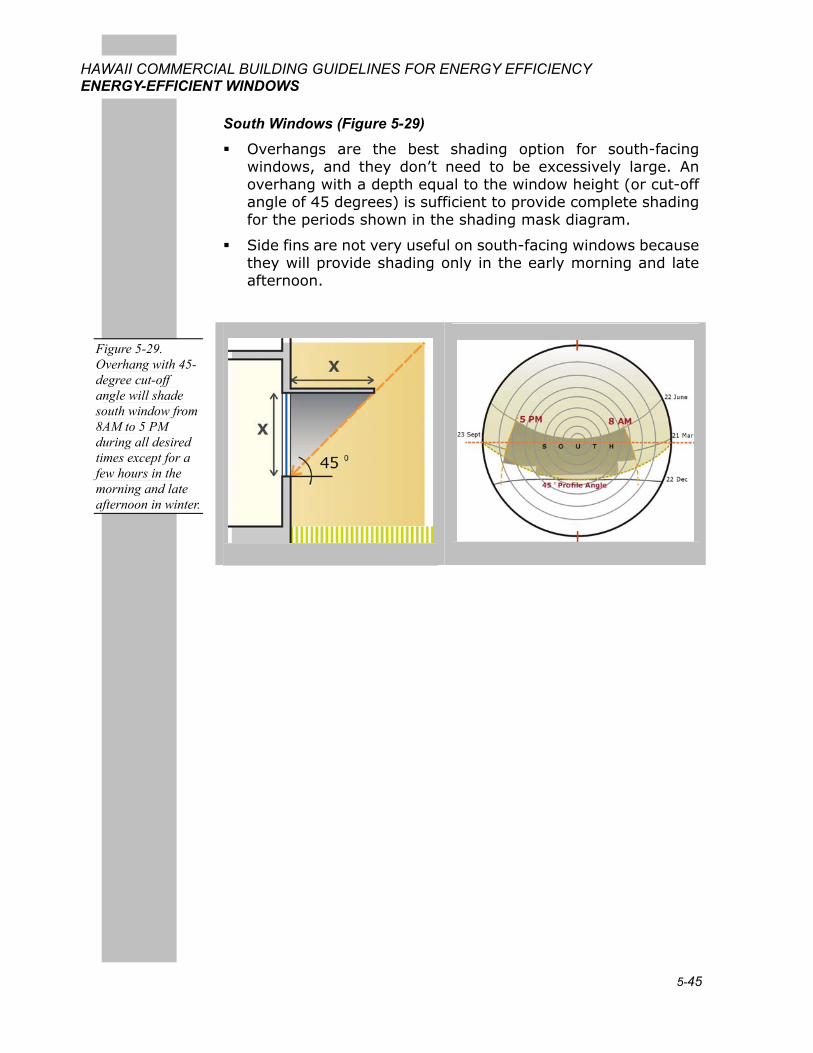
South Windows (Figure 5-29)
Overhangs are the best shading option for south-facing windows, and they don’t need to be excessively large. An overhang with a depth equal to the window height (or cut-off angle of 45 degrees) is sufficient to provide complete shading for the periods shown in the shading mask diagram.
Side fins are not very useful on south-facing windows because they will provide shading only in the early morning and late afternoon.
Figure 5-29. Overhang with 45-degree cut-off angle will shade south window from 8AM to 5 PM during all desired times except for a few hours in the morning and late afternoon in winter.
5-46
HAWAII COMMERCIAL BUILDING GUIDELINES FOR ENERGY EFFICIENCY ENERGY-EFFICIENT WINDOWS
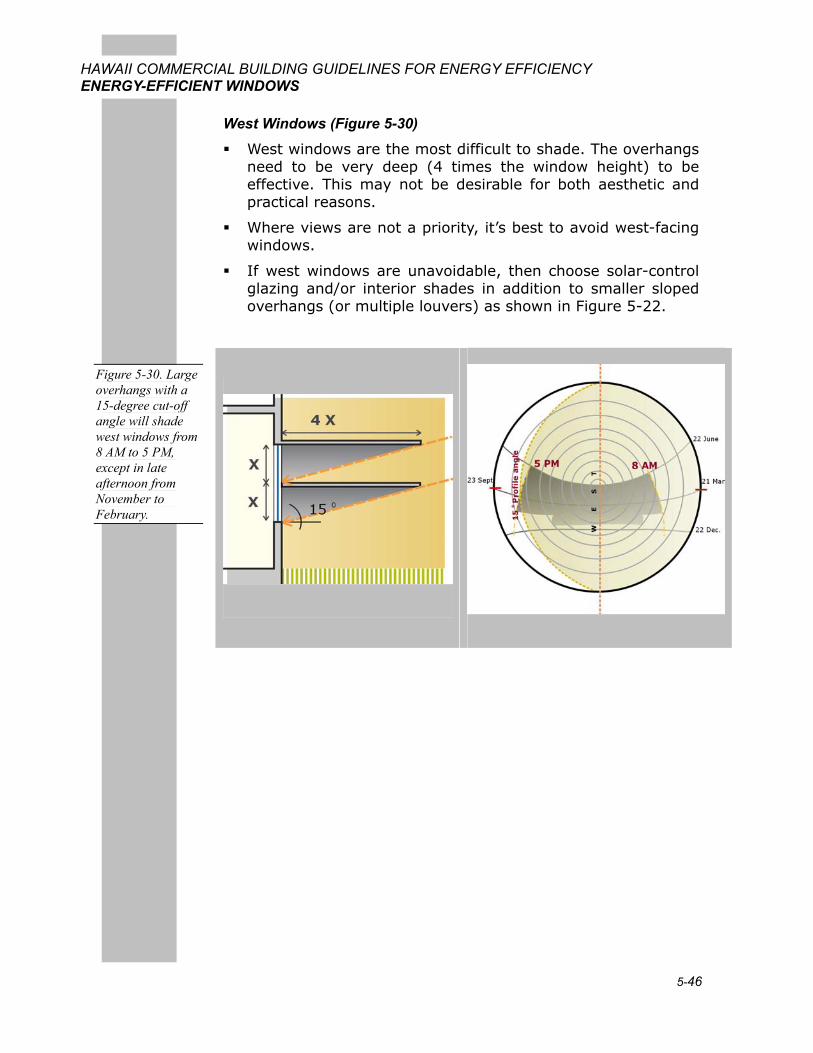
West Windows (Figure 5-30)
West windows are the most difficult to shade. The overhangs need to be very deep (4 times the window height) to be effective. This may not be desirable for both aesthetic and practical reasons.
Where views are not a priority, it’s best to avoid west-facing windows.
If west windows are unavoidable, then choose solar-control glazing and/or interior shades in addition to smaller sloped overhangs (or multiple louvers) as shown in Figure 5-22.
Figure 5-30. Large overhangs with a 15-degree cut-off angle will shade west windows from 8 AM to 5 PM, except in late afternoon from November to February.
5-47
HAWAII COMMERCIAL BUILDING GUIDELINES FOR ENERGY EFFICIENCY ENERGY-EFFICIENT WINDOWS
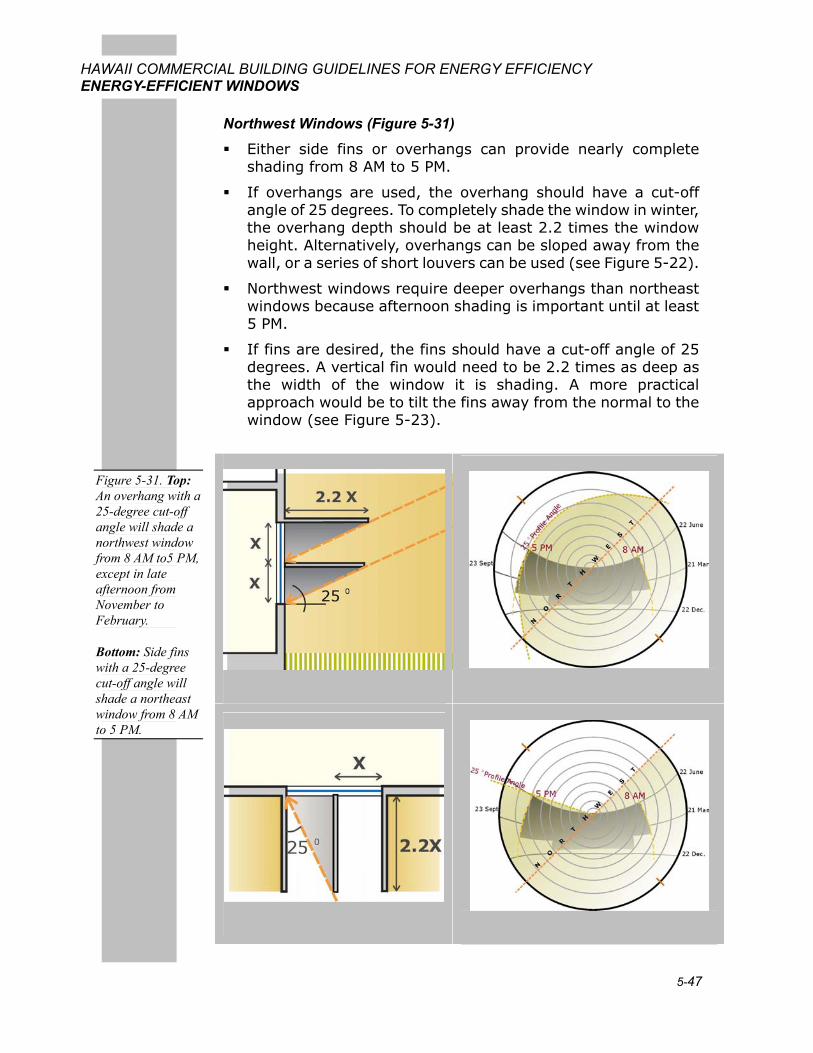
Northwest Windows (Figure 5-31)
Either side fins or overhangs can provide nearly complete shading from 8 AM to 5 PM.
If overhangs are used, the overhang should have a cut-off angle of 25 degrees. To completely shade the window in winter, the overhang depth should be at least 2.2 times the window height. Alternatively, overhangs can be sloped away from the wall, or a series of short louvers can be used (see Figure 5-22).
Northwest windows require deeper overhangs than northeast windows because afternoon shading is important until at least 5 PM.
If fins are desired, the fins should have a cut-off angle of 25 degrees. A vertical fin would need to be 2.2 times as deep as the width of the window it is shading. A more practical approach would be to tilt the fins away from the normal to the window (see Figure 5-23).
Figure 5-31. Top: An overhang with a 25-degree cut-off angle will shade a northwest window from 8 AM to5 PM, except in late afternoon from November to February.
Bottom: Side fins with a 25-degree cut-off angle will shade a northeast window from 8 AM to 5 PM.
5-48
HAWAII COMMERCIAL BUILDING GUIDELINES FOR ENERGY EFFICIENCY ENERGY-EFFICIENT WINDOWS
See the Design and Analysis Tools section in the General Principles of Window Design Guideline earlier in this chapter.
Some issues to consider with exterior shading devices are window cleaning access and the potential mess created by roosting birds.
Fixed window shading systems require little commissioning. However, design review is important to ensure that shading devices are correctly sized and oriented because mistakes are expensive to correct during or after construction. Operable shading systems must be tested to ensure that they work as intended.
To take advantage of any existing opportunities for energy-efficient windows incentives, contact your utility company representative as early as possible in the design process.
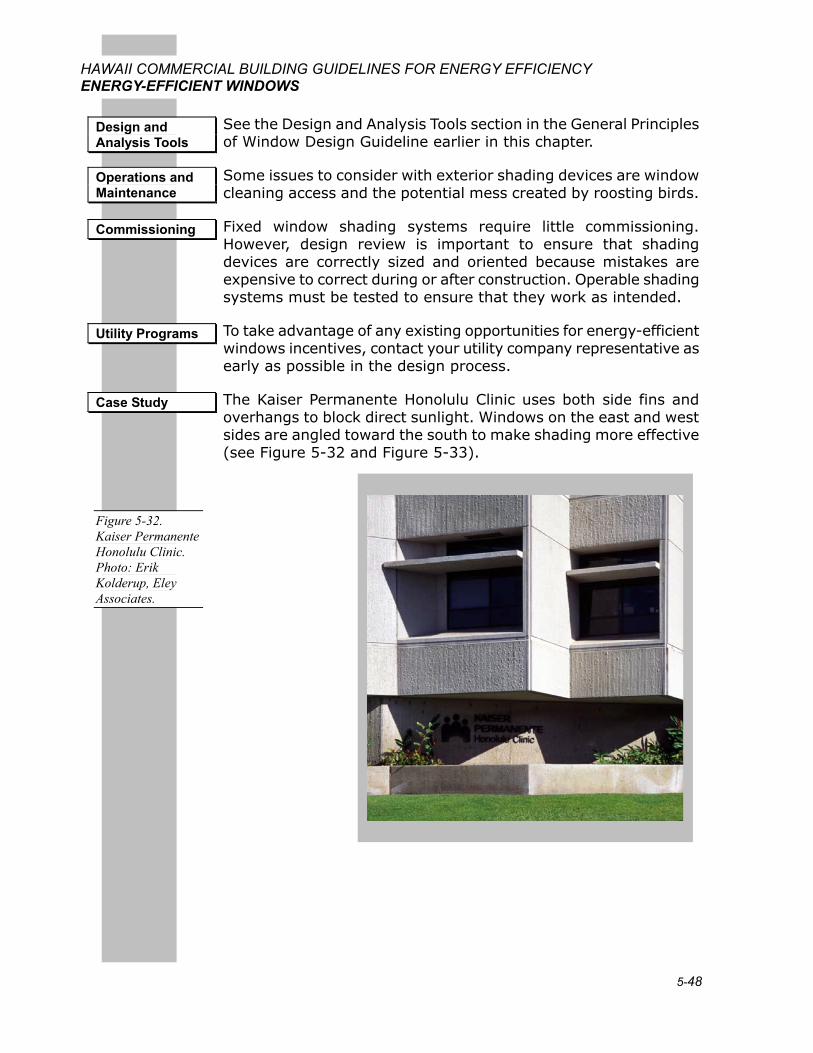
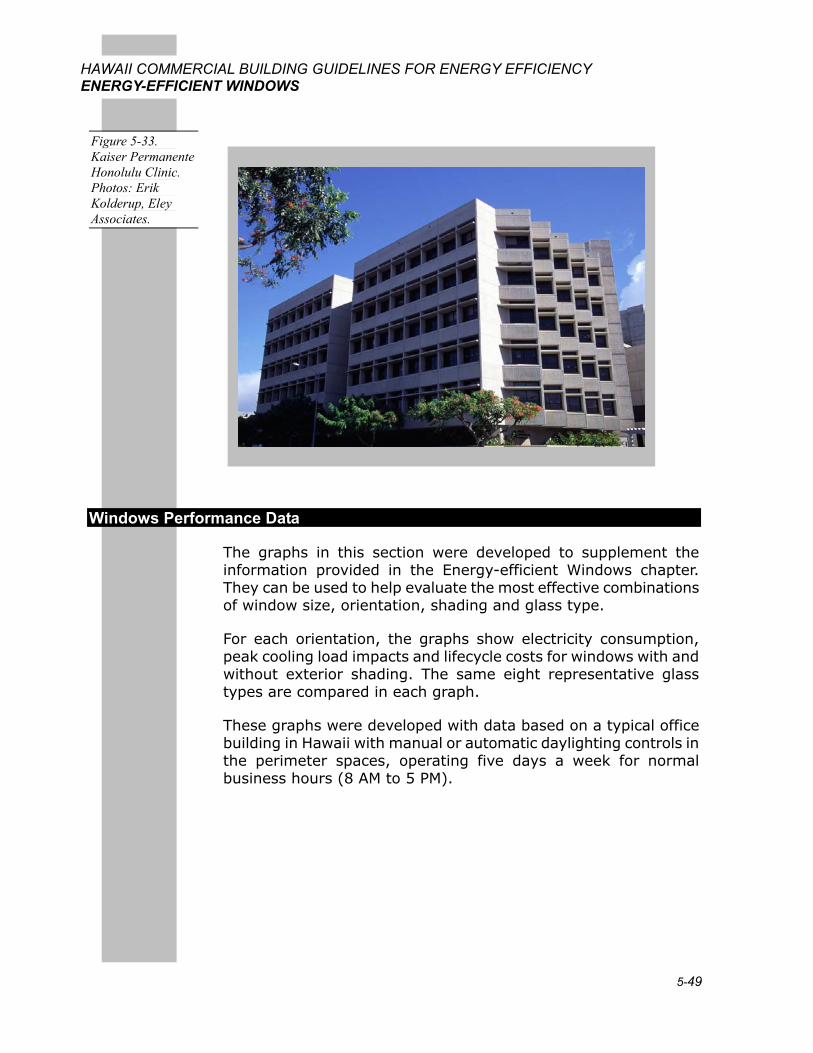
The Kaiser Permanente Honolulu Clinic uses both side fins and overhangs to block direct sunlight. Windows on the east and west sides are angled toward the south to make shading more effective (see Figure 5-32 and Figure 5-33).
Design and Analysis Tools
Operations and Maintenance
Commissioning
Utility Programs
Case Study
Figure 5-32. Kaiser Permanente Honolulu Clinic. Photo: Erik Kolderup, Eley Associates.
5-49
HAWAII COMMERCIAL BUILDING GUIDELINES FOR ENERGY EFFICIENCY ENERGY-EFFICIENT WINDOWS
Windows Performance Data
The graphs in this section were developed to supplement the information provided in the Energy-efficient Windows chapter. They can be used to help evaluate the most effective combinations of window size, orientation, shading and glass type.
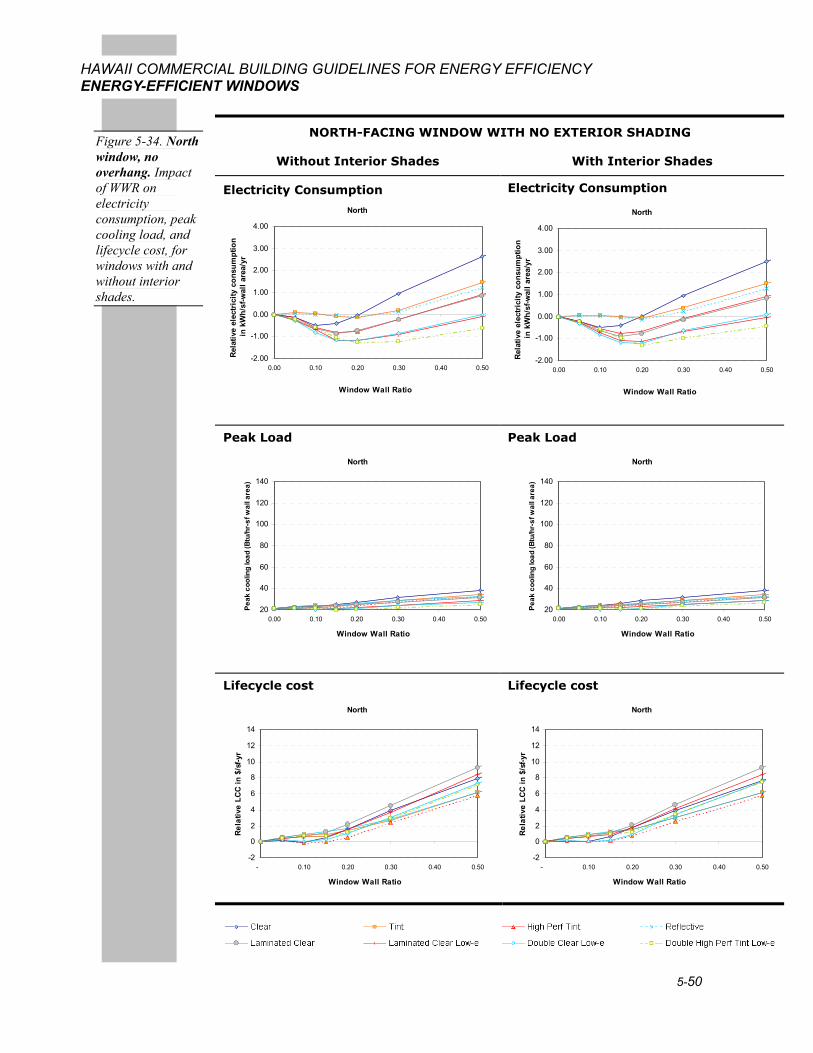
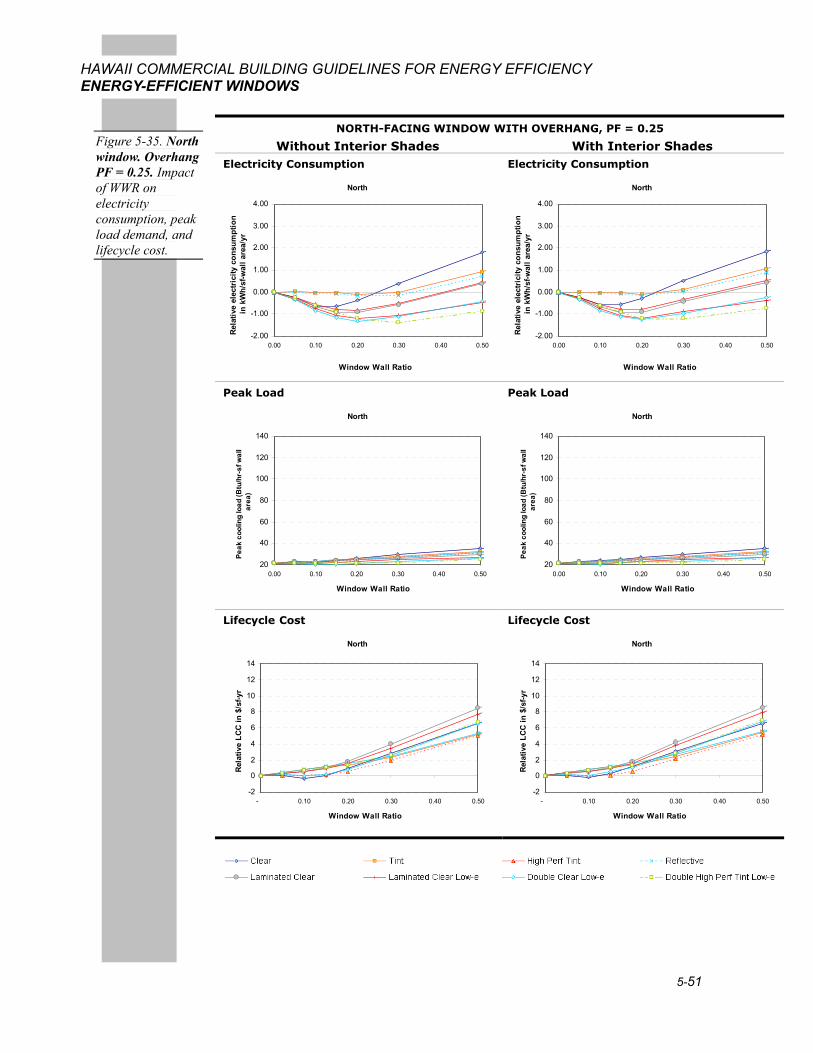
For each orientation, the graphs show electricity consumption, peak cooling load impacts and lifecycle costs for windows with and without exterior shading. The same eight representative glass types are compared in each graph.
These graphs were developed with data based on a typical office building in Hawaii with manual or automatic daylighting controls in the perimeter spaces, operating five days a week for normal business hours (8 AM to 5 PM).
Figure 5-33. Kaiser Permanente Honolulu Clinic. Photos: Erik Kolderup, Eley Associates.
5-50
HAWAII COMMERCIAL BUILDING GUIDELINES FOR ENERGY EFFICIENCY ENERGY-EFFICIENT WINDOWS
NORTH-FACING WINDOW WITH NO EXTERIOR SHADING
Without Interior Shades With Interior Shades
Electricity Consumption
North
-2.00
-1.00
0.00
1.00
2.00
3.00
4.00
0.00 0.10 0.20 0.30 0.40 0.50
Window Wall Ratio
Rel
ativ
e el
ectr
icity
con
sum
ptio
n in
kW
h/sf
-wal
l are
a/yr
Electricity Consumption
North
-2.00
-1.00
0.00
1.00
2.00
3.00
4.00
0.00 0.10 0.20 0.30 0.40 0.50
Window Wall Ratio
Rel
ativ
e el
ectr
icity
con
sum
ptio
n in
kW
h/sf
-wal
l are
a/yr
Peak Load
North
20
40
60
80
100
120
140
0.00 0.10 0.20 0.30 0.40 0.50
Window Wall Ratio
Peak
coo
ling
load
(Btu
/hr-
sf w
all a
rea)
Peak Load
North
20
40
60
80
100
120
140
0.00 0.10 0.20 0.30 0.40 0.50
Window Wall Ratio
Peak
coo
ling
load
(Btu
/hr-
sf w
all a
rea)
Lifecycle cost
North
-2
0
2
4
6
8
10
12
14
- 0.10 0.20 0.30 0.40 0.50
Window Wall Ratio
Rel
ativ
e LC
C in
$/s
f-yr
Lifecycle cost
North
-2
0
2
4
6
8
10
12
14
- 0.10 0.20 0.30 0.40 0.50
Window Wall Ratio
Rel
ativ
e LC
C in
$/s
f-yr
Figure 5-34. North window, no overhang. Impact of WWR on electricity consumption, peak cooling load, and lifecycle cost, for windows with and without interior shades.
5-51
HAWAII COMMERCIAL BUILDING GUIDELINES FOR ENERGY EFFICIENCY ENERGY-EFFICIENT WINDOWS
NORTH-FACING WINDOW WITH OVERHANG, PF = 0.25
Without Interior Shades With Interior Shades Electricity Consumption
North
-2.00
-1.00
0.00
1.00
2.00
3.00
4.00
0.00 0.10 0.20 0.30 0.40 0.50
Window Wall Ratio
Rel
ativ
e el
ectr
icity
con
sum
ptio
n in
kW
h/sf
-wal
l are
a/yr
Electricity Consumption
North
-2.00
-1.00
0.00
1.00
2.00
3.00
4.00
0.00 0.10 0.20 0.30 0.40 0.50
Window Wall Ratio
Rel
ativ
e el
ectr
icity
con
sum
ptio
n in
kW
h/sf
-wal
l are
a/yr
Peak Load
North
20
40
60
80
100
120
140
0.00 0.10 0.20 0.30 0.40 0.50
Window Wall Ratio
Peak
coo
ling
load
(Btu
/hr-
sf w
all
area
)
Peak Load
North
20
40
60
80
100
120
140
0.00 0.10 0.20 0.30 0.40 0.50
Window Wall Ratio
Peak
coo
ling
load
(Btu
/hr-
sf w
all
area
)
Lifecycle Cost
North
-2
0
2
4
6
8
10
12
14
- 0.10 0.20 0.30 0.40 0.50
Window Wall Ratio
Rel
ativ
e LC
C in
$/s
f-yr
Lifecycle Cost
North
-2
0
2
4
6
8
10
12
14
- 0.10 0.20 0.30 0.40 0.50
Window Wall Ratio
Rel
ativ
e LC
C in
$/s
f-yr
Figure 5-35. North window. Overhang PF = 0.25. Impact of WWR on electricity consumption, peak load demand, and lifecycle cost.
5-52
HAWAII COMMERCIAL BUILDING GUIDELINES FOR ENERGY EFFICIENCY ENERGY-EFFICIENT WINDOWS
NORTH-FACING WINDOW WITH OVERHANG, PF = 0.50
Without Interior Shades With Interior Shades Electricity Consumption
North
-2.00
-1.00
0.00
1.00
2.00
3.00
4.00
0.00 0.10 0.20 0.30 0.40 0.50
Window Wall Ratio
Rel
ativ
e el
ectr
icity
con
sum
ptio
n in
kW
h/sf
-wal
l are
a/yr
Electricity Consumption
North
-2.00
-1.00
0.00
1.00
2.00
3.00
4.00
0.00 0.10 0.20 0.30 0.40 0.50
Window Wall Ratio
Rel
ativ
e el
ectr
icity
con
sum
ptio
n in
kW
h/sf
-wal
l are
a/yr
Peak Load
North
20
40
60
80
100
120
140
0.00 0.10 0.20 0.30 0.40 0.50
Window Wall Ratio
Peak
coo
ling
load
(Btu
/hr-
sf w
all
area
)
Peak Load
North
20
40
60
80
100
120
140
0.00 0.10 0.20 0.30 0.40 0.50
Window Wall Ratio
Peak
coo
ling
load
(Btu
/hr-
sf w
all
area
)
Lifecycle Cost
North
-2
0
2
4
6
8
10
12
14
- 0.10 0.20 0.30 0.40 0.50
Window Wall Ratio
Rel
ativ
e LC
C in
$/s
f-yr
Lifecycle Cost
North
-2
0
2
4
6
8
10
12
14
- 0.10 0.20 0.30 0.40 0.50
Window Wall Ratio
Rel
ativ
e LC
C in
$/s
f-yr
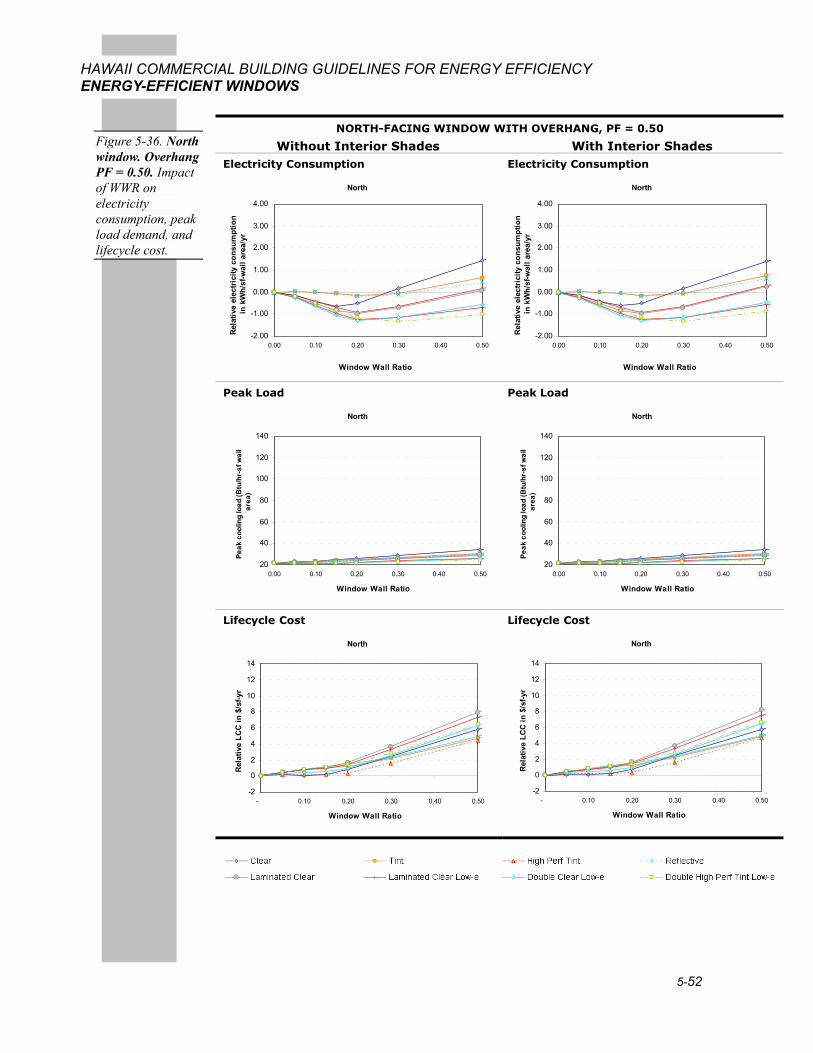
Figure 5-36. North window. Overhang PF = 0.50. Impact of WWR on electricity consumption, peak load demand, and lifecycle cost.
5-53
HAWAII COMMERCIAL BUILDING GUIDELINES FOR ENERGY EFFICIENCY ENERGY-EFFICIENT WINDOWS
NORTH-FACING WINDOW WITH OVERHANG, PF = 1.00
Without Interior Shades With Interior Shades Electricity Consumption
North
-2.00
-1.00
0.00
1.00
2.00
3.00
4.00
0.00 0.10 0.20 0.30 0.40 0.50
Window Wall Ratio
Rel
ativ
e el
ectr
icity
con
sum
ptio
n in
kW
h/sf
-wal
l are
a/yr
Electricity Consumption
North
-2.00
-1.00
0.00
1.00
2.00
3.00
4.00
0.00 0.10 0.20 0.30 0.40 0.50
Window Wall Ratio
Rel
ativ
e el
ectr
icity
con
sum
ptio
n in
kW
h/sf
-wal
l are
a/yr
Peak Load
North
20
40
60
80
100
120
140
0.00 0.10 0.20 0.30 0.40 0.50
Window Wall Ratio
Peak
coo
ling
load
(Btu
/hr-
sf w
all
area
)
Peak Load
North
20
40
60
80
100
120
140
0.00 0.10 0.20 0.30 0.40 0.50
Window Wall Ratio
Peak
coo
ling
load
(Btu
/hr-
sf w
all
area
)
Lifecycle Cost
North
-2
0
2
4
6
8
10
12
14
- 0.10 0.20 0.30 0.40 0.50
Window Wall Ratio
Rel
ativ
e LC
C in
$/s
f-yr
Lifecycle Cost
North
-2
0
2
4
6
8
10
12
14
- 0.10 0.20 0.30 0.40 0.50
Window Wall Ratio
Rel
ativ
e LC
C in
$/s
f-yr
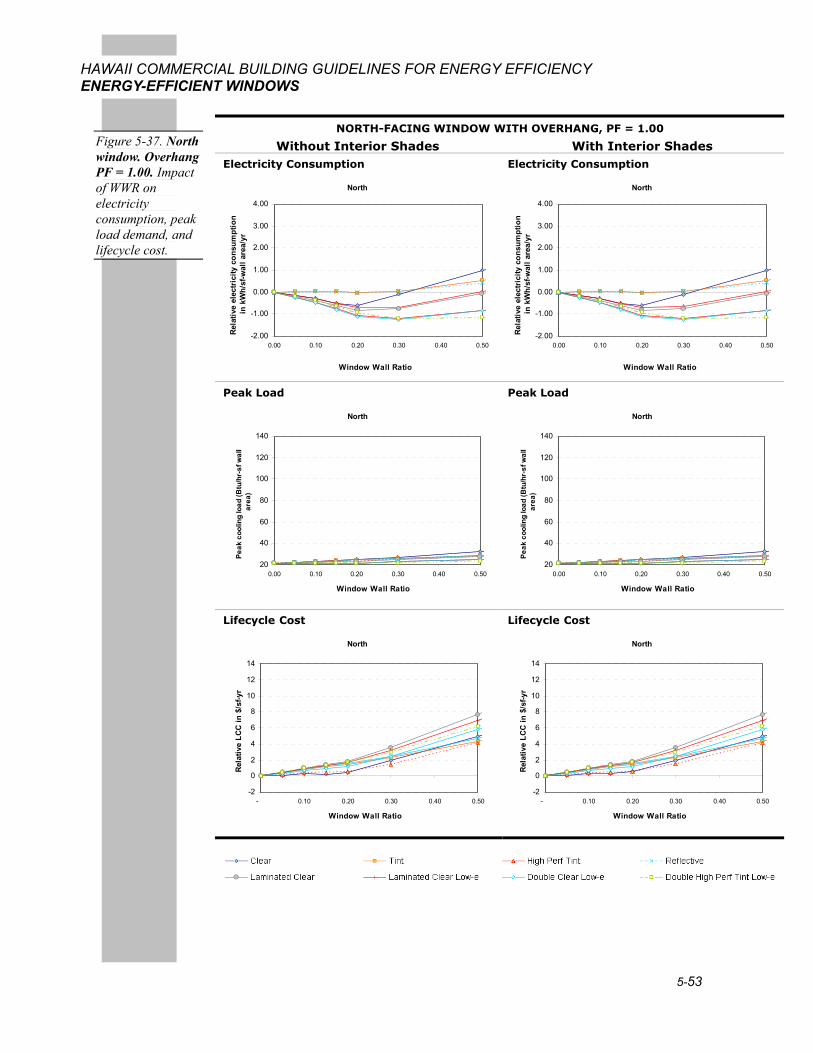
Figure 5-37. North window. Overhang PF = 1.00. Impact of WWR on electricity consumption, peak load demand, and lifecycle cost.
5-54
HAWAII COMMERCIAL BUILDING GUIDELINES FOR ENERGY EFFICIENCY ENERGY-EFFICIENT WINDOWS
NORTHEAST-FACING WINDOW WITH NO EXTERIOR SHADING
Without Interior Shades With Interior Shades
Electricity Consumption
Northeast
-2.00
-1.00
0.00
1.00
2.00
3.00
4.00
0.00 0.10 0.20 0.30 0.40 0.50
Window Wall Ratio
Rel
ativ
e el
ectr
icity
con
sum
ptio
n in
kW
h/sf
-wal
l are
a/yr
Electricity Consumption
Northeast
-2.00
-1.00
0.00
1.00
2.00
3.00
4.00
0.00 0.10 0.20 0.30 0.40 0.50
Window Wall Ratio
Rel
ativ
e el
ectr
icity
con
sum
ptio
n in
kW
h/sf
-wal
l are
a/yr
Peak Load
Northeast
20
40
60
80
100
120
140
0.00 0.10 0.20 0.30 0.40 0.50
Window Wall Ratio
Peak
coo
ling
load
(Btu
/hr-
sf w
all a
rea)
Peak Load
Northeast
20
40
60
80
100
120
140
0.00 0.10 0.20 0.30 0.40 0.50
Window Wall Ratio
Peak
coo
ling
load
(Btu
/hr-
sf w
all a
rea)
Lifecycle cost
Northeast
-2
0
2
4
6
8
10
12
14
- 0.10 0.20 0.30 0.40 0.50
Window Wall Ratio
Rel
ativ
e LC
C in
$/s
f-yr
Lifecycle cost
Northeast
-2
0
2
4
6
8
10
12
14
- 0.10 0.20 0.30 0.40 0.50
Window Wall Ratio
Rel
ativ
e LC
C in
$/s
f-yr
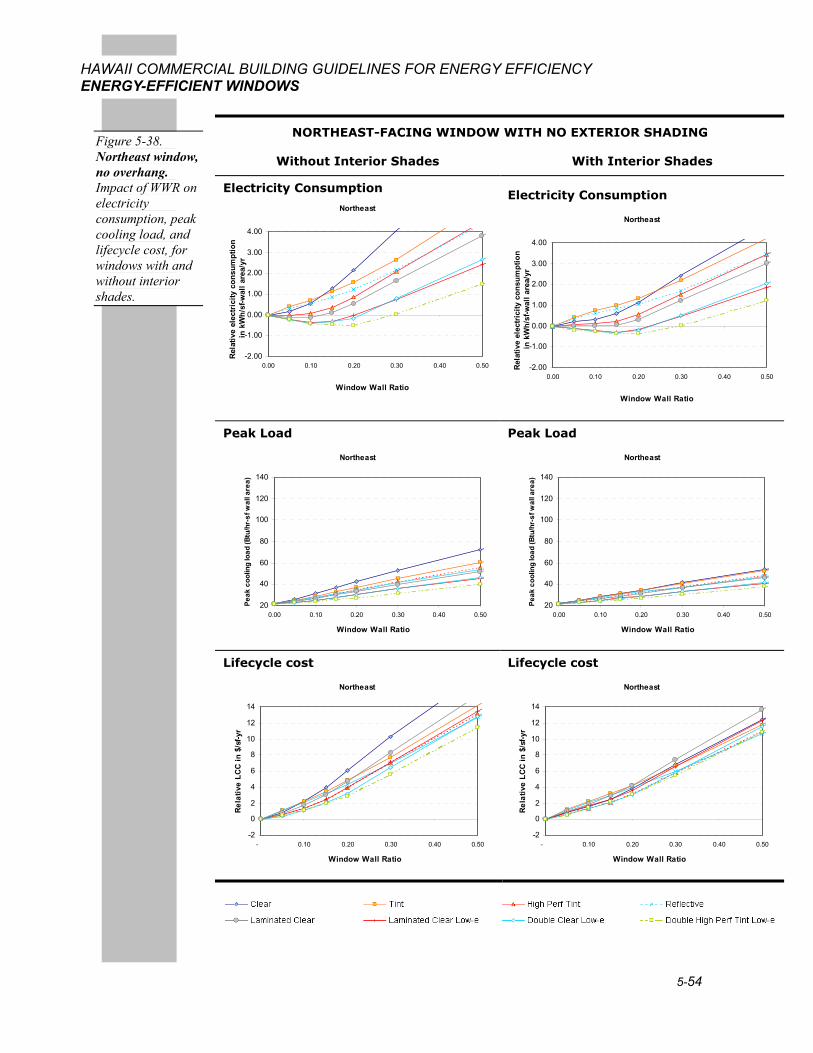
Figure 5-38. Northeast window, no overhang. Impact of WWR on electricity consumption, peak cooling load, and lifecycle cost, for windows with and without interior shades.
5-55
HAWAII COMMERCIAL BUILDING GUIDELINES FOR ENERGY EFFICIENCY ENERGY-EFFICIENT WINDOWS
NORTHEAST-FACING WINDOW WITH OVERHANG, PF = 0.25
Without Interior Shades With Interior Shades Electricity Consumption
Northeast
-2.00
-1.00
0.00
1.00
2.00
3.00
4.00
0.00 0.10 0.20 0.30 0.40 0.50
Window Wall Ratio
Rel
ativ
e el
ectr
icity
con
sum
ptio
n in
kW
h/sf
-wal
l are
a/yr
Electricity Consumption
Northeast
-2.00
-1.00
0.00
1.00
2.00
3.00
4.00
0.00 0.10 0.20 0.30 0.40 0.50
Window Wall Ratio
Rel
ativ
e el
ectr
icity
con
sum
ptio
n in
kW
h/sf
-wal
l are
a/yr
Peak Load
Northeast
20
40
60
80
100
120
140
0.00 0.10 0.20 0.30 0.40 0.50
Window Wall Ratio
Peak
coo
ling
load
(Btu
/hr-
sf w
all
area
)
Peak Load
Northeast
20
40
60
80
100
120
140
0.00 0.10 0.20 0.30 0.40 0.50
Window Wall Ratio
Peak
coo
ling
load
(Btu
/hr-
sf w
all
area
)
Lifecycle Cost
Northeast
-2
0
2
4
6
8
10
12
14
- 0.10 0.20 0.30 0.40 0.50
Window Wall Ratio
Rel
ativ
e LC
C in
$/s
f-yr
Lifecycle Cost
Northeast
-2
0
2
4
6
8
10
12
14
- 0.10 0.20 0.30 0.40 0.50
Window Wall Ratio
Rel
ativ
e LC
C in
$/s
f-yr
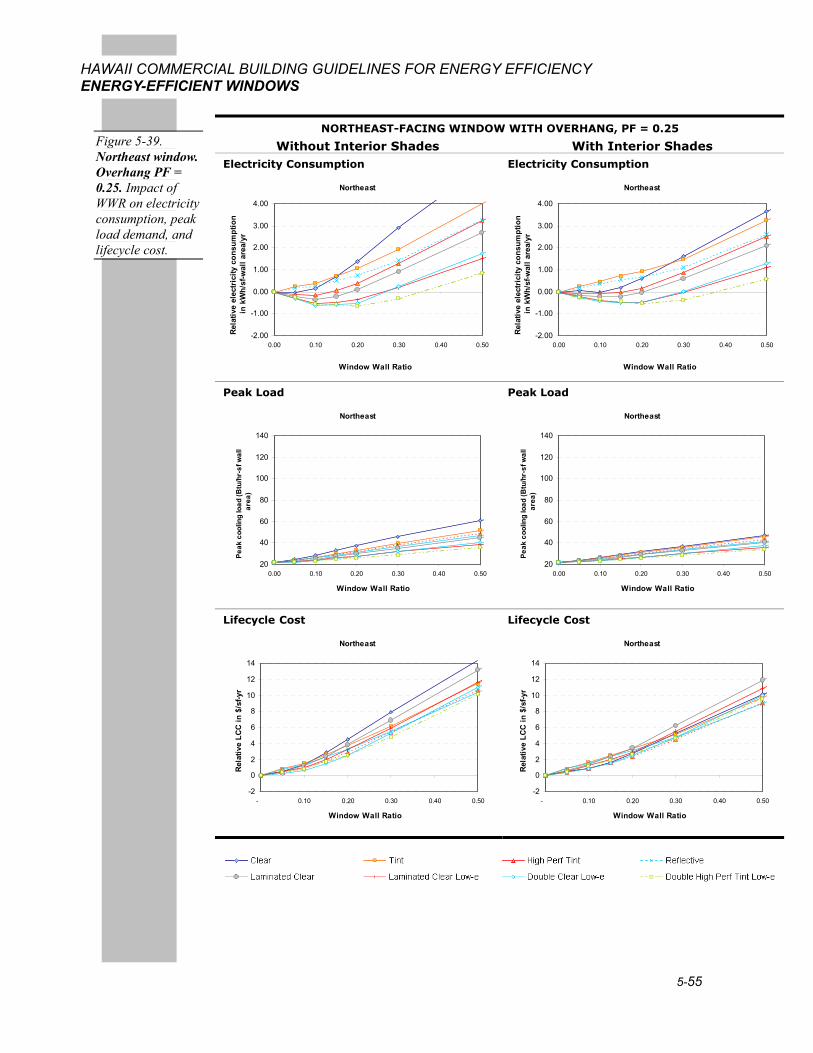
Figure 5-39. Northeast window. Overhang PF = 0.25. Impact of WWR on electricity consumption, peak load demand, and lifecycle cost.
5-56
HAWAII COMMERCIAL BUILDING GUIDELINES FOR ENERGY EFFICIENCY ENERGY-EFFICIENT WINDOWS
NORTHEAST-FACING WINDOW WITH OVERHANG, PF = 0.50
Without Interior Shades With Interior Shades Electricity Consumption
Northeast
-2.00
-1.00
0.00
1.00
2.00
3.00
4.00
0.00 0.10 0.20 0.30 0.40 0.50
Window Wall Ratio
Rel
ativ
e el
ectr
icity
con
sum
ptio
n in
kW
h/sf
-wal
l are
a/yr
Electricity Consumption
Northeast
-2.00
-1.00
0.00
1.00
2.00
3.00
4.00
0.00 0.10 0.20 0.30 0.40 0.50
Window Wall Ratio
Rel
ativ
e el
ectr
icity
con
sum
ptio
n in
kW
h/sf
-wal
l are
a/yr
Peak Load
Northeast
20
40
60
80
100
120
140
0.00 0.10 0.20 0.30 0.40 0.50
Window Wall Ratio
Peak
coo
ling
load
(Btu
/hr-
sf w
all
area
)
Peak Load
Northeast
20
40
60
80
100
120
140
0.00 0.10 0.20 0.30 0.40 0.50
Window Wall Ratio
Peak
coo
ling
load
(Btu
/hr-
sf w
all
area
)
Lifecycle Cost
Northeast
-2
0
2
4
6
8
10
12
14
- 0.10 0.20 0.30 0.40 0.50
Window Wall Ratio
Rel
ativ
e LC
C in
$/s
f-yr
Lifecycle Cost
Northeast
-2
0
2
4
6
8
10
12
14
- 0.10 0.20 0.30 0.40 0.50
Window Wall Ratio
Rel
ativ
e LC
C in
$/s
f-yr
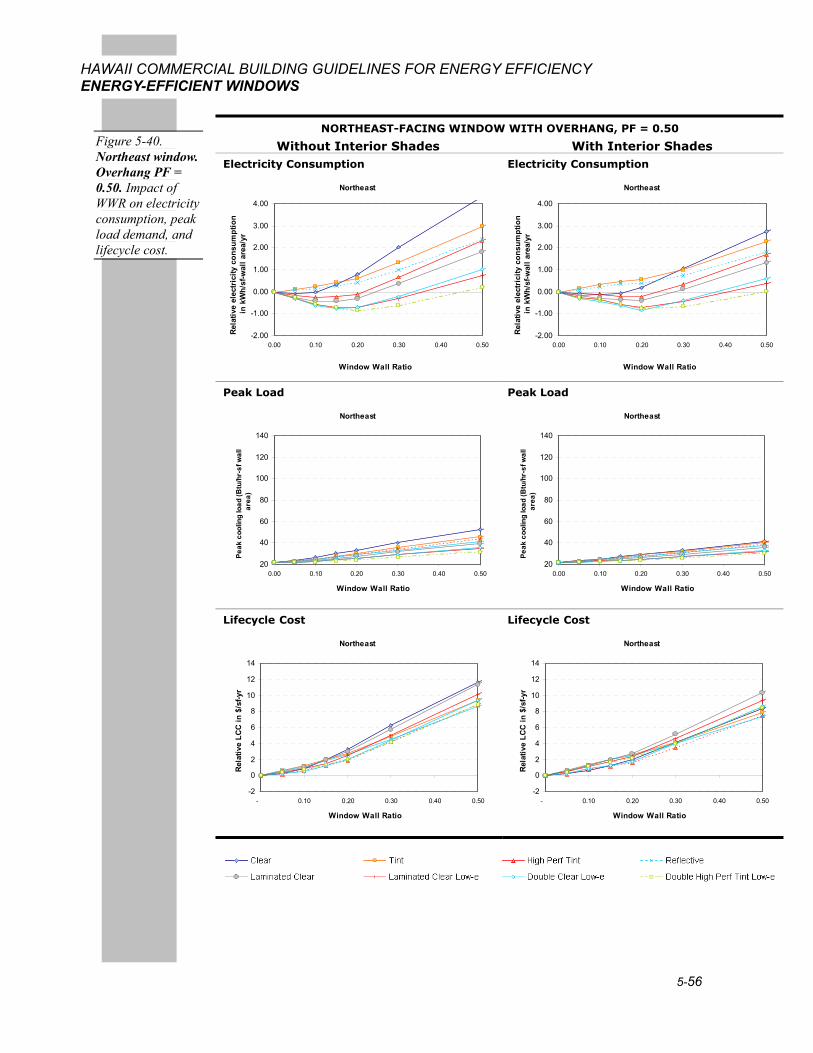
Figure 5-40. Northeast window. Overhang PF = 0.50. Impact of WWR on electricity consumption, peak load demand, and lifecycle cost.
5-57
HAWAII COMMERCIAL BUILDING GUIDELINES FOR ENERGY EFFICIENCY ENERGY-EFFICIENT WINDOWS
NORTHEAST-FACING WINDOW WITH OVERHANG, PF = 1.00
Without Interior Shades With Interior Shades Electricity Consumption
Northeast
-2.00
-1.00
0.00
1.00
2.00
3.00
4.00
0.00 0.10 0.20 0.30 0.40 0.50
Window Wall Ratio
Rela
tive
ener
gy c
onsu
mpt
ion
in
kWh/
sf-w
all a
rea/
yr
Electricity Consumption
Northeast
-2.00
-1.00
0.00
1.00
2.00
3.00
4.00
0.00 0.10 0.20 0.30 0.40 0.50
Window Wall Ratio
Rel
ativ
e el
ectr
icity
con
sum
ptio
n in
kW
h/sf
-wal
l are
a/yr
Peak Load
Northeast
20
40
60
80
100
120
140
0.00 0.10 0.20 0.30 0.40 0.50
Window Wall Ratio
Peak
coo
ling
load
(Btu
/hr-
sf w
all
area
)
Peak Load
Northeast
20
40
60
80
100
120
140
0.00 0.10 0.20 0.30 0.40 0.50
Window Wall Ratio
Peak
coo
ling
load
(Btu
/hr-
sf w
all
area
)
Lifecycle Cost
Northeast
-2
0
2
4
6
8
10
12
14
- 0.10 0.20 0.30 0.40 0.50
Window Wall Ratio
Rel
ativ
e LC
C in
$/s
f-yr
Lifecycle Cost
Northeast
-2
0
2
4
6
8
10
12
14
- 0.10 0.20 0.30 0.40 0.50
Window Wall Ratio
Rela
tive
LCC
in $
/sf-y
r
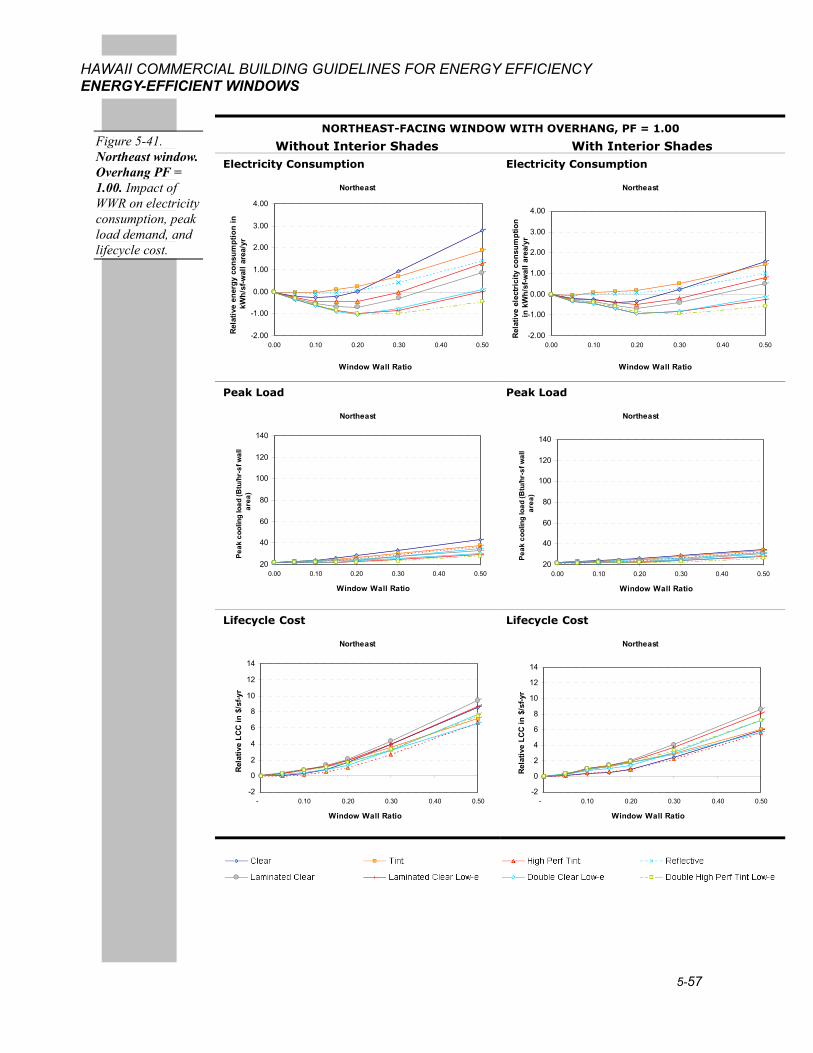
Figure 5-41. Northeast window. Overhang PF = 1.00. Impact of WWR on electricity consumption, peak load demand, and lifecycle cost.
5-58
HAWAII COMMERCIAL BUILDING GUIDELINES FOR ENERGY EFFICIENCY ENERGY-EFFICIENT WINDOWS
EAST-FACING WINDOW WITH NO EXTERIOR SHADING
Without Interior Shades With Interior Shades
Electricity Consumption
East
-2.00
-1.00
0.00
1.00
2.00
3.00
4.00
0.00 0.10 0.20 0.30 0.40 0.50
Window Wall Ratio
Rel
ativ
e el
ectr
icity
con
sum
ptio
n in
kW
h/sf
-wal
l are
a/yr
Electricity Consumption
East
-2.00
-1.00
0.00
1.00
2.00
3.00
4.00
0.00 0.10 0.20 0.30 0.40 0.50
Window Wall Ratio
Rel
ativ
e el
ectr
icity
con
sum
ptio
n in
kW
h/sf
-wal
l are
a/yr
Peak Load
East
20
40
60
80
100
120
140
0.00 0.10 0.20 0.30 0.40 0.50
Window Wall Ratio
Peak
coo
ling
load
(Btu
/hr-
sf w
all a
rea)
Peak Load
East
20
40
60
80
100
120
140
0.00 0.10 0.20 0.30 0.40 0.50
Window Wall Ratio
Peak
coo
ling
load
(Btu
/hr-
sf w
all a
rea)
Lifecycle cost
East
-2
0
2
4
6
8
10
12
14
- 0.10 0.20 0.30 0.40 0.50
Window Wall Ratio
Rel
ativ
e LC
C in
$/s
f-yr
Lifecycle cost
East
-2
0
2
4
6
8
10
12
14
- 0.10 0.20 0.30 0.40 0.50
Window Wall Ratio
Rel
ativ
e LC
C in
$/s
f-yr
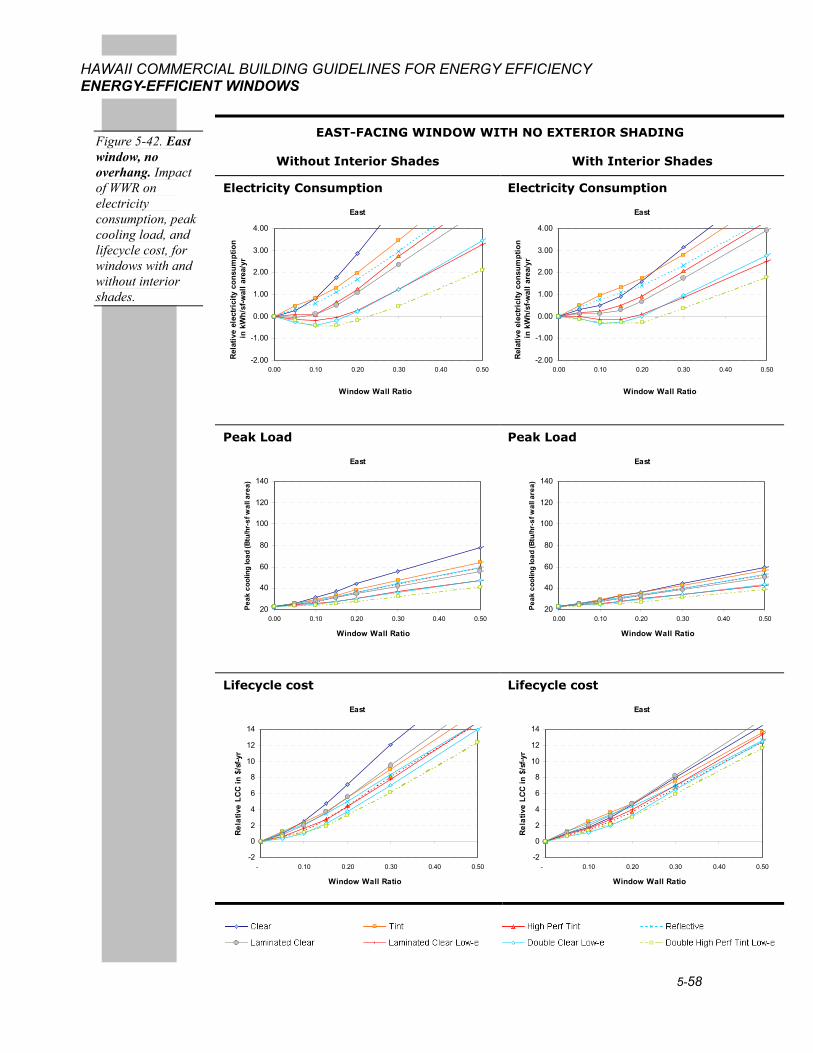
Figure 5-42. East window, no overhang. Impact of WWR on electricity consumption, peak cooling load, and lifecycle cost, for windows with and without interior shades.
5-59
HAWAII COMMERCIAL BUILDING GUIDELINES FOR ENERGY EFFICIENCY ENERGY-EFFICIENT WINDOWS
EAST-FACING WINDOW WITH OVERHANG, PF = 0.25
Without Interior Shades With Interior Shades Electricity Consumption
East
-2.00
-1.00
0.00
1.00
2.00
3.00
4.00
0.00 0.10 0.20 0.30 0.40 0.50
Window Wall Ratio
Rel
ativ
e el
ectr
icity
con
sum
ptio
n in
kW
h/sf
-wal
l are
a/yr
Electricity Consumption
East
-2.00
-1.00
0.00
1.00
2.00
3.00
4.00
0.00 0.10 0.20 0.30 0.40 0.50
Window Wall Ratio
Rel
ativ
e el
ectr
icity
con
sum
ptio
n in
kW
h/sf
-wal
l are
a/yr
Peak Load
East
20
40
60
80
100
120
140
0.00 0.10 0.20 0.30 0.40 0.50
Window Wall Ratio
Peak
coo
ling
load
(Btu
/hr-
sf w
all
area
)
Peak Load
East
20
40
60
80
100
120
140
0.00 0.10 0.20 0.30 0.40 0.50
Window Wall Ratio
Peak
coo
ling
load
(Btu
/hr-
sf w
all
area
)
Lifecycle Cost
East
-2
0
2
4
6
8
10
12
14
- 0.10 0.20 0.30 0.40 0.50
Window Wall Ratio
Rel
ativ
e LC
C in
$/s
f-yr
Lifecycle Cost
East
-2
0
2
4
6
8
10
12
14
- 0.10 0.20 0.30 0.40 0.50
Window Wall Ratio
Rel
ativ
e LC
C in
$/s
f-yr
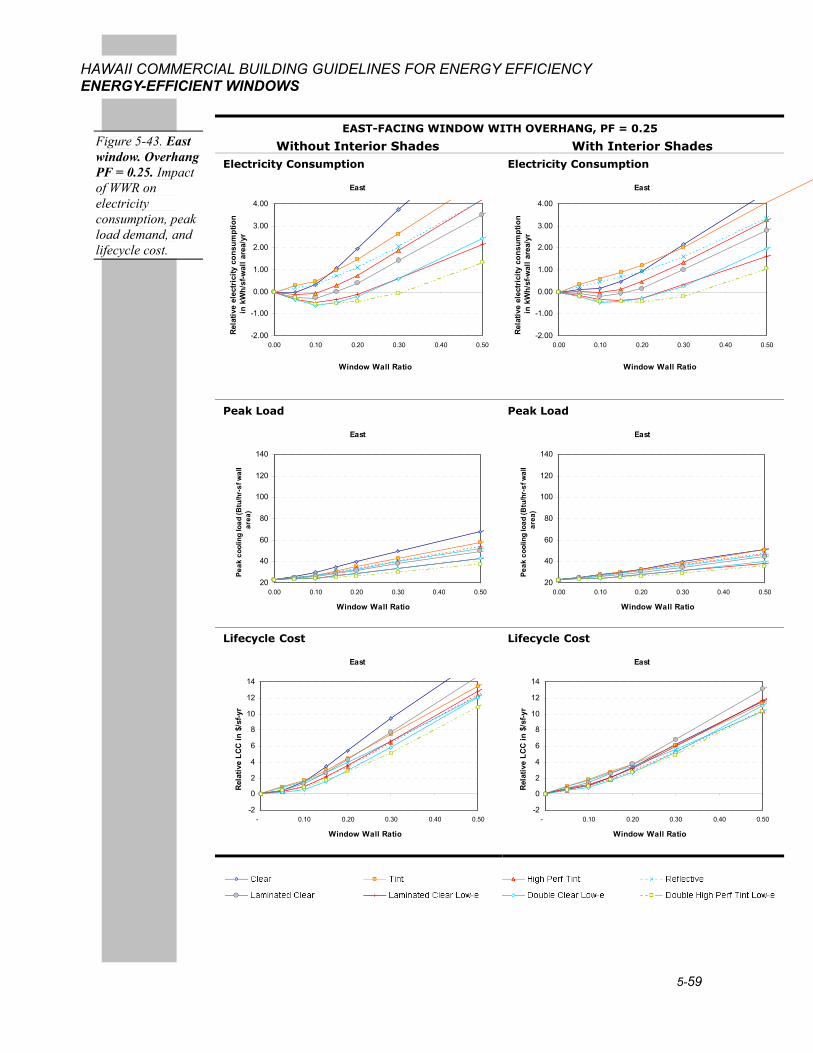
Figure 5-43. East window. Overhang PF = 0.25. Impact of WWR on electricity consumption, peak load demand, and lifecycle cost.
5-60
HAWAII COMMERCIAL BUILDING GUIDELINES FOR ENERGY EFFICIENCY ENERGY-EFFICIENT WINDOWS
EAST-FACING WINDOW WITH OVERHANG, PF = 0.50
Without Interior Shades With Interior Shades Electricity Consumption
East
-2.00
-1.00
0.00
1.00
2.00
3.00
4.00
0.00 0.10 0.20 0.30 0.40 0.50
Window Wall Ratio
Rel
ativ
e el
ectr
icity
con
sum
ptio
n in
kW
h/sf
-wal
l are
a/yr
Electricity Consumption
East
-2.00
-1.00
0.00
1.00
2.00
3.00
4.00
0.00 0.10 0.20 0.30 0.40 0.50
Window Wall Ratio
Rel
ativ
e el
ectr
icity
con
sum
ptio
n in
kW
h/sf
-wal
l are
a/yr
Peak Load
East
20
40
60
80
100
120
140
0.00 0.10 0.20 0.30 0.40 0.50
Window Wall Ratio
Peak
coo
ling
load
(Btu
/hr-
sf w
all
area
)
Peak Load
East
20
40
60
80
100
120
140
0.00 0.10 0.20 0.30 0.40 0.50
Window Wall Ratio
Peak
coo
ling
load
(Btu
/hr-
sf w
all
area
)
Lifecycle Cost
East
-2
0
2
4
6
8
10
12
14
- 0.10 0.20 0.30 0.40 0.50
Window Wall Ratio
Rel
ativ
e LC
C in
$/s
f-yr
Lifecycle Cost
East
-2
0
2
4
6
8
10
12
14
- 0.10 0.20 0.30 0.40 0.50
Window Wall Ratio
Rel
ativ
e LC
C in
$/s
f-yr
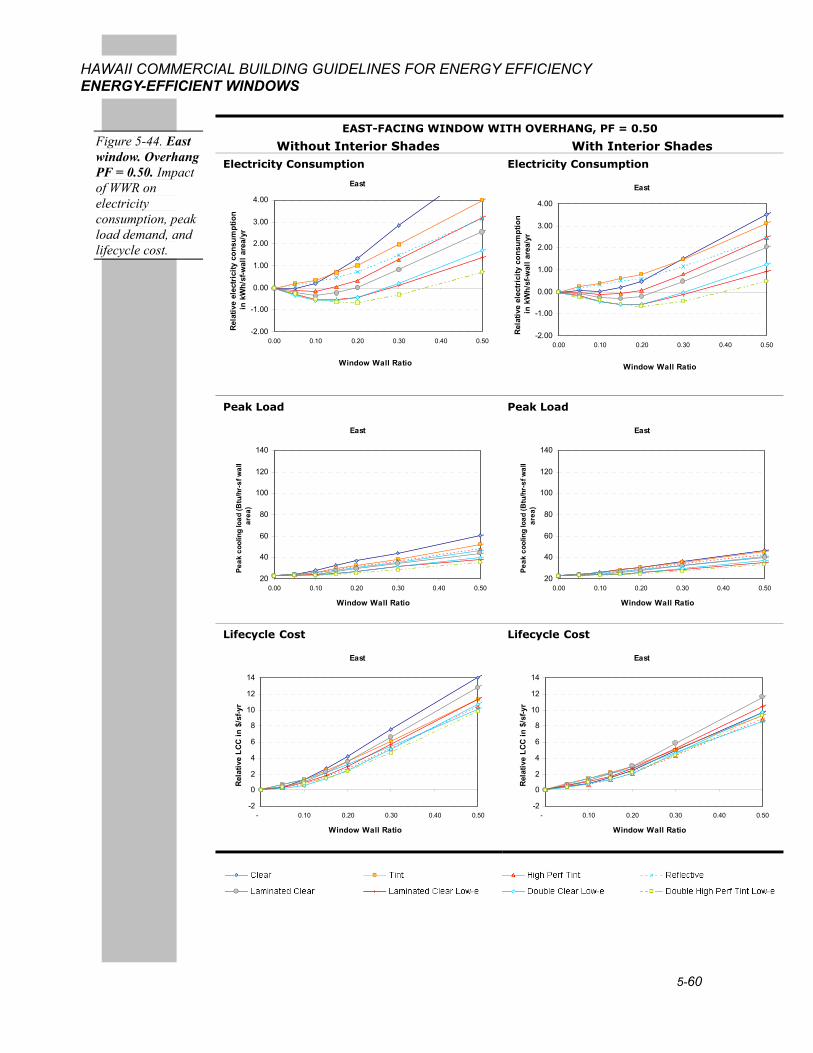
Figure 5-44. East window. Overhang PF = 0.50. Impact of WWR on electricity consumption, peak load demand, and lifecycle cost.
5-61
HAWAII COMMERCIAL BUILDING GUIDELINES FOR ENERGY EFFICIENCY ENERGY-EFFICIENT WINDOWS
EAST-FACING WINDOW WITH OVERHANG, PF = 1.00
Without Interior Shades With Interior Shades Electricity Consumption
East
-2.00
-1.00
0.00
1.00
2.00
3.00
4.00
0.00 0.10 0.20 0.30 0.40 0.50
Window Wall Ratio
Rel
ativ
e el
ectr
icity
con
sum
ptio
n in
kW
h/sf
-wal
l are
a/yr
Electricity Consumption
East
-2.00
-1.00
0.00
1.00
2.00
3.00
4.00
0.00 0.10 0.20 0.30 0.40 0.50
Window Wall Ratio
Rel
ativ
e el
ectr
icity
con
sum
ptio
n in
kW
h/sf
-wal
l are
a/yr
Peak Load
East
20
40
60
80
100
120
140
0.00 0.10 0.20 0.30 0.40 0.50
Window Wall Ratio
Peak
coo
ling
load
(Btu
/hr-
sf w
all
area
)
Peak Load
East
20
40
60
80
100
120
140
0.00 0.10 0.20 0.30 0.40 0.50
Window Wall Ratio
Peak
coo
ling
load
(Btu
/hr-
sf w
all
area
)
Lifecycle Cost
East
-2
0
2
4
6
8
10
12
14
- 0.10 0.20 0.30 0.40 0.50
Window Wall Ratio
Rel
ativ
e LC
C in
$/s
f-yr
Lifecycle Cost
East
-2
0
2
4
6
8
10
12
14
- 0.10 0.20 0.30 0.40 0.50
Window Wall Ratio
Rel
ativ
e LC
C in
$/s
f-yr
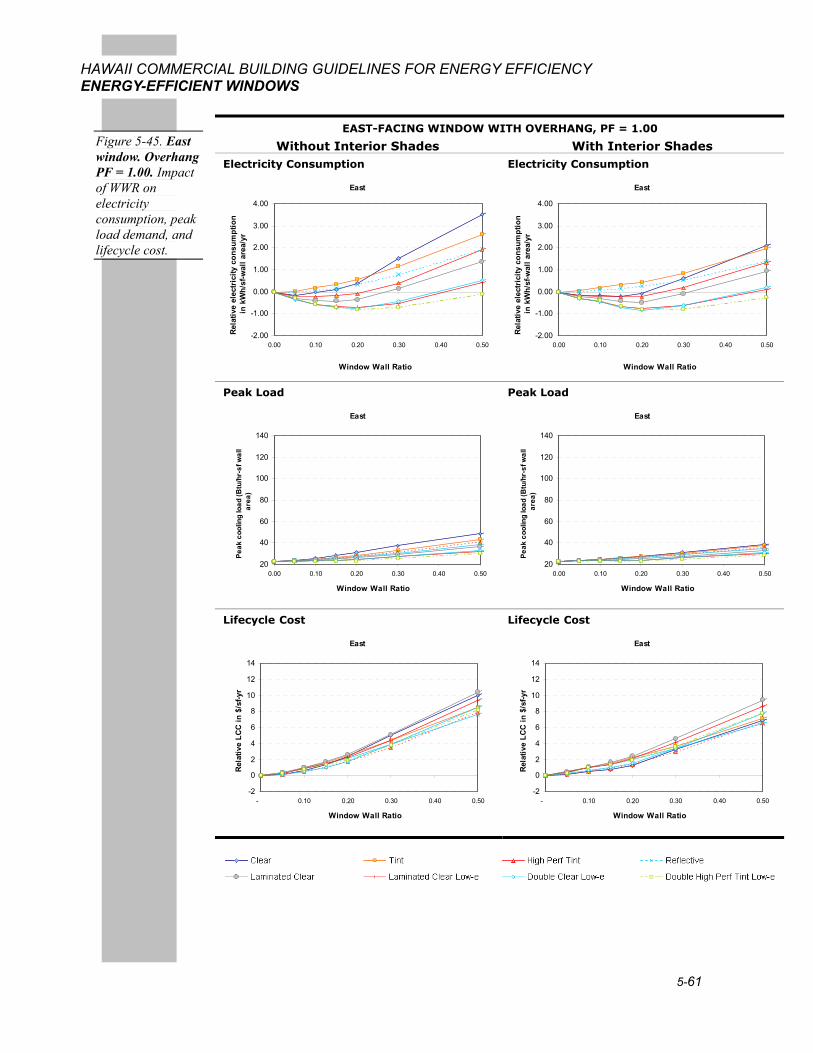
Figure 5-45. East window. Overhang PF = 1.00. Impact of WWR on electricity consumption, peak load demand, and lifecycle cost.
5-62
HAWAII COMMERCIAL BUILDING GUIDELINES FOR ENERGY EFFICIENCY ENERGY-EFFICIENT WINDOWS
SOUTHEAST-FACING WINDOW WITH NO EXTERIOR SHADING
Without Interior Shades With Interior Shades
Electricity Consumption
Southeast
-2.00
-1.00
0.00
1.00
2.00
3.00
4.00
0.00 0.10 0.20 0.30 0.40 0.50
Window Wall Ratio
Rel
ativ
e el
ectr
icity
con
sum
ptio
n in
kW
h/sf
-wal
l are
a/yr
Electricity Consumption
Southeast
-2.00
-1.00
0.00
1.00
2.00
3.00
4.00
0.00 0.10 0.20 0.30 0.40 0.50
Window Wall Ratio
Rela
tive
ener
gy c
onsu
mpt
ion
in
kWh/
sf-w
all a
rea/
yr
Peak Load
Southeast
20
40
60
80
100
120
140
0.00 0.10 0.20 0.30 0.40 0.50
Window Wall Ratio
Peak
coo
ling
load
(Btu
/hr-
sf w
all a
rea)
Peak Load
Southeast
20
40
60
80
100
120
140
0.00 0.10 0.20 0.30 0.40 0.50
Window Wall Ratio
Peak
coo
ling
load
(Btu
/hr-
sf w
all a
rea)
Lifecycle cost
Southeast
-2
0
2
4
6
8
10
12
14
- 0.10 0.20 0.30 0.40 0.50
Window Wall Ratio
Rel
ativ
e LC
C in
$/s
f-yr
Lifecycle cost
Southeast
-2
0
2
4
6
8
10
12
14
- 0.10 0.20 0.30 0.40 0.50
Window Wall Ratio
Rel
ativ
e LC
C in
$/s
f-yr
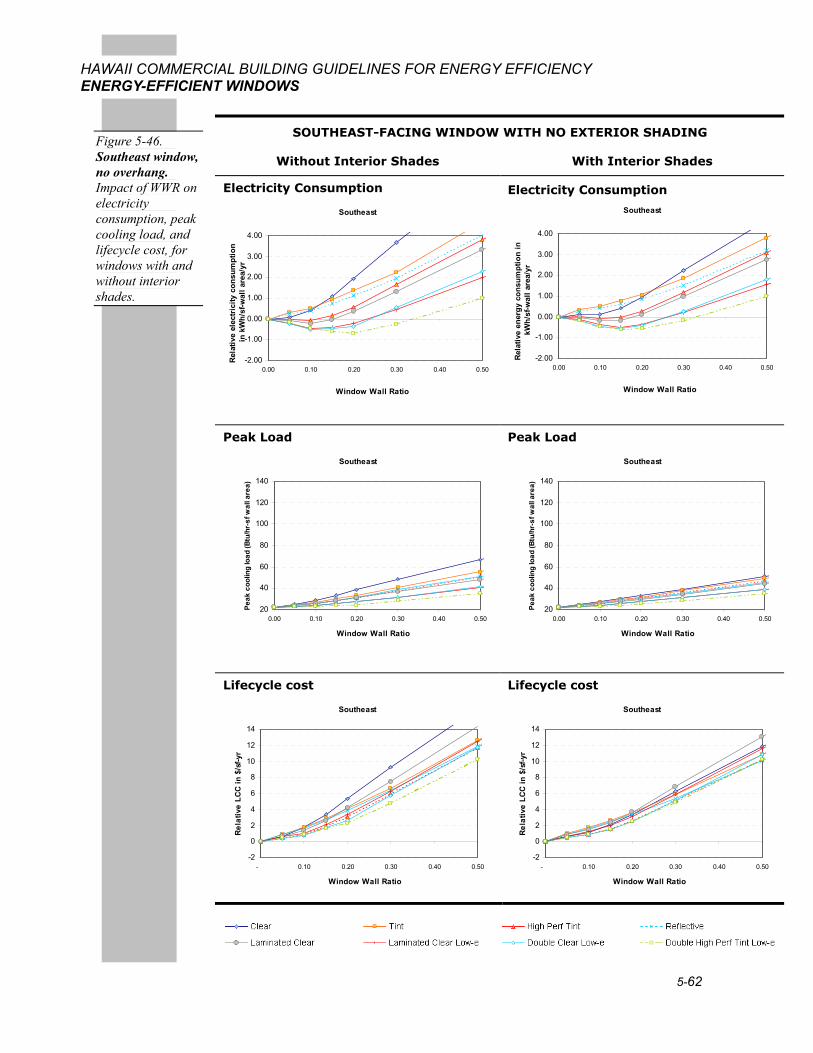
Figure 5-46. Southeast window, no overhang. Impact of WWR on electricity consumption, peak cooling load, and lifecycle cost, for windows with and without interior shades.

5-63
HAWAII COMMERCIAL BUILDING GUIDELINES FOR ENERGY EFFICIENCY ENERGY-EFFICIENT WINDOWS
SOUTHEAST-FACING WINDOW WITH OVERHANG, PF = 0.25
Without Interior Shades With Interior Shades Electricity Consumption
Southeast
-2.00
-1.00
0.00
1.00
2.00
3.00
4.00
0.00 0.10 0.20 0.30 0.40 0.50
Window Wall Ratio
Rela
tive
ener
gy c
onsu
mpt
ion
in
kWh/
sf-y
r
Electricity Consumption
Southeast
-2.00
-1.00
0.00
1.00
2.00
3.00
4.00
0.00 0.10 0.20 0.30 0.40 0.50
Window Wall Ratio
Rela
tive
ener
gy c
onsu
mpt
ion
in
kWh/
sf-y
r
Peak Load
Southeast
20
40
60
80
100
120
140
0.00 0.10 0.20 0.30 0.40 0.50
Window Wall Ratio
Peak
coo
ling
load
(Btu
/hr-
sf w
all
area
)
Peak Load
Southeast
20
40
60
80
100
120
140
0.00 0.10 0.20 0.30 0.40 0.50
Window Wall Ratio
Peak
coo
ling
load
(Btu
/hr-
sf w
all
area
)
Lifecycle Cost
Southeast
-2
0
2
4
6
8
10
12
14
- 0.10 0.20 0.30 0.40 0.50
Window Wall Ratio
Rel
ativ
e LC
C in
$/s
f-yr
Lifecycle Cost
Southeast
-2
0
2
4
6
8
10
12
14
- 0.10 0.20 0.30 0.40 0.50
Window Wall Ratio
Rel
ativ
e LC
C in
$/s
f-yr
Figure 5-47. Southeast window. Overhang PF = 0.25. Impact of WWR on electricity consumption, peak load demand, and lifecycle cost.
5-64
HAWAII COMMERCIAL BUILDING GUIDELINES FOR ENERGY EFFICIENCY ENERGY-EFFICIENT WINDOWS
SOUTHEAST-FACING WINDOW WITH OVERHANG, PF = 0.50
Without Interior Shades With Interior Shades Electricity Consumption
Southeast
-2.00
-1.00
0.00
1.00
2.00
3.00
4.00
0.00 0.10 0.20 0.30 0.40 0.50
Window Wall Ratio
Rel
ativ
e el
ectr
icity
con
sum
ptio
n in
kW
h/sf
-wal
l are
a/yr
Electricity Consumption
Southeast
-2.00
-1.00
0.00
1.00
2.00
3.00
4.00
0.00 0.10 0.20 0.30 0.40 0.50
Window Wall Ratio
Rel
ativ
e el
ectr
icity
con
sum
ptio
n in
kW
h/sf
-wal
l are
a/yr
Peak Load
Southeast
20
40
60
80
100
120
140
0.00 0.10 0.20 0.30 0.40 0.50
Window Wall Ratio
Peak
coo
ling
load
(Btu
/hr-
sf w
all
area
)
Peak Load
Southeast
20
40
60
80
100
120
140
0.00 0.10 0.20 0.30 0.40 0.50
Window Wall Ratio
Peak
coo
ling
load
(Btu
/hr-
sf w
all
area
)
Lifecycle Cost
Southeast
-2
0
2
4
6
8
10
12
14
- 0.10 0.20 0.30 0.40 0.50
Window Wall Ratio
Rel
ativ
e LC
C in
$/s
f-yr
Lifecycle Cost
Southeast
-2
0
2
4
6
8
10
12
14
- 0.10 0.20 0.30 0.40 0.50
Window Wall Ratio
Rel
ativ
e LC
C in
$/s
f-yr
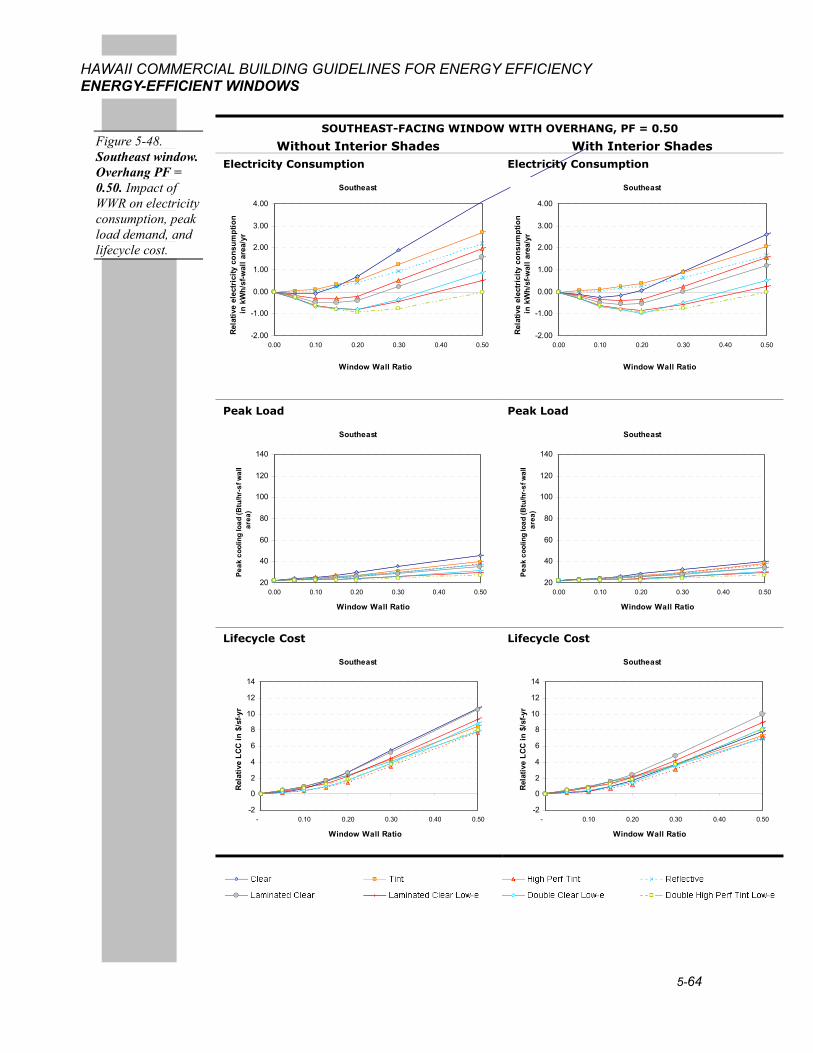
Figure 5-48. Southeast window. Overhang PF = 0.50. Impact of WWR on electricity consumption, peak load demand, and lifecycle cost.
5-65
HAWAII COMMERCIAL BUILDING GUIDELINES FOR ENERGY EFFICIENCY ENERGY-EFFICIENT WINDOWS
SOUTHEAST-FACING WINDOW WITH OVERHANG, PF = 1.00
Without Interior Shades With Interior Shades Electricity Consumption
Southeast
-2.00
-1.00
0.00
1.00
2.00
3.00
4.00
0.00 0.10 0.20 0.30 0.40 0.50
Window Wall Ratio
Rel
ativ
e el
ectr
icity
con
sum
ptio
n in
kW
h/sf
-wal
l are
a/yr
Electricity Consumption
Southeast
-2.00
-1.00
0.00
1.00
2.00
3.00
4.00
0.00 0.10 0.20 0.30 0.40 0.50
Window Wall Ratio
Rel
ativ
e el
ectr
icity
con
sum
ptio
n in
kW
h/sf
-wal
l are
a/yr
Peak Load
Southeast
20
40
60
80
100
120
140
0.00 0.10 0.20 0.30 0.40 0.50
Window Wall Ratio
Peak
coo
ling
load
(Btu
/hr-
sf w
all
area
)
Peak Load
Southeast
20
40
60
80
100
120
140
0.00 0.10 0.20 0.30 0.40 0.50
Window Wall Ratio
Peak
coo
ling
load
(Btu
/hr-
sf w
all
area
)
Lifecycle Cost
Southeast
-2
0
2
4
6
8
10
12
14
- 0.10 0.20 0.30 0.40 0.50
Window Wall Ratio
Rel
ativ
e LC
C in
$/s
f-yr
Lifecycle Cost
Southeast
-2
0
2
4
6
8
10
12
14
- 0.10 0.20 0.30 0.40 0.50
Window Wall Ratio
Rel
ativ
e LC
C in
$/s
f-yr
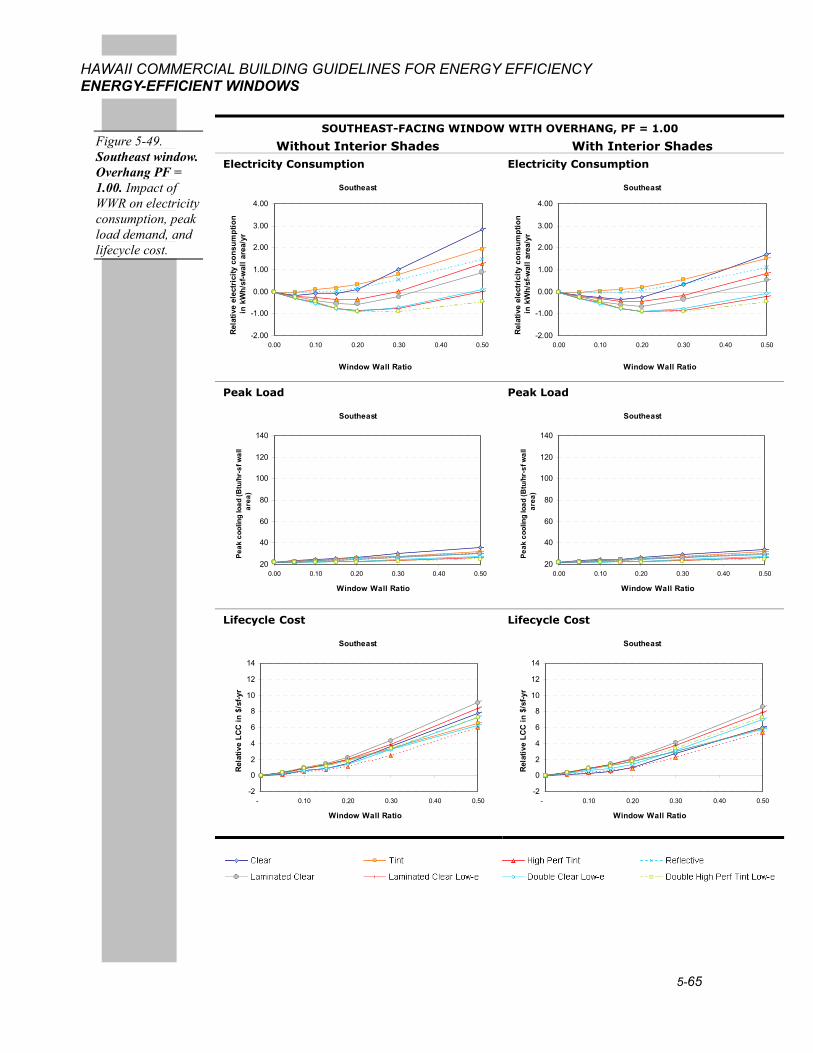
Figure 5-49. Southeast window. Overhang PF = 1.00. Impact of WWR on electricity consumption, peak load demand, and lifecycle cost.
5-66
HAWAII COMMERCIAL BUILDING GUIDELINES FOR ENERGY EFFICIENCY ENERGY-EFFICIENT WINDOWS
SOUTH-FACING WINDOW WITH NO EXTERIOR SHADING
Without Interior Shades With Interior Shades
Electricity Consumption
South
-2.00
-1.00
0.00
1.00
2.00
3.00
4.00
0.00 0.10 0.20 0.30 0.40 0.50
Window Wall Ratio
Rel
ativ
e el
ectr
icity
con
sum
ptio
n in
kW
h/sf
-wal
l are
a/yr
Electricity Consumption
South
-2.00
-1.00
0.00
1.00
2.00
3.00
4.00
0.00 0.10 0.20 0.30 0.40 0.50
Window Wall Ratio
Rel
ativ
e el
ectr
icity
con
sum
ptio
n in
kW
h/sf
-wal
l are
a/yr
Peak Load
South
20
40
60
80
100
120
140
0.00 0.10 0.20 0.30 0.40 0.50
Window Wall Ratio
Peak
coo
ling
load
(Btu
/hr-
sf w
all a
rea)
Peak Load
South
20
40
60
80
100
120
140
0.00 0.10 0.20 0.30 0.40 0.50
Window Wall Ratio
Peak
coo
ling
load
(Btu
/hr-
sf w
all a
rea)
Lifecycle cost
South
-2
0
2
4
6
8
10
12
14
- 0.10 0.20 0.30 0.40 0.50
Window Wall Ratio
Rel
ativ
e LC
C in
$/s
f-yr
Lifecycle cost
South
-2
0
2
4
6
8
10
12
14
- 0.10 0.20 0.30 0.40 0.50
Window Wall Ratio
Rel
ativ
e LC
C in
$/s
f-yr
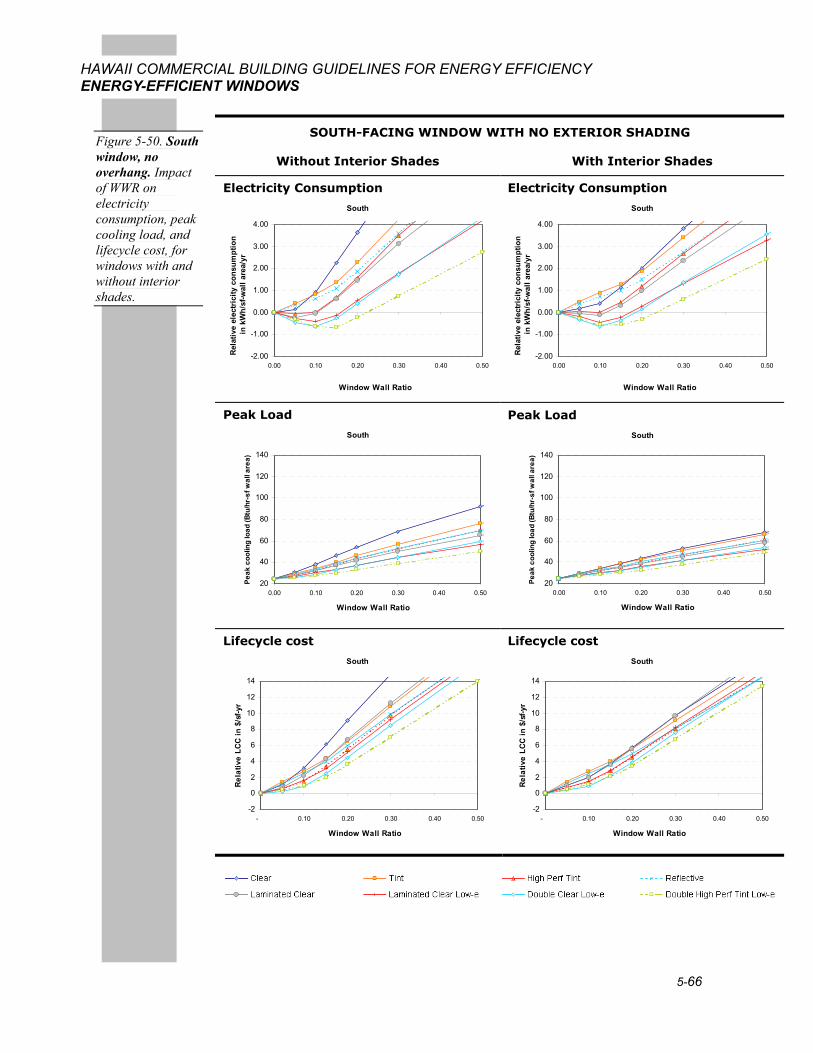
Figure 5-50. South window, no overhang. Impact of WWR on electricity consumption, peak cooling load, and lifecycle cost, for windows with and without interior shades.
5-67
HAWAII COMMERCIAL BUILDING GUIDELINES FOR ENERGY EFFICIENCY ENERGY-EFFICIENT WINDOWS
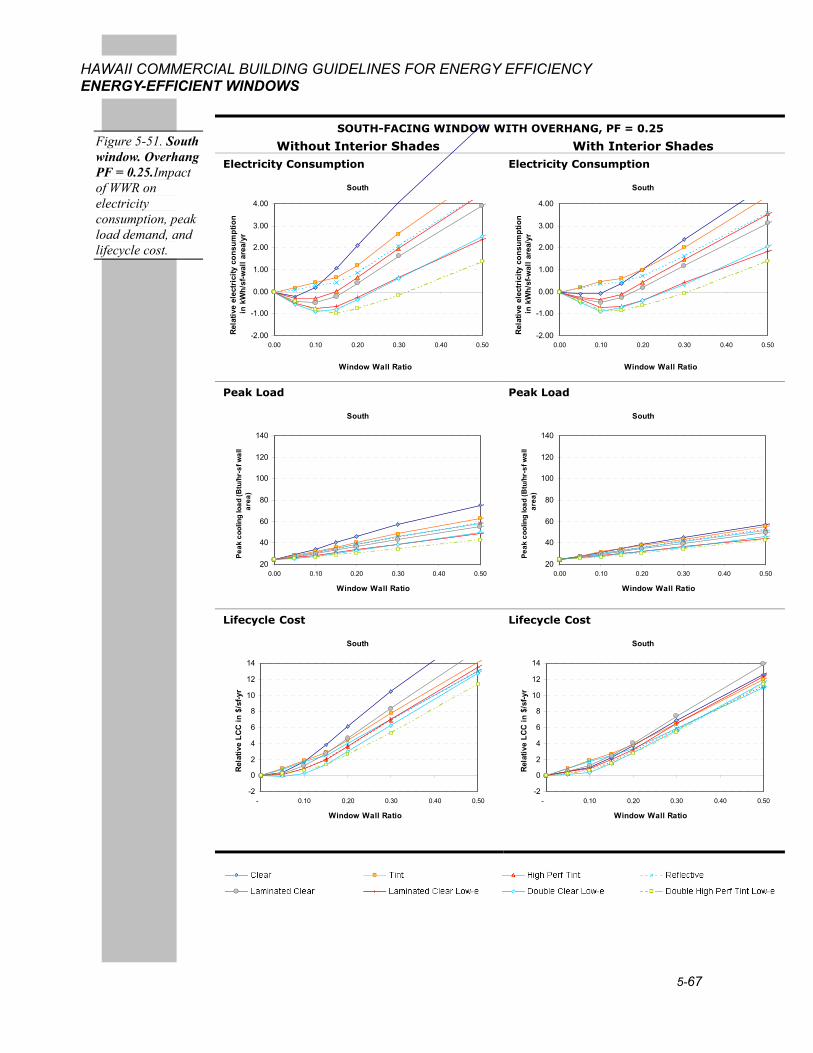
SOUTH-FACING WINDOW WITH OVERHANG, PF = 0.25
Without Interior Shades With Interior Shades Electricity Consumption
South
-2.00
-1.00
0.00
1.00
2.00
3.00
4.00
0.00 0.10 0.20 0.30 0.40 0.50
Window Wall Ratio
Rel
ativ
e el
ectr
icity
con
sum
ptio
n in
kW
h/sf
-wal
l are
a/yr
Electricity Consumption
South
-2.00
-1.00
0.00
1.00
2.00
3.00
4.00
0.00 0.10 0.20 0.30 0.40 0.50
Window Wall Ratio
Rel
ativ
e el
ectr
icity
con
sum
ptio
n in
kW
h/sf
-wal
l are
a/yr
Peak Load
South
20
40
60
80
100
120
140
0.00 0.10 0.20 0.30 0.40 0.50
Window Wall Ratio
Peak
coo
ling
load
(Btu
/hr-
sf w
all
area
)
Peak Load
South
20
40
60
80
100
120
140
0.00 0.10 0.20 0.30 0.40 0.50
Window Wall Ratio
Peak
coo
ling
load
(Btu
/hr-
sf w
all
area
)
Lifecycle Cost
South
-2
0
2
4
6
8
10
12
14
- 0.10 0.20 0.30 0.40 0.50
Window Wall Ratio
Rel
ativ
e LC
C in
$/s
f-yr
Lifecycle Cost
South
-2
0
2
4
6
8
10
12
14
- 0.10 0.20 0.30 0.40 0.50
Window Wall Ratio
Rel
ativ
e LC
C in
$/s
f-yr
Figure 5-51. South window. Overhang PF = 0.25.Impact of WWR on electricity consumption, peak load demand, and lifecycle cost.
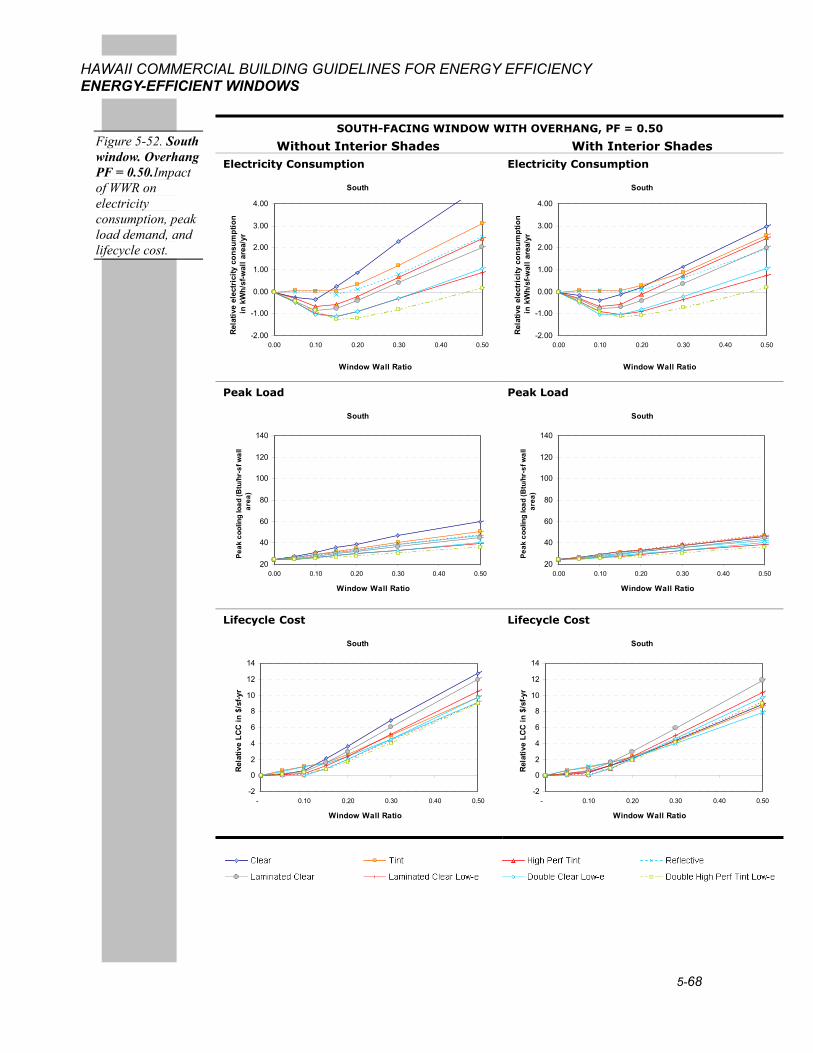
5-68
HAWAII COMMERCIAL BUILDING GUIDELINES FOR ENERGY EFFICIENCY ENERGY-EFFICIENT WINDOWS
SOUTH-FACING WINDOW WITH OVERHANG, PF = 0.50
Without Interior Shades With Interior Shades Electricity Consumption
South
-2.00
-1.00
0.00
1.00
2.00
3.00
4.00
0.00 0.10 0.20 0.30 0.40 0.50
Window Wall Ratio
Rel
ativ
e el
ectr
icity
con
sum
ptio
n in
kW
h/sf
-wal
l are
a/yr
Electricity Consumption
South
-2.00
-1.00
0.00
1.00
2.00
3.00
4.00
0.00 0.10 0.20 0.30 0.40 0.50
Window Wall Ratio
Rel
ativ
e el
ectr
icity
con
sum
ptio
n in
kW
h/sf
-wal
l are
a/yr
Peak Load
South
20
40
60
80
100
120
140
0.00 0.10 0.20 0.30 0.40 0.50
Window Wall Ratio
Peak
coo
ling
load
(Btu
/hr-
sf w
all
area
)
Peak Load
South
20
40
60
80
100
120
140
0.00 0.10 0.20 0.30 0.40 0.50
Window Wall Ratio
Peak
coo
ling
load
(Btu
/hr-
sf w
all
area
)
Lifecycle Cost
South
-2
0
2
4
6
8
10
12
14
- 0.10 0.20 0.30 0.40 0.50
Window Wall Ratio
Rel
ativ
e LC
C in
$/s
f-yr
Lifecycle Cost
South
-2
0
2
4
6
8
10
12
14
- 0.10 0.20 0.30 0.40 0.50
Window Wall Ratio
Rel
ativ
e LC
C in
$/s
f-yr
Figure 5-52. South window. Overhang PF = 0.50.Impact of WWR on electricity consumption, peak load demand, and lifecycle cost.
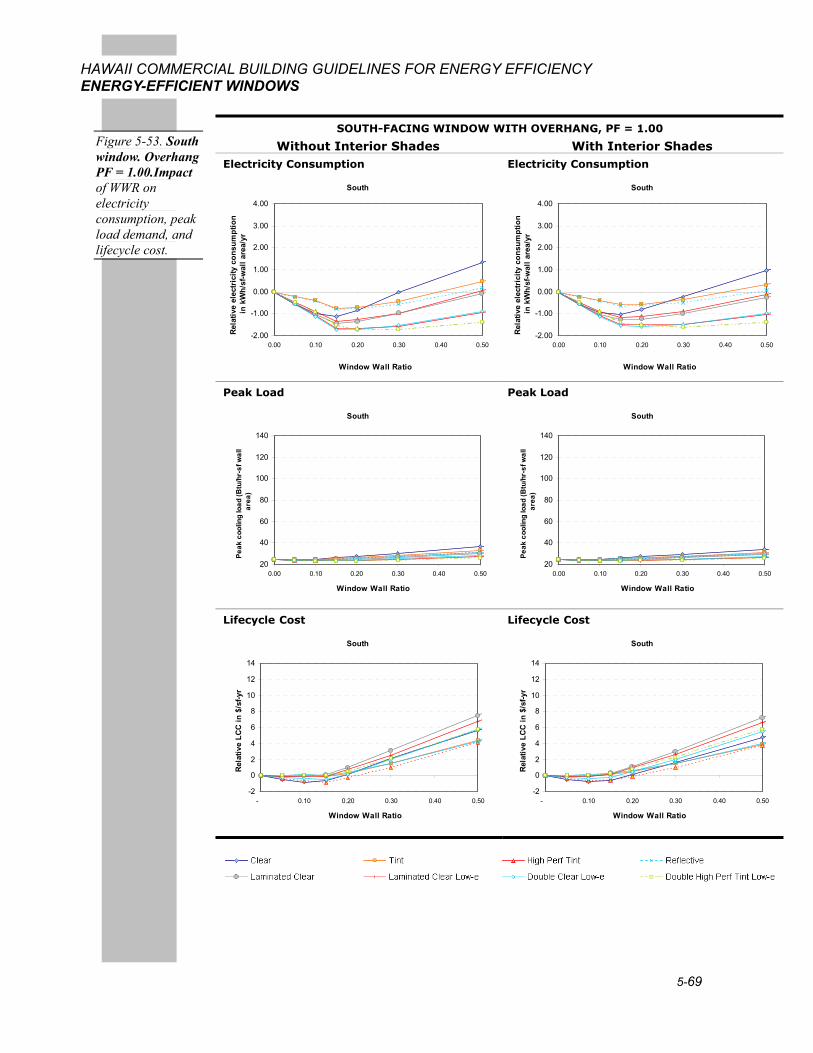
5-69
HAWAII COMMERCIAL BUILDING GUIDELINES FOR ENERGY EFFICIENCY ENERGY-EFFICIENT WINDOWS
SOUTH-FACING WINDOW WITH OVERHANG, PF = 1.00
Without Interior Shades With Interior Shades Electricity Consumption
South
-2.00
-1.00
0.00
1.00
2.00
3.00
4.00
0.00 0.10 0.20 0.30 0.40 0.50
Window Wall Ratio
Rel
ativ
e el
ectr
icity
con
sum
ptio
n in
kW
h/sf
-wal
l are
a/yr
Electricity Consumption
South
-2.00
-1.00
0.00
1.00
2.00
3.00
4.00
0.00 0.10 0.20 0.30 0.40 0.50
Window Wall Ratio
Rel
ativ
e el
ectr
icity
con
sum
ptio
n in
kW
h/sf
-wal
l are
a/yr
Peak Load
South
20
40
60
80
100
120
140
0.00 0.10 0.20 0.30 0.40 0.50
Window Wall Ratio
Peak
coo
ling
load
(Btu
/hr-
sf w
all
area
)
Peak Load
South
20
40
60
80
100
120
140
0.00 0.10 0.20 0.30 0.40 0.50
Window Wall Ratio
Peak
coo
ling
load
(Btu
/hr-
sf w
all
area
)
Lifecycle Cost
South
-2
0
2
4
6
8
10
12
14
- 0.10 0.20 0.30 0.40 0.50
Window Wall Ratio
Rel
ativ
e LC
C in
$/s
f-yr
Lifecycle Cost
South
-2
0
2
4
6
8
10
12
14
- 0.10 0.20 0.30 0.40 0.50
Window Wall Ratio
Rel
ativ
e LC
C in
$/s
f-yr
Figure 5-53. South window. Overhang PF = 1.00.Impact of WWR on electricity consumption, peak load demand, and lifecycle cost.
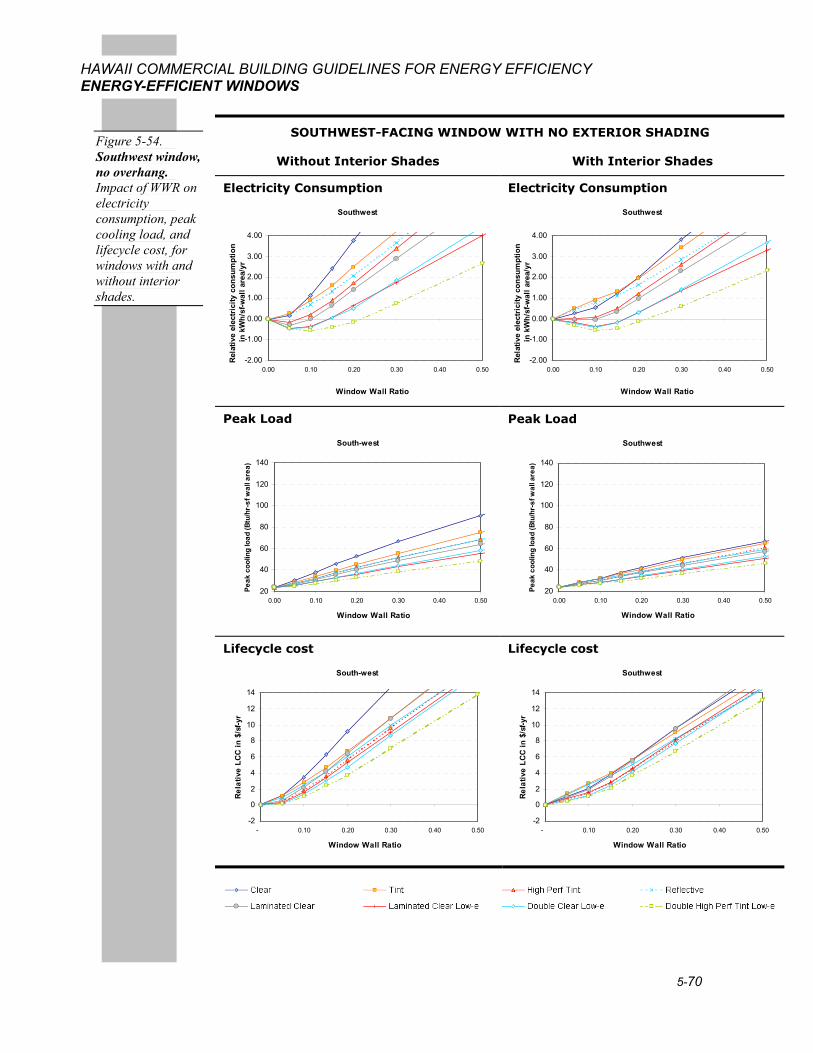
5-70
HAWAII COMMERCIAL BUILDING GUIDELINES FOR ENERGY EFFICIENCY ENERGY-EFFICIENT WINDOWS
SOUTHWEST-FACING WINDOW WITH NO EXTERIOR SHADING
Without Interior Shades With Interior Shades
Electricity Consumption
Southwest
-2.00
-1.00
0.00
1.00
2.00
3.00
4.00
0.00 0.10 0.20 0.30 0.40 0.50
Window Wall Ratio
Rel
ativ
e el
ectr
icity
con
sum
ptio
n in
kW
h/sf
-wal
l are
a/yr
Electricity Consumption
Southwest
-2.00
-1.00
0.00
1.00
2.00
3.00
4.00
0.00 0.10 0.20 0.30 0.40 0.50
Window Wall Ratio
Rel
ativ
e el
ectr
icity
con
sum
ptio
n in
kW
h/sf
-wal
l are
a/yr
Peak Load
South-west
20
40
60
80
100
120
140
0.00 0.10 0.20 0.30 0.40 0.50
Window Wall Ratio
Peak
coo
ling
load
(Btu
/hr-
sf w
all a
rea)
Peak Load
Southwest
20
40
60
80
100
120
140
0.00 0.10 0.20 0.30 0.40 0.50
Window Wall Ratio
Peak
coo
ling
load
(Btu
/hr-
sf w
all a
rea)
Lifecycle cost
South-west
-2
0
2
4
6
8
10
12
14
- 0.10 0.20 0.30 0.40 0.50
Window Wall Ratio
Rel
ativ
e LC
C in
$/s
f-yr
Lifecycle cost
Southwest
-2
0
2
4
6
8
10
12
14
- 0.10 0.20 0.30 0.40 0.50
Window Wall Ratio
Rel
ativ
e LC
C in
$/s
f-yr
Figure 5-54. Southwest window, no overhang. Impact of WWR on electricity consumption, peak cooling load, and lifecycle cost, for windows with and without interior shades.
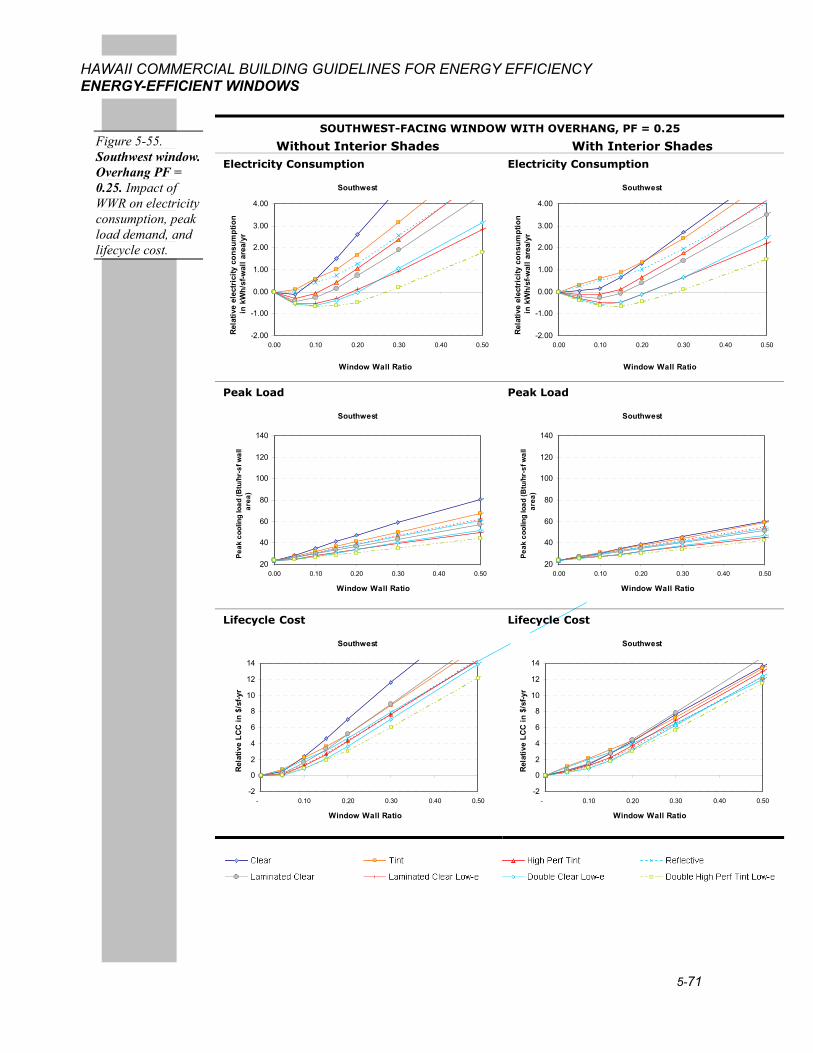
5-71
HAWAII COMMERCIAL BUILDING GUIDELINES FOR ENERGY EFFICIENCY ENERGY-EFFICIENT WINDOWS
SOUTHWEST-FACING WINDOW WITH OVERHANG, PF = 0.25
Without Interior Shades With Interior Shades Electricity Consumption
Southwest
-2.00
-1.00
0.00
1.00
2.00
3.00
4.00
0.00 0.10 0.20 0.30 0.40 0.50
Window Wall Ratio
Rel
ativ
e el
ectr
icity
con
sum
ptio
n in
kW
h/sf
-wal
l are
a/yr
Electricity Consumption
Southwest
-2.00
-1.00
0.00
1.00
2.00
3.00
4.00
0.00 0.10 0.20 0.30 0.40 0.50
Window Wall Ratio
Rel
ativ
e el
ectr
icity
con
sum
ptio
n in
kW
h/sf
-wal
l are
a/yr
Peak Load
Southwest
20
40
60
80
100
120
140
0.00 0.10 0.20 0.30 0.40 0.50
Window Wall Ratio
Peak
coo
ling
load
(Btu
/hr-
sf w
all
area
)
Peak Load
Southwest
20
40
60
80
100
120
140
0.00 0.10 0.20 0.30 0.40 0.50
Window Wall Ratio
Peak
coo
ling
load
(Btu
/hr-
sf w
all
area
)
Lifecycle Cost
Southwest
-2
0
2
4
6
8
10
12
14
- 0.10 0.20 0.30 0.40 0.50
Window Wall Ratio
Rel
ativ
e LC
C in
$/s
f-yr
Lifecycle Cost
Southwest
-2
0
2
4
6
8
10
12
14
- 0.10 0.20 0.30 0.40 0.50
Window Wall Ratio
Rel
ativ
e LC
C in
$/s
f-yr
Figure 5-55. Southwest window. Overhang PF = 0.25. Impact of WWR on electricity consumption, peak load demand, and lifecycle cost.
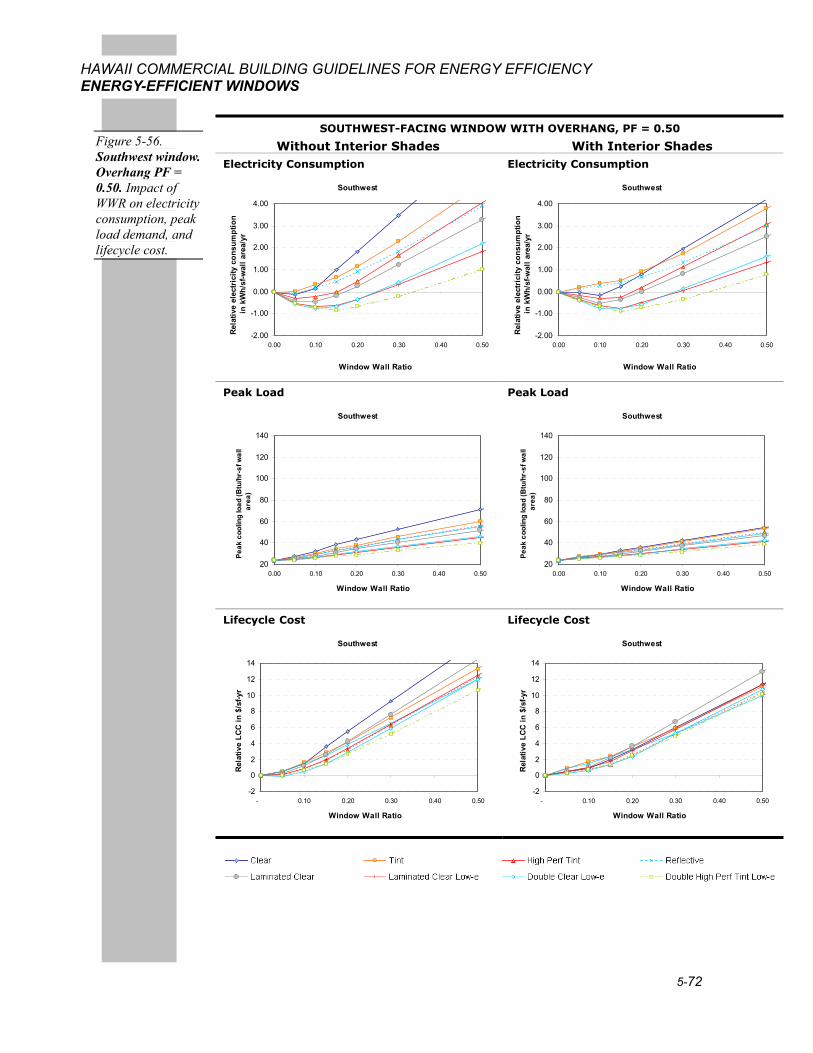
5-72
HAWAII COMMERCIAL BUILDING GUIDELINES FOR ENERGY EFFICIENCY ENERGY-EFFICIENT WINDOWS
SOUTHWEST-FACING WINDOW WITH OVERHANG, PF = 0.50
Without Interior Shades With Interior Shades Electricity Consumption
Southwest
-2.00
-1.00
0.00
1.00
2.00
3.00
4.00
0.00 0.10 0.20 0.30 0.40 0.50
Window Wall Ratio
Rel
ativ
e el
ectr
icity
con
sum
ptio
n in
kW
h/sf
-wal
l are
a/yr
Electricity Consumption
Southwest
-2.00
-1.00
0.00
1.00
2.00
3.00
4.00
0.00 0.10 0.20 0.30 0.40 0.50
Window Wall Ratio
Rel
ativ
e el
ectr
icity
con
sum
ptio
n in
kW
h/sf
-wal
l are
a/yr
Peak Load
Southwest
20
40
60
80
100
120
140
0.00 0.10 0.20 0.30 0.40 0.50
Window Wall Ratio
Peak
coo
ling
load
(Btu
/hr-
sf w
all
area
)
Peak Load
Southwest
20
40
60
80
100
120
140
0.00 0.10 0.20 0.30 0.40 0.50
Window Wall Ratio
Peak
coo
ling
load
(Btu
/hr-
sf w
all
area
)
Lifecycle Cost
Southwest
-2
0
2
4
6
8
10
12
14
- 0.10 0.20 0.30 0.40 0.50
Window Wall Ratio
Rel
ativ
e LC
C in
$/s
f-yr
Lifecycle Cost
Southwest
-2
0
2
4
6
8
10
12
14
- 0.10 0.20 0.30 0.40 0.50
Window Wall Ratio
Rel
ativ
e LC
C in
$/s
f-yr
Figure 5-56. Southwest window. Overhang PF = 0.50. Impact of WWR on electricity consumption, peak load demand, and lifecycle cost.
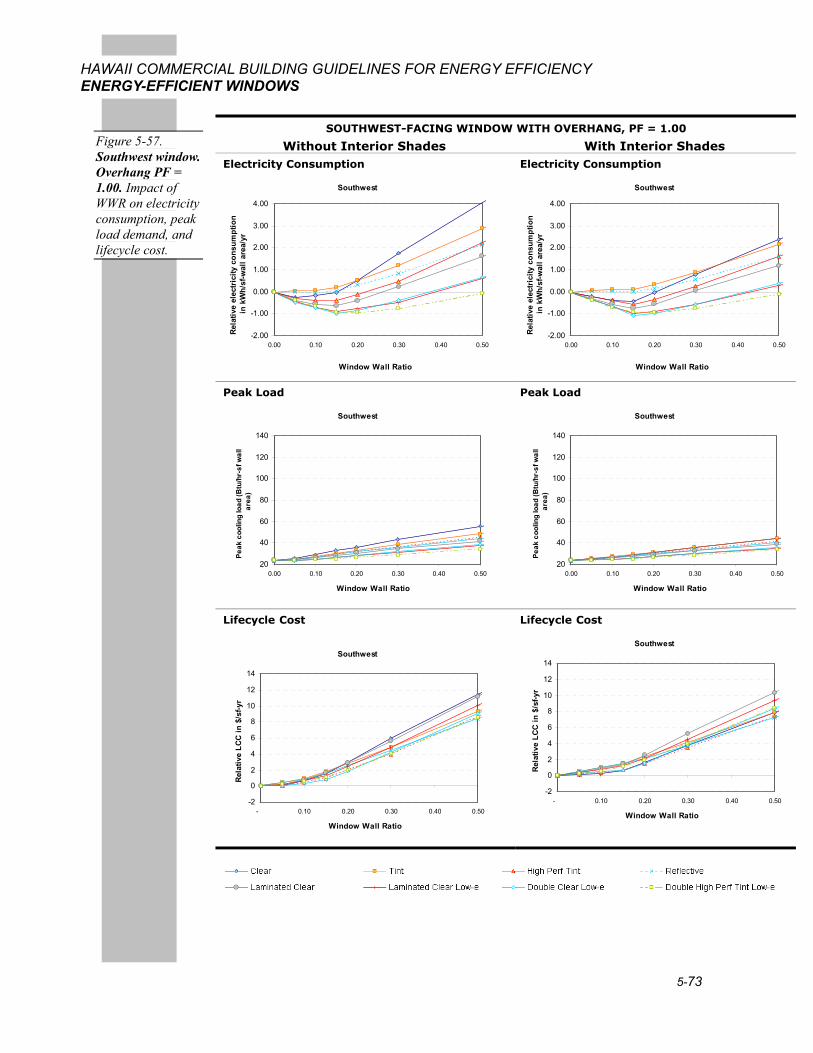
5-73
HAWAII COMMERCIAL BUILDING GUIDELINES FOR ENERGY EFFICIENCY ENERGY-EFFICIENT WINDOWS
SOUTHWEST-FACING WINDOW WITH OVERHANG, PF = 1.00
Without Interior Shades With Interior Shades Electricity Consumption
Southwest
-2.00
-1.00
0.00
1.00
2.00
3.00
4.00
0.00 0.10 0.20 0.30 0.40 0.50
Window Wall Ratio
Rel
ativ
e el
ectr
icity
con
sum
ptio
n in
kW
h/sf
-wal
l are
a/yr
Electricity Consumption
Southwest
-2.00
-1.00
0.00
1.00
2.00
3.00
4.00
0.00 0.10 0.20 0.30 0.40 0.50
Window Wall Ratio
Rel
ativ
e el
ectr
icity
con
sum
ptio
n in
kW
h/sf
-wal
l are
a/yr
Peak Load
Southwest
20
40
60
80
100
120
140
0.00 0.10 0.20 0.30 0.40 0.50
Window Wall Ratio
Peak
coo
ling
load
(Btu
/hr-
sf w
all
area
)
Peak Load
Southwest
20
40
60
80
100
120
140
0.00 0.10 0.20 0.30 0.40 0.50
Window Wall Ratio
Peak
coo
ling
load
(Btu
/hr-
sf w
all
area
)
Lifecycle Cost
Southwest
-2
0
2
4
6
8
10
12
14
- 0.10 0.20 0.30 0.40 0.50
Window Wall Ratio
Rel
ativ
e LC
C in
$/s
f-yr
Lifecycle Cost
Southwest
-2
0
2
4
6
8
10
12
14
- 0.10 0.20 0.30 0.40 0.50
Window Wall Ratio
Rel
ativ
e LC
C in
$/s
f-yr
Figure 5-57. Southwest window. Overhang PF = 1.00. Impact of WWR on electricity consumption, peak load demand, and lifecycle cost.
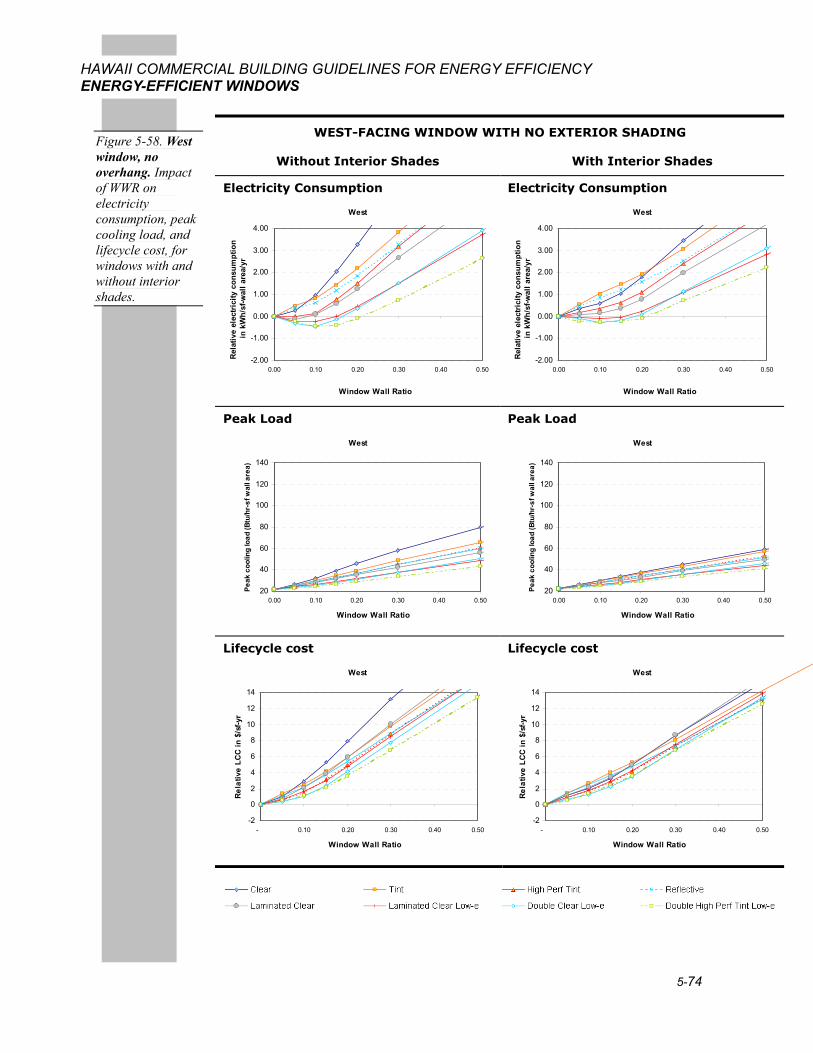
5-74
HAWAII COMMERCIAL BUILDING GUIDELINES FOR ENERGY EFFICIENCY ENERGY-EFFICIENT WINDOWS
WEST-FACING WINDOW WITH NO EXTERIOR SHADING
Without Interior Shades With Interior Shades
Electricity Consumption
West
-2.00
-1.00
0.00
1.00
2.00
3.00
4.00
0.00 0.10 0.20 0.30 0.40 0.50
Window Wall Ratio
Rel
ativ
e el
ectr
icity
con
sum
ptio
n in
kW
h/sf
-wal
l are
a/yr
Electricity Consumption
West
-2.00
-1.00
0.00
1.00
2.00
3.00
4.00
0.00 0.10 0.20 0.30 0.40 0.50
Window Wall Ratio
Rel
ativ
e el
ectr
icity
con
sum
ptio
n in
kW
h/sf
-wal
l are
a/yr
Peak Load
West
20
40
60
80
100
120
140
0.00 0.10 0.20 0.30 0.40 0.50
Window Wall Ratio
Peak
coo
ling
load
(Btu
/hr-
sf w
all a
rea)
Peak Load
West
20
40
60
80
100
120
140
0.00 0.10 0.20 0.30 0.40 0.50
Window Wall Ratio
Peak
coo
ling
load
(Btu
/hr-
sf w
all a
rea)
Lifecycle cost
West
-2
0
2
4
6
8
10
12
14
- 0.10 0.20 0.30 0.40 0.50
Window Wall Ratio
Rel
ativ
e LC
C in
$/s
f-yr
Lifecycle cost
West
-2
0
2
4
6
8
10
12
14
- 0.10 0.20 0.30 0.40 0.50
Window Wall Ratio
Rel
ativ
e LC
C in
$/s
f-yr
Figure 5-58. West window, no overhang. Impact of WWR on electricity consumption, peak cooling load, and lifecycle cost, for windows with and without interior shades.
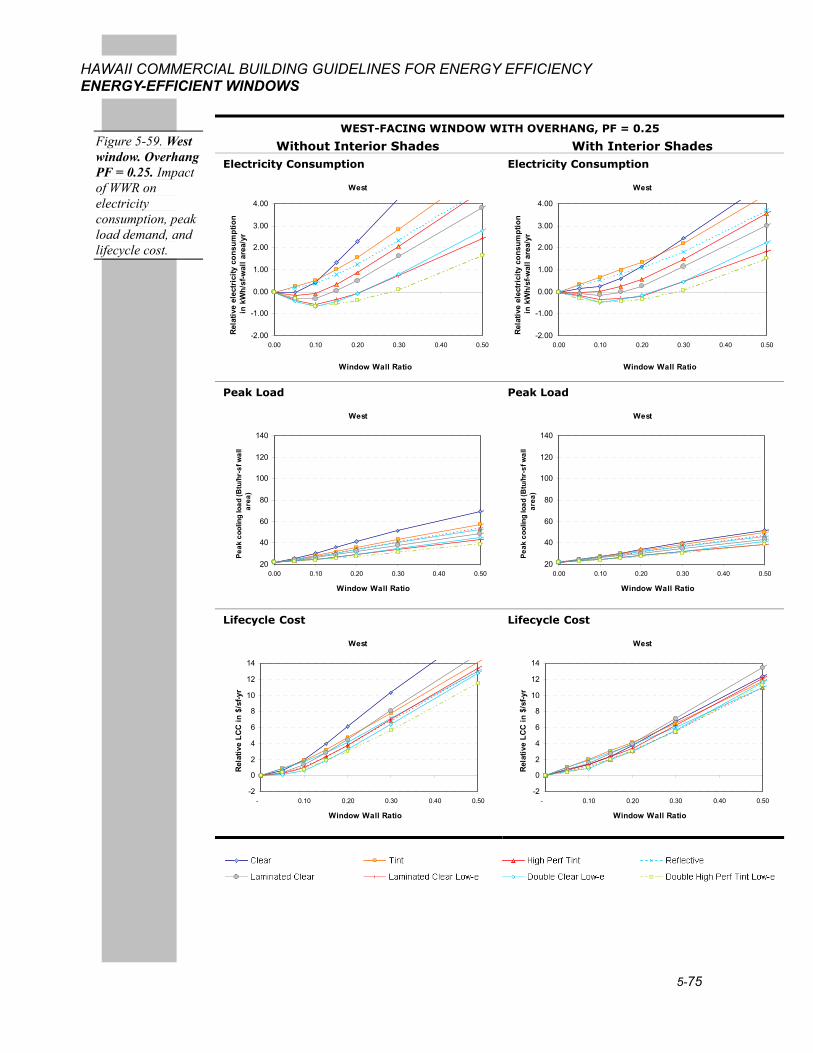
5-75
HAWAII COMMERCIAL BUILDING GUIDELINES FOR ENERGY EFFICIENCY ENERGY-EFFICIENT WINDOWS
WEST-FACING WINDOW WITH OVERHANG, PF = 0.25
Without Interior Shades With Interior Shades Electricity Consumption
West
-2.00
-1.00
0.00
1.00
2.00
3.00
4.00
0.00 0.10 0.20 0.30 0.40 0.50
Window Wall Ratio
Rel
ativ
e el
ectr
icity
con
sum
ptio
n in
kW
h/sf
-wal
l are
a/yr
Electricity Consumption
West
-2.00
-1.00
0.00
1.00
2.00
3.00
4.00
0.00 0.10 0.20 0.30 0.40 0.50
Window Wall Ratio
Rel
ativ
e el
ectr
icity
con
sum
ptio
n in
kW
h/sf
-wal
l are
a/yr
Peak Load
West
20
40
60
80
100
120
140
0.00 0.10 0.20 0.30 0.40 0.50
Window Wall Ratio
Peak
coo
ling
load
(Btu
/hr-
sf w
all
area
)
Peak Load
West
20
40
60
80
100
120
140
0.00 0.10 0.20 0.30 0.40 0.50
Window Wall Ratio
Peak
coo
ling
load
(Btu
/hr-
sf w
all
area
)
Lifecycle Cost
West
-2
0
2
4
6
8
10
12
14
- 0.10 0.20 0.30 0.40 0.50
Window Wall Ratio
Rel
ativ
e LC
C in
$/s
f-yr
Lifecycle Cost
West
-2
0
2
4
6
8
10
12
14
- 0.10 0.20 0.30 0.40 0.50
Window Wall Ratio
Rel
ativ
e LC
C in
$/s
f-yr
Figure 5-59. West window. Overhang PF = 0.25. Impact of WWR on electricity consumption, peak load demand, and lifecycle cost.
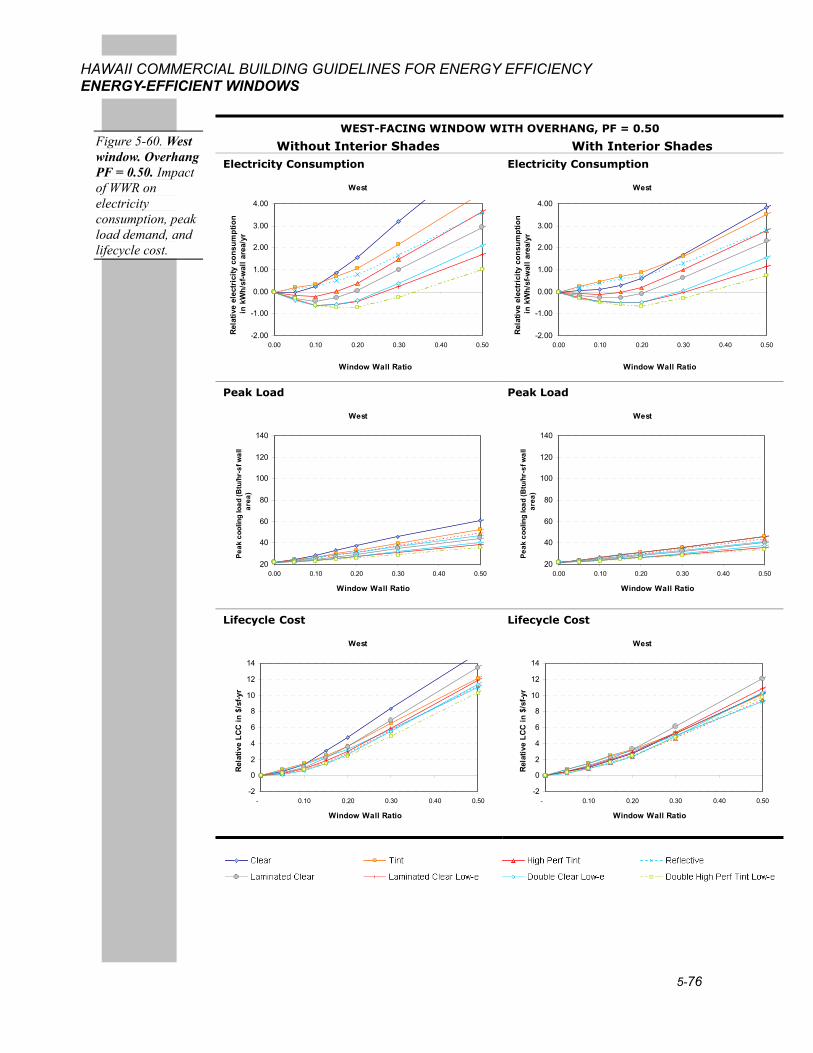
5-76
HAWAII COMMERCIAL BUILDING GUIDELINES FOR ENERGY EFFICIENCY ENERGY-EFFICIENT WINDOWS
WEST-FACING WINDOW WITH OVERHANG, PF = 0.50
Without Interior Shades With Interior Shades Electricity Consumption
West
-2.00
-1.00
0.00
1.00
2.00
3.00
4.00
0.00 0.10 0.20 0.30 0.40 0.50
Window Wall Ratio
Rel
ativ
e el
ectr
icity
con
sum
ptio
n in
kW
h/sf
-wal
l are
a/yr
Electricity Consumption
West
-2.00
-1.00
0.00
1.00
2.00
3.00
4.00
0.00 0.10 0.20 0.30 0.40 0.50
Window Wall Ratio
Rel
ativ
e el
ectr
icity
con
sum
ptio
n in
kW
h/sf
-wal
l are
a/yr
Peak Load
West
20
40
60
80
100
120
140
0.00 0.10 0.20 0.30 0.40 0.50
Window Wall Ratio
Peak
coo
ling
load
(Btu
/hr-
sf w
all
area
)
Peak Load
West
20
40
60
80
100
120
140
0.00 0.10 0.20 0.30 0.40 0.50
Window Wall Ratio
Peak
coo
ling
load
(Btu
/hr-
sf w
all
area
)
Lifecycle Cost
West
-2
0
2
4
6
8
10
12
14
- 0.10 0.20 0.30 0.40 0.50
Window Wall Ratio
Rel
ativ
e LC
C in
$/s
f-yr
Lifecycle Cost
West
-2
0
2
4
6
8
10
12
14
- 0.10 0.20 0.30 0.40 0.50
Window Wall Ratio
Rel
ativ
e LC
C in
$/s
f-yr
Figure 5-60. West window. Overhang PF = 0.50. Impact of WWR on electricity consumption, peak load demand, and lifecycle cost.
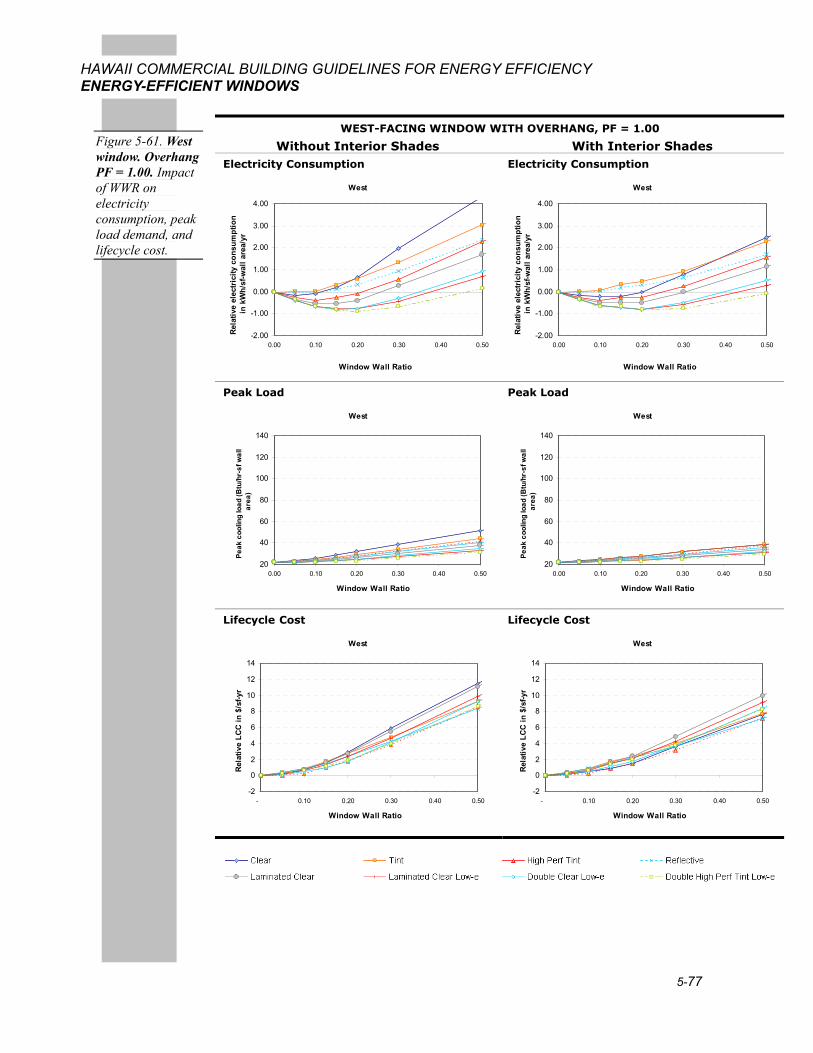
5-77
HAWAII COMMERCIAL BUILDING GUIDELINES FOR ENERGY EFFICIENCY ENERGY-EFFICIENT WINDOWS
WEST-FACING WINDOW WITH OVERHANG, PF = 1.00
Without Interior Shades With Interior Shades Electricity Consumption
West
-2.00
-1.00
0.00
1.00
2.00
3.00
4.00
0.00 0.10 0.20 0.30 0.40 0.50
Window Wall Ratio
Rel
ativ
e el
ectr
icity
con
sum
ptio
n in
kW
h/sf
-wal
l are
a/yr
Electricity Consumption
West
-2.00
-1.00
0.00
1.00
2.00
3.00
4.00
0.00 0.10 0.20 0.30 0.40 0.50
Window Wall Ratio
Rel
ativ
e el
ectr
icity
con
sum
ptio
n in
kW
h/sf
-wal
l are
a/yr
Peak Load
West
20
40
60
80
100
120
140
0.00 0.10 0.20 0.30 0.40 0.50
Window Wall Ratio
Peak
coo
ling
load
(Btu
/hr-
sf w
all
area
)
Peak Load
West
20
40
60
80
100
120
140
0.00 0.10 0.20 0.30 0.40 0.50
Window Wall Ratio
Peak
coo
ling
load
(Btu
/hr-
sf w
all
area
)
Lifecycle Cost
West
-2
0
2
4
6
8
10
12
14
- 0.10 0.20 0.30 0.40 0.50
Window Wall Ratio
Rel
ativ
e LC
C in
$/s
f-yr
Lifecycle Cost
West
-2
0
2
4
6
8
10
12
14
- 0.10 0.20 0.30 0.40 0.50
Window Wall Ratio
Rel
ativ
e LC
C in
$/s
f-yr
Figure 5-61. West window. Overhang PF = 1.00. Impact of WWR on electricity consumption, peak load demand, and lifecycle cost.
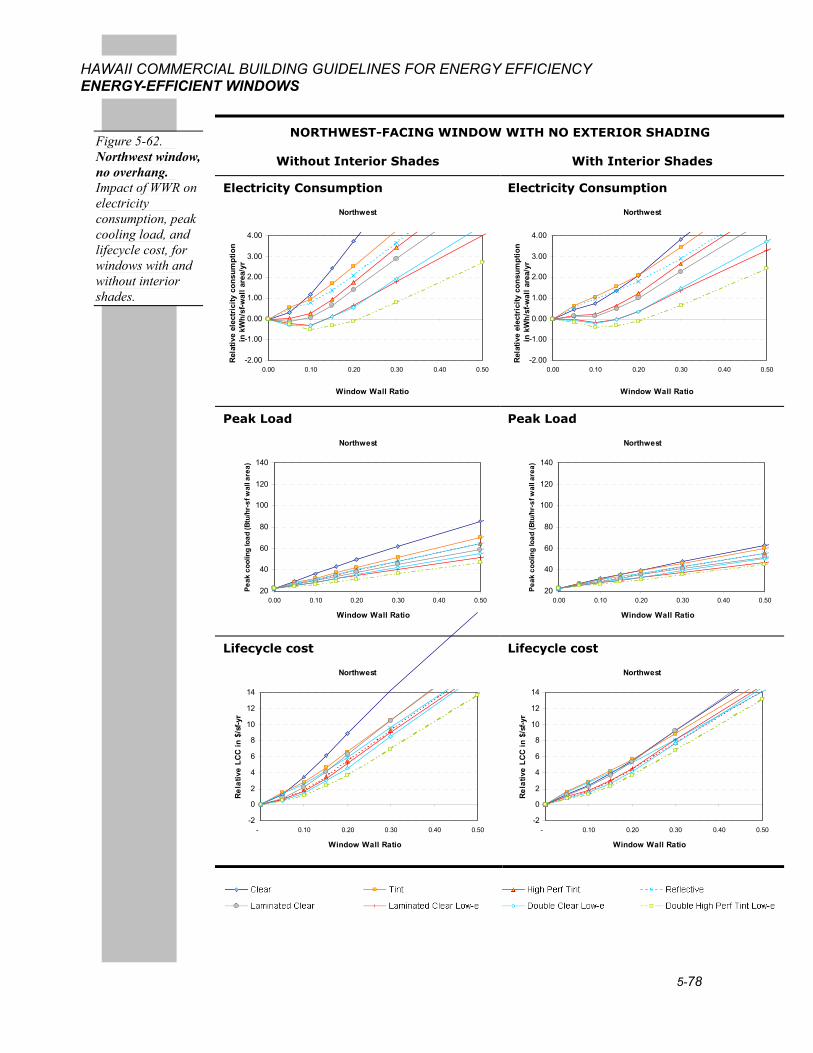
5-78
HAWAII COMMERCIAL BUILDING GUIDELINES FOR ENERGY EFFICIENCY ENERGY-EFFICIENT WINDOWS
NORTHWEST-FACING WINDOW WITH NO EXTERIOR SHADING
Without Interior Shades With Interior Shades
Electricity Consumption
Northwest
-2.00
-1.00
0.00
1.00
2.00
3.00
4.00
0.00 0.10 0.20 0.30 0.40 0.50
Window Wall Ratio
Rel
ativ
e el
ectr
icity
con
sum
ptio
n in
kW
h/sf
-wal
l are
a/yr
Electricity Consumption
Northwest
-2.00
-1.00
0.00
1.00
2.00
3.00
4.00
0.00 0.10 0.20 0.30 0.40 0.50
Window Wall Ratio
Rel
ativ
e el
ectr
icity
con
sum
ptio
n in
kW
h/sf
-wal
l are
a/yr
Peak Load
Northwest
20
40
60
80
100
120
140
0.00 0.10 0.20 0.30 0.40 0.50
Window Wall Ratio
Peak
coo
ling
load
(Btu
/hr-
sf w
all a
rea)
Peak Load
Northwest
20
40
60
80
100
120
140
0.00 0.10 0.20 0.30 0.40 0.50
Window Wall Ratio
Peak
coo
ling
load
(Btu
/hr-
sf w
all a
rea)
Lifecycle cost
Northwest
-2
0
2
4
6
8
10
12
14
- 0.10 0.20 0.30 0.40 0.50
Window Wall Ratio
Rel
ativ
e LC
C in
$/s
f-yr
Lifecycle cost
Northwest
-2
0
2
4
6
8
10
12
14
- 0.10 0.20 0.30 0.40 0.50
Window Wall Ratio
Rel
ativ
e LC
C in
$/s
f-yr
Figure 5-62. Northwest window, no overhang. Impact of WWR on electricity consumption, peak cooling load, and lifecycle cost, for windows with and without interior shades.
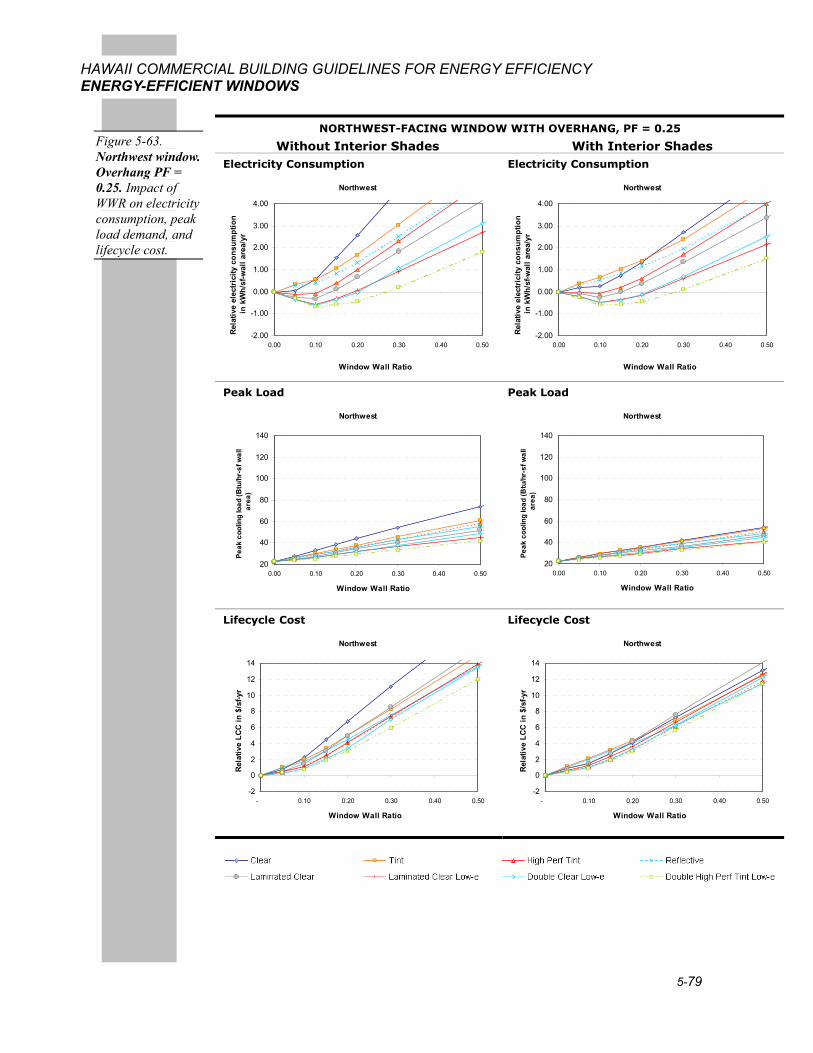
5-79
HAWAII COMMERCIAL BUILDING GUIDELINES FOR ENERGY EFFICIENCY ENERGY-EFFICIENT WINDOWS
NORTHWEST-FACING WINDOW WITH OVERHANG, PF = 0.25
Without Interior Shades With Interior Shades Electricity Consumption
Northwest
-2.00
-1.00
0.00
1.00
2.00
3.00
4.00
0.00 0.10 0.20 0.30 0.40 0.50
Window Wall Ratio
Rel
ativ
e el
ectr
icity
con
sum
ptio
n in
kW
h/sf
-wal
l are
a/yr
Electricity Consumption
Northwest
-2.00
-1.00
0.00
1.00
2.00
3.00
4.00
0.00 0.10 0.20 0.30 0.40 0.50
Window Wall Ratio
Rel
ativ
e el
ectr
icity
con
sum
ptio
n in
kW
h/sf
-wal
l are
a/yr
Peak Load
Northwest
20
40
60
80
100
120
140
0.00 0.10 0.20 0.30 0.40 0.50
Window Wall Ratio
Peak
coo
ling
load
(Btu
/hr-
sf w
all
area
)
Peak Load
Northwest
20
40
60
80
100
120
140
0.00 0.10 0.20 0.30 0.40 0.50
Window Wall Ratio
Peak
coo
ling
load
(Btu
/hr-
sf w
all
area
)
Lifecycle Cost
Northwest
-2
0
2
4
6
8
10
12
14
- 0.10 0.20 0.30 0.40 0.50
Window Wall Ratio
Rel
ativ
e LC
C in
$/s
f-yr
Lifecycle Cost
Northwest
-2
0
2
4
6
8
10
12
14
- 0.10 0.20 0.30 0.40 0.50
Window Wall Ratio
Rel
ativ
e LC
C in
$/s
f-yr
Figure 5-63. Northwest window. Overhang PF = 0.25. Impact of WWR on electricity consumption, peak load demand, and lifecycle cost.
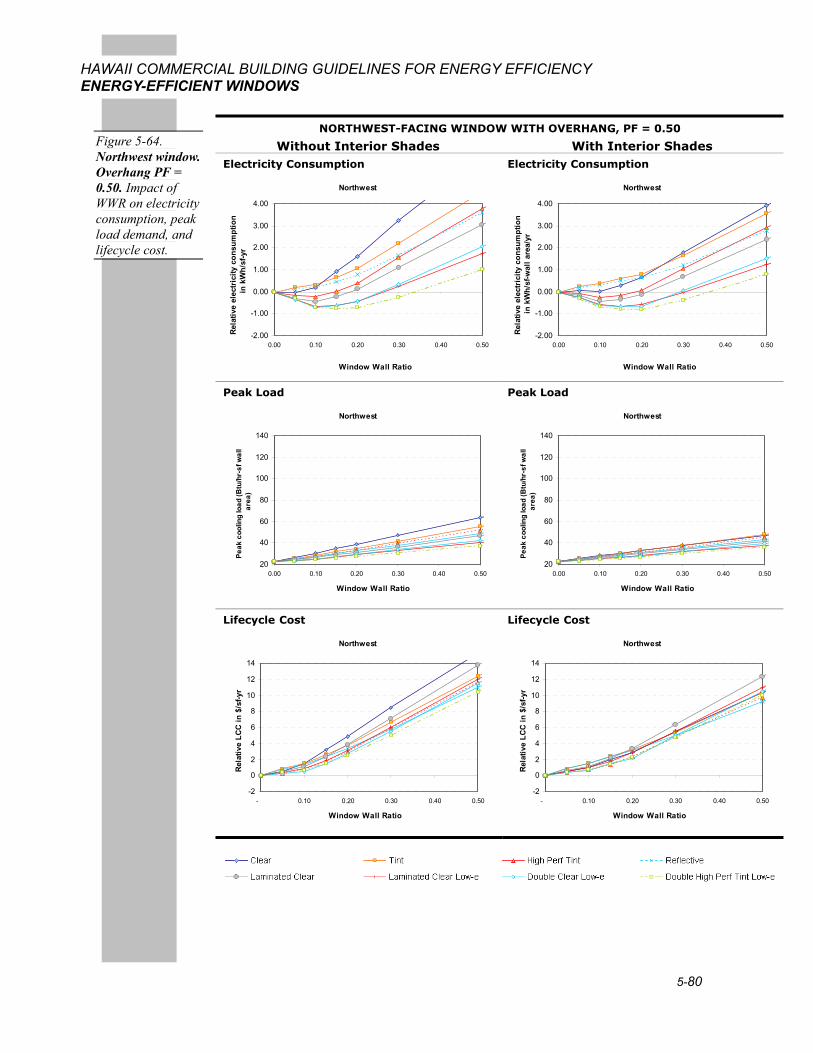
5-80
HAWAII COMMERCIAL BUILDING GUIDELINES FOR ENERGY EFFICIENCY ENERGY-EFFICIENT WINDOWS
NORTHWEST-FACING WINDOW WITH OVERHANG, PF = 0.50
Without Interior Shades With Interior Shades Electricity Consumption
Northwest
-2.00
-1.00
0.00
1.00
2.00
3.00
4.00
0.00 0.10 0.20 0.30 0.40 0.50
Window Wall Ratio
Rel
ativ
e el
ectr
icity
con
sum
ptio
n in
kW
h/sf
-yr
Electricity Consumption
Northwest
-2.00
-1.00
0.00
1.00
2.00
3.00
4.00
0.00 0.10 0.20 0.30 0.40 0.50
Window Wall Ratio
Rel
ativ
e el
ectr
icity
con
sum
ptio
n in
kW
h/sf
-wal
l are
a/yr
Peak Load
Northwest
20
40
60
80
100
120
140
0.00 0.10 0.20 0.30 0.40 0.50
Window Wall Ratio
Peak
coo
ling
load
(Btu
/hr-
sf w
all
area
)
Peak Load
Northwest
20
40
60
80
100
120
140
0.00 0.10 0.20 0.30 0.40 0.50
Window Wall Ratio
Peak
coo
ling
load
(Btu
/hr-
sf w
all
area
)
Lifecycle Cost
Northwest
-2
0
2
4
6
8
10
12
14
- 0.10 0.20 0.30 0.40 0.50
Window Wall Ratio
Rel
ativ
e LC
C in
$/s
f-yr
Lifecycle Cost
Northwest
-2
0
2
4
6
8
10
12
14
- 0.10 0.20 0.30 0.40 0.50
Window Wall Ratio
Rel
ativ
e LC
C in
$/s
f-yr
Figure 5-64. Northwest window. Overhang PF = 0.50. Impact of WWR on electricity consumption, peak load demand, and lifecycle cost.
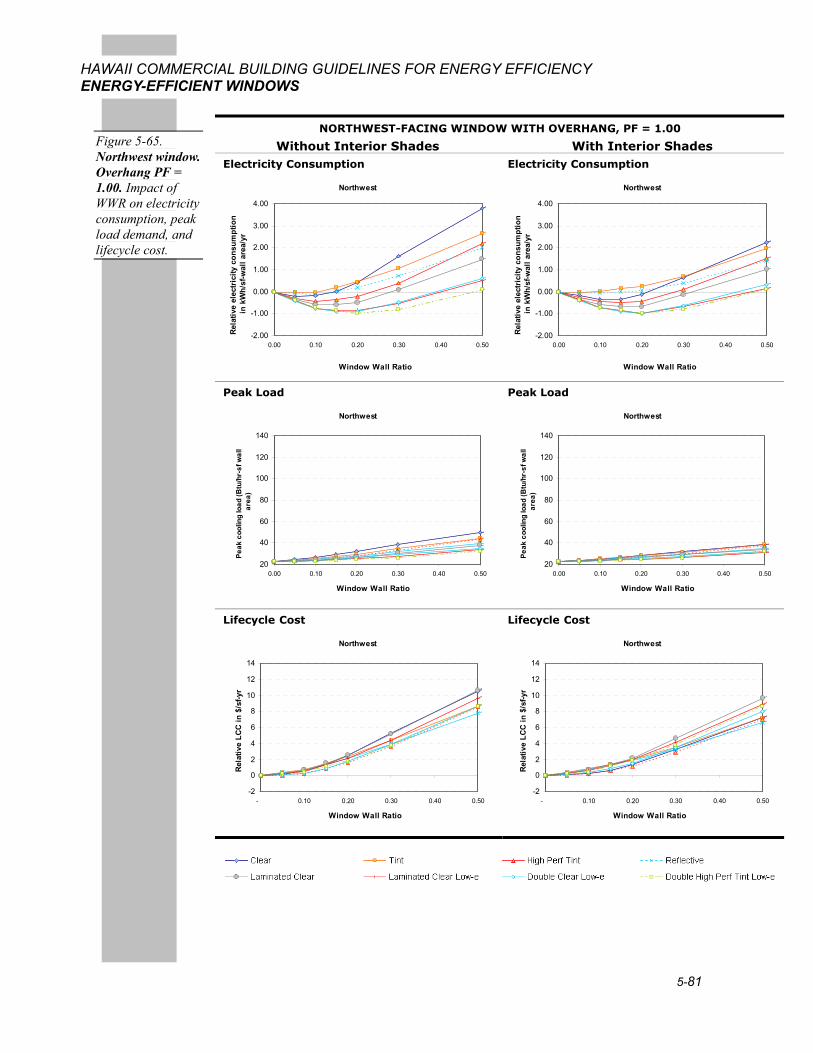
5-81
HAWAII COMMERCIAL BUILDING GUIDELINES FOR ENERGY EFFICIENCY ENERGY-EFFICIENT WINDOWS
NORTHWEST-FACING WINDOW WITH OVERHANG, PF = 1.00
Without Interior Shades With Interior Shades Electricity Consumption
Northwest
-2.00
-1.00
0.00
1.00
2.00
3.00
4.00
0.00 0.10 0.20 0.30 0.40 0.50
Window Wall Ratio
Rel
ativ
e el
ectr
icity
con
sum
ptio
n in
kW
h/sf
-wal
l are
a/yr
Electricity Consumption
Northwest
-2.00
-1.00
0.00
1.00
2.00
3.00
4.00
0.00 0.10 0.20 0.30 0.40 0.50
Window Wall Ratio
Rel
ativ
e el
ectr
icity
con
sum
ptio
n in
kW
h/sf
-wal
l are
a/yr
Peak Load
Northwest
20
40
60
80
100
120
140
0.00 0.10 0.20 0.30 0.40 0.50
Window Wall Ratio
Peak
coo
ling
load
(Btu
/hr-
sf w
all
area
)
Peak Load
Northwest
20
40
60
80
100
120
140
0.00 0.10 0.20 0.30 0.40 0.50
Window Wall Ratio
Peak
coo
ling
load
(Btu
/hr-
sf w
all
area
)
Lifecycle Cost
Northwest
-2
0
2
4
6
8
10
12
14
- 0.10 0.20 0.30 0.40 0.50
Window Wall Ratio
Rel
ativ
e LC
C in
$/s
f-yr
Lifecycle Cost
Northwest
-2
0
2
4
6
8
10
12
14
- 0.10 0.20 0.30 0.40 0.50
Window Wall Ratio
Rel
ativ
e LC
C in
$/s
f-yr
Figure 5-65. Northwest window. Overhang PF = 1.00. Impact of WWR on electricity consumption, peak load demand, and lifecycle cost.
6-1
HAWAII COMMERCIAL BUILDING GUIDELINES FOR ENERGY EFFICIENCY COOL ROOF SYSTEMS
6. COOL ROOF SYSTEMS Overview...........................................................................................................6-1 Low-slope Roofs.............................................................................................6-12 Sloped Roofs ..................................................................................................6-20
Overview
The purpose of this chapter is to provide designers with recommendations for cool roof systems that provide cost effective energy savings and meet or exceed the Hawaii Energy Code requirements. 1
“Cool roof systems” reduce solar heat gain using a combination of strategies, including “cool roof” surfaces, insulation, and radiant barriers.
The term “cool roof” is typically used to describe surfaces with high solar reflectance and high emissivity. A high solar reflectance means that more solar radiation is reflected and less is absorbed by the roof surface, keeping the surface temperature lower and reducing heat gain. Such surfaces are usually light in color. A high emittance helps the roof in rapidly losing heat by allowing radiation to the sky, when the surrounding environment is cooler.
Cool roof systems as described in this chapter cover more than just the surface. Several factors affect a roof’s energy performance.
Membrane characteristics
Insulation type and thickness
Use of a radiant barrier
Presence of air gaps and ventilation
Fortunately for the designer, various combinations of these strategies can provide equal performance. The sections titled Low-slope Roofs and Sloped Roofs provide details on a range of recommended designs.
1 Note that even though the guideline focuses on thermal performance, moisture resistance is the primary roof function and must be the designer’s first consideration.
Description
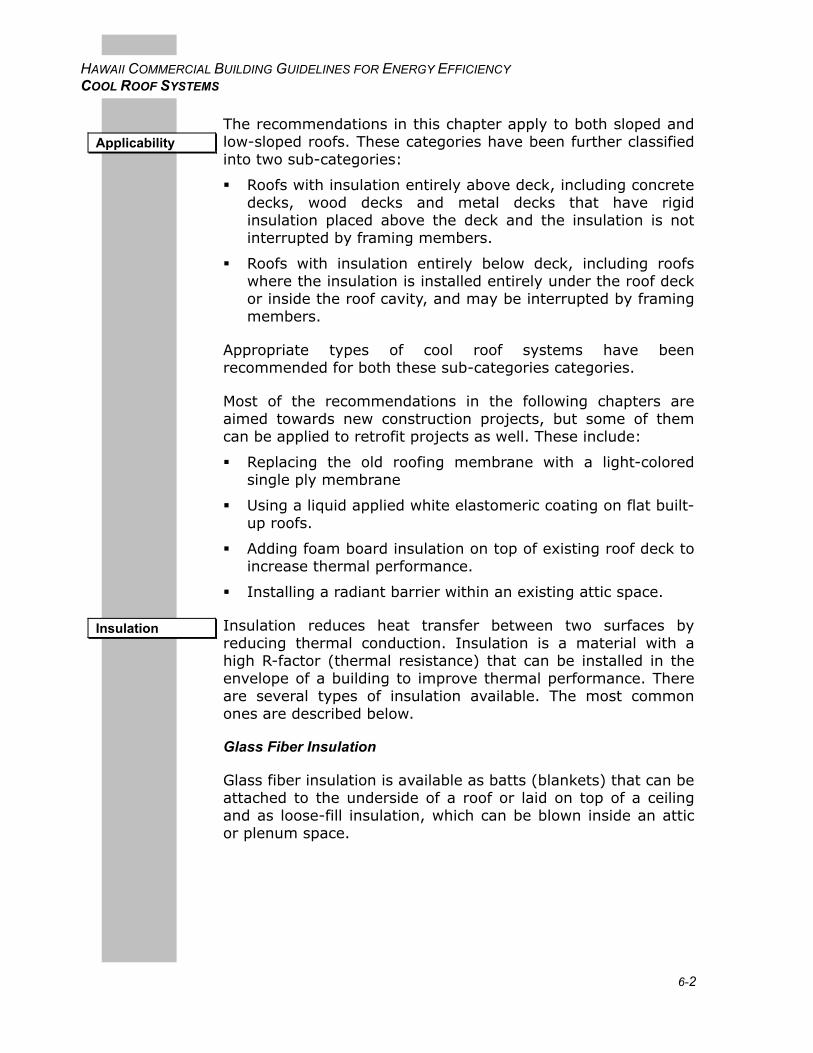
6-2
HAWAII COMMERCIAL BUILDING GUIDELINES FOR ENERGY EFFICIENCY COOL ROOF SYSTEMS
The recommendations in this chapter apply to both sloped and low-sloped roofs. These categories have been further classified into two sub-categories:
Roofs with insulation entirely above deck, including concrete decks, wood decks and metal decks that have rigid insulation placed above the deck and the insulation is not interrupted by framing members.
Roofs with insulation entirely below deck, including roofs where the insulation is installed entirely under the roof deck or inside the roof cavity, and may be interrupted by framing members.
Appropriate types of cool roof systems have been recommended for both these sub-categories categories.
Most of the recommendations in the following chapters are aimed towards new construction projects, but some of them can be applied to retrofit projects as well. These include:
Replacing the old roofing membrane with a light-colored single ply membrane
Using a liquid applied white elastomeric coating on flat built-up roofs.
Adding foam board insulation on top of existing roof deck to increase thermal performance.
Installing a radiant barrier within an existing attic space.
Insulation reduces heat transfer between two surfaces by reducing thermal conduction. Insulation is a material with a high R-factor (thermal resistance) that can be installed in the envelope of a building to improve thermal performance. There are several types of insulation available. The most common ones are described below.
Glass Fiber Insulation
Glass fiber insulation is available as batts (blankets) that can be attached to the underside of a roof or laid on top of a ceiling and as loose-fill insulation, which can be blown inside an attic or plenum space.
Applicability
Insulation
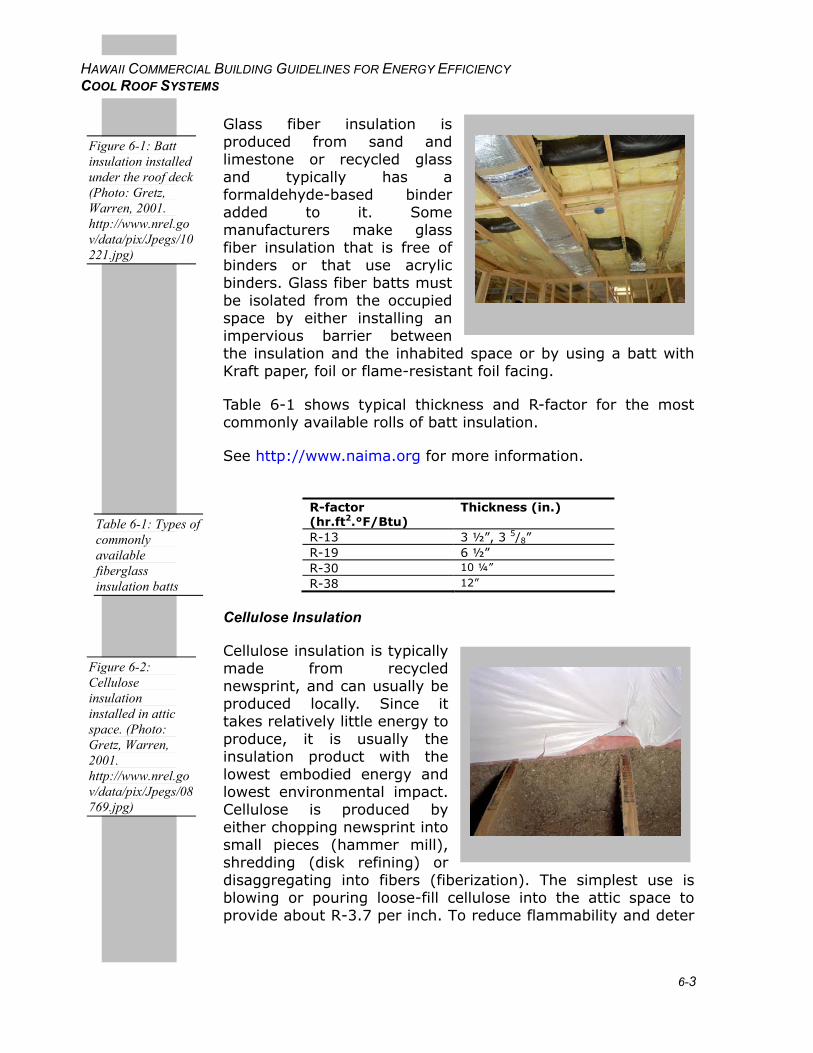
6-3
HAWAII COMMERCIAL BUILDING GUIDELINES FOR ENERGY EFFICIENCY COOL ROOF SYSTEMS
Glass fiber insulation is produced from sand and limestone or recycled glass and typically has a formaldehyde-based binder added to it. Some manufacturers make glass fiber insulation that is free of binders or that use acrylic binders. Glass fiber batts must be isolated from the occupied space by either installing an impervious barrier between the insulation and the inhabited space or by using a batt with Kraft paper, foil or flame-resistant foil facing.
Table 6-1 shows typical thickness and R-factor for the most commonly available rolls of batt insulation.
See http://www.naima.org for more information.
R-factor (hr.ft2.°F/Btu)
Thickness (in.)
R-13 3 ½”, 3 5/8” R-19 6 ½” R-30 10 ¼”
R-38 12”
Cellulose Insulation
Cellulose insulation is typically made from recycled newsprint, and can usually be produced locally. Since it takes relatively little energy to produce, it is usually the insulation product with the lowest embodied energy and lowest environmental impact. Cellulose is produced by either chopping newsprint into small pieces (hammer mill), shredding (disk refining) or disaggregating into fibers (fiberization). The simplest use is blowing or pouring loose-fill cellulose into the attic space to provide about R-3.7 per inch. To reduce flammability and deter
Figure 6-1: Batt insulation installed under the roof deck (Photo: Gretz, Warren, 2001. http://www.nrel.gov/data/pix/Jpegs/10221.jpg)
Table 6-1: Types of commonly available fiberglass insulation batts
Figure 6-2: Cellulose insulation installed in attic space. (Photo: Gretz, Warren, 2001. http://www.nrel.gov/data/pix/Jpegs/08769.jpg)
6-4
HAWAII COMMERCIAL BUILDING GUIDELINES FOR ENERGY EFFICIENCY COOL ROOF SYSTEMS
pests, cellulose insulation is typically treated with boric acid, sodium borate (borax), or ammonium sulfate.
Wet-spray cellulose has water or binders added during installation to make it stick and can be used on vertical surfaces. Conventional wet-spray cellulose using a hammer mill product usually requires about 4 gallons of water per 30 lb. bag. A relatively new formulation of cellulose insulation, referred to as stabilized cellulose, has a binder added to prevent settling as is common in the case of conventional loose-fill cellulose used in attics. See http://www.cellulose.org for more information
Foam Board Insulation
Even though many foam insulation products are more expensive than other insulating materials, they are commonly used in buildings where there are space limitations or where very high R-factors are desirable. Foam boards are the usual choice when insulation is installed on top of the roof deck because they can tolerate some foot traffic and resist compression.
Three different types of foam board are typically used for building applications: molded expanded polystyrene (MEPS), extruded expanded polystyrene (XEPS), and polyisocyanurate.
Molded Expanded Polystyrene (MEPS) is commonly known as "beadboard". Beadboard is made from loose, unexpanded polystyrene beads containing liquid pentane and a blowing agent, which are heated to expand the beads and increase its thermal resistance. Adding a vapor diffusion retarder is essential in building applications since spaces between the foam beads can absorb water. R-factors vary from 3.8 to 4.4 per inch of thickness.
Extruded Expanded Polystyrene (XEPS) is a closed-cell foam insulation similar to MEPS. Polystyrene pellets are mixed with chemicals to form a liquid, and a blowing agent is injected into the mixture, to form gas bubbles. The liquid mixture is solidified through a cooling process and the gas bubbles are trapped to give it an insulating property. XEPS is more expensive than MEPS, and like MEPS the R-factor depends upon the density of the material and is typically equal to R-5 per inch. It has a higher compressive strength than MEPS, making it better suited for use on roofs or for wall panels. Extruded polystyrene also has excellent resistance to moisture absorption. The rigid foam board recommendations in the
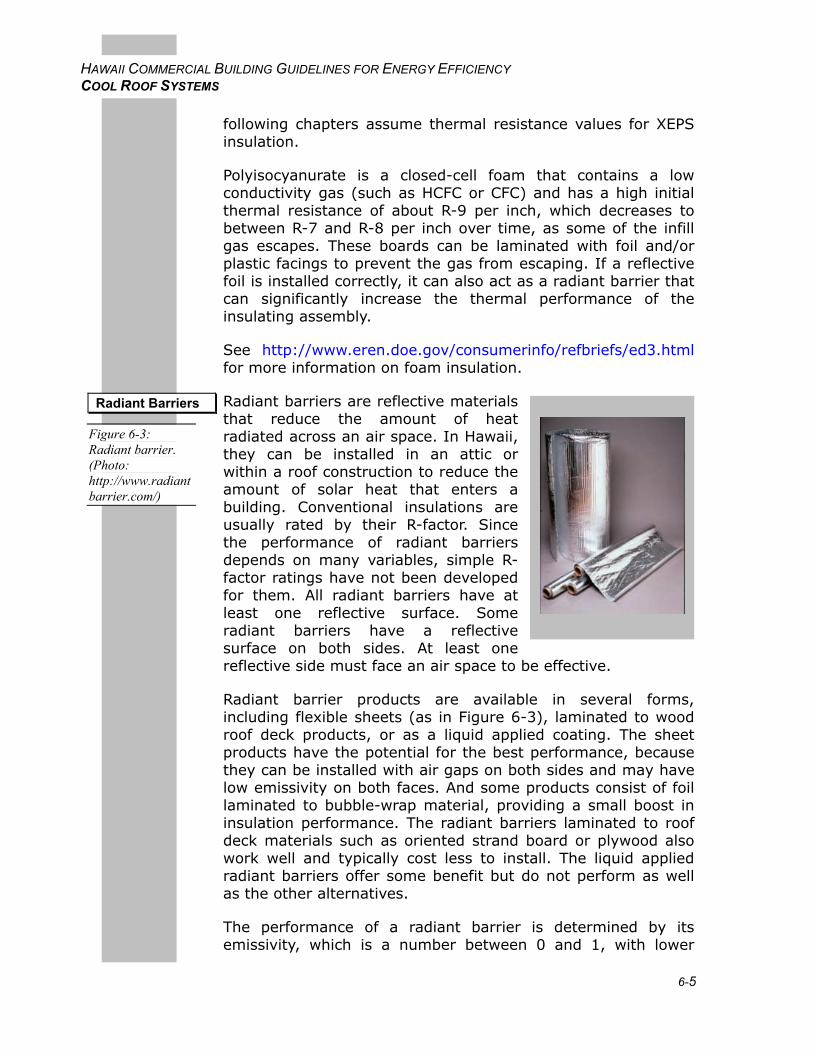
6-5
HAWAII COMMERCIAL BUILDING GUIDELINES FOR ENERGY EFFICIENCY COOL ROOF SYSTEMS
following chapters assume thermal resistance values for XEPS insulation.
Polyisocyanurate is a closed-cell foam that contains a low conductivity gas (such as HCFC or CFC) and has a high initial thermal resistance of about R-9 per inch, which decreases to between R-7 and R-8 per inch over time, as some of the infill gas escapes. These boards can be laminated with foil and/or plastic facings to prevent the gas from escaping. If a reflective foil is installed correctly, it can also act as a radiant barrier that can significantly increase the thermal performance of the insulating assembly.
See http://www.eren.doe.gov/consumerinfo/refbriefs/ed3.html for more information on foam insulation.
Radiant barriers are reflective materials that reduce the amount of heat radiated across an air space. In Hawaii, they can be installed in an attic or within a roof construction to reduce the amount of solar heat that enters a building. Conventional insulations are usually rated by their R-factor. Since the performance of radiant barriers depends on many variables, simple R-factor ratings have not been developed for them. All radiant barriers have at least one reflective surface. Some radiant barriers have a reflective surface on both sides. At least one reflective side must face an air space to be effective.
Radiant barrier products are available in several forms, including flexible sheets (as in Figure 6-3), laminated to wood roof deck products, or as a liquid applied coating. The sheet products have the potential for the best performance, because they can be installed with air gaps on both sides and may have low emissivity on both faces. And some products consist of foil laminated to bubble-wrap material, providing a small boost in insulation performance. The radiant barriers laminated to roof deck materials such as oriented strand board or plywood also work well and typically cost less to install. The liquid applied radiant barriers offer some benefit but do not perform as well as the other alternatives.
The performance of a radiant barrier is determined by its emissivity, which is a number between 0 and 1, with lower
Radiant Barriers
Figure 6-3: Radiant barrier. (Photo: http://www.radiantbarrier.com/)
6-6
HAWAII COMMERCIAL BUILDING GUIDELINES FOR ENERGY EFFICIENCY COOL ROOF SYSTEMS
numbers indicating better potential for performance. To receive compliance credit for using a radiant barrier, the installation must have an emissivity no greater than 0.10, and should follow one of the installation procedures outlined in the Hawaii Energy Code. For comparison, most other materials have much higher emissivity values, between 0.8 and 0.9. Liquid applied radiant barriers have an emissivity of around 0.5.
Roofing membranes are surfaces that are applied or attached to a structural roof deck to provide water resistance. These include a wide range of products such as shingles, tiles, metal sheets, mineral cap sheets, and single-ply membranes.
For low-slope roofs the membrane typically consists of single or multiple rolls of (usually) petroleum derived impervious material that can be laid flat over a roofing substrate, and held in place by mechanical fasteners, adhesives or ballast laid on top of it. Typical single-ply roofing membranes include EPDM (ethylene-propylene-diene-terpolymer membrane), PVC (polyvinyl chloride), CPE (chlorinated polyethylene), TPO (thermoplastic polyolefin). These membranes are available both in dark and light colors.
Roof Membranes
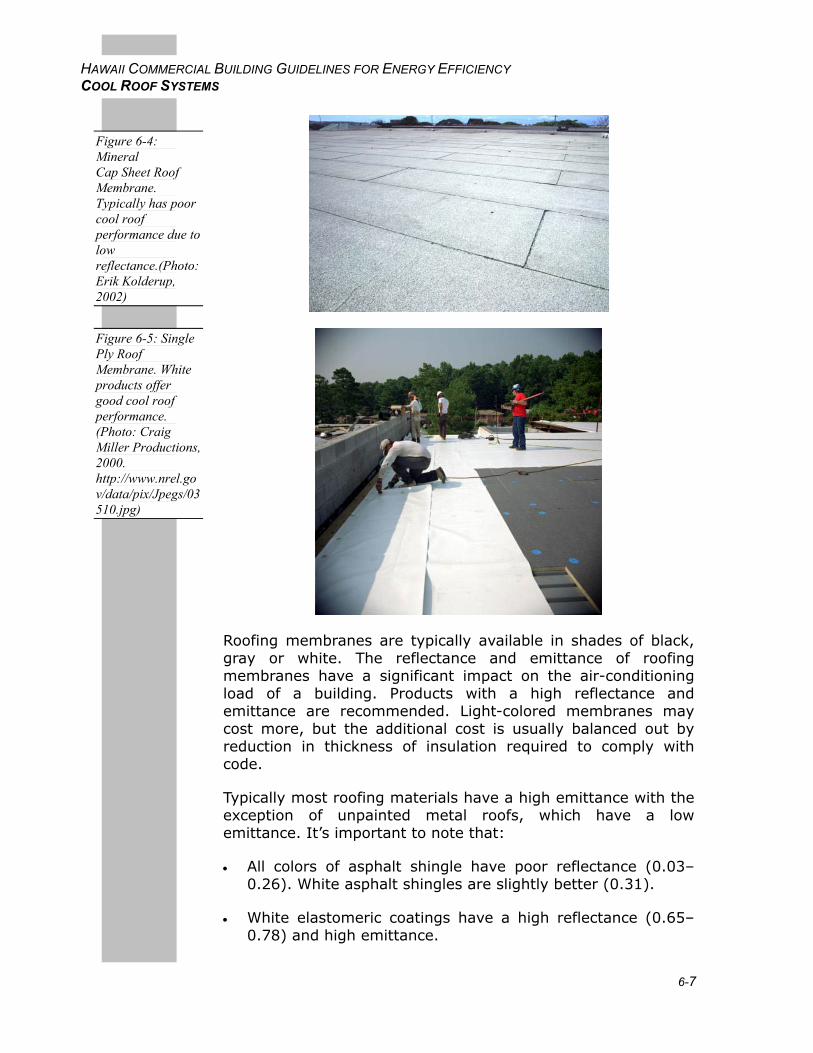
6-7
HAWAII COMMERCIAL BUILDING GUIDELINES FOR ENERGY EFFICIENCY COOL ROOF SYSTEMS
Roofing membranes are typically available in shades of black, gray or white. The reflectance and emittance of roofing membranes have a significant impact on the air-conditioning load of a building. Products with a high reflectance and emittance are recommended. Light-colored membranes may cost more, but the additional cost is usually balanced out by reduction in thickness of insulation required to comply with code.
Typically most roofing materials have a high emittance with the exception of unpainted metal roofs, which have a low emittance. It’s important to note that:
• All colors of asphalt shingle have poor reflectance (0.03–0.26). White asphalt shingles are slightly better (0.31).
• White elastomeric coatings have a high reflectance (0.65–0.78) and high emittance.
Figure 6-4: Mineral Cap Sheet Roof Membrane. Typically has poor cool roof performance due to low reflectance.(Photo: Erik Kolderup, 2002)
Figure 6-5: Single Ply Roof Membrane. White products offer good cool roof performance. (Photo: Craig Miller Productions, 2000. http://www.nrel.gov/data/pix/Jpegs/03510.jpg)
6-8
HAWAII COMMERCIAL BUILDING GUIDELINES FOR ENERGY EFFICIENCY COOL ROOF SYSTEMS
• White single-ply membranes have a high reflectance (0.69–0.81) and high emittance.
Other coated white roofing systems (such as white metal roof and painted concrete) have high reflectance (0.67– 0.85).
See http://www.coolroofs.org/ratedproductsdirectory.html for a directory of rated cool roof products.
The Cool Roof Rating Council (CRRC) is a non-profit organization founded in 1998 to develop accurate and credible methods for evaluating and labeling the solar reflectance and thermal emittance of roofing products and to make the information available to interested parties. The EPA EnergyStar ® Roof Products Program (http://www.energystar.gov) is a voluntary initiative with roofing manufacturers that encourages them to promote products that meet agreed upon energy efficiency criteria.
Absorptivity (α): Absorptivity is the fraction of solar radiation absorbed by a surface. Absorptivity is a term in the roof heat gain factor (RHGF) calculation
Reflectance: Percentage of radiant energy reflected by a material. This is equal to (1-α) for opaque materials such as roof membranes.
Emissivity: The ratio of the radiant heat flux emitted by a specimen to that emitted by a black body at the same temperature and the same conditions. Galvanized metal and other metallic finishes have a low emittance, which means that when they warm up, they can not easily release their heat by radiating it back to the sky. For roof surfaces a high emissivity is desired while for radiant barriers a low emissivity is necessary.
R-factor or R-value (thermal resistance): The R-factor or R-factor of a material is its ability to resist conductive heat transfer between two surfaces and is measured in units of hr. sq. ft. °F/Btu at a specified temperature. The R-factor does not include the thermal resistance of air films.
U-factor or U-value (coefficient of heat transmission): U-factor or U-value is a measure of the ability of a building envelope to transfer heat in units of Btu/hr. sq. ft. °F (and is usually measured at temperature of 75 °F). It describes the insulating properties of building envelope components such as walls and roofs. U-factor is the inverse of the sum of R-factor ( R), which
Definitions
6-9
HAWAII COMMERCIAL BUILDING GUIDELINES FOR ENERGY EFFICIENCY COOL ROOF SYSTEMS
is thermal resistance. R includes resistances of surfaces, structural components, and insulation. A lower U-factor means lower heat flow through the envelope.
Section 8.4 of the code contains the prescriptive criteria for the building envelope of commercial buildings.2 The prescriptive option provides the easiest way to comply with the envelope requirements of the Code, but offers limited trade-off possibilities.
The requirement for opaque roof surfaces is a maximum roof heat gain factor (RHGF) of 0.05. The RHGF is a product of three elements of roof design that effect solar heat gain: insulation (U-factor), color (absorptivity) and the presence of a radiant barrier (radiant barrier credit).
The RHGF of the opaque roof may be calculated with the following equation:
where,
U = U-factor of the roof construction. α = absorptivity of the roof surface. RB = radiant barrier credit. RB equals 0.33 if a radiant barrier is installed or 1.0 if there is no radiant barrier. See Radiant Barriers for installation requirements.
If there is more than one type of roof construction, then determine the RHGF for each portion and take an area-weighted average.
Note that the average RHGF for the whole roof must be less than 0.05. Portions of the roof may fall short of the requirement if other parts have more insulation than is necessary.
There are a number of benefits provided by cool roof systems, including:
Smaller AC equipment; in some cases eliminating the need for AC.
Lower cooling costs.
2 Low-rise residential roofs are covered by a separate code, adopted in Honolulu in 2001.
Hawaii Energy Code Requirements
Benefits
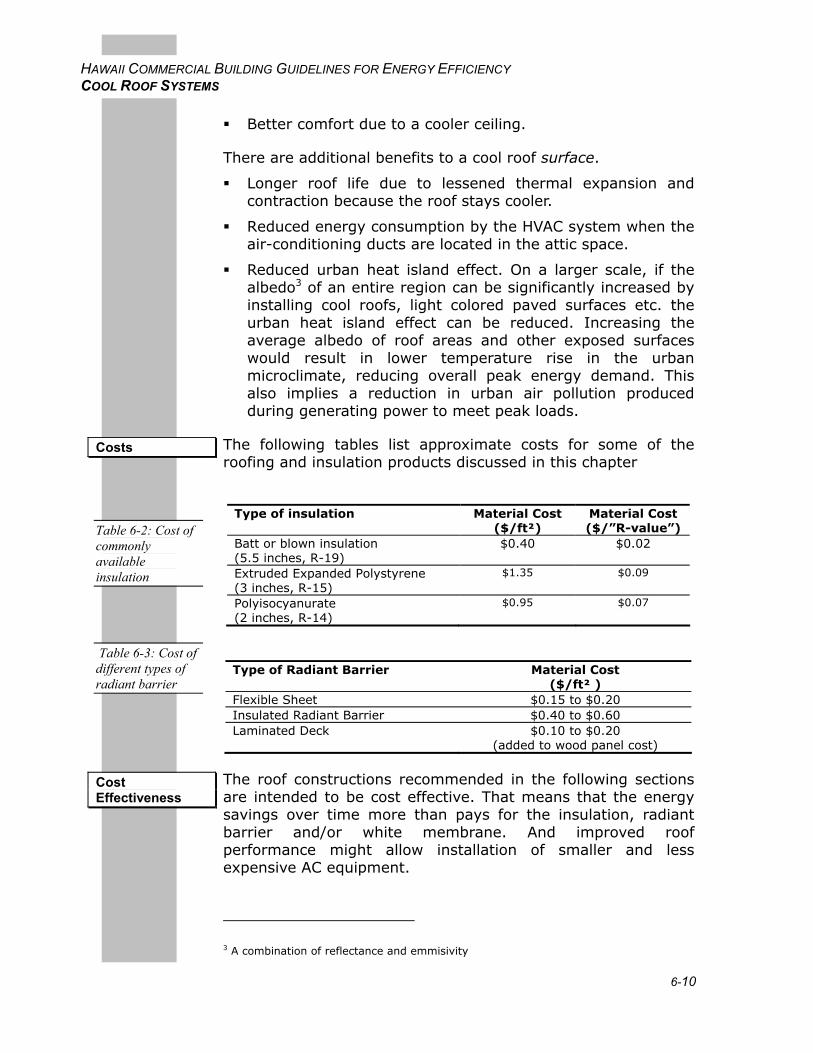
6-10
HAWAII COMMERCIAL BUILDING GUIDELINES FOR ENERGY EFFICIENCY COOL ROOF SYSTEMS
Better comfort due to a cooler ceiling.
There are additional benefits to a cool roof surface.
Longer roof life due to lessened thermal expansion and contraction because the roof stays cooler.
Reduced energy consumption by the HVAC system when the air-conditioning ducts are located in the attic space.
Reduced urban heat island effect. On a larger scale, if the albedo3 of an entire region can be significantly increased by installing cool roofs, light colored paved surfaces etc. the urban heat island effect can be reduced. Increasing the average albedo of roof areas and other exposed surfaces would result in lower temperature rise in the urban microclimate, reducing overall peak energy demand. This also implies a reduction in urban air pollution produced during generating power to meet peak loads.
The following tables list approximate costs for some of the roofing and insulation products discussed in this chapter
Type of insulation Material Cost
($/ft²) Material Cost ($/”R-value”)
Batt or blown insulation (5.5 inches, R-19)
$0.40 $0.02
Extruded Expanded Polystyrene (3 inches, R-15)
$1.35 $0.09
Polyisocyanurate (2 inches, R-14)
$0.95 $0.07
Type of Radiant Barrier Material Cost
($/ft² ) Flexible Sheet $0.15 to $0.20 Insulated Radiant Barrier $0.40 to $0.60 Laminated Deck $0.10 to $0.20
(added to wood panel cost)
The roof constructions recommended in the following sections are intended to be cost effective. That means that the energy savings over time more than pays for the insulation, radiant barrier and/or white membrane. And improved roof performance might allow installation of smaller and less expensive AC equipment.
3 A combination of reflectance and emmisivity
Costs
Table 6-2: Cost of commonly available insulation
Table 6-3: Cost of different types of radiant barrier
Cost Effectiveness
6-11
HAWAII COMMERCIAL BUILDING GUIDELINES FOR ENERGY EFFICIENCY COOL ROOF SYSTEMS
Lighter roof surfaces can cost more, but that is not always the case. Radiant barriers can be relatively inexpensive, especially the type that is laminated to roof deck material at the factory. The most cost effective option will vary from one project to the next depending on design details, but the recommendations in this chapter should be a good starting point.
To assure continued performance of cool roof surfaces (white roofs), they should be cleaned periodically with a high-pressure water spray or with soap and water. (Verify that doing this does not void the product warranty.) Cleaning is especially important in dusty areas. Liquid-applied roof coatings may need to be reapplied every five years or so.
Shiny surfaces of radiant barriers should be free of dust, paint or any other coating that would reduce the reflectivity of the radiant barrier. Avoid poking holes/perforations in the radiant barrier as too many holes will affect the performance of the radiant barrier. Seal visible holes with foil tape.
If any part of the insulation is moved around or removed due to repairs in the roof or ceiling, ensure that the insulation is replaced or moved back in place to ensure continued thermal benefits.
While no field testing is appropriate, there are a few important steps.
Review contractor submittals to ensure that any product substitutions provide equal or better performance compared to the specified products. Pay attention to roof membrane reflectance, insulation R-factor and radiant barrier emissivity.
Inspect construction to ensure that the proper insulation type and thickness is installed, that any radiant barriers are installed facing the proper direction and with adequate air gaps, and that the correct roof membrane is installed and properly cleaned.
Impact of cool roofs and cool roofs materials database. Heat Island Group, Lawrence Berkeley National Laboratory. http://eetd.lbl.gov/HeatIsland/CoolRoofs/)
Cool Roof Rating Council. http://www.coolroofs.org
Cool roofs resources and information. Energy Star Roof Products Program. http://www.nationalcoatings.com/coolroof/estar/)
Operations and Maintenance
Commissioning
References
6-12
HAWAII COMMERCIAL BUILDING GUIDELINES FOR ENERGY EFFICIENCY COOL ROOF SYSTEMS
Energy Star Roof Products. http://yosemite1.epa.gov/estar/consumers.nsf/content/roofbus.htm
Roof heat gain factor. Hawaii Model Energy Code. http://www.state.hi.us/dbedt/ert/model_ec.html
ASHRAE. 2001. ANSI/ASHRAE/IESNA Standard 90.1-2001. Atlanta, GA. Includes tables of U-factors for a wide range of typical roof constructions.
ASHRAE. 2001. 2001 Fundamentals. Atlanta, GA. Provides guidelines and material performance data for U-factor calculations.
Low-slope Roofs
Use a roof surface that is light in color (high reflectance), yet has a non-metallic finish (high emissivity). The basic recommendation is to install a single ply membrane (with an initial reflectance greater than 0.7 and an emittance greater than 0.8) with 1.5 to 2 inches of foam board insulation. See also Figure 6-6 through Figure 6-14 for alternative recommendations for low-slope roofs.
Low slope roofs are roofs that have a slope of less than 1 in 6.
The recommendations in this chapter apply to concrete, metal and wood decks.
Like all roofing systems, skylights and other roof penetrations, as well as the roof-top equipment mounts, should be considered in the design of the roof. Equipment access should be provided in a manner that does not create undue wear or damage to the roof membrane. Slopes for moisture drainage should be carefully designed to prevent “ponding” of water, which would promote growth of mildew and reduce the effectiveness of the “cool roof”. In order to take advantage of cooling equipment downsizing, cool roofs should be considered in the schematic design phase.
The following figures show a variety of options for achieving similar performance and complying with the energy code. These examples include one of two surface types, one dark and one white. The dark option represents either a dark gray EPDM roof or typical mineral cap sheet (α=0.80). The light roof membrane cases assume aged value of white T-EPDM
Recommendation
Description
Applicability
Integrated Design Implications
Design Details
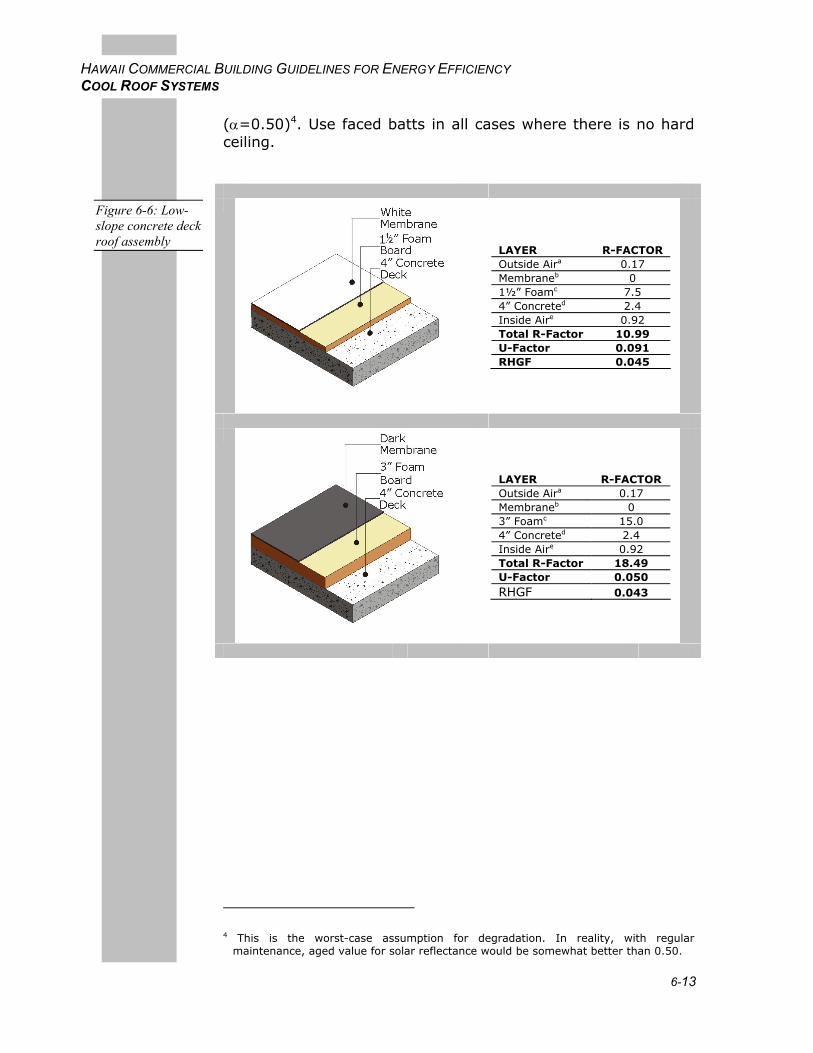
6-13
HAWAII COMMERCIAL BUILDING GUIDELINES FOR ENERGY EFFICIENCY COOL ROOF SYSTEMS
(α=0.50)4. Use faced batts in all cases where there is no hard ceiling.
LAYER R-FACTOR Outside Aira 0.17 Membraneb 0 1½” Foamc 7.5 4” Concreted 2.4 Inside Aire 0.92 Total R-Factor 10.99 U-Factor 0.091 RHGF 0.045
LAYER R-FACTOR Outside Aira 0.17 Membraneb 0 3” Foamc 15.0 4” Concreted 2.4 Inside Aire 0.92 Total R-Factor 18.49 U-Factor 0.050 RHGF 0.043
4 This is the worst-case assumption for degradation. In reality, with regular maintenance, aged value for solar reflectance would be somewhat better than 0.50.
Figure 6-6: Low-slope concrete deck roof assembly
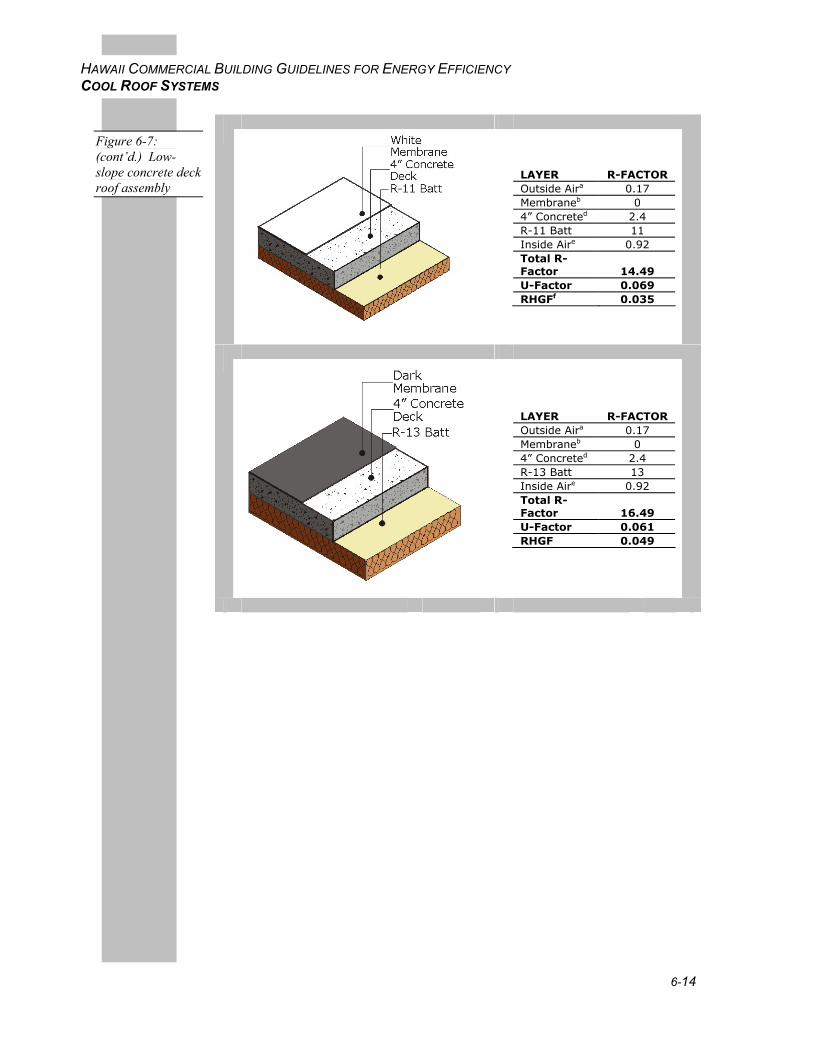
6-14
HAWAII COMMERCIAL BUILDING GUIDELINES FOR ENERGY EFFICIENCY COOL ROOF SYSTEMS
LAYER R-FACTOR Outside Aira 0.17 Membraneb 0 4” Concreted 2.4 R-11 Batt 11 Inside Aire 0.92 Total R-Factor 14.49 U-Factor 0.069 RHGFf 0.035
LAYER R-FACTOR Outside Aira 0.17 Membraneb 0 4” Concreted 2.4 R-13 Batt 13 Inside Aire 0.92 Total R-Factor 16.49 U-Factor 0.061 RHGF 0.049
Figure 6-7: (cont’d.) Low-slope concrete deck roof assembly
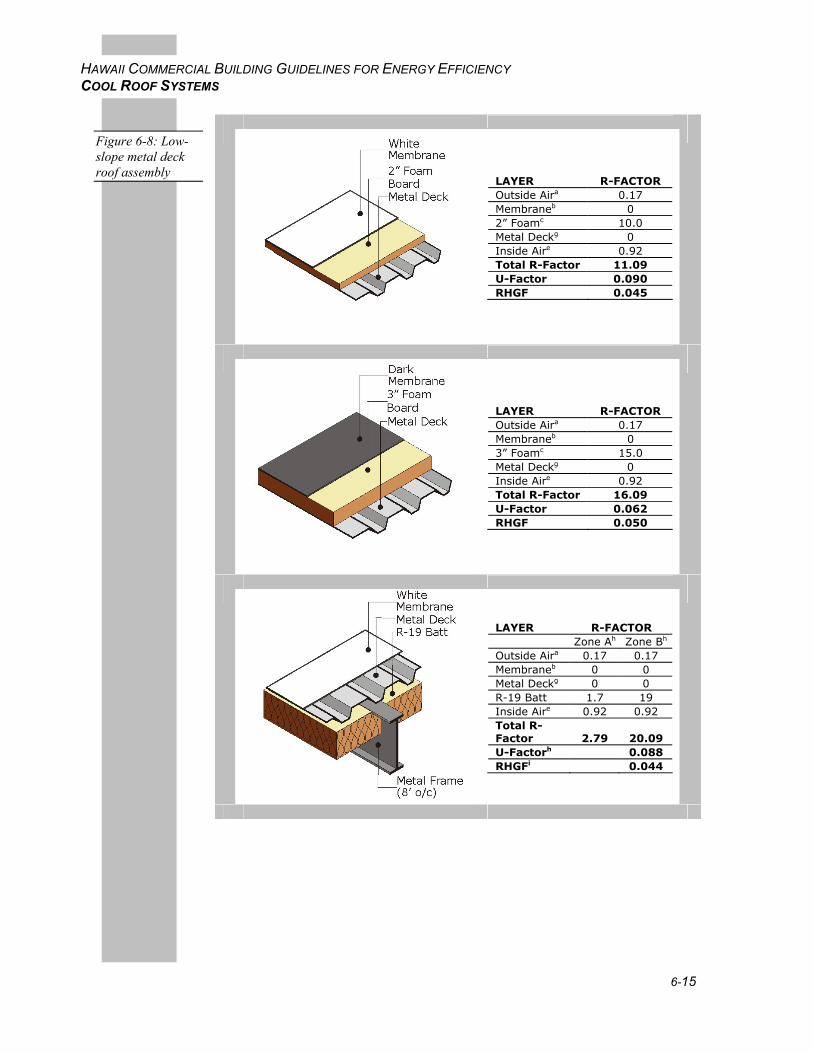
6-15
HAWAII COMMERCIAL BUILDING GUIDELINES FOR ENERGY EFFICIENCY COOL ROOF SYSTEMS
LAYER R-FACTOR Outside Aira 0.17 Membraneb 0 2” Foamc 10.0 Metal Deckg 0 Inside Aire 0.92 Total R-Factor 11.09 U-Factor 0.090 RHGF 0.045
LAYER R-FACTOR Outside Aira 0.17 Membraneb 0 3” Foamc 15.0 Metal Deckg 0 Inside Aire 0.92 Total R-Factor 16.09 U-Factor 0.062 RHGF 0.050
LAYER R-FACTOR Zone Ah Zone Bh Outside Aira 0.17 0.17 Membraneb 0 0 Metal Deckg 0 0 R-19 Batt 1.7 19 Inside Aire 0.92 0.92 Total R-Factor 2.79 20.09 U-Factorh 0.088 RHGFi 0.044
Figure 6-8: Low-slope metal deck roof assembly
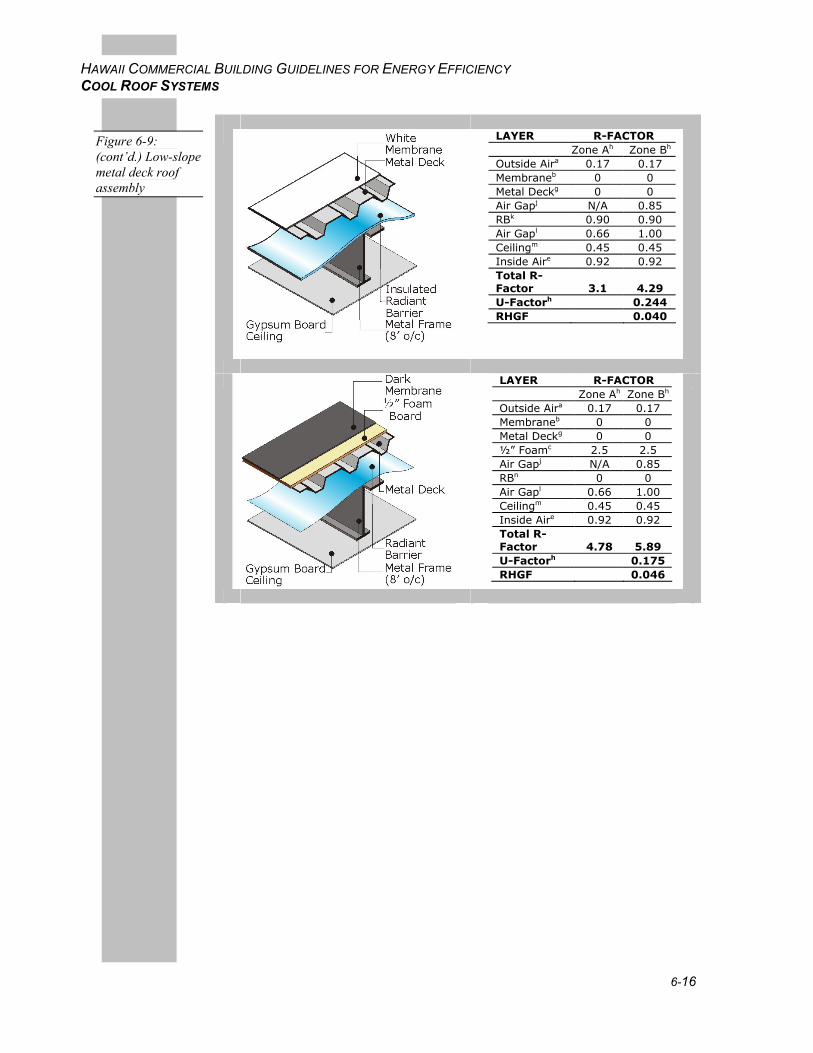
6-16
HAWAII COMMERCIAL BUILDING GUIDELINES FOR ENERGY EFFICIENCY COOL ROOF SYSTEMS
LAYER R-FACTOR Zone Ah Zone Bh
Outside Aira 0.17 0.17 Membraneb 0 0 Metal Deckg 0 0 Air Gapj N/A 0.85 RBk 0.90 0.90 Air Gapl 0.66 1.00 Ceilingm 0.45 0.45 Inside Aire 0.92 0.92 Total R-Factor 3.1 4.29 U-Factorh 0.244 RHGF 0.040
LAYER R-FACTOR Zone Ah Zone Bh Outside Aira 0.17 0.17 Membraneb 0 0 Metal Deckg 0 0 ½” Foamc 2.5 2.5 Air Gapj N/A 0.85 RBn 0 0 Air Gapl 0.66 1.00 Ceilingm 0.45 0.45 Inside Aire 0.92 0.92 Total R-Factor 4.78 5.89 U-Factorh 0.175 RHGF 0.046
Figure 6-9: (cont’d.) Low-slope metal deck roof assembly
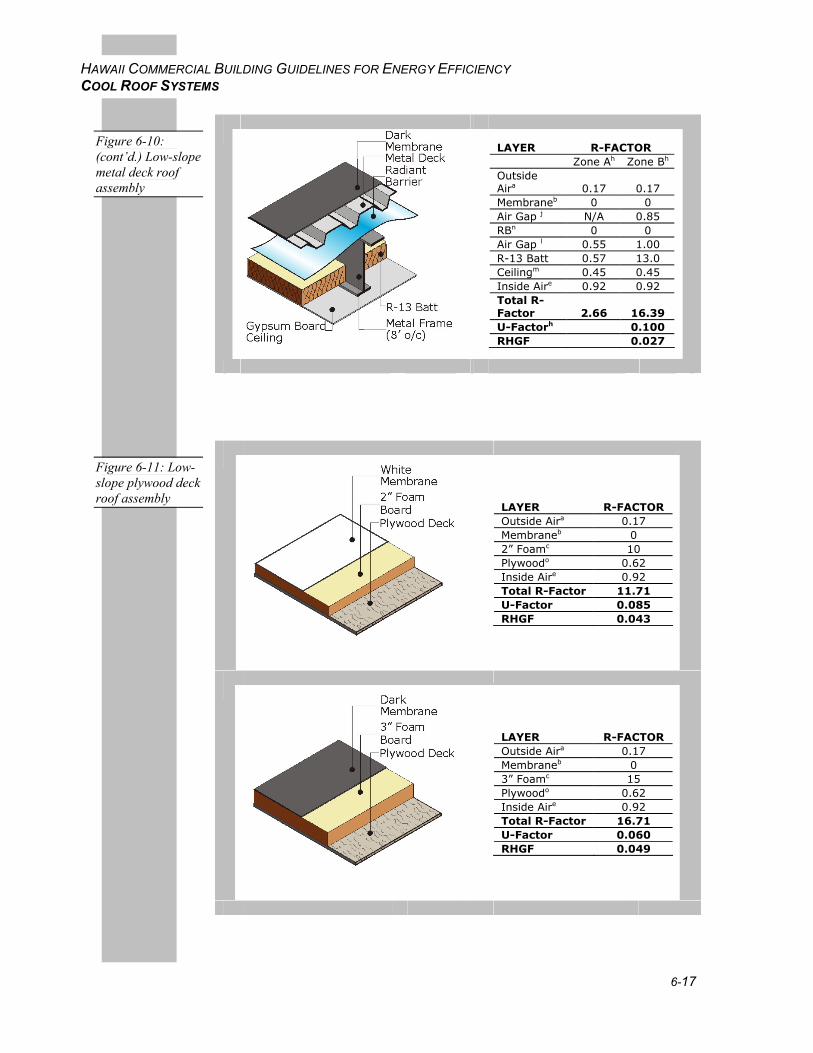
6-17
HAWAII COMMERCIAL BUILDING GUIDELINES FOR ENERGY EFFICIENCY COOL ROOF SYSTEMS
LAYER R-FACTOR Zone Ah Zone Bh Outside Aira 0.17 0.17 Membraneb 0 0 Air Gap j N/A 0.85 RBn 0 0 Air Gap l 0.55 1.00 R-13 Batt 0.57 13.0 Ceilingm 0.45 0.45 Inside Aire 0.92 0.92 Total R-Factor 2.66 16.39 U-Factorh 0.100 RHGF 0.027
LAYER R-FACTOR Outside Aira 0.17 Membraneb 0 2” Foamc 10 Plywoodo 0.62 Inside Aire 0.92 Total R-Factor 11.71 U-Factor 0.085 RHGF 0.043
LAYER R-FACTOR Outside Aira 0.17 Membraneb 0 3” Foamc 15 Plywoodo 0.62 Inside Aire 0.92 Total R-Factor 16.71 U-Factor 0.060 RHGF 0.049
Figure 6-10: (cont’d.) Low-slope metal deck roof assembly
Figure 6-11: Low-slope plywood deck roof assembly
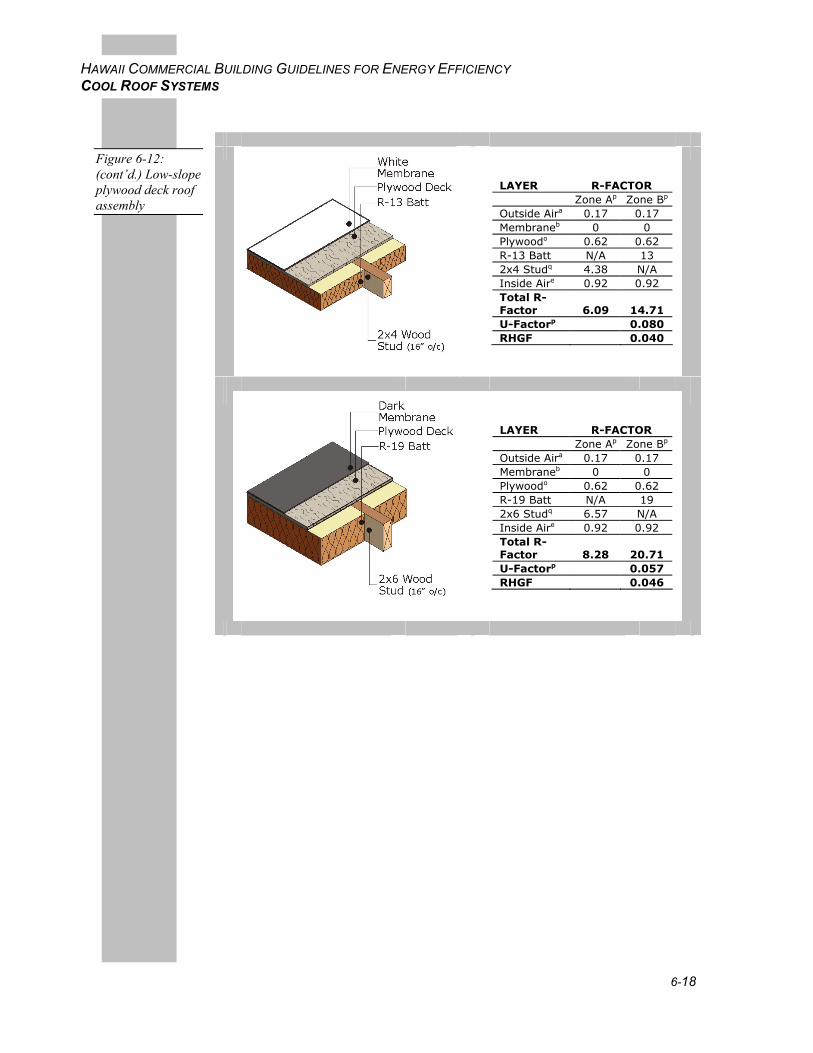
6-18
HAWAII COMMERCIAL BUILDING GUIDELINES FOR ENERGY EFFICIENCY COOL ROOF SYSTEMS
LAYER R-FACTOR Zone Ap Zone Bp
Outside Aira 0.17 0.17 Membraneb 0 0 Plywoodo 0.62 0.62 R-13 Batt N/A 13 2x4 Studq 4.38 N/A Inside Aire 0.92 0.92 Total R-Factor 6.09 14.71 U-Factorp 0.080 RHGF 0.040
LAYER R-FACTOR Zone Ap Zone Bp Outside Aira 0.17 0.17 Membraneb 0 0 Plywoodo 0.62 0.62 R-19 Batt N/A 19 2x6 Studq 6.57 N/A Inside Aire 0.92 0.92 Total R-Factor 8.28 20.71 U-Factorp 0.057 RHGF 0.046
Figure 6-12: (cont’d.) Low-slope plywood deck roof assembly
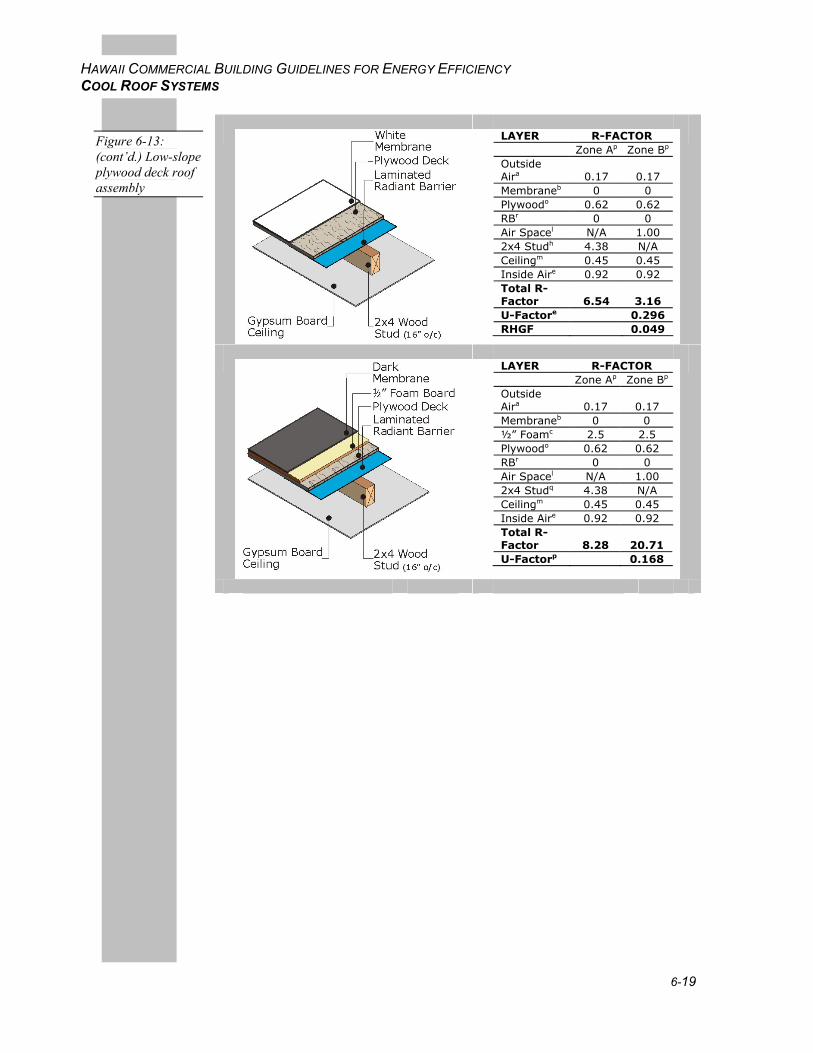
6-19
HAWAII COMMERCIAL BUILDING GUIDELINES FOR ENERGY EFFICIENCY COOL ROOF SYSTEMS
LAYER R-FACTOR Zone Ap Zone Bp Outside Aira 0.17 0.17 Membraneb 0 0 Plywoodo 0.62 0.62 RBr 0 0 Air Spacel N/A 1.00 2x4 Studh 4.38 N/A Ceilingm 0.45 0.45 Inside Aire 0.92 0.92 Total R-Factor 6.54 3.16 U-Factore 0.296 RHGF 0.049
LAYER R-FACTOR Zone Ap Zone Bp Outside Aira 0.17 0.17 Membraneb 0 0 ½” Foamc 2.5 2.5 Plywoodo 0.62 0.62 RBr 0 0 Air Spacel N/A 1.00 2x4 Studq 4.38 N/A Ceilingm 0.45 0.45 Inside Aire 0.92 0.92 Total R-Factor 8.28 20.71 U-Factorp 0.168
Figure 6-13: (cont’d.) Low-slope plywood deck roof assembly
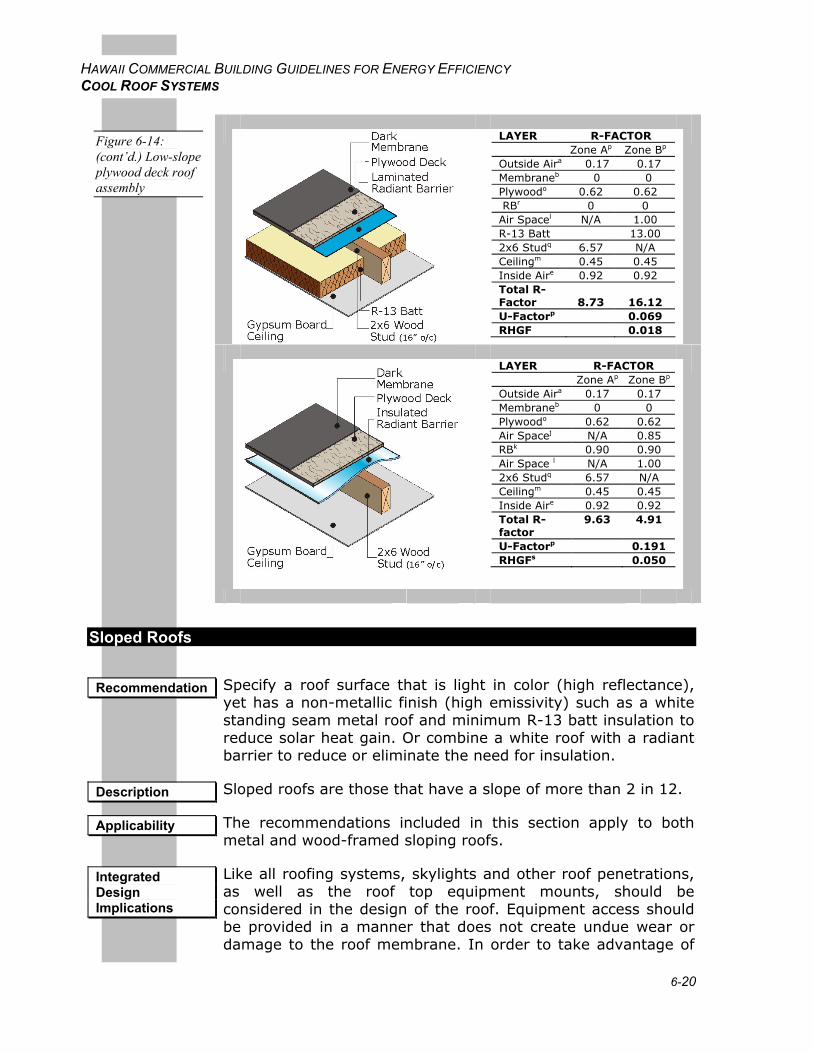
6-20
HAWAII COMMERCIAL BUILDING GUIDELINES FOR ENERGY EFFICIENCY COOL ROOF SYSTEMS
LAYER R-FACTOR Zone Ap Zone Bp Outside Aira 0.17 0.17 Membraneb 0 0 Plywoodo 0.62 0.62 RBr 0 0 Air Spacel N/A 1.00 R-13 Batt 13.00 2x6 Studq 6.57 N/A Ceilingm 0.45 0.45 Inside Aire 0.92 0.92 Total R-Factor 8.73 16.12 U-Factorp 0.069 RHGF 0.018
LAYER R-FACTOR Zone Ap Zone Bp Outside Aira 0.17 0.17 Membraneb 0 0 Plywoodo 0.62 0.62 Air Spacej N/A 0.85 RBk 0.90 0.90 Air Space l N/A 1.00 2x6 Studq 6.57 N/A Ceilingm 0.45 0.45 Inside Aire 0.92 0.92 Total R-factor
9.63 4.91
U-Factorp 0.191 RHGFs 0.050
Sloped Roofs
Specify a roof surface that is light in color (high reflectance), yet has a non-metallic finish (high emissivity) such as a white standing seam metal roof and minimum R-13 batt insulation to reduce solar heat gain. Or combine a white roof with a radiant barrier to reduce or eliminate the need for insulation.
Sloped roofs are those that have a slope of more than 2 in 12.
The recommendations included in this section apply to both metal and wood-framed sloping roofs.
Like all roofing systems, skylights and other roof penetrations, as well as the roof top equipment mounts, should be considered in the design of the roof. Equipment access should be provided in a manner that does not create undue wear or damage to the roof membrane. In order to take advantage of
Figure 6-14: (cont’d.) Low-slope plywood deck roof assembly
Recommendation
Description
Applicability
Integrated Design Implications
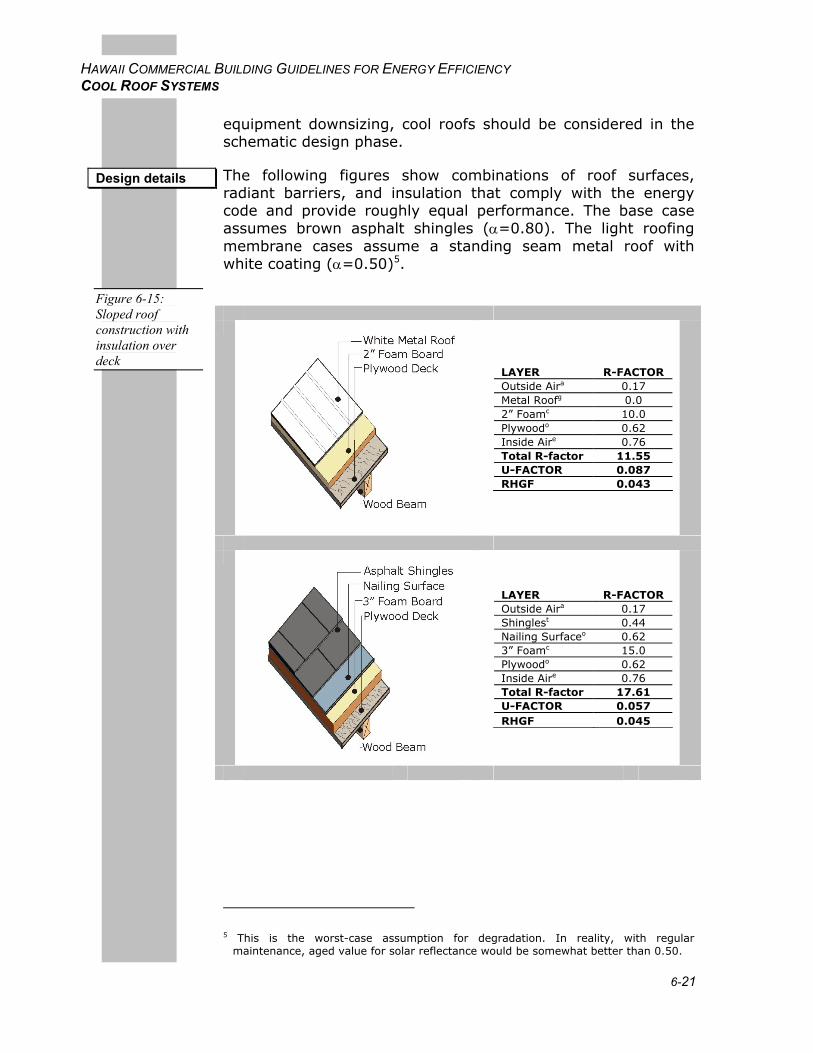
6-21
HAWAII COMMERCIAL BUILDING GUIDELINES FOR ENERGY EFFICIENCY COOL ROOF SYSTEMS
equipment downsizing, cool roofs should be considered in the schematic design phase.
The following figures show combinations of roof surfaces, radiant barriers, and insulation that comply with the energy code and provide roughly equal performance. The base case assumes brown asphalt shingles (α=0.80). The light roofing membrane cases assume a standing seam metal roof with white coating (α=0.50)5.
LAYER R-FACTOR Outside Aira 0.17 Metal Roofg 0.0 2” Foamc 10.0 Plywoodo 0.62 Inside Aire 0.76 Total R-factor 11.55 U-FACTOR 0.087 RHGF 0.043
LAYER R-FACTOR Outside Aira 0.17 Shinglest 0.44 Nailing Surfaceo 0.62 3” Foamc 15.0 Plywoodo 0.62 Inside Aire 0.76 Total R-factor 17.61 U-FACTOR 0.057 RHGF 0.045
5 This is the worst-case assumption for degradation. In reality, with regular maintenance, aged value for solar reflectance would be somewhat better than 0.50.
Design details
Figure 6-15: Sloped roof construction with insulation over deck
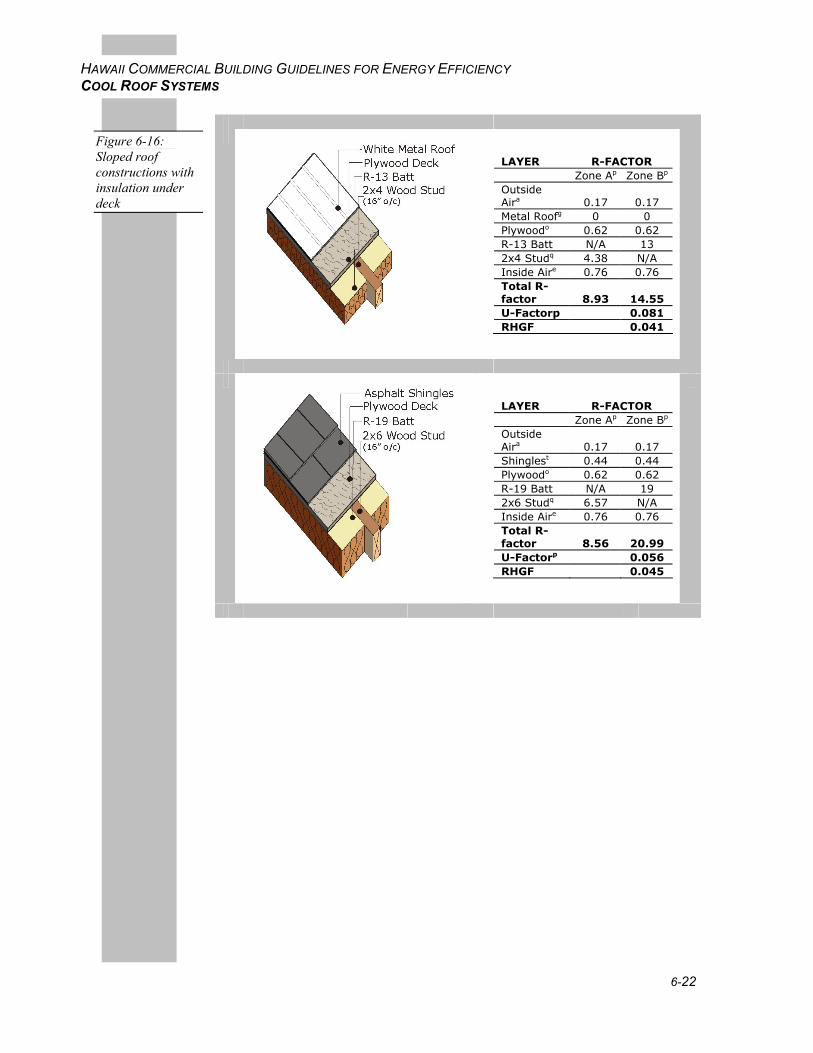
6-22
HAWAII COMMERCIAL BUILDING GUIDELINES FOR ENERGY EFFICIENCY COOL ROOF SYSTEMS
LAYER R-FACTOR Zone Ap Zone Bp Outside Aira 0.17 0.17 Metal Roofg 0 0 Plywoodo 0.62 0.62 R-13 Batt N/A 13 2x4 Studq 4.38 N/A Inside Aire 0.76 0.76 Total R-factor 8.93 14.55 U-Factorp 0.081 RHGF 0.041
LAYER R-FACTOR Zone Ap Zone Bp Outside Aira 0.17 0.17 Shinglest 0.44 0.44 Plywoodo 0.62 0.62 R-19 Batt N/A 19 2x6 Studq 6.57 N/A Inside Aire 0.76 0.76 Total R-factor 8.56 20.99 U-Factorp 0.056 RHGF 0.045
Figure 6-16: Sloped roof constructions with insulation under deck
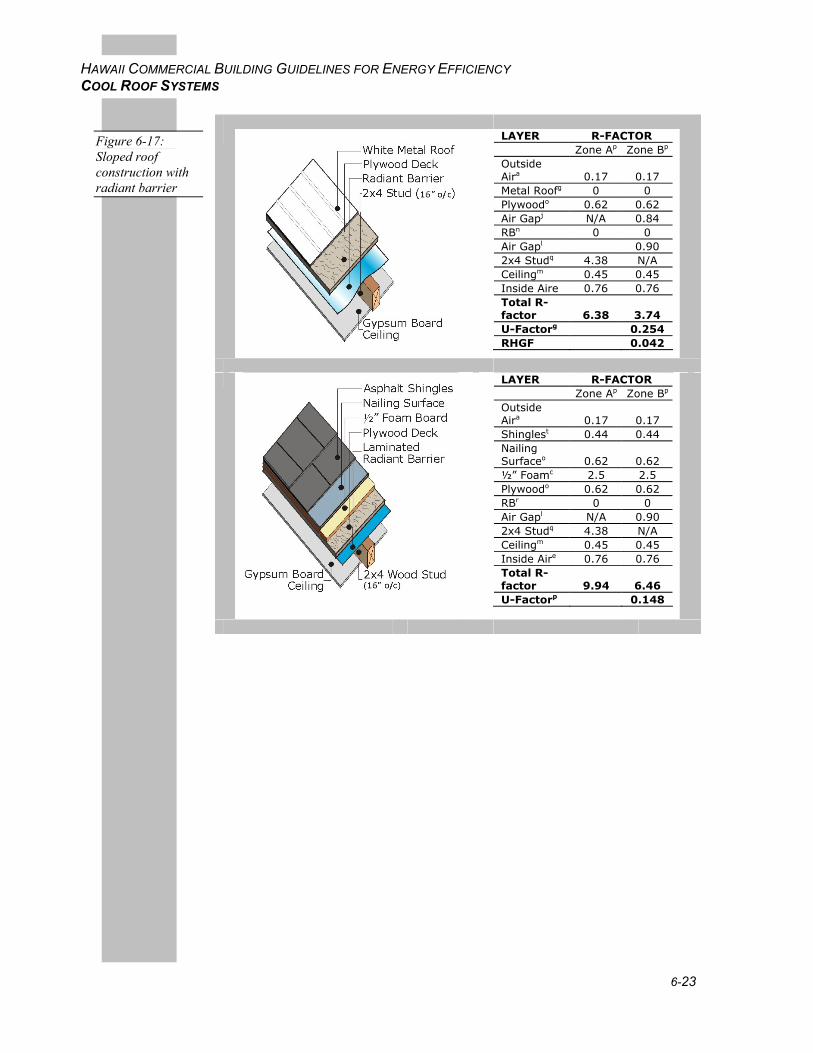
6-23
HAWAII COMMERCIAL BUILDING GUIDELINES FOR ENERGY EFFICIENCY COOL ROOF SYSTEMS
LAYER R-FACTOR Zone Ap Zone Bp Outside Aira 0.17 0.17 Metal Roofg 0 0 Plywoodo 0.62 0.62 Air Gapj N/A 0.84 RBn 0 0 Air Gapl 0.90 2x4 Studq 4.38 N/A Ceilingm 0.45 0.45 Inside Aire 0.76 0.76 Total R-factor 6.38 3.74 U-Factorg 0.254 RHGF 0.042
LAYER R-FACTOR Zone Ap Zone Bp Outside Aira 0.17 0.17 Shinglest 0.44 0.44 Nailing Surfaceo 0.62 0.62 ½” Foamc 2.5 2.5 Plywoodo 0.62 0.62 RBr 0 0 Air Gapl N/A 0.90 2x4 Studq 4.38 N/A Ceilingm 0.45 0.45 Inside Aire 0.76 0.76 Total R-factor 9.94 6.46 U-Factorp 0.148
Figure 6-17: Sloped roof construction with radiant barrier
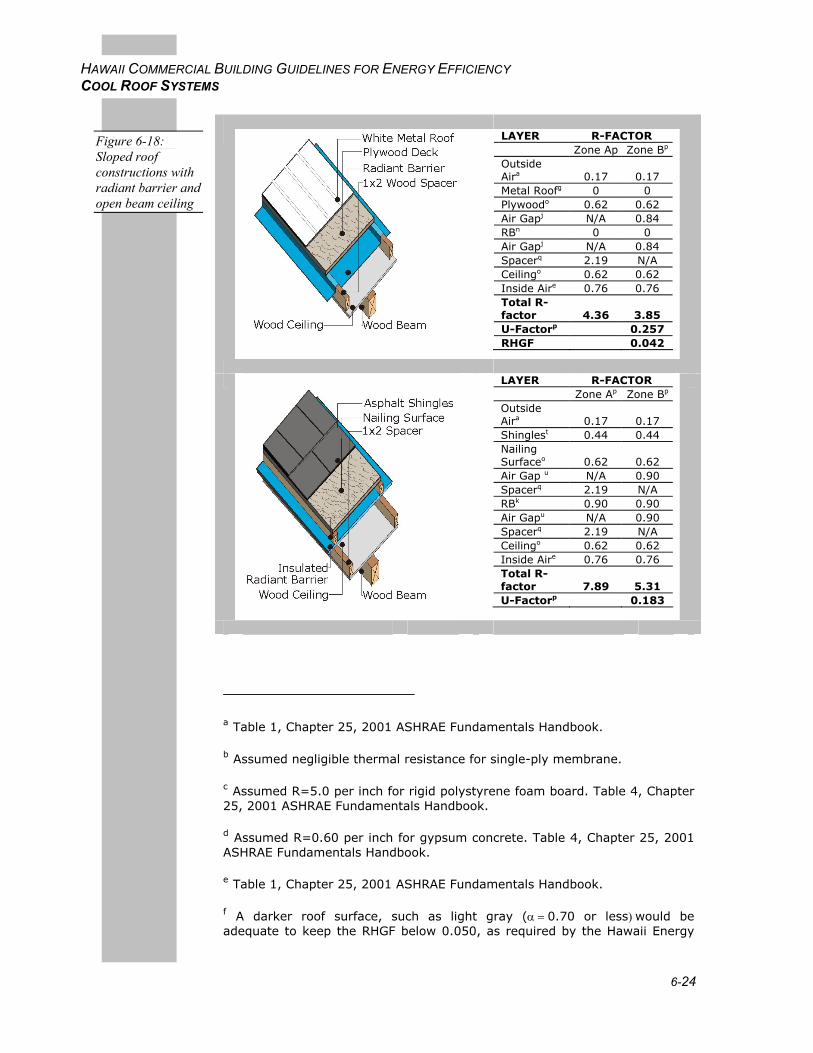
6-24
HAWAII COMMERCIAL BUILDING GUIDELINES FOR ENERGY EFFICIENCY COOL ROOF SYSTEMS
LAYER R-FACTOR Zone Ap Zone Bp Outside Aira 0.17 0.17 Metal Roofg 0 0 Plywoodo 0.62 0.62 Air Gapj N/A 0.84 RBn 0 0 Air Gapj N/A 0.84 Spacerq 2.19 N/A Ceilingo 0.62 0.62 Inside Aire 0.76 0.76 Total R-factor 4.36 3.85 U-Factorp 0.257 RHGF 0.042
LAYER R-FACTOR Zone Ap Zone Bp Outside Aira 0.17 0.17 Shinglest 0.44 0.44 Nailing Surfaceo 0.62 0.62 Air Gap u N/A 0.90 Spacerq 2.19 N/A RBk 0.90 0.90 Air Gapu N/A 0.90 Spacerq 2.19 N/A Ceilingo 0.62 0.62 Inside Aire 0.76 0.76 Total R-factor 7.89 5.31 U-Factorp 0.183
a Table 1, Chapter 25, 2001 ASHRAE Fundamentals Handbook.
b Assumed negligible thermal resistance for single-ply membrane.
c Assumed R=5.0 per inch for rigid polystyrene foam board. Table 4, Chapter 25, 2001 ASHRAE Fundamentals Handbook.
d Assumed R=0.60 per inch for gypsum concrete. Table 4, Chapter 25, 2001 ASHRAE Fundamentals Handbook.
e Table 1, Chapter 25, 2001 ASHRAE Fundamentals Handbook.
f A darker roof surface, such as light gray (α = 0.70 or less) would be adequate to keep the RHGF below 0.050, as required by the Hawaii Energy
Figure 6-18: Sloped roof constructions with radiant barrier and open beam ceiling
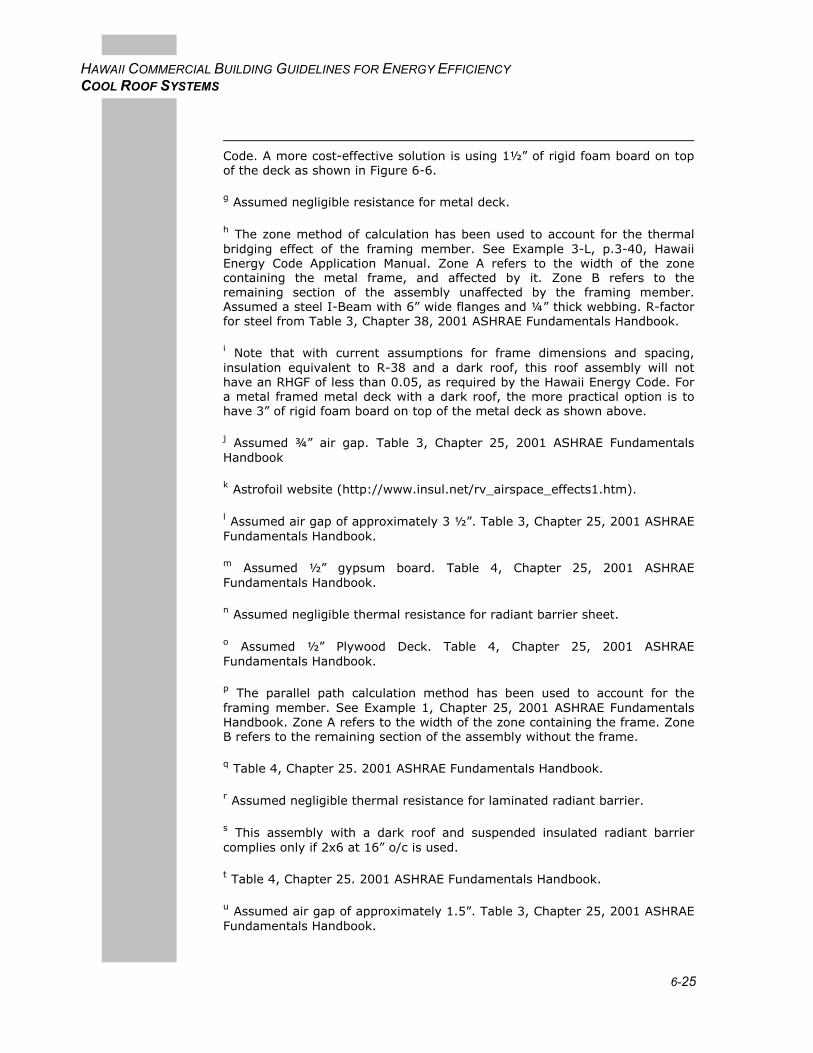
6-25
HAWAII COMMERCIAL BUILDING GUIDELINES FOR ENERGY EFFICIENCY COOL ROOF SYSTEMS
Code. A more cost-effective solution is using 1½” of rigid foam board on top of the deck as shown in Figure 6-6.
g Assumed negligible resistance for metal deck.
h The zone method of calculation has been used to account for the thermal bridging effect of the framing member. See Example 3-L, p.3-40, Hawaii Energy Code Application Manual. Zone A refers to the width of the zone containing the metal frame, and affected by it. Zone B refers to the remaining section of the assembly unaffected by the framing member. Assumed a steel I-Beam with 6” wide flanges and ¼” thick webbing. R-factor for steel from Table 3, Chapter 38, 2001 ASHRAE Fundamentals Handbook.
i Note that with current assumptions for frame dimensions and spacing, insulation equivalent to R-38 and a dark roof, this roof assembly will not have an RHGF of less than 0.05, as required by the Hawaii Energy Code. For a metal framed metal deck with a dark roof, the more practical option is to have 3” of rigid foam board on top of the metal deck as shown above.
j Assumed ¾” air gap. Table 3, Chapter 25, 2001 ASHRAE Fundamentals Handbook
k Astrofoil website (http://www.insul.net/rv_airspace_effects1.htm).
l Assumed air gap of approximately 3 ½”. Table 3, Chapter 25, 2001 ASHRAE Fundamentals Handbook.
m Assumed ½” gypsum board. Table 4, Chapter 25, 2001 ASHRAE Fundamentals Handbook.
n Assumed negligible thermal resistance for radiant barrier sheet.
o Assumed ½” Plywood Deck. Table 4, Chapter 25, 2001 ASHRAE Fundamentals Handbook.
p The parallel path calculation method has been used to account for the framing member. See Example 1, Chapter 25, 2001 ASHRAE Fundamentals Handbook. Zone A refers to the width of the zone containing the frame. Zone B refers to the remaining section of the assembly without the frame.
q Table 4, Chapter 25. 2001 ASHRAE Fundamentals Handbook.
r Assumed negligible thermal resistance for laminated radiant barrier.
s This assembly with a dark roof and suspended insulated radiant barrier complies only if 2x6 at 16” o/c is used.
t Table 4, Chapter 25. 2001 ASHRAE Fundamentals Handbook.
u Assumed air gap of approximately 1.5”. Table 3, Chapter 25, 2001 ASHRAE Fundamentals Handbook.
6-26
HAWAII COMMERCIAL BUILDING GUIDELINES FOR ENERGY EFFICIENCY COOL ROOF SYSTEMS
v This assembly complies only if two rows of 1x2 spacers are used as shown in the corresponding figure.
7-1
HAWAII COMMERCIAL BUILDING GUIDELINES FOR ENERGY EFFICIENCY DEHUMIDIFICATION
7. DEHUMIDIFICATION GUIDELINES Overview...........................................................................................................7-1 Conventional Cooling Systems with Reheat ..................................................7-10 Run-around Coil Systems ..............................................................................7-14 Heat Pipe Systems.........................................................................................7-17 Dual-path Systems .........................................................................................7-19 Desiccant Systems.........................................................................................7-24
Overview
In commercial buildings, temperature control often receives far more attention than humidity control. But moisture-related problems do occur in commercial buildings, especially in climates such as Hawaii’s, and these problems can be costly. A significant portion of the construction claims against architects, engineers and contractors are related to moisture and humidity problems. Mold and mildew cost the hotel industry over $68 million every year in lost income and replacement furnishings, according to the American Hotel and Motel Association. Microbial growth accounts for more than one-third of indoor air quality (IAQ) problems.
HVAC systems are typically designed to ensure that they meet indoor comfort conditions at peak cooling loads. These systems, however, may not be able to provide adequate dehumidification during low load periods. These guidelines introduce system alternatives designed to improve part-load dehumidification performance as well as energy efficiency.
Finding the proper balance between energy efficiency and acceptable indoor air quality has become a critical problem for designers, building owners and operators, and maintenance personnel. For indoor thermal comfort, relative humidity levels up to 70% in summer may be acceptable. But for indoor air quality, the optimal humidity is between 40% and 60%. Poor indoor air quality may lead to an increased incidence of health-related symptoms, which in turn may lead to a rise in absenteeism and a loss of productivity. Increased ventilation can improve the indoor environment but may add to the first cost and operating cost of air conditioning systems, particularly in Hawaii.
Excess moisture and humidity problems in buildings are mostly caused by the intrusion of rain and groundwater and the infiltration of humid outside air through the building envelope,
Introduction
7-2
HAWAII COMMERCIAL BUILDING GUIDELINES FOR ENERGY EFFICIENCY DEHUMIDIFICATION
coupled with inadequate dehumidification capability and the inadequate operation of HVAC systems to remove the moisture and humidity. These problems can be resolved by correct air pressurization in buildings, adequate dehumidification capability and proper operation of HVAC systems.
Good control of humidity will reduce operation and maintenance costs of buildings, provide a healthy working environment and improve worker productivity. Most importantly, an energy-efficient cooling and dehumidification system does not necessarily have a higher initial cost than a conventional system, and it will save a significant amount in lifecycle costs.
There are basically two types of dehumidification: cooling-based systems and desiccant systems. Cooling-based systems extract moisture in a liquid state by using coils to cool the air to a saturation state, with the air temperature lower than the space air’s dew-point temperature. In contrast, desiccant systems directly extract moisture from the air in a vapor state; this occurs without a cooling effect and produces air with a higher temperature (due to heat of adsorption) and lower humidity content.
Buildings in hot/warm and humid climates, with high space latent loads, high outside air ventilation rate, low interior space humidity requirement or stringent humidity control, will need dehumidification. These types of buildings include supermarkets, hospitals, labs, clean rooms and theaters.
Section 9.3(e) of the Hawaii Model Energy Code states: “Where a humidistat is used for comfort dehumidification, it shall be capable of being set to prevent the use of fossil fuel or electricity to reduce relative humidities below 60%.”
The following standards address dehumidification in buildings:
ASHRAE Standard 62–1999, Ventilation for Acceptable Indoor Air Quality
ANSI/ASHRAE Standard 55–1992, Thermal Environmental Conditions for Human Occupancy
Applicability
Codes and Standards
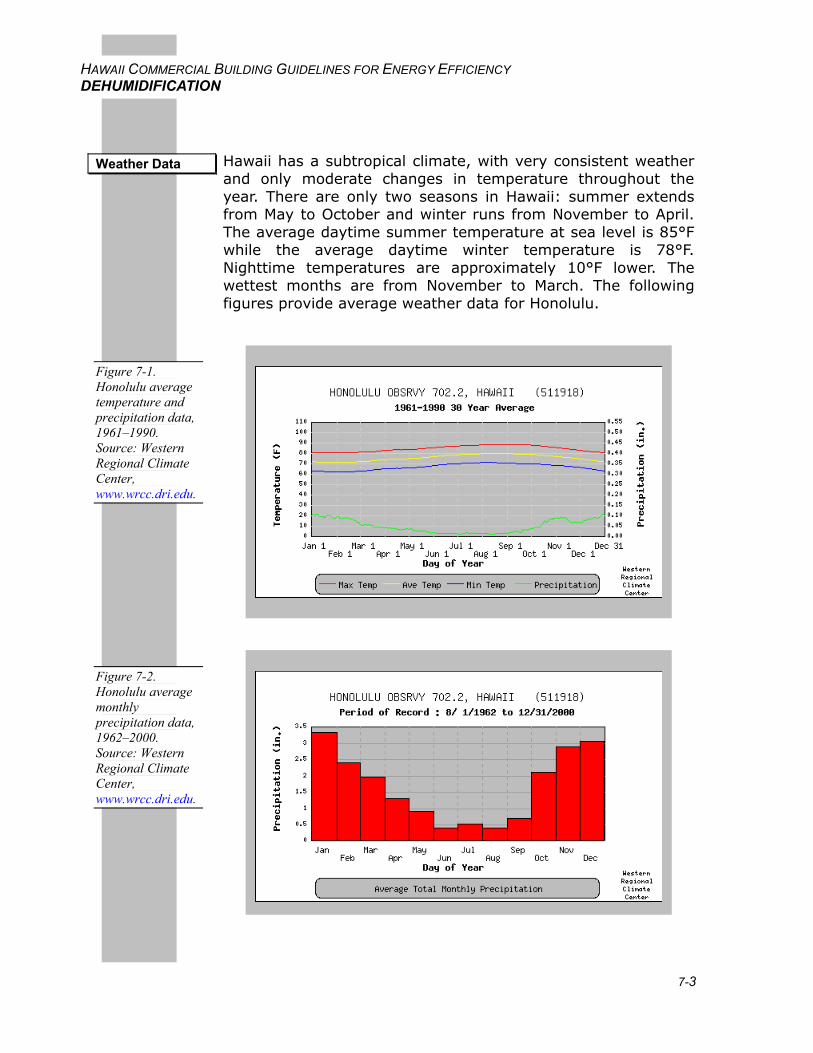
7-3
HAWAII COMMERCIAL BUILDING GUIDELINES FOR ENERGY EFFICIENCY DEHUMIDIFICATION
Hawaii has a subtropical climate, with very consistent weather and only moderate changes in temperature throughout the year. There are only two seasons in Hawaii: summer extends from May to October and winter runs from November to April. The average daytime summer temperature at sea level is 85°F while the average daytime winter temperature is 78°F. Nighttime temperatures are approximately 10°F lower. The wettest months are from November to March. The following figures provide average weather data for Honolulu.
Weather Data
Figure 7-1. Honolulu average temperature and precipitation data, 1961–1990. Source: Western Regional Climate Center, www.wrcc.dri.edu.
Figure 7-2. Honolulu average monthly precipitation data, 1962–2000. Source: Western Regional Climate Center, www.wrcc.dri.edu.
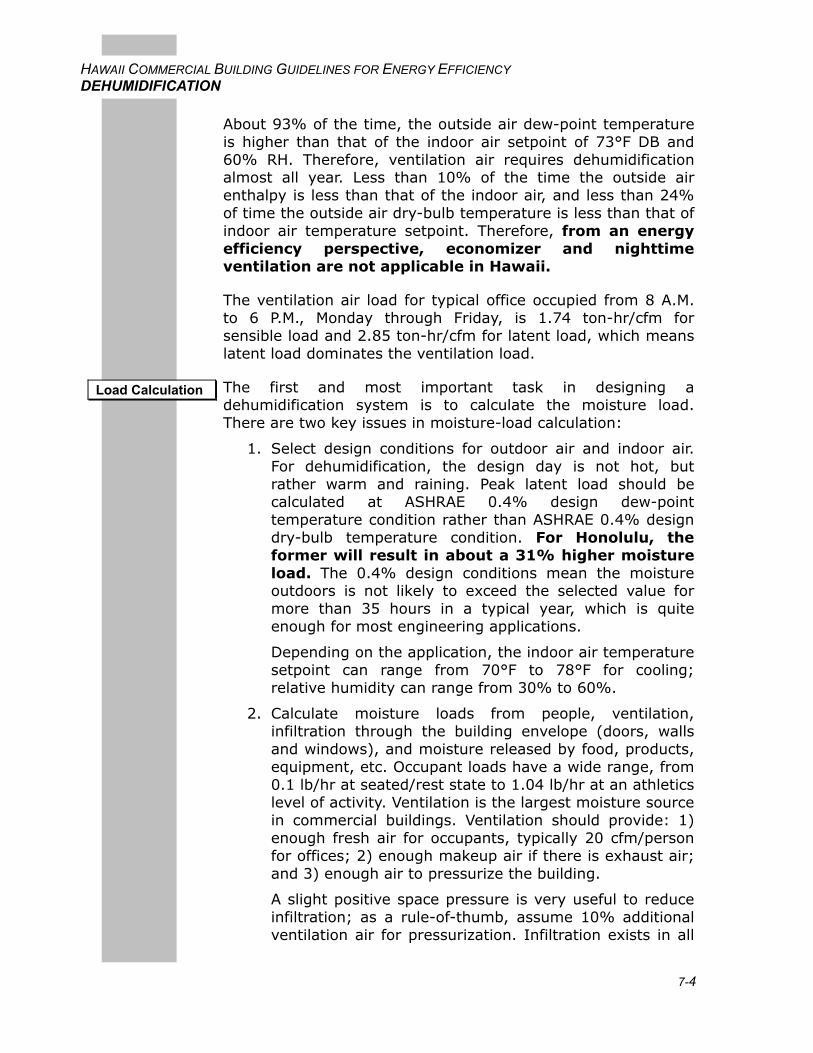
7-4
HAWAII COMMERCIAL BUILDING GUIDELINES FOR ENERGY EFFICIENCY DEHUMIDIFICATION
About 93% of the time, the outside air dew-point temperature is higher than that of the indoor air setpoint of 73°F DB and 60% RH. Therefore, ventilation air requires dehumidification almost all year. Less than 10% of the time the outside air enthalpy is less than that of the indoor air, and less than 24% of time the outside air dry-bulb temperature is less than that of indoor air temperature setpoint. Therefore, from an energy efficiency perspective, economizer and nighttime ventilation are not applicable in Hawaii.
The ventilation air load for typical office occupied from 8 A.M. to 6 P.M., Monday through Friday, is 1.74 ton-hr/cfm for sensible load and 2.85 ton-hr/cfm for latent load, which means latent load dominates the ventilation load.
The first and most important task in designing a dehumidification system is to calculate the moisture load. There are two key issues in moisture-load calculation:
1. Select design conditions for outdoor air and indoor air. For dehumidification, the design day is not hot, but rather warm and raining. Peak latent load should be calculated at ASHRAE 0.4% design dew-point temperature condition rather than ASHRAE 0.4% design dry-bulb temperature condition. For Honolulu, the former will result in about a 31% higher moisture load. The 0.4% design conditions mean the moisture outdoors is not likely to exceed the selected value for more than 35 hours in a typical year, which is quite enough for most engineering applications.
Depending on the application, the indoor air temperature setpoint can range from 70°F to 78°F for cooling; relative humidity can range from 30% to 60%.
2. Calculate moisture loads from people, ventilation, infiltration through the building envelope (doors, walls and windows), and moisture released by food, products, equipment, etc. Occupant loads have a wide range, from 0.1 lb/hr at seated/rest state to 1.04 lb/hr at an athletics level of activity. Ventilation is the largest moisture source in commercial buildings. Ventilation should provide: 1) enough fresh air for occupants, typically 20 cfm/person for offices; 2) enough makeup air if there is exhaust air; and 3) enough air to pressurize the building.
A slight positive space pressure is very useful to reduce infiltration; as a rule-of-thumb, assume 10% additional ventilation air for pressurization. Infiltration exists in all
Load Calculation
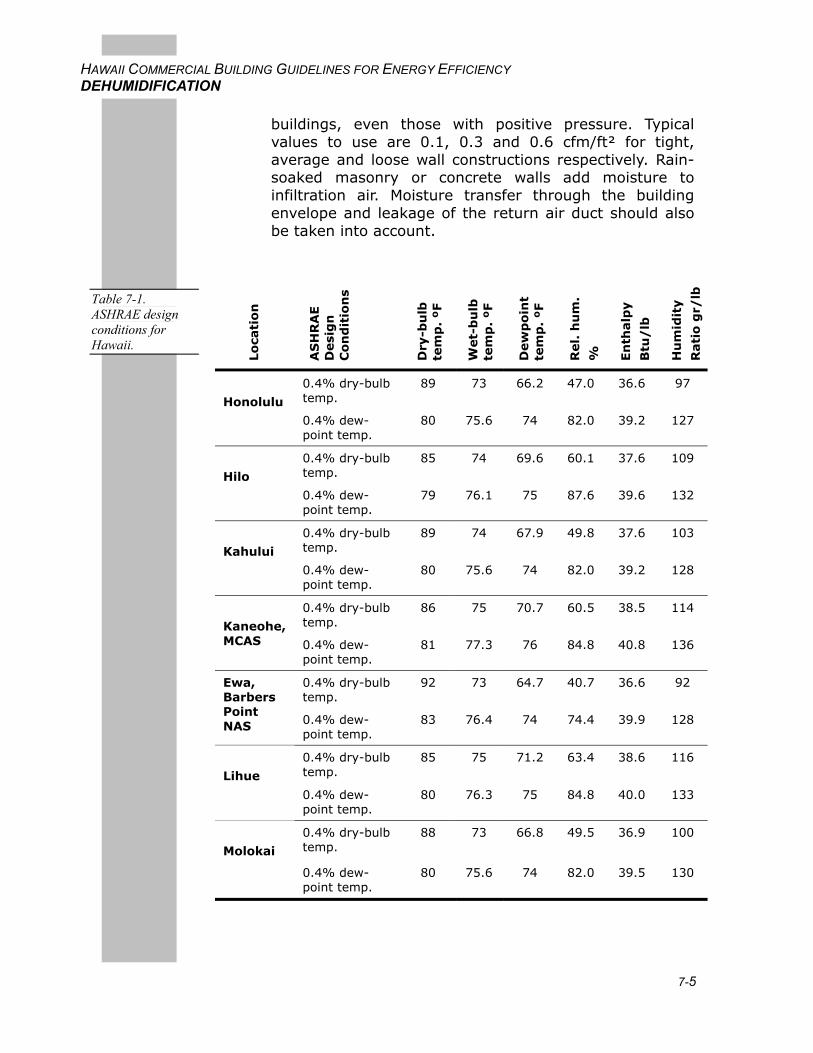
7-5
HAWAII COMMERCIAL BUILDING GUIDELINES FOR ENERGY EFFICIENCY DEHUMIDIFICATION
buildings, even those with positive pressure. Typical values to use are 0.1, 0.3 and 0.6 cfm/ft² for tight, average and loose wall constructions respectively. Rain-soaked masonry or concrete walls add moisture to infiltration air. Moisture transfer through the building envelope and leakage of the return air duct should also be taken into account.
Lo
cati
on
AS
HR
AE
Desi
gn
C
on
dit
ion
s
Dry
-bu
lb
tem
p.
ºF
Wet-
bu
lb
tem
p.
ºF
Dew
po
int
tem
p.
ºF
Rel.
hu
m.
%
En
thalp
y
Btu
/lb
Hu
mid
ity
Rati
o g
r/lb
0.4% dry-bulb temp.
89 73 66.2 47.0 36.6 97
Honolulu
0.4% dew-point temp.
80 75.6 74 82.0 39.2 127
0.4% dry-bulb temp.
85 74 69.6 60.1 37.6 109
Hilo
0.4% dew-point temp.
79 76.1 75 87.6 39.6 132
0.4% dry-bulb temp.
89 74 67.9 49.8 37.6 103
Kahului
0.4% dew-point temp.
80 75.6 74 82.0 39.2 128
0.4% dry-bulb temp.
86 75 70.7 60.5 38.5 114
Kaneohe, MCAS 0.4% dew-
point temp. 81 77.3 76 84.8 40.8 136
0.4% dry-bulb temp.
92 73 64.7 40.7 36.6 92 Ewa, Barbers Point NAS 0.4% dew-
point temp. 83 76.4 74 74.4 39.9 128
0.4% dry-bulb temp.
85 75 71.2 63.4 38.6 116
Lihue
0.4% dew-point temp.
80 76.3 75 84.8 40.0 133
0.4% dry-bulb temp.
88 73 66.8 49.5 36.9 100
Molokai
0.4% dew-point temp.
80 75.6 74 82.0 39.5 130
Table 7-1. ASHRAE design conditions for Hawaii.
7-6
HAWAII COMMERCIAL BUILDING GUIDELINES FOR ENERGY EFFICIENCY DEHUMIDIFICATION
A variety of dehumidification systems have been developed to improve the energy efficiency of conventional reheat systems. Their target is zero reheat and zero overcooling in the dehumidification process by energy recovery, recycling, reuse and load reduction. These systems, which are discussed later in this chapter, include:
Conventional reheat systems
Run-around coil systems
Heat pipe systems
Dual-path systems
Desiccant systems
Refrigerant subcooling systems are discussed in the single-zone direct-expansion (DX) Systems section of the HVAC Guidelines.
When dehumidification is integrated into a cooling system, pay special attention to these issues:
Select and size HVAC equipment (coils, fan, pump, damper, etc.) for sensible and latent cooling at peak load conditions. These usually don’t occur simultaneously.
Design for energy efficiency at part-load conditions because peak load usually occurs for only about 2% of the operating time
Annual energy consumption for three system types is estimated using Honolulu bin weather data for the three common systems used in commercial buildings. See the individual system sections below for detailed performance data. Table 7-2 summarizes the system performance results.
System Alternatives
Integrated Design Implications
System Performance
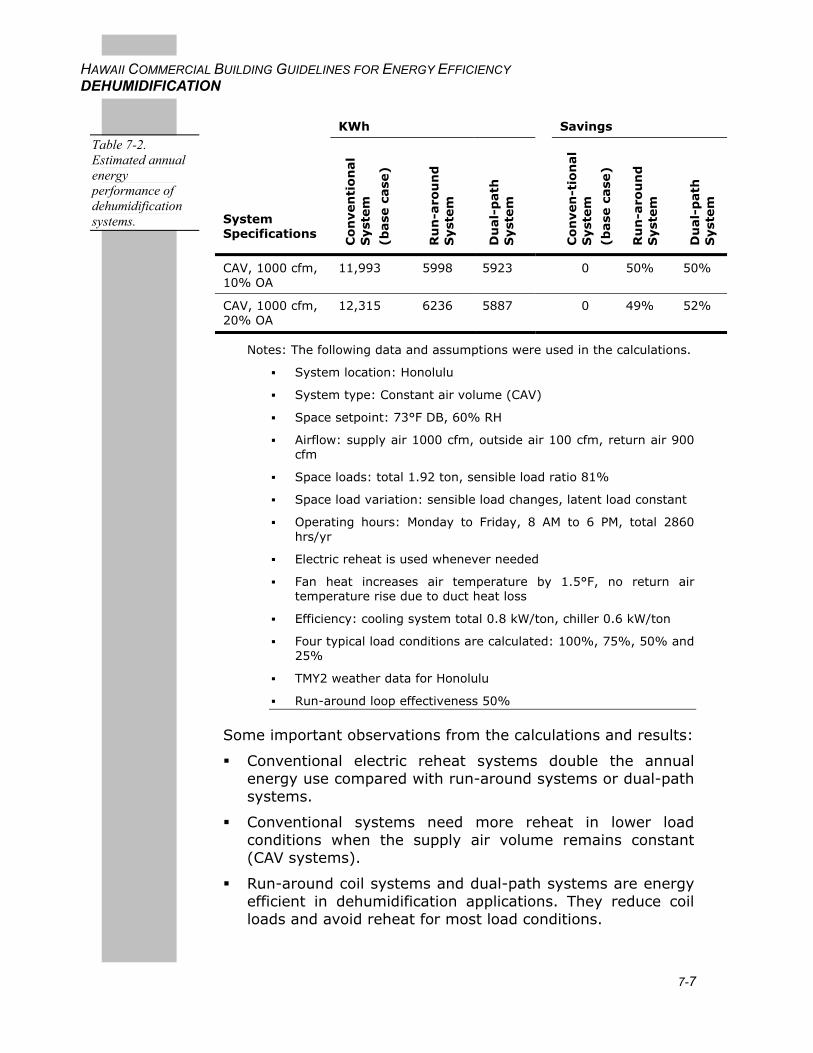
7-7
HAWAII COMMERCIAL BUILDING GUIDELINES FOR ENERGY EFFICIENCY DEHUMIDIFICATION
KWh Savings
System Specifications
Co
nven
tio
nal
Syst
em
(base
case
)
Ru
n-a
rou
nd
S
yst
em
Du
al-
path
S
yst
em
Co
nven
-tio
nal
Syst
em
(base
case
)
Ru
n-a
rou
nd
S
yst
em
Du
al-
path
S
yst
em
CAV, 1000 cfm, 10% OA
11,993 5998 5923 0 50% 50%
CAV, 1000 cfm, 20% OA
12,315 6236 5887 0 49% 52%
Notes: The following data and assumptions were used in the calculations.
System location: Honolulu
System type: Constant air volume (CAV)
Space setpoint: 73°F DB, 60% RH
Airflow: supply air 1000 cfm, outside air 100 cfm, return air 900 cfm
Space loads: total 1.92 ton, sensible load ratio 81%
Space load variation: sensible load changes, latent load constant
Operating hours: Monday to Friday, 8 AM to 6 PM, total 2860 hrs/yr
Electric reheat is used whenever needed
Fan heat increases air temperature by 1.5°F, no return air temperature rise due to duct heat loss
Efficiency: cooling system total 0.8 kW/ton, chiller 0.6 kW/ton
Four typical load conditions are calculated: 100%, 75%, 50% and 25%
TMY2 weather data for Honolulu
Run-around loop effectiveness 50%
Some important observations from the calculations and results:
Conventional electric reheat systems double the annual energy use compared with run-around systems or dual-path systems.
Conventional systems need more reheat in lower load conditions when the supply air volume remains constant (CAV systems).
Run-around coil systems and dual-path systems are energy efficient in dehumidification applications. They reduce coil loads and avoid reheat for most load conditions.
Table 7-2. Estimated annual energy performance of dehumidification systems.
7-8
HAWAII COMMERCIAL BUILDING GUIDELINES FOR ENERGY EFFICIENCY DEHUMIDIFICATION
Run-around systems and dual-path systems may need reheat at very low load conditions when space latent load dominates the total cooling load and the ventilation rate remains constant. A special case occurs in supermarkets where refrigerated display cases cool the store during unoccupied hours or when the store is cool due to cool weather. In this case, dual-path systems are equipped with reversing valves that allow the return air circuit to provide heating (see the Foodland Lahaina case study in the Dual-path Systems Guideline).
To achieve an energy-efficient dehumidification system design, consider the following factors:
From an energy efficiency perspective, economizer and nighttime ventilation are not applicable in Hawaii.
Size and select cooling coils with enough cooling capacity to handle the peak sensible cooling load and peak latent cooling load that occur at different load conditions. Use low-approach cooling coils and low temperature water.
Design systems considering various load conditions rather than only the peak load condition. For conventional cooling with reheat systems, size reheat equipment to handle a higher reheat requirement in lower load conditions, especially for constant-volume systems.
Integrate heat recovery equipment into conventional cooling systems to reduce cooling loads and reheat energy. Run-around loop systems are much more energy efficient than conventional cooling systems, especially when operating in part-load conditions.
Dual-path systems offer competitive energy efficiency with run-around loop systems, and provide better control of the outside air ventilation rate. Dual-path systems decouple sensible cooling and latent cooling for easy control of the supply air temperature and humidity. Equipment is available to provide both cooling and reheat (for example, ClimateMaster).
Desiccant systems are more competitive when a low supply air dew-point temperature is required, latent load fraction is high, low- or no-cost reactivation heat from steam, hot water or waste heat is available, and electricity costs are high when compared to gas costs.
Lay out equipment correctly. Place filters upstream of coils. Place fans downstream of coils (draw-through mode) to provide a small amount of reheat.
Design Details
7-9
HAWAII COMMERCIAL BUILDING GUIDELINES FOR ENERGY EFFICIENCY DEHUMIDIFICATION
Select low face velocity coils to reduce air pressure drop and improve dehumidification performance.
When using heat pipes, make sure that the additional delta-P is accounted for.
To maintain efficient operation of cooling and dehumidification systems:
1. Coils must drain condensate and be cleaned regularly.
2. Filters must be cleaned or replaced regularly.
3. Chilled water temperature reset should not sacrifice the dehumidification requirement of cooling coils. A system analysis (air and water) can tell you what the optimum chilled water temperature is.
The utilities that serve Oahu, Maui, Molokai, Lanai and the Big Island (HECO, MECO and HELCO) have a rebate program called the Commercial and Industrial Customized Rebate (CICR) program. Under this program innovative technologies that save energy and demand qualify for a rebate based on $125 per kW of peak demand reduction and $0.05 per kWh for a year of energy savings. Rebates are based on engineering estimates of energy and demand savings. In the case of unproven technologies, the rebate may be paid over a period of five years based on metered savings.
American Gas Cooling Center (AGCC), www.agcc.org
ASHRAE Handbooks, www.ashrae.org
ASHRAE, Humidity Control Design Guide for Commercial and Institutional Buildings
Electrical Power Research Institute (EPRI), www.epri.com
ESource, Technology Atlas Series — Space Cooling, www.esource.com
Federal Energy Management Program (FEMP), www.eren.doe.gov/femp
Gas Technology Institute (GTI), www.gri.org
Hawaiian Electric Co., Hawaii Electric Light Co., Maui Electric Co., www.heco.com
Operation and Maintenance
Utility Programs
Resources
7-10
HAWAII COMMERCIAL BUILDING GUIDELINES FOR ENERGY EFFICIENCY DEHUMIDIFICATION
HPAC (Heating/Piping/Air-conditioning) Engineering journal, www.hpac.com
Munters Corporation, The Dehumidification Handbook, www.dehumidification.com
National Renewable Energy Laboratory (NREL), http://www.nrel.gov
Penn State University, The Dedicated Outside Air System, www.doas.psu.edu
J. David Odom and George DuBose, Preventing Indoor Air Quality Problems in Hot, Humid Climates: Problem Avoidance Guidelines, Revised 1996, CH2M Hill.
Conventional Cooling Systems with Reheat
Install conventional systems in applications with low latent loads, with no requirements for indoor air quality or humidity control, and where low first cost is a high priority. Consider the use of cooling-coil face and bypass dampers or cold air distribution to reduce the need for reheat.
Conventional cooling systems dehumidify the mixed air by passing it across a cooling coil that is cold enough to condense water vapor, and then reheating it to the required supply air temperature. The cooling coil can be powered by chilled water from central chiller plant or it can be a direct expansion refrigerant coil. Reheat may be trivial or not needed at peak load conditions, which is usually based on the design dry-bulb temperature that gives maximum sensible cooling loads instead of maximum latent loads. Reheat is often needed at typical low-load conditions with higher latent load fraction. Conventional systems often double the total energy use because of overcooling and reheating of the supply air.
Recommendation
Description
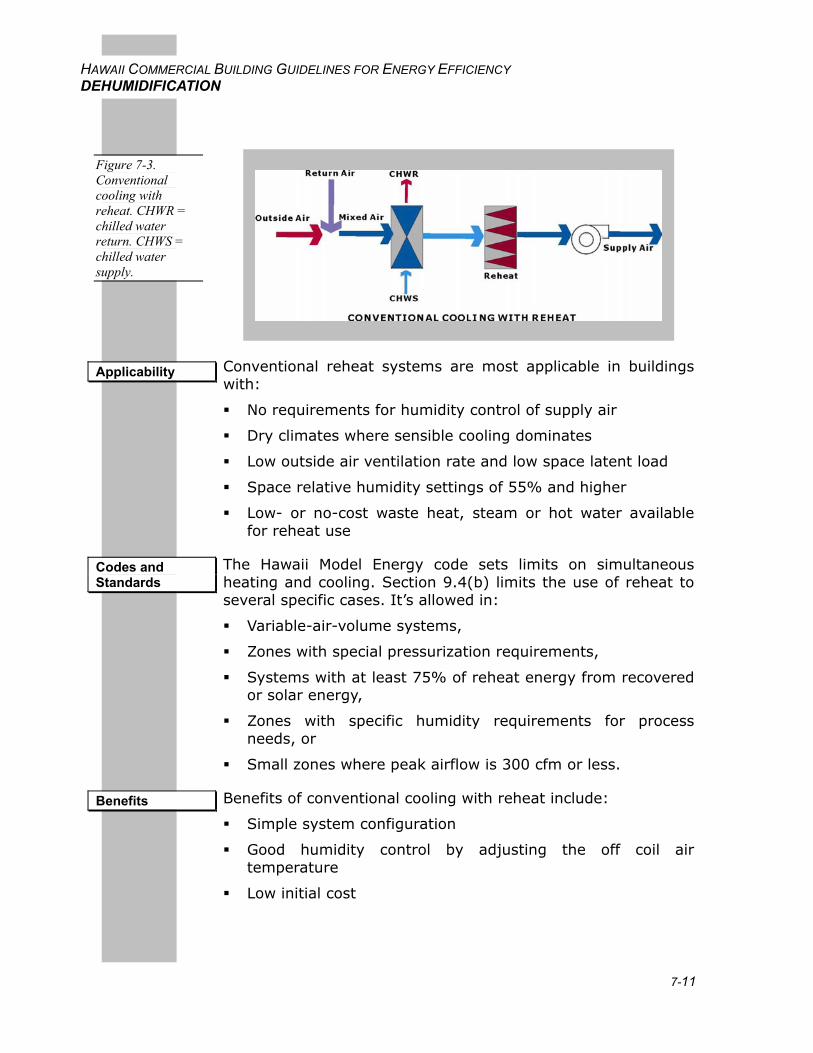
7-11
HAWAII COMMERCIAL BUILDING GUIDELINES FOR ENERGY EFFICIENCY DEHUMIDIFICATION
Conventional reheat systems are most applicable in buildings with:
No requirements for humidity control of supply air
Dry climates where sensible cooling dominates
Low outside air ventilation rate and low space latent load
Space relative humidity settings of 55% and higher
Low- or no-cost waste heat, steam or hot water available for reheat use
The Hawaii Model Energy code sets limits on simultaneous heating and cooling. Section 9.4(b) limits the use of reheat to several specific cases. It’s allowed in:
Variable-air-volume systems,
Zones with special pressurization requirements,
Systems with at least 75% of reheat energy from recovered or solar energy,
Zones with specific humidity requirements for process needs, or
Small zones where peak airflow is 300 cfm or less.
Benefits of conventional cooling with reheat include:
Simple system configuration
Good humidity control by adjusting the off coil air temperature
Low initial cost
Figure 7-3. Conventional cooling with reheat. CHWR = chilled water return. CHWS = chilled water supply.
Applicability
Codes and Standards
Benefits
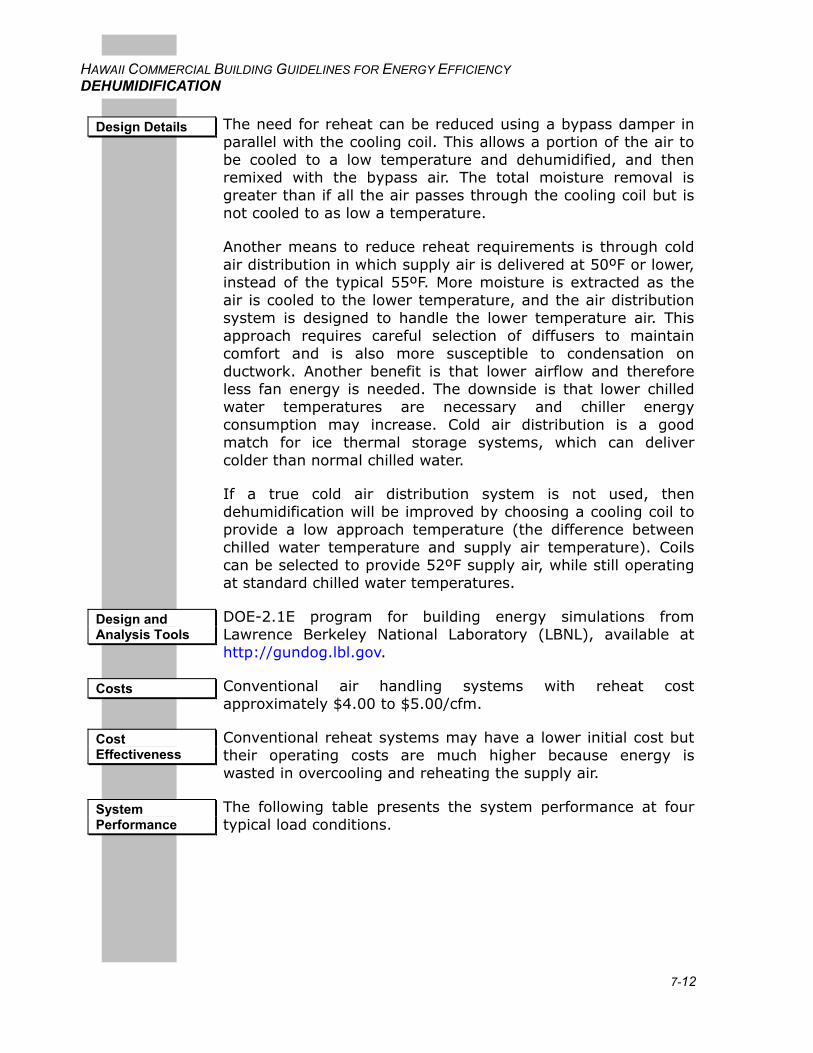
7-12
HAWAII COMMERCIAL BUILDING GUIDELINES FOR ENERGY EFFICIENCY DEHUMIDIFICATION
The need for reheat can be reduced using a bypass damper in parallel with the cooling coil. This allows a portion of the air to be cooled to a low temperature and dehumidified, and then remixed with the bypass air. The total moisture removal is greater than if all the air passes through the cooling coil but is not cooled to as low a temperature.
Another means to reduce reheat requirements is through cold air distribution in which supply air is delivered at 50ºF or lower, instead of the typical 55ºF. More moisture is extracted as the air is cooled to the lower temperature, and the air distribution system is designed to handle the lower temperature air. This approach requires careful selection of diffusers to maintain comfort and is also more susceptible to condensation on ductwork. Another benefit is that lower airflow and therefore less fan energy is needed. The downside is that lower chilled water temperatures are necessary and chiller energy consumption may increase. Cold air distribution is a good match for ice thermal storage systems, which can deliver colder than normal chilled water.
If a true cold air distribution system is not used, then dehumidification will be improved by choosing a cooling coil to provide a low approach temperature (the difference between chilled water temperature and supply air temperature). Coils can be selected to provide 52ºF supply air, while still operating at standard chilled water temperatures.
DOE-2.1E program for building energy simulations from Lawrence Berkeley National Laboratory (LBNL), available at http://gundog.lbl.gov.
Conventional air handling systems with reheat cost approximately $4.00 to $5.00/cfm.
Conventional reheat systems may have a lower initial cost but their operating costs are much higher because energy is wasted in overcooling and reheating the supply air.
The following table presents the system performance at four typical load conditions.
Design Details
Design and Analysis Tools
Costs
Cost Effectiveness
System Performance
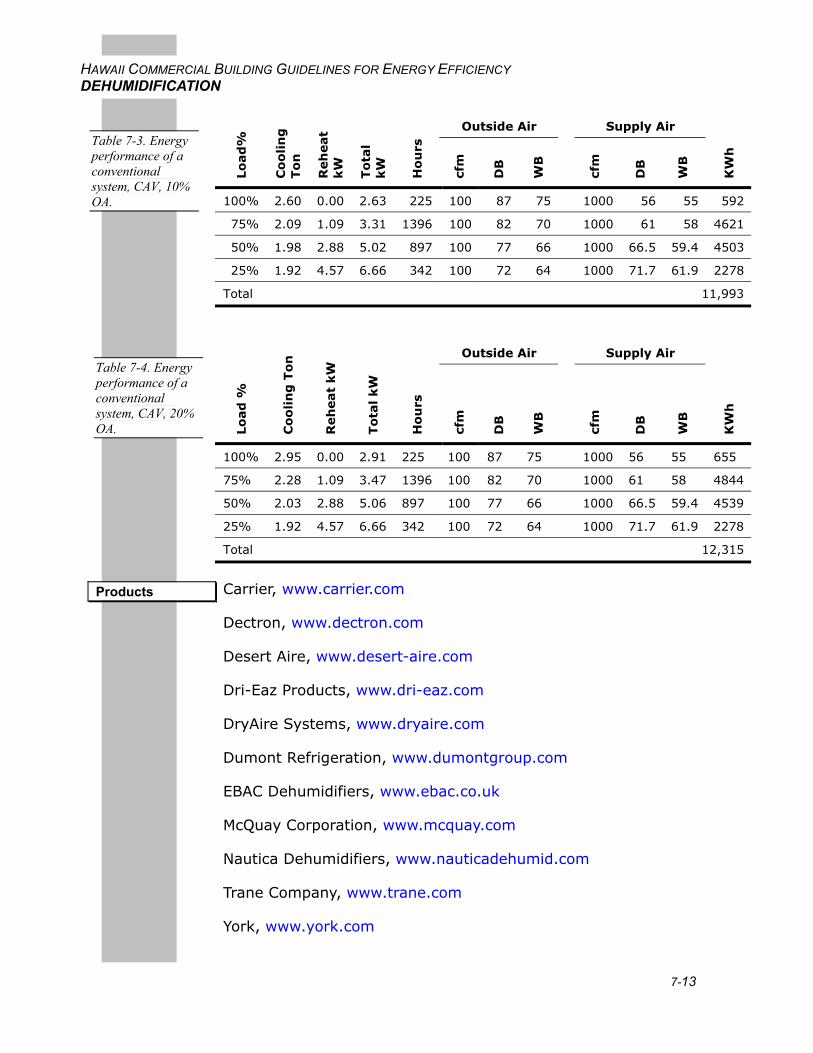
7-13
HAWAII COMMERCIAL BUILDING GUIDELINES FOR ENERGY EFFICIENCY DEHUMIDIFICATION
Outside Air Supply Air
Lo
ad
%
Co
oli
ng
To
n
Reh
eat
kW
To
tal
kW
Ho
urs
cfm
DB
WB
cf
m
DB
WB
KW
h
100% 2.60 0.00 2.63 225 100 87 75 1000 56 55 592
75% 2.09 1.09 3.31 1396 100 82 70 1000 61 58 4621
50% 1.98 2.88 5.02 897 100 77 66 1000 66.5 59.4 4503
25% 1.92 4.57 6.66 342 100 72 64 1000 71.7 61.9 2278
Total 11,993
Outside Air Supply Air
Lo
ad
%
Co
oli
ng
To
n
Reh
eat
kW
To
tal kW
Ho
urs
cfm
DB
WB
cfm
DB
WB
KW
h
100% 2.95 0.00 2.91 225 100 87 75 1000 56 55 655
75% 2.28 1.09 3.47 1396 100 82 70 1000 61 58 4844
50% 2.03 2.88 5.06 897 100 77 66 1000 66.5 59.4 4539
25% 1.92 4.57 6.66 342 100 72 64 1000 71.7 61.9 2278
Total 12,315
Carrier, www.carrier.com
Dectron, www.dectron.com
Desert Aire, www.desert-aire.com
Dri-Eaz Products, www.dri-eaz.com
DryAire Systems, www.dryaire.com
Dumont Refrigeration, www.dumontgroup.com
EBAC Dehumidifiers, www.ebac.co.uk
McQuay Corporation, www.mcquay.com
Nautica Dehumidifiers, www.nauticadehumid.com
Trane Company, www.trane.com
York, www.york.com
Table 7-3. Energy performance of a conventional system, CAV, 10% OA.
Table 7-4. Energy performance of a conventional system, CAV, 20% OA.
Products
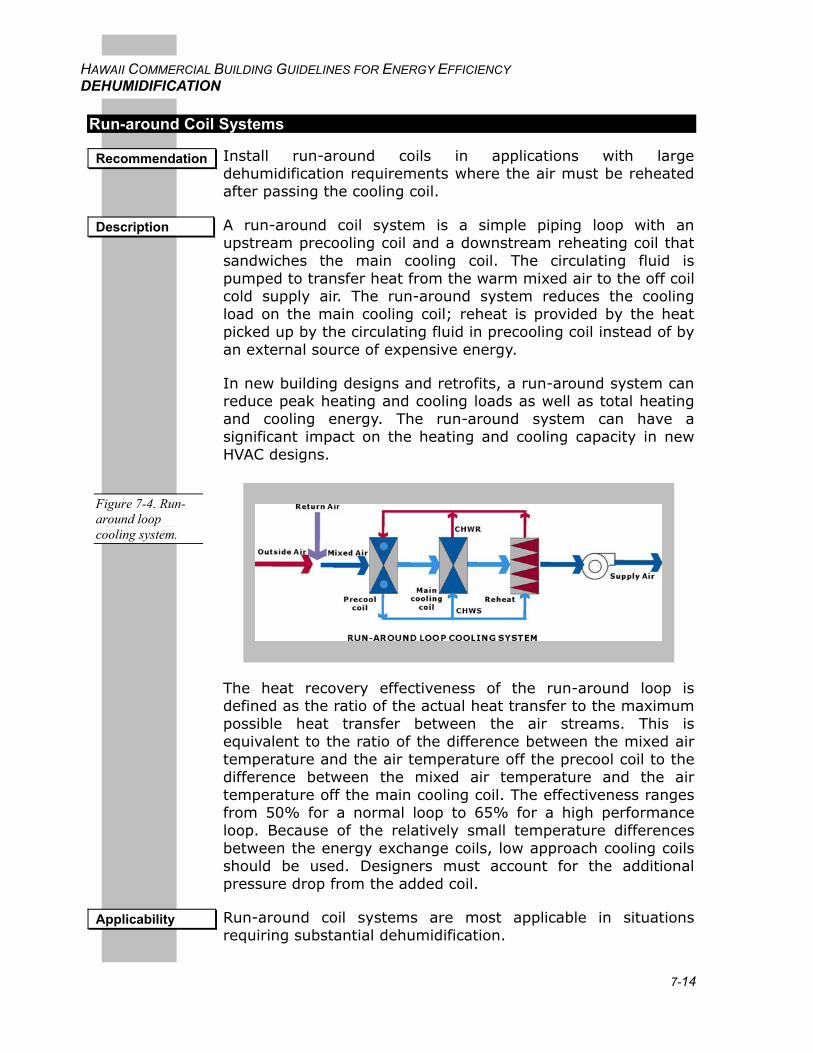
7-14
HAWAII COMMERCIAL BUILDING GUIDELINES FOR ENERGY EFFICIENCY DEHUMIDIFICATION
Run-around Coil Systems
Install run-around coils in applications with large dehumidification requirements where the air must be reheated after passing the cooling coil.
A run-around coil system is a simple piping loop with an upstream precooling coil and a downstream reheating coil that sandwiches the main cooling coil. The circulating fluid is pumped to transfer heat from the warm mixed air to the off coil cold supply air. The run-around system reduces the cooling load on the main cooling coil; reheat is provided by the heat picked up by the circulating fluid in precooling coil instead of by an external source of expensive energy.
In new building designs and retrofits, a run-around system can reduce peak heating and cooling loads as well as total heating and cooling energy. The run-around system can have a significant impact on the heating and cooling capacity in new HVAC designs.
The heat recovery effectiveness of the run-around loop is defined as the ratio of the actual heat transfer to the maximum possible heat transfer between the air streams. This is equivalent to the ratio of the difference between the mixed air temperature and the air temperature off the precool coil to the difference between the mixed air temperature and the air temperature off the main cooling coil. The effectiveness ranges from 50% for a normal loop to 65% for a high performance loop. Because of the relatively small temperature differences between the energy exchange coils, low approach cooling coils should be used. Designers must account for the additional pressure drop from the added coil.
Run-around coil systems are most applicable in situations requiring substantial dehumidification.
Recommendation
Description
Figure 7-4. Run-around loop cooling system.
Applicability
7-15
HAWAII COMMERCIAL BUILDING GUIDELINES FOR ENERGY EFFICIENCY DEHUMIDIFICATION
ANSI/ASHRAE Standard 84–1991, Method of Testing Air-to-Air Heat Exchangers
Benefits of run-around coil systems include:
Lower cooling load contributes to a smaller cooling system and less pumping energy use, but fan energy increases due to extra air pressure drop through the run-around coils.
Reheat energy is saved
Lower total energy use
The increased dehumidification capacity provided by run-around coils allows for a smaller cooling system. However, the addition of coils will increase the pressure drop, and fan power must be adjusted accordingly.
The run-around loop can either be applied to existing systems or can be installed at the factory. The run-around loop requires a fractional horsepower pump, a 120V–60HZ single-phase electrical circuit, and a three-way valve or a variable-speed drive (VSD) for the pump. For bigger systems, an expansion tank with air vent may be needed.
Run-around coils can be selected by manufacturers or by design engineers using coil selection programs from manufacturers.
The initial cost of a run-around system is about double that of a conventional system, but if the downsizing of the chiller and cooling tower is counted, the total initial cost will be very close. The total installation cost is approximately $4.50 to $5.00/cfm.
The cost effectiveness of a run-around system depends on the system it is replacing. When used instead of a dehumidifying system requiring reheat, the simple payback is about two to three years. However, when the system replaces a system without reheat (no humidity control), there are additional benefits including increased comfort and enhanced indoor air quality, which are difficult to quantify.
Run-around systems require extra maintenance for the two coils and the loop. Air trapped in the coils, pump and piping must be vented upon initial startup to ensure effective fluid flow and heat transfer. The precooling and reheating function can be controlled by adjusting the pump speed with VSD, cycling the pump on-off, or using valve control and bypass.
Codes and Standards
Benefits
Integrated Design Implications
Design Details
Design and Analysis Tools
Costs
Cost Effectiveness
Operations and Maintenance
7-16
HAWAII COMMERCIAL BUILDING GUIDELINES FOR ENERGY EFFICIENCY DEHUMIDIFICATION
Commissioning of a run-around system must be done for typical various load conditions to determine whether additional reheat is needed at very low load conditions.
The following tables present the system performance at four typical load conditions.
Outside Air Supply Air
Lo
ad
%
Co
oli
ng
To
n
Reh
eat
kW
To
tal kW
Ho
urs
cfm
DB
WB
cfm
DB
WB
KW
h
100% 2.60 0.00 2.72 225 100 87 75 1000 56 55 612
75% 1.78 0.00 2.07 1396 100 82 70 1000 61 58 2890
50% 1.16 0.00 1.57 897 100 77 66 1000 66.5 59.4 1408
25% 1.10 1.65 3.18 342 100 72 64 1000 71.7 61.9 1088
Total 5998
Outside Air Supply Air
Lo
ad
%
Co
oli
ng
To
n
Reh
eat
kW
To
tal
kW
Ho
urs
cfm
DB
WB
cfm
DB
WB
KW
h
100% 2.95 0.00 3.00 225 100 87 75 1000 56 55 675
75% 1.93 0.00 2.19 1396 100 82 70 1000 61 58 3057
50% 1.18 0.00 1.59 897 100 77 66 1000 66.5 59.4 1426
25% 1.07 1.65 3.15 342 100 72 64 1000 71.7 61.9 1077
Total 6236
Run-around coils with ARI certification are available from at least 10 manufacturers.
Commissioning
System Performance
Table 7-5. Energy performance of a run-around system, CAV, 10% OA.
Table 7-6. Energy performance of a run-around system, CAV, 20% OA.
Products
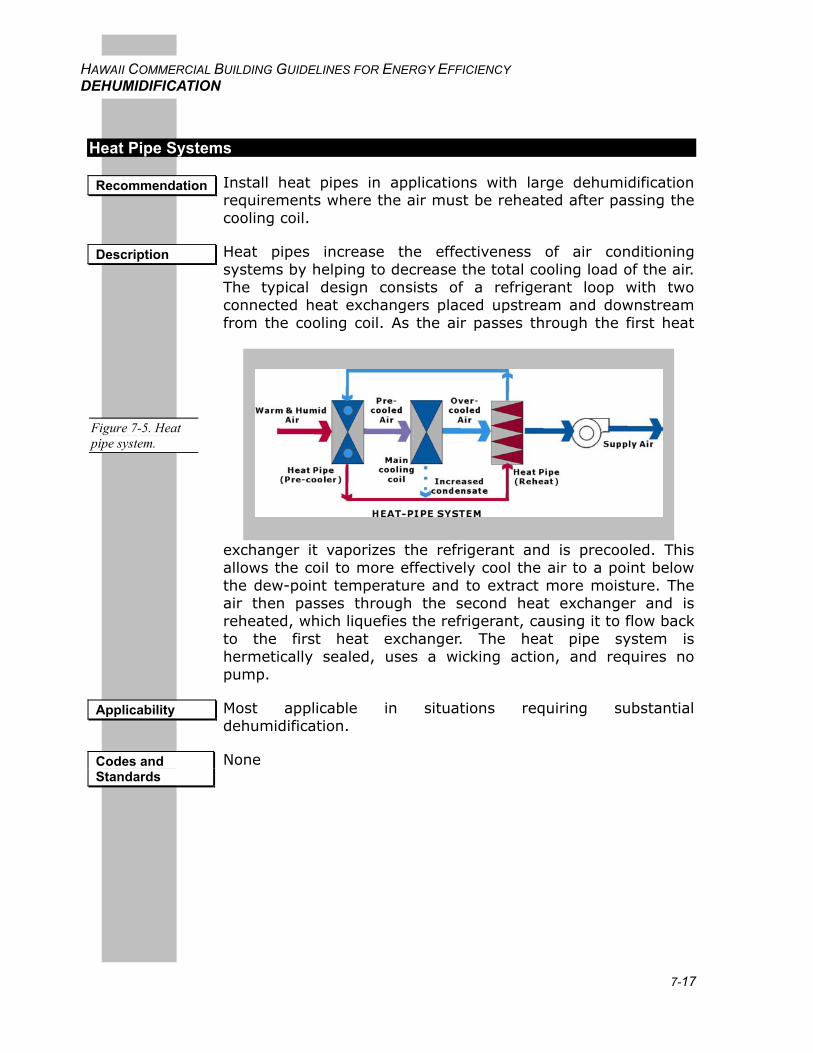
7-17
HAWAII COMMERCIAL BUILDING GUIDELINES FOR ENERGY EFFICIENCY DEHUMIDIFICATION
Heat Pipe Systems
Install heat pipes in applications with large dehumidification requirements where the air must be reheated after passing the cooling coil.
Heat pipes increase the effectiveness of air conditioning systems by helping to decrease the total cooling load of the air. The typical design consists of a refrigerant loop with two connected heat exchangers placed upstream and downstream from the cooling coil. As the air passes through the first heat
exchanger it vaporizes the refrigerant and is precooled. This allows the coil to more effectively cool the air to a point below the dew-point temperature and to extract more moisture. The air then passes through the second heat exchanger and is reheated, which liquefies the refrigerant, causing it to flow back to the first heat exchanger. The heat pipe system is hermetically sealed, uses a wicking action, and requires no pump.
Most applicable in situations requiring substantial dehumidification.
None
Recommendation
Description
Figure 7-5. Heat pipe system.
Applicability
Codes and Standards
7-18
HAWAII COMMERCIAL BUILDING GUIDELINES FOR ENERGY EFFICIENCY DEHUMIDIFICATION
Benefits of heat pipe systems include:
Removes 50% to 100% more moisture than systems without heat pipes.
Saves energy compared to systems that provide similar amounts of dehumidification.
Simple system with no moving parts or external connections makes it basically maintenance free.
The increased dehumidification capacity provided by heat pipes allows for a smaller cooling system. However, the addition of heat pipes will increase the pressure drop, and fan power must be adjusted accordingly.
Heat pipes can either be applied to existing HVAC systems or can be installed at the factory. The heat pipe loop is usually controlled by cycling on-off or modulating the refrigerant flow with a control valve.
Heat Pipe Technologies product selection software, www.heatpipe.com.
The installation cost of a heat pipe loop for a cooling system is approximately $2.50/cfm.
The cost effectiveness of heat pipes depends on the system it is replacing. When used instead of a dehumidifying system requiring reheat, the simple payback is two to three years. However, when the system replaces a system without reheat (that is, no humidity control), there are additional benefits including increased comfort and enhanced indoor air quality, which are difficult to quantify.
Some heat pipe applications require the same routine maintenance as any air conditioning unit. Valveless units require no maintenance aside from cleaning. Valved units have normal balancing requirements.
The precooling and reheating heat pipes should be installed closely to sandwich the main cooling coil. A Dinh-style heat pipe dehumidification system was installed in the air handling system (19,000 cfm) in Building 49 at the EPA’s Gulf Breeze laboratory in Pensacola, Florida, in 1996. The heat pipe was effective in reducing inside humidity levels by about 10%, from an average of 75% before installation to an average of 65% after installation, without affecting the inside
Benefits
Integrated Design Implications
Design Details
Design and Analysis Tools
Costs
Cost Effectiveness
Operations and Maintenance
Commissioning
Case Study
7-19
HAWAII COMMERCIAL BUILDING GUIDELINES FOR ENERGY EFFICIENCY DEHUMIDIFICATION
temperatures. An additional 20 tons of mechanical cooling would have been necessary to provide this additional dehumidification during peak conditions.
The heat pipe cost $42,000 to install; the additional mechanical cooling equipment necessary to provide the same level of dehumidification would have cost $30,000. Therefore the additional cost of installing a heat pipe instead of mechanical cooling to provide the 10% lower indoor humidity was $12,000.
Using a weather bin method analysis, the heat pipe in this location provides a maximum 20 tons of precooling and 240 kBTU/h of reheat with no energy input, saving an estimated 56 kW in peak summer demand, 153,775 kWh in annual energy consumption (about 10% of the total), and $7,700 in annual energy costs. The simple payback of using a heat pipe to provide the enhanced dehumidification for this installation is therefore 15 months. The payback will vary for other installations based on weather data, mechanical system efficiencies, and utility rates. A comparison of the EPA Building 49 utility bills for the 12 months before installation and the 12 months following installation, normalized for weather variations, showed an actual energy reduction of 230,750 kWh (14%) and a cost reduction of $9,980.
Heat Pipe Technologies, www.heatpipe.com
Island Energy Systems (sales representative) Contact: Joseph Petrie PO Box 316, 111 Kaapahu Road, Paauilo, HI 96776 Phone: 808-776-1333 Fax: 808-776-164
Heat Pipe Technologies, www.heatpipe.com
Dual-path Systems
Install dual-path systems in applications with return air and large dehumidification load due to high outside air ventilation rate.
A dual-path system uses two coils (either chilled water or DX) to separately cool the incoming outside air and return air. The hot and humid outdoor air is cooled by a primary coil to 42°F to 45°F for dehumidification. The secondary coil furnishes the
Products
Resources
Recommendation
Description
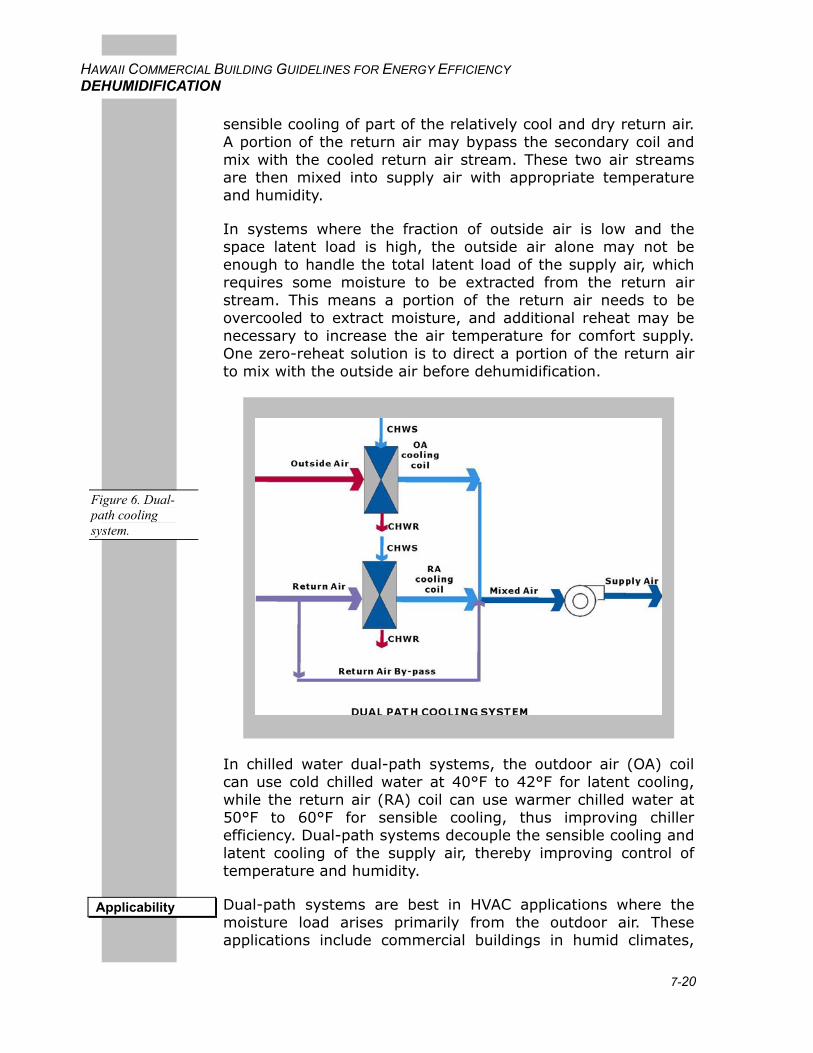
7-20
HAWAII COMMERCIAL BUILDING GUIDELINES FOR ENERGY EFFICIENCY DEHUMIDIFICATION
sensible cooling of part of the relatively cool and dry return air. A portion of the return air may bypass the secondary coil and mix with the cooled return air stream. These two air streams are then mixed into supply air with appropriate temperature and humidity.
In systems where the fraction of outside air is low and the space latent load is high, the outside air alone may not be enough to handle the total latent load of the supply air, which requires some moisture to be extracted from the return air stream. This means a portion of the return air needs to be overcooled to extract moisture, and additional reheat may be necessary to increase the air temperature for comfort supply. One zero-reheat solution is to direct a portion of the return air to mix with the outside air before dehumidification.
In chilled water dual-path systems, the outdoor air (OA) coil can use cold chilled water at 40°F to 42°F for latent cooling, while the return air (RA) coil can use warmer chilled water at 50°F to 60°F for sensible cooling, thus improving chiller efficiency. Dual-path systems decouple the sensible cooling and latent cooling of the supply air, thereby improving control of temperature and humidity.
Dual-path systems are best in HVAC applications where the moisture load arises primarily from the outdoor air. These applications include commercial buildings in humid climates,
Figure 6. Dual-path cooling system.
Applicability
7-21
HAWAII COMMERCIAL BUILDING GUIDELINES FOR ENERGY EFFICIENCY DEHUMIDIFICATION
schools, clean rooms, theaters, supermarkets, hotels and motels. For larger systems, separate air-handling units for outside air and return air can be used.
None
Benefits of dual-path systems include:
Reduces the installed cooling tons over a conventional single-path system
Provides low operating cost with efficient cooling and no reheat
Provides direct control of ventilation air quantity for improved indoor air quality
Provides good humidity control at all times, including part load, as moisture is removed at its source, regardless of building load
Dual-path systems avoid overcooling and reheating the supply air, thus reducing the size of cooling and heating systems. The sensible cooling of the return air can use chilled water with higher temperature to improve chiller efficiency. The additional costs of coil, duct and pipe work, and damper or VSD control must be adjusted accordingly.
Dual-path systems can be installed separately or integrated with additional HVAC/R equipment. They are currently available in factory package units for indoor and outdoor installation. The OA cooling coil should be sized for peak latent load, while the RA cooling coil should be sized for peak sensible load. The OA path controls the humidity of the supply air by modulating the chilled water flow, while the RA path controls the supply air temperature by adjusting the bypass damper position.
Selection of dual-path systems can be made by manufacturers or by design engineers using selection programs from manufacturers.
The installation price of a dual-path system varies between $5–$6/cfm. Dual-path systems are energy efficient while assuring an acceptable humidity level at all ventilation air volumes. Its use can also reduce demand and energy charges sufficiently to offset the higher first cost.
Codes and Standards
Benefits
Integrated Design Implications
Design Details
Design and Analysis Tools
Costs
Cost Effectiveness
7-22
HAWAII COMMERCIAL BUILDING GUIDELINES FOR ENERGY EFFICIENCY DEHUMIDIFICATION
Maintenance of an additional coil and equipment in the return air stream is required. The outside air path runs as cool as possible almost all the time while the return air path is controlled to obtain the required temperature and humidity of the supply air.
Measurement of airflows and temperatures of both air streams must be done to confirm that the system is operating as designed.
Dual-path heat pump systems were installed in the 200,000-ft² Wal-Mart Supercenter in 1995 in Moore, Oklahoma. In 1996 the system met the stringent target of 45% RH for 99.2% of all operating hours. The system also saves on peak electricity use and costs compared to the best conventional systems using air-source vapor compression air conditioning, gas-driven dehumidification, and air-cooled refrigeration racks. In all, monitoring showed total energy savings of more than $70,000 per year. This project won the 1998 ASHRAE Technology Award.
Based on the success of the Wal-Mart installation, a dual-path system was installed at the Foodland Supermarket in Lahaina, Maui, in 1999. This supermarket achieved its design goal of 45% RH and 75ºF store conditions after VaCom Technologies installed a new digital control system. This store has achieved one of the lowest operating costs of the 30 or so Foodland sites in Hawaii. This project received Maui Electric’s 1999 Energy Project of the Year award.
The Pearl Harbor Naval Shipyard employs a dual-path strategy to provide 150 tons of cooling. A dedicated outside air unit provides most of the latent cooling, while two large return air units control sensible cooling.
The following tables present the dual-path system performance with 10% OA and 20% OA at four typical load conditions.
Operations and Maintenance
Commissioning
Case Study
System Performance
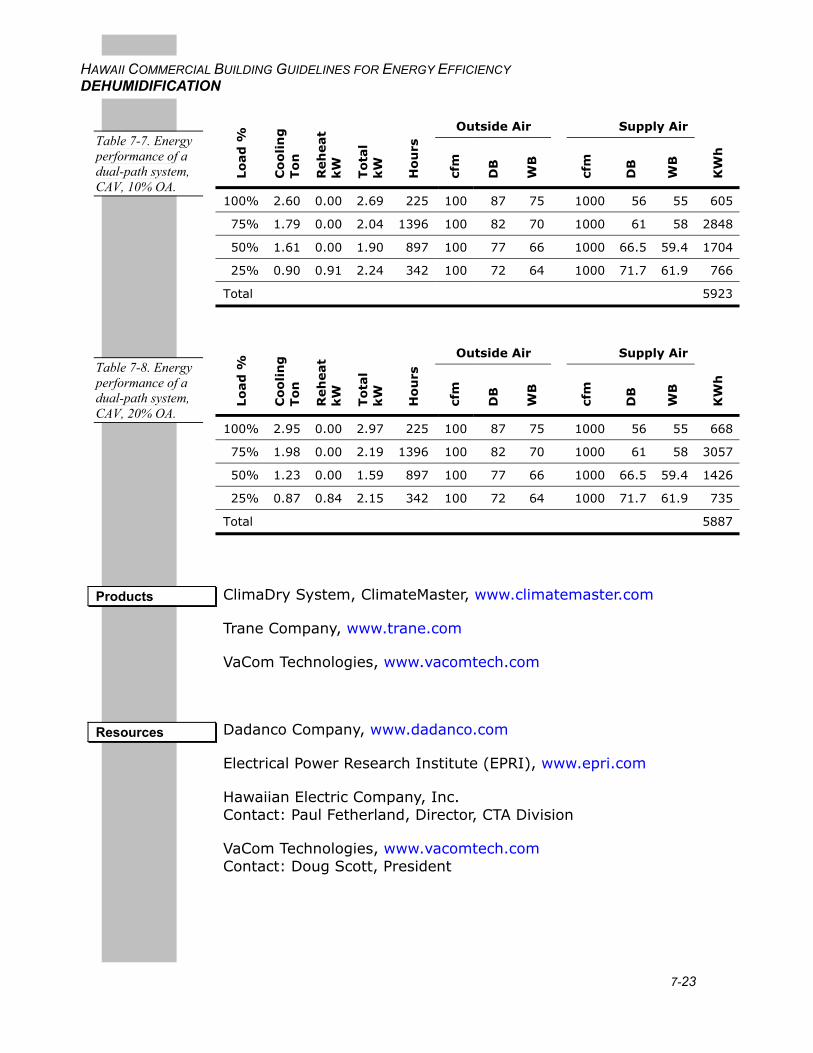
7-23
HAWAII COMMERCIAL BUILDING GUIDELINES FOR ENERGY EFFICIENCY DEHUMIDIFICATION
Outside Air Supply Air
Lo
ad
%
Co
oli
ng
To
n
Reh
eat
kW
To
tal
kW
Ho
urs
cfm
DB
WB
cfm
DB
WB
KW
h
100% 2.60 0.00 2.69 225 100 87 75 1000 56 55 605
75% 1.79 0.00 2.04 1396 100 82 70 1000 61 58 2848
50% 1.61 0.00 1.90 897 100 77 66 1000 66.5 59.4 1704
25% 0.90 0.91 2.24 342 100 72 64 1000 71.7 61.9 766
Total 5923
Outside Air Supply Air
Lo
ad
%
Co
oli
ng
To
n
Reh
eat
kW
To
tal
kW
Ho
urs
cfm
DB
WB
cfm
DB
WB
KW
h
100% 2.95 0.00 2.97 225 100 87 75 1000 56 55 668
75% 1.98 0.00 2.19 1396 100 82 70 1000 61 58 3057
50% 1.23 0.00 1.59 897 100 77 66 1000 66.5 59.4 1426
25% 0.87 0.84 2.15 342 100 72 64 1000 71.7 61.9 735
Total 5887
ClimaDry System, ClimateMaster, www.climatemaster.com
Trane Company, www.trane.com
VaCom Technologies, www.vacomtech.com
Dadanco Company, www.dadanco.com
Electrical Power Research Institute (EPRI), www.epri.com
Hawaiian Electric Company, Inc. Contact: Paul Fetherland, Director, CTA Division
VaCom Technologies, www.vacomtech.com Contact: Doug Scott, President
Table 7-7. Energy performance of a dual-path system, CAV, 10% OA.
Table 7-8. Energy performance of a dual-path system, CAV, 20% OA.
Products
Resources
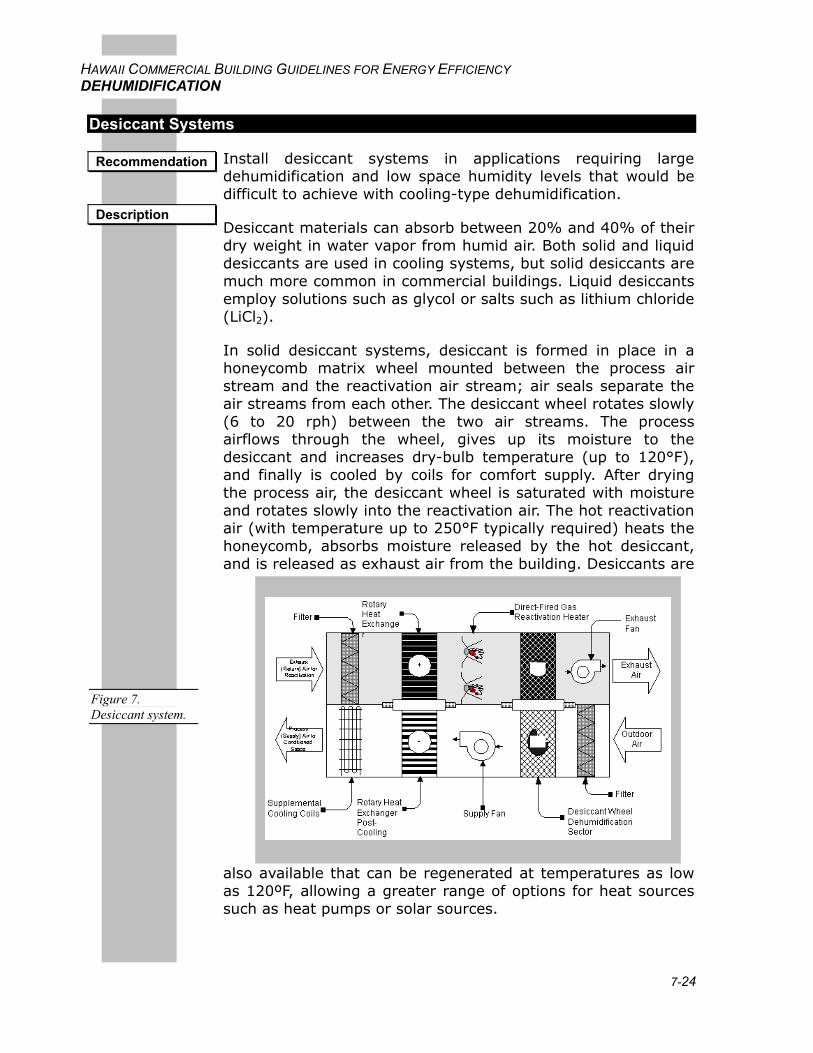
7-24
HAWAII COMMERCIAL BUILDING GUIDELINES FOR ENERGY EFFICIENCY DEHUMIDIFICATION
Desiccant Systems
Install desiccant systems in applications requiring large dehumidification and low space humidity levels that would be difficult to achieve with cooling-type dehumidification.
Desiccant materials can absorb between 20% and 40% of their dry weight in water vapor from humid air. Both solid and liquid desiccants are used in cooling systems, but solid desiccants are much more common in commercial buildings. Liquid desiccants employ solutions such as glycol or salts such as lithium chloride (LiCl2).
In solid desiccant systems, desiccant is formed in place in a honeycomb matrix wheel mounted between the process air stream and the reactivation air stream; air seals separate the air streams from each other. The desiccant wheel rotates slowly (6 to 20 rph) between the two air streams. The process airflows through the wheel, gives up its moisture to the desiccant and increases dry-bulb temperature (up to 120°F), and finally is cooled by coils for comfort supply. After drying the process air, the desiccant wheel is saturated with moisture and rotates slowly into the reactivation air. The hot reactivation air (with temperature up to 250°F typically required) heats the honeycomb, absorbs moisture released by the hot desiccant, and is released as exhaust air from the building. Desiccants are
also available that can be regenerated at temperatures as low as 120ºF, allowing a greater range of options for heat sources such as heat pumps or solar sources.
Recommendation
Description
Figure 7. Desiccant system.
7-25
HAWAII COMMERCIAL BUILDING GUIDELINES FOR ENERGY EFFICIENCY DEHUMIDIFICATION
Desiccant systems often incorporate heat recovery equipment. If exhaust air is available, it can be used to cool the warm air (leaving the desiccant section) before it passes through the cooling coil. When there is no exhaust air, outside air can be used to cool this warm air, and the heated outside air can be used to reactivate the desiccant.
In commercial air conditioning systems, desiccants last between 10,000 hours and 100,000 hours before they need replacement. According to the manufacturers, a well-maintained desiccant wheel will last for approximately 100,000 hours of operation (10 to 15 years).
Desiccant systems improve an air conditioning system by removing moisture from ventilation air. Since the cooling system no longer has to remove moisture, it operates more efficiently in sensible cooling mode. Desiccant systems usually use heat from natural gas as their primary energy source, and use very little electricity. On the mainland, these systems can save money when the cost of power is high during the peak demand periods of summer. In Hawaii, however, there is little seasonality. But desiccant systems offer a wide range of other benefits that are specific to the types of buildings in which they are installed. Those benefits are usually associated with keeping humidity lower than would be practical with conventional cooling-based systems.
There are several circumstances that may favor desiccant systems rather than cooling-based dehumidification systems. These include:
Economic benefit from low humidity
High moisture loads with low sensible load
Need for more fresh air
Exhaust air available for desiccant post cooling
Low thermal energy cost with high electrical demand charges
Economic benefit to dry duct work
Low-cost heat available for desiccant regeneration
Desiccant systems are applicable to existing or new HVAC systems for clean rooms, supermarkets, refrigerated warehouses, ice rinks, schools, restaurants, theaters, hotels, hospital/healthcare facilities, and situations where one or more of the following situations apply:
Applicability
7-26
HAWAII COMMERCIAL BUILDING GUIDELINES FOR ENERGY EFFICIENCY DEHUMIDIFICATION
Low indoor humidity (dew point below 50°F)
High latent load fraction (greater than 25%)
High outside air fraction (greater than 20%)
High electrical cost and low gas costs
Available heat source from waste heat, steam, hot water or gas for regeneration of desiccant
ARI Standard 940-1998, Desiccant Dehumidification Components
Decouples latent cooling from sensible cooling for precise control of humidity independent of temperature.
Lower operating cost. Cooling system runs more efficiently to produce chilled water with higher temperature for sensible cooling.
No wet coils or draining/cleaning requirement. Dry duct systems help avoid microbial and fungal growth associated with sick building syndrome.
Dehumidification process can use low-grade heat from natural gas, steam, hot water and solar energy.
Provide supply air with dew-point temperature below the practical limits of cooling technology.
The choice of a desiccant system affects the selection and sizing of the cooling coil, because the cooling coil only needs to handle the sensible load of the supply air, which allows for higher chilled water temperature and efficient operation. The sensible cooling load will be higher because of the hot dry air leaving from the desiccant wheel (due to heat of adsorption). However, the addition of a desiccant wheel will increase the pressure drop, fan power and maintenance, and an additional motor is required to rotate the wheel. This extra energy usage must be counted accordingly.
Desiccant systems should use low-cost surplus heat, waste heat or solar heat for desiccant reactivation. Dampers or VSD for fans should be installed to control airflow through the wheel. Side access for wheel and filter replacement and maintenance should be provided. Energy recovery and direct/indirect evaporative cooling are frequently incorporated in desiccant systems to reduce the cooling and heating energy.
DesiCalc program from InterEnergy, www.interenergysoftware.com
Codes and Standards
Benefits
Integrated Design Implications
Design Details
Design and Analysis Tools
7-27
HAWAII COMMERCIAL BUILDING GUIDELINES FOR ENERGY EFFICIENCY DEHUMIDIFICATION
Costs of desiccant systems are typically given in terms of $/cfm. For large commercial systems, the cost is approximately $5/cfm, while smaller units (less than 1000 cfm) may cost up to $8/cfm.
The higher initial cost of desiccant systems may be offset by lower operating costs and improved productivity because of increased comfort and enhanced indoor air quality. In large buildings where non-electric heat is available for reactivation of desiccants, desiccant systems can reduce HVAC electricity use by 30% to 60% and peak electricity demand by 65% to 70%.
The maintenance requirements of desiccant systems can be modest compared to conventional cooling-based dehumidification systems. Filters located in the inlet of process air and reactivation air need to be cleaned or replaced every two months. About 90% of reported problems related to desiccant systems can be traced to clogged filters. The wheel can be vacuumed to remove dust from the wheel face. The drive belt around the heat wheel needs to be tight enough to turn the wheel without putting excessive load on the drive motor shaft bearings. No regular maintenance is required for the desiccant materials.
Measurement of airflow, temperature and moisture must be done for both the dehumidified air and the reactivation air during commissioning to confirm that a desiccant system is operating as designed.
The Sanders Research and Education building at the Medical College of Georgia in Augusta contains 250,000 ft² of classroom and laboratory space. The original conventional cooling system was equipped with 1200 tons of chiller capacity for cooling and dehumidification in summer and gas-fired steam boilers to provide heating in winter and reheat for humidity control. While the space temperature can be maintained between 70°F to 75°F, the relative humidity swings as high as 70% and as low as 40% as the weather changes. A desiccant system was installed to improve control humidity between 45% and 55%. The system saves 45% of the annual operation cost, about $200,000, compared with a conventional system.
Air Technology Systems, www.air-tech.com
Bry-Air, www.bryair.com
DehuTech AB, www.dehutech.com
Costs
Cost Effectiveness
Operations and Maintenance
Commissioning
Case Study
Products
7-28
HAWAII COMMERCIAL BUILDING GUIDELINES FOR ENERGY EFFICIENCY DEHUMIDIFICATION
Dri-Eaz Products, www.dri-eaz.com
DryKor, www.drykor.com
Engelhard/ICC, www.engelhardicc.com
Fresh Air Solutions, www.freshairsolutions.com
Humidity Control Systems Ltd, www.humiditycontrol.co.uk
Kathabar Systems Division, Sommerset Technologies, www.kathabar.com
Munters Corp., www.muntersamerica.com
NovelAire Technologies, www.novelaire.com
Octagon Air System, www.octagonair.com
Seasons-4, www.seasons4.net
SEMCO, www.semcoinc.com
American Gas Cooling Center (AGCC), Applications Engineering Manual for Desiccant Systems, www.agcc.org
ASHRAE Handbooks, www.ashrae.org
ESource, Technology Atlas Series – Space Cooling, www.esource.com
Federal Energy Management Program (FEMP), www.eren.doe.gov/femp
Gas Research Institute (GRI), www.gri.org
National Renewable Energy Laboratory (NREL), http://www.nrel.gov
Related Standards:
ANSI/ASHRAE Standard 84–1991, Method of Testing Air-to-Air Heat Exchangers
ARI Standard 1060–2000, Rating Air-to-Air Energy Recovery Ventilation Equipment
ARI Standard 940–1998, Desiccant Dehumidification Components
Resources
8-1
HAWAII COMMERCIAL BUILDING GUIDELINES FOR ENERGY EFFICIENCY HVAC AND WATER HEATING
8. HVAC AND WATER HEATING
Sizing AC Systems...........................................................................................8-1 Efficient Air Distribution System .....................................................................8-14 Efficient Chilled Water Distribution .................................................................8-22 Single-zone DX AC System ...........................................................................8-29 Heat Pump Water Heating and Heat Recovery .............................................8-34 Energy Management System.........................................................................8-38 Ultraviolet Light Germicidal Irradiation ...........................................................8-43 Kitchen Exhaust Makeup................................................................................8-49 Demand-controlled Ventilation .......................................................................8-55
Sizing AC Systems
Air conditioning systems are intended to provide adequate cooling comfort, dehumidification, and ventilation to occupied spaces at a reasonable cost. AC sizing, together with zoning and system layout, is an important aspect of AC design. AC sizing is a complex issue that needs to be approached systematically. Appropriate size depends on many factors, including climate, building configuration, space usage, system zoning and layout.
AC sizing includes sizing of primary systems and secondary systems. Depending on the system type and configuration, primary systems may include chillers, cooling towers and pumps for central systems, or direct-expansion (DX) equipment for packaged systems. Secondary systems may include fans, coils, filters, silencers, dampers, valves, air duct, diffusers and pumps.
Appropriate sizing of AC components is critical to the design of energy-efficient AC systems. Correctly sized systems cost less to install, operate and maintain. Undersized systems will not meet a space's temperature, humidity or indoor air quality requirements. Oversized systems cost more to install, need more space, operate less efficiently in part-load conditions, often provide poorer dehumidification performance, and shorten equipment life because of frequent on/off cycles.
Early in the design phase, when zone layout is unknown, rough AC sizing can be based on rules of thumb. In the detailed design phase, accurate calculations of cooling loads at zone, system and plant levels should be done once zoning and
Overview
8-2
HAWAII COMMERCIAL BUILDING GUIDELINES FOR ENERGY EFFICIENCY HVAC AND WATER HEATING
system layout are determined. Correct sizing is based on accurate load calculation and reasonable design margin considerations, which require professional knowledge and experience in the air-conditioning field.
Like there are code compliance requirements for the building envelope, AC component ratings, and whole building energy performance, there are also code requirements for AC sizing. Both the Hawaii energy codes and ASHRAE Standard 90.1 include load calculation and sizing guidelines. However, surveys and experience have revealed that most AC systems are oversized. In most cases oversizing is not a good design practice. It is much more effective to pursue a lean design that correctly sizes individual components and makes them work together for maximum energy performance — not only at design conditions but also at off-design conditions.
There are many factors that lead to oversizing of air conditioning systems and components. This section addresses those factors, describes the impacts of oversizing, and provides some solutions to minimizing the negative impact of oversizing. There are a number of factors that lead to selection of systems that are larger than necessary.
Unrealistically high internal heat gain assumptions. Actual lighting power and plug loads are often lower than assumed in load calculations.
Unnecessarily restrictive design parameters such as high occupant densities, outside air of 20 cfm/person, indoor thermostat of 72°F for cooling
Limited options for component size (selecting “next size up”)
Use of excessive safety margins in load calculations
Increasing use of software design packages without competent knowledge of the calculations and margins they use
Security against system breakdown and maintenance
Allowance for actual capacity to be lower than nominal capacity due to anticipated lack of commissioning or to improper operation
Designer’s liability concerns
Allowance for future changes in building operation that might increase cooling loads.
Oversizing
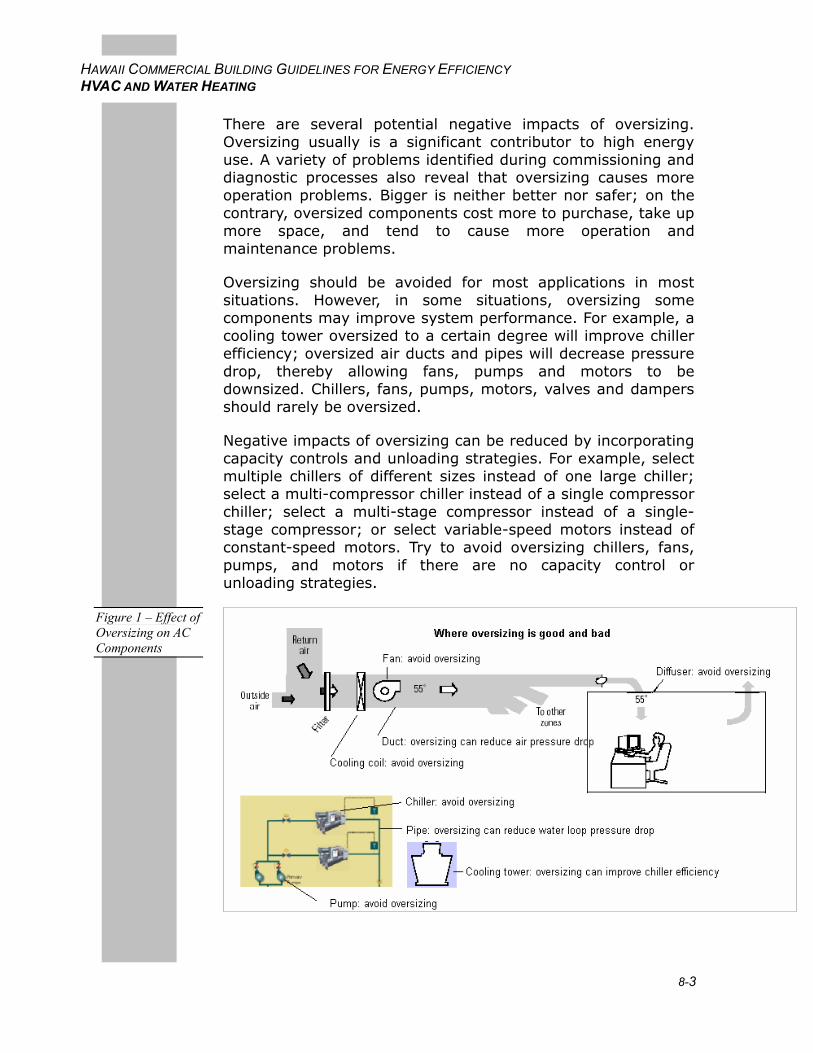
8-3
HAWAII COMMERCIAL BUILDING GUIDELINES FOR ENERGY EFFICIENCY HVAC AND WATER HEATING
There are several potential negative impacts of oversizing. Oversizing usually is a significant contributor to high energy use. A variety of problems identified during commissioning and diagnostic processes also reveal that oversizing causes more operation problems. Bigger is neither better nor safer; on the contrary, oversized components cost more to purchase, take up more space, and tend to cause more operation and maintenance problems.
Oversizing should be avoided for most applications in most situations. However, in some situations, oversizing some components may improve system performance. For example, a cooling tower oversized to a certain degree will improve chiller efficiency; oversized air ducts and pipes will decrease pressure drop, thereby allowing fans, pumps and motors to be downsized. Chillers, fans, pumps, motors, valves and dampers should rarely be oversized.
Negative impacts of oversizing can be reduced by incorporating capacity controls and unloading strategies. For example, select multiple chillers of different sizes instead of one large chiller; select a multi-compressor chiller instead of a single compressor chiller; select a multi-stage compressor instead of a single-stage compressor; or select variable-speed motors instead of constant-speed motors. Try to avoid oversizing chillers, fans, pumps, and motors if there are no capacity control or unloading strategies.
Figure 1 – Effect of Oversizing on AC Components
8-4
HAWAII COMMERCIAL BUILDING GUIDELINES FOR ENERGY EFFICIENCY HVAC AND WATER HEATING
There are a variety of uncertainties involved in load calculation, building occupancy and use. Optimal sizing should be a tradeoff among cost, performance and safety. Legal design risks related to AC sizing need to be addressed in the design intent and clearly conveyed to building owners and tenants. For example, oversized cooling systems can lead to poor humidity control and result in higher liabilities. Also, design engineers should be encouraged to avoid oversizing where it has negative impacts. Education and communication in the AC design community are crucial for resolving the problem of oversizing.
Good AC sizing requires detailed and accurate cooling load calculations. Computer programs are usually employed in load calculation and sizing because these procedures are usually too difficult and tedious for hand calculation. The cooling load calculation is usually done for a summer design day. The calculated results provide no more than the peak load and a 24-hour profile. While design cooling load is adequate to determine the total cooling capacity of AC equipment, optimal selection of AC equipment may need an annual cooling load profile, which can help decide the number and size of chillers that should be selected to achieve the most energy-efficient operation.
The variables affecting load calculations are numerous and involve a variety of uncertainties; a load estimate is no better than the assumptions that went into it, including physical makeup of the various envelope surfaces, conditions of occupancy and use, and outside weather conditions. Even with the availability of computer programs for load calculations, the practitioner's experience is extremely important. The load estimating process requires proper engineering judgment, including a thorough understanding of heat balance fundamentals.
Cooling load calculation involves three steps:
1. Determine the zone cooling load. This consists of external loads through the building envelope and internal loads from people, lights, appliances, infiltration loads, moisture loads, and other heat sources.
2. Calculate the system cooling load. This step adapts the selected air distribution system to the zone load and involves the introduction of the required outdoor air volume into the air conditioning system for ventilation.
Load Calculations
8-5
HAWAII COMMERCIAL BUILDING GUIDELINES FOR ENERGY EFFICIENCY HVAC AND WATER HEATING
3. Calculate the plant load which has to meet the maximum coincident system cooling load and compensate for pipe losses.
Zone Loads
Zone loads address the cooling energy required to maintain the design indoor conditions. To calculate a space cooling load, the design indoor and outdoor conditions, detailed building design information, and individual load components need to be collected and evaluated.
Design conditions. Design outdoor conditions are tabulated in the ASHRAE Fundamentals Handbook (2001). In Hawaii, for applications that don't require humidity control, use the ASHRAE 0.4% design dry-bulb with mean coincident wet-bulb temperatures. However, for dehumidification applications, which might be considered the majority of Hawaii applications, the peak load for a space that requires both large quantities of outside air and close control of moisture may occur at peak wet-bulb or peak dew-point conditions when the corresponding dry-bulb temperature is significantly lower than normal design conditions. For sizing cooling towers and evaporative cooling systems, use the design wet-bulb temperature. For sizing desiccant cooling systems, use the design dew-point conditions.
Design indoor conditions should comply with the latest version of ASHRAE Standard 55.
Conditions for human occupancy. For thermal comfort and indoor air quality, the design indoor relative humidity should be between 40% to 60%, and the temperature should be between 72°F to 78°F. It is important to note that when the relative humidity is at the lower end of the range that people will usually feel comfortable at higher temperatures.
Internal loads. Internal loads include sensible loads from lights, equipment and occupants, and latent loads mostly from occupants. Use up-to-date values for lighting and equipment power, since lighting and equipment efficiency have improved significantly in recent years. Double check any values posted a decade ago or even several years ago before using them.
For densely occupied buildings, adjust occupant loads by occupant activity level; latent loads should be correctly estimated. Diversity factors should be used while calculating internal loads because it is very unlikely that all lights are on,
8-6
HAWAII COMMERCIAL BUILDING GUIDELINES FOR ENERGY EFFICIENCY HVAC AND WATER HEATING
all equipment is on or all occupants are present at the same time. Reasonable values of lighting and equipment can be found in the Hawaii energy codes and in ASHRAE Standard 90.1: Energy Efficient Design of New Buildings Except Low-Rise Residential Buildings.
Envelope loads. Calculate heat transmission through walls, windows, roofs, floors and slabs together with solar gains through fenestration. In the load calculations, account for external shading effects of walls, roofs and windows from trees and adjacent buildings. At this point, also consider any envelope improvements that might reduce loads. See the Whole Building Design chapter for discussion of load reduction strategies.
Infiltration load. Estimate infiltration load according to the tightness of the building structure and the pressurization requirement of the spaces. Infiltration may contribute to a significant amount of moisture load in Hawaii's commercial buildings. Infiltration exists even in spaces with positive pressure, such as in supermarkets where wind pressure easily overcomes the building pressurization.
Calculation methods and accuracy. Detailed and accurate cooling load calculation procedures are published in the ASHRAE Fundamentals Handbook and are updated every four years. The 2001 edition describes a heat balance method, and its simplified and derived variant, the radiant time series method. The transfer function method is still being used in many commercial load calculation programs. Earlier methods like total equivalent temperature differential method with time averaging, and cooling load temperature differential method with solar cooling load factors were developed mainly for manual calculations in the days when computer use was limited. Avoid these load calculation methods today. The heat balance method is recommended for accurate peak load calculation.
A realistic cooling load calculation provides values for acceptable system performance. Variation in the heat transmission coefficients of typical building materials and composite assemblies, the differing motivations and skills of those who construct the building, and the manner in which the building is actually operated are some of the variables that make a precise calculation impossible. Even if the designer uses reasonable procedures to account for these factors, the
8-7
HAWAII COMMERCIAL BUILDING GUIDELINES FOR ENERGY EFFICIENCY HVAC AND WATER HEATING
calculation can never be more than a good estimate of the actual cooling load.
System Loads
The proper design and sizing of central AC systems require more than calculating the cooling load in the space to be conditioned. A zoned system needs to provide no greater total cooling load capacity than the largest hourly summary of simultaneous zone loads throughout a design day; however, it must handle the peak cooling load for each zone at its individual peak hour.
When estimating the load of a system serving a group of spaces, the assembled zones must be analyzed to consider: 1) diversity of zone loads due to different zone orientation and occupancy; 2) ventilation loads; and 3) miscellaneous heat gain from fan heat, duct heat, duct leakage and other unique circumstances. Correct zoning will prevent system loads from varying widely.
Adequate system design and component sizing require that system performance be analyzed as a series of psychrometric processes. The conventional assumption of a fixed relative humidity for the cooling coil leaving-air condition can give the wrong value for the system cooling load. To meet the same amount of zone loads, systems with heat recovery devices may come up with lower cooling loads, especially for applications with a high volume of outside air that indicates a higher dehumidification load.
Plant Loads
For central air conditioning systems, the cooling plant needs to provide no greater total cooling load capacity than the largest hourly sum of simultaneous cooling coil loads throughout a design day; however, it must handle the peak cooling load for each system at its individual peak hour. Plant loads need to meet system loads and compensate for pipe losses. With buildings that involve more than a single AC system, simultaneous loads and any additional diversity must be considered. Design cooling load determines the total cooling capacity of plant. The annual cooling load profile is very useful for sizing and selecting multiple size chillers instead of one single chiller. Equal size chillers are not necessarily the optimum choice.
8-8
HAWAII COMMERCIAL BUILDING GUIDELINES FOR ENERGY EFFICIENCY HVAC AND WATER HEATING
Other Issues
Underground surface heat transfer. For underground spaces, heat transfer through underground surfaces behaves quite differently from heat transfer through above-grade surfaces. Make sure the load calculation procedures address this.
Site elevation. Air flow calculations are normally based on volume. They are assumed to be at a standard condition of 60°F at saturation and 69°F dry air at standard atmospheric pressure. For site locations with much higher or lower elevations than sea level, the deviation of air density due to local atmospheric pressure can be significant. This should be adjusted by a correction factor or by using more accurate engineering equations based on air mass instead of volume.
Safety margins. Because design parameters, load calculation procedures and computer programs may already have some built-in safety margins, use the calculated loads as-is to size and select equipment rather than introducing additional safety margins. Controlling the use of safety margins is a key to avoiding oversizing. Safety margins used in load calculation and sizing should be carefully justified based on individual application requirements and professional experience.
There are a variety of computer programs for load calculation and sizing, but some use very simple methods that may result in a very overestimated or underestimated cooling load. Choose computer programs with procedures compatible with those defined in the 1997 or 2001 editions of the ASHRAE Fundamentals Handbook.
Load calculation programs can be complicated and require hundreds of inputs. The user, of course, has to spend time collecting and preparing these data. Programs that promise a "one-click" answer will probably not provide very accurate results. To get a more accurate load estimation, the user must:
Collect detailed data including building geometry, construction details, fenestration details, internal heat gains, schedules, design outside and inside conditions, etc.
Master the program including the procedures to set up the model; understand assumptions, simplifications, default values, and safety margins used by the program.
Understand how to interpret the calculation results, and how to troubleshoot.
Design Tools
8-9
HAWAII COMMERCIAL BUILDING GUIDELINES FOR ENERGY EFFICIENCY HVAC AND WATER HEATING
Double check calculated results with rules of thumb or compare with results from other programs.
Currently, four programs are widely used in load calculations for commercial buildings: HAP from Carrier, Trace from Trane, CHVAC from Elitesoft and Right-CommLoad from Wrightsoft. Although DOE-2.1E is popular in building energy simulation, it is not commonly employed for load calculation or sizing. EnergyPlus estimates loads more accurately based on the heat balance method. The Hbfort program uses the ASHRAE heat balance method and was released with the book, Cooling and Heating Load Calculation Principles.
An ideal design tool would:
1. Calculate design cooling loads with heat balance method;
2. Calculate annual cooling load profile;
3. Do psychrometric analysis for system load calculation and sizing; and
4. Provide interface to CADD programs for air duct and pipe sizing.
Use rules-of-thumb such as square-foot-per-ton, cfm-per-square-foot, cfm-per-ton, kW-per-cfm and gpm-per-kW for only rough sizing. Accurate sizing should be based on detailed design parameters like temperature, humidity, air flow, water flow and static pressure. Sizing individual component correctly is only one side of the coin; the other is to match the capacity of each component in a system so that they work together efficiently.
Zone Air Flow
Normally, zone air flow is calculated based on design sensible loads and design supply air flow, which may not meet humidity requirements. For dehumidification applications, the design air flow must meet both temperature and humidity requirements. Zone air flow should also maintain air velocity between 10 to 50 fpm in the vicinity of occupants to prevent a draft effect, and should address ventilation and space pressurization needs.
Zone supply air temperature is established to maintain certain comfort conditions. Supply temperature varies with system type. While normal supply air temperature is 55°F,
Component Sizing
8-10
HAWAII COMMERCIAL BUILDING GUIDELINES FOR ENERGY EFFICIENCY HVAC AND WATER HEATING
displacement or underfloor ventilation systems may use higher temperatures of up to 65°F. Cold air distribution systems may use supply temperatures between 40°F to 50°F. In Hawaii, cold air systems have been used successfully at a number of sites.
If the zone air flow is oversized, then the supply air temperature must be reset upward in order to meet sensible load, which may decrease dehumidification. At low load conditions, the zone latent cooling load may dominate the total cooling load, which requires a small amount of cold air or a large amount of warm and dry air to maintain the design zone temperature and humidity level. When determining the zone design air flow and supply temperature, consider the zone cooling and dehumidification needs at both design and off-design conditions.
Cooling Coil
A cooling coil serving one or more conditioned spaces is sized to meet the highest sum of the instantaneous space loads for all the spaces served by the coil, plus any external loads such as fan heat gain, duct heat gain, duct air leakage, and outdoor air ventilation loads (sensible and latent).
At design condition, a cooling coil provides design air flow at design off-coil air temperature and humidity, which are determined to meet each zone’s temperature and humidity requirements. For dehumidification applications, the cooling coil should have adequate latent cooling capacity as well as sensible cooling capacity. The Dehumidification Guidelines provide more detail.
Cooling coil sizing and selection must take into account the design air-side and water-side entering and leaving temperatures, flow rates, and pressure drops. Cooling coil manufacturers usually provides computer programs for coil selection. To improve coil heat transfer performance and reduce air-side pressure drop, select coils with a low face velocity of 250 to 300 fpm instead of 500 to 600 fpm, and low approach temperatures of 5°F to 8°F instead of 10°F to 15°F.
Chiller
Chiller sizing is based on the system's total cooling capacity. The design chilled water flow and the supply and return water temperatures are important criteria for selecting chillers. Try to avoid oversizing chillers (see the Oversizing section above). An oversized chiller not only costs more to purchase, it also leads
8-11
HAWAII COMMERCIAL BUILDING GUIDELINES FOR ENERGY EFFICIENCY HVAC AND WATER HEATING
to substantial energy losses and more chiller wear and tear from excessive cycling. Based on the annual load profile, selecting two or more smaller chillers to meet varying load requirements may be cost effective. Multiple chillers also provide redundancy for routine maintenance and equipment failure. For many typical facilities, sizing one chiller at one-third and another chiller at two-thirds of the peak load enables the system to meet most cooling conditions at relatively high chiller part-load efficiencies. When one single chiller is used, try to select a chiller with effective unloading (VSD, multiple stage compressor, etc.). PG&E's CoolTools Chilled Water Plant Design and Specification Guide describes optimal chiller sizing procedures.1
Cooling Tower
Cooling tower sizing is based on the chiller condenser load and other heat gains from the pipe, pump and other components. The condenser load equals the evaporator load (cooling load) plus the chiller compressor heat. Once cooling capacity is determined, size the cooling tower using the ASHRAE design wet-bulb temperature conditions. Select cooling towers with multiple cells and with VSD fans. An oversized cooling tower will provide cooler condenser water temperature and thus improve chiller efficiency. PG&E's CoolTools Chilled Water Plant Design and Specification Guide describes optimal chiller sizing procedures.
Fan
Size the fan to meet the system design air flow and air loop pressure drop. When selecting the fan, also consider the noise level, type and efficiency. In general, avoid oversizing fans. If a fan has to deal with a wide range of air flows, a variable-speed drive should be installed for the fan motor. See the Advanced VAV System Design Guide2 for more details on fan selection for large HVAC systems.
Pump
Size the pump to meet the design chilled water flow and pressure drop. When selecting the pump, also consider the noise level, type and efficiency. Avoid oversizing pumps. If a
1 Available at www.hvacexchange.com/cooltools.
2 Available at www.newbuildings.org.
8-12
HAWAII COMMERCIAL BUILDING GUIDELINES FOR ENERGY EFFICIENCY HVAC AND WATER HEATING
pump has to deal with a wide range of water flows, a variable-speed drive should be installed for the pump motor.
Duct
Duct sizing is based on air flow rate, pressure drop and noise level. As far as space and cost allows, oversizing air ducts will decrease air velocity and pressure drop and will allow the fan to be downsized. A round duct is better than a rectangular one due to lower pressure loss. The T-Method described in the 2001 edition of ASHRAE's Fundamentals Handbook is used to optimize duct sizes together with fans.
Diffuser
Diffusers are designed to inject high velocity air so as to entrain and mix it with room air. Base diffuser sizing on design air flow and noise level. Avoid oversizing diffusers because during low load conditions, air flow may be low and oversized diffusers may dump cold air.
Pipe
Base pipe sizing on fluid flow rate and pressure drop. As far as space and cost allow, oversized pipes will downsize pumps and save energy, as long as there are no partial flow and cavitation problems.
Noise, erosion, and installation and operating costs all limit the maximum and minimum velocities in piping systems. If piping sizes are too small, noise levels, erosion levels, and pumping costs can be unfavorable; if piping sizes are too large, installation costs are excessive. Therefore, pipe sizes are chosen to optimize initial cost while avoiding the undesirable effects of high velocities. PG&E's CoolTools Chilled Water Plant Design and Specification Guide describes procedures to optimize pipe sizing based on lifecycle cost.3
Many factors affect system load and sizing, including the AC system type, fan energy, fan location, duct loss, vented lighting fixtures, and the type of return air system.
3 Available at www.hvacexchange.com/cooltools.
System Issues
8-13
HAWAII COMMERCIAL BUILDING GUIDELINES FOR ENERGY EFFICIENCY HVAC AND WATER HEATING
Start Up
During the start-up period, AC systems may need to run at full capacity to bring zone conditions to the comfort level. Conventional design practice is to add extra cooling capacity to the design loads. But during the start-up period, the building is not yet occupied, and for most applications, there is no need for outside air ventilation; therefore the AC system runs at 100% return air mode and most probably will meet the cooling requirement without extra capacity.
Intermittent Cooling
Systems running intermittently may need extra cooling capacity to cool down the building in a specified time period. Double check whether this has already been taken care of in the load calculation procedures before adding extra capacity.
Radiant Cooling
Most load calculations assume an all-air system. For radiant cooling systems (which are used frequently in Europe), the heat balance method still applies, but the user must verify that the computer program is capable of dealing with radiant systems and that it takes appropriate input data. Depending on the type and configuration of radiant systems, the design load may vary. The start-up effect must be investigated in more detailed for radiant systems. This usually involves the delay or temperature control of radiant cooling until the relative humidity in the space is below a specified threshold in order to prevent condensation.
Packaged Systems
The rated EER/SEER for packaged units is normally based on the sensible cooling load under design conditions. A higher EER/SEER unit may yield a lower latent cooling capacity. When sizing packaged systems, make sure there is adequate latent cooling capacity. Air flow for packaged systems usually maintains over 400 cfm/ton to prevent coil freezing, which may require a significant amount of reheat for dehumidification applications running in low load conditions. The dehumidification performance of packaged systems can be substantially improved by installing a heat recovery loop such as run-around coils or heat pipes to precool the supply air and post-heat the air leaving the DX coil. Another attractive option is to use heat pumps (i.e. reversing valves) on the return air circuits.
8-14
HAWAII COMMERCIAL BUILDING GUIDELINES FOR ENERGY EFFICIENCY HVAC AND WATER HEATING
ACCA, Manual N: Commercial Load Calculation
ASHRAE, www.ashrae.org.
Fundamentals Handbook, 2001 and 1997
Cooling and Heating Load Calculation Manual
Cooling and Heating Load Calculation Principles
Standard 55: Thermal Environmental Conditions for Human Occupancy
Standard 62: Ventilation for Acceptable Indoor Air Quality
Standard 90.1: Energy Efficient Design of New Buildings Except Low-Rise Residential Buildings
BSRIA, Application Guide AG 1/2000: Enhancing the Performance of Oversized Plant
DOE-2, and EnergyPlus, http://www.eren.doe.gov/buildings/energy_tools/energyplus
Elitesoft, www.elitesoft.com
Electric Power Research Institute, TR102545 Guide to Energy Efficient Office Equipment.
ESource, Technology Atlas: Space Cooling.
New Buildings Institute, Advanced VAV System Design Guide, www.newbuildings.org.
PG&E, CoolTools Chilled Water Plant Design and Specification Guide, www.hvacexchange.com.
Wrightsoft, www.wrightsoft.com
Efficient Air Distribution System
Design the air distribution system to minimize pressure drop and noise by increasing duct size, eliminating duct turns and specifying low-loss duct transitions and plenums. Use the lowest possible fan speed that maintains adequate air flow. Pay special attention to the longest or most restricted duct branch because the fan pressure required for adequate air flow is dictated by the duct run with the greatest pressure loss.
Optimal air distribution system design is fairly complicated. An optimal design balances the need for comfort and low noise
Resources
Recommendation
Description
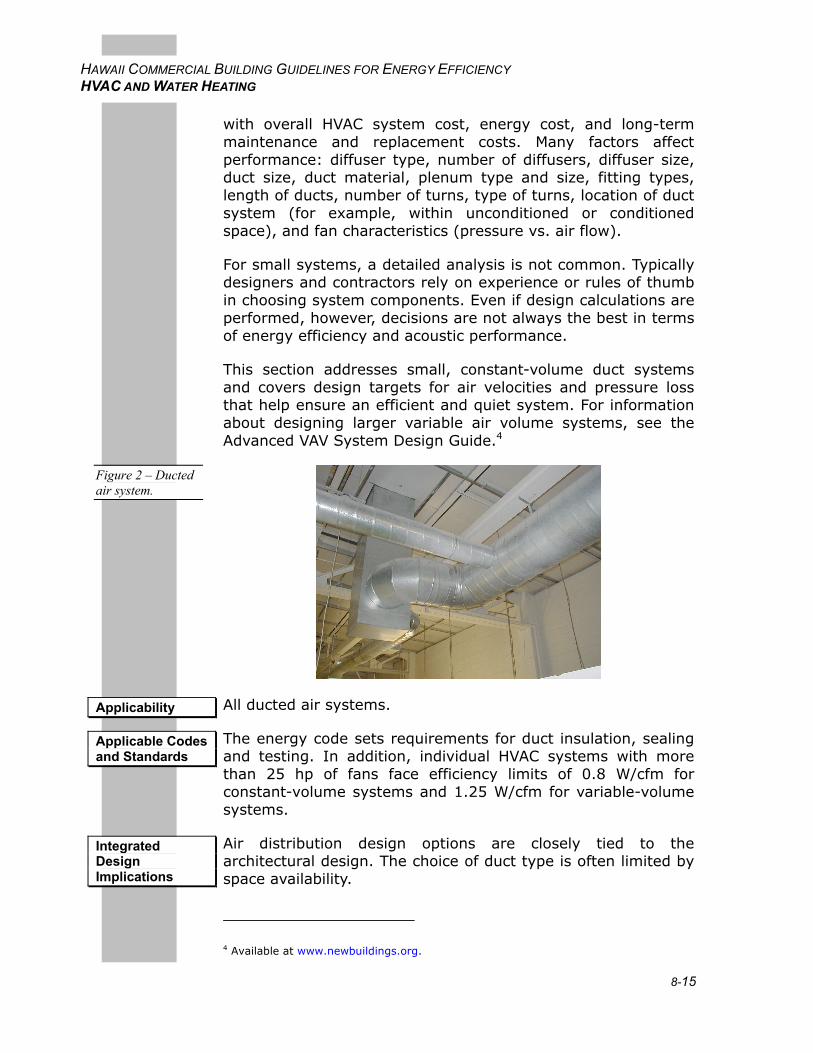
8-15
HAWAII COMMERCIAL BUILDING GUIDELINES FOR ENERGY EFFICIENCY HVAC AND WATER HEATING
with overall HVAC system cost, energy cost, and long-term maintenance and replacement costs. Many factors affect performance: diffuser type, number of diffusers, diffuser size, duct size, duct material, plenum type and size, fitting types, length of ducts, number of turns, type of turns, location of duct system (for example, within unconditioned or conditioned space), and fan characteristics (pressure vs. air flow).
For small systems, a detailed analysis is not common. Typically designers and contractors rely on experience or rules of thumb in choosing system components. Even if design calculations are performed, however, decisions are not always the best in terms of energy efficiency and acoustic performance.
This section addresses small, constant-volume duct systems and covers design targets for air velocities and pressure loss that help ensure an efficient and quiet system. For information about designing larger variable air volume systems, see the Advanced VAV System Design Guide.4
All ducted air systems.
The energy code sets requirements for duct insulation, sealing and testing. In addition, individual HVAC systems with more than 25 hp of fans face efficiency limits of 0.8 W/cfm for constant-volume systems and 1.25 W/cfm for variable-volume systems.
Air distribution design options are closely tied to the architectural design. The choice of duct type is often limited by space availability.
4 Available at www.newbuildings.org.
Figure 2 – Ducted air system.
Applicability
Applicable Codes and Standards
Integrated Design Implications
8-16
HAWAII COMMERCIAL BUILDING GUIDELINES FOR ENERGY EFFICIENCY HVAC AND WATER HEATING
Ducts may be located outside, in unconditioned space, or within the conditioned space. The most efficient option is usually within the conditioned space. More expensive sheet-metal ducts are usually required, but they need not be insulated. If ducts are located in an unconditioned attic, then the roof should be insulated, and/or equipped with a radiant barrier to reduce heat gain to the ducts. Outdoor ducts should not be used unless no other option is feasible.
Consideration of potential condensation is necessary regardless of whether ducts are in conditioned or unconditioned space. For ducts inside conditioned space, the cooling system should be properly sized and controlled to keep the space dry so that condensation does not occur on the cool outer surface of the ducts. For ducts outside conditioned space, careful attention to insulation, duct sealing and vapor barriers can limit condensation.
Coordinate the location of supply air outlets with the lighting design (for outlets located in the ceiling) or with the space plan and furniture (for wall or floor outlets).
Sometimes extra cost for low-loss fittings or larger ducts is necessary to achieve a high performance design. These costs can often be offset by carefully sizing the heating and cooling system to reduce overall system size. In addition, many air distribution improvements — such as proper installation of flex duct — cost little or no extra.
Numerous duct sizing computer programs are commercially available.
A common tool is a “ductilator," a manual device used to calculate pressure loss for different types of ducts.
SMACNA and ASHRAE publish tables listing pressure loss data for a variety of common duct fittings.
These guidelines cover typical small single-zone systems. Additional criteria appropriate for multi-zone air distribution systems are not covered here.
Air Flow
System cooling air flow. Total system air flow should generally fall between 350 and 450 cfm/ton for systems with cooling. If air flow is greater, then condensation might blow off the cooling coil. If air flow is less than 350 cfm/ton, then the
Cost Effectiveness
Design Tools
Design Details
8-17
HAWAII COMMERCIAL BUILDING GUIDELINES FOR ENERGY EFFICIENCY HVAC AND WATER HEATING
cooling capacity and efficiency drop somewhat. However, the capacity loss due to low air flow is worst in dry climates where latent cooling loads are low. Therefore it may be appropriate for systems in Hawaii to operate at the lower end of the airflow range because the air temperature leaving the cooling coil will be lower and more dehumidification occurs.
System heating air flow. For heating-only systems, a good target is 25 cfm per kBtu/h of heating capacity, providing about 105°F supply air. Heating air flow should not be lower than 15 cfm per kBtu/h because supply air temperature will exceed 135°F. If the air flow is low, then supply air will be too warm and air velocity too low, and poor mixing occurs in the room. Excessive air flow during heating creates more noise and can cause uncomfortable drafts. In Hawaii, heating scenarios will be limited.
Air flow adjustment. After system installation, air flow can be adjusted by either changing the fan speed or altering the duct system. To reduce air flow, lower the speed of the fan rather than install dampers. Try to use the lowest fan speed possible because fan energy consumption drops rapidly as fan speed decreases. If possible, specify a variable-speed fan or multiple-speed fan. To increase air flow, try to modify the duct system rather than increasing the fan speed. Possible measures include replacing the most restrictive ducts with larger sizes, improving duct transitions to reduce pressure loss, and eliminating duct turns or constrictions (especially in flex duct).
Air Velocity
Supply diffuser. The velocity of air leaving the supply air diffusers should generally not exceed 700 fpm to minimize noise. Most diffusers also have a minimum velocity needed for proper mixing and to avoid dumping cool air on occupants. Refer to manufacturers’ guidelines for specific types of supply diffusers. When choosing diffusers based on NC (noise criteria) noise rating, remember that manufacturers’ data are usually at ideal conditions (long, straight duct attached to diffuser) and actual noise level is likely to be higher.
Return grille. The return air grille or grilles must be larger than the total supply air diffuser area to avoid excessive noise. Air velocity should not exceed 300 fpm at the inlet.
Duct. Air velocity should not exceed 700 fpm in flex ducts and 900 fpm in sheet metal ducts. Higher flow creates excessive turbulence, noise, and pressure drop. There is usually a
8-18
HAWAII COMMERCIAL BUILDING GUIDELINES FOR ENERGY EFFICIENCY HVAC AND WATER HEATING
practical lower limit to duct air velocity, where the duct becomes too large and expensive.
Cooling coil. Minimize air velocity through the cooling coils to reduce pressure loss. A good target is 300 fpm. However, designers seldom have a choice of coil area in small packaged HVAC units, though it is possible to compare air flow and fan power data from different manufacturers to identify units with lower internal pressure loss.
Duct Type
Flex duct. Flexible ducts are widely used. They offer a number of advantages when properly installed but also have some disadvantages.
Flex ducts are most popular for their low cost and ease of installation. In addition, they attenuate noise much better than sheet metal ducts, offer lower air leakage, are usually pre-insulated, and provide some flexibility for future changes.
On the downside, pressure loss is greater in flex ducts, even when they are perfectly installed. They are also prone to kinking, sagging and compression, problems that further reduce air flow. And since they are flexible, flex ducts are usually installed with more turns than sheet metal ducts. Actual performance of flex ducts in the field is often poor because of these installation problems. As a final disadvantage, flexible ducts are typically warranted for only about 10 years and will need replacement more often than a sheet metal equivalent.
If flex duct is used, there are several important points to consider:
The duct must be large enough for the desired air flow (see Table 1).
The ducts must be properly suspended according to manufacturer guidelines without compression or sagging.
All ducts must be stretched to full length (see note in Table 1).
Keep flexible duct bends as gentle as possible; allow no tight turns.
Fasten all flex ducts securely to rigid sheet metal boots and seal with mastic.
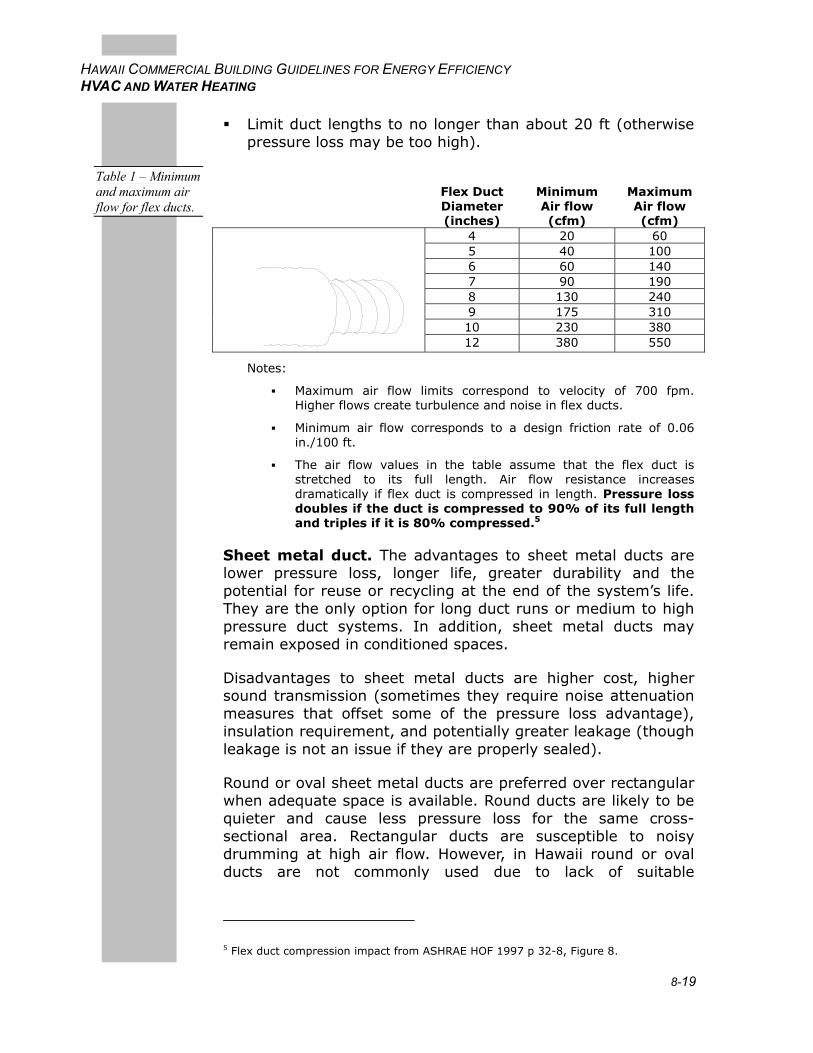
8-19
HAWAII COMMERCIAL BUILDING GUIDELINES FOR ENERGY EFFICIENCY HVAC AND WATER HEATING
Limit duct lengths to no longer than about 20 ft (otherwise pressure loss may be too high).
Flex Duct Diameter (inches)
Minimum Air flow (cfm)
Maximum Air flow (cfm)
4 20 60 5 40 100 6 60 140 7 90 190 8 130 240 9 175 310 10 230 380
12 380 550
Notes:
Maximum air flow limits correspond to velocity of 700 fpm. Higher flows create turbulence and noise in flex ducts.
Minimum air flow corresponds to a design friction rate of 0.06 in./100 ft.
The air flow values in the table assume that the flex duct is stretched to its full length. Air flow resistance increases dramatically if flex duct is compressed in length. Pressure loss doubles if the duct is compressed to 90% of its full length and triples if it is 80% compressed.5
Sheet metal duct. The advantages to sheet metal ducts are lower pressure loss, longer life, greater durability and the potential for reuse or recycling at the end of the system’s life. They are the only option for long duct runs or medium to high pressure duct systems. In addition, sheet metal ducts may remain exposed in conditioned spaces.
Disadvantages to sheet metal ducts are higher cost, higher sound transmission (sometimes they require noise attenuation measures that offset some of the pressure loss advantage), insulation requirement, and potentially greater leakage (though leakage is not an issue if they are properly sealed).
Round or oval sheet metal ducts are preferred over rectangular when adequate space is available. Round ducts are likely to be quieter and cause less pressure loss for the same cross-sectional area. Rectangular ducts are susceptible to noisy drumming at high air flow. However, in Hawaii round or oval ducts are not commonly used due to lack of suitable
5 Flex duct compression impact from ASHRAE HOF 1997 p 32-8, Figure 8.
Table 1 – Minimum and maximum air flow for flex ducts.
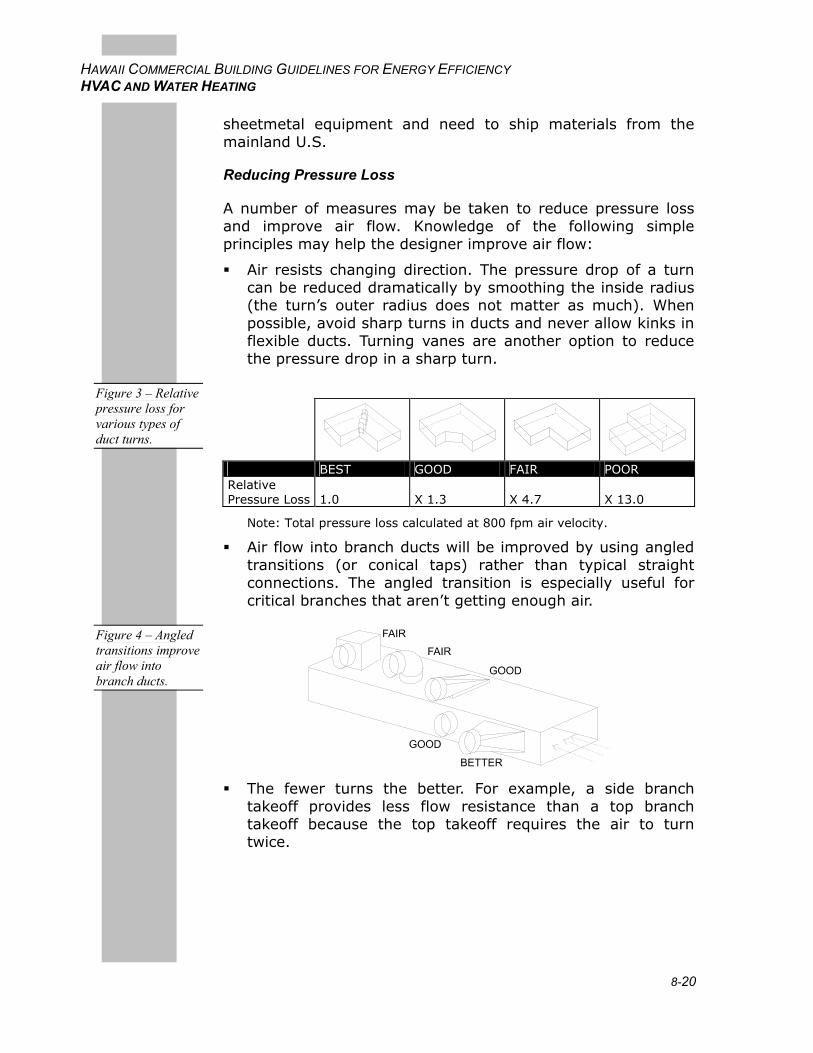
8-20
HAWAII COMMERCIAL BUILDING GUIDELINES FOR ENERGY EFFICIENCY HVAC AND WATER HEATING
sheetmetal equipment and need to ship materials from the mainland U.S.
Reducing Pressure Loss
A number of measures may be taken to reduce pressure loss and improve air flow. Knowledge of the following simple principles may help the designer improve air flow:
Air resists changing direction. The pressure drop of a turn can be reduced dramatically by smoothing the inside radius (the turn’s outer radius does not matter as much). When possible, avoid sharp turns in ducts and never allow kinks in flexible ducts. Turning vanes are another option to reduce the pressure drop in a sharp turn.
BEST GOOD FAIR POOR Relative Pressure Loss
1.0
X 1.3
X 4.7
X 13.0
Note: Total pressure loss calculated at 800 fpm air velocity.
Air flow into branch ducts will be improved by using angled transitions (or conical taps) rather than typical straight connections. The angled transition is especially useful for critical branches that aren’t getting enough air.
The fewer turns the better. For example, a side branch takeoff provides less flow resistance than a top branch takeoff because the top takeoff requires the air to turn twice.
Figure 3 – Relative pressure loss for various types of duct turns.
Figure 4 – Angled transitions improve air flow into branch ducts.
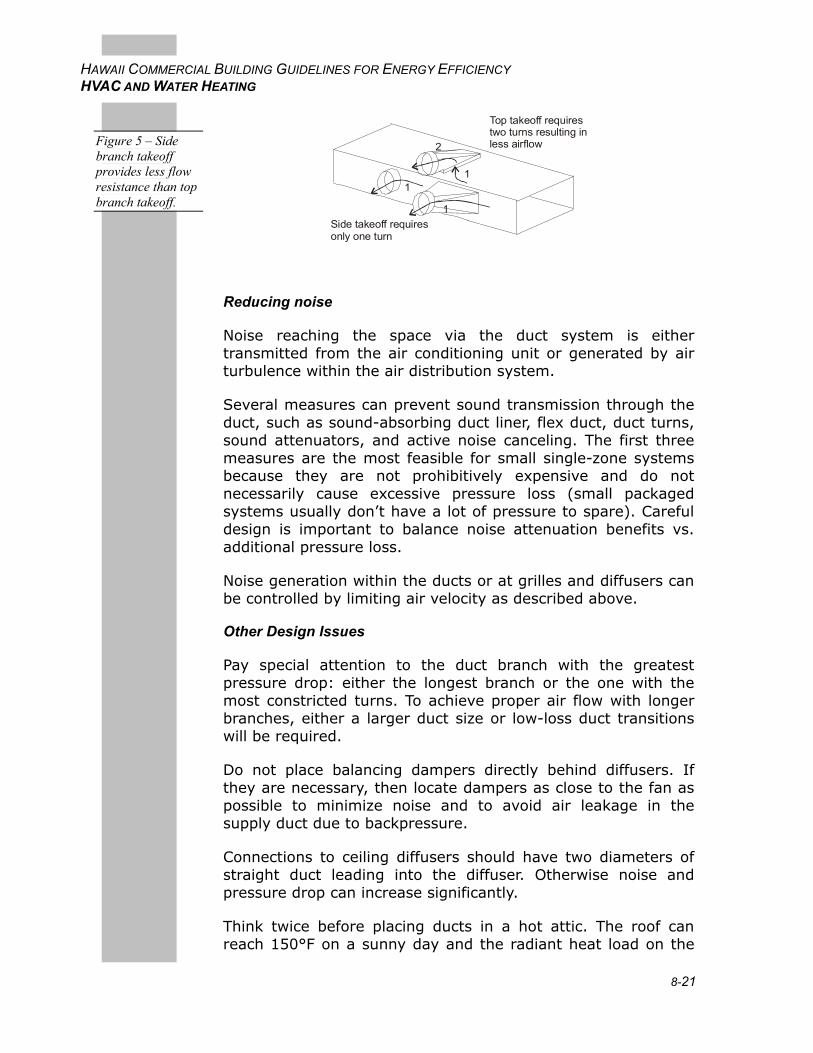
8-21
HAWAII COMMERCIAL BUILDING GUIDELINES FOR ENERGY EFFICIENCY HVAC AND WATER HEATING
1
2
1
1
Top takeoff requirestwo turns resulting in less airflow
Side takeoff requiresonly one turn
Reducing noise
Noise reaching the space via the duct system is either transmitted from the air conditioning unit or generated by air turbulence within the air distribution system.
Several measures can prevent sound transmission through the duct, such as sound-absorbing duct liner, flex duct, duct turns, sound attenuators, and active noise canceling. The first three measures are the most feasible for small single-zone systems because they are not prohibitively expensive and do not necessarily cause excessive pressure loss (small packaged systems usually don’t have a lot of pressure to spare). Careful design is important to balance noise attenuation benefits vs. additional pressure loss.
Noise generation within the ducts or at grilles and diffusers can be controlled by limiting air velocity as described above.
Other Design Issues
Pay special attention to the duct branch with the greatest pressure drop: either the longest branch or the one with the most constricted turns. To achieve proper air flow with longer branches, either a larger duct size or low-loss duct transitions will be required.
Do not place balancing dampers directly behind diffusers. If they are necessary, then locate dampers as close to the fan as possible to minimize noise and to avoid air leakage in the supply duct due to backpressure.
Connections to ceiling diffusers should have two diameters of straight duct leading into the diffuser. Otherwise noise and pressure drop can increase significantly.
Think twice before placing ducts in a hot attic. The roof can reach 150°F on a sunny day and the radiant heat load on the
Figure 5 – Side branch takeoff provides less flow resistance than top branch takeoff.
8-22
HAWAII COMMERCIAL BUILDING GUIDELINES FOR ENERGY EFFICIENCY HVAC AND WATER HEATING
duct is significant. If ducts are above the ceiling, then insulation must be installed on or under the roof or a radiant barrier must be installed under the roof deck.
In many cases, if the pressure loss in the air distribution system can be reduced by as little as 0.15 in. w.c., then fan speed can be reduced and fan power decreases significantly. In the case of a 3-ton rooftop packaged unit, energy savings can be $200 to $300 over a 10-year period. Manufacturer’s data for a typical 3-ton unit shows that the fan can supply 1100 cfm at 0.80 in. w.c. external static pressure if the fan is set to high speed. The fan can provide the same air flow at 0.65 in. w.c. at medium speed. Therefore, if the duct system is carefully designed and installed it may be possible to run at medium speed. The fan power then drops from 590 watts to 445 watts. For typical operating hours and electricity rates, the savings are about $30 per year.
Filters must be replaced regularly to maintain air flow and to prevent filter housings from collapsing and allowing air to bypass the filter.
Measure supply air flow and external static pressure to compare to design values. If air flow is low, take measures to reduce restrictions in duct system rather than increasing fan speed. If airflow is higher than necessary, then reduce fan speed rather than closing down balancing dampers.
Check with the local electric utility to see if custom incentives are available for high efficiency duct systems.
Advanced VAV System Design Guide, New Buildings Institute, www.newbuildings.org.
ASHRAE Fundamentals Handbook (Atlanta, GA: American Society of Heating, Refrigeration and Air Conditioning Engineers, 1997). Web site: www.ashrae.org.
HVAC Systems — Duct Design (Chantilly, VA: Sheet Metal and Air Conditioning Contractors National Association, 1990). Web site: www.smacna.org.
Efficient Chilled Water Distribution
Utilize variable-flow chilled water distribution when a central plant is needed, and consider using a primary-only pumping system for greater energy savings.
Operation and Maintenance Issues
Commissioning
Utility Programs
Resources
Recommendation
8-23
HAWAII COMMERCIAL BUILDING GUIDELINES FOR ENERGY EFFICIENCY HVAC AND WATER HEATING
Chilled water distribution is a big energy end use in Hawaii due to year-round cooling loads. Older chilled water plant designs circulate a constant volume of chilled water through the chillers and the building, no matter if the cooling load is large or small. If loads are small, the constant volume of chilled water is diverted around the cooling coils by three-way valves. As a result, energy consumption is higher than necessary, and variable-flow systems have emerged. The energy savings can be captured cost effectively using modern control systems and variable speed drives.
There are several different strategies to variable flow chilled water system design. One common option is the primary/secondary system, where flow through the chiller is maintained relatively constant while flow through the cooling coils is varied according to demand for cooling. The other option that is somewhat more efficient and becoming increasingly popular is the variable-primary system, where flow through the chiller is also varied.
Regardless of pumping system configuration, chilled water pipe insulation is a critical concern in Hawaii. Due to the moist climate, condensation will form on poorly insulated pipes and can cause damage. Condensation can be minimized when pipes are adequately insulated and insulation is protected with a vapor barrier. When dealing with condensation problems in existing systems, it is important to repair damaged vapor barriers and insulation rather than increase the chilled water temperature setpoint to avoid condensation. If the chilled water temperature is increased, then it is likely that the cooling coils will not provide adequate dehumidification.
Applicable whenever a significant amount of chilled water is required.
The energy code includes several requirements related to chilled water distribution systems. Insulation is required on chilled water pipes. Variable flow systems are required for pumping systems that include control valves that are designed to modulate flow based on load and that have pumps larger than 25 hp. This requirement covers most large chilled water cooling systems and essentially requires the use of two-way valves rather than three-way valves that bypass unneeded chilled water around the cooling coil.
An efficient chilled water distribution system can have a significant impact on a building's total energy consumption.
Description
Applicability
Applicable Codes and Standards
Benefits
8-24
HAWAII COMMERCIAL BUILDING GUIDELINES FOR ENERGY EFFICIENCY HVAC AND WATER HEATING
Choices regarding chilled water distribution are intimately related to the entire chilled water plant.
The possibility of condensation should be considered when routing chilled water pipes. It is best to avoid areas where moisture could cause structural damage or mold growth, especially if access for maintenance is difficult.
This section provides a brief overview of two options for variable-flow chilled water distribution design. For much more detail, see the CoolTools Energy Efficiency Chilled Water Plant Design and Performance Guide.6
Primary-Only Variable Flow Design
Figure 6 shows the piping arrangement for a typical primary-only system, in this case with a single chiller serving multiple cooling coils. Each of the coils has a two-way valve that modulates flow through the coil according to demand. A bypass line with control valve diverts water from the supply into the return piping to maintain a minimum flow through the chiller or chillers. A variable speed drive on the pump is controlled from a remote differential pressure controller or cooling coil valve position.
6 Available at www.hvacexchange.com/cooltools.
Integrated Design Implications
Design Details
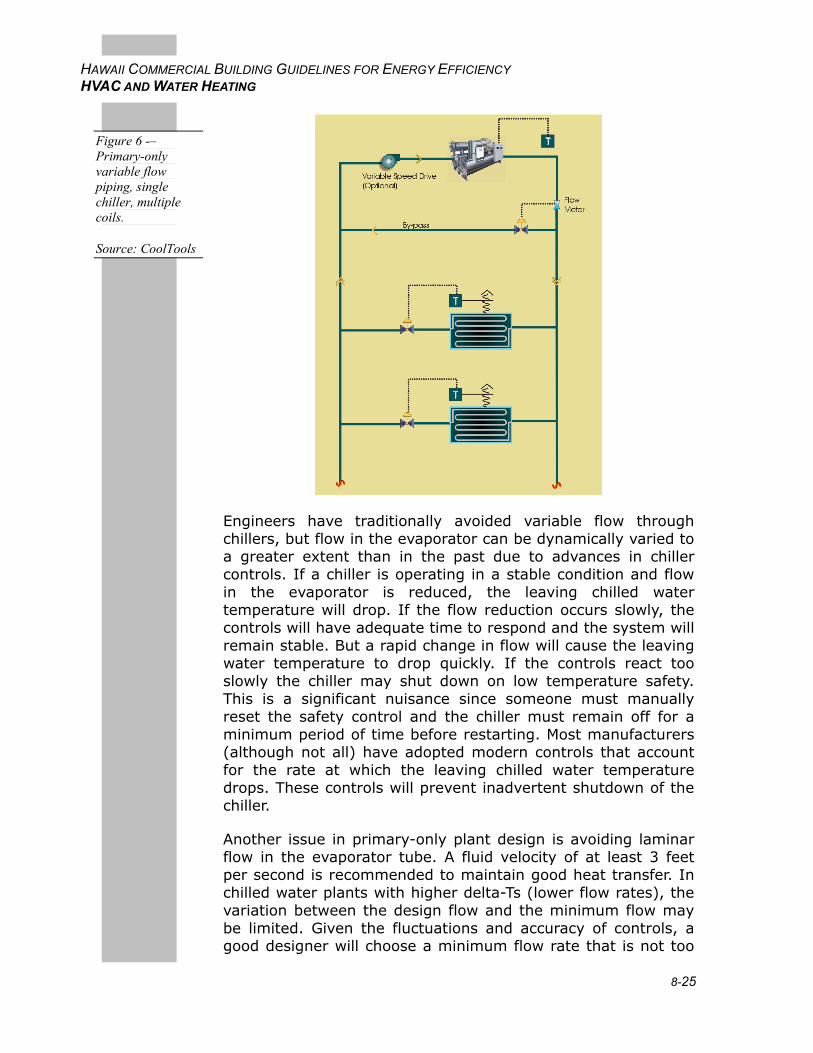
8-25
HAWAII COMMERCIAL BUILDING GUIDELINES FOR ENERGY EFFICIENCY HVAC AND WATER HEATING
Engineers have traditionally avoided variable flow through chillers, but flow in the evaporator can be dynamically varied to a greater extent than in the past due to advances in chiller controls. If a chiller is operating in a stable condition and flow in the evaporator is reduced, the leaving chilled water temperature will drop. If the flow reduction occurs slowly, the controls will have adequate time to respond and the system will remain stable. But a rapid change in flow will cause the leaving water temperature to drop quickly. If the controls react too slowly the chiller may shut down on low temperature safety. This is a significant nuisance since someone must manually reset the safety control and the chiller must remain off for a minimum period of time before restarting. Most manufacturers (although not all) have adopted modern controls that account for the rate at which the leaving chilled water temperature drops. These controls will prevent inadvertent shutdown of the chiller.
Another issue in primary-only plant design is avoiding laminar flow in the evaporator tube. A fluid velocity of at least 3 feet per second is recommended to maintain good heat transfer. In chilled water plants with higher delta-Ts (lower flow rates), the variation between the design flow and the minimum flow may be limited. Given the fluctuations and accuracy of controls, a good designer will choose a minimum flow rate that is not too
Figure 6 -– Primary-only variable flow piping, single chiller, multiple coils.
Source: CoolTools
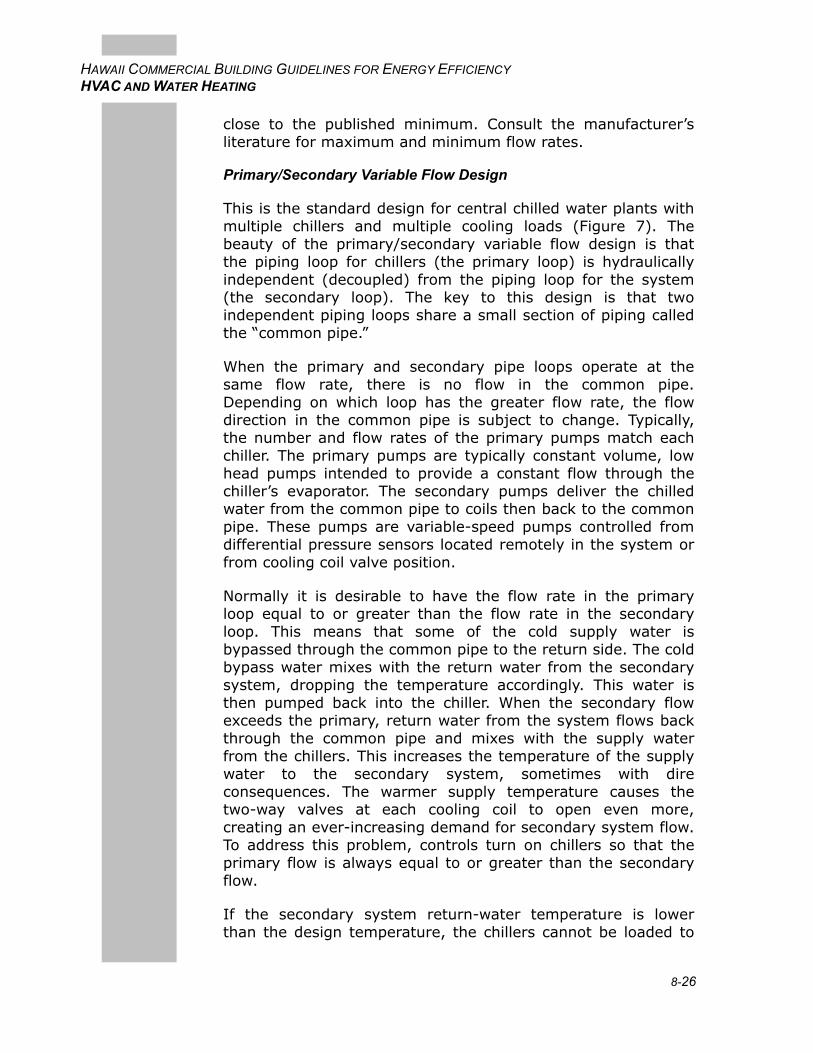
8-26
HAWAII COMMERCIAL BUILDING GUIDELINES FOR ENERGY EFFICIENCY HVAC AND WATER HEATING
close to the published minimum. Consult the manufacturer’s literature for maximum and minimum flow rates.
Primary/Secondary Variable Flow Design
This is the standard design for central chilled water plants with multiple chillers and multiple cooling loads (Figure 7). The beauty of the primary/secondary variable flow design is that the piping loop for chillers (the primary loop) is hydraulically independent (decoupled) from the piping loop for the system (the secondary loop). The key to this design is that two independent piping loops share a small section of piping called the “common pipe.”
When the primary and secondary pipe loops operate at the same flow rate, there is no flow in the common pipe. Depending on which loop has the greater flow rate, the flow direction in the common pipe is subject to change. Typically, the number and flow rates of the primary pumps match each chiller. The primary pumps are typically constant volume, low head pumps intended to provide a constant flow through the chiller’s evaporator. The secondary pumps deliver the chilled water from the common pipe to coils then back to the common pipe. These pumps are variable-speed pumps controlled from differential pressure sensors located remotely in the system or from cooling coil valve position.
Normally it is desirable to have the flow rate in the primary loop equal to or greater than the flow rate in the secondary loop. This means that some of the cold supply water is bypassed through the common pipe to the return side. The cold bypass water mixes with the return water from the secondary system, dropping the temperature accordingly. This water is then pumped back into the chiller. When the secondary flow exceeds the primary, return water from the system flows back through the common pipe and mixes with the supply water from the chillers. This increases the temperature of the supply water to the secondary system, sometimes with dire consequences. The warmer supply temperature causes the two-way valves at each cooling coil to open even more, creating an ever-increasing demand for secondary system flow. To address this problem, controls turn on chillers so that the primary flow is always equal to or greater than the secondary flow.
If the secondary system return-water temperature is lower than the design temperature, the chillers cannot be loaded to
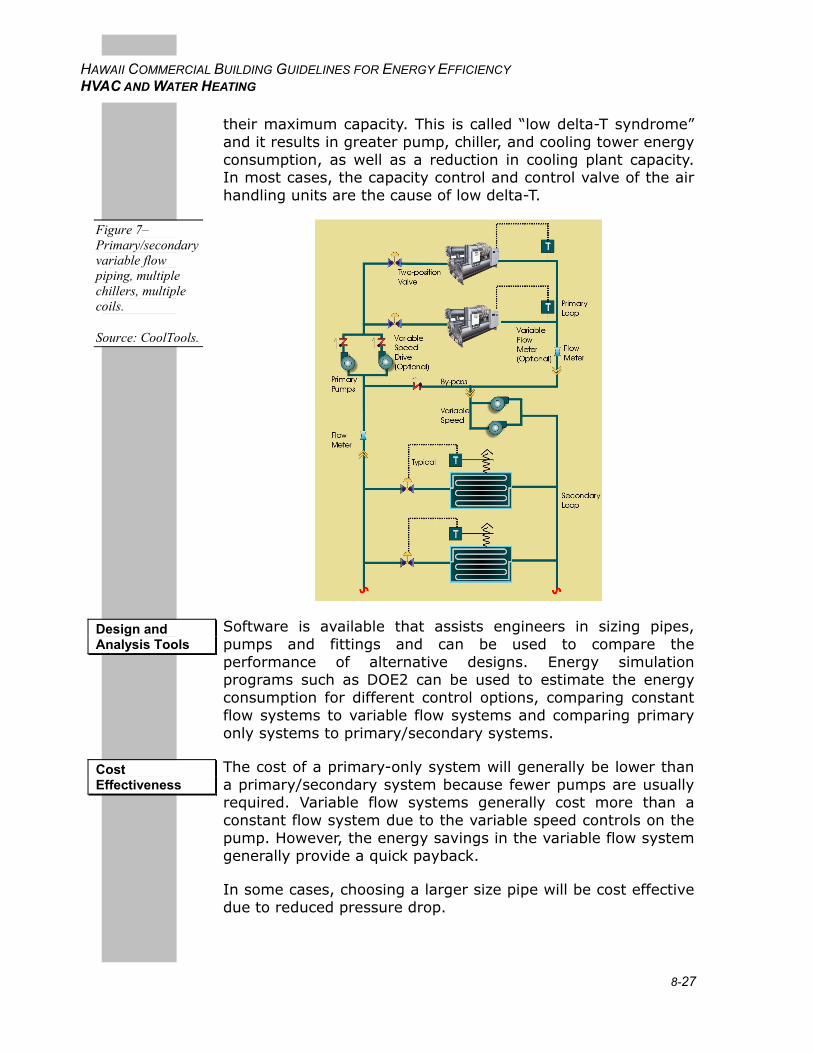
8-27
HAWAII COMMERCIAL BUILDING GUIDELINES FOR ENERGY EFFICIENCY HVAC AND WATER HEATING
their maximum capacity. This is called “low delta-T syndrome” and it results in greater pump, chiller, and cooling tower energy consumption, as well as a reduction in cooling plant capacity. In most cases, the capacity control and control valve of the air handling units are the cause of low delta-T.
Software is available that assists engineers in sizing pipes, pumps and fittings and can be used to compare the performance of alternative designs. Energy simulation programs such as DOE2 can be used to estimate the energy consumption for different control options, comparing constant flow systems to variable flow systems and comparing primary only systems to primary/secondary systems.
The cost of a primary-only system will generally be lower than a primary/secondary system because fewer pumps are usually required. Variable flow systems generally cost more than a constant flow system due to the variable speed controls on the pump. However, the energy savings in the variable flow system generally provide a quick payback.
In some cases, choosing a larger size pipe will be cost effective due to reduced pressure drop.
Figure 7– Primary/secondary variable flow piping, multiple chillers, multiple coils.
Source: CoolTools.
Design and Analysis Tools
Cost Effectiveness
8-28
HAWAII COMMERCIAL BUILDING GUIDELINES FOR ENERGY EFFICIENCY HVAC AND WATER HEATING
Periodic pump maintenance should check vibration, bearing temperature, noise, entrapped air, pressure, current, bearing wear, impeller and casing wear, and signs of cavitation.
The air release valve automatically ejects unwanted air to the atmosphere. Air inside the system contributes to corrosion and unnecessary energy usage. Periodically check for and purge entrapped air. Check for water leaks.
The air and dirt separators extract air from chilled water systems. Dirt inside the systems is trapped and expelled by the use of a blowdown valve to maintain a clean system. The air and dirt separators contribute in keeping the systems operating at peak efficiency and also, prolong the life expectancy of pumps, coils, valves, and piping
Pipe insulation damage is common. Visually inspect for damage. Missing insulation on chilled water pipes can lead to condensation and moisture damage.
Also inspect for leaks.
Commissioning of pumping control systems is critically important. Calibration of flow and temperature sensors is important. In addition, operation must be verified over the full range of operation, from minimum to maximum flow.
The utilities that serve Oahu, Maui, Molokai, Lanai, and the Big Island (HECO, MECO, and HELCO) have a rebate program called the Commercial and Industrial Customized Rebate (CICR) program. Under this program innovative technologies that save energy and demand would qualify for a rebate based on $125/kW of peak demand reduction and $0.05/kWh for a year of energy savings. Rebates are based on engineering estimates of energy and demand savings. In the case of unproven technologies the rebate may be paid over a period of 5 years based on metered savings.
The Kauai Island Utility Cooperative's "Energy Wise Program" offers incentives for Kauai commercial buildings (phone 808-246-8275).
Variable-flow primary-only systems have been installed in several Hawaiian facilities. The DFS Galleria in Waikiki installed two 750-ton variable-flow chillers with primary-only chilled water loop as part of a renovation and expansion. Other examples include the Ala Moana Hotel and the U.S. Postal Service Airport P&DC.
Operations and Maintenance
Commissioning
Utility Programs
Case Study
8-29
HAWAII COMMERCIAL BUILDING GUIDELINES FOR ENERGY EFFICIENCY HVAC AND WATER HEATING
CoolTools Energy Efficiency Chilled Water Plant Design and Performance Guide, Pacific Gas & Electric. www.hvacexchange.com/cooltools.
www.griswoldcontrols.com
www.taco--hvac.com
Single-zone DX AC System
If choosing a single-zone direct-expansion (DX) system, be sure to properly size the system for good dehumidification performance and consider including refrigerant subcooling to increase the latent capacity.
Two possible equipment choices when specifying a single-zone DX system are packaged rooftop and split system. A packaged rooftop system is fully self contained and consists of a supply fan, direct expansion cooling coil, filters, compressors, condenser coils and condenser fans. Units are typically mounted on roof curbs but can be also mounted on structural supports or on grade. Packaged rooftop single-zone units are typically controlled from a single space thermostat with one unit provided for each zone. Supply air and return air ducts connect to the bottom (vertical discharge) or side (horizontal discharge) of the unit.
A ductless split system consists of two matched pieces of equipment: an indoor fan coil unit and an outdoor condenser and compressor unit. The two are connected by refrigerant tubing and control wiring that run through the wall or roof. The indoor unit contains a cooling coil, fan and filter. The outdoor unit includes a compressor or compressors, condenser coil, and condenser fans. In its simplest form, a ductless split system recycles 100% indoor air. However, on many units ventilation air can be supplied with an optional duct attachment that passes through the wall.
Packaged rooftop units are available in capacities from two tons to more than 100 tons and can be used for single zones from 600 ft2 to more than 30,000 ft2.
A ductless split system can serve spaces up to about 1,000 ft2, or perhaps 2,000 ft2 if multiple units are installed. They are most useful for buildings with indoor and/or outdoor space constraints, where rooftop space is unavailable or space for
Resources
Recommendation
Description
Applicability
8-30
HAWAII COMMERCIAL BUILDING GUIDELINES FOR ENERGY EFFICIENCY HVAC AND WATER HEATING
ducts is limited. This system is also applicable for retrofits where ducts do not currently exist.
Due to the constant volume fan, packaged single-zone systems are usually not the best choice when humidity control is important.
Federal regulations require a SEER value of 10.0 for both split and packaged rooftop systems smaller than 65,000 Btu/h.
The Hawaii energy codes set efficiency requirements for packaged air conditioners larger than 65,000 Btu/h. (The latent cooling capacity of AC systems is often sacrificed in order to meet Federal regulations. This is obviously unfortunate for tropical climates such as Hawaii.)
Rooftop units can have a significant visual impact. Consider their location early in the architectural design process to allow for efficient duct layout. In addition, consider the location of ducts and supply registers when making lighting system decisions.
Specify system controls so that they integrate with natural ventilation design. Use automatic interlock controls to shut off the system when windows are opened or allow manual fan shutoff.
Try to place ducts within the conditioned envelope as much as possible to minimize the impact of leakage and conduction losses (which can be very significant). When ducts are located above the ceiling, then insulate under the roof deck rather than on top of a suspended ceiling.
The overall cost for a packaged rooftop system can be as low as $10 per square foot (installed cost, including ductwork and controls).
Cost of the unit alone ranges from about $1,500 for a 2-ton unit to around $2,000 for a 5-ton unit. High efficiency package units (when available) cost about 10% more than standard efficiency models and have paybacks of around 3 to 4 years in warm climates such as Hawaii.
The price for a typical 2-ton split system unit is $4,000 to $5,000.
Packaged rooftop systems are often the lowest cost alternative. However, they are relatively costly to maintain and energy
Applicable Codes and Standards
Integrated Design Implications
Costs
Cost Effectiveness

8-31
HAWAII COMMERCIAL BUILDING GUIDELINES FOR ENERGY EFFICIENCY HVAC AND WATER HEATING
costs are higher than average. Due to the extra cost, a ductless split system will probably be cost effective only where space constraints prohibit the use of ducted system types.
This section lists a number of design considerations.
It is important to look at the psychrometrics of the actual zone loads and to realize that most packaged systems are not designed for the latent loads experienced in the Hawaiian climate. Specify high efficiency units if they provide adequate dehumidification performance.
Look for packaged equipment that is specially designed for humid climates and has a high latent (moisture removing) cooling capacity. Increased dehumidification can be achieved by further subcooling the hot liquid refrigerant leaving the condenser coil. The package consists of a subcooling coil located on the leaving-air side of the evaporator coil. Refrigerant passes through this subcooling coil before it enters the evaporator. Therefore, air passing through the evaporator is cooled to a lower temperature than in a normal system and more moisture is extracted. Then this cool supply air is reheated somewhat when it passes through the subcooling coil. This arrangement greatly enhances the latent capacity of the system.
The incremental equipment cost for packaged rooftop equipment is not too large to increase size from say, two to four tons. Therefore, the temptation is strong to specify the larger unit for safety’s sake. However, there are performance penalties for oversized systems. Bigger is not always better. Do not rely on rules of thumb to select air flow, cooling capacity or heating capacity. See the Sizing AC Systems section for a discussion of load calculations and the impact of cooling capacity oversizing.
In order to avoid excessive cycling, be very careful not to oversize the unit, which reduces humidity control, reduces reliability, and irritates occupants. Manufacturers even recommend choosing a system slightly smaller than peak load for these reasons.
Consider using packaged AC units in a dual-path arrangement as described in the Dehumidification chapter. For example, one unit can be dedicated to cooling outdoor ventilation air and run continuously. Additional units can cool recirculated air as necessary to maintain space temperature at a comfortable setpoint.
Design Details
8-32
HAWAII COMMERCIAL BUILDING GUIDELINES FOR ENERGY EFFICIENCY HVAC AND WATER HEATING
Most packaged systems have several fan speed options that can be selected in the field when the unit is installed. Careful design of the air distribution system can reduce pressure drop and provide significant savings if the fan is wired for low or medium speed
Variable-speed fans are becoming more commonly available and should be considered in order to minimize cycling and reduce noise.
Pay attention to security, noise and ambient temperature when positioning the outdoor unit.
Specify low-noise units.
Demand control ventilation is an option available on many units, employing CO2 measurements manage ventilation loads.
Specify coated fins to maintain efficiencies and extend life of packaged rooftop AC units.
Specify thicker fins with wider spacing when available.
Ultraviolet germicidal irradiation (UVGI) lamps are available as options from some manufacturers. See the section Ultraviolet Germicidal Irradiation for more details.
Water may condense on the indoor cooling coil. Therefore, a condensate pump may be required to remove water from the condensate drain pan to an approved receptacle. Overflow from the drain pan must be routed to a visible location.
For ductless split systems, place the indoor unit on an external wall for ventilation air access and for minimum distance to the outdoor unit. Follow the manufacturer's recommendations for positioning the indoor unit to provide maximum air distribution and to avoid drafts.
The indoor unit of ductless split systems are available in several forms: high wall mount, ceiling mount, and above-ceiling mounting. The high wall mount may be least costly but is usually limited in peak capacity to about two tons. Capacities up to five tons are available with suspended ceiling units. The above-ceiling units typical fit in a 2 ft x 2 ft suspended ceiling system and resemble a typical supply diffuser from below.
Ductless split systems are available that allow two indoor units to be connected to a single outdoor unit.
8-33
HAWAII COMMERCIAL BUILDING GUIDELINES FOR ENERGY EFFICIENCY HVAC AND WATER HEATING
For split systems insulate suction and liquid refrigerant lines separately during installation. Otherwise one heats the other, causing capacity and efficiency loss.
Maintenance requirements for a packaged rooftop system are very similar to other system types. Recommended maintenance tasks include:
Replace filters regularly.
Clean coils regularly (indoor and outdoor). Be careful regarding the type and application of coil cleaners employed to ensure that they will not damage the fins.
Check refrigerant charge.
Clean cooling coil condensate pan and drain.
Lubricate and adjust fan as recommended by manufacturer.
Clean UVGI lamps if installed. Replace lamps if necessary.
Measure total supply air flow with a flow hood or comparable measuring device. Make sure that air flow is within 10% of design value. If air flow is low, then check ducts for constrictions and check that filters and coils are free of obstructions. Larger ducts or shorter duct runs may be necessary. Reduce the number of duct turns to a minimum. If air flow is high, then reduce fan speed if possible according to manufacturer’s instructions.
Verify proper multiple fan speed control operation and thermostat operation.
Hawaiian Electric Company and Maui Electric Company offer rebates for energy efficient packaged and split system air conditioners. The Kauai Island Utility Cooperative's "Energy Wise Program" offers incentives for Kauai commercial buildings (phone 808-246-8275).
Marco’s Southside Grill won a MECO 2001 Energy Project of the Year award, partly for the use of a 5-ton Thermoplus "WaterWise" air conditioner that provides space cooling as well as virtually all of the hot water for the kitchen. The unit recovers waste heat from the air conditioner to provide the facility with hot water.
Carrier's packaged systems with the MoistureMi$er dehumidification package provide increased latent capacity through refrigerant subcooling. www.commercial.carrier.com.
Operation and Maintenance Issues
Commissioning
Utility Programs
Case Study
Products
8-34
HAWAII COMMERCIAL BUILDING GUIDELINES FOR ENERGY EFFICIENCY HVAC AND WATER HEATING
WaterWise by Thermoplus Air Inc. is a packaged air conditioner that recovers condenser heat to preheat hot water for domestic or industrial uses. www.thermoplus.com.
Lennox provides an optional dehumidification system for their packaged systems that uses hot gas reheat for humidity control called Humiditrol. www.lennox.com.
Small Commercial HVAC System Design Guide, New Buildings Institute. www.newbuildings.org.
Heat Pump Water Heating and Heat Recovery
Install heat pump water heating (HPWH) systems in spaces such as restaurant kitchens, commercial and coin-operated laundries, and hotels. Take advantage of the space cooling opportunity provided by the system.
A heat pump water heating (HPWH) system consists of an evaporator, condenser, compressor, expansion valve, hot water circulating pump and controls. Generally, additional water storage capacity is also used to minimize the heat pump size while providing satisfactory water delivery capacity. The system is essentially a refrigeration loop in reverse. Heat is removed from either air or water, and transferred to the water. Transporting the heat from one place to another also provides for a cooling opportunity. This can be used to cool a space, such as a kitchen or elevator machine room, or to enhance chiller efficiency.
Heat recovery for service water heating can be categorized as either heat recovered from condenser water or heat recovered from the refrigerant. Recovery systems that extract heat from the condenser water include simple double-walled (required by health codes) heat exchangers and separate HPWH. Desuperheaters and double-bundle (also known as “side-arm” arrangement) chillers are two examples of systems that recover heat from the refrigerant. A desuperheater is a refrigerant-to-water heat exchanger located between the compressor and condenser. As it name suggests, it extracts heat from the superheated refrigerant vapor. Double-bundle chillers have two possible pathways for extracting heat. One pathway is a conventional cooling tower. The other pathway is heat recovery for space service water heating.
Applicable in all building types requiring a significant amount of service hot water. Both HPWH and heat recovery systems are
Resources
Recommendation
Description
Applicability
8-35
HAWAII COMMERCIAL BUILDING GUIDELINES FOR ENERGY EFFICIENCY HVAC AND WATER HEATING
most applicable in spaces where the hot water demand coincides with a cooling demand. These spaces include restaurant kitchens, commercial and coin-operated laundries, and hotels. Another application is spaces where additional spot cooling is desired but where it would be difficult to run ducting or refrigerant lines.
The Hawaii energy codes require heat recovery in certain buildings that have both space cooling and water heating loads.
Condenser heat recovery from air conditioning or refrigeration equipment is required for any single cooling system larger than 10 tons of cooling capacity or compressor size of greater than 15 hp for buildings with service hot water heaters with more than 75,000 Btu/h or 12 kW input rating, unless the system can be shown to be not cost effective over its anticipated service life
Heat pump water heaters can provide the following benefits:
Able to provide space cooling as well as water heating.
More efficient than electrical resistance water heating by a factor of 3.5 to 4.5.
Can be used to improve chiller efficiency. The combined chiller-heat pump system can reach COPs between 8 and 10.
It is important to integrate the design of heat pump water heaters with the air conditioning system to capture full savings.
The various components of the HPWH system should be placed wisely. The evaporator should be placed in, or near, areas providing significant amounts of waste heat, or needing additional cooling.
Double-bundle, or “side-arm” arrangement, condensers have applications in large heat pumps systems. They have two water tube bundles enclosed in the shell. High-pressure refrigerant gases are released in to the shell. As they condense, heat is released. The cooling tower water is pumped through the "summer-bundle," carrying off any excess heat beyond that needed for domestic hot water.
Hot drain heat pumps use hot drain water as its source. Typical applications include commercial laundries and conveyor dishwashers. The recovered heat preheats fresh water before it goes in the domestic hot water tank — reducing the energy needed to heat it to the required temperature.
Applicable Codes and Standards
Benefits
Integrated Design Implications
8-36
HAWAII COMMERCIAL BUILDING GUIDELINES FOR ENERGY EFFICIENCY HVAC AND WATER HEATING
Depending upon the hot water demand schedule, one application of a HPWH system is to preheat water for a gas or electric unit, especially when water temperature in excess of 140°F is required.
A HPWH system can be integrated with a chiller to enhance the overall efficiency of the system.
HPWHs are most efficient during long run times versus cyclic operation.
Screw compressor heat pumps have been replacing reciprocating compressors in larger sizes. Scroll heat pumps are often used in small HPWHs and multiple scroll compressors are used for sizes that can exceed 20 tons in heating capacity.
The system will run more efficiently (highest COP) if the coldest water from the storage tanks is introduced to the water side of the condenser. This is accomplished through stratification of the storage tanks and other techniques. In a large installation, it is easier to use several smaller tanks piped together rather than one large tank.
Install the unit next to equipment that produces waste heat, such as dryers, boilers or furnaces.
Provide a drainage outlet for condensation in air-cooled heat pumps.
For each kilowatt of electric power input, a typical air-source HPWH with COP of 2.93 operating at normal ambient conditions delivers about 10,000 Btu/h of water heating and 6,600 Btu/h of cooling and dehumidification.
Performance: About 15 gallons of water can be heated per hour through a temperature change of 80°F with a HPWH rated for 10,000 Btu/h heating.
System sizing depends on peak hot water demand, hourly hot water demand, cooling demand, and space available for storage tanks.
Systems generally have two controls: an aquastat and a time clock. The aquastat monitors the storage tank temperature and shuts off the HPWH when the setpoint is reached. The time clock can be used to limit the operation of the system to times when it is needed.
Design Details
8-37
HAWAII COMMERCIAL BUILDING GUIDELINES FOR ENERGY EFFICIENCY HVAC AND WATER HEATING
Service water temperatures of 140°F are attainable with the aforementioned systems, but the system as a whole will run more efficiently if used for preheating and limited to temperatures below 110°F. In Hawaii, R134a heat pumps are commonplace at 140°F while R22 systems are limited to 120°F operation.
HPWH is most efficient during long run times.
Hot water temperature is now recommended to be maintained above 135°F while in distribution and storage systems to avoid the threat of Legionnaires disease.
Software is available from manufacturers such as Colmac (HPAPro) and ETech.
The initial cost of HPWH systems is always higher than that of a conventional water heater. Installed systems cost between $90 to $130 per gallon per hour. Insulated storage tanks cost from $4 to $10 per gallon. Fiberglass-reinforced-plastic (FRP) tanks are well-suited to the Hawaii climate.
Energy economics in Hawaii make HPWH an attractive option. Combine the high price of gas with the inefficiency of electric water heaters and HPWH systems become a very viable option, especially when their cooling ability is taken advantage of. Hawaii leads the nation in the implementation of HPWH systems.
In cases where the cooling opportunity is captured, payback can be as little as one year.
Air source systems require maintenance similar to that for air conditioners. The water side requires standard heat exchanger and hydronic system-type maintenance to ensure pumps are functioning and to avoid a decrease in heat transfer from fouling/scaling.
Heat pump water heating systems should be tested following installation to ensure that they are providing expected performance.
The utilities that serve Oahu, Maui, Molokai, Lanai and the Big Island (HECO, MECO, and HELCO) have a rebate program called the Commercial and Industrial Customized Rebate (CICR) program. Under this program innovative technologies that save energy and demand would qualify for a rebate based on $125/kW of peak demand reduction and $0.05/kWh for a year of energy savings. Rebates are based on engineering
Design and Analysis Tools
Costs
Cost Effectiveness
Operations and Maintenance
Commissioning
Utility Programs
8-38
HAWAII COMMERCIAL BUILDING GUIDELINES FOR ENERGY EFFICIENCY HVAC AND WATER HEATING
estimates of energy and demand savings. In the case of unproven technologies the rebate may be paid over a period of 5 years based on metered savings.
The Kauai Island Utility Cooperative's "Energy Wise Program" offers incentives for Kauai commercial buildings (phone 808-246-8275).
The Coasters Restaurant in Honolulu uses two E-Tech Model 400 Heat pumps and 400 gallon tank.
Honolulu Park Place Spa and Restaurant replaced its electrical resistance water heating with HPWH system. They achieved a simple payback period of 2.8 years on the incremental cost of premium efficiency equipment and saved $1200 per year on their electricity bill.
The largest commercial heat pump water heater in Hawaii was installed at the Sheraton Waikiki hotel in 1994.
The Ala Moana Hotel operated a McQuay Templifier HPWH since 1984, saving over $300,000 per year with a 1.2 year payback. The system was replaced in 2001 with a Carrier screw compressor HPWH.
The Grand Wailea Hotel on Maui uses two York heat pumps.
EPRI Commercial HPWH Applications Handbook, D.W. Abrams and Associates.
EPRI Report on Heat Pump Water Heaters (CU-2020R.1.90)
Hawaiian Electric Company Guide to HPWH For Condominiums and Commercial Facilities.
EPRI Report on Heat Recovery Heat Pumps (BR-020250)
Hawaiian Electric Company Report, “How Do You Define a Heat Pump”.
Contact HECO’s Energy Services Department at (808) 543-4756 to obtain HPWH publications and assistance.
Energy Management System
Use an energy management system (EMS) to integrate multiple components of HVAC equipment and provide detailed
Case Study
Resources
Recommendation
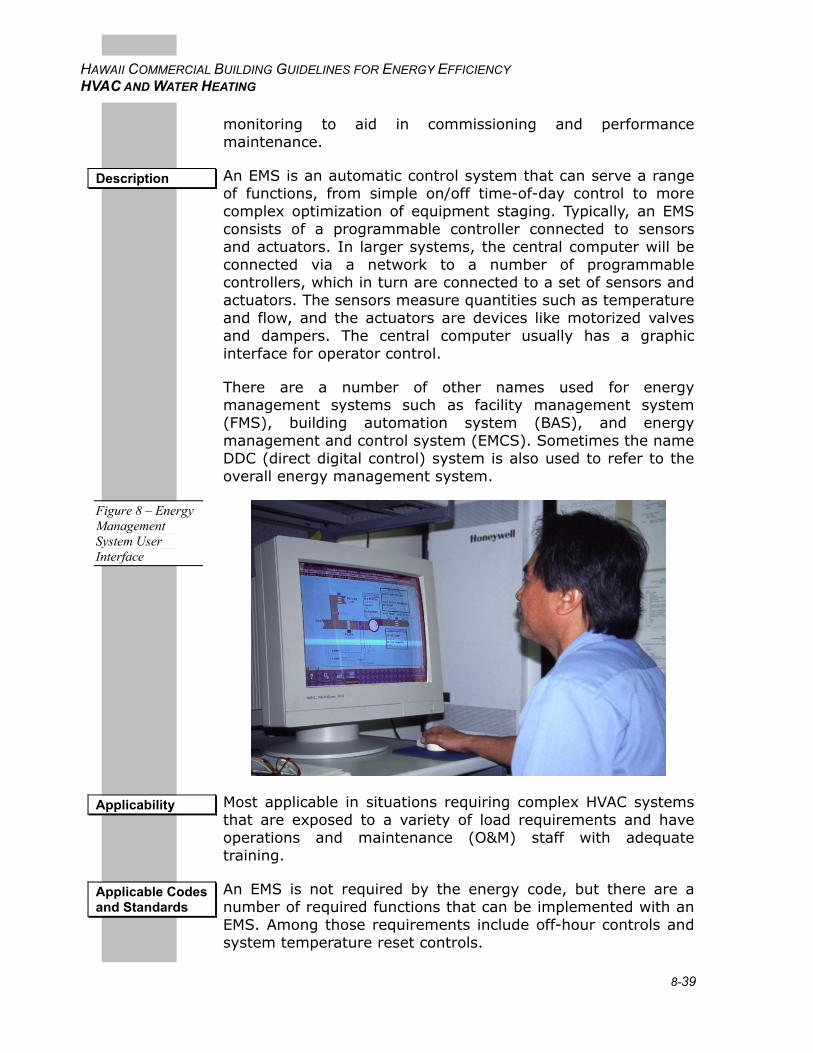
8-39
HAWAII COMMERCIAL BUILDING GUIDELINES FOR ENERGY EFFICIENCY HVAC AND WATER HEATING
monitoring to aid in commissioning and performance maintenance.
An EMS is an automatic control system that can serve a range of functions, from simple on/off time-of-day control to more complex optimization of equipment staging. Typically, an EMS consists of a programmable controller connected to sensors and actuators. In larger systems, the central computer will be connected via a network to a number of programmable controllers, which in turn are connected to a set of sensors and actuators. The sensors measure quantities such as temperature and flow, and the actuators are devices like motorized valves and dampers. The central computer usually has a graphic interface for operator control.
There are a number of other names used for energy management systems such as facility management system (FMS), building automation system (BAS), and energy management and control system (EMCS). Sometimes the name DDC (direct digital control) system is also used to refer to the overall energy management system.
Most applicable in situations requiring complex HVAC systems that are exposed to a variety of load requirements and have operations and maintenance (O&M) staff with adequate training.
An EMS is not required by the energy code, but there are a number of required functions that can be implemented with an EMS. Among those requirements include off-hour controls and system temperature reset controls.
Description
Figure 8 – Energy Management System User Interface
Applicability
Applicable Codes and Standards
8-40
HAWAII COMMERCIAL BUILDING GUIDELINES FOR ENERGY EFFICIENCY HVAC AND WATER HEATING
A properly installed and maintained EMS provides the following benefits:
Significant energy savings due to the ability to monitor and maintain equipment efficiency.
Increased comfort through smaller variations in thermal conditions.
Peak electric demand savings when load management controls are implemented.
Remote monitoring and control can help to reduce the time spent on maintenance calls.
Overall cost is $0.50 to$1.50/ft2 or roughly $300 to $500 per input or output "point." Special O&M training is required to operate, maintain and troubleshoot EMS systems. Periodic recalibration or replacement of sensors is required for precise and proper control. Software upgrades are periodically required and the life expectancy of major system components may be as low as 8 to 10 years due to the rapid pace of development of computer control technologies.
Simple paybacks for EMS systems range from 4 to 15 years based upon energy and maintenance related savings. The system must be programmed carefully, checked out thoroughly, and maintained actively. If O&M personnel are comfortable with the system, it is less likely to be bypassed, and thus sufficient training is always critical. Often the greatest benefit of EMS systems is as a maintenance tool, allowing remote adjustment and troubleshooting of equipment.
Coordination between mechanical and electrical consultants is necessary for supplying power to EMS systems. If the system is to integrate control of lighting and other building systems, significantly greater coordination will be required between the mechanical and controls contractors. These decisions must be made early in the design phase to allow for coordination throughout the design.
Keep controls as simple as possible for a particular function. They will generally be operated (or bypassed) to the lowest level of understanding of any of the O&M personnel responsible for the HVAC system.
Benefits
Costs
Cost Effectiveness
Integrated Design Implications
Design Details
8-41
HAWAII COMMERCIAL BUILDING GUIDELINES FOR ENERGY EFFICIENCY HVAC AND WATER HEATING
Rooftop units are often available with optional factory installed control modules that will interface with the EMS as an independent “node” allowing a high level of monitoring and control. Make sure that these modules interface satisfactorily with the chosen EMS.
Specify a graphics-based user interface where desired; some users prefer a simple text-based interface.
Discharge air temperature sensors are necessary for troubleshooting, even if not required for control.
Specify thermostats with adjustable set point to give occupants control within a reasonable range.
Specify training. Since O&M personnel will “inherit” the system, and its performance will ultimately depend on them, involve them as much as possible in design decisions.
Specify at least a 1-year warranty, including all programming changes.
By specifying the configuration of specific data trend logs (not just the capability to collect them) and submittal of them for review & approval at system completion, some system commissioning may be accomplished by the design engineer and/or other owner’s representatives.
Specify all software necessary for efficient system operation by O&M personnel to be provided as part of the system installation.
For hotels, consider a system that controls guest room conditions and can set back conditions when a room is not occupied.
Local EMS contractors will usually be willing to provide design assistance or even a “complete” design package. Great care should be taken in such collaboration, for it is unlikely that thorough engineering will be applied to the design. The control system should be carefully specified by the design engineer, and details left up to the installing contractor only after careful consideration.
Control algorithms that may be specified to increase energy efficiency include: optimal start time calculation based on learned building behavior; operation of central equipment based on zone demand, including supply air temperature or pressure reset; heating and cooling system lockouts based on current or predicted outside air temperature; or heating and cooling lockout when windows or doors are opened for natural ventilation (using security system sensor switches).
8-42
HAWAII COMMERCIAL BUILDING GUIDELINES FOR ENERGY EFFICIENCY HVAC AND WATER HEATING
Specify submittal of control wiring diagrams as part of the design drawing package.
Control systems manufacturers and their representatives are usually able to assist with the design process. This resource should be used with care; it is important not to overlook the design engineers' responsibility to specify a well-engineered system. Close attention to development of the sequence of operation is always worthwhile. Software to chart sequences of operation in block diagrams or flow charts is available commercially and from control manufacturers.
Energy simulation software can predict savings for many control sequences. Savings can be compared to additional cost to judge if an extra investment is justified. DOE-2 is an example of applicable software.
Calibration of critical points is required annually or semi-annually. Alternation of redundant or lead/lag equipment for even wear may be triggered automatically or manually. Operation and maintenance requires special training, particularly in the case of software; therefore consistency with existing systems may be desirable. Access to make permanent software changes should be carefully limited. Periodic checkout is necessary. A procedure to re-install up-to-date control software including databases must be established.
Careful commissioning is critical for success of EMS installations, and proper control operation is necessary for proper equipment operation. Since EMS software may be somewhat esoteric, lack of commissioning may mean that this important aspect of the contractor’s work may never be inspected and therefore may never be finished to the desired level. Therefore it is a very good idea to provide for some commissioning of the control system by an independent party or organization representing the owner’s interests and/or by the people who will maintain and operate the building systems.
Submittal and review of contractor’s input and output point verification test documentation should be required. Field calibration of any temperature sensors that must be accurate for proper control is necessary (for example, sensors for chilled water systems, boilers, etc.). Factory calibration is adequate only for non-critical sensors, such as room temperatures with adjustable set points.
Design and Analysis Tools
Operations and Maintenance
Commissioning
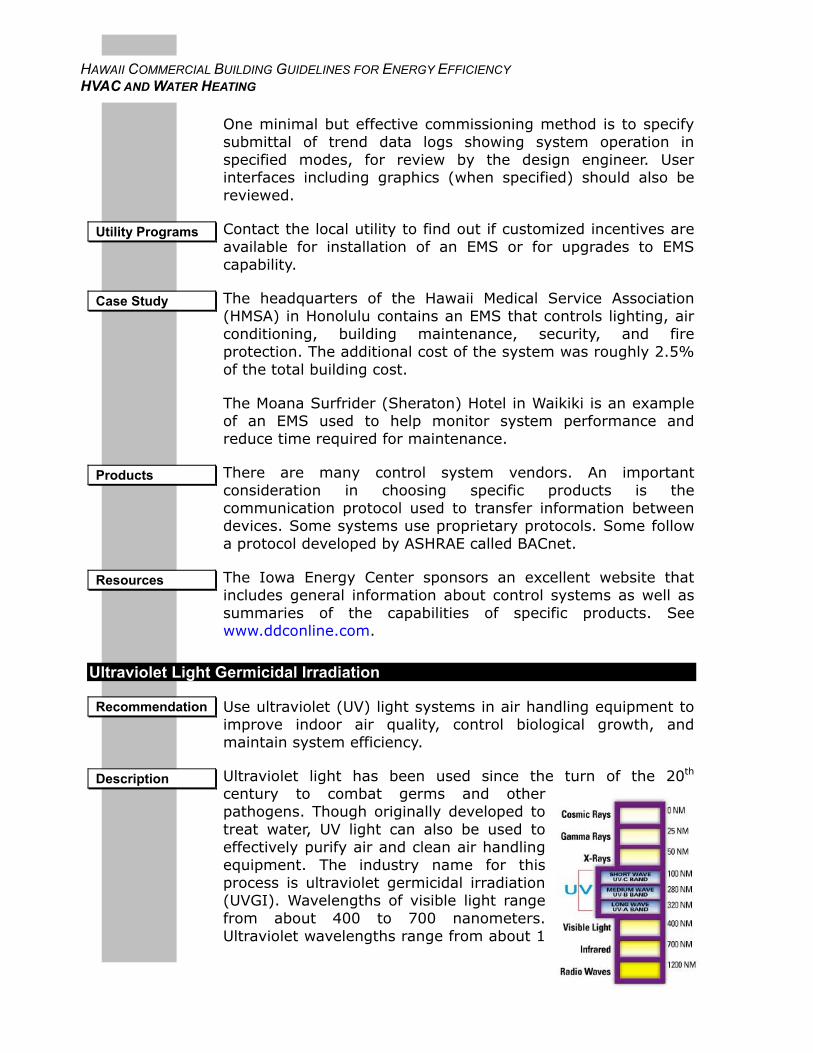
8-43
HAWAII COMMERCIAL BUILDING GUIDELINES FOR ENERGY EFFICIENCY HVAC AND WATER HEATING
One minimal but effective commissioning method is to specify submittal of trend data logs showing system operation in specified modes, for review by the design engineer. User interfaces including graphics (when specified) should also be reviewed.
Contact the local utility to find out if customized incentives are available for installation of an EMS or for upgrades to EMS capability.
The headquarters of the Hawaii Medical Service Association (HMSA) in Honolulu contains an EMS that controls lighting, air conditioning, building maintenance, security, and fire protection. The additional cost of the system was roughly 2.5% of the total building cost.
The Moana Surfrider (Sheraton) Hotel in Waikiki is an example of an EMS used to help monitor system performance and reduce time required for maintenance.
There are many control system vendors. An important consideration in choosing specific products is the communication protocol used to transfer information between devices. Some systems use proprietary protocols. Some follow a protocol developed by ASHRAE called BACnet.
The Iowa Energy Center sponsors an excellent website that includes general information about control systems as well as summaries of the capabilities of specific products. See www.ddconline.com.
Ultraviolet Light Germicidal Irradiation
Use ultraviolet (UV) light systems in air handling equipment to improve indoor air quality, control biological growth, and maintain system efficiency.
Ultraviolet light has been used since the turn of the 20th century to combat germs and other pathogens. Though originally developed to treat water, UV light can also be used to effectively purify air and clean air handling equipment. The industry name for this process is ultraviolet germicidal irradiation (UVGI). Wavelengths of visible light range from about 400 to 700 nanometers. Ultraviolet wavelengths range from about 1
Utility Programs
Case Study
Products
Resources
Recommendation
Description
8-44
HAWAII COMMERCIAL BUILDING GUIDELINES FOR ENERGY EFFICIENCY HVAC AND WATER HEATING
to 400 nanometers and are beyond the range of visible light.
Ultraviolet rays with wavelengths shorter than 300 nanometers are effective in killing bacteria and viruses. The most effective sterilizing range for UV is within the C bandwidth (UVC). This range is called the germicidal bandwidth.
Though unable to penetrate the dead outer layer of skin on humans, UVC light can penetrate germ cells and destroy DNA information. This renders germ and mold cells unable to reproduce.
UVGI systems have been used to control the spread of infectious disease in places such as hospitals and shelters for 50 years. In Hawaii, notable examples include Queen’s Medical Center and Iolani School. UVC has been used in hospitals for decades to sterilize surgical instruments, water, and the air in operating rooms. Many food and drug companies use germicidal lamps to disinfect various types of products and their containers. More recently these systems have been used to avoid "sick building syndrome" by controlling the quantity of bio-aerosols arising from air handling equipment. Aside from the benefits of better indoor air quality and increased human productivity, UVGI systems can also decrease the required cleaning maintenance of air handlers by preventing mold growth and help maintain system efficiency.
Systems designed to control the spread of infectious disease are most applicable in hospitals, clinics, and shelters where controlling the spread of disease is of the utmost importance. Less powerful systems designed to control biological growth and the dispersion of allergens are applicable in any situation where moisture may be present.
ARI Standard 850-93 “Commercial and Industrial Air Filter Equipment.”
Use of UVGI systems can result in the elimination or drastic reduction in cooling coil and pan cleaning maintenance. This provides not only economic benefits but also environmental benefits due to the elimination of toxic chemicals normally employed for this purpose.
Applicability
Applicable Codes and Standards
Benefits
8-45
HAWAII COMMERCIAL BUILDING GUIDELINES FOR ENERGY EFFICIENCY HVAC AND WATER HEATING
Bio-film and slime can reduce coil heat transfer by up to 30%. UVGI systems help to maintain system efficiency by keeping the coils clean, allowing them to perform at original operating conditions. Clean coils offer less obstruction to air flow, and lower pressure loss means that less fan energy is required compared to systems that are only manually cleaned a few times per year.
Keeping the air handling unit mold- and pathogen-free results in a healthier environment for the building occupants. This can result in lower absenteeism and improved productivity.
UVGI systems affect choices regarding air handling equipment. To optimize operation, consider both systems simultaneously. It is important to consider the affects of the UVGI system on pressure drop and cooling load. A UVGI system should not completely take the place of filtration. For healthcare applications, the Center for Disease Control (CDC) recommends that high efficiency particulate air (HEPA) filters be used with the system. A properly configured system will enhance indoor air quality and maintain system efficiency.
The design and effectiveness of UVGI systems depends on several factors. The most important are the intended application (bio-growth or infectious disease control), characteristics of the air flow, and the air handling equipment being treated.
Mold vs. infectious disease. The choice between mold control and infectious disease control will determine the required dosage. The dosage is determined by the radiation intensity and the time of exposure. This is a function of the lamp power, distance from lamps, reflectivity of surrounding surfaces, and characteristics of the air flow.
Integrated Design Implications
Design Details
8-46
HAWAII COMMERCIAL BUILDING GUIDELINES FOR ENERGY EFFICIENCY HVAC AND WATER HEATING
Air flow characteristics. Important air flow characteristics include relative humidity, temperature, velocity, and presence of particulates. Increased RH is believed to decrease decay rates under UV exposure though studies regarding this topic are currently incomplete. Air temperature can affect the power output of the UV lamps if it is outside the range of design values. UVGI lamps are optimized for specific temperature ranges (consult manufacturer). Air velocity should be high enough to ensure complete mixing. The typical UVGI system is designed for a similar air velocity as filter banks, about 400 ft/s. The presence of particulates and dust can decrease the system's effectiveness by providing shelter for pathogens and fouling lamp surfaces.
Air handling equipment. Though UVGI systems can easily be installed into existing air handling systems, their effectiveness and ease of installation is enhanced when the air handling system is designed with them in mind. The use of highly reflective materials can be an economical way of increasing the effectiveness of UVGI systems. Be sure the material reflects UV radiation. Polished aluminum works well for this, but copper does not reflect UV light.
UVGI systems are rarely placed in outside air supply ducts. Spores from the outdoors are more efficiently removed by filtration alone. Since UV-C energy requires a finite amount of time to effect a kill, it’s ideally suited to treat static contaminated surfaces - like the damp cooling coil and condensate pan inside an HVAC unit.
The best location for the lamps is on the downstream side of the coil, evenly spaced across the coil, within 13 to 16 in. of the target surface(s). The downstream location is selected because the downstream side is the wettest portion of the coil and typically the largest portion of the drain pan is on this side of the coil. HVAC units using evaporator coils that are very deep may require lamps installed on both sides of the coil for best effectiveness.
As a general rule, use 24 in. of UVC lamp length for every 4 ft² of coil face area. For infectious disease application, the ratio should be greater.
Be sure to shield any wiring that may be susceptible to UV light with foil tape or metal conduit because UV light degrades rubber, plastic and similar materials.
8-47
HAWAII COMMERCIAL BUILDING GUIDELINES FOR ENERGY EFFICIENCY HVAC AND WATER HEATING
Used lamps are hazardous materials and should be treated as such. Used lamps should be disposed of properly.
Contact UV product suppliers for design guidance.
The cost of UVGI systems depends on the application. In facilities such as hospitals and shelters, where controlling the spread of infectious is the focus, UVGI systems will be more expensive than for mold-control applications. Equipment and installation costs roughly $100/ton for mold control and $200/ton for infectious disease control. Operation and maintenance costs are roughly $40/ton per year including an annual lamp change.
Combining savings from decreased cleaning maintenance and more energy-efficient operation leads to a payback period of one to two years. This does not include the expected external benefits such as increased worker productivity, which are significant. Researchers at Lawrence Berkeley National Laboratory have estimated that companies could save up to $58 billion a year by preventing so called "sick building syndrome" and an additional $200 billion by improving worker productivity through better indoor air quality. A project at Queen’s Medical Center that employed both UVGI and variable air volume control dramatically improved indoor air quality in the area.
These systems are fairly easy to install even in retrofit situations. Sensors can be used to determine when bulbs should be changed.
Bulbs should be cleaned with each filter change. Dust settling on light bulbs can reduce effectiveness.
Properly designed high output lamps last about 9000 hours (just over one year of continuous use).
The “glass” portion of the bulb is heavy wall 100% quartz and should not be touched by unprotected human hands. Handle the bulb with the same caution as a quartz halogen automotive headlamp bulb using clean gloves or other suitable protection.
It is recommended that the UV-C lamps are “ON” at all times and not cycle with the fan or the HVAC system. The most opportune time for growth of fungi and mold is when the air is still (the fan is “OFF”); therefore it is important to irradiate the
Design and Analysis Tools
Costs
Cost Effectiveness
Operations and Maintenance
8-48
HAWAII COMMERCIAL BUILDING GUIDELINES FOR ENERGY EFFICIENCY HVAC AND WATER HEATING
surface at all times. The energy consumed is only 70-75 watts per lamp.
Controls for UVGI systems should be verified. In most cases it is desirable for the lamps to remain on 24 hours per day even if the fan is off.
Since UVGI light systems provide relatively little energy savings, and may increase energy use due to the electricity consumption of the lamps, there may not be utility incentives available.
The Iolani School in Honolulu pioneered the installation of UVGI systems in a project involving the Hawaiian Electric Company (HECO) and Steril-Aire Corporation. The tightly constructed, 32,000-ft2facility uses a high percentage of recirculated air, resulting in indoor air quality concerns. The project involved an initial installation of UVGI lamps in a 16-ton unit and was later extended to four other units. Tests performed on the initial system showed a 98% drop in colony-forming units per millimeter (a mold indicator), and inspection revealed a cooling coil that looked "factory clean." Maintenance cost savings were $8,000 per year for coil and pan cleaning.
The Queens Medical Center in Honolulu has UVGI systems in three facilities. The center is a 530-bed acute care facility located in the heart of the city. UVGI systems were installed in a project involving HECO, the Electric Power Research Institute, Commercial Lighting Design, and Steril-Aire Corporation. A total of 50 lamps were installed in three air handling units sized between 20 and 30 tons. The systems were oversized by 15% to account for high Hawaiian humidity levels. Annual cleaning of the coils and pans has been eliminated. In addition, ceiling and wall-mounted UVGI fixtures were installed to further protect workers in clinic and emergency room areas.
The most common UVGI system places a UVC lamp on the discharge side of the cooling coil, mounted to expose both the coil surface and drain pan to as much light as possible, and positioned a foot from the coil surface.
Another UVGI configuration is the patient-room wall or ceiling-mounted unit. In this application, the UV light source is directed into the room to kill organisms floating in the air. The efficacy varies widely depending on ventilation rate, activity in the room, room bioburden loading, and other factors.
Commissioning
Utility Programs
Case Study
Products
8-49
HAWAII COMMERCIAL BUILDING GUIDELINES FOR ENERGY EFFICIENCY HVAC AND WATER HEATING
Commercial Lighting Design Inc. / Lumalier, www.lumalier.com
Island Controls. Steril-Aire representative.
Island Air Filters. Steril-Aire representative.
Kowalski and Bahnfleth, UVGI Design Basics for Air and Surface Disinfection, HPAC Engineering, January 2000.
Lawrence Berkeley National Laboratory, www.lbnl.gov
Penn State University: http://www.engr.psu.edu/ae/wjk/uvhpac.html
Steril-Aire, www.steril-aire-usa.com
Kitchen Exhaust Makeup
Install kitchen exhaust systems that avoid the conditioning of makeup air. Spot cooling provides the most beneficial cooling for kitchen workers.
Commercial kitchen ventilation systems account for upward of 20% of the total energy consumed in a restaurant. Unfortunately, these systems are generally designed with only indoor air quality in mind. Several measures can be taken to conserve energy while maintaining proper indoor air quality.
Kitchen exhaust makeup refers to air replacing the air exhausted to remove cooking effluents. Common kitchen exhaust systems include wall-mounted canopy hoods, island (single or double) canopy hoods, and proximity (backshelf, pass-over, or eyebrow) hoods. Each hood type has a different capture area and is mounted at a different height relative to the cooking equipment.
Resources
Recommendation
Description
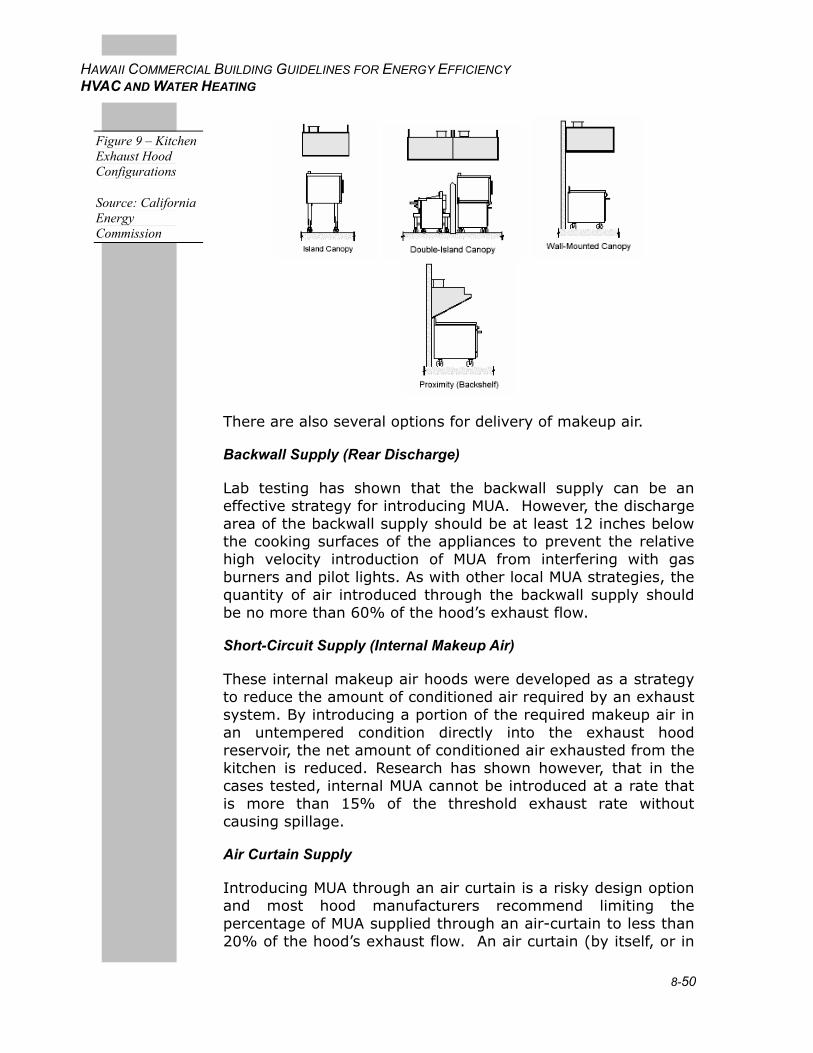
8-50
HAWAII COMMERCIAL BUILDING GUIDELINES FOR ENERGY EFFICIENCY HVAC AND WATER HEATING
There are also several options for delivery of makeup air.
Backwall Supply (Rear Discharge)
Lab testing has shown that the backwall supply can be an effective strategy for introducing MUA. However, the discharge area of the backwall supply should be at least 12 inches below the cooking surfaces of the appliances to prevent the relative high velocity introduction of MUA from interfering with gas burners and pilot lights. As with other local MUA strategies, the quantity of air introduced through the backwall supply should be no more than 60% of the hood’s exhaust flow.
Short-Circuit Supply (Internal Makeup Air)
These internal makeup air hoods were developed as a strategy to reduce the amount of conditioned air required by an exhaust system. By introducing a portion of the required makeup air in an untempered condition directly into the exhaust hood reservoir, the net amount of conditioned air exhausted from the kitchen is reduced. Research has shown however, that in the cases tested, internal MUA cannot be introduced at a rate that is more than 15% of the threshold exhaust rate without causing spillage.
Air Curtain Supply
Introducing MUA through an air curtain is a risky design option and most hood manufacturers recommend limiting the percentage of MUA supplied through an air-curtain to less than 20% of the hood’s exhaust flow. An air curtain (by itself, or in
Figure 9 – Kitchen Exhaust Hood Configurations
Source: California Energy Commission
8-51
HAWAII COMMERCIAL BUILDING GUIDELINES FOR ENERGY EFFICIENCY HVAC AND WATER HEATING
combination with another pathway) is not recommended, unless velocities are kept to a minimum. It is too easy for the as-installed system to oversupply, creating higher discharge velocities that cause cooking effluent to spill into the kitchen.
Front Face Supply
Supplying air through the front face of the hood is a configuration that has been recommended by many hood manufacturers. However, a front face discharge, with louvers or perforated face, can perform poorly if its design does not consider discharge air velocity and direction. Not all face discharge systems share the same design; internal baffling and/or a double layer of perforated plates improve the uniformity of flow. Face discharge velocities should not exceed 150 fpm and should exit the front face in a horizontal direction. Greater distance between the lower capture edge of the hood and the bottom of the face discharge area may decrease the tendency of the MUA supply to interfere with hood capture and containment.
Perforated Perimeter Supply
Perforated supply plenums (with perforated face diffuser) are similar to a front face supply, but the air is directed downward toward the hood capture area. This may be advantageous under some conditions, since the air is directed downward into the hood capture zone. Face discharge velocities should not exceed 150 fpm from any section of the diffuser and the distance to lower edge of the hood should be no less than 18 inches (or the system begins to act like an air curtain). Widening the plenum will lower the discharge velocity for a given flow of MUA and reduce the chance of the supply air affecting exhaust.
Four-Way Ceiling Diffusers
Four-way diffusers located close to kitchen exhaust hoods can have a detrimental affect on hood performance, particularly when the flow through the diffuser approaches its design limit. Air from a diffuser within the vicinity of the hood should not be directed toward the hood. Discharge velocity at the diffuser face should be set at a design value such that the terminal velocity does not exceed 50 fpm at the edge of the hood capture area. It is recommended that only perforated plate ceiling diffusers be used in the vicinity of the hood.
8-52
HAWAII COMMERCIAL BUILDING GUIDELINES FOR ENERGY EFFICIENCY HVAC AND WATER HEATING
Displacement Diffusers
Supplying makeup air through displacement diffusers at a good distance away from the hood is an effective strategy for introducing replacement air. It is analogous to low-velocity “transfer air” from the dining room. However, the diffusers require floor or wall space that is usually a premium in the commercial kitchen. A couple of remote displacement diffusers (built into a corner) could help diversify the introduction of makeup air into the kitchen when transfer air is not viable.
Applicable in all buildings with commercial-style kitchen equipment such as restaurants and school cafeterias.
The Honolulu energy code requires that individual kitchen exhaust hoods larger than 5000 cfm (2500 L/s) be provided with make-up air sized for at least 50% of exhaust air volume that is uncooled or cooled without the use of mechanical cooling.
ASTM Standard 1704-99, 99 Standard Test Method for the Performance of Commercial Kitchen Ventilation Systems. ASTM International. West Conshohocken, PA
UL Standard 710. UL 710, Exhaust Hoods for Commercial Cooking Equipment. Underwriters Laboratories
Proper design of kitchen exhaust makeup can enhance indoor air quality and thermal comfort while also saving energy.
Kitchen hood systems should be installed with the makeup air system integrated with the exhaust hood operation. A portion of the makeup air may come from adjacent dining areas, and in those cases the control of the dining room ventilation system needs to be integrated with the kitchen system.
The strategy used to introduce replacement (makeup) air can significantly impact hood performance and should be a key factor in the design of kitchen ventilation systems. Makeup air introduced close to the hood’s capture zone may create local air velocities and turbulence that result in periodic or sustained failures in thermal plume capture and containment. Furthermore, the more makeup air supplied (expressed as a percentage of the total replacement air requirement), the more dramatic the negative effect.
The following design suggestions come from the California Energy Commission’s Design Guide: Improving Commercial
Applicability
Applicable Codes and Standards
Benefits
Integrated Design Implications
Design Details
8-53
HAWAII COMMERCIAL BUILDING GUIDELINES FOR ENERGY EFFICIENCY HVAC AND WATER HEATING
Kitchen Ventilation System Performance (see Resources ) and can improve the energy efficiency and performance of commercial kitchen ventilation systems:
• Group appliances according to effluent production and associated ventilation requirements. Specify different ventilation rates for hoods or hood sections over the different duty classification of appliances. Where practical, place heavy-duty appliances such as charbroilers in the center of a hood section, rather than at the end.
Use UL Listed proximity type hoods where applicable.
Hood construction details (such as interior angles and flanges along the edge) or high-velocity jets can promote capture and containment at lower exhaust rates.
Install side and/or back panels on canopy hoods to minimize cross drafts and reduce heat gain.
Integrate the kitchen ventilation with the building HVAC system (i.e., use dining room outdoor air as makeup air for the hood).
Maximize transfer air and minimize direct makeup air.
Do not use short-circuit hoods. Use caution with air-curtain designs.
Avoid 4-way or slot ceiling diffusers in the kitchen, especially near hoods.
Diversify makeup air pathways (use combination of backwall supply, perforated perimeter supply, face supply, displacement diffusers, etc.).
Minimize makeup air velocity near the hood; it should be less than 75 fpm.
Consider variable or 2-speed exhaust fan control for operations with high diversity of appliances and/or schedule of use.
Provide air balance requirements to avoid over- or under-supply of makeup air.
Locate vent canopy on a wall to minimize the required air flow. Wall-mounted canopy hoods function effectively with a lower exhaust flow rate than the single-island hoods.
If an island canopy is required, place a partition at the back of a row of cooking equipment or between a double row of equipment to improve efficiency.
8-54
HAWAII COMMERCIAL BUILDING GUIDELINES FOR ENERGY EFFICIENCY HVAC AND WATER HEATING
Locate kitchen exhaust away from the HVAC fresh air intake.
Install spot cooling equipment (or radiant ceiling panels) to provide thermal comfort for the kitchen staff.
There is a public-domain software program described in the following ASHRAE paper that provides engineers with a more sophisticated hour-by-hour simulation of commercial kitchen ventilation systems. The software illustrates the impact of makeup air set point and geographic location on outdoor air load.
Donald Fisher, P.Eng, Ferdinand Schmid and Anthony J. Spata. "Estimating the Energy-Saving Benefit of Reduced-Flow and/or Multi-Speed Commercial Kitchen Ventilation Systems," Publication. CH-99-20-3. Available from ASHRAE: www.ashrae.org.
The Outdoor Airload Calculator (OAC) software quickly estimates the energy use for different commercial kitchen ventilation design and operating strategies. The software is available free at www.archenergy.com/ckv/oac.
A well-designed kitchen exhaust system can reduce both fan energy and conditioned air, and thereby improve the efficiency of the kitchen ventilation system up to 50%. This translates into energy savings of $1,000 - $2,000 per hood per year in any given kitchen. A typical payback ranges from one to three years. The exact savings depend on variables such as hours of operation, cost of energy, size of hood and fans, and nature of cooking load.
Regularly clean filters and oil traps.
Building air balancing and system commissioning should be required as part of the construction requirements.
The utilities that serve Oahu, Maui, Molokai, Lanai and the Big Island (HECO, MECO, and HELCO) have a rebate program called the Commercial and Industrial Customized Rebate (CICR) program. Under this program innovative technologies that save energy and demand would qualify for a rebate based on $125/kW of peak demand reduction and $0.05/kWh for a year of energy savings. Rebates are based on engineering estimates of energy and demand savings. In the case of
Design and Analysis Tools
Cost Effectiveness
Operations and Maintenance
Commissioning
Utility Programs
8-55
HAWAII COMMERCIAL BUILDING GUIDELINES FOR ENERGY EFFICIENCY HVAC AND WATER HEATING
unproven technologies the rebate may be paid over a period of 5 years based on metered savings.
The Kauai Island Utility Cooperative's "Energy Wise Program" offers incentives for Kauai commercial buildings (phone 808-246-8275).
Melink Intelli-Hood Plant, 5508 Fair Lane, Cincinnati, OH 45227 Ph. 513-527-7020, /www.melinkcorp.com.
California Energy Commission, Design Guide: Improving Commercial Kitchen Ventilation System Performance, publication # 500-03-034F. www.energy.ca.gov.
Demand-controlled Ventilation
Specify controls to adjust ventilation rate for spaces with varying occupancy to prevent unnecessary cooling of large quantities of outside air, and ensure that adequate ventilation is provided when needed.
Many spaces — such as auditoriums and theaters — require high ventilation rates due to dense “design” occupancy, but experience this occupancy level only sporadically. The outdoor air required can represent a very large cooling load, especially in subtropical climates such as Hawaii. Therefore substantial amounts of energy and wear on equipment may be saved by reducing the amount of ventilation during those times the space is partly occupied or unoccupied but temperature needs to be maintained. This may be accomplished using occupancy sensors or air quality (CO2 concentration) sensors to control the quantity of ventilation air. This may be done either in conjunction with a EMS system or by independent controls. Many packaged air conditioning systems now offer demand control ventilation (DCV) controls either standard or as an option.
DCV controls have the biggest impact in spaces with intermittent, high-density occupancy such as theaters, cafeterias, and conference rooms. These spaces need to be designed with ventilation adequate to meet the full occupancy rates but don’t need full ventilation during unoccupied periods.
In Hawaii, due to the humidity load caused by outdoor air ventilation, DCV controls can also be used in any spaces that have intermittent occupancy such as offices.
Products
Resources
Recommendation
Description
Applicability
8-56
HAWAII COMMERCIAL BUILDING GUIDELINES FOR ENERGY EFFICIENCY HVAC AND WATER HEATING
DCV controls based on CO2 measurement are usually not applicable for spaces that have high pollution loads that are independent of human occupancy. Examples of these building types include retail stores where off-gassing from products affects air quality or healthcare and laboratory buildings.
Ventilation systems should be designed to meet the requirements of ASHRAE Standard 62.
The benefits of DCV systems include reduced energy consumption, reduced wear on equipment, and confirmed/documented interior air quality
To ensure good air quality when DCV is used, it is important to minimize indoor pollution sources. One source of pollution is emissions from materials such as carpets, ceilings, and furnishes. Cleaning chemicals and procedures also have an impact on indoor air quality.
Demand-controlled ventilation responds to human occupancy only. Other sources of internal pollutants must be addressed with per-area baseline ventilation, targeted ventilation, or other methods. Demand-controlled ventilation should be considered very carefully before being applied, especially for classrooms where various odor sources may occur. Logic dictates that demand-controlled ventilation results in worse interior air quality than a properly adjusted system constantly delivering ventilation for rated occupancy; however, DCV can provide significant energy savings.
CO2 sensor-based ventilation control uses the measured CO2
level as an indicator of the current occupancy level, so the ventilation rate may be adjusted accordingly. This is an important difference from using the CO2 sensor as a direct indication of air quality.
For multiple zone AC systems, the CO2 sensor used for DCV must be located directly in the space. Otherwise, if a single sensor is located in a common return duct, the system will not be able to detect significant differences in CO2 between spaces.
In areas where the outside air CO2 concentration is relatively constant, ventilation may be controlled by a single return air sensor to maintain a fixed CO2 limit. Otherwise, outdoor and return air sensors should be used.
The setpoint must be calculated based on occupancy and activity level. For example, the CO2 concentration for an office
Applicable Codes and Standards
Benefits
Integrated Design Implications
Design Details
8-57
HAWAII COMMERCIAL BUILDING GUIDELINES FOR ENERGY EFFICIENCY HVAC AND WATER HEATING
space designed at 15 cfm per person (sedentary adult) can be calculated at 700 ppm above ambient.
Energy simulation programs such as DOE2 can be used to estimate the impact of reducing ventilation air volume.
Each CO2 sensor costs from $500 to $1,000. Installation, testing and adjustment cost from $500 to $1,500 per system. Annual calibration is necessary and recommended (follow manufacturer recommendations). The cost for a handheld CO2
sensor for calibration is about $500.
Generally, the cost effectiveness for occupancy sensor-based control will be very high for larger systems. For CO2 sensor-based control, it will depend on the climate being “severe” enough, and the required ventilation rate being large enough so that the cooling load reduction saves enough energy costs to offset the first cost of the CO2-sensing equipment. In Hawaii, ventilation cooling loads can easily justify DCV.
Calibration is required. Trend logs of CO2 measurements should be reviewed periodically to ensure that the system is providing adequate ventilation.
Review system operation under varying occupancy. Correlate with balance report data for minimum and maximum outside air damper positions. Verify acceptable levels of CO2
concentration in space when occupied using hand held sensor. Perform all testing in non-economizer mode.
The utilities that serve Oahu, Maui, Molokai, Lanai and the Big Island (HECO, MECO, and HELCO) have a rebate program called the Commercial and Industrial Customized Rebate (CICR) program. Under this program innovative technologies that save energy and demand would qualify for a rebate based on $125/kW of peak demand reduction and $0.05/kWh for a year of energy savings. Rebates are based on engineering estimates of energy and demand savings. In the case of unproven technologies the rebate may be paid over a period of 5 years based on metered savings.
The Kauai Island Utility Cooperative's "Energy Wise Program" offers incentives for Kauai commercial buildings (phone 808-246-8275).
ASHRAE Standard 62
Design and Analysis Tools
Costs
Cost Effectiveness
Operations and Maintenance
Commissioning
Utility Programs
Resources
8-58
HAWAII COMMERCIAL BUILDING GUIDELINES FOR ENERGY EFFICIENCY HVAC AND WATER HEATING
"Interpretation of Ventilation Standard IC-62-1989-27," ASHRAE Journal (April 1997).
Mumma, Stanley, “Is CO2 Demand-Controlled Ventilation the Answer?”, Engineered Systems, May 2002
9-1
HAWAII COMMERCIAL BUILDING GUIDELINES FOR ENERGY EFFICIENCY BUILDING COOLING, HEATING AND POWER GENERATION SYSTEMS
9. BUILDING COOLING, HEATING AND POWER GENERATION SYSTEMS
Recommendation .............................................................................................9-1 Description........................................................................................................9-1 Applicability.......................................................................................................9-2 Regulatory Issues.............................................................................................9-3 Benefits.............................................................................................................9-4 Costs ................................................................................................................9-5 Design Considerations .....................................................................................9-5 Design and Analysis Tools..............................................................................9-10 Operation and Maintenance........................................................................... 9-11 Case Studies .................................................................................................. 9-11 Products .........................................................................................................9-12 Resources ......................................................................................................9-12
Consider an integrated cooling, heating and power generation system for buildings with both significant cooling loads and heating loads. Appropriate heating loads are usually domestic hot water or swimming pools. Building cooling, heating and power (BCHP) systems are most cost effective for facilities operated continuously such as hotels, hospitals or high-rise residential buildings.
The term BCHP covers a range of system types and is sometimes defined as Building Combined Heating and Power and other times as Building Cooling, Heating and Power. The common elements are usually electricity generation and recovery of waste heat from the generation process (also called cogeneration). The “optional” element is space cooling — either using the waste heat to feed absorption cooling equipment or using the electricity to run an electric chiller. A variation on BCHP systems actually has no generator; it uses an engine-driven chiller for cooling and recovers the waste heat from the engine for water heating. BCHP systems include at least two of the following components:
Power Components. Turbines, engines, fuel cells or micro-turbines.
Cooling Components. Engine-driven chillers, electric chillers, and/or absorption chillers.
Heating Components. Domestic water heating, pool heating, desiccant regenerators, and/or reheat for humidity control.
In Hawaii, the waste heat is most often used to produce domestic hot water for hotels, hospitals or high-rise residential buildings. In
Recommendation
Description
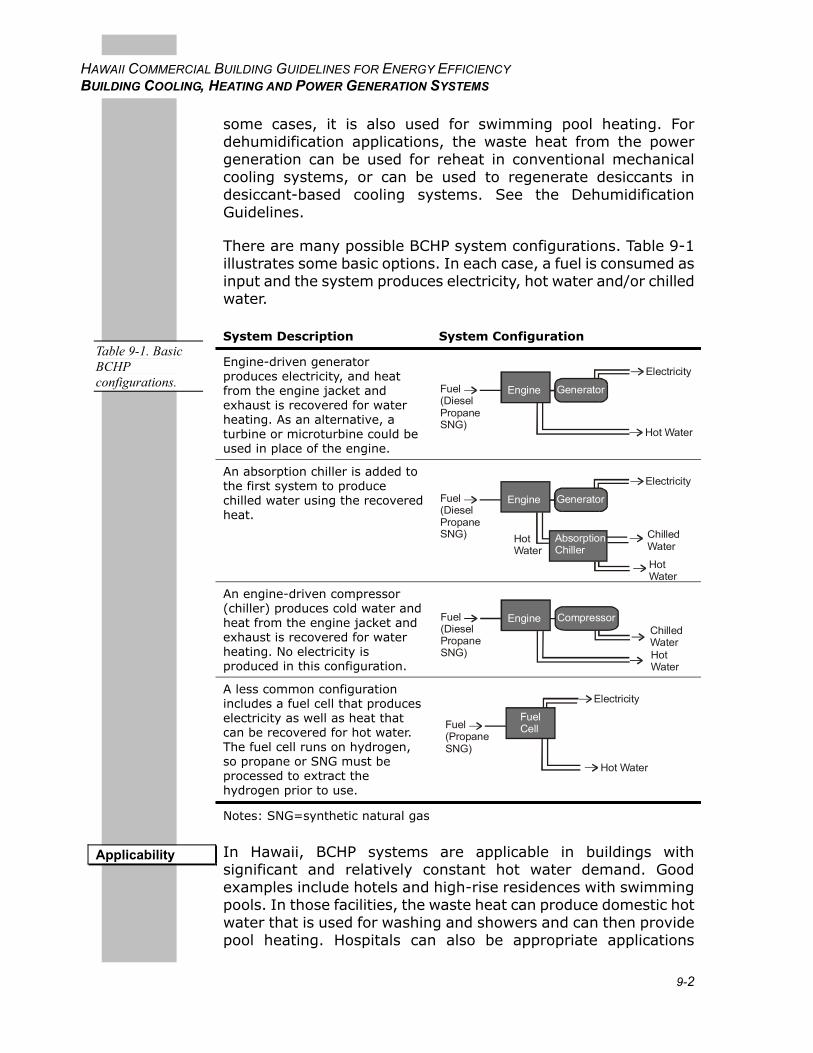
9-2
HAWAII COMMERCIAL BUILDING GUIDELINES FOR ENERGY EFFICIENCY BUILDING COOLING, HEATING AND POWER GENERATION SYSTEMS
some cases, it is also used for swimming pool heating. For dehumidification applications, the waste heat from the power generation can be used for reheat in conventional mechanical cooling systems, or can be used to regenerate desiccants in desiccant-based cooling systems. See the Dehumidification Guidelines.
There are many possible BCHP system configurations. Table 9-1 illustrates some basic options. In each case, a fuel is consumed as input and the system produces electricity, hot water and/or chilled water. System Description System Configuration
Engine-driven generator produces electricity, and heat from the engine jacket and exhaust is recovered for water heating. As an alternative, a turbine or microturbine could be used in place of the engine.
Engine Generator
Electricity
Hot Water
Fuel(DieselPropaneSNG)
An absorption chiller is added to the first system to produce chilled water using the recovered heat.
Engine Generator
Electricity
Hot Water
Hot Water
Fuel(DieselPropaneSNG) Chilled
WaterAbsorptionChiller
An engine-driven compressor (chiller) produces cold water and heat from the engine jacket and exhaust is recovered for water heating. No electricity is produced in this configuration.
Engine Compressor
Hot Water
Fuel(DieselPropaneSNG)
ChilledWater
A less common configuration includes a fuel cell that produces electricity as well as heat that can be recovered for hot water. The fuel cell runs on hydrogen, so propane or SNG must be processed to extract the hydrogen prior to use.
FuelCell
Electricity
Hot Water
Fuel(PropaneSNG)
Notes: SNG=synthetic natural gas
In Hawaii, BCHP systems are applicable in buildings with significant and relatively constant hot water demand. Good examples include hotels and high-rise residences with swimming pools. In those facilities, the waste heat can produce domestic hot water that is used for washing and showers and can then provide pool heating. Hospitals can also be appropriate applications
Table 9-1. Basic BCHP configurations.
Applicability
9-3
HAWAII COMMERCIAL BUILDING GUIDELINES FOR ENERGY EFFICIENCY BUILDING COOLING, HEATING AND POWER GENERATION SYSTEMS
because they may have a relatively large and constant hot water load.
Installation of a BCHP system is most likely to be cost effective in a new construction project or as part of a major renovation. Among existing buildings, good candidates include hotels with aging and inefficient chilled water and hot water plants.
BCHP systems are less likely to be cost effective in general commercial buildings such as offices or stores because they have relatively small heating requirements and may not have 24-hour electricity demand. They are also less cost effective in facilities with widely fluctuating heat demands. In those cases, large storage tanks would be required, which would add cost to the system.
BCHP systems face a number of regulatory issues that should be considered as early as possible in the planning phase.
Hawaii State Department of Health — Clean Air Branch
Hawaii clean air regulations are essentially equal to the U.S. Environmental Protection Agency regulations and are administered by the Clean Air Branch of the Hawaii State Department of Health (telephone 808/586-4200). Fuel-burning equipment such as BCHP units require a permit, but there are a number of specific exemptions:
Equipment with less than 1 MBtu/hr heat input.
Equipment with emissions of less than one ton per year of regulated pollutants.
Equipment with emissions of less than 0.1 ton per year of hazardous pollutants
Other specific exemptions.
Discretionary exemptions from the Clean Air Branch.
The actual requirements for permitted equipment will be project specific but may include a requirement for best available control technology. The Clean Air Branch may perform a modeling assessment of pollutant impact to determine appropriate measures.
For exempt systems it is not necessary to contact the Clean Air Branch for a determination, but it may be a good idea, especially for a system that is close to the emissions limit. Information submitted with a permit application includes equipment specifications, fuel type and location.
Regulatory Issues
9-4
HAWAII COMMERCIAL BUILDING GUIDELINES FOR ENERGY EFFICIENCY BUILDING COOLING, HEATING AND POWER GENERATION SYSTEMS
Local City and County
Permits are required from the local Building Division to cover electrical, mechanical, plumbing and structural work.
Zoning regulations set noise limits that vary depending on location. Residential zones have lower allowances.
Utilities
Utilities set interconnection requirements to maintain power quality on the electricity distribution grid. Due to the potentially high cost of connection equipment, it is critical to discuss requirements with the utility early in the planning process. The U.S. Department of Energy is working on a nationwide standard, IEEE 1547, for interconnection of distributed generation, but each utility company still sets its own requirements.
Some electric utilities also impose standby charges for on-site generation equipment. These charges account for the fact that the utility may have to provide power at short notice if the on-site generator fails. These charges can have a significant impact on project feasibility and should be identified at the beginning of project planning.
Fuel suppliers may offer special rates for cogeneration facilities. It is important to identify the appropriate fuel prices when evaluating project feasibility.
Water
A water permit may be required for an existing facility if the new system will increase water consumption. For example, if an absorption chiller is installed to replace an electric chiller, the heat rejection load will increase and cause higher cooling tower water consumption.
Under the right conditions, BCHP systems reduce air pollutant emissions and increase energy efficiency. BCHP produces both electric or shaft power and usable thermal energy on site or near site, converting as much as 80% of the fuel into usable energy.
BCHP systems reduce energy costs if properly applied and operated.
On-site generation reduces electricity transmission losses.
Engine-driven generators are relatively efficient, converting up to 40% of the fuel energy into electric energy.
Benefits
9-5
HAWAII COMMERCIAL BUILDING GUIDELINES FOR ENERGY EFFICIENCY BUILDING COOLING, HEATING AND POWER GENERATION SYSTEMS
Utilization of waste heat improves overall energy conversion efficiency to as high as 80% or 90% if the heating requirements are well matched to the availability of waste heat.
If appropriate redundancy is provided, BCHP systems can improve electrical grid reliability (by reducing the potential for peak-time blackouts).
BCHP systems can be used as a load management tool to reduce peak demand on the electric utility.
They are easier to site relative to new central power plants that face greater regulatory hurdles.
They form an effective foundation for district energy plants.
BCHP systems may get credits toward Leadership in Energy and Environmental Design (LEED) green building certification from the U.S. Green Building Council.
An engine-driven generator and heat recovery equipment costs roughly $1,000 to $1,500 per kilowatt of electric power capacity. Several factors can lead to significant variability in price:
Interconnection equipment may be costly and is critical to the economics of a BCHP project.
Wiring from the generator to the point of utility connection costs about $1,000 per foot. Therefore, location within the site is an important factor.
In some cases, emission control equipment may be needed and may add extra cost.
Costs in Hawaii are about 40% higher than on the mainland due to higher labor rates.
Chilled water system costs are additional. Absorption chillers cost roughly $700 to $1,000 per ton to install. Electric chiller systems are less expensive, typically in the range of $500 to $700 per ton.
Maintenance costs can be significant for BCHP systems and must be considered in a lifecycle cost analysis. Check with manufacturers for recommended service and replacement intervals.
Check to see if tax credits or utility incentives are available.
Professional Design Assistance
BCHP systems are complex, and it is recommended that mechanical and electrical engineers with extensive BCHP
Costs
Design Considerations
9-6
HAWAII COMMERCIAL BUILDING GUIDELINES FOR ENERGY EFFICIENCY BUILDING COOLING, HEATING AND POWER GENERATION SYSTEMS
experience be selected. It is also critical that contractors and operators have experience with BCHP systems.
Grid-connected vs. Stand-alone Systems
A BCHP system may be connected to the electricity grid, or it may remain independent. A grid-connected system offers the advantage of utility backup in case the BCHP system fails or needs to be shut down for maintenance. In some areas it is possible to sell excess electricity back to the utility (net metering). But grid connection also requires relatively expensive interconnect equipment. And grid-connected systems may be subject to standby charges from the utility. Standby charges account for the fact the utility may be required to take on the facility’s electrical load if the BCHP system shuts down.
A stand-alone BCHP system avoids the cost and complexity of grid connection, but requires equipment redundancy to provide reliable power. Stand-alone systems are most applicable in locations without existing utility service or where adding utility capacity would be too expensive.
Even in a grid-connected system, redundant generators are likely to be necessary to achieve the full demand reduction (and corresponding utility bill savings). In estimating the cost effectiveness of the system, it is important to realize that even a short system shut down, when utility backup is required, can lead to high peak electric demand charges and offset much of the savings.
Emergency and Standby Generation Issues
Some facilities such as hospitals require emergency generators to keep critical equipment running when the electric grid fails. Other buildings have standby generators that provide tenants with power in the case of an electricity outage. Ideally, a BCHP generator would be able to take the place of these emergency and standby generators in order to offset part of the construction cost. However, there are several issues to consider.
The emergency generator must be large enough to meet the load of critical systems, while a BCHP generator should be sized based on the facility’s thermal load. Therefore, it is possible that the emergency generation requirement is larger than the appropriate BCHP capacity.
BCHP equipment is typically more expensive than standby equipment because BCHP units are designed for continuous operation.
9-7
HAWAII COMMERCIAL BUILDING GUIDELINES FOR ENERGY EFFICIENCY BUILDING COOLING, HEATING AND POWER GENERATION SYSTEMS
On-site fuel storage may be required by code for some emergency generator systems, limiting the fuel options and affecting operating cost.
A thorough review of code requirements is recommended before choosing to use a BCHP system for emergency power.
Engine-driven Systems
The most common BCHP system type in Hawaii includes an internal combustion engine-driven generator, running on either diesel or propane fuel. In a typical engine, heat is dumped through the radiator and out the engine exhaust. In a cogeneration engine, heat exchangers are used to capture this heat. They typically produce water at about 200ºF, and are available in a wide range of sizes, from as small as 25 kW up to 5 MW. Issues to consider with engine-driven systems include:
They are relatively efficient, reaching 40% electric generation efficiency.
Engine emissions can be controlled through several means including catalytic converters, spark retard ignition, and water injection.
Propane engines require a special design to account for the variability of the fuel’s heating value. Otherwise they may suffer reliability problems.
Microturbine Systems
Microturbines are newer and less common than engine-driven BCHP systems. These work like a jet engine except that the hot combustion exhaust spins a turbine to produce electricity rather than to propel an aircraft. Heat is recovered from the hot exhaust air after it passes through the turbine. Here are some issues to consider with microturbine systems:
They are available in sizes of 30 kW to 100 kW.
Efficiency is moderate, typically around 30%.
Precooling of inlet air to about 59ºF improves efficiency and reduces emissions.
Maintenance requirements should be lower than engines due to air bearings and fewer moving parts.
Current microturbine systems need to be rebuilt after about 1,500 starts and may not be desirable in applications with intermittent operation.
9-8
HAWAII COMMERCIAL BUILDING GUIDELINES FOR ENERGY EFFICIENCY BUILDING COOLING, HEATING AND POWER GENERATION SYSTEMS
Fuel Cell Systems
Fuel cells use an entirely different means, similar to a battery, to produce electricity. They consist of two electrodes sandwiched around a catalyst and electrolyte. Hydrogen and oxygen are fed to either side of the “sandwich” and the catalyst causes the hydrogen to split into an electron and a proton. The proton passes through the electrolyte and the electron travels through an external wire (providing the fuel cell output). The proton and electron join with the oxygen on the other side to produce water. Hydrogen is typically created from natural gas in a fuel reformer. When a fuel cell is used as part of a BCHP system, waste heat is recovered to meet heating loads.
System Sizing
BCHP system capacity is usually selected based on the facility’s heating requirements. Otherwise, if the heat output is larger than necessary the system must either be throttled back to reduce output or excess heat must be dumped (via a radiator or cooling tower). And when the system is not operating at full capacity, more time is required to recover the installation cost.
In an existing facility, accurate measurements of actual electrical load, heating load and cooling load are necessary. The BCHP system should then be designed to satisfy most or all of the heating load, as long as the resulting generation capacity does not exceed the building’s electric demand. Typically, if a BCHP system also provides cooling, it will only satisfy a portion of the total load and additional cooling equipment will be required.
For new buildings, simulation programs can be used to estimate the expected loads and choose an appropriate system size.
Heat Recovery Applications
Waste heat from BCHP systems may be used for a wide variety of applications. The most common application in Hawaii is domestic water heating for uses such as showers, kitchens and laundries.
To achieve the greatest overall system efficiency, a BCHP system will supply a cascading set of heating loads where each load can be satisfied with a lower water temperature. A swimming pool is a good example of a low-temperature load that can help utilize the maximum amount of waste heat.
Dehumidification is also a potential use for waste heat in facilities where there are special humidity control requirements, such as
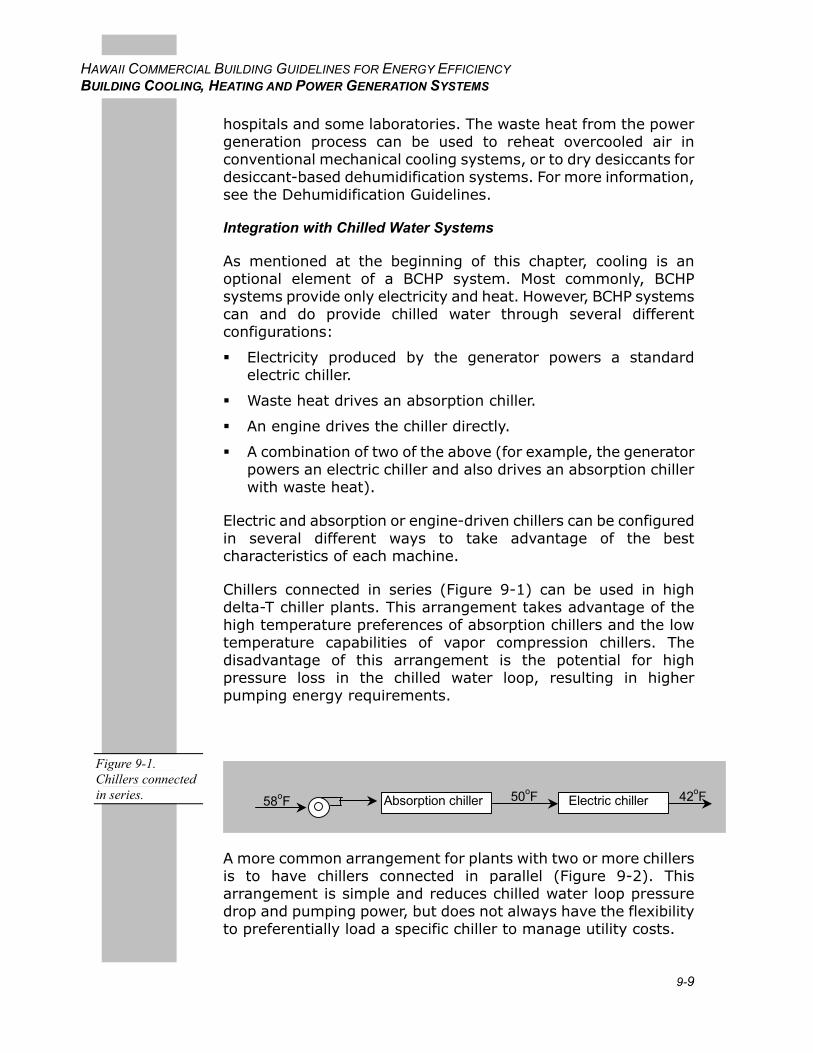
9-9
HAWAII COMMERCIAL BUILDING GUIDELINES FOR ENERGY EFFICIENCY BUILDING COOLING, HEATING AND POWER GENERATION SYSTEMS
hospitals and some laboratories. The waste heat from the power generation process can be used to reheat overcooled air in conventional mechanical cooling systems, or to dry desiccants for desiccant-based dehumidification systems. For more information, see the Dehumidification Guidelines.
Integration with Chilled Water Systems
As mentioned at the beginning of this chapter, cooling is an optional element of a BCHP system. Most commonly, BCHP systems provide only electricity and heat. However, BCHP systems can and do provide chilled water through several different configurations:
Electricity produced by the generator powers a standard electric chiller.
Waste heat drives an absorption chiller.
An engine drives the chiller directly.
A combination of two of the above (for example, the generator powers an electric chiller and also drives an absorption chiller with waste heat).
Electric and absorption or engine-driven chillers can be configured in several different ways to take advantage of the best characteristics of each machine.
Chillers connected in series (Figure 9-1) can be used in high delta-T chiller plants. This arrangement takes advantage of the high temperature preferences of absorption chillers and the low temperature capabilities of vapor compression chillers. The disadvantage of this arrangement is the potential for high pressure loss in the chilled water loop, resulting in higher pumping energy requirements.
A more common arrangement for plants with two or more chillers is to have chillers connected in parallel (Figure 9-2). This arrangement is simple and reduces chilled water loop pressure drop and pumping power, but does not always have the flexibility to preferentially load a specific chiller to manage utility costs.
Figure 9-1. Chillers connected in series. Absorption chiller Electric chiller58oF 50oF 42oF
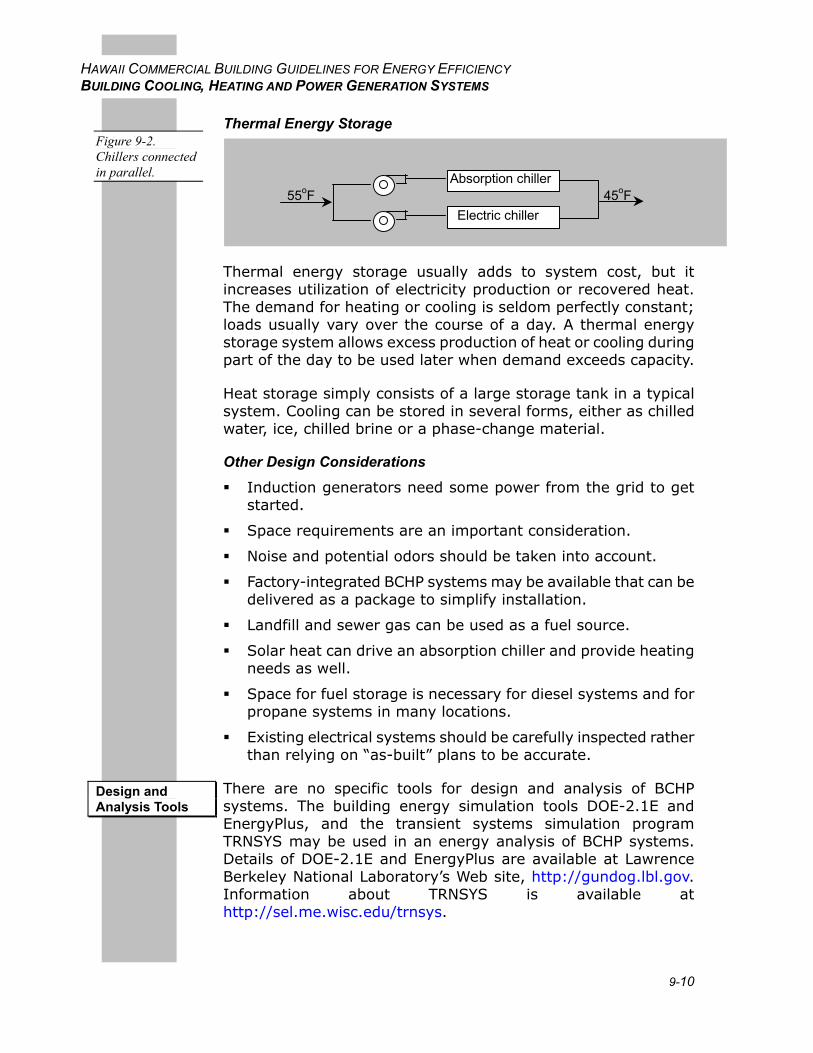
9-10
HAWAII COMMERCIAL BUILDING GUIDELINES FOR ENERGY EFFICIENCY BUILDING COOLING, HEATING AND POWER GENERATION SYSTEMS
Thermal Energy Storage
Thermal energy storage usually adds to system cost, but it increases utilization of electricity production or recovered heat. The demand for heating or cooling is seldom perfectly constant; loads usually vary over the course of a day. A thermal energy storage system allows excess production of heat or cooling during part of the day to be used later when demand exceeds capacity.
Heat storage simply consists of a large storage tank in a typical system. Cooling can be stored in several forms, either as chilled water, ice, chilled brine or a phase-change material.
Other Design Considerations
Induction generators need some power from the grid to get started.
Space requirements are an important consideration.
Noise and potential odors should be taken into account.
Factory-integrated BCHP systems may be available that can be delivered as a package to simplify installation.
Landfill and sewer gas can be used as a fuel source.
Solar heat can drive an absorption chiller and provide heating needs as well.
Space for fuel storage is necessary for diesel systems and for propane systems in many locations.
Existing electrical systems should be carefully inspected rather than relying on “as-built” plans to be accurate.
There are no specific tools for design and analysis of BCHP systems. The building energy simulation tools DOE-2.1E and EnergyPlus, and the transient systems simulation program TRNSYS may be used in an energy analysis of BCHP systems. Details of DOE-2.1E and EnergyPlus are available at Lawrence Berkeley National Laboratory’s Web site, http://gundog.lbl.gov. Information about TRNSYS is available at http://sel.me.wisc.edu/trnsys.
Figure 9-2. Chillers connected in parallel.
Design and Analysis Tools
Absorption chiller
Electric chiller55oF 45oF
9-11
HAWAII COMMERCIAL BUILDING GUIDELINES FOR ENERGY EFFICIENCY BUILDING COOLING, HEATING AND POWER GENERATION SYSTEMS
BCHP systems should be operated as continuously as possible to improve energy efficiency and reduce maintenance costs. Here are some operation and maintenance considerations:
Experienced or trained operators are needed to operate BCHP systems.
BCHP systems typically operate about 90% of the time. Downtime occurs as a result of planned maintenance and unscheduled outages.
Frequent starting and stopping of BCHP system operations increase costs of operation and maintenance significantly.
Maintenance costs for gas engine generators are in the range of $0.0075 to $0.0100 per kWh. Costs for microturbine maintenance are potentially lower, ranging from $0.002 to $0.010 per kWh.1
Wilcox Hospital on Kauai installed five, 400-ton diesel engine-driven chillers (made by Caterpillar) for a total of 2000 tons of cooling capacity. The waste heat is used for domestic water heating. In this case, the BCHP system does not generate electricity, but provides both heating and cooling and offsets the need for electricity.
The Orchid at Mauna Lani Hotel installed four 220-kW synchronous generators (propane engines) and one 240-ton absorption chiller. The waste heat is used for hot water for most guest rooms.
1 Source: Combined Heat and Power: A Federal Manager’s Resource Guide, U.S. Department of Energy, March 2000.
Operation and Maintenance
Case Studies
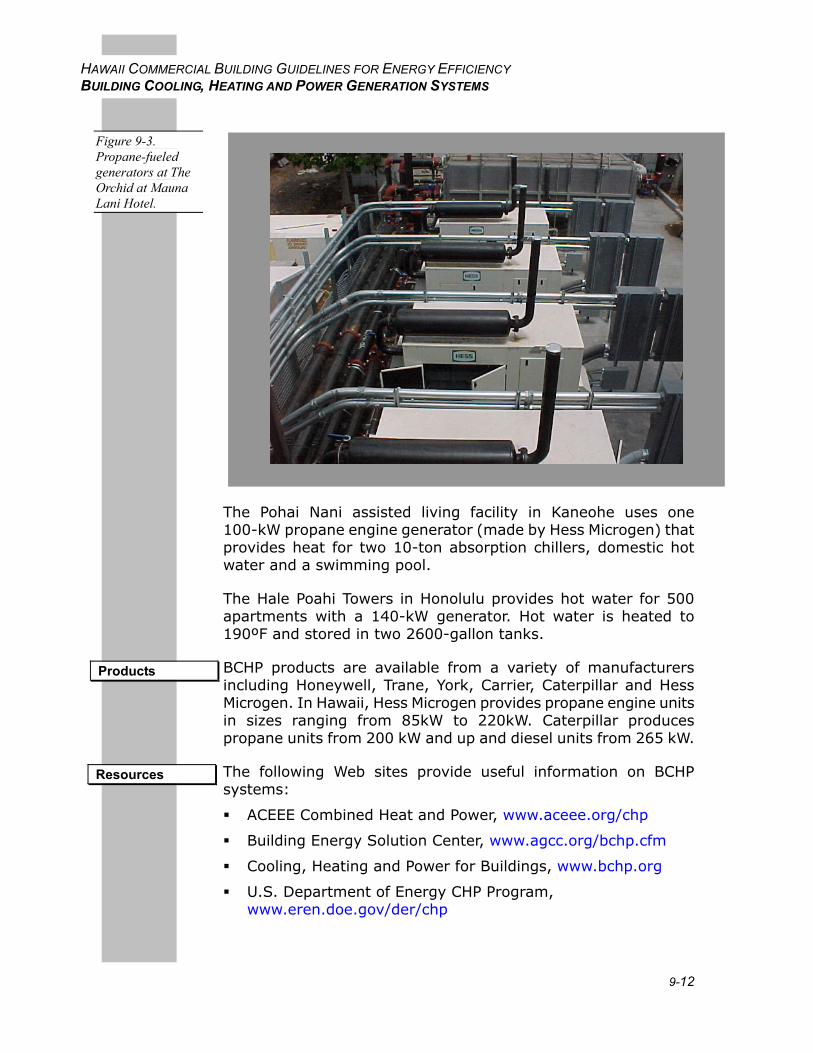
9-12
HAWAII COMMERCIAL BUILDING GUIDELINES FOR ENERGY EFFICIENCY BUILDING COOLING, HEATING AND POWER GENERATION SYSTEMS
The Pohai Nani assisted living facility in Kaneohe uses one 100-kW propane engine generator (made by Hess Microgen) that provides heat for two 10-ton absorption chillers, domestic hot water and a swimming pool.
The Hale Poahi Towers in Honolulu provides hot water for 500 apartments with a 140-kW generator. Hot water is heated to 190ºF and stored in two 2600-gallon tanks.
BCHP products are available from a variety of manufacturers including Honeywell, Trane, York, Carrier, Caterpillar and Hess Microgen. In Hawaii, Hess Microgen provides propane engine units in sizes ranging from 85kW to 220kW. Caterpillar produces propane units from 200 kW and up and diesel units from 265 kW.
The following Web sites provide useful information on BCHP systems:
ACEEE Combined Heat and Power, www.aceee.org/chp
Building Energy Solution Center, www.agcc.org/bchp.cfm
Cooling, Heating and Power for Buildings, www.bchp.org
U.S. Department of Energy CHP Program, www.eren.doe.gov/der/chp
Figure 9-3. Propane-fueled generators at The Orchid at Mauna Lani Hotel.
Products
Resources
9-13
HAWAII COMMERCIAL BUILDING GUIDELINES FOR ENERGY EFFICIENCY BUILDING COOLING, HEATING AND POWER GENERATION SYSTEMS
University of Maryland, Center for Environmental Energy Engineering, www.enme.umd.edu/ceee/bchp