Embed Size (px)
Citation preview

HAWAIIAN AIRLINES INVESTOR DAY December 2, 2015

This presentation contains “forward-looking statements” within the meaning of the Private Securities Litigation Reform Act
of 1995 that reflect the Company’s current views with respect to certain current and future events and financial
performance. Words such as “expects,” “anticipates,” “projects,” “intends,” “plans,” “believes,” “estimates,” variations of
such words, and similar expressions are also intended to identify such forward-looking statements. These forward-looking
statements are and will be, as the case may be, subject to many risks, uncertainties and assumptions relating to the
Company’s operations and business environment, all of which may cause the Company’s actual results to be materially
different from any future results, expressed or implied, in these forward-looking statements. These risks and uncertainties
include, without limitation, the Company’s ability to accurately forecast quarter and year-end results; economic volatility;
the price and availability of aircraft fuel; fluctuations in demand for transportation in the markets in which the Company
operates; the Company’s dependence on tourist travel; foreign currency exchange rate fluctuations; and the Company’s
ability to implement its growth strategy.
The risks, uncertainties and assumptions referred to above that could cause the Company’s results to differ materially from
the results expressed or implied by such forward-looking statements also include the risks, uncertainties and assumptions
discussed from time to time in the Company’s public filings and public announcements, including the Company’s Annual
Report on Form 10-K for the year ended December 31, 2014 and the Company’s Quarterly Reports on Form 10-Q, as well
as other documents that may be filed by the Company from time to time with the Securities and Exchange Commission. All
forward-looking statements included in this document are based on information available to the Company on the date
hereof. The Company does not undertake to publicly update or revise any forward-looking statements to reflect events or
circumstances that may arise after the date hereof even if experience or future changes make it clear that any projected
results expressed or implied herein will not be realized.
Forward-looking statements

MARK DUNKERLEY President and Chief Executive Officer
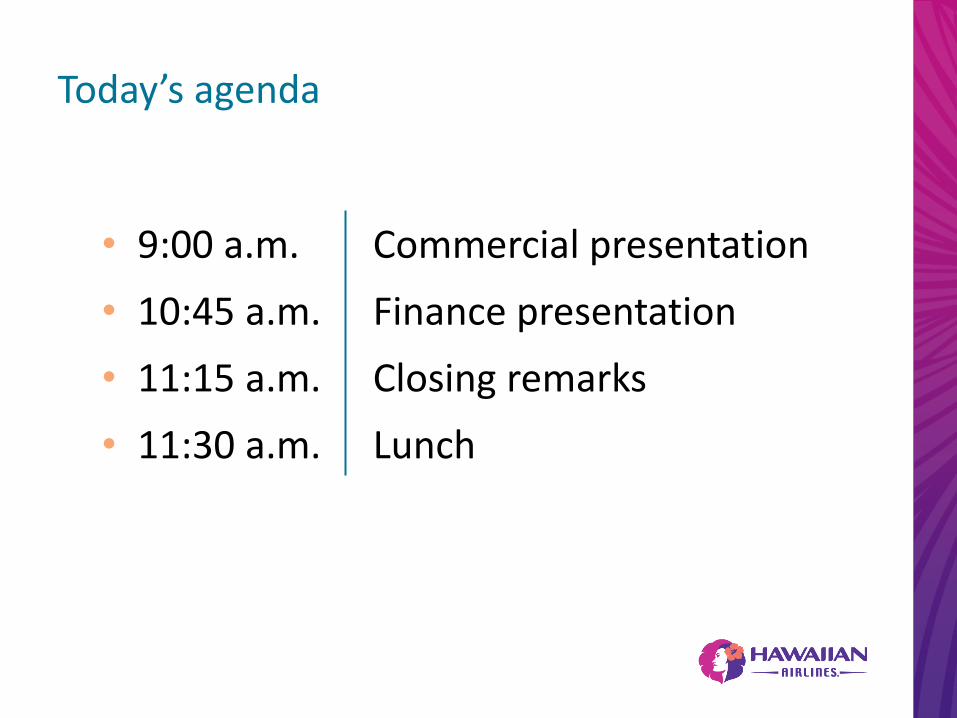
Today’s agenda
Commercial presentation
Finance presentation
Closing remarks
Lunch
• 9:00 a.m.
• 10:45 a.m.
• 11:15 a.m.
• 11:30 a.m.

LOOKING BACK

Tokyo
Beijing
Auckland
New York City

Beijing
Auckland
New York City

Tokyo
Beijing
Auckland
New York City


30%
62%
8%
2009 2015
North America Neighbor Island International
25%
53%
22%
Passenger Revenue

CURRENT

Our financial performance has improved
• Record earnings
• Record margins
• Stronger balance sheet

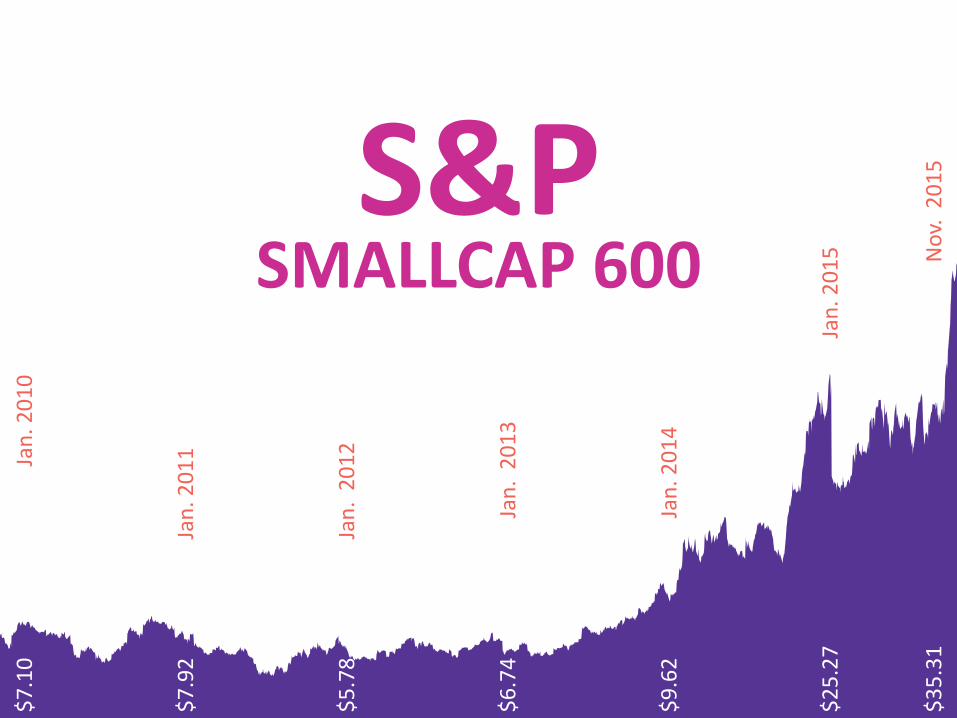
S&P
Jan
. 20
10
No
v. 2
01
5
Jan
. 2
01
3
Jan
. 20
15
Jan
. 20
11
SMALLCAP 600
$7
.10
$7
.92
$5
.78
$6
.74
$9
.62
Ja
n. 2
01
4
Jan
. 2
01
2
$2
5.2
7
$3
5.3
1


#1 On-Time

NEXT 18 MONTHS
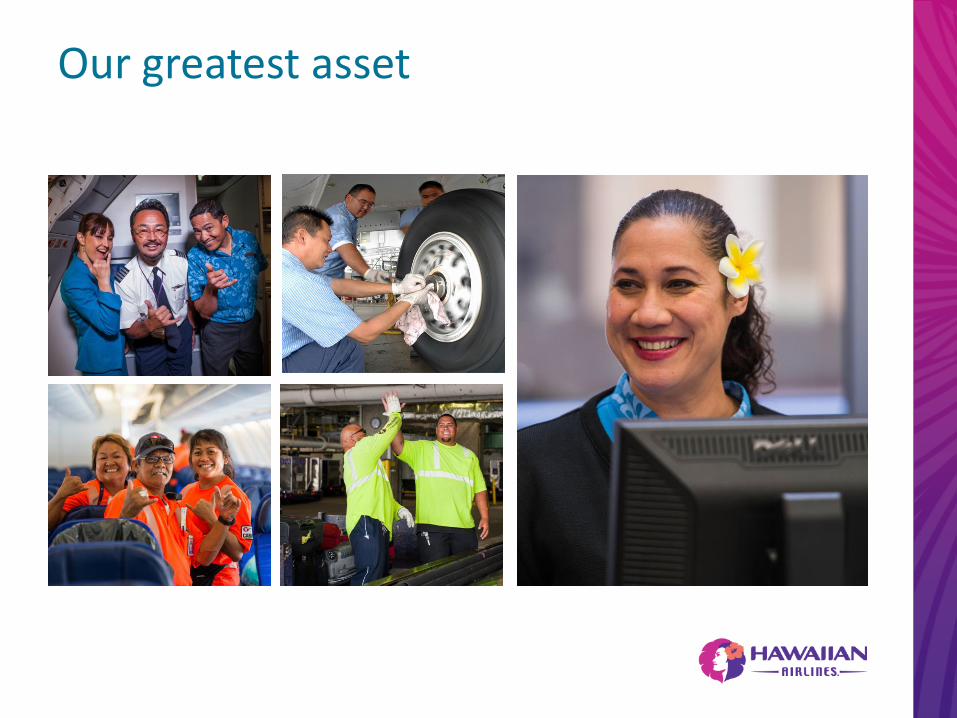
Our greatest asset

Strengthen competitive
position Achieve mastery
Grow long-term shareholder value

2016 is going to be…
a better year than 2015.

PETER INGRAM Executive Vice President, Chief Commercial Officer
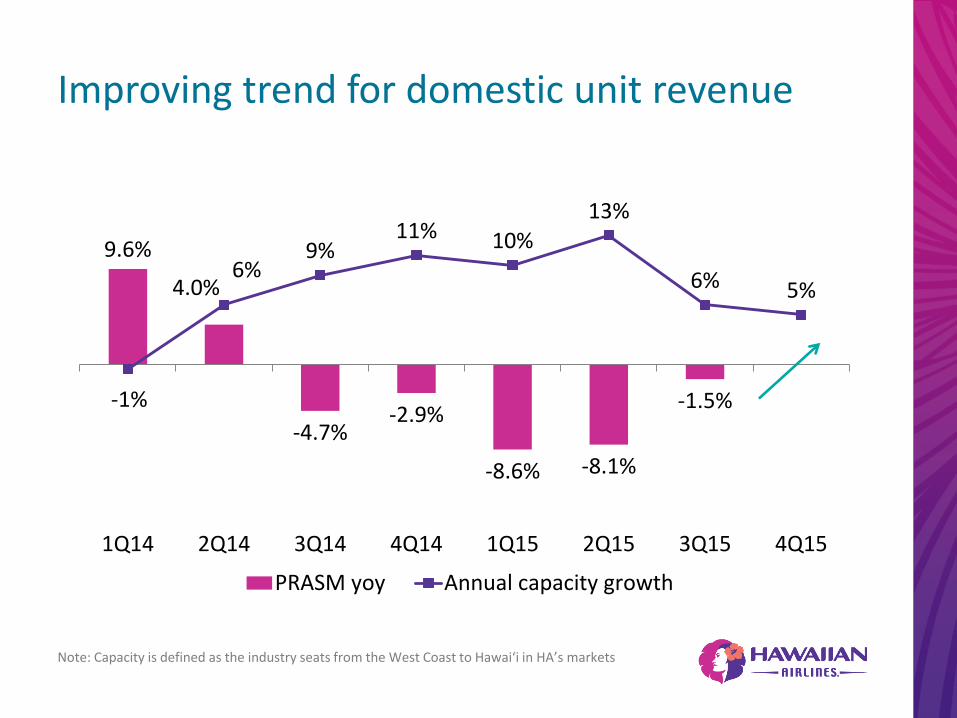
Improving trend for domestic unit revenue
Note: Capacity is defined as the industry seats from the West Coast to Hawai‘i in HA’s markets
9.6%
4.0%
-4.7% -2.9%
-8.6% -8.1%
-1.5% -1%
6% 9%
11% 10% 13%
6% 5%
1Q14 2Q14 3Q14 4Q14 1Q15 2Q15 3Q15 4Q15
PRASM yoy Annual capacity growth

Underlying international market performance improving…
2014 MarketPerformanceand Network
Changes
FX Fuel Surcharge 2015
International PRASM

…but FX and Fuel surcharges offset improvements
2014 MarketPerformanceand Network
Changes
FX Fuel Surcharge 2015
International PRASM

¥100
¥105
¥110
¥115
¥120
¥125
Jan Mar May Jul Sep Nov
FX headwinds weighed on 2015 unit revenue
1.00
1.05
1.10
1.15
1.20
1.25
1.30
1.35
1.40
1.45
Jan Mar May Jul Sep Nov
2014
AUD / $ JPY / $
2015

Lower fuel prices led to lower fuel surcharges
¥-
¥2,000
¥4,000
¥6,000
¥8,000
¥10,000
¥12,000
¥14,000
¥16,000
¥18,000
1.50
1.70
1.90
2.10
2.30
2.50
2.70
2.90
3.10
3.30
Jan Mar May Jul Sep Nov
Japan fuel surcharge Economic fuel cost per gallon
2014 2015
FLEET EVOLUTION
NETWORK EVOLUTION
PRODUCT EVOLUTION
ANCILLARY / OTHER
PRODUCT EVOLUTION

Best fleet for our missions
Aircraft: A321neo
Quantity: 16 on order delivery starting 2017
Aircraft: A330-200
Quantity: 23
Aircraft: B717
Quantity: 18

A330 allows us to grow into longer-haul destinations
Tokyo
Beijing
Auckland
Beijing
Tokyo New York City
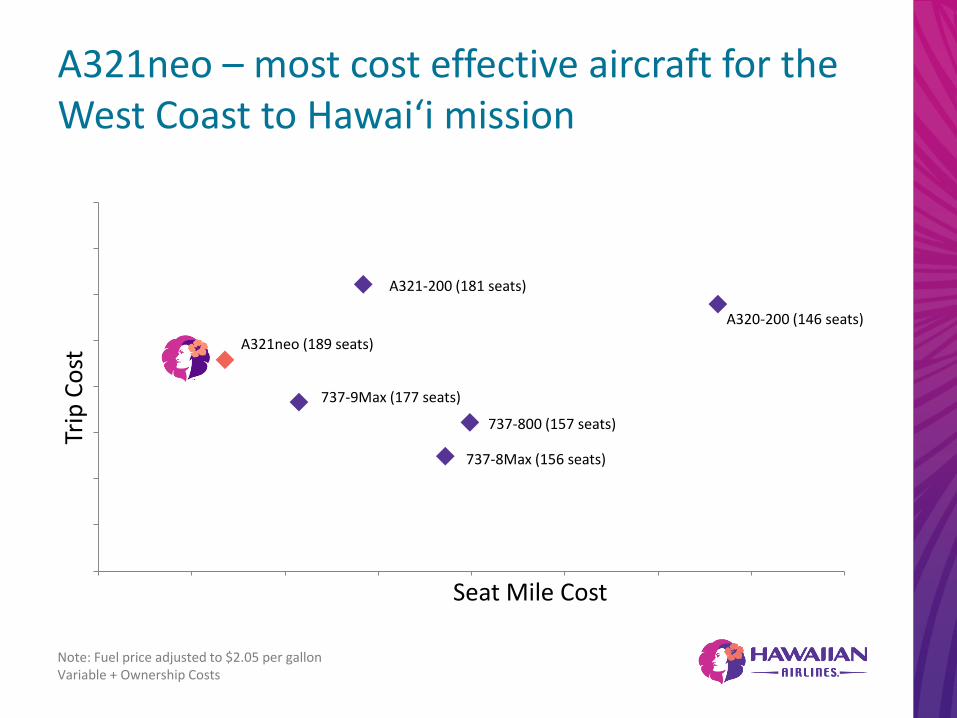
A321neo (189 seats)
737-8Max (156 seats)
737-9Max (177 seats)
737-800 (157 seats)
A321-200 (181 seats)
A320-200 (146 seats)
Trip
Co
st
Seat Mile Cost
A321neo – most cost effective aircraft for the West Coast to Hawai‘i mission
Note: Fuel price adjusted to $2.05 per gallon Variable + Ownership Costs
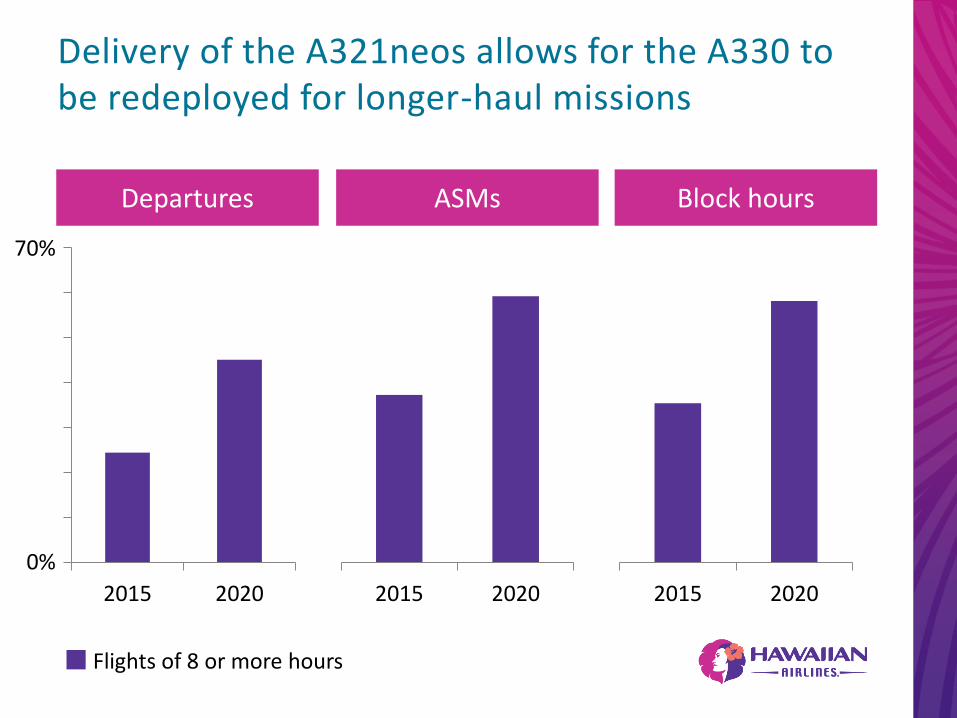
Delivery of the A321neos allows for the A330 to be redeployed for longer-haul missions
2015 2020
ASMs Departures Block hours
2015 2020
Flights of 8 or more hours
2015 2020
70%
0%

Neighbor Island network
LĀNA‘I
LĪHU‘E
KONA
HILO
MAUI
HONOLULU
• 160 daily flights • ~ 90% seat share • 2/3 is local traffic
B717
ATR42
B717 / ATR42
MOLOKA‘I

18 B717 retrofitted to a standard seat count of 128 seats
125 additional seats
Equivalent to one additional B717
B717 interior retrofits

FLEET EVOLUTION
NETWORK EVOLUTION
PRODUCT EVOLUTION
ANCILLARY / OTHER
PRODUCT EVOLUTION
FLEET EVOLUTION
NETWORK EVOLUTION
PRODUCT EVOLUTION
ANCILLARY / OTHER
PRODUCT EVOLUTION
BRENT OVERBEEK Vice President - Revenue Management & Network Planning

Upgauge Peak-PeriodFrequencyIncreases
Off-PeakFrequencyReductions
NRT Other
2016: Moderate capacity growth
2011 2012 2013 2014 2015E 2016E
Up 3% to 5%
Year-over-Year ASM Growth
Composition of Projected 2016 ASM growth
19% 22%
14%
Up 2.5% to 5.5% 2%
2.5% to 5.5%
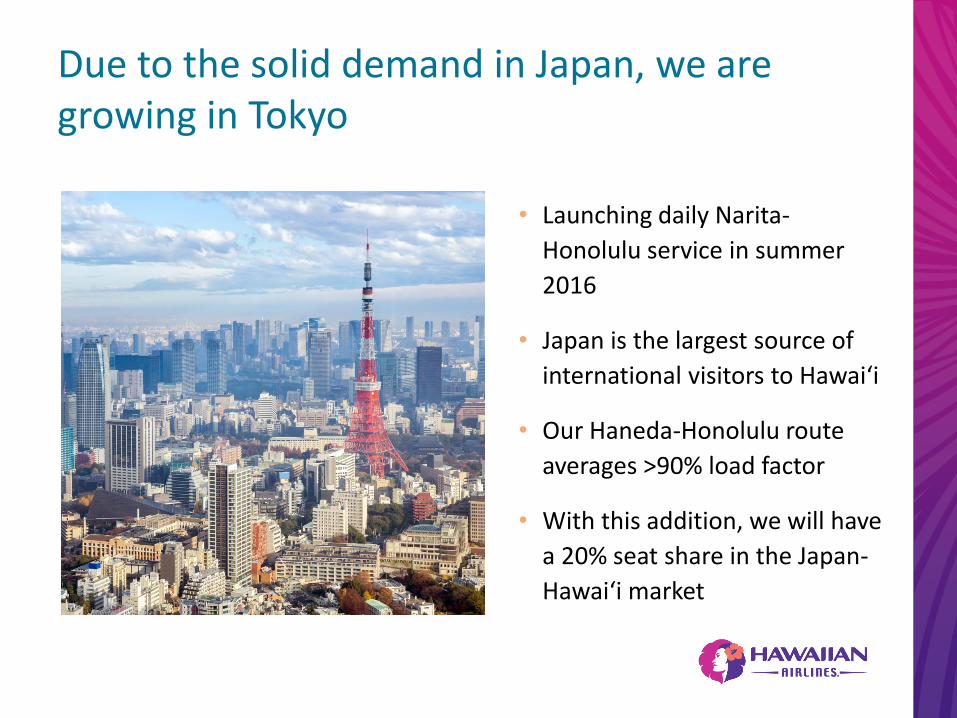
Due to the solid demand in Japan, we are growing in Tokyo
• Launching daily Narita-
Honolulu service in summer
2016
• Japan is the largest source of
international visitors to Hawai‘i
• Our Haneda-Honolulu route
averages >90% load factor
• With this addition, we will have
a 20% seat share in the Japan-
Hawai‘i market
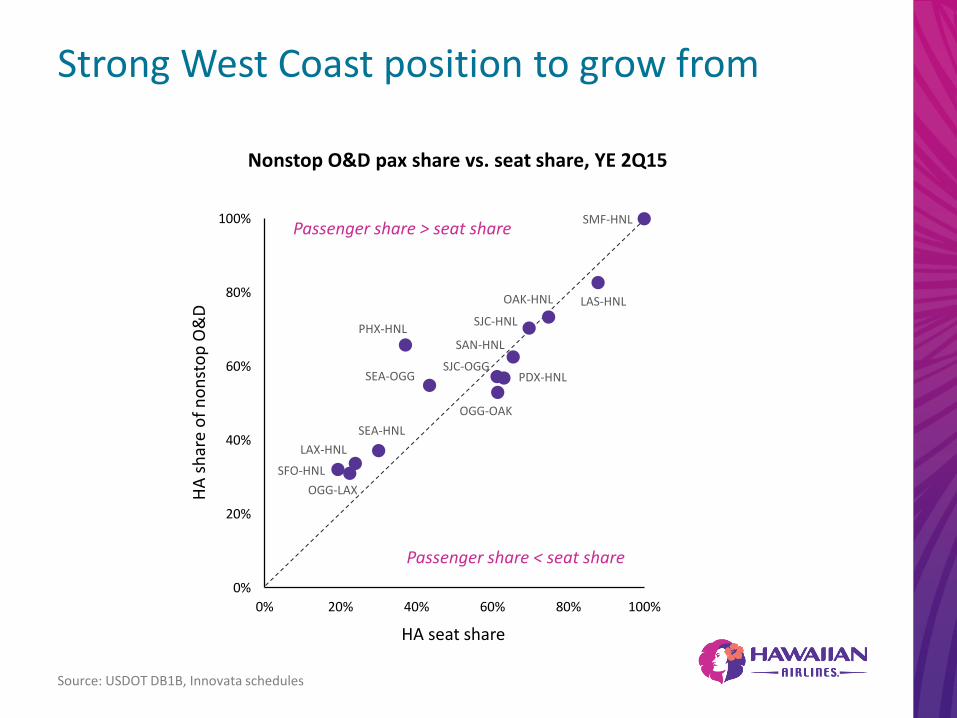
Strong West Coast position to grow from
Source: USDOT DB1B, Innovata schedules
LAX-HNL
SFO-HNL
OGG-LAX
SEA-HNL
LAS-HNL
PHX-HNL SJC-HNL
SEA-OGG
SAN-HNL
PDX-HNL
OGG-OAK
SJC-OGG
OAK-HNL
SMF-HNL
0%
20%
40%
60%
80%
100%
0% 20% 40% 60% 80% 100%
HA
sh
are
of
no
nst
op
O&
D
HA seat share
Passenger share > seat share
Nonstop O&D pax share vs. seat share, YE 2Q15
Passenger share < seat share
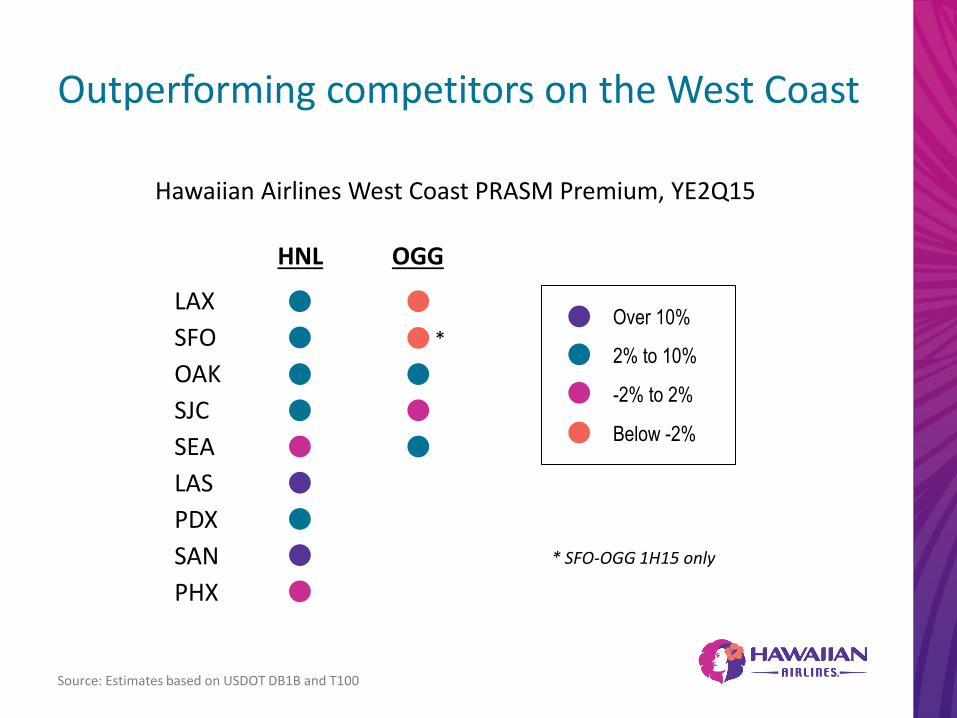
Outperforming competitors on the West Coast
Hawaiian Airlines West Coast PRASM Premium, YE2Q15
HNL OGG
LAX
SFO
OAK
SJC
SEA
LAS
PDX
SAN
PHX
Over 10%
2% to 10%
-2% to 2%
Below -2%
*
* SFO-OGG 1H15 only
Source: Estimates based on USDOT DB1B and T100
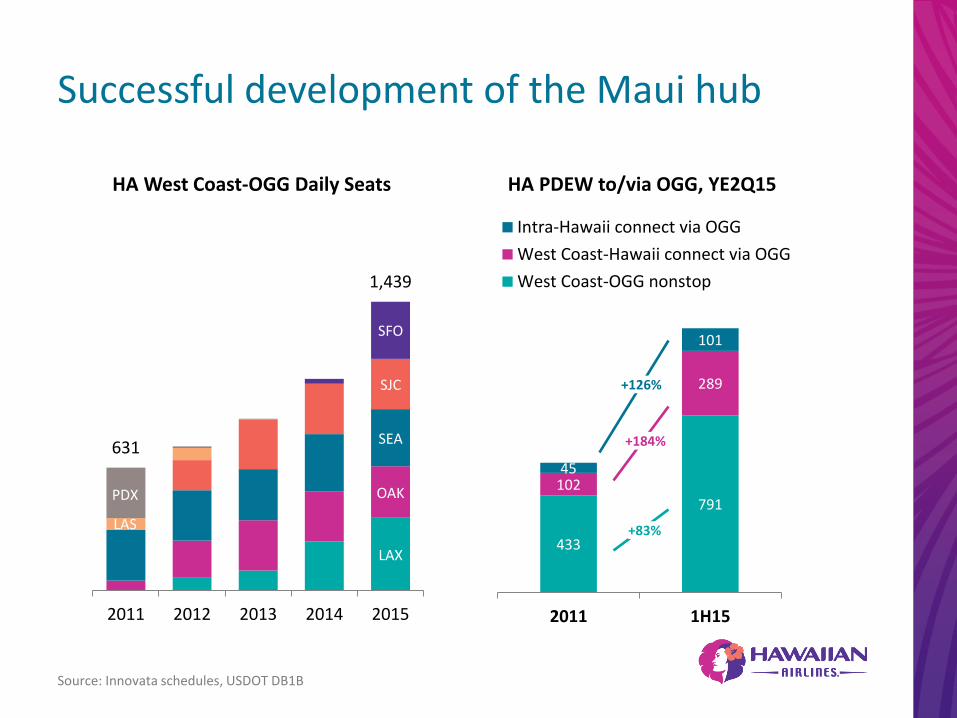
433
791 102
289
45
101
2011 1H15
Intra-Hawaii connect via OGG
West Coast-Hawaii connect via OGG
West Coast-OGG nonstop
Successful development of the Maui hub
631
1,439
2011 2012 2013 2014 2015
HA West Coast-OGG Daily Seats HA PDEW to/via OGG, YE2Q15
+126%
+184%
+83%
SFO
SJC
SEA
OAK
LAX
PDX
LAS
Source: Innovata schedules, USDOT DB1B
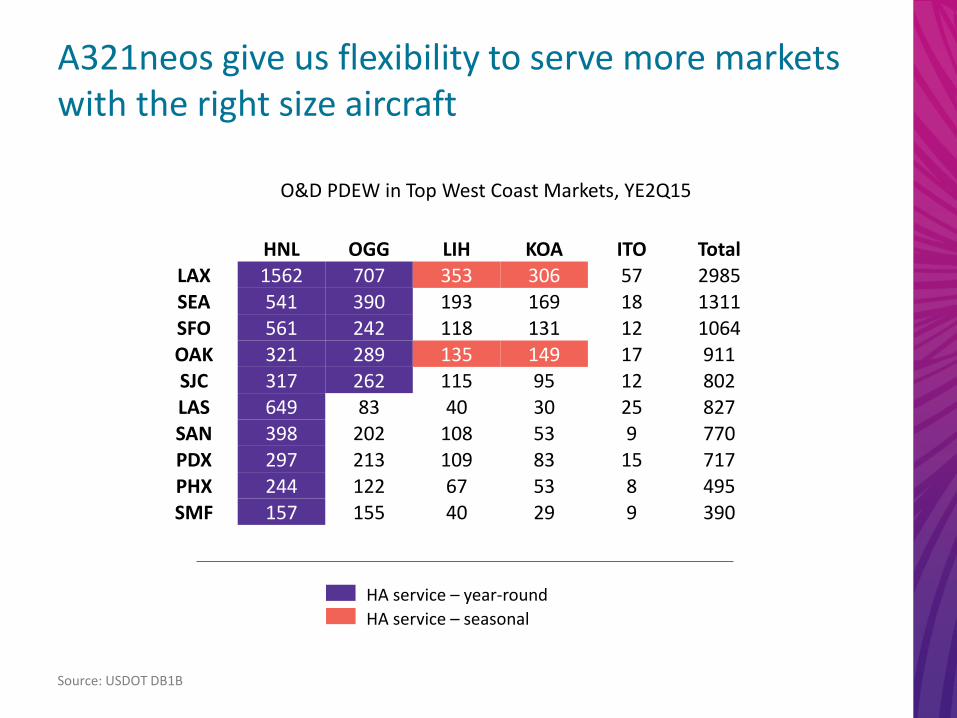
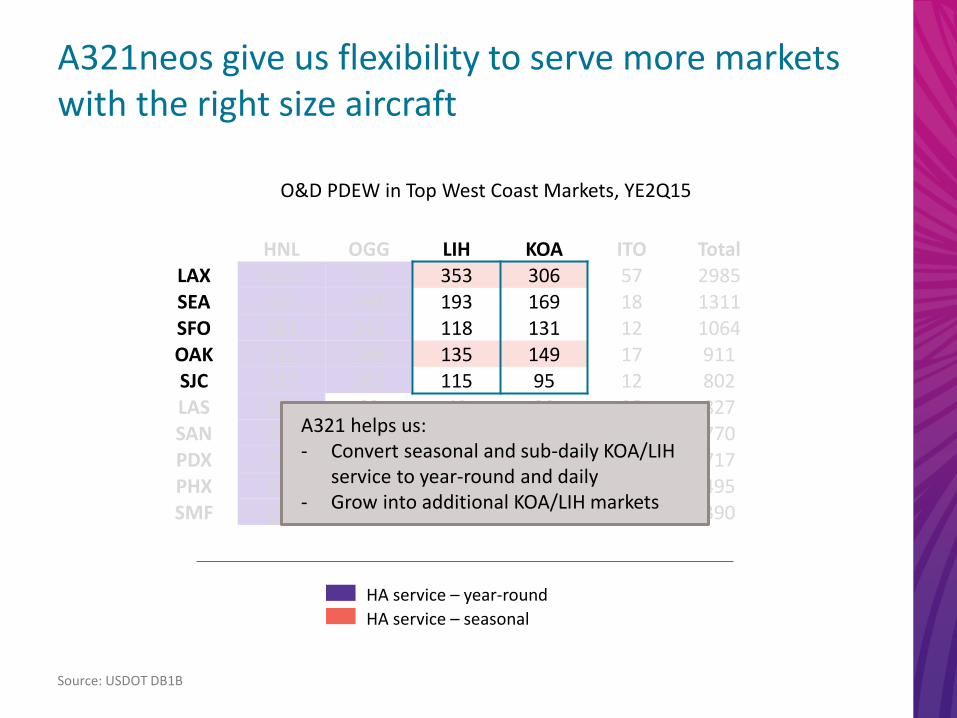
A321neos give us flexibility to serve more markets with the right size aircraft
HA service – year-round
HA service – seasonal
HNL OGG LIH KOA ITO Total LAX 1562 707 353 306 57 2985 SEA 541 390 193 169 18 1311 SFO 561 242 118 131 12 1064 OAK 321 289 135 149 17 911 SJC 317 262 115 95 12 802 LAS 649 83 40 30 25 827 SAN 398 202 108 53 9 770 PDX 297 213 109 83 15 717 PHX 244 122 67 53 8 495 SMF 157 155 40 29 9 390
O&D PDEW in Top West Coast Markets, YE2Q15
Source: USDOT DB1B
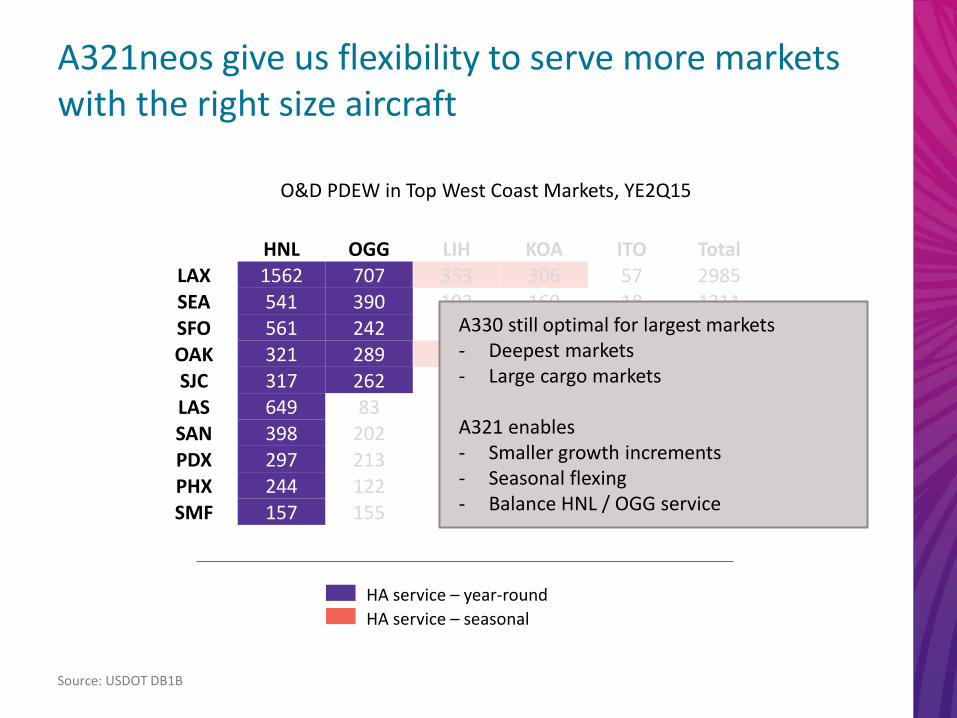
A330 still optimal for largest markets - Deepest markets - Large cargo markets A321 enables - Smaller growth increments - Seasonal flexing - Balance HNL / OGG service
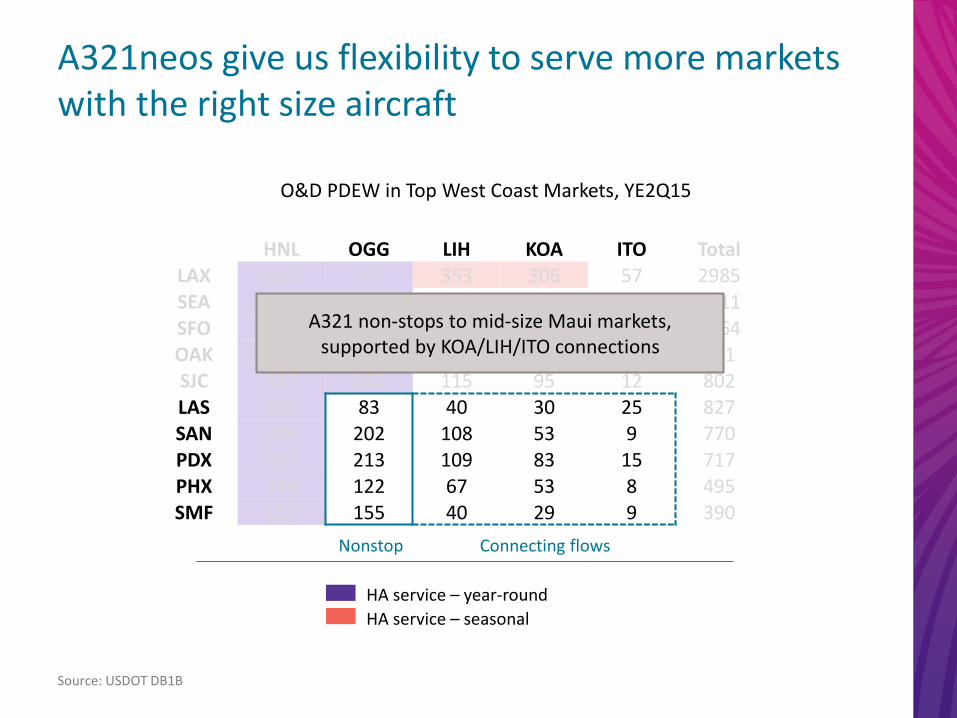
A321neos give us flexibility to serve more markets with the right size aircraft
HA service – year-round
HA service – seasonal
HNL OGG LIH KOA ITO Total LAX 1562 707 353 306 57 2985 SEA 541 390 193 169 18 1311 SFO 561 242 118 131 12 1064 OAK 321 289 135 149 17 911 SJC 317 262 115 95 12 802 LAS 649 83 40 30 25 827 SAN 398 202 108 53 9 770 PDX 297 213 109 83 15 717 PHX 244 122 67 53 8 495 SMF 157 155 40 29 9 390
O&D PDEW in Top West Coast Markets, YE2Q15
Source: USDOT DB1B
Nonstop Connecting flows
A321 non-stops to mid-size Maui markets, supported by KOA/LIH/ITO connections
A321neos give us flexibility to serve more markets with the right size aircraft
HA service – year-round
HA service – seasonal
HNL OGG LIH KOA ITO Total LAX 1562 707 353 306 57 2985 SEA 541 390 193 169 18 1311 SFO 561 242 118 131 12 1064 OAK 321 289 135 149 17 911 SJC 317 262 115 95 12 802 LAS 649 83 40 30 25 827 SAN 398 202 108 53 9 770 PDX 297 213 109 83 15 717 PHX 244 122 67 53 8 495 SMF 157 155 40 29 9 390
O&D PDEW in Top West Coast Markets, YE2Q15
Source: USDOT DB1B
A321 helps us: - Convert seasonal and sub-daily KOA/LIH
service to year-round and daily - Grow into additional KOA/LIH markets

Philadelphia
Washington Nagoya
SYDNEY
SEOUL TOKYO / HANEDA
OSAKA SAN FRANCISCO
LOS ANGELES
LAS VEGAS
PAGO PAGO PAPEETE
SEATTLE
PORTLAND
PHOENIX SAN DIEGO
SACRAMENTO OAKLAND
SAN JOSE
KAHULUI
NEW YORK / JFK
POTENTIAL MARKETS
BRISBANE
SAPPORO
AUCKLAND
1-2M 3-5M 5-10M 10-20M >20M
Singapore
Melbourne
Boston
Montreal
Toronto
Austin
2015 Metropolitan Population
Vancouver Calgary
Edmonton
Jakarta Bangkok
Many Growth Opportunities Remain
EXISTING ROUTES SEASONAL ROUTES
Saigon
BEIJING
Shanghai
LIHUE
KONA
Hong Kong
Guangzhou
Chengdu
TOKYO / NARITA
Anchorage
48
HNL

FLEET EVOLUTION
NETWORK EVOLUTION
PRODUCT EVOLUTION
ANCILLARY / OTHER
PRODUCT EVOLUTION

FLEET EVOLUTION
NETWORK EVOLUTION
PRODUCT EVOLUTION
ANCILLARY / OTHER
PRODUCT EVOLUTION

AVI MANNIS Senior Vice President - Marketing

The right cabins for our future network
A330 Long-haul
A321 NEO Mid-haul
B717 Neighbor Island
189 seats Ideal configuration for the 5 - 6 hour mission Balance between density and ability to upsell High ratio of Extra Comfort seating to meet demand from West Coast markets Streaming IFE
278 seats Investing in a new fully lie-flat premium product 28 more Extra Comfort seats due to its success In-seat IFE product to compete with international competitors Highly competitive leisure product in all cabins
128 seats New interiors add a row and harmonize seat-count across the fleet Ideally suited for 30-60 minute flights
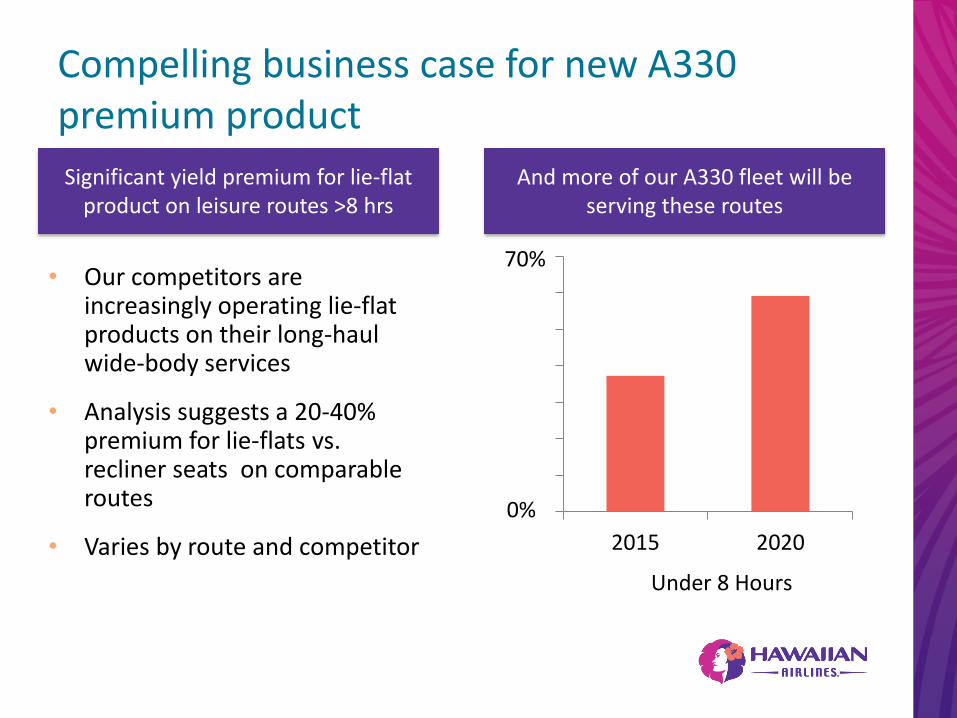
• Our competitors are increasingly operating lie-flat products on their long-haul wide-body services
• Analysis suggests a 20-40% premium for lie-flats vs. recliner seats on comparable routes
• Varies by route and competitor
2015 2020
Under 8 Hours
Compelling business case for new A330 premium product
Significant yield premium for lie-flat product on leisure routes >8 hrs
And more of our A330 fleet will be serving these routes
0%
70%
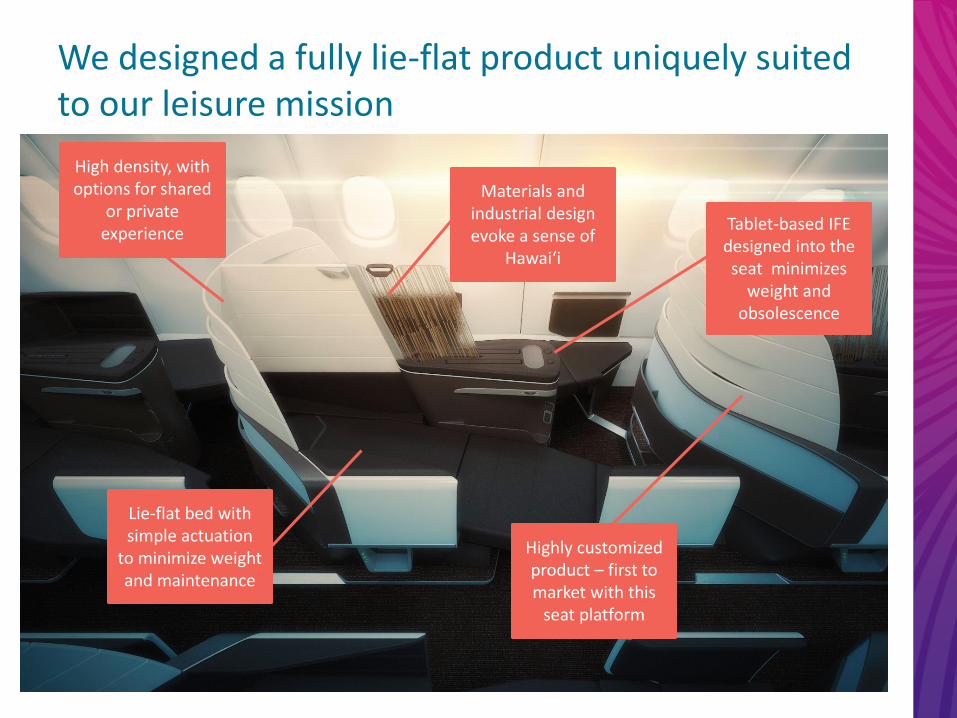
We designed a fully lie-flat product uniquely suited to our leisure mission
Materials and industrial design evoke a sense of
Hawai‘i
High density, with options for shared
or private experience
Tablet-based IFE designed into the seat minimizes
weight and obsolescence
Lie-flat bed with simple actuation
to minimize weight and maintenance
Highly customized product – first to market with this
seat platform

And a unique brand statement

Success of the Extra Comfort seat product
• > 80% paid utilization in North America
• Improving
international distribution
• Outstanding ROI

A321-NEO cabins will be ideally configured for their mission
• Bringing our award-winning
wide-body guest service to the
A321-NEO
• 189 seats (16F / 45 PY / 128 Y)
• Comfortable seats and living
space in the main cabin
• Streaming IFE– no seat-back
screens
• Cabin aesthetics that extend
our unique design language
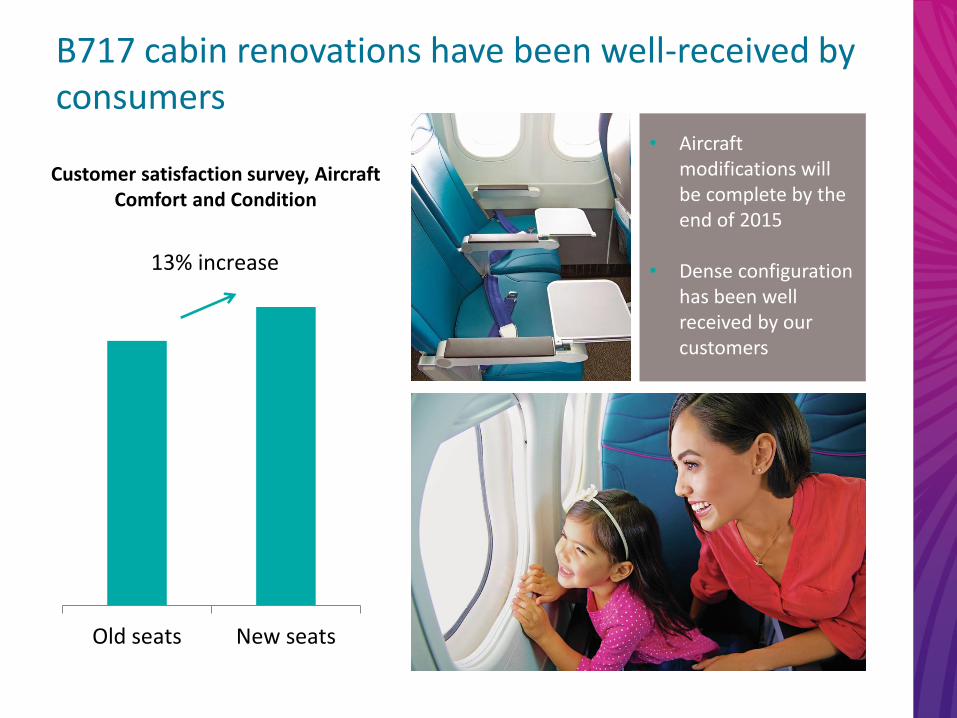
Old seats New seats
13% increase
B717 cabin renovations have been well-received by consumers
Customer satisfaction survey, Aircraft Comfort and Condition
• Aircraft modifications will be complete by the end of 2015
• Dense configuration
has been well received by our customers

FLEET EVOLUTION
NETWORK EVOLUTION
PRODUCT EVOLUTION
ANCILLARY / OTHER
PRODUCT EVOLUTION

FLEET EVOLUTION
NETWORK EVOLUTION
PRODUCT EVOLUTION
ANCILLARY / OTHER
PRODUCT EVOLUTION
VICKI NAKATA Vice President – Loyalty & Travel Products
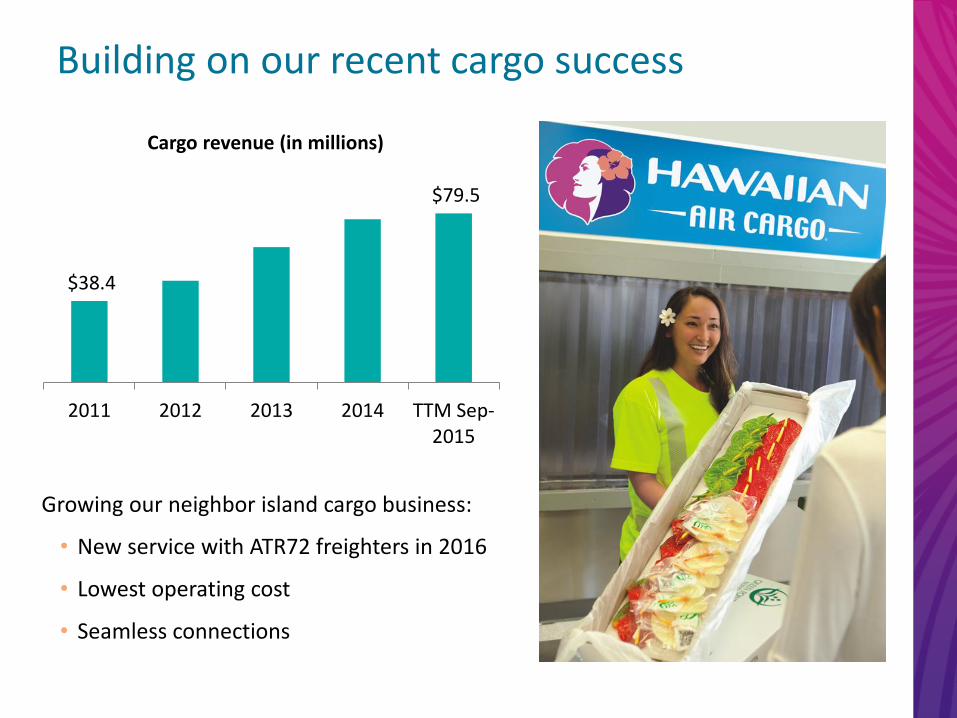
$38.4
$79.5
2011 2012 2013 2014 TTM Sep-2015
Building on our recent cargo success
Growing our neighbor island cargo business:
• New service with ATR72 freighters in 2016
• Lowest operating cost
• Seamless connections
Cargo revenue (in millions)

Growing sales of value-added products
• Averaging $3.5M/month*
• Growth will come from additional inventory, pricing optimization, and new distribution channels
• >10% credit card portfolio growth
• >20% growth in credit card spend
$14.69
$19.72 $21.91
2013 2014 TTM Sep 2015
Other
Baggage
Sales of HawaiianMiles
Extra Comfort / Preferred Seat Sales
Value-added revenue per passenger
Note: “Other” includes ticket fees, first class upgrades, vacation commissions and on-board sales * Includes Extra Comfort and Preferred Seat revenue
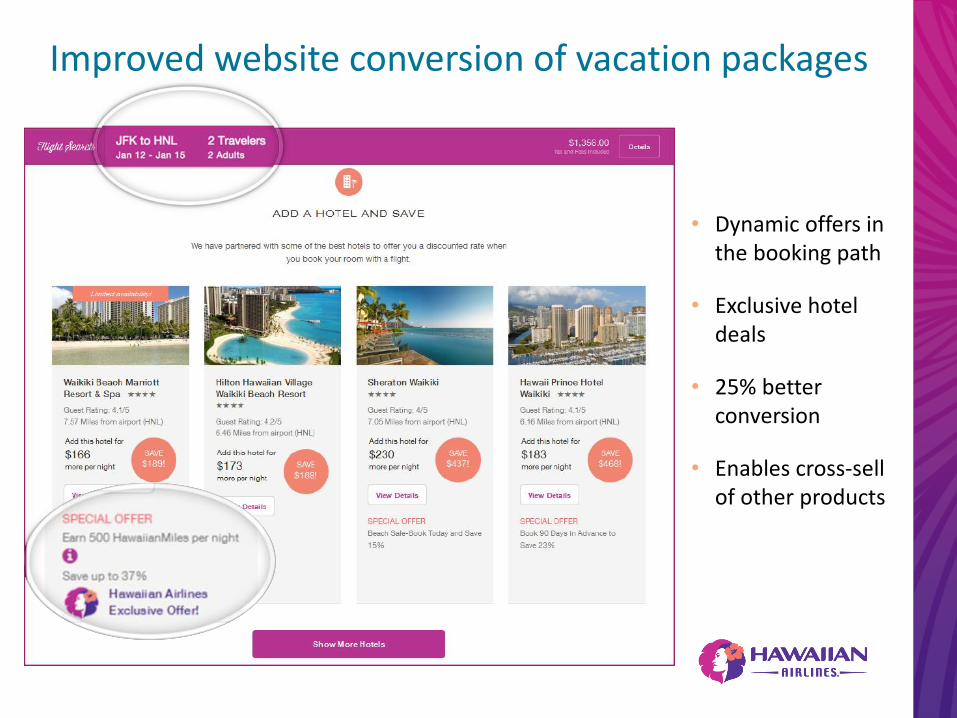
Improved website conversion of vacation packages
• Dynamic offers in the booking path
• Exclusive hotel deals
• 25% better conversion
• Enables cross-sell of other products

Better merchandising of seat upgrades

Testing new products and sales touch points

New products in the pipeline

FLEET EVOLUTION
NETWORK EVOLUTION
PRODUCT EVOLUTION
ANCILLARY / OTHER
PRODUCT EVOLUTION
• Ideal fleet positioning
• Network opportunities in North America and
International
• Optimizing our product for our guests throughout
the network
• Pursuing ancillary revenue
Conclusion

Mahalo.

SHANNON OKINAKA Executive Vice President, Chief Financial Officer

Improving financial performance

Record financial performance in 2015
$0.87 $0.85 $1.06
$0.88
$1.55
$2.65
2010 2011 2012 2013 2014 TTMSep
2015
Adjusted Earnings per share Adjusted Pre-Tax Margin
6.0%
4.6% 4.6% 3.6%
6.9%
11.7%
2010 2011 2012 2013 2014 TTMSep
2015

We are generating returns on our investments
15.6%
25.0%
2010 2011 2012 2013 2014 TTMSep
2015
Pre-Tax ROIC

2010 2011 2012 2013 2014 2015E2016E
CASM ex-fuel (in cents)
1.0%
1.0%
0.5%
2016 CASM ex-fuel yoy headwinds
Controlling our costs
Note<1>: 2015E is based on the mid-point of FY15 CASM ex-fuel guidance of up 1% - 3%
Note<2>: 2011 represents CASM ex-fuel and lease terminations expense of $70.0M
Up in the low single digit range
Maintenance
Wages
Space Rent 8.31
8.15 7.88
8.18
8.70 8.83

$2.00 - $2.10
Lower fuel costs provide a tailwind
Note<1>: 2015E and 2016E economic fuel cost per gallon estimates are based on the forward fuel
curve as of November 18, 2015.
Note<2>: Based on the Company’s hedge portfolio as of November 18, 2015
% Hedged Price
4Q15 60% $2.12
1Q16 49% $1.85
2Q16 36% $1.80
3Q16 22% $1.71
4Q16 10% $1.70
Heating Oil Hedge Position
2010 2011 2012 2013 2014 2015E2016E
Economic Fuel Cost per gallon
$3.13 $3.03
$2.31
$3.20 $3.15
$1.65 - $1.75

Strengthening our balance sheet

$600M
2010-2014
Net Debt Increase
Cash Flow from Ops
2010-2014: Borrowed to fund heavy Capex
Return to shareholders
1%
Investments in the business
99%
Sources of cash Uses of cash
$1,184M

$189M
$462M
$661M
$806M
$914M
2010 2011 2012 2013 2014 Q315
Decreasing our debt (YTD 3Q15)
$1,050M
YTD Sep 2015
Convertible Note Repurchase
$68M
Principal debt payments
$68M
Total $136M
Interest savings of $4M 3Q15

Equity repurchases (YTD 3Q15)
Represents ~7% of our outstanding market cap
TOTAL
Convertible Note – Equity Repurchase $103M
Share Repurchases $38M
Total Equity Repurchases $141M

-81-
Savings from equity repurchases
Convertible Notes
Share Buyback
Total
Value of repurchase at 9/30/15 $259M $40M $299M
Cash expended (216)M (38)M (254)M
Unrealized savings at 9/30/15 $43M $2M $45M
$45M in unrealized benefits

$2.25
$0.25
$0.06
$0.06
Lower share count in 2016 increases EPS
Tailwinds from the full
year effects of:
• Warrant unwind
• Convertible note
repurchase
• Share buyback
16% or 37 cent improvement to pro forma EPS
$2.62 Share buyback
Convertible note
repurchases
Warrant unwind
Adjusted EPS YTD 9/30/15
Diluted EPS

Capital Allocation
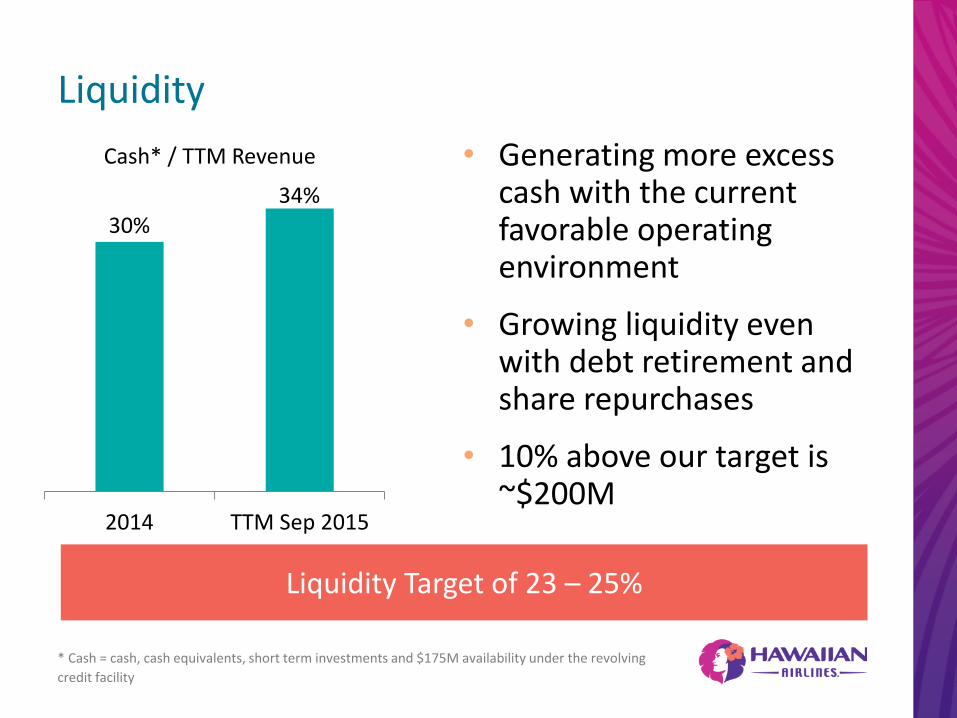
30%
2014 TTM Sep 2015
Liquidity
• Generating more excess cash with the current favorable operating environment
• Growing liquidity even with debt retirement and share repurchases
• 10% above our target is ~$200M
* Cash = cash, cash equivalents, short term investments and $175M availability under the revolving
credit facility
Cash* / TTM Revenue
34%
Liquidity Target of 23 – 25%

2014 TTM Sep 2015
4.2x
• Met the leverage target
we set last year
• Continue to de-lever
through debt
retirement
Leverage
Note: Aircraft Rent is capitalized at 7x.
3.1x
Optimize our capitalization and minimize cost of capital
Adjusted Debt / Adjusted EBITDAR
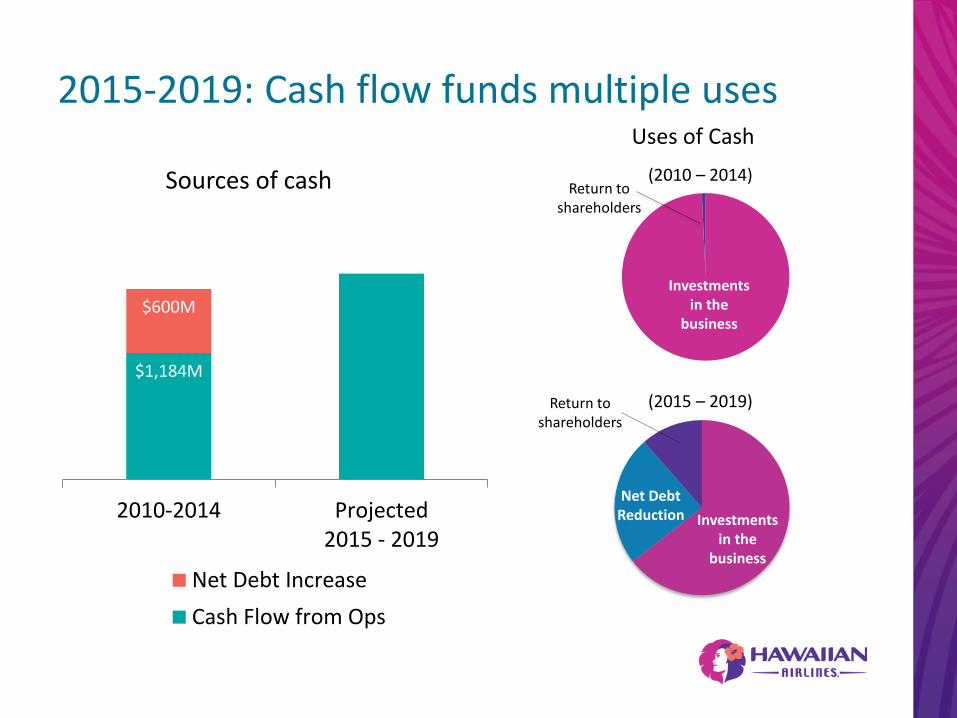
$1,184M
$600M
2010-2014 Projected2015 - 2019
Net Debt Increase
Cash Flow from Ops
Investments in the
business
Return to shareholders
(2010 – 2014)
2015-2019: Cash flow funds multiple uses
Net Debt Reduction
Sources of cash
(2015 – 2019)
Investments in the
business
Return to shareholders
Uses of Cash
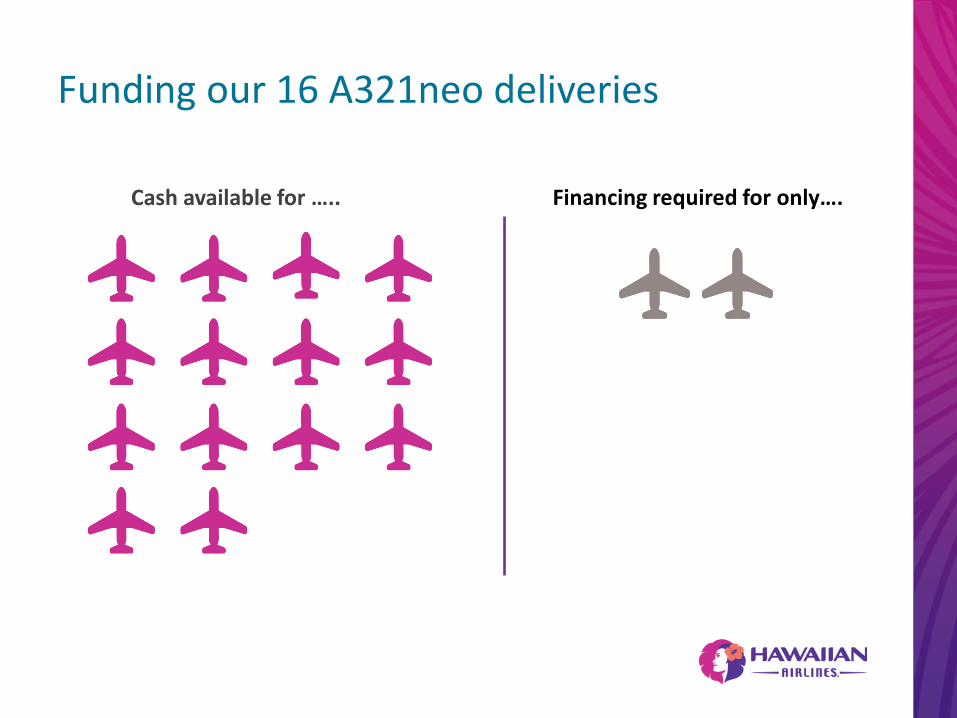
Funding our 16 A321neo deliveries
Cash available for ….. Financing required for only….

Anticipated additional debt retirement
Results in Interest expense savings of ~$5 - $10M
TOTAL
Early debt retirement $150M
Contractual principal debt payments $80M
$230M

Anticipated additional pension plan contributions
$199M
Reducing our pension
liability leads to:
- Lower future
contributions
- Decreases future
pension expense
- Decreases PBGC
premiums
3Q15
Pension liability OPEB
Detail of pension liability
$209M
$199M
Pension and other postretirement liability Benefits
$161M
$30M
$8M

Pathway to long-term value
Optimize cost of capital
Increase enterprise
value
Strengthen balance
sheet
Strong financial
performance
SHAREHOLDER VALUE
• Improving financial performance
• Strengthening balance sheet
• Capital allocation
Creating long-term value

Mahalo.

MARK DUNKERLEY President and Chief Executive Officer
• Strengthen competitive position
• Achieve mastery
• Grow long-term value for our shareholders
2016 is going to be a better year than 2015

Mahalo.

Non-GAAP Reconciliations
NON-GAAP RECONCILIATIONS ($ in thousands, except CASM data) FY 2010 FY 2011 FY 2012 FY 2013 FY 2014
GAAP Operating Expenses $1,218,815 $1,630,176 $1,832,955 $2,022,118 $2,069,747
Less: aircraft fuel, including taxes and delivery (322,999) (513,284) (631,741) (698,802) (678,253)
Less: lease termination expense - (70,014) - - -
Adjusted operating expenses - excluding aircraft fuel and lease termination
$895,816 $1,046,878 $1,201,214 $1,323,316 $1,391,494
Available Seat Miles 10,150,659 12,039,933 14,687,472 16,785,827 17,073,630
CASM - GAAP (in cents) 12.01 13.54 12.48 12.05 12.12
Less: aircraft fuel and lease termination expense (in cents) (3.18) (4.84) (4.30) (4.16) (3.97)
CASM Excluding Fuel and lease termination expense (in cents) 8.83 8.70 8.18 7.88 8.15
NON-GAAP RECONCILIATIONS ($ in thousands)
FY 2010 FY 2011 FY 2012 FY 2013 FY 2014 TTM Sep 2015
Net Income (Loss), GAAP $110,255 $(2,649) $53,237 $51,854 $68,926 $48,834
Add: lease termination expense, net of tax - 42,008 - - - -
Add: loss on extinguishment of debt, net of tax - - - - 2,331 178
Add: changes in fair value of fuel derivatives, net of tax 3,859 3,859 2,375 (5,210) 25,864 (11,519)
Add: non-recurring tax benefits (62,546) - - - - -
Adjusted Net Income, Non-GAAP $45,405 $43,218 $55,612 $46,644 $97,121 $37,493
The Company evaluates its financial performance utilizing various GAAP and non-GAAP financial measures, including operating income and CASM. Pursuant to Regulation G, the Company has included the following reconciliation of reported non-GAAP financial measures to comparable financial measures reported on a GAAP basis. The Company believes that excluding fuel costs from certain measures is useful to investors because it provides an additional measure of management’s performance excluding the effects of a significant cost item over which management has limited influence.

Pre-tax margin
NON-GAAP RECONCILIATIONS ($ in thousands)
FY 2010 FY 2011 FY 2012 FY 2013 FY 2014 TTM Sep 2015
Income Before Income Taxes, as reported $ 81,989 $(1,082) $85,786 $86,410 $113,447 $252,638
Add: changes in fair value of fuel derivatives (3,840) 6,432 3,958 (8,684) 43,106 7,147
Add: loss on extinguishment of debt - - - - 3,885 11,181
Add: lease termination expense - 70,014 - - - -
Adjusted Income Before Income Taxes, Non-GAAP $78,149 $75,364 $89,744 $77,726 $160,438 $270,966
Revenue $1,310,093 $1,650,459 $1,962,353 $2,155,865 $2,314,879 $2,318,152
NON-GAAP RECONCILIATIONS ($ in thousands)
FY 2010 FY 2011 FY 2012 FY 2013 FY 2014 TTM Sep 2015
Pre-Tax Margin, as reported 6.3% (0.1)% 4.4% 4.0% 4.9% 10.9%
Add: changes in fair value of fuel derivatives, net of tax (0.3)% 0.4% 0.2% (0.4)% 1.9% 0.3%
Add: loss on extinguishment of debt, net of tax - - - - 0.1% 0.5%
Add: lease termination expense, net of tax - 4.3% - - - -
Pre-Tax Margin, adjusted 6.0% 4.6% 4.6% 3.6% 6.9% 11.7%

Leverage NON-GAAP RECONCILIATIONS
($ in thousands) FY 2015 TTM 3Q2015
Debt and capital lease obligations 1,049,637 914,413
Plus: Aircraft leases capitalized at 7x last 12 months’ aircraft rent 744,954 798,312
Adjusted debt and capital lease obligations 1,794,591 1,712,805
Income Before Income Taxes 113,447 252,638
Add back:
Interest and amortization of debt expense 64,240 58.871
Depreciation and amortization 96,374 104,192
Rent Expense 106,422 114,056
EBITDAR 380,483 529,757
Adjustments:
Add: changes in fair value of derivative contracts 43,106 7,147
Add: Loss on extinguishment of debt 3,885 11,181
Adjusted EBITDAR 427,474 548,085
Leverage Ratio 4.2x 3.1x
The Company evaluates its financial performance utilizing various GAAP and non-GAAP financial measures, including operating income and CASM. Pursuant to Regulation G, the Company has included the following reconciliation of reported non-GAAP financial measures to comparable financial measures reported on a GAAP basis. The Company believes that excluding fuel costs from certain measures is useful to investors because it provides an additional measure of management’s performance excluding the effects of a significant cost item over which management has limited influence.
99
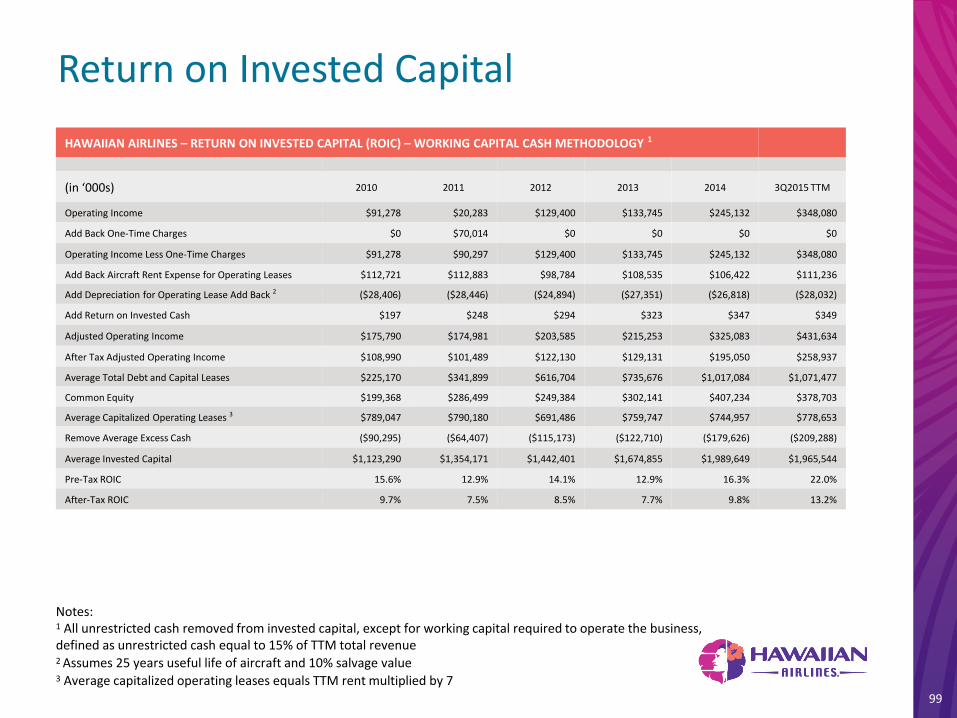
Return on Invested Capital
HAWAIIAN AIRLINES – RETURN ON INVESTED CAPITAL (ROIC) – WORKING CAPITAL CASH METHODOLOGY 1
(in ‘000s) 2010 2011 2012 2013 2014 3Q2015 TTM
Operating Income $91,278 $20,283 $129,400 $133,745 $245,132 $348,080
Add Back One-Time Charges $0 $70,014 $0 $0 $0 $0
Operating Income Less One-Time Charges $91,278 $90,297 $129,400 $133,745 $245,132 $348,080
Add Back Aircraft Rent Expense for Operating Leases $112,721 $112,883 $98,784 $108,535 $106,422 $111,236
Add Depreciation for Operating Lease Add Back 2 ($28,406) ($28,446) ($24,894) ($27,351) ($26,818) ($28,032)
Add Return on Invested Cash $197 $248 $294 $323 $347 $349
Adjusted Operating Income $175,790 $174,981 $203,585 $215,253 $325,083 $431,634
After Tax Adjusted Operating Income $108,990 $101,489 $122,130 $129,131 $195,050 $258,937
Average Total Debt and Capital Leases $225,170 $341,899 $616,704 $735,676 $1,017,084 $1,071,477
Common Equity $199,368 $286,499 $249,384 $302,141 $407,234 $378,703
Average Capitalized Operating Leases 3 $789,047 $790,180 $691,486 $759,747 $744,957 $778,653
Remove Average Excess Cash ($90,295) ($64,407) ($115,173) ($122,710) ($179,626) ($209,288)
Average Invested Capital $1,123,290 $1,354,171 $1,442,401 $1,674,855 $1,989,649 $1,965,544
Pre-Tax ROIC 15.6% 12.9% 14.1% 12.9% 16.3% 22.0%
After-Tax ROIC 9.7% 7.5% 8.5% 7.7% 9.8% 13.2%
Notes: 1 All unrestricted cash removed from invested capital, except for working capital required to operate the business, defined as unrestricted cash equal to 15% of TTM total revenue 2 Assumes 25 years useful life of aircraft and 10% salvage value 3 Average capitalized operating leases equals TTM rent multiplied by 7