Embed Size (px)
Citation preview

Hawaiian Electric Industries, Inc. Financial Community Meetings February – March 2018

Leadership Building strength through

Constance H. Lau President and Chief Executive Officer Chairman Chairman Hawaiian Electric Industries, Inc Hawaiian Electric Company, Inc American Savings Bank, F.S.B Ms. Lau was named President and Chief Executive Officer (CEO) of Hawaiian Electric Industries, Inc. (HEI) in May 2006. She also serves as Chairman of HEI subsidiaries Hawaiian Electric Company (Hawaiian Electric) and American Savings Bank (ASB). Born and raised in Honolulu, Ms. Lau joined the HEI companies in 1984 and has served in numerous capacities across HEI and its subsidiaries, including in legal, financial and executive management functions. Her tenure with HEI and its subsidiaries includes serving as Treasurer of each of Hawaiian Electric (1987-98) and HEI (1989-99), as a director, Senior Executive Vice President and Chief Operating Officer of ASB (1999-2001), as ASB President and CEO (2001-06) and ASB Chairman, President and CEO (2006-08). She served as an HEI director from 2001 through 2004 and has been serving as an HEI director since May 2006. Ms. Lau graduated from Yale College with a bachelor of science in administrative sciences. She earned a juris doctor (JD) from the University of California Hastings College of the Law and a master of business administration (MBA) from the Stanford Graduate School of Business. Ms. Lau chairs the National Infrastructure Advisory Council, which advises the President of the United States on the security of critical infrastructure sectors and their information systems. Ms. Lau is a member of the federal Electricity Subsector Coordinating Council and serves as a C3E Clean Energy Ambassador appointed by the Secretary of the Department of Energy. She serves on the Executive Committee of the Edison Electric Institute and on the board of Associated Electrical & Gas Insurance Services. She previously served on the Federal Reserve Bank of San Francisco’s Twelfth District Community Depository Institutions Advisory Council and was one of U.S. Banker’s 25 Most Powerful Women in Banking for 2004, 2005, and 2006 during her tenure leading ASB. She is also a director of Matson, Inc. (NYSE-MATX), a major shipping carrier to Hawaii, Alaska, Guam and the South Pacific. In Hawaii, Ms. Lau was named Pacific Business News (PBN)’s 2004 Hawaii Business Leader of the Year, and in 2013, she was named one of PBN’s 10 to Watch for her leadership in clean energy and transportation. Ms. Lau serves on the boards of the Hawaii Business Roundtable, the Foundation for the Asia-Pacific Center for Security Studies, Punahou School, and the Consuelo Foundation, which helps women, children and families in Hawaii and the Philippines. She also served as a trustee for Kamehameha Schools Bishop Estate from 1999 to 2007.
i
Alan M. Oshima Hawaiian Electric Company, Inc. President and Chief Executive Officer Mr. Oshima was named President and Chief Executive Officer of Hawaiian Electric effective Oct. 1, 2014. Mr. Oshima first joined Hawaiian Electric as a member of the board of directors in 2008. In 2011, he left the board to serve as HEI’s Executive Vice President for Corporate and Community Advancement and President of the HEI Charitable Foundation. In May 2014, he joined the Hawaiian Electric executive team full time. Prior to joining the Hawaiian Electric Board in 2008, Mr. Oshima served as Senior Vice President, General Counsel and Corporate Secretary of Hawaiian Telcom from 2005 to 2008 and later as a senior adviser and director helping the company successfully emerge from reorganization in 2010. Mr. Oshima also founded the law firm of Oshima Chun Fong & Chung and, prior to that, practiced law with Carlsmith Ball. With his significant experience with electric, telecommunications and transportation companies, as well as water and sewer resources in Hawaii, Mr. Oshima was consistently recognized as one of “America’s Best Lawyers” in the field of public utilities.
He has received the Hawaii State Bar Association Pro Bono Service Award and been recognized by the Hawaii Institute of Public Affairs and the Public Schools of Hawaii Foundation for his leadership and commitment to improving public education in Hawaii. Mr. Oshima chairs Hawaii 3Rs, a nonprofit organization that facilitates public-private partnerships to repair, restore and remodel Hawaii’s public schools. He serves as a director of the Hawaii Institute of Public Affairs where he’s helped lead an initiative to form a public school land trust to rebuild and upgrade school facilities across the state. Mr. Oshima also serves as a member of the Governor’s Every Student Succeeds Act (ESSA) Team. He is also a longtime volunteer and former chairman of the board for the YMCA of Honolulu and previously served on the board of advisors for The Learning Coalition. Mr. Oshima also served as one of the six Hawaii Commissioners on the national Education Commission of the States. A graduate of Farrington High School, Mr. Oshima received a marketing degree from Northwestern University and a Law Degree from University of California, Hastings College of the Law. He also served as a Supply Corps Officer with the U.S. Navy and among other places was stationed in Pearl Harbor and San Diego.
ii

Richard F. Wacker American Savings Bank, F.S.B. President and Chief Executive Officer Mr. Wacker was named President and Chief Executive Officer of ASB in November 2010 and serves on the ASB Board. Prior to joining ASB, Mr. Wacker was Chairman of Korea Exchange Bank (KEB), the fifth largest commercial bank in Korea and the largest foreign exchange bank in the country. He joined KEB in 2004 as Chief Operating Officer and was appointed President and CEO in 2005. At KEB he held the position of Chairman of the Board from 2007 through 2010. Mr. Wacker established the KEB Foundation, the first non-profit foundation in the Korean financial industry. An active supporter in the community, Mr. Wacker holds leadership positions in Hawai‘i, serving on several prominent boards including, Child & Family Services (Chair), Hawaii Business Roundtable (Executive Committee), Chaminade University (Board of Regents), University of Hawai‘i—Pacific Asian Center for Entrepreneurship, University of Hawai'i Foundation (Vice-Chair), University of Hawai‘i—XLR8UH accelerator program and the Hawaii Bankers Association. Mr. Wacker has served as a board member for the Hawai‘i Chapter of the American Red Cross, director for Junior Achievement Korea and as a member of the Board of Governors of the American Chamber of Commerce in Korea. In 2008, Mr. Wacker was recognized as one of Korea’s “Most Respected CEOs.”
Prior to joining KEB, Mr. Wacker had a 20-year career with General Electric (GE) where he was a company officer and held a wide range of senior leadership positions at GE and GE Capital in the United States and Europe. Mr. Wacker earned a Bachelor of Science degree in Mechanical Engineering from the University of Missouri.
iii

Greg C. Hazelton Hawaiian Electric Industries, Inc. Executive Vice President and Chief Financial Officer Mr. Hazelton was appointed HEI’s Executive Vice President and Chief Financial Officer (CFO) in April 2017, after serving as Senior Vice President, Finance beginning in October 2016. Mr. Hazelton was NW Natural Gas Company’s (NW Natural) Senior Vice President and CFO from June 2015 to September 2016 and also served as its Treasurer from March to September 2016. Before joining NW Natural in June 2015, Mr. Hazelton was Vice President of Finance, Treasurer and Controller at HEI from August 2013 to June 2015. Prior to joining HEI in 2013 he held a number of positions over a thirteen year career in investment banking, most recently as a Managing Director with UBS Investment Bank’s Global Power and Utilities Group until May 2013. Mr. Hazelton also held various operational, SEC financial reporting and accounting, financial forecast and analysis, and business development positions at energy companies, including Portland General Electric, from 1989 to 1999. Mr. Hazelton received a Bachelor of Science degree from Warner Pacific College and an MBA from the University of Chicago Graduate School of Business. He received his CPA (currently inactive) from the State of Washington.
iv

Clifford H. Chen Hawaiian Electric Industries, Inc. Treasurer, Manager of Investor Relations and Strategic Planning Mr. Chen joined HEI in June 2014. Mr. Chen has a strong investment banking/corporate financial markets background, having worked for approximately ten years at UBS Securities, Bank of America and Merrill Lynch in New York, where he focused on investment banking, advisory and M&A for financial institutions. Prior to his investment banking career, he practiced corporate and securities law at Wilson Sonsini in Palo Alto, CA. Mr. Chen earned his undergraduate degree from Harvard University, a JD from the University of Michigan and an MBA from the University of Chicago Graduate School of Business. He is an inactive member of the California Bar Association.
v

Julie R. Smolinski Hawaiian Electric Industries, Inc. Director, Investor and Strategic Projects Ms. Smolinski joined HEI in 2011, spending several years as in-house counsel focused on transactions, governance and general corporate practice before joining the Investor Relations and Strategic Planning team. Prior to HEI, Ms. Smolinski practiced corporate law at Goodsill Anderson Quinn & Stifel in Honolulu, HI and WilmerHale in Palo Alto, CA. Ms. Smolinski also has previous experience in public affairs with the U.S. Department of State and Powell Tate in Washington, DC. Ms. Smolinski earned her undergraduate degree from Wellesley College, a JD from Stanford University and an Executive MBA from the University of Hawaii.
vi

Non-GAAP financial information This presentation refers to certain financial measures that were not prepared in accordance with U.S. generally accepted accounting principles (GAAP). For reconciliations of such non-GAAP financial measures to the most directly comparable GAAP financial measures, see the Appendix that follows this presentation. Core results referred to in this presentation are non-GAAP financial measures. Core results exclude items relating to the terminated merger with NextEra Energy, Inc. and the associated cancellation of the spin-off of American Savings Bank, F.S.B. and termination of a Hawaiian Electric Company, Inc. liquefied natural gas (LNG) contract; in addition, 2017 core results exclude the impact of the federal tax reform act due to the adjustment of deferred tax asset balances and a one-time employee bonus paid by the bank related to federal tax reform.
Cautionary statements and risk factors that may affect future results This presentation includes forward-looking statements within the meaning of the federal securities laws. Actual results could differ materially from such forward-looking statements. The factors that could cause actual results to differ are discussed in the Appendix that follows this presentation and in HEI’s SEC filings.
1

Company Overview Providing essential electric and financial services ensuring a brighter and greener future for the communities we serve
2

Data above as of 12/31/17 unless otherwise indicated 1 Based on 2017 core earnings and excludes other companies’ net loss. See the reconciliation of GAAP to Non-GAAP (Core) measures in this presentation. 2 Market capitalization, total enterprise value and dividend yield are based on the closing price of $33.20 on 2/21/18 3 Total enterprise value is calculated as market capitalization plus debt and preferred stock, less cash (excluding cash of American Savings Bank)
Market capitalization2 $3.6B
Total enterprise value2, 3 $5.4B
Capital structure: consolidated common equity to total capitalization 53%
2017 consolidated GAAP ROE / CORE ROE 7.9% / 8.6%
Dividend yield2 3.7%
2017 dividend payout ratio 82%
5-year total return (CAGR%) for period ending 12/31/17 12.2%
HE is included in the following indices: S&P Mid-Cap 400, Russell 1000
HEI profile Subsidiary contributions
to net income1
Utility 66%
Bank 34%
3

Through our operating subsidiaries, we have a presence on all major islands in Hawaii
3 Kauai
Oahu
Molokai Maui
Hawaii
Maui Electric Customers: 71,352 Generating capability: 268 MW Rate base: $0.45B Renewable generation1: 34% 35
1
6
5
Hawaii Electric Light Customers: 85,925 Generating capability: 182 MW IPP firm contract power: 95 MW Rate Base: $0.50B Renewable generation1: 57%
Hawaiian Electric Customers: 304,948 Generating capability: 1,222 MW IPP firm contract power: 457 MW Rate Base: $2.03B Renewable generation1: 21%
Lanai
Note: All data as of 12/31/17 unless otherwise noted 1 As a percentage of total sales
Utility locations
Bank branches
Bank branches
Project locations
4
1

Hawaii’s economy continues to grow
Real State GDP
Year-over-year change December 2017 2017
Arrivals +6.3% +5.0%
Expenditures +2.9% +6.2%
• Oahu sales volume: • 2017: single family homes up 6.3%, condominiums up 6.9% vs 2016 • Jan. 2018: single family homes up 2%, condominiums down 1.1% vs Jan. 2017
• Jan. 2018 Oahu median sales prices: • Single family homes: $772,000, up 5.8% from the prior year • Condominiums: $430,000, up 13.2% from the prior year
• December 2017 – Hawaii: 2.0%; U.S.: 4.1%
Sources: Department of Business, Economic Development and Tourism, U.S. Bureau of Labor Statistics, State of Hawaii Department of Labor and Industrial Relations, Title Guaranty Hawaii.
• Expected to increase 1.7% in 2018
Tourism
Unemployment
Real Estate
5

$48.7
($21.7)
$60.3 ($6.0)
($11.7) ($15.7)
$57.3
$67.0 $1.0
$57.3 $66.0
$142.3
$120.0
($2.1) ($9.2)
$144.5 $129.1
$248.3
$165.3
$58.2
($14.2)
$190.1 $179.5
2016 2017 2016 2017 2016 2017
2017 Consolidated Results ($ millions / $/share)
GAAP Core
Utility Bank Holding Co. & Other Note: Columns may not foot due to rounding. See the reconciliation of GAAP to Non-GAAP (Core) measures in this presentation. * Holding company results reflect ~$2 million adjustment to tax benefits in 4Q 2016 and ~$4 million favorable tax benefits in the full year 2016 as HEI moved out of a federal net operating loss position.
*
*
Non-Core Adjustments 2017: federal tax reform
2016: merger/spin related
6
$0.45 ($0.20)
$0.56 ($0.11) ($0.14)
$0.53
$0.62
$0.01
$0.53 $0.61
$1.31
$1.10
($0.02) ($0.08)
$1.33 $1.19
$2.29
$1.52
$0.54
($0.13)
$1.75 $1.65
($0.05)
Net Income
EPS

Overall, tax reform a net positive moving forward
Hawaiian Electric
American Savings Bank
Holding Company and Other
Consolidated Enterprise
($9.2) million • Reduction of net deferred tax
asset
$1 million • Reduction of deferred tax liability • Net of one-time non-executive
employee bonus
($6) million • Reduction of deferred tax asset
($14.2) million
• Benefits from lower tax rates to flow to customers • Loss of bonus depreciation increases need for financing of capex
and should incrementally increase rate base going forward • Domestic Production Activities Deduction (DPAD) repealed and
Contributions in Aid of Construction (CIAC) exclusion eliminated • Exempt from limit on deductibility of interest
• Net income increases with lower tax rate • Marginally higher cost structure due to compensation increases • Higher earnings increase capacity for dividends to holding company
• Net loss increases with lower tax rate • As consolidated taxpayer with subsidiaries, bank’s net interest
income position offsets holding company’s net interest expense
• Modest impact due to elimination of performance-based compensation deduction under 162(m)
• Consolidated impact expected to be a net positive
2017 one-time adjustments Primary ongoing impacts
Pacific Current None • Earnings subject to lower tax rates • Higher dividend to holding company than would otherwise occur
7

9.5% (Core)
12.4% (GAAP)
2016 2017
7.9% (GAAP)
Consolidated HEI ROE
Twelve Months Ended December 31
See the reconciliation of GAAP to Non-GAAP (Core) measures in this presentation. Note: All ROEs calculated using net income divided by average GAAP common equity, simple average method
Core Earnings Adjustment
2016 2017
Utility GAAP 8.1% / Core 8.2% GAAP 6.6% / Core 7.1%
Bank 10.1% 11.3%
HEI ROE
8.6% (Core)
8

2017 Highlights 2017 core financial results in line with full year expectations
9
Strong financial performance Higher net interest income Strong deposit growth Improving efficiency and credit
quality Construction of new campus
well underway
Returning to triennial rate case cycle Progressing foundational
framework for 100% renewable future Increasing renewable resource
integration New customer options for
renewable participation
Newly formed subsidiary focused on clean energy and sustainability investments Completed first acquisition Under contract for second
project, which will provide solar plus storage for multi-site commercial scale system

Progress is being made at a rapid pace
Interim D&O in Hawaii Electric Light 2016 TY Rate Case effective 8/31/17
Authorizes start of process to procure 370 MW of renewables
Interim D&O in Hawaiian Electric 2017 TY Rate Case
Accepts Power Supply Improvement Plan
Hawaiian Electric issues real estate master plan RFP
Hawaiian Electric files final draft RFPs for state’s largest ever renewables procurement
July August October
Approves community solar program
December
Maui Electric files 2018 TY Rate Case
Approves PPAs for 3 solar projects and for biomass plant
January February 2017 2018
PUC
Dec
isio
ns
Oth
er D
evel
opm
ents
Approves demand response management system implementation
Approves new rooftop solar and battery storage programs
• Key PUC decisions issued at increased pace • Entering 2018 with momentum toward renewable goals
Maui Electric announces PPA for Molokai solar plus battery storage project
Hawaiian Electric confirms $244 million customer benefit commitment from ERP/EAM1 project
Approves expanded demand response program portfolio and revised tariff structure
Approves implementation of grid modernization strategy
Grants Hawaiian Electric’s motion for partial reconsideration of 2017 TY Rate Case interim D&O; interim rates effective 2/16/18
Hawaiian Electric announces 19% increase in solar (distributed and grid-scale) in 2017
Hawaiian Electric files estimated tax reform benefits to flow to customers 1 Enterprise Resource Planning/Enterprise Asset Management
Hawaiian Electric files innovative dispatchable renewable PPA
10

2017 rates and recovery mechanism developments Hawaii Electric Light
2016 Rate Case (Docket No. 2015-0170)
Interim Decision and Order (D&O) effective Aug. 31, 2017 Rate increase of 3.4% ($9.9 million) Allowed ROE of 9.5%
Hawaiian Electric (Oahu) 2017 Rate Case
(Docket No. 2016-0328) (Order No. 35220)
Interim D&O received Dec. 15, 2017 effective February 16, 2018 Rate increase of 2.3% ($36.0 million) Allowed ROE of 9.5% March 2018: Evidentiary hearings on remaining issues
Maui Electric 2018 Rate Case
(Docket No. 2017-0150)
Oct. 12, 2017: Filed 2018 test year rate case Requested 9.3% rate increase ($30.1 million) and ROE of 10.6% May 2018: Filing of Joint Settlement Letter; July 2018: Evidentiary Hearings; August 2018: Interim decision expected
Major Projects Interim Recovery (MPIR) Adjustment
Mechanism
Requested recovery via MPIR of the following projects: Schofield Barracks 50 MW Generating Station: expected in service in 2Q 2018 West Loch Annex at Joint Base Pearl Harbor-Hickam 20 MW Solar Facility: expected in service 4Q 2018
Performance Incentive Mechanisms (PIMs)
Sep. 2017: PIM tariffs effective Jan. 1, 2018 System Average Interruption Duration Index (penalties only) and System Average Interruption Frequency Index (penalties
only); approx. $6.2 million max penalty combined for all three utilities Call Center Performance (penalty or incentive); approximately $1.2 million maximum penalty or incentive in total for all
three utilities First reward or penalty to be incorporated in 2019 annual decoupling filing
In demand response proceeding PUC established 5% PIM to encourage rapid enrollment
Tax Reform Act
Jan. 31, 2018: Filed estimated tax reform benefits Working with PUC on plan to flow net tax reform benefits to customers
11

Key developments in renewables, customer programs Power Supply Improvement
Plan (PSIP) Update (Docket No. 2014-0183)
Comprehensive and flexible roadmap for Hawaii’s 100% renewable future Details a proposed five-year action plan through 2021 Accepted July 2017
Grid Modernization Strategy (Docket No. 2016-0226)
Tangible vision developed with stakeholders for building more resilient and renewable-ready island grids Approved for implementation February 2018
Resource Acquisition
Utility authorized to open competitive bidding process for state’s largest ever renewable procurement, including storage Process includes innovative renewable dispatchable generation PPA: Allows utility greater dispatch flexibility, provides
more economic certainty for IPPs and maximizes value for customers Targeting 370 MW of renewables, including 40 MW of firm generation, through 2022 Filed final draft RFPs for PUC approval of variable generation on Oahu, Maui and Hawaii Island in February 2018
Demand Response (DR)
DR enables customer resources (water heater, air conditioner, storage, EV, etc.) to help integrate more renewable
resources on the grid while maintaining grid stability and reliability In January 2018, PUC approved the Companies’ expanded DR portfolio and tariff structure To implement DR Portfolio, PUC approved surcharge recovery reconciled quarterly until costs included into base rates Established 5% PIM capped at $500,000 in 2018 to encourage rapid enrollment
Community Based Renewable Energy (CBRE)
Approved by PUC Utility filed tariffs February 20, 2018 Phase 1: 8 MW of capacity, utility to play an administrative role only; credit rates range from 15 cents/kwh (Oahu and
Hawaii Island) to 26 cents/kwh (Lanai) Phase 2: 64 MW of capacity, of which 9 MW allocated to utility to develop; Phase 2 will commence upon PUC order after
review of Phase 1 results
12

2017 saw continued strong increase in solar, up 19% from 2016
Grid-scale and distributed solar growth
Company ended year with 695 MW of solar on grid 19% increase from 2016 includes additions of grid-scale and private rooftop solar Biggest increase in solar in 5 years, reduces annual oil consumption by 300,000 barrels 17% of residential customers now have rooftop solar, compared to 1% nationally 30% of single family homes on Oahu have installed private solar 135 MW of new grid-scale solar to come online through 2019
New options for residential solar
Smart export program for rooftop solar plus battery
Option to export power to grid during non-daylight hours at rates based on average marginal cost (~15 cents/kWh on Oahu, credit varies by island)
Customer Grid Supply Plus without energy storage Option to export power to grid during the day at rates based on average on-peak avoided cost (10.08 cents/kWh on Oahu; credit varies by island)
Other customer service enhancements
Introduced new mobile app, including outage map and platform for future enhancements Introduced first-of-its-kind online private rooftop solar interconnection tool, enabling customers to
complete paperwork online, sign documents and check status of applications
Electric vehicle growth remains strong
Hawaii 2nd in nation in electric vehicle sales per capita City & County of Honolulu U.S.-manufactured electric bus demonstration ongoing All county mayors have committed to 100% renewable fuel sources for ground transportation by
2045
13

National leader in renewable energy integration and distributed generation
Committed to achieving Hawaii’s 100% renewable goal by 2045
-
200
400
600
800
1,000
1,200
2008 2009 2010 2011 2012 2013 2014 2015 2016 2017
Renewable Energy incl. Solar
Renewable Energy excl. Solar
MW
Rapid growth of renewables, especially solar
Renewable energy amounts reflect firm generated and contracted capacity Renewable Energy incl. Solar includes Net Energy Metering (NEM), Standard Interconnection Agreements (SIA), Feed-in-Tariff (FIT), Purchase Power Agreement (PPA), Smart Power for Schools (SmPS), and utility owned
1 Electrical energy generated using renewable resources as a percentage of total sales
Energized Solar PV 2008 2014 2015 2016 2017
PV Systems 850 ~50K ~60K ~70K ~74K
Megawatts 12 389 487 586 695
2017 Renewable Portfolio Standard1
Consolidated Oahu Maui County Hawaii Island
27% 21% 34% 57%
16% of all customers and 17% of residential customers had installed solar PV as of 4Q17
14

0.00
0.05
0.10
0.15
0.20
0.25
0.30
0.35
0.40En
ergy
Cos
t ($/
kWh)
Utility fossil fuel energy cost Contracted renewable energy cost
Oil
Pre-2016 PPAs
Renewable energy can be cost competitive in Hawaii depending on oil price volatility
* In June 2017, the Hawai‘i Public Utilities Commission (PUC) approved the 20 MW solar energy facility at Joint Base Pearl Harbor-Hickam, West Loch, the lowest cost renewable energy in the state at 9.56 cents per kWh or lower
In July 2017, the PUC approved the purchase power agreements with NRG Energy for 3 solar plants: (i) 14.7 MW (11.4 cents/kWh), (ii) 45.9 MW (10.4 cents/ kWh); and (iii) 49 MW (which would be the state’s largest) (10.99 cents/kWh); pricing includes the Hawaii State Tax Credit
** Represents the revised contract with Hu Honua at 22.1 cents/kWh as approved by the PUC *** The 2011 fuel oil increase was largely driven by the nuclear disaster of the Fukushima power plant in March 2011, which increased price of oil in Hawaii as our fuel oil purchases are largely driven by the Asia
Pacific market
Wind
Solar
2016+ PPAs Proposed and Approved
Subject to volatile oil prices Significant reduction in cost of utilty-scale renewables*
12/2011***
12/2010 12/2017 Biomass**
15

Oil is the primary driver of rates in Hawaii
1 Hawaiian Electric Oahu average revenue per kWh sold 2 Based on the February 2018 energy cost adjustment filing for residential customers only
6.1 6.6 7.5 7.9 8.5 8.7 8.8 8.8
2.2 2.1 2.3 2.3 2.4 2.3 2.5 2.5
0.4 0.7 0.8 0.9 1.1 1.1 1.2 1.3
2.1 2.7
3.0 2.9 3.0 2.3 2.1 2.3
3.1 4.4
4.6 4.5 4.4
3.1 2.8 3.1 8.7
12.6
13.5 12.4 12.1
6.8 4.6
6.2 22.6
29.1
31.8 30.9 31.5
24.3
22.0 24.3
28.0
0
5
10
15
20
25
30
35
40
2010 2011 2012 2013 2014 2015 2016 2017 Feb-18
¢/kW
h
Breakdown of Hawaiian Electric Rates1
(typical residential bill)
FuelPurchased Energy Fossil FuelsRevenue TaxesPurchased Energy RenewablesPPAC ExpensesAll Other
2
December 2010
$133.22
Components (~45.7%) largely driven by oil
December 2013
$173.33
December 2017
$141.82
February 2018
$150.24
16

HAWAII OIL PRICES HAWAII OIL PRICES
HAWAII OIL PRICES
Hawaii’s oil situation Low Sulfur Fuel Oil vs. Crude Oil
December 2011 to December 2017 Price per bbl
Hawaii oil prices based on Hawaiian Electric low sulfur fuel oil inventory prices Crude oil prices based on West Texas Intermediate (WTI)
HAWAII OIL PRICES HAWAII OIL PRICES
HAWAII OIL PRICES
$25
$45
$65
$85
$105
$125
$145
CRUDE OIL PRICES
HAWAII OIL PRICES
17

$2,750 $2,972
$3,200 $3,300 $3,500
$60 $150
$200
$1,500
$2,000
$2,500
$3,000
$3,500
$4,000
2016 2017 2018 2019 2020
$3,700
2016 2017 2018 2019 2020
Rate Base Growth2 4% 5% 8-10% 4-7% 5-8% RAM Plant Addition Cap ~$275 ~$275 ~$275 Capex (net of CIAC) $318 $401 $450 $400-500 $400-500 Major Capex Projects
[50 MW] • Schofield 1 $34 $83 $26 -- -- • ERP1 -- 29 31 -- -- [20 MW] • Joint Base Pearl Harbor PV 1 -- 6 56 -- -- • Other Projects -- 19 43 29 42
Clean and reliable energy the primary driver of our capital investment strategy
$3,260 $3,450
= Top of Range = Bottom of Range
Year End Rate Base Forecast
1 Schofield Generating Station (Schofield), Enterprise Resource Planning (ERP) system, and Joint Base Pearl Harbor PV forecasted to be placed into service in 2018 2 Rate base is impacted primarily by plant additions but also includes other items (i.e., unamortized contributions in aid of construction, accumulated deferred income taxes, certain regulatory assets, etc.)
(in millions)
Projects pending application under PSIP and grid modernization
strategy
18

8.1% (GAAP) 6.6%
(GAAP)
8.2% (core)
2016 2017
Consolidated Utility Hawaiian Electric Hawaii Electric Light Maui Electric
2016 GAAP 8.1% 8.3% 7.3% 8.1%
2017 GAAP 6.6% 6.5% 7.0% 6.8%
Allowed1 9.8% 10.0% 10.0% / 9.5% 9.0%
Note: Last base revenue increase: Hawaiian Electric: 2017 test year (interim D&O eff. 2/16/18); Hawaii Electric Light: 2016 test year (interim D&O eff. 8/31/17); Maui Electric: 2012 test year Note: All ROEs calculated using net income divided by average GAAP common equity, simple average method 1 Based on regulatory calculation. Hawaiian Electric and Maui Electric Allowed ROEs reflect Public Utilities Commission decisions in effect on December 31, 2017. Due to the interim D&O effective 8/31/17 in the
Hawaii Electric Light 2016 test year rate case, in 2017 Hawaii Electric Light had eight months of 10.0% and four months of 9.5% Allowed ROE.
Consolidated Utility ROE
Twelve Months Ended December 31, Utility ROE
7.1% (core)
19

9.3
2017 consolidated utility ROE lag
20

$57.3 $67.0
2016 2017
Bank net income (millions) Key bank earnings drivers, after-tax fav/(unfav)
2017 vs
2016
Net interest income 11
Provision for loan losses 4
Noninterest income (3)
Noninterest expense, excluding tax reform related bonuses
(3)
Federal tax reform impact net of related bonuses 1
Bank achieved strong financial results in 2017
21
Driven by higher net interest income, lower provision and net positive impact of tax reform Well positioned to continue solid results in 2018 and benefit from tax reform
+17%

Certificates of Deposit 16
Other Liab. 11
Loans 72
Other 11
Investment Securities
17
Core Deposits 62
Equity 11
Core Deposits 76
Certificates of Deposit 11 Other Liab. 4
Equity 9
Loans 68
Other 9
Investment Securities
23
Overall loan-to-deposit ratio of 79% 100% of ASB loans funded with low-cost core deposits
09/30/17 (%)
Peer Banks1
Peer median of avg yield on earning assets 3Q17: 4.04% Peer median of avg cost of funds 3Q17: 0.56%
Source for peer data: SNL Financial (based on data available as of February 21, 2018) 1 Peer group based on publicly traded banks and thrifts between $3.5B and $8B in total assets. See ASB Peer Group - 2017.
Quality balance sheet
Avg yield on earning assets 4Q17: 3.88% Avg cost of funds 4Q17: 0.21%
12/31/17 (%)
ASB
Leverage ratio: 8.6% Tangible common equity to tangible assets: 7.8% Total capital ratio: 14.2%
22

Residential 1-4 $2,118 (45%)
HELOC $913 (20%)
Consumer $224 (5%)
Residential Construction & Lot Loans $31 (<1%)
Commercial markets $545 (12%)
Commercial real estate $733 (16%)
Commercial construction $108 (2%)
Low-risk loan mix
Total loans at 12/31/17 - $4.7B1
Note: $ in millions, unless otherwise noted 1 Before deferred fees, discounts and allowance for loan losses 23
4Q16 3Q17 4Q17
$4,744
$4,891 $5,044 $5,124
$658 $708 $767
4Q16 3Q17 4Q17Core Time
$5,752 $5,891
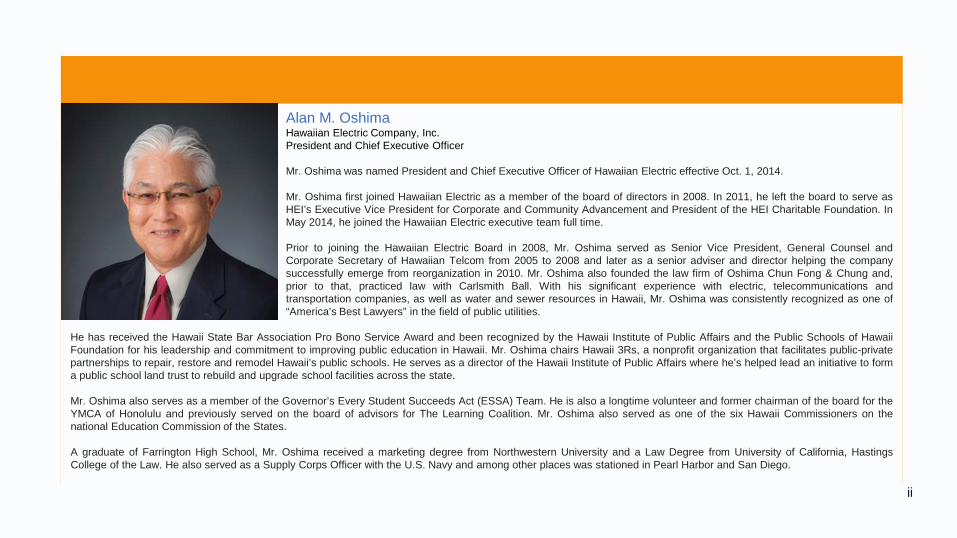
Revenue growth driven primarily by net interest income ($ in millions)
Total loans
$5,892 $5,992 $6,089 $6,063 $6,174
Total deposits
$53.0 $54.8 $56.0 $56.2 $57.0
$16.4 $15.1 $16.2 $15.2 $15.0
4Q16 1Q17 2Q17 3Q17 4Q17
Net interest income Noninterest income
$72.2 $69.4
Average Interest-Earning Assets
Net interest income and noninterest income
$5,549
$4,678
$71.4 $4,672
$72.0 $69.9
2016 2017
Net Interest Income Non Interest Income
206.2 67.0 273.2
224.0 61.5 285.5
24

Pacific Current provides new growth platform
25
• Non-regulated platform for clean energy and sustainability investments • Focused on projects consistent with investment grade profile
Acquired Hamakua Energy Plant, Hawaii Island Awarded and contracted for multi-site, commercial scale solar plus storage project
• Critical dispatchable generating resource as island transitions to 100% renewable energy by 2045
• Contracted cash flows and non-recourse financing support investment grade profile
• Accretive from outset, expected to continue over contract life
• Evaluating potential to use biofuel and options for unused land/transmission interconnection next to plant
• Selected in competitive process
• Contracted cash flows and non-recourse financing support investment grade profile
• Investment-grade counterparties
• Accretive first full year post COD; increasingly accretive thereafter
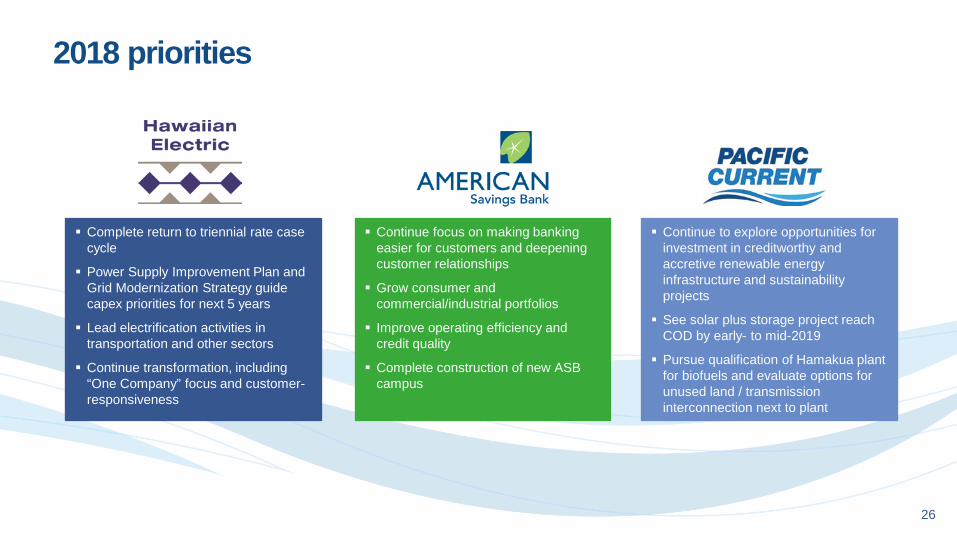
2018 priorities
Complete return to triennial rate case cycle
Power Supply Improvement Plan and Grid Modernization Strategy guide capex priorities for next 5 years
Lead electrification activities in transportation and other sectors
Continue transformation, including “One Company” focus and customer-responsiveness
Continue focus on making banking easier for customers and deepening customer relationships
Grow consumer and commercial/industrial portfolios
Improve operating efficiency and credit quality
Complete construction of new ASB campus
Continue to explore opportunities for investment in creditworthy and accretive renewable energy infrastructure and sustainability projects
See solar plus storage project reach COD by early- to mid-2019
Pursue qualification of Hamakua plant for biofuels and evaluate options for unused land / transmission interconnection next to plant
26

HEI 2018 EPS guidance (as of February 14, 2018)
HEI EPS: $1.80 - $2.00 per share
Key Assumptions: No change to decoupling or recovery mechanisms O&M1: forecasted at 2% above 2017 levels, excluding pension Fuel efficiency: similar to rate case levels, subject to changes due
to demands on the system Rate base growth: 8% - 10% based upon 2018 capex of $450
million Equity capitalization: currently implemented rate case levels LT debt: ~$150 million of new issuances to support capex plan
Key Assumptions: Low to mid-single digit asset growth NIM: ~3.7% to 3.8% Provision expense: $14 million to $18 million ROA > 1.10%
Utility EPS: $1.33 - $1.46 Bank EPS: $0.68 - $0.74
Note: Holding company & other net loss estimated at $0.19 - $0.21 1 Excludes operations and maintenance (O&M) expenses covered by surcharges or by third parties that are neutral to net income Reference the cautionary note regarding forward-looking statements (FLS) accompanying this presentation which provides additional information on important factors that could cause results to differ. The company undertakes no obligation to publicly update or revise FLS, including EPS guidance, whether as a result of new information, future events, or otherwise. See also the FLS and risk factors in HEI’s SEC Form 10-Q for the quarter ended September 30, 2017 and 2017 SEC Form 10-K, when filed.
No new equity issuances through 2018
27

HEI financing outlook 2018 (as of February 2018)
External Dividends $135
HEI Investments in
Utility $132
Debt Maturities $50
Other HC Exp. $20
ASB Dividends $44
Utility Dividends $103
Debt Issuance/cash
reduction $190
Uses Sources
~$337M ~$337M
2018 holding company sources & uses of capital (in millions)
Intend to maintain a
consolidated investment grade profile
28

Appendices
29

Tax Reform Act Impacts
Tax Rate Reduction to 21%
We expect benefit pass-through to utility customers in near- to mid-term / Negative cash flow impact Filed estimated tax benefit with PUC on January 31; working with Consumer Advocate and the PUC on amount
and timing of customer give-backs Deferred taxes now at lower 21% rate, established regulatory liability to customers for excess deferreds
Deferred tax asset write-downs impacting net income in 2017 More of Pacific Current’s earnings to flow to bottom line going forward Holding company net loss will increase with lower tax rate beginning 2018
Immediate Expensing and Bonus Depreciation
Regulated public utilities do not qualify for immediate expensing / bonus depreciation Will increase need for financing of capital expenditures
For non-utility entities: Bonus depreciation expands to used property acquisitions and will start phasing out in 2023 20% each year
Lower growth of deferred income tax offsets will incrementally increase rate base and should have positive net income effects longer-term
Tax Deductibility of Interest Expense
Operating utilities exempt from limits on deductibility of interest expense to 30% of adjusted taxable income HEI (consolidated tax payer with subsidiaries) however protected by net interest income from Bank
Other Utility Impacts
Tax credits for solar and wind developments continue but maintains sunsetting Reduces deduction of NOLs; Can carry forward indefinitely but carry back eliminated Domestic Production Activities Deduction (DPAD) repealed and Contributions in Aid of Construction (CIAC)
exclusion eliminated Elimination of deductibility for performance-based compensation (162(m)) incrementally reduces net income
Tax Impact on Bank
Financial impact on Bank is long-term positive Benefits substantially drop to bottom line Bank is in deferred tax liability position and lower tax rate results in income gain and greater equity position Bank can take advantage of immediate expensing of capital expenditure (i.e., campus items < 20 yr life) Bank giveback to employees in form of $1000 per non-executive employee and increase in minimum wage and
elevated pay scale through organization Earnings improvement increases bank capacity for dividends to holding company
General economic impact could be beneficial for loan growth opportunities Some concern of increased pricing competition for loans and deposits
30

HEI financial performance 5-Year EPS CAGR:
GAAP 1.4% / Adjusted 3.0%1
Diluted Earnings Per Share (EPS)
Net Income (in millions)
1 2014, 2015 and 2016 include $5M (~5 cents) net expense, $16M (~15 cents) net expense and $58M (~54 cents) net income, respectively, of merger, terminated LNG and spin-off items after-tax; 2017 includes ~$14M (~13 cents) reduction for federal tax reform and related impacts. See the reconciliation of GAAP to Non-GAAP measures in the Appendix.
GAAP Tax Reform; Merger-Spin Adjusted
Net Income (GAAP) $139 $162 $168 $160 $248 $165
Net Income 2017 Tax Reform Adjusted & 2014-2016 Merger-Spin Adjusted
$173 $176 $190 $179
ROE (GAAP) 8.9% 9.7% 9.6% 8.6% 12.4% 7.9%
Dividend Payout (GAAP) 87% 76% 75% 82% 54% 82%
$1.42 $1.62 $1.63
$1.50
$2.29
$1.52
$1.68 $1.65 $1.75 1.65
$0.00
$0.50
$1.00
$1.50
$2.00
$2.50
$3.00
$0
$50
$100
$150
$200
$250
$300
2012 2013 2014 2015 2016 2017
31

$34.1 $34.5
$144.5 $129.1
$0
$20
$40
$60
$80
$100
$120
$140
$160
4Q16 4Q17 2016 2017
Utility Core net income Key utility core earnings drivers, after-tax fav/(unfav)
4Q17 vs
4Q16
2017 vs
2016
Expiration of the Oahu RAM settlement Higher (lower) RAM revenues Hawaii Electric Light 2016 interim increase Other Net revenues*
-- 2
1 (1) 2
(11) 6
2 (2) (5)
O&M, excluding net income neutral items (3) (11)
Allowance for funds used during construction 2 5
Depreciation (1) (3)
Other 1 (1) *Net revenues is “Revenues” less the following expenses: “fuel oil,” “purchased power,” and “taxes, other than income taxes”
2017 utility financial highlights (in millions)
Note: Columns may not foot due to rounding. See the reconciliation of GAAP to Non-GAAP (Core) measures in this presentation.
32

Accelerates achievement of key milestones, including reaching a 48% Renewable Portfolio Standard1 by 2020; mandated goal is 30%
Anticipates reaching 100% Renewable Portfolio Standard1 by 2040, 5 years ahead of mandate Describes a greater and faster expansion of the companies’ renewable energy portfolio than in the
previous plan filed in April 2016 Plan stresses the need to stay flexible and not crowd out future technological advances Focus on near-term actions (2017 - 2021) Near-term plans to incorporate Distributed Energy Resources, Community-Based Renewable Energy,
Demand Response and Energy Efficiency programs Includes continued growth of private rooftop solar to an estimated total of 165,000 private systems by
2030, more than double 2016’s total of ~79,000 Includes an addition of ~360 megawatts of grid-scale solar, ~157 megawatts of grid-scale wind and
~115 megawatts from Demand Response (DR) programs Describes grid and generation modernization work needed to reliably integrate renewable energy
resources while strengthening resilience By March 1, 2018, the utilities must file with the PUC a report that details their planning approach and
schedule for the next round of resource planning
Power supply improvement plan (PSIP) update Hawaii PUC Docket No. 2014-0183 (closed) Accepted on July 14, 2017
1 Electrical energy generated using renewable resources as a percentage of total sales 33

Implementation of grid modernization strategy approved by PUC February 2018, with project applications to follow
Customer and stakeholder engagement used to define grid modernization goals; engagement to continue as implementation applications developed
Enables grid to interconnect DER levels consistent with the accepted PSIP Provides customer choice through DER options and customer portal Uses new technologies to increase utilization of DER while improving reliability and resiliency of the grid $205 million in upgrades and enhancements to the grid over the next six years included in current capex
forecast Related upcoming filings include plan for executing near-term roadmap and proposed integrated grid-
planning process
Grid Modernization Strategy update Hawaii PUC Docket No. 2017-0226
34

Utility regulatory mechanisms provide financial stability during renewable transition
Mechanisms What they do
Sales decoupling Provides predictable revenue stream by fixing net revenues at level approved in last rate case (revenues not linked to kWh sales)
Revenue adjustment mechanism (RAM)
Annually adjusts revenue to recover general “inflation” of operations and maintenance expenses and baseline plant additions between rate cases
Major Projects Interim Recovery adjustment mechanism (MPIR)
Permits recovery through the RBA of costs (net of benefits) for major capital projects including but not restricted to projects to advance transformational efforts
Energy cost and purchased power adjustment clauses
Allow recovery of fuel and purchased power costs
Pension and post-employment benefit trackers
Allow tracking of pension and post-employment benefit costs and contributions above or below the cost included in rates in a separate regulatory asset/liability account
Renewable energy infrastructure program
Permits recovery of renewable energy infrastructure projects through a surcharge
35

1. Sales decoupling via a Revenue Balancing Account (RBA)
Delinks utility revenues from electricity usage GAAP revenue = revenue approved in the last rate case (interim or final)
Recorded revenues adjusted monthly in the RBA
Target (decoupling) revenues will be allocated as follows:
On a cash basis, RBA annually trued-up in rates beginning June of the following year; interest recorded monthly by multiplying average of beginning and ending month balance in RBA net of deferred tax times (1.75% for Hawaiian Electric, 3.25% for Hawaii Electric Light, 1.25% for Maui Electric) divided by 12
Components
1Q 2Q 3Q 4Q
Hawaiian Electric (prior to 2017TY interim) 23.46% 24.75% 26.49% 25.30%
Hawaiian Electric (after 2017TY interim) 23.88% 24.45% 26.29% 25.38%
Hawaii Electric Light (prior to 8/31/17) 24.23% 24.54% 25.87% 25.36%
Hawaii Electric Light (8/31/17 thereafter) 24.74% 24.45% 25.61% 25.20%
Maui Electric 23.92% 24.77% 26.21% 25.10%
Components of decoupling Hawaii PUC Docket No. 2008 - 0274 Hawaii PUC Docket No. for the decoupling review: 2013 - 0141
36

2. RAM Revenue Adjustment Allowed
(Order No. 32735*)
Lesser of: 2a - RAM Revenue Adjustment based on the RAM provisions in place prior to Order No. 32735** -or- 2b - RAM Revenue Adjustment Cap (“RAM Cap”)
2a. RAM Revenue Adjustment Determined According to Tariffs and Procedures Prior to Order No. 32735 (2 components)
Base Expenses (O&M) – Component 1 Base expenses = expense levels in the last approved rate case (interim or final), adjusted for annual
indexed increases, and excluding expenses covered by a separate tracking mechanism1 and increases in labor expenses for merit employees since the last approved rate case
Union labor escalation rate = rate per the union labor agreement less 0.76% productivity factor
Non-labor escalation rate = consensus estimated annual change in GDPPI per the Blue Chip Economic Indicators published each February
O&M in excess of the last rate case level and/or the indexed increases, is not covered by the RAM
Annually, O&M RAM adjustment filed by 3/31 and adjusted rates commence on 6/1 for following 12 month period, if not suspended
Components
* Order No. 32735 issued by the PUC on March 31, 2015 ** With the exception of the 90% limitation on the incremental rate base RAM 1 Includes fuel, purchased power, DSM, pension, other post employment benefits, approved projects under the renewable energy infrastructure surcharge.
Components of decoupling Hawaii PUC Docket No. 2008 - 0274 Hawaii PUC Docket No. for the decoupling review: 2013 - 0141
37
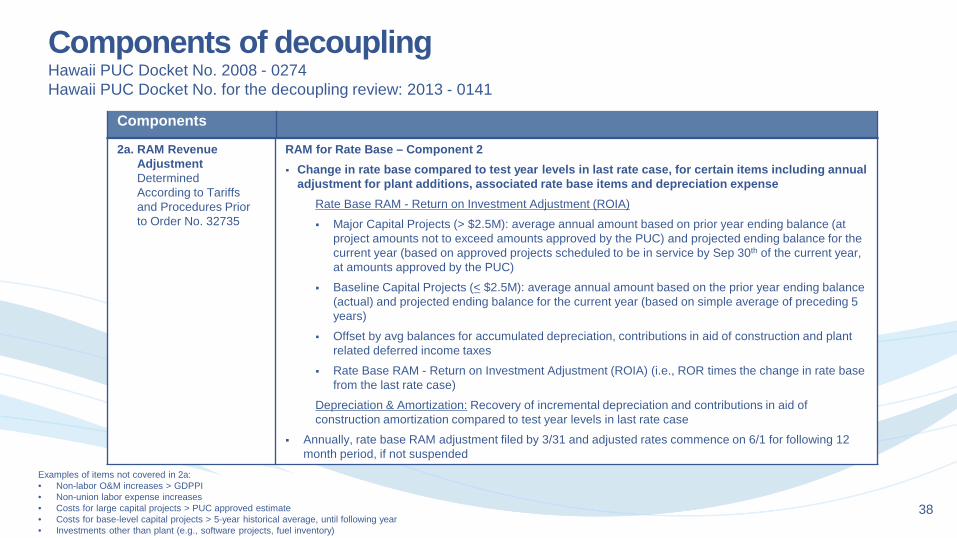
2a. RAM Revenue Adjustment Determined According to Tariffs and Procedures Prior to Order No. 32735
RAM for Rate Base – Component 2 Change in rate base compared to test year levels in last rate case, for certain items including annual
adjustment for plant additions, associated rate base items and depreciation expense Rate Base RAM - Return on Investment Adjustment (ROIA)
Major Capital Projects (> $2.5M): average annual amount based on prior year ending balance (at project amounts not to exceed amounts approved by the PUC) and projected ending balance for the current year (based on approved projects scheduled to be in service by Sep 30th of the current year, at amounts approved by the PUC)
Baseline Capital Projects (< $2.5M): average annual amount based on the prior year ending balance (actual) and projected ending balance for the current year (based on simple average of preceding 5 years)
Offset by avg balances for accumulated depreciation, contributions in aid of construction and plant related deferred income taxes
Rate Base RAM - Return on Investment Adjustment (ROIA) (i.e., ROR times the change in rate base from the last rate case)
Depreciation & Amortization: Recovery of incremental depreciation and contributions in aid of construction amortization compared to test year levels in last rate case
Annually, rate base RAM adjustment filed by 3/31 and adjusted rates commence on 6/1 for following 12 month period, if not suspended
Components
Examples of items not covered in 2a: • Non-labor O&M increases > GDPPI • Non-union labor expense increases • Costs for large capital projects > PUC approved estimate • Costs for base-level capital projects > 5-year historical average, until following year • Investments other than plant (e.g., software projects, fuel inventory)
Components of decoupling Hawaii PUC Docket No. 2008 - 0274 Hawaii PUC Docket No. for the decoupling review: 2013 - 0141
38

2b. RAM Revenue Adjustment Cap
(Order No. 32735)
Cumulative RAM for 2017 RAM Revenue Adjustment – Prior year RAM Cap Target Revenues times GDPPI (2.0% for 2017) + prior year RAM Cap
Revenue Adjustment
3. Earnings Sharing Credit
Sharing of earnings with customers for ratemaking ROE > 10% (through 12/2017) and 9.5% (after 12/2017) for Hawaiian Electric; 10% (through 8/2017) and 9.5% (after 8/2017) for Hawaii Electric Light; 9% for Maui Electric First 100 bps = 25% sharing with customers Next 200 bps = 50% sharing with customers Exceeding 300 bps = 90% sharing with customers
Components of decoupling Hawaii PUC Docket No. 2008 - 0274 Hawaii PUC Docket No. For the decoupling review: 2013 - 0141
Components
39

3 3 3 3 3
0
2
4
6
8
10
J F M A M J J A S O N D
(in $
mill
ions
)
Recognition of Previously Unrecognized 2013 RAM Revenues
9 9 9 9 9 8 8
0
2
4
6
8
10
J F M A M J J A S O N D
(in $
mill
ions
)
Lagged Method – Beginning June 2017
8 7
8 8 9 9 9 9 9 9
8 8
0
2
4
6
8
10
J F M A M J J A S O N D
(in $
mill
ions
) Calendar Year Method – Beginning January 2017
2017 Impact of Loss of January 1 RAM Revenue Recognition Method
• Background: Per the Settlement Agreement with the Consumer Advocate approved by the Public Utilities Commission in 2013, Hawaiian Electric was allowed to record RAM revenues beginning January 1 (“calendar year method”) for RAM years 2014 – 2016.
• The Settlement Agreement expired on December 31, 2016, and the Company has reverted back to the lagged method whereby RAM revenues are recorded beginning June 1 of each year through May 31 of the subsequent year in line with when they are collected on a cash basis from customers.
• Did not change cash collections • As part of transitioning back to the lagged method, in
2017 the Company recognized five months of the 2013 RAM revenues that were previously collected but not recognized.
$40M RAM Revenues
$15M 2013 RAM Revenues
2017 Net Income Impact of RAM Revenues Jan – May Revenue After Tax 2017 Calendar Year Method ($40M) Previously Unrecognized RAM Revenues __15M 2017 Impact ($25M) ($14M)
40

Application
(10/12/17)
Amount requested $30.1M (9.3% increase over revenues at current effective rates) 1
Deprec. & amort. expenses $24.6M
Return on average common equity 10.60% with mechanisms
Common equity capitalization (%) 56.94%
Return on rate base 8.05%
Average rate base $473.3M
GWh sales 1,047.0
Rate case assumes existing Balancing Accounts, Trackers and/or Surcharges: Decoupling Revenue Balancing Account (RBA)/ Rate Adjustment Mechanism (RAM); Energy Cost Adjustment Clause (ECAC): Fuel & Purchased Energy; Pension & OPEB Trackers; DSM Surcharge; Renewable Energy Infrastructure Surcharge and Purchase Power Adjustment Clause (PPAC). 1 Revenues at current effective rates include revenues based on the Final rates approved in Maui Electric Company’s 2012 test year rate case and revenues from the ECAC, PPAC, the
estimated RAM Revenue Adjustment for the 2018 RAM period, and the RBA and other operating revenues.
Maui Electric Rate Case: 2018 Test Year Hawaii PUC Docket No. 2017-0150
41

Application
(12/16/16)
Settlement (11/15/17)
Interim D&O (12/15/17 as modified by ______)
Amount requested $106.4M
(6.9% increase over revenues at current effective rates) 1
Approximately $53.7M (at 9.5% ROE)-$58.8M (at 9.75% ROE)
(3.5%-3.8% increase over revenues at current effective rates) 2
Approximately $36.0M (at 9.5% ROE) 3 (2.3% increase over revenues at current
effective rates) 4
Deprec. & amort. expenses $130.7M $130.7M $130.6M
Return on average common equity 10.60% with mechanisms
9.5%-9.75% with mechanisms
9.5% With mechanisms
Common equity capitalization (%) 57.36% 57.10% 57.10%
Return on rate base 8.28% 7.57%-7.72% 7.57%
Average rate base $2,002M $1,990M $1,980M
GWh sales 6,660.2 6,660.2 6,660.2
Rate case assumes existing Balancing Accounts, Trackers and/or Surcharges: Decoupling Revenue Balancing Account (RBA)/ Rate Adjustment Mechanism (RAM); Energy Cost Adjustment Clause (ECAC): Fuel & Purchased Energy; Pension & OPEB Trackers; DSM Surcharge; Renewable Energy Infrastructure Surcharge and Purchase Power Adjustment Clause (PPAC). 1 Revenues at current effective rates include revenues based on the Final rates approved in Hawaiian Electric Company’s 2011 test year rate case and revenues from the ECAC, PPAC, the estimated
RAM Revenue Adjustment for the 2017 RAM period, and the RBA and other operating revenues. 2 In Settlement Agreement, Parties settled on all issues except whether the ROE of 9.75% should be reduced by up to 25 basis points for the impact of decoupling. 3 Interim D&O made 3 adjustments from the Settlement Letter filed by Hawaiian Electric and Consumer Advocate: (i) $6M reduction for customer benefit, (ii) $5M revenue reduction pending further
examination of baseline plant additions and (iii) $5 million related to pension contributions in excess of pension expenses. PUC approved company’s partial motion for reconsideration to ensure same customer benefits without requiring write off of pension regulatory asset.
4 The Company proposed interim revenue increase of $36.0M (adjusted downward from $38.4M interim) reflects the adjustment to remove the impact of the modifications to the ECAC and aligns with the change in total annual target revenues.
5 Interim rate increase became effective February 16, 2018.
Hawaiian Electric Rate Case: 2017 Test Year Hawaii PUC Docket No. 2016-0328
42

Application
(9/19/16) Settlement (7/11/17)
Interim D&O (eff. 8/31/17)
Amount requested $19.3M
(6.5% increase over revenues at current effective rates) 1
Approximately $9.9M (at 9.5% ROE)-$11.1M (at
9.75% ROE)2 (3.4%-3.8% increase over
revenues at current effective rates)
Approximately $9.9M (at 9.5% ROE)3
(3.4% increase over revenues at current effective rates)
Deprec. & amort. expenses $37.8M $37.8M $37.8M
Return on average common equity
10.60% with mechanisms
9.5%-9.75% With mechanisms
9.5% With mechanisms
Common equity capitalization (%) 57.12% 56.69% 56.69%
Return on rate base 8.44% 7.80%-7.94% 7.80%
Average rate base $478.8M $482.1M $482.1M
GWh sales 1,040.7 1,040.7 1,040.7
Rate case assumes existing Balancing Accounts, Trackers and/or Surcharges: Decoupling Revenue Balancing Account (RBA)/ Rate Adjustment Mechanism (RAM); Energy Cost Adjustment Clause (ECAC): Fuel & Purchased Energy; Pension & OPEB Trackers; DSM Surcharge; Renewable Energy Infrastructure Surcharge and Purchase Power Adjustment Clause (PPAC). 1 Revenues at current effective rates include revenues based on the Final rates approved in Hawaii Electric Light’s 2010 test year rate case and revenues from the ECAC, PPAC, the RAM
Revenue Adjustment for the 2016 RAM period, and the RBA and other operating revenues. 2 In Settlement Agreement, Parties settled on all issues except whether the ROE of 9.75% should be reduced by up to 25 basis points for the impact of decoupling. 3 Interim rate increase became effective on August 31, 2017. Parties filed separate opening and reply briefs on September 20, 2017 and October 5, 2017, respectively.
Hawaii Electric Light Rate Case: 2016 Test Year Hawaii PUC Docket No. 2015-0170
43

Application (7/22/11)
Interim D&O (eff.6/1/12)
Final D&O (eff.8/1/13)
Base Request $27.5M1
(6.7% increase) $13.1M3
(3.2% increase) $5.3M4
(1.3% increase)
Depr. & amort. expenses $19.8M
without mechanisms
$19.7M with mechanisms
$19.7M with mechanisms
Return on average common equity 11.00% 10.00% 9.00%
Common equity capitalization (%) 56.85% 56.86% 56.86%
Return on average rate base 8.72% 7.91% 7.34%
Average rate base amount2 $393M $393M $393M
GWh sales 1,201.8 1,201.8 1,201.8
Existing Balancing Accounts, Trackers and/or Surcharges Decoupling Revenue Balancing Account/Revenue Adjustment Mechanism; ECAC: Fuel & Purchased Energy; Pension & OPEB Trackers; DSM Surcharge; Renewable Energy Infrastructure Surcharge and Purchase Power Adjustment Clause. 1 Increase consists of:
• Return on rate base $ 3.0 M • O&M $19.5 M • Other, net $ 5.0 M
2 Current effective rates are based on the adjusted interim D&O in the Maui Electric’s 2010 test year rate case. Average rate base in that D&O was $387M. 3 Based on updated settlement which included the implementation of final rates in the 2010 test year rate case. On May 21, 2012, the Commission issued an interim D&O which approved
interim rates effective on June 1, 2012. 4 Final rates became effective as of August 1, 2013. Maui Electric refunded $9.7 million (which includes interest and related revenue taxes since June 1, 2012) to customers from September
to October 2013. On July 2, 2013, the Commission denied Maui Electric’s motion for partial reconsideration of the 9.00% ROE in the final D&O but allowed the deferral of IRP costs incurred from June 1, 2012 until determination of the level and method of recovery in the IRP docket.
Maui Electric Rate Case: 2012 Test Year Hawaii PUC Docket No. 2011-0092
44

The Governor, with the consent of the Senate, appoints three full-time commissioners to staggered six-year terms. Commissioners can serve no more than 12 consecutive years. Randall Y. Iwase, Chair (Appointed by Governor David Y. Ige) Appointed Chair in January 2015 for a term to expire on June 30, 2020 Prior to appointment, served as the Chair of the Hawaii State Tax Review Commission and Chair of the Hawaii Labor and
Industrial Relations Appeals Board Also served as Supervising Deputy Attorney General for division providing legal counsel to the Department of Commerce
and Consumer Affairs and the Public Utilities Commission (PUC) Former state senator and former Honolulu city council member University of San Francisco School of Law (JD) & University of Florida, Gainesville, where he graduated with honors (BA)
Lorraine H. Akiba (Appointed by Governor Neil Abercrombie) Began serving as Commissioner on July 1, 2012 for a term to expire on June 30, 2018 Former partner at McCorriston Miller Mukai MacKinnon LLP and head of the firm’s Environmental Practice Group Served as State of Hawaii Director of Labor and Industrial Relations from 1995 to 2000, under Governor Ben Cayetano Former Chair of the Democratic Party of Hawaii from 2001 to 2003 Has experience working with independent power producers and developers through her private practice Member of the EPRI Advisory Council Hastings College of Law (JD) & University of California, Berkeley (BA in Political Science) James P. (Jay) Griffin (Appointed by Governor David Y. Ige) Appointed as interim Commissioner in May 2017 and confirmed by State Senate in August 2017 for a term to expire on
June 30, 2022 Prior to appointment, served as PUC Chief of Policy and Research Previously worked as a researcher at the University of Hawaii at Manoa, Hawaii Natural Energy Institute Pardee RAND Graduate School (PhD in policy analysis), Duke University (joint master’s in public policy and
environmental management) UC Santa Barbara (MA in economics), Williams College (BA in political economy)
Public Utilities Commission of the State of Hawaii
45
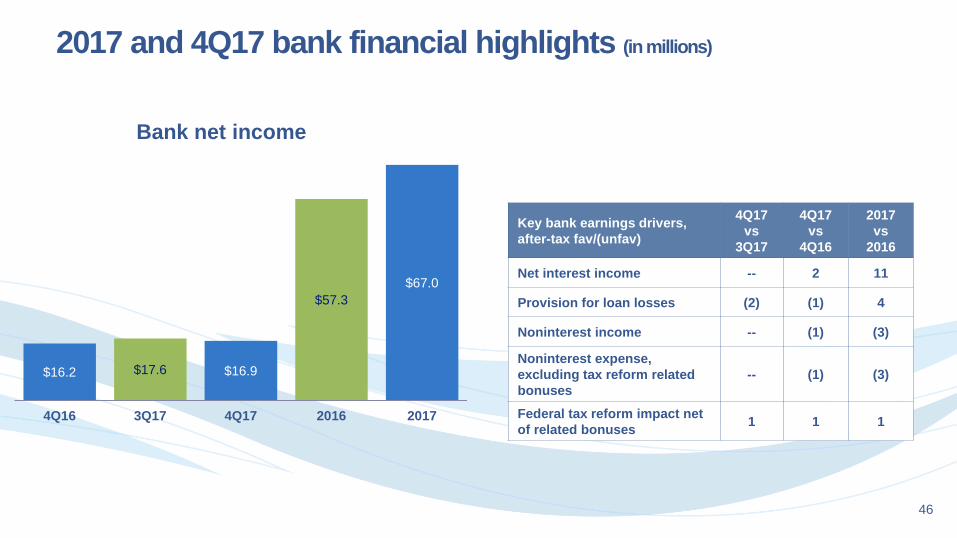
$16.2 $17.6 $16.9
$57.3 $67.0
4Q16 3Q17 4Q17 2016 2017
Bank net income
Key bank earnings drivers, after-tax fav/(unfav)
4Q17 vs
3Q17
4Q17 vs
4Q16
2017 vs
2016
Net interest income -- 2 11
Provision for loan losses (2) (1) 4
Noninterest income -- (1) (3)
Noninterest expense, excluding tax reform related bonuses
-- (1) (3)
Federal tax reform impact net of related bonuses 1 1 1
2017 and 4Q17 bank financial highlights (in millions)
46

1.01 1.02 0.95
1.17 3.68 3.69 3.50 3.57
Peers 2017
Return on assets (%) Net interest margin (%)
~3.5 - 3.6
Original Target
Original Target
Peers 2017
ASB 4Q17
ASB QTD Annualized Peers1
High Performing Peers2 ASB Target
ASB 4Q17
>0.90
Source for peer data: SNL Financial (based upon data available as of February 21, 2018) Note: Quarterly information is annualized 1 Median for peer group based on publicly traded banks and thrifts between $3.5B and $8B in total assets and not subject to the Durbin Amendment caps limiting interchange fees. See ASB Peer Group – 2017. 2 Median for peer group of 18 high performing banks and not subject to the Durbin Amendment caps limiting interchange fees. See ASB Peer Group - 2017.
Bank 2017 performance
ASB 2017
ASB 2017
ASB 2017
47

Net interest margin
3.59 3.68 3.68 3.69 3.68
3.00
3.50
4.00
4Q16 1Q17 2Q17 3Q17 4Q17
3.80 3.88 3.88 3.88 3.88
3.00
3.50
4.00
4.50
4Q16 1Q17 2Q17 3Q17 4Q17
0.22 0.20 0.21 0.20 0.21 0.00
0.40
0.80
4Q16 1Q17 2Q17 3Q17 4Q17
Asset yield %
Liability cost %
Net interest margin (NIM) %
Source for peer data: SNL Financial (based upon data available as of February 21, 2018) Asset Yield: Total interest income as a percentage of average interest-earning assets Liability Cost: Total interest expense as a percentage of average interest-bearing and non-interest bearing liabilities Net Interest Margin: Net interest income as a percentage of average interest-earning assets
1 Median for peer group based on publicly traded banks and thrifts between $3.5B and $8B in total assets. See appendix. 2 Median for peer group of 18 high performing banks. See appendix.
ASB High Performing Peers2
Peers1
48

$23.3 $19.4 $21.0
$23.4 $23.6
0.49% 0.41% 0.44% 0.50% 0.51% 0.53% 0.47%
0.43% 0.42% 0.42% 0.49% 0.45%
0.40% 0.42% 0.42%
4Q16 1Q17 2Q17 3Q17 4Q17
Nonaccrual loans2
$1.5
$3.9
$2.8
$0.5
$3.7
$16.8
$10.9
$4.7
$3.4 $2.5
$3.8 $3.1
$11.3 $12.8
0.40%
0.29%
0.21%
0.32%
0.26%
0.08% 0.04% 0.05% 0.06%
0.11% 0.11%
0.04% 0.06% 0.10%
0.15%
4Q16 1Q17 2Q17 3Q17 4Q17 2016 2017
Source for peer data: SNL Financial (based upon data available as of February 21, 2018) 1 Quarterly net charge-off ratio reflected as a percentage of average loans held during the period 2 Quarterly nonaccrual loans ratio reflected as a percentage of total loans 3 Median for peer group based on publicly traded banks and thrifts between $3.5B and $8B in total assets. See ASB Peer Group - 2017. 4 Median for peer group of 18 high performing banks. See ASB Peer Group - 2017.
Credit quality ($ in millions)
ASB Nonaccrual loans Peers3 High Performing Peers4
Net charge-offs1
ASB Provision for loan losses ASB Net charge-offs
Annual
49

Note: Based on year-end 2016 data of publicly traded banks and thrifts between $3.5 billion and $8.0 billion in assets (based upon data available in SNL as of January 26, 2017). The peer group is updated annually in December and banks that no longer report as a separate entity (e.g., mergers, acquisitions, failed banks, etc.) are not included in the median calculations from the time of the transaction or failure. * Subset of 18 banks representing ASB’s high performing peer group, based on a 3-year average return on average assets rank above the 70th percentile
ASB peer group – 2017 * 1st Source Corporation SRCE First Bancorp FBNC Opus Bank OPB
Ameris Bancorp ABCB First Busey Corporation BUSE * Oritani Financial Corp. ORITBancFirst Corporation BANF First Commonwealth Financial Corporation FCF Pacific Premier Bancorp, Inc. PPBIBerkshire Hills Bancorp, Inc. BHLB * First Financial Bankshares, Inc. FFIN * Park National Corporation PRKBNC Bancorp BNCN * First Merchants Corporation FRME Republic Bancorp, Inc. RBCAA
* BofI Holding, Inc. BOFI Flushing Financial Corporation FFIC * S&T Bancorp, Inc. STBABoston Private Financial Holdings, Inc. BPFH * Great Southern Bancorp, Inc. GSBC Sandy Spring Bancorp, Inc. SASRBridge Bancorp, Inc. BDGE Green Bancorp, Inc. GNBC Seacoast Banking Corporation of Florida SBCFBrookline Bancorp, Inc. BRKL * Hanmi Financial Corporation HAFC * ServisFirst Bancshares, Inc. SFBS
* Cardinal Financial Corporation CFNL Heritage Financial Corporation HFWA Southside Bancshares, Inc. SBSICenterState Banks, Inc. CSFL HomeStreet, Inc. HMST State Bank Financial Corporation STBZCentral Pacific Financial Corp. CPF Independent Bank Corp. INDB Tompkins Financial Corporation TMPCentury Bancorp, Inc. CNBKA Independent Bank Group, Inc. IBTX TowneBank TOWN
* City Holding Company CHCO Kearny Financial Corp. KRNY TriCo Bancshares TCBK* Community Trust Bancorp, Inc. CTBI Lakeland Bancorp, Inc. LBAI TriState Capital Holdings, Inc. TSC
ConnectOne Bancorp, Inc. CNOB * Lakeland Financial Corporation LKFN TrustCo Bank Corp NY TRSTDime Community Bancshares, Inc. DCOM MainSource Financial Group, Inc. MSFG United Financial Bancorp, Inc. UBNK
* Eagle Bancorp, Inc. EGBN Meridian Bancorp, Inc. EBSB Univest Corporation of Pennsylvania UVSPEnterprise Financial Services Corp EFSC Meta Financial Group, Inc. CASH * Washington Trust Bancorp, Inc. WASH
* Farmers & Merchants Bank of Long Beach FMBL National Bank Holdings Corporation NBHC * Westamerica Bancorporation WABCFidelity Southern Corporation LION Northfield Bancorp, Inc. NFBK WSFS Financial Corporation WSFSFinancial Institutions, Inc. FISI OceanFirst Financial Corp. OCFC Yadkin Financial Corporation YDKN
50

Credit Ratings HEI Hawaiian Electric ASB
S&P1 BBB-/Stable/A-3 BBB-/Stable/A-3 BBB/Stable/A-2
Moody’s2 Unrated/Stable/P-3 Baa2/Stable/P-2 n/a
Fitch3 BBB/Stable/F3 BBB+/Stable/F2 n/a
($ in millions)
Note: Debt maturities data as of December 31, 2017 1 Source for ratings: February 2018 (HEI & Hawaiian Electric) & November 2017 (ASB) S&P reports 2 Source for ratings: August 2017 (HEI & Hawaiian Electric) Moody’s reports; On February 10, 2017, Moody’s withdrew ratings of ASB for its own business reasons 3 Source for ratings: January 2017 (HEI) & June 2017 (Hawaiian Electric) Fitch reports * Excludes debt expenses of ~ $10 million (does not reflect the adoption of ASU No. 2015-03, Interest-Imputation of Interest: Simplifying the Presentation of Debt Issuance Costs) * * Includes $50 million short term HEI term loan due in 2018
$75
Debt maturities* & credit ratings
**
$50** $50 $150 $50
$50 $96
$52
$1,179
$4 $4
$4 $4
$4
$47
$0
$200
$400
$600
$800
$1,000
$1,200
2018 2019 2020 2021 2022 Thereafter to 2046
HEI Hawaiian Electric Pacific Current Pacific Current: ~$4 million debt payment in each year
51

-45.0%
-30.0%
-15.0%
0.0%
15.0%
30.0%
400
600
800
1000
1200
1400
Dec-14 Dec-15 Dec-16 Dec-17
Yr-Yr% Change Visitor Arrivals Year
vs.
Yea
r % C
hang
e
Visi
tor a
rriv
als
(in
thou
sand
s)
Year
vs.
Yea
r % C
hang
e
Visi
tor e
xpen
ditu
res
(in
thou
sand
s)
Source: State of Hawaii Department of Business, Economic Development and Tourism
Monthly Visitor Arrivals
Year vs. Year % Change
-45.0%
-30.0%
-15.0%
0.0%
15.0%
30.0%
45.0%
700
975
1250
1525
1800
2075
2350
Dec-14 Dec-15 Dec-16 Dec-17
Yr-Yr% Change Visitor Expenditures
Year vs. Year % Change
Monthly Visitor Expenditures
2017 Hawaii visitor arrivals up 5.0% and visitor expenditures up 6.2%
52

0
4
8
12
Dec-07 Dec-08 Dec-09 Dec-10 Dec-11 Dec-12 Dec-13 Dec-14 Dec-15 Dec-16 Dec-17
Hawaii
U.S.
Hawaii: 2.0%
Seasonally adjusted
US: 4.1%
Hawaii County: 2.0%
Not seasonally adjusted
Honolulu County: 1.7%
Maui County: 1.8% Kauai County: 1.7%
0
4
8
12
Dec-07 Dec-08 Dec-09 Dec-10 Dec-11 Dec-12 Dec-13 Dec-14 Dec-15 Dec-16 Dec-17
Honolulu County
Maui County
Hawaii County
Kauai County
Not seasonally adjusted
Source: U.S. Bureau of Labor Statistics and the State of Hawaii Department of Labor and Industrial Relations
Hawaii unemployment rate remains low at 2.0%
53

Hawaii real estate
Num
ber o
f sal
es
Med
ian
pric
e
Oahu Number of Sales and Median Sales Price
Median Sales Price Oahu, Maui, Hawaii, Kauai
Med
ian
pric
e
Oahu: $750,000
Maui: $695,500
Kauai: $587,500
Hawaii Island: $339,000
0
100
200
300
400
$0
$200,000
$400,000
$600,000
$800,000
$1,000,000
Dec-08 Dec-09 Dec-10 Dec-11 Dec-12 Dec-13 Dec-14 Dec-15 Dec-16 Dec-17
Number of Sales Median Sales Price
$200,000
$400,000
$600,000
$800,000
$1,000,000
Dec-08 Dec-09 Dec-10 Dec-11 Dec-12 Dec-13 Dec-14 Dec-15 Dec-16 Dec-17
Oahu Median Sales Price Maui Median Sales Price Hawaii Island Median Sales Price Kauai Median Sales Price
Source: Title Guaranty (2008 - current) 54

HEI and Hawaiian Electric Company management use certain non-GAAP measures to evaluate the performance of HEI and the utility. Management believes these non-GAAP measures provide useful information and are a better indicator of the companies’ core operating activities given the non-recurring nature of certain items. Core earnings and other financial measures as presented here may not be comparable to similarly titled measures used by other companies. The accompanying tables provide a reconciliation of reported GAAP¹ earnings to non-GAAP core earnings and the adjusted return on average common equity (ROACE) for HEI and the utility. The reconciling adjustments from GAAP earnings to core earnings include income, costs and associated taxes related to the terminated merger between HEI and NextEra Energy, Inc., the cancelled spin-off of ASB Hawaii, Inc., and the termination of the liquefied natural gas (LNG) contract which required Hawaii Public Utilities Commission approval of the merger with NextEra Energy, Inc. For more information on the transactions, see HEI’s Form 8-K filed on July 18, 2016 and HEI’s Form 8-K filed on July 19, 2016. In addition, the reconciling adjustments from GAAP earnings to core earnings also exclude the impact of the federal tax reform act due to the adjustment of the deferred tax balances and one-time employee bonus paid by the bank related to federal tax reform. Management does not consider these items to be representative of the company’s fundamental core earnings. Management has shown adjusted non-GAAP (core) net income, adjusted non-GAAP (core) diluted earnings per common share and adjusted non-GAAP (core) ROACE in order to provide better comparability of core net income, EPS and ROACE between periods. The accompanying table also provides the calculation of utility GAAP other operation and maintenance (O&M) expense adjusted for costs related to the terminated merger discussed above. “O&M-related net income neutral items” which are O&M expenses covered by specific surcharges or by third parties have also been excluded. These “O&M-related net income neutral items” are grossed-up in revenue and expense and do not impact net income.
Explanation of HEI’s use of certain unaudited non-GAAP measures
55

56

57

58

This presentation and other presentations made by Hawaiian Electric Industries, Inc. (HEI) and Hawaiian Electric Company, Inc. (Hawaiian Electric) and their subsidiaries contain “forward-looking statements,” which include statements that are predictive in nature, depend upon or refer to future events or conditions and usually include words such as “will,” “expects,” “anticipates,” “intends,” “plans,” “believes,” “predicts,” “estimates” or similar expressions. In addition, any statements concerning future financial performance, ongoing business strategies or prospects or possible future actions are also forward-looking statements. Forward-looking statements are based on current expectations and projections about future events and are subject to risks, uncertainties and the accuracy of assumptions concerning HEI and its subsidiaries (collectively, the Company), the performance of the industries in which they do business and economic, political and market factors, among other things. These forward-looking statements are not guarantees of future performance.
Risks, uncertainties and other important factors that could cause actual results to differ materially from those described in forward-looking statements and from historical results include, but are not limited to, the following:
international, national and local economic and political conditions--including the state of the Hawaii tourism, defense and construction industries; the strength or weakness of the Hawaii and continental U.S. real estate markets (including the fair value and/or the actual performance of collateral underlying loans held by ASB, which could result in higher loan loss provisions and write-offs); decisions concerning the extent of the presence of the federal government and military in Hawaii; the implications and potential impacts of U.S. and foreign capital and credit market conditions and federal, state and international responses to those conditions; and the potential impacts of global developments (including global economic conditions and uncertainties; unrest; the conflict in Syria; the effects of changes that have or may occur in U.S. policy, such as with respect to immigration and trade; terrorist acts by ISIS or others; potential conflict or crisis with North Korea; and potential pandemics);
the effects of future actions or inaction of the U.S. government or related agencies, including those related to the U.S. debt ceiling, monetary policy and policy and regulation changes advanced or proposed by President Trump and his administration;
weather and natural disasters (e.g., hurricanes, earthquakes, tsunamis, lightning strikes, lava flows and the potential effects of climate change, such as more severe storms and rising sea levels), including their impact on the Company's and Utilities' operations and the economy;
the timing and extent of changes in interest rates and the shape of the yield curve;
the ability of the Company and the Utilities to access the credit and capital markets (e.g., to obtain commercial paper and other short-term and long-term debt financing, including lines of credit, and, in the case of HEI, to issue common stock) under volatile and challenging market conditions, and the cost of such financings, if available;
the risks inherent in changes in the value of the Company’s pension and other retirement plan assets and ASB’s securities available for sale;
Cautionary note regarding forward looking statements
59
changes in laws, regulations (including tax regulations), market conditions and other factors that result in changes in assumptions used to calculate retirement benefits costs and funding requirements;
the impact of the Dodd-Frank Wall Street Reform and Consumer Protection Act of 2010 (Dodd-Frank Act) and of the rules and regulations that the Dodd-Frank Act requires to be promulgated;
increasing competition in the banking industry (e.g., increased price competition for deposits, or an outflow of deposits to alternative investments, which may have an adverse impact on ASB’s cost of funds);
the potential delay by the Public Utilities Commission of the State of Hawaii (PUC) in considering (and potential disapproval of actual or proposed) renewable energy proposals and related costs; reliance by the Utilities on outside parties such as the state, independent power producers (IPPs) and developers; and uncertainties surrounding technologies, solar power, wind power, biofuels, environmental assessments required to meet renewable portfolio standards (RPS) goals and the impacts of implementation of the renewable energy proposals on future costs of electricity;
the ability of the Utilities to develop, implement and recover the costs of implementing the Utilities’ action plans included in their updated Power Supply Improvement Plans (PSIPs), Demand Response Portfolio Plan, Distributed Generation Interconnection Plan, Grid Modernization Plans, and business model changes, which have been and are continuing to be developed and updated in response to the orders issued by the PUC in April 2014, its April 2014 inclinations on the future of Hawaii’s electric utilities and the vision, business strategies and regulatory policy changes required to align the Utilities’ business model with customer interests and the state’s public policy goals, and subsequent orders of the PUC;
capacity and supply constraints or difficulties, especially if generating units (utility-owned or IPP-owned) fail or measures such as demand-side management (DSM), distributed generation (DG), combined heat and power or other firm capacity supply-side resources fall short of achieving their forecasted benefits or are otherwise insufficient to reduce or meet peak demand;
fuel oil price changes, delivery of adequate fuel by suppliers and the continued availability to the electric utilities of their energy cost adjustment clauses (ECACs);
the continued availability to the electric utilities or modifications of other cost recovery mechanisms, including the purchased power adjustment clauses (PPACs), rate adjustment mechanisms (RAMs) and pension and postretirement benefits other than pensions (OPEB) tracking mechanisms, and the continued decoupling of revenues from sales to mitigate the effects of declining kilowatthour sales;
the impact of fuel price volatility on customer satisfaction and political and regulatory support for the Utilities;
60

the risks associated with increasing reliance on renewable energy, including the availability and cost of non-fossil fuel supplies for renewable energy generation and the operational impacts of adding intermittent sources of renewable energy to the electric grid;
the growing risk that energy production from renewable generating resources may be curtailed and the interconnection of additional resources will be constrained as more generating resources are added to the Utilities' electric systems and as customers reduce their energy usage;
the ability of IPPs to deliver the firm capacity anticipated in their power purchase agreements (PPAs);
the potential that, as IPP contracts near the end of their terms, there may be less economic incentive for the IPPs to make investments in their units to ensure the availability of their units;
the ability of the Utilities to negotiate, periodically, favorable agreements for significant resources such as fuel supply contracts and collective bargaining agreements;
new technological developments that could affect the operations and prospects of the Utilities and ASB or their competitors such as the commercial development of energy storage and microgrids and banking through alternative channels;
cyber security risks and the potential for cyber incidents, including potential incidents at HEI, ASB and the Utilities (including at ASB branches and electric utility plants) and incidents at data processing centers they use, to the extent not prevented by intrusion detection and prevention systems, anti-virus software, firewalls and other general information technology controls;
federal, state, county and international governmental and regulatory actions, such as existing, new and changes in laws, rules and regulations applicable to HEI, the Utilities and ASB (including changes in taxation, increases in capital requirements, regulatory policy changes, environmental laws and regulations (including resulting compliance costs and risks of fines and penalties and/or liabilities), the regulation of greenhouse gas emissions, governmental fees and assessments (such as Federal Deposit Insurance Corporation assessments), and potential carbon “cap and trade” legislation that may fundamentally alter costs to produce electricity and accelerate the move to renewable generation);
developments in laws, regulations and policies governing protections for historic, archaeological and cultural sites, and plant and animal species and habitats, as well as developments in the implementation and enforcement of such laws, regulations and policies;
discovery of conditions that may be attributable to historical chemical releases, including any necessary investigation and remediation, and any associated enforcement, litigation or regulatory oversight;
decisions by the PUC in rate cases and other proceedings (including the risks of delays in the timing of decisions, adverse changes in final decisions from interim decisions and the disallowance of project costs as a result of adverse regulatory audit reports or otherwise);
61

decisions by the PUC and by other agencies and courts on land use, environmental and other permitting issues (such as required corrective actions, restrictions and penalties that may arise, such as with respect to environmental conditions or RPS);
potential enforcement actions by the Office of the Comptroller of the Currency (OCC), the Federal Reserve Board (FRB), the Federal Deposit Insurance Corporation (FDIC) and/or other governmental authorities (such as consent orders, required corrective actions, restrictions and penalties that may arise, for example, with respect to compliance deficiencies under existing or new banking and consumer protection laws and regulations or with respect to capital adequacy);
the ability of the Utilities to recover increasing costs and earn a reasonable return on capital investments not covered by RAMs;
the risks associated with the geographic concentration of HEI’s businesses and ASB’s loans, ASB’s concentration in a single product type (i.e., first mortgages) and ASB’s significant credit relationships (i.e., concentrations of large loans and/or credit lines with certain customers);
changes in accounting principles applicable to HEI, the Utilities and ASB, including the adoption of new U.S. accounting standards, the potential discontinuance of regulatory accounting and the effects of potentially required consolidation of variable interest entities (VIEs) or required capital lease accounting for PPAs with IPPs;
changes by securities rating agencies in their ratings of the securities of HEI and Hawaiian Electric and the results of financing efforts;
faster than expected loan prepayments that can cause an acceleration of the amortization of premiums on loans and investments and the impairment of mortgage-servicing assets of ASB;
changes in ASB’s loan portfolio credit profile and asset quality which may increase or decrease the required level of provision for loan losses, allowance for loan losses and charge-offs;
changes in ASB’s deposit cost or mix which may have an adverse impact on ASB’s cost of funds;
the final outcome of tax positions taken by HEI, the Utilities and ASB;
the risks of suffering losses and incurring liabilities that are uninsured (e.g., damages to the Utilities’ transmission and distribution system and losses from business interruption) or underinsured (e.g., losses not covered as a result of insurance deductibles or other exclusions or exceeding policy limits); and
other risks or uncertainties described elsewhere in this report (e.g., Item 1A. Risk Factors) and in other reports previously and subsequently filed by HEI and/or Hawaiian Electric with the Securities and Exchange Commission (SEC).
Forward-looking statements speak only as of the date of the presentation or filing in which they are made. Except to the extent required by the federal securities laws, HEI, Hawaiian Electric, ASB and their subsidiaries undertake no obligation to publicly update or revise any forward-looking statements, whether written or oral and whether as a result of new information, future events or otherwise.
62

Corporate Headquarters
Hawaiian Electric Industries, Inc. 1001 Bishop Street, Suite 2900 Honolulu, Hawaii 96813 Telephone: 808-543-5662 Internet address: www.hei.com
Institutional Investor And Securities Analyst Inquiries Please direct inquiries to: Clifford Chen Treasurer & Manager, Investor Relations & Strategic Planning Telephone: 808-543-7384 Email: [email protected] Julie Smolinski Director, Investor & Strategic Projects Telephone: 808-543-5874 Email: [email protected]