Embed Size (px)
Citation preview

J. Chil. Chem. Soc., 57, Nº 4 (2012)
1447
NOVEL SPECTROPHOTOMETRIC METHODS FOR THE DETERMINATION OF FLUCONAZOLE IN THE PRESENCE OF ITS OXIDATIVE DEGRADATION PRODUCT
HAYAM MAHMOUD LOTFY, HANY HUNTER MONIR*AND ABD EL-AZIZ EL-BAYOUMI ABD EL-ALEEMAnalytical Chemistry Department , Faculty of Pharmacy, Cairo University, Kasr El-Aini Street, P. O. Box 11562, Cairo, Egypt
(Received: May 7, 2012 - Accepted: August 31, 2012)
ABSTRACT
Five sensitive, selective and precise spectrophotometric stability-indicating methods for the determination of fluconazole in the presence of its oxidative degradation product and in pharmaceutical formulations are developed and validated. Method A is a newly developed spectrophotometric one that is called ratio difference method by measuring the difference in amplitudes between 261.5 and 266.5 nm of ratio spectrum. Method B is a third derivative spectropho-tometric one, which determines peak amplitudes from 265.5-268nm (peak-peak). Method C is ratio subtraction method. Method D is the first derivative of the ratio spectra by measuring the peak amplitude at 269 nm. Finally, method E is the mean centering of ratio spectra method by measuring the peak amplitude at 266.5 nm. The proposed methods allow the determination of fluconazole in the presence of its oxidative degradation product over a concentration range of 50- 400 µg.mL-1 with mean percentage recoveries of 100.24±0.91, 99.91±0.52, 100.20±1.26, 99.79±0.69, and 100.77±0.72 respectively.
The selectivity of the proposed methods is checked using laboratory prepared mixtures. The proposed methods have been successfully applied to the analysis of fluconazole in pharmaceutical dosage forms without interference from other dosage form additives and the results have been statistically compared with a reported method.
Keywords: Fluconazole, Spectrophotometry, Ratio difference spectrophotometry, Stability-indicating analysis
INTRODUCTION
Fluconazole, (FLZ) [2-(2,4,-difluorophenyl)-1,3-bis(1H-1, 2,4,-triazol-1-yl)propan-2-ol],fig. 1. It is an orally active antifungal agent, which is used in the treatment of superficial and systemic candidiasis and in the treatment of cryptococcal infections in patients with the acquired immunodeficiency syndrome (AIDS). It acts by blocking the synthesis of ergosterol, an essential component of the fungal cell membrane1. Mammalian cell is much less sensi-tive to FLZ inhibition.
method, ratio difference, is valid for resolving mixtures with severely spectral interfering problems, either drug or its degradation product or two drugs in binary mixture without preliminary separation. The new method is very simple, accurate, precise and did not require any sophisticated apparatus or computer programs. The methods used are simple, rapid, selective, less expensive and less time-consuming compared to published methods.
Theory of Ratio difference spectrophotometric method (RDSM)A new method is developed in which the amplitude difference between
two points on the ratio spectra of a mixture is directly proportional to the con-centration of the component of interest; independence of the interfering com-ponent is the basic principle of the ratio difference method.
This method depends on that, if a mixture of two drugs X and Y having overlapped spectra, one can determine X by dividing the spectrum of the mix-ture (X+Y) by a known concentration of Y as a divisor (Y’). The division will
give a new curve that represents i.e. , Where is a
constant. On the obtained
ratio curve; by selecting 2 wavelengths λ1 and λ2 and subtracting the amplitudes
at these two points, the constant (relating to the interfering substance)
will be cancelled along with any other instrumental error or any interference
from the sample matrix. This can be summarized as the following:
Figure 1: Structure of fluconazole.
The literature survey reveals several analytical methods used for quan-titative determination of FLZ in body fluids and pharmaceutical prepara-tions. These methods include high-performance liquid chromatography2-8, liquid chromatography-tandem mass spectrometry9-11, gas chromatography12-
15,micellar electrokinetic capillary chromatography16and bioassay17. The international conference on Harmonization (ICH) guideline entitled
‘stability testing of new drug substances and products” requires the stress test-ing to be carried out to elucidate the inherent stability characteristics of the active substance18. ICH states that drugs and chemicals are subjected to oxida-tion during transportation and storage, so studying of their stability is of great value. An ideal stability-indicating method is one that quantifies the standard drug alone without any interference from its degradation product. To date, no simple stability-indicating analytical methods have been described in the lit-erature, and no previous systematic studies focused on FLZ degradation have been performed. The goal of the present study was to develop and validate simple stability-indicating methods to be used for quality control of FLZ in pharmaceutical preparations. These methods include one novel method called ratio difference spectrophotometric method, and four well-established meth-ods; namely: third derivative, ratio subtraction, first derivative of ratio spectra, and mean centering method.
The scientific novelty of the present work is that the newly developed
Therefore, constant
Supposing the amplitudes at the two selected wavelengths are P1 and P2 at λ1 and λ2, respectively, by subtracting the two amplitudes, the interfering substance Y shows no interference. Then:

J. Chil. Chem. Soc., 57, Nº 4 (2012)
1448
The concentration of the drug (X) was calculated by using the regression equation representing a linear correlation between the differences of ratio am-plitudes at the two selected wavelengths versus the corresponding concentra-tions of the drug (X).
Similarly, Y could be determined by the same procedure using a known concentration of X as a divisor.
EXPERIMENTAL
Materials and methods
Instruments− Infrared spectrophotometer: FTIR Jasco 460 plus (Japan).− Mass spectrophotometer: Shimadzu Qp-2010 Plus (Japan).− Pre-coated aluminium 105553 TLC-plates consisted of silica gel 60 F254
(20 cm x 20 cm, 0.25 mm) and came from Merck (Darmstadt, Germany).− Spectrophotometer: Shimadzu UV-1601 PC, dual-beam UV-vis. spectro-
photometer (Kyoto-Japan), with matched 1 cm quartz cells, connected to an IBM compatible PC and an HP-600 inkjet printer. Bundled, UV-PC personal spectroscopy software version 3.7 was used to process the ab-sorption and the derivative spectra. The spectral band width was 2 nm with wavelength-scanning speed of 2800 nm min-1.
− Rotary evaporator: Normschliff Gerätebau Wertheim (Germany).− Sonicator: Bandelin Sonorex RK 510S, Donation of Alexander von Hum-
boldt – Foundation, Bonn-Bad, Godesberg, Federal Republic of Germany.
Software− All computations were performed in Matlab.
Materials and reagentsAll chemicals and reagents were analytical grade, and water was always
bi-distilled.
MATERIALS
Pure standardFLZ standard was kindly donated by Amoun Pharmaceutical Co. (El-
Obour City, Cairo, Egypt). Its purity was found to be 99.13±0.95 % (n=6) according to a reported method8.
Pharmaceutical formulations− Diflucan® syrup BN: 0305,labeled to contain 5 mg.mL-1, diflucan® vial BN:
9742,labeled to contain 2 mg.mL-1, diflucan® capsule BN: 0202,labeled to contain 50 mg/capsule, diflucan® capsule BN: 0105,labeled to contain 150 mg/capsule (manufactured by Pfizer Egypt S.A.E., Cairo, Egypt, Under the authority of Pfizer Inc. U.S.A.).
− Fungican capsule BN: 101148, labeled to contain 150 mg/capsule (manu-factured by Amoun Pharmaceutical Co. (El-Obour City, Cairo, Egypt)).
− Alkanazole capsule BN: 032, labeled to contain 150 mg/capsule (manufac-tured by Hikma Pharma S.A.E., 6th of October City - Egypt).
− Triflucan capsule BN: 1002159, labeled to contain 150 mg/capsule (manu-factured by Egyptian International Pharmaceutical Industries Company (EIPICO)).
Standard solutionsStandard solution of FLZ and oxidative degradation product (each 1mg.
mL-1) were prepared in methanol. Oxidative degradation product solution was prepared as described later and calculated with respect to pure FLZ. All solu-tions were freshly prepared and stored in a refrigerator to be used within 72 h.
ReagentsAcetonitrile was HPLC grade and supplied by Sigma-Aldrich(Steinheim,
Germany).35% hydrogen peroxide solution,33% aqueous ammonia solution, methanol, chloroform were supplied by Adwic, El-Nasr Pharm. Co. (Cairo, Egypt). Deionized water: bidistilled from “Aquatron” Automatic Water still A4000 was provided by sterillin (Staffordshire, England).
ProceduresOxidation of FLZAccelerated hydrogen peroxide-oxidation was performed by refluxing 100
mg of pure FLZ powder with 30 mL of 35 % hydrogen peroxide solution for 3 hrs. Then liquid was boiled on a small flame till free from hydrogen perox-ide and evaporated on rotary evaporator nearly to dryness and redissoled in
methanol. The main obtained product was elucidated using FTIR and MS. For quantitative assays, the oxidative degradation product was calculated in terms of the intact FLZ.
Spectral characteristicsThe absorption spectra of the FLZ and its oxidation product in methanol
were recorded over the range 200-400 nm using methanol as blank.
Construction of calibration graphsRatio difference method (RDSM)Working standard solutions containing 50-400 µg.mL-1 FLZ were prepared
separately in methanol using its corresponding standard solution (1 mg.mL-1). The absorption spectra of the resulting solutions were measured using metha-nol as blank and stored in the computer. The stored spectra of FLZ were di-vided by the spectrum of 100 µg.mL-1 of oxidative degradation product to ob-tain ratio spectra. A calibration curve was constructed relating the difference between the amplitudes of ratio spectra of FLZ at 261.5 and 266.5 nm versus the corresponding concentration of FLZ µg.mL-1, and the regression equation was computed.
Third derivative (D3) methodWorking standard solutions containing 50-400 µg.mL-1 FLZ were prepared
separately in methanol using its corresponding standard solution (1 mg.mL-1). The absorption spectra of the resulting solutions were measured using meth-anol as blank. Third derivative values of the obtained spectra (∆λ=4.00 nm, scale=100) at 265.5–268 nm (P-P) were plotted versus the corresponding con-centration, and regression equation was computed.
Ratio subtraction method (RSM)Working standard solutions containing 50-400 µg.mL-1 FLZ were prepared
in methanol using its corresponding standard solution (1 mg.mL-1). A calibra-tion curve was constructed relating the peak amplitudes 266.5 nm versus the corresponding concentrations of FLZ and the regression equation was com-puted.
First-derivative of ratio spectra (DD1) method Working standard solutions containing 50-400 µg.mL-1 FLZ were prepared
in methanol using its corresponding standard solution (1 mg.mL-1). The ab-sorption spectra of the resulting solutions were measured and divided by the absorption spectra of 100 µg.mL-1 oxidation product, where the obtained ratio spectra were differentiated with respect to wavelength. First derivative values (∆λ=4.00, scale=10) at 269 nm were plotted versus the corresponding concen-tration, and regression equation was computed.
Mean centering of ratio spectra (MCR) methodWorking standard solutions containing 50-400 µg.mL-1 FLZ were prepared
in methanol using its corresponding standard solution (1 mg.mL-1). The ab-sorption spectra of the resulting solutions were measured and divided by the absorption spectra of 100 µg.mL-1 oxidation product, where the obtained ratio spectra were mean centered. Mean center values at 266.5 nm were plotted ver-sus the corresponding concentration, and regression equation was computed.
Analysis of laboratory prepared mixtures containing different ratios of FLZ and its oxidative degradation product using the proposed methods
Ten laboratory prepared mixtures containing different ratios of FLZ and its oxidative degradation product were analyzed using the proposed methods. The concentrations of FLZ were calculated from the corresponding regression equations.
Assay of pharmaceutical formulations In case of capsules, all content of five capsules were evacuated and the
average weight was calculated, the contents were thoroughly mixed to furnish a homogeneous powder and certain amount of the powder was dissolved by the aid of an ultrasonic bath for 30 minutes in methanol (to ensure complete dissolution of FLZ), then filtered and made to volume with methanol to attain a concentration of FLZ of 1mg.mL-1. In case of syrup and I.V. solution, no sample preparation was required other than dilution of the dosage form with appropriate amount of methanol in order to have the same concentration of FLZ. Experimentation was preceded as mentioned under each method and the concentrations of FLZ were calculated from the corresponding regression equations.
J. Chil. Chem. Soc., 57, Nº 4 (2012)
1449
RESULTS AND DISCUSSION
FLZ was subjected to acid, alkaline hydrolysis and oxidation degradation. The drug was found to be degraded under oxidation condition.
The international conference on Harmonization (ICH) guideline entitled ‘stability testing of new drug substances and products” requires the stress test-ing to be carried out to elucidate the inherent stability characteristics of the active substance18. An ideal stability-indicating method is one that quantifies the standard drug alone without any interference from its degradation product. The presented work focused on the intact drug only as it is pharmacologically active with no need for analysis of its degradation product.
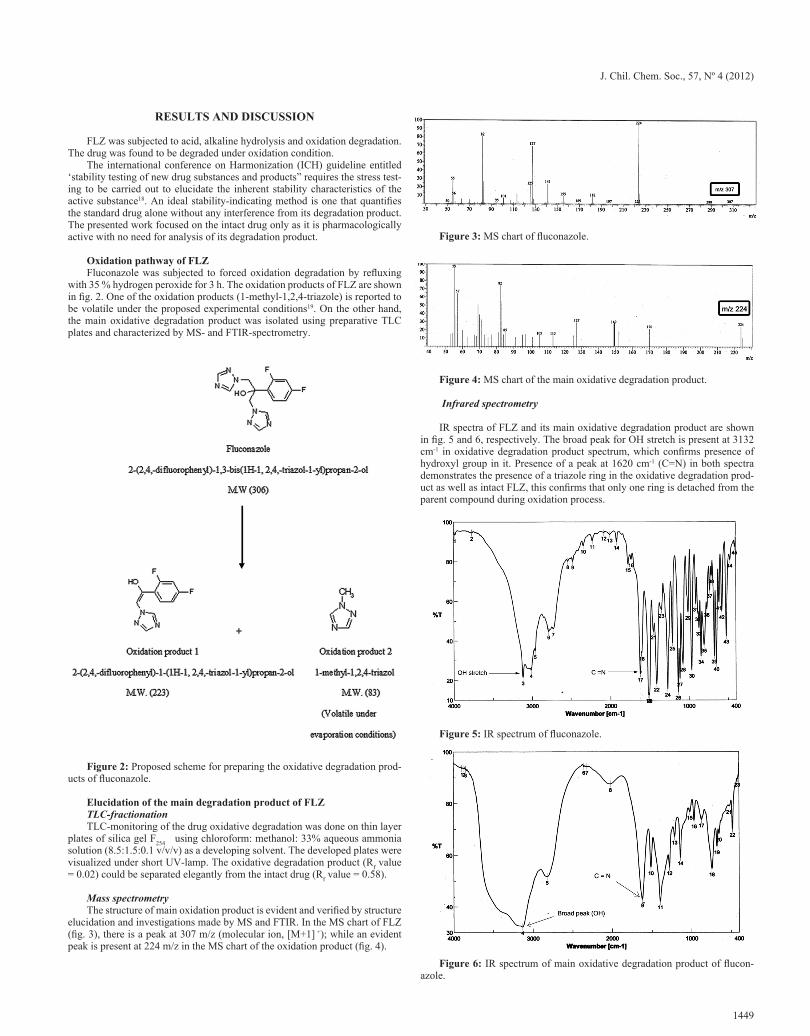
Oxidation pathway of FLZFluconazole was subjected to forced oxidation degradation by refluxing
with 35 % hydrogen peroxide for 3 h. The oxidation products of FLZ are shown in fig. 2. One of the oxidation products (1-methyl-1,2,4-triazole) is reported to be volatile under the proposed experimental conditions19. On the other hand, the main oxidative degradation product was isolated using preparative TLC plates and characterized by MS- and FTIR-spectrometry.
Figure 3: MS chart of fluconazole.
Figure 2: Proposed scheme for preparing the oxidative degradation prod-ucts of fluconazole.
Elucidation of the main degradation product of FLZTLC-fractionationTLC-monitoring of the drug oxidative degradation was done on thin layer
plates of silica gel F254 using chloroform: methanol: 33% aqueous ammonia solution (8.5:1.5:0.1 v/v/v) as a developing solvent. The developed plates were visualized under short UV-lamp. The oxidative degradation product (Rf value = 0.02) could be separated elegantly from the intact drug (Rf value = 0.58).
Mass spectrometryThe structure of main oxidation product is evident and verified by structure
elucidation and investigations made by MS and FTIR. In the MS chart of FLZ (fig. 3), there is a peak at 307 m/z (molecular ion, [M+1] +); while an evident peak is present at 224 m/z in the MS chart of the oxidation product (fig. 4).
Figure 5: IR spectrum of fluconazole.
Figure 4: MS chart of the main oxidative degradation product.
Infrared spectrometry
IR spectra of FLZ and its main oxidative degradation product are shown in fig. 5 and 6, respectively. The broad peak for OH stretch is present at 3132 cm-1 in oxidative degradation product spectrum, which confirms presence of hydroxyl group in it. Presence of a peak at 1620 cm-1 (C=N) in both spectra demonstrates the presence of a triazole ring in the oxidative degradation prod-uct as well as intact FLZ, this confirms that only one ring is detached from the parent compound during oxidation process.
Figure 6: IR spectrum of main oxidative degradation product of flucon-azole.

J. Chil. Chem. Soc., 57, Nº 4 (2012)
1450
Method DevelopmentAs shown in fig. 7, a severe overlap exists between spectra of both FLZ
and its oxidative degradation product. This overlap prevents direct determina-tion of FLZ in presence of its oxidative degradation product. To overcome this difficulty, the following stability-indicating spectrophotometric methods were developed.
Figure 8a: Ratio spectra of FLZ 50-400 µg.mL-1 using 100 µg.mL-1 of oxi-dative degradation product as a divisor showing difference of peak amplitudes of ratio spectra between λ1&λ2
Figure 8b: Ratio spectra of FLZ 100 µg.mL-1 ( ___ ), 50 µg.mL-1 of oxida-tive degradation product ( --- ), and laboratory-prepared mixture of both (with the same concentration of each) (…) using 100 µg.mL-1 of oxidative degrada-tion product as a divisor showing that the difference of peak amplitudes of ratio spectra atλ1&λ2 is constant for pure FLZ and the laboratory-prepared mixture containing same concentration.
The regression equation for amplitude difference (266.5 – 261.5 nm) ver-sus concentrations of FLZ is calculated
RD =0.0015 C +0.0003 r = 0.9999
Where RD is the amplitude difference, C is concentration of FLZ (µg.mL-
1) and r is the correlation coefficient.According the above theory, the division by the oxidative degradation
product spectrum gives a constant cancelled by subtraction. The method is valid in the presence of up to about 90 % oxidative degradation product.
Third derivative method (D3)The zero-order absorption spectra of FLZ and its oxidative degradation
product contain overlapping, which interferes with the direct determination of FLZ, (fig. 7).Applying third derivative for both FLZ and oxidative degradation product could resolve this difficulty.
The derivative values in the considered spectral region of 200 – 300 nm were determined by 2 graphical measurements: peak-zero (P-O) and peak-peak (P-P). In the P-O technique, the measurement was made from a maximum to zero line or from a minimum to zero line. In P-P technique, the determination was made by measuring the amplitude from a maximum to a minimum of the spectral curve (fig. 9). In order to optimize D3 method, different smoothing and scaling factors were tested, where a smoothing factor ∆λ= 4 and a scaling factor = 100 showed a suitable signal to noise ratio and the spectra showed good resolution. Thus using the two techniques, FLZ can be determined in the standard solution at the following wavelengths: 263, 265.5 and 268 nm [P-0] and 263-265.5 and 265.5-268 nm [P-P] for the third derivative. A linear rela-tionship was obtained in the range of 50 – 400 µg.mL-1 for FLZ, corresponding regression equations were computed and found to be:
Figure 7: Zero-order absorption spectra of 100 mg.mL-1 pure fluconazole ( ___ ) and 100 mg.mL-1 oxidative degradation product ( - - - ) and a laboratory-prepared mixture of them (…) in methanol.
Since the UV cutoff of the used solvent (methanol) is 205 nm20, and all measurements were made away from this wavelength, so no absorption bands overlap is noted and there was no interference in the measurements.
Ratio difference spectrophotometric method (RDSM)The most striking feature of the ratio difference method is its simplicity,
rapidity and accuracy. This is a newly developed method having the ability for solving severely overlapped spectra without prior separation meanwhile it doesn’t require any sophisticated apparatus or computer programs.
The utility of ratio difference method is to calculate the unknown concen-tration of a component of interest present in a mixture containing both compo-nent of interest and an unwanted interfering component.
For the determination of concentration of component of interest by the ratio difference method, there is no requirement for the selection of the two wavelengths λ1&λ2 where the ratio spectrum of the interfering component shows the same amplitudes (constant) whereas the component of interest shows significant difference in these two values at the selected wavelengths with concentration.
The overlapped spectra of FLZ and its oxidative degradation product sug-gest that a ratio difference spectrophotometric method is a suitable method for stability-indicating determination of FLZ in presence of its oxidative degrada-tion product. In ratio difference method, the amplitude at261.5 and 266.5nm are selected for determination of FLZ using ratio spectrum of the mixture and (100 µg.mL-1) of oxidative degradation product as a divisor (fig. 8).

J. Chil. Chem. Soc., 57, Nº 4 (2012)
1451
D3 = 0.0115 C + 0.0762 r = 0.9998, at 263 nmD3 = 0.017 C + 0.0796 r = 0.9999, at 265.5 nmD3 = 0.0149 C + 0.0572 r = 0.9999, at 268 nmD3 = 0.0286 C + 0.1558 r = 0.9999, at 263-265.5 nmD3 = 0.0319 C + 0.1368 r = 0.9999, at 265.5 -268 nm
Where D3 is the amplitude of the third-derivative curve (AA/AA) at the corresponding wavelength, C is the concentration of FLZ (µg.mL-1) and r is the correlation coefficient.
Figure 9: Third-derivative spectra of 50 - 400 mg.mL-1 pure ( ___ ) and 100 mg.mL-1 oxidation product ( - - - ) in methanol.
By applying the proposed method at the two graphical measurement tech-niques at different chosen wavelengths, FLZ can be determined with mean percentage recoveries with regard to good correlation (r=0.9999), precision [relative standard deviation (RSD) bellow 1%), and accuracy (recovery about 100%) of FLZ analysis in the standard solution, the best measurement tech-nique was 265.5-268 nm (P-P) which shows the most accurate and the best correlation coefficient.
It was found that peak amplitude (265.5-268 nm) (P-P) showed good se-lectivity without interference of up to 66% of oxidative degradation product (corresponding to zero contribution of the oxidative degradation product).
By dividing peak amplitudes of the third derivative of different concentra-tions of standard FLZ at 265.5 and 268 nm, the ratio was constant (P265.4/P268.2
= 1.15) for different pure FLZ concentrations and also for laboratory prepared mixtures containing up to 66% of oxidative degradation product, this ensures that no interference is made by the oxidative degradation product.
Ratio subtraction method (RSM)The ratio subtraction method was applied to determine FLZ (X) in pres-
ence of its oxidative degradation product in laboratory-prepared mixtures by dividing the spectrum of the mixture by a known concentration of 100 µg/mL oxidative degradation product (Y’) as a divisor. The division will give a new curve that represents a spectrum as in:,fig. 10. In this spectrum, there is a small portion which is constant in absorbance. If we subtract this constant, we will get fig. 11then multiply the new curve obtained after subtraction by Y’ (the devisor), therefore we can obtain the original zero order spectra of FLZ (X) in the mixture, fig. 12. It is clear from the figure that an identical spectrum of FLZ was obtained after division by the chosen divisor, subtraction of the constant, then multiplication by the same divisor.
The regression equation for absorbance at its λmax (261 nm) versus concen-trations of FLZ in µg/mL is calculated:
A = 0.0023 C + 0.002 r = 0.9998
Where A is the absorbance, C is concentration of FLZ (µg.mL-1) and r is the correlation coefficient. The mean percentage recovery was found to 100.3±0.66
The method is valid in the presence of up to about 90 % oxidative degrada-tion product in different laboratory prepared mixtures as presented in table I.
Figure 10: Division spectra of laboratory-prepared mixture of fluconazole and its oxidative degradation product using 100 µg.mL-1 of oxidative degradation product as a divisor and methanol as a solvent.
Figure 11: Division spectra of laboratory-prepared mixture of fluconazole and its oxidative degradation product using 100 µg.mL-1 of oxidative degrada-tion product as a divisor and methanol as a solvent after subtraction of the constant.
Figure 12: The obtained zero order absorption spectrum of 100 µg.mL-1
fluconazole ( ___ ) from laboratory-prepared mixture after multiplication by the divisor using the proposed method and the original spectrum of 50 µg.mL-1
intact (pure) fluconazole (- - -).
J. Chil. Chem. Soc., 57, Nº 4 (2012)
1452
Table I: Determination of FLZ in laboratory-prepared mixtures by the proposed methods.
Determina-tion of intact Fluconazole in lab. Mix.
Ratio Differ-ence
Methoda
Third De-
rivative Methodb
Ratio Subtrac-
tion Methodc
De-rivative Ratio
Methodd
Mean Centering Methode
Mean ± S.D. 101.16 ± 0.92
99.96 ± 0.47
100.25 ± 0.62
99.99 ± 0.82
100.64 ± 0.83
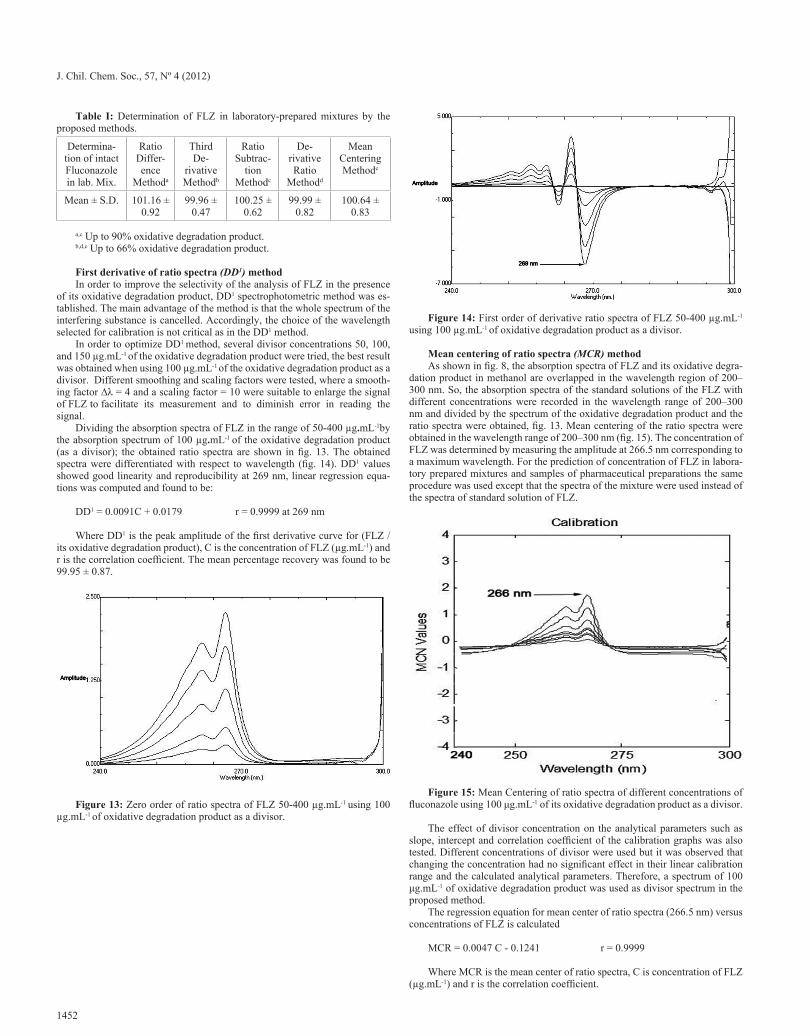
a,c Up to 90% oxidative degradation product.b,d,e Up to 66% oxidative degradation product. First derivative of ratio spectra (DD1) methodIn order to improve the selectivity of the analysis of FLZ in the presence
of its oxidative degradation product, DD1 spectrophotometric method was es-tablished. The main advantage of the method is that the whole spectrum of the interfering substance is cancelled. Accordingly, the choice of the wavelength selected for calibration is not critical as in the DD1 method.
In order to optimize DD1 method, several divisor concentrations 50, 100, and 150 µg.mL-1 of the oxidative degradation product were tried, the best result was obtained when using 100 µg.mL-1 of the oxidative degradation product as a divisor. Different smoothing and scaling factors were tested, where a smooth-ing factor ∆λ = 4 and a scaling factor = 10 were suitable to enlarge the signal of FLZ to facilitate its measurement and to diminish error in reading the signal.
Dividing the absorption spectra of FLZ in the range of 50-400 µg.mL-1by the absorption spectrum of 100 µg.mL-1 of the oxidative degradation product (as a divisor); the obtained ratio spectra are shown in fig. 13. The obtained spectra were differentiated with respect to wavelength (fig. 14). DD1 values showed good linearity and reproducibility at 269 nm, linear regression equa-tions was computed and found to be:
DD1 = 0.0091C + 0.0179 r = 0.9999 at 269 nm
Where DD1 is the peak amplitude of the first derivative curve for (FLZ / its oxidative degradation product), C is the concentration of FLZ (µg.mL-1) and r is the correlation coefficient. The mean percentage recovery was found to be 99.95 ± 0.87.
Figure 14: First order of derivative ratio spectra of FLZ 50-400 µg.mL-1
using 100 µg.mL-1 of oxidative degradation product as a divisor.
Mean centering of ratio spectra (MCR) methodAs shown in fig. 8, the absorption spectra of FLZ and its oxidative degra-
dation product in methanol are overlapped in the wavelength region of 200–300 nm. So, the absorption spectra of the standard solutions of the FLZ with different concentrations were recorded in the wavelength range of 200–300 nm and divided by the spectrum of the oxidative degradation product and the ratio spectra were obtained, fig. 13. Mean centering of the ratio spectra were obtained in the wavelength range of 200–300 nm (fig. 15). The concentration of FLZ was determined by measuring the amplitude at 266.5 nm corresponding to a maximum wavelength. For the prediction of concentration of FLZ in labora-tory prepared mixtures and samples of pharmaceutical preparations the same procedure was used except that the spectra of the mixture were used instead of the spectra of standard solution of FLZ.
Figure 13: Zero order of ratio spectra of FLZ 50-400 µg.mL-1 using 100 µg.mL-1 of oxidative degradation product as a divisor.
Figure 15: Mean Centering of ratio spectra of different concentrations of fluconazole using 100 μg.mL-1 of its oxidative degradation product as a divisor.
The effect of divisor concentration on the analytical parameters such as slope, intercept and correlation coefficient of the calibration graphs was also tested. Different concentrations of divisor were used but it was observed that changing the concentration had no significant effect in their linear calibration range and the calculated analytical parameters. Therefore, a spectrum of 100 μg.mL-1 of oxidative degradation product was used as divisor spectrum in the proposed method.
The regression equation for mean center of ratio spectra (266.5 nm) versus concentrations of FLZ is calculated
MCR = 0.0047 C - 0.1241 r = 0.9999
Where MCR is the mean center of ratio spectra, C is concentration of FLZ (µg.mL-1) and r is the correlation coefficient.
J. Chil. Chem. Soc., 57, Nº 4 (2012)
1453
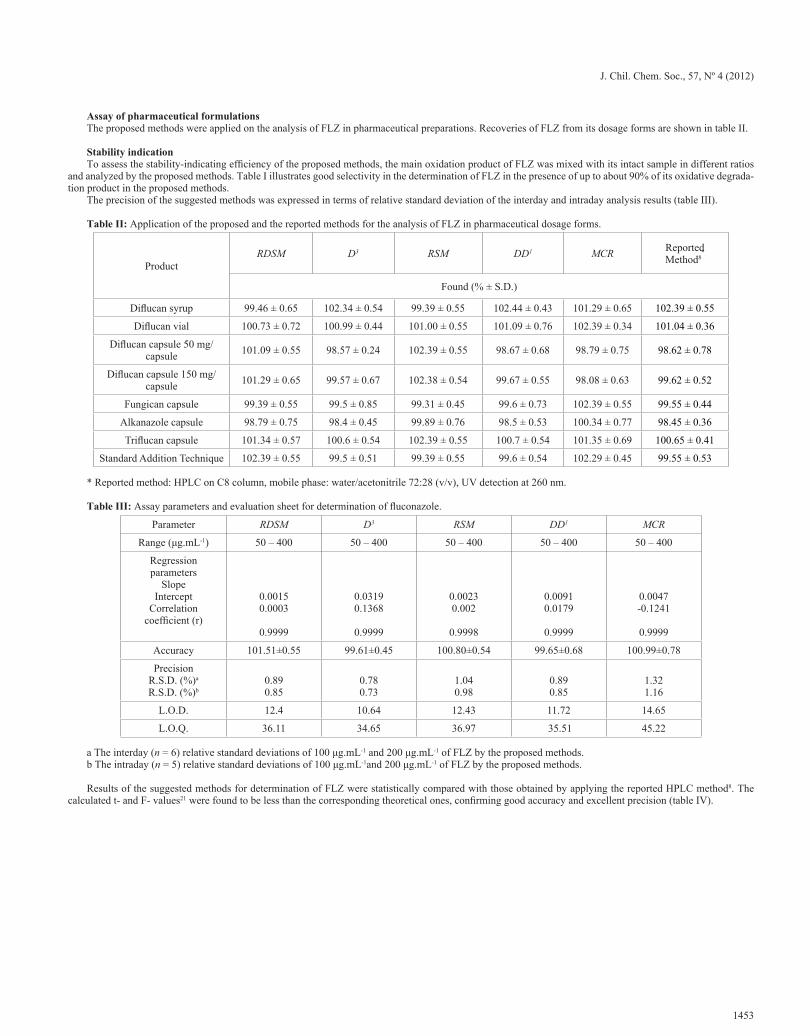
Assay of pharmaceutical formulationsThe proposed methods were applied on the analysis of FLZ in pharmaceutical preparations. Recoveries of FLZ from its dosage forms are shown in table II.
Stability indicationTo assess the stability-indicating efficiency of the proposed methods, the main oxidation product of FLZ was mixed with its intact sample in different ratios
and analyzed by the proposed methods. Table I illustrates good selectivity in the determination of FLZ in the presence of up to about 90% of its oxidative degrada-tion product in the proposed methods.
The precision of the suggested methods was expressed in terms of relative standard deviation of the interday and intraday analysis results (table III).
Table II: Application of the proposed and the reported methods for the analysis of FLZ in pharmaceutical dosage forms.
ProductRDSM D3 RSM DD1 MCR Reported
Method8*
Found (% ± S.D.)
Diflucan syrup 99.46 ± 0.65 102.34 ± 0.54 99.39 ± 0.55 102.44 ± 0.43 101.29 ± 0.65 102.39 ± 0.55
Diflucan vial 100.73 ± 0.72 100.99 ± 0.44 101.00 ± 0.55 101.09 ± 0.76 102.39 ± 0.34 101.04 ± 0.36
Diflucan capsule 50 mg/capsule 101.09 ± 0.55 98.57 ± 0.24 102.39 ± 0.55 98.67 ± 0.68 98.79 ± 0.75 98.62 ± 0.78
Diflucan capsule 150 mg/capsule 101.29 ± 0.65 99.57 ± 0.67 102.38 ± 0.54 99.67 ± 0.55 98.08 ± 0.63 99.62 ± 0.52
Fungican capsule 99.39 ± 0.55 99.5 ± 0.85 99.31 ± 0.45 99.6 ± 0.73 102.39 ± 0.55 99.55 ± 0.44
Alkanazole capsule 98.79 ± 0.75 98.4 ± 0.45 99.89 ± 0.76 98.5 ± 0.53 100.34 ± 0.77 98.45 ± 0.36
Triflucan capsule 101.34 ± 0.57 100.6 ± 0.54 102.39 ± 0.55 100.7 ± 0.54 101.35 ± 0.69 100.65 ± 0.41
Standard Addition Technique 102.39 ± 0.55 99.5 ± 0.51 99.39 ± 0.55 99.6 ± 0.54 102.29 ± 0.45 99.55 ± 0.53
* Reported method: HPLC on C8 column, mobile phase: water/acetonitrile 72:28 (v/v), UV detection at 260 nm.
Table III: Assay parameters and evaluation sheet for determination of fluconazole.
Parameter RDSM D3 RSM DD1 MCR
Range (μg.mL-1) 50 – 400 50 – 400 50 – 400 50 – 400 50 – 400
Regression parameters
SlopeIntercept
Correlation coefficient (r)
0.00150.0003
0.9999
0.03190.1368
0.9999
0.00230.002
0.9998
0.00910.0179
0.9999
0.0047-0.1241
0.9999
Accuracy 101.51±0.55 99.61±0.45 100.80±0.54 99.65±0.68 100.99±0.78
PrecisionR.S.D. (%)a
R.S.D. (%)b0.890.85
0.780.73
1.040.98
0.890.85
1.321.16
L.O.D. 12.4 10.64 12.43 11.72 14.65
L.O.Q. 36.11 34.65 36.97 35.51 45.22
a The interday (n = 6) relative standard deviations of 100 μg.mL-1 and 200 μg.mL-1 of FLZ by the proposed methods.b The intraday (n = 5) relative standard deviations of 100 μg.mL-1and 200 μg.mL-1 of FLZ by the proposed methods.
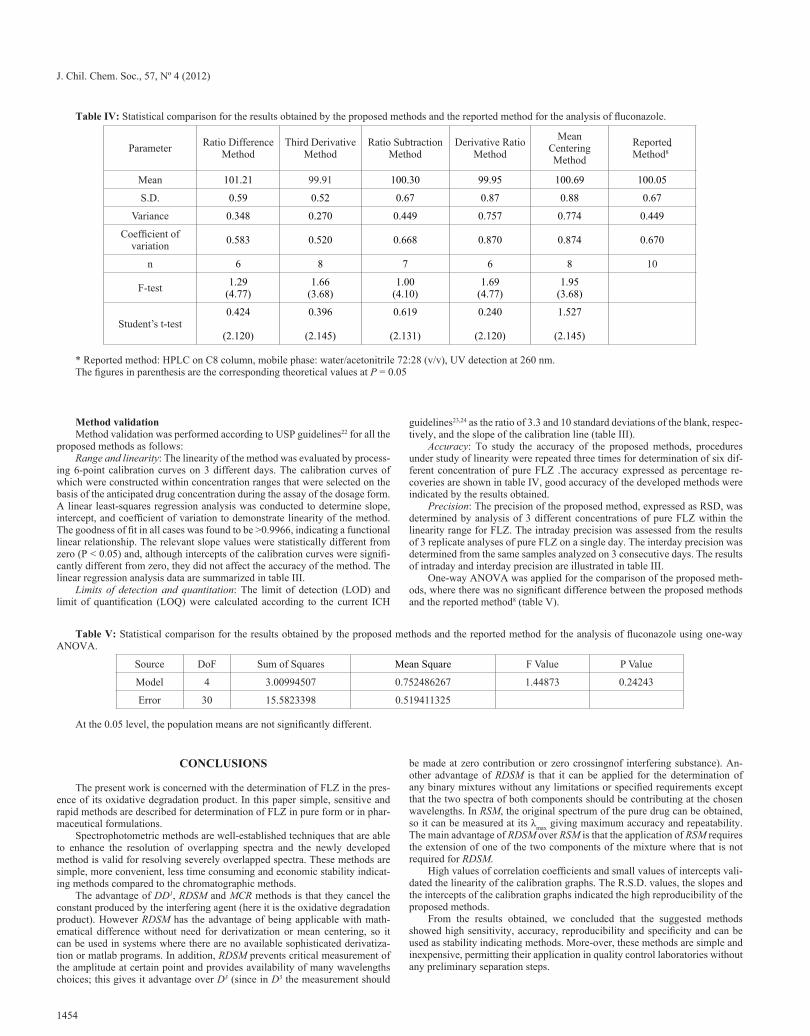
Results of the suggested methods for determination of FLZ were statistically compared with those obtained by applying the reported HPLC method8. The calculated t- and F- values21 were found to be less than the corresponding theoretical ones, confirming good accuracy and excellent precision (table IV).
J. Chil. Chem. Soc., 57, Nº 4 (2012)
1454
Table IV: Statistical comparison for the results obtained by the proposed methods and the reported method for the analysis of fluconazole.
Parameter Ratio Difference Method
Third Derivative Method
Ratio Subtraction Method
Derivative Ratio Method
Mean Centering Method
Reported Method8
*
Mean 101.21 99.91 100.30 99.95 100.69 100.05
S.D. 0.59 0.52 0.67 0.87 0.88 0.67
Variance 0.348 0.270 0.449 0.757 0.774 0.449
Coefficient of variation 0.583 0.520 0.668 0.870 0.874 0.670
n 6 8 7 6 8 10
F-test 1.29(4.77)
1.66(3.68)
1.00(4.10)
1.69(4.77)
1.95(3.68)
Student’s t-test0.424
(2.120)
0.396
(2.145)
0.619
(2.131)
0.240
(2.120)
1.527
(2.145)
* Reported method: HPLC on C8 column, mobile phase: water/acetonitrile 72:28 (v/v), UV detection at 260 nm.The figures in parenthesis are the corresponding theoretical values at P = 0.05
Method validationMethod validation was performed according to USP guidelines22 for all the
proposed methods as follows: Range and linearity: The linearity of the method was evaluated by process-
ing 6-point calibration curves on 3 different days. The calibration curves of which were constructed within concentration ranges that were selected on the basis of the anticipated drug concentration during the assay of the dosage form. A linear least-squares regression analysis was conducted to determine slope, intercept, and coefficient of variation to demonstrate linearity of the method. The goodness of fit in all cases was found to be >0.9966, indicating a functional linear relationship. The relevant slope values were statistically different from zero (P < 0.05) and, although intercepts of the calibration curves were signifi-cantly different from zero, they did not affect the accuracy of the method. The linear regression analysis data are summarized in table III.
Limits of detection and quantitation: The limit of detection (LOD) and limit of quantification (LOQ) were calculated according to the current ICH
guidelines23,24 as the ratio of 3.3 and 10 standard deviations of the blank, respec-tively, and the slope of the calibration line (table III).
Accuracy: To study the accuracy of the proposed methods, procedures under study of linearity were repeated three times for determination of six dif-ferent concentration of pure FLZ .The accuracy expressed as percentage re-coveries are shown in table IV, good accuracy of the developed methods were indicated by the results obtained.
Precision: The precision of the proposed method, expressed as RSD, was determined by analysis of 3 different concentrations of pure FLZ within the linearity range for FLZ. The intraday precision was assessed from the results of 3 replicate analyses of pure FLZ on a single day. The interday precision was determined from the same samples analyzed on 3 consecutive days. The results of intraday and interday precision are illustrated in table III.
One-way ANOVA was applied for the comparison of the proposed meth-ods, where there was no significant difference between the proposed methods and the reported method8 (table V).
Table V: Statistical comparison for the results obtained by the proposed methods and the reported method for the analysis of fluconazole using one-way ANOVA.
Source DoF Sum of Squares Mean Square F Value P Value
Model 4 3.00994507 0.752486267 1.44873 0.24243
Error 30 15.5823398 0.519411325
At the 0.05 level, the population means are not significantly different.
CONCLUSIONS
The present work is concerned with the determination of FLZ in the pres-ence of its oxidative degradation product. In this paper simple, sensitive and rapid methods are described for determination of FLZ in pure form or in phar-maceutical formulations.
Spectrophotometric methods are well-established techniques that are able to enhance the resolution of overlapping spectra and the newly developed method is valid for resolving severely overlapped spectra. These methods are simple, more convenient, less time consuming and economic stability indicat-ing methods compared to the chromatographic methods.
The advantage of DD1, RDSM and MCR methods is that they cancel the constant produced by the interfering agent (here it is the oxidative degradation product). However RDSM has the advantage of being applicable with math-ematical difference without need for derivatization or mean centering, so it can be used in systems where there are no available sophisticated derivatiza-tion or matlab programs. In addition, RDSM prevents critical measurement of the amplitude at certain point and provides availability of many wavelengths choices; this gives it advantage over D3 (since in D3 the measurement should
be made at zero contribution or zero crossingnof interfering substance). An-other advantage of RDSM is that it can be applied for the determination of any binary mixtures without any limitations or specified requirements except that the two spectra of both components should be contributing at the chosen wavelengths. In RSM, the original spectrum of the pure drug can be obtained, so it can be measured at its λmax giving maximum accuracy and repeatability. The main advantage of RDSM over RSM is that the application of RSM requires the extension of one of the two components of the mixture where that is not required for RDSM.
High values of correlation coefficients and small values of intercepts vali-dated the linearity of the calibration graphs. The R.S.D. values, the slopes and the intercepts of the calibration graphs indicated the high reproducibility of the proposed methods.
From the results obtained, we concluded that the suggested methods showed high sensitivity, accuracy, reproducibility and specificity and can be used as stability indicating methods. More-over, these methods are simple and inexpensive, permitting their application in quality control laboratories without any preliminary separation steps.

J. Chil. Chem. Soc., 57, Nº 4 (2012)
1455
11. D. J. Conrado, E. C. Palma, C. A. M. Fraga, E. J. Barriero, S. M. K. Rates, and T. D. Costa. Journal of Pharmaceutical and Biomedical Analysis. 43, 677, (2007).
12. S. Khundker, J. R. Dean, and P. Jones. Journal of Pharmaceutical and Biomedical Analysis. 13, 1441, (1995).
13. D. Debruyne, J. P. Ryckelynck, M. C. Bigot, and M. Moulin. J. Pharm. Sci.77, 534, (1988).
14. S. C. Harris, J. E. Wallace, G. Foulds, and M. G. Rinaldi. Antimicrobial Agents and Chemotherapy. 33, 714, (1989).
15. A. B. Rege, J. Y. Walker-Cador, R. A. Clark, J. J. Lertora, J. N. E. Hys-lop, and W. J. George. Antimicrobial Agents and Chemotherapy. 36, 647, (1992).
16. F. VonHeeren, R. Tanner, R. Theurillat, and W. Thormann. Journal of Chromatography A. 745, 165, (1996).
17. R. T. Sane, A. A. Fulay, and A. N. Joshi. Indian Drugs. 31, 207, (1994).18. ICH, Stability Testing of New Drug Substances and Products, Interna-
tional Conference on Harmonization, Geneva, 1993.19. M. R. Atkinson and J. B. Polya. J. Chem. Soc. 141, (1954).20. http://www.molecularinfo.com/MTM/G/G3/G3-1/G3-1-11.html, cited in
July 2012.21. M. R. Spiegel and L. J. S. Schaum. Outline of Theory and Problems of
Statistics, Schaum Outline Series: New York, 1999.22. The United States Pharmacopeia and National Formulary, The Official
Compendia of Standards, Asian Edition, USP 30-NF 25 The United States Pharmacopeial Convention Inc., Rockvill, MD, 2007.
23. ICH(Q2A) Note for guidance on validation of analytical methods: defini-tion and terminology. International Conference on Harmonization, IF-PMA, Geneva, 1994.
24. ICH(Q2B) Note for guidance on validation of of analytical methods meth-odology. International Conference on Harmonization, IFPMA, Geneva, 1996.
ACKNOWLEDGMENTS
Authors would like to express their deep thanks to “Amoun Pharmaceu-tical Co.”(El-Obour City, Cairo, Egypt) for supply of authentic fluconazole. Also special appreciation to “Micro Analytical Center”, Faculty of Science, Cairo University, for their help in obtaining IR and MS spectra of compounds under study.
REFERENCES
1. J. E. Bennett. Goodman-Gilman, The Pharmaceutical Basis of Therapeu-tics, Mc-Graw-Hill, 1992.
2. S. C. Creaser, J. W. Stygall, D. V. Bowen, and F. S. Pullen. Talanta. 44, 1025, (1997).
3. I. Baranowska, P. Markowski, and J. Baranowski. Analytica Chimica Acta. 570, 46, (2006).
4. C. H. W. Koks, H. Rosing, P. L. Meenhorst, A. Bult, and J. H. Beijnen. Journal of Chromatography B. 663, 345, (1995).
5. F. X. Mathy, B. Vroman, D. Ntivunwa, A. J. D. Winne, R. K. Verbeeck, and V. Preat. Journal of Chromatography B. 787, 323, (2003).
6. S. S. Kim, H. K. Im, I. M. Kang, H. S. Lee, H. W. Lee, S. H. Cho, J. B. Kim, and K. T. Lee. Journal of Chromatography B. 852, 174, (2007).
7. P. A. Majcherczyk, P. Moreillon, L. A. Decosterd, D. Sanglard, J. Bille, M. P. Glauser, and O. Marchetti. Journal of Pharmaceutical and Bio-medical Analysis. 28, 645, (2002).
8. M. Cociglio, S. Brandissou, R. Alric, and F. Bressolle. Journal of Chro-matography B. 686, 11, (1996).
9. A. Eerkes, Z. S. Wilson, and W. Naidong. Journal of Pharmaceutical and Biomedical Analysis. 31, 917, (2003).
10. S. Sun, H. Lou, Y. Gao, P. Fan, B. Ma, W. Ge, and X. Wang. Journal of Pharmaceutical and Biomedical Analysis. 34, 1117, (2004).