Embed Size (px)
Citation preview
Haydee Acebo, Cokiliar Brown-Smith, AJ Clark, Elijah German.
Business Research Methods
QNT/561Dr. Warren HuckabayJuly 18, 2011
Team A

Table of Contents
1
•Business Problem
2
•Research Question
3
•Hypothesis
4
•Hypothesis Testing Procedure
5
•Study Variables
6 -7
•Data Collection Plan
8
•Data Collection Results
9
•Conclusion
10
•References
Team A
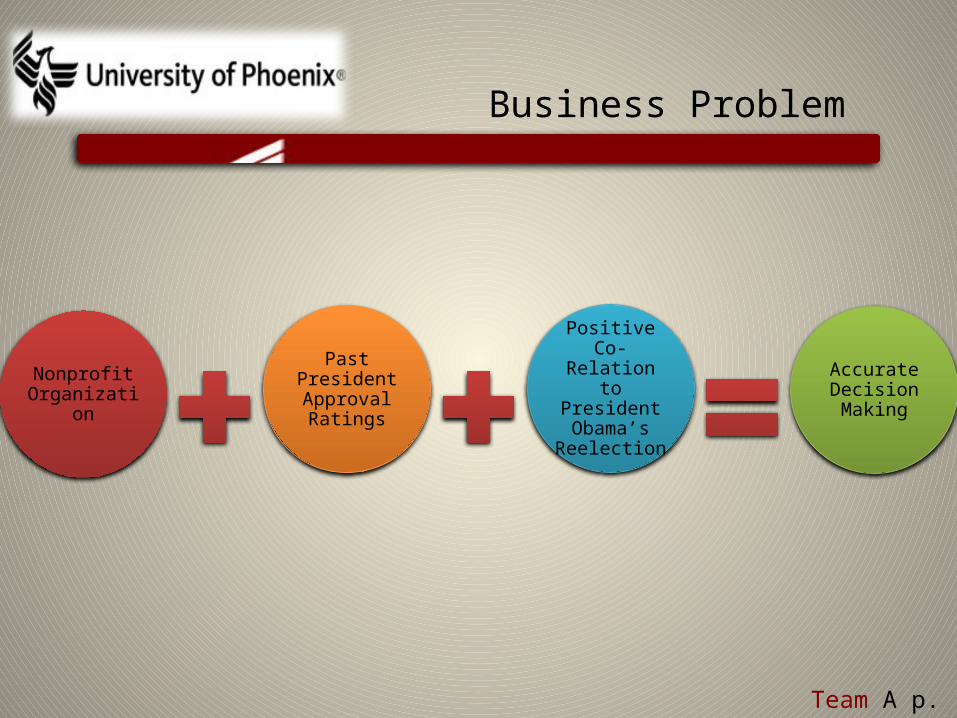
Nonprofit Organizatio
n
Past President Approval Ratings
Positive Co-Relation to President Obama’s
Reelection
Business Problem
Accurate Decision Making
Team A p. 1
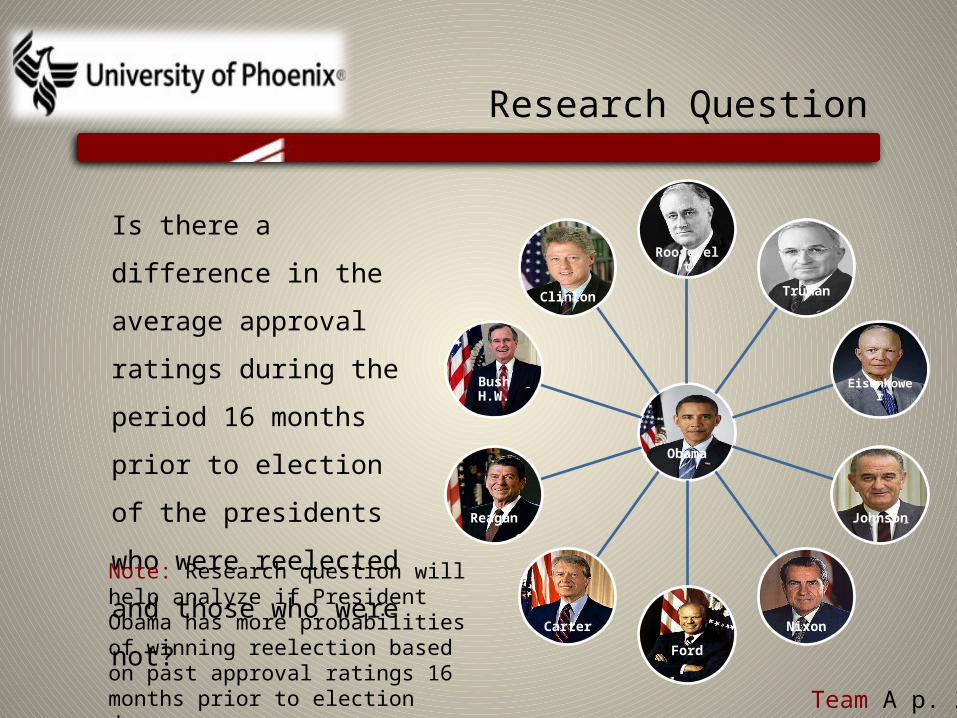
Research Question
Team A p. 2
Is there a difference in
the average approval
ratings during the
period 16 months prior
to election of the
presidents who were
reelected and those
who were not?
Obama
Roosevelt
Truman
Eisenhower
Johnson
Nixon
Ford
Carter
Reagan
Bush H.W.
Clinton
Note: Research question will help analyze if President Obama has more probabilities of winning reelection based on past approval ratings 16 months prior to election day.
Hypothesis
Team A p. 3
0:
0:
211
210
H
H
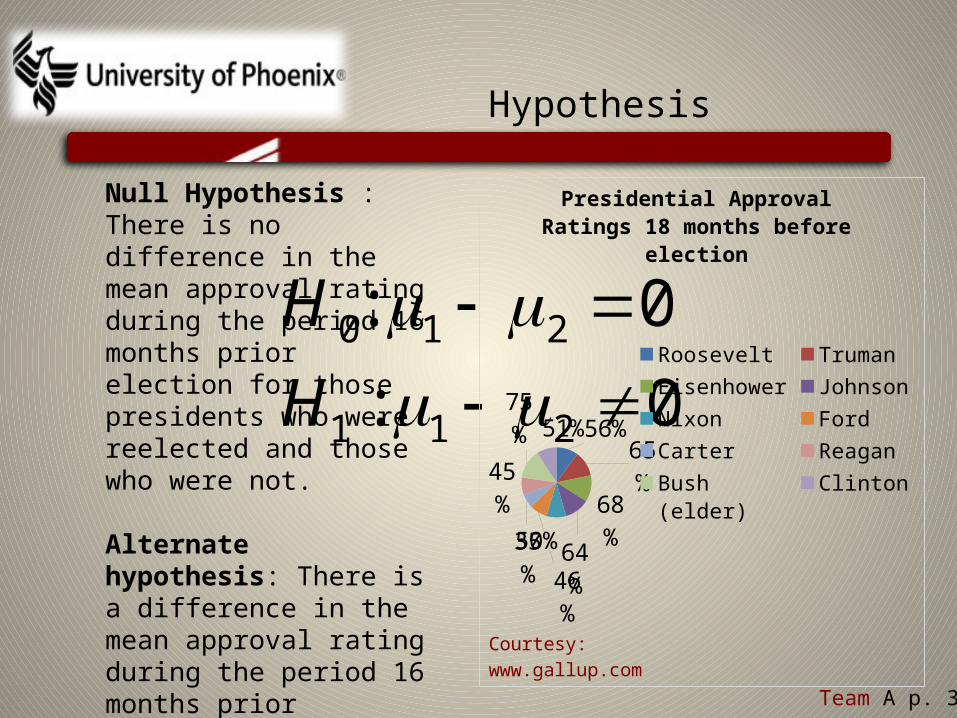
Null Hypothesis : There is no difference in the mean approval rating during the period 16 months prior election for those presidents who were reelected and those who were not.
Alternate hypothesis: There is a difference in the mean approval rating during the period 16 months prior election for those presidents who were reelected and those who were not.
56%
65%
68%
64%50%46
%
35%
45%
75%
51%
Presidential Approval Ratings 18 months before election
RooseveltTrumanEisenhowerJohnsonNixonFordCarterReaganBush (elder)Clinton
Courtesy: www.gallup.-com
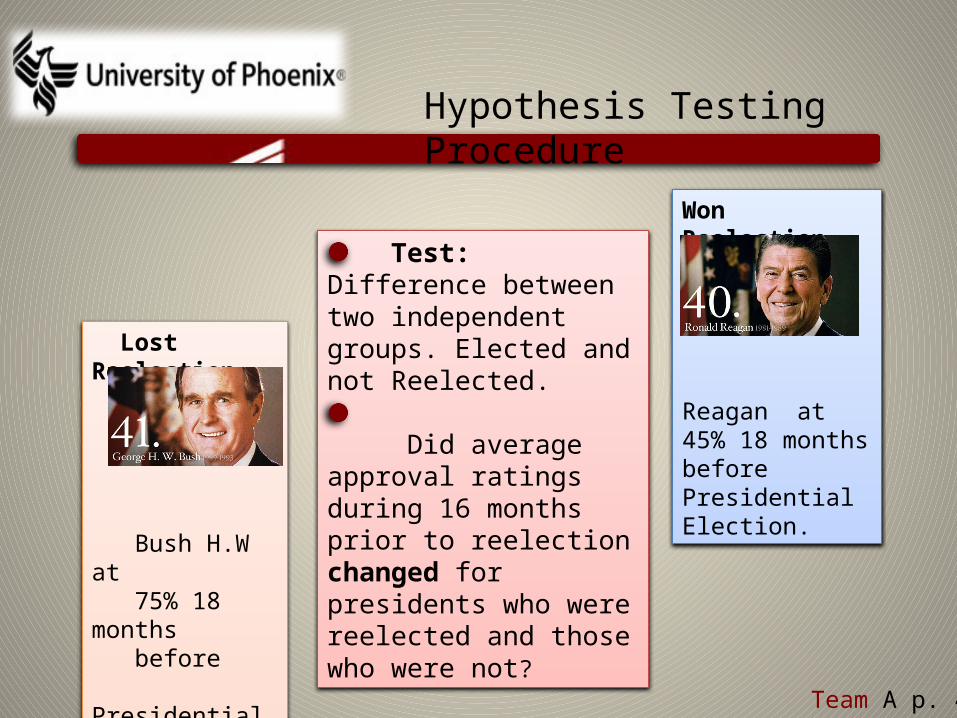
Hypothesis Testing Procedure
Team A p. 4
Test: Difference between two independent groups. Elected and not Reelected.
Did average approval ratings during 16 months prior to reelection changed for presidents who were reelected and those who were not?
Won Reelection
Reagan at 45% 18 months before Presidential Election.
Lost Reelection
Bush H.W at 75% 18 months before Presidential Election.
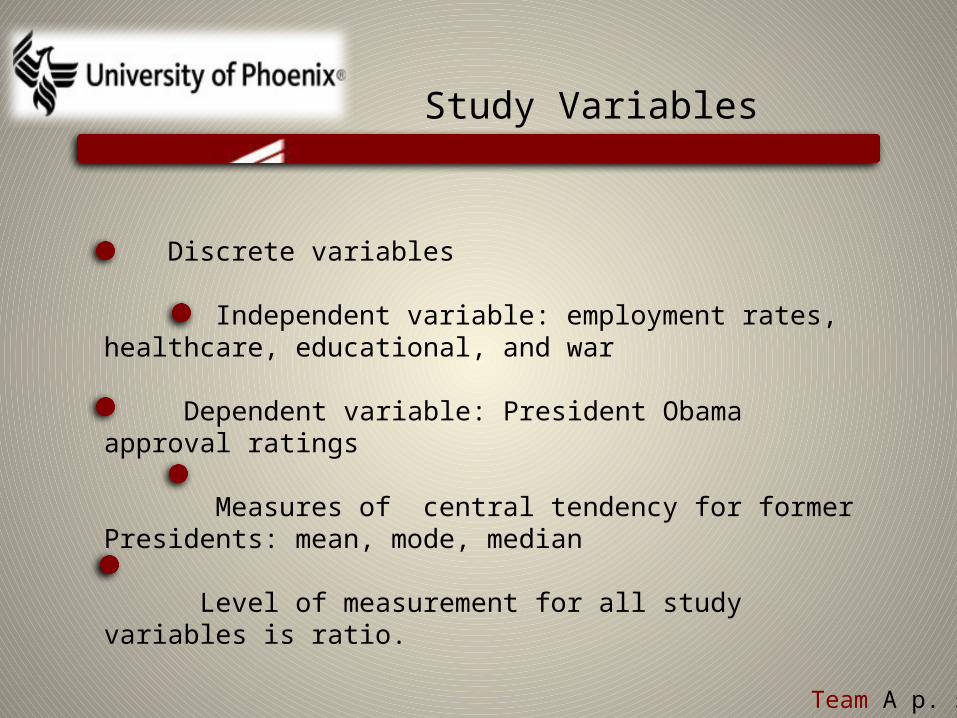
Study Variables
Team A p. 5
Discrete variables
Independent variable: employment rates, healthcare, educational, and war
Dependent variable: President Obama approval ratings
Measures of central tendency for former Presidents: mean, mode, median
Level of measurement for all study variables is ratio.
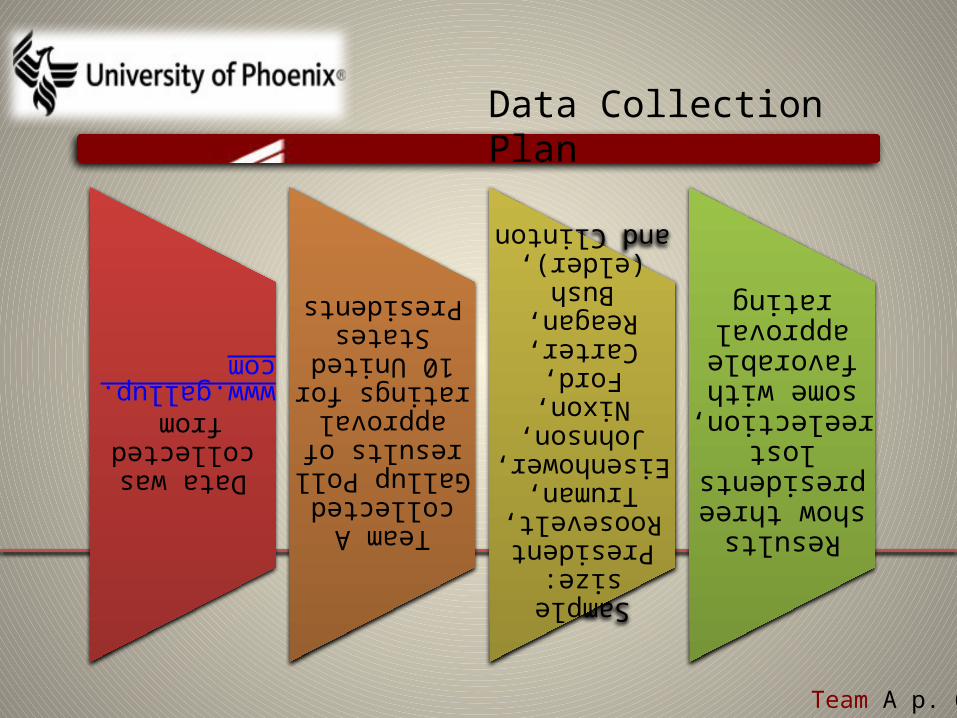
Data Collection Plan
Team A p. 6
Data was collected from www.gallup.com
Team A collected Gallup Poll results of approval ratings for 10
United States Presidents
Sample size: President Roosevelt, Truman, Eisenhower, Johnson, Nixon, Ford, Carter, Reagan,
Bush (elder), and Clinton
Results show three presidents lost reelection, some with favorable approval rating
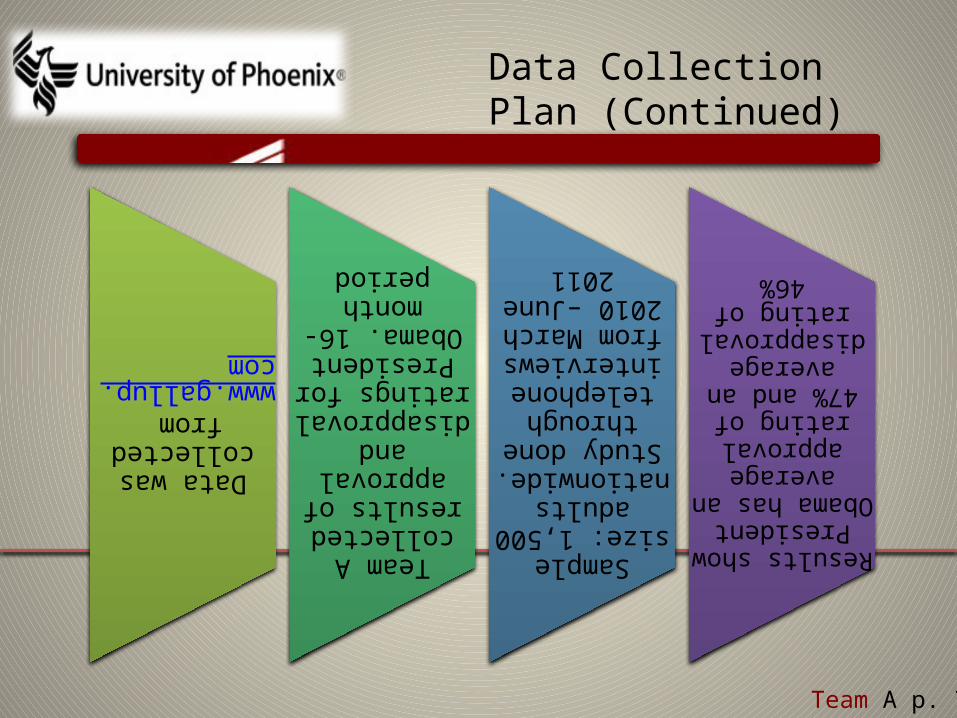
Data Collection Plan (Continued)
Team A p. 7
Data was collected from www.gallup.com
Team A collected results of approval and disapproval ratings for President Obama. 16-month
period
Sample size: 1,500 adults nationwide. Study done through telephone interviews from March
2010 –June 2011
Results show President Obama has an average approval rating of 47% and an average disapproval rating
of 46%
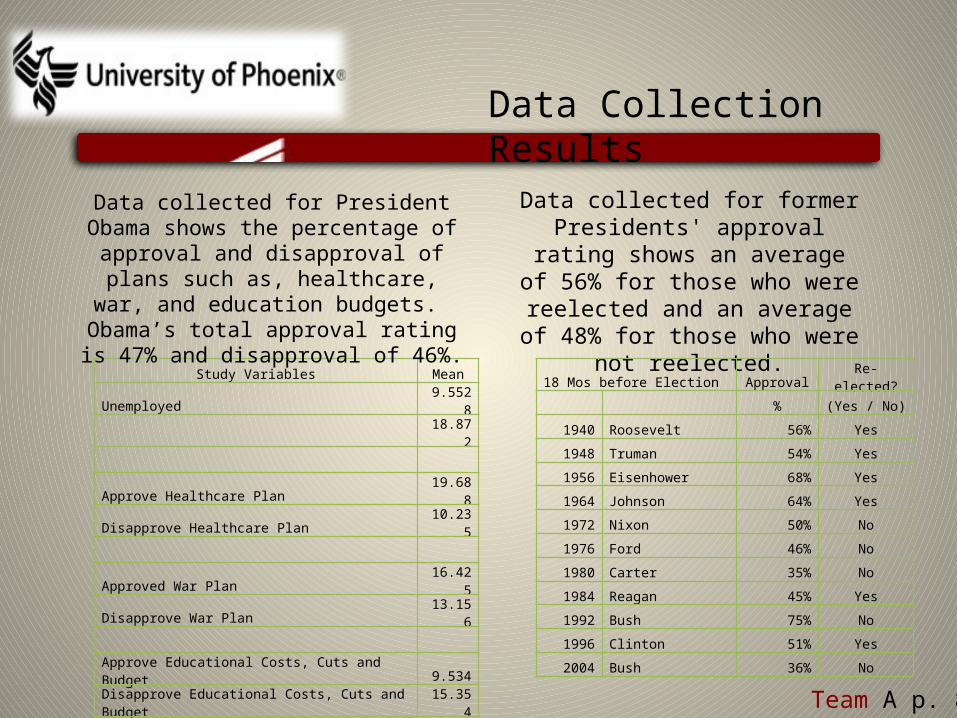
Data Collection Results
Team A p. 8
Study Variables Mean
Unemployed 9.5528
18.872
Approve Healthcare Plan 19.688
Disapprove Healthcare Plan 10.235
Approved War Plan 16.425
Disapprove War Plan 13.156
Approve Educational Costs, Cuts and Budget 9.534Disapprove Educational Costs, Cuts and Budget 15.354
Data collected for former Presidents' approval rating
shows an average of 56% for those who were reelected and an average of 48% for those
who were not reelected.
18 Mos before Election Approval Re-elected?
% (Yes / No)
1940 Roosevelt 56% Yes
1948 Truman 54% Yes
1956 Eisenhower 68% Yes
1964 Johnson 64% Yes
1972 Nixon 50% No
1976 Ford 46% No
1980 Carter 35% No
1984 Reagan 45% Yes
1992 Bush 75% No
1996 Clinton 51% Yes
2004 Bush 36% No
Data collected for President Obama shows the percentage of approval and disapproval of plans such as, healthcare, war, and education
budgets. Obama’s total approval rating is
47% and disapproval of 46%.
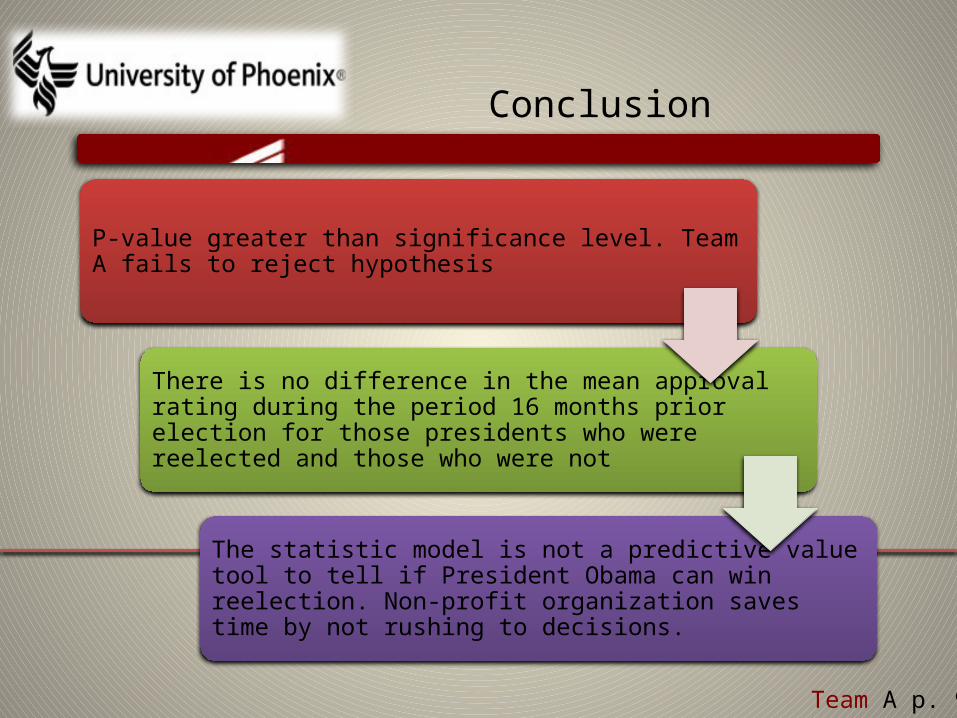
Conclusion
Team A p. 9
Team A fails to reject the null hypothesisP-value greater than significance level. Team A fails to reject hypothesis
There is no difference in the mean approval rating during the period 16 months prior election for those presidents who were reelected and those who were not
The statistic model is not a predictive value tool to tell if President Obama can win reelection. Non-profit organization saves time by not rushing to decisions.
References
Team A p. 10
•Cooper, D. R., & Schindler, P. S. (2006). Business research methods (9th ed.). New York, NY: McGraw-Hill.
•Gallup, Inc. (2011). www.Gallup.com. Retrieved from http://www.gallup.com/poll/8608/reflections-presidential-job-approval-reelection-odds.aspx
•Gallup Inc.. (2011). Gallup. Retrieved from http://www.gallup.com/poll/113980/gallup-daily-obama-job-approval.aspx
•Lind−Marchal−Wathen: Statistical Techniques in Business and Economics, 13th Edition 3. Describing Data: Numerical Measures Text © The McGraw−Hill, 2008