Embed Size (px)
Citation preview
EXPRESSION AND PURIFICATION OF Arabidopsis thaliana HETEROTRIMERIC
G PROTEIN ALPHA SUBUNIT (GPA1) USING BACTERIA AND YEAST
SYSTEMS
by
HAZAL BÜŞRA KÖSE
Submitted to the Graduate School of Engineering and Natural Sciences
in partial fulfillment of
the requirements for the degree of
Master of Science
Sabancı University
Spring 2014

i
© Hazal Büşra Kose, 2014
All rights reserved.
ii
EXPRESSION AND PURIFICATION OF Arabidopsis thaliana HETEROTRIMERIC
G PROTEIN ALPHA SUBUNIT (GPA1) USING BACTERIA AND YEAST
SYSTEMS
Hazal Büşra Köse
Department of Biological Science and Bioengineering, Sabanci
University, Orhanli, Tuzla, 34956 Istanbul, Turkey
Keywords: G proteins, GPA1, different expression systems
Abstract
Heterotrimeric G-proteins mediate transmission of signals from G-protein coupled
receptors to cell interior and activate signaling pathways in several organisms from
yeast to mammals and plants. The heterotrimer consists of the alpha (Gα), beta (Gβ) and
gamma (Gγ) subunits; Gα has GTP binding and hydrolysis activity and Gα and Gβ/Gγ
dimeric complex interact with downstream effectors upon activation. G-protein subunits
have been identified in several plant species and were shown to be involved in growth
and in responses to light and environmental stress factors including draught and
pathogens [1]. Although the crystal structure data at 2.34 Å resolution is available for A.
Thaliana Gα [2] but direct structural data on the Gβ/Gγ dimer and the heterotrimer as a
whole are lacking in the literature. The mechanism of activation for the plant
heterotrimer is generally inferred by assuming analogy with the mammalian complex.
However, recent studies indicate that the plant α subunit may possess a self activation
mechanism not observed in the mammalian system which sets a limit to the extent of
the analogy [3].
Previously in our group we cloned and expressed Arabidopsis thaliana α subunit
(GPA1) using Pichia Pastoris and β (AGB1) andγ (AGG2) subunits using E.coli
systems [4, 5] with the aim structure-function studies on the individual subunits and the
reconstituted complex. However, since expression and purification of the recombinant
protein from yeast are more time and resource consuming compared with E.coli, we
investigated possibilities for cloning the GPA1 sequence using alternative methods. In
this study, results of cloning of GPA1 using pETM41 and pQE80L vectors are given
iii
together with investigation of expression. In different E.coli host cells, after optimizing
the GPA1 expression, recombinant GPA1 was purified and biochemically characterized.
Preliminary structural characterization of E.coli produced GPA1 was also conducted by
circular dichroism spectropolarimetry and dynamic light scattering measurements.
Results show that GPA1 can be expressed in the Rosetta strain of E.coli as a fusion with
maltose binding protein (MBP) giving a yield of 1.2 mg of protein from 1 L of culture.
However, during cleavage of MBP tag with tobacco etch virus (TEV) protease,
precipitation results in the loss of more than 70% of the purified protein with the
remaining part of GPA1 being aggregated. We suggest that the one possible cause of
precipitation is the N-terminal flexible region of GPA1 consisting of 36 aminoacids
which may disrupt the stability. Another possible reason is the lack of post-translational
modifications in E.coli. We did not observe any aggregation in GPA1 samples produced
in P.pastoris system. Structural characterization experiments showed that the secondary
structure content of P.pastoris GPA1 is consistent with the crystal structure data of
mammalian GPA1. Further experiments are required to both improve the purification
results to produce more GPA1 and for structural characterization of the protein.
iv
A.thaliana G-PROTEİNİ ALFA ALTBİRİMİ (GPA1)’ IN BAKTERİ VE MAYA
SİSTEMLERİNDE EKSPRESYONU VE SAFLAŞTIRILMASI
Hazal Büşra Köse
Biyoloji Bilimleri ve Biyomühendislik, MSc Programı, 2014
Tez Danışmanı: Prof. Zehra Sayers
Anahtar Kelimeler: G proteinleri, GPA1, farklı ekspresyon sistemleri
ÖZET
Heterotrimerik G proteinleri, G-protein eşli reseptörlerden (GPCR) hücre içerisine
sinyal iletimine aracılık eder ve maya, memeli ve bitki gibi birçok sistemde bulunan
sinyal iletim yollarını aktifleştirir. Heterotrimer, alfa (Gα), beta (Gβ) ve gama (Gγ)
olmak üzere üç altbirimden oluşur; Gα GTP bağlanma ve hidroliz aktivitesine sahiptir,
GTP bağlanmasının üzerine Gα ve Gβ/Gγ dimer kompleksi aşağı yönde, hücre içine
doğru efektör moleküllerle etkileşim içine girer. G- protein altbirimleri birçok bitki
türünde tanımlanmış ve kuraklık, patojenler gibi çevresel stres faktörleri ve büyüme ile
ilişkili olduğu gösterilmiştir [1]. A. Thaliana Gα için 2.34 Ao ‘luk kristal yapı datası
olmasına rağmen [2], Gβ/Gγ dimerin ve heterotrimerin bir bütün olarak yapısal dataları
literatürde eksiktir. Bitki heterotrimeri için aktivasyon mekanizması, genel olarak
genetik sekanstaki korunmuş bölgeler sebebiyle memeli kompleksiyle analoji
oluşturarak yorumlanır. Buna rağmen, yakın zamanda yapılan çalışmalar bitki α
altbiriminin kendine özgü, memeli sisteminde görülmeyen türde ve analojiyi limitleyen
bir aktivasyon mekanizması olabileceği yönünde ipuçlarını göstermektedir [3].
Daha önce, Arabidopsis thaliana α altyapısı (GPA1), Pichia Pastoris kullanılarak, β
(AGB1) ve γ (AGG2) altyapısı ise E.coli sistemleri kullanılarak klonlanmış ve
ekspresyonları, her bir altbirimin ve bir araya getirilmiş kompleksin yapı-fonksiyon
ilişkisi hedeflenerek gerçekleştirilmiştir [4, 5]. Buna rağmen, ekspresyon ve saflaştırma
işlemi maya sistemi kullanıldığında, bakteri sistemine kıyasla çok daha fazla zaman ve
kaynak kullanımına sebep olduğundan, GPA1’ın maya dışında alternatif methodlar
kullanılarak klonlanması ve ekspresyonunu araştırılmıştır. Bu çalışmada, GPA1’ın
pETM41 ve pQE80L vektörleri kullanılarak gerçekleştirilen klonlama sonuçları, bu
vektörler kullanılarak elde edilen ekspresyon sonuçlarıyla birlikte verilmiştir. Farklı
E.coli konak hücrelerinde GPA1 ekspresyonunun optimizasyonu yapıldıktan sonra,
v
rekombinant GPA1 saflaştırılıp biyokimyasal analizleri yapıldı. E.coli ile üretilen
GPA1’ın öncül yapısal karakterizasyonu “Circular Dichroism” ve “Dynamic Light
Scattering” ölçüm methodları kullanılarak belirlenmiştir.
Elde edilen sonuçlar, GPA1 E.coli’ nin Rosetta konak hücre çeşidi ile MBP’ ye
(Maltose Binding Protein) bağlı olarak 1L’lik kültürden 1.2 mg miktarında
üretilebildiğini gösterdi. Buna rağmen, MBP işaretinin Tobacco Etch Virus (TEV)
proteazı ile kesilmesi, GPA1’ın yaklaşık %70’lik kısmını çökmesi, kalan kısmının da
kümeleşmesiyle sonuçlandı. Çökmenin muhtemel sebebinin, GPA1’ın N-bitiş
kısmındaki 36 aminoasitlik esnek bölgesinin proteinin kararlılığına zarar vermesi
olabileceğini düşünüyoruz. Bir başka muhtemel sebep ise E.coli’nin translasyon
sonrasındaki modifikasyonları gerçekleştirememesi olabilir. Maya sistemi kullanılarak
üretilen GPA1 örneklerinde herhangi bir kümeleşmeye rastlanmadı. Bununla birlikte,
yapısal karakterizasyon deneyleri maya kullanılarak üretilen GPA1 örneklerinin,
GPA’ın kristal yapı datalarıyla tutarlı olduğunu gösterdi. Hem saflaştırma deneylerini
geliştirmek için hem de üretilen GPA1 miktarını yapısal karakterizasyon deneylerinde
kullanmak adına arttırmak için daha fazla deney yapılması gerektiğine karar verildi.
vi
“Virtue is under certain circumstances merely an honorable form of stupidity: who
could be ill-disposed toward it on that account? And this kind of virtue has not been
outlived even today. A kind of sturdy peasant simplicity, which, however, is possible in
all classes and can be encountered only with respect and a smile, believes even today
that everything is in good hands, namely in the "hands of God"; and when it maintains
this proportion with the same modest certainty as it would that two and two make four,
we others certainly refrain from contradicting. Why disturb this pure foolishness? Why
darken it with our worries about man, people, goal, future? And even if we wanted to do
it, we could not. They project their own honorable stupidity and goodness into the heart
of things (the old God, deus myops, still lives among them!); we others — we read
something else into the heart of things: our own enigmatic nature, our contradictions,
our deeper, more painful, more mistrustful wisdom.”
― Friedrich Nietzsche, The Will to Power

vii
ACKNOWLEDGEMENTS
I would like to thank Zehra Sayers, my supervisor, for everything. She believed in me
and she helped me when I jumped into the Biology ocean as a physics student.
Whenever I doubted myself, she believed in me even more and took my self esteem
from the ground. I hope that I can be open to my students in the future as much as she
was to me.
Sandra Quarantini, the things that I learned from you were not only the experimental
methods we used in the lab, but also how to have fun when you are abroad. Thank you
for both being a selfless teacher and a friend. I had great times with you and your cats!
I would like to thank Emel Durmaz for kindly providing me TEV protease vector and
answering all my questions whenever I faced with the dead end and helping me finding
the way out.
I would like to thank each and every member of my family for being always with me
and supporting all my decisions without a doubt.
There are people in my life who deserve to be in this page more than anybody but I feel
like if I write their names, it is going to be sort of a good bye and this is not even the last
thing that I want to do. If I say “I would like to thank Ayşegül Güvenek and Enes
Karaboğa whom I spent my last year quite closely”, it may seem like everything has
ended and we are going to share nothing anymore. So, I refuse to thank those two
people. Because I know that we will continue to contribute to our lives in many ways.
Ahmet Sinan Yavuz, who is one of the best graduate students in Sabanci University, has
helped me a lot both when I first started to this school and when I am leaving now. I
sincerely hope that he will never lose his enthusiasm about what he wants for his life
and I know that he will get what he truly deserves.
Yusuf Talha Tamer, your sabotage will not be forgotten and forgiven. Yet, thank you
for your patience about my tough jokes on you.
I would like to thank all the members of the Toprak Lab, both graduates and
undergraduates, for creating such a friendly environment in the lab. The positive effect
of a nice environment and seeing your friends instead of hostile, competitive people are
priceless.
viii
TABLE of CONTENTS
1 INTRODUCTION ..................................................................................................... 1
1.1 G Protein Coupled Receptors ............................................................................. 1
1.1.1 Structure of GPCRs .................................................................................... 2
1.1.2 Mechanisms of GPCRs ............................................................................... 3
1.2 RGS Proteins ...................................................................................................... 4
1.3 Mammalian Heterotrimeric G Protein ............................................................... 5
1.3.1 Structure of Mammalian G Proteins ........................................................... 6
1.3.2 Signaling in Mammalian G Proteins ........................................................... 7
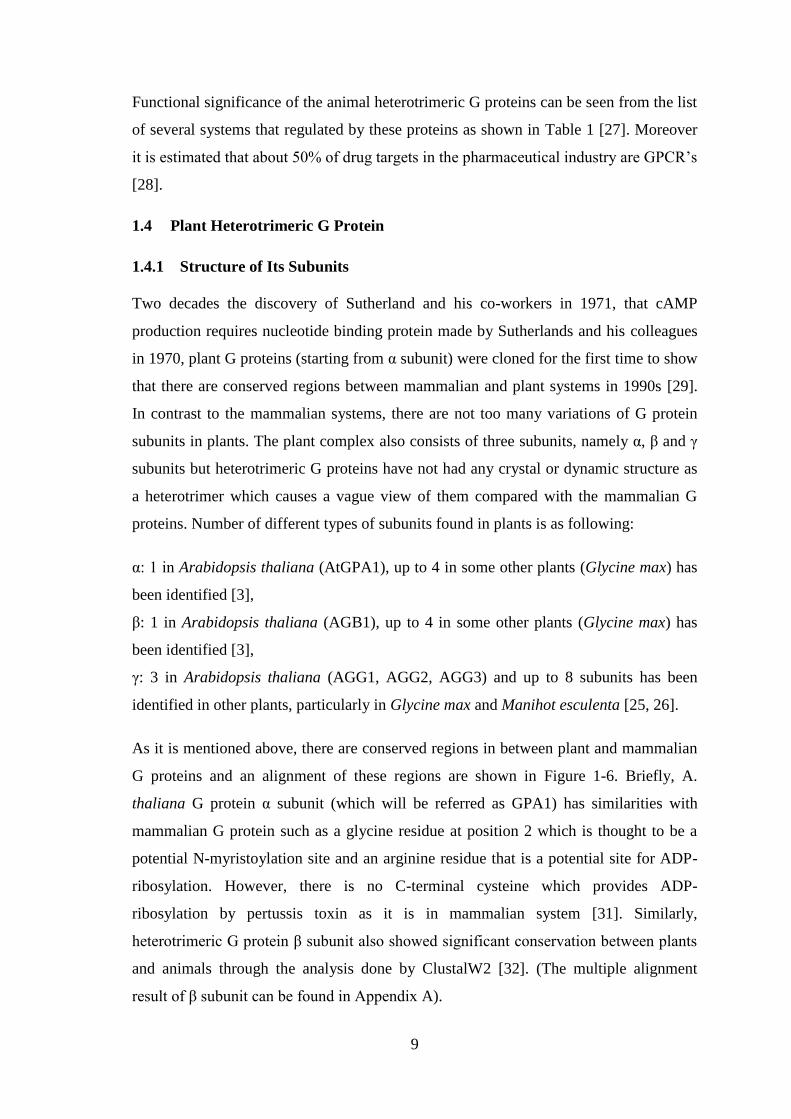
1.4 Plant Heterotrimeric G Protein ........................................................................... 9
1.4.1 Structure of Its Subunits ............................................................................. 9
1.4.2 Signaling Mechanism of Plant G Proteins ................................................ 12
1.5 The Aim of the Study ....................................................................................... 14
2 MATERIALS and METHODS ............................................................................... 15
2.1 MATERIALS ................................................................................................... 15
2.1.1 Chemicals .................................................................................................. 15
2.1.2 Vectors ...................................................................................................... 15
2.1.3 Enzymes .................................................................................................... 16
2.1.4 Cell Lines .................................................................................................. 16
2.1.5 Culture Media ........................................................................................... 17
2.1.6 Buffers ...................................................................................................... 17
2.1.7 Columns .................................................................................................... 19
2.2 METHODS ...................................................................................................... 20
2.2.1 Cloning GPA1 gene into vectors .............................................................. 20
2.2.2 Restriction Digestion with Corresponding Restriction Enzymes ............. 21
2.2.3 Ligation of GPA1 into pETM-41 and pQE80L ........................................ 22
2.2.4 Transformation .......................................................................................... 22
2.2.5 Colony Selection ....................................................................................... 23
2.2.6 Plasmid Isolation ....................................................................................... 23
2.2.7 Control PCR .............................................................................................. 23
ix
2.2.8 Verification of GPA1 Sequence by Restriction Digestion ....................... 23
2.2.9 Sequence Verification ............................................................................... 24
2.2.10 Gene Expression ....................................................................................... 24
2.2.11 Large Scale Expression ............................................................................. 25
2.2.12 Purification ................................................................................................ 25
2.2.13 TEV Protease Digestion ............................................................................ 28
2.2.14 Applying TEV to GPA1 ........................................................................... 29
2.2.15 Western Blotting ....................................................................................... 30
2.2.16 Sample Analysis ....................................................................................... 31
3 RESULTS ................................................................................................................ 32
3.1 Cloning GPA1 into vectors .............................................................................. 32
3.2 Verification of GPA1 Gene Expression in BL21(DE3) Competent Cells ....... 34
3.3 IPTG and Temperature Effects on the Expression of GPA1 in BL21 Cells .... 35
3.4 Purification of GPA1 Expressed in BL21 Cells ............................................... 37
3.4.1 Affinity Chromatography ......................................................................... 37
3.4.2 Anion Exchange Chromatography ............................................................ 37
3.5 Elimination of MBP-tag with TEV Digestion ................................................. 38
3.6 Expression of GPA1 in Rosetta Cells .............................................................. 40
3.7 Temperature and IPTG Effects on the Expression of GPA1 in Rosetta Cells . 41
3.8 Purification of GPA1 Expressed in Rosetta Cells ............................................ 42
3.8.1 Affinity Chromatography ......................................................................... 42
3.8.2 Anion Exchange Chromatography ............................................................ 43
3.8.3 Size Exclusion Chromatography .............................................................. 44
3.9 Applying TEV Digestion to GPA1 .................................................................. 46
3.10 Western Blotting .............................................................................................. 47
3.11 Sample Analysis ............................................................................................... 49
3.12 Experiments with P. Pastoris ........................................................................... 50
3.12.1 Expression of GPA1 in P. Pastoris .......................................................... 50
3.12.2 Purification of GPA1 Expressed in P. Pastoris ........................................ 50
3.12.3 Sample Analysis ....................................................................................... 52
4 DISCUSSION .......................................................................................................... 56
4.1 Cloning GPA1 into Vectors ............................................................................. 56
x
4.2 Expression and Purification of GPA1 in E.coli System ................................... 57
4.3 Expression and Purification of GPA1 in P. pastoris System ........................... 59
5 Conclusion and Future Works ................................................................................. 60
6 REFERENCES ........................................................................................................ 62
7 APPENDICES (A-F)
xi
LIST OF FIGURES
Figure 1-1: Crystal Structure of GPCR and together with heterotrimeric G protein. ....... 2
Figure 1-2: The model of GPCR with heterotrimeric G proteins and conformational
changes of G protein upon an agonist stimulation. ........................................................... 4
Figure 1-3: Crystal structure of RGS protein bund to Gα and their part in the activation
mechanism. ....................................................................................................................... 5
Figure 1-4: The unrooted homology tree of G protein alpha subunits together with their
corresponding date of cloning of cDNAs. ........................................................................ 6
Figure 1-5: Mammalian heterotrimeric G protein. ........................................................... 7
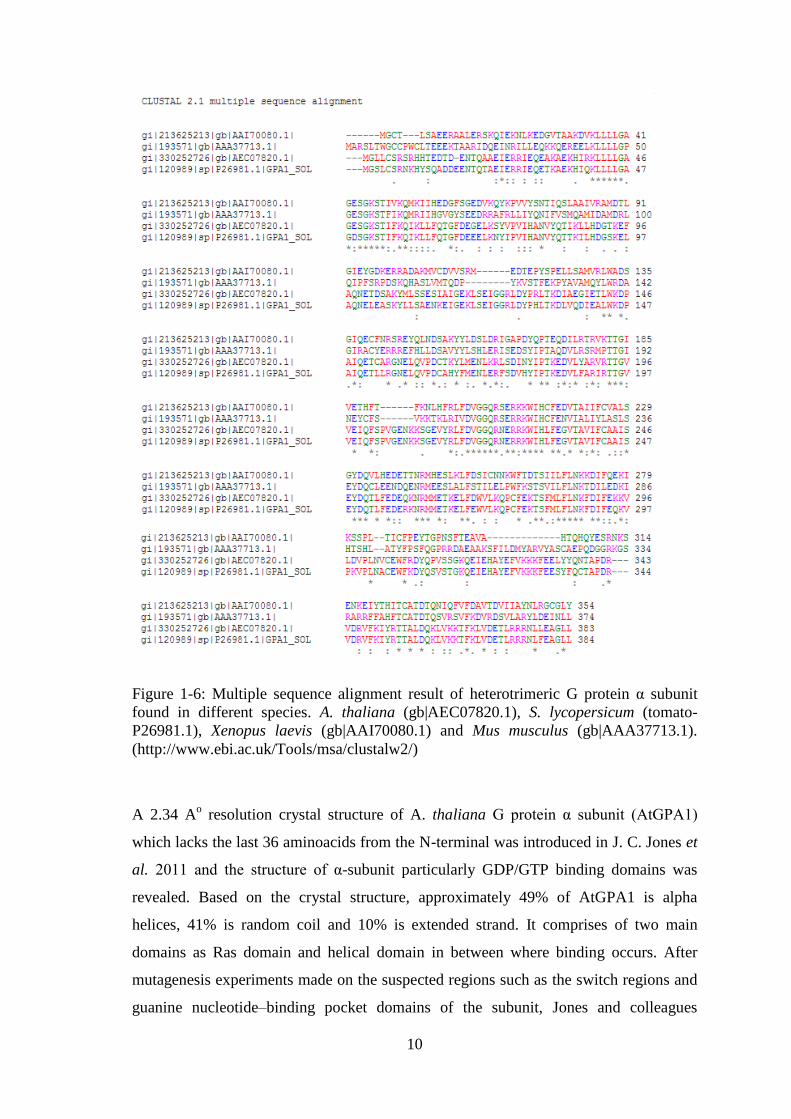
Figure 1-6: Multiple sequence alignment result of heterotrimeric G protein alpha
subunit found in different species. .................................................................................. 10
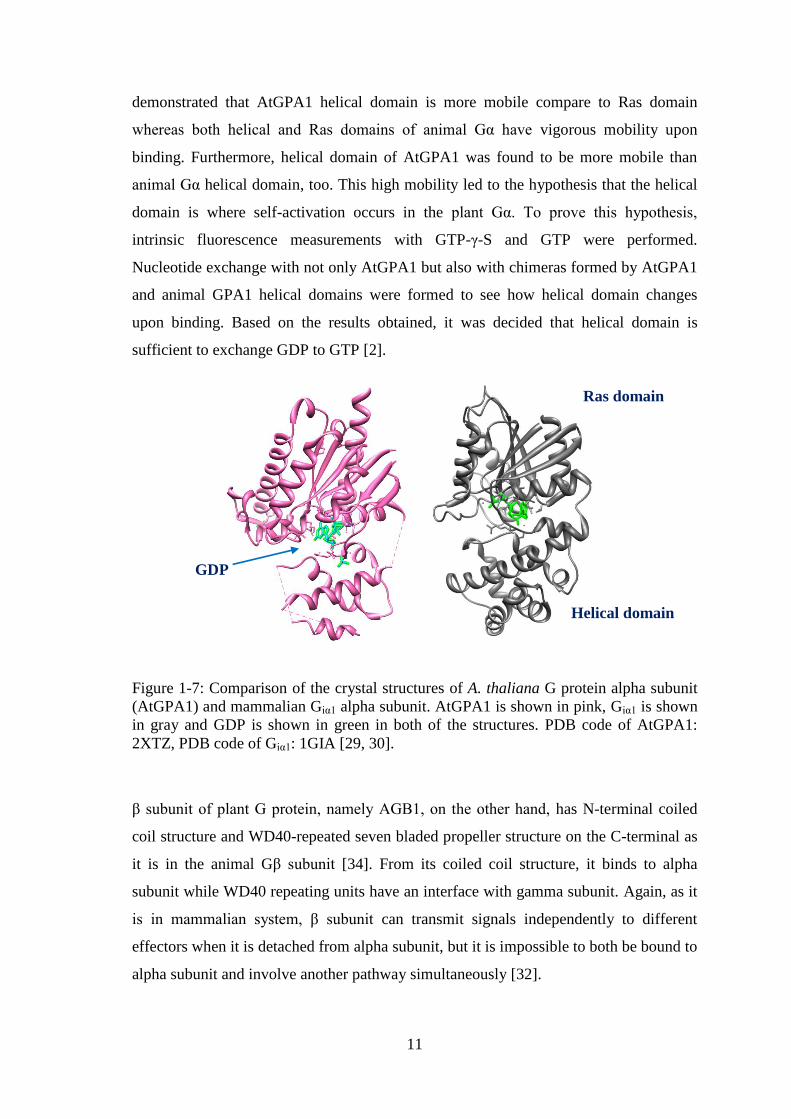
Figure 1-7: Comparison of the crystal structures of A. Thaliana G protein alpha subunit
(AtGPA1) and mammalian Giα1 alpha subunit.. ............................................................. 11
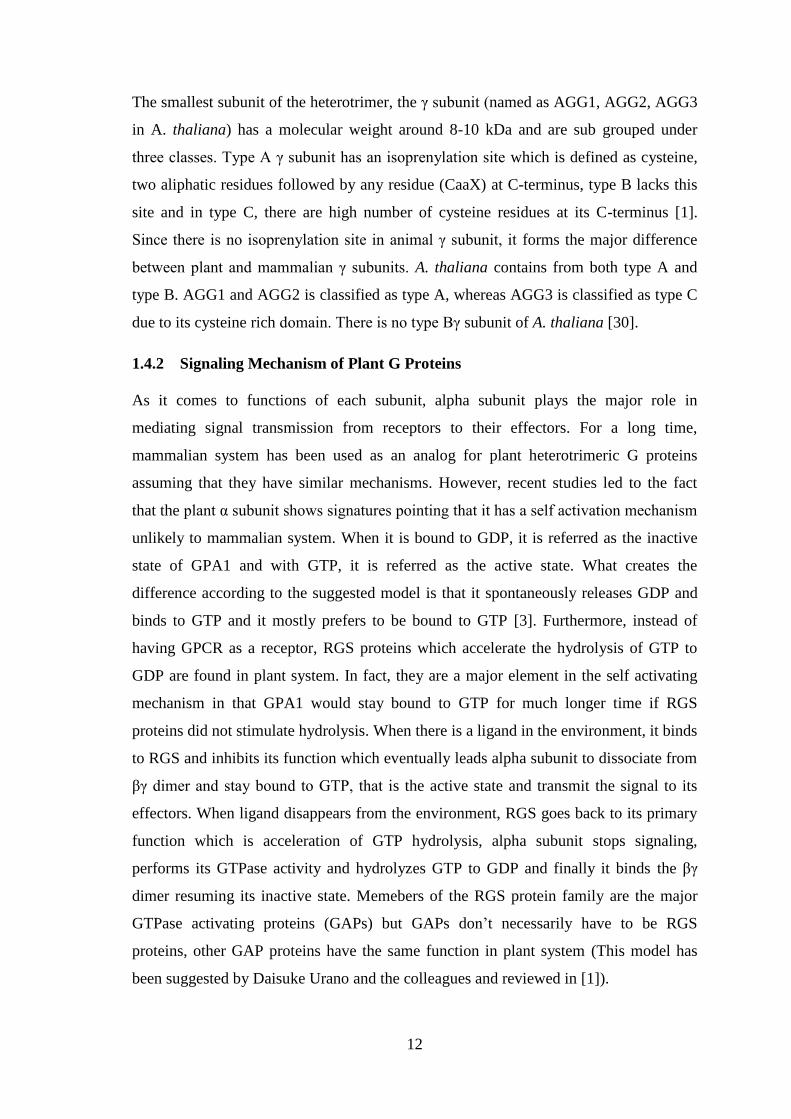
Figure 1-8: Proposed mechanism of the self activation of Gα in both mammalian and
plant systems demonstrating GPCR and RGS proteins. ................................................. 13
Figure 2-1: The vectors used to clone GPA1 and their tags inside the vector sequence. 15
Figure 3-1: The control PCR results of GPA1 gene when isolated plasmids were used as
template and primers having the restriction enzyme recognition sites were used as
primers. ........................................................................................................................... 32
Figure 3-2: After restriction digestion was applied to GPA1-pETM-41 plasmids with
NcoI and KpnI enzymes. ................................................................................................ 33
Figure 3-3: Restriction digestion of pETM-vector with single restriction enzymes to
show that there are no multiple recognition sites. .......................................................... 33
Figure 3-4: SDS-PAGE result to verify GPA1 expression in BL21(DE3) cells. ........... 34
Figure 3-5: Western blotting result to verify GPA1 expression in BL21(DE3) cells..... 35
xii
Figure 3-6: SDS-PAGE results of pellets harvested from cell cultures induced with
different IPTG concentrations and grown in different temperatures. ............................. 36
Figure 3-7: Western blotting performed with the samples defined in Figure 3-6 by using
anti-His antibody staining. .............................................................................................. 36
Figure 3-8:(left) UV profile obtained in affinity chromatography, SDS-PAGE result run
with the fractions collected in affinity.. .......................................................................... 37
Figure 3-9: (A) UV absorbance profile obtained in the desalting step. (B) UV
absorbance profile of anion Exchange chromatography.(C) SDS-PAGE result which
was run with the samples named above the image. ........................................................ 38
Figure 3-10: Affinity chromatography applied after TEV reaction to eliminate GPA1
which has no tag from the His-MBP-tag. ....................................................................... 39
Figure 3-11: Western blotting after TEV digestion. ....................................................... 40
Figure 3-12: Affinity chromatography applied to GPA1 expressed in Rosetta cells ..... 41
Figure 3-13: IPTG and temperature effects on GPA1 expression in Rosetta cells. ........ 42
Figure 3-14: Affinity chromatography applied to GPA1 expressed in 1 L using Rosetta
cells. ................................................................................................................................ 43
Figure 3-15: Anion exchange chromatography applied to GPA1 after affinity chrom.
and desalting. .................................................................................................................. 44
Figure 3-16: Size exclusion (SEC) chromatography applied to GPA1 after anion
exchange chromatography. ............................................................................................. 45
Figure 3-17: Concentration measurements after the fractions obtained from SEC
chromatography were pooled and concentrated. ............................................................ 46
Figure 3-18: Affinity chromatography applied to GPA1 after TEV digestion reaction . 47
Figure 3-19: Western blotting result. .............................................................................. 48
Figure 3-20: The concentration measurement of GPA1 obtained after TEV reaction. .. 48
xiii
Figure 3-21: Native gel result.. ....................................................................................... 49
Figure 3-22: Intensity distribution of GPA1 after TEV digestion.. ................................ 50
Figure 3-23: SDS-PAGE result after affinity chrom. of GPA1 expressed in P.Pastoris..
........................................................................................................................................ 51
Figure 3-24: (A) Anion exchange UV absorbance profile and (B) SDS-PAGE result
with collected fractions. .................................................................................................. 51
Figure 3-25: (A) The UV absorbance profile of SEC and (B) SDS-PAGE result obtained
by using fractions collected during SEC. ........................................................................ 52
Figure 3-26: (A) Western blotting result confirming that what is seen in SDS-PAGE
result is GPA1, (B) Native gel result showing that no aggregation occurred in GPA1. . 53
Figure 3-27: Intensty distribution of GPA1 for three measurements. ........................... 53
Figure 3-28: (A) CD data obtained from GPA1 without DTT, (B) GPA1 with 1 mM
DTT. ................................................................................................................................ 54
Figure 3-29: (A) SDS-PAGE result, (B) Native Gel result. ........................................... 55
xiv
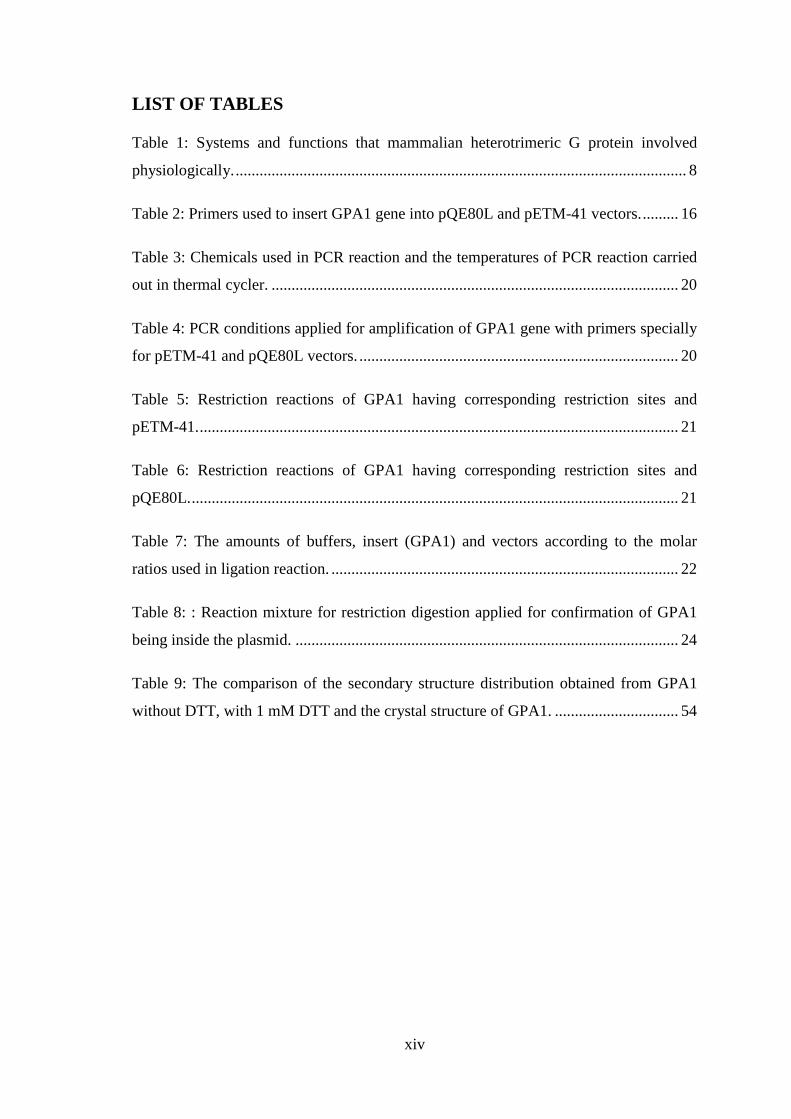
LIST OF TABLES
Table 1: Systems and functions that mammalian heterotrimeric G protein involved
physiologically. ................................................................................................................. 8
Table 2: Primers used to insert GPA1 gene into pQE80L and pETM-41 vectors. ......... 16
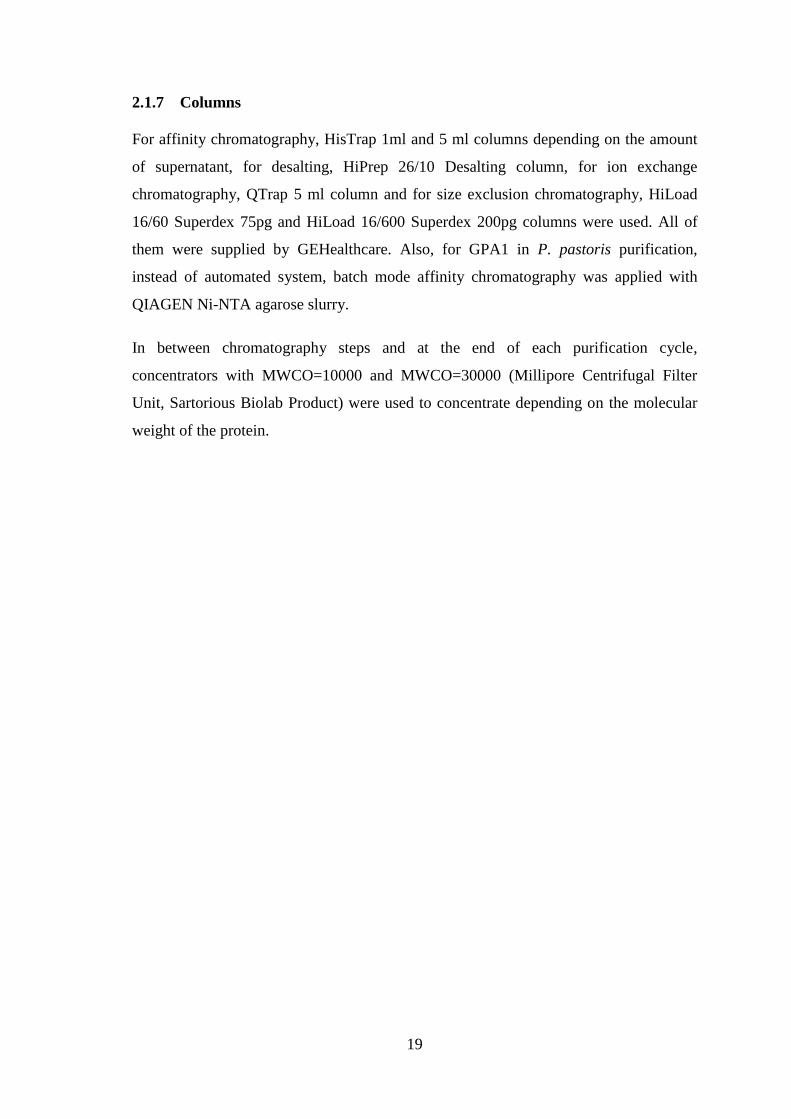
Table 3: Chemicals used in PCR reaction and the temperatures of PCR reaction carried
out in thermal cycler. ...................................................................................................... 20
Table 4: PCR conditions applied for amplification of GPA1 gene with primers specially
for pETM-41 and pQE80L vectors. ................................................................................ 20
Table 5: Restriction reactions of GPA1 having corresponding restriction sites and
pETM-41. ........................................................................................................................ 21
Table 6: Restriction reactions of GPA1 having corresponding restriction sites and
pQE80L. .......................................................................................................................... 21
Table 7: The amounts of buffers, insert (GPA1) and vectors according to the molar
ratios used in ligation reaction. ....................................................................................... 22
Table 8: : Reaction mixture for restriction digestion applied for confirmation of GPA1
being inside the plasmid. ................................................................................................ 24
Table 9: The comparison of the secondary structure distribution obtained from GPA1
without DTT, with 1 mM DTT and the crystal structure of GPA1. ............................... 54
xv
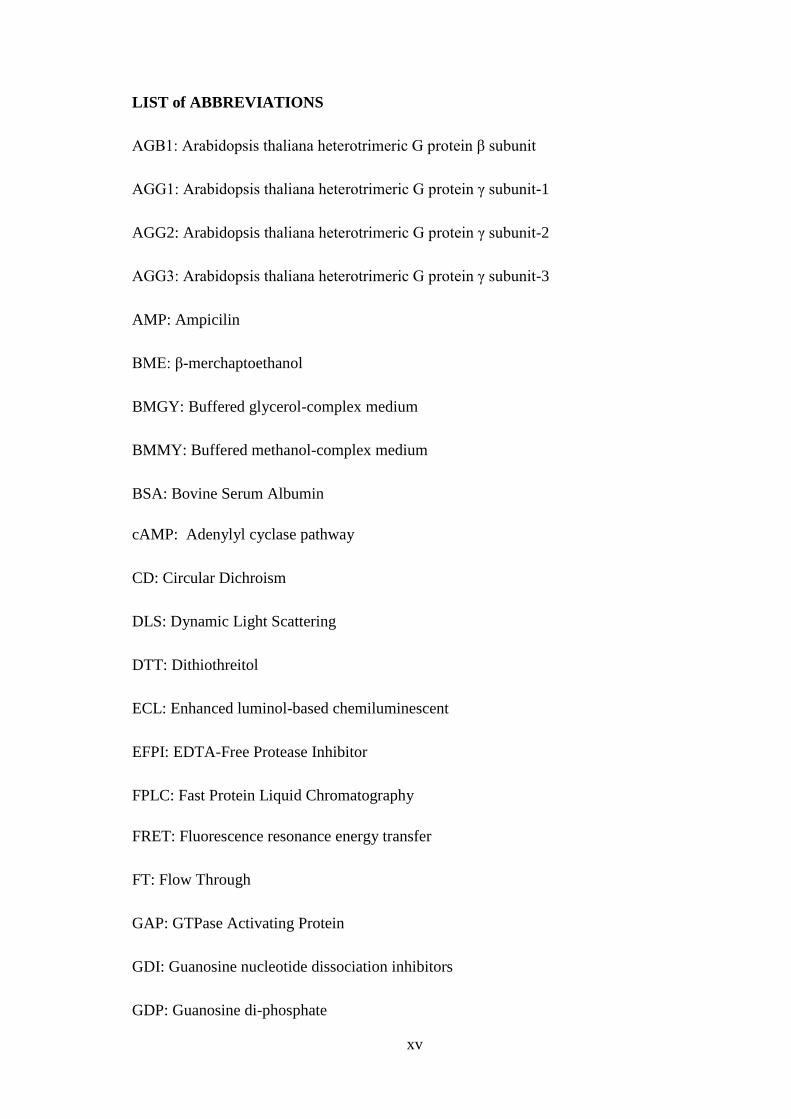
LIST of ABBREVIATIONS
AGB1: Arabidopsis thaliana heterotrimeric G protein β subunit
AGG1: Arabidopsis thaliana heterotrimeric G protein γ subunit-1
AGG2: Arabidopsis thaliana heterotrimeric G protein γ subunit-2
AGG3: Arabidopsis thaliana heterotrimeric G protein γ subunit-3
AMP: Ampicilin
BME: β-merchaptoethanol
BMGY: Buffered glycerol-complex medium
BMMY: Buffered methanol-complex medium
BSA: Bovine Serum Albumin
cAMP: Adenylyl cyclase pathway
CD: Circular Dichroism
DLS: Dynamic Light Scattering
DTT: Dithiothreitol
ECL: Enhanced luminol-based chemiluminescent
EFPI: EDTA-Free Protease Inhibitor
FPLC: Fast Protein Liquid Chromatography
FRET: Fluorescence resonance energy transfer
FT: Flow Through
GAP: GTPase Activating Protein
GDI: Guanosine nucleotide dissociation inhibitors
GDP: Guanosine di-phosphate
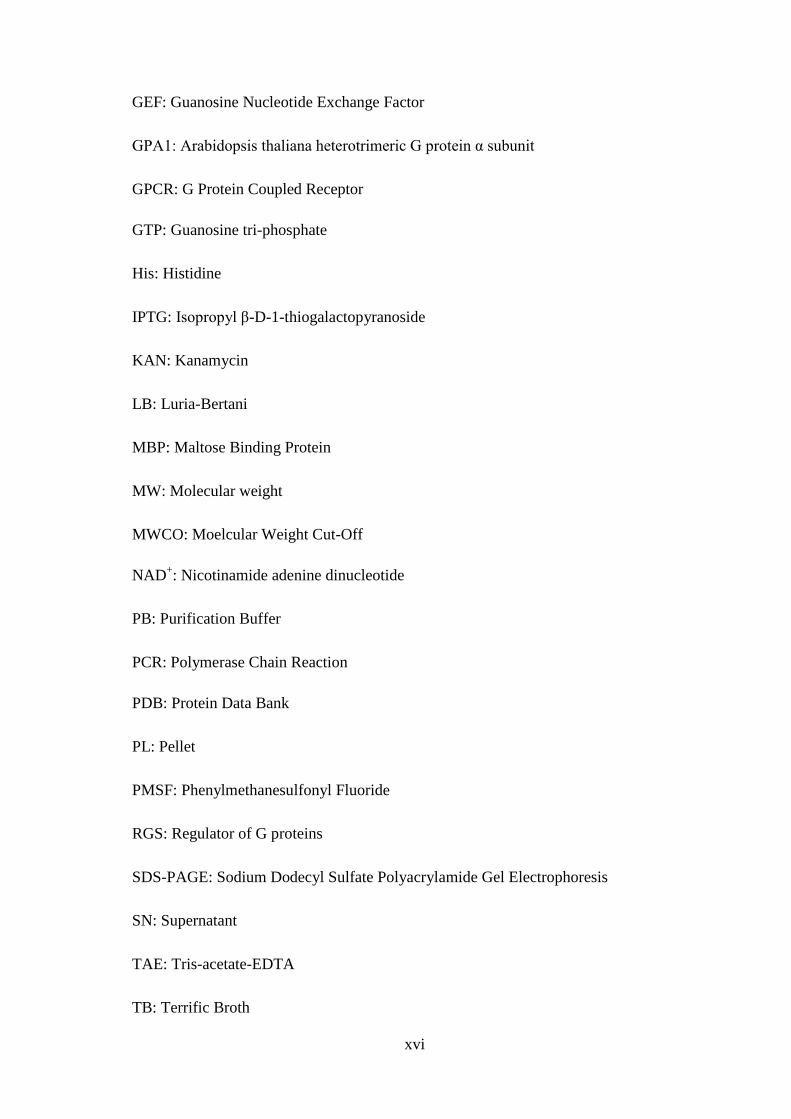
xvi
GEF: Guanosine Nucleotide Exchange Factor
GPA1: Arabidopsis thaliana heterotrimeric G protein α subunit
GPCR: G Protein Coupled Receptor
GTP: Guanosine tri-phosphate
His: Histidine
IPTG: Isopropyl β-D-1-thiogalactopyranoside
KAN: Kanamycin
LB: Luria-Bertani
MBP: Maltose Binding Protein
MW: Molecular weight
MWCO: Moelcular Weight Cut-Off
NAD+: Nicotinamide adenine dinucleotide
PB: Purification Buffer
PCR: Polymerase Chain Reaction
PDB: Protein Data Bank
PL: Pellet
PMSF: Phenylmethanesulfonyl Fluoride
RGS: Regulator of G proteins
SDS-PAGE: Sodium Dodecyl Sulfate Polyacrylamide Gel Electrophoresis
SN: Supernatant
TAE: Tris-acetate-EDTA
TB: Terrific Broth
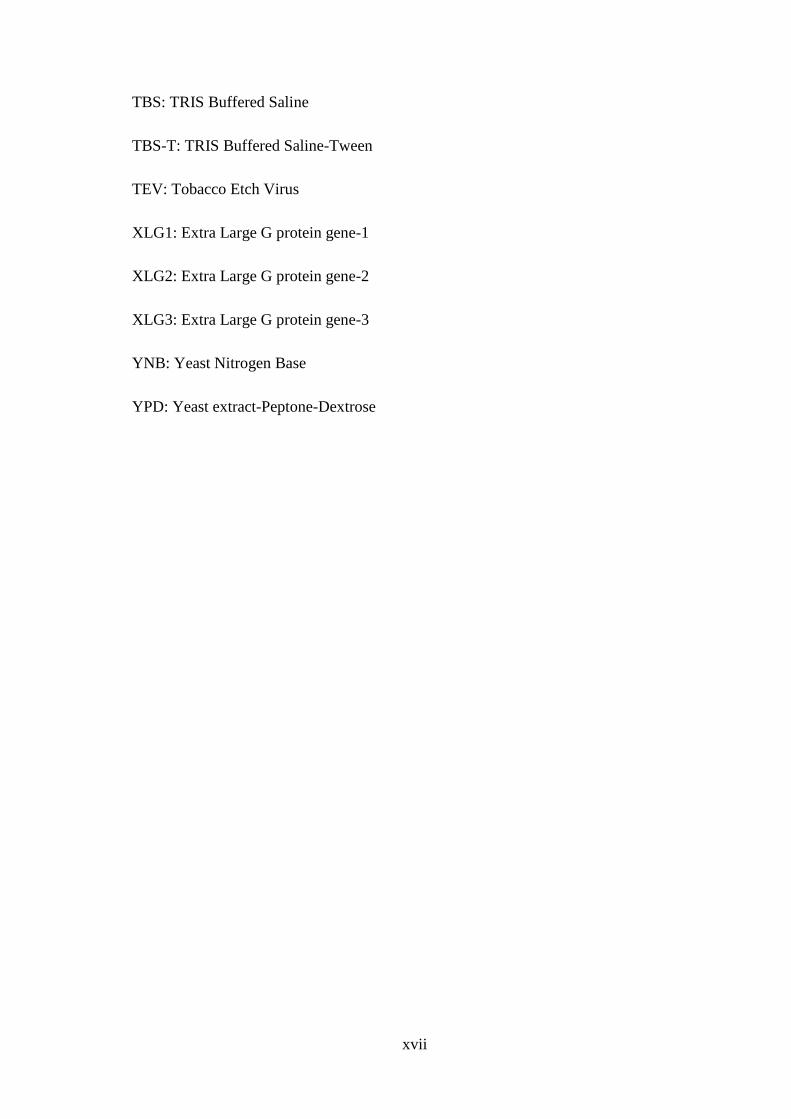
xvii
TBS: TRIS Buffered Saline
TBS-T: TRIS Buffered Saline-Tween
TEV: Tobacco Etch Virus
XLG1: Extra Large G protein gene-1
XLG2: Extra Large G protein gene-2
XLG3: Extra Large G protein gene-3
YNB: Yeast Nitrogen Base
YPD: Yeast extract-Peptone-Dextrose
1
EXPRESSION AND PURIFICATION OF Arabidopsis thaliana HETEROTRIMERIC
G PROTEIN ALPHA SUBUNIT (GPA1) USING BACTERIA AND YEAST
SYSTEMS
1 INTRODUCTION
In 1970, the first step towards the discovery of the importance of G proteins was made
by the work of Sutherland and his coworkers, which was on the stimulation of the
production of cyclic AMP (cAMP) via the enzyme mono-ADP- ribosyl-transferase,
which catalyzes the transfer of NAD+ to protein substrate. Eventually, this discovery
ended up with a Nobel Prize in Physiology and Medicine in 1971 for Sutherland for his
work on cAMP. Funnily it was, the discovery was the result of an honest mistake. The
bacterial exotoxins produced by Vibrio cholerae causing elevation of cAMP levels in
the mouse lymphoma cell line S49, were thought to be ATP-dependent but the ATP
used in the experiments was contaminated with GTP [6]. Later, with the treatment with
radioactive [32
P] NAD+ and cholera toxin of S49 cell line and its mutant cyc
-, which are
unable to generate cAMP in response to the beta-adrenergic agonist isoprenaline, but
still had a binding site similar to β2-adrenoceptor, a 45 kDa polypeptide was identified.
After purification of this polypeptide, it was understood that it was not alone but
complexed with 35 kDa and 8-10 kDa polypeptides. These proteins were then labeled as
α- subunit (45 kDa), β-subunit (35 kDa) and γ-subunit (8-10 kDa) of functional
heterotrimeric G proteins [6]. Alfred Gillman and Martin Rodbell won Nobel prize for
Physiology and Medicine in 1994 for this study together with other complementary
studies to the function on G proteins [7].
1.1 G Protein Coupled Receptors
G protein coupled receptors (GPCR’s) are one of the largest protein families. They are
classified under five subgroups, namely Rhodopsin (683 members), Adhesion family
(24 members), Frizzled/taste family (24 members), Glutamate family (15 members) and
Secretin family (15 members) [3, 4]. A recent study by Krishnan et al. in 2012 revealed
that these five families have a longer evolutionary history than it has been thought and
2
four of them (Rhodopsin, Adhesion, Frizzled and Secretin) have a common origin with
cAMP receptors [8] . GPCR’s are involved in many signaling pathways and The Nobel
Prize in Chemistry 2012 is won by Brian K. Kobilka and Robert J. Lefkowitz for studies
of G-protein–coupled receptors.
1.1.1 Structure of GPCRs
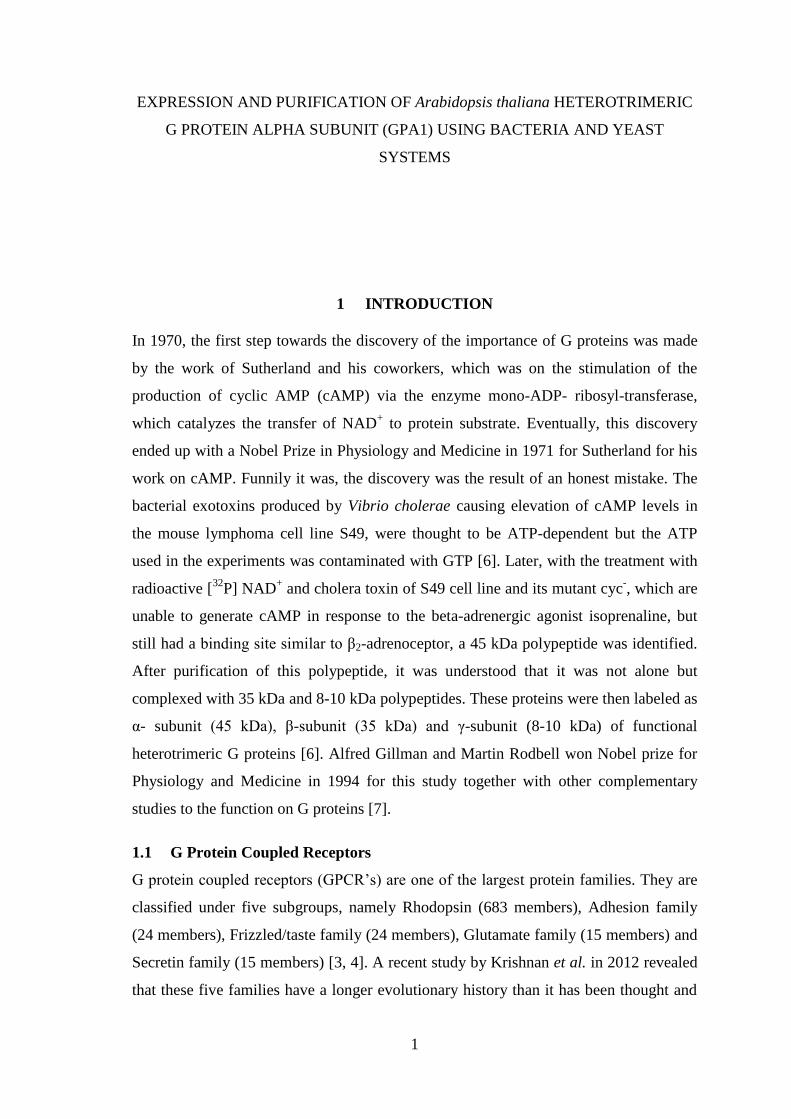
Main structural features of GPCR’s can be seen in Figure 1-1. All GPCR’s have seven
transmembrane regions, which mostly conserved over years and among species, with an
extracellular amino- and intracellular C terminal. Exceptionally, Adhesion and
Glutamate family members are recognized with relatively longer N termini [10].
Figure 1-1: Crystal Structure of GPCR and together with heterotrimeric G protein. (left)
Crystal structure of human β2 adrenergic receptor (one of the members of GPCR
family), PDB code: 2RH1, (right) human β2 adrenergic receptor together with
mammalian heterotrimeric G protein. Color code: GPCR: cyan, Gα: yellow, Gβ: green,
Gγ: orange and ligant: red (PDB code: 3SN6).
GPCR’s have two kinds of heterogeneity. The first one is structural heterogeneity
caused by posttranslational modifications such as glycosylation, phosphorylation and
palmitoylation. These modifications can be minimized if GPCR can be expressed in
bacteria [11]. The other source of heterogeneity comes from conformational changes.
GPCR’s are highly flexible and it is functionally very important because these structural
changes may be required for binding of signal molecules. These heterogeneities make
GPCR’s hard to crystallize and/or even if they are crystallized, flexible regions have
poor resolutions which lead to poor understanding of the structure and the function of
3
these domains. It has been shown that flexibility of GPCR’s can be reduced by using
specific ligands [12]. There is no need to mention that transmembrane proteins are
already quite hard to crystallize because of the fact that detergents required in their
purification steps make the protein almost impossible to crystallize due to the large
enclosing micelles.
1.1.2 Mechanisms of GPCRs
There are several evidences showing that GPCR’s form oligomers [8–10]. Although the
mechanism leading to oligomer formation is not yet completely understood, it is
suggested that oligomerization might be essential for activation and signal transduction.
Especially, the idea that GPCR’s may be dimerized to complex with G proteins was
suggested after realizing that a pentameric complex forms when leukotriene is
reconstituted with purified G protein α-subunit (Baneres & Parello 2003).
A large number of studies have been conducted to understand the kinetics of GPCR’s
upon binding to a ligand or as in some cases diffusing into an unliganded receptor [17].
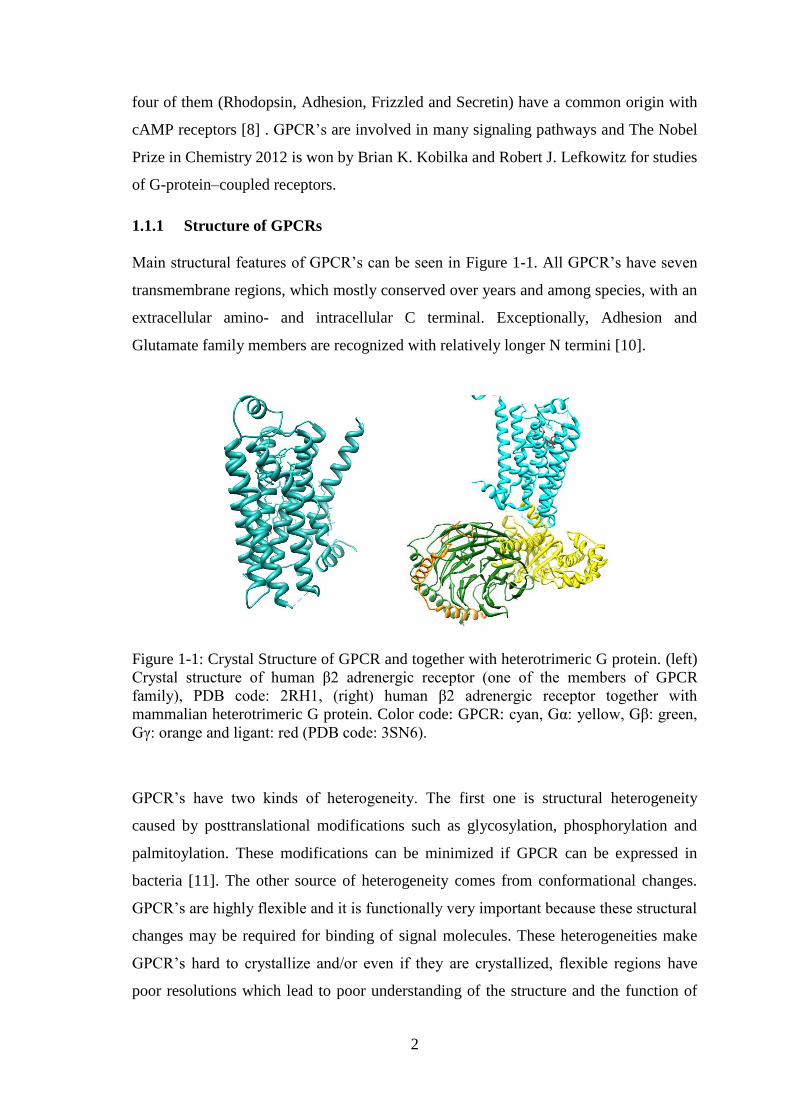
The most common and well known model to explain the mechanism of GPCR
activation is the two-state model, depicted in Figure 1-2, in which there is basically an
active and inactive state of the GPCR. When there is an agonist in the environment, it
binds to the GPCR and stabilizes its active state more. The activated GPCRs act as a
guanine nucleotide exchange factor (GEF) and activate downstream elements such as G
proteins to transmit the signal. In case of an inverse agonist, the inactive state is
stabilized. It has been reported that there are partial agonists leading an in-between state
where GPCR can be found both active and inactive states [18]. Although the two model
system explains a vast majority of the GPCR’s behaviors, there is a new trend in
experiments showing that multiple conformational states are available instead of one
active and one inactive state [19]. Based on these different suggestions based on logical
evidences, more experiments such as fluorescence assays, FRET experiments for
dynamic movements of different domains are required to understand the GPCR protein
family which has too many members and all of them may have different conformations
upon activation and deactivation. The bottom line that we can come up with based on
these studies is that there is more work to do compare with what have been done so far.
4
Figure 1-2: The model of GPCR with heterotrimeric G proteins and conformational
changes of G protein upon an agonist stimulation. Li, J. et al. The Molecule Pages
database. Nature 420, 716-717 (2002).
1.2 RGS Proteins
The first time that RGS (regulator of G protein signaling) proteins came onto stage is
when researchers showed evidence that there is an enormous difference between the
rates of Gα- subunit’s GTP to GDP hydrolysis in vivo and in vitro. Although they
observed a rapid hydrolysis in vivo, when the rates of purified Gα- subunit’s GTP
hydrolysis to GDP in vitro were measured, it was found out that purified Gα has a lower
rate compared with in vivo. So, it was obvious that there are other proteins involved in
the hydrolysis step of G protein activation/deactivation cycle in the cell [20]. The
general name given for these proteins is GTPase activating proteins (GAPs). It did not
take for a long time to discover RGS protein family with approximately 30 members.
Contrary to GPCR’s which has a role in activation of G proteins, RGS proteins
stimulate GTPase activity and increase the hydrolysis rate of Gα- subunit from GTP to
GDP on the G subunit around thousand fold and brings G proteins to their inactive
state again [16, 17].
5
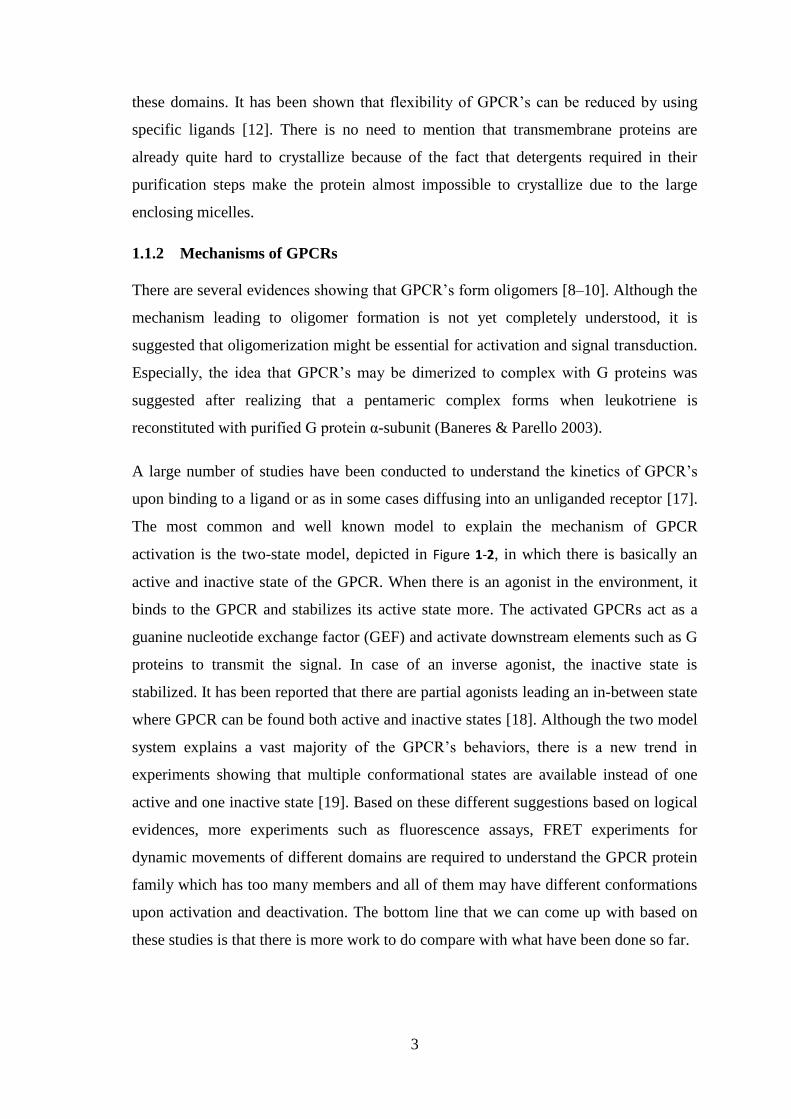
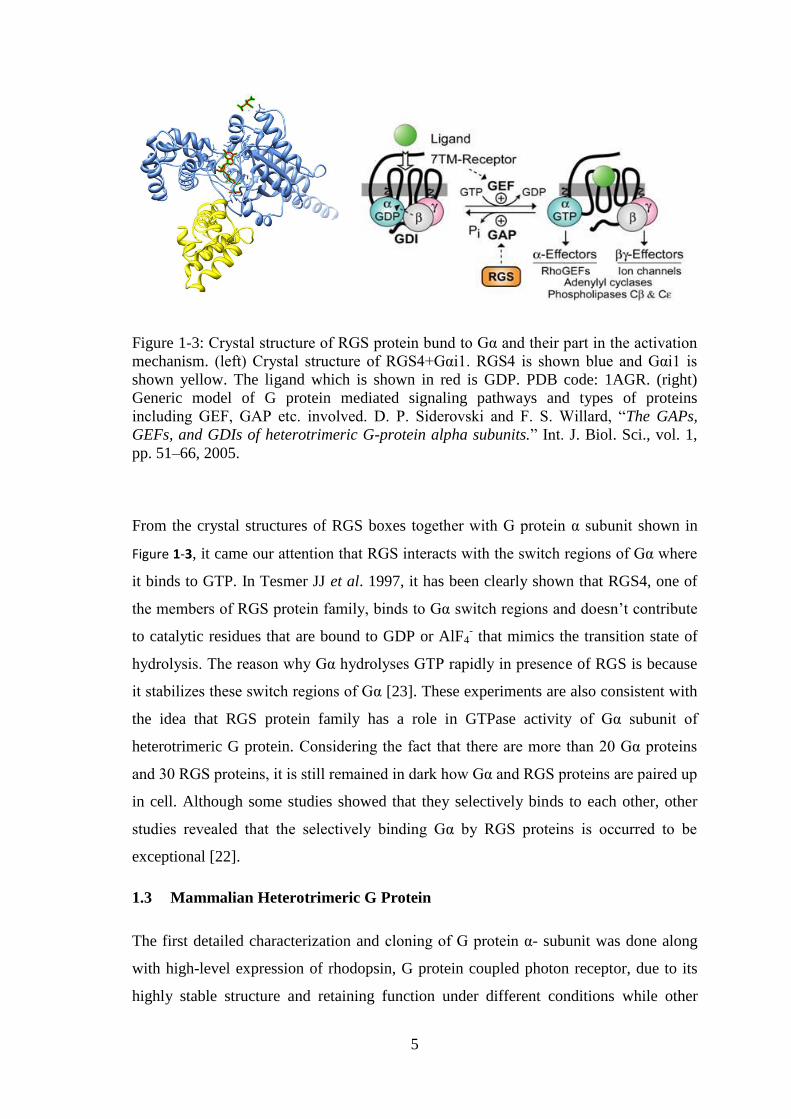
Figure 1-3: Crystal structure of RGS protein bund to Gα and their part in the activation
mechanism. (left) Crystal structure of RGS4+Gαi1. RGS4 is shown blue and Gαi1 is
shown yellow. The ligand which is shown in red is GDP. PDB code: 1AGR. (right)
Generic model of G protein mediated signaling pathways and types of proteins
including GEF, GAP etc. involved. D. P. Siderovski and F. S. Willard, “The GAPs,
GEFs, and GDIs of heterotrimeric G-protein alpha subunits.” Int. J. Biol. Sci., vol. 1,
pp. 51–66, 2005.
From the crystal structures of RGS boxes together with G protein α subunit shown in
Figure 1-3, it came our attention that RGS interacts with the switch regions of Gα where
it binds to GTP. In Tesmer JJ et al. 1997, it has been clearly shown that RGS4, one of
the members of RGS protein family, binds to Gα switch regions and doesn’t contribute
to catalytic residues that are bound to GDP or AlF4- that mimics the transition state of
hydrolysis. The reason why Gα hydrolyses GTP rapidly in presence of RGS is because
it stabilizes these switch regions of Gα [23]. These experiments are also consistent with
the idea that RGS protein family has a role in GTPase activity of Gα subunit of
heterotrimeric G protein. Considering the fact that there are more than 20 Gα proteins
and 30 RGS proteins, it is still remained in dark how Gα and RGS proteins are paired up
in cell. Although some studies showed that they selectively binds to each other, other
studies revealed that the selectively binding Gα by RGS proteins is occurred to be
exceptional [22].
1.3 Mammalian Heterotrimeric G Protein
The first detailed characterization and cloning of G protein α- subunit was done along
with high-level expression of rhodopsin, G protein coupled photon receptor, due to its
highly stable structure and retaining function under different conditions while other
6
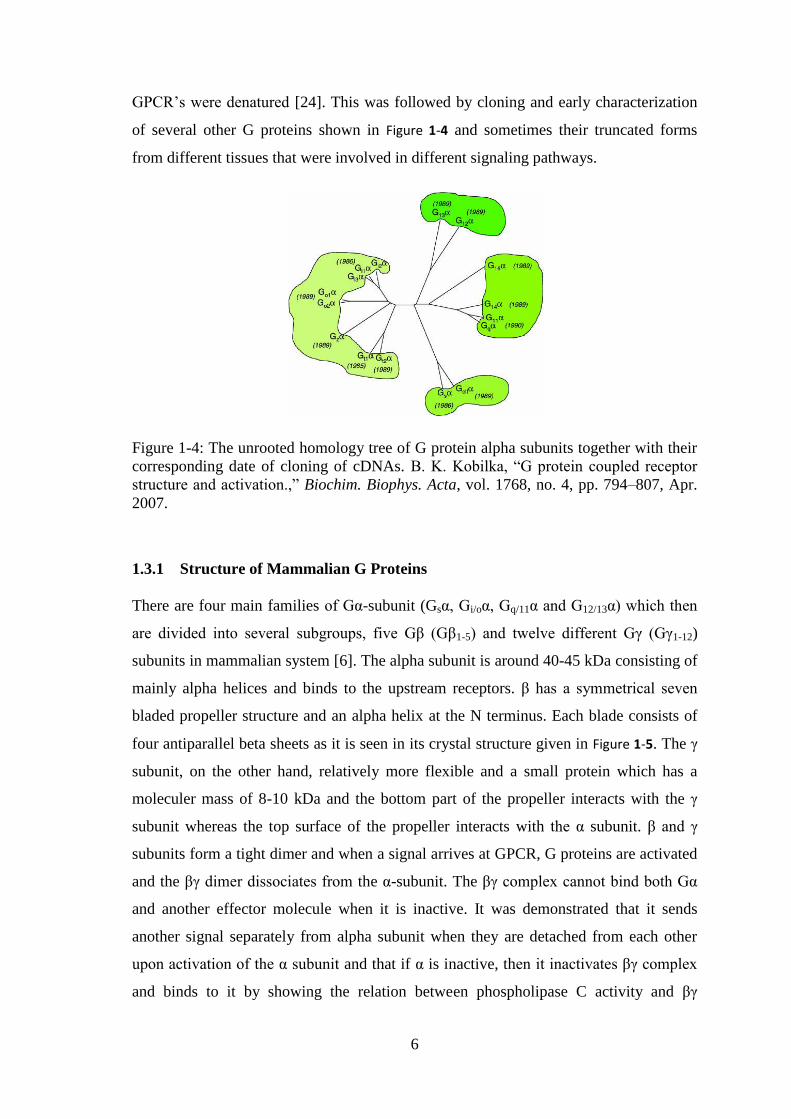
GPCR’s were denatured [24]. This was followed by cloning and early characterization
of several other G proteins shown in Figure 1-4 and sometimes their truncated forms
from different tissues that were involved in different signaling pathways.
Figure 1-4: The unrooted homology tree of G protein alpha subunits together with their
corresponding date of cloning of cDNAs. B. K. Kobilka, “G protein coupled receptor
structure and activation.,” Biochim. Biophys. Acta, vol. 1768, no. 4, pp. 794–807, Apr.
2007.
1.3.1 Structure of Mammalian G Proteins
There are four main families of Gα-subunit (Gsα, Gi/oα, Gq/11α and G12/13α) which then
are divided into several subgroups, five Gβ (Gβ1-5) and twelve different Gγ (Gγ1-12)
subunits in mammalian system [6]. The alpha subunit is around 40-45 kDa consisting of
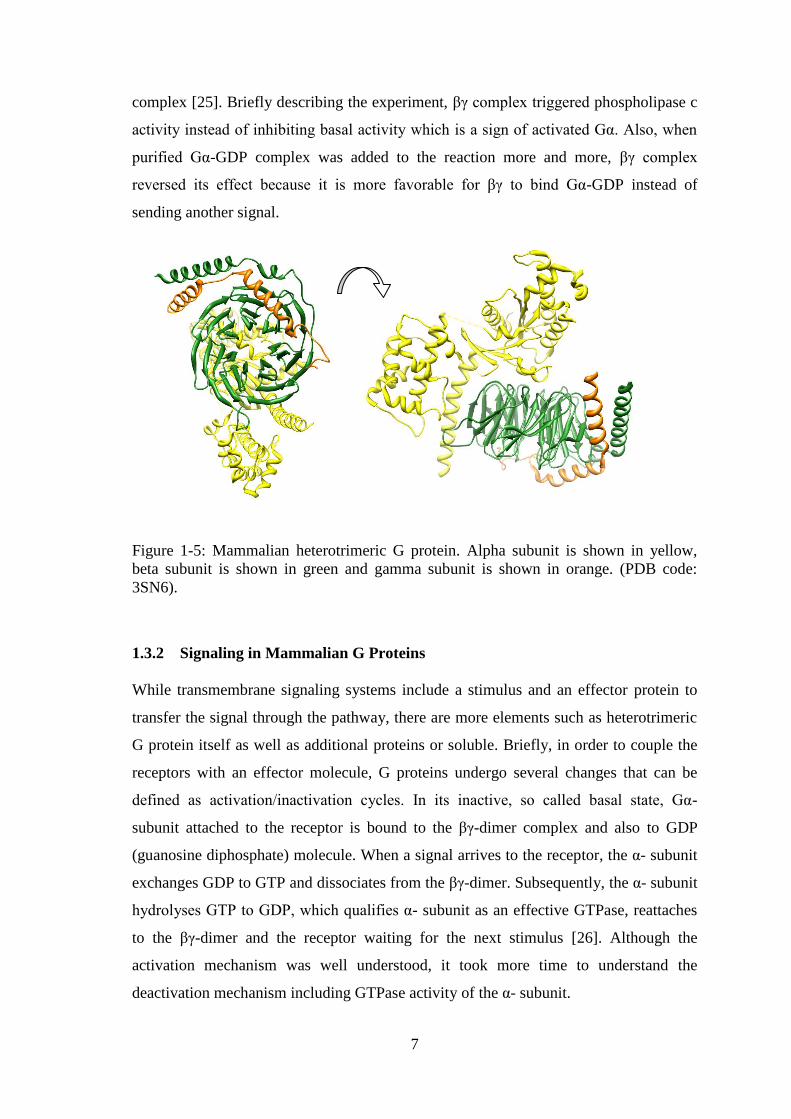
mainly alpha helices and binds to the upstream receptors. β has a symmetrical seven
bladed propeller structure and an alpha helix at the N terminus. Each blade consists of
four antiparallel beta sheets as it is seen in its crystal structure given in Figure 1-5. The γ
subunit, on the other hand, relatively more flexible and a small protein which has a
moleculer mass of 8-10 kDa and the bottom part of the propeller interacts with the γ
subunit whereas the top surface of the propeller interacts with the α subunit. β and γ
subunits form a tight dimer and when a signal arrives at GPCR, G proteins are activated
and the βγ dimer dissociates from the α-subunit. The βγ complex cannot bind both Gα
and another effector molecule when it is inactive. It was demonstrated that it sends
another signal separately from alpha subunit when they are detached from each other
upon activation of the α subunit and that if α is inactive, then it inactivates βγ complex
and binds to it by showing the relation between phospholipase C activity and βγ
7
complex [25]. Briefly describing the experiment, βγ complex triggered phospholipase c
activity instead of inhibiting basal activity which is a sign of activated Gα. Also, when
purified Gα-GDP complex was added to the reaction more and more, βγ complex
reversed its effect because it is more favorable for βγ to bind Gα-GDP instead of
sending another signal.
Figure 1-5: Mammalian heterotrimeric G protein. Alpha subunit is shown in yellow,
beta subunit is shown in green and gamma subunit is shown in orange. (PDB code:
3SN6).
1.3.2 Signaling in Mammalian G Proteins
While transmembrane signaling systems include a stimulus and an effector protein to
transfer the signal through the pathway, there are more elements such as heterotrimeric
G protein itself as well as additional proteins or soluble. Briefly, in order to couple the
receptors with an effector molecule, G proteins undergo several changes that can be
defined as activation/inactivation cycles. In its inactive, so called basal state, Gα-
subunit attached to the receptor is bound to the βγ-dimer complex and also to GDP
(guanosine diphosphate) molecule. When a signal arrives to the receptor, the α- subunit
exchanges GDP to GTP and dissociates from the βγ-dimer. Subsequently, the α- subunit
hydrolyses GTP to GDP, which qualifies α- subunit as an effective GTPase, reattaches
to the βγ-dimer and the receptor waiting for the next stimulus [26]. Although the
activation mechanism was well understood, it took more time to understand the
deactivation mechanism including GTPase activity of the α- subunit.
Cardiovascular
system
Endocrine System
and Metabolism Immune System Nervous System Sensory Systems Development
Cell Growth and
Transformation
Autonomic
control of heart
function
Hypothalamo-
pituitary system
Leukocyte
migration/homing
Inhibitory
modulation of
synaptic
transmission
Visual system
G11-mediated
signaling in
embryonic
angiogenesis
Cellular growth
induced by G12/G13
Myocardial
hypertrophy Pancreatic β-cells
Immune cell
effector functions
Modulation of
synaptic
transmission by the
Gq/G11-mediated
signaling pathway
Olfactory/pheromone
system
Gq/G11-mediated
signaling during
embryonic
myocardial growth
Gi-mediated cell
transformation
Smooth muscle
tone
Thyroid
gland/parathyroid
gland
Gustatory system Neural crest
development
The oncogenic
potential of Gs
Platelet activation
Regulation of
carbohydrate and
lipid metabolism
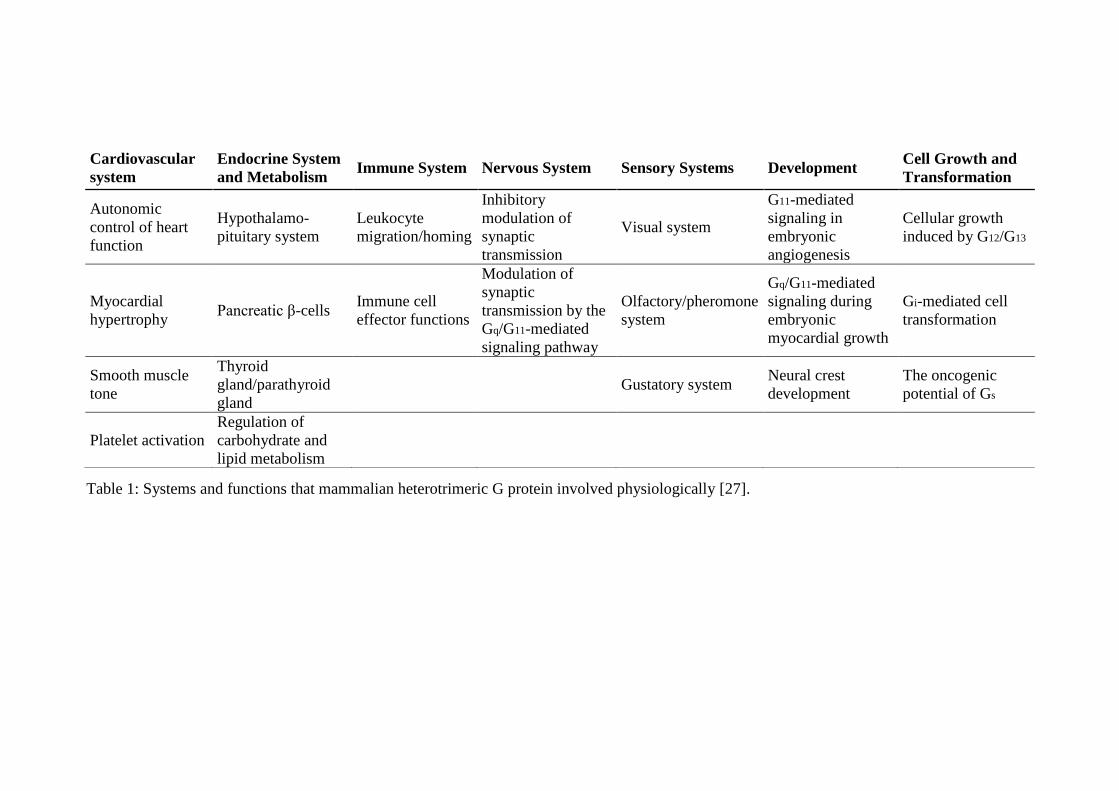
Table 1: Systems and functions that mammalian heterotrimeric G protein involved physiologically [27].
9
Functional significance of the animal heterotrimeric G proteins can be seen from the list
of several systems that regulated by these proteins as shown in Table 1 [27]. Moreover
it is estimated that about 50% of drug targets in the pharmaceutical industry are GPCR’s
[28].
1.4 Plant Heterotrimeric G Protein
1.4.1 Structure of Its Subunits
Two decades the discovery of Sutherland and his co-workers in 1971, that cAMP
production requires nucleotide binding protein made by Sutherlands and his colleagues
in 1970, plant G proteins (starting from α subunit) were cloned for the first time to show
that there are conserved regions between mammalian and plant systems in 1990s [29].
In contrast to the mammalian systems, there are not too many variations of G protein
subunits in plants. The plant complex also consists of three subunits, namely α, β and γ
subunits but heterotrimeric G proteins have not had any crystal or dynamic structure as
a heterotrimer which causes a vague view of them compared with the mammalian G
proteins. Number of different types of subunits found in plants is as following:
α: 1 in Arabidopsis thaliana (AtGPA1), up to 4 in some other plants (Glycine max) has
been identified [3],
β: 1 in Arabidopsis thaliana (AGB1), up to 4 in some other plants (Glycine max) has
been identified [3],
γ: 3 in Arabidopsis thaliana (AGG1, AGG2, AGG3) and up to 8 subunits has been
identified in other plants, particularly in Glycine max and Manihot esculenta [25, 26].
As it is mentioned above, there are conserved regions in between plant and mammalian
G proteins and an alignment of these regions are shown in Figure 1-6. Briefly, A.
thaliana G protein α subunit (which will be referred as GPA1) has similarities with
mammalian G protein such as a glycine residue at position 2 which is thought to be a
potential N-myristoylation site and an arginine residue that is a potential site for ADP-
ribosylation. However, there is no C-terminal cysteine which provides ADP-
ribosylation by pertussis toxin as it is in mammalian system [31]. Similarly,
heterotrimeric G protein β subunit also showed significant conservation between plants
and animals through the analysis done by ClustalW2 [32]. (The multiple alignment
result of β subunit can be found in Appendix A).
10
Figure 1-6: Multiple sequence alignment result of heterotrimeric G protein α subunit
found in different species. A. thaliana (gb|AEC07820.1), S. lycopersicum (tomato-
P26981.1), Xenopus laevis (gb|AAI70080.1) and Mus musculus (gb|AAA37713.1).
(http://www.ebi.ac.uk/Tools/msa/clustalw2/)
A 2.34 Ao resolution crystal structure of A. thaliana G protein α subunit (AtGPA1)
which lacks the last 36 aminoacids from the N-terminal was introduced in J. C. Jones et
al. 2011 and the structure of α-subunit particularly GDP/GTP binding domains was
revealed. Based on the crystal structure, approximately 49% of AtGPA1 is alpha
helices, 41% is random coil and 10% is extended strand. It comprises of two main
domains as Ras domain and helical domain in between where binding occurs. After
mutagenesis experiments made on the suspected regions such as the switch regions and
guanine nucleotide–binding pocket domains of the subunit, Jones and colleagues
11
demonstrated that AtGPA1 helical domain is more mobile compare to Ras domain
whereas both helical and Ras domains of animal Gα have vigorous mobility upon
binding. Furthermore, helical domain of AtGPA1 was found to be more mobile than
animal Gα helical domain, too. This high mobility led to the hypothesis that the helical
domain is where self-activation occurs in the plant Gα. To prove this hypothesis,
intrinsic fluorescence measurements with GTP-γ-S and GTP were performed.
Nucleotide exchange with not only AtGPA1 but also with chimeras formed by AtGPA1
and animal GPA1 helical domains were formed to see how helical domain changes
upon binding. Based on the results obtained, it was decided that helical domain is
sufficient to exchange GDP to GTP [2].
Figure 1-7: Comparison of the crystal structures of A. thaliana G protein alpha subunit
(AtGPA1) and mammalian Giα1 alpha subunit. AtGPA1 is shown in pink, Giα1 is shown
in gray and GDP is shown in green in both of the structures. PDB code of AtGPA1:
2XTZ, PDB code of Giα1: 1GIA [29, 30].
β subunit of plant G protein, namely AGB1, on the other hand, has N-terminal coiled
coil structure and WD40-repeated seven bladed propeller structure on the C-terminal as
it is in the animal Gβ subunit [34]. From its coiled coil structure, it binds to alpha
subunit while WD40 repeating units have an interface with gamma subunit. Again, as it
is in mammalian system, β subunit can transmit signals independently to different
effectors when it is detached from alpha subunit, but it is impossible to both be bound to
alpha subunit and involve another pathway simultaneously [32].
Ras domain
Helical domain
GDP
12
The smallest subunit of the heterotrimer, the γ subunit (named as AGG1, AGG2, AGG3
in A. thaliana) has a molecular weight around 8-10 kDa and are sub grouped under
three classes. Type A γ subunit has an isoprenylation site which is defined as cysteine,
two aliphatic residues followed by any residue (CaaX) at C-terminus, type B lacks this
site and in type C, there are high number of cysteine residues at its C-terminus [1].
Since there is no isoprenylation site in animal γ subunit, it forms the major difference
between plant and mammalian γ subunits. A. thaliana contains from both type A and
type B. AGG1 and AGG2 is classified as type A, whereas AGG3 is classified as type C
due to its cysteine rich domain. There is no type Bγ subunit of A. thaliana [30].
1.4.2 Signaling Mechanism of Plant G Proteins
As it comes to functions of each subunit, alpha subunit plays the major role in
mediating signal transmission from receptors to their effectors. For a long time,
mammalian system has been used as an analog for plant heterotrimeric G proteins
assuming that they have similar mechanisms. However, recent studies led to the fact
that the plant α subunit shows signatures pointing that it has a self activation mechanism
unlikely to mammalian system. When it is bound to GDP, it is referred as the inactive
state of GPA1 and with GTP, it is referred as the active state. What creates the
difference according to the suggested model is that it spontaneously releases GDP and
binds to GTP and it mostly prefers to be bound to GTP [3]. Furthermore, instead of
having GPCR as a receptor, RGS proteins which accelerate the hydrolysis of GTP to
GDP are found in plant system. In fact, they are a major element in the self activating
mechanism in that GPA1 would stay bound to GTP for much longer time if RGS
proteins did not stimulate hydrolysis. When there is a ligand in the environment, it binds
to RGS and inhibits its function which eventually leads alpha subunit to dissociate from
βγ dimer and stay bound to GTP, that is the active state and transmit the signal to its
effectors. When ligand disappears from the environment, RGS goes back to its primary
function which is acceleration of GTP hydrolysis, alpha subunit stops signaling,
performs its GTPase activity and hydrolyzes GTP to GDP and finally it binds the βγ
dimer resuming its inactive state. Memebers of the RGS protein family are the major
GTPase activating proteins (GAPs) but GAPs don’t necessarily have to be RGS
proteins, other GAP proteins have the same function in plant system (This model has
been suggested by Daisuke Urano and the colleagues and reviewed in [1]).
13
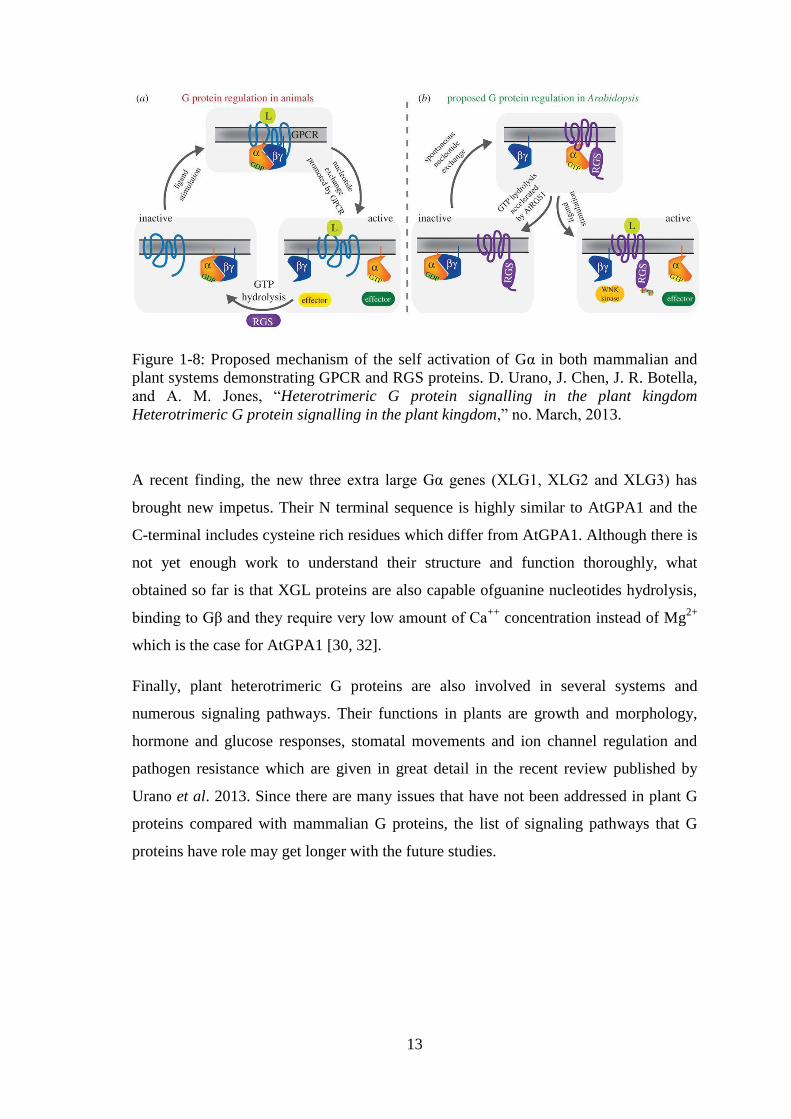
Figure 1-8: Proposed mechanism of the self activation of Gα in both mammalian and
plant systems demonstrating GPCR and RGS proteins. D. Urano, J. Chen, J. R. Botella,
and A. M. Jones, “Heterotrimeric G protein signalling in the plant kingdom
Heterotrimeric G protein signalling in the plant kingdom,” no. March, 2013.
A recent finding, the new three extra large Gα genes (XLG1, XLG2 and XLG3) has
brought new impetus. Their N terminal sequence is highly similar to AtGPA1 and the
C-terminal includes cysteine rich residues which differ from AtGPA1. Although there is
not yet enough work to understand their structure and function thoroughly, what
obtained so far is that XGL proteins are also capable ofguanine nucleotides hydrolysis,
binding to Gβ and they require very low amount of Ca++
concentration instead of Mg2+
which is the case for AtGPA1 [30, 32].
Finally, plant heterotrimeric G proteins are also involved in several systems and
numerous signaling pathways. Their functions in plants are growth and morphology,
hormone and glucose responses, stomatal movements and ion channel regulation and
pathogen resistance which are given in great detail in the recent review published by
Urano et al. 2013. Since there are many issues that have not been addressed in plant G
proteins compared with mammalian G proteins, the list of signaling pathways that G
proteins have role may get longer with the future studies.
14
1.5 The Aim of the Study
The suggested self activation mechanism of heterotrimeric G-proteins in plants, which
distinguishes them from their mammalian counterparts is not yet fully understood.
There is limited evidence in the literature towards this model. In order to provide insight
in to the less known aspects of the mechanism and fuction of plant heterotrimeric G
proteins, it is necessary to express, purify and obtain adequate amounts of each three
subunits of the heterotrimer so that reconstitution can be performed in vitro and
dynamic data on the structure and structural changes can be obtained. Our ultimate goal
is to determine 3D structure of the heterotrimeric G protein of A.thaliana as a whole by
reconstituting the complex of the three subunits in vitro. In this study, we investigated
the expression of the alpha subunit of A. Thaliana (AtGPA1) heterotrimeric G protein in
E.coli in order to optimize the time and resource. Aims of the work presented in this
were:
Cloning of GPA1 by using two different vectors, namely petM41 and pQE80L
which would produce the recombinant protein as fusion with his-tag and maltose
binding protein (MBP) and his-tag respectively,
Optimization of protein expression using different host E.coli strains and
varying environmental conditions,
Purification of the fusion proteins from E.coli by applying different
chromatography methods,
Cleavage of the tags, to obtain the native proteins,
Characterization of the purified GPA1 by DLS (dynamic light scattering),
absorption spectroscopy and SDS- and native-PAGE.
Additionally towards further biophysical characterization of GPA1 expressed in P.
pastoris circular dichroism (CD) measurements were carried out to show that the
secondary structure content is consistent with that obtained from the crystal structure.
15
2 MATERIALS AND METHODS
2.1 MATERIALS
2.1.1 Chemicals
Chemicals used through the project time were supplied from different companies which
are Invitrogen, Sigma Aldrich, peQLAB, ThermoScientific, Roche, Qiagen, Fermentas,
Miltenyi Biotechnology MACS, AppliChem, Amresco, MERCK, Molekula and Biolife.
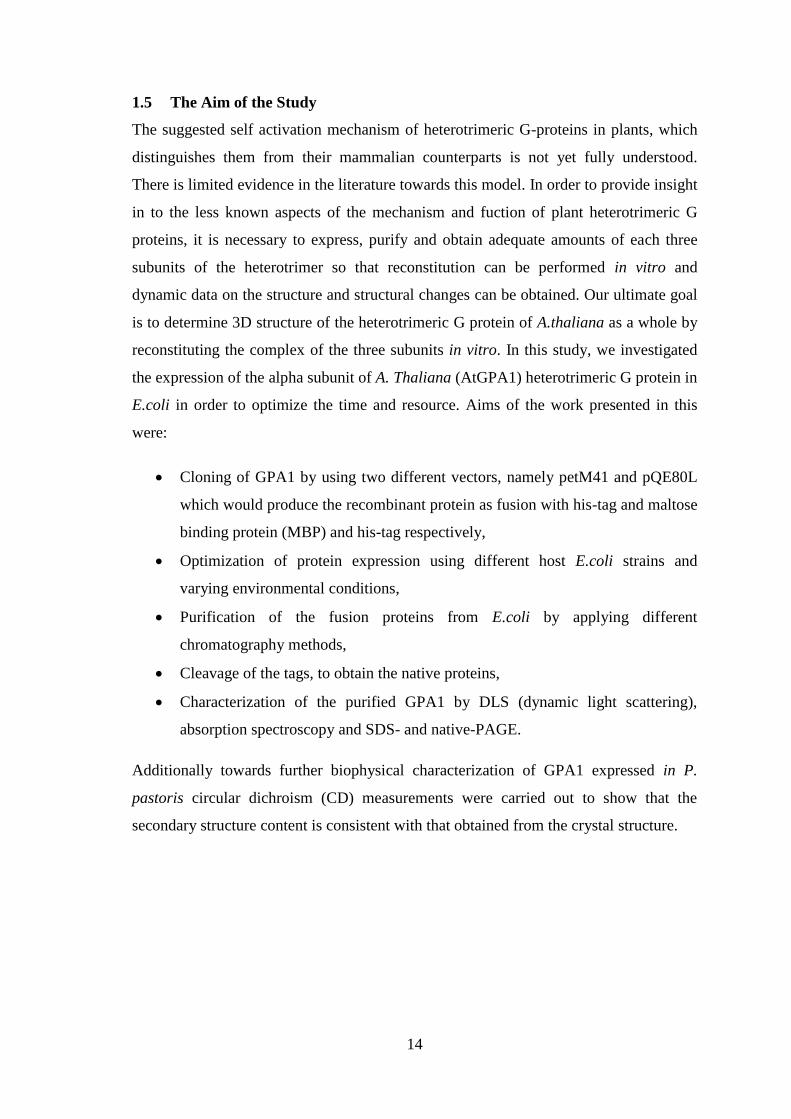
2.1.2 Vectors
petM-41 and pQE80L vectors were used to clone GPA1 gene. Vectors were already
stocked by former members of the lab and vector maps can be found in Appendix D. In
Figure 2-1, more simplistic versions of petM-41 and pQE80L are represented to show
the tags which are used to recognize GPA1 in cells and also further confirmation that it
is GPA1 but not another random protein with similar molecular weight.
Figure 2-1: The vectors used to clone GPA1 and their tags inside the vector sequence.
Shortly, there two N-terminal tags in pETM-41 which are MBP (maltose binding
protein) tag that corresponds to incrase solubility and has 45-kDa molecular weight and
Histidine-tag that is six consequtive Histidine aminoacid for affinity chromatography.
There is also TEV cleavage site which is comprised of “Glu-Asn-Leu-Tyr-Phe-Gln-
Gly” aminoacid sequence and it is used for removal of MBP and leaving GPA1 without
a tag. pETM-41 has Kanamycin resistance sequence in it. On the other hand, pQE80L
has only one N-terminal tag which is His-tag for affinity chromatography. pQE80L has
Ampicilin resistance sequence in it.
16
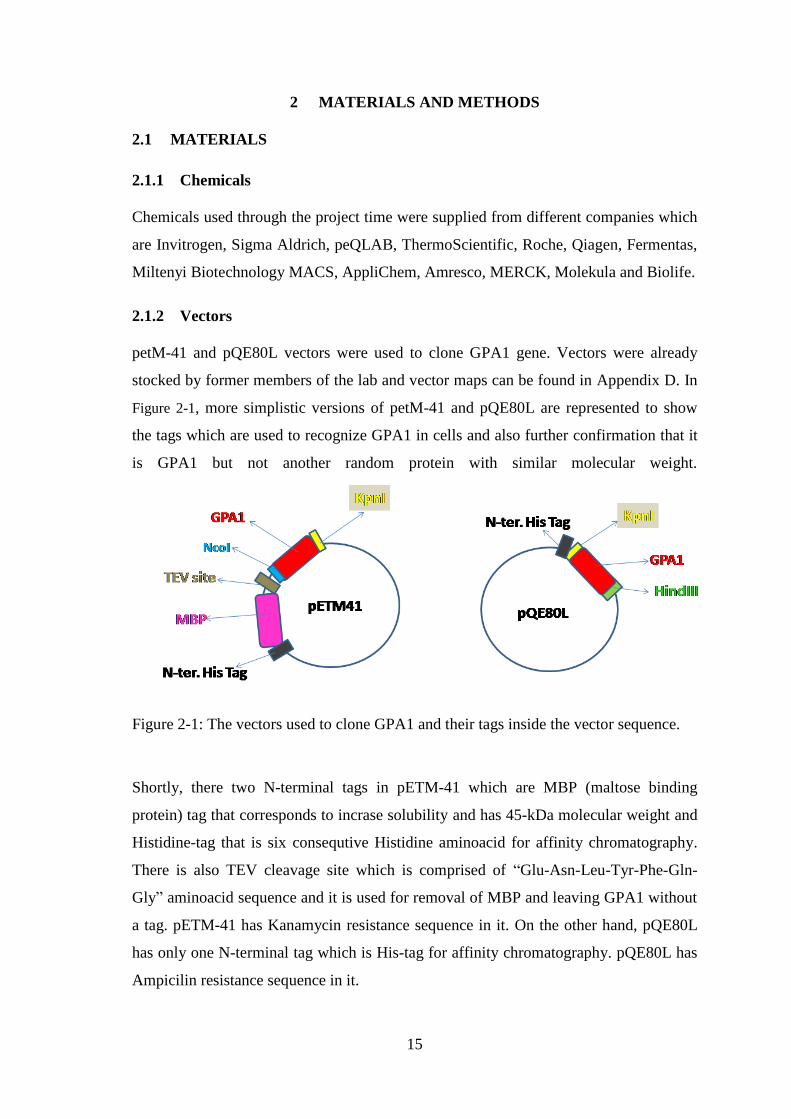
2.1.2.1 Primers designed for these vectors
Here are given the sequences of all the primers used for amplification of GPA1 gene,
primers corresponding to cloning of GPA1 in pETM-41 vector and primers
corresponding to cloning of GPA1 in pQE80L vector in Table 2.
Sequences
Restriction
enzyme
GPA1 Forward 5’-ATGGGCTTACTCTGCAGTAGA-3’ -
Reverse 5’-TTATTATCATAAAAGGCCAGCCTCCAG-3’ -
GPA1-pETM41 Forward 5’-CATGCCATGGGCTTACTCTGCAGTTAC-3’ NcoI
Reverse 5’-CGGGGTACCTCATCATAAAGGCCAGCCTC-3’ KpnI
GPA1-pQE80L Forward 5’-GGGGTACCGGCTTACTCTGCAGTAGA-3’ HindIII
Reverse 5’-CCAAGCTTTTATCATAAAAGGCCAGCCTC-3’ KpnI
Table 2: Primers used to insert GPA1 gene into pQE80L and pETM-41 vectors.
2.1.3 Enzymes
As it is listed in Table 2, restriction enzymes used to cut vector in their introduced sites
are NcoI, KpnI for pETM41 and HindIII, KpnI for pQE80L. Ligation enzyme was
always T4 Ligase, and Taq Polymerase was used to amplify the templates by PCR
reaction.
2.1.4 Cell Lines
BL21(DE3) and Rosetta are the E.coli strains that were used to express GPA1 in high
amounts and Top10 strain of E.coli was used to transform vectors into bacteria in the
first step. Rosetta is a specific strain which includes the codons for rare tRNAs that are
AUA,AGG, AGA, CUA, CCC and GGA.
For yeast expression, P. pastoris was used.
17
2.1.5 Culture Media
2.1.5.1 E.coli
In all transformation and expression trials, LB (Luria-Bertani) Broth was used.
Ingredients are 10 g Trptone, 5 g yeast extract and 5 gr NaCl for 1 L medium. For solid
medium that are used to inoculate cells after transformation, 15 g of LB-Agar was
added to1 L LB medium with required antibiotics which are Kanamycin and Ampicilin
for pETM41 and pQE80L respectively.
Additionally, Terrific Broth (TB) medium was used only in TEV protease expression.
The content of TB was 24 gr Tryptone, 12 gr yeast extract, 0.17 M KH2PO4 (in 100 ml),
0.72 M K2HPO4 (in 100 ml), 0.12% glycerol and 2 mM MgSO4 for 1 L medium.
2.1.5.2 P. pastoris
YPD (Yeast extract-Peptone-Dextrose) Broth was used for inoculation on solid agar
medium and starter culture (5 ml) with required antibiotic which is Zeocin. Ingredients
of YPD are given as, 10 gr yeast extract, 20 gr peptone and 20 gr agar for solid medium
only.
After dissolving the above in 900 ml dH2O, it is autoclaved and then 100 ml of filter-
sterilized 20% dextrose is added for 1 L YPD medium.
BMGY and BMMY media are used to make larger culture. Ingredients for 1 L are 10 gr
yeast extract and 20 gr peptone are dissolved in 700 ml dH2O autoclaved. Then, 100 ml
1M sterilized potassium phosphate (pH=6.0), 100 ml 10X YNB stock and 1ml 500X
Biotin are added. Finally, for BMGY,100 ml 10X glycerol and for BMMY 100 ml 10X
methanol instead of glycerol are added to media.
2.1.6 Buffers
2.1.6.1 E.coli system
After obtaining cell pellet at the end of expression step;
Lysis buffer: 100 mM NaCl, 50 mM TRIS pH=7.5, 50 µg/ml PMSF, Protease Inhibitor
Tablet, 0.5 mg/ml Lysozyme from chicken egg white,
18
Affinity (HiTrap) buffer (Buffer A): 50 mM TRIS, 300 mM NaCl, 1% glycerol, 10 mM
imidazole, 50 µM GDP, 5 mM MgCl2, 30 µM Al2(SO4)3 and 20 mM NaF,
Elution buffer (Buffer B): 50 mM TRIS, 300 mM NaCl, 1% glycerol, 1 M imidazole, 50
µM GDP, 5 mM MgCl2, 30 µM Al2(SO4)3 and 20 mM NaF,
Desalting buffer: 50 mM TRIS pH=7.4,
Anion Exchange (QTrap) buffer (A): 50 mM TRIS pH=7.4
Anion Exchange (QTrap) elution buffer (B): 50 mM TRIS pH=7.4, 700 mM NaCl
buffer,
Size Exclusion Chromatography (SEC) buffer: 25 mM TRISpH=7.4, 100 mM NaCl, 50
µM GDP, 1 mM DTT.
2.1.6.2 P. pastoris system
Lysis buffer: 10 mM MgCl2, 0.1% Triton-X-100, 2 mM PMSF, 1X EDTA-Free
Protease Inhibitor Tablet.
10X Purification Buffer: 500 mM TRIS, pH 8.0, 100 mM BME (β-merchaptoethanol), 3
M NaCl, 200 mM imidazole, 50 mM MgCl2, 2 mM PMSF, 300 µM Al2(SO4)3, 100 mM
NaF, 1X EDTA-Free Protease Inh. Tablet, 500 µM GDP.
Dialysis buffer: 50 mM TRIS, pH=8.0, 1 mM DTT, 5% glycerol with CelluSep
Renegenerated tubular membrane with molecular weight cutoff (MWCO) 6000-8000
and MWCO 12000-14000 Da.
Anion Exchange (QTrap) Start Buffer: 50 mM TRIS, pH: 8.0
Anion Exchange (QTrap) Binding Buffer: 50 mM TRIS, 700 mM NaCl.
Size Exclusion Chromatography (SEC) buffer: 50 mM TRISpH=7.4, 150 mM NaCl, 50
µM GDP, 1 mM DTT.
All buffers used in chromatography steps were prepared with dH2O, filtered with 0.22
µm Millipore filter paper and degassed before using them.
Buffers used in electrophoresis, SDS-PAGE, Native-PAGE, Western Blotting, etc. can
be found in Appendix E.
19
2.1.7 Columns
For affinity chromatography, HisTrap 1ml and 5 ml columns depending on the amount
of supernatant, for desalting, HiPrep 26/10 Desalting column, for ion exchange
chromatography, QTrap 5 ml column and for size exclusion chromatography, HiLoad
16/60 Superdex 75pg and HiLoad 16/600 Superdex 200pg columns were used. All of
them were supplied by GEHealthcare. Also, for GPA1 in P. pastoris purification,
instead of automated system, batch mode affinity chromatography was applied with
QIAGEN Ni-NTA agarose slurry.
In between chromatography steps and at the end of each purification cycle,
concentrators with MWCO=10000 and MWCO=30000 (Millipore Centrifugal Filter
Unit, Sartorious Biolab Product) were used to concentrate depending on the molecular
weight of the protein.
20
2.2 METHODS
2.2.1 Cloning GPA1 gene into vectors
In order to clone GPA1 gene into vectors (pETM-41 and pQE80L), PCR was applied
with primers having restriction enzyme recognition sites given in Table 2.
Chemicals Amount
(µl)
Forward primer (20 mM) 1
Reverse primer (20 mM) 1
Template (GPA1) 1
MgCl2 (25 mM) 2,5
Taq Polymerase 1
Taq poly buff w/o MgCl2 1,5
dNTPs 1
dH2O 15
Total 25
Table 3: Chemicals used in PCR reaction and the temperatures of PCR reaction carried
out in thermal cycler.
PCR conditions
(pETM-41)
Time PCR conditions
(pQE80L)
Time
95o C 5’ 95
o C 5’
95o C 45’’
34
cycles
95o C 45’’
34
cycles 50
o C 45’’ 52
o C 45’’
72o C 45’’ 72
o C 45’’
72o C 5’ 72
o C 5’
4o C ∞ 4
o C ∞
Table 4: PCR conditions applied for amplification of GPA1 gene with primers specially
for pETM-41 and pQE80L vectors.
After each PCR reaction, 1% agarose gel electrophoresis was applied for 1 hour with
1X TAE buffer (ingredients/preparation of the buffer can be found in Appendix E) to
visualize the PCR products and see if their molecular weight that is number of
approximate base pair is consistent with the expected molecular weight. 6X loading dye
was added to each sample to visualize them with the help of ethidium bromide (EtBr)
staining. Molecular weight estimation of DNA fragments was made by using MassRuler
21
DNA ladder mix (ThermoScientific). If DNA fragment is consistent with the length of
GPA1 with restriction sites, the fragment was cut out of the gel and it was purified from
the gel by using Gel Extraction Kit (QIAGEN).
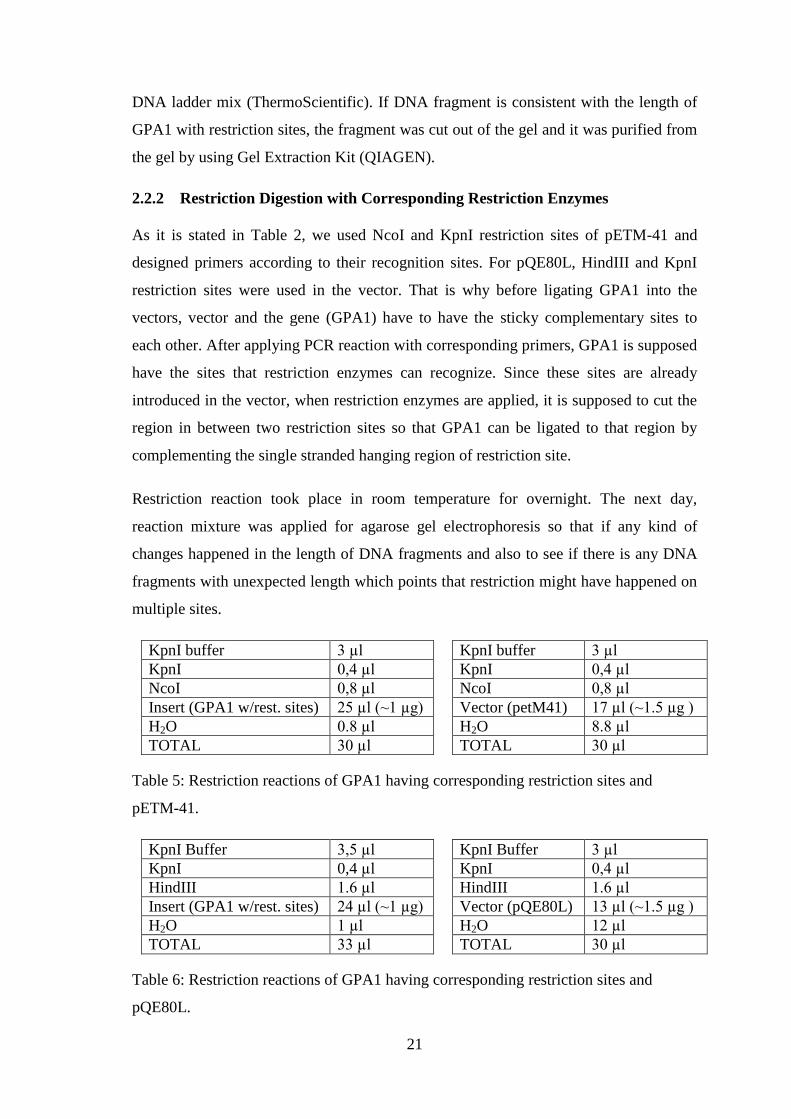
2.2.2 Restriction Digestion with Corresponding Restriction Enzymes
As it is stated in Table 2, we used NcoI and KpnI restriction sites of pETM-41 and
designed primers according to their recognition sites. For pQE80L, HindIII and KpnI
restriction sites were used in the vector. That is why before ligating GPA1 into the
vectors, vector and the gene (GPA1) have to have the sticky complementary sites to
each other. After applying PCR reaction with corresponding primers, GPA1 is supposed
have the sites that restriction enzymes can recognize. Since these sites are already
introduced in the vector, when restriction enzymes are applied, it is supposed to cut the
region in between two restriction sites so that GPA1 can be ligated to that region by
complementing the single stranded hanging region of restriction site.
Restriction reaction took place in room temperature for overnight. The next day,
reaction mixture was applied for agarose gel electrophoresis so that if any kind of
changes happened in the length of DNA fragments and also to see if there is any DNA
fragments with unexpected length which points that restriction might have happened on
multiple sites.
KpnI buffer
3 µl KpnI buffer 3 µl
KpnI 0,4 µl KpnI 0,4 µl
NcoI 0,8 µl NcoI 0,8 µl
Insert (GPA1 w/rest. sites) 25 µl (~1 µg) Vector (petM41) 17 µl (~1.5 µg )
H2O 0.8 µl H2O 8.8 µl
TOTAL 30 µl TOTAL 30 µl
Table 5: Restriction reactions of GPA1 having corresponding restriction sites and
pETM-41.
KpnI Buffer
3,5 µl KpnI Buffer 3 µl
KpnI 0,4 µl KpnI 0,4 µl
HindIII 1.6 µl HindIII 1.6 µl
Insert (GPA1 w/rest. sites) 24 µl (~1 µg) Vector (pQE80L) 13 µl (~1.5 µg )
H2O 1 µl H2O 12 µl
TOTAL 33 µl TOTAL 30 µl
Table 6: Restriction reactions of GPA1 having corresponding restriction sites and
pQE80L.
22
If the DNA fragments are consistent with the expected length, again, corresponding
bands seen in agarose gel was cut out of it and gel extraction was applied to prepare the
sample for the next step.
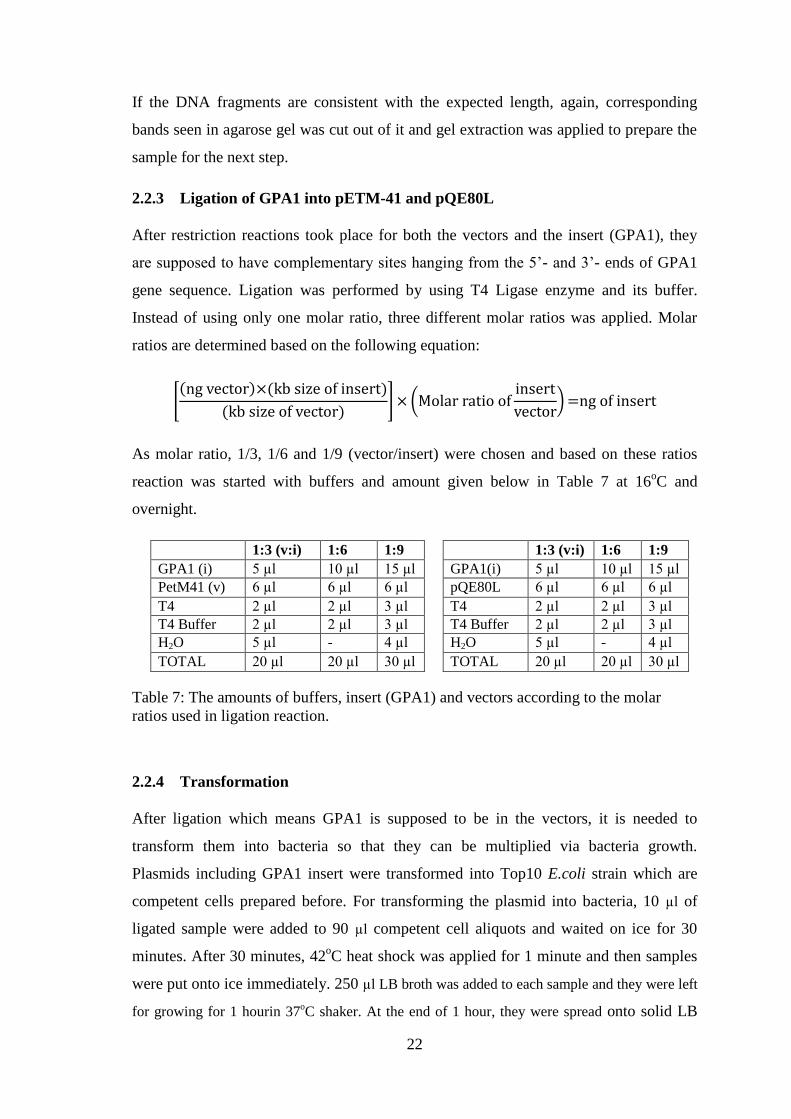
2.2.3 Ligation of GPA1 into pETM-41 and pQE80L
After restriction reactions took place for both the vectors and the insert (GPA1), they
are supposed to have complementary sites hanging from the 5’- and 3’- ends of GPA1
gene sequence. Ligation was performed by using T4 Ligase enzyme and its buffer.
Instead of using only one molar ratio, three different molar ratios was applied. Molar
ratios are determined based on the following equation:
As molar ratio, 1/3, 1/6 and 1/9 (vector/insert) were chosen and based on these ratios
reaction was started with buffers and amount given below in Table 7 at 16oC and
overnight.
1:3 (v:i) 1:6 1:9 1:3 (v:i) 1:6 1:9
GPA1 (i) 5 µl 10 µl 15 µl GPA1(i) 5 µl 10 µl 15 µl
PetM41 (v) 6 µl 6 µl 6 µl pQE80L 6 µl 6 µl 6 µl
T4 2 µl 2 µl 3 µl T4 2 µl 2 µl 3 µl
T4 Buffer 2 µl 2 µl 3 µl T4 Buffer 2 µl 2 µl 3 µl
H2O 5 µl - 4 µl H2O 5 µl - 4 µl
TOTAL 20 µl 20 µl 30 µl TOTAL 20 µl 20 µl 30 µl
Table 7: The amounts of buffers, insert (GPA1) and vectors according to the molar
ratios used in ligation reaction.
2.2.4 Transformation
After ligation which means GPA1 is supposed to be in the vectors, it is needed to
transform them into bacteria so that they can be multiplied via bacteria growth.
Plasmids including GPA1 insert were transformed into Top10 E.coli strain which are
competent cells prepared before. For transforming the plasmid into bacteria, 10 µl of
ligated sample were added to 90 µl competent cell aliquots and waited on ice for 30
minutes. After 30 minutes, 42oC heat shock was applied for 1 minute and then samples
were put onto ice immediately. 250 µl LB broth was added to each sample and they were left
for growing for 1 hourin 37oC shaker. At the end of 1 hour, they were spread onto solid LB
23
agar medium including the corresponding antibiotics which are Kanamycin and
Ampicilin for pETM-41 and pQE80L respectively. Agar plates were incubated
overnight at 37oC. And the next day, colony formation was observed.
2.2.5 Colony Selection
After observing colonies on plates, single well grown colonies from each plate were
picked and inoculated in 5 ml LB media including respective antibiotics stated above to
increase their number of copies so that plasmid isolation can be applied. 5 ml cultures
were left in shaker for growing overnight at 37oC and 250 rpm.
2.2.6 Plasmid Isolation
At the end of overnight growth, 5 ml cultures were taken and in order to isolate the
plasmids inside bacteria cells, QIAprep Spin Miniprep Kit (QIAGEN) was used. The
final concentration after Miniprep was measured by using ND 1000 Nanodrop
Spectrophotometer.
2.2.7 Control PCR
In order to confirm that isolated plasmids have GPA1 gene inside, control PCR was
applied. Isolated plasmids were used as template and corrsponding primers given in
Table 2 were also added to the reaction mixture to understand whether GPA1 sequence
is inside the plasmid or not. After PCR reaction, DNA fragments were visualized 1%
agarose gel electrophoresis by running it with 1X TAE buffer for 60 minutes.
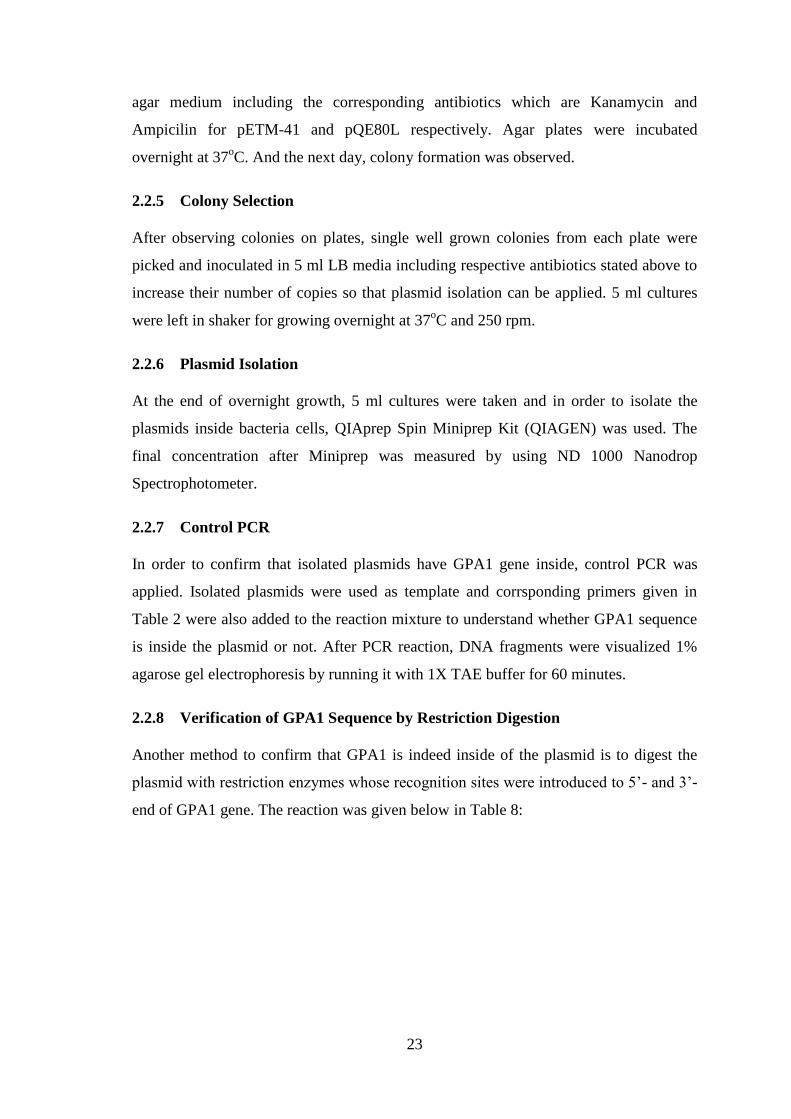
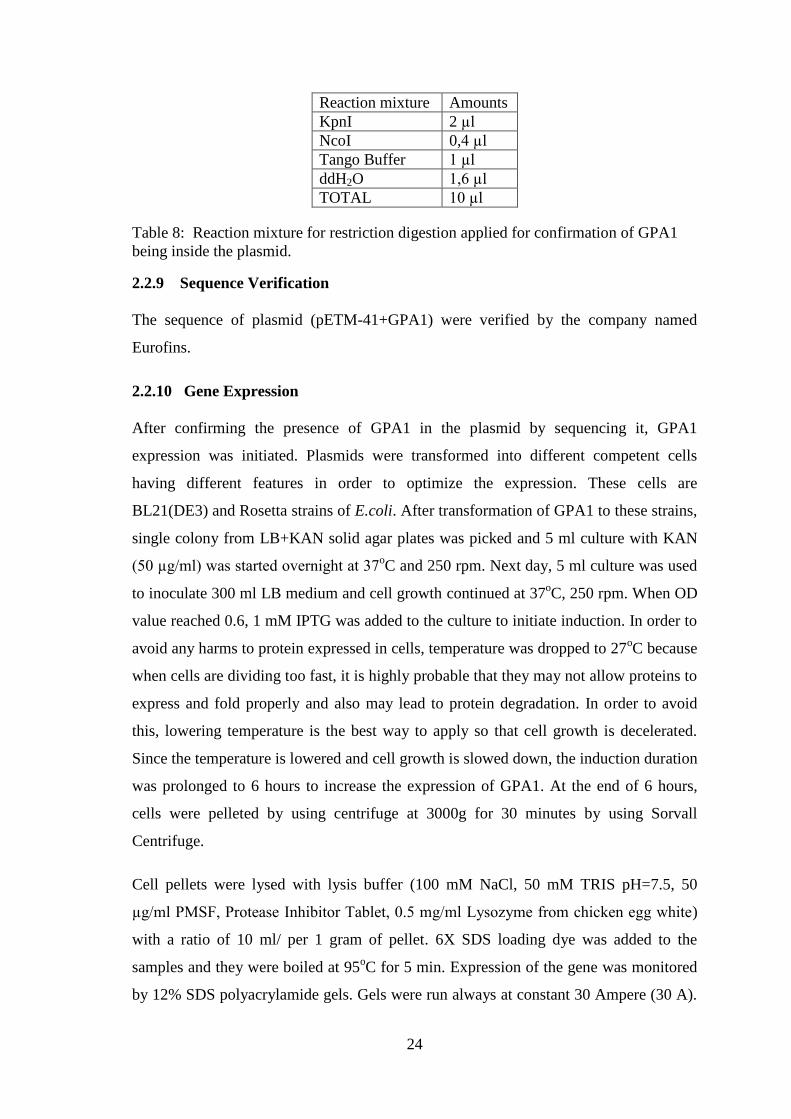
2.2.8 Verification of GPA1 Sequence by Restriction Digestion
Another method to confirm that GPA1 is indeed inside of the plasmid is to digest the
plasmid with restriction enzymes whose recognition sites were introduced to 5’- and 3’-
end of GPA1 gene. The reaction was given below in Table 8:
24
Reaction mixture Amounts
KpnI 2 µl
NcoI 0,4 µl
Tango Buffer 1 µl
ddH2O 1,6 µl
TOTAL 10 µl
Table 8: Reaction mixture for restriction digestion applied for confirmation of GPA1
being inside the plasmid.
2.2.9 Sequence Verification
The sequence of plasmid (pETM-41+GPA1) were verified by the company named
Eurofins.
2.2.10 Gene Expression
After confirming the presence of GPA1 in the plasmid by sequencing it, GPA1
expression was initiated. Plasmids were transformed into different competent cells
having different features in order to optimize the expression. These cells are
BL21(DE3) and Rosetta strains of E.coli. After transformation of GPA1 to these strains,
single colony from LB+KAN solid agar plates was picked and 5 ml culture with KAN
(50 µg/ml) was started overnight at 37oC and 250 rpm. Next day, 5 ml culture was used
to inoculate 300 ml LB medium and cell growth continued at 37oC, 250 rpm. When OD
value reached 0.6, 1 mM IPTG was added to the culture to initiate induction. In order to
avoid any harms to protein expressed in cells, temperature was dropped to 27oC because
when cells are dividing too fast, it is highly probable that they may not allow proteins to
express and fold properly and also may lead to protein degradation. In order to avoid
this, lowering temperature is the best way to apply so that cell growth is decelerated.
Since the temperature is lowered and cell growth is slowed down, the induction duration
was prolonged to 6 hours to increase the expression of GPA1. At the end of 6 hours,
cells were pelleted by using centrifuge at 3000g for 30 minutes by using Sorvall
Centrifuge.
Cell pellets were lysed with lysis buffer (100 mM NaCl, 50 mM TRIS pH=7.5, 50
µg/ml PMSF, Protease Inhibitor Tablet, 0.5 mg/ml Lysozyme from chicken egg white)
with a ratio of 10 ml/ per 1 gram of pellet. 6X SDS loading dye was added to the
samples and they were boiled at 95oC for 5 min. Expression of the gene was monitored
by 12% SDS polyacrylamide gels. Gels were run always at constant 30 Ampere (30 A).
25
Samples were run until the dyes of the samples were at the lower border of the gel.
Protein molecular weight markers (Fermentas, pqeLAB) were loaded in each gel to
identify the molecular mass of the proteins in the samples and at the end of each run
protein bands were visualized by coomassie blue staining.
2.2.11 Large Scale Expression
2.2.11.1 E.coli system
After confirming that GPA1 gene is expressed in E.coli cells, in order to find the
optimum conditions for expression, different conditions of IPTG (isopropyl-beta-D-
thiogalactopyranoside) and temperature were applied for two different E.coli strains that
are BL21(DE3) and Rosetta. In each case, a small culture (5 ml) of LB+KAN
(Kanamycin with the concentration of 50 µg/ml) was inoculated with a single colony
grown on the LB plate after transformation overnight at 37oC and 250 rpm. Next day,
observably grown cultures were used to inoculate a larger one (generally it varied
between 1-2 L cultures) and their OD600 (Optical density, 600 nm) measurements were
performed to monitor how fast the cells are growing. When they reached OD=0.6 value,
induction was started by adding IPTG (0.5 mM, 0.8 mM and 1 mM depending on
temperature) and lowering the temperature from 37oC to 20
oC, 25
oC and 27
oC. After the
induction (induction time is also varied from 6 hours to 18 hours depending on
temperature), cells were pelleted by using centrifuge at 3000g for 30 minutes by using
Sorvall Centrifuge and pellets were kept at -80oC until purification took place.
2.2.11.2 P. pastoris system
Additionally, the expression of GPA1 was also monitored in yeast system. For this,
former construct and its -80oC stocks were used [4]. The optimized conditions defined
in Kaplan, 2009 were used to express GPA1 in yeast.
2.2.12 Purification
2.2.12.1 Affinity Chromatography
2.2.12.1.1 Ni-Affinity HisTrap Columns
After harvesting cells from large scale expressions, they were lysed with lysis buffer as
it is described in Section 2.1.6.1. After lysis, sonication was applied with parameters of
38% amplification, 7 sec pulse on, 20 sec pulse off for 30 min. At the end of sonication,
26
it is expected to see clearer lysate if sonication worked well. After sonication, in order
to have the supernatant which includes all the contents of cells, centrifugation was
applied at 15000 rpm for 30 min at 4oC with Sorvall SS-34 centrifuge rotor. At the end
of centrifugation, supernatant was kept on ice and only a small portion of pellet was
kept seperately in order to load it to SDS-PAGE to visualize GPA1 remained in the
pellet if any.
Before loading the supernatant into His-Trap column which is connected to AKTA
FPLC (Fast Protein Liquid Chromatography), the column was washed with dH2O to
eliminate the EtOH used to store the column. Depending on the volume of supernatant,
either 1 ml or 5 ml HisTrap column was used. After UV line is stabilized, pumps were
washed with affinity buffers described in Section 2.1.6 and then column was washed
wtih buffer A (binding buffer). By using appropriote sized loop, supernatant was loaded
into column to allow GPA1 which has N-terminal His6- tag to bind Ni ions available in
the column. When all the sample was loaded into column, elution was started by
applying a gradient of elution buffer which includes high concentration of imidazole
that competes with His6- molecules and binds Ni ions instead of GPA1. When an
increase was observed in UV spectrum, fractions were collected and 12% SDS-PAGE
was loaded with these fractions together with FT (flow through), supernatant and pellet
samples.
2.2.12.1.1.1 Desalting
Based on the SDS result, desalting was applied to eliminate high concentration of
imidazole and salts to prepare the sample for the next purification which is to eliminate
further proteins came together with GPA1. For desalting, HiPrep 26/10 Desalting
column was used. Again, first the column was washed with dH2O to eliminate the EtOH
used to store the column and then washed with desalting buffer (50 mM TRIS, pH=7.4).
The sample was loaded to the column and when UV values started to increase, fractions
were collected.
2.2.12.1.2 Batch mode
Instead of using AKTA FPLC system, a slurry of Ni-NTA agarose was used to elute
GPA1 from the supernatant obtained from P. Pastoris cell lysate. First, cells were lysed
with lysis buffer described in Section 2.1.6.2 (10 ml/gr pellet) and Then, re-pelleted at
27
5000 rpm for 15 minutes. Re-pelleted sample was lysated in 60 ml (5 ml/gr) lysis buffer
in which EFPI tablet was added. Instead of sonication, zirconia beads and beater were
used were used to break the cells mechanically. After 10-12 cycles, cells were observed
via light microscope and they were disrupted. Centrifugation at 5000 rpm for 10
minutes was applied in order to eliminate beads and high speed centrifugation at 23000g
(~13400 rpm) for 30 minutes was applied and supernatant was kept for purification.
Supernatant was equilibriated with purification buffer described in Section 2.1.6.2.
Supernatant with PB was mixed with resin for binding and waited for at least 60
minutes on moving table. 20 ml plastic column was filled with the mixture and
seperated from flowthrough by using pump with a speed of 1 ml/min. When
flowthrough was finished, washing step was started. Column was washed with 1
column volume of 1X PB for 4 times after incubating for 5 minutes. After washing step,
elution was started. Elution buffer is slightly different from washing buffer, it includes
higher concentration of imidazole (300 mM) to elute the protein bound to resin. Then, 5
ml of elution buffer was added to column for two times and collected seperately.Again,
at the end of purification, flow through (FT), supernatant, pellet, wash and elution
samples were loaded into 12% SDS-PAGE gel to visualize GPA1 through the steps.
2.2.12.1.2.1 Dialysis
In order to eliminate high concentration of imidazole, dialysis was applied. All eluates
were pooled in CelluSep Regenerated Celluose Tubular Membrane with a molecular
weight cut off value of either 6000-8000 Da or 12000-14000 Da both of which is
acceptable since GPA1 has a molecular weight of 45000 Da (45 kDa). Then, membrane
was left in 50 mM TRIS, pH=8.0 overnight.
2.2.12.2 Anion Exchange Chromatography by QTrap Column
After desalting/dialysis, anion exchange chromatography was applied to further
eliminate the proteins came along with GPA1 during affinity chromatography. A similar
procedure was applied: The column was connected to the FPLC system, first washed
with dH2O, then with buffer A (same with desalting/dialysis buffer). After loading the
sample to the QTrap column (5 ml) and observing a steady UV spectrum, a gradient of
buffer B including high concentration of salt (50 mM TRIS pH= 7.4 or 8.0, 700 mM
NaCl) was applied to elute the bound GPA1 on the column. Fraction starting from the
point that UV started to increase were collected.
28
At the end of purification step, before dialysis/desalting sample, after dialysis/desalting
sample and fractions collected were loaded to 12% SDS-PAGE to visualize how the
purity of GPA1 was changed in between steps.
2.2.12.3 Size Exclusion Chromatography (Gel Filtration)
In order to seperate proteins based on its molecular weight, size exclusion
chromatography was used. This method is useful for both increasing the purity and
confirming that the purified protein in former steps is the protein that was aimed to be
purified by analyzing it via its molecular weight. It is also practical to see if proteins
form oligomers instead of being as monomer. For size exclusion chromatography,
HiLoad 16/60 Superdex 75 and HiLoad 16/600 Superdex 200 pg were used. Since the
maximum volume that can be loaded into SEC columns is 5 ml, samples were
concentrated at 3000 rpm at 4oC until they reach 5 ml or less. Concentration was
performed by using Millipore Centrifugal Filter Units or Sartorious Biolab Products
concentrators with MWCO=10000 Da or 30000 Da depending on which construct of
GPA1 was purified. After connecting the column to the FPLC system, it is washed first
with dH2O and then equilibriated with SEC buffer described in Section 2.1.6. Then the
sample is loaded and again fractions starting from the point that UV started to increase
were collected until UV value reached its the lowest value and was stabilized.
At the end of SEC, fractions were loaded to 12% SDS-PAGE and dyed with comassie
blue after running them at 30 A. Concentration measurements in between steps were
done by using the absorbance of the samples at 280 nm (A280) by NanoDrop and the
concentration of the samples were determined by the extinction coefficient
(GPA1=0.93, GPA1 with MBP tag=1.24).
2.2.13 TEV Protease Digestion
2.2.13.1 Expression, Purification and Storage of TEV Protease
TEV protease expression, purification and storage was performed as it was described in
[36]. Briefly, pMHT238Δ vector which has His6-tag TEV protease gene was
transformed into BL21 E.coli cells and spreaded onto LB-KAN solid agar medium since
the vector is KAN resistant. After observing colony formation, single colony was
picked and and 5 ml Terrific Broth (TB) medium was inoculated with it overnight at
37oC, 250 rpm. Next day, the small culture was used to inoculate 1 L TB medium.
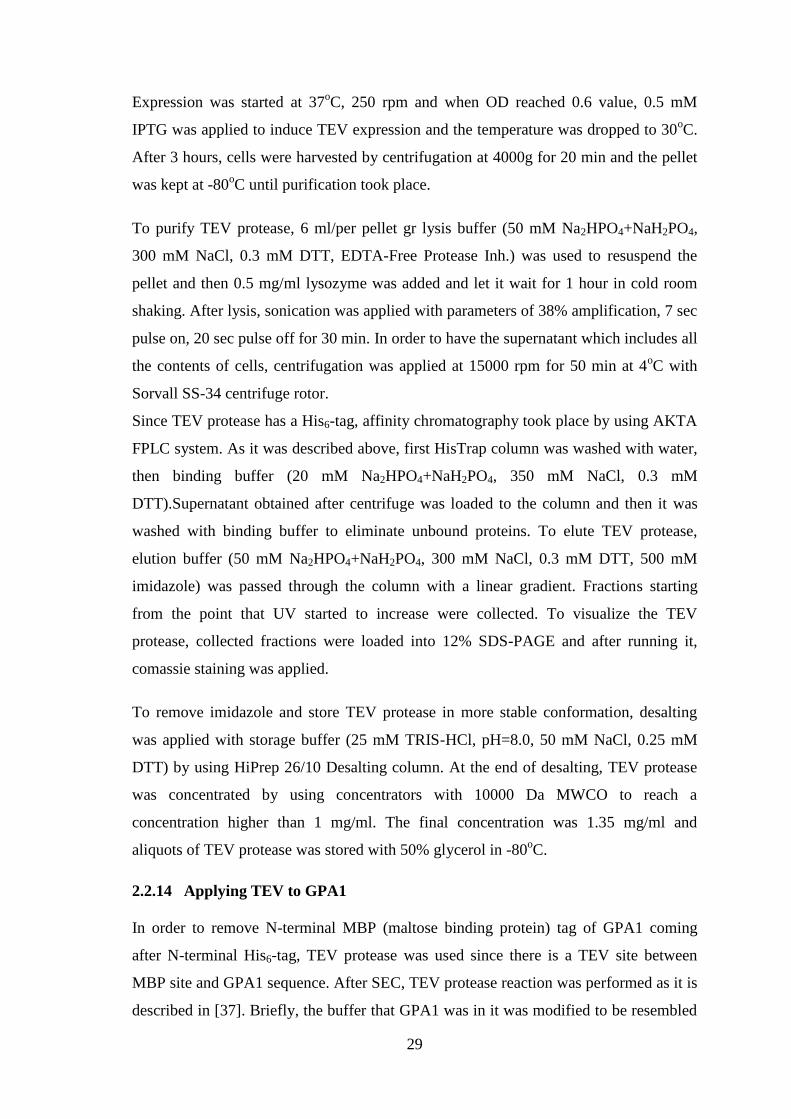
29
Expression was started at 37oC, 250 rpm and when OD reached 0.6 value, 0.5 mM
IPTG was applied to induce TEV expression and the temperature was dropped to 30oC.
After 3 hours, cells were harvested by centrifugation at 4000g for 20 min and the pellet
was kept at -80oC until purification took place.
To purify TEV protease, 6 ml/per pellet gr lysis buffer (50 mM Na2HPO4+NaH2PO4,
300 mM NaCl, 0.3 mM DTT, EDTA-Free Protease Inh.) was used to resuspend the
pellet and then 0.5 mg/ml lysozyme was added and let it wait for 1 hour in cold room
shaking. After lysis, sonication was applied with parameters of 38% amplification, 7 sec
pulse on, 20 sec pulse off for 30 min. In order to have the supernatant which includes all
the contents of cells, centrifugation was applied at 15000 rpm for 50 min at 4oC with
Sorvall SS-34 centrifuge rotor.
Since TEV protease has a His6-tag, affinity chromatography took place by using AKTA
FPLC system. As it was described above, first HisTrap column was washed with water,
then binding buffer (20 mM Na2HPO4+NaH2PO4, 350 mM NaCl, 0.3 mM
DTT).Supernatant obtained after centrifuge was loaded to the column and then it was
washed with binding buffer to eliminate unbound proteins. To elute TEV protease,
elution buffer (50 mM Na2HPO4+NaH2PO4, 300 mM NaCl, 0.3 mM DTT, 500 mM
imidazole) was passed through the column with a linear gradient. Fractions starting
from the point that UV started to increase were collected. To visualize the TEV
protease, collected fractions were loaded into 12% SDS-PAGE and after running it,
comassie staining was applied.
To remove imidazole and store TEV protease in more stable conformation, desalting
was applied with storage buffer (25 mM TRIS-HCl, pH=8.0, 50 mM NaCl, 0.25 mM
DTT) by using HiPrep 26/10 Desalting column. At the end of desalting, TEV protease
was concentrated by using concentrators with 10000 Da MWCO to reach a
concentration higher than 1 mg/ml. The final concentration was 1.35 mg/ml and
aliquots of TEV protease was stored with 50% glycerol in -80oC.
2.2.14 Applying TEV to GPA1
In order to remove N-terminal MBP (maltose binding protein) tag of GPA1 coming
after N-terminal His6-tag, TEV protease was used since there is a TEV site between
MBP site and GPA1 sequence. After SEC, TEV protease reaction was performed as it is
described in [37]. Briefly, the buffer that GPA1 was in it was modified to be resembled
30
to TEV protease reaction buffer. TEV protease is not active in salt concentrations higher
than 500 mM. The recommended TEV reaction buffer is 50 mM TRIS pH=8.0, 1 mM
DTT and 0.5 mM EDTA. GPA1 final buffer included 50 mM TRIS pH=7.5, 1 mM
DTT, 100 mM NaCl and 50 µM GDP.In order to make it more similar to TEV reaction
buffer, 0.5 mM EDTA was added. For 1 mg of GPA1, 30 µg of TEV protease was used
in the reaction. The reaction took place at 4oC to avoid possible precipitation of GPA1.
The reaction was checked at each hour and taken 20 µl of samples. At the end of 4
hours, precipitation was observed and the reaction was stopped by applying affinity
chromatography. As binding buffer, TEV reaction buffer was used and as elution buffer,
TEV reaction buffer plus 500 mM imidazole was used. Affinity procedure was the same
as described above in the Section 2.2.12.1. The important part is that since GPA1 has no
tags after TEV protease reaction, it was supposed to come in the flow through part
because GPA1 is not supposed to bind to the column. Thus, all the flow through was
collected and when UV profile was stabilized, a gradient of elution buffer was applied
and again fractions starting from UV increase point were collected. At the end of
affinity chromatography, 12% SDS-PAGE was run to see if GPA1 was indeed in the
flowthrough part without any tags.
2.2.15 Western Blotting
Western Blotting with required antibody (anti-His antibody) was performed to confirm
that the purified protein was indeed GPA1. After running 12% SDS-PAGE with the
samples to be visualized, PDVF Transfer Membrane (0.45 µm) having the same size
with the SDS gel was prepared by immersing it into MetOH for 1 minute. The western
sandwich was prepared with sponges and filter papers including SDS gel and transfer
membrane on it. It was run until reaching 300 mA then the transfer membrane was
taken out. It is washed with TBS (25 mM TRIS- HCl pH= 8.5, 200 mM Glycine) and
ponceus stain is used to visualize whether transfer is completed or not. Ponceus stain
was washed with dd H2O and TBS until there is no ponceus stain on the membrane.
Then it was left with blocking buffer (10 ml TBS-T, 5% nonfat dry milk) overnight at
4oC. The next day, the membrane is washed thrice with TBS-T and twice with TBS.
Then, membrane is left with anti-His solution (TBS-T, 3% BSA) together with anti-His
antibody for 1 hour at room temperature. At the end of 1 hour, the membrane is washed
with TBS-T and TBS. To visualize it, ECL solution (TRIS-HCL pH=8.8, 90 mM
Cumeric acid, 250 µM Luminol and H2O2) was prepared and the rest of the procedure is
31
taken place in dark room. Membrane was washed with ECL solution and then put into a
casket. X-Ray Films are cut according to the size of the membrane and put onto it.
Then, casket is closed and wait ~1-2 minutes. X-Ray films were washed with KONIX
Developer and Fixer solution until black bands become visible. At the end, films are
washed with water.
2.2.16 Sample Analysis
In between each step, concentration measurement was made by using the absorbance of
the samples at 280nm (A280) by NanoDrop and the concentration of the samples were
determined by the extinction coefficient (GPA1=0.93, GPA1 with MBP tag=1.24).
Also, 12% SDS-PAGE was used to confirm the presence of proteins with their
estimated molecular weights.
8% Native-PAGE was used to visualize if the sample was in a good conformation or it
has any oligomer forms. In the case of having high concentration of samples (more than
1.5 mg/ml), DLS (Dynamic Light Scattering) was applied to determine the quality of
the sample in terms of being aggregated. CD (Circular Dichroism) measurements took
place when we have samples with a concentration higher than 4 mg/ml in order to make
the secondary structure analysis.
32
3 RESULTS
3.1 Cloning GPA1 into vectors
In order not to damage DNA fragments in the middle steps of cloning, they were not
exposed to UV under which EtBr is visible to take a picture of them. So, after plasmid
isolation, control PCR was applied to visualize GPA1 if it is inside the pETM-41 and
pQE80L. The result is given in Figure 3-1. The length of GPA1 is 383 aminoacids
corresponding to 1149 bp.
Figure 3-1: The control PCR results of GPA1 gene when isolated plasmids were used as
template and primers having the restriction enzyme recognition sites were used as
primers. From left to right, 1st lane: GPA1-pETM-41 1/3 ligation construct, 2
nd lane:
GPA1-pETM-41 1/6 ligation construct, 3rd
lane: GPA1-pETM-41 1/9 ligation construct,
4th
lane: GPA1-pQE80L 1/3 ligation construct, 5th
lane: GPA1-pQE80L 1/6 ligation
construct, 6th
lane: GPA1-pQE80L 1/9 ligation construct.
It is obvious that pQE80L construct did not work and GPA1 gene is not in it because
there is no band around ~1000 bp marker. On the other hand, inserting GPA1 gene into
pETM41 worked well because there are not multiple bands resulted at the end of PCR.
The size of the fragment is also consistent with the length of GPA1. It is above the 1031
bp molecular marker band.
To further confirm that GPA1 is inside pETM-41 vector, restriction digestion was
applied. As it is known, NcoI restriction enzyme recognition site was introduced before
the N-terminal region of GPA1 and KpnI restriction enzyme recognition site was
introduced after C-terminal region of GPA1. Thus, if GPA1 is indeed in the plasmid,
then it means that there should be ~1150 bp long DNA fragment visible after applying
both of the restriction enzymes to the plasmid. In Figure 3-2, the result of 1% agarose
gel electrophoresis run after restriction reaction was shown. And in Figure 3-3, it is
1031 bp
200 bp
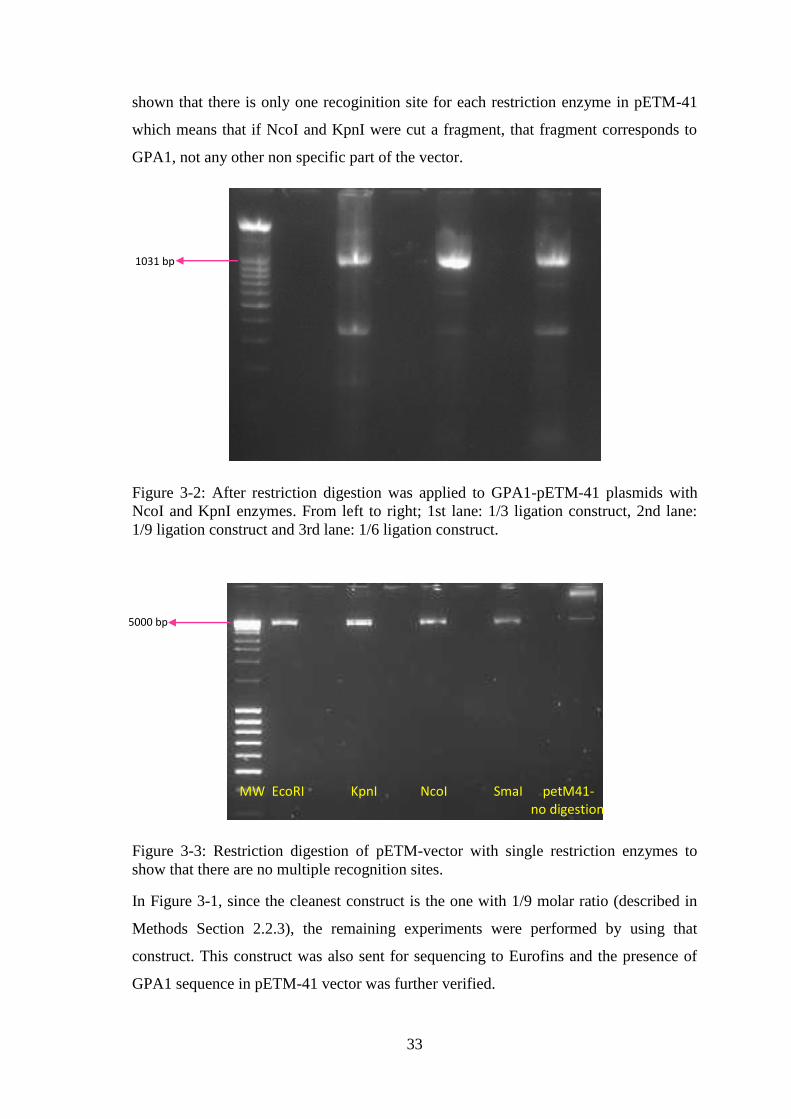
33
shown that there is only one recoginition site for each restriction enzyme in pETM-41
which means that if NcoI and KpnI were cut a fragment, that fragment corresponds to
GPA1, not any other non specific part of the vector.
Figure 3-2: After restriction digestion was applied to GPA1-pETM-41 plasmids with
NcoI and KpnI enzymes. From left to right; 1st lane: 1/3 ligation construct, 2nd lane:
1/9 ligation construct and 3rd lane: 1/6 ligation construct.
Figure 3-3: Restriction digestion of pETM-vector with single restriction enzymes to
show that there are no multiple recognition sites.
In Figure 3-1, since the cleanest construct is the one with 1/9 molar ratio (described in
Methods Section 2.2.3), the remaining experiments were performed by using that
construct. This construct was also sent for sequencing to Eurofins and the presence of
GPA1 sequence in pETM-41 vector was further verified.
MW EcoRI KpnI NcoI SmaI petM41- no digestion
1031 bp
5000 bp
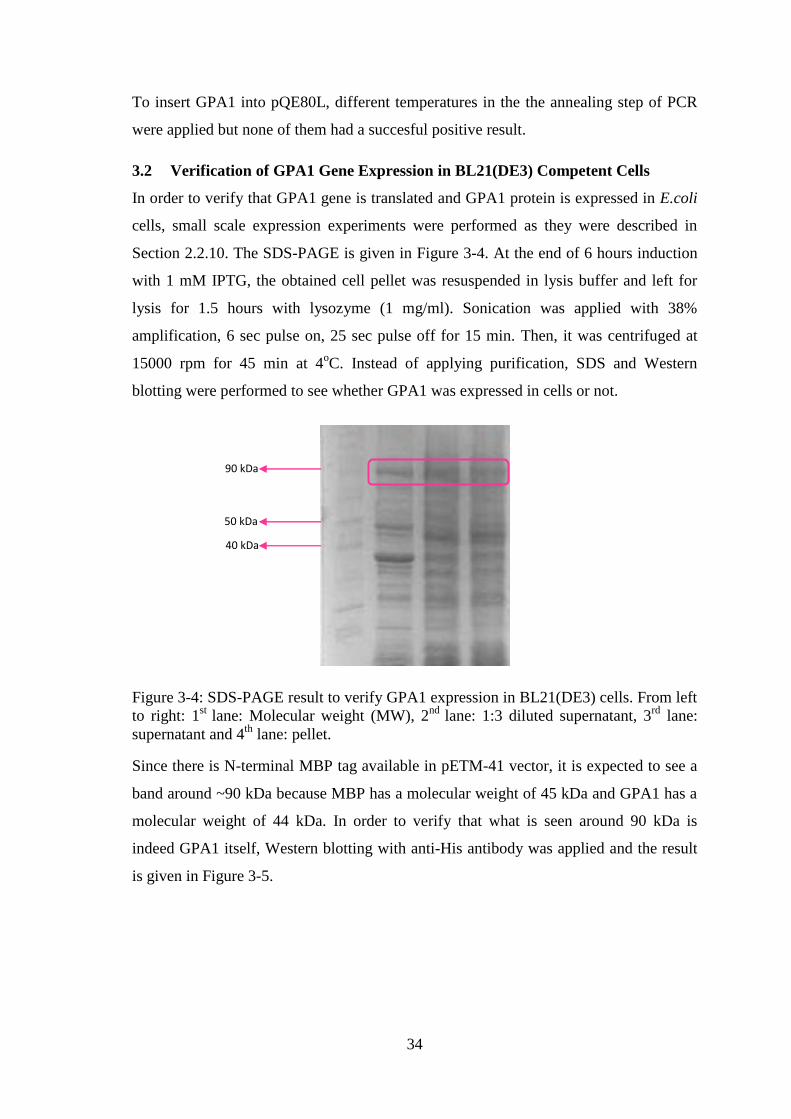
34
To insert GPA1 into pQE80L, different temperatures in the the annealing step of PCR
were applied but none of them had a succesful positive result.
3.2 Verification of GPA1 Gene Expression in BL21(DE3) Competent Cells
In order to verify that GPA1 gene is translated and GPA1 protein is expressed in E.coli
cells, small scale expression experiments were performed as they were described in
Section 2.2.10. The SDS-PAGE is given in Figure 3-4. At the end of 6 hours induction
with 1 mM IPTG, the obtained cell pellet was resuspended in lysis buffer and left for
lysis for 1.5 hours with lysozyme (1 mg/ml). Sonication was applied with 38%
amplification, 6 sec pulse on, 25 sec pulse off for 15 min. Then, it was centrifuged at
15000 rpm for 45 min at 4oC. Instead of applying purification, SDS and Western
blotting were performed to see whether GPA1 was expressed in cells or not.
Figure 3-4: SDS-PAGE result to verify GPA1 expression in BL21(DE3) cells. From left
to right: 1st
lane: Molecular weight (MW), 2nd
lane: 1:3 diluted supernatant, 3rd
lane:
supernatant and 4th
lane: pellet.
Since there is N-terminal MBP tag available in pETM-41 vector, it is expected to see a
band around ~90 kDa because MBP has a molecular weight of 45 kDa and GPA1 has a
molecular weight of 44 kDa. In order to verify that what is seen around 90 kDa is
indeed GPA1 itself, Western blotting with anti-His antibody was applied and the result
is given in Figure 3-5.
90 kDa
50 kDa
40 kDa
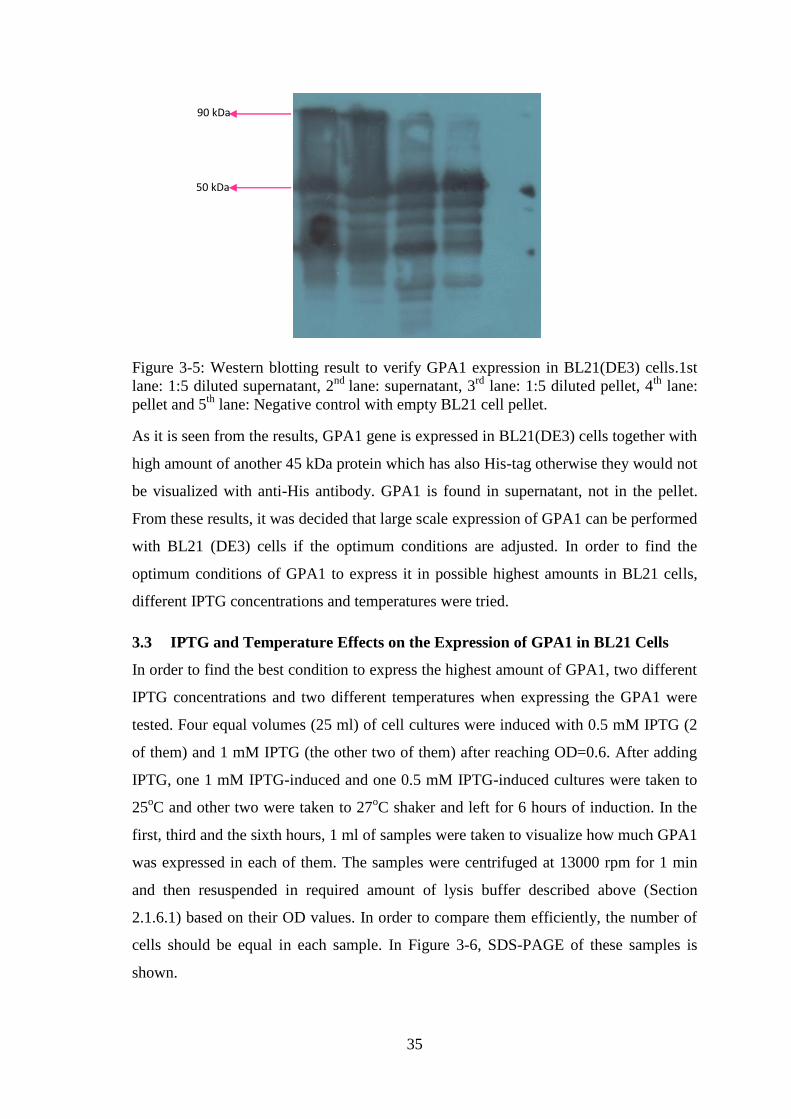
35
Figure 3-5: Western blotting result to verify GPA1 expression in BL21(DE3) cells.1st
lane: 1:5 diluted supernatant, 2nd
lane: supernatant, 3rd
lane: 1:5 diluted pellet, 4th
lane:
pellet and 5th
lane: Negative control with empty BL21 cell pellet.
As it is seen from the results, GPA1 gene is expressed in BL21(DE3) cells together with
high amount of another 45 kDa protein which has also His-tag otherwise they would not
be visualized with anti-His antibody. GPA1 is found in supernatant, not in the pellet.
From these results, it was decided that large scale expression of GPA1 can be performed
with BL21 (DE3) cells if the optimum conditions are adjusted. In order to find the
optimum conditions of GPA1 to express it in possible highest amounts in BL21 cells,
different IPTG concentrations and temperatures were tried.
3.3 IPTG and Temperature Effects on the Expression of GPA1 in BL21 Cells
In order to find the best condition to express the highest amount of GPA1, two different
IPTG concentrations and two different temperatures when expressing the GPA1 were
tested. Four equal volumes (25 ml) of cell cultures were induced with 0.5 mM IPTG (2
of them) and 1 mM IPTG (the other two of them) after reaching OD=0.6. After adding
IPTG, one 1 mM IPTG-induced and one 0.5 mM IPTG-induced cultures were taken to
25oC and other two were taken to 27
oC shaker and left for 6 hours of induction. In the
first, third and the sixth hours, 1 ml of samples were taken to visualize how much GPA1
was expressed in each of them. The samples were centrifuged at 13000 rpm for 1 min
and then resuspended in required amount of lysis buffer described above (Section
2.1.6.1) based on their OD values. In order to compare them efficiently, the number of
cells should be equal in each sample. In Figure 3-6, SDS-PAGE of these samples is
shown.
90 kDa
50 kDa
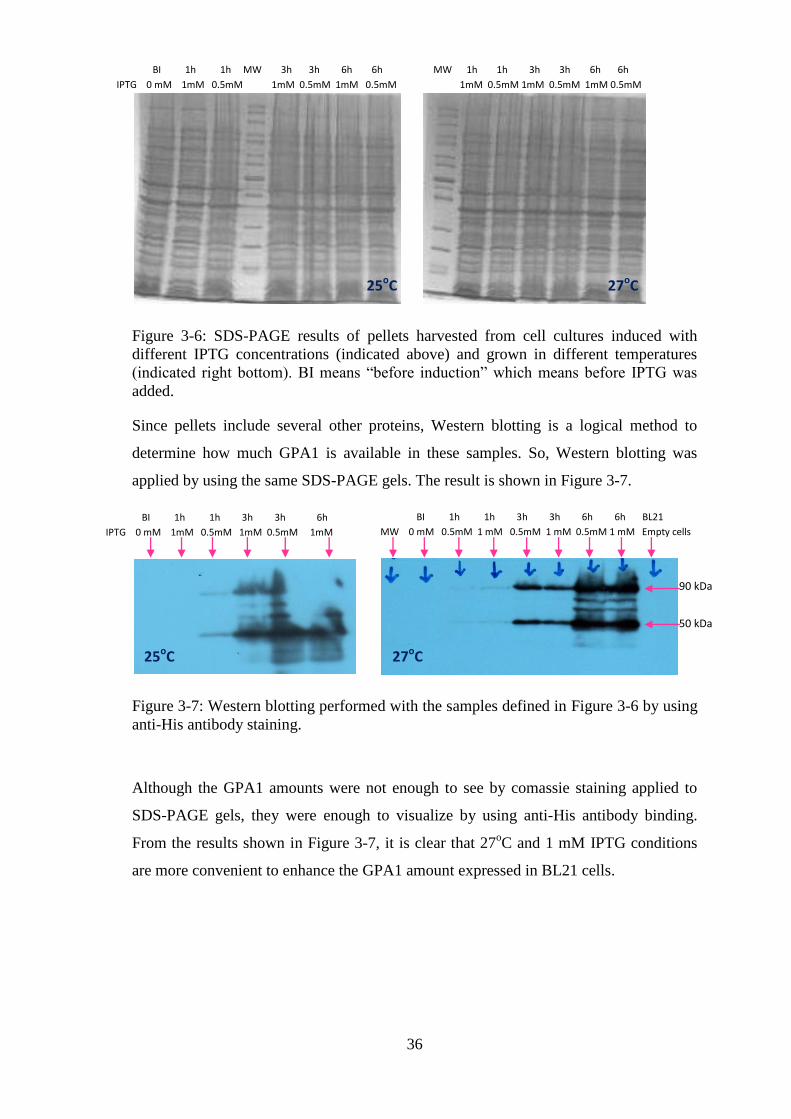
36
Figure 3-6: SDS-PAGE results of pellets harvested from cell cultures induced with
different IPTG concentrations (indicated above) and grown in different temperatures
(indicated right bottom). BI means “before induction” which means before IPTG was
added.
Since pellets include several other proteins, Western blotting is a logical method to
determine how much GPA1 is available in these samples. So, Western blotting was
applied by using the same SDS-PAGE gels. The result is shown in Figure 3-7.
Figure 3-7: Western blotting performed with the samples defined in Figure 3-6 by using
anti-His antibody staining.
Although the GPA1 amounts were not enough to see by comassie staining applied to
SDS-PAGE gels, they were enough to visualize by using anti-His antibody binding.
From the results shown in Figure 3-7, it is clear that 27oC and 1 mM IPTG conditions
are more convenient to enhance the GPA1 amount expressed in BL21 cells.
BI 1h 1h MW 3h 3h 6h 6h
IPTG 0 mM 1mM 0.5mM 1mM 0.5mM 1mM 0.5mM
MW 1h 1h 3h 3h 6h 6h
1mM 0.5mM 1mM 0.5mM 1mM 0.5mM
25oC 27oC
BI 1h 1h 3h 3h 6h
IPTG 0 mM 1mM 0.5mM 1mM 0.5mM 1mM
BI 1h 1h 3h 3h 6h 6h BL21
MW 0 mM 0.5mM 1 mM 0.5mM 1 mM 0.5mM 1 mM Empty cells
25oC 27oC
90 kDa
50 kDa
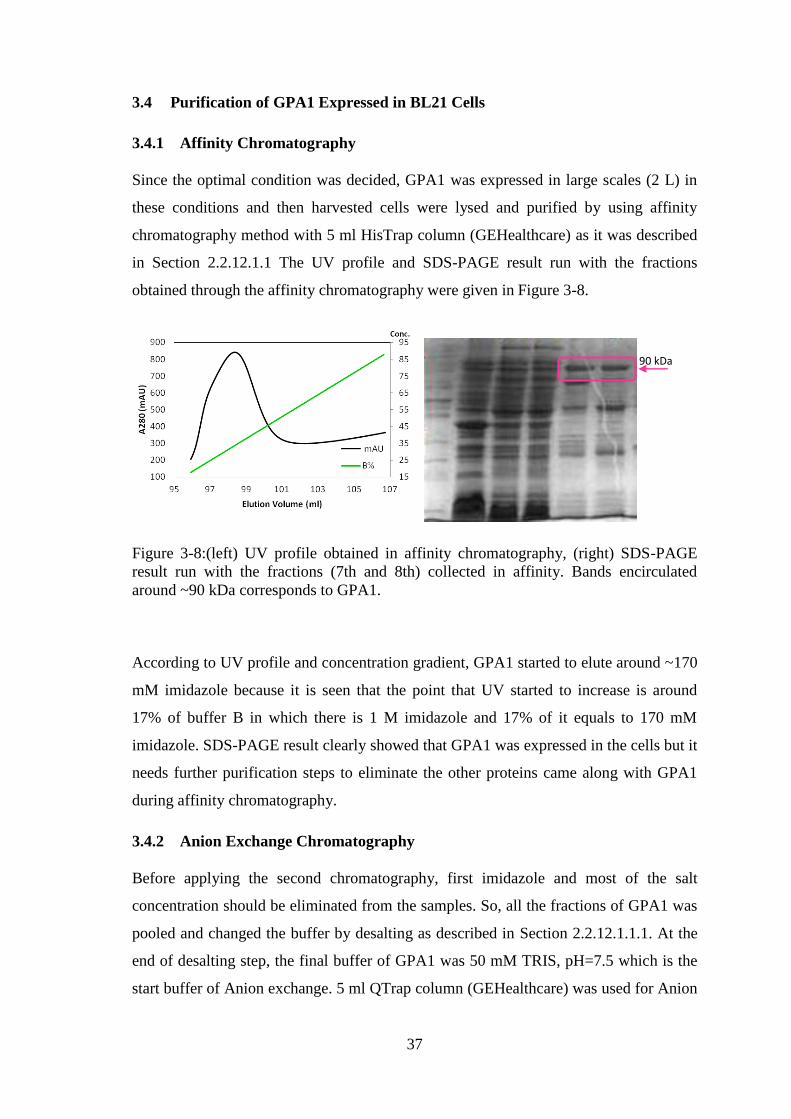
37
3.4 Purification of GPA1 Expressed in BL21 Cells
3.4.1 Affinity Chromatography
Since the optimal condition was decided, GPA1 was expressed in large scales (2 L) in
these conditions and then harvested cells were lysed and purified by using affinity
chromatography method with 5 ml HisTrap column (GEHealthcare) as it was described
in Section 2.2.12.1.1 The UV profile and SDS-PAGE result run with the fractions
obtained through the affinity chromatography were given in Figure 3-8.
Figure 3-8:(left) UV profile obtained in affinity chromatography, (right) SDS-PAGE
result run with the fractions (7th and 8th) collected in affinity. Bands encirculated
around ~90 kDa corresponds to GPA1.
According to UV profile and concentration gradient, GPA1 started to elute around ~170
mM imidazole because it is seen that the point that UV started to increase is around
17% of buffer B in which there is 1 M imidazole and 17% of it equals to 170 mM
imidazole. SDS-PAGE result clearly showed that GPA1 was expressed in the cells but it
needs further purification steps to eliminate the other proteins came along with GPA1
during affinity chromatography.
3.4.2 Anion Exchange Chromatography
Before applying the second chromatography, first imidazole and most of the salt
concentration should be eliminated from the samples. So, all the fractions of GPA1 was
pooled and changed the buffer by desalting as described in Section 2.2.12.1.1.1. At the
end of desalting step, the final buffer of GPA1 was 50 mM TRIS, pH=7.5 which is the
start buffer of Anion exchange. 5 ml QTrap column (GEHealthcare) was used for Anion
90 kDa
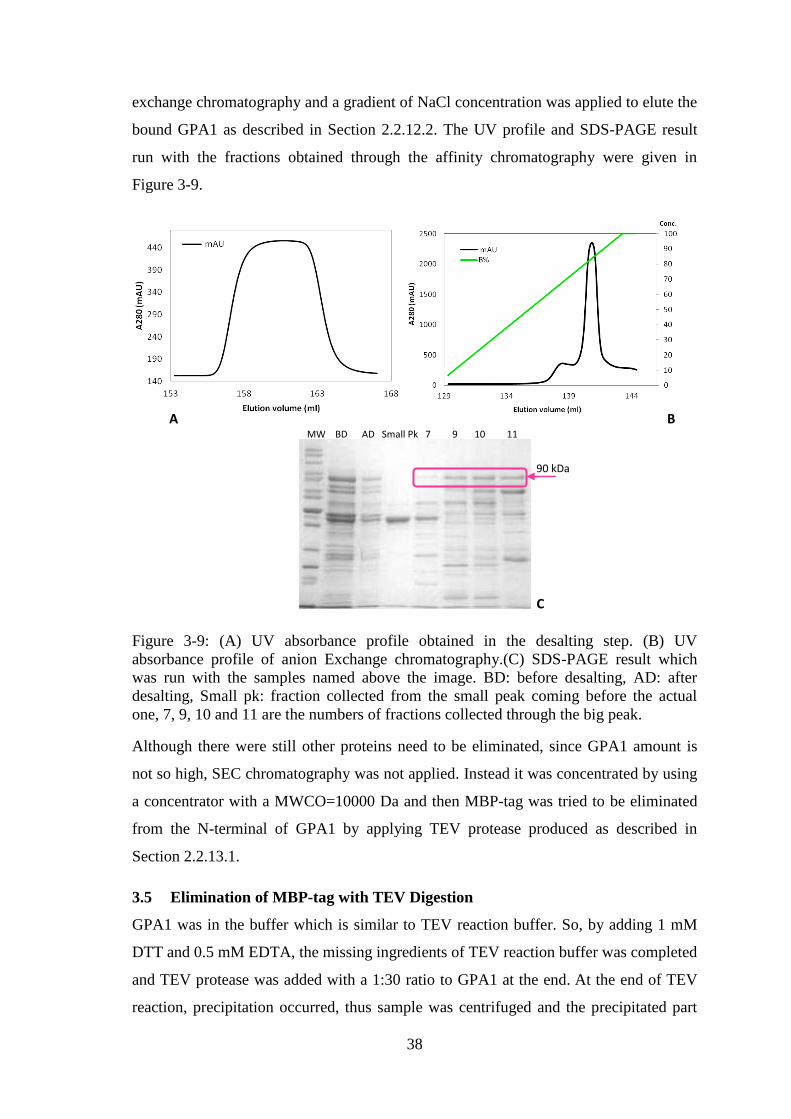
38
exchange chromatography and a gradient of NaCl concentration was applied to elute the
bound GPA1 as described in Section 2.2.12.2. The UV profile and SDS-PAGE result
run with the fractions obtained through the affinity chromatography were given in
Figure 3-9.
Figure 3-9: (A) UV absorbance profile obtained in the desalting step. (B) UV
absorbance profile of anion Exchange chromatography.(C) SDS-PAGE result which
was run with the samples named above the image. BD: before desalting, AD: after
desalting, Small pk: fraction collected from the small peak coming before the actual
one, 7, 9, 10 and 11 are the numbers of fractions collected through the big peak.
Although there were still other proteins need to be eliminated, since GPA1 amount is
not so high, SEC chromatography was not applied. Instead it was concentrated by using
a concentrator with a MWCO=10000 Da and then MBP-tag was tried to be eliminated
from the N-terminal of GPA1 by applying TEV protease produced as described in
Section 2.2.13.1.
3.5 Elimination of MBP-tag with TEV Digestion
GPA1 was in the buffer which is similar to TEV reaction buffer. So, by adding 1 mM
DTT and 0.5 mM EDTA, the missing ingredients of TEV reaction buffer was completed
and TEV protease was added with a 1:30 ratio to GPA1 at the end. At the end of TEV
reaction, precipitation occurred, thus sample was centrifuged and the precipitated part
90 kDa
MW BD AD Small Pk 7 9 10 11
A B
C
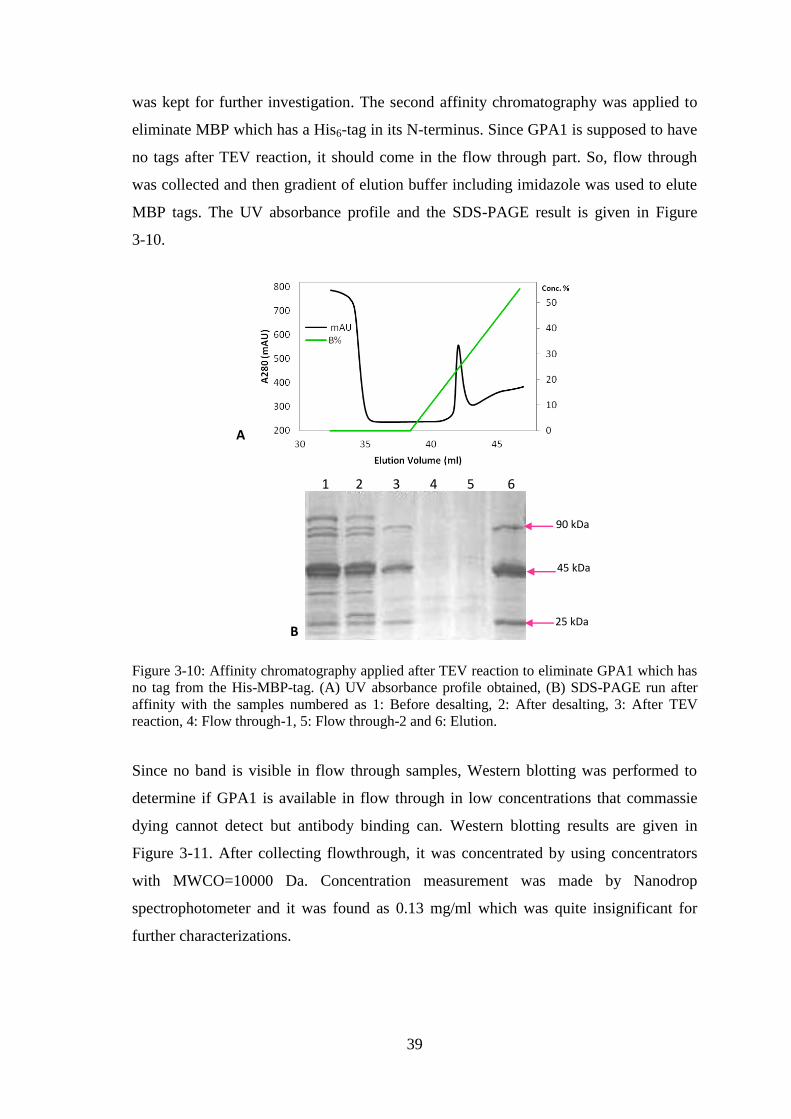
39
was kept for further investigation. The second affinity chromatography was applied to
eliminate MBP which has a His6-tag in its N-terminus. Since GPA1 is supposed to have
no tags after TEV reaction, it should come in the flow through part. So, flow through
was collected and then gradient of elution buffer including imidazole was used to elute
MBP tags. The UV absorbance profile and the SDS-PAGE result is given in Figure
3-10.
Figure 3-10: Affinity chromatography applied after TEV reaction to eliminate GPA1 which has
no tag from the His-MBP-tag. (A) UV absorbance profile obtained, (B) SDS-PAGE run after
affinity with the samples numbered as 1: Before desalting, 2: After desalting, 3: After TEV
reaction, 4: Flow through-1, 5: Flow through-2 and 6: Elution.
Since no band is visible in flow through samples, Western blotting was performed to
determine if GPA1 is available in flow through in low concentrations that commassie
dying cannot detect but antibody binding can. Western blotting results are given in
Figure 3-11. After collecting flowthrough, it was concentrated by using concentrators
with MWCO=10000 Da. Concentration measurement was made by Nanodrop
spectrophotometer and it was found as 0.13 mg/ml which was quite insignificant for
further characterizations.
1 2 3 4 5 6
B
A
90 kDa
45 kDa
25 kDa
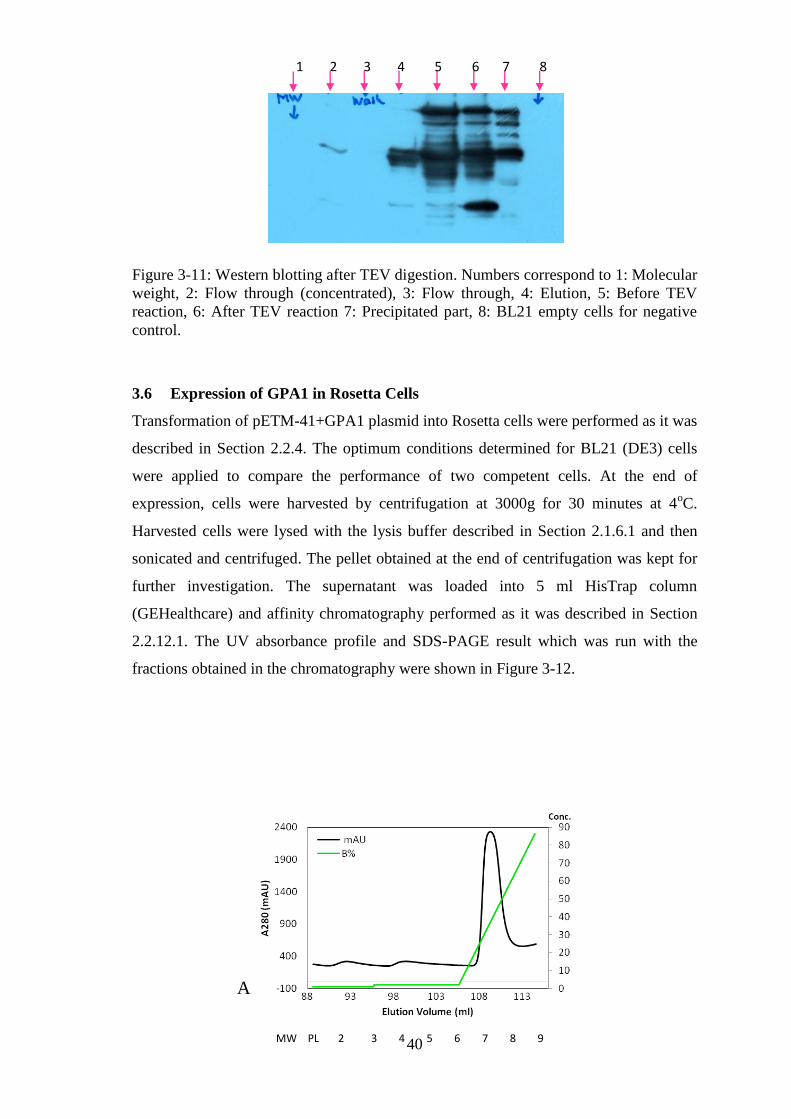
40
Figure 3-11: Western blotting after TEV digestion. Numbers correspond to 1: Molecular
weight, 2: Flow through (concentrated), 3: Flow through, 4: Elution, 5: Before TEV
reaction, 6: After TEV reaction 7: Precipitated part, 8: BL21 empty cells for negative
control.
3.6 Expression of GPA1 in Rosetta Cells
Transformation of pETM-41+GPA1 plasmid into Rosetta cells were performed as it was
described in Section 2.2.4. The optimum conditions determined for BL21 (DE3) cells
were applied to compare the performance of two competent cells. At the end of
expression, cells were harvested by centrifugation at 3000g for 30 minutes at 4oC.
Harvested cells were lysed with the lysis buffer described in Section 2.1.6.1 and then
sonicated and centrifuged. The pellet obtained at the end of centrifugation was kept for
further investigation. The supernatant was loaded into 5 ml HisTrap column
(GEHealthcare) and affinity chromatography performed as it was described in Section
2.2.12.1. The UV absorbance profile and SDS-PAGE result which was run with the
fractions obtained in the chromatography were shown in Figure 3-12.
1 2 3 4 5 6 7 8
A
MW PL 2 3 4 5 6 7 8 9
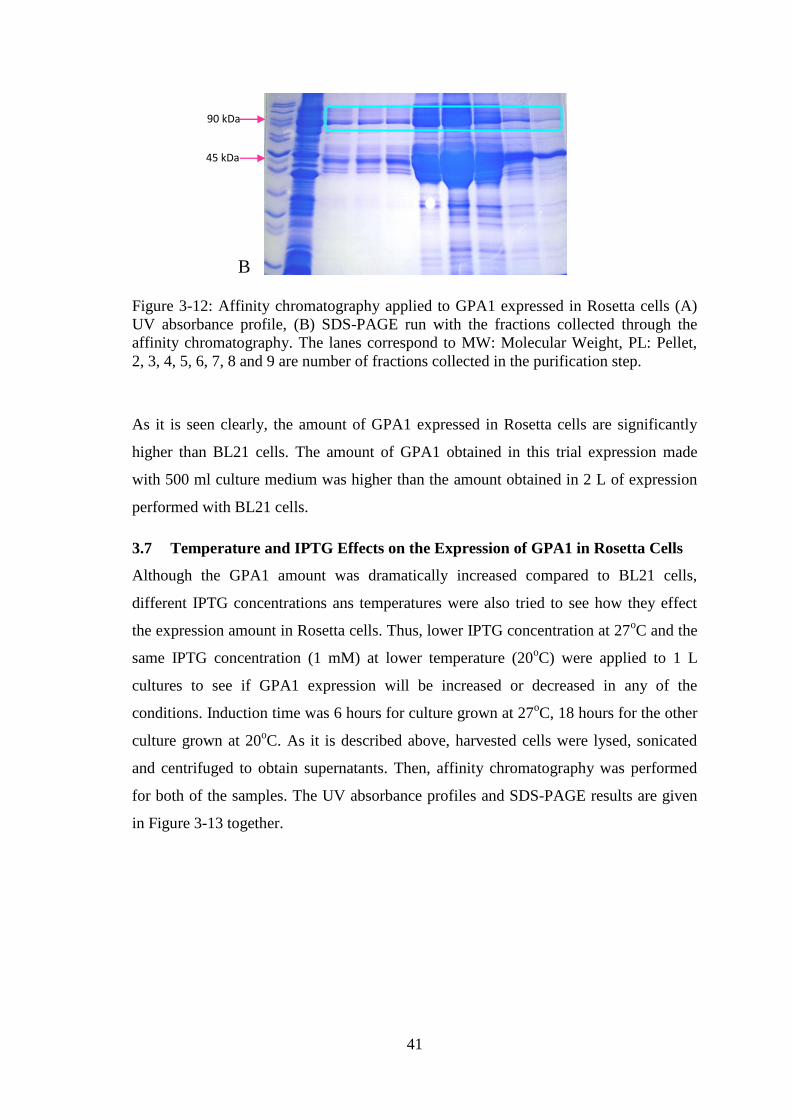
41
Figure 3-12: Affinity chromatography applied to GPA1 expressed in Rosetta cells (A)
UV absorbance profile, (B) SDS-PAGE run with the fractions collected through the
affinity chromatography. The lanes correspond to MW: Molecular Weight, PL: Pellet,
2, 3, 4, 5, 6, 7, 8 and 9 are number of fractions collected in the purification step.
As it is seen clearly, the amount of GPA1 expressed in Rosetta cells are significantly
higher than BL21 cells. The amount of GPA1 obtained in this trial expression made
with 500 ml culture medium was higher than the amount obtained in 2 L of expression
performed with BL21 cells.
3.7 Temperature and IPTG Effects on the Expression of GPA1 in Rosetta Cells
Although the GPA1 amount was dramatically increased compared to BL21 cells,
different IPTG concentrations ans temperatures were also tried to see how they effect
the expression amount in Rosetta cells. Thus, lower IPTG concentration at 27oC and the
same IPTG concentration (1 mM) at lower temperature (20oC) were applied to 1 L
cultures to see if GPA1 expression will be increased or decreased in any of the
conditions. Induction time was 6 hours for culture grown at 27oC, 18 hours for the other
culture grown at 20oC. As it is described above, harvested cells were lysed, sonicated
and centrifuged to obtain supernatants. Then, affinity chromatography was performed
for both of the samples. The UV absorbance profiles and SDS-PAGE results are given
in Figure 3-13 together.
45 kDa
90 kDa
B
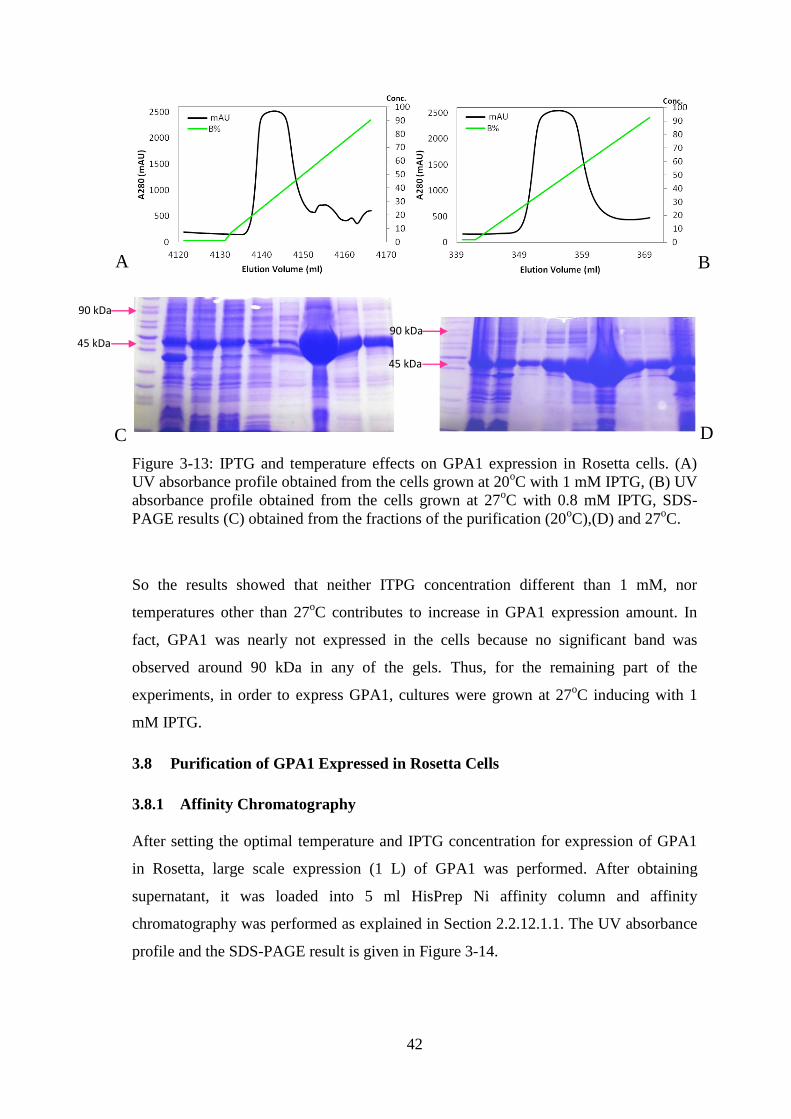
42
Figure 3-13: IPTG and temperature effects on GPA1 expression in Rosetta cells. (A)
UV absorbance profile obtained from the cells grown at 20oC with 1 mM IPTG, (B) UV
absorbance profile obtained from the cells grown at 27oC with 0.8 mM IPTG, SDS-
PAGE results (C) obtained from the fractions of the purification (20oC),(D) and 27
oC.
So the results showed that neither ITPG concentration different than 1 mM, nor
temperatures other than 27oC contributes to increase in GPA1 expression amount. In
fact, GPA1 was nearly not expressed in the cells because no significant band was
observed around 90 kDa in any of the gels. Thus, for the remaining part of the
experiments, in order to express GPA1, cultures were grown at 27oC inducing with 1
mM IPTG.
3.8 Purification of GPA1 Expressed in Rosetta Cells
3.8.1 Affinity Chromatography
After setting the optimal temperature and IPTG concentration for expression of GPA1
in Rosetta, large scale expression (1 L) of GPA1 was performed. After obtaining
supernatant, it was loaded into 5 ml HisPrep Ni affinity column and affinity
chromatography was performed as explained in Section 2.2.12.1.1. The UV absorbance
profile and the SDS-PAGE result is given in Figure 3-14.
A
D C
B
45 kDa
90 kDa
45 kDa
90 kDa
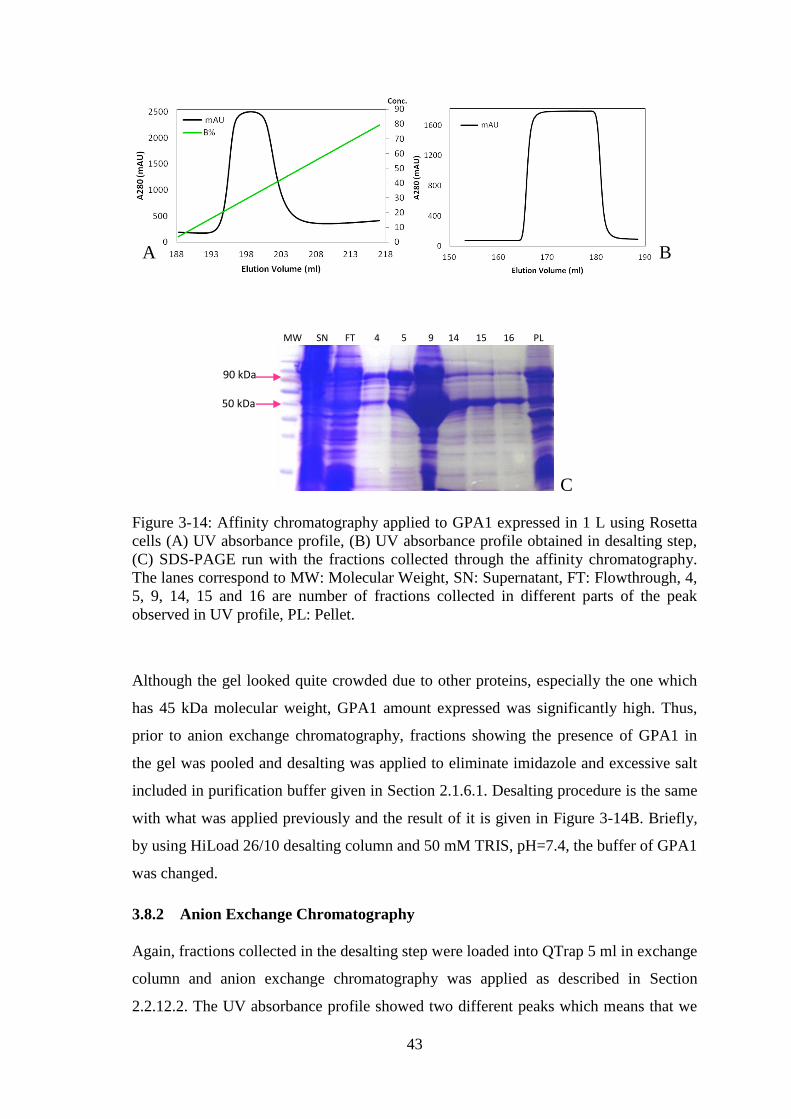
43
Figure 3-14: Affinity chromatography applied to GPA1 expressed in 1 L using Rosetta
cells (A) UV absorbance profile, (B) UV absorbance profile obtained in desalting step,
(C) SDS-PAGE run with the fractions collected through the affinity chromatography.
The lanes correspond to MW: Molecular Weight, SN: Supernatant, FT: Flowthrough, 4,
5, 9, 14, 15 and 16 are number of fractions collected in different parts of the peak
observed in UV profile, PL: Pellet.
Although the gel looked quite crowded due to other proteins, especially the one which
has 45 kDa molecular weight, GPA1 amount expressed was significantly high. Thus,
prior to anion exchange chromatography, fractions showing the presence of GPA1 in
the gel was pooled and desalting was applied to eliminate imidazole and excessive salt
included in purification buffer given in Section 2.1.6.1. Desalting procedure is the same
with what was applied previously and the result of it is given in Figure 3-14B. Briefly,
by using HiLoad 26/10 desalting column and 50 mM TRIS, pH=7.4, the buffer of GPA1
was changed.
3.8.2 Anion Exchange Chromatography
Again, fractions collected in the desalting step were loaded into QTrap 5 ml in exchange
column and anion exchange chromatography was applied as described in Section
2.2.12.2. The UV absorbance profile showed two different peaks which means that we
MW SN FT 4 5 9 14 15 16 PL
50 kDa
90 kDa
B A
C
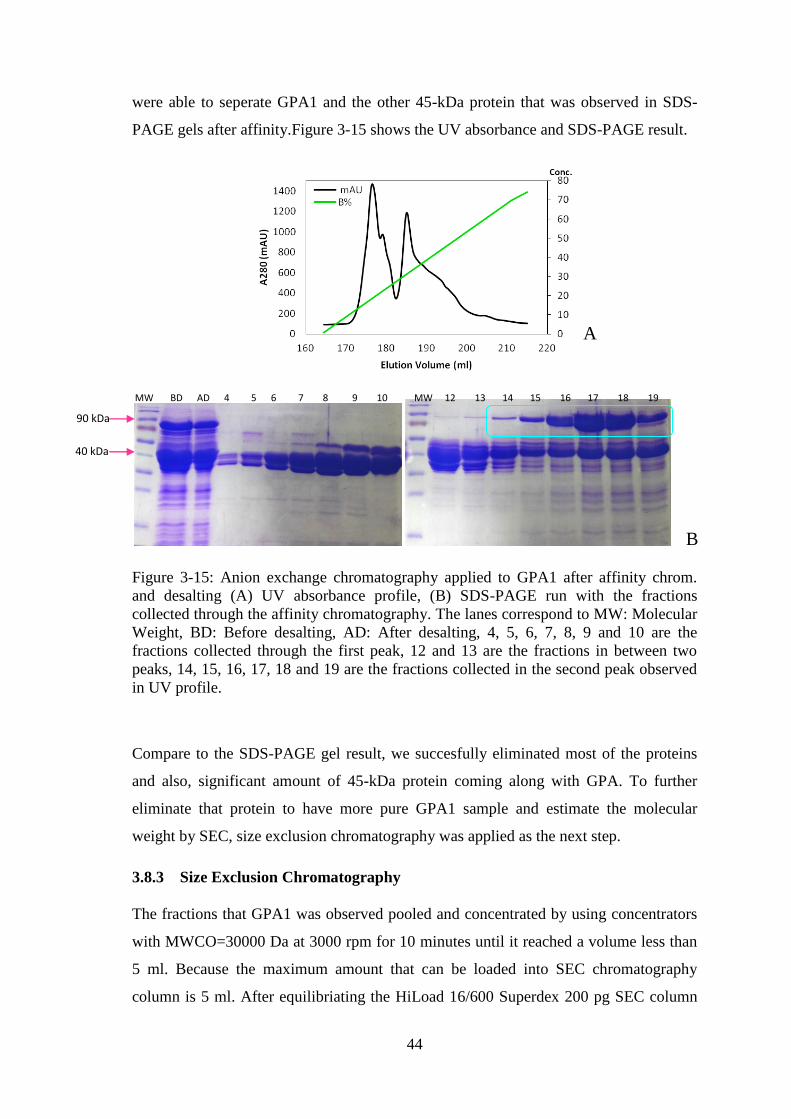
44
were able to seperate GPA1 and the other 45-kDa protein that was observed in SDS-
PAGE gels after affinity.Figure 3-15 shows the UV absorbance and SDS-PAGE result.
Figure 3-15: Anion exchange chromatography applied to GPA1 after affinity chrom.
and desalting (A) UV absorbance profile, (B) SDS-PAGE run with the fractions
collected through the affinity chromatography. The lanes correspond to MW: Molecular
Weight, BD: Before desalting, AD: After desalting, 4, 5, 6, 7, 8, 9 and 10 are the
fractions collected through the first peak, 12 and 13 are the fractions in between two
peaks, 14, 15, 16, 17, 18 and 19 are the fractions collected in the second peak observed
in UV profile.
Compare to the SDS-PAGE gel result, we succesfully eliminated most of the proteins
and also, significant amount of 45-kDa protein coming along with GPA. To further
eliminate that protein to have more pure GPA1 sample and estimate the molecular
weight by SEC, size exclusion chromatography was applied as the next step.
3.8.3 Size Exclusion Chromatography
The fractions that GPA1 was observed pooled and concentrated by using concentrators
with MWCO=30000 Da at 3000 rpm for 10 minutes until it reached a volume less than
5 ml. Because the maximum amount that can be loaded into SEC chromatography
column is 5 ml. After equilibriating the HiLoad 16/600 Superdex 200 pg SEC column
40 kDa
90 kDa
B
A
MW BD AD 4 5 6 7 8 9 10 MW 12 13 14 15 16 17 18 19
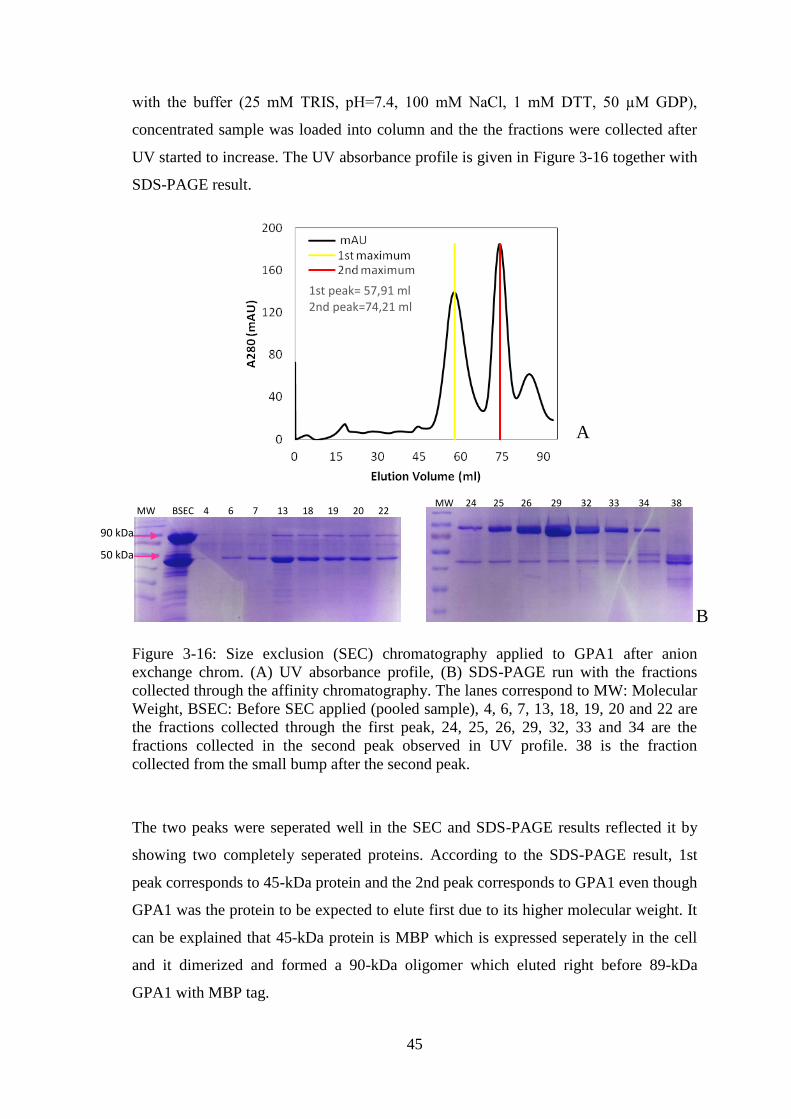
45
with the buffer (25 mM TRIS, pH=7.4, 100 mM NaCl, 1 mM DTT, 50 µM GDP),
concentrated sample was loaded into column and the the fractions were collected after
UV started to increase. The UV absorbance profile is given in Figure 3-16 together with
SDS-PAGE result.
Figure 3-16: Size exclusion (SEC) chromatography applied to GPA1 after anion
exchange chrom. (A) UV absorbance profile, (B) SDS-PAGE run with the fractions
collected through the affinity chromatography. The lanes correspond to MW: Molecular
Weight, BSEC: Before SEC applied (pooled sample), 4, 6, 7, 13, 18, 19, 20 and 22 are
the fractions collected through the first peak, 24, 25, 26, 29, 32, 33 and 34 are the
fractions collected in the second peak observed in UV profile. 38 is the fraction
collected from the small bump after the second peak.
The two peaks were seperated well in the SEC and SDS-PAGE results reflected it by
showing two completely seperated proteins. According to the SDS-PAGE result, 1st
peak corresponds to 45-kDa protein and the 2nd peak corresponds to GPA1 even though
GPA1 was the protein to be expected to elute first due to its higher molecular weight. It
can be explained that 45-kDa protein is MBP which is expressed seperately in the cell
and it dimerized and formed a 90-kDa oligomer which eluted right before 89-kDa
GPA1 with MBP tag.
50 kDa
90 kDa
MW BSEC 4 6 7 13 18 19 20 22 MW 24 25 26 29 32 33 34 38
1st peak= 57,91 ml 2nd peak=74,21 ml
B
A
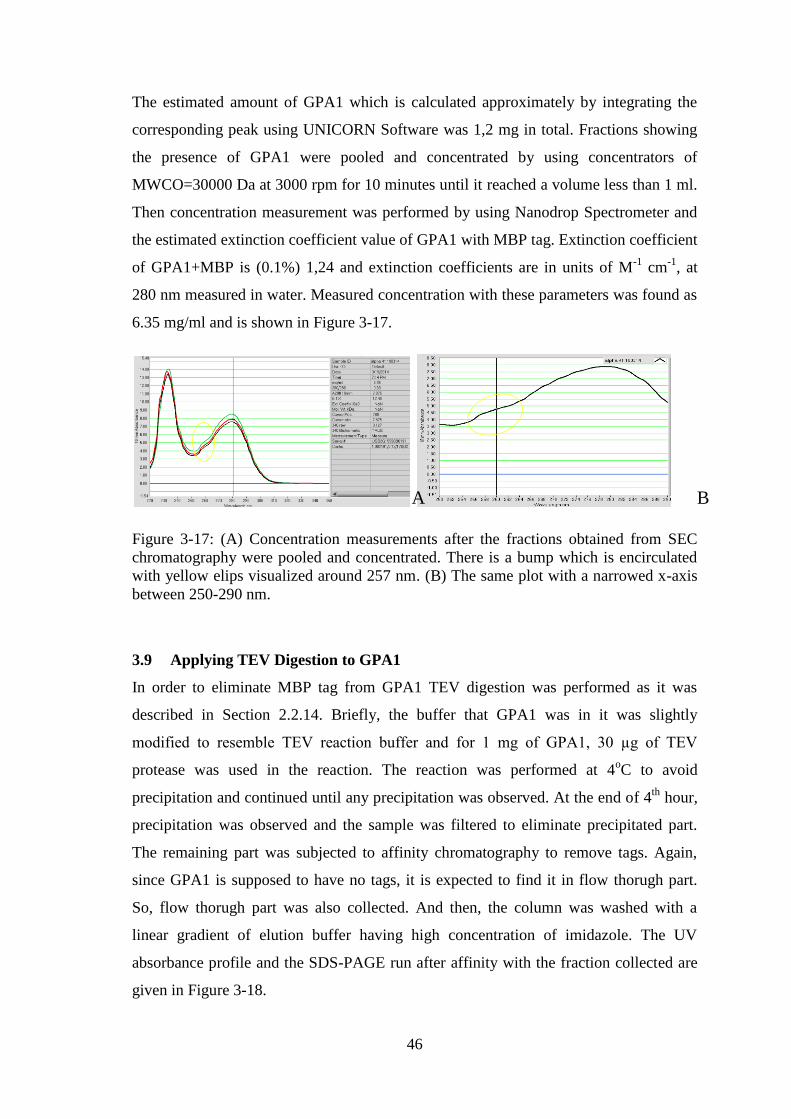
46
The estimated amount of GPA1 which is calculated approximately by integrating the
corresponding peak using UNICORN Software was 1,2 mg in total. Fractions showing
the presence of GPA1 were pooled and concentrated by using concentrators of
MWCO=30000 Da at 3000 rpm for 10 minutes until it reached a volume less than 1 ml.
Then concentration measurement was performed by using Nanodrop Spectrometer and
the estimated extinction coefficient value of GPA1 with MBP tag. Extinction coefficient
of GPA1+MBP is (0.1%) 1,24 and extinction coefficients are in units of M-1
cm-1
, at
280 nm measured in water. Measured concentration with these parameters was found as
6.35 mg/ml and is shown in Figure 3-17.
Figure 3-17: (A) Concentration measurements after the fractions obtained from SEC
chromatography were pooled and concentrated. There is a bump which is encirculated
with yellow elips visualized around 257 nm. (B) The same plot with a narrowed x-axis
between 250-290 nm.
3.9 Applying TEV Digestion to GPA1
In order to eliminate MBP tag from GPA1 TEV digestion was performed as it was
described in Section 2.2.14. Briefly, the buffer that GPA1 was in it was slightly
modified to resemble TEV reaction buffer and for 1 mg of GPA1, 30 µg of TEV
protease was used in the reaction. The reaction was performed at 4oC to avoid
precipitation and continued until any precipitation was observed. At the end of 4th
hour,
precipitation was observed and the sample was filtered to eliminate precipitated part.
The remaining part was subjected to affinity chromatography to remove tags. Again,
since GPA1 is supposed to have no tags, it is expected to find it in flow thorugh part.
So, flow thorugh part was also collected. And then, the column was washed with a
linear gradient of elution buffer having high concentration of imidazole. The UV
absorbance profile and the SDS-PAGE run after affinity with the fraction collected are
given in Figure 3-18.
B A
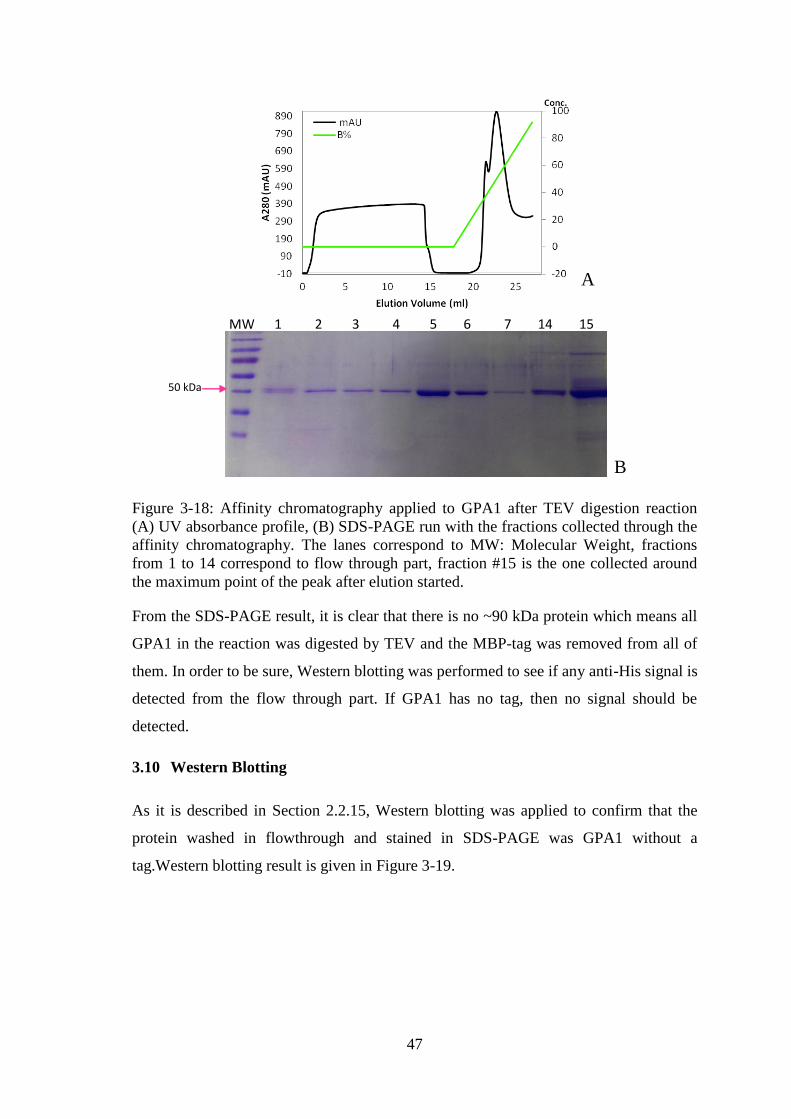
47
Figure 3-18: Affinity chromatography applied to GPA1 after TEV digestion reaction
(A) UV absorbance profile, (B) SDS-PAGE run with the fractions collected through the
affinity chromatography. The lanes correspond to MW: Molecular Weight, fractions
from 1 to 14 correspond to flow through part, fraction #15 is the one collected around
the maximum point of the peak after elution started.
From the SDS-PAGE result, it is clear that there is no ~90 kDa protein which means all
GPA1 in the reaction was digested by TEV and the MBP-tag was removed from all of
them. In order to be sure, Western blotting was performed to see if any anti-His signal is
detected from the flow through part. If GPA1 has no tag, then no signal should be
detected.
3.10 Western Blotting
As it is described in Section 2.2.15, Western blotting was applied to confirm that the
protein washed in flowthrough and stained in SDS-PAGE was GPA1 without a
tag.Western blotting result is given in Figure 3-19.
50 kDa
MW 1 2 3 4 5 6 7 14 15
B
A
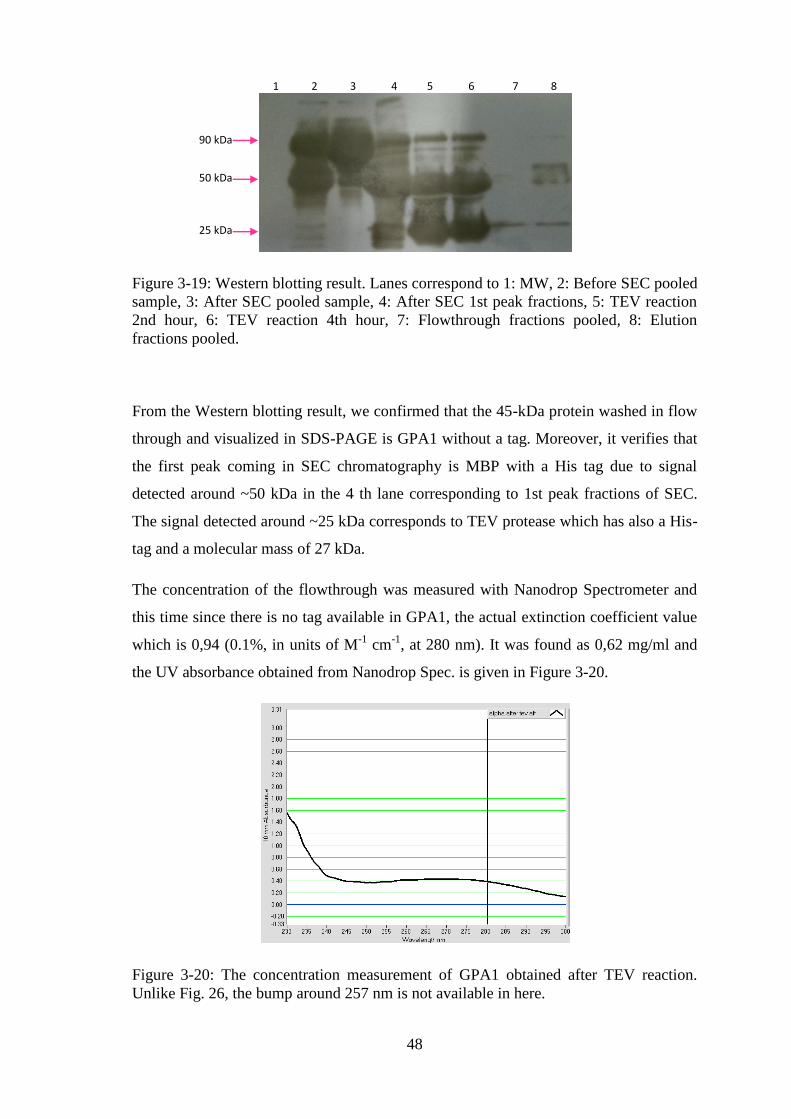
48
Figure 3-19: Western blotting result. Lanes correspond to 1: MW, 2: Before SEC pooled
sample, 3: After SEC pooled sample, 4: After SEC 1st peak fractions, 5: TEV reaction
2nd hour, 6: TEV reaction 4th hour, 7: Flowthrough fractions pooled, 8: Elution
fractions pooled.
From the Western blotting result, we confirmed that the 45-kDa protein washed in flow
through and visualized in SDS-PAGE is GPA1 without a tag. Moreover, it verifies that
the first peak coming in SEC chromatography is MBP with a His tag due to signal
detected around ~50 kDa in the 4 th lane corresponding to 1st peak fractions of SEC.
The signal detected around ~25 kDa corresponds to TEV protease which has also a His-
tag and a molecular mass of 27 kDa.
The concentration of the flowthrough was measured with Nanodrop Spectrometer and
this time since there is no tag available in GPA1, the actual extinction coefficient value
which is 0,94 (0.1%, in units of M-1
cm-1
, at 280 nm). It was found as 0,62 mg/ml and
the UV absorbance obtained from Nanodrop Spec. is given in Figure 3-20.
Figure 3-20: The concentration measurement of GPA1 obtained after TEV reaction.
Unlike Fig. 26, the bump around 257 nm is not available in here.
50 kDa
90 kDa
25 kDa
1 2 3 4 5 6 7 8
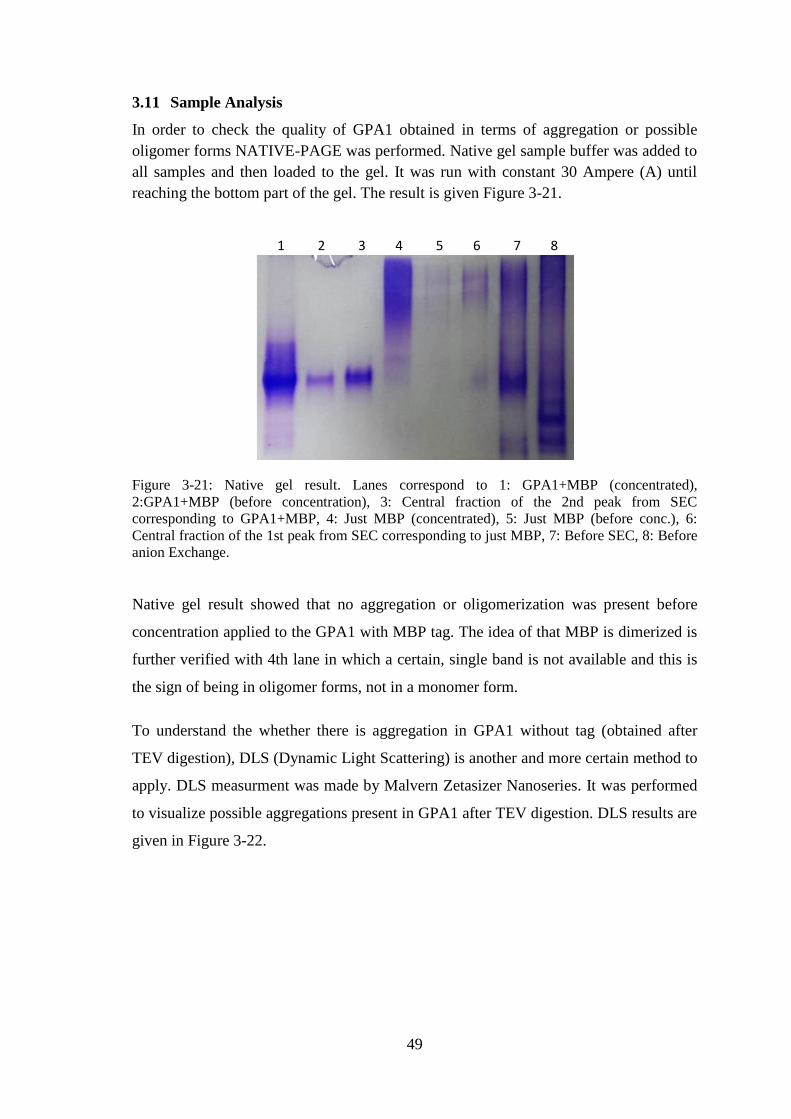
49
3.11 Sample Analysis
In order to check the quality of GPA1 obtained in terms of aggregation or possible
oligomer forms NATIVE-PAGE was performed. Native gel sample buffer was added to
all samples and then loaded to the gel. It was run with constant 30 Ampere (A) until
reaching the bottom part of the gel. The result is given Figure 3-21.
Figure 3-21: Native gel result. Lanes correspond to 1: GPA1+MBP (concentrated),
2:GPA1+MBP (before concentration), 3: Central fraction of the 2nd peak from SEC
corresponding to GPA1+MBP, 4: Just MBP (concentrated), 5: Just MBP (before conc.), 6:
Central fraction of the 1st peak from SEC corresponding to just MBP, 7: Before SEC, 8: Before
anion Exchange.
Native gel result showed that no aggregation or oligomerization was present before
concentration applied to the GPA1 with MBP tag. The idea of that MBP is dimerized is
further verified with 4th lane in which a certain, single band is not available and this is
the sign of being in oligomer forms, not in a monomer form.
To understand the whether there is aggregation in GPA1 without tag (obtained after
TEV digestion), DLS (Dynamic Light Scattering) is another and more certain method to
apply. DLS measurment was made by Malvern Zetasizer Nanoseries. It was performed
to visualize possible aggregations present in GPA1 after TEV digestion. DLS results are
given in Figure 3-22.
1 2 3 4 5 6 7 8
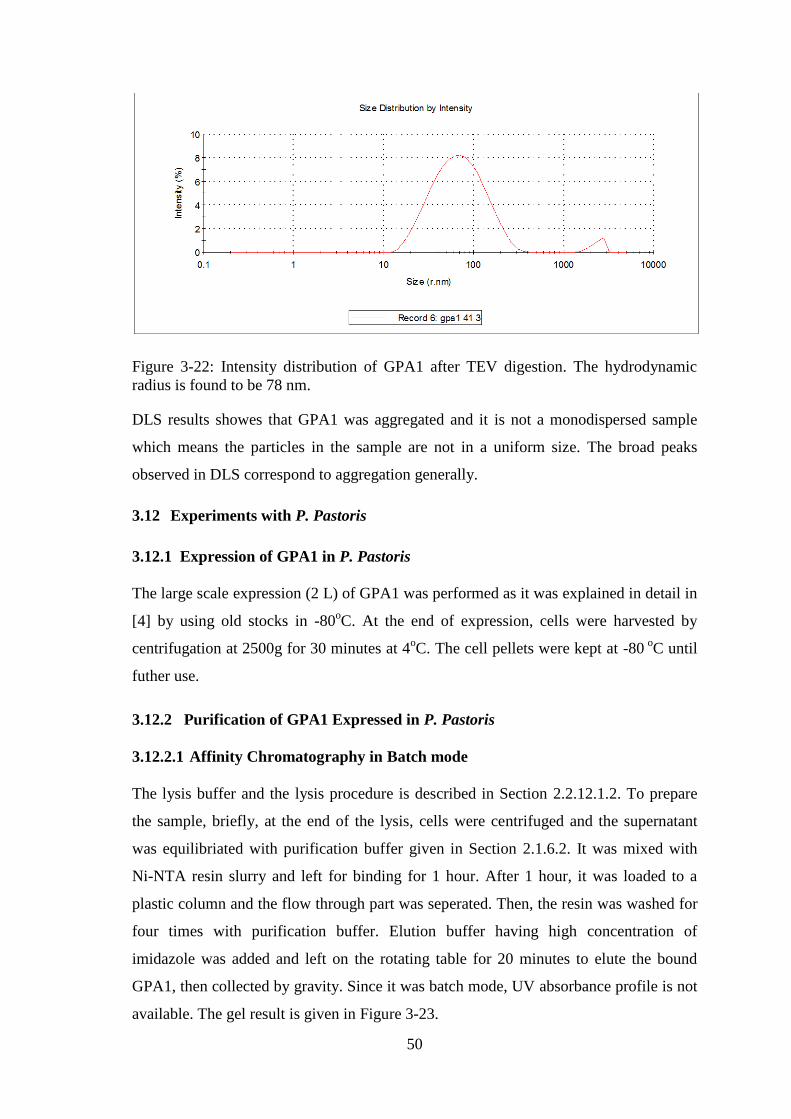
50
Figure 3-22: Intensity distribution of GPA1 after TEV digestion. The hydrodynamic
radius is found to be 78 nm.
DLS results showes that GPA1 was aggregated and it is not a monodispersed sample
which means the particles in the sample are not in a uniform size. The broad peaks
observed in DLS correspond to aggregation generally.
3.12 Experiments with P. Pastoris
3.12.1 Expression of GPA1 in P. Pastoris
The large scale expression (2 L) of GPA1 was performed as it was explained in detail in
[4] by using old stocks in -80oC. At the end of expression, cells were harvested by
centrifugation at 2500g for 30 minutes at 4oC. The cell pellets were kept at -80
oC until
futher use.
3.12.2 Purification of GPA1 Expressed in P. Pastoris
3.12.2.1 Affinity Chromatography in Batch mode
The lysis buffer and the lysis procedure is described in Section 2.2.12.1.2. To prepare
the sample, briefly, at the end of the lysis, cells were centrifuged and the supernatant
was equilibriated with purification buffer given in Section 2.1.6.2. It was mixed with
Ni-NTA resin slurry and left for binding for 1 hour. After 1 hour, it was loaded to a
plastic column and the flow through part was seperated. Then, the resin was washed for
four times with purification buffer. Elution buffer having high concentration of
imidazole was added and left on the rotating table for 20 minutes to elute the bound
GPA1, then collected by gravity. Since it was batch mode, UV absorbance profile is not
available. The gel result is given in Figure 3-23.
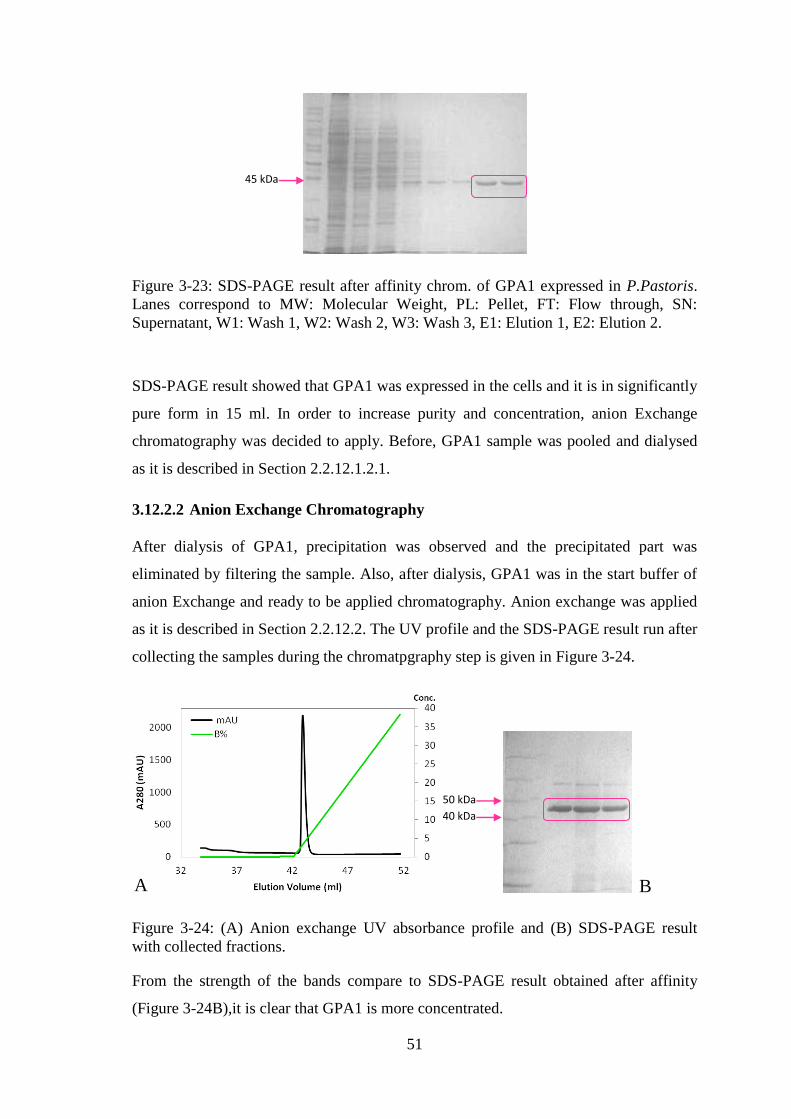
51
Figure 3-23: SDS-PAGE result after affinity chrom. of GPA1 expressed in P.Pastoris.
Lanes correspond to MW: Molecular Weight, PL: Pellet, FT: Flow through, SN:
Supernatant, W1: Wash 1, W2: Wash 2, W3: Wash 3, E1: Elution 1, E2: Elution 2.
SDS-PAGE result showed that GPA1 was expressed in the cells and it is in significantly
pure form in 15 ml. In order to increase purity and concentration, anion Exchange
chromatography was decided to apply. Before, GPA1 sample was pooled and dialysed
as it is described in Section 2.2.12.1.2.1.
3.12.2.2 Anion Exchange Chromatography
After dialysis of GPA1, precipitation was observed and the precipitated part was
eliminated by filtering the sample. Also, after dialysis, GPA1 was in the start buffer of
anion Exchange and ready to be applied chromatography. Anion exchange was applied
as it is described in Section 2.2.12.2. The UV profile and the SDS-PAGE result run after
collecting the samples during the chromatpgraphy step is given in Figure 3-24.
Figure 3-24: (A) Anion exchange UV absorbance profile and (B) SDS-PAGE result
with collected fractions.
From the strength of the bands compare to SDS-PAGE result obtained after affinity
(Figure 3-24B),it is clear that GPA1 is more concentrated.
45 kDa
40 kDa
50 kDa
B A
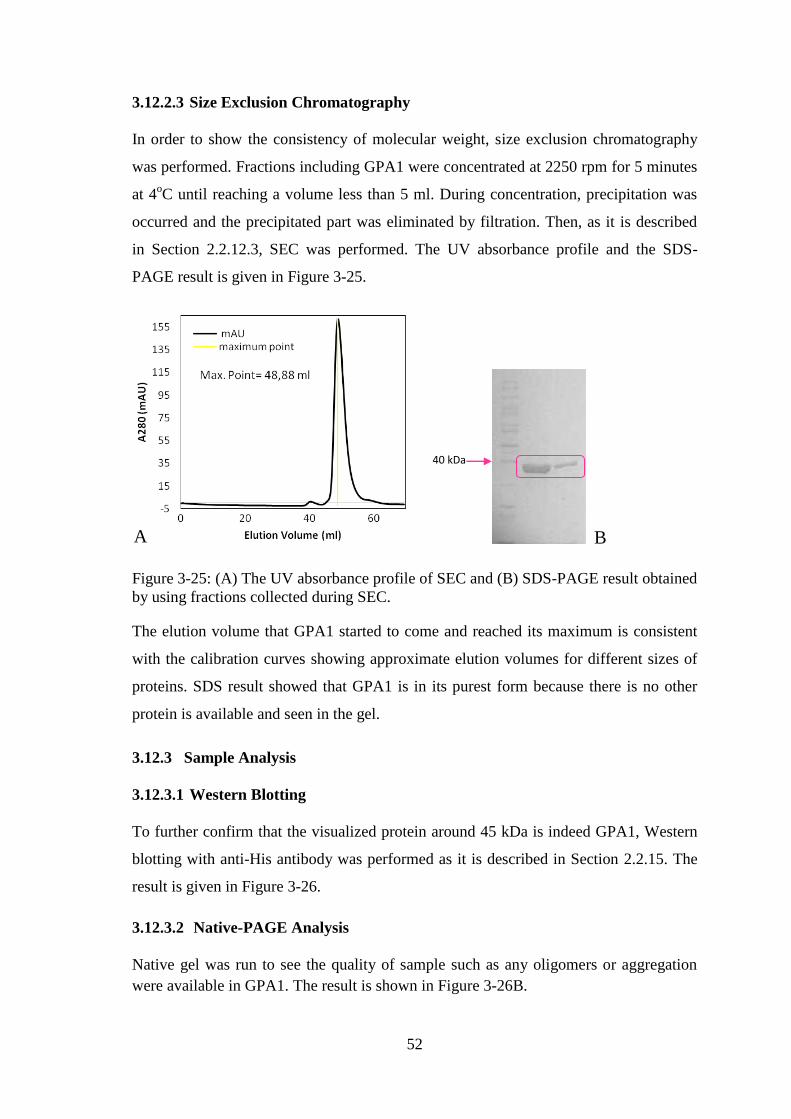
52
3.12.2.3 Size Exclusion Chromatography
In order to show the consistency of molecular weight, size exclusion chromatography
was performed. Fractions including GPA1 were concentrated at 2250 rpm for 5 minutes
at 4oC until reaching a volume less than 5 ml. During concentration, precipitation was
occurred and the precipitated part was eliminated by filtration. Then, as it is described
in Section 2.2.12.3, SEC was performed. The UV absorbance profile and the SDS-
PAGE result is given in Figure 3-25.
Figure 3-25: (A) The UV absorbance profile of SEC and (B) SDS-PAGE result obtained
by using fractions collected during SEC.
The elution volume that GPA1 started to come and reached its maximum is consistent
with the calibration curves showing approximate elution volumes for different sizes of
proteins. SDS result showed that GPA1 is in its purest form because there is no other
protein is available and seen in the gel.
3.12.3 Sample Analysis
3.12.3.1 Western Blotting
To further confirm that the visualized protein around 45 kDa is indeed GPA1, Western
blotting with anti-His antibody was performed as it is described in Section 2.2.15. The
result is given in Figure 3-26.
3.12.3.2 Native-PAGE Analysis
Native gel was run to see the quality of sample such as any oligomers or aggregation
were available in GPA1. The result is shown in Figure 3-26B.
40 kDa
B A
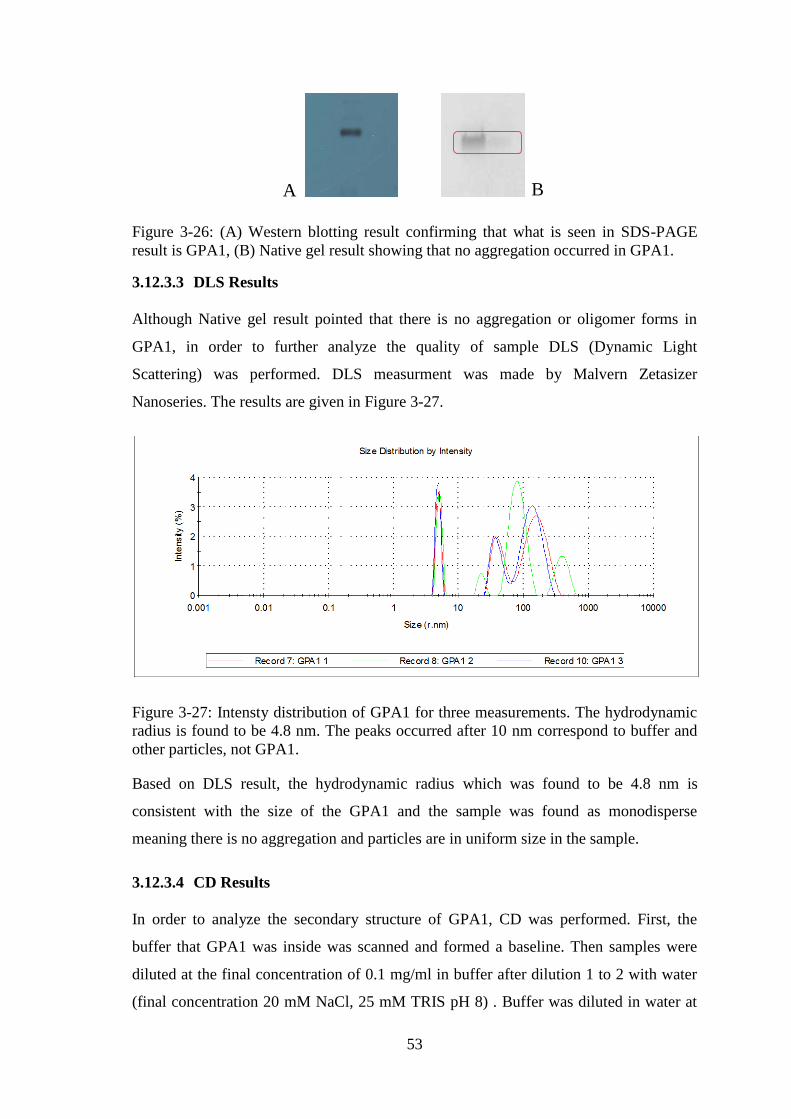
53
Figure 3-26: (A) Western blotting result confirming that what is seen in SDS-PAGE
result is GPA1, (B) Native gel result showing that no aggregation occurred in GPA1.
3.12.3.3 DLS Results
Although Native gel result pointed that there is no aggregation or oligomer forms in
GPA1, in order to further analyze the quality of sample DLS (Dynamic Light
Scattering) was performed. DLS measurment was made by Malvern Zetasizer
Nanoseries. The results are given in Figure 3-27.
Figure 3-27: Intensty distribution of GPA1 for three measurements. The hydrodynamic
radius is found to be 4.8 nm. The peaks occurred after 10 nm correspond to buffer and
other particles, not GPA1.
Based on DLS result, the hydrodynamic radius which was found to be 4.8 nm is
consistent with the size of the GPA1 and the sample was found as monodisperse
meaning there is no aggregation and particles are in uniform size in the sample.
3.12.3.4 CD Results
In order to analyze the secondary structure of GPA1, CD was performed. First, the
buffer that GPA1 was inside was scanned and formed a baseline. Then samples were
diluted at the final concentration of 0.1 mg/ml in buffer after dilution 1 to 2 with water
(final concentration 20 mM NaCl, 25 mM TRIS pH 8) . Buffer was diluted in water at
A B
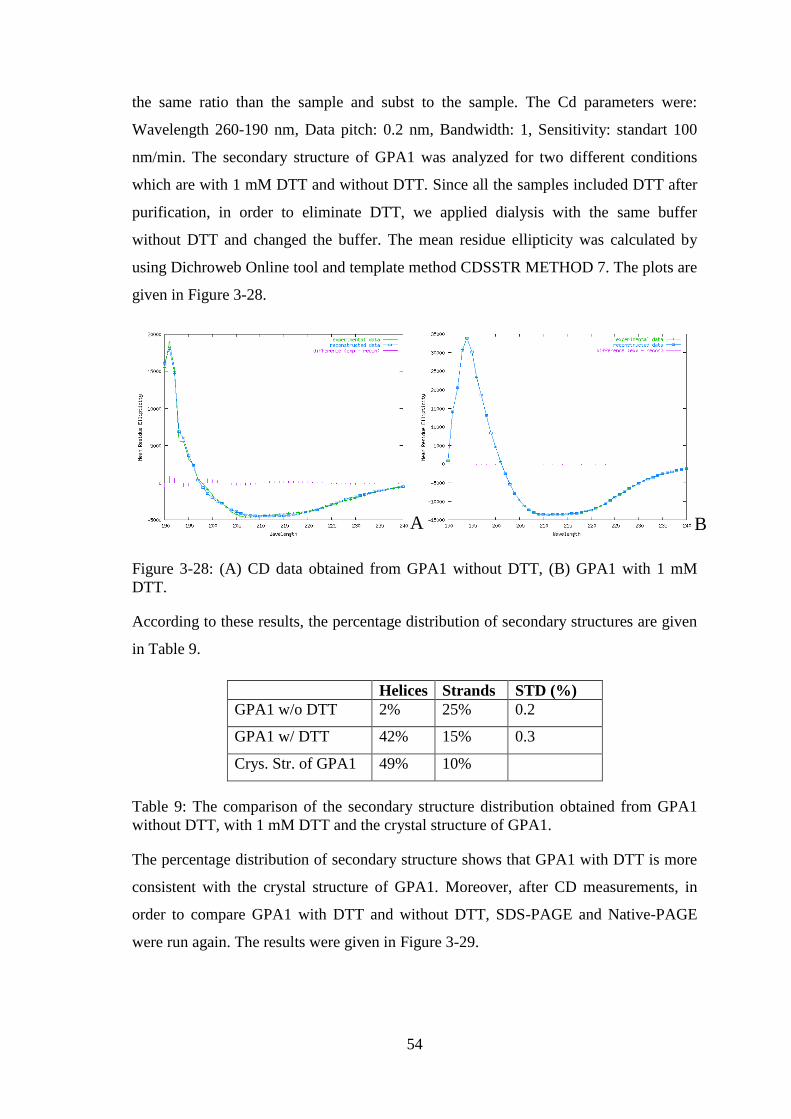
54
the same ratio than the sample and subst to the sample. The Cd parameters were:
Wavelength 260-190 nm, Data pitch: 0.2 nm, Bandwidth: 1, Sensitivity: standart 100
nm/min. The secondary structure of GPA1 was analyzed for two different conditions
which are with 1 mM DTT and without DTT. Since all the samples included DTT after
purification, in order to eliminate DTT, we applied dialysis with the same buffer
without DTT and changed the buffer. The mean residue ellipticity was calculated by
using Dichroweb Online tool and template method CDSSTR METHOD 7. The plots are
given in Figure 3-28.
Figure 3-28: (A) CD data obtained from GPA1 without DTT, (B) GPA1 with 1 mM
DTT.
According to these results, the percentage distribution of secondary structures are given
in Table 9.
Helices Strands STD (%)
GPA1 w/o DTT 2% 25% 0.2
GPA1 w/ DTT 42% 15% 0.3
Crys. Str. of GPA1 49% 10%
Table 9: The comparison of the secondary structure distribution obtained from GPA1
without DTT, with 1 mM DTT and the crystal structure of GPA1.
The percentage distribution of secondary structure shows that GPA1 with DTT is more
consistent with the crystal structure of GPA1. Moreover, after CD measurements, in
order to compare GPA1 with DTT and without DTT, SDS-PAGE and Native-PAGE
were run again. The results were given in Figure 3-29.
A B
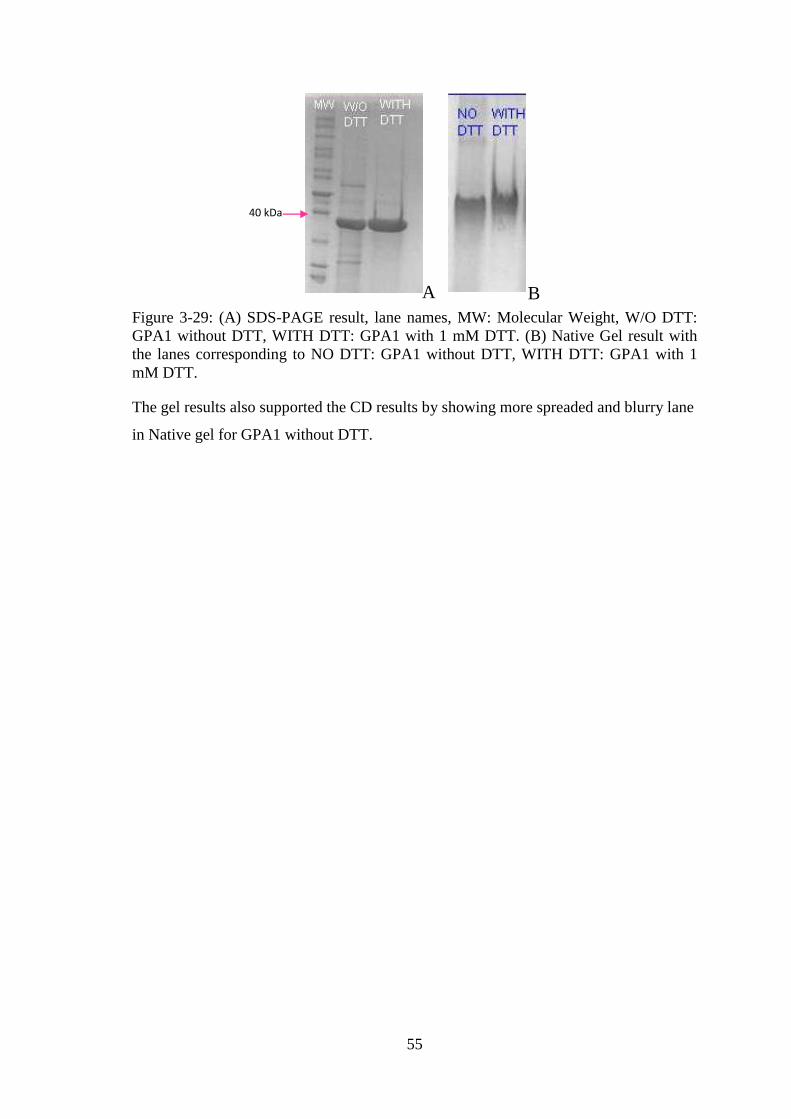
55
Figure 3-29: (A) SDS-PAGE result, lane names, MW: Molecular Weight, W/O DTT:
GPA1 without DTT, WITH DTT: GPA1 with 1 mM DTT. (B) Native Gel result with
the lanes corresponding to NO DTT: GPA1 without DTT, WITH DTT: GPA1 with 1
mM DTT.
The gel results also supported the CD results by showing more spreaded and blurry lane
in Native gel for GPA1 without DTT.
40 kDa
A B
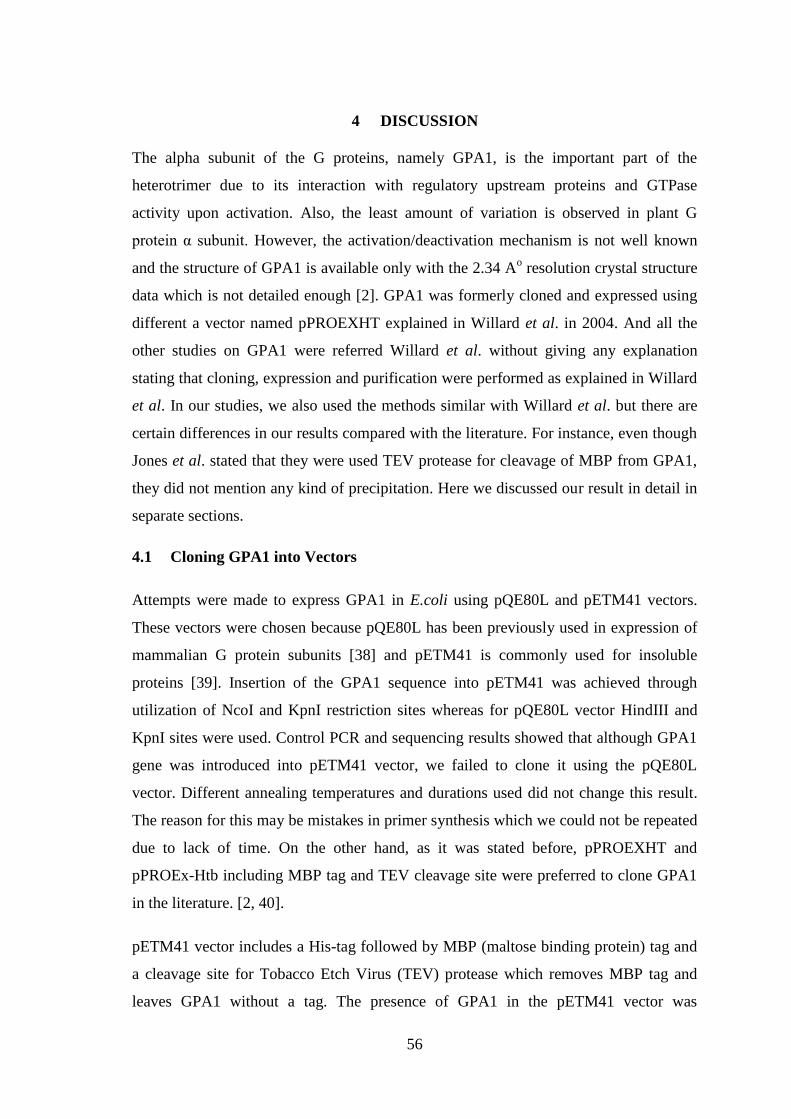
56
4 DISCUSSION
The alpha subunit of the G proteins, namely GPA1, is the important part of the
heterotrimer due to its interaction with regulatory upstream proteins and GTPase
activity upon activation. Also, the least amount of variation is observed in plant G
protein α subunit. However, the activation/deactivation mechanism is not well known
and the structure of GPA1 is available only with the 2.34 Ao resolution crystal structure
data which is not detailed enough [2]. GPA1 was formerly cloned and expressed using
different a vector named pPROEXHT explained in Willard et al. in 2004. And all the
other studies on GPA1 were referred Willard et al. without giving any explanation
stating that cloning, expression and purification were performed as explained in Willard
et al. In our studies, we also used the methods similar with Willard et al. but there are
certain differences in our results compared with the literature. For instance, even though
Jones et al. stated that they were used TEV protease for cleavage of MBP from GPA1,
they did not mention any kind of precipitation. Here we discussed our result in detail in
separate sections.
4.1 Cloning GPA1 into Vectors
Attempts were made to express GPA1 in E.coli using pQE80L and pETM41 vectors.
These vectors were chosen because pQE80L has been previously used in expression of
mammalian G protein subunits [38] and pETM41 is commonly used for insoluble
proteins [39]. Insertion of the GPA1 sequence into pETM41 was achieved through
utilization of NcoI and KpnI restriction sites whereas for pQE80L vector HindIII and
KpnI sites were used. Control PCR and sequencing results showed that although GPA1
gene was introduced into pETM41 vector, we failed to clone it using the pQE80L
vector. Different annealing temperatures and durations used did not change this result.
The reason for this may be mistakes in primer synthesis which we could not be repeated
due to lack of time. On the other hand, as it was stated before, pPROEXHT and
pPROEx-Htb including MBP tag and TEV cleavage site were preferred to clone GPA1
in the literature. [2, 40].
pETM41 vector includes a His-tag followed by MBP (maltose binding protein) tag and
a cleavage site for Tobacco Etch Virus (TEV) protease which removes MBP tag and
leaves GPA1 without a tag. The presence of GPA1 in the pETM41 vector was
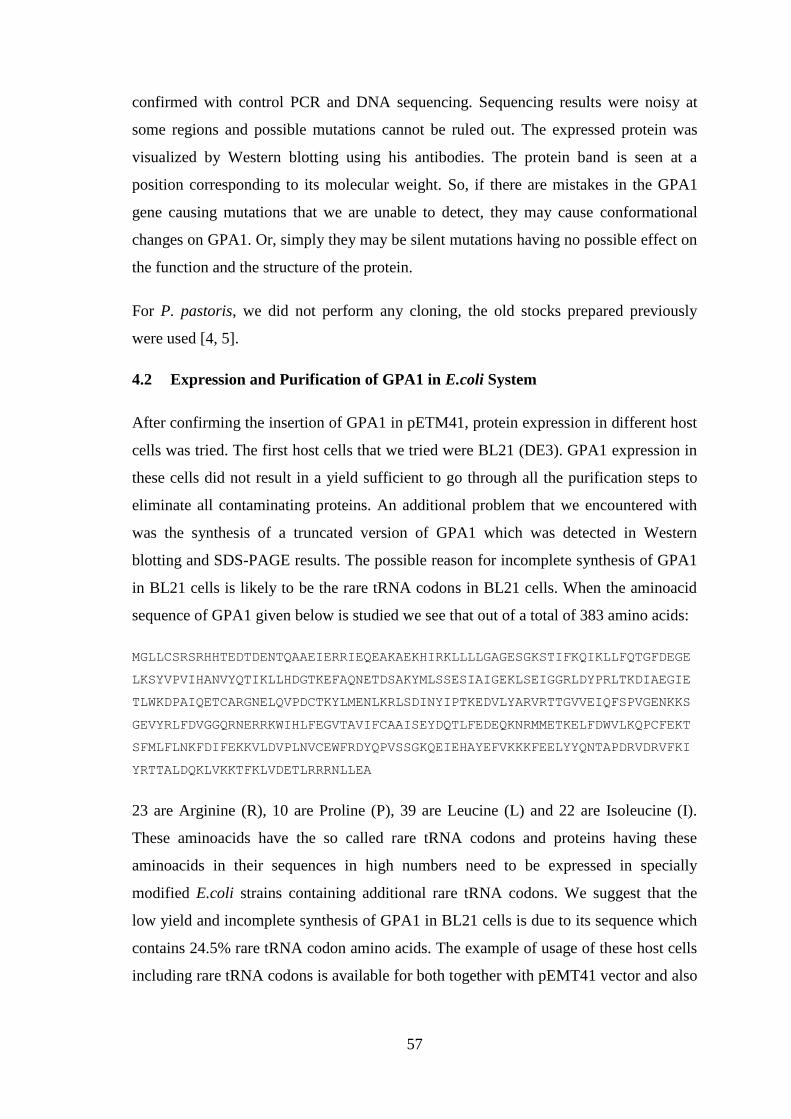
57
confirmed with control PCR and DNA sequencing. Sequencing results were noisy at
some regions and possible mutations cannot be ruled out. The expressed protein was
visualized by Western blotting using his antibodies. The protein band is seen at a
position corresponding to its molecular weight. So, if there are mistakes in the GPA1
gene causing mutations that we are unable to detect, they may cause conformational
changes on GPA1. Or, simply they may be silent mutations having no possible effect on
the function and the structure of the protein.
For P. pastoris, we did not perform any cloning, the old stocks prepared previously
were used [4, 5].
4.2 Expression and Purification of GPA1 in E.coli System
After confirming the insertion of GPA1 in pETM41, protein expression in different host
cells was tried. The first host cells that we tried were BL21 (DE3). GPA1 expression in
these cells did not result in a yield sufficient to go through all the purification steps to
eliminate all contaminating proteins. An additional problem that we encountered with
was the synthesis of a truncated version of GPA1 which was detected in Western
blotting and SDS-PAGE results. The possible reason for incomplete synthesis of GPA1
in BL21 cells is likely to be the rare tRNA codons in BL21 cells. When the aminoacid
sequence of GPA1 given below is studied we see that out of a total of 383 amino acids:
MGLLCSRSRHHTEDTDENTQAAEIERRIEQEAKAEKHIRKLLLLGAGESGKSTIFKQIKLLFQTGFDEGE
LKSYVPVIHANVYQTIKLLHDGTKEFAQNETDSAKYMLSSESIAIGEKLSEIGGRLDYPRLTKDIAEGIE
TLWKDPAIQETCARGNELQVPDCTKYLMENLKRLSDINYIPTKEDVLYARVRTTGVVEIQFSPVGENKKS
GEVYRLFDVGGQRNERRKWIHLFEGVTAVIFCAAISEYDQTLFEDEQKNRMMETKELFDWVLKQPCFEKT
SFMLFLNKFDIFEKKVLDVPLNVCEWFRDYQPVSSGKQEIEHAYEFVKKKFEELYYQNTAPDRVDRVFKI
YRTTALDQKLVKKTFKLVDETLRRRNLLEA
23 are Arginine (R), 10 are Proline (P), 39 are Leucine (L) and 22 are Isoleucine (I).
These aminoacids have the so called rare tRNA codons and proteins having these
aminoacids in their sequences in high numbers need to be expressed in specially
modified E.coli strains containing additional rare tRNA codons. We suggest that the
low yield and incomplete synthesis of GPA1 in BL21 cells is due to its sequence which
contains 24.5% rare tRNA codon amino acids. The example of usage of these host cells
including rare tRNA codons is available for both together with pEMT41 vector and also
58
other vectors [2, 39]. That is why we tried to express GPA1 in Rosetta cells which have
rare tRNAs additionally.
When we changed the strain from BL21 to Rosetta, the yield of GPA1 (as MBP+GPA1
fusion) increased significantly. The highest yield that we obtained at the end of
purification steps was 1.2 mg of protein from 1 L expression in LB medium. Despite the
fact that the solubility of GPA1 was increased due to the MBP tag, MBP expression on
its own also occurred at extremely high levels as it is seen from Figure 3-12, Figure
3-13 Figure 3-14. Even though MBP was expressed more than the fusion protein in
cells, we were able to separate them and obtain a clean sample of MBP+GPA1 fusion
protein. But the drawback of having excessive yield of MBP was that the culture
volume could not be increased beyond 1 L. A scale up would result in a sample that
would have too much contamination that would be hard to eliminate.
We did not observe any precipitation when GPA1 had MBP tag. It is an expected result
due to the fact that MBP increases solubility [41]. We found out from the SEC results
that MBP was dimerized and eluted before GPA1. It appears that MBP is not stable in
monomeric form and dimerizes in solution. When it is bound to GPA1, on the other
hand, it remains in the monomeric form.
Another issue that needs to be pointed out is that after TEV protease reaction, we
observed precipitation and almost 70% of GPA1 was lost. Even worse, the remaining
part of the GPA1 was aggregated according to DLS results. So, we can claim that GPA1
is not soluble enough and when there is no solubility agent like MBP, it precipitates.
Also, we can say that GPA1 is not sufficiently stable when the βγ dimer is not in the
environment. Jones et al. in 2011 reported that before they crystallized Gα subunit, they
removed 36 aminoacids from the N-terminus stating that these do not have any
contribution to the self activation mechanism which was demonstrated by intrinsic
fluorescent measurement comparison between non-truncated and the truncated form of
Gα, so structurally the protein structure remains unchanged [2]. In order to crystallize a
protein, high concentrations of the purest form are required. When these 36 aminoacids
were removed, GPA1 was expressed and purified with high yields, probably without
precipitation. We may infer that these 36 aminoacids from N-terminal contributes to the
flexibility of GPA1, which in turn, may cause precipitation since the stability of GPA1
may be reduced.
59
The observed aggregation may be caused of that there is no posttranslational
modifications in E.coli. It has been reported that there are several posttranslational
modifications such as myristoylation occuring at N-terminus and palmitoylation which
involves the attachment of palmitic acid using the first cysteine aminoacid [41, 42]
by N-myristoyl transferase (NMT) and palmitoyl transferase (PAT), respectively [43].
The posttranslational modifications occurred on Gα can be found in Appendix A. They
may stabilize GPA1 and when such modifications cannot be made, it may cause
aggregation.
4.3 Expression and Purification of GPA1 in P. pastoris System
When GPA1 was expressed and purified, the eluate was significantly more pure and
cleaner compared with the eluate obtained in E.coli system. Unfortunately, since there is
no MBP tag or any other solubility agent to increase solubility, more precipitation was
observed. In this system, again, the highest yield of GPA1 obtained was ~1.5 mg per 20
gr of pellet. When DLS measurements were performed, aggregation was not observed
and the sample was monodisperse. This allowed us to perform further measurements
such as CD measurements as a biophysical characterization method to understand its
secondary structure. Although the C-terminal His-tag was not eliminated, it was shown
that the percentage of secondary structure distribution is consistent with crystal structure
of GPA1. In the presence of DTT, GPA1 was more consistent to the crystal structure
but when there is no DTT, its secondary structure was disrupted. So, we can say that
DTT has positive effect on the structure of GPA1. Although E.coli system was easier to
work with in terms of time and source comsumption, the quality of sample was higher
in the yeast system.
60
5 CONCLUSION AND FUTURE WORKS
Cloning of the alpha subunit of heterotrimeric G protein, namely GPA1, into two
vectors, pQE80L and pETM41, was investigated and the cloning was successfully
accomplished in the latter. pETM41 cloning resulted in the synthesis of the
MBP+GPA1 fusion protein. Different expression systems such as E.coli and P.pastoris
were used to express the protein after optimizing the expression conditions in both of
them. Although GPA1 was previously cloned and expressed in the yeast system
previously, since it is more time and resource consuming compared with bacteria, we
switched to the bacteria systems for GPA1 expression by using different strains of
E.coli. It was found that, due to the presence of several rare codon in the GPA1
sequence Rosetta strain of E.coli is an efficient host to express GPA1 giving the yield of
1.2 mg/ 1 L expression.
Purification results showed that, although a significant amount of incomplete synthesis
gives high quantities of MBP, it is possible to eliminate it from the samples and obtain
pure form of GPA1 at the end of size exclusion chromatography. In between
purification steps, no precipitation occurred in the bacteria system due to the fact that
MBP increased the solubility of GPA1. However, precipitation was observed in several
steps when purifying GPA1 expressed in the yeast system and most of the protein was
lost in these steps.
After purifying GPA1, preliminary biophysical characterization of the samples obtained
from both the bacteria and yeast systems was performed by using native page gel, CD
(circular dichroism) and DLS (dynamic light scattering) measurements. Results showed
that after eliminating MBP tag with TEV protease digestion from the N- terminal of
GPA1, samples were aggregated. However, no aggregation was observed in the samples
obtained from the yeast expression system.
As future works, firstly purification and cleavage conditions need to be optimized to
eliminate aggregation of GPA1 after treatment with TEV. After obtaining sufficient
amount of non-aggregated protein without a tag, further structural characterization such
as secondary structure analysis using CD measurements can be performed. Additionally

61
functionality of GPA1 in terms of GTP and GDP binding and GTPase activity need to
be tested. These functions can be monitored by intrinsic fluorescent measurements and
real-time fluorescence-based assays as reported in the literature [2, 43, 44] Furthermore
if sufficient amponts of protein can be obtaine it will be informative to perform SAXS
measurements to follow dynamic changes in the structure upon binding different
nucleotides and their analogues.
62
6 REFERENCES
[1] D. Urano, J. Chen, J. R. Botella, and A. M. Jones, “Heterotrimeric G protein
signalling in the plant kingdom Heterotrimeric G protein signalling in the plant
kingdom,” no. March, 2013.
[2] J. C. Jones, J. W. Duffy, M. Machius, B. R. S. Temple, H. G. Dohlman, and A.
M. Jones, “The crystal structure of a self-activating G protein alpha subunit
reveals its distinct mechanism of signal initiation.,” Sci. Signal., vol. 4, p. ra8,
2011.
[3] D. Urano, J. C. Jones, H. Wang, M. Matthews, W. Bradford, J. L. Bennetzen, and
A. M. Jones, “G protein activation without a GEF in the plant kingdom.,” PLoS
Genet., vol. 8, no. 6, p. e1002756, Jun. 2012.
[4] B. Kaplan, “Structural Investigation of G-Protein Signaling in Plants.,” 2009.
[5] A. Akturk, “Characterization of A. thaliana G-Protein Gamma Subunit (AGG2)
and Investigation of DTT Effect on Its Oligomeric State,” 2012.
[6] G. Milligan and E. Kostenis, “Heterotrimeric G-proteins: a short history.,” Br. J.
Pharmacol., vol. 147 Suppl , pp. S46–S55, 2006.
[7] M. Rodbell, “Signal Transduction: Evolution of an idea,” pp. 220–237, 1994.
[8] A. Krishnan, M. S. Alm??n, R. Fredriksson, and H. B. Schi??th, “The origin of
GPCRs: Identification of mammalian like rhodopsin, adhesion, glutamate and
frizzled GPCRs in fungi,” PLoS One, vol. 7, no. 1, 2012.
[9] B. K. Kobilka, “G protein coupled receptor structure and activation.,” Biochim.
Biophys. Acta, vol. 1768, no. 4, pp. 794–807, Apr. 2007.
[10] M. C. Lagerstrom and H. B. Schioth, “Structural diversity of G protein-coupled
receptors and significance for drug discovery,” Nat Rev Drug Discov, vol. 7, pp.
339–357, 2008.
[11] V. Sarramegna, F. Talmont, P. Demange, and A. Milon, “Heterologous
expression of G-protein-coupled receptors: comparison of expression systems
from the standpoint of large-scale production and purification.,” Cell. Mol. Life
Sci., vol. 60, pp. 1529–1546, 2003.
[12] P. Ghanouni, Z. Gryczynski, J. J. Steenhuis, T. W. Lee, D. L. Farrens, J. R.
Lakowicz, and B. K. Kobilka, “Functionally different agonists induce distinct
conformations in the G protein coupling domain of the beta 2 adrenergic
receptor.,” J. Biol. Chem., vol. 276, pp. 24433–24436, 2001.
[13] S. Bulenger, S. Marullo, and M. Bouvier, “Emerging role of homo- and
heterodimerization in G-protein-coupled receptor biosynthesis and maturation,”
Trends in Pharmacological Sciences, vol. 26. pp. 131–137, 2005.
63
[14] J. A. Javitch, “The ants go marching two by two: oligomeric structure of G-
protein-coupled receptors.,” Mol. Pharmacol., vol. 66, pp. 1077–1082, 2004.
[15] S. Angers, A. Salahpour, and M. Bouvier, “Dimerization: an emerging concept
for G protein-coupled receptor ontogeny and function.,” Annu. Rev. Pharmacol.
Toxicol., vol. 42, pp. 409–435, 2002.
[16] J. L. Baneres and J. Parello, “Structure-based analysis of GPCR function:
Evidence for a novel pentameric assembly between the dimeric leukotriene B4
receptor BLT1 and the G-protein,” J. Mol. Biol., vol. 329, pp. 815–829, 2003.
[17] T. Kenakin, “Efficacy at G-protein-coupled receptors.,” Nat. Rev. Drug Discov.,
vol. 1, pp. 103–110, 2002.
[18] G. Swaminath, X. Deupi, T. W. Lee, W. Zhu, F. S. Thian, T. S. Kobilka, and B.
Kobilka, “Probing the beta2 adrenoceptor binding site with catechol reveals
differences in binding and activation by agonists and partial agonists.,” J. Biol.
Chem., vol. 280, pp. 22165–22171, 2005.
[19] T. Kenakin, “Ligand-selective receptor conformations revisited: The promise and
the problem,” Trends in Pharmacological Sciences, vol. 24. pp. 346–354, 2003.
[20] C. Hapter, D. P. Siderovski, and T. K. Harden, “The RGS Protein Superfamily,”
Handb. Cell Signal., vol. 2, no. Chapter 225, pp. 631–638, 2003.
[21] J. R. Hepler, D. M. Berman, A. G. Gilman, and T. Kozasa, “RGS4 and GAIP are
GTPase-activating proteins for Gq alpha and block activation of phospholipase C
beta by gamma-thio-GTP-Gq alpha.,” Proc. Natl. Acad. Sci. U. S. A., vol. 94, pp.
428–432, 1997.
[22] J. R. Hepler, “RGS protein and G protein interactions: a little help from their
friends.,” Mol. Pharmacol., vol. 64, no. 3, pp. 547–9, Sep. 2003.
[23] J. J. Tesmer, D. M. Berman, A. G. Gilman, and S. R. Sprang, “Structure of RGS4
bound to AlF4--activated G(i alpha1): stabilization of the transition state for GTP
hydrolysis.,” Cell, vol. 89, pp. 251–261, 1997.
[24] M. Pines, P. Gierschik, G. Milligan, W. Klee, and A. Spiegel, “Antibodies
against the carboxyl-terminal 5-kDa peptide of the alpha subunit of transducin
crossreact with the 40-kDa but not the 39-kDa guanine nucleotide binding protein
from brain.,” Proc. Natl. Acad. Sci. U. S. A., vol. 82, pp. 4095–4099, 1985.
[25] D. T. Lodowski, J. A. Pitcher, W. D. Capel, R. J. Lefkowitz, and J. J. G. Tesmer,
“Keeping G proteins at bay: a complex between G protein-coupled receptor
kinase 2 and Gbetagamma.,” Science, vol. 300, pp. 1256–1262, 2003.
[26] L. Birnbaumer, “Signal transduction by G proteins. basic principles, molecular
diversity, and structural basis of their actions,” in Handbook of Cell Signaling,
2/e, vol. 2, 2010, pp. 1597–1614.
64
[27] N. Wettschureck and S. Offermanns, “Mammalian G Proteins and Their Cell
Type Specific Functions,” Physiol Rev., vol. 85, pp. 1159–1204, 2005.
[28] B. Ahrén, “Islet G protein-coupled receptors as potential targets for treatment of
type 2 diabetes.,” Nat. Rev. Drug Discov., vol. 8, pp. 369–385, 2009.
[29] H. Ma, M. F. Yanofsky, and E. M. Meyerowitz, “Molecular cloning and
characterization of GPA1, a G protein alpha subunit gene from Arabidopsis
thaliana.,” Proc. Natl. Acad. Sci. U. S. A., vol. 87, pp. 3821–3825, 1990.
[30] Y. Trusov, D. Chakravorty, and J. R. Botella, “Diversity of heterotrimeric G-
protein gamma subunits in plants,” BMC Research Notes, vol. 5. p. 608, 2012.
[31] H. Ma, M. F. Yanofsky, and E. M. Meyerowitz, “Molecular cloning and
characterization of GPA1, a G protein alpha subunit gene from Arabidopsis
thaliana.,” Proc. Natl. Acad. Sci. U. S. A., vol. 87, no. 10, pp. 3821–5, May 1990.
[32] D. Chakravorty, Y. Trusov, and J. R. Botella, “Site-directed mutagenesis of the
Arabidopsis heterotrimeric G protein β subunit suggests divergent mechanisms of
effector activation between plant and animal G proteins,” Planta, vol. 235. pp.
615–627, 2012.
[33] D. E. Coleman, A. M. Berghuis, E. Lee, M. E. Linder, A. G. Gilman, and S. R.
Sprang, “Structures of active conformations of Gi alpha 1 and the mechanism of
GTP hydrolysis.,” Science, vol. 265, pp. 1405–1412, 1994.
[34] D. Hackenberg, H. Sakayama, T. Nishiyama, and S. Pandey, “Characterization of
the heterotrimeric G-protein complex and its regulator from the green alga Chara
braunii expands the evolutionary breadth of plant G-protein signaling.,” Plant
Physiol., vol. 163, pp. 1510–7, 2013.
[35] Y. R. Lee and S. M. Assmann, “Arabidopsis thaliana ‘extra-large GTP-binding
protein’ (AtXLG1): a new class of G-protein.,” Plant Mol. Biol., vol. 40, pp. 55–
64, 1999.
[36] P. G. Blommel and B. G. Fox, “A combined approach to improving large-scale
production of tobacco etch virus protease.,” Protein Expr. Purif., vol. 55, no. 1,
pp. 53–68, Sep. 2007.
[37] D. S. Waugh, “TEV Protease FAQ,” no. September, 2010.
[38] P. Mega, O. Orun, C. Nacar, and U. Osman, “Structural characterization of
recombinant bovine Go α by spectroscopy and homology modeling,” vol. 26, no.
1, pp. 213–229, 2011.
[39] C. Fladeby, E. S. Vik, J. K. Laerdahl, C. Gran Neurauter, J. E. Heggelund, E.
Thorgaard, P. Strøm-Andersen, M. Bjørås, B. Dalhus, and I. Alseth, “The human
homolog of Escherichia coli endonuclease V is a nucleolar protein with affinity
for branched DNA structures.,” PLoS One, vol. 7, no. 11, p. e47466, Jan. 2012.
65
[40] F. S. Willard and D. P. Siderovski, “Purification and in vitro functional analysis
of the Arabidopsis thaliana regulator of G-protein signaling-1.,” Methods
Enzymol., vol. 389, no. 1995, pp. 320–38, Jan. 2004.
[41] J. D. Fox and D. S. Waugh, “Maltose-binding protein as a solubility enhancer.,”
Methods Mol. Biol., vol. 205, pp. 99–117, Jan. 2003.
[42] M. J. Lee, “Activation of G protein signaling by a non-receptor exchange factor,”
2008.
[43] M. J. W. Adjobo-Hermans, J. Goedhart, and T. W. J. Gadella, “Plant G protein
heterotrimers require dual lipidation motifs of Galpha and Ggamma and do not
dissociate upon activation.,” J. Cell Sci., vol. 119, no. Pt 24, pp. 5087–97, Dec.
2006.
[44] R. E. Muller, D. P. Siderovski, A. J. Kimple, N. Carolina, and C. Hill, “Using
Intrinsic Tryptophan Fluorescence to Measure Heterotrimeric G-Protein
Activation,” vol. 7, 2009.
[45] R. J. Kimple, M. B. Jones, A. Shutes, B. R. Yerxa, D. P. Siderovski, and F. S.
Willard, “Established and emerging fluorescence-based assays for G-protein
function: heterotrimeric G-protein alpha subunits and regulator of G-protein
signaling (RGS) proteins.,” Comb. Chem. High Throughput Screen., vol. 6, no. 4,
pp. 399–407, Jun. 2003.
66
APPENDIX LIST
APPENDIX A: Post translational modifications occurred in GPA1 and multiple
alignment result for beta subunit of plant heterotrimeric G protein.
APPENDIX B: Chemicals
APPENDIX C: Molecular weight markers
APPENDIX D: Vector maps
APPENDIX E: Buffers and solutions
APPENDIX F: Equipments
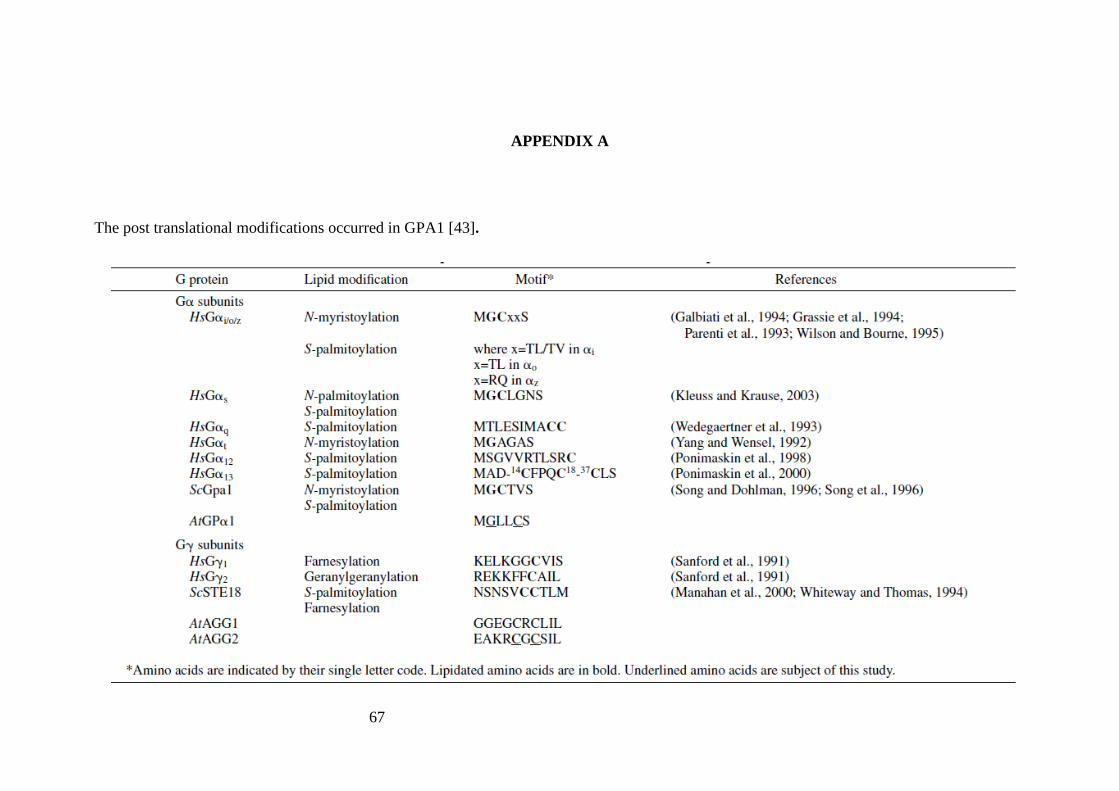
67
APPENDIX A
The post translational modifications occurred in GPA1 [43].
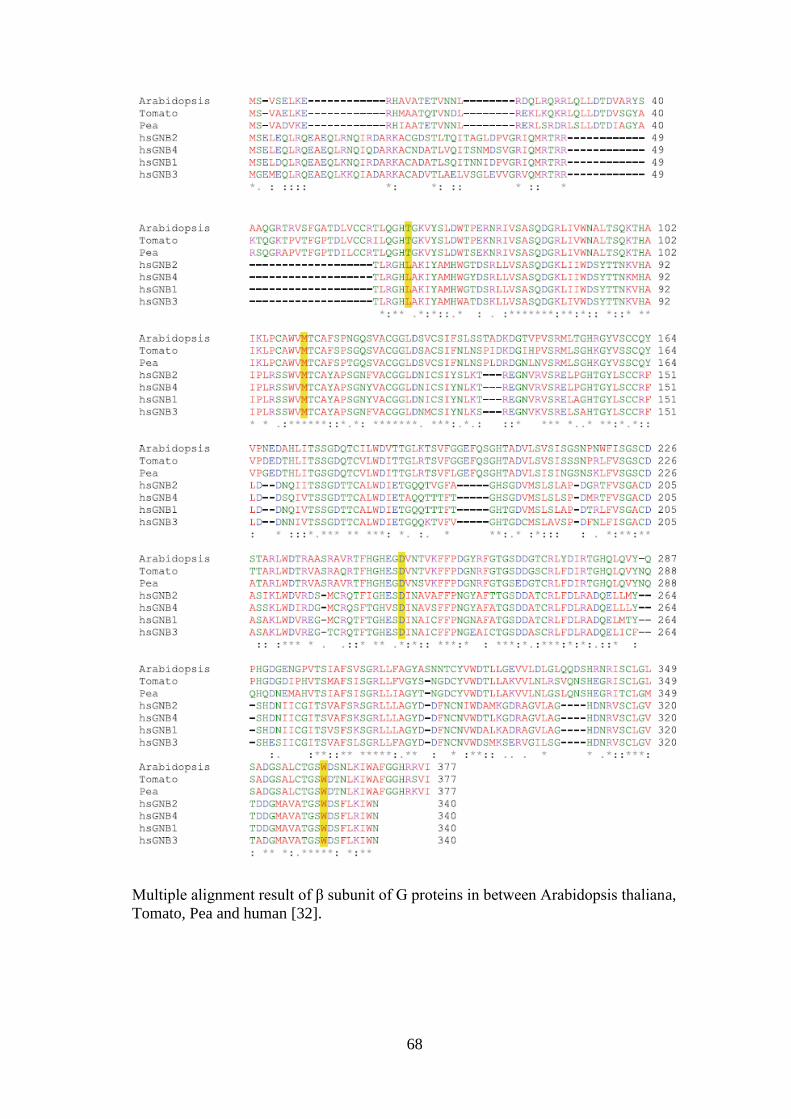
68
Multiple alignment result of β subunit of G proteins in between Arabidopsis thaliana,
Tomato, Pea and human [32].
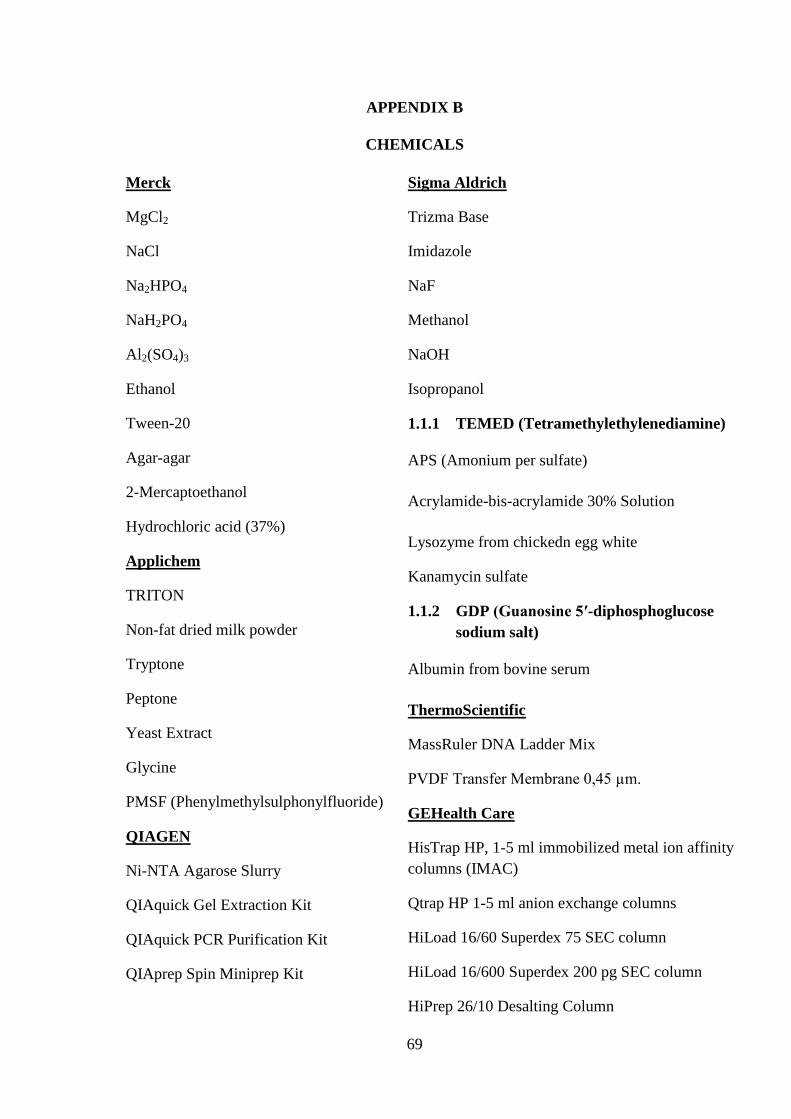
69
APPENDIX B
CHEMICALS
Sigma Aldrich
Trizma Base
Imidazole
NaF
Methanol
NaOH
Isopropanol
1.1.1 TEMED (Tetramethylethylenediamine)
APS (Amonium per sulfate)
Acrylamide-bis-acrylamide 30% Solution
Lysozyme from chickedn egg white
Kanamycin sulfate
1.1.2 GDP (Guanosine 5′-diphosphoglucose
sodium salt)
Albumin from bovine serum
ThermoScientific
MassRuler DNA Ladder Mix
PVDF Transfer Membrane 0,45 µm.
GEHealth Care
HisTrap HP, 1-5 ml immobilized metal ion affinity
columns (IMAC)
Qtrap HP 1-5 ml anion exchange columns
HiLoad 16/60 Superdex 75 SEC column
HiLoad 16/600 Superdex 200 pg SEC column
HiPrep 26/10 Desalting Column
Merck
MgCl2
NaCl
Na2HPO4
NaH2PO4
Al2(SO4)3
Ethanol
Tween-20
Agar-agar
2-Mercaptoethanol
Hydrochloric acid (37%)
Applichem
TRITON
Non-fat dried milk powder
Tryptone
Peptone
Yeast Extract
Glycine
PMSF (Phenylmethylsulphonylfluoride)
QIAGEN
Ni-NTA Agarose Slurry
QIAquick Gel Extraction Kit
QIAquick PCR Purification Kit
QIAprep Spin Miniprep Kit
70
Fermentas
BamHI
NcoI
KpnI
HindIII
T4 Ligase
Taq. Polymerase
dNTPs
Pre-stained Protein Molecular Marker
AMRESCO
SDS (Sodium dodecyl sulfate)
TRIS
CelluSep
Regenerated Cellulose Tubular
Membrane
peqGOLD Lab
Protein Marker II Unstained 10-200 kDa
Universal Agarose
Duchefa Biochemie
Ampicillin
Roche
Complete Protease Inhibitor Tablets
Complete EDTA-Free Protease Inhibitor
Tablets
ITPG (Isopropyl-β-D-thiogalactoside)
Fluka
1,4-Dithiothreitol (DTT)
Coomassie Brillant Blue R-250
FUJI
Medical X-Ray Films
BioSpec Products
0.5 mm Zirconia/Silica Beads
Millipore
Membrane Filters (0.22, 0.45 µm)
Miltenyi MACS Biotechs
Anti-His antibody
KONIX
Developer, Fixer
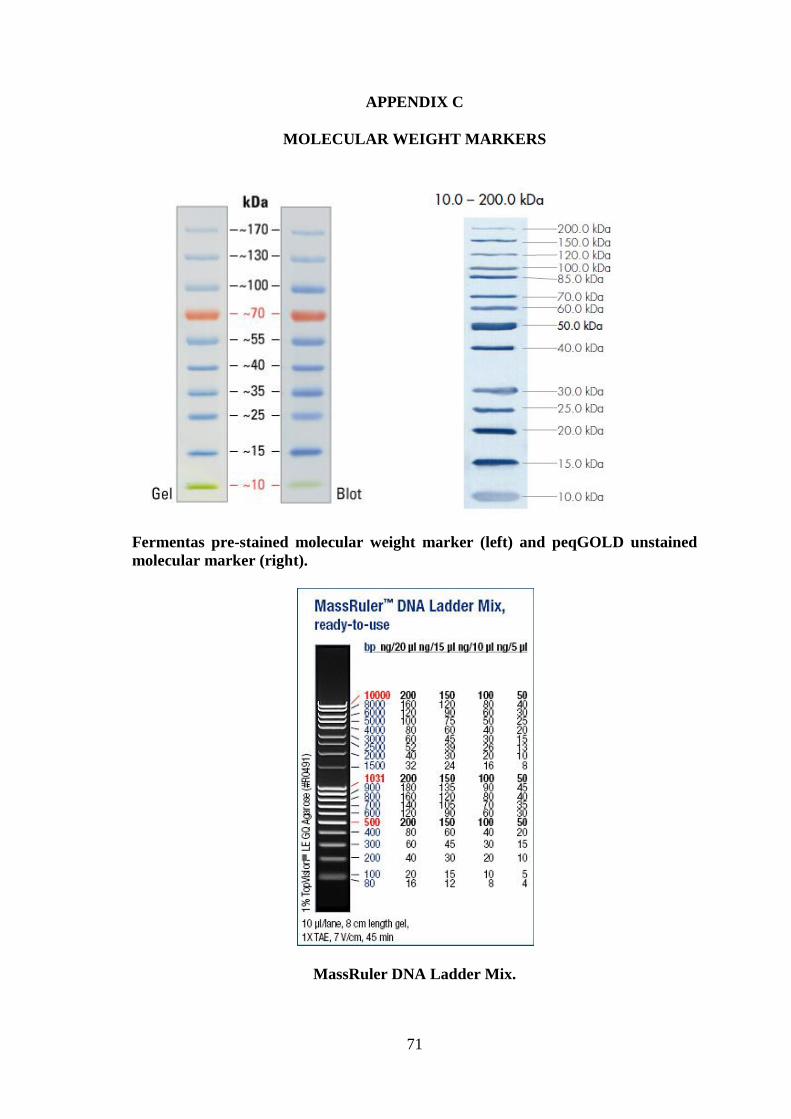
71
APPENDIX C
MOLECULAR WEIGHT MARKERS
Fermentas pre-stained molecular weight marker (left) and peqGOLD unstained
molecular marker (right).
MassRuler DNA Ladder Mix.
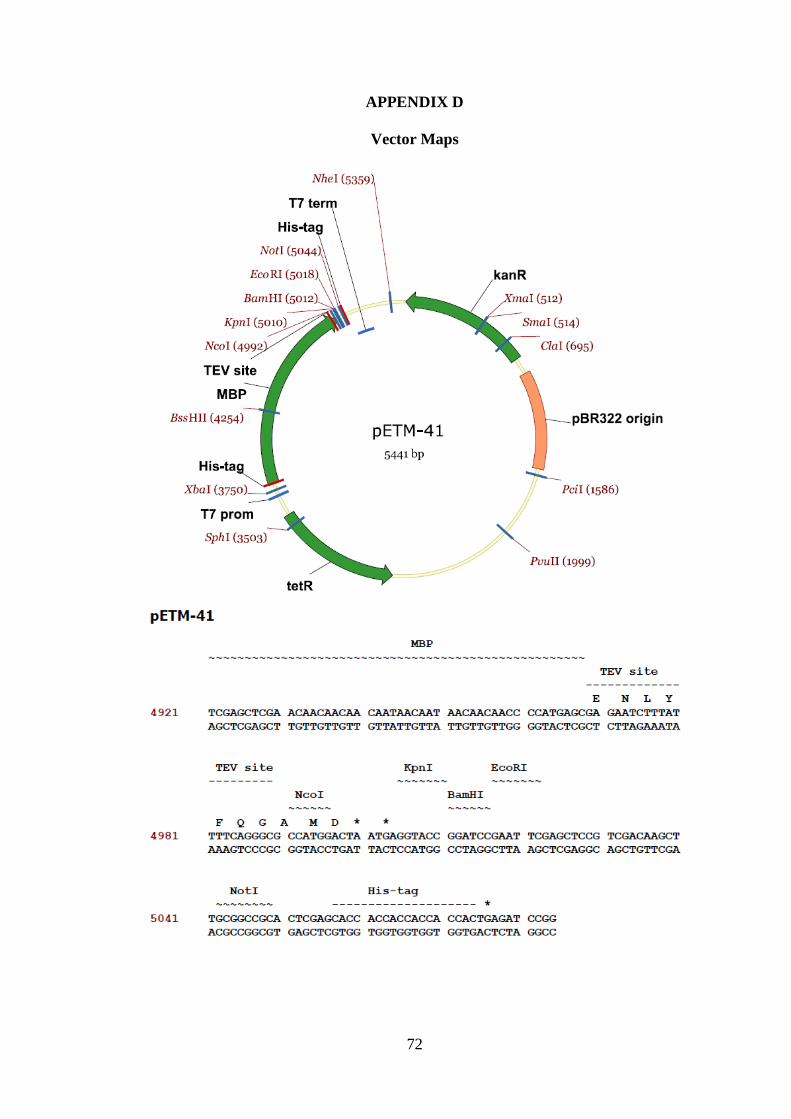
72
APPENDIX D
Vector Maps
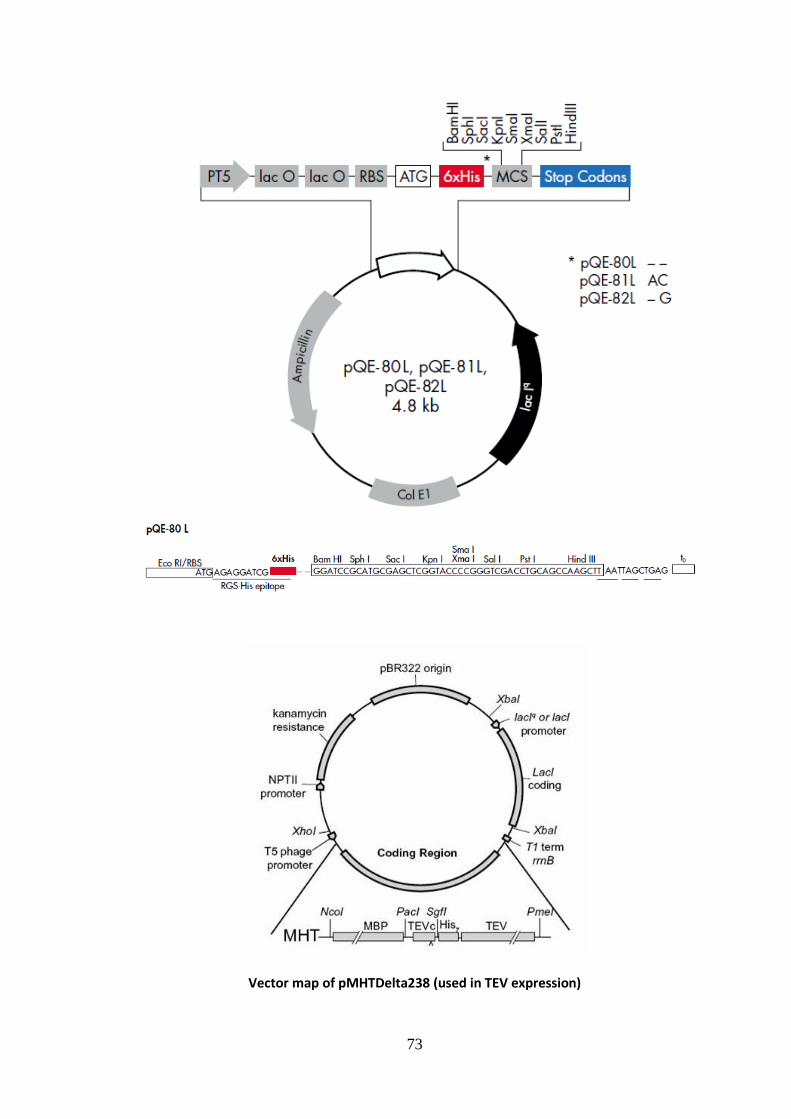
73
Vector map of pMHTDelta238 (used in TEV expression)
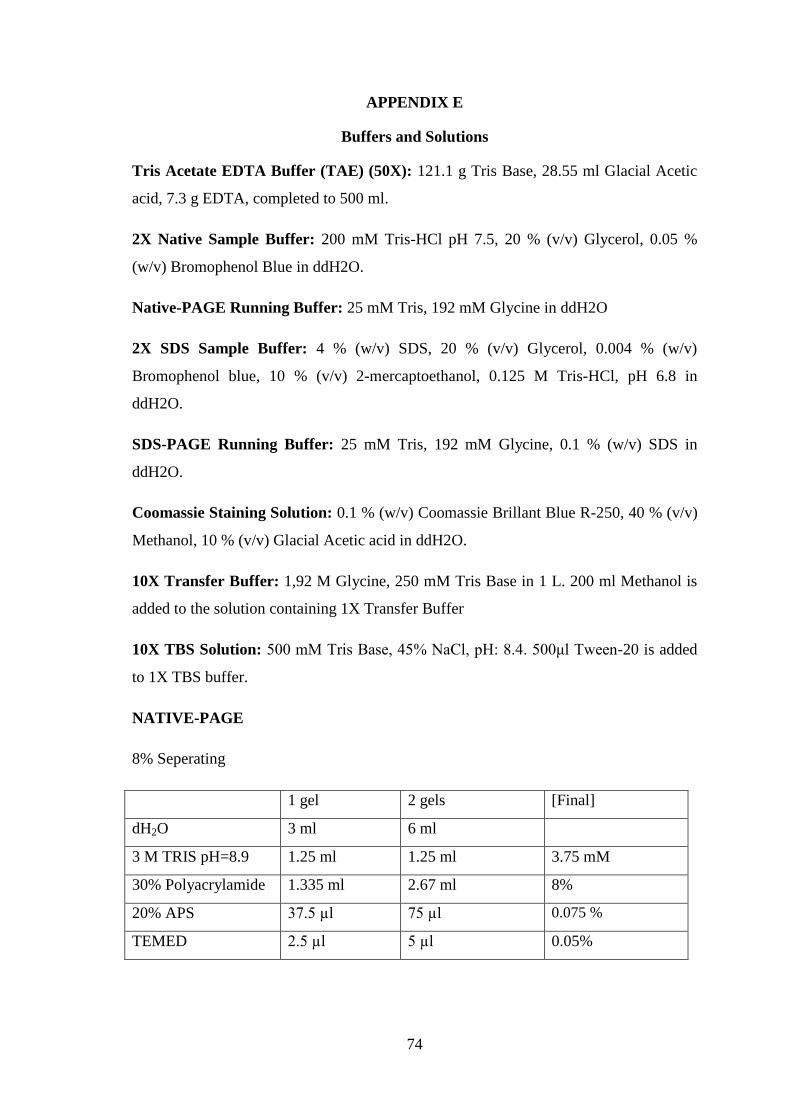
74
APPENDIX E
Buffers and Solutions
Tris Acetate EDTA Buffer (TAE) (50X): 121.1 g Tris Base, 28.55 ml Glacial Acetic
acid, 7.3 g EDTA, completed to 500 ml.
2X Native Sample Buffer: 200 mM Tris-HCl pH 7.5, 20 % (v/v) Glycerol, 0.05 %
(w/v) Bromophenol Blue in ddH2O.
Native-PAGE Running Buffer: 25 mM Tris, 192 mM Glycine in ddH2O
2X SDS Sample Buffer: 4 % (w/v) SDS, 20 % (v/v) Glycerol, 0.004 % (w/v)
Bromophenol blue, 10 % (v/v) 2-mercaptoethanol, 0.125 M Tris-HCl, pH 6.8 in
ddH2O.
SDS-PAGE Running Buffer: 25 mM Tris, 192 mM Glycine, 0.1 % (w/v) SDS in
ddH2O.
Coomassie Staining Solution: 0.1 % (w/v) Coomassie Brillant Blue R-250, 40 % (v/v)
Methanol, 10 % (v/v) Glacial Acetic acid in ddH2O.
10X Transfer Buffer: 1,92 M Glycine, 250 mM Tris Base in 1 L. 200 ml Methanol is
added to the solution containing 1X Transfer Buffer
10X TBS Solution: 500 mM Tris Base, 45% NaCl, pH: 8.4. 500μl Tween-20 is added
to 1X TBS buffer.
NATIVE-PAGE
8% Seperating
1 gel 2 gels [Final]
dH2O 3 ml 6 ml
3 M TRIS pH=8.9 1.25 ml 1.25 ml 3.75 mM
30% Polyacrylamide 1.335 ml 2.67 ml 8%
20% APS 37.5 µl 75 µl 0.075 %
TEMED 2.5 µl 5 µl 0.05%
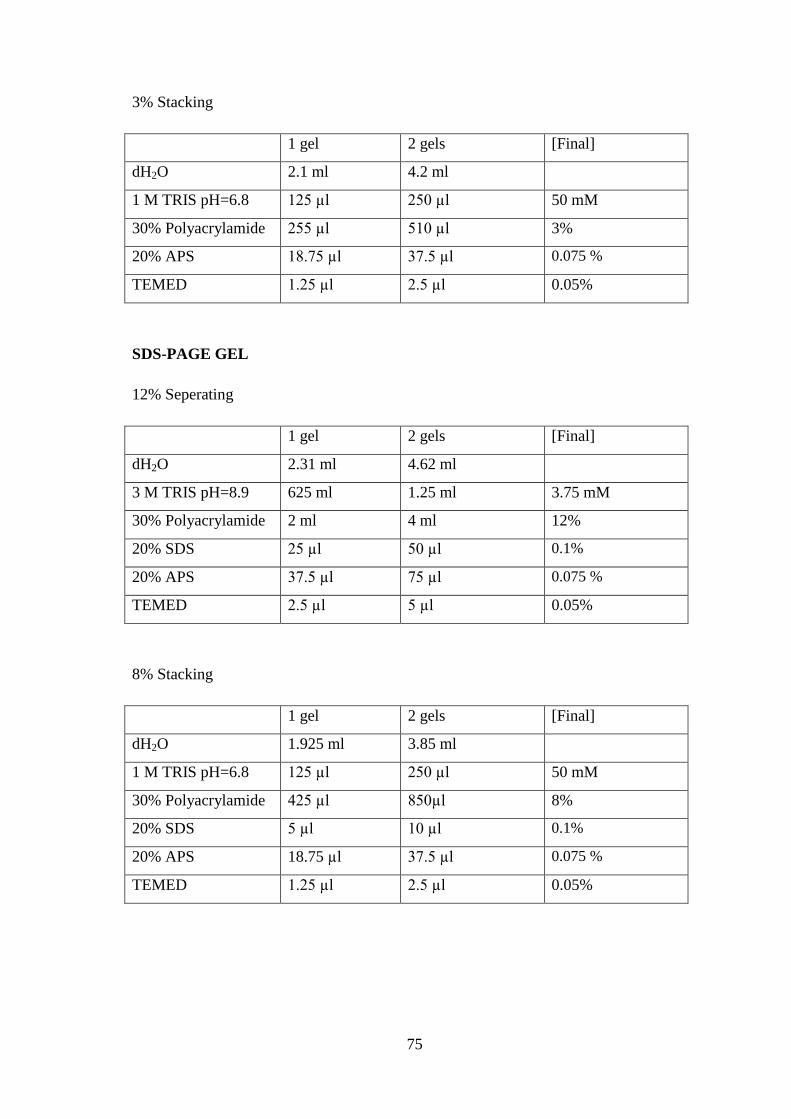
75
3% Stacking
1 gel 2 gels [Final]
dH2O 2.1 ml 4.2 ml
1 M TRIS pH=6.8 125 µl 250 µl 50 mM
30% Polyacrylamide 255 µl 510 µl 3%
20% APS 18.75 µl 37.5 µl 0.075 %
TEMED 1.25 µl 2.5 µl 0.05%
SDS-PAGE GEL
12% Seperating
1 gel 2 gels [Final]
dH2O 2.31 ml 4.62 ml
3 M TRIS pH=8.9 625 ml 1.25 ml 3.75 mM
30% Polyacrylamide 2 ml 4 ml 12%
20% SDS 25 µl 50 µl 0.1%
20% APS 37.5 µl 75 µl 0.075 %
TEMED 2.5 µl 5 µl 0.05%
8% Stacking
1 gel 2 gels [Final]
dH2O 1.925 ml 3.85 ml
1 M TRIS pH=6.8 125 µl 250 µl 50 mM
30% Polyacrylamide 425 µl 850µl 8%
20% SDS 5 µl 10 µl 0.1%
20% APS 18.75 µl 37.5 µl 0.075 %
TEMED 1.25 µl 2.5 µl 0.05%
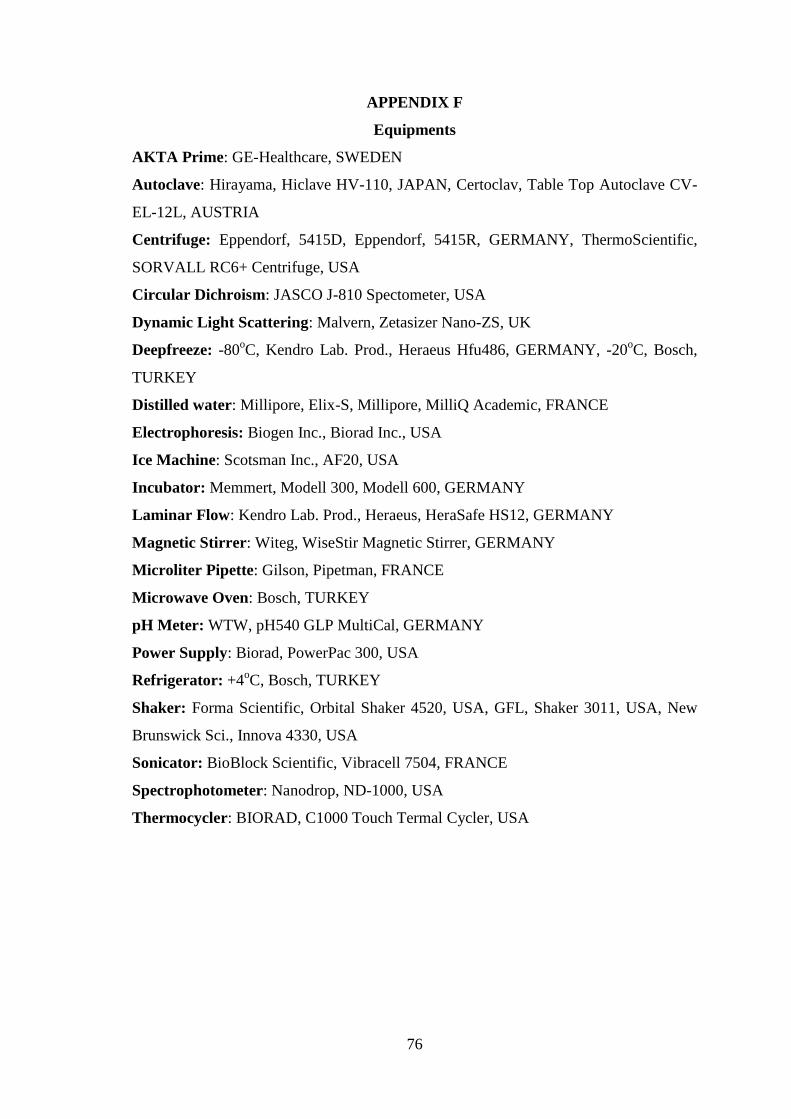
76
APPENDIX F
Equipments
AKTA Prime: GE-Healthcare, SWEDEN
Autoclave: Hirayama, Hiclave HV-110, JAPAN, Certoclav, Table Top Autoclave CV-
EL-12L, AUSTRIA
Centrifuge: Eppendorf, 5415D, Eppendorf, 5415R, GERMANY, ThermoScientific,
SORVALL RC6+ Centrifuge, USA
Circular Dichroism: JASCO J-810 Spectometer, USA
Dynamic Light Scattering: Malvern, Zetasizer Nano-ZS, UK
Deepfreeze: -80oC, Kendro Lab. Prod., Heraeus Hfu486, GERMANY, -20
oC, Bosch,
TURKEY
Distilled water: Millipore, Elix-S, Millipore, MilliQ Academic, FRANCE
Electrophoresis: Biogen Inc., Biorad Inc., USA
Ice Machine: Scotsman Inc., AF20, USA
Incubator: Memmert, Modell 300, Modell 600, GERMANY
Laminar Flow: Kendro Lab. Prod., Heraeus, HeraSafe HS12, GERMANY
Magnetic Stirrer: Witeg, WiseStir Magnetic Stirrer, GERMANY
Microliter Pipette: Gilson, Pipetman, FRANCE
Microwave Oven: Bosch, TURKEY
pH Meter: WTW, pH540 GLP MultiCal, GERMANY
Power Supply: Biorad, PowerPac 300, USA
Refrigerator: +4oC, Bosch, TURKEY
Shaker: Forma Scientific, Orbital Shaker 4520, USA, GFL, Shaker 3011, USA, New
Brunswick Sci., Innova 4330, USA
Sonicator: BioBlock Scientific, Vibracell 7504, FRANCE
Spectrophotometer: Nanodrop, ND-1000, USA
Thermocycler: BIORAD, C1000 Touch Termal Cycler, USA


![[Published online 29 May, 2007] Heterotrimerik G Proteinleri · enzim ve iyon kanalı gibi pekçok efektör üzerinden sinyal iletimine aracılık ederler. Heterotrimerik G proteinleri](https://img.pdfslide.net/doc/110x75/5e43ac03845a57227752bfc6/published-online-29-may-2007-heterotrimerik-g-enzim-ve-iyon-kanal-gibi-pekok.jpg)