Embed Size (px)
Citation preview

HCM Signalized Intersection Capacity Analysis US 90 Corridor Study1: US 90 & Woodbine Rd 2017 Midday Peak
US 90 Corridor Study Synchro 7 - ReportPage 1
Movement EBL EBT WBT WBR SBL SBRLane ConfigurationsVolume (vph) 377 721 717 202 277 282Ideal Flow (vphpl) 1900 1900 1900 1900 1900 1900Total Lost time (s) 4.0 4.0 4.0 4.0 4.0 4.0Lane Util. Factor 0.97 0.95 0.95 1.00 1.00 1.00Frt 1.00 1.00 1.00 0.85 1.00 0.85Flt Protected 0.95 1.00 1.00 1.00 0.95 1.00Satd. Flow (prot) 3433 3539 3539 1583 1770 1583Flt Permitted 0.95 1.00 1.00 1.00 0.95 1.00Satd. Flow (perm) 3433 3539 3539 1583 1770 1583Peak-hour factor, PHF 0.92 0.92 0.92 0.92 0.92 0.92Growth Factor (vph) 105% 105% 105% 105% 105% 105%Adj. Flow (vph) 430 823 818 231 316 322RTOR Reduction (vph) 0 0 0 160 0 245Lane Group Flow (vph) 430 823 818 71 316 77Turn Type Prot Perm PermProtected Phases 5 2 6 4Permitted Phases 6 4Actuated Green, G (s) 8.0 25.5 13.5 13.5 10.5 10.5Effective Green, g (s) 8.0 25.5 13.5 13.5 10.5 10.5Actuated g/C Ratio 0.18 0.58 0.31 0.31 0.24 0.24Clearance Time (s) 4.0 4.0 4.0 4.0 4.0 4.0Vehicle Extension (s) 3.0 3.0 3.0 3.0 3.0 3.0Lane Grp Cap (vph) 624 2051 1086 486 422 378v/s Ratio Prot c0.13 0.23 c0.23 c0.18v/s Ratio Perm 0.04 0.05v/c Ratio 0.69 0.40 0.75 0.15 0.75 0.20Uniform Delay, d1 16.8 5.1 13.7 11.1 15.5 13.4Progression Factor 1.00 1.00 1.00 1.00 1.00 1.00Incremental Delay, d2 3.2 0.1 3.0 0.1 7.1 0.3Delay (s) 20.0 5.2 16.8 11.2 22.7 13.7Level of Service C A B B C BApproach Delay (s) 10.3 15.5 18.1Approach LOS B B B
Intersection SummaryHCM Average Control Delay 13.9 HCM Level of Service BHCM Volume to Capacity ratio 0.74Actuated Cycle Length (s) 44.0 Sum of lost time (s) 12.0Intersection Capacity Utilization 58.2% ICU Level of Service BAnalysis Period (min) 15c Critical Lane Group

HCM Unsignalized Intersection Capacity Analysis US 90 Corridor Study5: Diamond St & US 90 2017 Midday Peak
US 90 Corridor Study Synchro 7 - ReportPage 2
Movement WBL WBR NBT NBR SBL SBTLane ConfigurationsVolume (veh/h) 70 14 994 82 15 749Sign Control Stop Free FreeGrade 0% 0% 0%Peak Hour Factor 0.92 0.92 0.92 0.92 0.92 0.92Hourly flow rate (vph) 80 16 1134 94 17 855PedestriansLane Width (ft)Walking Speed (ft/s)Percent BlockageRight turn flare (veh)Median type None NoneMedian storage veh)Upstream signal (ft) 724pX, platoon unblockedvC, conflicting volume 1596 567 1228vC1, stage 1 conf volvC2, stage 2 conf volvCu, unblocked vol 1596 567 1228tC, single (s) 6.8 6.9 4.1tC, 2 stage (s)tF (s) 3.5 3.3 2.2p0 queue free % 15 97 97cM capacity (veh/h) 94 467 563
Direction, Lane # WB 1 NB 1 NB 2 NB 3 SB 1 SB 2 SB 3Volume Total 96 567 567 94 17 427 427Volume Left 80 0 0 0 17 0 0Volume Right 16 0 0 94 0 0 0cSH 109 1700 1700 1700 563 1700 1700Volume to Capacity 0.88 0.33 0.33 0.06 0.03 0.25 0.25Queue Length 95th (ft) 131 0 0 0 2 0 0Control Delay (s) 128.8 0.0 0.0 0.0 11.6 0.0 0.0Lane LOS F BApproach Delay (s) 128.8 0.0 0.2Approach LOS F
Intersection SummaryAverage Delay 5.7Intersection Capacity Utilization 40.5% ICU Level of Service AAnalysis Period (min) 15

HCM Signalized Intersection Capacity Analysis US 90 Corridor Study9: US 90 & Chumuckla Hwy 2017 Midday Peak
US 90 Corridor Study Synchro 7 - ReportPage 3
Movement EBL EBT EBR WBL WBT WBR NBL NBT NBR SBL SBT SBRLane ConfigurationsVolume (vph) 137 844 29 22 712 124 185 17 114 45 36 32Ideal Flow (vphpl) 1900 1900 1900 1900 1900 1900 1900 1900 1900 1900 1900 1900Total Lost time (s) 4.0 4.0 4.0 4.0 4.0 4.0 4.0 4.0Lane Util. Factor 1.00 0.95 1.00 0.95 1.00 1.00 1.00 1.00Frt 1.00 1.00 1.00 0.98 1.00 0.87 1.00 0.93Flt Protected 0.95 1.00 0.95 1.00 0.95 1.00 0.95 1.00Satd. Flow (prot) 1770 3522 1770 3460 1770 1619 1770 1730Flt Permitted 0.15 1.00 0.23 1.00 0.58 1.00 0.66 1.00Satd. Flow (perm) 287 3522 435 3460 1071 1619 1234 1730Peak-hour factor, PHF 0.92 0.92 0.92 0.92 0.92 0.92 0.92 0.92 0.92 0.92 0.92 0.92Growth Factor (vph) 105% 105% 105% 105% 105% 105% 105% 105% 105% 105% 105% 105%Adj. Flow (vph) 156 963 33 25 813 142 211 19 130 51 41 37RTOR Reduction (vph) 0 3 0 0 22 0 0 108 0 0 32 0Lane Group Flow (vph) 156 993 0 25 933 0 211 41 0 51 46 0Turn Type pm+pt pm+pt pm+pt pm+ptProtected Phases 5 2 1 6 3 8 7 4Permitted Phases 2 6 8 4Actuated Green, G (s) 31.7 26.5 23.2 22.0 15.4 9.7 11.8 7.9Effective Green, g (s) 31.7 26.5 23.2 22.0 15.4 9.7 11.8 7.9Actuated g/C Ratio 0.55 0.46 0.40 0.38 0.27 0.17 0.21 0.14Clearance Time (s) 4.0 4.0 4.0 4.0 4.0 4.0 4.0 4.0Vehicle Extension (s) 3.0 3.0 3.0 3.0 3.0 3.0 3.0 3.0Lane Grp Cap (vph) 306 1629 204 1328 357 274 291 239v/s Ratio Prot c0.05 0.28 0.00 c0.27 c0.06 0.03 0.01 0.03v/s Ratio Perm 0.23 0.05 c0.10 0.02v/c Ratio 0.51 0.61 0.12 0.70 0.59 0.15 0.18 0.19Uniform Delay, d1 8.5 11.5 10.5 14.9 17.4 20.3 18.6 21.9Progression Factor 1.00 1.00 1.00 1.00 1.00 1.00 1.00 1.00Incremental Delay, d2 1.3 0.7 0.3 1.7 2.6 0.3 0.3 0.4Delay (s) 9.8 12.2 10.7 16.6 20.0 20.5 18.9 22.3Level of Service A B B B C C B CApproach Delay (s) 11.9 16.5 20.2 20.9Approach LOS B B C C
Intersection SummaryHCM Average Control Delay 15.2 HCM Level of Service BHCM Volume to Capacity ratio 0.67Actuated Cycle Length (s) 57.3 Sum of lost time (s) 16.0Intersection Capacity Utilization 60.9% ICU Level of Service BAnalysis Period (min) 15c Critical Lane Group

HCM Signalized Intersection Capacity Analysis US 90 Corridor Study14: US 90 & W Spencer Field Rd 2017 Midday Peak
US 90 Corridor Study Synchro 7 - ReportPage 4
Movement EBL EBT EBR WBL WBT WBR NBL NBT NBR SBL SBT SBRLane ConfigurationsVolume (vph) 119 1022 0 18 884 78 5 15 7 154 14 106Ideal Flow (vphpl) 1900 1900 1900 1900 1900 1900 1900 1900 1900 1900 1900 1900Total Lost time (s) 4.0 4.0 4.0 4.0 4.0 4.0 4.0 4.0Lane Util. Factor 1.00 0.95 1.00 0.95 1.00 1.00 1.00 1.00Frt 1.00 1.00 1.00 1.00 0.85 0.97 1.00 0.85Flt Protected 0.95 1.00 0.95 1.00 1.00 0.99 0.96 1.00Satd. Flow (prot) 1593 3185 1593 3185 1425 1603 1603 1425Flt Permitted 0.18 1.00 0.21 1.00 1.00 0.94 0.72 1.00Satd. Flow (perm) 298 3185 349 3185 1425 1520 1209 1425Peak-hour factor, PHF 0.92 0.92 0.92 0.92 0.92 0.92 0.92 0.92 0.92 0.92 0.92 0.92Growth Factor (vph) 105% 105% 105% 105% 105% 105% 105% 105% 105% 105% 105% 105%Adj. Flow (vph) 136 1166 0 21 1009 89 6 17 8 176 16 121RTOR Reduction (vph) 0 0 0 0 0 45 0 6 0 0 0 97Lane Group Flow (vph) 136 1166 0 21 1009 44 0 25 0 0 192 24Turn Type pm+pt Perm pm+pt Perm Perm Perm PermProtected Phases 5 2 1 6 8 4Permitted Phases 2 2 6 6 8 4 4Actuated Green, G (s) 39.5 34.3 30.7 29.5 29.5 11.9 11.9 11.9Effective Green, g (s) 39.5 34.3 30.7 29.5 29.5 11.9 11.9 11.9Actuated g/C Ratio 0.66 0.58 0.52 0.50 0.50 0.20 0.20 0.20Clearance Time (s) 4.0 4.0 4.0 4.0 4.0 4.0 4.0 4.0Vehicle Extension (s) 3.0 3.0 3.0 3.0 3.0 3.0 3.0 3.0Lane Grp Cap (vph) 329 1839 206 1582 708 305 242 285v/s Ratio Prot c0.04 c0.37 0.00 0.32v/s Ratio Perm 0.23 0.05 0.03 0.02 c0.16 0.02v/c Ratio 0.41 0.63 0.10 0.64 0.06 0.08 0.79 0.09Uniform Delay, d1 5.5 8.4 7.2 11.0 7.8 19.3 22.6 19.3Progression Factor 1.00 1.00 1.00 1.00 1.00 1.00 1.00 1.00Incremental Delay, d2 0.8 0.7 0.2 0.9 0.0 0.1 16.2 0.1Delay (s) 6.3 9.1 7.4 11.9 7.8 19.4 38.8 19.5Level of Service A A A B A B D BApproach Delay (s) 8.8 11.5 19.4 31.3Approach LOS A B B C
Intersection SummaryHCM Average Control Delay 12.5 HCM Level of Service BHCM Volume to Capacity ratio 0.63Actuated Cycle Length (s) 59.4 Sum of lost time (s) 8.0Intersection Capacity Utilization 63.8% ICU Level of Service BAnalysis Period (min) 15c Critical Lane Group
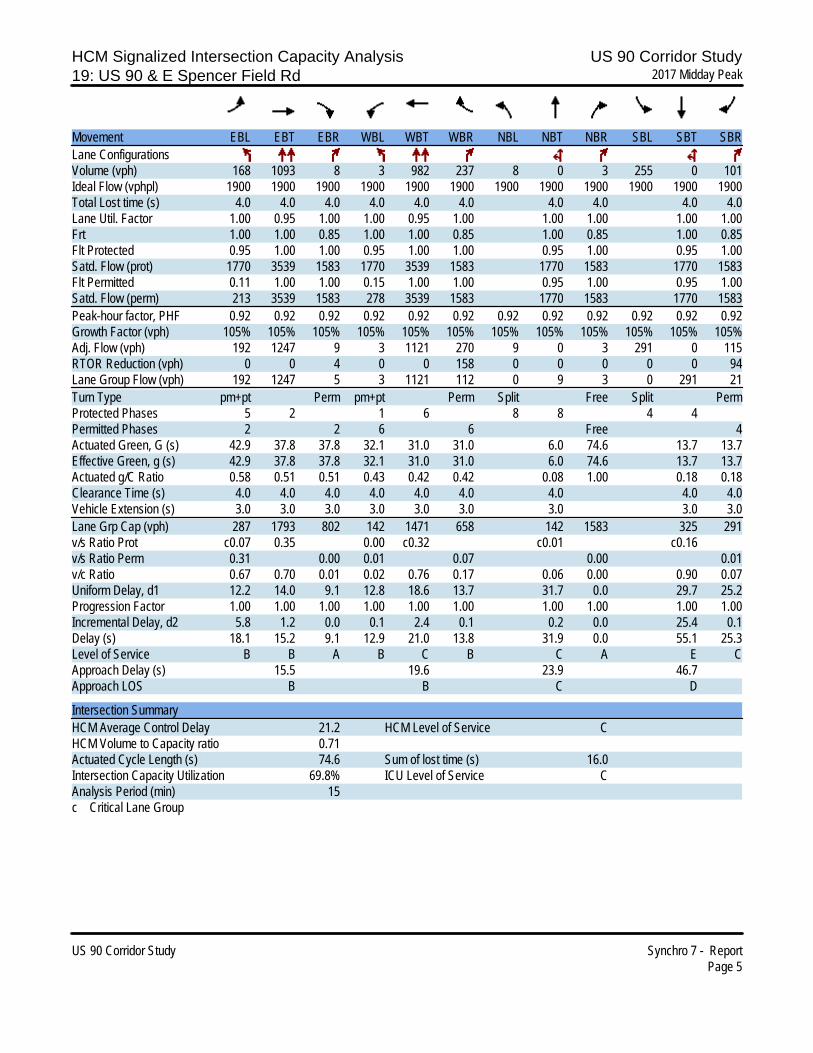
HCM Signalized Intersection Capacity Analysis US 90 Corridor Study19: US 90 & E Spencer Field Rd 2017 Midday Peak
US 90 Corridor Study Synchro 7 - ReportPage 5
Movement EBL EBT EBR WBL WBT WBR NBL NBT NBR SBL SBT SBRLane ConfigurationsVolume (vph) 168 1093 8 3 982 237 8 0 3 255 0 101Ideal Flow (vphpl) 1900 1900 1900 1900 1900 1900 1900 1900 1900 1900 1900 1900Total Lost time (s) 4.0 4.0 4.0 4.0 4.0 4.0 4.0 4.0 4.0 4.0Lane Util. Factor 1.00 0.95 1.00 1.00 0.95 1.00 1.00 1.00 1.00 1.00Frt 1.00 1.00 0.85 1.00 1.00 0.85 1.00 0.85 1.00 0.85Flt Protected 0.95 1.00 1.00 0.95 1.00 1.00 0.95 1.00 0.95 1.00Satd. Flow (prot) 1770 3539 1583 1770 3539 1583 1770 1583 1770 1583Flt Permitted 0.11 1.00 1.00 0.15 1.00 1.00 0.95 1.00 0.95 1.00Satd. Flow (perm) 213 3539 1583 278 3539 1583 1770 1583 1770 1583Peak-hour factor, PHF 0.92 0.92 0.92 0.92 0.92 0.92 0.92 0.92 0.92 0.92 0.92 0.92Growth Factor (vph) 105% 105% 105% 105% 105% 105% 105% 105% 105% 105% 105% 105%Adj. Flow (vph) 192 1247 9 3 1121 270 9 0 3 291 0 115RTOR Reduction (vph) 0 0 4 0 0 158 0 0 0 0 0 94Lane Group Flow (vph) 192 1247 5 3 1121 112 0 9 3 0 291 21Turn Type pm+pt Perm pm+pt Perm Split Free Split PermProtected Phases 5 2 1 6 8 8 4 4Permitted Phases 2 2 6 6 Free 4Actuated Green, G (s) 42.9 37.8 37.8 32.1 31.0 31.0 6.0 74.6 13.7 13.7Effective Green, g (s) 42.9 37.8 37.8 32.1 31.0 31.0 6.0 74.6 13.7 13.7Actuated g/C Ratio 0.58 0.51 0.51 0.43 0.42 0.42 0.08 1.00 0.18 0.18Clearance Time (s) 4.0 4.0 4.0 4.0 4.0 4.0 4.0 4.0 4.0Vehicle Extension (s) 3.0 3.0 3.0 3.0 3.0 3.0 3.0 3.0 3.0Lane Grp Cap (vph) 287 1793 802 142 1471 658 142 1583 325 291v/s Ratio Prot c0.07 0.35 0.00 c0.32 c0.01 c0.16v/s Ratio Perm 0.31 0.00 0.01 0.07 0.00 0.01v/c Ratio 0.67 0.70 0.01 0.02 0.76 0.17 0.06 0.00 0.90 0.07Uniform Delay, d1 12.2 14.0 9.1 12.8 18.6 13.7 31.7 0.0 29.7 25.2Progression Factor 1.00 1.00 1.00 1.00 1.00 1.00 1.00 1.00 1.00 1.00Incremental Delay, d2 5.8 1.2 0.0 0.1 2.4 0.1 0.2 0.0 25.4 0.1Delay (s) 18.1 15.2 9.1 12.9 21.0 13.8 31.9 0.0 55.1 25.3Level of Service B B A B C B C A E CApproach Delay (s) 15.5 19.6 23.9 46.7Approach LOS B B C D
Intersection SummaryHCM Average Control Delay 21.2 HCM Level of Service CHCM Volume to Capacity ratio 0.71Actuated Cycle Length (s) 74.6 Sum of lost time (s) 16.0Intersection Capacity Utilization 69.8% ICU Level of Service CAnalysis Period (min) 15c Critical Lane Group

HCM Unsignalized Intersection Capacity Analysis US 90 Corridor Study21: US 90 & Santa Villa Dr 2017 Midday Peak
US 90 Corridor Study Synchro 7 - ReportPage 6
Movement EBT EBR WBL WBT NBL NBRLane ConfigurationsVolume (veh/h) 1294 53 27 1277 46 17Sign Control Free Free StopGrade 0% 0% 0%Peak Hour Factor 0.92 0.92 0.92 0.92 0.92 0.92Hourly flow rate (vph) 1477 60 31 1457 52 19PedestriansLane Width (ft)Walking Speed (ft/s)Percent BlockageRight turn flare (veh)Median type None NoneMedian storage veh)Upstream signal (ft)pX, platoon unblockedvC, conflicting volume 1537 2267 738vC1, stage 1 conf volvC2, stage 2 conf volvCu, unblocked vol 1537 2267 738tC, single (s) 4.1 6.8 6.9tC, 2 stage (s)tF (s) 2.2 3.5 3.3p0 queue free % 93 0 95cM capacity (veh/h) 428 32 360
Direction, Lane # EB 1 EB 2 EB 3 WB 1 WB 2 WB 3 NB 1 NB 2Volume Total 738 738 60 31 729 729 52 19Volume Left 0 0 0 31 0 0 52 0Volume Right 0 0 60 0 0 0 0 19cSH 1700 1700 1700 428 1700 1700 32 360Volume to Capacity 0.43 0.43 0.04 0.07 0.43 0.43 1.65 0.05Queue Length 95th (ft) 0 0 0 6 0 0 148 4Control Delay (s) 0.0 0.0 0.0 14.1 0.0 0.0 589.7 15.6Lane LOS B F CApproach Delay (s) 0.0 0.3 434.8Approach LOS F
Intersection SummaryAverage Delay 10.2Intersection Capacity Utilization 47.6% ICU Level of Service AAnalysis Period (min) 15

HCM Signalized Intersection Capacity Analysis US 90 Corridor Study23: US 90 & Driveway 2017 Midday Peak
US 90 Corridor Study Synchro 7 - ReportPage 7
Movement EBL EBT EBR WBL WBT WBR NBL NBT NBR SBL SBT SBRLane ConfigurationsVolume (vph) 6 1138 122 14 1067 5 140 0 9 0 0 0Ideal Flow (vphpl) 1900 1900 1900 1900 1900 1900 1900 1900 1900 1900 1900 1900Total Lost time (s) 4.0 4.0 4.0 4.0 4.0 4.0 4.0Lane Util. Factor 1.00 0.95 1.00 0.97 0.95 0.95 0.95Frt 1.00 1.00 0.85 1.00 1.00 1.00 0.98Flt Protected 0.95 1.00 1.00 0.95 1.00 0.95 0.96Satd. Flow (prot) 1770 3539 1583 3433 3537 1681 1665Flt Permitted 0.18 1.00 1.00 0.95 1.00 0.95 0.96Satd. Flow (perm) 337 3539 1583 3433 3537 1681 1665Peak-hour factor, PHF 0.92 0.92 0.92 0.92 0.92 0.92 0.92 0.92 0.92 0.92 0.92 0.92Growth Factor (vph) 105% 105% 105% 105% 105% 105% 105% 105% 105% 105% 105% 105%Adj. Flow (vph) 7 1299 139 16 1218 6 160 0 10 0 0 0RTOR Reduction (vph) 0 0 53 0 0 0 0 8 0 0 0 0Lane Group Flow (vph) 7 1299 86 16 1224 0 86 76 0 0 0 0Turn Type pm+pt Perm Prot Split Split PermProtected Phases 5 2 1 6 8 8 4 4Permitted Phases 2 2 4Actuated Green, G (s) 31.5 30.5 30.5 1.1 30.6 5.9 5.9Effective Green, g (s) 31.5 30.5 30.5 1.1 30.6 5.9 5.9Actuated g/C Ratio 0.64 0.62 0.62 0.02 0.62 0.12 0.12Clearance Time (s) 4.0 4.0 4.0 4.0 4.0 4.0 4.0Vehicle Extension (s) 3.0 3.0 3.0 3.0 3.0 3.0 3.0Lane Grp Cap (vph) 243 2181 975 76 2187 200 198v/s Ratio Prot 0.00 c0.37 c0.00 0.35 c0.05 0.05v/s Ratio Perm 0.02 0.05v/c Ratio 0.03 0.60 0.09 0.21 0.56 0.43 0.38Uniform Delay, d1 3.7 5.8 3.9 23.8 5.5 20.2 20.1Progression Factor 1.00 1.00 1.00 1.00 1.00 1.00 1.00Incremental Delay, d2 0.0 0.4 0.0 1.4 0.3 1.5 1.2Delay (s) 3.8 6.2 3.9 25.2 5.8 21.7 21.4Level of Service A A A C A C CApproach Delay (s) 6.0 6.1 21.5 0.0Approach LOS A A C A
Intersection SummaryHCM Average Control Delay 6.9 HCM Level of Service AHCM Volume to Capacity ratio 0.56Actuated Cycle Length (s) 49.5 Sum of lost time (s) 12.0Intersection Capacity Utilization 44.1% ICU Level of Service AAnalysis Period (min) 15c Critical Lane Group

HCM Signalized Intersection Capacity Analysis US 90 Corridor Study26: US 90 & Spears St 2017 Midday Peak
US 90 Corridor Study Synchro 7 - ReportPage 8
Movement EBL EBT EBR WBL WBT WBR NBL NBT NBR SBL SBT SBRLane ConfigurationsVolume (vph) 27 1061 48 65 975 1 98 0 90 8 1 8Ideal Flow (vphpl) 1900 1900 1900 1900 1900 1900 1900 1900 1900 1900 1900 1900Total Lost time (s) 4.0 4.0 4.0 4.0 4.0 4.0 4.0 4.0 4.0Lane Util. Factor 1.00 0.95 1.00 1.00 0.95 0.95 0.95 1.00 1.00Frt 1.00 1.00 0.85 1.00 1.00 1.00 1.00 0.85 0.94Flt Protected 0.95 1.00 1.00 0.95 1.00 0.95 0.95 1.00 0.98Satd. Flow (prot) 1770 3539 1583 1770 3539 1681 1681 1583 1703Flt Permitted 0.21 1.00 1.00 0.13 1.00 0.95 0.95 1.00 0.98Satd. Flow (perm) 394 3539 1583 248 3539 1681 1681 1583 1703Peak-hour factor, PHF 0.92 0.92 0.92 0.92 0.92 0.92 0.92 0.92 0.92 0.92 0.92 0.92Growth Factor (vph) 105% 105% 105% 105% 105% 105% 105% 105% 105% 105% 105% 105%Adj. Flow (vph) 31 1211 55 74 1113 1 112 0 103 9 1 9RTOR Reduction (vph) 0 0 25 0 0 0 0 0 92 0 9 0Lane Group Flow (vph) 31 1211 30 74 1114 0 56 56 11 0 10 0Turn Type pm+pt Perm pm+pt Split Perm SplitProtected Phases 5 2 1 6 8 8 4 4Permitted Phases 2 2 6 8Actuated Green, G (s) 28.4 27.3 27.3 33.8 30.0 5.5 5.5 5.5 1.1Effective Green, g (s) 28.4 27.3 27.3 33.8 30.0 5.5 5.5 5.5 1.1Actuated g/C Ratio 0.53 0.51 0.51 0.63 0.56 0.10 0.10 0.10 0.02Clearance Time (s) 4.0 4.0 4.0 4.0 4.0 4.0 4.0 4.0 4.0Vehicle Extension (s) 3.0 3.0 3.0 3.0 3.0 3.0 3.0 3.0 3.0Lane Grp Cap (vph) 237 1799 805 264 1977 172 172 162 35v/s Ratio Prot 0.00 c0.34 c0.02 0.31 c0.03 0.03 c0.01v/s Ratio Perm 0.07 0.02 0.16 0.01v/c Ratio 0.13 0.67 0.04 0.28 0.56 0.33 0.33 0.07 0.29Uniform Delay, d1 6.3 9.9 6.6 5.8 7.6 22.4 22.4 21.8 25.9Progression Factor 1.00 1.00 1.00 1.00 1.00 1.00 1.00 1.00 1.00Incremental Delay, d2 0.3 1.0 0.0 0.6 0.4 1.1 1.1 0.2 4.6Delay (s) 6.5 10.9 6.6 6.4 8.0 23.5 23.5 21.9 30.5Level of Service A B A A A C C C CApproach Delay (s) 10.6 7.9 22.7 30.5Approach LOS B A C C
Intersection SummaryHCM Average Control Delay 10.5 HCM Level of Service BHCM Volume to Capacity ratio 0.64Actuated Cycle Length (s) 53.7 Sum of lost time (s) 20.0Intersection Capacity Utilization 52.3% ICU Level of Service AAnalysis Period (min) 15c Critical Lane Group

HCM Signalized Intersection Capacity Analysis US 90 Corridor Study29: US 90 & Cardinal St 2017 Midday Peak
US 90 Corridor Study Synchro 7 - ReportPage 9
Movement EBL EBT EBR WBL WBT WBR NBL NBT NBR SBL SBT SBRLane ConfigurationsVolume (vph) 41 1083 115 111 885 24 143 3 23 32 9 6Ideal Flow (vphpl) 1900 1900 1900 1900 1900 1900 1900 1900 1900 1900 1900 1900Total Lost time (s) 4.0 4.0 4.0 4.0 4.0 4.0 4.0 4.0Lane Util. Factor 1.00 0.95 1.00 0.97 0.95 1.00 1.00 1.00Frt 1.00 1.00 0.85 1.00 1.00 1.00 0.85 0.98Flt Protected 0.95 1.00 1.00 0.95 1.00 0.95 1.00 0.97Satd. Flow (prot) 1770 3539 1583 3433 3525 1776 1583 1770Flt Permitted 0.95 1.00 1.00 0.95 1.00 0.95 1.00 0.97Satd. Flow (perm) 1770 3539 1583 3433 3525 1776 1583 1770Peak-hour factor, PHF 0.92 0.92 0.92 0.92 0.92 0.92 0.92 0.92 0.92 0.92 0.92 0.92Growth Factor (vph) 105% 105% 105% 105% 105% 105% 105% 105% 105% 105% 105% 105%Adj. Flow (vph) 47 1236 131 127 1010 27 163 3 26 37 10 7RTOR Reduction (vph) 0 0 75 0 3 0 0 0 23 0 7 0Lane Group Flow (vph) 47 1236 56 127 1034 0 0 166 3 0 47 0Turn Type Prot Perm Prot Split Perm SplitProtected Phases 5 2 1 6 8 8 4 4Permitted Phases 2 8Actuated Green, G (s) 2.9 25.2 25.2 5.9 28.2 7.8 7.8 4.2Effective Green, g (s) 2.9 25.2 25.2 5.9 28.2 7.8 7.8 4.2Actuated g/C Ratio 0.05 0.43 0.43 0.10 0.48 0.13 0.13 0.07Clearance Time (s) 4.0 4.0 4.0 4.0 4.0 4.0 4.0 4.0Vehicle Extension (s) 3.0 3.0 3.0 3.0 3.0 3.0 3.0 3.0Lane Grp Cap (vph) 87 1509 675 343 1682 234 209 126v/s Ratio Prot 0.03 c0.35 c0.04 c0.29 c0.09 c0.03v/s Ratio Perm 0.04 0.00v/c Ratio 0.54 0.82 0.08 0.37 0.61 0.71 0.02 0.38Uniform Delay, d1 27.4 14.9 10.1 24.9 11.4 24.6 22.3 26.2Progression Factor 1.00 1.00 1.00 1.00 1.00 1.00 1.00 1.00Incremental Delay, d2 6.7 3.6 0.1 0.7 0.7 9.5 0.0 1.9Delay (s) 34.1 18.5 10.1 25.5 12.1 34.0 22.3 28.1Level of Service C B B C B C C CApproach Delay (s) 18.3 13.6 32.4 28.1Approach LOS B B C C
Intersection SummaryHCM Average Control Delay 17.5 HCM Level of Service BHCM Volume to Capacity ratio 0.76Actuated Cycle Length (s) 59.1 Sum of lost time (s) 20.0Intersection Capacity Utilization 56.0% ICU Level of Service BAnalysis Period (min) 15c Critical Lane Group

HCM Unsignalized Intersection Capacity Analysis US 90 Corridor Study32: US 90 & Keyser Ln 2017 Midday Peak
US 90 Corridor Study Synchro 7 - ReportPage 10
Movement EBL EBT EBR WBL WBT WBR NBL NBT NBR SBL SBT SBRLane ConfigurationsVolume (veh/h) 35 1021 54 160 979 9 47 0 117 7 0 8Sign Control Free Free Stop StopGrade 0% 0% 0% 0%Peak Hour Factor 0.92 0.92 0.92 0.92 0.92 0.92 0.92 0.92 0.92 0.92 0.92 0.92Hourly flow rate (vph) 40 1165 62 183 1117 10 54 0 134 8 0 9PedestriansLane Width (ft)Walking Speed (ft/s)Percent BlockageRight turn flare (veh) 8Median type None NoneMedian storage veh)Upstream signal (ft) 818 1254pX, platoon unblocked 0.95 0.72 0.75 0.75 0.72 0.75 0.75 0.95vC, conflicting volume 1128 1227 2178 2738 583 2150 2794 564vC1, stage 1 conf volvC2, stage 2 conf volvCu, unblocked vol 1031 543 1603 2353 0 1566 2429 438tC, single (s) 4.1 4.1 7.5 6.5 6.9 7.5 6.5 6.9tC, 2 stage (s)tF (s) 2.2 2.2 3.5 4.0 3.3 3.5 4.0 3.3p0 queue free % 94 75 0 100 83 78 100 98cM capacity (veh/h) 637 737 40 19 783 36 17 539
Direction, Lane # EB 1 EB 2 EB 3 EB 4 WB 1 WB 2 WB 3 NB 1 SB 1Volume Total 40 583 583 62 183 745 383 187 17Volume Left 40 0 0 0 183 0 0 54 8Volume Right 0 0 0 62 0 0 10 134 9cSH 637 1700 1700 1700 737 1700 1700 139 72Volume to Capacity 0.06 0.34 0.34 0.04 0.25 0.44 0.23 1.34 0.24Queue Length 95th (ft) 5 0 0 0 24 0 0 297 21Control Delay (s) 11.0 0.0 0.0 0.0 11.5 0.0 0.0 127.3 70.4Lane LOS B B F FApproach Delay (s) 0.3 1.6 127.3 70.4Approach LOS F F
Intersection SummaryAverage Delay 9.9Intersection Capacity Utilization 56.5% ICU Level of Service BAnalysis Period (min) 15
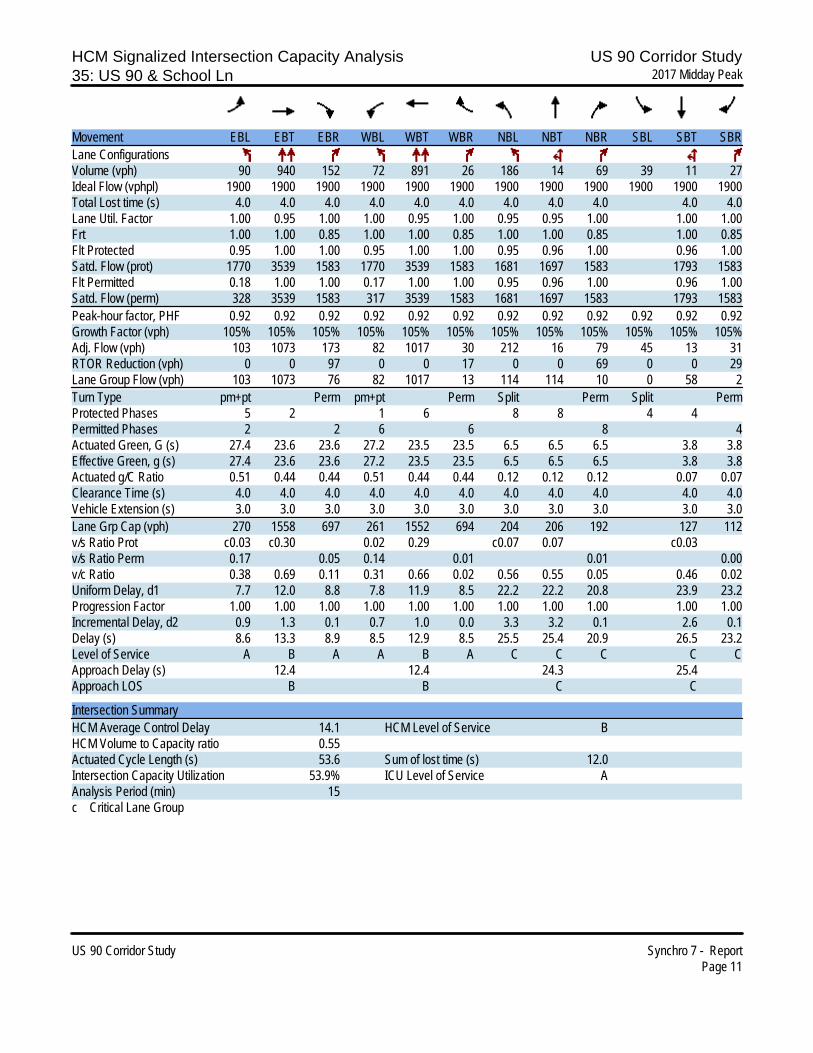
HCM Signalized Intersection Capacity Analysis US 90 Corridor Study35: US 90 & School Ln 2017 Midday Peak
US 90 Corridor Study Synchro 7 - ReportPage 11
Movement EBL EBT EBR WBL WBT WBR NBL NBT NBR SBL SBT SBRLane ConfigurationsVolume (vph) 90 940 152 72 891 26 186 14 69 39 11 27Ideal Flow (vphpl) 1900 1900 1900 1900 1900 1900 1900 1900 1900 1900 1900 1900Total Lost time (s) 4.0 4.0 4.0 4.0 4.0 4.0 4.0 4.0 4.0 4.0 4.0Lane Util. Factor 1.00 0.95 1.00 1.00 0.95 1.00 0.95 0.95 1.00 1.00 1.00Frt 1.00 1.00 0.85 1.00 1.00 0.85 1.00 1.00 0.85 1.00 0.85Flt Protected 0.95 1.00 1.00 0.95 1.00 1.00 0.95 0.96 1.00 0.96 1.00Satd. Flow (prot) 1770 3539 1583 1770 3539 1583 1681 1697 1583 1793 1583Flt Permitted 0.18 1.00 1.00 0.17 1.00 1.00 0.95 0.96 1.00 0.96 1.00Satd. Flow (perm) 328 3539 1583 317 3539 1583 1681 1697 1583 1793 1583Peak-hour factor, PHF 0.92 0.92 0.92 0.92 0.92 0.92 0.92 0.92 0.92 0.92 0.92 0.92Growth Factor (vph) 105% 105% 105% 105% 105% 105% 105% 105% 105% 105% 105% 105%Adj. Flow (vph) 103 1073 173 82 1017 30 212 16 79 45 13 31RTOR Reduction (vph) 0 0 97 0 0 17 0 0 69 0 0 29Lane Group Flow (vph) 103 1073 76 82 1017 13 114 114 10 0 58 2Turn Type pm+pt Perm pm+pt Perm Split Perm Split PermProtected Phases 5 2 1 6 8 8 4 4Permitted Phases 2 2 6 6 8 4Actuated Green, G (s) 27.4 23.6 23.6 27.2 23.5 23.5 6.5 6.5 6.5 3.8 3.8Effective Green, g (s) 27.4 23.6 23.6 27.2 23.5 23.5 6.5 6.5 6.5 3.8 3.8Actuated g/C Ratio 0.51 0.44 0.44 0.51 0.44 0.44 0.12 0.12 0.12 0.07 0.07Clearance Time (s) 4.0 4.0 4.0 4.0 4.0 4.0 4.0 4.0 4.0 4.0 4.0Vehicle Extension (s) 3.0 3.0 3.0 3.0 3.0 3.0 3.0 3.0 3.0 3.0 3.0Lane Grp Cap (vph) 270 1558 697 261 1552 694 204 206 192 127 112v/s Ratio Prot c0.03 c0.30 0.02 0.29 c0.07 0.07 c0.03v/s Ratio Perm 0.17 0.05 0.14 0.01 0.01 0.00v/c Ratio 0.38 0.69 0.11 0.31 0.66 0.02 0.56 0.55 0.05 0.46 0.02Uniform Delay, d1 7.7 12.0 8.8 7.8 11.9 8.5 22.2 22.2 20.8 23.9 23.2Progression Factor 1.00 1.00 1.00 1.00 1.00 1.00 1.00 1.00 1.00 1.00 1.00Incremental Delay, d2 0.9 1.3 0.1 0.7 1.0 0.0 3.3 3.2 0.1 2.6 0.1Delay (s) 8.6 13.3 8.9 8.5 12.9 8.5 25.5 25.4 20.9 26.5 23.2Level of Service A B A A B A C C C C CApproach Delay (s) 12.4 12.4 24.3 25.4Approach LOS B B C C
Intersection SummaryHCM Average Control Delay 14.1 HCM Level of Service BHCM Volume to Capacity ratio 0.55Actuated Cycle Length (s) 53.6 Sum of lost time (s) 12.0Intersection Capacity Utilization 53.9% ICU Level of Service AAnalysis Period (min) 15c Critical Lane Group

HCM Unsignalized Intersection Capacity Analysis US 90 Corridor Study40: US 90 & Anna Simpson Rd 2017 Midday Peak
US 90 Corridor Study Synchro 7 - ReportPage 12
Movement EBL EBT WBT WBR SBL SBRLane ConfigurationsVolume (veh/h) 11 1184 1496 2 1 6Sign Control Free Free StopGrade 0% 0% 0%Peak Hour Factor 0.92 0.92 0.92 0.92 0.92 0.92Hourly flow rate (vph) 13 1351 1707 2 1 7PedestriansLane Width (ft)Walking Speed (ft/s)Percent BlockageRight turn flare (veh)Median type None NoneMedian storage veh)Upstream signal (ft)pX, platoon unblockedvC, conflicting volume 1710 2408 854vC1, stage 1 conf volvC2, stage 2 conf volvCu, unblocked vol 1710 2408 854tC, single (s) 4.1 6.8 6.9tC, 2 stage (s)tF (s) 2.2 3.5 3.3p0 queue free % 97 96 98cM capacity (veh/h) 367 26 302
Direction, Lane # EB 1 EB 2 EB 3 WB 1 WB 2 WB 3 SB 1Volume Total 13 676 676 854 854 2 8Volume Left 13 0 0 0 0 0 1Volume Right 0 0 0 0 0 2 7cSH 367 1700 1700 1700 1700 1700 121Volume to Capacity 0.03 0.40 0.40 0.50 0.50 0.00 0.07Queue Length 95th (ft) 3 0 0 0 0 0 5Control Delay (s) 15.1 0.0 0.0 0.0 0.0 0.0 36.7Lane LOS C EApproach Delay (s) 0.1 0.0 36.7Approach LOS E
Intersection SummaryAverage Delay 0.2Intersection Capacity Utilization 53.4% ICU Level of Service AAnalysis Period (min) 15

HCM Unsignalized Intersection Capacity Analysis US 90 Corridor Study42: US 90 & Van Horn Rd 2017 Midday Peak
US 90 Corridor Study Synchro 7 - ReportPage 13
Movement EBL EBT EBR WBL WBT WBR NBL NBT NBR SBL SBT SBRLane ConfigurationsVolume (veh/h) 27 982 3 8 993 41 4 0 7 18 0 10Sign Control Free Free Stop StopGrade 0% 0% 0% 0%Peak Hour Factor 0.92 0.92 0.92 0.92 0.92 0.92 0.92 0.92 0.92 0.92 0.92 0.92Hourly flow rate (vph) 31 1121 3 9 1133 47 5 0 8 21 0 11PedestriansLane Width (ft)Walking Speed (ft/s)Percent BlockageRight turn flare (veh)Median type None NoneMedian storage veh)Upstream signal (ft)pX, platoon unblockedvC, conflicting volume 1180 1124 1779 2381 560 1805 2361 590vC1, stage 1 conf volvC2, stage 2 conf volvCu, unblocked vol 1180 1124 1779 2381 560 1805 2361 590tC, single (s) 4.1 4.1 7.5 6.5 6.9 7.5 6.5 6.9tC, 2 stage (s)tF (s) 2.2 2.2 3.5 4.0 3.3 3.5 4.0 3.3p0 queue free % 95 99 91 100 98 56 100 97cM capacity (veh/h) 588 617 48 32 471 46 33 451
Direction, Lane # EB 1 EB 2 EB 3 EB 4 WB 1 WB 2 WB 3 NB 1 SB 1Volume Total 31 560 560 3 9 756 425 13 32Volume Left 31 0 0 0 9 0 0 5 21Volume Right 0 0 0 3 0 0 47 8 11cSH 588 1700 1700 1700 617 1700 1700 112 68Volume to Capacity 0.05 0.33 0.33 0.00 0.01 0.44 0.25 0.11 0.47Queue Length 95th (ft) 4 0 0 0 1 0 0 9 47Control Delay (s) 11.5 0.0 0.0 0.0 10.9 0.0 0.0 41.1 97.6Lane LOS B B E FApproach Delay (s) 0.3 0.1 41.1 97.6Approach LOS E F
Intersection SummaryAverage Delay 1.7Intersection Capacity Utilization 40.2% ICU Level of Service AAnalysis Period (min) 15

HCM Signalized Intersection Capacity Analysis US 90 Corridor Study45: US 90 & Avalon Blvd 2017 Midday Peak
US 90 Corridor Study Synchro 7 - ReportPage 14
Movement EBL EBT EBR WBL WBT WBR NBL NBT NBR SBL SBT SBRLane ConfigurationsVolume (vph) 23 963 91 650 1134 7 98 3 308 99 22 20Ideal Flow (vphpl) 1900 1900 1900 1900 1900 1900 1900 1900 1900 1900 1900 1900Total Lost time (s) 4.0 4.0 4.0 4.0 4.0 4.0 4.0 4.0 4.0 4.0Lane Util. Factor 1.00 0.95 1.00 0.97 0.95 1.00 1.00 0.88 1.00 1.00Frt 1.00 1.00 0.85 1.00 1.00 0.85 1.00 0.85 1.00 0.85Flt Protected 0.95 1.00 1.00 0.95 1.00 1.00 0.95 1.00 0.96 1.00Satd. Flow (prot) 1770 3539 1583 3433 3539 1583 1776 2787 1789 1583Flt Permitted 0.20 1.00 1.00 0.95 1.00 1.00 0.95 1.00 0.96 1.00Satd. Flow (perm) 366 3539 1583 3433 3539 1583 1776 2787 1789 1583Peak-hour factor, PHF 0.92 0.92 0.92 0.92 0.92 0.92 0.92 0.92 0.92 0.92 0.92 0.92Growth Factor (vph) 105% 105% 105% 105% 105% 105% 105% 105% 105% 105% 105% 105%Adj. Flow (vph) 26 1099 104 742 1294 8 112 3 352 113 25 23RTOR Reduction (vph) 0 0 66 0 0 4 0 0 317 0 0 21Lane Group Flow (vph) 26 1099 38 742 1294 4 0 115 35 0 138 2Turn Type pm+pt Perm Prot Perm Split Perm Split PermProtected Phases 5 2 1 6 8 8 4 4Permitted Phases 2 2 6 8 4Actuated Green, G (s) 30.6 28.1 28.1 17.0 42.6 42.6 7.7 7.7 7.9 7.9Effective Green, g (s) 30.6 28.1 28.1 17.0 42.6 42.6 7.7 7.7 7.9 7.9Actuated g/C Ratio 0.40 0.37 0.37 0.22 0.56 0.56 0.10 0.10 0.10 0.10Clearance Time (s) 4.0 4.0 4.0 4.0 4.0 4.0 4.0 4.0 4.0 4.0Vehicle Extension (s) 3.0 3.0 3.0 3.0 3.0 3.0 3.0 3.0 3.0 3.0Lane Grp Cap (vph) 192 1297 580 761 1966 879 178 280 184 163v/s Ratio Prot 0.00 c0.31 c0.22 0.37 c0.06 c0.08v/s Ratio Perm 0.05 0.02 0.00 0.01 0.00v/c Ratio 0.14 0.85 0.07 0.98 0.66 0.01 0.65 0.13 0.75 0.01Uniform Delay, d1 14.1 22.3 15.8 29.6 11.9 7.6 33.2 31.4 33.4 30.9Progression Factor 1.00 1.00 1.00 1.00 1.00 1.00 1.00 1.00 1.00 1.00Incremental Delay, d2 0.3 5.3 0.0 26.3 0.8 0.0 7.8 0.2 15.7 0.0Delay (s) 14.4 27.6 15.8 56.0 12.8 7.6 41.0 31.6 49.1 30.9Level of Service B C B E B A D C D CApproach Delay (s) 26.4 28.4 33.9 46.5Approach LOS C C C D
Intersection SummaryHCM Average Control Delay 29.2 HCM Level of Service CHCM Volume to Capacity ratio 0.84Actuated Cycle Length (s) 76.7 Sum of lost time (s) 16.0Intersection Capacity Utilization 71.1% ICU Level of Service CAnalysis Period (min) 15c Critical Lane Group

HCM Signalized Intersection Capacity Analysis US 90 Corridor Study49: US 90 & Driveway 2017 Midday Peak
US 90 Corridor Study Synchro 7 - ReportPage 15
Movement EBL EBT WBT WBR SBL SBRLane ConfigurationsVolume (vph) 0 0 0 0 0 0Ideal Flow (vphpl) 1900 1900 1900 1900 1900 1900Total Lost time (s)Lane Util. FactorFrtFlt ProtectedSatd. Flow (prot)Flt PermittedSatd. Flow (perm)Peak-hour factor, PHF 0.92 0.92 0.92 0.92 0.92 0.92Growth Factor (vph) 105% 105% 105% 105% 105% 105%Adj. Flow (vph) 0 0 0 0 0 0RTOR Reduction (vph) 0 0 0 0 0 0Lane Group Flow (vph) 0 0 0 0 0 0Turn Type pm+pt Perm PermProtected Phases 5 2 6 4Permitted Phases 2 6 4Actuated Green, G (s)Effective Green, g (s)Actuated g/C RatioClearance Time (s)Vehicle Extension (s)Lane Grp Cap (vph)v/s Ratio Protv/s Ratio Permv/c RatioUniform Delay, d1Progression FactorIncremental Delay, d2Delay (s)Level of ServiceApproach Delay (s) 0.0 0.0 0.0Approach LOS A A A
Intersection SummaryHCM Average Control Delay 0.0 HCM Level of Service AHCM Volume to Capacity ratio 0.00Actuated Cycle Length (s) 24.5 Sum of lost time (s) 0.0Intersection Capacity Utilization 0.0% ICU Level of Service AAnalysis Period (min) 15c Critical Lane Group

HCM Signalized Intersection Capacity Analysis US 90 Corridor Study52: US 90 & Jaimee Lee Dr 2017 Midday Peak
US 90 Corridor Study Synchro 7 - ReportPage 16
Movement EBL EBT EBR WBL WBT WBR NBL NBT NBR SBL SBT SBRLane ConfigurationsVolume (vph) 5 1217 67 193 1116 12 145 0 148 7 1 11Ideal Flow (vphpl) 1900 1900 1900 1900 1900 1900 1900 1900 1900 1900 1900 1900Total Lost time (s) 4.0 4.0 4.0 4.0 4.0 4.0 4.0 4.0 4.0Lane Util. Factor 1.00 0.95 1.00 1.00 0.95 1.00 1.00 1.00 1.00Frt 1.00 1.00 0.85 1.00 1.00 0.85 1.00 0.85 0.92Flt Protected 0.95 1.00 1.00 0.95 1.00 1.00 0.95 1.00 0.98Satd. Flow (prot) 1770 3539 1583 1770 3539 1583 1770 1583 1687Flt Permitted 0.20 1.00 1.00 0.11 1.00 1.00 0.74 1.00 0.87Satd. Flow (perm) 379 3539 1583 203 3539 1583 1385 1583 1494Peak-hour factor, PHF 0.92 0.92 0.92 0.92 0.92 0.92 0.92 0.92 0.92 0.92 0.92 0.92Growth Factor (vph) 104% 104% 104% 104% 104% 104% 104% 104% 104% 104% 104% 104%Adj. Flow (vph) 6 1376 76 218 1262 14 164 0 167 8 1 12RTOR Reduction (vph) 0 0 35 0 0 5 0 0 143 0 10 0Lane Group Flow (vph) 6 1376 41 218 1262 9 0 164 24 0 11 0Turn Type pm+pt Perm pm+pt Perm Perm Perm PermProtected Phases 5 2 1 6 8 4Permitted Phases 2 2 6 6 8 8 4Actuated Green, G (s) 33.8 32.7 32.7 44.1 39.0 39.0 8.8 8.8 8.8Effective Green, g (s) 33.8 32.7 32.7 44.1 39.0 39.0 8.8 8.8 8.8Actuated g/C Ratio 0.56 0.54 0.54 0.72 0.64 0.64 0.14 0.14 0.14Clearance Time (s) 4.0 4.0 4.0 4.0 4.0 4.0 4.0 4.0 4.0Vehicle Extension (s) 3.0 3.0 3.0 3.0 3.0 3.0 3.0 3.0 3.0Lane Grp Cap (vph) 235 1900 850 337 2266 1014 200 229 216v/s Ratio Prot 0.00 c0.39 c0.08 0.36v/s Ratio Perm 0.01 0.03 0.39 0.01 c0.12 0.02 0.01v/c Ratio 0.03 0.72 0.05 0.65 0.56 0.01 0.82 0.11 0.05Uniform Delay, d1 6.1 10.7 6.7 9.5 6.1 4.0 25.3 22.6 22.4Progression Factor 1.00 1.00 1.00 1.00 1.00 1.00 1.00 1.00 1.00Incremental Delay, d2 0.0 1.4 0.0 4.2 0.3 0.0 22.4 0.2 0.1Delay (s) 6.1 12.1 6.7 13.8 6.4 4.0 47.6 22.8 22.5Level of Service A B A B A A D C CApproach Delay (s) 11.8 7.5 35.1 22.5Approach LOS B A D C
Intersection SummaryHCM Average Control Delay 12.2 HCM Level of Service BHCM Volume to Capacity ratio 0.73Actuated Cycle Length (s) 60.9 Sum of lost time (s) 12.0Intersection Capacity Utilization 71.1% ICU Level of Service CAnalysis Period (min) 15c Critical Lane Group

HCM Signalized Intersection Capacity Analysis US 90 Corridor Study55: US 90 & Glover Ln 2017 Midday Peak
US 90 Corridor Study Synchro 7 - ReportPage 17
Movement EBL EBT EBR WBL WBT WBR NBL NBT NBR SBL SBT SBRLane ConfigurationsVolume (vph) 229 1255 11 5 1130 60 13 0 3 76 0 245Ideal Flow (vphpl) 1900 1900 1900 1900 1900 1900 1900 1900 1900 1900 1900 1900Total Lost time (s) 4.0 4.0 4.0 4.0 4.0 4.0 4.0Lane Util. Factor 1.00 0.95 0.95 1.00 1.00 1.00 1.00Frt 1.00 1.00 1.00 0.85 0.98 1.00 0.85Flt Protected 0.95 1.00 1.00 1.00 0.96 0.95 1.00Satd. Flow (prot) 1770 3535 3538 1583 1748 1770 1583Flt Permitted 0.12 1.00 0.95 1.00 0.96 0.93 1.00Satd. Flow (perm) 227 3535 3357 1583 1748 1733 1583Peak-hour factor, PHF 0.92 0.92 0.92 0.92 0.92 0.92 0.92 0.92 0.92 0.92 0.92 0.92Growth Factor (vph) 104% 104% 104% 104% 104% 104% 104% 104% 104% 104% 104% 104%Adj. Flow (vph) 259 1419 12 6 1277 68 15 0 3 86 0 277RTOR Reduction (vph) 0 1 0 0 0 31 0 3 0 0 0 0Lane Group Flow (vph) 259 1430 0 0 1283 37 0 15 0 86 0 277Turn Type pm+pt Perm Perm Perm custom FreeProtected Phases 5 2 6 8Permitted Phases 2 6 6 8 4 FreeActuated Green, G (s) 43.7 43.7 30.8 30.8 4.3 4.3 56.0Effective Green, g (s) 43.7 43.7 30.8 30.8 4.3 4.3 56.0Actuated g/C Ratio 0.78 0.78 0.55 0.55 0.08 0.08 1.00Clearance Time (s) 4.0 4.0 4.0 4.0 4.0 4.0Vehicle Extension (s) 3.0 3.0 3.0 3.0 3.0 3.0Lane Grp Cap (vph) 422 2759 1846 871 134 133 1583v/s Ratio Prot c0.10 0.40v/s Ratio Perm 0.38 c0.38 0.02 0.01 c0.05 0.17v/c Ratio 0.61 0.52 0.70 0.04 0.11 0.65 0.17Uniform Delay, d1 8.2 2.3 9.2 5.8 24.1 25.1 0.0Progression Factor 1.00 1.00 1.00 1.00 1.00 1.00 1.00Incremental Delay, d2 2.6 0.2 1.2 0.0 0.4 10.3 0.2Delay (s) 10.8 2.4 10.3 5.8 24.5 35.4 0.2Level of Service B A B A C D AApproach Delay (s) 3.7 10.1 24.5 8.6Approach LOS A B C A
Intersection SummaryHCM Average Control Delay 6.9 HCM Level of Service AHCM Volume to Capacity ratio 0.68Actuated Cycle Length (s) 56.0 Sum of lost time (s) 12.0Intersection Capacity Utilization 86.7% ICU Level of Service EAnalysis Period (min) 15c Critical Lane Group

HCM Signalized Intersection Capacity Analysis US 90 Corridor Study60: US 90 & Dogwood Dr 2017 Midday Peak
US 90 Corridor Study Synchro 7 - ReportPage 18
Movement EBL EBT EBR WBL WBT WBR NBL NBT NBR SBL SBT SBRLane ConfigurationsVolume (vph) 444 917 11 67 740 185 16 23 29 116 58 188Ideal Flow (vphpl) 1900 1900 1900 1900 1900 1900 1900 1900 1900 1900 1900 1900Total Lost time (s) 4.0 4.0 4.0 4.0 4.0 4.0 4.0 4.0 4.0 4.0 4.0Lane Util. Factor 0.97 0.95 1.00 1.00 0.95 1.00 1.00 1.00 0.95 0.95 1.00Frt 1.00 1.00 0.85 1.00 1.00 0.85 1.00 0.85 1.00 1.00 0.85Flt Protected 0.95 1.00 1.00 0.95 1.00 1.00 0.98 1.00 0.95 0.98 1.00Satd. Flow (prot) 3433 3539 1583 1770 3539 1583 1825 1583 1681 1740 1583Flt Permitted 0.95 1.00 1.00 0.95 1.00 1.00 0.98 1.00 0.95 0.98 1.00Satd. Flow (perm) 3433 3539 1583 1770 3539 1583 1825 1583 1681 1740 1583Peak-hour factor, PHF 0.92 0.92 0.92 0.92 0.92 0.92 0.92 0.92 0.92 0.92 0.92 0.92Growth Factor (vph) 104% 104% 104% 104% 104% 104% 104% 104% 104% 104% 104% 104%Adj. Flow (vph) 502 1037 12 76 837 209 18 26 33 131 66 213RTOR Reduction (vph) 0 0 6 0 0 138 0 0 31 0 0 0Lane Group Flow (vph) 502 1037 6 76 837 71 0 44 2 97 100 213Turn Type Prot Perm Prot Perm Split Perm Split FreeProtected Phases 5 2 1 6 8 8 4 4Permitted Phases 2 6 8 FreeActuated Green, G (s) 11.0 25.8 25.8 4.0 18.8 18.8 3.8 3.8 5.6 5.6 55.2Effective Green, g (s) 11.0 25.8 25.8 4.0 18.8 18.8 3.8 3.8 5.6 5.6 55.2Actuated g/C Ratio 0.20 0.47 0.47 0.07 0.34 0.34 0.07 0.07 0.10 0.10 1.00Clearance Time (s) 4.0 4.0 4.0 4.0 4.0 4.0 4.0 4.0 4.0 4.0Vehicle Extension (s) 3.0 3.0 3.0 3.0 3.0 3.0 3.0 3.0 3.0 3.0Lane Grp Cap (vph) 684 1654 740 128 1205 539 126 109 171 177 1583v/s Ratio Prot c0.15 c0.29 0.04 0.24 c0.02 c0.06 0.06v/s Ratio Perm 0.00 0.04 0.00 0.13v/c Ratio 0.73 0.63 0.01 0.59 0.69 0.13 0.35 0.02 0.57 0.56 0.13Uniform Delay, d1 20.7 11.1 7.9 24.8 15.7 12.6 24.5 24.0 23.6 23.6 0.0Progression Factor 1.00 1.00 1.00 1.00 1.00 1.00 1.00 1.00 1.00 1.00 1.00Incremental Delay, d2 4.1 0.8 0.0 7.2 1.8 0.1 1.7 0.1 4.3 4.1 0.2Delay (s) 24.8 11.8 7.9 32.0 17.5 12.7 26.2 24.0 27.9 27.7 0.2Level of Service C B A C B B C C C C AApproach Delay (s) 16.0 17.6 25.3 13.5Approach LOS B B C B
Intersection SummaryHCM Average Control Delay 16.5 HCM Level of Service BHCM Volume to Capacity ratio 0.60Actuated Cycle Length (s) 55.2 Sum of lost time (s) 12.0Intersection Capacity Utilization 56.0% ICU Level of Service BAnalysis Period (min) 15c Critical Lane Group

HCM Unsignalized Intersection Capacity Analysis US 90 Corridor Study65: US 90 & Chavers St 2017 Midday Peak
US 90 Corridor Study Synchro 7 - ReportPage 19
Movement EBL EBT EBR WBL WBT WBR NBL NBT NBR SBL SBT SBRLane ConfigurationsVolume (veh/h) 64 922 0 10 864 13 0 0 0 8 0 35Sign Control Free Free Stop StopGrade 0% 0% 0% 0%Peak Hour Factor 0.92 0.92 0.92 0.92 0.92 0.92 0.92 0.92 0.92 0.92 0.92 0.92Hourly flow rate (vph) 72 1042 0 11 977 15 0 0 0 9 0 40PedestriansLane Width (ft)Walking Speed (ft/s)Percent BlockageRight turn flare (veh)Median type Raised RaisedMedian storage veh) 1 1Upstream signal (ft)pX, platoon unblockedvC, conflicting volume 991 1042 1737 2201 521 1672 2194 496vC1, stage 1 conf vol 1187 1187 1007 1007vC2, stage 2 conf vol 551 1014 666 1187vCu, unblocked vol 991 1042 1737 2201 521 1672 2194 496tC, single (s) 4.1 4.1 7.5 6.5 6.9 7.5 6.5 6.9tC, 2 stage (s) 6.5 5.5 6.5 5.5tF (s) 2.2 2.2 3.5 4.0 3.3 3.5 4.0 3.3p0 queue free % 90 98 100 100 100 94 100 92cM capacity (veh/h) 693 663 128 125 500 161 136 520
Direction, Lane # EB 1 EB 2 WB 1 WB 2 NB 1 SB 1Volume Total 420 695 500 503 0 49Volume Left 72 0 11 0 0 9Volume Right 0 0 0 15 0 40cSH 693 1700 663 1700 1700 367Volume to Capacity 0.10 0.41 0.02 0.30 0.00 0.13Queue Length 95th (ft) 9 0 1 0 0 11Control Delay (s) 3.0 0.0 0.5 0.0 0.0 16.3Lane LOS A A A CApproach Delay (s) 1.1 0.2 0.0 16.3Approach LOS A C
Intersection SummaryAverage Delay 1.1Intersection Capacity Utilization 67.3% ICU Level of Service CAnalysis Period (min) 15

HCM Signalized Intersection Capacity Analysis US 90 Corridor Study69: US 90 & Stewart St 2017 Midday Peak
US 90 Corridor Study Synchro 7 - ReportPage 20
Movement EBL EBT WBT WBR SBL SBRLane ConfigurationsVolume (vph) 561 561 402 187 193 330Ideal Flow (vphpl) 1900 1900 1900 1900 1900 1900Total Lost time (s) 4.0 4.0 4.0 4.0 4.0 4.0Lane Util. Factor 0.97 0.95 0.95 1.00 0.97 1.00Frt 1.00 1.00 1.00 0.85 1.00 0.85Flt Protected 0.95 1.00 1.00 1.00 0.95 1.00Satd. Flow (prot) 3433 3539 3539 1583 3433 1583Flt Permitted 0.95 1.00 1.00 1.00 0.95 1.00Satd. Flow (perm) 3433 3539 3539 1583 3433 1583Peak-hour factor, PHF 0.92 0.92 0.92 0.92 0.92 0.92Growth Factor (vph) 104% 104% 104% 104% 104% 104%Adj. Flow (vph) 634 634 454 211 218 373RTOR Reduction (vph) 0 0 0 150 0 0Lane Group Flow (vph) 634 634 454 61 218 373Turn Type Prot Perm FreeProtected Phases 5 2 6 4Permitted Phases 6 FreeActuated Green, G (s) 8.4 23.0 10.6 10.6 5.6 36.6Effective Green, g (s) 8.4 23.0 10.6 10.6 5.6 36.6Actuated g/C Ratio 0.23 0.63 0.29 0.29 0.15 1.00Clearance Time (s) 4.0 4.0 4.0 4.0 4.0Vehicle Extension (s) 3.0 3.0 3.0 3.0 3.0Lane Grp Cap (vph) 788 2224 1025 458 525 1583v/s Ratio Prot c0.18 0.18 c0.13 c0.06v/s Ratio Perm 0.04 0.24v/c Ratio 0.80 0.29 0.44 0.13 0.42 0.24Uniform Delay, d1 13.3 3.1 10.6 9.6 14.0 0.0Progression Factor 1.00 1.00 1.00 1.00 1.00 1.00Incremental Delay, d2 6.0 0.1 0.3 0.1 0.5 0.4Delay (s) 19.3 3.1 10.9 9.7 14.6 0.4Level of Service B A B A B AApproach Delay (s) 11.2 10.5 5.6Approach LOS B B A
Intersection SummaryHCM Average Control Delay 9.7 HCM Level of Service AHCM Volume to Capacity ratio 0.56Actuated Cycle Length (s) 36.6 Sum of lost time (s) 12.0Intersection Capacity Utilization 43.9% ICU Level of Service AAnalysis Period (min) 15c Critical Lane Group
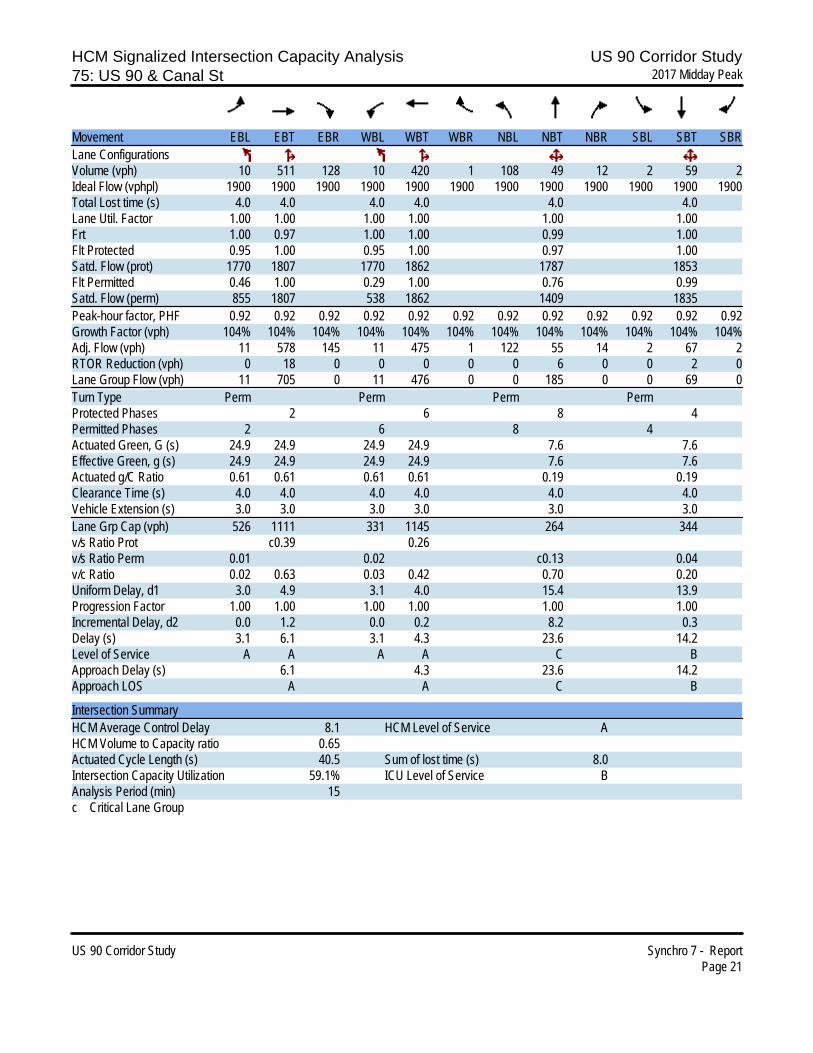
HCM Signalized Intersection Capacity Analysis US 90 Corridor Study75: US 90 & Canal St 2017 Midday Peak
US 90 Corridor Study Synchro 7 - ReportPage 21
Movement EBL EBT EBR WBL WBT WBR NBL NBT NBR SBL SBT SBRLane ConfigurationsVolume (vph) 10 511 128 10 420 1 108 49 12 2 59 2Ideal Flow (vphpl) 1900 1900 1900 1900 1900 1900 1900 1900 1900 1900 1900 1900Total Lost time (s) 4.0 4.0 4.0 4.0 4.0 4.0Lane Util. Factor 1.00 1.00 1.00 1.00 1.00 1.00Frt 1.00 0.97 1.00 1.00 0.99 1.00Flt Protected 0.95 1.00 0.95 1.00 0.97 1.00Satd. Flow (prot) 1770 1807 1770 1862 1787 1853Flt Permitted 0.46 1.00 0.29 1.00 0.76 0.99Satd. Flow (perm) 855 1807 538 1862 1409 1835Peak-hour factor, PHF 0.92 0.92 0.92 0.92 0.92 0.92 0.92 0.92 0.92 0.92 0.92 0.92Growth Factor (vph) 104% 104% 104% 104% 104% 104% 104% 104% 104% 104% 104% 104%Adj. Flow (vph) 11 578 145 11 475 1 122 55 14 2 67 2RTOR Reduction (vph) 0 18 0 0 0 0 0 6 0 0 2 0Lane Group Flow (vph) 11 705 0 11 476 0 0 185 0 0 69 0Turn Type Perm Perm Perm PermProtected Phases 2 6 8 4Permitted Phases 2 6 8 4Actuated Green, G (s) 24.9 24.9 24.9 24.9 7.6 7.6Effective Green, g (s) 24.9 24.9 24.9 24.9 7.6 7.6Actuated g/C Ratio 0.61 0.61 0.61 0.61 0.19 0.19Clearance Time (s) 4.0 4.0 4.0 4.0 4.0 4.0Vehicle Extension (s) 3.0 3.0 3.0 3.0 3.0 3.0Lane Grp Cap (vph) 526 1111 331 1145 264 344v/s Ratio Prot c0.39 0.26v/s Ratio Perm 0.01 0.02 c0.13 0.04v/c Ratio 0.02 0.63 0.03 0.42 0.70 0.20Uniform Delay, d1 3.0 4.9 3.1 4.0 15.4 13.9Progression Factor 1.00 1.00 1.00 1.00 1.00 1.00Incremental Delay, d2 0.0 1.2 0.0 0.2 8.2 0.3Delay (s) 3.1 6.1 3.1 4.3 23.6 14.2Level of Service A A A A C BApproach Delay (s) 6.1 4.3 23.6 14.2Approach LOS A A C B
Intersection SummaryHCM Average Control Delay 8.1 HCM Level of Service AHCM Volume to Capacity ratio 0.65Actuated Cycle Length (s) 40.5 Sum of lost time (s) 8.0Intersection Capacity Utilization 59.1% ICU Level of Service BAnalysis Period (min) 15c Critical Lane Group

HCM Signalized Intersection Capacity Analysis US 90 Corridor Study80: US 90 & Elmira St 2017 Midday Peak
US 90 Corridor Study Synchro 7 - ReportPage 22
Movement EBL EBT EBR WBL WBT WBR NBL NBT NBR SBL SBT SBRLane ConfigurationsVolume (vph) 4 493 31 11 435 7 12 6 12 1 4 0Ideal Flow (vphpl) 1900 1900 1900 1900 1900 1900 1900 1900 1900 1900 1900 1900Total Lost time (s) 4.0 4.0 4.0 4.0 4.0 4.0Lane Util. Factor 1.00 1.00 1.00 1.00 1.00 1.00Frt 1.00 0.99 1.00 1.00 0.95 1.00Flt Protected 0.95 1.00 0.95 1.00 0.98 0.99Satd. Flow (prot) 1770 1846 1770 1858 1728 1847Flt Permitted 0.43 1.00 0.35 1.00 0.89 0.95Satd. Flow (perm) 805 1846 651 1858 1561 1775Peak-hour factor, PHF 0.92 0.92 0.92 0.92 0.92 0.92 0.92 0.92 0.92 0.92 0.92 0.92Growth Factor (vph) 104% 104% 104% 104% 104% 104% 104% 104% 104% 104% 104% 104%Adj. Flow (vph) 5 557 35 12 492 8 14 7 14 1 5 0RTOR Reduction (vph) 0 5 0 0 1 0 0 11 0 0 0 0Lane Group Flow (vph) 5 587 0 12 499 0 0 24 0 0 6 0Turn Type Perm Perm Perm PermProtected Phases 4 8 2 6Permitted Phases 4 8 2 6Actuated Green, G (s) 13.8 13.8 13.8 13.8 6.0 6.0Effective Green, g (s) 13.8 13.8 13.8 13.8 6.0 6.0Actuated g/C Ratio 0.50 0.50 0.50 0.50 0.22 0.22Clearance Time (s) 4.0 4.0 4.0 4.0 4.0 4.0Vehicle Extension (s) 3.0 3.0 3.0 3.0 3.0 3.0Lane Grp Cap (vph) 400 916 323 922 337 383v/s Ratio Prot c0.32 0.27v/s Ratio Perm 0.01 0.02 c0.02 0.00v/c Ratio 0.01 0.64 0.04 0.54 0.07 0.02Uniform Delay, d1 3.5 5.2 3.6 4.8 8.7 8.6Progression Factor 1.00 1.00 1.00 1.00 1.00 1.00Incremental Delay, d2 0.0 1.5 0.0 0.7 0.1 0.0Delay (s) 3.6 6.7 3.6 5.5 8.8 8.6Level of Service A A A A A AApproach Delay (s) 6.7 5.4 8.8 8.6Approach LOS A A A A
Intersection SummaryHCM Average Control Delay 6.2 HCM Level of Service AHCM Volume to Capacity ratio 0.47Actuated Cycle Length (s) 27.8 Sum of lost time (s) 8.0Intersection Capacity Utilization 38.9% ICU Level of Service AAnalysis Period (min) 15c Critical Lane Group

HCM Signalized Intersection Capacity Analysis US 90 Corridor Study82: US 90 & Willing St 2017 Midday Peak
US 90 Corridor Study Synchro 7 - ReportPage 23
Movement EBL EBT EBR WBL WBT WBR NBL NBT NBR SBL SBT SBRLane ConfigurationsVolume (vph) 10 425 43 1 404 148 163 15 20 11 4 10Ideal Flow (vphpl) 1900 1900 1900 1900 1900 1900 1900 1900 1900 1900 1900 1900Total Lost time (s) 4.0 4.0 4.0 4.0 4.0Lane Util. Factor 1.00 1.00 1.00 1.00 1.00Frt 1.00 0.99 0.96 0.99 0.95Flt Protected 0.95 1.00 1.00 0.96 0.98Satd. Flow (prot) 1770 1837 1795 1764 1727Flt Permitted 0.44 1.00 1.00 0.74 0.88Satd. Flow (perm) 819 1837 1795 1368 1547Peak-hour factor, PHF 0.92 0.92 0.92 0.92 0.92 0.92 0.92 0.92 0.92 0.92 0.92 0.92Growth Factor (vph) 104% 104% 104% 104% 104% 104% 104% 104% 104% 104% 104% 104%Adj. Flow (vph) 11 480 49 1 457 167 184 17 23 12 5 11RTOR Reduction (vph) 0 9 0 0 31 0 0 11 0 0 9 0Lane Group Flow (vph) 11 520 0 0 594 0 0 213 0 0 19 0Turn Type Perm Perm Perm PermProtected Phases 2 6 8 4Permitted Phases 2 6 8 4Actuated Green, G (s) 20.5 20.5 20.5 7.4 7.4Effective Green, g (s) 20.5 20.5 20.5 7.4 7.4Actuated g/C Ratio 0.57 0.57 0.57 0.21 0.21Clearance Time (s) 4.0 4.0 4.0 4.0 4.0Vehicle Extension (s) 3.0 3.0 3.0 3.0 3.0Lane Grp Cap (vph) 468 1049 1025 282 319v/s Ratio Prot 0.28v/s Ratio Perm 0.01 0.33 c0.16 0.01v/c Ratio 0.02 0.50 0.58 0.75 0.06Uniform Delay, d1 3.3 4.6 4.9 13.4 11.5Progression Factor 1.00 1.00 1.00 1.00 1.00Incremental Delay, d2 0.0 0.4 0.8 10.9 0.1Delay (s) 3.4 5.0 5.7 24.3 11.5Level of Service A A A C BApproach Delay (s) 4.9 5.7 24.3 11.5Approach LOS A A C B
Intersection SummaryHCM Average Control Delay 8.5 HCM Level of Service AHCM Volume to Capacity ratio 0.63Actuated Cycle Length (s) 35.9 Sum of lost time (s) 8.0Intersection Capacity Utilization 57.1% ICU Level of Service BAnalysis Period (min) 15c Critical Lane Group