Embed Size (px)
Citation preview

HDFC Asset Management Company LimitedA Joint Venture with Standard Life Investments Limited
Registered Office: Ramon House, 3rd Floor, H.T. Parekh Marg, 169, Backbay Reclamation, Churchgate, Mumbai 400 020.Investor Services Centre (at Mumbai) : Mistry Bhawan, 2nd Floor, 122, Backbay Reclamation, Dinsha Vachha Road, Churchgate, Mumbai - 400 020 • Tel.: 022-6631 6300 • Toll-free number : 1800 233 6767 • Fax : 022-2282 1144 • e-mail : [email protected] • Visit us at : www.hdfcfund.com
HALF-YEARLY PORTFOLIO STATEMENT OF THE SCHEMES / PLANS OF HDFC MUTUAL FUND AS ON 31ST MARCH 2009[ Pursuant to Regulation 59A of Securities and Exchange Board of India (Mutual Funds) Regulations, 1996 ]
Page: 10 (continued....)¥ Portfolio Turnover Ratio = Lower of purchases or sales of securities during the twelve months ended March 31, 2009 / Average Net Assets during the twelve months ended March 31, 2009.
HDFC GROWTH FUND(AN OPEN-ENDED GROWTH SCHEME)
Name of the Instrument Industry Quantity Market/ % toFair Value NAV
(Rs. In Lakhs)EQUITY & EQUITY RELATED(a) Listed / awaiting listing onStock Exchanges
� State Bank of India Banks 403,000 4,300.41 5.41� Sun Pharmaceuticals Industries Ltd Pharmaceuticals 344,365 3,827.44 4.81� Bharti Airtel Limited Telecom - Services 550,346 3,443.79 4.33� ICICI Bank Ltd Banks 932,397 3,103.02 3.90� Divi’s Laboratories Limited Pharmaceuticals 318,535 3,007.93 3.78� Bharat Petroleum Corpn. Ltd Petroleum Products 726,557 2,732.22 3.43� Crompton Greaves Ltd Industrial Capital Goods 2,189,819 2,704.43 3.39� ITC Ltd. Consumer Non Durables 1,462,305 2,703.07 3.39� Housing Development
Finance Corporation Ltd.$ Finance 182,500 2,577.27 3.24� Dr. Reddy’s Laboratories Ltd. Pharmaceuticals 520,000 2,549.04 3.20
Nestle India Ltd. Consumer Non Durables 160,268 2,494.41 3.13Zee Entertainment Enterprises Ltd Media & Entertainment 2,310,179 2,456.88 3.08Reliance Industries Ltd. Petroleum Products 154,250 2,351.93 2.95Exide Industries Ltd. Auto Ancillaries 5,319,910 2,199.78 2.76Dabur India Ltd Consumer Non Durables 2,050,115 2,033.71 2.55Biocon Limited Pharmaceuticals 1,319,006 1,888.16 2.37Hindustan Petroleum Corporation Ltd. Petroleum Products 633,721 1,706.29 2.14Tata Steel Limited Ferrous Metals 825,000 1,698.68 2.13Infosys Technologies Ltd. Software 120,000 1,588.68 1.99Solar Explosives Limited Chemicals 713,510 1,513.00 1.90Bank of Baroda Banks 619,151 1,450.98 1.82MphasiS Limited Software 700,000 1,422.75 1.79HT Media Limited Media & Entertainment 2,307,000 1,350.75 1.70The Great Eastern Shipping Co. Limited Transportation 673,500 1,277.97 1.60Apollo Tyres Ltd Auto Ancillaries 5,367,120 979.50 1.23Hindustan Unilever Limited Diversified 403,355 957.97 1.20Axis Bank Limited Banks 220,000 912.89 1.15Oil & Natural Gas Corpn Ltd Oil 111,353 868.78 1.09Noida Toll Bridge Company Ltd Transportation 3,607,000 858.47 1.08Coromandel Fertilisers Ltd. Fertilisers 930,000 842.58 1.06Thermax Ltd Industrial Capital Goods 367,366 663.65 0.83Ballarpur Industries Limited Paper 3,967,287 583.19 0.73Indo Rama Synthetics (India) Limited Textiles - Synthetic 2,417,482 494.38 0.62Nagarjuna Construction Co. Ltd Construction Project 711,738 439.85 0.55C & C Constructions Limited Construction 381,996 381.81 0.48Eimco Elecon (India) Ltd. Industrial Capital Goods 276,428 369.72 0.46Amara Raja Batteries Ltd Auto Ancillaries 836,454 306.56 0.38KNR Constructions Limited Construction 710,597 271.45 0.34Maytas Infra Limited Construction 761,912 264.76 0.33ISMT Limited Ferrous Metals 1,175,668 233.96 0.29Disa India Ltd Engineering 12,612 207.69 0.26Ahmednagar Forgings Ltd Industrial Products 424,234 142.12 0.18Technocraft Industries (India) Limited Ferrous Metals 530,345 109.25 0.14Subtotal 66,271.17 83.19(b) Unlisted Nil NilTotal 66,271.17 83.19DEBT INSTRUMENTS(a) Listed / awaiting listing onStock ExchangesGovernment Securities Nil NilNon-Convertible debentures / Bonds Nil Nil(b) Privately Placed / UnlistedNon-Convertible debentures / Bonds Nil Nil(c) Securitized Debt Instruments Nil NilTotal Nil NilMONEY MARKET INSTRUMENTSBills Rediscounting Nil NilCommercial Papers (CP) /Certificate of Deposit (CD) Nil NilTreasury bills Nil NilCollateralised Borrowing &Lending Obligation 10,277.62 12.90Subtotal 10,277.62 12.90Fixed DepositsDeposits (Placed as Margin,maturity not exceeding 301 days)Jammu & Kashmir Bank Ltd. 1,000.00 1.26Subtotal 1,000.00 1.26Total 11,277.62 14.16OTHERSNet Current Assets 2,111.12 2.65Grand Total 79,659.91 100.00
Notes:1) Total NPAs provided for and its percentage to NAV : Nil 2) Total value and percentage of Illiquid Equity
Shares : Nil3) NAVs at a Glance March 31, 2009 September 30, 2008
NAV per Unit (Rs.) Growth Plan 38.730 54.537Dividend Plan 16.682 26.858
4) For details on dividend declared during the half-year ended March 31, 2009, please refer to Dividend History Table.5) Total outstanding exposure in Derivative Instruments: Rs. 4,221.35 Lacs6) Total investments in Foreign Securities / Overseas ETFs: Nil7) Portfolio Turnover Ratio¥ : 75.30%8) Investments in Fixed Deposits : Rs.1,000 Lacs(�) Top Ten Holdings, (+) Industry Classification as recommended by AMFI ($) Sponsor.
HDFC EQUITY FUND(AN OPEN-ENDED GROWTH SCHEME)
Name of the Instrument Industry Quantity Market/ % toFair Value NAV
(Rs. In Lakhs)EQUITY & EQUITY RELATED(a) Listed / awaiting listing onStock Exchanges
� State Bank of India Banks 1,350,000 14,405.85 5.82� Reliance Industries Ltd. Petroleum Products 697,923 10,641.58 4.29� Bank of Baroda Banks 4,525,000 10,604.34 4.28� Hero Honda Motors Ltd. Auto 956,989 10,250.79 4.15� Britannia Industries Ltd Consumer Non Durables 688,505 9,639.41 3.90� Crompton Greaves Ltd Industrial Capital Goods 7,578,565 9,359.53 3.79� Rural Electrification Corporation Ltd. Finance 9,700,000 9,321.70 3.77� Sun Pharmaceuticals Industries Ltd Pharmaceuticals 768,877 8,545.68 3.46� United Phosphorous Limited Pesticides 8,150,184 8,007.56 3.24� Oil & Natural Gas Corpn Ltd Oil 1,000,000 7,802.00 3.16
Biocon Limited Pharmaceuticals 4,875,000 6,978.56 2.82Titan Industries Ltd. Consumer Non Durables 876,667 6,853.34 2.77Divi’s Laboratories Limited Pharmaceuticals 724,000 6,836.73 2.77Infosys Technologies Ltd. Software 510,000 6,751.89 2.73ICICI Bank Ltd Banks 2,025,000 6,739.20 2.73GlaxoSmithKline ConsumerHealthcare Limited Consumer Non Durables 945,619 6,659.99 2.69Axis Bank Limited Banks 1,500,000 6,224.25 2.52Dr. Reddy’s Laboratories Ltd. Pharmaceuticals 1,227,000 6,014.75 2.43LIC Housing Finance Ltd Finance 2,450,000 5,497.80 2.22Tata Consultancy Services Limited Software 1,000,000 5,385.50 2.18Bharat Petroleum Corpn. Ltd Petroleum Products 1,320,000 4,963.86 2.01Motherson Sumi Systems Ltd. Auto Ancillaries 6,900,000 4,671.30 1.89AIA Engineering Limited Industrial Capital Goods 3,356,195 4,193.57 1.70HT Media Limited Media & Entertainment 6,777,825 3,968.42 1.61Zee News Limited Media & Entertainment 11,197,358 3,667.13 1.48Housing Development FinanceCorporation Ltd.$ Finance 250,000 3,530.50 1.43Zee Entertainment Enterprises Ltd Media & Entertainment 3,200,900 3,404.16 1.38CMC Ltd Hardware 1,000,000 3,199.50 1.29Jagran Prakashan Limited Media & Entertainment 5,289,670 3,012.47 1.22
Name of the Instrument Industry Quantity Market/ % toFair Value NAV
(Rs. In Lakhs)Tata Steel Limited Ferrous Metals 1,400,000 2,882.60 1.17United Spirits Limited Consumer Non Durables 425,000 2,758.04 1.12Nagarjuna Construction Co. Ltd. Construction Project 4,400,000 2,719.20 1.10Patni Computer Systems Limited Software 2,000,000 2,577.00 1.04Punjab National Bank Banks 600,000 2,468.70 1.00Nestle India Ltd. Consumer Non Durables 156,000 2,427.98 0.98Dishman Pharmaceuticals andChemicals Limited Pharmaceuticals 2,108,207 2,097.67 0.85TV Today Network Limited Media & Entertainment 2,847,069 1,864.83 0.75Jet Airways (India) Ltd. Transportation 1,100,000 1,862.85 0.75IRB Infrastructure Developers Limited Transportation 1,846,710 1,496.76 0.61Dish TV India Limited Media & Entertainment 5,411,124 1,298.67 0.53Motilal Oswal Financial Services Limited Finance 1,689,364 1,295.74 0.52Balkrishna Industries Limited Auto Ancillaries 945,640 1,284.65 0.52Himatsingka Seide Ltd Textile Products 5,206,277 1,207.86 0.49ISMT Limited Ferrous Metals 5,962,399 1,186.52 0.48Savita Chemicals Ltd Chemicals 830,063 1,012.26 0.41Indo Rama Synthetics (India) Limited Textiles - Synthetic 4,638,229 948.52 0.38The Federal Bank Ltd Banks 278,388 383.90 0.16Maruti Suzuki India Limited Auto 1,800 14.04 0.01Subtotal 228,919.15 92.60(b) UnlistedAlberg Software Ltd. £ Software Nil NilSubtotal Nil NilTotal 228,919.15 92.60DEBT INSTRUMENTS(a) Listed / awaiting listing onStock ExchangesGovernment Securities Nil NilNon-Convertible debentures / Bonds Nil Nil(b) Privately Placed / UnlistedNon-Convertible debentures / Bonds Nil Nil(c) Securitized Debt Instruments Nil NilTotal Nil NilMONEY MARKET INSTRUMENTSBills Rediscounting Nil NilCommercial Papers (CP) /Certificate of Deposit (CD) Nil NilTreasury bills Nil NilCollateralised Borrowing &Lending Obligation 3,882.48 1.57Subtotal 3,882.48 1.57Fixed DepositsDeposits(maturity not exceeding 91 days) Nil NilTotal 3,882.48 1.57OTHERSNet Current Assets 14,435.01 5.83Grand Total 247,236.64 100.00
Notes :1) Total NPAs provided for and its percentage to NAV : Nil2) Total value and percentage of Illiquid Equity Shares is as under:
Company Name Quantity Value (Rs.) %Alberg Software Ltd. £ 7,500 Nil Nil
3) NAVs at a Glance March 31, 2009 September 30, 2008NAV per Unit (in Rs.) Growth Plan 108.852 145.721
Dividend Plan 21.854 33.616
4) For details on dividend declared during the half-year ended March 31, 2009, please refer to Dividend History Table.5) Total outstanding exposure in Derivative Instruments : Rs. 4,811.42 Lacs6) Total investments in Foreign Securities / Overseas ETFs : Nil7) Portfolio Turnover Ratio¥ : 80.18%8) Investments in Fixed Deposits : Nil(�) Top Ten Holdings, (+) Industry Classification as recommended by AMFI, ($) Sponsor, (£) Illiquid Shares. Fair Valueas per procedures determined by HDFC AMC in accordance with the guidelines for valuation specified in the SEBI(Mutual Funds) Regulations, 1996, and amendments thereto, as applicable.
HDFC TOP 200 FUND(AN OPEN-ENDED GROWTH SCHEME)
Name of the Instrument Industry Quantity Market/ % to+/Rating Fair Value NAV
(Rs. In Lakhs)EQUITY & EQUITY RELATED(a) Listed / awaiting listing onStock Exchanges
� Reliance Industries Ltd. Petroleum Products 883,750 13,474.98 6.46� Infosys Technologies Ltd. Software 900,000 11,915.10 5.71� State Bank of India Banks 783,000 8,355.39 4.00� Hero Honda Motors Ltd. Auto 743,122 7,959.95 3.82� ICICI Bank Ltd Banks 2,100,000 6,988.80 3.35� Oil & Natural Gas Corpn Ltd Oil 860,000 6,709.72 3.22� Bharti Airtel Limited Telecom - Services 950,000 5,944.63 2.85� Housing Development Finance
Corporation Ltd.$ Finance 418,000 5,903.00 2.83� Bank of Baroda Banks 2,250,000 5,272.88 2.53� Sun Pharmaceuticals Industries Ltd Pharmaceuticals 447,500 4,973.74 2.38
Crompton Greaves Ltd Industrial Capital Goods 3,980,983 4,916.51 2.36Rural Electrification Corporation Ltd. Finance 5,000,000 4,805.00 2.30Hindustan Unilever Limited Diversified 1,800,000 4,275.00 2.05LIC Housing Finance Ltd Finance 1,740,000 3,904.56 1.87Tata Steel Limited Ferrous Metals 1,804,600 3,715.67 1.78Axis Bank Limited Banks 888,359 3,686.25 1.77United Spirits Limited Consumer Non Durables 559,000 3,627.63 1.74ITC Ltd. Consumer Non Durables 1,900,000 3,512.15 1.68Maruti Suzuki India Limited Auto 432,140 3,370.04 1.62Titan Industries Ltd. Consumer Non Durables 428,102 3,346.69 1.60Divi’s Laboratories Limited Pharmaceuticals 350,000 3,305.05 1.58Zee Entertainment Enterprises Ltd Media & Entertainment 3,032,000 3,224.53 1.55Punjab National Bank Banks 781,962 3,217.38 1.54Dr. Reddy’s Laboratories Ltd. Pharmaceuticals 639,875 3,136.67 1.50United Phosphorous Limited Pesticides 3,159,098 3,103.81 1.49Tata Consultancy Services Limited Software 564,550 3,040.38 1.46Bharat Petroleum Corpn. Ltd Petroleum Products 800,000 3,008.40 1.44GlaxoSmithKline ConsumerHealthcare Limited Consumer Non Durables 415,000 2,922.85 1.40Dabur India Ltd Consumer Non Durables 2,843,669 2,820.92 1.35Lupin Limited Pharmaceuticals 385,000 2,635.52 1.26Patni Computer Systems Limited Software 2,000,000 2,577.00 1.24Bharat Heavy Electricals Ltd Industrial Capital Goods 157,600 2,380.63 1.14Larsen & Toubro Limited Construction Project 350,000 2,349.90 1.13The Federal Bank Ltd Banks 1,348,888 1,860.12 0.89Sterlite Industries ( India ) Limited Non - Ferrous Metals 500,000 1,788.00 0.86Colgate Palmolive (India) Ltd Consumer Non Durables 374,298 1,763.69 0.85Jindal Steel & Power Ltd. Ferrous Metals 135,000 1,627.49 0.78Reliance Communications Limited Telecom - Services 895,422 1,565.65 0.75Cairn India Limited Oil 850,000 1,564.85 0.75Cipla Ltd. Pharmaceuticals 700,000 1,540.35 0.74Punj Lloyd Limited Construction Project 1,600,000 1,456.00 0.70Nagarjuna Construction Co. Ltd Construction Project 2,344,119 1,448.67 0.69Britannia Industries Ltd Consumer Non Durables 103,384 1,447.43 0.69Reliance Infrastructure Limited Power 275,000 1,417.76 0.68HDFC Bank Ltd. Banks 145,000 1,411.43 0.68Container Corporation of India Limited Transportation 180,451 1,297.26 0.62Wipro Ltd Software 483,204 1,188.20 0.57Nestle India Ltd. Consumer Non Durables 74,000 1,151.74 0.55Biocon Limited Pharmaceuticals 787,560 1,127.39 0.54IRB Infrastructure Developers Limited Transportation 1,346,383 1,091.24 0.52Kotak Mahindra Bank Limited Banks 385,000 1,086.47 0.52Hindustan Petroleum Corporation Ltd. Petroleum Products 400,000 1,077.00 0.52Grasim Industries Ltd. Cement 55,000 870.18 0.42GlaxoSmithKline Pharmaceuticals Limited Pharmaceuticals 69,808 762.62 0.37CMC Ltd Hardware 235,584 753.75 0.36Thermax Ltd Industrial Capital Goods 403,910 729.66 0.35
Name of the Instrument Industry Quantity Market/ % to+/Rating Fair Value NAV
(Rs. In Lakhs)
Indian Oil Corporation Ltd Petroleum Products 180,000 698.04 0.33Power Finance Corporation Limited Finance 437,147 632.11 0.30Tata Motors Limited Auto 300,000 540.90 0.26Apollo Tyres Ltd Auto Ancillaries 2,615,000 477.24 0.23Century Textiles & Industries Ltd Cement 200,000 439.90 0.21Marico Limited Consumer Non Durables 625,000 376.88 0.18Siemens Ltd Industrial Capital Goods 100,000 268.10 0.13Oracle Financial ServicesSoftware Limited Software 25,000 185.60 0.09Tata Steel Ltd. Ferrous Metals 450,000 149.18 0.07Subtotal 188,175.63 90.20(b) Unlisted Nil NilTotal 188,175.63 90.20DEBT INSTRUMENTS(a) Listed / awaiting listing onStock ExchangesGovernment Securities Nil NilNon-Convertible debentures / BondsHousing DevelopmentFinance Corporation Ltd.**$ AAA 100 1,000.69 0.48Subtotal 1,000.69 0.48(b) Privately Placed / UnlistedNon-Convertible debentures / Bonds Nil Nil(c) Securitized Debt Instruments Nil NilTotal 1,000.69 0.48MONEY MARKET INSTRUMENTSBills Rediscounting Nil NilCommercial Papers (CP) /Certificate of Deposit (CD) Nil NilTreasury bills Nil NilCollateralised Borrowing &Lending Obligation 4,151.44 1.99Subtotal 4,151.44 1.99Fixed DepositsDeposits(maturity not exceeding 91 days) Nil NilTotal 4,151.44 1.99OTHERSNet Current Assets 15,297.97 7.33Grand Total 208,625.73 100.00
Notes :1) Total NPAs provided for and its percentage to NAV : Nil 2) Total value and percentage of Illiquid Equity
Shares : Nil
3) NAVs at a Glance March 31, 2009 September 30, 2008NAV per Unit (in Rs.) Growth Plan 92.552 118.754
Dividend Plan 23.932 35.1754) For details on dividend declared during the half-year ended March 31, 2009, please refer to Dividend History Table.5) Total outstanding exposure in Derivative Instruments : Rs. 1,021.32 Lacs6) Total investments in Foreign Securities / Overseas ETFs : Nil7) Portfolio Turnover Ratio ¥ : 81.41%8) Investments in Fixed Deposits : Nil(�) Top Ten Holdings, (+) Industry Classification as recommended by AMFI, (**) Thinly Traded / Non-Traded Securities,($) Sponsor.
HDFC CAPITAL BUILDER FUND(AN OPEN-ENDED GROWTH SCHEME)
Name of the Instrument Industry Quantity Market/ % toFair Value NAV
(Rs. In Lakhs)EQUITY & EQUITY RELATED(a) Listed / awaiting listing onStock Exchanges
� Hero Honda Motors Ltd. Auto 231,705 2,481.91 7.00� State Bank of India Banks 170,000 1,814.07 5.11� ICICI Bank Ltd Banks 500,000 1,664.00 4.69� Reliance Industries Ltd. Petroleum Products 100,000 1,524.75 4.30� ITC Ltd. Consumer Non Durables 800,000 1,478.80 4.17� Dr. Reddy’s Laboratories Ltd. Pharmaceuticals 300,000 1,470.60 4.14� Britannia Industries Ltd Consumer Non Durables 99,113 1,387.63 3.91� Crompton Greaves Ltd Industrial Capital Goods 1,090,000 1,346.15 3.79� Bharti Airtel Limited Telecom - Services 200,000 1,251.50 3.53� Exide Industries Ltd. Auto Ancillaries 2,967,988 1,227.26 3.46
Bharat Petroleum Corpn. Ltd Petroleum Products 323,854 1,217.85 3.43Pidilite Industries Ltd Chemicals 1,420,000 1,202.74 3.39IPCA Laboratories Ltd. Pharmaceuticals 360,000 1,189.62 3.35Biocon Limited Pharmaceuticals 820,788 1,174.96 3.31Nestle India Ltd. Consumer Non Durables 70,000 1,089.48 3.07Tata Consultancy Services Limited Software 165,000 888.61 2.50Blue Star Limited Consumer Durables 570,672 886.82 2.50Bharat Electronics Ltd Industrial Capital Goods 100,000 884.30 2.49Axis Bank Limited Banks 200,000 829.90 2.34Container Corporation of India Limited Transportation 115,000 826.74 2.33Dabur India Ltd Consumer Non Durables 757,138 751.08 2.12Sun Pharmaceuticals Industries Ltd Pharmaceuticals 65,000 722.44 2.04Thermax Ltd Industrial Capital Goods 378,106 683.05 1.92SKF India Limited Industrial Products 408,269 610.97 1.72Wyeth Limited Pharmaceuticals 142,400 595.52 1.68United Phosphorous Limited Pesticides 600,000 589.50 1.66Procter & Gamble Hygiene andHealth Care Limited Consumer Non Durables 76,200 572.15 1.61Bharat Heavy Electricals Ltd Industrial Capital Goods 35,000 528.69 1.49Indraprastha Gas Limited Gas 400,000 437.80 1.23Zee Entertainment Enterprises Ltd Media & Entertainment 400,000 425.40 1.20Sintex Industries Ltd. Industrial Products 400,000 391.40 1.10Elecon Engineering Co Ltd Industrial Capital Goods 898,816 279.08 0.79Himatsingka Seide Ltd Textile Products 800,000 185.60 0.52Motilal Oswal FinancialServices Limited Finance 25,000 19.18 0.05Subtotal 32,629.55 91.94(b) UnlistedRenewable Energy System Ltd. £ Industrial Capital Goods 90,900 Nil NilSubtotal Nil NilTotal 32,629.55 91.94DEBT INSTRUMENTS(a) Listed / awaiting listing onStock ExchangesGovernment Securities Nil NilNon-Convertible debentures / Bonds Nil Nil(b) Privately Placed / UnlistedNon-Convertible debentures / Bonds Nil Nil(c) Securitized Debt Instruments Nil NilTotal Nil NilMONEY MARKET INSTRUMENTSBills Rediscounting Nil NilCommercial Papers (CP) /Certificate of Deposit (CD) Nil NilTreasury bills Nil NilCollateralised Borrowing &Lending Obligation 1,640.78 4.62Subtotal 1,640.78 4.62Fixed DepositsDeposits(maturity not exceeding 91 days) Nil NilTotal 1,640.78 4.62OTHERSNet Current Assets 1,220.00 3.44Grand Total 35,490.33 100.00

HDFC Asset Management Company LimitedA Joint Venture with Standard Life Investments Limited
Registered Office: Ramon House, 3rd Floor, H.T. Parekh Marg, 169, Backbay Reclamation, Churchgate, Mumbai 400 020.Investor Services Centre (at Mumbai) : Mistry Bhawan, 2nd Floor, 122, Backbay Reclamation, Dinsha Vachha Road, Churchgate, Mumbai - 400 020 • Tel.: 022-6631 6300 • Toll-free number : 1800 233 6767 • Fax : 022-2282 1144 • e-mail : [email protected] • Visit us at : www.hdfcfund.com
HALF-YEARLY PORTFOLIO STATEMENT OF THE SCHEMES / PLANS OF HDFC MUTUAL FUND AS ON 31ST MARCH 2009[ Pursuant to Regulation 59A of Securities and Exchange Board of India (Mutual Funds) Regulations, 1996 ]
Page: 11 (continued....)¥ Portfolio Turnover Ratio = Lower of purchases or sales of securities during the twelve months ended March 31, 2009 / Average Net Assets during the twelve months ended March 31, 2009.
Notes :1) Total NPAs provided for and its percentage to NAV : Nil2) Total value and percentage of Illiquid Equity Shares is as under :
Company Name Quantity Value (Rs.) %Renewable Energy Systems Ltd. £ 90,900 Nil Nil
3) NAVs at a Glance March 31, 2009 September 30, 2008NAV per Unit (in Rs.) Growth Plan 46.604 63.365
Dividend Plan 12.449 20.0074) For details on dividend declared during the half-year ended March 31, 2009, please refer to Dividend History Table.5) Total outstanding exposure in Derivative Instruments : Rs. 2,486.19 Lacs6) Total investments in Foreign Securities / Overseas ETFs : Nil7) Portfolio Turnover Ratio ¥ : 40.62%8) Investments in Fixed Deposits : Nil(•) Top Ten Holdings, (+) Industry Classification as recommended by AMFI, (£) Illiquid Shares. Fair Value as perprocedures determined by HDFC AMC in accordance with the guidelines for valuation specified in the SEBI (MutualFunds) Regulations, 1996 and amendments thereto, as applicable.
HDFC CORE & SATELLITE FUND(AN OPEN-ENDED GROWTH SCHEME)
Name of the Instrument Industry Quantity Market/ % toFair Value NAV
(Rs. In Lakhs)EQUITY & EQUITY RELATED(a) Listed / awaiting listing onStock Exchanges
� State Bank of India Banks 150,000 1,600.65 6.82� United Phosphorous Limited Pesticides 1,410,000 1,385.33 5.89� ICICI Bank Ltd Banks 410,000 1,364.48 5.80� Infosys Technologies Ltd. Software 95,000 1,257.71 5.35� Dr. Reddy’s Laboratories Ltd. Pharmaceuticals 250,000 1,225.50 5.21� Bank of Baroda Banks 485,000 1,136.60 4.83� Tata Consultancy Services Limited Software 187,500 1,009.78 4.29� Crompton Greaves Ltd. Industrial Capital Goods 800,000 988.00 4.20� United Spirits Limited Consumer Non Durables 138,000 895.55 3.81� Motherson Sumi Systems Ltd. Auto Ancillaries 1,310,821 887.43 3.77
Britannia Industries Ltd. Consumer Non Durables 63,000 882.03 3.75Maruti Suzuki India Limited Auto 100,000 779.85 3.32Zee Entertainment Enterprises Ltd Media & Entertainment 699,376 743.79 3.16Bharat Petroleum Corpn. Ltd Petroleum Products 194,000 729.54 3.10Biocon Limited Pharmaceuticals 507,140 725.97 3.09Bharti Airtel Limited Telecom - Services 112,000 700.84 2.98TV Today Network Limited Media & Entertainment 920,755 603.09 2.57Blue Star Limited Consumer Durables 338,323 525.75 2.24Tata Steel Limited Ferrous Metals 250,000 514.75 2.19KEC International Limited Power 330,000 502.76 2.14HT Media Limited Media & Entertainment 825,100 483.10 2.05Amtek Auto Ltd Auto Ancillaries 648,388 481.75 2.05HDFC Bank Ltd. Banks 45,000 438.03 1.86Hindustan Petroleum Corporation Ltd. Petroleum Products 162,579 437.74 1.86Dishman Pharmaceuticals andChemicals Limited Pharmaceuticals 438,964 436.77 1.86Dish TV India Limited Media & Entertainment 1,491,000 357.84 1.52Pidilite Industries Ltd Chemicals 373,000 315.93 1.34Esab India Ltd Industrial Products 100,607 310.98 1.32Sundram Fasteners Ltd Auto Ancillaries 1,940,000 288.09 1.23Sadbhav Engineering Limited Construction 83,424 265.50 1.13Zee News Limited Media & Entertainment 782,830 256.38 1.09Patni Computer Systems Limited Software 187,500 241.59 1.03Ahmednagar Forgings Ltd Industrial Products 503,900 168.81 0.72Subtotal 22,941.91 97.57(b) Unlisted Nil NilTotal 22,941.91 97.57DEBT INSTRUMENTS(a) Listed / awaiting listing onStock ExchangesGovernment Securities Nil NilNon-Convertible debentures / Bonds Nil Nil(b) Privately Placed / UnlistedNon-Convertible debentures / Bonds Nil Nil(c) Securitized Debt Instruments Nil NilTotal Nil NilMONEY MARKET INSTRUMENTSBills Rediscounting Nil NilCommercial Papers (CP) /Certificate of Deposit (CD) Nil NilTreasury bills Nil NilCollateralised Borrowing &Lending Obligation 464.94 1.98Subtotal 464.94 1.98Fixed DepositsDeposits Nil Nil(maturity not exceeding 91 days)Total 464.94 1.98OTHERSNet Current Assets 105.32 0.45Grand Total 23,512.17 100.00
Notes :1) Total NPAs provided for and its percentage to NAV : Nil2) Total value and percentage of Illiquid Equity Shares : Nil
3) NAVs at a Glance March 31, 2009 September 30, 2008NAV per Unit (in Rs.) Growth Option 15.915 22.656
Dividend Option 10.959 15.6014) Total outstanding exposure in Derivative Instruments : Nil 6) Portfolio Turnover Ratio ¥ : 75.60%5) Total investments in Foreign Securities / Overseas ETFs : Nil 7) Investments in Fixed Deposits : Nil(�) Top Ten Holdings, (+) Industry Classification as recommended by AMFI.
HDFC PREMIER MULTI-CAP FUND(AN OPEN-ENDED GROWTH SCHEME)
Name of the Instrument Industry Quantity Market/ % toFair Value NAV
(Rs. In Lakhs)EQUITY & EQUITY RELATED(a) Listed / awaiting listing onStock Exchanges
� State Bank of India Banks 180,000 1920.78 6.67� ICICI Bank Ltd Banks 500,000 1664 5.77� Dr. Reddy’s Laboratories Ltd. Pharmaceuticals 300,000 1470.6 5.11� Crompton Greaves Ltd Industrial Capital Goods 1,188,000 1467.18 5.09� United Phosphorous Limited Pesticides 1,450,000 1424.63 4.94� Container Corporation of India Limited Transportation 194,218 1396.23 4.84� Bharat Petroleum Corpn. Ltd Petroleum Products 330,000 1240.97 4.31� Hindustan Petroleum Corporation Ltd. Petroleum Products 400,000 1077 3.74� AIA Engineering Limited Industrial Capital Goods 795,770 994.31 3.45� Aventis Pharma Limited Pharmaceuticals 100,000 982.4 3.41
United Spirits Limited Consumer Non Durables 150,000 973.43 3.38Bharat Heavy Electricals Ltd Industrial Capital Goods 60,000 906.33 3.14Bank of Baroda Banks 350,000 820.23 2.85KEC International Limited Power 483,756 737 2.56Amtek Auto Ltd Auto Ancillaries 955,000 709.57 2.46HT Media Limited Media & Entertainment 1,210,672 708.85 2.46Zee News Limited Media & Entertainment 2,114,578 692.52 2.40Jagran Prakashan Limited Media & Entertainment 1,165,000 663.47 2.30Infosys Technologies Ltd. Software 50,000 661.95 2.30Britannia Industries Ltd Consumer Non Durables 47,000 658.02 2.28Procter & Gamble Hygieneand Health Care Limited Consumer Non Durables 81,914 615.05 2.13MphasiS Limited Software 300,000 609.75 2.12Pidilite Industries Ltd Chemicals 674,700 571.47 1.98Kotak Mahindra Bank Limited Banks 198,945 561.42 1.95ITC Ltd. Consumer Non Durables 300,000 554.55 1.92Zee Entertainment Enterprises Ltd Media & Entertainment 512,500 545.04 1.89Tata Consultancy Services Limited Software 100,000 538.55 1.87
Name of the Instrument Industry Quantity Market/ % toFair Value NAV
(Rs. In Lakhs)Hero Honda Motors Ltd. Auto 50,000 535.58 1.86HDFC Bank Ltd. Banks 45,000 438.03 1.52Wyeth Limited Pharmaceuticals 97,008 405.69 1.41Sun Pharmaceuticals Industries Ltd Pharmaceuticals 35,000 389.01 1.35Axis Bank Limited Banks 71,000 294.61 1.02Dishman Pharmaceuticals andChemicals Limited Pharmaceuticals 175,000 174.13 0.60Ballarpur Industries Limited Paper 1,000,000 147 0.51Biocon Limited Pharmaceuticals 56,000 80.16 0.28Motherson Sumi Systems Ltd. Auto Ancillaries 72,000 48.74 0.17Blue Star Limited Consumer Durables 28,160 43.76 0.15Subtotal 27,722.01 96.19(b) Unlisted Nil NilTotal 27,722.01 96.19DEBT INSTRUMENTS(a) Listed / awaiting listing onStock ExchangesGovernment Securities Nil NilNon-Convertible debentures / Bonds Nil Nil(b) Privately Placed / UnlistedNon-Convertible debentures / Bonds Nil Nil(c) Securitized Debt Instruments Nil NilTotal Nil NilMONEY MARKET INSTRUMENTSBills Rediscounting Nil NilCommercial Papers (CP) /Certificate of Deposit (CD) Nil NilTreasury bills Nil NilCollateralised Borrowing &Lending Obligation 988.87 3.43Subtotal 988.87 3.43Fixed DepositsDeposits(maturity not exceeding 91 days) Nil NilTotal 988.87 3.43OTHERSNet Current Assets 110.15 0.38Grand Total 28,821.03 100.00
Notes :1) Total NPAs provided for and its percentage to NAV : Nil2) Total value and percentage of Illiquid Equity Shares : Nil
3) NAVs at a Glance March 31, 2009 September 30, 2008NAV per Unit (Rs.) Growth Option 11.998 17.249
Dividend Option 8.283 11.9094) Total outstanding exposure in Derivative Instruments : Nil 6) Portfolio Turnover Ratio ¥ : 63.29%5) Total investments in Foreign Securities / Overseas ETFs : Nil 7) Investments in Fixed Deposits : Nil(�) Top Ten Holdings, (+) Industry Classification as recommended by AMFI.
HDFC INDEX FUND - SENSEX PLAN(AN OPEN-ENDED INDEX LINKED SCHEME)
Name of the Instrument Industry Quantity Market/ % toFair Value NAV
(Rs. In Lakhs)
EQUITY & EQUITY RELATED(a) Listed / awaiting listing onStock Exchanges
� Reliance Industries Ltd. Petroleum Products 43,725 666.02 16.90� Infosys Technologies Ltd. Software 27,053 358.21 9.09� ITC Ltd. Consumer Non Durables 146,761 271.21 6.88� Bharti Airtel Limited Telecom - Services 36,937 231.15 5.86� ICICI Bank Ltd Banks 61,866 205.77 5.22� Larsen & Toubro Limited Construction Project 29,291 197.03 5.00� HDFC Bank Ltd. Banks 20,078 194.32 4.93� Housing Development Finance
Corporation Ltd.$ Finance 13,450 189.81 4.81� Oil & Natural Gas Corpn Ltd Oil 23,780 185.41 4.70� State Bank of India Banks 15,892 169.50 4.30� Hindustan Unilever Limited Diversified 60,569 144.28 3.66� Bharat Heavy Electricals Ltd Industrial Capital Goods 9,525 143.29 3.63
NTPC Limited Power 68,748 123.88 3.14Tata Consultancy Services Limited Software 13,566 73.26 1.86Reliance Communications Limited Telecom - Services 40,074 69.97 1.77Tata Power Co. Ltd. Power 8,603 65.84 1.67Maruti Suzuki India Limited Auto 8,047 62.37 1.58Grasim Industries Ltd. Cement 3,829 60.38 1.53Tata Steel Limited Ferrous Metals 28,360 58.42 1.48Sterlite Industries ( India ) Limited Non - Ferrous Metals 15,777 56.11 1.42Sun Pharmaceuticals Industries Ltd Pharmaceuticals 4,588 51.03 1.29Reliance Infrastructure Limited Power 8,177 42.14 1.07Mahindra & Mahindra Ltd. Auto 10,763 41.24 1.05Wipro Ltd Software 16,249 39.88 1.01ACC Limited Cement 5,749 33.15 0.84Hindalco Industries Ltd. Non - Ferrous Metals 61,605 31.97 0.81Jaiprakash Associates Limited Cement 36,142 30.43 0.77Tata Motors Limited Auto 13,818 24.91 0.63DLF Limited Construction 14,228 23.79 0.60Ranbaxy Laboratories Ltd Pharmaceuticals 9,319 15.43 0.39Subtotal 3,860.20 97.89(b) Unlisted Nil NilTotal 3,860.20 97.89DEBT INSTRUMENTS(a) Listed / awaiting listing onStock ExchangesGovernment Securities Nil NilNon-Convertible debentures / Bonds Nil Nil(b) Privately Placed / UnlistedNon-Convertible debentures / Bonds Nil Nil(c) Securitized Debt Instruments Nil NilTotal Nil NilMONEY MARKET INSTRUMENTSBills Rediscounting Nil NilCommercial Papers (CP) /Certificate of Deposit (CD) Nil NilTreasury bills Nil NilCollateralised Borrowing &Lending Obligation 131.98 3.35Subtotal 131.98 3.35Fixed DepositsDeposits(maturity not exceeding 91 days) Nil NilTotal 131.98 3.35OTHERSNet Current Assets (48.90) (1.24)Grand Total 3,943.28 100.00
Notes :1) Total NPAs provided for and its percentage to NAV : Nil2) Total value and percentage of Illiquid Equity Shares : Nil
3) NAVs at a Glance March 31, 2009 September 30, 2008NAV Per Unit (Rs.) [Face value per Unit = 32.161]
Growth Option 82.6830 112.5567
4) Total outstanding exposure in Derivative Instruments : Nil 6) Portfolio Turnover Ratio ¥ : 117.27%5) Total investments in Foreign Securities / Overseas ETFs : Nil 7) Investments in Fixed Deposits : Nil(�) Top Ten Holdings, (+) Industry Classification as recommended by AMFI, ($) Sponsor.
HDFC INDEX FUND - NIFTY PLAN(AN OPEN-ENDED INDEX LINKED SCHEME)
Name of the Instrument Industry Quantity Market/ % toFair Value NAV
(Rs. In Lakhs)EQUITY & EQUITY RELATED(a) Listed / awaiting listing onStock Exchanges
� Reliance Industries Ltd. Petroleum Products 19,910 303.58 11.48� Oil & Natural Gas Corpn Ltd Oil 27,059 211.11 7.98� NTPC Limited Power 104,315 187.61 7.09� Bharti Airtel Limited Telecom - Services 24,008 150.23 5.67� Infosys Technologies Ltd. Software 7,247 95.94 3.62� Bharat Heavy Electricals Ltd Industrial Capital Goods 6,193 93.55 3.53� ITC Ltd. Consumer Non Durables 47,751 88.27 3.33� State Bank of India Banks 8,032 85.71 3.24� Tata Consultancy Services Limited Software 12,380 66.67 2.52� Hindustan Unilever Limited Diversified 27,577 65.50 2.47
Reliance Petroleum Limited Petroleum Products 56,930 54.14 2.04HDFC Bank Ltd. Banks 5,382 52.39 1.98Power Grid Corporation of India Limited Power 53,246 50.90 1.92Housing DevelopmentFinance Corporation Ltd $ Finance 3,598 50.81 1.92Steel Authority of India Ltd. Ferrous Metals 52,254 50.40 1.90Larsen & Toubro Limited Construction Project 7,409 49.74 1.88ICICI Bank Ltd Banks 14,079 46.85 1.77Reliance Communications Limited Telecom - Services 26,113 45.66 1.72Wipro Ltd Software 18,521 45.54 1.72Cairn India Limited Oil 23,995 44.17 1.67GAIL (India) Limited Gas 16,047 39.41 1.49DLF Limited Construction 21,472 35.92 1.36Sterlite Industries ( India ) Limited Non - Ferrous Metals 8,963 32.05 1.21Reliance Power Limited Power 30,322 31.03 1.17Sun Pharmaceuticals Industries Ltd Pharmaceuticals 2,621 29.13 1.10Maruti Suzuki India Limited Auto 3,656 28.51 1.08Hero Honda Motors Ltd. Auto 2,526 27.06 1.02Cipla Ltd. Pharmaceuticals 9,834 21.64 0.82Tata Power Co. Ltd. Power 2,802 21.54 0.81Idea Cellular Limited Telecom - Services 39,220 19.65 0.74Axis Bank Limited Banks 4,696 19.49 0.74Tata Steel Limited Ferrous Metals 9,245 19.04 0.72Tata Communications Limited Telecom - Services 3,605 18.69 0.71Grasim Industries Ltd. Cement 1,159 18.34 0.69National Aluminium Company Limited Non - Ferrous Metals 8,151 17.50 0.66Bharat Petroleum Corpn. Ltd Petroleum Products 4,574 17.20 0.65Punjab National Bank Banks 3,985 16.40 0.62Reliance Infrastructure Limited Power 2,882 14.86 0.56ACC Limited Cement 2,374 13.64 0.52Ambuja Cements Ltd Cement 19,263 13.60 0.51Mahindra & Mahindra Ltd. Auto 3,528 13.54 0.51ABB Limited Industrial Capital Goods 2,681 11.44 0.43Siemens Ltd Industrial Capital Goods 4,266 11.44 0.43Hindalco Industries Ltd. Non - Ferrous Metals 21,514 11.20 0.42Reliance Capital Ltd. Finance 3,107 10.98 0.41Tata Motors Limited Auto 5,692 10.26 0.39Ranbaxy Laboratories Ltd Pharmaceuticals 5,318 8.81 0.33HCL Technologies Ltd Software 8,473 8.65 0.33Suzlon Energy Limited Industrial Capital Goods 18,955 8.03 0.30Unitech Ltd Construction 20,538 7.17 0.27Subtotal 2,394.99 90.45(b) Unlisted Nil NilTotal 2,394.99 90.45DEBT INSTRUMENTS(a) Listed / awaiting listing onStock ExchangesGovernment Securities Nil NilNon-Convertible debentures / Bonds Nil Nil(b) Privately Placed / UnlistedNon-Convertible debentures / Bonds Nil Nil(c) Securitized Debt Instruments Nil NilTotal Nil NilMONEY MARKET INSTRUMENTSBills Rediscounting Nil NilCommercial Papers (CP) /Certificate of Deposit (CD) Nil NilTreasury bills Nil NilCollateralised Borrowing &Lending Obligation 11.00 0.42Subtotal 11.00 0.42Fixed DepositsDeposits(maturity not exceeding 91 days) Nil NilTotal 11.00 0.42OTHERSNet Current Assets 241.65 9.13Grand Total 2,647.64 100.00
Notes :1) Total NPAs provided for and its percentage to NAV : Nil2) Total value and percentage of Illiquid Equity Shares : Nil
3) NAVs at a Glance March 31, 2009 September 30, 2008NAV Per Unit (Rs.) [Face value per Unit = Rs. 10.326]
Growth Option 27.2364 35.0608
4) Total outstanding exposure in Derivative Instruments : Nil 6) Portfolio Turnover Ratio ¥ : 168.91%5) Total investments in Foreign Securities / Overseas ETFs : Nil 7) Investments in Fixed Deposits : Nil(�) Top Ten Holdings, (+) Industry Classification as recommended by AMFI, ($) Sponsor
HDFC INDEX FUND - SENSEX PLUS PLAN(AN OPEN-ENDED INDEX LINKED SCHEME)
Name of the Instrument Industry Quantity Market/ % toFair Value NAV
(Rs. In Lakhs)
EQUITY & EQUITY RELATED(a) Listed / awaiting listing onStock Exchanges
� Reliance Industries Ltd. Petroleum Products 21,091 321.26 10.83� Infosys Technologies Ltd. Software 17,245 228.34 7.69� Bharti Airtel Limited Telecom - Services 33,539 209.89 7.08� State Bank of India Banks 18,682 199.25 6.72� ITC Ltd. Consumer Non Durables 103,598 191.45 6.46� Bharat Heavy Electricals Ltd Industrial Capital Goods 11,899 179.00 6.04� ICICI Bank Ltd Banks 47,418 157.71 5.32� Dr. Reddy’s Laboratories Ltd. # Pharmaceuticals 26,000 127.05 4.29� Larsen & Toubro Limited Construction Project 18,657 125.50 4.23� Housing Development
Finance Corporation Ltd.$ Finance 8,559 120.78 4.07Oil & Natural Gas Corpn Ltd Oil 13,054 101.78 3.43HDFC Bank Ltd. Banks 10,454 101.18 3.41Hindustan Unilever Limited Diversified 38,613 91.98 3.10Container Corporation of India Limited # Transportation 10,000 71.62 2.42The Federal Bank Ltd # Banks 50,000 69.05 2.33Motherson Sumi Systems Ltd. # Auto Ancillaries 100,000 67.15 2.26Procter & Gamble Hygiene andHealth Care Limited # Consumer Non Durables 8,822 66.29 2.24Sun Pharmaceuticals Industries Ltd Pharmaceuticals 5,408 60.16 2.03United Spirits Limited # Consumer Non Durables 8,000 51.98 1.75Tata Consultancy Services Limited Software 8,679 46.87 1.58Cipla Ltd. # Pharmaceuticals 20,477 45.00 1.52Maruti Suzuki India Limited Auto 5,109 39.60 1.34Tata Steel Limited Ferrous Metals 18,148 37.38 1.26NTPC Limited Power 18,503 33.34 1.12Mahindra & Mahindra Ltd. Auto 6,940 26.59 0.90

HDFC Asset Management Company LimitedA Joint Venture with Standard Life Investments Limited
Registered Office: Ramon House, 3rd Floor, H.T. Parekh Marg, 169, Backbay Reclamation, Churchgate, Mumbai 400 020.Investor Services Centre (at Mumbai) : Mistry Bhawan, 2nd Floor, 122, Backbay Reclamation, Dinsha Vachha Road, Churchgate, Mumbai - 400 020 • Tel.: 022-6631 6300 • Toll-free number : 1800 233 6767 • Fax : 022-2282 1144 • e-mail : [email protected] • Visit us at : www.hdfcfund.com
HALF-YEARLY PORTFOLIO STATEMENT OF THE SCHEMES / PLANS OF HDFC MUTUAL FUND AS ON 31ST MARCH 2009[ Pursuant to Regulation 59A of Securities and Exchange Board of India (Mutual Funds) Regulations, 1996 ]
Page: 12 (continued....)¥ Portfolio Turnover Ratio = Lower of purchases or sales of securities during the twelve months ended March 31, 2009 / Average Net Assets during the twelve months ended March 31, 2009.
Name of the Instrument Industry Quantity Market/ % to+/Rating Fair Value NAV
(Rs. In Lakhs)
Wipro Ltd Software 10,374 25.46 0.86Reliance Communications Limited Telecom - Services 14,546 25.40 0.86Jaiprakash Associates Limited Cement 24,937 21.00 0.71Tata Motors Limited Auto 8,505 15.33 0.52DLF Limited Construction 9,081 15.18 0.51Grasim Industries Ltd. Cement 934 14.73 0.50Kirloskar Pneumatic Ltd. # Industrial Products 7,500 12.26 0.41ACC Limited Cement 1,949 11.24 0.38Reliance Infrastructure Limited Power 1,704 8.78 0.30Ranbaxy Laboratories Ltd Pharmaceuticals 5,124 8.49 0.29Hindalco Industries Ltd. Non - Ferrous Metals 13,375 6.94 0.23Tata Power Co. Ltd. Power 763 5.84 0.20Sterlite Industries ( India ) Limited Non - Ferrous Metals 1,398 4.97 0.17Subtotal 2,945.82 99.36(b) Unlisted Nil NilTotal 2,945.82 99.36DEBT INSTRUMENTS(a) Listed / awaiting listing onStock ExchangesGovernment Securities Nil NilNon-Convertible debentures / Bonds Nil Nil(b) Privately Placed / UnlistedNon-Convertible debentures / Bonds Nil Nil(c) Securitized Debt Instruments Nil NilTotal Nil NilMONEY MARKET INSTRUMENTSBills Rediscounting Nil NilCommercial Papers (CP) /Certificate of Deposit (CD) Nil NilTreasury bills Nil NilCollateralised Borrowing &Lending Obligation 212.97 7.18Subtotal 212.97 7.18Fixed DepositsDeposits(maturity not exceeding 91 days) Nil NilTotal 212.97 7.18OTHERSNet Current Assets (194.01) (6.54)Grand Total 2,964.78 100.00
Notes :1) Total NPAs provided for and its percentage to NAV : Nil2) Total value and percentage of Illiquid Equity Shares : Nil
3) NAVs at a Glance March 31, 2009 September 30, 2008NAV Per Unit (Rs.) [Face value per Unit = Rs. 32.161]
Growth Option 111.6689 142.82344) Total outstanding exposure in Derivative Instruments : Nil 6) Portfolio Turnover Ratio ¥ : 104.76%5) Total investments in Foreign Securities / Overseas ETFs : Nil 7) Investments in Fixed Deposits : Nil(�) Top Ten Holdings, (+) Industry Classification as recommended by AMFI, ($) Sponsor, # Non Sensex Scrips.
HDFC BALANCED FUND(AN OPEN-ENDED BALANCED SCHEME)
Name of the Instrument Industry Quantity Market/ % to+/Rating Fair Value NAV
(Rs. In Lakhs)
EQUITY & EQUITY RELATED(a) Listed / awaiting listing onStock Exchanges
� Reliance Industries Ltd. Petroleum Products 31,000 472.67 5.92� Coromandel Fertilisers Ltd. Fertilisers 380,000 344.28 4.31� ITC Ltd. Consumer Non Durables 185,000 341.97 4.28� Sun Pharmaceuticals Industries Ltd Pharmaceuticals 30,000 333.44 4.18� The Federal Bank Ltd Banks 200,000 275.80 3.46� Infosys Technologies Ltd. Software 20,000 264.78 3.32
Bharat Heavy Electricals Ltd Industrial Capital Goods 17,500 264.35 3.31ICICI Bank Ltd Banks 75,000 249.60 3.13Dabur India Ltd Consumer Non Durables 250,000 248.00 3.11Motherson Sumi Systems Ltd. Auto Ancillaries 350,000 236.95 2.97Biocon Limited Pharmaceuticals 160,000 229.04 2.87Tata Consultancy Services Limited Software 40,000 215.42 2.70Bharat Petroleum Corpn. Ltd Petroleum Products 51,445 193.46 2.42Bharti Airtel Limited Telecom - Services 30,000 187.73 2.35Axis Bank Limited Banks 45,000 186.73 2.34Larsen & Toubro Limited Construction Project 25,800 173.22 2.17Bank of Baroda Banks 70,000 164.05 2.06Crompton Greaves Ltd Industrial Capital Goods 130,743 161.47 2.02IPCA Laboratories Ltd. Pharmaceuticals 40,000 132.18 1.66Balkrishna Industries Limited Auto Ancillaries 95,900 130.28 1.63United Spirits Limited Consumer Non Durables 20,000 129.79 1.63Divi’s Laboratories Limited Pharmaceuticals 13,200 124.65 1.56Aarti Industries Ltd. Chemicals 420,000 119.07 1.49Blue Star Limited Consumer Durables 65,000 101.01 1.27KEC International Limited Power 60,500 92.17 1.15Sadbhav Engineering Limited Construction 27,445 87.34 1.09MM Forgings Ltd. Industrial Products 208,000 77.17 0.97VIP Industries Ltd. Consumer Non Durables 167,500 57.03 0.71Amtek Auto Ltd Auto Ancillaries 75,000 55.73 0.70Subtotal 5,649.38 70.78(b) Unlisted Nil NilTotal 5,649.38 70.78DEBT INSTRUMENTS(a) Listed / awaiting listing onStock ExchangesGovernment Securities Nil NilNon-Convertible debentures / Bonds
� Housing DevelopmentFinance Corporation Ltd.**$ AAA 50 493.05 6.18State Bank of India** AAA 25 263.16 3.30Subtotal 756.21 9.48(b) Privately Placed / UnlistedNon-Convertible debentures / Bonds Nil Nil(c) Securitized Debt Instruments
� Grasim Industries Ltd.** AAA (SO) 8 475.07 5.95� Credit Asset Trust Series XVII ** AA (SO) 4 394.43 4.94� Bajaj Auto Ltd.** AAA (SO) 5 280.03 3.51
Reliance Industries Ltd.** AAA (SO) 5 107.88 1.35Subtotal 1,257.41 15.75Total 2,013.62 25.23MONEY MARKET INSTRUMENTSBills Rediscounting Nil NilCommercial Papers (CP) /Certificate of Deposit (CD) Nil NilTreasury bills Nil NilCollateralised Borrowing &Lending Obligation 145.98 1.83Subtotal 145.98 1.83Fixed DepositsDeposits(maturity not exceeding 91 days) Nil NilTotal 145.98 1.83OTHERSNet Current Assets 172.47 2.16Grand Total 7,981.45 100.00
Notes :1) Total NPAs provided for and its percentage to NAV : Nil2) Total value and percentage of Illiquid Equity Shares : Nil
3) NAVs at a Glance March 31, 2009 September 30, 2008NAV per Unit (Rs.) Growth Plan 25.938 31.826Dividend Plan 11.470 16.022
4) For details on dividend declared during the half-year ended March 31, 2009, please refer to Dividend History Table.5) Total outstanding exposure in Derivative Instruments : Nil 7) Portfolio Turnover Ratio ¥ : 30.92%6) Total investments in Foreign Securities / Overseas ETFs : Nil 8) Investments in Fixed Deposits : Nil(�) Top Ten Holdings, (+) Industry Classification as recommended by AMFI, (**) Thinly Traded / Non-Traded Securities,($) Sponsor.
HDFC PRUDENCE FUND(AN OPEN-ENDED BALANCED SCHEME)
Name of the Instrument Industry Quantity Market/ % to+/Rating Fair Value NAV
(Rs. In Lakhs)EQUITY & EQUITY RELATED(a) Listed / awaiting listing onStock Exchanges
� GlaxoSmithKline ConsumerHealthcare Limited Consumer Non Durables 900,000 6,338.70 3.68
� State Bank of India Banks 440,000 4,695.24 2.72� Crompton Greaves Ltd Industrial Capital Goods 3,737,500 4,615.81 2.68� Bank of Baroda Banks 1,968,800 4,613.88 2.67� Sun Pharmaceuticals Industries Ltd Pharmaceuticals 362,819 4,032.55 2.34� Oil & Natural Gas Corpn Ltd Oil 500,000 3,901.00 2.26� Titan Industries Ltd. Consumer Non Durables 498,424 3,896.43 2.26
LIC Housing Finance Ltd Finance 1,695,000 3,803.58 2.20Rural Electrification Corporation Ltd. Finance 3,918,224 3,765.41 2.18Divi’s Laboratories Limited Pharmaceuticals 390,500 3,687.49 2.14United Phosphorous Limited Pesticides 3,550,000 3,487.88 2.02ICICI Bank Ltd Banks 1,020,000 3,394.56 1.97AIA Engineering Limited Industrial Capital Goods 2,650,000 3,311.18 1.92Hero Honda Motors Ltd. Auto 300,000 3,213.45 1.86Britannia Industries Ltd Consumer Non Durables 210,365 2,945.22 1.71Apollo Tyres Ltd Auto Ancillaries 16,050,000 2,929.13 1.70Page Industries Limited Textile Products 779,539 2,845.32 1.65The Federal Bank Ltd Banks 2,038,012 2,810.42 1.63Jagran Prakashan Limited Media & Entertainment 4,885,668 2,782.39 1.61Tata Consultancy Services Limited Software 500,000 2,692.75 1.56Bharat Petroleum Corpn. Ltd Petroleum Products 700,000 2,632.35 1.53Reliance Industries Ltd. Petroleum Products 170,000 2,592.08 1.50HT Media Limited Media & Entertainment 4,366,965 2,556.86 1.48Procter & Gamble Hygiene andHealth Care Limited Consumer Non Durables 340,143 2,553.96 1.48Zee News Limited Media & Entertainment 6,969,745 2,282.59 1.323M India Limited Trading 252,531 2,264.95 1.31IPCA Laboratories Ltd. Pharmaceuticals 656,763 2,170.27 1.26Axis Bank Limited Banks 500,000 2,074.75 1.20Esab India Ltd Industrial Products 648,305 2,003.91 1.16Patni Computer Systems Limited Software 1,500,000 1,932.75 1.12Shree Cements Ltd Cement 267,000 1,897.04 1.10Punjab National Bank Banks 450,000 1,851.53 1.07Ballarpur Industries Limited Paper 11,700,000 1,719.90 1.00Nestle India Ltd. Consumer Non Durables 101,840 1,585.04 0.92Merck Limited Pharmaceuticals 412,500 1,488.71 0.86Tata Steel Limited Ferrous Metals 700,000 1,441.30 0.84KEC International Limited Power 900,000 1,371.15 0.79Zee Entertainment Enterprises Ltd Media & Entertainment 1,241,092 1,319.90 0.76Grindwell Norton Limited Industrial Products 1,626,001 1,249.58 0.72Wipro Ltd Software 500,000 1,229.50 0.71Pidilite Industries Ltd Chemicals 1,438,812 1,218.67 0.71Aarti Industries Ltd. Chemicals 3,529,794 1,000.70 0.58TV Today Network Limited Media & Entertainment 1,513,936 991.63 0.57Dishman Pharmaceuticals andChemicals Limited Pharmaceuticals 988,087 983.15 0.57Elecon Engineering Co Ltd Industrial Capital Goods 3,018,941 937.38 0.54Punj Lloyd Limited Construction Project 1,000,000 910.00 0.53Shanthi Gears Ltd Auto Ancillaries 3,241,645 833.10 0.48Dr. Reddy’s Laboratories Ltd. Pharmaceuticals 150,000 735.30 0.43Nagarjuna Construction Co. Ltd Construction Project 1,175,000 726.15 0.42Blue Star Limited Consumer Durables 460,000 714.84 0.41Eveready Industries India Limited Consumer Non Durables 3,685,869 656.08 0.38Biocon Limited Pharmaceuticals 450,000 644.18 0.37Himatsingka Seide Ltd Textile Products 2,738,320 635.29 0.37Ahmednagar Forgings Ltd Industrial Products 1,867,572 625.64 0.36Savita Chemicals Ltd Chemicals 488,278 595.46 0.35Maharashtra Seamless Ltd Ferrous Metals 405,749 578.40 0.34Motilal Oswal Financial Services Limited Finance 698,113 535.45 0.31Infosys Technologies Ltd. Software 40,000 529.56 0.31Balkrishna Industries Limited Auto Ancillaries 287,335 390.34 0.23United Spirits Limited Consumer Non Durables 50,000 324.48 0.19Indo Rama Synthetics (India) Limited Textiles - Synthetic 1,500,000 306.75 0.18ISMT Limited Ferrous Metals 1,405,098 279.61 0.16Simplex Infrastructures Limited Construction 140,863 221.51 0.13Uniphos Enterprises Limited Trading 1,098,228 153.75 0.09Subtotal 127,507.93 73.90(b) UnlistedAlberg Software Ltd. £ Software 7,500 Nil NilSubtotal Nil NilTotal 127,507.93 73.90DEBT INSTRUMENTS(a) Listed / awaiting listing onStock ExchangesGovernment Securities7.61 % GOI 2015 SOV 250,000 250.13 0.14Subtotal 250.13 0.14Non-Convertible debentures / Bonds
� Indian Railways Finance Corporation Ltd.** AAA 850 9,478.42 5.50� State Bank of India** AAA 600 6,315.93 3.66� Power Finance Corporation Ltd** AAA 525 5,808.38 3.37
Housing Development FinanceCorporation Ltd.**$ AAA 300 3,151.13 1.83Axis Bank Ltd.** AAA 300 2,984.92 1.73Punjab National Bank** AAA 200 2,069.48 1.20National Bank for Agriculture andRural Development** AAA 150 1,569.23 0.91Infrastructure DevelopmentFinance Company Ltd** AAA (I) 150 1,569.15 0.91State Bank of Indore** AAA 150 1,542.33 0.89State Bank of Bikaner & Jaipur** AAA 100 1,030.53 0.60ICICI Bank Ltd.** AAA 7,551 739.37 0.43State Bank of Patiala** AAA 50 522.87 0.30Subtotal 36,781.74 21.33(b) Privately Placed / UnlistedNon-Convertible debentures / Bonds Nil Nil(c) Securitized Debt InstrumentsJet Airways (India) Ltd.** AAA (SO) 900,000 473.61 0.27Subtotal 473.61 0.27Total 37,505.48 21.74MONEY MARKET INSTRUMENTSBills Rediscounting Nil NilCommercial Papers (CP) /Certificate of Deposit (CD) Nil NilTreasury bills Nil NilCollateralised Borrowing &Lending Obligation 65.99 0.04Subtotal 65.99 0.04Fixed DepositsDeposits(maturity not exceeding 91 days) Nil NilTotal 65.99 0.04OTHERS
Name of the Instrument Industry Quantity Market/ % to+/Rating Fair Value NAV
(Rs. In Lakhs)Net Current Assets 7,461.93 4.32Grand Total 172,541.33 100.00
Notes :1) Total NPAs provided for and its percentage to NAV : Nil2) Total value and percentage of Illiquid Equity Shares is as under :
Company Name Quantity Value (Rs.) %Alberg Software Ltd. £ 7,500 Nil Nil
3) NAVs at a Glance March 31, 2009 September 30, 2008NAV per Unit (Rs.) Growth Plan 91.474 114.111
Dividend Plan 15.823 23.0494) For details on dividend declared during the half-year ended March 31, 2009, please refer to Dividend History Table.5) Total outstanding exposure in Derivative Instruments : Nil 7) Portfolio Turnover Ratio ¥ : 59.67%6) Total investments in Foreign Securities / Overseas ETFs : Nil 8) Investments in Fixed Deposits : Nil(�) Top Ten Holdings, (+) Industry Classification as recommended by AMFI, ($) Sponsor, (**) Thinly Traded /Non-Traded Securities, (£) Illiquid Shares. Fair Value as per procedures determined by HDFC AMC in accordance withthe guidelines for valuation specified in the SEBI (Mutual Funds) Regulations, 1996, and amendments thereto, asapplicable.
HDFC CHILDREN’S GIFT FUND - INVESTMENT PLAN(AN OPEN-ENDED BALANCED SCHEME)
Name of the Instrument Industry Quantity Market/ % to+/Rating Fair Value NAV
(Rs. In Lakhs)EQUITY & EQUITY RELATED(a) Listed / awaiting listing onStock Exchanges
� Reliance Industries Ltd. Petroleum Products 41,800 637.35 5.44� Sun Pharmaceuticals Industries Ltd Pharmaceuticals 33,000 366.78 3.13� Biocon Limited Pharmaceuticals 246,000 352.15 3.01� Bharti Airtel Limited Telecom - Services 55,000 344.16 2.94� Coromandel Fertilisers Ltd. Fertilisers 374,500 339.30 2.90� GlaxoSmithKline Consumer
Healthcare Limited Consumer Non Durables 46,292 326.03 2.79Hero Honda Motors Ltd. Auto 30,000 321.35 2.75Infosys Technologies Ltd. Software 22,000 291.26 2.49Divi’s Laboratories Limited Pharmaceuticals 30,000 283.29 2.42Axis Bank Limited Banks 65,000 269.72 2.30ITC Ltd. Consumer Non Durables 140,000 258.79 2.21Motherson Sumi Systems Ltd. Auto Ancillaries 380,000 257.26 2.20ICICI Bank Ltd Banks 77,000 256.26 2.19Britannia Industries Ltd Consumer Non Durables 17,000 238.01 2.03Bank of Baroda Banks 100,000 234.35 2.00Maruti Suzuki India Limited Auto 30,000 233.96 2.00Bharat Heavy Electricals Ltd Industrial Capital Goods 15,000 226.58 1.94LIC Housing Finance Ltd Finance 100,000 224.40 1.92Dabur India Ltd Consumer Non Durables 225,000 223.20 1.91Union Bank of India Banks 140,000 205.59 1.76Crompton Greaves Ltd Industrial Capital Goods 163,000 201.31 1.72Esab India Ltd Industrial Products 65,000 200.92 1.72Shanthi Gears Ltd Auto Ancillaries 780,000 200.46 1.71United Spirits Limited Consumer Non Durables 30,000 194.69 1.66Blue Star Limited Consumer Durables 120,000 186.48 1.59Taj GVK Hotels & Resorts Limited Hotels 300,000 142.95 1.22The Great Eastern Shipping Co. Limited Transportation 75,000 142.31 1.22Micro Inks Limited Chemicals 101,965 137.65 1.18Tata Consultancy Services Limited Software 25,000 134.64 1.15CRISIL Limited Finance 4,858 131.27 1.12Thermax Ltd Industrial Capital Goods 72,000 130.07 1.11Larsen & Toubro Limited Construction Project 18,000 120.85 1.03Zee Entertainment Enterprises Ltd Media & Entertainment 110,000 116.99 1.00Carborundum Universal Ltd Industrial Products 100,000 78.75 0.67Subtotal 8,009.13 68.43(b) Unlisted Nil NilTotal 8,009.13 68.43DEBT INSTRUMENTS(a) Listed / awaiting listing onStock ExchangesGovernment Securities Nil NilNon-Convertible debentures / Bonds
� ICICI Bank Ltd.** AAA 7,801 794.85 6.79� M&M Financial Services Ltd.** AA- 50 500.00 4.27
Sundaram Finance Ltd.** AA+ 30 294.30 2.51Tata Motor Finance Ltd.** A 18 181.55 1.55Subtotal 1,770.70 15.12(b) Privately Placed / UnlistedNon-Convertible debentures / Bonds Nil Nil(c) Securitized Debt Instruments
� Jet Airways (India) Ltd.** AAA (SO) 1,000,000 526.24 4.50� Credit Asset Trust Series XVII ** AA (SO) 4 394.43 3.37
Bajaj Auto Ltd.** AAA (SO) 3 168.02 1.44Subtotal 1,088.69 9.31Total 2,859.39 24.43MONEY MARKET INSTRUMENTSBills Rediscounting Nil NilCommercial Papers (CP) /Certificate of Deposit (CD) Nil NilTreasury bills Nil NilCollateralised Borrowing &Lending Obligation 708.90 6.06Subtotal 708.90 6.06Fixed DepositsDeposits(maturity not exceeding 91 days) Nil NilTotal 708.90 6.06OTHERSNet Current Assets 126.45 1.08Grand Total 11,703.87 100.00
Notes :1) Total NPAs provided for and its percentage to NAV : Nil2) Total value and percentage of Illiquid Equity Shares : Nil
3) NAVs at a Glance March 31, 2009 September 30, 2008NAV per Unit (Rs.) Growth Option 19.367 23.988
4) Total outstanding exposure in Derivative Instruments (Interest Rate Swap): Rs. 500 Lacs5) Total investments in Foreign Securities / Overseas ETFs : Nil6) Portfolio Turnover Ratio ¥ : 18.21%7) Investments in Fixed Deposits : Nil(�) Top Ten Holdings, (+) Industry Classification as recommended by AMFI, (**) Thinly Traded / Non-Traded Securities,($) Sponsor.
HDFC CHILDREN’S GIFT FUND - SAVINGS PLAN(AN OPEN-ENDED BALANCED SCHEME)
Name of the Instrument Industry Quantity Market/ % to+/Rating Fair Value NAV
(Rs. In Lakhs)
EQUITY & EQUITY RELATED(a) Listed / awaiting listing onStock ExchangesProcter & Gamble Hygiene andHealth Care Limited Consumer Non Durables 6,700 50.31 0.99Britannia Industries Ltd Consumer Non Durables 3,300 46.20 0.91Infosys Technologies Ltd. Software 3,250 43.03 0.85CRISIL Limited Finance 1,500 40.53 0.80Sun Pharmaceuticals Industries Ltd Pharmaceuticals 3,500 38.90 0.77Motherson Sumi Systems Ltd. Auto Ancillaries 50,000 33.85 0.67United Phosphorous Limited Pesticides 30,000 29.48 0.58GlaxoSmithKline ConsumerHealthcare Limited Consumer Non Durables 4,100 28.88 0.57Carborundum Universal Ltd Industrial Products 35,324 27.82 0.55Coromandel Fertilisers Ltd. Fertilisers 30,000 27.18 0.54
HDFC Asset Management Company LimitedA Joint Venture with Standard Life Investments Limited
Registered Office: Ramon House, 3rd Floor, H.T. Parekh Marg, 169, Backbay Reclamation, Churchgate, Mumbai 400 020.Investor Services Centre (at Mumbai) : Mistry Bhawan, 2nd Floor, 122, Backbay Reclamation, Dinsha Vachha Road, Churchgate, Mumbai - 400 020 • Tel.: 022-6631 6300 • Toll-free number : 1800 233 6767 • Fax : 022-2282 1144 • e-mail : [email protected] • Visit us at : www.hdfcfund.com
HALF-YEARLY PORTFOLIO STATEMENT OF THE SCHEMES / PLANS OF HDFC MUTUAL FUND AS ON 31ST MARCH 2009[ Pursuant to Regulation 59A of Securities and Exchange Board of India (Mutual Funds) Regulations, 1996 ]
Page: 13 (continued....)¥ Portfolio Turnover Ratio = Lower of purchases or sales of securities during the twelve months ended March 31, 2009 / Average Net Assets during the twelve months ended March 31, 2009.
Name of the Instrument Industry Quantity Market/ % to+/Rating Fair Value NAV
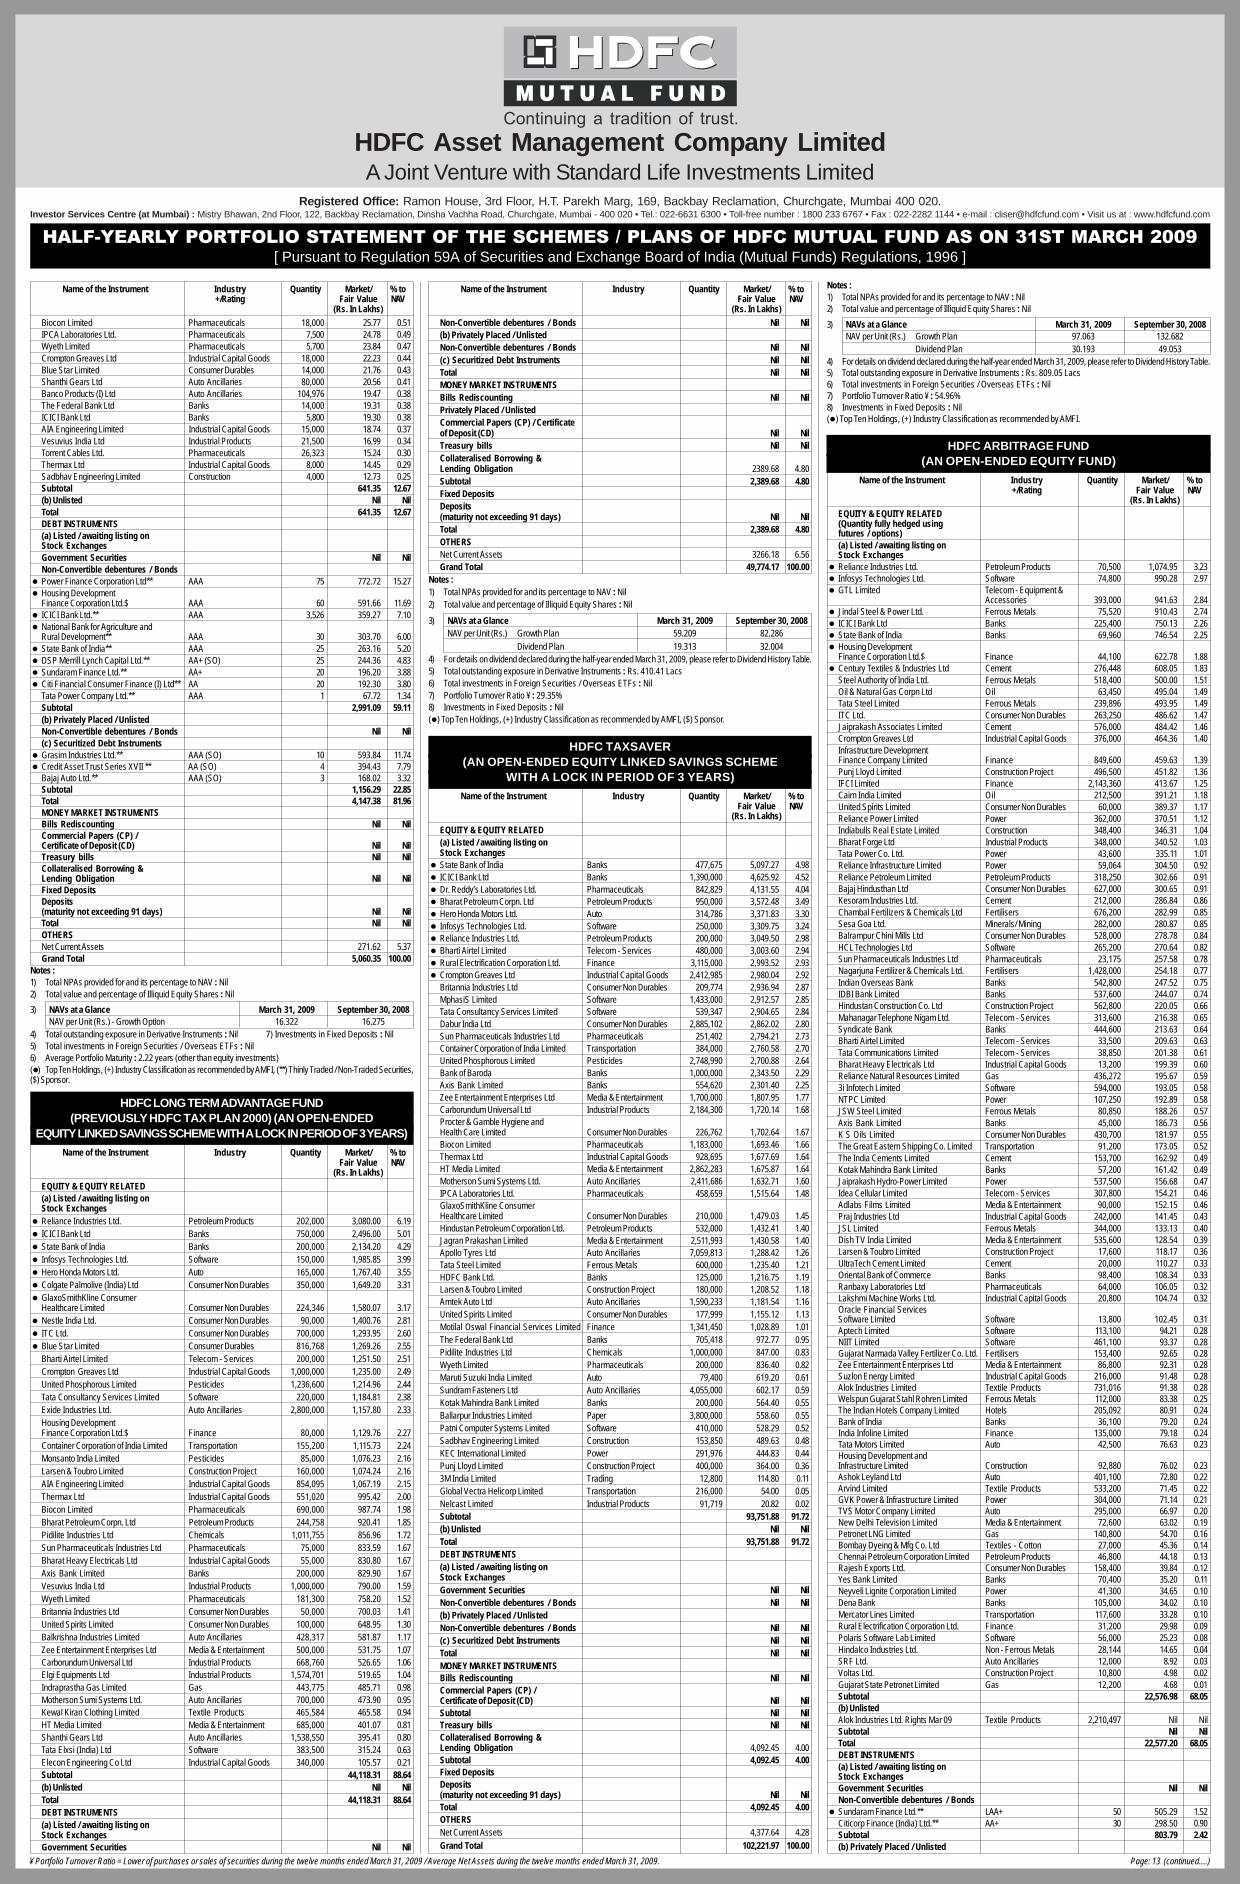
(Rs. In Lakhs)Biocon Limited Pharmaceuticals 18,000 25.77 0.51IPCA Laboratories Ltd. Pharmaceuticals 7,500 24.78 0.49Wyeth Limited Pharmaceuticals 5,700 23.84 0.47Crompton Greaves Ltd Industrial Capital Goods 18,000 22.23 0.44Blue Star Limited Consumer Durables 14,000 21.76 0.43Shanthi Gears Ltd Auto Ancillaries 80,000 20.56 0.41Banco Products (I) Ltd Auto Ancillaries 104,976 19.47 0.38The Federal Bank Ltd Banks 14,000 19.31 0.38ICICI Bank Ltd Banks 5,800 19.30 0.38AIA Engineering Limited Industrial Capital Goods 15,000 18.74 0.37Vesuvius India Ltd Industrial Products 21,500 16.99 0.34Torrent Cables Ltd. Pharmaceuticals 26,323 15.24 0.30Thermax Ltd Industrial Capital Goods 8,000 14.45 0.29Sadbhav Engineering Limited Construction 4,000 12.73 0.25Subtotal 641.35 12.67(b) Unlisted Nil NilTotal 641.35 12.67DEBT INSTRUMENTS(a) Listed / awaiting listing onStock ExchangesGovernment Securities Nil NilNon-Convertible debentures / Bonds
� Power Finance Corporation Ltd** AAA 75 772.72 15.27� Housing Development
Finance Corporation Ltd.$ AAA 60 591.66 11.69� ICICI Bank Ltd.** AAA 3,526 359.27 7.10� National Bank for Agriculture and
Rural Development** AAA 30 303.70 6.00� State Bank of India** AAA 25 263.16 5.20� DSP Merrill Lynch Capital Ltd.** AA+ (SO) 25 244.36 4.83� Sundaram Finance Ltd.** AA+ 20 196.20 3.88� Citi Financial Consumer Finance (I) Ltd** AA 20 192.30 3.80
Tata Power Company Ltd.** AAA 1 67.72 1.34Subtotal 2,991.09 59.11(b) Privately Placed / UnlistedNon-Convertible debentures / Bonds Nil Nil(c) Securitized Debt Instruments
� Grasim Industries Ltd.** AAA (SO) 10 593.84 11.74� Credit Asset Trust Series XVII ** AA (SO) 4 394.43 7.79
Bajaj Auto Ltd.** AAA (SO) 3 168.02 3.32Subtotal 1,156.29 22.85Total 4,147.38 81.96MONEY MARKET INSTRUMENTSBills Rediscounting Nil NilCommercial Papers (CP) /Certificate of Deposit (CD) Nil NilTreasury bills Nil NilCollateralised Borrowing &Lending Obligation Nil NilFixed DepositsDeposits(maturity not exceeding 91 days) Nil NilTotal Nil NilOTHERSNet Current Assets 271.62 5.37Grand Total 5,060.35 100.00
Notes :1) Total NPAs provided for and its percentage to NAV : Nil2) Total value and percentage of Illiquid Equity Shares : Nil
3) NAVs at a Glance March 31, 2009 September 30, 2008NAV per Unit (Rs.) - Growth Option 16.322 16.275
4) Total outstanding exposure in Derivative Instruments : Nil 7) Investments in Fixed Deposits : Nil5) Total investments in Foreign Securities / Overseas ETFs : Nil6) Average Portfolio Maturity : 2.22 years (other than equity investments)(�) Top Ten Holdings, (+) Industry Classification as recommended by AMFI, (**) Thinly Traded / Non-Traded Securities,($) Sponsor.
HDFC LONG TERM ADVANTAGE FUND(PREVIOUSLY HDFC TAX PLAN 2000) (AN OPEN-ENDED
EQUITY LINKED SAVINGS SCHEME WITH A LOCK IN PERIOD OF 3 YEARS)
Name of the Instrument Industry Quantity Market/ % toFair Value NAV
(Rs. In Lakhs)
EQUITY & EQUITY RELATED(a) Listed / awaiting listing onStock Exchanges
� Reliance Industries Ltd. Petroleum Products 202,000 3,080.00 6.19� ICICI Bank Ltd Banks 750,000 2,496.00 5.01� State Bank of India Banks 200,000 2,134.20 4.29� Infosys Technologies Ltd. Software 150,000 1,985.85 3.99� Hero Honda Motors Ltd. Auto 165,000 1,767.40 3.55� Colgate Palmolive (India) Ltd Consumer Non Durables 350,000 1,649.20 3.31� GlaxoSmithKline Consumer
Healthcare Limited Consumer Non Durables 224,346 1,580.07 3.17� Nestle India Ltd. Consumer Non Durables 90,000 1,400.76 2.81� ITC Ltd. Consumer Non Durables 700,000 1,293.95 2.60� Blue Star Limited Consumer Durables 816,768 1,269.26 2.55
Bharti Airtel Limited Telecom - Services 200,000 1,251.50 2.51Crompton Greaves Ltd Industrial Capital Goods 1,000,000 1,235.00 2.49United Phosphorous Limited Pesticides 1,236,600 1,214.96 2.44Tata Consultancy Services Limited Software 220,000 1,184.81 2.38Exide Industries Ltd. Auto Ancillaries 2,800,000 1,157.80 2.33Housing DevelopmentFinance Corporation Ltd.$ Finance 80,000 1,129.76 2.27Container Corporation of India Limited Transportation 155,200 1,115.73 2.24Monsanto India Limited Pesticides 85,000 1,076.23 2.16Larsen & Toubro Limited Construction Project 160,000 1,074.24 2.16AIA Engineering Limited Industrial Capital Goods 854,095 1,067.19 2.15Thermax Ltd Industrial Capital Goods 551,020 995.42 2.00Biocon Limited Pharmaceuticals 690,000 987.74 1.98Bharat Petroleum Corpn. Ltd Petroleum Products 244,758 920.41 1.85Pidilite Industries Ltd Chemicals 1,011,755 856.96 1.72Sun Pharmaceuticals Industries Ltd Pharmaceuticals 75,000 833.59 1.67Bharat Heavy Electricals Ltd Industrial Capital Goods 55,000 830.80 1.67Axis Bank Limited Banks 200,000 829.90 1.67Vesuvius India Ltd Industrial Products 1,000,000 790.00 1.59Wyeth Limited Pharmaceuticals 181,300 758.20 1.52Britannia Industries Ltd Consumer Non Durables 50,000 700.03 1.41United Spirits Limited Consumer Non Durables 100,000 648.95 1.30Balkrishna Industries Limited Auto Ancillaries 428,317 581.87 1.17Zee Entertainment Enterprises Ltd Media & Entertainment 500,000 531.75 1.07Carborundum Universal Ltd Industrial Products 668,760 526.65 1.06Elgi Equipments Ltd Industrial Products 1,574,701 519.65 1.04Indraprastha Gas Limited Gas 443,775 485.71 0.98Motherson Sumi Systems Ltd. Auto Ancillaries 700,000 473.90 0.95Kewal Kiran Clothing Limited Textile Products 465,584 465.58 0.94HT Media Limited Media & Entertainment 685,000 401.07 0.81Shanthi Gears Ltd Auto Ancillaries 1,538,550 395.41 0.80Tata Elxsi (India) Ltd Software 383,500 315.24 0.63Elecon Engineering Co Ltd Industrial Capital Goods 340,000 105.57 0.21Subtotal 44,118.31 88.64(b) Unlisted Nil NilTotal 44,118.31 88.64DEBT INSTRUMENTS(a) Listed / awaiting listing onStock ExchangesGovernment Securities Nil Nil
Name of the Instrument Industry Quantity Market/ % toFair Value NAV
(Rs. In Lakhs)Non-Convertible debentures / Bonds Nil Nil(b) Privately Placed / UnlistedNon-Convertible debentures / Bonds Nil Nil(c) Securitized Debt Instruments Nil NilTotal Nil NilMONEY MARKET INSTRUMENTSBills Rediscounting Nil NilPrivately Placed / UnlistedCommercial Papers (CP) / Certificateof Deposit (CD) Nil NilTreasury bills Nil NilCollateralised Borrowing &Lending Obligation 2389.68 4.80Subtotal 2,389.68 4.80Fixed DepositsDeposits(maturity not exceeding 91 days) Nil NilTotal 2,389.68 4.80OTHERSNet Current Assets 3266.18 6.56Grand Total 49,774.17 100.00
Notes :1) Total NPAs provided for and its percentage to NAV : Nil2) Total value and percentage of Illiquid Equity Shares : Nil
3) NAVs at a Glance March 31, 2009 September 30, 2008NAV per Unit (Rs.) Growth Plan 59.209 82.286
Dividend Plan 19.313 32.0044) For details on dividend declared during the half-year ended March 31, 2009, please refer to Dividend History Table.5) Total outstanding exposure in Derivative Instruments : Rs. 410.41 Lacs6) Total investments in Foreign Securities / Overseas ETFs : Nil7) Portfolio Turnover Ratio ¥ : 29.35%8) Investments in Fixed Deposits : Nil(�) Top Ten Holdings, (+) Industry Classification as recommended by AMFI, ($) Sponsor.
HDFC TAXSAVER(AN OPEN-ENDED EQUITY LINKED SAVINGS SCHEME
WITH A LOCK IN PERIOD OF 3 YEARS)
Name of the Instrument Industry Quantity Market/ % toFair Value NAV
(Rs. In Lakhs)
EQUITY & EQUITY RELATED(a) Listed / awaiting listing onStock Exchanges
� State Bank of India Banks 477,675 5,097.27 4.98� ICICI Bank Ltd Banks 1,390,000 4,625.92 4.52� Dr. Reddy’s Laboratories Ltd. Pharmaceuticals 842,829 4,131.55 4.04� Bharat Petroleum Corpn. Ltd Petroleum Products 950,000 3,572.48 3.49� Hero Honda Motors Ltd. Auto 314,786 3,371.83 3.30� Infosys Technologies Ltd. Software 250,000 3,309.75 3.24� Reliance Industries Ltd. Petroleum Products 200,000 3,049.50 2.98� Bharti Airtel Limited Telecom - Services 480,000 3,003.60 2.94� Rural Electrification Corporation Ltd. Finance 3,115,000 2,993.52 2.93� Crompton Greaves Ltd Industrial Capital Goods 2,412,985 2,980.04 2.92
Britannia Industries Ltd Consumer Non Durables 209,774 2,936.94 2.87MphasiS Limited Software 1,433,000 2,912.57 2.85Tata Consultancy Services Limited Software 539,347 2,904.65 2.84Dabur India Ltd Consumer Non Durables 2,885,102 2,862.02 2.80Sun Pharmaceuticals Industries Ltd Pharmaceuticals 251,402 2,794.21 2.73Container Corporation of India Limited Transportation 384,000 2,760.58 2.70United Phosphorous Limited Pesticides 2,748,990 2,700.88 2.64Bank of Baroda Banks 1,000,000 2,343.50 2.29Axis Bank Limited Banks 554,620 2,301.40 2.25Zee Entertainment Enterprises Ltd Media & Entertainment 1,700,000 1,807.95 1.77Carborundum Universal Ltd Industrial Products 2,184,300 1,720.14 1.68Procter & Gamble Hygiene andHealth Care Limited Consumer Non Durables 226,762 1,702.64 1.67Biocon Limited Pharmaceuticals 1,183,000 1,693.46 1.66Thermax Ltd Industrial Capital Goods 928,695 1,677.69 1.64HT Media Limited Media & Entertainment 2,862,283 1,675.87 1.64Motherson Sumi Systems Ltd. Auto Ancillaries 2,411,686 1,632.71 1.60IPCA Laboratories Ltd. Pharmaceuticals 458,659 1,515.64 1.48GlaxoSmithKline ConsumerHealthcare Limited Consumer Non Durables 210,000 1,479.03 1.45Hindustan Petroleum Corporation Ltd. Petroleum Products 532,000 1,432.41 1.40Jagran Prakashan Limited Media & Entertainment 2,511,993 1,430.58 1.40Apollo Tyres Ltd Auto Ancillaries 7,059,813 1,288.42 1.26Tata Steel Limited Ferrous Metals 600,000 1,235.40 1.21HDFC Bank Ltd. Banks 125,000 1,216.75 1.19Larsen & Toubro Limited Construction Project 180,000 1,208.52 1.18Amtek Auto Ltd Auto Ancillaries 1,590,233 1,181.54 1.16United Spirits Limited Consumer Non Durables 177,999 1,155.12 1.13Motilal Oswal Financial Services Limited Finance 1,341,450 1,028.89 1.01The Federal Bank Ltd Banks 705,418 972.77 0.95Pidilite Industries Ltd Chemicals 1,000,000 847.00 0.83Wyeth Limited Pharmaceuticals 200,000 836.40 0.82Maruti Suzuki India Limited Auto 79,400 619.20 0.61Sundram Fasteners Ltd Auto Ancillaries 4,055,000 602.17 0.59Kotak Mahindra Bank Limited Banks 200,000 564.40 0.55Ballarpur Industries Limited Paper 3,800,000 558.60 0.55Patni Computer Systems Limited Software 410,000 528.29 0.52Sadbhav Engineering Limited Construction 153,850 489.63 0.48KEC International Limited Power 291,976 444.83 0.44Punj Lloyd Limited Construction Project 400,000 364.00 0.363M India Limited Trading 12,800 114.80 0.11Global Vectra Helicorp Limited Transportation 216,000 54.00 0.05Nelcast Limited Industrial Products 91,719 20.82 0.02Subtotal 93,751.88 91.72(b) Unlisted Nil NilTotal 93,751.88 91.72DEBT INSTRUMENTS(a) Listed / awaiting listing onStock ExchangesGovernment Securities Nil NilNon-Convertible debentures / Bonds Nil Nil(b) Privately Placed / UnlistedNon-Convertible debentures / Bonds Nil Nil(c) Securitized Debt Instruments Nil NilTotal Nil NilMONEY MARKET INSTRUMENTSBills Rediscounting Nil NilCommercial Papers (CP) /Certificate of Deposit (CD) Nil NilSubtotal Nil NilTreasury bills Nil NilCollateralised Borrowing &Lending Obligation 4,092.45 4.00Subtotal 4,092.45 4.00Fixed DepositsDeposits(maturity not exceeding 91 days) Nil NilTotal 4,092.45 4.00OTHERSNet Current Assets 4,377.64 4.28Grand Total 102,221.97 100.00
Notes :1) Total NPAs provided for and its percentage to NAV : Nil2) Total value and percentage of Illiquid Equity Shares : Nil
3) NAVs at a Glance March 31, 2009 September 30, 2008NAV per Unit (Rs.) Growth Plan 97.063 132.682
Dividend Plan 30.193 49.0534) For details on dividend declared during the half-year ended March 31, 2009, please refer to Dividend History Table.5) Total outstanding exposure in Derivative Instruments : Rs. 809.05 Lacs6) Total investments in Foreign Securities / Overseas ETFs : Nil7) Portfolio Turnover Ratio ¥ : 54.96%8) Investments in Fixed Deposits : Nil(�) Top Ten Holdings, (+) Industry Classification as recommended by AMFI.
HDFC ARBITRAGE FUND(AN OPEN-ENDED EQUITY FUND)
Name of the Instrument Industry Quantity Market/ % to+/Rating Fair Value NAV
(Rs. In Lakhs)EQUITY & EQUITY RELATED(Quantity fully hedged usingfutures / options)(a) Listed / awaiting listing onStock Exchanges
� Reliance Industries Ltd. Petroleum Products 70,500 1,074.95 3.23� Infosys Technologies Ltd. Software 74,800 990.28 2.97� GTL Limited Telecom - Equipment &
Accessories 393,000 941.63 2.84� Jindal Steel & Power Ltd. Ferrous Metals 75,520 910.43 2.74� ICICI Bank Ltd Banks 225,400 750.13 2.26� State Bank of India Banks 69,960 746.54 2.25� Housing Development
Finance Corporation Ltd.$ Finance 44,100 622.78 1.88� Century Textiles & Industries Ltd Cement 276,448 608.05 1.83
Steel Authority of India Ltd. Ferrous Metals 518,400 500.00 1.51Oil & Natural Gas Corpn Ltd Oil 63,450 495.04 1.49Tata Steel Limited Ferrous Metals 239,896 493.95 1.49ITC Ltd. Consumer Non Durables 263,250 486.62 1.47Jaiprakash Associates Limited Cement 576,000 484.42 1.46Crompton Greaves Ltd Industrial Capital Goods 376,000 464.36 1.40Infrastructure DevelopmentFinance Company Limited Finance 849,600 459.63 1.39Punj Lloyd Limited Construction Project 496,500 451.82 1.36IFCI Limited Finance 2,143,360 413.67 1.25Cairn India Limited Oil 212,500 391.21 1.18United Spirits Limited Consumer Non Durables 60,000 389.37 1.17Reliance Power Limited Power 362,000 370.51 1.12Indiabulls Real Estate Limited Construction 348,400 346.31 1.04Bharat Forge Ltd Industrial Products 348,000 340.52 1.03Tata Power Co. Ltd. Power 43,600 335.11 1.01Reliance Infrastructure Limited Power 59,064 304.50 0.92Reliance Petroleum Limited Petroleum Products 318,250 302.66 0.91Bajaj Hindusthan Ltd Consumer Non Durables 627,000 300.65 0.91Kesoram Industries Ltd. Cement 212,000 286.84 0.86Chambal Fertilizers & Chemicals Ltd Fertilisers 676,200 282.99 0.85Sesa Goa Ltd. Minerals/ Mining 282,000 280.87 0.85Balrampur Chini Mills Ltd Consumer Non Durables 528,000 278.78 0.84HCL Technologies Ltd Software 265,200 270.64 0.82Sun Pharmaceuticals Industries Ltd Pharmaceuticals 23,175 257.58 0.78Nagarjuna Fertilizer & Chemicals Ltd. Fertilisers 1,428,000 254.18 0.77Indian Overseas Bank Banks 542,800 247.52 0.75IDBI Bank Limited Banks 537,600 244.07 0.74Hindustan Construction Co. Ltd Construction Project 562,800 220.05 0.66Mahanagar Telephone Nigam Ltd. Telecom - Services 313,600 216.38 0.65Syndicate Bank Banks 444,600 213.63 0.64Bharti Airtel Limited Telecom - Services 33,500 209.63 0.63Tata Communications Limited Telecom - Services 38,850 201.38 0.61Bharat Heavy Electricals Ltd Industrial Capital Goods 13,200 199.39 0.60Reliance Natural Resources Limited Gas 436,272 195.67 0.593i Infotech Limited Software 594,000 193.05 0.58NTPC Limited Power 107,250 192.89 0.58JSW Steel Limited Ferrous Metals 80,850 188.26 0.57Axis Bank Limited Banks 45,000 186.73 0.56K S Oils Limited Consumer Non Durables 430,700 181.97 0.55The Great Eastern Shipping Co. Limited Transportation 91,200 173.05 0.52The India Cements Limited Cement 153,700 162.92 0.49Kotak Mahindra Bank Limited Banks 57,200 161.42 0.49Jaiprakash Hydro-Power Limited Power 537,500 156.68 0.47Idea Cellular Limited Telecom - Services 307,800 154.21 0.46Adlabs Films Limited Media & Entertainment 90,000 152.15 0.46Praj Industries Ltd Industrial Capital Goods 242,000 141.45 0.43JSL Limited Ferrous Metals 344,000 133.13 0.40Dish TV India Limited Media & Entertainment 535,600 128.54 0.39Larsen & Toubro Limited Construction Project 17,600 118.17 0.36UltraTech Cement Limited Cement 20,000 110.27 0.33Oriental Bank of Commerce Banks 98,400 108.34 0.33Ranbaxy Laboratories Ltd Pharmaceuticals 64,000 106.05 0.32Lakshmi Machine Works Ltd. Industrial Capital Goods 20,800 104.74 0.32Oracle Financial ServicesSoftware Limited Software 13,800 102.45 0.31Aptech Limited Software 113,100 94.21 0.28NIIT Limited Software 461,100 93.37 0.28Gujarat Narmada Valley Fertilizer Co. Ltd. Fertilisers 153,400 92.65 0.28Zee Entertainment Enterprises Ltd Media & Entertainment 86,800 92.31 0.28Suzlon Energy Limited Industrial Capital Goods 216,000 91.48 0.28Alok Industries Limited Textile Products 731,016 91.38 0.28Welspun Gujarat Stahl Rohren Limited Ferrous Metals 112,000 83.38 0.25The Indian Hotels Company Limited Hotels 205,092 80.91 0.24Bank of India Banks 36,100 79.20 0.24India Infoline Limited Finance 135,000 79.18 0.24Tata Motors Limited Auto 42,500 76.63 0.23Housing Development andInfrastructure Limited Construction 92,880 76.02 0.23Ashok Leyland Ltd Auto 401,100 72.80 0.22Arvind Limited Textile Products 533,200 71.45 0.22GVK Power & Infrastructure Limited Power 304,000 71.14 0.21TVS Motor Company Limited Auto 295,000 66.97 0.20New Delhi Television Limited Media & Entertainment 72,600 63.02 0.19Petronet LNG Limited Gas 140,800 54.70 0.16Bombay Dyeing & Mfg Co. Ltd Textiles - Cotton 27,000 45.36 0.14Chennai Petroleum Corporation Limited Petroleum Products 46,800 44.18 0.13Rajesh Exports Ltd. Consumer Non Durables 158,400 39.84 0.12Yes Bank Limited Banks 70,400 35.20 0.11Neyveli Lignite Corporation Limited Power 41,300 34.65 0.10Dena Bank Banks 105,000 34.02 0.10Mercator Lines Limited Transportation 117,600 33.28 0.10Rural Electrification Corporation Ltd. Finance 31,200 29.98 0.09Polaris Software Lab Limited Software 56,000 25.23 0.08Hindalco Industries Ltd. Non - Ferrous Metals 28,144 14.65 0.04SRF Ltd. Auto Ancillaries 12,000 8.92 0.03Voltas Ltd. Construction Project 10,800 4.98 0.02Gujarat State Petronet Limited Gas 12,200 4.68 0.01Subtotal 22,576.98 68.05(b) UnlistedAlok Industries Ltd. Rights Mar 09 Textile Products 2,210,497 Nil NilSubtotal Nil NilTotal 22,577.20 68.05DEBT INSTRUMENTS(a) Listed / awaiting listing onStock ExchangesGovernment Securities Nil NilNon-Convertible debentures / Bonds
� Sundaram Finance Ltd.** LAA+ 50 505.29 1.52Citicorp Finance (India) Ltd.** AA+ 30 298.50 0.90Subtotal 803.79 2.42(b) Privately Placed / Unlisted

HDFC Asset Management Company LimitedA Joint Venture with Standard Life Investments Limited
Registered Office: Ramon House, 3rd Floor, H.T. Parekh Marg, 169, Backbay Reclamation, Churchgate, Mumbai 400 020.Investor Services Centre (at Mumbai) : Mistry Bhawan, 2nd Floor, 122, Backbay Reclamation, Dinsha Vachha Road, Churchgate, Mumbai - 400 020 • Tel.: 022-6631 6300 • Toll-free number : 1800 233 6767 • Fax : 022-2282 1144 • e-mail : [email protected] • Visit us at : www.hdfcfund.com
HALF-YEARLY PORTFOLIO STATEMENT OF THE SCHEMES / PLANS OF HDFC MUTUAL FUND AS ON 31ST MARCH 2009[ Pursuant to Regulation 59A of Securities and Exchange Board of India (Mutual Funds) Regulations, 1996 ]
Page: 14 (continued....)¥ Portfolio Turnover Ratio = Lower of purchases or sales of securities during the twelve months ended March 31, 2009 / Average Net Assets during the twelve months ended March 31, 2009.
Name of the Instrument Industry Quantity Market/ % to+/Rating Fair Value NAV
(Rs. In Lakhs)Non-Convertible debentures / Bonds Nil Nil(c) Securitized Debt Instruments
� PTA Loan Trust** P1+ (SO) 7 626.68 1.89Subtotal 626.68 1.89Total 1,430.47 4.31MONEY MARKET INSTRUMENTSBills Rediscounting Nil NilCommercial Papers (CP) /Certificate of Deposit (CD)State Bank Of Hyderabad** P1+ 350 333.40 1.00Subtotal 333.40 1.00Treasury bills Nil NilCollateralised Borrowing &Lending Obligation 30.00 0.09Subtotal 30.00 0.09Fixed DepositsDeposits(maturity not exceeding 91 days)HDFC Bank Ltd. 600.00 1.81Deposits (Placed as Margin,maturity not exceeding 329 days)HDFC Bank Ltd. 3,000.00 9.04Axis Bank Ltd. 2,500.00 7.53Central Bank of India 1,940.00 5.85Subtotal 8,040.00 24.23Total 8,403.40 25.32OTHERSNet Current Assets 769.78 2.32Grand Total 33,180.85 100.00
Notes :1) Total NPAs provided for and its percentage to NAV : Nil2) Total value and percentage of Illiquid Equity Shares : Nil3) NAVs at a Glance :
Wholesale Plan March 31, 2009 September 30, 2008NAV per Unit ( Rs.) Growth Option 11.202 10.791
Monthly Dividend Option 10.040 10.063Quarterly Dividend Option 10.028 10.063
Retail Plan March 31, 2009 September 30, 2008NAV per Unit ( Rs.) Growth Option 11.161 10.765
Monthly Dividend Option 10.038 10.062Quarterly Dividend Option 10.028 10.063
4) For details on dividend declared during the half-year ended March 31, 2009, please refer to Dividend History Table.5) Total outstanding exposure in Derivative Instruments : Rs. 22,630 Lacs6) Total investments in Foreign Securities / Overseas ETFs : Nil7) Portfolio Turnover Ratio ¥ : 248.64%8) Investments in Fixed Deposits : Rs. 8,040.00 Lacs(�) Top Ten Holdings, (+) Industry Classification as recommended by AMFI, (##) All dividends are on face value ofRs.10 per Unit, ($) Sponsor.
HDFC LONG TERM EQUITY FUND(A 5 year close-ended Equity Scheme with automatic conversion
into an open-ended Scheme upon maturity)
Name of the Instrument Industry Quantity Market/ % to+/Rating Fair Value NAV
(Rs. In Lakhs)
EQUITY & EQUITY RELATED(a) Listed / awaiting listing onStock Exchanges
� State Bank of India Banks 411,290 4,388.88 6.04� Hero Honda Motors Ltd. Auto 396,200 4,243.90 5.84� Nestle India Ltd. Consumer Non Durables 255,683 3,979.45 5.47� Biocon Limited Pharmaceuticals 2,498,252 3,576.25 4.92� Britannia Industries Ltd Consumer Non Durables 239,593 3,354.42 4.61� Aventis Pharma Limited Pharmaceuticals 337,101 3,311.68 4.55� Divi’s Laboratories Limited Pharmaceuticals 308,662 2,914.70 4.01� Crompton Greaves Ltd Industrial Capital Goods 2,282,920 2,819.41 3.88� Exide Industries Ltd. Auto Ancillaries 6,303,112 2,606.34 3.58� Bharat Petroleum Corpn. Ltd Petroleum Products 635,402 2,389.43 3.29
ICICI Bank Ltd Banks 617,348 2,054.53 2.83ITC Ltd. Consumer Non Durables 1,100,000 2,033.35 2.80Hindustan Petroleum Corporation Ltd. Petroleum Products 750,000 2,019.38 2.78Bharti Airtel Limited Telecom - Services 317,500 1,986.76 2.73Axis Bank Limited Banks 450,000 1,867.28 2.57Zee Entertainment Enterprises Ltd Media & Entertainment 1,609,980 1,712.21 2.35IPCA Laboratories Ltd. Pharmaceuticals 425,136 1,404.86 1.93Pidilite Industries Ltd Chemicals 1,631,373 1,381.77 1.90United Phosphorous Limited Pesticides 1,223,438 1,202.03 1.65MphasiS Limited Software 585,000 1,189.01 1.63AIA Engineering Limited Industrial Capital Goods 873,635 1,091.61 1.50Reliance Industries Ltd. Petroleum Products 70,000 1,067.33 1.47IRB Infrastructure Developers Limited Transportation 1,282,920 1,039.81 1.43Oil & Natural Gas Corpn Ltd Oil 125,000 975.25 1.34Atlas Copco ( India) Ltd. Industrial Products 207,808 951.55 1.31Sadbhav Engineering Limited Construction 291,000 926.11 1.27Jagran Prakashan Limited Media & Entertainment 1,492,056 849.73 1.17Punjab National Bank Banks 200,000 822.90 1.13Hindustan Unilever Limited Diversified 335,000 795.63 1.09Trent Ltd. Retailing 220,096 729.07 1.00Aarti Industries Ltd. Chemicals 2,561,438 726.17 1.00CESC Ltd. Power 325,000 685.75 0.94Vesuvius India Ltd Industrial Products 774,950 612.21 0.84Shanthi Gears Ltd Auto Ancillaries 1,992,915 512.18 0.70KEC International Limited Power 236,737 360.67 0.50KCP Ltd Cement 228,591 297.17 0.41KNR Constructions Limited Construction 647,410 247.31 0.34Suven Life Sciences Limited Pharmaceuticals 2,054,411 225.99 0.31Manugraph India Ltd. Industrial Capital Goods 615,811 182.59 0.25Vimta Labs Limited Pharmaceuticals 700,000 110.95 0.15Maytas Infra Limited Construction 269,230 93.56 0.13Subtotal 63,739.18 87.64(b) Unlisted Nil NilTotal 63,739.18 87.64DEBT INSTRUMENTS(a) Listed / awaiting listing onStock ExchangesGovernment Securities Nil NilNon-Convertible debentures / BondsHousing DevelopmentFinance Corporation Ltd.**$ AAA 100 1,000.69 1.38Subtotal 1,000.69 1.38(b) Privately Placed / UnlistedNon-Convertible debentures / Bonds Nil Nil(c) Securitized Debt Instruments Nil NilTotal 1,000.69 1.38MONEY MARKET INSTRUMENTSBills Rediscounting Nil NilCommercial Papers (CP) /Certificate of Deposit (CD) Nil NilTreasury bills Nil NilCollateralised Borrowing &Lending Obligation 5,849.22 8.04Subtotal 5,849.22 8.04Fixed DepositsDeposits(maturity not exceeding 91 days) Nil NilTotal 5,849.22 8.04OTHERSNet Current Assets 2,136.97 2.94Grand Total 72,726.06 100.00
Notes:1) Total NPAs provided for and its percentage to NAV : Nil2) Total value and percentage of Illiquid Equity Shares : Nil
3) NAVs at a Glance March 31, 2009 September 30, 2008NAV per Unit (Rs.) Growth Option 7.512 10.258
Dividend Option 6.874 9.3884) Total outstanding exposure in Derivative Instruments: Rs. 2,562.96 Lacs5) Total investments in Foreign Securities / Overseas ETFs : Nil6) Portfolio Turnover Ratio ¥ : 74.83%7) Investments in Fixed Deposits : Nil(�) Top Ten Holdings, (+) Industry Classification as recommended by AMFI, (**) Thinly Traded / Non-Traded Securities,($) Sponsor.
HDFC MID-CAP OPPORTUNITIES FUND(A 3 year Close-ended Equity Scheme with automatic
conversion into an open-ended scheme upon maturity)
Name of the Instrument Industry Quantity Market/ % toFair Value NAV
(Rs. In Lakhs)EQUITY & EQUITY RELATED(a) Listed / awaiting listing onStock Exchanges
� GlaxoSmithKline ConsumerHealthcare Limited Consumer Non Durables 480,000 3,380.64 4.80
� United Phosphorous Limited Pesticides 2,921,414 2,870.29 4.07� Castrol India Ltd Petroleum Products 829,316 2,718.91 3.86� Crompton Greaves Ltd Industrial Capital Goods 2,122,500 2,621.29 3.72� Marico Limited Consumer Non Durables 4,196,767 2,530.65 3.60� Britannia Industries Ltd Consumer Non Durables 162,631 2,276.92 3.24� Axis Bank Limited Banks 525,000 2,178.49 3.10� Hindustan Petroleum Corporation Ltd. Petroleum Products 800,000 2,154.00 3.06� Colgate Palmolive (India) Ltd Consumer Non Durables 440,000 2,073.28 2.95� ICICI Bank Ltd Banks 550,000 1,830.40 2.60
The Federal Bank Ltd Banks 1,247,270 1,719.99 2.45Dabur India Ltd Consumer Non Durables 1,725,000 1,711.20 2.43Divi’s Laboratories Limited Pharmaceuticals 180,000 1,699.74 2.42Union Bank of India Banks 1,100,000 1,615.35 2.30Pidilite Industries Ltd Chemicals 1,749,770 1,482.06 2.11Exide Industries Ltd. Auto Ancillaries 3,336,229 1,379.53 1.96Carborundum Universal Ltd Industrial Products 1,735,407 1,366.63 1.94Bharat Electronics Ltd Industrial Capital Goods 153,448 1,356.94 1.93Biocon Limited Pharmaceuticals 947,495 1,356.34 1.93IPCA Laboratories Ltd. Pharmaceuticals 400,000 1,321.80 1.88Jain Irrigation Systems Limited Industrial Products 385,000 1,315.93 1.87United Spirits Limited Consumer Non Durables 200,000 1,297.90 1.85Container Corporation of India Limited Transportation 176,511 1,268.94 1.80Solar Explosives Limited Chemicals 583,180 1,236.63 1.76Aventis Pharma Limited Pharmaceuticals 125,000 1,228.00 1.75Micro Inks Limited Chemicals 861,229 1,162.66 1.65Zee Entertainment Enterprises Ltd Media & Entertainment 1,000,000 1,063.50 1.51Amara Raja Batteries Ltd Auto Ancillaries 2,775,000 1,017.04 1.45The Paper Products Limited Industrial Products 2,688,217 970.45 1.38Blue Star Limited Consumer Durables 600,000 932.40 1.33Esab India Ltd Industrial Products 297,300 918.95 1.31Indraprastha Gas Limited Gas 805,500 881.62 1.25Dishman Pharmaceuticalsand Chemicals Limited Pharmaceuticals 846,375 842.14 1.20Thermax Ltd Industrial Capital Goods 457,676 826.79 1.18Punj Lloyd Limited Construction Project 900,000 819.00 1.16Amtek India Limited Auto Ancillaries 2,512,850 766.42 1.09Jagran Prakashan Limited Media & Entertainment 1,302,905 742.00 1.05LIC Housing Finance Ltd Finance 330,000 740.52 1.05Dr. Reddy’s Laboratories Ltd. Pharmaceuticals 150,000 735.30 1.05Maharashtra Seamless Ltd Ferrous Metals 513,100 731.42 1.04Sintex Industries Ltd. Industrial Products 694,883 679.94 0.97Tata Elxsi (India) Ltd Software 737,500 606.23 0.86VIP Industries Ltd. Consumer Non Durables 1,774,670 604.28 0.86Sundram Fasteners Ltd Auto Ancillaries 4,061,502 603.13 0.86NRB Bearing Limited Industrial Products 1,692,000 554.98 0.79Shriram Transport Finance Co. Ltd. Finance 298,527 549.89 0.78Grindwell Norton Limited Industrial Products 689,154 529.61 0.75Patni Computer Systems Limited Software 382,780 493.21 0.70Kalindee Rail Nirman (Engineers) Limited Construction 541,924 486.92 0.69Amtek Auto Ltd Auto Ancillaries 558,937 415.29 0.59Ador Welding Limited Industrial Products 423,557 342.02 0.49ISMT Limited Ferrous Metals 1,363,500 271.34 0.39Subtotal 65,278.90 92.81(b) Unlisted Nil NilTotal 65,278.90 92.81DEBT INSTRUMENTS(a) Listed / awaiting listing onStock ExchangesGovernment Securities Nil NilNon-Convertible debentures / Bonds Nil Nil(b) Privately Placed / UnlistedNon-Convertible debentures / Bonds Nil Nil(c) Securitized Debt Instruments Nil NilTotal Nil NilMONEY MARKET INSTRUMENTSBills Rediscounting Nil NilCommercial Papers (CP) /Certificate of Deposit (CD) Nil NilTreasury bills Nil NilCollateralised Borrowing &Lending Obligation 2,245.70 3.19Subtotal 2,245.70 3.19Fixed DepositsDeposits(maturity not exceeding 91 days) Nil NilTotal 2,245.70 3.19OTHERSNet Current Assets 2,816.40 4.00Grand Total 70,341.00 100.00
Notes:1) Total NPAs provided for and its percentage to NAV : Nil2) Total value and percentage of Illiquid Equity Shares : Nil
3) NAVs at a Glance March 31, 2009 September 30, 2008NAV per Unit (Rs.) Growth Option 5.876 8.288
Dividend Option 5.876 8.2884) Total outstanding exposure in Derivative Instruments : Nil 6) Portfolio Turnover Ratio ¥ : 38.23%5) Total investments in Foreign Securities / Overseas ETFs : Nil 7) Investments in Fixed Deposits : Nil(�) Top Ten Holdings, (+) Industry Classification as recommended by AMFI.
HDFC INFRASTRUCTURE FUND(A 3 year Close-ended Equity Scheme with automatic
conversion into an open-ended scheme upon maturity)Name of the Instrument Industry Quantity Market/ % to
Fair Value NAV(Rs. In Lakhs)
EQUITY & EQUITY RELATED(a) Listed / awaiting listing onStock Exchanges
� State Bank of India Banks 695,000 7,416.35 8.83� ICICI Bank Ltd Banks 1,400,000 4,659.20 5.56� Oil & Natural Gas Corpn Ltd Oil 574,800 4,484.59 5.35� Hero Honda Motors Ltd. Auto 398,000 4,263.18 5.08� IRB Infrastructure Developers Limited Transportation 4,788,075 3,880.73 4.63� Crompton Greaves Ltd Industrial Capital Goods 2,567,470 3,170.83 3.78� Bank of Baroda Banks 1,276,000 2,990.31 3.57� Bharat Petroleum Corpn. Ltd Petroleum Products 700,000 2,632.35 3.14� Sun Pharmaceuticals Industries Ltd Pharmaceuticals 200,000 2,222.90 2.65� Noida Toll Bridge Company Ltd Transportation 8,900,000 2,118.20 2.53
Name of the Instrument Industry Quantity Market/ % toFair Value NAV
(Rs. In Lakhs)Rural Electrification Corporation Ltd. Finance 2,201,613 2,115.75 2.52Zee Entertainment Enterprises Ltd Media & Entertainment 1,863,068 1,981.37 2.36LIC Housing Finance Ltd Finance 850,000 1,907.40 2.27ITC Ltd. Consumer Non Durables 1,000,000 1,848.50 2.20Container Corporation of India Limited Transportation 252,000 1,811.63 2.16Motherson Sumi Systems Ltd. Auto Ancillaries 2,620,000 1,773.74 2.11Power Finance Corporation Limited Finance 1,210,000 1,749.66 2.09Nagarjuna Construction Co. Ltd Construction Project 2,791,361 1,725.06 2.06Axis Bank Limited Banks 390,000 1,618.31 1.93KEC International Limited Power 1,035,108 1,576.99 1.88Punjab National Bank Banks 350,000 1,440.08 1.72The Federal Bank Ltd Banks 1,000,000 1,379.00 1.64Sadbhav Engineering Limited Construction 424,911 1,352.28 1.61Thermax Ltd Industrial Capital Goods 730,900 1,320.37 1.57Gujarat Industries Power Co. Ltd Power 2,764,779 1,292.53 1.54HT Media Limited Media & Entertainment 1,931,860 1,131.10 1.35Hindustan Petroleum Corporation Ltd. Petroleum Products 420,000 1,130.85 1.35Ingersoll Rand (India) Ltd. Industrial Capital Goods 410,000 1,078.10 1.29Tata Consultancy Services Limited Software 200,000 1,077.10 1.28Tata Steel Limited Ferrous Metals 479,200 986.67 1.18Dr. Reddy’s Laboratories Ltd. Pharmaceuticals 184,853 906.15 1.08C & C Constructions Limited Construction 876,000 875.56 1.04Blue Star Limited Consumer Durables 558,645 868.13 1.04United Spirits Limited Consumer Non Durables 120,000 778.74 0.93Reliance Industries Ltd. Petroleum Products 50,000 762.38 0.91Indraprastha Gas Limited Gas 606,000 663.27 0.79Infosys Technologies Ltd. Software 50,000 661.95 0.79Carborundum Universal Ltd Industrial Products 817,193 643.54 0.77Elecon Engineering Co Ltd Industrial Capital Goods 2,007,331 623.28 0.74Housing DevelopmentFinance Corporation Ltd.$ Finance 42,500 600.19 0.72Gammon India Ltd. Construction Project 734,000 421.32 0.50Honeywell Automation India Limited Industrial Capital Goods 40,000 300.12 0.36Titagarh Wagons Limited Industrial Capital Goods 159,092 225.43 0.27KNR Constructions Limited Construction 489,895 187.14 0.22Maytas Infra Limited Construction 534,954 185.90 0.22Atlas Copco ( India) Ltd. Industrial Products 16,000 73.26 0.09Subtotal 76,911.49 91.70(b) Unlisted Nil NilTotal 76,911.49 91.70DEBT INSTRUMENTS(a) Listed / awaiting listing onStock ExchangesGovernment Securities Nil NilNon-Convertible debentures / Bonds Nil Nil(b) Privately Placed / UnlistedNon-Convertible debentures / Bonds Nil Nil(c) Securitized Debt Instruments Nil NilTotal Nil NilMONEY MARKET INSTRUMENTSBills Rediscounting Nil NilCommercial Papers (CP) /Certificate of Deposit (CD) Nil NilTreasury billsCollateralised Borrowing &Lending Obligation 786.89 0.94Subtotal 786.89 0.94Fixed DepositsDeposits(maturity not exceeding 91 days) Nil NilTotal 786.89 0.94OTHERSNet Current Assets 6,173.03 7.36Grand Total 83,871.41 100.00
Notes :1) Total NPAs provided for and its percentage to NAV : Nil2) Total value and percentage of Illiquid Equity Shares : Nil
3) NAVs at a Glance March 31, 2009 September 30, 2008NAV per Unit (Rs.) Growth Option 5.182 7.609
Dividend Option 5.182 7.6094) Total outstanding exposure in Derivative Instruments : Nil 6) Portfolio Turnover Ratio ¥ : 41.51%5) Total investments in Foreign Securities / Overseas ETFs : Nil 7) Investments in Fixed Deposits : Nil(�) Top Ten Holdings, (+) Industry Classification as recommended by AMFI, ($) Sponsor.
HDFC MF MONTHLY INCOME PLAN - SHORT TERM PLAN(AN OPEN-ENDED INCOME SCHEME)
Name of the Instrument Industry Quantity Market/ % to+/Rating Fair Value NAV
(Rs. In Lakhs)
EQUITY & EQUITY RELATED(a) Listed / awaiting listing onStock Exchanges
� ITC Ltd. Consumer Non Durables 50,000 92.43 1.38The Federal Bank Ltd Banks 65,000 89.64 1.34TV Today Network Limited Media & Entertainment 134,500 88.10 1.32Crompton Greaves Ltd Industrial Capital Goods 69,000 85.22 1.27Procter & Gamble Hygiene andHealth Care Limited Consumer Non Durables 9,500 71.33 1.07Jagran Prakashan Limited Media & Entertainment 125,000 71.19 1.06ICICI Bank Ltd Banks 19,000 63.23 0.94Lupin Limited Pharmaceuticals 9,200 62.98 0.94Biocon Limited Pharmaceuticals 36,000 51.53 0.77Pidilite Industries Ltd Chemicals 60,000 50.82 0.76IRB Infrastructure Developers Limited Transportation 50,000 40.53 0.61Blue Star Limited Consumer Durables 25,000 38.85 0.58Motherson Sumi Systems Ltd. Auto Ancillaries 55,000 37.24 0.56Amtek Auto Ltd Auto Ancillaries 50,000 37.15 0.55United Phosphorous Limited Pesticides 30,000 29.48 0.44Nagarjuna Construction Co. Ltd Construction Project 45,000 27.81 0.42Sadbhav Engineering Limited Construction 2,500 7.96 0.12Trent Ltd. Retailing 38,624 2.57 0.04Subtotal 948.06 14.17(b) Unlisted Nil NilTotal 948.06 14.17DEBT INSTRUMENTS(a) Listed / awaiting listing onStock ExchangesGovernment Securities Nil NilNon-Convertible debentures / Bonds
� Housing DevelopmentFinance Corporation Ltd.**$ AAA 200 2,008.21 29.99
� Shriram Transport Finance Co. Ltd.** AA (ind) 55 550.00 8.22� Kotak Mahindra Prime Ltd.** P1+ 50 494.02 7.38� Indian Railways Finance Corporation Ltd.** AAA 30 335.74 5.02� Tata Sons Ltd.** AAA 10 93.93 1.40
Subtotal 3,481.90 52.01(b) Privately Placed / UnlistedNon-Convertible debentures / Bonds
� Dr. Reddy’s Holding Pvt.Ltd.** P1+ 5 499.21 7.46Subtotal 499.21 7.46(c) Securitized Debt Instruments
� Auto Securitisation Trust MP A May 2008** AAA (SO) 6 672.11 10.04� ILSS 1 Trust 2009 ** AAA (SO) 5 466.05 6.96� Credit Asset Trust Series XLIX** F1+ (ind) (SO) 4 435.98 6.51
Subtotal 1,574.14 23.51
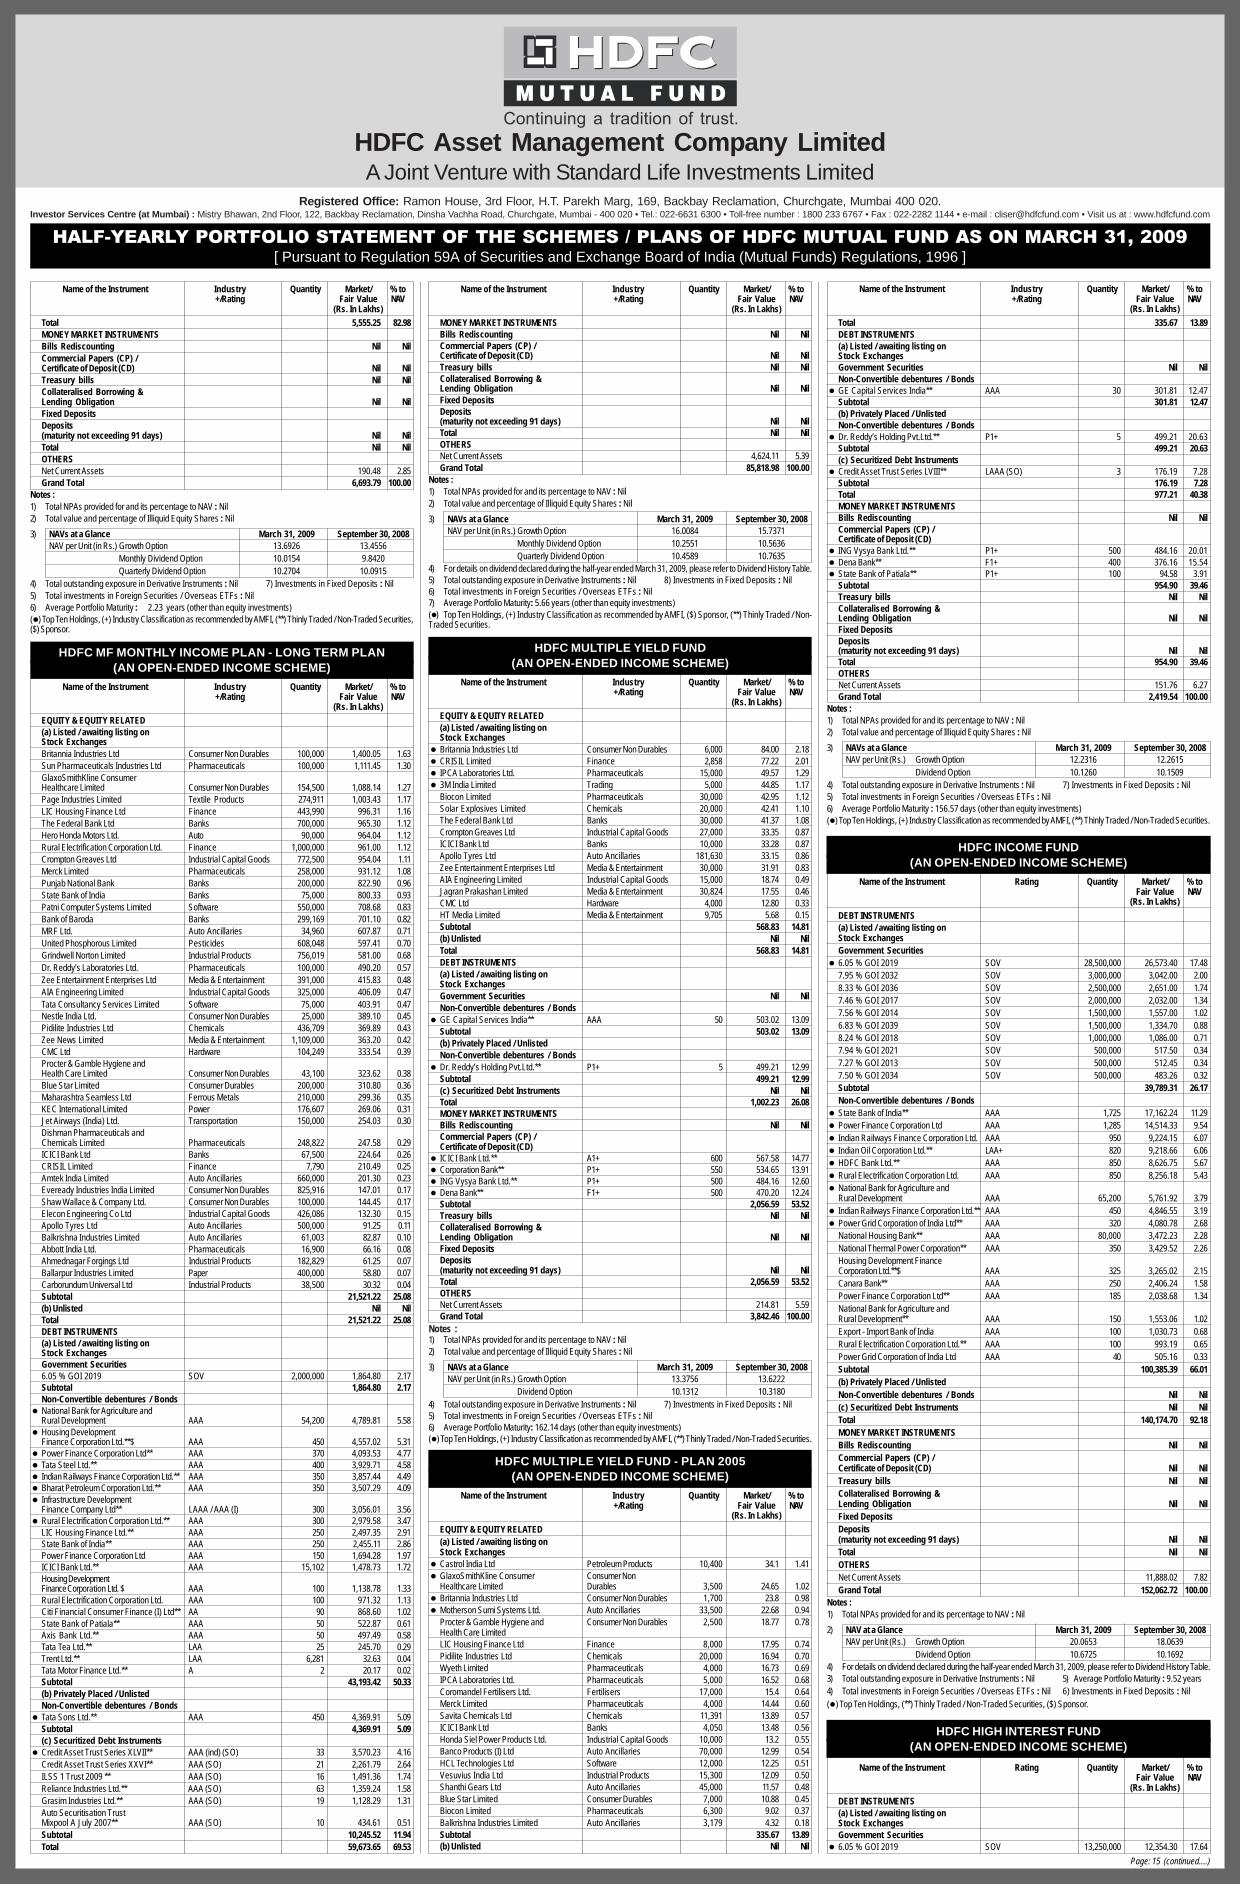
HDFC Asset Management Company LimitedA Joint Venture with Standard Life Investments Limited
Registered Office: Ramon House, 3rd Floor, H.T. Parekh Marg, 169, Backbay Reclamation, Churchgate, Mumbai 400 020.Investor Services Centre (at Mumbai) : Mistry Bhawan, 2nd Floor, 122, Backbay Reclamation, Dinsha Vachha Road, Churchgate, Mumbai - 400 020 • Tel.: 022-6631 6300 • Toll-free number : 1800 233 6767 • Fax : 022-2282 1144 • e-mail : [email protected] • Visit us at : www.hdfcfund.com
HALF-YEARLY PORTFOLIO STATEMENT OF THE SCHEMES / PLANS OF HDFC MUTUAL FUND AS ON MARCH 31, 2009[ Pursuant to Regulation 59A of Securities and Exchange Board of India (Mutual Funds) Regulations, 1996 ]
Page: 15 (continued....)
Name of the Instrument Industry Quantity Market/ % to+/Rating Fair Value NAV
(Rs. In Lakhs)Total 5,555.25 82.98MONEY MARKET INSTRUMENTSBills Rediscounting Nil NilCommercial Papers (CP) /Certificate of Deposit (CD) Nil NilTreasury bills Nil NilCollateralised Borrowing &Lending Obligation Nil NilFixed DepositsDeposits(maturity not exceeding 91 days) Nil NilTotal Nil NilOTHERSNet Current Assets 190.48 2.85Grand Total 6,693.79 100.00
Notes :1) Total NPAs provided for and its percentage to NAV : Nil2) Total value and percentage of Illiquid Equity Shares : Nil
3) NAVs at a Glance March 31, 2009 September 30, 2008NAV per Unit (in Rs.) Growth Option 13.6926 13.4556
Monthly Dividend Option 10.0154 9.8420Quarterly Dividend Option 10.2704 10.0915
4) Total outstanding exposure in Derivative Instruments : Nil 7) Investments in Fixed Deposits : Nil5) Total investments in Foreign Securities / Overseas ETFs : Nil6) Average Portfolio Maturity : 2.23 years (other than equity investments)(�) Top Ten Holdings, (+) Industry Classification as recommended by AMFI, (**) Thinly Traded / Non-Traded Securities,($) Sponsor.
HDFC MF MONTHLY INCOME PLAN - LONG TERM PLAN(AN OPEN-ENDED INCOME SCHEME)
Name of the Instrument Industry Quantity Market/ % to+/Rating Fair Value NAV
(Rs. In Lakhs)EQUITY & EQUITY RELATED(a) Listed / awaiting listing onStock ExchangesBritannia Industries Ltd Consumer Non Durables 100,000 1,400.05 1.63Sun Pharmaceuticals Industries Ltd Pharmaceuticals 100,000 1,111.45 1.30GlaxoSmithKline ConsumerHealthcare Limited Consumer Non Durables 154,500 1,088.14 1.27Page Industries Limited Textile Products 274,911 1,003.43 1.17LIC Housing Finance Ltd Finance 443,990 996.31 1.16The Federal Bank Ltd Banks 700,000 965.30 1.12Hero Honda Motors Ltd. Auto 90,000 964.04 1.12Rural Electrification Corporation Ltd. Finance 1,000,000 961.00 1.12Crompton Greaves Ltd Industrial Capital Goods 772,500 954.04 1.11Merck Limited Pharmaceuticals 258,000 931.12 1.08Punjab National Bank Banks 200,000 822.90 0.96State Bank of India Banks 75,000 800.33 0.93Patni Computer Systems Limited Software 550,000 708.68 0.83Bank of Baroda Banks 299,169 701.10 0.82MRF Ltd. Auto Ancillaries 34,960 607.87 0.71United Phosphorous Limited Pesticides 608,048 597.41 0.70Grindwell Norton Limited Industrial Products 756,019 581.00 0.68Dr. Reddy’s Laboratories Ltd. Pharmaceuticals 100,000 490.20 0.57Zee Entertainment Enterprises Ltd Media & Entertainment 391,000 415.83 0.48AIA Engineering Limited Industrial Capital Goods 325,000 406.09 0.47Tata Consultancy Services Limited Software 75,000 403.91 0.47Nestle India Ltd. Consumer Non Durables 25,000 389.10 0.45Pidilite Industries Ltd Chemicals 436,709 369.89 0.43Zee News Limited Media & Entertainment 1,109,000 363.20 0.42CMC Ltd Hardware 104,249 333.54 0.39Procter & Gamble Hygiene andHealth Care Limited Consumer Non Durables 43,100 323.62 0.38Blue Star Limited Consumer Durables 200,000 310.80 0.36Maharashtra Seamless Ltd Ferrous Metals 210,000 299.36 0.35KEC International Limited Power 176,607 269.06 0.31Jet Airways (India) Ltd. Transportation 150,000 254.03 0.30Dishman Pharmaceuticals andChemicals Limited Pharmaceuticals 248,822 247.58 0.29ICICI Bank Ltd Banks 67,500 224.64 0.26CRISIL Limited Finance 7,790 210.49 0.25Amtek India Limited Auto Ancillaries 660,000 201.30 0.23Eveready Industries India Limited Consumer Non Durables 825,916 147.01 0.17Shaw Wallace & Company Ltd. Consumer Non Durables 100,000 144.45 0.17Elecon Engineering Co Ltd Industrial Capital Goods 426,086 132.30 0.15Apollo Tyres Ltd Auto Ancillaries 500,000 91.25 0.11Balkrishna Industries Limited Auto Ancillaries 61,003 82.87 0.10Abbott India Ltd. Pharmaceuticals 16,900 66.16 0.08Ahmednagar Forgings Ltd Industrial Products 182,829 61.25 0.07Ballarpur Industries Limited Paper 400,000 58.80 0.07Carborundum Universal Ltd Industrial Products 38,500 30.32 0.04Subtotal 21,521.22 25.08(b) Unlisted Nil NilTotal 21,521.22 25.08DEBT INSTRUMENTS(a) Listed / awaiting listing onStock ExchangesGovernment Securities6.05 % GOI 2019 SOV 2,000,000 1,864.80 2.17Subtotal 1,864.80 2.17Non-Convertible debentures / Bonds
� National Bank for Agriculture andRural Development AAA 54,200 4,789.81 5.58
� Housing DevelopmentFinance Corporation Ltd.**$ AAA 450 4,557.02 5.31
� Power Finance Corporation Ltd** AAA 370 4,093.53 4.77� Tata Steel Ltd.** AAA 400 3,929.71 4.58� Indian Railways Finance Corporation Ltd.** AAA 350 3,857.44 4.49� Bharat Petroleum Corporation Ltd.** AAA 350 3,507.29 4.09� Infrastructure Development
Finance Company Ltd** LAAA / AAA (I) 300 3,056.01 3.56� Rural Electrification Corporation Ltd.** AAA 300 2,979.58 3.47
LIC Housing Finance Ltd.** AAA 250 2,497.35 2.91State Bank of India** AAA 250 2,455.11 2.86Power Finance Corporation Ltd AAA 150 1,694.28 1.97ICICI Bank Ltd.** AAA 15,102 1,478.73 1.72Housing DevelopmentFinance Corporation Ltd. $ AAA 100 1,138.78 1.33Rural Electrification Corporation Ltd. AAA 100 971.32 1.13Citi Financial Consumer Finance (I) Ltd** AA 90 868.60 1.02State Bank of Patiala** AAA 50 522.87 0.61Axis Bank Ltd.** AAA 50 497.49 0.58Tata Tea Ltd.** LAA 25 245.70 0.29Trent Ltd.** LAA 6,281 32.63 0.04Tata Motor Finance Ltd.** A 2 20.17 0.02Subtotal 43,193.42 50.33(b) Privately Placed / UnlistedNon-Convertible debentures / Bonds
� Tata Sons Ltd.** AAA 450 4,369.91 5.09Subtotal 4,369.91 5.09(c) Securitized Debt Instruments
� Credit Asset Trust Series XLVII** AAA (ind) (SO) 33 3,570.23 4.16Credit Asset Trust Series XXVI** AAA (SO) 21 2,261.79 2.64ILSS 1 Trust 2009 ** AAA (SO) 16 1,491.36 1.74Reliance Industries Ltd.** AAA (SO) 63 1,359.24 1.58Grasim Industries Ltd.** AAA (SO) 19 1,128.29 1.31Auto Securitisation TrustMixpool A July 2007** AAA (SO) 10 434.61 0.51Subtotal 10,245.52 11.94Total 59,673.65 69.53
Name of the Instrument Industry Quantity Market/ % to+/Rating Fair Value NAV
(Rs. In Lakhs)MONEY MARKET INSTRUMENTSBills Rediscounting Nil NilCommercial Papers (CP) /Certificate of Deposit (CD) Nil NilTreasury bills Nil NilCollateralised Borrowing &Lending Obligation Nil NilFixed DepositsDeposits(maturity not exceeding 91 days) Nil NilTotal Nil NilOTHERSNet Current Assets 4,624.11 5.39Grand Total 85,818.98 100.00
Notes :1) Total NPAs provided for and its percentage to NAV : Nil2) Total value and percentage of Illiquid Equity Shares : Nil
3) NAVs at a Glance March 31, 2009 September 30, 2008NAV per Unit (in Rs.) Growth Option 16.0084 15.7371
Monthly Dividend Option 10.2551 10.5636Quarterly Dividend Option 10.4589 10.7635
4) For details on dividend declared during the half-year ended March 31, 2009, please refer to Dividend History Table.5) Total outstanding exposure in Derivative Instruments : Nil 8) Investments in Fixed Deposits : Nil6) Total investments in Foreign Securities / Overseas ETFs : Nil7) Average Portfolio Maturity: 5.66 years (other than equity investments)(�) Top Ten Holdings, (+) Industry Classification as recommended by AMFI, ($) Sponsor, (**) Thinly Traded / Non-Traded Securities.
HDFC MULTIPLE YIELD FUND(AN OPEN-ENDED INCOME SCHEME)
Name of the Instrument Industry Quantity Market/ % to+/Rating Fair Value NAV
(Rs. In Lakhs)EQUITY & EQUITY RELATED(a) Listed / awaiting listing onStock Exchanges
� Britannia Industries Ltd Consumer Non Durables 6,000 84.00 2.18� CRISIL Limited Finance 2,858 77.22 2.01� IPCA Laboratories Ltd. Pharmaceuticals 15,000 49.57 1.29� 3M India Limited Trading 5,000 44.85 1.17
Biocon Limited Pharmaceuticals 30,000 42.95 1.12Solar Explosives Limited Chemicals 20,000 42.41 1.10The Federal Bank Ltd Banks 30,000 41.37 1.08Crompton Greaves Ltd Industrial Capital Goods 27,000 33.35 0.87ICICI Bank Ltd Banks 10,000 33.28 0.87Apollo Tyres Ltd Auto Ancillaries 181,630 33.15 0.86Zee Entertainment Enterprises Ltd Media & Entertainment 30,000 31.91 0.83AIA Engineering Limited Industrial Capital Goods 15,000 18.74 0.49Jagran Prakashan Limited Media & Entertainment 30,824 17.55 0.46CMC Ltd Hardware 4,000 12.80 0.33HT Media Limited Media & Entertainment 9,705 5.68 0.15Subtotal 568.83 14.81(b) Unlisted Nil NilTotal 568.83 14.81DEBT INSTRUMENTS(a) Listed / awaiting listing onStock ExchangesGovernment Securities Nil NilNon-Convertible debentures / Bonds
� GE Capital Services India** AAA 50 503.02 13.09Subtotal 503.02 13.09(b) Privately Placed / UnlistedNon-Convertible debentures / Bonds
� Dr. Reddy’s Holding Pvt.Ltd.** P1+ 5 499.21 12.99Subtotal 499.21 12.99(c) Securitized Debt Instruments Nil NilTotal 1,002.23 26.08MONEY MARKET INSTRUMENTSBills Rediscounting Nil NilCommercial Papers (CP) /Certificate of Deposit (CD)
� ICICI Bank Ltd.** A1+ 600 567.58 14.77� Corporation Bank** P1+ 550 534.65 13.91� ING Vysya Bank Ltd.** P1+ 500 484.16 12.60� Dena Bank** F1+ 500 470.20 12.24
Subtotal 2,056.59 53.52Treasury bills Nil NilCollateralised Borrowing &Lending Obligation Nil NilFixed DepositsDeposits(maturity not exceeding 91 days) Nil NilTotal 2,056.59 53.52OTHERSNet Current Assets 214.81 5.59Grand Total 3,842.46 100.00
Notes :1) Total NPAs provided for and its percentage to NAV : Nil2) Total value and percentage of Illiquid Equity Shares : Nil
3) NAVs at a Glance March 31, 2009 September 30, 2008NAV per Unit (in Rs.) Growth Option 13.3756 13.6222
Dividend Option 10.1312 10.31804) Total outstanding exposure in Derivative Instruments : Nil 7) Investments in Fixed Deposits : Nil5) Total investments in Foreign Securities / Overseas ETFs : Nil6) Average Portfolio Maturity: 162.14 days (other than equity investments)(�) Top Ten Holdings, (+) Industry Classification as recommended by AMFI, (**) Thinly Traded / Non-Traded Securities.
HDFC MULTIPLE YIELD FUND - PLAN 2005(AN OPEN-ENDED INCOME SCHEME)
Name of the Instrument Industry Quantity Market/ % to+/Rating Fair Value NAV
(Rs. In Lakhs)
EQUITY & EQUITY RELATED(a) Listed / awaiting listing onStock Exchanges
� Castrol India Ltd Petroleum Products 10,400 34.1 1.41� GlaxoSmithKline Consumer Consumer Non
Healthcare Limited Durables 3,500 24.65 1.02� Britannia Industries Ltd Consumer Non Durables 1,700 23.8 0.98� Motherson Sumi Systems Ltd. Auto Ancillaries 33,500 22.68 0.94
Procter & Gamble Hygiene and Consumer Non Durables 2,500 18.77 0.78Health Care LimitedLIC Housing Finance Ltd Finance 8,000 17.95 0.74Pidilite Industries Ltd Chemicals 20,000 16.94 0.70Wyeth Limited Pharmaceuticals 4,000 16.73 0.69IPCA Laboratories Ltd. Pharmaceuticals 5,000 16.52 0.68Coromandel Fertilisers Ltd. Fertilisers 17,000 15.4 0.64Merck Limited Pharmaceuticals 4,000 14.44 0.60Savita Chemicals Ltd Chemicals 11,391 13.89 0.57ICICI Bank Ltd Banks 4,050 13.48 0.56Honda Siel Power Products Ltd. Industrial Capital Goods 10,000 13.2 0.55Banco Products (I) Ltd Auto Ancillaries 70,000 12.99 0.54HCL Technologies Ltd Software 12,000 12.25 0.51Vesuvius India Ltd Industrial Products 15,300 12.09 0.50Shanthi Gears Ltd Auto Ancillaries 45,000 11.57 0.48Blue Star Limited Consumer Durables 7,000 10.88 0.45Biocon Limited Pharmaceuticals 6,300 9.02 0.37Balkrishna Industries Limited Auto Ancillaries 3,179 4.32 0.18Subtotal 335.67 13.89(b) Unlisted Nil Nil
Name of the Instrument Industry Quantity Market/ % to+/Rating Fair Value NAV
(Rs. In Lakhs)
Total 335.67 13.89DEBT INSTRUMENTS(a) Listed / awaiting listing onStock ExchangesGovernment Securities Nil NilNon-Convertible debentures / Bonds
� GE Capital Services India** AAA 30 301.81 12.47Subtotal 301.81 12.47(b) Privately Placed / UnlistedNon-Convertible debentures / Bonds
� Dr. Reddy’s Holding Pvt.Ltd.** P1+ 5 499.21 20.63Subtotal 499.21 20.63(c) Securitized Debt Instruments
� Credit Asset Trust Series LVIII** LAAA (SO) 3 176.19 7.28Subtotal 176.19 7.28Total 977.21 40.38MONEY MARKET INSTRUMENTSBills Rediscounting Nil NilCommercial Papers (CP) /Certificate of Deposit (CD)
� ING Vysya Bank Ltd.** P1+ 500 484.16 20.01� Dena Bank** F1+ 400 376.16 15.54� State Bank of Patiala** P1+ 100 94.58 3.91
Subtotal 954.90 39.46Treasury bills Nil NilCollateralised Borrowing &Lending Obligation Nil NilFixed DepositsDeposits(maturity not exceeding 91 days) Nil NilTotal 954.90 39.46OTHERSNet Current Assets 151.76 6.27Grand Total 2,419.54 100.00
Notes :1) Total NPAs provided for and its percentage to NAV : Nil2) Total value and percentage of Illiquid Equity Shares : Nil
3) NAVs at a Glance March 31, 2009 September 30, 2008NAV per Unit (Rs.) Growth Option 12.2316 12.2615
Dividend Option 10.1260 10.15094) Total outstanding exposure in Derivative Instruments : Nil 7) Investments in Fixed Deposits : Nil5) Total investments in Foreign Securities / Overseas ETFs : Nil6) Average Portfolio Maturity : 156.57 days (other than equity investments)(�) Top Ten Holdings, (+) Industry Classification as recommended by AMFI, (**) Thinly Traded / Non-Traded Securities.
HDFC INCOME FUND(AN OPEN-ENDED INCOME SCHEME)
Name of the Instrument Rating Quantity Market/ % toFair Value NAV
(Rs. In Lakhs)
DEBT INSTRUMENTS(a) Listed / awaiting listing onStock ExchangesGovernment Securities
� 6.05 % GOI 2019 SOV 28,500,000 26,573.40 17.487.95 % GOI 2032 SOV 3,000,000 3,042.00 2.008.33 % GOI 2036 SOV 2,500,000 2,651.00 1.747.46 % GOI 2017 SOV 2,000,000 2,032.00 1.347.56 % GOI 2014 SOV 1,500,000 1,557.00 1.026.83 % GOI 2039 SOV 1,500,000 1,334.70 0.888.24 % GOI 2018 SOV 1,000,000 1,086.00 0.717.94 % GOI 2021 SOV 500,000 517.50 0.347.27 % GOI 2013 SOV 500,000 512.45 0.347.50 % GOI 2034 SOV 500,000 483.26 0.32Subtotal 39,789.31 26.17Non-Convertible debentures / Bonds
� State Bank of India** AAA 1,725 17,162.24 11.29� Power Finance Corporation Ltd AAA 1,285 14,514.33 9.54� Indian Railways Finance Corporation Ltd. AAA 950 9,224.15 6.07� Indian Oil Corporation Ltd.** LAA+ 820 9,218.66 6.06� HDFC Bank Ltd.** AAA 850 8,626.75 5.67� Rural Electrification Corporation Ltd. AAA 850 8,256.18 5.43� National Bank for Agriculture and
Rural Development AAA 65,200 5,761.92 3.79� Indian Railways Finance Corporation Ltd.** AAA 450 4,846.55 3.19� Power Grid Corporation of India Ltd** AAA 320 4,080.78 2.68
National Housing Bank** AAA 80,000 3,472.23 2.28National Thermal Power Corporation** AAA 350 3,429.52 2.26Housing Development FinanceCorporation Ltd.**$ AAA 325 3,265.02 2.15Canara Bank** AAA 250 2,406.24 1.58Power Finance Corporation Ltd** AAA 185 2,038.68 1.34National Bank for Agriculture andRural Development** AAA 150 1,553.06 1.02Export - Import Bank of India AAA 100 1,030.73 0.68Rural Electrification Corporation Ltd.** AAA 100 993.19 0.65Power Grid Corporation of India Ltd AAA 40 505.16 0.33Subtotal 100,385.39 66.01(b) Privately Placed / UnlistedNon-Convertible debentures / Bonds Nil Nil(c) Securitized Debt Instruments Nil NilTotal 140,174.70 92.18MONEY MARKET INSTRUMENTSBills Rediscounting Nil NilCommercial Papers (CP) /Certificate of Deposit (CD) Nil NilTreasury bills Nil NilCollateralised Borrowing &Lending Obligation Nil NilFixed DepositsDeposits(maturity not exceeding 91 days) Nil NilTotal Nil NilOTHERSNet Current Assets 11,888.02 7.82Grand Total 152,062.72 100.00
Notes :1) Total NPAs provided for and its percentage to NAV : Nil
2) NAV at a Glance March 31, 2009 September 30, 2008NAV per Unit (Rs.) Growth Option 20.0653 18.0639
Dividend Option 10.6725 10.16924) For details on dividend declared during the half-year ended March 31, 2009, please refer to Dividend History Table.3) Total outstanding exposure in Derivative Instruments : Nil 5) Average Portfolio Maturity : 9.52 years4) Total investments in Foreign Securities / Overseas ETFs : Nil 6) Investments in Fixed Deposits : Nil(�) Top Ten Holdings, (**) Thinly Traded / Non-Traded Securities, ($) Sponsor.
HDFC HIGH INTEREST FUND(AN OPEN-ENDED INCOME SCHEME)
Name of the Instrument Rating Quantity Market/ % toFair Value NAV
(Rs. In Lakhs)DEBT INSTRUMENTS(a) Listed / awaiting listing onStock ExchangesGovernment Securities
� 6.05 % GOI 2019 SOV 13,250,000 12,354.30 17.64

HDFC Asset Management Company LimitedA Joint Venture with Standard Life Investments Limited
Registered Office: Ramon House, 3rd Floor, H.T. Parekh Marg, 169, Backbay Reclamation, Churchgate, Mumbai 400 020.Investor Services Centre (at Mumbai) : Mistry Bhawan, 2nd Floor, 122, Backbay Reclamation, Dinsha Vachha Road, Churchgate, Mumbai - 400 020 • Tel.: 022-6631 6300 • Toll-free number : 1800 233 6767 • Fax : 022-2282 1144 • e-mail : [email protected] • Visit us at : www.hdfcfund.com
HALF-YEARLY PORTFOLIO STATEMENT OF THE SCHEMES / PLANS OF HDFC MUTUAL FUND AS ON MARCH 31, 2009[ Pursuant to Regulation 59A of Securities and Exchange Board of India (Mutual Funds) Regulations, 1996 ]
Page: 16 (continued....)
Name of the Instrument Rating Quantity Market/ % toFair Value NAV
(Rs. In Lakhs)
� 7.95 % GOI 2032 SOV 5,500,000 5,577.00 7.97� 8.33 % GOI 2036 SOV 2,250,000 2,385.90 3.41
7.56 % GOI 2014 SOV 2,000,000 2,076.00 2.978.24 % GOI 2018 SOV 500,000 543.00 0.787.94 % GOI 2021 SOV 500,000 517.50 0.747.27 % GOI 2013 SOV 500,000 512.45 0.737.61 % GOI 2015 SOV 250,000 250.13 0.3611.30 % GOI 2010 SOV 5,000 5.39 0.01Subtotal 24,221.67 34.61Non-Convertible debentures / Bonds
� Indian Oil Corporation Ltd.** LAA+ 580 6,520.52 9.32� National Bank for Agriculture and
Rural Development** AAA 450 4,601.60 6.58� State Bank of India** AAA 425 4,191.34 5.99� Power Finance Corporation Ltd AAA 365 4,122.75 5.89� Power Grid Corporation of India Ltd** AAA 320 4,076.90 5.82� Indian Railways Finance Corporation Ltd. AAA 400 3,884.61 5.55� HDFC Bank Ltd.** AAA 300 3,053.93 4.36
National Bank for Agriculture andRural Development AAA 24,550 2,169.56 3.10National Housing Bank** AAA 44,400 1,927.09 2.75Housing DevelopmentFinance Corporation Ltd.**$ AAA 175 1,753.12 2.50National Thermal Power Corporation** AAA 150 1,469.79 2.10Rural Electrification Corporation Ltd. AAA 150 1,456.97 2.08Power Finance Corporation Ltd** AAA 100 1,106.36 1.58Indian Railways Finance Corporation Ltd.** AAA 65 720.59 1.03Neyveli Lignite Corporation Ltd.** AAA 50 503.10 0.72Subtotal 41,558.23 59.37(b) Privately Placed / UnlistedNon-Convertible debentures / Bonds Nil Nil(c) Securitized Debt Instruments Nil NilTotal 65,779.90 93.98MONEY MARKET INSTRUMENTSBills Rediscounting Nil NilCommercial Papers (CP) /Certificate of Deposit (CD)Andhra Bank** F1+ 1,500 1,423.51 2.03Punjab National Bank** F1+ 1,000 943.46 1.35Subtotal 2,366.97 3.38Treasury bills Nil NilCollateralised Borrowing &Lending Obligation Nil NilFixed DepositsDeposits(maturity not exceeding 91 days) Nil NilTotal 2,366.97 3.38OTHERSNet Current Assets 1,844.51 2.64Grand Total 69,991.38 100.00
Notes :1) Total NPAs provided for and its percentage to NAV : Nil2) NAVs at a Glance March 31, 2009 September 30, 2008
NAV per Unit (Rs.) Growth Plan 29.2142 26.7207Quarterly Dividend Option 10.8883 10.5172Half-Yearly Dividend Option 10.6097 10.2824Yearly Dividend Option 11.1237 10.8583
3) For details on dividend declared during the half-year ended March 31, 2009, please refer to Dividend History Table.4) Total outstanding exposure in Derivative Instruments : Nil 6) Average Portfolio Maturity : 10.12 years5) Total investments in Foreign Securities / Overseas ETFs : Nil 7) Investments in Fixed Deposits : Nil(�) Top Ten Holdings, (**) Thinly Traded / Non-Traded Securities, ($) Sponsor.
HDFC HIGH INTEREST FUND - SHORT TERM PLAN(AN OPEN-ENDED INCOME SCHEME)
Name of the Instrument Rating Quantity Market/ % toFair Value NAV
(Rs. In Lakhs)
DEBT INSTRUMENTS(a) Listed / awaiting listing onStock ExchangesGovernment Securities Nil NilNon-Convertible debentures / Bonds
� Indian Railways Finance Corporation Ltd.** AAA 600 6,196.60 8.01� LIC Housing Finance Ltd.** AAA 500 5,081.90 6.57� Infrastructure Development
Finance Company Ltd** AAA / LAAA 350 3,483.00 4.51� Power Finance Corporation Ltd** AAA 315 3,213.16 4.14� Rural Electrification Corporation Ltd. AAA 250 2,740.96 3.54� National Bank for Agriculture and
Rural Development** AAA 250 2,588.43 3.34Export - Import Bank of India AAA 250 2,576.83 3.33Bharat Petroleum Corporation Ltd.** AAA 250 2,505.21 3.23Reliance Industries Ltd.** AAA 200 2,220.13 2.87ACC Ltd.** AAA 100 1,089.73 1.41Power Grid Corporation of India Ltd** AAA 80 1,033.63 1.33Tata Steel Ltd.** AAA 100 989.08 1.28ICICI Home Finance Ltd** AAA 100 987.68 1.28Citi Financial Consumer Finance (I) Ltd** AA 100 977.84 1.26Shriram Transport Finance Co. Ltd.** AA (ind) 70 700.00 0.90Housing DevelopmentFinance Corporation Ltd.**$ AAA 55 574.64 0.74Rural Electrification Corporation Ltd.** AAA 50 534.04 0.69Indian Oil Corporation Ltd.** LAA+ 50 531.31 0.69Indian Railways Finance Corporation Ltd. AAA 50 501.66 0.65Citicorp Finance (India) Ltd.** AA+ 50 497.50 0.64Subtotal 39,023.33 50.41(b) Privately Placed / UnlistedNon-Convertible debentures / BondsDr. Reddy’s Holding Pvt.Ltd.** P1+ 10 998.42 1.29Subtotal 998.42 1.29(c) Securitized Debt Instruments
� NOVO IV Trust** AAA (ind) (SO) 530 4,262.88 5.50UBL Trust Series 61** P1+ (SO) 24 2,414.89 3.12Grasim Industries Ltd.** AAA (SO) 24 1,425.21 1.84Auto Securitisation Trust MP A May 2008** AAA (SO) 11 1,232.20 1.59ILSS 1 Trust 2009 ** AAA (SO) 11 1,025.31 1.32BHPC Auto Securitisation Trust Feb 08 I** AAA (SO) 6 646.15 0.83Credit Asset Trust Series XLVII** AAA (ind) (SO) 5 540.94 0.70Indian Corporate LoanTrust 2008 Series 7** PR1+ (SO) 5 493.73 0.64Transportation Loan Trust Series 1** AAA (SO) 3 199.28 0.26Subtotal 12,240.59 15.80Total 52,262.34 67.50MONEY MARKET INSTRUMENTSBills Rediscounting Nil NilCommercial Papers (CP) /Certificate of Deposit (CD)
� ICICI Bank Ltd.** A1+ / P1+ 6,499 6,083.25 7.85� ONGC Videsh Limited** P1+ (SO) 900 4,237.95 5.47� State Bank of Hyderabad** P1+ 3,500 3,333.98 4.30
Canara Bank** P1+ 2,500 2,329.60 3.01LIC Housing Finance Ltd.** P1+ 500 2,328.93 3.01Kotak Mahindra Bank Ltd.** P1+ 1,000 964.03 1.24Oriental Bank of Commerce** P1+ 1,000 951.87 1.23Dena Bank** F1+ 1,000 940.41 1.21Corporation Bank** P1+ 600 583.26 0.75State Bank of Patiala** P1+ 500 481.91 0.62
Name of the Instrument Rating Quantity Market/ % toFair Value NAV
(Rs. In Lakhs)
Subtotal 22,235.19 28.69Treasury bills Nil NilCollateralised Borrowing &Lending Obligation Nil NilFixed DepositsDeposits(maturity not exceeding 91 days) Nil NilTotal 22,235.19 28.69OTHERSNet Current Assets 2,953.25 3.81Grand Total 77,450.78 100.00
Notes :1) Total NPAs provided for and its percentage to NAV : Nil
2) NAVs at a Glance March 31, 2009 September 30, 2008NAV per Unit (Rs.) Growth Option 16.9474 15.6800
Dividend Option (Monthly) 10.6054 10.66663) For details on dividend declared during the half-year ended March 31, 2009, please refer to Dividend History Table.4) Total outstanding exposure in Derivative Instruments : Nil 6) Investments in Fixed Deposits : Nil5) Total investments in Foreign Securities / Overseas ETFs : Nil 7) Average Portfolio Maturity : 2.05 years(�) Top Ten Holdings, (**) Thinly Traded / Non-Traded Securities, ($) Sponsor
HDFC SHORT TERM PLAN(AN OPEN-ENDED INCOME SCHEME)
Name of the Instrument Rating Quantity Market/ % toFair Value NAV
(Rs. In Lakhs)
DEBT INSTRUMENTS(a) Listed / awaiting listing onStock ExchangesGovernment Securities Nil NilNon-Convertible debentures / Bonds
� National Bank for Agriculture andRural Development** AAA 1,150 11,831.32 11.61
� Power Finance Corporation Ltd AAA 700 7,186.84 7.05� Power Finance Corporation Ltd** AAA 625 6,409.26 6.29� LIC Housing Finance Ltd.** AAA 600 6,108.75 5.99� Rural Electrification Corporation Ltd.** AAA 580 6,095.88 5.98� Indian Oil Corporation Ltd.** AA+ / LAA+ 560 5,633.11 5.53
Indian Railways Finance Corporation Ltd.** AAA 350 3,554.45 3.48Rural Electrification Corporation Ltd. AAA 300 3,245.92 3.19Indian Railways Finance Corporation Ltd. AAA 200 2,006.64 1.97Power Grid Corporation of India Ltd** AAA 120 1,534.12 1.51Export - Import Bank of India AAA 100 1,030.73 1.01Bharat Petroleum Corporation Ltd.** AAA 50 501.04 0.49Subtotal 55,138.06 54.10(b) Privately Placed / UnlistedNon-Convertible debentures / Bonds Nil Nil(c) Securitized Debt Instruments
� NOVO IV Trust** AAA (ind) (SO) 700 5,485.12 5.39Subtotal 5,485.12 5.39Total 5,485.12 5.39MONEY MARKET INSTRUMENTSBills Rediscounting Nil NilCommercial Papers (CP) /Certificate of Deposit (CD)
� Punjab National Bank** F1+ 8,000 7,488.85 7.35� Dena Bank** F1+ 7,500 6,968.13 6.84� ONGC Videsh Limited** P1+ (SO) 1,000 4,708.83 4.62
State Bank of Patiala** P1+ 5,000 4,683.81 4.60UCO Bank** P1+ 5,000 4,642.73 4.56Allahabad Bank** P1+ 3,750 3,588.74 3.52Hindustan Petroleum Corporation Ltd.** P1+ 500 2,348.58 2.30ICICI Bank Ltd.** P1+ 2,500 2,311.08 2.27The Federal Bank Ltd.** P1+ 1,500 1,413.38 1.39Oriental Bank of Commerce** P1+ 1,300 1,232.02 1.21LIC Housing Finance Ltd.** P1+ 200 931.57 0.91State Bank of Hyderabad** P1+ 500 471.82 0.46Subtotal 40,789.54 40.03Treasury bills Nil NilCollateralised Borrowing &Lending Obligation Nil NilFixed DepositsDeposits(maturity not exceeding 91 days) Nil NilTotal 40,789.54 40.03OTHERSNet Current Assets 486.31 0.48Grand Total 101,899.03 100.00
Notes :1) Total NPAs provided for and its percentage to NAV : Nil2) NAVs at a Glance March 31, 2009 September 30, 2008
NAV per Unit (Rs.) Growth Option 16.7245 15.2503Dividend Reinvestment Option 10.3411 10.3434
3) For details on dividend declared during the half-year ended March 31, 2009, please refer to Dividend History Table.3) Total outstanding exposure in Derivative Instruments : Nil 5) Average Portfolio Maturity : 2.07 years4) Total investments in Foreign Securities / Overseas ETFs : Nil 6) Investments in Fixed Deposits : Nil(�) Top Ten Holdings, (**) Thinly Traded / Non-Traded Securities.
HDFC GILT FUND - SHORT TERM PLAN(AN OPEN-ENDED INCOME SCHEME)
Name of the Instrument Rating Quantity Market/ % toFair Value NAV
(Rs. In Lakhs)
DEBT INSTRUMENTS(a) Listed / awaiting listing onStock ExchangesGovernment Securities5.48 % GOI 2009 SOV 1,500,000 1,500.60 43.367.56 % GOI 2014 SOV 500,000 519.00 14.997.27 % GOI 2013 SOV 500,000 512.45 14.809.39 % GOI 2011 SOV 250,000 269.33 7.78Subtotal 2,801.38 80.93Non-Convertible debentures / Bonds Nil Nil(b) Privately Placed / UnlistedNon-Convertible debentures / Bonds Nil Nil(c) Securitized Debt Instruments Nil NilTotal 2,801.38 80.93MONEY MARKET INSTRUMENTSBills Rediscounting Nil NilCommercial Papers (CP) /Certificate of Deposit (CD) Nil NilTreasury bills Nil NilCollateralised Borrowing &Lending Obligation Nil NilFixed DepositsDeposits(maturity not exceeding 91 days) Nil NilTotal Nil NilOTHERSNet Current Assets 660.22 19.07Grand Total 3,461.60 100.00
Notes :1) Total NPAs provided for and its percentage to NAV : Nil2) NAVs at a Glance March 31, 2009 September 30, 2008
NAV per Unit (Rs.) Growth Option 15.3990 14.8534Dividend Option 10.5978 10.6086
3) For details on dividend declared during the half-year ended March 31, 2009, please refer to Dividend History Table.4) Total outstanding exposure in Derivative Instruments : Nil 6) Average Portfolio Maturity: 1.76 years5) Total investments in Foreign Securities / Overseas ETFs : Nil 7) Investments in Fixed Deposits : Nil
HDFC GILT FUND - LONG TERM PLAN(AN OPEN-ENDED INCOME SCHEME)
Name of the Instrument Rating Quantity Market/ % toFair Value NAV
(Rs. In Lakhs)DEBT INSTRUMENTS(a) Listed / awaiting listing onStock ExchangesGovernment Securities6.05 % GOI 2019 SOV 6,250,000 5,827.50 51.747.95 % GOI 2032 SOV 1,500,000 1,521.00 13.508.24 % GOI 2018 SOV 1,000,000 1,086.00 9.647.56 % GOI 2014 SOV 1,000,000 1,038.00 9.219.39 % GOI 2011 SOV 250,000 269.33 2.398.33 % GOI 2036 SOV 250,000 265.10 2.35Subtotal 10,006.93 88.83Non-Convertible debentures / Bonds Nil Nil(b) Privately Placed / UnlistedNon-Convertible debentures / Bonds Nil Nil(c) Securitized Debt Instruments Nil NilTotal 10,006.93 88.83MONEY MARKET INSTRUMENTSBills Rediscounting Nil NilCommercial Papers (CP) /Certificate of Deposit (CD) Nil NilTreasury bills Nil NilCollateralised Borrowing &Lending Obligation Nil NilFixed DepositsDeposits(maturity not exceeding 91 days) Nil NilTotal Nil NilOTHERSNet Current Assets 1,258.01 11.17Grand Total 11,264.94 100.00
Notes :1) Total NPAs provided for and its percentage to NAV : Nil
2) NAVs at a Glance March 31, 2009 September 30, 2008NAV per Unit (Rs.) Growth Option 17.9840 17.0346
Dividend Option 10.2652 10.27363) For details on dividend declared during the half-year ended March 31, 2009, please refer to Dividend History Table.4) Total outstanding exposure in Derivative Instruments : Nil 6) Average Portfolio Maturity : 10.34 years5) Total investments in Foreign Securities / Overseas ETFs : Nil 7) Investments in Fixed Deposits : Nil
HDFC FLOATING RATE INCOME FUND - SHORT TERM(AN OPEN-ENDED INCOME SCHEME)
Name of the Instrument Rating Quantity Market/ % toFair Value NAV
(Rs. In Lakhs)DEBT INSTRUMENTS(a) Listed / awaiting listing onStock ExchangesGovernment Securities Nil NilNon-Convertible debentures / Bonds
� Bharat Petroleum Corporation Ltd.** AAA 500 5,010.42 3.58ICICI Home Finance Ltd** AAA 400 3,950.70 2.82Infrastructure DevelopmentFinance Company Ltd** LAAA/AAA 300 2,962.16 2.12Housing DevelopmentFinance Corporation Ltd.**$ AAA 270 2,662.48 1.90Tata Steel Ltd.** AAA 250 2,500.00 1.78Export - Import Bank of India** AAA 200 2,028.07 1.45Citicorp Maruti Finance Ltd.** AA+ 200 1,994.38 1.42National Bank for Agricultureand Rural Development** AAA 100 1,013.10 0.72SREI Infrastructure Finance Ltd.** AA 450 447.85 0.32Subtotal 22,569.16 16.11(b) Privately Placed / UnlistedNon-Convertible debentures / Bonds Nil Nil(c) Securitized Debt Instruments
� Indian Retail ABS Trust 96 2008** AAA (SO) 87 8,524.25 6.08Indian InfrastructureEquipments Trust MAR 08** LAAA (SO) 40 4,397.80 3.14Bajaj Auto Ltd.** AAA (SO) 71 3,976.42 2.84Credit Asset Trust Series LXIV** F1+ (SO) 28 2,803.25 2.00SME Retail Pool III Trust** AAA (SO) 47 1,962.15 1.40Indian Retail ABS Trust 95** AAA (SO) 23 1,892.07 1.35India Loan SecuritisationSeries 5 Trust 2008 ** AAA (SO) 30 1,374.00 0.98Investment Vehicle 1508** AAA (SO) 16 1,340.63 0.96Corporate Debt Trust Series 11** A1+ (SO) 150 889.17 0.63India Loan Securitisation EC9Trust 2008** LAAA (SO) 8 658.74 0.47Auto Securitisation Trust Oct 07** AA (SO) 9 650.04 0.46Corporate Loan Series 60** AAA (SO) 5 507.65 0.36Credit Asset Trust Series XVII ** AA (SO) 8 456.84 0.33Indian Loans ReceivableTrust Dec 2007** A (SO) 4 426.78 0.30SME Retail Pool II Trust** AAA (SO) 4 356.44 0.25BHPC Auto Securitisation Trust Nov II** AAA (SO) 3 292.08 0.21CE Pool Trust June 2007** LAAA (SO) 15 185.08 0.13ILSS 1 Trust 2009 ** P1+ (SO) 15 95.67 0.07Subtotal 30,789.06 21.96Total 53,358.22 38.07MONEY MARKET INSTRUMENTSBills Rediscounting Nil NilPrivately Placed / UnlistedCommercial Papers (CP) /Certificate of Deposit (CD)
� State Bank Of Hyderabad** P1+ 14,000 13,450.77 9.59� State Bank of Patiala** P1+ 9,900 9,369.77 6.68� Allahabad Bank** P1+ 8,150 7,662.06 5.46� The Federal Bank Ltd.** P1+ 7,500 7,030.01 5.01� Canara Bank** P1+ 6,450 6,006.20 4.28� State Bank of Mysore** A1+ 6,000 5,797.82 4.13� Syndicate Bank** PR1+ 5,000 4,760.98 3.39� State Bank of Indore** P1+ 5,000 4,739.76 3.38
ICICI Home Finance Ltd** A1+ 1,000 4,619.48 3.29ICICI Bank Ltd.** P1+/A1+ 4,750 4,397.20 3.13Vijaya Bank** PR1+ 3,900 3,627.06 2.59UCO Bank** P1+ 2,500 2,417.64 1.72LIC Housing Finance Ltd.** P1+ 500 2,328.93 1.66BHW Birla Home Finance Ltd.** P1+ 170 845.23 0.60IDBI Bank Limited** A1+ 100 95.05 0.07Oriental Bank of Commerce** P1+ 100 94.77 0.07Subtotal 77,242.73 55.05Treasury bills Nil NilCollateralised Borrowing& Lending Obligation Nil NilFixed DepositsDeposits(maturity not exceeding 91 days)

HDFC Asset Management Company LimitedA Joint Venture with Standard Life Investments Limited
Registered Office: Ramon House, 3rd Floor, H.T. Parekh Marg, 169, Backbay Reclamation, Churchgate, Mumbai 400 020.Investor Services Centre (at Mumbai) : Mistry Bhawan, 2nd Floor, 122, Backbay Reclamation, Dinsha Vachha Road, Churchgate, Mumbai - 400 020 • Tel.: 022-6631 6300 • Toll-free number : 1800 233 6767 • Fax : 022-2282 1144 • e-mail : [email protected] • Visit us at : www.hdfcfund.com
HALF-YEARLY PORTFOLIO STATEMENT OF THE SCHEMES / PLANS OF HDFC MUTUAL FUND AS ON MARCH 31, 2009[ Pursuant to Regulation 59A of Securities and Exchange Board of India (Mutual Funds) Regulations, 1996 ]
Page: 17 (continued....)
Name of the Instrument Rating Quantity Market/ % toFair Value NAV
(Rs. In Lakhs)IDBI Bank Limited 6,000 4.28Central Bank of India 2,970 2.12Subtotal 8,970.00 6.40Total 86,212.73 61.45OTHERSNet Current Assets 674.35 0.48Grand Total 140,245.30 100.00
Notes :1) Total NPAs provided for and its percentage to NAV : Nil2) NAVs at a Glance
Retail Option March 31, 2009 September 30, 2008NAV per Unit (Rs.) Growth Option 14.8593 14.2584
Dividend Reinvestment Option - Daily 10.0809 10.0809Dividend Option - Weekly 10.1378 10.1381Dividend Option - Monthly 10.1466 10.1468
Wholesale Option March 31, 2009 September 30, 2008NAV per Unit (Rs.) Growth Option 14.9230 14.3019
Dividend Reinvestment Option - Daily 10.0809 10.0809Dividend Option - Weekly 10.1379 10.1382Dividend Option - Monthly 10.1466 10.1468
3) For details on dividend declared during the half-year ended March 31, 2009, please refer to Dividend History Table.4) Total outstanding exposure in Derivative Instruments : Nil 6) Average Portfolio Maturity : 297.04 days5) Total investments in Foreign Securities / Overseas ETFs : Nil 7) Investments in Fixed Deposits : Rs.8970.00 Lacs(�) Top Ten Holdings, (**) Thinly Traded / Non-Traded Securities, ($) Sponsor.
HDFC FLOATING RATE INCOME FUND - LONG TERM PLAN (AN OPEN-ENDED INCOME SCHEME)
Name of the Instrument Rating Quantity Market/ % toFair Value NAV
(Rs. In Lakhs)DEBT INSTRUMENTS(a) Listed / awaiting listing onStock ExchangesGovernment Securities Nil NilNon-Convertible debentures / Bonds
� Infrastructure DevelopmentFinance Company Ltd** AAA 650 6,557.00 9.75
� Indian Oil Corporation Ltd.** AA+ 310 3,080.12 4.58� Power Finance Corporation Ltd AAA 300 3,048.14 4.53� Rural Electrification Corporation Ltd.** AAA 270 2,812.50 4.18
Housing Development FinanceCorporation Ltd. $ AAA 200 2,008.21 2.99Power Finance Corporation Ltd. AAA 100 1,021.46 1.52Bharat Petroleum Corporation Ltd.** AAA 100 1,002.08 1.49Subtotal 19,529.51 29.04(b) Privately Placed / UnlistedNon-Convertible debentures / Bonds Nil Nil(c) Securitized Debt Instruments
� NOVO IV Trust** AAA (ind) (SO) 250 2,319.58 3.45Subtotal 2,319.58 3.45Total 21,849.09 32.49MONEY MARKET INSTRUMENTSBills Rediscounting Nil NilCommercial Papers (CP) /Certificate of Deposit (CD)
� Dena Bank** F1+ 12,400 11,577.54 17.22� State Bank of Patiala** P1+ 11,000 10,304.38 15.33� Syndicate Bank** PR1+ 10,000 9,345.72 13.92� Vijaya Bank** PR1+ 10,000 9,312.96 13.86� Andhra Bank** F1+ 5,000 4,661.70 6.93
Subtotal 45,202.30 67.26Treasury bills Nil NilCollateralised Borrowing &Lending Obligation Nil NilFixed DepositsDeposits(maturity not exceeding 91 days) Nil NilTotal 45,202.30 67.26OTHERSNet Current Assets 168.7 0.25Grand Total 67,220.09 100.00
Notes :1) Total NPAs provided for and its percentage to NAV : Nil
2) NAVs at a Glance March 31, 2009 September 30, 2008NAV per Unit (Rs.) Growth Option 14.7447 14.1054
Dividend Reinvestment Option 10.1784 10.17363) For details on dividend declared during the half-year ended March 31, 2009, please refer to Dividend History Table.4) Total outstanding exposure in Derivative Instruments : Nil 6) Average Portfolio Maturity : 1.09 years5) Total investments in Foreign Securities / Overseas ETFs : Nil 7) Investments in Fixed Deposits : Nil(�) Top Ten Holdings, (**) Thinly Traded / Non-Traded Securities, ($) Sponsor
HDFC LIQUID FUND(INCLUDING PREMIUM PLAN & PREMIUM PLUS PLAN)
(AN OPEN-ENDED LIQUID INCOME SCHEME)
Name of the Instrument Rating Quantity Market/ % toFair Value NAV
(Rs. In Lakhs)
DEBT INSTRUMENTS(a) Listed / awaiting listing onStock ExchangesGovernment Securities Nil NilNon-Convertible debentures / Bonds
� Housing DevelopmentFinance Corporation Ltd.**$ AAA 3,305 31,891.39 4.65ICICI Home Finance Ltd** AAA 438 4,395.76 0.64M&M Financial Services Ltd.** AA- 435 4,341.80 0.63Citicorp Finance (India) Ltd.** AA+ 400 4,004.54 0.58Tata Steel Ltd.** AAA 250 2,500.00 0.36Citi Financial Consumer Finance (I) Ltd** AA 250 2,498.99 0.36Power Finance Corporation Ltd** AAA 250 2,482.64 0.36ICICI Bank Ltd.** AAA 20,550 2,222.55 0.32BHW Birla Home Finance Ltd.** LAA+ 180 1,804.98 0.26Tata Sons Ltd.** AAA 170 1,596.75 0.23Citicorp Maruti Finance Ltd.** AA+ 100 997.19 0.15Sundaram Finance Ltd.** AA+ 100 994.00 0.14National Housing Bank** AAA 60 598.64 0.09Kotak Mahindra Prime Ltd.** AA 50 489.57 0.07Subtotal 60,818.80 8.84(b) Privately Placed / UnlistedNon-Convertible debentures / BondsTata Sons Ltd.** AAA 850 8,499.47 1.25SREI Infrastructure Finance Ltd.** AA 500 5,001.63 0.73Tata Realty & Infra Infopark Ltd.** PR1+ (SO) 50 4,988.53 0.73Shriram City Union Finance Ltd.** F1 (ind) (SO) 300,000 2,995.93 0.44Dr. Reddy’s Holding Pvt.Ltd.** P1+ 21 2,096.69 0.31GE Money Financial Services Limited** AAA 30 295.68 0.04Subtotal 23,877.93 3.50(c) Securitized Debt InstrumentsUBL Trust Series 61** P1+ (SO) 74 7,445.90 1.10RB Loan Trust Series 26 ** P1+ (SO) 103 6,938.78 1.01Credit Asset Trust Series LXII** F1+ (ind) (SO) 70 6,720.28 0.98RB Loan Trust Series 28** F1+ (ind) (SO) 154 5,413.64 0.79Receivable Securitisation Trust VII** AAA (SO) 173 4,990.43 0.73Loan Securitisation Trust Series 51** AA+ (SO)/PR1+ (SO) 41 3,929.46 0.57Corporate Debt Trust Series 13 ** A1+ (SO) 125 2,835.30 0.41
Name of the Instrument Rating Quantity Market/ % toFair Value NAV
(Rs. In Lakhs)Corporate Loan SecuritisationSeries XXXIII 2006** F1+ (ind) (SO) 28 2,797.50 0.41India Loan SecuritisationSeries 8 Trust 2008** AAA (SO) 27 2,638.27 0.38BHPC Auto Securitisation Trust Nov II** AAA (SO) 26 2,531.66 0.37Credit Asset Trust Series LXI** P2+ (SO) 24 2,394.98 0.35Corporate Debt Trust Series 12** A1+ (SO) 120 2,388.34 0.35SME Loan Receivables Trust AUG 2007** AAA (SO) 52 2,351.64 0.34CLSS 27 Trust 2009 ** AAA (SO) 15 2,263.56 0.33Indian Retail ABS Trust 95** AAA (SO) 25 2,056.60 0.30Indian Corporate Loan Trust 2008 14** P1+ (SO) 20 2,000.50 0.29Auto Securitisation TrustMixpool A July 2007** AAA (SO) 45 1,955.74 0.29Auto Securitisation Trust MP A May 2008** AAA (SO) 43 1,698.49 0.25KEC Loan Trust** AA- (SO) 15 1,503.85 0.22Credit Asset Trust Series LXIV** F1+ (SO) 13 1,328.75 0.19IKR Loan Trust** PR1+ (SO) 17 1,162.88 0.17Credit Asset Trust Series XXXII** LAAA (SO) 10 1,109.28 0.16India Loan SecuritisationSeries 5 Trust 2008 ** AAA (SO) 21 961.80 0.14Tata Teleservices (Maharashtra) Limited** LAAA (SO) 8,000,000 795.33 0.12Auto Securitisation Trust Oct 07** AA (SO) 42 774.18 0.11RB Loan Trust Series XV 2008** AAA (SO) 7 693.05 0.10CE Pool Trust June 2007** LAAA (SO) 49 604.60 0.09PFL Loan Trust** P1+ (SO) 10 489.37 0.07Credit Asset Trust Series LXVI** F1+ (ind) (SO) 4 443.69 0.06Credit Asset Trust Series LXVII** F1+ (ind) (SO) 4 442.12 0.06BHPC Auto Securitisation Trust Feb 08 I** AAA (SO) 21 392.44 0.06SME Retail Pool II Trust** AAA (SO) 25 380.05 0.06India Loan Securitisation EC9 Trust 2008** LAAA (SO) 30 378.54 0.06Indian Corporate LoanSecuritisation Trust 2008-40** P1+ (SO) 50 335.85 0.05Credit Asset Trust Series XLIX** F1+ (ind) (SO) 3 326.99 0.05Indian Corporate LoanSecuritisation Trust - Series LXV** LAA+ (SO) 75 271.63 0.04Corporate Debt Trust Series 11** A1+ (SO) 3 266.40 0.04Transportation Loan Trust Series 1** AAA (SO) 3 227.02 0.03Investment Vehicle 1508** AAA (SO) 15 217.64 0.03IPL Loan Trust** PR1+ (SO) 5 129.05 0.02Bharat Securitisation Trust 6 ** LAAA (SO) 14 83.86 0.01Indian Corporate Loan Trust - Series IV** A1+ (SO) 35 56.40 0.01Subtotal 76,725.84 11.20Total 161,422.57 23.54MONEY MARKET INSTRUMENTSBills RediscountingKotak Mahindra Bank Ltd.** A1+ 2 4,954.93 0.72Subtotal 4,954.93 0.72Commercial Papers (CP) /Certificate of Deposit (CD)
� ICICI Bank Ltd.** P1+/A1+ 44,901 42,254.70 6.16� Punjab National Bank** F1+ 40,900 39,277.53 5.73� Bank of India** A1+ 32,500 31,531.95 4.61� The Federal Bank Ltd.** P1+ 32,500 30,609.98 4.47� Allahabad Bank** P1+ 30,000 29,225.83 4.26� State Bank of Mysore** A1+ 30,000 29,096.08 4.25� Andhra Bank** F1+ 30,000 29,091.19 4.26� ONGC Videsh Limited** P1+ (SO) 6,000 28,252.99 4.12� Union Bank of India** A1+ 26,000 24,640.51 3.59
Indian Bank** P1+/F1+ 25,000 24,259.28 3.53Syndicate Bank** PR1+ 22,500 21,875.31 3.18LIC Housing Finance Ltd.** P1+ 3,800 17,687.54 2.58State Bank Of Hyderabad** P1+ 15,100 14,652.24 2.14UCO Bank** P1+ 15,000 14,547.77 2.12Axis Bank Ltd.** P1+ 15,000 14,033.76 2.04Corporation Bank** P1+ 10,000 9,752.33 1.42IDBI Bank Limited** A1+ 10,000 9,674.02 1.41State Bank of Bikaner & Jaipur** P1+ 10,000 9,430.43 1.38ICICI Home Finance Ltd** A1+ 1,200 5,796.38 0.85Canara Bank** P1+ 5,000 4,887.49 0.71Yes Bank Ltd.** A1+ 5,000 4,810.04 0.70State Bank of Travancore** P1+ 2,500 2,445.80 0.36Oriental Bank of Commerce** P1+ 2,500 2,355.30 0.34Birla Global Finance Company Ltd.** A1+ 300 1,438.84 0.21Kotak Mahindra Prime Ltd.** P1+ 100 492.95 0.07State Bank of Patiala** P1+ 500 481.91 0.07BHW Birla Home Finance Ltd.** P1+ 80 397.76 0.06Subtotal 442,999.91 64.62Treasury bills Nil NilCollateralised Borrowing &Lending Obligation Nil NilFixed DepositsDeposits(maturity not exceeding 91 days)Central Bank of India 16,830 2.45IDBI Bank Limited 12,000 1.75Subtotal 28,830.00 4.20Total 476,784.84 69.54OTHERSNet Current Assets 47,475.11 6.92Grand Total 685,682.52 100.00
Notes :1) Total NPAs provided for and its percentage to NAV : Nil2) NAVs at a Glance :
HDFC Liquid Fund March 31, 2009 September 30, 2008NAV per Unit (Rs.) Growth Option 17.4635 16.7993
Dividend Reinvestment Option - Daily 10.1982 10.1982Dividend Option - Weekly 10.3125 10.3131Dividend Option - Monthly 10.2652 10.2658
HDFC Liquid Fund - Premium Plan March 31, 2009 September 30, 2008NAV per Unit (Rs.) Growth Option 17.6273 16.9343
Dividend Reinvestment Option - Daily 12.2598 12.2598Dividend Option - Weekly NA NA
HDFC Liquid Fund - Premium Plus Plan March 31, 2009 September 30, 2008NAV per Unit (Rs.) Growth Option 17.6642 16.9699
Dividend Option - Weekly 12.4205 12.4211
3) For details on dividend declared during the half-year ended March 31, 2009, please refer to Dividend History Table.4) Total outstanding exposure in Derivative Instruments : Nil5) Total investments in Foreign Securities / Overseas ETFs : Nil6) Average Portfolio Maturity : 178.11 days7) Investments in Fixed Deposits : Rs. 28,830.00 Lacs(�) Top Ten Holdings, (**) Thinly Traded / Non-Traded Securities, ($) Sponsor, (NA) No Unit Hoders.
HDFC CASH MANAGEMENT FUND - SAVINGS PLAN(AN OPEN-ENDED HIGH LIQUIDITY INCOME SCHEME)
Name of the Instrument Rating Quantity Market/ % toFair Value NAV
(Rs. In Lakhs)
DEBT INSTRUMENTS(a) Listed / awaiting listing onStock ExchangesGovernment Securities Nil NilNon-Convertible debentures / Bonds
� Housing DevelopmentFinance Corporation Ltd.**$ AAA 2,235 21,911.88 6.84IDBI Bank Limited** AA+ 850 8,502.48 2.66Citicorp Finance (India) Ltd.** AA+ 400 3,998.83 1.25ICICI Home Finance Ltd** AAA 250 2,509.00 0.78
L & T Finance Ltd.** AA+ 200 2,000.99 0.63
Name of the Instrument Rating Quantity Market/ % toFair Value NAV
(Rs. In Lakhs)Citi Financial Consumer Finance (I) Ltd** AA 150 1,494.99 0.47Sundaram Finance Ltd.** AA+ 150 1,490.99 0.47National Bank for Agriculture andRural Development** AAA 125 1,265.42 0.40GE Capital Services India** AAA 120 1,207.25 0.38Kotak Mahindra Prime Ltd.** P1+ 25 248.77 0.08Citicorp Maruti Finance Ltd.** AA+ 20 199.44 0.06Subtotal 44,830.04 14.02(b) Privately Placed / UnlistedNon-Convertible debentures / BondsSBI Factors & CommercialServices Pvt Ltd** A1+ 100 10,000.00 3.13Kotak Mahindra Bank Ltd.** P1+ 7,500 7,500.00 2.34Carol Info Services Limited** Unrated 460 4,600.00 1.44Dr. Reddy’s Holding Pvt.Ltd.** P1+ 12 1,198.11 0.37GE Money Financial Services Limited** AAA 96 961.94 0.30Subtotal 24,260.05 7.58(c) Securitized Debt InstrumentsInvestment Vehicle 1508** AAA (SO) 39 3,267.78 1.02Credit Asset Trust Series LXII** F1+ (ind) (SO) 30 3,010.05 0.94Indian Retail ABS Trust 96 2008** AAA (SO) 70 2,736.71 0.86Credit Asset Trust Series XXVI** P1+ (SO) 23 1,144.20 0.36KEC Loan Trust** AA- (SO) 9 1,013.93 0.32Credit Asset Trust Series XXXII** LAAA (SO) 9 998.35 0.31Reliance Industries Ltd.** AAA (SO) 7 151.03 0.05SME Retail Pool II Trust** AAA (SO) 8 127.50 0.04Indian Corporate LoanSecuritisation Trust 2008-40** P1+ (SO) 1 94.64 0.03RB Loan Trust Series 30** PR1+ (SO) 5 34.50 0.01Subtotal 12,578.69 3.94Total 81,668.78 25.54MONEY MARKET INSTRUMENTSBills Rediscounting Nil NilCommercial Papers (CP) /Certificate of Deposit (CD)
� State Bank of Patiala** P1+ 35,000 33,991.31 10.62� Punjab National Bank** F1+ 35,000 33,840.12 10.57� State Bank of Mysore** A1+ 30,000 28,516.01 8.91� Union Bank of India** A1+ 20,000 18,808.12 5.87� State Bank of Bikaner & Jaipur** P1+ 15,000 14,322.96 4.48� Allahabad Bank** P1+ 12,500 12,074.12 3.77� Axis Bank Ltd.** P1+ 12,500 11,696.61 3.66� ICICI Bank Ltd.** P1+ 10,550 10,081.67 3.15� Corporation Bank** P1+ 10,320 10,063.40 3.15
Oriental Bank of Commerce** P1+ 10,100 9,770.11 3.06State Bank Of Hyderabad** P1+ 10,000 9,572.74 2.99ONGC Videsh Limited** P1+ (SO) 2,000 9,417.66 2.94LIC Housing Finance Ltd.** P1+ 1,500 6,982.68 2.18Reliance Capital Ltd.** A1+ 1,100 5,493.39 1.72UCO Bank** P1+ 5,000 4,849.26 1.52Bank of India** A1+ 5,000 4,833.94 1.51Canara Bank** P1+ 4,000 3,874.47 1.21State Bank of Indore** P1+ 2,500 2,423.50 0.76Hongkong & Shanghai BankingCorporation Ltd.** F1+ 1,000 981.26 0.31Subtotal 231,593.33 72.38Treasury bills Nil NilCollateralised Borrowing &Lending Obligation Nil NilFixed DepositsDeposits(maturity not exceeding 91 days) Nil NilTotal 231,593.33 72.38OTHERSNet Current Assets 6,651.65 2.08Grand Total 319,913.76 100.00
Notes :1) Total NPAs provided for and its percentage to NAV : Nil
2) NAVs at a Glance March 31, 2009 September 30, 2008NAV per unit (Rs.) Growth Option 18.3844 17.6668
Dividend Reinvestment Option - Daily 10.6364 10.6364Dividend Option - Weekly 10.6270 10.6361
3) For details on dividend declared during the half-year ended March 31, 2009, please refer to Dividend History Table.4) Total outstanding exposure in Derivative Instruments : Nil 6) Average Portfolio Maturity : 175.32 days5) Total investments in Foreign Securities / Overseas ETFs : Nil 7) Investments in Fixed Deposits : Nil(�) Top Ten Holdings, (**) Thinly Traded / Non-Traded Securities, ($) Sponsor.
HDFC CASH MANAGEMENT FUND - TREASURY ADVANTAGE PLAN(PREVIOUSLY HDFC CASH MANAGEMENT FUND - SAVINGS PLUS PLAN)
(AN OPEN - ENDED INCOME SCHEME)Name of the Instrument Rating Quantity Market/ % to
Fair Value NAV(Rs. In Lakhs)
DEBT INSTRUMENTS(a) Listed / awaiting listing onStock ExchangesGovernment Securities5.48 % GOI 2009 SOV 4,000,000 4,001.60 0.37Subtotal 4,001.60 0.37Non-Convertible debentures / Bonds
� Housing DevelopmentFinance Corporation Ltd.**$ AAA 4,675 44,985.61 4.16
� Bharat Petroleum Corporation Ltd.** AAA 3,250 32,567.71 3.02LIC Housing Finance Ltd.** AAA 2,125 20,537.62 1.89Power Finance Corporation Ltd AAA 1,950 19,812.92 1.83Housing DevelopmentFinance Corporation Ltd.$ AAA 1,638 16,743.08 1.55Citicorp Finance (India) Ltd.** AA+ 1,605 16,041.51 1.48Tata Steel Ltd.** AAA 1,500 15,000.00 1.39ICICI Home Finance Ltd** AAA 1,500 14,815.14 1.37M&M Financial Services Ltd.** AA- 1,350 13,496.83 1.25Rural Electrification Corporation Ltd.** AAA 850 8,931.30 0.83Citi Financial Consumer Finance (I) Ltd** AA 825 8,209.45 0.75National Bank for Agriculture andRural Development** AAA 780 7,896.25 0.73Shriram Transport Finance Co. Ltd.** AA (ind) / AA 820 7,858.99 0.73Sundaram Finance Ltd.** LAA+ / AA+ 651 6,478.87 0.60Infrastructure DevelopmentFinance Corporation Ltd.** AAA / LAAA 500 4,967.44 0.46Export - Import Bank of India** AAA 450 4,322.26 0.40DSP Merrill Lynch Capital Ltd.** AA+ (SO) 265 2,624.06 0.24SREI Infrastructure Finance Ltd.** AA 2,500 2,490.44 0.23Indian Oil Corporation Ltd.** AA+ 70 695.51 0.06Great Eastern Shipping Company Ltd.** AA+ 5 452.68 0.04BHW Birla Home Finance Ltd.** LAA+ 5 50.14 ^Subtotal 248,977.81 23.01(b) Privately Placed / UnlistedNon-Convertible debentures / BondsTata Sons Ltd.** AAA 1,180 11,780.09 1.08Kotak Mahindra Bank Ltd.** P1+ 7,500 7,500.00 0.69SBI Factors & CommercialServices Pvt Ltd** A1+ 50 5,000.00 0.46Carol Info Services Limited** Unrated 300 3,000.00 0.28GE Capital Services India** AAA 50 500.00 0.05Subtotal 27,780.09 2.56(c) Securitized Debt InstrumentsIndian Retail ABS Trust 95** AAA (SO) 201 18,390.98 1.70UBL Trust Series 61** P1+ (SO) 150 16,405.75 1.52CLSS 28 Trust 2009 ** A1+ (SO) 110 9,560.31 0.88RB Loan Trust Series 26 ** P1+ (SO) 102 9,063.17 0.84Corporate Debt Trust Series 16 ** AAA (SO) 192 8,964.42 0.83Credit Asset Trust Series LXIV** F1+ (SO) 80 8,009.28 0.74Corporate Debt Trust Series 13 ** A1+ (SO) 75 6,657.79 0.62BHPC Auto Securitisation Trust Nov II** AAA (SO) 193 6,590.99 0.61
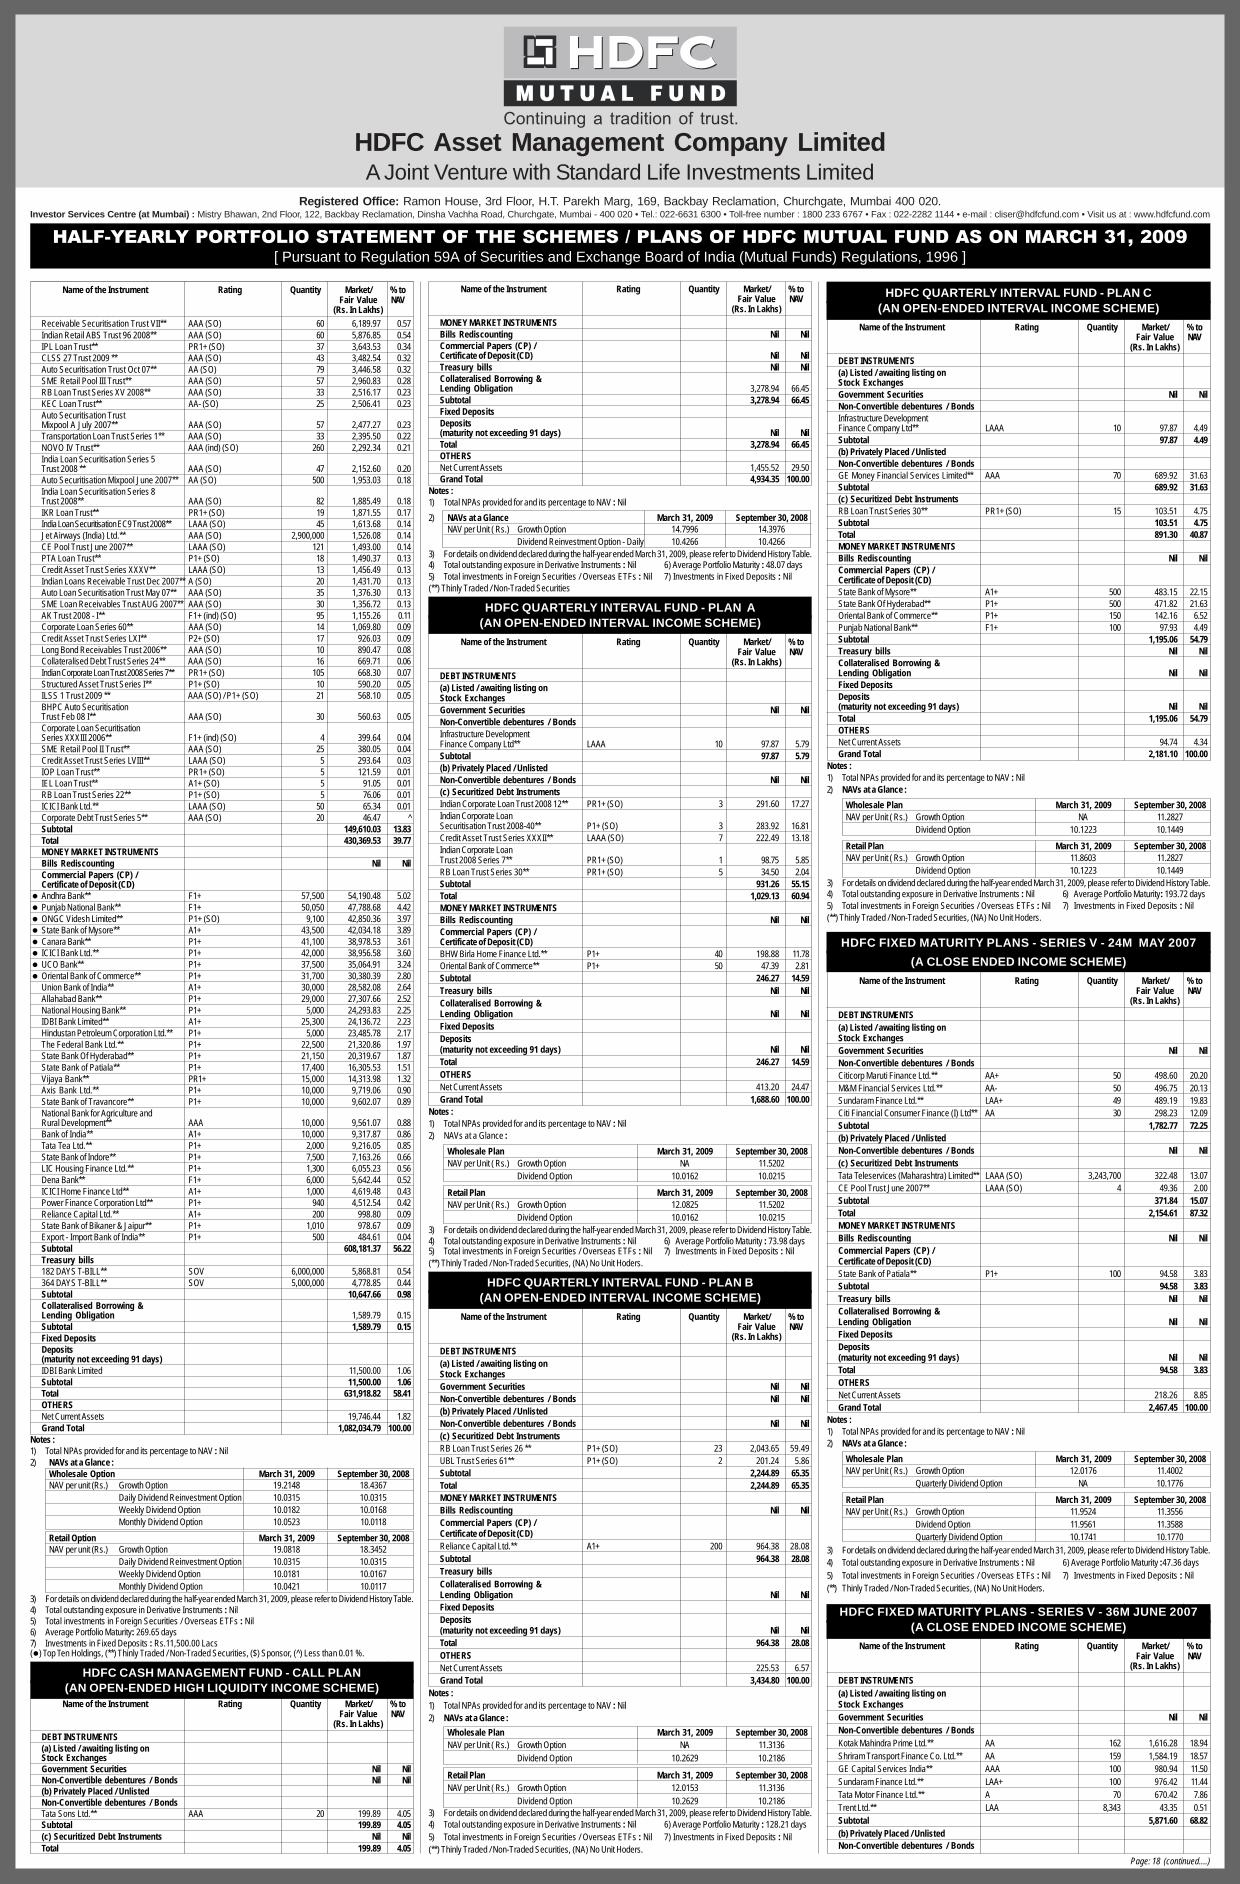
HDFC Asset Management Company LimitedA Joint Venture with Standard Life Investments Limited
Registered Office: Ramon House, 3rd Floor, H.T. Parekh Marg, 169, Backbay Reclamation, Churchgate, Mumbai 400 020.Investor Services Centre (at Mumbai) : Mistry Bhawan, 2nd Floor, 122, Backbay Reclamation, Dinsha Vachha Road, Churchgate, Mumbai - 400 020 • Tel.: 022-6631 6300 • Toll-free number : 1800 233 6767 • Fax : 022-2282 1144 • e-mail : [email protected] • Visit us at : www.hdfcfund.com
HALF-YEARLY PORTFOLIO STATEMENT OF THE SCHEMES / PLANS OF HDFC MUTUAL FUND AS ON MARCH 31, 2009[ Pursuant to Regulation 59A of Securities and Exchange Board of India (Mutual Funds) Regulations, 1996 ]
Page: 18 (continued....)
Name of the Instrument Rating Quantity Market/ % toFair Value NAV
(Rs. In Lakhs)Receivable Securitisation Trust VII** AAA (SO) 60 6,189.97 0.57Indian Retail ABS Trust 96 2008** AAA (SO) 60 5,876.85 0.54IPL Loan Trust** PR1+ (SO) 37 3,643.53 0.34CLSS 27 Trust 2009 ** AAA (SO) 43 3,482.54 0.32Auto Securitisation Trust Oct 07** AA (SO) 79 3,446.58 0.32SME Retail Pool III Trust** AAA (SO) 57 2,960.83 0.28RB Loan Trust Series XV 2008** AAA (SO) 33 2,516.17 0.23KEC Loan Trust** AA- (SO) 25 2,506.41 0.23Auto Securitisation TrustMixpool A July 2007** AAA (SO) 57 2,477.27 0.23Transportation Loan Trust Series 1** AAA (SO) 33 2,395.50 0.22NOVO IV Trust** AAA (ind) (SO) 260 2,292.34 0.21India Loan Securitisation Series 5Trust 2008 ** AAA (SO) 47 2,152.60 0.20Auto Securitisation Mixpool June 2007** AA (SO) 500 1,953.03 0.18India Loan Securitisation Series 8Trust 2008** AAA (SO) 82 1,885.49 0.18IKR Loan Trust** PR1+ (SO) 19 1,871.55 0.17India Loan Securitisation EC9 Trust 2008** LAAA (SO) 45 1,613.68 0.14Jet Airways (India) Ltd.** AAA (SO) 2,900,000 1,526.08 0.14CE Pool Trust June 2007** LAAA (SO) 121 1,493.00 0.14PTA Loan Trust** P1+ (SO) 18 1,490.37 0.13Credit Asset Trust Series XXXV** LAAA (SO) 13 1,456.49 0.13Indian Loans Receivable Trust Dec 2007** A (SO) 20 1,431.70 0.13Auto Loan Securitisation Trust May 07** AAA (SO) 35 1,376.30 0.13SME Loan Receivables Trust AUG 2007** AAA (SO) 30 1,356.72 0.13AK Trust 2008 - I** F1+ (ind) (SO) 95 1,155.26 0.11Corporate Loan Series 60** AAA (SO) 14 1,069.80 0.09Credit Asset Trust Series LXI** P2+ (SO) 17 926.03 0.09Long Bond Receivables Trust 2006** AAA (SO) 10 890.47 0.08Collateralised Debt Trust Series 24** AAA (SO) 16 669.71 0.06Indian Corporate Loan Trust 2008 Series 7** PR1+ (SO) 105 668.30 0.07Structured Asset Trust Series I** P1+ (SO) 10 590.20 0.05ILSS 1 Trust 2009 ** AAA (SO) / P1+ (SO) 21 568.10 0.05BHPC Auto SecuritisationTrust Feb 08 I** AAA (SO) 30 560.63 0.05Corporate Loan SecuritisationSeries XXXIII 2006** F1+ (ind) (SO) 4 399.64 0.04SME Retail Pool II Trust** AAA (SO) 25 380.05 0.04Credit Asset Trust Series LVIII** LAAA (SO) 5 293.64 0.03IOP Loan Trust** PR1+ (SO) 5 121.59 0.01IEL Loan Trust** A1+ (SO) 5 91.05 0.01RB Loan Trust Series 22** P1+ (SO) 5 76.06 0.01ICICI Bank Ltd.** LAAA (SO) 50 65.34 0.01Corporate Debt Trust Series 5** AAA (SO) 20 46.47 ^Subtotal 149,610.03 13.83Total 430,369.53 39.77MONEY MARKET INSTRUMENTSBills Rediscounting Nil NilCommercial Papers (CP) /Certificate of Deposit (CD)
� Andhra Bank** F1+ 57,500 54,190.48 5.02� Punjab National Bank** F1+ 50,050 47,788.68 4.42� ONGC Videsh Limited** P1+ (SO) 9,100 42,850.36 3.97� State Bank of Mysore** A1+ 43,500 42,034.18 3.89� Canara Bank** P1+ 41,100 38,978.53 3.61� ICICI Bank Ltd.** P1+ 42,000 38,956.58 3.60� UCO Bank** P1+ 37,500 35,064.91 3.24� Oriental Bank of Commerce** P1+ 31,700 30,380.39 2.80
Union Bank of India** A1+ 30,000 28,582.08 2.64Allahabad Bank** P1+ 29,000 27,307.66 2.52National Housing Bank** P1+ 5,000 24,293.83 2.25IDBI Bank Limited** A1+ 25,300 24,136.72 2.23Hindustan Petroleum Corporation Ltd.** P1+ 5,000 23,485.78 2.17The Federal Bank Ltd.** P1+ 22,500 21,320.86 1.97State Bank Of Hyderabad** P1+ 21,150 20,319.67 1.87State Bank of Patiala** P1+ 17,400 16,305.53 1.51Vijaya Bank** PR1+ 15,000 14,313.98 1.32Axis Bank Ltd.** P1+ 10,000 9,719.06 0.90State Bank of Travancore** P1+ 10,000 9,602.07 0.89National Bank for Agriculture andRural Development** AAA 10,000 9,561.07 0.88Bank of India** A1+ 10,000 9,317.87 0.86Tata Tea Ltd.** P1+ 2,000 9,216.05 0.85State Bank of Indore** P1+ 7,500 7,163.26 0.66LIC Housing Finance Ltd.** P1+ 1,300 6,055.23 0.56Dena Bank** F1+ 6,000 5,642.44 0.52ICICI Home Finance Ltd** A1+ 1,000 4,619.48 0.43Power Finance Corporation Ltd** P1+ 940 4,512.54 0.42Reliance Capital Ltd.** A1+ 200 998.80 0.09State Bank of Bikaner & Jaipur** P1+ 1,010 978.67 0.09Export - Import Bank of India** P1+ 500 484.61 0.04Subtotal 608,181.37 56.22Treasury bills182 DAYS T-BILL** SOV 6,000,000 5,868.81 0.54364 DAYS T-BILL** SOV 5,000,000 4,778.85 0.44Subtotal 10,647.66 0.98Collateralised Borrowing &Lending Obligation 1,589.79 0.15Subtotal 1,589.79 0.15Fixed DepositsDeposits(maturity not exceeding 91 days)IDBI Bank Limited 11,500.00 1.06Subtotal 11,500.00 1.06Total 631,918.82 58.41OTHERSNet Current Assets 19,746.44 1.82Grand Total 1,082,034.79 100.00
Notes :1) Total NPAs provided for and its percentage to NAV : Nil2) NAVs at a Glance :
Wholesale Option March 31, 2009 September 30, 2008NAV per unit (Rs.) Growth Option 19.2148 18.4367
Daily Dividend Reinvestment Option 10.0315 10.0315Weekly Dividend Option 10.0182 10.0168Monthly Dividend Option 10.0523 10.0118
Retail Option March 31, 2009 September 30, 2008NAV per unit (Rs.) Growth Option 19.0818 18.3452
Daily Dividend Reinvestment Option 10.0315 10.0315Weekly Dividend Option 10.0181 10.0167Monthly Dividend Option 10.0421 10.0117
3) For details on dividend declared during the half-year ended March 31, 2009, please refer to Dividend History Table.4) Total outstanding exposure in Derivative Instruments : Nil5) Total investments in Foreign Securities / Overseas ETFs : Nil6) Average Portfolio Maturity: 269.65 days7) Investments in Fixed Deposits : Rs.11,500.00 Lacs(�) Top Ten Holdings, (**) Thinly Traded / Non-Traded Securities, ($) Sponsor, (^) Less than 0.01 %.
HDFC CASH MANAGEMENT FUND - CALL PLAN(AN OPEN-ENDED HIGH LIQUIDITY INCOME SCHEME)
Name of the Instrument Rating Quantity Market/ % toFair Value NAV
(Rs. In Lakhs)DEBT INSTRUMENTS(a) Listed / awaiting listing onStock ExchangesGovernment Securities Nil NilNon-Convertible debentures / Bonds Nil Nil(b) Privately Placed / UnlistedNon-Convertible debentures / BondsTata Sons Ltd.** AAA 20 199.89 4.05Subtotal 199.89 4.05(c) Securitized Debt Instruments Nil NilTotal 199.89 4.05
Name of the Instrument Rating Quantity Market/ % toFair Value NAV
(Rs. In Lakhs)MONEY MARKET INSTRUMENTSBills Rediscounting Nil NilCommercial Papers (CP) /Certificate of Deposit (CD) Nil NilTreasury bills Nil NilCollateralised Borrowing &Lending Obligation 3,278.94 66.45Subtotal 3,278.94 66.45Fixed DepositsDeposits(maturity not exceeding 91 days) Nil NilTotal 3,278.94 66.45OTHERSNet Current Assets 1,455.52 29.50Grand Total 4,934.35 100.00
Notes :1) Total NPAs provided for and its percentage to NAV : Nil
2) NAVs at a Glance March 31, 2009 September 30, 2008NAV per Unit ( Rs.) Growth Option 14.7996 14.3976
Dividend Reinvestment Option - Daily 10.4266 10.42663) For details on dividend declared during the half-year ended March 31, 2009, please refer to Dividend History Table.4) Total outstanding exposure in Derivative Instruments : Nil 6) Average Portfolio Maturity : 48.07 days5) Total investments in Foreign Securities / Overseas ETFs : Nil 7) Investments in Fixed Deposits : Nil(**) Thinly Traded / Non-Traded Securities
HDFC QUARTERLY INTERVAL FUND - PLAN A(AN OPEN-ENDED INTERVAL INCOME SCHEME)
Name of the Instrument Rating Quantity Market/ % toFair Value NAV
(Rs. In Lakhs)
DEBT INSTRUMENTS(a) Listed / awaiting listing onStock ExchangesGovernment Securities Nil NilNon-Convertible debentures / BondsInfrastructure DevelopmentFinance Company Ltd** LAAA 10 97.87 5.79Subtotal 97.87 5.79(b) Privately Placed / UnlistedNon-Convertible debentures / Bonds Nil Nil(c) Securitized Debt InstrumentsIndian Corporate Loan Trust 2008 12** PR1+ (SO) 3 291.60 17.27Indian Corporate LoanSecuritisation Trust 2008-40** P1+ (SO) 3 283.92 16.81Credit Asset Trust Series XXXII** LAAA (SO) 7 222.49 13.18Indian Corporate LoanTrust 2008 Series 7** PR1+ (SO) 1 98.75 5.85RB Loan Trust Series 30** PR1+ (SO) 5 34.50 2.04Subtotal 931.26 55.15Total 1,029.13 60.94MONEY MARKET INSTRUMENTSBills Rediscounting Nil NilCommercial Papers (CP) /Certificate of Deposit (CD)BHW Birla Home Finance Ltd.** P1+ 40 198.88 11.78Oriental Bank of Commerce** P1+ 50 47.39 2.81Subtotal 246.27 14.59Treasury bills Nil NilCollateralised Borrowing &Lending Obligation Nil NilFixed DepositsDeposits(maturity not exceeding 91 days) Nil NilTotal 246.27 14.59OTHERSNet Current Assets 413.20 24.47Grand Total 1,688.60 100.00
Notes :1) Total NPAs provided for and its percentage to NAV : Nil2) NAVs at a Glance :
Wholesale Plan March 31, 2009 September 30, 2008NAV per Unit ( Rs.) Growth Option NA 11.5202
Dividend Option 10.0162 10.0215
Retail Plan March 31, 2009 September 30, 2008NAV per Unit ( Rs.) Growth Option 12.0825 11.5202
Dividend Option 10.0162 10.02153) For details on dividend declared during the half-year ended March 31, 2009, please refer to Dividend History Table.4) Total outstanding exposure in Derivative Instruments : Nil 6) Average Portfolio Maturity : 73.98 days5) Total investments in Foreign Securities / Overseas ETFs : Nil 7) Investments in Fixed Deposits : Nil(**) Thinly Traded / Non-Traded Securities, (NA) No Unit Hoders.
HDFC QUARTERLY INTERVAL FUND - PLAN B(AN OPEN-ENDED INTERVAL INCOME SCHEME)
Name of the Instrument Rating Quantity Market/ % toFair Value NAV
(Rs. In Lakhs)
DEBT INSTRUMENTS(a) Listed / awaiting listing onStock ExchangesGovernment Securities Nil NilNon-Convertible debentures / Bonds Nil Nil(b) Privately Placed / UnlistedNon-Convertible debentures / Bonds Nil Nil(c) Securitized Debt InstrumentsRB Loan Trust Series 26 ** P1+ (SO) 23 2,043.65 59.49UBL Trust Series 61** P1+ (SO) 2 201.24 5.86Subtotal 2,244.89 65.35Total 2,244.89 65.35MONEY MARKET INSTRUMENTSBills Rediscounting Nil NilCommercial Papers (CP) /Certificate of Deposit (CD)Reliance Capital Ltd.** A1+ 200 964.38 28.08Subtotal 964.38 28.08Treasury billsCollateralised Borrowing &Lending Obligation Nil NilFixed DepositsDeposits(maturity not exceeding 91 days) Nil NilTotal 964.38 28.08OTHERSNet Current Assets 225.53 6.57Grand Total 3,434.80 100.00
Notes :1) Total NPAs provided for and its percentage to NAV : Nil2) NAVs at a Glance :
Wholesale Plan March 31, 2009 September 30, 2008NAV per Unit ( Rs.) Growth Option NA 11.3136
Dividend Option 10.2629 10.2186
Retail Plan March 31, 2009 September 30, 2008NAV per Unit ( Rs.) Growth Option 12.0153 11.3136
Dividend Option 10.2629 10.21863) For details on dividend declared during the half-year ended March 31, 2009, please refer to Dividend History Table.4) Total outstanding exposure in Derivative Instruments : Nil 6) Average Portfolio Maturity : 128.21 days5) Total investments in Foreign Securities / Overseas ETFs : Nil 7) Investments in Fixed Deposits : Nil(**) Thinly Traded / Non-Traded Securities, (NA) No Unit Hoders.
HDFC QUARTERLY INTERVAL FUND - PLAN C(AN OPEN-ENDED INTERVAL INCOME SCHEME)
Name of the Instrument Rating Quantity Market/ % toFair Value NAV
(Rs. In Lakhs)DEBT INSTRUMENTS(a) Listed / awaiting listing onStock ExchangesGovernment Securities Nil NilNon-Convertible debentures / BondsInfrastructure DevelopmentFinance Company Ltd** LAAA 10 97.87 4.49Subtotal 97.87 4.49(b) Privately Placed / UnlistedNon-Convertible debentures / BondsGE Money Financial Services Limited** AAA 70 689.92 31.63Subtotal 689.92 31.63(c) Securitized Debt InstrumentsRB Loan Trust Series 30** PR1+ (SO) 15 103.51 4.75Subtotal 103.51 4.75Total 891.30 40.87MONEY MARKET INSTRUMENTSBills Rediscounting Nil NilCommercial Papers (CP) /Certificate of Deposit (CD)State Bank of Mysore** A1+ 500 483.15 22.15State Bank Of Hyderabad** P1+ 500 471.82 21.63Oriental Bank of Commerce** P1+ 150 142.16 6.52Punjab National Bank** F1+ 100 97.93 4.49Subtotal 1,195.06 54.79Treasury bills Nil NilCollateralised Borrowing &Lending Obligation Nil NilFixed DepositsDeposits(maturity not exceeding 91 days) Nil NilTotal 1,195.06 54.79OTHERSNet Current Assets 94.74 4.34Grand Total 2,181.10 100.00
Notes :1) Total NPAs provided for and its percentage to NAV : Nil2) NAVs at a Glance :
Wholesale Plan March 31, 2009 September 30, 2008NAV per Unit ( Rs.) Growth Option NA 11.2827
Dividend Option 10.1223 10.1449
Retail Plan March 31, 2009 September 30, 2008NAV per Unit ( Rs.) Growth Option 11.8603 11.2827
Dividend Option 10.1223 10.14493) For details on dividend declared during the half-year ended March 31, 2009, please refer to Dividend History Table.4) Total outstanding exposure in Derivative Instruments : Nil 6) Average Portfolio Maturity: 193.72 days5) Total investments in Foreign Securities / Overseas ETFs : Nil 7) Investments in Fixed Deposits : Nil(**) Thinly Traded / Non-Traded Securities, (NA) No Unit Hoders.
HDFC FIXED MATURITY PLANS - SERIES V - 24M MAY 2007
(A CLOSE ENDED INCOME SCHEME)
Name of the Instrument Rating Quantity Market/ % toFair Value NAV
(Rs. In Lakhs)
DEBT INSTRUMENTS(a) Listed / awaiting listing onStock ExchangesGovernment Securities Nil NilNon-Convertible debentures / BondsCiticorp Maruti Finance Ltd.** AA+ 50 498.60 20.20M&M Financial Services Ltd.** AA- 50 496.75 20.13Sundaram Finance Ltd.** LAA+ 49 489.19 19.83Citi Financial Consumer Finance (I) Ltd** AA 30 298.23 12.09Subtotal 1,782.77 72.25(b) Privately Placed / UnlistedNon-Convertible debentures / Bonds Nil Nil(c) Securitized Debt InstrumentsTata Teleservices (Maharashtra) Limited** LAAA (SO) 3,243,700 322.48 13.07CE Pool Trust June 2007** LAAA (SO) 4 49.36 2.00Subtotal 371.84 15.07Total 2,154.61 87.32MONEY MARKET INSTRUMENTSBills Rediscounting Nil NilCommercial Papers (CP) /Certificate of Deposit (CD)State Bank of Patiala** P1+ 100 94.58 3.83Subtotal 94.58 3.83Treasury bills Nil NilCollateralised Borrowing &Lending Obligation Nil NilFixed DepositsDeposits(maturity not exceeding 91 days) Nil NilTotal 94.58 3.83OTHERSNet Current Assets 218.26 8.85Grand Total 2,467.45 100.00
Notes :1) Total NPAs provided for and its percentage to NAV : Nil2) NAVs at a Glance :
Wholesale Plan March 31, 2009 September 30, 2008NAV per Unit ( Rs.) Growth Option 12.0176 11.4002
Quarterly Dividend Option NA 10.1776
Retail Plan March 31, 2009 September 30, 2008NAV per Unit ( Rs.) Growth Option 11.9524 11.3556
Dividend Option 11.9561 11.3588Quarterly Dividend Option 10.1741 10.1770
3) For details on dividend declared during the half-year ended March 31, 2009, please refer to Dividend History Table.4) Total outstanding exposure in Derivative Instruments : Nil 6) Average Portfolio Maturity :47.36 days5) Total investments in Foreign Securities / Overseas ETFs : Nil 7) Investments in Fixed Deposits : Nil(**) Thinly Traded / Non-Traded Securities, (NA) No Unit Hoders.
HDFC FIXED MATURITY PLANS - SERIES V - 36M JUNE 2007(A CLOSE ENDED INCOME SCHEME)
Name of the Instrument Rating Quantity Market/ % toFair Value NAV
(Rs. In Lakhs)
DEBT INSTRUMENTS(a) Listed / awaiting listing onStock ExchangesGovernment Securities Nil NilNon-Convertible debentures / BondsKotak Mahindra Prime Ltd.** AA 162 1,616.28 18.94Shriram Transport Finance Co. Ltd.** AA 159 1,584.19 18.57GE Capital Services India** AAA 100 980.94 11.50Sundaram Finance Ltd.** LAA+ 100 976.42 11.44Tata Motor Finance Ltd.** A 70 670.42 7.86Trent Ltd.** LAA 8,343 43.35 0.51Subtotal 5,871.60 68.82(b) Privately Placed / UnlistedNon-Convertible debentures / Bonds

HDFC Asset Management Company LimitedA Joint Venture with Standard Life Investments Limited
Registered Office: Ramon House, 3rd Floor, H.T. Parekh Marg, 169, Backbay Reclamation, Churchgate, Mumbai 400 020.Investor Services Centre (at Mumbai) : Mistry Bhawan, 2nd Floor, 122, Backbay Reclamation, Dinsha Vachha Road, Churchgate, Mumbai - 400 020 • Tel.: 022-6631 6300 • Toll-free number : 1800 233 6767 • Fax : 022-2282 1144 • e-mail : [email protected] • Visit us at : www.hdfcfund.com
HALF-YEARLY PORTFOLIO STATEMENT OF THE SCHEMES / PLANS OF HDFC MUTUAL FUND AS ON MARCH 31, 2009[ Pursuant to Regulation 59A of Securities and Exchange Board of India (Mutual Funds) Regulations, 1996 ]
Page: 19 (continued....)
Name of the Instrument Rating Quantity Market/ % toFair Value NAV
(Rs. In Lakhs)Trent Ltd.** AA 4 42.63 0.50Subtotal 42.63 0.50(c) Securitized Debt InstrumentsIndian Corporate LoanSecuritisation Trust - Series XLI** AA+ (SO) 24 2,067.82 24.23Credit Asset Trust Series XXVI** AAA (SO) 1 112.96 1.32Subtotal 2,180.78 25.55Total 8,095.01 94.87MONEY MARKET INSTRUMENTSBills Rediscounting Nil NilCommercial Papers (CP) /Certificate of Deposit (CD) Nil NilTreasury bills Nil NilCollateralised Borrowing &Lending Obligation Nil NilFixed DepositsDeposits(maturity not exceeding 91 days) Nil NilTotal Nil NilOTHERSNet Current Assets 437.59 5.13Grand Total 8,532.60 100.00
Notes :1) Total NPAs provided for and its percentage to NAV : Nil2) NAVs at a Glance :
Wholesale Plan March 31, 2009 September 30, 2008NAV per Unit ( Rs.) Growth Option 11.6443 10.9717
Quarterly Dividend Option 10.2838 10.0328
Retail Plan March 31, 2009 September 30, 2008NAV per Unit ( Rs.) Growth Option 11.5640 10.9177
Dividend Option 11.5640 10.9177Quarterly Dividend Option 10.1702 10.0321
3) For details on dividend declared during the half-year ended March 31, 2009, please refer to Dividend History Table.4) Total outstanding exposure in Derivative Instruments : Nil 6) Average Portfolio Maturity : 1.21 years5) Total investments in Foreign Securities / Overseas ETFs : Nil 7) Investments in Fixed Deposits : Nil(**) Thinly Traded / Non-Traded Securities.
HDFC FIXED MATURITY PLANS - SERIES VI - 18MSEPTEMBER 2007 (A CLOSE ENDED INCOME SCHEME)
Name of the Instrument Rating Quantity Market/ % toFair Value NAV
(Rs. In Lakhs)
DEBT INSTRUMENTS(a) Listed / awaiting listing onStock ExchangesGovernment Securities Nil NilNon-Convertible debentures / Bonds
� Citi Financial Consumer Finance (I) Ltd** AA 230 2,287.01 18.65� Shriram Transport Finance Co. Ltd.** AA 100 981.90 8.01� Sundaram Finance Ltd.** AA+ 30 294.30 2.40� Kotak Mahindra Prime Ltd.** P1+ 20 198.43 1.62
Subtotal 3,761.64 30.68(b) Privately Placed / UnlistedNon-Convertible debentures / Bonds Nil Nil(c) Securitized Debt Instruments
� Corporate Loan Series 60** AAA (SO) 24 2,760.47 22.52� Investment Vehicle 1508** AAA (SO) 20 1,675.78 13.67� Indian Corporate Loan Trust 2008
Series 7** PR1+ (SO) 14 1,382.45 11.28� IOP Loan Trust** PR1+ (SO) 11 1,070.43 8.73� RPS Trust ** LAAA (SO) 2,200,000 218.72 1.78
KEC Loan Trust** AA- (SO) 1 112.66 0.92Subtotal 7,220.51 58.90Total 10,982.15 89.58MONEY MARKET INSTRUMENTSBills Rediscounting Nil NilCommercial Papers (CP) /Certificate of Deposit (CD)
� State Bank of Patiala** P1+ 350 331.02 2.70Subtotal 331.02 2.70Treasury bills Nil NilCollateralised Borrowing &Lending Obligation 198.72 1.62Subtotal 198.72 1.62Fixed DepositsDeposits(maturity not exceeding 91 days) Nil NilTotal 529.74 4.32OTHERSNet Current Assets 747.77 6.10Grand Total 12,259.66 100.00
Notes :1) Total NPAs provided for and its percentage to NAV : Nil2) NAVs at a Glance :
Wholesale Plan March 31, 2009 September 30, 2008NAV per Unit ( Rs.) Growth Option 11.4393 10.8135
Quarterly Dividend Option 10.5627 10.0728
Retail Plan March 31, 2009 September 30, 2008NAV per Unit ( Rs.) Growth Option 11.3389 10.7507
Dividend Option 11.3389 10.7507Quarterly Dividend Option 10.5340 10.0718
3) For details on dividend declared during the half-year ended March 31, 2009, please refer to Dividend History Table.4) Total outstanding exposure in Derivative Instruments : Nil 6) Average Portfolio Maturity:79.81 days5) Total investments in Foreign Securities / Overseas ETFs : Nil 7) Investments in Fixed Deposits : Nil(�) Top Ten Holdings, (**) Thinly Traded / Non-Traded Securities.
HDFC FIXED MATURITY PLANS - SERIES VI - 18MOCTOBER 2007 (A CLOSE ENDED INCOME SCHEME)
Name of the Instrument Rating Quantity Market/ % toFair Value NAV
(Rs. In Lakhs)
DEBT INSTRUMENTS(a) Listed / awaiting listing onStock ExchangesGovernment Securities Nil NilNon-Convertible debentures / BondsShriram Transport Finance Co. Ltd.** AA 250 2,456.20 17.97Housing Development FinanceCorporation Ltd.**$ AAA 20 201.51 1.48Citicorp Finance (India) Ltd.** AA+ 5 49.75 0.36Subtotal 2,707.46 19.81(b) Privately Placed / UnlistedNon-Convertible debentures / Bonds Nil Nil(c) Securitized Debt InstrumentsIndian Retail ABS Trust 96 2008** AAA (SO) 28 2,742.53 20.08IKR Loan Trust** PR1+ (SO) 26 2,561.07 18.75Credit Asset Trust Series XXVI** AAA (SO) 23 2,499.41 18.30IPL Loan Trust** PR1+ (SO) 13 1,280.16 9.37IOP Loan Trust** PR1+ (SO) 9 875.81 6.41Investment Vehicle 1508** AAA (SO) 5 531.16 3.89Subtotal 10,490.14 76.80Total 13,197.60 96.61MONEY MARKET INSTRUMENTSBills Rediscounting Nil Nil
Name of the Instrument Rating Quantity Market/ % toFair Value NAV
(Rs. In Lakhs)Commercial Papers (CP) /Certificate of Deposit (CD) Nil NilTreasury bills Nil NilCollateralised Borrowing &Lending Obligation Nil NilFixed DepositsDeposits(maturity not exceeding 91 days) Nil NilTotal Nil NilOTHERSNet Current Assets 463.46 3.39Grand Total 13,661.06 100.00
Notes :1) Total NPAs provided for and its percentage to NAV : Nil2) NAVs at a Glance :
Wholesale Plan March 31, 2009 September 30, 2008NAV per Unit ( Rs.) Growth Option 11.2658 10.7315
Dividend Option 11.2658 10.7315
Retail Plan March 31, 2009 September 30, 2008NAV per Unit ( Rs.) Growth Option 11.1710 10.6730
Dividend Option 11.1710 10.6730
Quarterly Dividend Option 10.3625 10.00983) For details on dividend declared during the half-year ended March 31, 2009, please refer to Dividend History Table.4) Total outstanding exposure in Derivative Instruments : Nil 6) Average Portfolio Maturity : 177.99 days5) Total investments in Foreign Securities / Overseas ETFs : Nil 7) Investments in Fixed Deposits : Nil(**) Thinly Traded / Non-Traded Securities, ($) Sponsor
HDFC FIXED MATURITY PLANS - SERIES VI - 18MNOVEMBER 2007 (A CLOSE ENDED INCOME SCHEME)
Name of the Instrument Rating Quantity Market/ % toFair Value NAV
(Rs. In Lakhs)DEBT INSTRUMENTS(a) Listed / awaiting listing onStock ExchangesGovernment Securities Nil NilNon-Convertible debentures / Bonds
� Citicorp Finance (India) Ltd.** AA+ 70 696.72 4.58� M&M Financial Services Ltd.** AA- 30 298.05 1.96� ICICI Home Finance Ltd** AAA 23 230.83 1.52� BHW Birla Home Finance Ltd.** LAA+ 10 100.28 0.66
Citi Financial Consumer Finance (I) Ltd** AA 10 99.30 0.65Kotak Mahindra Prime Ltd.** P1+ 10 99.30 0.65LIC Housing Finance Ltd.** AAA 10 98.90 0.65Subtotal 1,623.38 10.67(b) Privately Placed / UnlistedNon-Convertible debentures / Bonds
� GE Money Financial Services Limited** AAA 150 1,478.40 9.70Subtotal 1,478.40 9.70(c) Securitized Debt Instruments
� Indian Retail ABS Trust 96 2008** AAA (SO) 38 3,733.88 24.50� SME Retail Pool II Trust** AAA (SO) 38 3,386.14 22.23� Indian Retail ABS Trust 95** AAA (SO) 21 2,142.16 14.06� KEC Loan Trust** AA- (SO) 11 1,239.25 8.13� Indian Corporate Loan
Trust 2008 Series 7** PR1+ (SO) 5 493.73 3.24Credit Asset Trust Series XLIX** F1+ (ind) (SO) 4 96.98 0.64RPS Trust ** LAAA (SO) 400,000 39.77 0.26Subtotal 11,131.91 73.06Total 14,233.69 93.43MONEY MARKET INSTRUMENTSBills Rediscounting Nil NilCommercial Papers (CP) /Certificate of Deposit (CD)State Bank of Bikaner & Jaipur** P1+ 50 48.45 0.32Subtotal 48.45 0.32Treasury bills Nil NilCollateralised Borrowing &Lending Obligation 99.36 0.65Subtotal 99.36 0.65Fixed DepositsDeposits(maturity not exceeding 91 days) Nil NilTotal 147.81 0.97OTHERSNet Current Assets 853.45 5.60
Grand Total 15,234.95 100.00Notes :1) Total NPAs provided for and its percentage to NAV : Nil2) NAVs at a Glance :
Wholesale Plan March 31, 2009 September 30, 2008NAV per Unit ( Rs.) Growth Option 11.2766 10.7176
Retail Plan March 31, 2009 September 30, 2008NAV per Unit ( Rs.) Growth Option 11.1854 10.6627
Dividend Option 11.1854 10.6627Quarterly Dividend Option 10.3286 10.0603
3) For details on dividend declared during the half-year ended March 31, 2009, please refer to Dividend History Table.4) Total outstanding exposure in Derivative Instruments : Nil 6) Average Portfolio Maturity : 232.52 days5) Total investments in Foreign Securities / Overseas ETFs : Nil 7) Investments in Fixed Deposits : Nil(�) Top Ten Holdings, (**) Thinly Traded / Non-Traded Securities.
HDFC FIXED MATURITY PLANS - SERIES VI - 18MDECEMBER 2007 (A CLOSE ENDED INCOME SCHEME)
Name of the Instrument Industry Quantity Market/ % to+/Rating Fair Value NAV
(Rs. In Lakhs)
DEBT INSTRUMENTS(a) Listed / awaiting listing onStock ExchangesGovernment Securities Nil NilNon-Convertible debentures / BondsHousing DevelopmentFinance Corporation Ltd.**$ AAA 20 199.73 8.64SREI Infrastructure Finance Ltd.** AA 200 199.05 8.61Sundaram Finance Ltd.** AA+ 20 196.20 8.49Subtotal 594.98 25.74(b) Privately Placed / UnlistedNon-Convertible debentures / Bonds Nil Nil(c) Securitized Debt InstrumentsIndia Loan SecuritisationSeries 8 Trust 2008** AAA (SO) 4 390.86 16.91BHPC Auto Securitisation Trust Nov II** AAA (SO) 4 389.87 16.87KEC Loan Trust** AA- (SO) 3 337.98 14.62Subtotal 1,118.71 48.40Total 1,713.69 74.14MONEY MARKET INSTRUMENTSBills Rediscounting Nil NilCommercial Papers (CP) /Certificate of Deposit (CD)State Bank of Patiala** P1+ 450 425.60 18.41Subtotal 425.60 18.41Treasury bills Nil NilCollateralised Borrowing &Lending Obligation Nil Nil
Name of the Instrument Industry Quantity Market/ % to+/Rating Fair Value NAV
(Rs. In Lakhs)
Fixed DepositsDeposits(maturity not exceeding 91 days) Nil NilTotal 425.60 18.41OTHERSNet Current Assets 172.09 7.45Grand Total 2,311.38 100.00
Notes :1) Total NPAs provided for and its percentage to NAV : Nil2) NAVs at a Glance :
Wholesale Plan March 31, 2009 September 30, 2008NAV per Unit ( Rs.) Dividend Option 11.1661 10.6154
Retail Plan March 31, 2009 September 30, 2008NAV per Unit ( Rs.) Growth Option 11.0820 10.5669
Dividend Option 11.0820 10.5669Quarterly Dividend Option 10.1774 10.0171
3) For details on dividend declared during the half-year ended March 31, 2009, please refer to Dividend History Table.4) Total outstanding exposure in Derivative Instruments : Nil 6) Average Portfolio Maturity: 210.66 days5) Total investments in Foreign Securities / Overseas ETFs : Nil 7) Investments in Fixed Deposits : Nil(**) Thinly Traded / Non-Traded Securities, ($) Sponsor.
HDFC FIXED MATURITY PLANS - SERIES VII - 18M JANUARY 2008 (A CLOSE ENDED INCOME SCHEME)
Name of the Instrument Rating Quantity Market/ % toFair Value NAV
(Rs. In Lakhs)
DEBT INSTRUMENTS(a) Listed / awaiting listing onStock ExchangesGovernment Securities Nil NilNon-Convertible debentures / Bonds
� Citicorp Finance (India) Ltd.** AA+ 99 984.29 6.72� National Housing Bank** AAA 40 399.09 2.73� Infrastructure Development
Finance Company Ltd** LAAA 10 97.87 0.67BHW Birla Home Finance Ltd.** LAA+ 5 50.14 0.34Subtotal 1,531.39 10.46(b) Privately Placed / UnlistedNon-Convertible debentures / Bonds
� Carol Info Services Limited** Unrated 130 1,300.00 8.89� Dr. Reddy’s Holding Pvt.Ltd.** P1+ 3 299.53 2.05
Subtotal 1,599.53 10.94(c) Securitized Debt Instruments
� BHPC Auto Securitisation Trust Feb 08 I** AAA (SO) 32 3,412.16 23.33� Credit Asset Trust Series XXXII** LAAA (SO) 24 2,662.28 18.20� Credit Asset Trust Series LXVI** F1+ (ind) (SO) 23 2,307.72 15.78� Indian Retail ABS Trust 96 2008** AAA (SO) 23 2,259.98 15.45� Credit Asset Trust Series LXVII** F1+ (ind) (SO) 5 501.83 3.43
Subtotal 11,143.97 76.19Total 14,274.89 97.59MONEY MARKET INSTRUMENTSBills Rediscounting Nil NilCommercial Papers (CP) /Certificate of Deposit (CD)State Bank of Patiala** P1+ 100 94.58 0.65Subtotal 94.58 0.65Treasury bills Nil NilCollateralised Borrowing &Lending Obligation Nil NilFixed DepositsDeposits(maturity not exceeding 91 days) Nil NilTotal 94.58 0.65OTHERSNet Current Assets 258.03 1.76
Grand Total 14,627.50 100.00Notes :
1) Total NPAs provided for and its percentage to NAV : Nil2) NAVs at a Glance :
Wholesale Plan March 31, 2009 September 30, 2008NAV per Unit ( Rs.) Growth Option 11.0063 10.4387
Retail Plan March 31, 2009 September 30, 2008NAV per Unit ( Rs.) Growth Option 10.9944 10.4481
Dividend Option 10.9944 10.4481
Quarterly Dividend Option 10.6876 10.2616
3) For details on dividend declared during the half-year ended March 31, 2009, please refer to Dividend History Table.4) Total outstanding exposure in Derivative Instruments : Nil 6) Average Portfolio Maturity : 211.65 days5) Total investments in Foreign Securities / Overseas ETFs : Nil 7) Investments in Fixed Deposits : Nil
(�) Top Ten Holdings, (**) Thinly Traded / Non-Traded Securities.
HDFC FIXED MATURITY PLANS - SERIES VII - 15MFEBRUARY 2008 (A CLOSE ENDED INCOME SCHEME)Name of the Instrument Rating Quantity Market/ % to
Fair Value NAV(Rs. In Lakhs)
DEBT INSTRUMENTS(a) Listed / awaiting listing onStock ExchangesGovernment Securities Nil NilNon-Convertible debentures / BondsICICI Home Finance Ltd** AAA 70 702.52 24.98National Housing Bank** AAA 70 698.42 24.83Citicorp Maruti Finance Ltd.** AA+ 60 598.32 21.27M&M Financial Services Ltd.** AA- 35 349.23 12.42Housing Development FinanceCorporation Ltd.**$ AAA 9 90.68 3.22Subtotal 2,439.17 86.72(b) Privately Placed / UnlistedNon-Convertible debentures / BondsGE Money Financial Services Limited** AAA 4 40.08 1.42Subtotal 40.08 1.42(c) Securitized Debt InstrumentsInvestment Vehicle 1508** AAA (SO) 1 106.23 3.78Subtotal 106.23 3.78Total 2,585.48 91.92MONEY MARKET INSTRUMENTSBills Rediscounting Nil NilCommercial Papers (CP) /Certificate of Deposit (CD)State Bank Of Hyderabad** P1+ 100 98.81 3.51Subtotal 98.81 3.51Treasury bills Nil NilCollateralised Borrowing &Lending Obligation Nil NilFixed DepositsDeposits(maturity not exceeding 91 days) Nil NilTotal 98.81 3.51

HDFC Asset Management Company LimitedA Joint Venture with Standard Life Investments Limited
Registered Office: Ramon House, 3rd Floor, H.T. Parekh Marg, 169, Backbay Reclamation, Churchgate, Mumbai 400 020.Investor Services Centre (at Mumbai) : Mistry Bhawan, 2nd Floor, 122, Backbay Reclamation, Dinsha Vachha Road, Churchgate, Mumbai - 400 020 • Tel.: 022-6631 6300 • Toll-free number : 1800 233 6767 • Fax : 022-2282 1144 • e-mail : [email protected] • Visit us at : www.hdfcfund.com
HALF-YEARLY PORTFOLIO STATEMENT OF THE SCHEMES / PLANS OF HDFC MUTUAL FUND AS ON MARCH 31, 2009[ Pursuant to Regulation 59A of Securities and Exchange Board of India (Mutual Funds) Regulations, 1996 ]
Page: 20 (continued....)
Name of the Instrument Rating Quantity Market/ % toFair Value NAV
(Rs. In Lakhs)
OTHERSNet Current Assets 128.45 4.57Grand Total 2,812.74 100.00
Notes :1) Total NPAs provided for and its percentage to NAV : Nil2) NAVs at a Glance :
Wholesale Plan March 31, 2009 September 30, 2008NAV per Unit ( Rs.) Growth Option 11.0835 10.4791
Retail Plan March 31, 2009 September 30, 2008NAV per Unit ( Rs.) Growth Option 11.0381 10.4595
Dividend Option 11.0381 10.4595
Quarterly Dividend Option 10.0086 10.0232
3) For details on dividend declared during the half-year ended March 31, 2009, please refer to Dividend History Table.4) Total outstanding exposure in Derivative Instruments : Nil 6) Average Portfolio Maturity: 95.55 days5) Total investments in Foreign Securities / Overseas ETFs : Nil 7) Investments in Fixed Deposits : Nil(**) Thinly Traded / Non-Traded Securities, ($) Sponsor.
HDFC FIXED MATURITY PLANS - SERIES VII - 14MFEBRUARY 2008 (A CLOSE ENDED INCOME SCHEME)
Name of the Instrument Rating Quantity Market/ % toFair Value NAV
(Rs. In Lakhs)
DEBT INSTRUMENTS(a) Listed / awaiting listing onStock ExchangesGovernment Securities Nil NilNon-Convertible debentures / BondsNational Bank for Agriculture andRural Development** AAA 35 354.32 8.61Citicorp Maruti Finance Ltd.** AA+ 20 199.44 4.85ICICI Home Finance Ltd** AAA 10 100.36 2.44Subtotal 654.12 15.90(b) Privately Placed / UnlistedNon-Convertible debentures / Bonds Nil Nil(c) Securitized Debt InstrumentsKEC Loan Trust** AA- (SO) 11 1,239.25 30.13Investment Vehicle 1508** AAA (SO) 10 1,062.32 25.82Credit Asset Trust Series XXXV** LAAA (SO) 6 668.84 16.26RB Loan Trust Series XV 2008** AAA (SO) 3 297.02 7.22Corporate Loan SecuritisationSeries XXXIII 2006** F1+ (ind) (SO) 1 99.91 2.43Subtotal 3,367.34 81.86Total 4,021.46 97.76MONEY MARKET INSTRUMENTSBills Rediscounting Nil NilCommercial Papers (CP) /Certificate of Deposit (CD) Nil NilTreasury bills Nil NilCollateralised Borrowing &Lending Obligation Nil NilFixed DepositsDeposits(maturity not exceeding 91 days) Nil NilTotal Nil NilOTHERSNet Current Assets 92.23 2.24Grand Total 4,113.69 100.00
Notes :1) Total NPAs provided for and its percentage to NAV : Nil2) NAVs at a Glance :
Wholesale Plan March 31, 2009 September 30, 2008NAV per Unit ( Rs.) Growth Option 11.0196 10.4063
Retail Plan March 31, 2009 September 30, 2008NAV per Unit ( Rs.) Growth Option 10.9795 10.3859
Dividend Option 10.9795 10.3859
Quarterly Dividend Option 10.6825 10.1050
3) Total outstanding exposure in Derivative Instruments : Nil 5) Average Portfolio Maturity :114.29 days4) Total investments in Foreign Securities / Overseas ETFs : Nil 6) Investments in Fixed Deposits : Nil(•) Top Ten Holdings, (**) Thinly Traded / Non-Traded Securities,
HDFC FIXED MATURITY PLANS - SERIES VII - 13M MARCH 2008 (A CLOSE ENDED INCOME SCHEME)
Name of the Instrument Rating Quantity Market/ % toFair Value NAV
(Rs. In Lakhs)
DEBT INSTRUMENTS(a) Listed / awaiting listing onStock ExchangesGovernment Securities Nil NilNon-Convertible debentures / Bonds Nil Nil(b) Privately Placed / UnlistedNon-Convertible debentures / Bonds Nil Nil(c) Securitized Debt Instruments Nil NilTotal Nil NilMONEY MARKET INSTRUMENTSBills Rediscounting Nil NilPrivately Placed / UnlistedCommercial Papers (CP) /Certificate of Deposit (CD)ICICI Bank Ltd.** P1+ 1,000 979.54 56.66Oriental Bank of Commerce** P1+ 500 475.94 27.53Subtotal 1,455.48 84.19Treasury bills Nil NilCollateralised Borrowing &Lending Obligation Nil NilFixed DepositsDeposits(maturity not exceeding 91 days) Nil NilTotal 1,455.48 84.19OTHERSNet Current Assets 273.35 15.81Grand Total 1,728.83 100.00
Notes :1) Total NPAs provided for and its percentage to NAV : Nil2) NAVs at a Glance :
Wholesale Plan March 31, 2009 September 30, 2008NAV per Unit ( Rs.) Growth Option 11.0514 10.5441
Retail Plan March 31, 2009 September 28, 2007NAV per Unit ( Rs.) Growth Option 11.0177 10.5271
Dividend Option 11.0177 10.5271
Quarterly Dividend Option 10.0017 10.0129
3) For details on dividend declared during the half-year ended March 31, 2009, please refer to Dividend History Table.4) Total outstanding exposure in Derivative Instruments : Nil 6) Average Portfolio Maturity: 94.99 days5) Total investments in Foreign Securities / Overseas ETFs : Nil 7) Investments in Fixed Deposits : Nil(**) Thinly Traded / Non-Traded Securities.
HDFC FIXED MATURITY PLANS - SERIES VII - 13M MARCH 2008 (2) (A CLOSE ENDED INCOME SCHEME)
Name of the Instrument Rating Quantity Market/ % toFair Value NAV
(Rs. In Lakhs)DEBT INSTRUMENTS(a) Listed / awaiting listing onStock ExchangesGovernment Securities Nil NilNon-Convertible debentures / BondsIDBI Bank Limited** AA+ 410 4,092.50 15.37ICICI Bank Ltd.** AAA 24,800 2,340.80 8.79ICICI Home Finance Ltd** AAA 149 1,495.36 5.61Citicorp Finance (India) Ltd.** AA+ 40 397.11 1.49Subtotal 8,325.77 31.26(b) Privately Placed / UnlistedNon-Convertible debentures / Bonds Nil Nil(c) Securitized Debt InstrumentsIndian InfrastructureEquipments Trust MAR 08** LAAA (SO) 60 6,668.36 25.04Indian Retail ABS Trust 91** LAAA (SO) 55 5,606.92 21.05RB Loan Trust Series 28** F1+ (ind) (SO) 39 3,460.12 12.99Indian Corporate LoanTrust 2008 Series 7** PR1+ (SO) 20 1,974.93 7.42Subtotal 17,710.33 66.50Total 26,036.10 97.76MONEY MARKET INSTRUMENTSBills Rediscounting Nil NilCommercial Papers (CP) /Certificate of Deposit (CD)BHW Birla Home Finance Ltd.** P1+ 20 99.44 0.37State Bank Of Hyderabad** P1+ 100 98.81 0.37Subtotal 198.25 0.74Treasury bills Nil NilCollateralised Borrowing &Lending Obligation 99.36 0.37Subtotal 99.36 0.37Fixed DepositsDeposits(maturity not exceeding 91 days) Nil NilTotal 297.61 1.11OTHERSNet Current Assets 300.21 1.13Grand Total 26,633.92 100.00
Notes :1) Total NPAs provided for and its percentage to NAV : Nil2) NAVs at a Glance :
Wholesale Plan March 31, 2009 September 30, 2008NAV per Unit ( Rs.) Growth Option 11.0468 10.3920
Dividend Option 11.0468 10.3920
Retail Plan March 31, 2009 September 30, 2008NAV per Unit ( Rs.) Growth Option 11.0088 10.3722
Dividend Option 11.0088 10.3722Quarterly Dividend Option 10.5120 10.2273
3) For details on dividend declared during the half-year ended March 31, 2009, please refer to Dividend History Table.4) Total outstanding exposure in Derivative Instruments : Nil 6) Average Portfolio Maturity : 178.76 days5) Total investments in Foreign Securities / Overseas ETFs : Nil 7) Investments in Fixed Deposits : Nil(**) Thinly Traded / Non-Traded Securities.
HDFC FIXED MATURITY PLANS - SERIES VII - 370D MARCH 2008 (1)(A CLOSE ENDED INCOME SCHEME)
Name of the Instrument Rating Quantity Market/ % toFair Value NAV
(Rs. In Lakhs)
DEBT INSTRUMENTS(a) Listed / awaiting listing onStock ExchangesGovernment Securities Nil NilNon-Convertible debentures / BondsIDBI Bank Limited** AA+ 990 9,881.89 16.82Housing Development FinanceCorporation Ltd.$ AAA 800 7,979.05 13.59Subtotal 17,860.94 30.41(b) Privately Placed / UnlistedNon-Convertible debentures / Bonds Nil NilSubtotal(c) Securitized Debt Instruments Nil NilTotal 17,860.94 30.41MONEY MARKET INSTRUMENTSBills Rediscounting Nil NilCommercial Papers (CP) /Certificate of Deposit (CD)ICICI Bank Ltd.** P1+/A1+ 10,100 9,775.46 16.65National Bank for Agriculture &Rural Development ** AAA 6,500 6,411.75 10.91Export - Import Bank of India** P1+ 3,700 3,607.52 6.15Oriental Bank of Commerce** P1+ 3,300 3,141.18 5.35Punjab National Bank** F1+ 2,000 1,958.68 3.34Corporation Bank** P1+ 1,100 1,069.31 1.83Subtotal 25,963.90 44.23Treasury bills Nil NilCollateralised Borrowing &Lending Obligation 7,305.02 12.44Subtotal 7,305.02 12.44Fixed DepositsDeposits (maturity not exceeding 91 days) Nil NilTotal 33,268.92 56.67OTHERSNet Current Assets 7,588.78 12.92Grand Total 58,718.64 100.00
Notes :1) Total NPAs provided for and its percentage to NAV : Nil2) NAVs at a Glance :
Wholesale Plan March 31, 2009 September 30, 2008NAV per Unit ( Rs.) Growth Option 10.9069 10.3704
Retail Plan March 31, 2009 September 30, 2008NAV per Unit ( Rs.) Growth Option 10.9069 10.3704
Dividend Option 10.9069 10.37043) Total outstanding exposure in Derivative Instruments : Nil 5) Average Portfolio Maturity : 110.98 days4) Total investments in Foreign Securities / Overseas ETFs : Nil 6) Investments in Fixed Deposits : Nil(**) Thinly Traded / Non-Traded Securities, ($) Sponsor.
HDFC FIXED MATURITY PLANS - SERIES VII - 370DMARCH 2008 (2) (A CLOSE ENDED INCOME SCHEME)
Name of the Instrument Rating Quantity Market/ % toFair Value NAV
(Rs. In Lakhs)
DEBT INSTRUMENTS(a) Listed / awaiting listing onStock ExchangesGovernment Securities Nil NilNon-Convertible debentures / Bonds
� Housing DevelopmentFinance Corporation Ltd.$ AAA 916 9,363.04 11.54
� IDBI Bank Limited** AA+ 585 5,839.30 7.20� Cholamandalam D B Finance Company Ltd.** AA- 315 3,099.37 3.82
Citicorp Finance (India) Ltd.** AA+ 60 597.26 0.74
Name of the Instrument Rating Quantity Market/ % toFair Value NAV
(Rs. In Lakhs)Subtotal 18,898.97 23.30(b) Privately Placed / UnlistedNon-Convertible debentures / Bonds Nil Nil(c) Securitized Debt Instruments
� Indian Corporate LoanSecuritisation Trust - Series LXV** LAA+ (SO) 75 7,278.82 8.97
� RB Loan Trust Series XV 2008** AAA (SO) 56 5,544.43 6.83� Indian Corporate Loan Trust 2008
Series 7** PR1+ (SO) 50 4,937.33 6.08� Collateralised Debt Trust Series 24** AAA (SO) 44 4,359.76 5.37� Indian Corporate Loan Trust - Series IV** A1+ (SO) 35 3,465.35 4.27
Credit Asset Trust Series XXVI** AAA (SO) 24 2,672.97 3.29Corporate Loan Series 60** AAA (SO) 5 507.65 0.63Loan Securitisation Trust Series 51** AA+ (SO)/PR1+ (SO) 50 241.37 0.30Tata Teleservices (Maharashtra) Limited** LAAA (SO) 156,300 15.54 0.02Subtotal 29,023.22 35.76Total 47,922.19 59.06MONEY MARKET INSTRUMENTSBills Rediscounting Nil NilPrivately Placed / UnlistedCommercial Papers (CP) /Certificate of Deposit (CD)
� Reliance Capital Ltd.** A1+ 4,000 19,975.96 24.62� Tata Motor Finance Ltd.** P1 2,400 11,868.89 14.62
BHW Birla Home Finance Ltd.** P1+ 190 944.67 1.16IDBI Bank Limited** A1+ 100 95.05 0.12Subtotal 32,884.57 40.52Treasury bills Nil NilCollateralised Borrowing &Lending Obligation 155.98 0.19Subtotal 155.98 0.19Fixed DepositsDeposits(maturity not exceeding 91 days) Nil NilTotal 33,040.55 40.71OTHERSNet Current Assets 185.55 0.23Grand Total 81,148.29 100.00
Notes :1) Total NPAs provided for and its percentage to NAV : Nil2) NAVs at a Glance :
Wholesale Plan March 31, 2009 September 30, 2008NAV per Unit ( Rs.) Growth Option 10.9952 10.3809
Dividend Option 10.9952 10.3809
Retail Plan March 31, 2009 September 30, 2008NAV per Unit ( Rs.) Growth Option 10.9952 10.3809
Dividend Option 10.9952 10.3809Quarterly Dividend Option 10.3331 10.0532
3) For details on dividend declared during the half-year ended March 31, 2009, please refer to Dividend History Table.4) Total outstanding exposure in Derivative Instruments : Nil 6) Average Portfolio Maturity : 89.00 days5) Total investments in Foreign Securities / Overseas ETFs : Nil 7) Investments in Fixed Deposits : Nil(�) Top Ten Holdings, (**) Thinly Traded / Non-Traded Securities, ($) Sponsor.
HDFC FIXED MATURITY PLANS - SERIES VII - 18M APRIL 2008(A CLOSE ENDED INCOME SCHEME)
Name of the Instrument Rating Quantity Market/ % toFair Value NAV
(Rs. In Lakhs)DEBT INSTRUMENTS(a) Listed / awaiting listing onStock ExchangesGovernment Securities Nil NilNon-Convertible debentures / BondsIDBI Bank Limited** AA+ 90 898.35 18.97Housing Development FinanceCorporation Ltd.**$ AAA 85 830.42 17.52Citicorp Finance (India) Ltd.** AA+ 7 69.65 1.47Subtotal 1,798.42 37.96(b) Privately Placed / UnlistedNon-Convertible debentures / Bonds Nil Nil(c) Securitized Debt InstrumentsInvestment Vehicle 1508** AAA (SO) 9 956.09 20.18Auto Securitisation Trust MP A May 2008** AAA (SO) 9 942.12 19.88Credit Asset Trust Series LXVI** F1+ (ind) (SO) 9 903.02 19.06Subtotal 2,801.23 59.12Total 4,599.65 97.08MONEY MARKET INSTRUMENTSBills Rediscounting Nil NilCommercial Papers (CP) /Certificate of Deposit (CD) Nil NilTreasury bills Nil NilCollateralised Borrowing &Lending Obligation 120.98 2.55Subtotal 120.98 2.55Fixed DepositsDeposits(maturity not exceeding 91 days) Nil NilTotal 120.98 2.55OTHERSNet Current Assets 17.35 0.37Grand Total 4,737.98 100.00
Notes :1) Total NPAs provided for and its percentage to NAV : Nil2) NAVs at a Glance :
Wholesale Plan March 31, 2009 September 30, 2008NAV per Unit ( Rs.) Growth Option 10.8079 10.2298
Dividend Option 10.8079 10.2298
Retail Plan March 31, 2009 September 30, 2008NAV per Unit ( Rs.) Growth Option 10.7481 10.2032
Dividend Option 10.7481 10.2032Quarterly Dividend Option 10.0266 10.0207
3) For details on dividend declared during the half-year ended March 31, 2009, please refer to Dividend History Table.4) Total outstanding exposure in Derivative Instruments : Nil 6) Average Portfolio Maturity : 260.21 days5) Total investments in Foreign Securities / Overseas ETFs : Nil 7) Investments in Fixed Deposits : Nil(**) Thinly Traded / Non-Traded Securities, ($) Sponsor.
HDFC FIXED MATURITY PLANS - SERIES VII - 18MAPRIL 2008 (2) (A CLOSE ENDED INCOME SCHEME)
Name of the Instrument Rating Quantity Market/ % toFair Value NAV
(Rs. In Lakhs)
DEBT INSTRUMENTS(a) Listed / awaiting listing onStock ExchangesGovernment Securities Nil NilNon-Convertible debentures / BondsHousing DevelopmentFinance Corporation Ltd.$ AAA 320 3,270.93 20.44IDBI Bank Limited** AA+ 200 1,996.34 12.47LIC Housing Finance Ltd.** AAA 115 1,137.33 7.11Infrastructure DevelopmentFinance Company Ltd** LAAA 5 48.94 0.31Subtotal 6,453.54 40.33(b) Privately Placed / UnlistedNon-Convertible debentures / Bonds Nil Nil(c) Securitized Debt InstrumentsInvestment Vehicle 1508** AAA (SO) 34 3,611.90 22.57

HDFC Asset Management Company LimitedA Joint Venture with Standard Life Investments Limited
Registered Office: Ramon House, 3rd Floor, H.T. Parekh Marg, 169, Backbay Reclamation, Churchgate, Mumbai 400 020.Investor Services Centre (at Mumbai) : Mistry Bhawan, 2nd Floor, 122, Backbay Reclamation, Dinsha Vachha Road, Churchgate, Mumbai - 400 020 • Tel.: 022-6631 6300 • Toll-free number : 1800 233 6767 • Fax : 022-2282 1144 • e-mail : [email protected] • Visit us at : www.hdfcfund.com
HALF-YEARLY PORTFOLIO STATEMENT OF THE SCHEMES / PLANS OF HDFC MUTUAL FUND AS ON MARCH 31, 2009[ Pursuant to Regulation 59A of Securities and Exchange Board of India (Mutual Funds) Regulations, 1996 ]
Page: 21 (continued....)
Name of the Instrument Rating Quantity Market/ % toFair Value NAV
(Rs. In Lakhs)Treasury bills Nil NilCollateralised Borrowing &Lending Obligation 42.99 0.24Subtotal 42.99 0.24Fixed DepositsDeposits(maturity not exceeding 91 days) Nil NilTotal 42.99 0.24OTHERSNet Current Assets 425.51 2.35Grand Total 18,078.61 100.00
Notes :1) Total NPAs provided for and its percentage to NAV : Nil2) NAVs at a Glance :
Wholesale Plan March 31, 2009 September 30, 2008NAV per Unit ( Rs.) Growth Option 10.7252 10.1658
Dividend Option 10.7252 10.1658Quarterly Dividend Option 10.5127 10.0347
Retail Plan March 31, 2009 September 30, 2008NAV per Unit ( Rs.) Growth Option 10.6990 10.1571
Dividend Option 10.6990 10.1571Quarterly Dividend Option 10.5040 10.0341
3) For details on dividend declared during the half-year ended March 31, 2009, please refer to Dividend History Table.4) Total outstanding exposure in Derivative Instruments : Nil 6) Average Portfolio Maturity:141.65 days5) Total investments in Foreign Securities / Overseas ETFs : Nil 7) Investments in Fixed Deposits : Nil(**) Thinly Traded / Non-Traded Securities.
HDFC FIXED MATURITY PLANS - SERIES VIII - 370D JUNE 2008 (2)(A CLOSE ENDED INCOME SCHEME)
Name of the Instrument Rating Quantity Market/ % toFair Value NAV
(Rs. In Lakhs)
DEBT INSTRUMENTS(a) Listed / awaiting listing onStock ExchangesGovernment Securities Nil NilNon-Convertible debentures / Bonds
� Housing Development FinanceCorporation Ltd.**$ AAA 106 1,068.02 9.01
� Citi Financial Consumer Finance (I) Ltd** AA 60 595.77 5.03� Infrastructure Development Finance
Company Ltd** LAAA 30 293.61 2.48� National Bank for Agriculture and
Rural Development** AAA 25 253.08 2.14Subtotal 2,210.48 18.66(b) Privately Placed / UnlistedNon-Convertible debentures / Bonds
� Dr. Reddy’s Holding Pvt.Ltd.** P1+ 22 2,196.53 18.53� Carol Info Services Limited** Unrated 110 1,100.00 9.29
Subtotal 3,296.53 27.82(c) Securitized Debt Instruments
� Indian Retail ABS Trust 96 2008** AAA (SO) 25 2,448.69 20.67� Credit Asset Trust Series LXVII** F1+ (ind) (SO) 23 2,308.40 19.49� Indian Corporate Loan Trust 2008 12** PR1+ (SO) 7 680.41 5.74� Indian Corporate Loan Securitisation
Trust - Series LXV** LAA+ (SO) 25 122.82 1.04Auto Loan Securitisation Trust May 07** AAA (SO) 1 108.44 0.92India Loan Securitisation Series 5Trust 2008 ** AAA (SO) 2 91.60 0.77RB Loan Trust Series 28** F1+ (ind) (SO) 1 88.72 0.75Credit Asset Trust Series XXXV** LAAA (SO) 3 81.82 0.69Subtotal 5,930.90 50.07Total 11,437.91 96.55MONEY MARKET INSTRUMENTSBills Rediscounting Nil NilCommercial Papers (CP) /Certificate of Deposit (CD) Nil NilTreasury bills Nil NilCollateralised Borrowing &Lending Obligation 98.99 0.84Subtotal 98.99 0.84Fixed DepositsDeposits(maturity not exceeding 91 days) Nil NilTotal 98.99 0.84OTHERSNet Current Assets 309.34 2.61Grand Total 11,846.24 100.00
Notes :1) Total NPAs provided for and its percentage to NAV : Nil2) NAVs at a Glance :
Wholesale Plan March 31, 2009 September 30, 2008NAV per Unit ( Rs.) Growth Option 10.7158 10.1453
Dividend Option 10.7158 10.1453
Retail Plan March 31, 2009 September 30, 2008NAV per Unit ( Rs.) Growth Option 10.6850 10.1352
Dividend Option 10.6850 10.1352Quarterly Dividend Option 10.2853 10.1352
3) For details on dividend declared during the half-year ended March 31, 2009, please refer to Dividend History Table.4) Total outstanding exposure in Derivative Instruments : Nil 6) Average Portfolio Maturity :179.11 days5) Total investments in Foreign Securities / Overseas ETFs : Nil 7) Investments in Fixed Deposits : Nil(**) Thinly Traded / Non-Traded Securities, ($) Sponsor.
HDFC FIXED MATURITY PLANS - SERIES VIII - 370D JULY 2008 (1)
(A CLOSE ENDED INCOME SCHEME)Name of the Instrument Rating Quantity Market/ % to
Fair Value NAV(Rs. In Lakhs)
DEBT INSTRUMENTS(a) Listed / awaiting listing onStock ExchangesGovernment Securities Nil NilNon-Convertible debentures / Bonds
� Citi Financial Consumer Finance (I) Ltd** AA 50 496.48 3.13� Infrastructure Development
Finance Company Ltd** LAAA 35 342.55 2.16IDBI Bank Limited** AA+ 30 299.45 1.89Subtotal 1,138.48 7.18(b) Privately Placed / UnlistedNon-Convertible debentures / Bonds
� Dr. Reddy’s Holding Pvt.Ltd.** P1+ 25 2,496.06 15.74Subtotal 2,496.06 15.74(c) Securitized Debt Instruments
� Indian Retail ABS Trust 96 2008** AAA (SO) 33 3,232.27 20.38� Credit Asset Trust Series LVIII** LAAA (SO) 30 3,000.10 18.92� Indian Corporate Loan
Securitisation Trust 2008-40** P1+ (SO) 17 1,608.89 10.15� Credit Asset Trust Series LXVII** F1+ (ind) (SO) 14 1,405.11 8.86� Credit Asset Trust Series LXVI** F1+ (ind) (SO) 14 1,404.70 8.86� Bharat Securitisation Trust 6 ** LAAA (SO) 40 401.89 2.53
Subtotal 11,052.96 69.70Total 14,687.50 92.62MONEY MARKET INSTRUMENTS
Name of the Instrument Rating Quantity Market/ % toFair Value NAV
(Rs. In Lakhs)Credit Asset Trust Series LXIV** F1+ (SO) 31 3,103.60 19.39Auto Securitisation Trust MP A May 2008** AAA (SO) 23 2,407.64 15.05Indian Corporate LoanSecuritisation Trust - Series XLI** AA+ (SO) 25 316.02 1.97Indian Corporate Loan Trust 2008 12** PR1+ (SO) 49 124.15 0.78CE Pool Trust June 2007** LAAA (SO) 3 37.02 0.23Subtotal 9,600.33 59.99Total 16,053.87 100.32MONEY MARKET INSTRUMENTSBills Rediscounting Nil NilCommercial Papers (CP) /Certificate of Deposit (CD) Nil NilTreasury bills Nil NilCollateralised Borrowing &Lending Obligation Nil NilFixed DepositsDeposits(maturity not exceeding 91 days) Nil NilTotal Nil NilOTHERSNet Current Assets (51.01) (0.32)Grand Total 16,002.86 100.00
Notes :1) Total NPAs provided for and its percentage to NAV : Nil2) NAVs at a Glance :
Wholesale Plan March 31, 2009 September 30, 2008NAV per Unit ( Rs.) Growth Option 10.8589 10.2094
Quarterly Dividend Option 10.3637 10.0210
Retail Plan March 31, 2009 September 30, 2008NAV per Unit ( Rs.) Growth Option 10.7983 10.1844
Dividend Option 10.7983 10.1844Quarterly Dividend Option 10.3538 10.0201
3) For details on dividend declared during the half-year ended March 31, 2009, please refer to Dividend History Table.4) Total outstanding exposure in Derivative Instruments : Nil 6) Average Portfolio Maturity: 278.78 days5) Total investments in Foreign Securities / Overseas ETFs : Nil 7) Investments in Fixed Deposits : Nil(**) Thinly Traded / Non-Traded Securities, ($) Sponsor.
HDFC FIXED MATURITY PLANS - SERIES VIII - 370D MAY 2008(A CLOSE ENDED INCOME SCHEME)
Name of the Instrument Rating Quantity Market/ % toFair Value NAV
(Rs. In Lakhs)
DEBT INSTRUMENTS(a) Listed / awaiting listing onStock ExchangesGovernment Securities Nil NilNon-Convertible debentures / Bonds
� Kotak Mahindra Prime Ltd.** P1+ 390 3,872.66 15.92� ICICI Bank Ltd.** AAA 19,200 3,006.00 12.37� Infrastructure Development
Finance Company Ltd** AAA 200 1,999.91 8.23National Housing Bank** AAA 30 299.32 1.23Citi Financial Consumer Finance (I) Ltd** AA 15 148.94 0.61SREI Infrastructure Finance Ltd.** AA 100 99.52 0.41Citicorp Finance (India) Ltd.** AA+ 8 79.60 0.33National Bank for Agriculture andRural Development** AAA 5 50.62 0.21Subtotal 9,556.57 39.31(b) Privately Placed / UnlistedNon-Convertible debentures / Bonds
� Shriram City Union Finance Ltd.** F1 (ind) (SO) 450,000 4,493.90 18.49Subtotal 4,493.90 18.49(c) Securitized Debt Instruments
� ILSS 1 Trust 2009 ** AAA (SO) 29 2,731.37 11.24� IKR Loan Trust** PR1+ (SO) 20 1,970.06 8.11� Investment Vehicle 1508** AAA (SO) 20 1,675.78 6.89� Credit Asset Trust Series XLIX** F1+ (ind) (SO) 19 1,562.41 6.43� Credit Asset Trust Series XLVII** AAA (ind) (SO) 12 1,011.36 4.16
India Loan Securitisation Series 8Trust 2008** AAA (SO) 3 293.14 1.21IOP Loan Trust** PR1+ (SO) 1 97.31 0.40CE Pool Trust June 2007** LAAA (SO) 3 37.02 0.15Subtotal 9,378.45 38.59Total 23,428.92 96.39MONEY MARKET INSTRUMENTSBills Rediscounting Nil NilCommercial Papers (CP) /Certificate of Deposit (CD)State Bank Of Hyderabad** P1+ 100 98.81 0.41Subtotal 98.81 0.41Treasury bills Nil NilCollateralised Borrowing &Lending Obligation 369.08 1.52Subtotal 369.08 1.52Fixed DepositsDeposits(maturity not exceeding 91 days) Nil NilTotal 467.89 1.93OTHERSNet Current Assets 409.11 1.68Grand Total 24,305.92 100.00
Notes :1) Total NPAs provided for and its percentage to NAV : Nil2) NAVs at a Glance :
Wholesale Plan March 31, 2009 September 30, 2008NAV per Unit ( Rs.) Growth Option 10.7846 10.2072
Dividend Option 10.7846 10.2072Quarterly Dividend Option 10.2405 10.0086
Retail Plan March 31, 2009 September 30, 2008NAV per Unit ( Rs.) Growth Option 10.7543 10.1948
Dividend Option 10.7543 10.1948Quarterly Dividend Option 10.2399 10.0082
3) For details on dividend declared during the half-year ended March 31, 2009, please refer to Dividend History Table.4) Total outstanding exposure in Derivative Instruments : Nil 6) Average Portfolio Maturity: 96.82 days5) Total investments in Foreign Securities / Overseas ETFs : Nil 7) Investments in Fixed Deposits : Nil(•) Top Ten Holdings, (**) Thinly Traded / Non-Traded Securities.
HDFC FIXED MATURITY PLANS - SERIES VIII - 370D MAY 2008 (2) (A CLOSE ENDED INCOME SCHEME)
Name of the Instrument Rating Quantity Market/ % toFair Value NAV
(Rs. In Lakhs)
DEBT INSTRUMENTS(a) Listed / awaiting listing onStock ExchangesGovernment Securities Nil NilNon-Convertible debentures / BondsKotak Mahindra Prime Ltd.** P1+ 455 4,523.81 16.82Infrastructure DevelopmentFinance Company Ltd** AAA 200 1,999.91 7.44Housing DevelopmentFinance Corporation Ltd.**$ AAA 90 893.91 3.32Subtotal 7,417.63 27.58(b) Privately Placed / UnlistedNon-Convertible debentures / Bonds
Name of the Instrument Rating Quantity Market/ % toFair Value NAV
(Rs. In Lakhs)
Shriram City Union Finance Ltd.** F1 (ind) (SO) 500,000 4,993.22 18.56Subtotal 4,993.22 18.56(c) Securitized Debt InstrumentsCredit Asset Trust Series XLIX** F1+ (ind) (SO) 50 5,449.77 20.27Corporate Debt Trust Series 5** AAA (SO) 80 4,938.82 18.36AK Trust 2008 - I** AAA (ind) (SO) 31 3,367.00 12.52Investment Vehicle 1508** AAA (SO) 1 106.23 0.39Subtotal 13,861.82 51.54Total 26,272.67 97.68MONEY MARKET INSTRUMENTSBills Rediscounting Nil NilCommercial Papers (CP) /Certificate of Deposit (CD)State Bank Of Hyderabad** P1+ 100 98.81 0.37Subtotal 98.81 0.37Treasury bills Nil NilCollateralised Borrowing &Lending Obligation 35.00 0.13Subtotal 35.00 0.13Fixed DepositsDeposits(maturity not exceeding 91 days) Nil NilTotal 133.81 0.50OTHERSNet Current Assets 490.86 1.82Grand Total 26,897.34 100.00
Notes :1) Total NPAs provided for and its percentage to NAV : Nil2) NAVs at a Glance :
Wholesale Plan March 31, 2009 September 30, 2008NAV per Unit ( Rs.) Growth Option 10.7502 10.1810
Retail Plan March 31, 2009 September 30, 2008NAV per Unit ( Rs.) Growth Option 10.7182 10.1682
Dividend Option 10.7182 10.1682Quarterly Dividend Option 10.3745 10.0117
3) For details on dividend declared during the half-year ended March 31, 2009, please refer to Dividend History Table.4) Total outstanding exposure in Derivative Instruments : Nil 6) Average Portfolio Maturity: 84.07 days5) Total investments in Foreign Securities / Overseas ETFs : Nil 7) Investments in Fixed Deposits : Nil(**) Thinly Traded / Non-Traded Securities, ($) Sponsor.
HDFC FIXED MATURITY PLANS - SERIES VIII - 370D MAY 2008 (3)(A CLOSE ENDED INCOME SCHEME)
Name of the Instrument Rating Quantity Market/ % toFair Value NAV
(Rs. In Lakhs)
DEBT INSTRUMENTS(a) Listed / awaiting listing onStock ExchangesGovernment Securities Nil NilNon-Convertible debentures / BondsKotak Mahindra Prime Ltd.** P1+ 200 1,976.09 14.86SREI Infrastructure Finance Ltd.** AA 1,750 1,741.66 13.09Housing Development FinanceCorporation Ltd.**$ AAA 145 1,440.19 10.82ICICI Home Finance Ltd** AAA 20 200.72 1.51Subtotal 5,358.66 40.28(b) Privately Placed / UnlistedNon-Convertible debentures / Bonds Nil Nil(c) Securitized Debt InstrumentsIOP Loan Trust** PR1+ (SO) 29 2,822.05 21.21IEL Loan Trust** A1+ (SO) 25 2,431.75 18.27Credit Asset Trust Series XLIX** F1+ (ind) (SO) 20 2,179.91 16.38Subtotal 7,433.71 55.86Total 12,792.37 96.14MONEY MARKET INSTRUMENTSBills Rediscounting Nil NilCommercial Papers (CP) /Certificate of Deposit (CD) Nil NilTreasury bills Nil NilCollateralised Borrowing &Lending Obligation 42.99 0.32Subtotal 42.99 0.32Fixed DepositsDeposits(maturity not exceeding 91 days) Nil NilTotal 42.99 0.32OTHERSNet Current Assets 471.62 3.54Grand Total 13,306.98 100.00
Notes :1) Total NPAs provided for and its percentage to NAV : Nil2) NAVs at a Glance :
Wholesale Plan March 31, 2009 September 30, 2008NAV per Unit ( Rs.) Growth Option 10.6878 10.1420
Quarterly Dividend Option 10.4562 10.0102
Retail Plan March 31, 2009 September 30, 2008NAV per Unit ( Rs.) Growth Option 10.6567 10.1301
Dividend Option 10.6567 10.1301Quarterly Dividend Option 10.4467 10.0098
3) For details on dividend declared during the half-year ended March 31, 2009, please refer to Dividend History Table.4) Total outstanding exposure in Derivative Instruments : Nil 6) Average Portfolio Maturity : 81.12 days5) Total investments in Foreign Securities / Overseas ETFs : Nil 7) Investments in Fixed Deposits : Nil(**) Thinly Traded / Non-Traded Securities, ($) Sponsor
HDFC FIXED MATURITY PLANS - SERIES VIII - 370D JUNE 2008 (1)(A CLOSE ENDED INCOME SCHEME)
Name of the Instrument Rating Quantity Market/ % toFair Value NAV
(Rs. In Lakhs)
DEBT INSTRUMENTS
(a) Listed / awaiting listing onStock ExchangesGovernment Securities Nil NilNon-Convertible debentures / BondsCiticorp Finance (India) Ltd.** AA+ 229 2,277.44 12.59Cholamandalam DBS Finance Company Ltd.** AA- 85 836.34 4.63Citi Financial Consumer Finance (I) Ltd** AA 10 99.30 0.55Subtotal 3,213.08 17.77(b) Privately Placed / UnlistedNon-Convertible debentures / BondsDr. Reddy’s Holding Pvt.Ltd.** P1+ 10 998.42 5.52Subtotal 998.42 5.52(c) Securitized Debt InstrumentsIndian Corporate Loan Trust 2008 12** PR1+ (SO) 39 3,790.84 20.98Receivable Securitisation Trust VII** AAA (SO) 30 3,094.99 17.12RB Loan Trust Series 22** P1+ (SO) 25 2,415.57 13.36Indian Corporate LoanSecuritisation Trust - Series LXV** LAA+ (SO) 25 2,398.73 13.27Corporate Loan SecuritisationSeries XXXIII 2006** F1+ (ind) (SO) 17 1,698.48 9.39Subtotal 13,398.61 74.12Total 17,610.11 97.41MONEY MARKET INSTRUMENTSBills Rediscounting Nil NilCommercial Papers (CP) /Certificate of Deposit (CD) Nil Nil

HDFC Asset Management Company LimitedA Joint Venture with Standard Life Investments Limited
Registered Office: Ramon House, 3rd Floor, H.T. Parekh Marg, 169, Backbay Reclamation, Churchgate, Mumbai 400 020.Investor Services Centre (at Mumbai) : Mistry Bhawan, 2nd Floor, 122, Backbay Reclamation, Dinsha Vachha Road, Churchgate, Mumbai - 400 020 • Tel.: 022-6631 6300 • Toll-free number : 1800 233 6767 • Fax : 022-2282 1144 • e-mail : [email protected] • Visit us at : www.hdfcfund.com
HALF-YEARLY PORTFOLIO STATEMENT OF THE SCHEMES / PLANS OF HDFC MUTUAL FUND AS ON MARCH 31, 2009[ Pursuant to Regulation 59A of Securities and Exchange Board of India (Mutual Funds) Regulations, 1996 ]
Page: 22 (continued....)
Name of the Instrument Rating Quantity Market/ % toFair Value NAV
(Rs. In Lakhs)Commercial Papers (CP) /Certificate of Deposit (CD) Nil NilTreasury bills Nil NilCollateralised Borrowing &Lending Obligation 185.98 0.70Subtotal 185.98 0.70Fixed Deposits Nil NilDeposits(maturity not exceeding 91 days)Total 185.98 0.70OTHERSNet Current Assets 917.46 3.45Grand Total 26,606.92 100.00
Notes :1) Total NPAs provided for and its percentage to NAV : Nil2) NAVs at a Glance :
Wholesale Plan March 31, 2009 September 30, 2008NAV per Unit ( Rs.) Growth Option 10.6594 10.0996
Retail Plan March 31, 2009 September 30, 2008NAV per Unit ( Rs.) Growth Option 10.6059 10.0928
Dividend Option 10.6059 10.0928Quarterly Dividend Option 10.0485 10.0928
3) For details on dividend declared during the half-year ended March 31, 2009, please refer to Dividend History Table.4) Total outstanding exposure in Derivative Instruments : Nil 6) Average Portfolio Maturity : 1.29 years5) Total investments in Foreign Securities / Overseas ETFs : Nil 7) Investments in Fixed Deposits : Nil(�) Top Ten Holdings.
HDFC FIXED MATURITY PLANS - SERIES IX - 370D AUGUST 2008 (1)(A CLOSE ENDED INCOME SCHEME)
Name of the Instrument Rating Quantity Market/ % toFair Value NAV
(Rs. In Lakhs)
DEBT INSTRUMENTS(a) Listed / awaiting listing onStock ExchangesGovernment Securities Nil NilNon-Convertible debentures / BondsCiti Financial Consumer Finance (I) Ltd** AA 290 2,879.56 17.39Citicorp Finance (India) Ltd.** AA+ 147 1,462.65 8.83Subtotal 4,342.21 26.22(b) Privately Placed / UnlistedNon-Convertible debentures / Bonds Nil Nil(c) Securitized Debt InstrumentsPFL Loan Trust** P1+ (SO) 40 3,812.64 23.04Structured Asset Trust Series I** P1+ (SO) 39 3,710.93 22.41Indian Retail ABS Trust 96 2008** AAA (SO) 30 2,947.80 17.80Transportation Loan Trust Series 1** AAA (SO) 12 908.07 5.48Credit Asset Trust Series XXXV** LAAA (SO) 3 356.47 2.15Subtotal 11,735.91 70.88Total 16,078.12 97.10MONEY MARKET INSTRUMENTSBills Rediscounting Nil NilCommercial Papers (CP) /Certificate of Deposit (CD) Nil NilTreasury bills Nil NilCollateralised Borrowing &Lending Obligation 2.00 0.01Subtotal 2.00 0.01Fixed DepositsDeposits(maturity not exceeding 91 days) Nil NilTotal 2.00 0.01OTHERSNet Current Assets 478.05 2.89Grand Total 16,558.17 100.00
Notes :1) Total NPAs provided for and its percentage to NAV : Nil2) NAVs at a Glance :
Wholesale Plan March 31, 2009 September 30, 2008NAV per Unit ( Rs.) Growth Option 10.6497 10.1213
Dividend Option 10.6497 10.1213
Retail Plan March 31, 2009 September 30, 2008NAV per Unit ( Rs.) Growth Option 10.5890 10.1100
Dividend Option 10.5890 10.1100Quarterly Dividend Option 10.4663 10.1100
3) For details on dividend declared during the half-year ended March 31, 2009, please refer to Dividend History Table.4) Total outstanding exposure in Derivative Instruments : Nil 6) Average Portfolio Maturity :182.11 years5) Total investments in Foreign Securities / Overseas ETFs : Nil 7) Investments in Fixed Deposits : Nil(**) Thinly Traded / Non-Traded Securities.
HDFC FIXED MATURITY PLANS - SERIES IX - 370D AUGUST 2008 (2)(A CLOSE ENDED INCOME SCHEME)
Name of the Instrument Rating Quantity Market/ % toFair Value NAV
(Rs. In Lakhs)
DEBT INSTRUMENTS(a) Listed / awaiting listing onStock ExchangesGovernment Securities Nil NilNon-Convertible debentures / Bonds Nil Nil(b) Privately Placed / UnlistedNon-Convertible debentures / Bonds Nil Nil(c) Securitized Debt Instruments
� Corporate Debt Trust Series 11** A1+ (SO) 147 13,053.53 8.14� Credit Asset Trust Series LXI** P2+ (SO) 108 10,777.40 6.72� Corporate Debt Trust Series 12** A1+ (SO) 80 7,101.64 4.43� Structured Asset Trust Series I** P1+ (SO) 61 5,804.27 3.62� PFL Loan Trust** P1+ (SO) 60 5,718.96 3.57
Loan Securitisation Trust Series 51** PR1+ (SO) 9 863.24 0.54Subtotal 43,319.04 27.02Total 43,319.04 27.02MONEY MARKET INSTRUMENTSBills Rediscounting Nil NilCommercial Papers (CP) /Certificate of Deposit (CD)
� ICICI Bank Ltd.** A1+ 49,950 48,008.15 29.93� Axis Bank Ltd.** P1+ 26,000 24,904.18 15.52� Jammu & Kashmir Bank Ltd.** P1+ 20,000 19,159.43 11.95� Corporation Bank** P1+ 17,500 16,776.22 10.46� IDBI Bank Limited** A1+ 4,000 3,832.80 2.39
Oriental Bank of Commerce** P1+ 2,300 2,179.73 1.36Subtotal 114,860.51 71.61Treasury bills Nil NilCollateralised Borrowing &Lending Obligation 57.99 0.04Subtotal 57.99 0.04Fixed DepositsDeposits(maturity not exceeding 91 days) Nil NilTotal 114,918.50 71.65OTHERSNet Current Assets 2,135.21 1.33Grand Total 160,372.75 100.00
Notes :1) Total NPAs provided for and its percentage to NAV : Nil2) NAVs at a Glance :
Wholesale Plan March 31, 2009 September 30, 2008NAV per Unit ( Rs.) Growth Option 10.6845 10.1208
Retail Plan March 31, 2009 September 30, 2008NAV per Unit ( Rs.) Growth Option 10.6845 10.1208
Dividend Option 10.6845 10.12083) Total outstanding exposure in Derivative Instruments : Nil 5) Average Portfolio Maturity : 149.03 days4) Total investments in Foreign Securities / Overseas ETFs : Nil 6) Investments in Fixed Deposits : Nil(�) Top Ten Holdings, (**) Thinly Traded / Non-Traded Securities
HDFC FIXED MATURITY PLANS - SERIES IX - 370D AUGUST 2008 (3) (A CLOSE ENDED INCOME SCHEME)
Name of the Instrument Rating Quantity Market/ % toFair Value NAV
(Rs. In Lakhs)
DEBT INSTRUMENTS(a) Listed / awaiting listing onStock ExchangesGovernment Securities Nil NilNon-Convertible debentures / BondsSundaram Finance Ltd.** AA+ 150 1,471.50 12.84IDBI Bank Limited** AA+ 70 698.72 6.10Hindalco Industries Ltd.** AA- 50 486.11 4.24Subtotal 2,656.33 23.18(b) Privately Placed / UnlistedNon-Convertible debentures / Bonds Nil Nil(c) Securitized Debt InstrumentsRB Loan Trust Series 28** F1+ (ind) (SO) 6 532.33 4.64Credit Asset Trust Series LXI** P2+ (SO) 1 99.79 0.87Subtotal 632.12 5.51Total 3,288.45 28.69MONEY MARKET INSTRUMENTSBills Rediscounting Nil NilCommercial Papers (CP) /Certificate of Deposit (CD)IDBI Bank Limited** A1+ 3,450 3,279.18 28.61Oriental Bank of Commerce** P1+ 3,000 2,855.62 24.92Power Finance Corporation Ltd** P1+ 380 1,824.22 15.92Subtotal 7,959.02 69.45Treasury bills Nil NilCollateralised Borrowing &Lending Obligation 132.98 1.16Subtotal 132.98 1.16Fixed DepositsDeposits(maturity not exceeding 91 days) Nil NilTotal 8,092.00 70.61OTHERSNet Current Assets 80.50 0.70Grand Total 11,460.95 100.00
Notes :1) Total NPAs provided for and its percentage to NAV : Nil2) NAVs at a Glance :
Wholesale Plan March 31, 2009 September 30, 2008NAV per Unit ( Rs.) Growth Option 10.6565 10.0639
Dividend Option NA 10.0639
Retail Plan March 31, 2009 September 30, 2008NAV per Unit ( Rs.) Growth Option 10.6034 10.0595
Dividend Option 10.6034 10.0595Quarterly Dividend Option 10.0682 10.0595
3) For details on dividend declared during the half-year ended March 31, 2009, please refer to Dividend History Table.4) Total outstanding exposure in Derivative Instruments : Nil 6) Average Portfolio Maturity :173.04 days5) Total investments in Foreign Securities / Overseas ETFs : Nil 7) Investments in Fixed Deposits : Nil(**) Thinly Traded / Non-Traded Securities, (NA) No Unit Holders.
HDFC FIXED MATURITY PLANS - SERIES IX - 22MSEPTEMBER 2008 (A CLOSE ENDED INCOME SCHEME)
Name of the Instrument Rating Quantity Market/ % toFair Value NAV
(Rs. In Lakhs)DEBT INSTRUMENTS(a) Listed / awaiting listing onStock ExchangesGovernment Securities Nil NilNon-Convertible debentures / Bonds
� Cholamandalam DBS Finance Company Ltd.** AA- 300 2,990.43 15.52� Shriram Transport Finance Company Ltd.** AA (ind) 286 2,852.42 14.80
Subtotal 5,842.85 30.32(b) Privately Placed / UnlistedNon-Convertible debentures / Bonds
� BHW Birla Home Finance Ltd.** LAA+ 200 1,990.42 10.33� Trent Ltd.** AA 104 1,108.36 5.75
Subtotal 3,098.78 16.08(c) Securitized Debt Instruments
� CLSS 27 Trust 2009 ** AAA (SO) 38 3,077.59 15.96� Grasim Industries Ltd.** AAA (SO) 29 1,722.13 8.94� Credit Asset Trust Series XXVI** AAA (SO) 15 1,694.46 8.79� SME Retail Pool III Trust** AAA (SO) 10 866.72 4.50� Transportation Loan Trust Series 1** AAA (SO) 10 664.27 3.45� Corporate Debt Trust Series 16 ** AAA (SO) 8 651.00 3.38
India Loan Securitisation EC9 Trust 2008** LAAA (SO) 7 576.40 2.99Subtotal 9,252.57 48.01Total 18,194.20 94.41MONEY MARKET INSTRUMENTSBills Rediscounting Nil NilCommercial Papers (CP) /Certificate of Deposit (CD) Nil NilTreasury bills Nil NilCollateralised Borrowing &Lending Obligation 9.00 0.05Subtotal 9.00 0.05Fixed DepositsDeposits(maturity not exceeding 91 days) Nil NilTotal 9.00 0.05OTHERSNet Current Assets 1,066.89 5.54Grand Total 19,270.09 100.00
Notes :1) Total NPAs provided for and its percentage to NAV : Nil2) NAVs at a Glance :
Wholesale Plan March 31, 2009 September 30, 2008NAV per Unit ( Rs.) Growth Option 10.5873 10.0209
Dividend Option 10.5873 10.0209
Retail Plan March 31, 2009 September 30, 2008NAV per Unit ( Rs.) Growth Option 10.5390 10.0191
Dividend Option 10.5390 10.0191Quarterly Dividend Option 10.1193 10.0191
3) For details on dividend declared during the half-year ended March 31, 2009, please refer to Dividend History Table.4) Total outstanding exposure in Derivative Instruments : Nil 6) Average Portfolio Maturity: 1.31years5) Total investments in Foreign Securities / Overseas ETFs : Nil 7) Investments in Fixed Deposits : Nil(�) Top Ten Holdings, (**) Thinly Traded / Non-Traded Securities.
Name of the Instrument Rating Quantity Market/ % toFair Value NAV
(Rs. In Lakhs)Bills Rediscounting Nil NilCommercial Papers (CP) /Certificate of Deposit (CD)
� State Bank of Patiala** P1+ 600 567.46 3.58Subtotal 567.46 3.58Treasury bills Nil NilCollateralised Borrowing &Lending Obligation 85.99 0.54Subtotal 85.99 0.54Fixed DepositsDeposits(maturity not exceeding 91 days) Nil NilTotal 653.45 4.12OTHERSNet Current Assets 516.34 3.26Grand Total 15,857.29 100.00
Notes :1) Total NPAs provided for and its percentage to NAV : Nil2) NAVs at a Glance :
Wholesale Plan March 31, 2009 September 30, 2008NAV per Unit ( Rs.) Growth Option 10.6989 10.1485
Dividend Option 10.6989 10.1485Quarterly Dividend Option 10.1753 10.1485
Retail Plan March 31, 2009 September 30, 2008NAV per Unit ( Rs.) Growth Option 10.6560 10.1355
Dividend Option 10.6560 10.1355Quarterly Dividend Option 10.1748 10.1355
3) For details on dividend declared during the half-year ended March 31, 2009, please refer to Dividend History Table.4) Total outstanding exposure in Derivative Instruments : Nil 6) Average Portfolio Maturity : 209.31 days5) Total investments in Foreign Securities / Overseas ETFs : Nil 7) Investments in Fixed Deposits : Nil(�) Top Ten Holdings, (**) Thinly Traded / Non-Traded Securities.
HDFC FIXED MATURITY PLANS - SERIES IX - 370D JULY 2008 (2)(A CLOSE ENDED INCOME SCHEME)
Name of the Instrument Rating Quantity Market/ % toFair Value NAV
(Rs. In Lakhs)
DEBT INSTRUMENTS(a) Listed / awaiting listing onStock ExchangesGovernment SecuritiesNon-Convertible debentures / BondsDSP Merrill Lynch Capital Ltd.** AA+ (SO) 110 1,075.18 10.55Citicorp Finance (India) Ltd.** AA+ 100 993.04 9.75ICICI Home Finance Ltd** AAA 40 401.44 3.94Citi Financial Consumer Finance (I) Ltd** AA 20 198.59 1.95Subtotal 2,668.25 26.19(b) Privately Placed / UnlistedNon-Convertible debentures / BondsDr. Reddy’s Holding Pvt.Ltd.** P1+ 7 698.90 6.86Subtotal 698.90 6.86(c) Securitized Debt InstrumentsIndian Retail ABS Trust 96 2008** AAA (SO) 21 2,056.90 20.18Credit Asset Trust Series LVIII** LAAA (SO) 17 1,700.06 16.68Indian Infrastructure EquipmentsTrust MAR 08** LAAA (SO) 11 1,222.53 12.00Indian Corporate Loan SecuritisationTrust 2008-40** P1+ (SO) 11 1,041.04 10.21Bharat Securitisation Trust 6 ** LAAA (SO) 45 452.13 4.44Subtotal 6,472.66 63.51Total 9,839.81 96.56MONEY MARKET INSTRUMENTSBills Rediscounting Nil NilCommercial Papers (CP) /Certificate of Deposit (CD) Nil NilTreasury bills Nil NilCollateralised Borrowing &Lending Obligation 27.00 0.26Subtotal 27.00 0.26Fixed DepositsDeposits(maturity not exceeding 91 days) Nil NilTotal 27.00 0.26OTHERSNet Current Assets 324.49 3.18Grand Total 10,191.30 100.00
Notes :1) Total NPAs provided for and its percentage to NAV : Nil2) NAVs at a Glance :
Wholesale Plan March 31, 2009 September 30, 2008NAV per Unit ( Rs.) Growth Option 10.7168 10.1353
Retail Plan March 31, 2009 September 30, 2008NAV per Unit ( Rs.) Growth Option 10.6762 10.1246
Dividend Option 10.6762 10.1246Quarterly Dividend Option 10.2362 10.1246
3) For details on dividend declared during the half-year ended March 31, 2009, please refer to Dividend History Table.4) Total outstanding exposure in Derivative Instruments : Nil 6) Average Portfolio Maturity : 202.25 days5) Total investments in Foreign Securities / Overseas ETFs : Nil 7) Investments in Fixed Deposits : Nil
HDFC FIXED MATURITY PLANS - SERIES IX - 20M AUGUST 2008(A CLOSE ENDED INCOME SCHEME)
Name of the Instrument Rating Quantity Market/ % toFair Value NAV
(Rs. In Lakhs)
DEBT INSTRUMENTS(a) Listed / awaiting listing onStock ExchangesGovernment Securities Nil NilNon-Convertible debentures / Bonds
� Shriram Transport Finance Co. Ltd.** AA (ind) 430 4,287.26 16.12� Tata Capital Ltd.** LAA+ 470 4,058.64 15.25� Cholamandalam DBS Finance Company Ltd.** AA- 200 1,993.62 7.49� Indian Oil Corporation Ltd.** AA+ 155 1,540.06 5.79� LIC Housing Finance Ltd.** AAA 100 998.94 3.75� Tata Motor Finance Ltd.** A 80 766.19 2.88� Citi Financial Consumer Finance (I) Ltd** AA 50 481.94 1.81
Power Finance Corporation Ltd** AAA 40 408.58 1.54Subtotal 14,535.23 54.63(b) Privately Placed / UnlistedNon-Convertible debentures / Bonds
� Trent Ltd.** AA 330 3,516.90 13.22Subtotal 3,516.90 13.22(c) Securitized Debt Instruments
� CLSS 27 Trust 2009 ** AAA (SO) 66 5,345.29 20.09� BHPC Auto Securitisation Trust Nov II** AAA (SO) 14 1,363.20 5.12
BHPC Auto Securitisation Trust Feb 08 I** AAA (SO) 4 430.77 1.62Credit Asset Trust Series XXVI** AAA (SO) 2 225.93 0.85Indian Corporate LoanSecuritisation Trust - Series XLI** AA+ (SO) 1 86.16 0.32Subtotal 7,451.35 28.00Total 25,503.48 95.85MONEY MARKET INSTRUMENTSBills Rediscounting Nil Nil
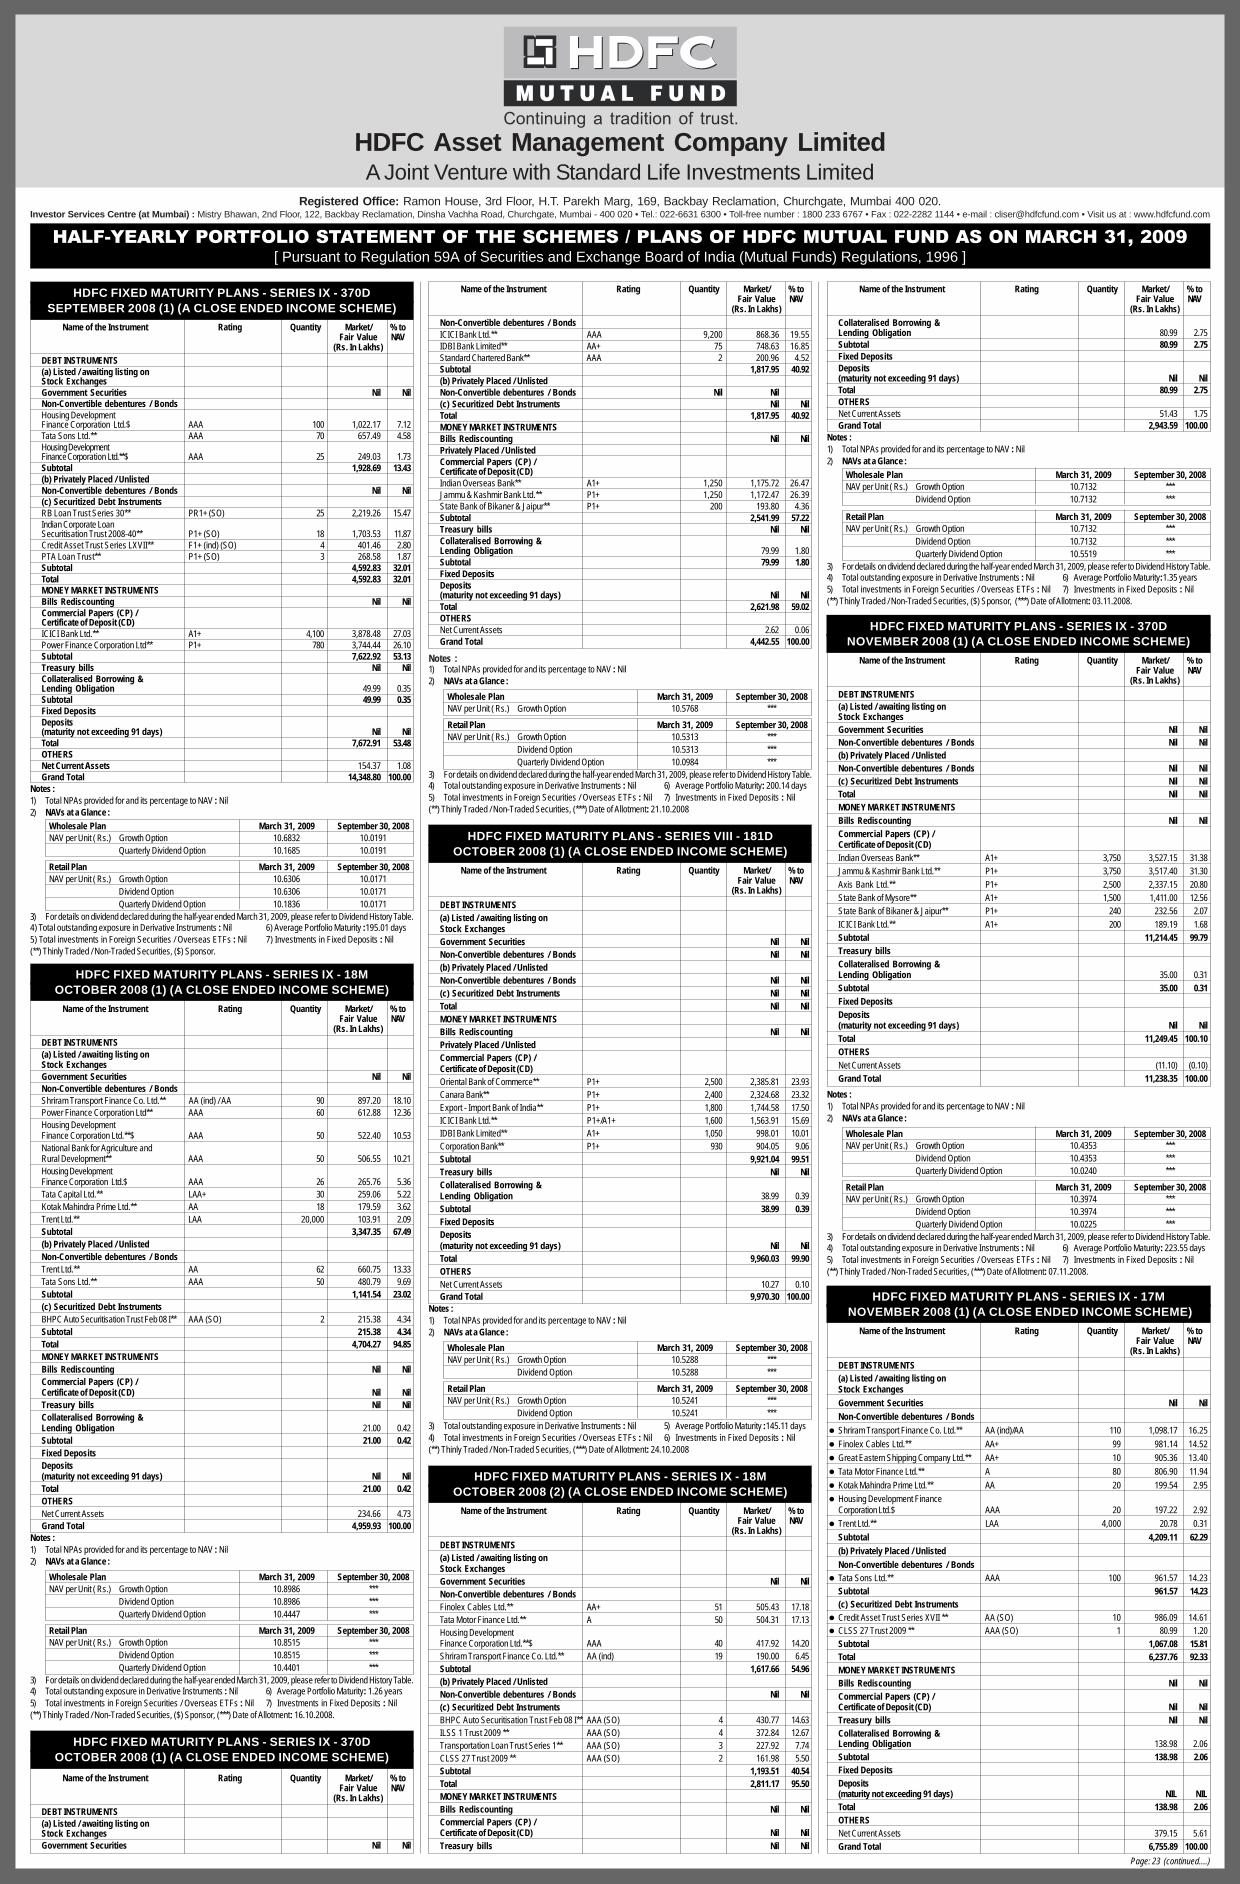
HDFC Asset Management Company LimitedA Joint Venture with Standard Life Investments Limited
Registered Office: Ramon House, 3rd Floor, H.T. Parekh Marg, 169, Backbay Reclamation, Churchgate, Mumbai 400 020.Investor Services Centre (at Mumbai) : Mistry Bhawan, 2nd Floor, 122, Backbay Reclamation, Dinsha Vachha Road, Churchgate, Mumbai - 400 020 • Tel.: 022-6631 6300 • Toll-free number : 1800 233 6767 • Fax : 022-2282 1144 • e-mail : [email protected] • Visit us at : www.hdfcfund.com
HALF-YEARLY PORTFOLIO STATEMENT OF THE SCHEMES / PLANS OF HDFC MUTUAL FUND AS ON MARCH 31, 2009[ Pursuant to Regulation 59A of Securities and Exchange Board of India (Mutual Funds) Regulations, 1996 ]
Page: 23 (continued....)
HDFC FIXED MATURITY PLANS - SERIES IX - 370DSEPTEMBER 2008 (1) (A CLOSE ENDED INCOME SCHEME)
Name of the Instrument Rating Quantity Market/ % toFair Value NAV
(Rs. In Lakhs)DEBT INSTRUMENTS(a) Listed / awaiting listing onStock ExchangesGovernment Securities Nil NilNon-Convertible debentures / BondsHousing DevelopmentFinance Corporation Ltd.$ AAA 100 1,022.17 7.12Tata Sons Ltd.** AAA 70 657.49 4.58Housing DevelopmentFinance Corporation Ltd.**$ AAA 25 249.03 1.73Subtotal 1,928.69 13.43(b) Privately Placed / UnlistedNon-Convertible debentures / Bonds Nil Nil(c) Securitized Debt InstrumentsRB Loan Trust Series 30** PR1+ (SO) 25 2,219.26 15.47Indian Corporate LoanSecuritisation Trust 2008-40** P1+ (SO) 18 1,703.53 11.87Credit Asset Trust Series LXVII** F1+ (ind) (SO) 4 401.46 2.80PTA Loan Trust** P1+ (SO) 3 268.58 1.87Subtotal 4,592.83 32.01Total 4,592.83 32.01MONEY MARKET INSTRUMENTSBills Rediscounting Nil NilCommercial Papers (CP) /Certificate of Deposit (CD)ICICI Bank Ltd.** A1+ 4,100 3,878.48 27.03Power Finance Corporation Ltd** P1+ 780 3,744.44 26.10Subtotal 7,622.92 53.13Treasury bills Nil NilCollateralised Borrowing &Lending Obligation 49.99 0.35Subtotal 49.99 0.35Fixed DepositsDeposits(maturity not exceeding 91 days) Nil NilTotal 7,672.91 53.48OTHERSNet Current Assets 154.37 1.08Grand Total 14,348.80 100.00
Notes :1) Total NPAs provided for and its percentage to NAV : Nil2) NAVs at a Glance :
Wholesale Plan March 31, 2009 September 30, 2008NAV per Unit ( Rs.) Growth Option 10.6832 10.0191
Quarterly Dividend Option 10.1685 10.0191
Retail Plan March 31, 2009 September 30, 2008NAV per Unit ( Rs.) Growth Option 10.6306 10.0171
Dividend Option 10.6306 10.0171Quarterly Dividend Option 10.1836 10.0171
3) For details on dividend declared during the half-year ended March 31, 2009, please refer to Dividend History Table.4) Total outstanding exposure in Derivative Instruments : Nil 6) Average Portfolio Maturity :195.01 days5) Total investments in Foreign Securities / Overseas ETFs : Nil 7) Investments in Fixed Deposits : Nil(**) Thinly Traded / Non-Traded Securities, ($) Sponsor.
HDFC FIXED MATURITY PLANS - SERIES IX - 18MOCTOBER 2008 (1) (A CLOSE ENDED INCOME SCHEME)
Name of the Instrument Rating Quantity Market/ % toFair Value NAV
(Rs. In Lakhs)DEBT INSTRUMENTS(a) Listed / awaiting listing onStock ExchangesGovernment Securities Nil NilNon-Convertible debentures / BondsShriram Transport Finance Co. Ltd.** AA (ind) / AA 90 897.20 18.10Power Finance Corporation Ltd** AAA 60 612.88 12.36Housing DevelopmentFinance Corporation Ltd.**$ AAA 50 522.40 10.53National Bank for Agriculture andRural Development** AAA 50 506.55 10.21Housing DevelopmentFinance Corporation Ltd.$ AAA 26 265.76 5.36Tata Capital Ltd.** LAA+ 30 259.06 5.22Kotak Mahindra Prime Ltd.** AA 18 179.59 3.62Trent Ltd.** LAA 20,000 103.91 2.09Subtotal 3,347.35 67.49(b) Privately Placed / UnlistedNon-Convertible debentures / BondsTrent Ltd.** AA 62 660.75 13.33Tata Sons Ltd.** AAA 50 480.79 9.69Subtotal 1,141.54 23.02(c) Securitized Debt InstrumentsBHPC Auto Securitisation Trust Feb 08 I** AAA (SO) 2 215.38 4.34Subtotal 215.38 4.34Total 4,704.27 94.85MONEY MARKET INSTRUMENTSBills Rediscounting Nil NilCommercial Papers (CP) /Certificate of Deposit (CD) Nil NilTreasury bills Nil NilCollateralised Borrowing &Lending Obligation 21.00 0.42Subtotal 21.00 0.42Fixed DepositsDeposits(maturity not exceeding 91 days) Nil NilTotal 21.00 0.42OTHERSNet Current Assets 234.66 4.73Grand Total 4,959.93 100.00
Notes :1) Total NPAs provided for and its percentage to NAV : Nil2) NAVs at a Glance :
Wholesale Plan March 31, 2009 September 30, 2008NAV per Unit ( Rs.) Growth Option 10.8986 ***
Dividend Option 10.8986 ***Quarterly Dividend Option 10.4447 ***
Retail Plan March 31, 2009 September 30, 2008NAV per Unit ( Rs.) Growth Option 10.8515 ***
Dividend Option 10.8515 ***Quarterly Dividend Option 10.4401 ***
3) For details on dividend declared during the half-year ended March 31, 2009, please refer to Dividend History Table.4) Total outstanding exposure in Derivative Instruments : Nil 6) Average Portfolio Maturity: 1.26 years5) Total investments in Foreign Securities / Overseas ETFs : Nil 7) Investments in Fixed Deposits : Nil(**) Thinly Traded / Non-Traded Securities, ($) Sponsor, (***) Date of Allotment: 16.10.2008.
HDFC FIXED MATURITY PLANS - SERIES IX - 370DOCTOBER 2008 (1) (A CLOSE ENDED INCOME SCHEME)
Name of the Instrument Rating Quantity Market/ % toFair Value NAV
(Rs. In Lakhs)DEBT INSTRUMENTS(a) Listed / awaiting listing onStock ExchangesGovernment Securities Nil Nil
Name of the Instrument Rating Quantity Market/ % toFair Value NAV
(Rs. In Lakhs)Non-Convertible debentures / BondsICICI Bank Ltd.** AAA 9,200 868.36 19.55IDBI Bank Limited** AA+ 75 748.63 16.85Standard Chartered Bank** AAA 2 200.96 4.52Subtotal 1,817.95 40.92(b) Privately Placed / UnlistedNon-Convertible debentures / Bonds Nil Nil(c) Securitized Debt Instruments Nil NilTotal 1,817.95 40.92MONEY MARKET INSTRUMENTSBills Rediscounting Nil NilPrivately Placed / UnlistedCommercial Papers (CP) /Certificate of Deposit (CD)Indian Overseas Bank** A1+ 1,250 1,175.72 26.47Jammu & Kashmir Bank Ltd.** P1+ 1,250 1,172.47 26.39State Bank of Bikaner & Jaipur** P1+ 200 193.80 4.36Subtotal 2,541.99 57.22Treasury bills Nil NilCollateralised Borrowing &Lending Obligation 79.99 1.80Subtotal 79.99 1.80Fixed DepositsDeposits(maturity not exceeding 91 days) Nil NilTotal 2,621.98 59.02OTHERSNet Current Assets 2.62 0.06Grand Total 4,442.55 100.00
Notes :1) Total NPAs provided for and its percentage to NAV : Nil2) NAVs at a Glance :
Wholesale Plan March 31, 2009 September 30, 2008NAV per Unit ( Rs.) Growth Option 10.5768 ***
Retail Plan March 31, 2009 September 30, 2008NAV per Unit ( Rs.) Growth Option 10.5313 ***
Dividend Option 10.5313 ***Quarterly Dividend Option 10.0984 ***
3) For details on dividend declared during the half-year ended March 31, 2009, please refer to Dividend History Table.4) Total outstanding exposure in Derivative Instruments : Nil 6) Average Portfolio Maturity: 200.14 days5) Total investments in Foreign Securities / Overseas ETFs : Nil 7) Investments in Fixed Deposits : Nil(**) Thinly Traded / Non-Traded Securities, (***) Date of Allotment: 21.10.2008
HDFC FIXED MATURITY PLANS - SERIES VIII - 181DOCTOBER 2008 (1) (A CLOSE ENDED INCOME SCHEME)
Name of the Instrument Rating Quantity Market/ % toFair Value NAV
(Rs. In Lakhs)
DEBT INSTRUMENTS(a) Listed / awaiting listing onStock ExchangesGovernment Securities Nil NilNon-Convertible debentures / Bonds Nil Nil(b) Privately Placed / UnlistedNon-Convertible debentures / Bonds Nil Nil(c) Securitized Debt Instruments Nil NilTotal Nil NilMONEY MARKET INSTRUMENTSBills Rediscounting Nil NilPrivately Placed / UnlistedCommercial Papers (CP) /Certificate of Deposit (CD)Oriental Bank of Commerce** P1+ 2,500 2,385.81 23.93Canara Bank** P1+ 2,400 2,324.68 23.32Export - Import Bank of India** P1+ 1,800 1,744.58 17.50ICICI Bank Ltd.** P1+/A1+ 1,600 1,563.91 15.69IDBI Bank Limited** A1+ 1,050 998.01 10.01Corporation Bank** P1+ 930 904.05 9.06Subtotal 9,921.04 99.51Treasury bills Nil NilCollateralised Borrowing &Lending Obligation 38.99 0.39Subtotal 38.99 0.39Fixed DepositsDeposits(maturity not exceeding 91 days) Nil NilTotal 9,960.03 99.90OTHERSNet Current Assets 10.27 0.10Grand Total 9,970.30 100.00
Notes :1) Total NPAs provided for and its percentage to NAV : Nil2) NAVs at a Glance :
Wholesale Plan March 31, 2009 September 30, 2008NAV per Unit ( Rs.) Growth Option 10.5288 ***
Dividend Option 10.5288 ***
Retail Plan March 31, 2009 September 30, 2008NAV per Unit ( Rs.) Growth Option 10.5241 ***
Dividend Option 10.5241 ***3) Total outstanding exposure in Derivative Instruments : Nil 5) Average Portfolio Maturity :145.11 days4) Total investments in Foreign Securities / Overseas ETFs : Nil 6) Investments in Fixed Deposits : Nil(**) Thinly Traded / Non-Traded Securities, (***) Date of Allotment: 24.10.2008
HDFC FIXED MATURITY PLANS - SERIES IX - 18MOCTOBER 2008 (2) (A CLOSE ENDED INCOME SCHEME)
Name of the Instrument Rating Quantity Market/ % toFair Value NAV
(Rs. In Lakhs)
DEBT INSTRUMENTS(a) Listed / awaiting listing onStock ExchangesGovernment Securities Nil NilNon-Convertible debentures / BondsFinolex Cables Ltd.** AA+ 51 505.43 17.18Tata Motor Finance Ltd.** A 50 504.31 17.13Housing DevelopmentFinance Corporation Ltd.**$ AAA 40 417.92 14.20Shriram Transport Finance Co. Ltd.** AA (ind) 19 190.00 6.45Subtotal 1,617.66 54.96(b) Privately Placed / UnlistedNon-Convertible debentures / Bonds Nil Nil(c) Securitized Debt InstrumentsBHPC Auto Securitisation Trust Feb 08 I** AAA (SO) 4 430.77 14.63ILSS 1 Trust 2009 ** AAA (SO) 4 372.84 12.67Transportation Loan Trust Series 1** AAA (SO) 3 227.92 7.74CLSS 27 Trust 2009 ** AAA (SO) 2 161.98 5.50Subtotal 1,193.51 40.54Total 2,811.17 95.50MONEY MARKET INSTRUMENTSBills Rediscounting Nil NilCommercial Papers (CP) /Certificate of Deposit (CD) Nil NilTreasury bills Nil Nil
Name of the Instrument Rating Quantity Market/ % toFair Value NAV
(Rs. In Lakhs)Collateralised Borrowing &Lending Obligation 80.99 2.75Subtotal 80.99 2.75Fixed DepositsDeposits(maturity not exceeding 91 days) Nil NilTotal 80.99 2.75OTHERSNet Current Assets 51.43 1.75Grand Total 2,943.59 100.00
Notes :1) Total NPAs provided for and its percentage to NAV : Nil2) NAVs at a Glance :
Wholesale Plan March 31, 2009 September 30, 2008NAV per Unit ( Rs.) Growth Option 10.7132 ***
Dividend Option 10.7132 ***
Retail Plan March 31, 2009 September 30, 2008NAV per Unit ( Rs.) Growth Option 10.7132 ***
Dividend Option 10.7132 ***Quarterly Dividend Option 10.5519 ***
3) For details on dividend declared during the half-year ended March 31, 2009, please refer to Dividend History Table.4) Total outstanding exposure in Derivative Instruments : Nil 6) Average Portfolio Maturity:1.35 years5) Total investments in Foreign Securities / Overseas ETFs : Nil 7) Investments in Fixed Deposits : Nil(**) Thinly Traded / Non-Traded Securities, ($) Sponsor, (***) Date of Allotment: 03.11.2008.
HDFC FIXED MATURITY PLANS - SERIES IX - 370DNOVEMBER 2008 (1) (A CLOSE ENDED INCOME SCHEME)
Name of the Instrument Rating Quantity Market/ % toFair Value NAV
(Rs. In Lakhs)
DEBT INSTRUMENTS(a) Listed / awaiting listing onStock ExchangesGovernment Securities Nil NilNon-Convertible debentures / Bonds Nil Nil(b) Privately Placed / UnlistedNon-Convertible debentures / Bonds Nil Nil(c) Securitized Debt Instruments Nil NilTotal Nil NilMONEY MARKET INSTRUMENTSBills Rediscounting Nil NilCommercial Papers (CP) /Certificate of Deposit (CD)Indian Overseas Bank** A1+ 3,750 3,527.15 31.38Jammu & Kashmir Bank Ltd.** P1+ 3,750 3,517.40 31.30Axis Bank Ltd.** P1+ 2,500 2,337.15 20.80State Bank of Mysore** A1+ 1,500 1,411.00 12.56State Bank of Bikaner & Jaipur** P1+ 240 232.56 2.07ICICI Bank Ltd.** A1+ 200 189.19 1.68Subtotal 11,214.45 99.79Treasury billsCollateralised Borrowing &Lending Obligation 35.00 0.31Subtotal 35.00 0.31Fixed DepositsDeposits(maturity not exceeding 91 days) Nil NilTotal 11,249.45 100.10OTHERSNet Current Assets (11.10) (0.10)Grand Total 11,238.35 100.00
Notes :1) Total NPAs provided for and its percentage to NAV : Nil2) NAVs at a Glance :
Wholesale Plan March 31, 2009 September 30, 2008NAV per Unit ( Rs.) Growth Option 10.4353 ***
Dividend Option 10.4353 ***Quarterly Dividend Option 10.0240 ***
Retail Plan March 31, 2009 September 30, 2008NAV per Unit ( Rs.) Growth Option 10.3974 ***
Dividend Option 10.3974 ***Quarterly Dividend Option 10.0225 ***
3) For details on dividend declared during the half-year ended March 31, 2009, please refer to Dividend History Table.4) Total outstanding exposure in Derivative Instruments : Nil 6) Average Portfolio Maturity: 223.55 days5) Total investments in Foreign Securities / Overseas ETFs : Nil 7) Investments in Fixed Deposits : Nil(**) Thinly Traded / Non-Traded Securities, (***) Date of Allotment: 07.11.2008.
HDFC FIXED MATURITY PLANS - SERIES IX - 17M NOVEMBER 2008 (1) (A CLOSE ENDED INCOME SCHEME)
Name of the Instrument Rating Quantity Market/ % toFair Value NAV
(Rs. In Lakhs)
DEBT INSTRUMENTS(a) Listed / awaiting listing onStock ExchangesGovernment Securities Nil NilNon-Convertible debentures / Bonds
� Shriram Transport Finance Co. Ltd.** AA (ind)/AA 110 1,098.17 16.25
� Finolex Cables Ltd.** AA+ 99 981.14 14.52
� Great Eastern Shipping Company Ltd.** AA+ 10 905.36 13.40
� Tata Motor Finance Ltd.** A 80 806.90 11.94
� Kotak Mahindra Prime Ltd.** AA 20 199.54 2.95
� Housing Development FinanceCorporation Ltd.$ AAA 20 197.22 2.92
� Trent Ltd.** LAA 4,000 20.78 0.31
Subtotal 4,209.11 62.29(b) Privately Placed / UnlistedNon-Convertible debentures / Bonds
� Tata Sons Ltd.** AAA 100 961.57 14.23Subtotal 961.57 14.23(c) Securitized Debt Instruments
� Credit Asset Trust Series XVII ** AA (SO) 10 986.09 14.61� CLSS 27 Trust 2009 ** AAA (SO) 1 80.99 1.20
Subtotal 1,067.08 15.81Total 6,237.76 92.33MONEY MARKET INSTRUMENTSBills Rediscounting Nil NilCommercial Papers (CP) /Certificate of Deposit (CD) Nil NilTreasury bills Nil NilCollateralised Borrowing &Lending Obligation 138.98 2.06Subtotal 138.98 2.06Fixed DepositsDeposits(maturity not exceeding 91 days) NIL NILTotal 138.98 2.06OTHERSNet Current Assets 379.15 5.61Grand Total 6,755.89 100.00

Notes :1) Total NPAs provided for and its percentage to NAV : Nil2) NAVs at a Glance :
Wholesale Plan March 31, 2009 September 30, 2008NAV per Unit ( Rs.) Growth Option 10.3906 ***
Dividend Option 10.3906 ***Quarterly Dividend Option 10.0972 ***
Retail Plan March 31, 2009 September 30, 2008NAV per Unit ( Rs.) Growth Option 10.3688 ***
Dividend Option 10.3688 ***Quarterly Dividend Option 10.0961 **
3) For details on dividend declared during the half-year ended March 31, 2009, please refer to Dividend History Table.4) Total outstanding exposure in Derivative Instruments : Nil 6) Average Portfolio Maturity : 1.27 yrs5) Total investments in Foreign Securities / Overseas ETFs : Nil 7) Investments in Fixed Deposits : Nil(�) Top Ten Holdings, (**) Thinly Traded / Non-Traded Securities, ($) Sponsor. (***) Date of Allotment: 27.11.2008
HDFC FIXED MATURITY PLANS - SERIES X - 16 MDECEMBER 2008 (1) (A CLOSE ENDED INCOME SCHEME)
Name of the Instrument Rating Quantity Market/ % toFair Value NAV
(Rs. In Lakhs)DEBT INSTRUMENTS(a) Listed / awaiting listing onStock ExchangesGovernment Securities Nil NilNon-Convertible debentures / BondsRural Electrification Corporation Ltd.** AAA 50 520.83 14.20National Bank for Agriculture andRural Development** AAA 50 506.55 13.81Sundaram Finance Ltd.** LAA+ 50 487.76 13.29Great Eastern Shipping Company Ltd.** AA+ 5 452.68 12.33Housing DevelopmentFinance Corporation Ltd.**$ AAA 40 417.92 11.39Shriram Transport Finance Co. Ltd.** AA (ind) / AA 11 109.96 2.99Indian Oil Corporation Ltd.** AA+ 5 49.68 1.35Subtotal 2,545.38 69.36(b) Privately Placed / UnlistedNon-Convertible debentures / BondsTata Sons Ltd.** AAA 50 480.79 13.10Subtotal 480.79 13.10(c) Securitized Debt InstrumentsCredit Asset Trust Series XXVI** AAA (SO) 4 451.86 12.31Subtotal 451.86 12.31Total 3,478.03 94.77MONEY MARKET INSTRUMENTSBills Rediscounting Nil NilCommercial Papers (CP) /Certificate of Deposit (CD) Nil NilTreasury bills Nil NilCollateralised Borrowing &Lending Obligation 2.00 0.05Subtotal 2.00 0.05Fixed DepositsDeposits(maturity not exceeding 91 days) Nil NilTotal 2.00 0.05OTHERSNet Current Assets 189.95 5.18Grand Total 3,669.98 100.00
Notes :1) Total NPAs provided for and its percentage to NAV : Nil2) NAVs at a Glance :
Wholesale Plan March 31, 2009 September 30, 2008NAV per Unit ( Rs.) Growth Option 10.2632 ***
Retail Plan March 31, 2009 September 30, 2008NAV per Unit ( Rs.) Growth Option 10.2433 ***
Dividend Option 10.2433 ***Quarterly Dividend Option 10.0333 ***
3) For details on dividend declared during the half-year ended March 31, 2009, please refer to Dividend History Table.4) Total outstanding exposure in Derivative Instruments : Nil 6) Average Portfolio Maturity : 1.21 years5) Total investments in Foreign Securities / Overseas ETFs : Nil 7) Investments in Fixed Deposits : Nil(**) Thinly Traded / Non-Traded Securities, ($) Sponsor, (***) Date of Allotment: 10.12.2008.
HDFC FIXED MATURITY PLANS - SERIES IX - 370DDECEMBER 2008 (1) (A CLOSE ENDED INCOME SCHEME)
Name of the Instrument Rating Quantity Market/ % toFair Value NAV
(Rs. In Lakhs)DEBT INSTRUMENTS(a) Listed / awaiting listing onStock ExchangesGovernment Securities Nil NilNon-Convertible debentures / BondsHousing DevelopmentFinance Corporation Ltd.**$ AAA 100 1,002.49 18.38Power Finance Corporation Ltd** AAA 100 993.06 18.21Subtotal 1,995.55 36.59(b) Privately Placed / UnlistedNon-Convertible debentures / Bonds Nil Nil(c) Securitized Debt Instruments Nil NilTotal 1,995.55 36.59MONEY MARKET INSTRUMENTSBills Rediscounting Nil NilCommercial Papers (CP) /
Non-Convertible debentures / Bonds Nil Nil(b) Privately Placed / UnlistedNon-Convertible debentures / Bonds Nil Nil(c) Securitized Debt Instruments Nil NilTotal Nil NilMONEY MARKET INSTRUMENTSBills Rediscounting Nil NilCommercial Papers (CP) /Certificate of Deposit (CD)ICICI Bank Ltd.** P1+ 250 234.63 23.92Dena Bank** F1+ 250 231.84 23.64Canara Bank** P1+ 150 139.68 14.24Vijaya Bank** PR1+ 150 139.50 14.23Subtotal 745.65 76.03Treasury bills Nil NilCollateralised Borrowing &Lending Obligation 33.00 3.37Subtotal 33.00 3.37Fixed DepositsDeposits(maturity not exceeding 91 days) Nil NilTotal 778.65 79.40OTHERSNet Current Assets 202.00 20.60Grand Total 980.65 100.00
Notes :1) Total NPAs provided for and its percentage to NAV : Nil2) NAVs at a Glance :
Wholesale Plan March 31, 2009 September 30, 2008NAV per Unit ( Rs.) Growth Option 10.0079 ***
Dividend Option 10.0079 ***
Retail Plan March 31, 2009 September 30, 2008NAV per Unit ( Rs.) Growth Option 10.0079 ***
Dividend Option 10.0079 ***Quarterly Dividend Option 10.0079 ***
3) Total outstanding exposure in Derivative Instruments : Nil 5) Average Portfolio Maturity : 256.28 days4) Total investments in Foreign Securities / Overseas ETFs : Nil 6) Investments in Fixed Deposits : Nil(**) Thinly Traded / Non-Traded Securities, (***) Date of Allotment: 25.03.2009.
HDFC FIXED MATURITY PLANS - SERIES X- 367D MARCH 2009 (1)(A CLOSE ENDED INCOME SCHEME)
Name of the Instrument Industry Quantity Market/ % to+/Rating Fair Value NAV
(Rs. In Lakhs)
DEBT INSTRUMENTS(a) Listed / awaiting listing onStock ExchangesGovernment Securities Nil NilNon-Convertible debentures / Bonds Nil Nil(b) Privately Placed / UnlistedNon-Convertible debentures / Bonds Nil Nil(c) Securitized Debt Instruments Nil NilTotal Nil NilMONEY MARKET INSTRUMENTSBills Rediscounting Nil NilCommercial Papers (CP) / Certificateof Deposit (CD)Allahabad Bank** P1+ 600 564.08 12.37Vijaya Bank** PR1+ 600 558.01 12.24Canara Bank** P1+ 550 512.16 11.23State Bank of Patiala** P1+ 500 467.43 10.25Dena Bank** F1+ 500 463.67 10.17ICICI Bank Ltd.** P1+ 500 462.22 10.14Subtotal 3,027.57 66.40Treasury bills Nil NilCollateralised Borrowing &Lending Obligation 43.99 0.93Subtotal 43.99 0.93Fixed DepositsDeposits(maturity not exceeding 91 days) Nil NilTotal 3,071.56 67.36OTHERSNet Current Assets 1,488.25 32.64Grand Total 4,559.81 100.00
Notes :1) Total NPAs provided for and its percentage to NAV : Nil2) NAVs at a Glance :
Wholesale Plan March 31, 2009 September 30, 2008NAV per Unit ( Rs.) Growth Option 10.0014 ***
Retail Plan March 31, 2009 September 30, 2008NAV per Unit ( Rs.) Growth Option 10.0014 ***
Dividend Option 10.0014 ***Quarterly Dividend Option 10.0014 ***
3) Total outstanding exposure in Derivative Instruments : Nil 5) Average Portfolio Maturity : 225.62 days4) Total investments in Foreign Securities / Overseas ETFs : Nil 6) Investments in Fixed Deposits : Nil(**) Thinly Traded / Non-Traded Securities, ($) Sponsor, (***) Date of Allotment: 31.03.2009.
Name of the Instrument Rating Quantity Market/ % toFair Value NAV
(Rs. In Lakhs)
Name of the Instrument Rating Quantity Market/ % toFair Value NAV
(Rs. In Lakhs)
HDFC Asset Management Company LimitedA Joint Venture with Standard Life Investments Limited
Registered Office: Ramon House, 3rd Floor, H.T. Parekh Marg, 169, Backbay Reclamation, Churchgate, Mumbai 400 020.Investor Services Centre (at Mumbai) : Mistry Bhawan, 1st Floor, 122, Backbay Reclamation, Dinsha Vachha Road, Churchgate, Mumbai - 400 020 • Tel.: 022-6631 6300 • Toll-free number : 1800 233 6767 • Fax : 022-2282 1144 • e-mail : [email protected] • Visit us at : www.hdfcfund.com
HALF-YEARLY PORTFOLIO STATEMENT OF THE SCHEMES / PLANS OF HDFC MUTUAL FUND AS ON 31ST MARCH 2009[ Pursuant to Regulation 59A of Securities and Exchange Board of India (Mutual Funds) Regulations, 1996 ]
Page: 24 (continued....)
DIVIDEND HISTORY *
HDFC GROWTH FUNDDividend Plan
Record NAV as on Dividend Per Unit (Re.) for Date Record Date Individuals & HUF Others
26-Feb-09 17.949 2.250 2.250
HDFC EQUITY FUNDDividend Plan
Record NAV as on Dividend Per Unit (Re.) for Date Record Date Individuals & HUF Others
19-Mar-09 23.252 3.000 3.000
HDFC TOP 200 FUNDDividend Plan
Record NAV as on Dividend Per Unit (Re.) for Date Record Date Individuals & HUF Others
5-Mar-09 23.364 3.000 3.000
HDFC CAPITAL BUILDER FUNDDividend Plan
Record NAV as on Dividend Per Unit (Re.) for Date Record Date Individuals & HUF Others
5-Mar-09 12.936 2.000 2.000
HDFC BALANCED FUNDDividend Plan
Record NAV as on Dividend Per Unit (Re.) for Date Record Date Individuals & HUF Others
26-Feb-09 12.326 1.500 1.500
HDFC PRUDENCE FUNDDividend Plan
Record NAV as on Dividend Per Unit (Re.) for Date Record Date Individuals & HUF Others
19-Mar-09 17.393 2.500 2.500
HDFC LONG TERM ADVANTAGE FUNDDividend Plan
Record NAV as on Dividend Per Unit (Re.) for Date Record Date Individuals & HUF Others
26-Feb-09 21.698 3.500 3.500
HDFC TAXSAVERDividend Plan
Record NAV as on Dividend Per Unit (Re.) for Date Record Date Individuals & HUF Others
5-Mar-09 31.155 5.000 5.000
HDFC ARBITRAGE FUNDWholesale Plan Quarterly Dividend Option
Record NAV as on Dividend Per Unit (Re.) for Date Record Date Individuals & HUF Others
26-Dec-08 10.295 0.295 0.295
25-Mar-09 10.119 0.119 0.119
Retail Plan Quarterly Dividend OptionRecord NAV as on Dividend Per Unit (Re.) for Date Record Date Individuals & HUF Others
26-Dec-08 10.289 0.289 0.289
25-Mar-09 10.112 0.112 0.112
Wholesale Plan Monthly Dividend OptionRecord NAV as on Dividend Per Unit (Re.) for Date Record Date Individuals & HUF Others
27-Oct-08 10.153 0.153 0.15326-Dec-08 10.141 0.141 0.14127-Jan-09 10.045 0.045 0.04525-Feb-09 10.061 0.061 0.061
Retail Plan Monthly Dividend OptionRecord NAV as on Dividend Per Unit (Re.) for Date Record Date Individuals & HUF Others
27-Oct-08 10.151 0.151 0.15126-Dec-08 10.135 0.135 0.13527-Jan-09 10.043 0.043 0.04325-Feb-09 10.059 0.059 0.059
HDFC MF MONTHLY INCOME PLAN- LONG TERM PLANQuarterly Dividend Plan
Record NAV as on Dividend Per Unit (Re.) for Date Record Date Individuals & HUF Others
26-Dec-08 10.7148 0.2400 0.223425-Mar-09 10.4822 0.1800 0.1675
Monthly Dividend PlanRecord NAV as on Dividend Per Unit (Re.) for Date Record Date Individuals & HUF Others
26-Dec-08 10.5157 0.2400 0.2234
27-Jan-09 10.1157 0.0600 0.0558
25-Mar-09 10.2137 0.1200 0.1116
HDFC INCOME FUNDDividend Plan
Record NAV as on Dividend Per Unit (Re.) for Date Record Date Individuals & HUF Others
26-Dec-08 11.5435 0.4000 0.3723
25-Mar-09 10.8160 0.1500 0.1396
HDFC HIGH INTEREST FUNDYearly Dividend Plan
Record NAV as on Dividend Per Unit (Re.) for Date Record Date Individuals & HUF Others
25-Mar-09 11.8425 0.6500 0.6050
Half Yearly Dividend PlanRecord NAV as on Dividend Per Unit (Re.) for Date Record Date Individuals & HUF Others
25-Mar-09 11.2151 0.5500 0.5119
Quarterly Dividend PlanRecord NAV as on Dividend Per Unit (Re.) for Date Record Date Individuals & HUF Others
26-Dec-08 11.9641 0.4000 0.3723
25-Mar-09 11.0349 0.1500 0.1396
Record NAV as on Dividend Per Unit (Re.) for Date Record Date Individuals & HUF Others
Record NAV as on Dividend Per Unit (Re.) for Date Record Date Individuals & HUF Others
Certificate of Deposit (CD)Canara Bank** P1+ 1,500 1,416.71 25.99Dena Bank** F1+ 1,100 1,034.45 18.97LIC Housing Finance Ltd.** P1+ 200 931.57 17.08Subtotal 3,382.73 62.04Treasury bills Nil NilCollateralised Borrowing &Lending Obligation 31.00 0.57Subtotal 31.00 0.57Fixed DepositsDeposits(maturity not exceeding 91 days) Nil NilTotal 3,413.73 62.61OTHERSNet Current Assets 43.81 0.80Grand Total 5,453.09 100.00
Notes :1) Total NPAs provided for and its percentage to NAV : Nil2) NAVs at a Glance :
Wholesale Plan March 31, 2009 September 30, 2008NAV per Unit ( Rs.) Growth Option 10.2984 ***
Dividend Option 10.2984 ***
Retail Plan March 31, 2009 September 30, 2008NAV per Unit ( Rs.) Growth Option 10.2815 ***
Dividend Option 10.2815 ***Quarterly Dividend Option 10.0635 ***
3) For details on dividend declared during the half-year ended March 31, 2009, please refer to Dividend History Table.4) Total outstanding exposure in Derivative Instruments : Nil 6) Average Portfolio Maturity: 257.16 days5) Total investments in Foreign Securities / Overseas ETFs : Nil 7) Investments in Fixed Deposits : Nil(**) Thinly Traded / Non-Traded Securities, (***) Date of Allotment: 11.12.2008, ($) Sponsor.
HDFC FIXED MATURITY PLANS - SERIES X - 13M MARCH 2009 (1) (A CLOSE ENDED INCOME SCHEME)
Name of the Instrument Rating Quantity Market/ % toFair Value NAV
(Rs. In Lakhs)
DEBT INSTRUMENTS(a) Listed / awaiting listing onStock ExchangesGovernment Securities Nil NilNon-Convertible debentures / Bonds Nil Nil(b) Privately Placed / UnlistedNon-Convertible debentures / Bonds Nil Nil(c) Securitized Debt Instruments Nil NilTotal Nil NilMONEY MARKET INSTRUMENTSBills Rediscounting Nil NilPrivately Placed / UnlistedCommercial Papers (CP) /Certificate of Deposit (CD)Punjab National Bank** F1+ 350 330.43 20.34Canara Bank** P1+ 350 325.92 20.07Vijaya Bank** PR1+ 350 325.51 20.05Dena Bank** F1+ 350 324.57 19.99Subtotal 1,306.43 80.45Treasury bills Nil NilCollateralised Borrowing &Lending Obligation 32.00 1.97Subtotal 32.00 1.97Fixed DepositsDeposits(maturity not exceeding 91 days) Nil NilTotal 1,338.43 82.42OTHERSNet Current Assets 285.39 17.58Grand Total 1,623.82 100.00
Notes :1) Total NPAs provided for and its percentage to NAV : Nil2) NAVs at a Glance :
Wholesale Plan March 31, 2009 September 30, 2008NAV per Unit ( Rs.) Growth Option 10.0070 ***
Retail Plan March 31, 2009 September 30, 2008NAV per Unit ( Rs.) Growth Option 10.0070 ***
Dividend Option 10.0070 ***Quarterly Dividend Option 10.0070 ***
3) Total outstanding exposure in Derivative Instruments : Nil 5) Average Portfolio Maturity : 274.58 years4) Total investments in Foreign Securities / Overseas ETFs : Nil 6) Investments in Fixed Deposits : Nil(**) Thinly Traded / Non-Traded Securities, (***) Date of Allotment: 25.03.2009.
HDFC FIXED MATURITY PLANS - SERIES X - 14MFEBRUARY 2009 (1) (A CLOSE ENDED INCOME SCHEME)
Name of the Instrument Rating Quantity Market/ % toFair Value NAV
(Rs. In Lakhs)DEBT INSTRUMENTS(a) Listed / awaiting listing onStock ExchangesGovernment Securities Nil Nil
* Dividend is declared on the face value of the unit i.e. Rs.10/- per unit. Past performance may or may not be sustained in future.

HDFC Asset Management Company LimitedA Joint Venture with Standard Life Investments Limited
Registered Office: Ramon House, 3rd Floor, H.T. Parekh Marg, 169, Backbay Reclamation, Churchgate, Mumbai 400 020.Investor Services Centre (at Mumbai) : Mistry Bhawan, 1st Floor, 122, Backbay Reclamation, Dinsha Vachha Road, Churchgate, Mumbai - 400 020 • Tel.: 022-6631 6300 • Toll-free number : 1800 233 6767 • Fax : 022-2282 1144 • e-mail : [email protected] • Visit us at : www.hdfcfund.com
DIVIDEND HISTORY (CONTD.)
HDFC HIGH INTEREST FUND- SHORT TERM PLAN
Dividend PlanRecord NAV as on Dividend Per Unit (Re.) for Date Record Date Individuals & HUF Others
1-Oct-08 10.6698 0.0806 0.07503-Nov-08 10.6383 0.0530 0.04931-Dec-08 10.6915 0.0996 0.092716-Dec-08 10.8629 0.2497 0.23241-Jan-09 10.7035 0.1101 0.102512-Jan-09 10.5947 0.0148 0.013827-Jan-09 10.6013 0.0206 0.019210-Feb-09 10.6060 0.0247 0.023025-Feb-09 10.6566 0.0690 0.064212-Mar-09 10.5803 0.0022 0.002025-Mar-09 10.6406 0.0550 0.0512
HDFC SHORT TERM PLANDividend Plan
Record NAV as on Dividend Per Unit (Re.) for Date Record Date Individuals & HUF Others
1-Oct-08 10.3463 0.0255 0.02373-Nov-08 10.3677 0.0442 0.041217-Nov-08 10.3493 0.0281 0.02621-Dec-08 10.3999 0.0724 0.067416-Dec-08 10.7474 0.3768 0.35071-Jan-09 10.4299 0.0987 0.091927-Jan-09 10.3917 0.0653 0.060725-Feb-09 10.4194 0.0895 0.083325-Mar-09 10.3690 0.0454 0.0422
HDFC GILT FUND - SHORT TERM PLANDividend Plan
Record NAV as on Dividend Per Unit (Re.) for Date Record Date Individuals & HUF Others
26-Dec-08 10.9701 0.2500 0.232725-Mar-09 10.7128 0.1000 0.0931
HDFC GILT FUND - LONG TERM PLANDividend Plan
Record NAV as on Dividend Per Unit (Re.) for Date Record Date Individuals & HUF Others
26-Dec-08 11.8667 0.4500 0.418825-Mar-09 10.4851 0.1000 0.0931
HDFC FLOATING RATE INCOME FUND- SHORT TERM PLAN
Wholesale Plan Monthly Dividend OptionRecord NAV as on Dividend Per Unit (Re.) for Date Record Date Individuals & HUF Others
27-Oct-08 10.2224 NA 0.063824-Nov-08 10.2186 NA 0.060829-Dec-08 10.2303 NA 0.070227-Jan-09 10.2124 NA 0.055724-Feb-09 10.2035 NA 0.048430-Mar-09 10.2106 NA 0.0543
NA: No unit holders
Wholesale Plan Weekly Dividend OptionRecord NAV as on Dividend Per Unit (Re.) for Date Record Date Individuals & HUF Others
6-Oct-08 10.1552 0.0173 0.016113-Oct-08 10.1546 0.0168 0.015620-Oct-08 10.1553 0.0175 0.016227-Oct-08 10.1544 0.0166 0.01543-Nov-08 10.1545 0.0167 0.015510-Nov-08 10.1537 0.0160 0.014917-Nov-08 10.1540 0.0163 0.015224-Nov-08 10.1538 0.0161 0.01501-Dec-08 10.1533 0.0157 0.01468-Dec-08 10.1526 0.0150 0.014015-Dec-08 10.1519 0.0144 0.013422-Dec-08 10.1525 0.0150 0.014029-Dec-08 10.1522 0.0147 0.01375-Jan-09 10.1524 0.0149 0.013812-Jan-09 10.1524 0.0148 0.013819-Jan-09 10.1516 0.0142 0.013227-Jan-09 10.1534 0.0158 0.01472-Feb-09 10.1485 0.0115 0.01079-Feb-09 10.1507 0.0134 0.012416-Feb-09 10.1498 0.0126 0.011824-Feb-09 10.1518 0.0143 0.01332-Mar-09 10.1478 0.0108 0.01019-Mar-09 10.1495 0.0123 0.011516-Mar-09 10.1487 0.0117 0.010923-Mar-09 10.1483 0.0113 0.010530-Mar-09 10.1489 0.0119 0.0111
Retail Plan Monthly Dividend OptionRecord NAV as on Dividend Per Unit (Re.) for Date Record Date Individuals & HUF Others
27-Oct-08 10.2204 0.0669 0.062224-Nov-08 10.2166 0.0635 0.059129-Dec-08 10.2275 0.0731 0.068027-Jan-09 10.2102 0.0579 0.053924-Feb-09 10.2016 0.0503 0.046930-Mar-09 10.2083 0.0562 0.0523
Retail Plan Weekly Dividend OptionRecord NAV as on Dividend Per Unit (Re.) for Date Record Date Individuals & HUF Others
6-Oct-08 10.1546 0.0168 0.015613-Oct-08 10.1540 0.0163 0.015220-Oct-08 10.1552 0.0173 0.016227-Oct-08 10.1538 0.0161 0.01503-Nov-08 10.1539 0.0162 0.015110-Nov-08 10.1531 0.0155 0.014517-Nov-08 10.1535 0.0159 0.014824-Nov-08 10.1533 0.0157 0.01461-Dec-08 10.1530 0.0154 0.01448-Dec-08 10.1520 0.0145 0.013515-Dec-08 10.1514 0.0140 0.013022-Dec-08 10.1521 0.0146 0.013629-Dec-08 10.1518 0.0144 0.01345-Jan-09 10.1518 0.0144 0.013412-Jan-09 10.1518 0.0144 0.013419-Jan-09 10.1510 0.0137 0.012727-Jan-09 10.1528 0.0152 0.01422-Feb-09 10.1482 0.0112 0.01049-Feb-09 10.1502 0.0129 0.012016-Feb-09 10.1494 0.0122 0.011424-Feb-09 10.1513 0.0139 0.01292-Mar-09 10.1474 0.0105 0.00989-Mar-09 10.1490 0.0119 0.011116-Mar-09 10.1482 0.0113 0.010523-Mar-09 10.1478 0.0109 0.010130-Mar-09 10.1485 0.0115 0.0107
Wholesale Plan Daily Dividend Option **Month NAV as on Dividend Per Unit (Re.) for
Record Date Individuals & HUF OthersOctober 10.0809 0.0797 0.0741
November 10.0809 0.0637 0.0593December 10.0809 0.0647 0.0606January 10.0809 0.0642 0.0599February 10.0809 0.0510 0.0474March 10.0809 0.0493 0.0457
Retail Plan Daily Dividend Option**Month NAV as on Dividend Per Unit (Re.) for
Record Date Individuals & HUF OthersOctober 10.0809 0.0777 0.0721November 10.0809 0.0621 0.0577December 10.0809 0.0632 0.0590January 10.0809 0.0624 0.0581February 10.0809 0.0492 0.0460March 10.0809 0.0475 0.0441
HDFC FLOATING RATE INCOME FUND- LONG TERM PLAN
Dividend PlanRecord NAV as on Dividend Per Unit (Re.) for Date Record Date Individuals & HUF Others
6-Oct-08 10.1899 0.0167 0.015513-Oct-08 10.1833 0.0108 0.010120-Oct-08 10.1917 0.0183 0.017027-Oct-08 10.1887 0.0156 0.01453-Nov-08 10.1855 0.0128 0.011910-Nov-08 10.1857 0.0130 0.012117-Nov-08 10.1912 0.0178 0.016624-Nov-08 10.1910 0.0176 0.01641-Dec-08 10.1920 0.0185 0.01728-Dec-08 10.1925 0.0189 0.017615-Dec-08 10.1842 0.0117 0.010922-Dec-08 10.1919 0.0184 0.017129-Dec-08 10.1892 0.0160 0.01495-Jan-09 10.1979 0.0237 0.022012-Jan-09 10.1835 0.0111 0.010319-Jan-09 10.1893 0.0161 0.015027-Jan-09 10.1883 0.0152 0.01422-Feb-09 10.1846 0.0120 0.01119-Feb-09 10.1902 0.0169 0.015816-Feb-09 10.1879 0.0149 0.013824-Feb-09 10.1880 0.0150 0.01402-Mar-09 10.1868 0.0139 0.01299-Mar-09 10.1821 0.0098 0.009116-Mar-09 10.1825 0.0101 0.009423-Mar-09 10.1869 0.0140 0.013030-Mar-09 10.1852 0.0125 0.0116
HDFC LIQUID FUNDMonthly Dividend Plan
Record NAV as on Dividend Per Unit (Re.) for Date Record Date Individuals & HUF Others
27-Oct-08 10.3357 0.0567 0.056724-Nov-08 10.3312 0.0531 0.053129-Dec-08 10.3420 0.0616 0.061627-Jan-09 10.3257 0.0489 0.048924-Feb-09 10.3185 0.0432 0.043230-Mar-09 10.3245 0.0479 0.0479
Weekly Dividend PlanRecord NAV as on Dividend Per Unit (Re.) for Date Record Date Individuals & HUF Others
6-Oct-08 10.3294 0.0149 0.014913-Oct-08 10.3290 0.0146 0.014620-Oct-08 10.3287 0.0143 0.014327-Oct-08 10.3268 0.0129 0.01293-Nov-08 10.3284 0.0141 0.014110-Nov-08 10.3268 0.0129 0.012917-Nov-08 10.3275 0.0134 0.013424-Nov-08 10.3267 0.0128 0.01281-Dec-08 10.3262 0.0124 0.01248-Dec-08 10.3260 0.0122 0.012215-Dec-08 10.3257 0.0120 0.012022-Dec-08 10.3262 0.0124 0.012429-Dec-08 10.3263 0.0125 0.01255-Jan-09 10.3263 0.0125 0.012512-Jan-09 10.3251 0.0115 0.011519-Jan-09 10.3250 0.0115 0.011527-Jan-09 10.3273 0.0132 0.01322-Feb-09 10.3224 0.0094 0.00949-Feb-09 10.3244 0.0110 0.011016-Feb-09 10.3240 0.0107 0.010724-Feb-09 10.3261 0.0123 0.01232-Mar-09 10.3221 0.0092 0.00929-Mar-09 10.3231 0.0100 0.010016-Mar-09 10.3224 0.0094 0.009423-Mar-09 10.3230 0.0099 0.009930-Mar-09 10.3228 0.0097 0.0097
Daily Dividend Plan**Month NAV as on Dividend Per Unit (Re.) for
Record Date Individuals & HUF OthersOctober 10.1982 0.0639 0.0639November 10.1982 0.0534 0.0534December 10.1982 0.0537 0.0537January 10.1982 0.0509 0.0509February 10.1982 0.0427 0.0427March 10.1982 0.0435 0.0435
HDFC LIQUID FUND PREMIUM PLUS PLANWeekly Dividend Plan
Record NAV as on Dividend Per Unit (Re.) for Date Record Date Individuals & HUF Others
6-Oct-08 12.4413 0.0185 0.018513-Oct-08 12.4411 0.0183 0.018320-Oct-08 12.4397 0.0172 0.017227-Oct-08 12.4381 0.0160 0.01603-Nov-08 12.4402 0.0176 0.017610-Nov-08 12.4382 0.0161 0.016117-Nov-08 12.4390 0.0167 0.016724-Nov-08 12.4382 0.0161 0.01611-Dec-08 12.4377 0.0157 0.01578-Dec-08 12.4371 0.0152 0.015215-Dec-08 12.4367 0.0149 0.014922-Dec-08 12.4373 0.0154 0.015429-Dec-08 12.4375 0.0155 0.01555-Jan-09 12.4375 0.0155 0.015512-Jan-09 12.4360 0.0143 0.014319-Jan-09 12.4360 0.0143 0.014327-Jan-09 12.4388 0.0165 0.01652-Feb-09 12.4327 0.0118 0.01189-Feb-09 12.4350 0.0136 0.013616-Feb-09 12.4345 0.0132 0.013224-Feb-09 12.4373 0.0154 0.01542-Mar-09 12.4324 0.0115 0.01159-Mar-09 12.4336 0.0125 0.012516-Mar-09 12.4328 0.0118 0.011823-Mar-09 12.4334 0.0123 0.012330-Mar-09 12.4333 0.0122 0.0122
HDFC LIQUID FUND PREMIUM PLANDaily Dividend Plan **
Month NAV as on Dividend Per Unit (Re.) forRecord Date Individuals & HUF Others
October 12.2598 0.0794 0.0794November 12.2598 0.0661 0.0661December 12.2598 0.0667 0.0667January 12.2598 0.0632 0.0632February 12.2598 0.0532 0.0532March 12.2598 0.0539 0.0539
HDFC CASH MANAGEMENT FUND- SAVINGS PLANWeekly Dividend Plan
Record NAV as on Dividend Per Unit (Re.) for Date Record Date Individuals & HUF Others
3-Oct-08 10.6450 0.0158 0.015810-Oct-08 10.6444 0.0154 0.015417-Oct-08 10.6440 0.0150 0.015024-Oct-08 10.6430 0.0143 0.014331-Oct-08 10.6430 0.0143 0.01437-Nov-08 10.6430 0.0143 0.014314-Nov-08 10.6431 0.0143 0.014321-Nov-08 10.6426 0.0140 0.014028-Nov-08 10.6417 0.0133 0.01335-Dec-08 10.6421 0.0136 0.013612-Dec-08 10.6411 0.0128 0.012819-Dec-08 10.6412 0.0128 0.012826-Dec-08 10.6417 0.0132 0.01322-Jan-09 10.6415 0.0131 0.01319-Jan-09 10.6412 0.0129 0.012916-Jan-09 10.6398 0.0118 0.011823-Jan-09 10.6401 0.0120 0.012030-Jan-09 10.6398 0.0118 0.01186-Feb-09 10.6398 0.0117 0.011713-Feb-09 10.6397 0.0117 0.011724-Feb-09 10.6476 0.0179 0.017927-Feb-09 10.6308 0.0047 0.00476-Mar-09 10.6387 0.0109 0.010913-Mar-09 10.6384 0.0107 0.010720-Mar-09 10.6381 0.0104 0.010430-Mar-09 10.6435 0.0147 0.0147
Daily Dividend Plan**Month NAV as on Dividend Per Unit (Re.) for
Record Date Individuals & HUF OthersOctober 10.6364 0.0680 0.0680November 10.6364 0.0575 0.0575December 10.6364 0.0578 0.0578January 10.6364 0.0539 0.0539February 10.6364 0.0458 0.0458March 10.6364 0.0472 0.0472
HDFC CASH MANAGEMENT FUND- TREASURY ADVANTAGE PLANWholesale Plan Monthly Dividend Option
Record NAV as on Dividend Per Unit (Re.) for Date Record Date Individuals & HUF Others
27-Oct-08 10.0836 0.0653 0.060824-Nov-08 10.0804 0.0626 0.058229-Dec-08 10.0923 0.0729 0.067927-Jan-09 10.0732 0.0379 0.035324-Feb-09 10.0870 0.0411 0.038330-Mar-09 10.1056 0.0487 0.0453
Retail Plan Monthly Dividend OptionRecord NAV as on Dividend Per Unit (Re.) for Date Record Date Individuals & HUF Others
27-Oct-08 10.0804 0.0626 0.058224-Nov-08 10.0764 0.0591 0.055029-Dec-08 10.0885 0.0696 0.064827-Jan-09 10.0701 0.0439 0.040824-Feb-09 10.0738 0.0384 0.035730-Mar-09 10.0918 0.0454 0.0422
Wholesale Plan Weekly Dividend OptionRecord NAV as on Dividend Per Unit (Re.) for Date Record Date Individuals & HUF Others
6-Oct-08 10.0331 0.0167 0.015613-Oct-08 10.0329 0.0165 0.015420-Oct-08 10.0323 0.0160 0.014927-Oct-08 10.0321 0.0159 0.01473-Nov-08 10.0320 0.0157 0.014710-Nov-08 10.0318 0.0156 0.014517-Nov-08 10.0316 0.0155 0.014424-Nov-08 10.0316 0.0155 0.01441-Dec-08 10.0310 0.0149 0.01388-Dec-08 10.0308 0.0147 0.013715-Dec-08 10.0302 0.0141 0.013222-Dec-08 10.0309 0.0148 0.013729-Dec-08 10.0302 0.0142 0.01325-Jan-09 10.0308 0.0147 0.013712-Jan-09 10.0295 0.0136 0.012719-Jan-09 10.0290 0.0131 0.012227-Jan-09 10.0306 0.0145 0.01352-Feb-09 10.0264 0.0100 0.00939-Feb-09 10.0292 0.0124 0.011616-Feb-09 10.0291 0.0123 0.011524-Feb-09 10.0311 0.0141 0.01312-Mar-09 10.0270 0.0105 0.00989-Mar-09 10.0285 0.0118 0.011016-Mar-09 10.0277 0.0111 0.010423-Mar-09 10.0275 0.0101 0.009430-Mar-09 10.0305 0.0127 0.0119
Retail Plan Weekly Dividend OptionRecord NAV as on Dividend Per Unit (Re.) for Date Record Date Individuals & HUF Others
6-Oct-08 10.0323 0.0161 0.015013-Oct-08 10.0321 0.0159 0.014820-Oct-08 10.0315 0.0154 0.014327-Oct-08 10.0312 0.0151 0.01413-Nov-08 10.0312 0.0150 0.014010-Nov-08 10.0311 0.0149 0.013917-Nov-08 10.0309 0.0148 0.013824-Nov-08 10.0309 0.0148 0.01381-Dec-08 10.0303 0.0142 0.01328-Dec-08 10.0300 0.0141 0.013115-Dec-08 10.0294 0.0135 0.012522-Dec-08 10.0301 0.0141 0.013129-Dec-08 10.0294 0.0135 0.01255-Jan-09 10.0301 0.0132 0.012312-Jan-09 10.0299 0.0116 0.010819-Jan-09 10.0310 0.0145 0.013527-Jan-09 10.0301 0.0136 0.01262-Feb-09 10.0264 0.0100 0.00939-Feb-09 10.0283 0.0117 0.010916-Feb-09 10.0283 0.0117 0.010924-Feb-09 10.0302 0.0129 0.01202-Mar-09 10.0268 0.0102 0.0095
9-Mar-09 10.0279 0.0113 0.010516-Mar-09 10.0269 0.0105 0.009723-Mar-09 10.0268 0.0094 0.008830-Mar-09 10.0298 0.0121 0.0112
Wholesale Plan Daily Dividend Option**Month NAV as on Dividend Per Unit (Re.) for
Record Date Individuals & HUF OthersOctober 10.0315 0.0765 0.0708November 10.0315 0.0617 0.0571December 10.0315 0.0637 0.0598January 10.0315 0.0608 0.0565February 10.0315 0.0497 0.0460March 10.0315 0.0486 0.0453
Retail Plan Daily Dividend Option**Month NAV as on Dividend Per Unit (Re.) for
Record Date Individuals & HUF OthersOctober 10.0315 0.0729 0.0681November 10.0315 0.0588 0.0547December 10.0315 0.0611 0.0570January 10.0315 0.0576 0.0538February 10.0315 0.0467 0.0437March 10.0315 0.0459 0.0427
HDFC CASH MANAGEMENT FUND - CALL PLANDaily Dividend Plan**
Month NAV as on Dividend Per Unit (Re.) forRecord Date Individuals & HUF Others
October 10.4266 0.0613 0.0613November 10.4266 0.0415 0.0415December 10.4266 0.0383 0.0383January 10.4266 0.0269 0.0269February 10.4266 0.0231 0.0231March 10.4266 0.0316 0.0316
HDFC QUARTERLY INTERVAL FUND - PLAN AWholesale Plan Dividend Option
Record NAV as on Dividend Per Unit (Re.) for Date Record Date Individuals & HUF Others
22-Dec-08 10.0000 0.2532 0.235723-Mar-09 10.0000 0.1751 0.1630
Retail Plan Dividend OptionRecord NAV as on Dividend Per Unit (Re.) for Date Record Date Individuals & HUF Others
22-Dec-08 10.0000 0.2532 0.235723-Mar-09 10.0000 0.1751 0.1630
HDFC QUARTERLY INTERVAL FUND - PLAN BWholesale Plan Dividend Option
Record NAV as on Dividend Per Unit (Re.) for Date Record Date Individuals & HUF Others
13-Oct-08 10.0000 0.2277 0.211912-Jan-09 10.0000 0.2686 0.2500
Retail Plan Dividend OptionRecord NAV as on Dividend Per Unit (Re.) for Date Record Date Individuals & HUF Others
13-Oct-08 10.0000 0.2277 0.211912-Jan-09 10.0000 0.2686 0.2500
HDFC QUARTERLY INTERVAL FUND - PLAN CWholesale Plan Dividend Option
Record NAV as on Dividend Per Unit (Re.) for Date Record Date Individuals & HUF Others
10-Nov-08 10.0000 0.2316 0.21569-Feb-09 10.0000 0.2313 0.2153
Retail Plan Dividend OptionRecord NAV as on Dividend Per Unit (Re.) for Date Record Date Individuals & HUF Others
10-Nov-08 10.0000 0.2316 0.21569-Feb-09 10.0000 0.2313 0.2153
HDFC FMP - SERIES V - 24M MAY 2007Retail Plan Quarterly Dividend Option
Record NAV as on Dividend Per Unit (Re.) for Date Record Date Individuals & HUF Others
26-Dec-08 10.3884 0.2109 0.196325-Mar-09 10.4441 0.2535 0.2359
HDFC FMP - SERIES V - 36MJUNE 2007
Wholesale Plan Quarterly Dividend Option26-Dec-08 10.3141 0.1585 0.147525-Mar-09 10.4207 0.1548 0.1441
Retail Plan Quarterly Dividend OptionRecord NAV as on Dividend Per Unit (Re.) for Date Record Date Individuals & HUF Others
26-Dec-08 10.3036 0.2466 0.229525-Mar-09 10.2965 0.1445 0.1345
HDFC FMP - SERIES VI - 18MSEPTEMBER 2007
Wholesale Plan Quarterly Dividend OptionRecord NAV as on Dividend Per Unit (Re.) for Date Record Date Individuals & HUF Others
26-Dec-08 10.3369 0.0791 0.0736
Retail Plan Quarterly Dividend OptionRecord NAV as on Dividend Per Unit (Re.) for Date Record Date Individuals & HUF Others
26-Dec-08 10.3234 0.0776 0.0723
HDFC FMP - SERIES VI - 18MOCTOBER 2007
Retail Plan Quarterly Dividend OptionRecord NAV as on Dividend Per Unit (Re.) for Date Record Date Individuals & HUF Others
26-Dec-08 10.1597 0.0971 0.0903
HDFC FMP - SERIES VI - 18MNOVEMBER 2007
Retail Plan Quarterly Dividend OptionRecord NAV as on Dividend Per Unit (Re.) for Date Record Date Individuals & HUF Others
26-Dec-08 10.2413 0.0721 0.067125-Mar-09 10.4505 0.1224 0.1139
HDFC FMP - SERIES VI - 18MDECEMBER 2007
Retail Plan Quarterly Dividend OptionRecord NAV as on Dividend Per Unit (Re.) for Date Record Date Individuals & HUF Others
26-Dec-08 10.2276 0.1400 0.130325-Mar-09 10.3180 0.1433 0.1333
Month NAV as on Dividend Per Unit (Re.) forRecord Date Individuals & HUF Others
Record NAV as on Dividend Per Unit (Re.) for Date Record Date Individuals & HUF Others
* Dividend is declared on the face value of the unit i.e. Rs.10/- per unit. Past performance may or may not be sustained in future. ** Please log on to www.hdfcfund.com for Record date-wise listing of Dividends declared. Page: 25 (continued....)

HDFC FMP - SERIES VI - 18MJANUARY 2008
Retail Plan Quarterly Dividend OptionRecord NAV as on Dividend Per Unit (Re.) for Date Record Date Individuals & HUF Others
26-Dec-08 10.4306 0.0935 0.0871
HDFC FMP - SERIES VII - 15MFEBRUARY 2008
Retail Plan Quarterly Dividend Option
Record NAV as on Dividend Per Unit (Re.) for Date Record Date Individuals & HUF Others
26-Dec-08 10.3244 0.2841 0.264425-Mar-09 10.2402 0.2104 0.1958
HDFC FMP - SERIES VII - 13MMARCH 2008
Retail Plan Quarterly Dividend Option
Record NAV as on Dividend Per Unit (Re.) for Date Record Date Individuals & HUF Others
26-Dec-08 10.2422 0.2111 0.196525-Mar-09 10.2313 0.2026 0.1885
HDFC FMP - SERIES VII - 13MMARCH 2008 (2)
Retail Plan Quarterly Dividend OptionRecord NAV as on Dividend Per Unit (Re.) for Date Record Date Individuals & HUF Others
26-Dec-08 10.4814 0.1916 0.178325-Mar-09 10.6060 0.1018 0.0947
HDFC FMP - SERIES VII - 370DMARCH 2008 (2)
Retail Plan Quarterly Dividend OptionRecord NAV as on Dividend Per Unit (Re.) for Date Record Date Individuals & HUF Others
26-Dec-08 10.2986 0.1408 0.131125-Mar-09 10.4547 0.1301 0.1211
HDFC FMP - SERIES VII- 18M APRIL 2008Retail Plan Quarterly Dividend Option
Record NAV as on Dividend Per Unit (Re.) for Date Record Date Individuals & HUF Others
26-Dec-08 10.2521 0.2208 0.205525-Mar-09 10.2693 0.2358 0.2195
HDFC FMP - SERIES VII- 18M APRIL 2008 (2)Wholesale Plan Quarterly Dividend Option
Record NAV as on Dividend Per Unit (Re.) for Date Record Date Individuals & HUF Others
26-Dec-08 10.2552 0.1434 0.133425-Mar-09 10.4470 0.1088 0.1013
Retail Plan Quarterly Dividend OptionRecord NAV as on Dividend Per Unit (Re.) for Date Record Date Individuals & HUF Others
26-Dec-08 10.2389 0.1371 0.127625-Mar-09 10.4216 0.0943 0.0878
HDFC FMP - SERIES VIII - 370D MAY 2008Wholesale Plan Quarterly Dividend Option
Record NAV as on Dividend Per Unit (Re.) for Date Record Date Individuals & HUF Others
26-Dec-08 10.2662 0.1483 0.138025-Mar-09 10.3813 0.1400 0.1303
Retail Plan Quarterly Dividend OptionRecord NAV as on Dividend Per Unit (Re.) for Date Record Date Individuals & HUF Others
26-Dec-08 10.2580 0.1412 0.131425-Mar-09 10.3730 0.1328 0.1236
HDFC FMP - SERIES VIII - 370D MAY 2008 (2)Retail Plan Quarterly Dividend Option
Record NAV as on Dividend Per Unit (Re.) for Date Record Date Individuals & HUF Others
26-Dec-08 10.2304 0.0695 0.064725-Mar-09 10.4491 0.0846 0.0787
HDFC FMP - SERIES VIII - 370D MAY 2008 (3)Wholesale Plan Quarterly Dividend Option
Record NAV as on Dividend Per Unit (Re.) for Date Record Date Individuals & HUF Others
26-Dec-08 10.1937 0.0786 0.0731
Retail Plan Quarterly Dividend OptionRecord NAV as on Dividend Per Unit (Re.) for Date Record Date Individuals & HUF Others
26-Dec-08 10.1846 0.0706 0.0657
HDFC FMP - SERIES VIII- 370D JUNE 2008 (1)Wholesale Plan Quarterly Dividend Option
Record NAV as on Dividend Per Unit (Re.) for Date Record Date Individuals & HUF Others
26-Dec-08 10.2139 0.0628 0.0584
Retail Plan Quarterly Dividend OptionRecord NAV as on Dividend Per Unit (Re.) for Date Record Date Individuals & HUF Others
26-Dec-08 10.2055 0.0554 0.0516
HDFC FMP - SERIES VIII- 370D JUNE 2008 (2)Retail Plan Quarterly Dividend Option
Record NAV as on Dividend Per Unit (Re.) for Date Record Date Individuals & HUF Others
26-Dec-08 10.3914 0.1850 0.172225-Mar-09 10.4676 0.1600 0.1489
HDFC FMP - SERIES VIII - 370D JULY 2008 (1)Wholesale Plan Quarterly Dividend Option
Record NAV as on Dividend Per Unit (Re.) for Date Record Date Individuals & HUF Others
26-Dec-08 10.4122 0.2493 0.232025-Mar-09 10.4051 0.2026 0.1886
Retail Plan Quarterly Dividend Option
Record NAV as on Dividend Per Unit (Re.) for Date Record Date Individuals & HUF Others
26-Dec-08 10.3852 0.2326 0.216525-Mar-09 10.3830 0.1829 0.1703
HDFC FMP - SERIES IX- 370DJULY 2008 (2)
Retail Plan Quarterly Dividend OptionRecord NAV as on Dividend Per Unit (Re.) for Date Record Date Individuals & HUF Others
26-Dec-08 10.3376 0.2544 0.236825-Mar-09 10.3642 0.1227 0.1142
HDFC FMP - SERIES IX- 20MAUGUST 2008
Retail Plan Quarterly Dividend OptionRecord NAV as on Dividend Per Unit (Re.) for Date Record Date Individuals & HUF Others
26-Dec-08 10.2450 0.2146 0.199725-Mar-09 10.3412 0.2848 0.2650
HDFC FMP - SERIES IX- 370DAUGUST 2008 (1)
Retail Plan Quarterly Dividend OptionRecord NAV as on Dividend Per Unit (Re.) for Date Record Date Individuals & HUF Others
26-Dec-08 10.2857 0.1044 0.0971
HDFC FMP - SERIES IX - 370DAUGUST 2008 (3)
Retail Plan Quarterly Dividend OptionRecord NAV as on Dividend Per Unit (Re.) for Date Record Date Individuals & HUF Others
26-Dec-08 10.3201 0.2565 0.238725-Mar-09 10.2865 0.2051 0.1909
HDFC FMP - SERIES IX - 22MSEPTEMBER 2008
Retail Plan Quarterly Dividend OptionRecord NAV as on Dividend Per Unit (Re.) for Date Record Date Individuals & HUF Others
26-Dec-08 10.2220 0.1813 0.168825-Mar-09 10.2920 0.1796 0.1672
HDFC FMP - SERIES IX - 370DSEPTEMBER 2008 (1)
Wholesale Plan Quarterly Dividend OptionRecord NAV as on Dividend Per Unit (Re.) for Date Record Date Individuals & HUF Others
26-Dec-08 10.3671 0.2374 0.220925-Mar-09 10.3815 0.2058 0.1915
Retail Plan Quarterly Dividend OptionRecord NAV as on Dividend Per Unit (Re.) for Date Record Date Individuals & HUF Others
26-Dec-08 10.3416 0.2004 0.186625-Mar-09 10.3748 0.1853 0.1724
HDFC FMP - SERIES IX - 18MOCTOBER 2008 (1)
Wholesale Plan Quarterly Dividend OptionRecord NAV as on Dividend Per Unit (Re.) for Date Record Date Individuals & HUF Others
26-Dec-08 10.4996 0.1717 0.159825-Mar-09 10.6648 0.2188 0.2036
Retail Plan Quarterly Dividend OptionRecord NAV as on Dividend Per Unit (Re.) for Date Record Date Individuals & HUF Others
26-Dec-08 10.4789 0.1562 0.145425-Mar-09 10.6385 0.1985 0.1847
HDFC FMP - SERIES IX- 370DOCTOBER 2008 (1)
Retail Plan Quarterly Dividend OptionRecord NAV as on Dividend Per Unit (Re.) for Date Record Date Individuals & HUF Others
26-Dec-08 10.2528 0.1627 0.151425-Mar-09 10.3592 0.2133 0.1985
HDFC FMP - SERIES IX- 18MOCTOBER 2008 (2)
Retail Plan Quarterly Dividend OptionRecord NAV as on Dividend Per Unit (Re.) for Date Record Date Individuals & HUF Others
25-Mar-09 10.6793 0.1407 0.1309
HDFC FMP - SERIES IX- 370DNOVEMBER 2008 (1)
Wholesale Plan Quarterly Dividend OptionRecord NAV as on Dividend Per Unit (Re.) for Date Record Date Individuals & HUF Others
26-Dec-08 10.1439 0.1260 0.117325-Mar-09 10.2701 0.2304 0.2144
Retail Plan Quarterly Dividend OptionRecord NAV as on Dividend Per Unit (Re.) for Date Record Date Individuals & HUF Others
26-Dec-08 10.1313 0.1150 0.107025-Mar-09 10.2470 0.2101 0.1956
HDFC FMP - SERIES IX- 17MNOVEMBER 2008 (1)
Wholesale Plan Quarterly Dividend OptionRecord NAV as on Dividend Per Unit (Re.) for Date Record Date Individuals & HUF Others
25-Mar-09 10.3579 0.2563 0.2386
Retail Plan Quarterly Dividend OptionRecord NAV as on Dividend Per Unit (Re.) for Date Record Date Individuals & HUF Others
25-Mar-09 10.3372 0.2380 0.2215
HDFC FMP - SERIES X- 16MDECEMBER 2008 (1)
Retail Plan Quarterly Dividend OptionRecord NAV as on Dividend Per Unit (Re.) for Date Record Date Individuals & HUF Others
25-Mar-09 10.2229 0.1845 0.1717
HDFC FMP - SERIES IX- 370DDECEMBER 2008 (1)
Retail Plan Quarterly Dividend OptionRecord NAV as on Dividend Per Unit (Re.) for Date Record Date Individuals & HUF Others
25-Mar-09 10.2167 0.1898 0.1766
HDFC Asset Management Company LimitedA Joint Venture with Standard Life Investments Limited
Registered Office: Ramon House, 3rd Floor, H.T. Parekh Marg, 169, Backbay Reclamation, Churchgate, Mumbai 400 020.Investor Services Centre (at Mumbai) : Mistry Bhawan, 1st Floor, 122, Backbay Reclamation, Dinsha Vachha Road, Churchgate, Mumbai - 400 020 • Tel.: 022-6631 6300 • Toll-free number : 1800 233 6767 • Fax : 022-2282 1144 • e-mail : [email protected] • Visit us at : www.hdfcfund.com
DIVIDEND HISTORY (CONTD.)Risk Factors: All mutual funds and securities investments are subject to market risks and there can be no assurance that theSchemes’ objectives will be achieved and the NAV of the Schemes may go up or down depending upon the factors and forcesaffecting the securities market. Past performance of the Sponsors and their affiliates / AMC / Mutual Fund and its Scheme(s) donot indicate the future performance of the Scheme of the Mutual Fund. There is no assurance or guarantee to unit holders asto the rate of dividend distribution nor that dividends will be paid regularly. Investors in the Schemes are not being offered anyguaranteed / assured returns. The NAV of the units issued under the Schemes may be affected, inter-alia by changes in theinterest rates, trading volumes, settlement periods, transfer procedures and performance of individual securities. The NAV willinter-alia be exposed to Price / Interest Rate Risk and Credit Risk. HDFC Growth Fund (an open-ended growth scheme; theobjective of the scheme is to generate long term capital appreciation from a portfolio that is invested predominantly in equity andequity related instruments), HDFC Equity Fund (an open-ended growth scheme; the objective of the scheme is to achievecapital appreciation), HDFC Top 200 Fund (an open-ended growth scheme; the objective of the scheme is to generate longterm capital appreciation from a portfolio of equity and equity linked instruments primarily drawn from the companies in BSE 200index), HDFC Capital Builder Fund (an open-ended growth scheme; the objective of the scheme is to achieve capitalappreciation in the long term), HDFC Core & Satellite Fund (an open-ended growth scheme; the objective of the scheme isto generate capital appreciation through equity investment in companies whose shares are quoting at prices below their truevalue), HDFC Premier Multi-Cap Fund (an open-ended growth scheme, the objective of the scheme is to generate capitalappreciation in the long term through equity investments by investing in a diversified portfolio of Mid Cap & Large Cap ‘blue chip’companies), HDFC Index Fund (an open-ended index linked scheme; the scheme has 3 plans viz - Nifty Plan - the objectiveof the Plan is to generate returns that are commensurate with the performance of the Nifty, subject to tracking error, Sensex Plan– the objective of the Plan is to generate returns that are commensurate with the performance of the SENSEX, subject to trackingerror, and Sensex Plus Plan - the objective of the Plan is to invest 80 to 90% of the net assets of the Plan in companies whosesecurities are included in SENSEX and between 10% & 20% of the net assets in companies whose securities are not includedin the SENSEX), HDFC Long Term Advantage Fund (an open-ended equity linked savings scheme with a lock-in period of3 years; the objective of the Scheme is to generate long term capital appreciation from a portfolio that is invested predominantlyin equity and equity related instruments), HDFC TaxSaver (an open-ended equity linked savings scheme with a lock-in periodof 3 years; the objective of the scheme is to achieve long term growth of capital), HDFC Arbitrage Fund (an open-ended equityfund, the objective of the Scheme is to generate income through arbitrage opportunities between cash and derivative marketand arbitrage opportunities within the derivative segment and by deployment of surplus cash in debt securities and moneymarket instruments), HDFC Long Term Equity Fund (a close-ended equity scheme with a maturity period of 5 years withautomatic conversion into an open-ended scheme upon maturity of the Scheme, the objective of the scheme is to achieve long-term capital appreciation), HDFC Mid-Cap Opportunities Fund (a 3 year close-ended equity scheme with automaticconversion into an open-ended scheme upon maturity, the objective of the scheme is to generate long-term capital appreciationfrom a portfolio that is substantially constituted of equity and equity related securities of Small and Mid-Cap companies), HDFCInfrastructure Fund, (a 3 year close-ended equity scheme with automatic conversion into an open-ended scheme uponmaturity, the objective of the scheme is to seek long-term capital appreciation by investing predominantly in equity and equityrelated securities of companies engaged in or expected to benefit from the growth and development of infrastructure), HDFCBalanced Fund (an open-ended balanced scheme; the objective of the Scheme is to generate capital appreciation along withcurrent income from a combined portfolio of equity and equity related and debt and money market instruments), HDFCPrudence Fund (an open-ended balanced scheme; the objective of the scheme is to provide periodic returns and capitalappreciation over a long period of time from a judicious mix of equity and debt instruments with an aim to prevent / minimise anycapital erosion), HDFC Children’s Gift Fund (an open-ended balanced scheme; the objective of both the Plans under theScheme is to generate long term capital appreciation), HDFC MF Monthly Income Plan (an open-ended income scheme.Monthly income is not assured and is subject to availability of distributable surplus; the objective of the scheme is to generateregular returns through investment primarily in debt and money market instruments. The secondary objective of the scheme isto generate long term capital appreciation by investing a portion of the scheme’s assets in equity and equity related instruments),HDFC Multiple Yield Fund (an open-ended income scheme, the objective of the scheme is to generate positive returns overmedium time frame with low risk of capital loss over medium time frame), HDFC Multiple Yield Fund- Plan 2005 (an open-ended income scheme, the objective of the scheme is to generate positive returns over the medium time frame with low risk ofcapital loss over medium time frame), HDFC Income Fund (an open-ended income scheme; the objective of the Scheme is tooptimise returns while maintaining a balance of safety, yield and liquidity), HDFC High Interest Fund (an open-ended incomescheme; the objective of the Scheme is to generate income by investing in a range of debt and money market instruments ofvarious maturity dates with a view to maximise income while maintaining the optimum balance of yield, safety and liquidity),HDFC Short Term Plan (an open-ended income scheme; the objective of the scheme is to generate regular income throughinvestment in debt securities and money market instruments), HDFC Gilt Fund (an open-ended income scheme; the objectiveof the scheme is to generate credit risk free returns through investments in sovereign securities issued by the Central Govern-ment and/or a State Government), HDFC Floating Rate Income Fund (an open-ended income scheme; the objective of thescheme is to generate regular income through investment in a portfolio comprising substantially of floating rate debt / moneymarket instruments, fixed rate debt / money market instruments swapped for floating rate returns, and fixed rate debt securitiesand money market instruments), HDFC Liquid Fund (an open-ended liquid income scheme; the objective of the Scheme is toenhance income consistent with a high level of liquidity, through a judicious portfolio mix comprising of money market and debtinstruments), HDFC Cash Management Fund (Savings & Call Plan, an open-ended high liquidity income scheme; theobjective of the scheme is to generate optimal returns while maintaining safety and high liquidity; Treasury Advantage Plan,an open-ended income scheme, the objective is to generate regular income through investment in debt securities and moneymarket instruments), HDFC Fixed Maturity Plans, HDFC Fixed Maturity Plans – Series V, HDFC Fixed Maturity Plans– Series VI , HDFC Fixed Maturity Plans – Series VII, HDFC Fixed Maturity Plans – Series VIII, HDFC FixedMaturity Plans – Series IX and HDFC Fixed Maturity Plans – Series X (close-ended income schemes, the objective ofthe Plans under the Scheme is to generate regular income through investments in Debt/Money Market Instruments andGovernment Securities) and HDFC Quarterly Interval Fund (an open-ended interval income scheme, the objective of thePlans under the Scheme is to generate regular income through investments in Debt / Money Market Instruments and Govern-ment Securities) are only the names of the Scheme(s) and do not in any manner indicate either the quality of the Scheme(s),their future prospects and returns. In view of the individual nature of tax consequences, each investor is advised to consult his/her professional tax advisor. Please read the offer document(s) of the respective Scheme(s) before investing.
“Standard & Poor’s ®” and “S & P ®” are trademarks of The McGraw-Hill Companies, Inc. and have been licensed for use byIndia Index Services & Products Limited (IISL), which has sublicensed such marks to HDFC Asset Management CompanyLimited. The S & P CNX Nifty is not compiled calculated or distributed by Standard & Poor’s and IISL make no representationregarding the advisability of investing in products that utilize any such Index as a component. All rights in the SENSEX vest inBombay Stock Exchange Ltd. (“BSE”). BSE and SENSEX are trademarks of BSE and are used by HDFC Asset ManagementCompany Limited under license. BSE shall not be liable in any manner whatsoever (including in negligence) for any loss arisingto any person whosoever out of use of or reliance on the SENSEX by any person.
HDFC Equity Fund, HDFC Capital Builder Fund, HDFC TaxSaver and HDFC Premier Multi-Cap Fund and HDFC Infrastruc-ture Fund benchmarked to S&P CNX 500 Index, HDFC Mid-Cap Opportunities Fund benchmarked to CNX Midcap Index andHDFC Long Term Equity Fund benchmarked to S&P CNX Nifty, are not sponsored, endorsed, sold or promoted by India IndexServices & Products Limited (IISL). IISL is not responsible for any errors or omissions or the results obtained from the use ofsuch index and in no event shall IISL have any liability to any party for any damages of whatsoever nature (including lost profits)resulted to such party due to purchase or sale or otherwise of such product benchmarked to such index.
Statutory Details: HDFC Mutual Fund has been set up as a trust sponsored by Housing Development Finance CorporationLimited and Standard Life Investments Limited (liability restricted to their contribution of Rs. 1 lakh each to the corpus) with HDFCTrustee Company Limited as the Trustee (Trustee under the Indian Trusts Act, 1882) and with HDFC Asset ManagementCompany Limited as the Investment Manager.
* Dividend is declared on the face value of the unit i.e. Rs.10/- per unit. Past performance may or may not be sustained in future.
PRESSMAN