Embed Size (px)
DESCRIPTION
overview of hdfc life insurance
Citation preview
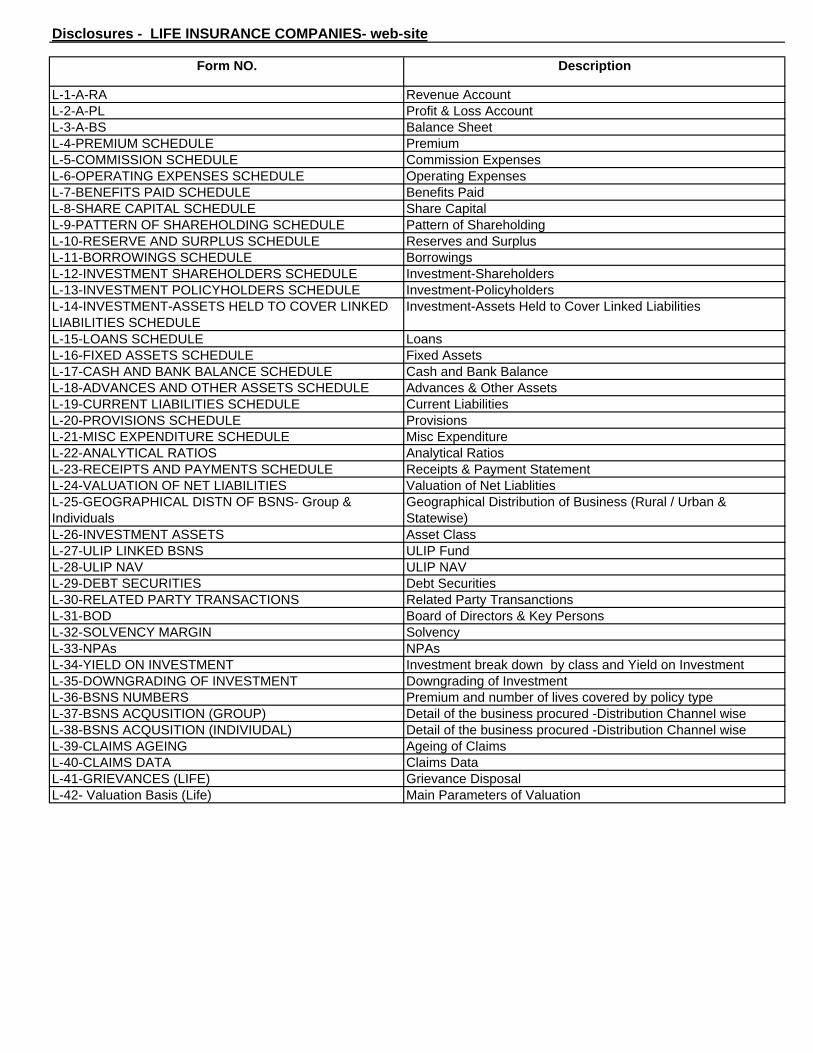
L-1-A-RA Revenue AccountL-2-A-PL Profit & Loss AccountL-3-A-BS Balance SheetL-4-PREMIUM SCHEDULE PremiumL-5-COMMISSION SCHEDULE Commission ExpensesL-6-OPERATING EXPENSES SCHEDULE Operating Expenses L-7-BENEFITS PAID SCHEDULE Benefits PaidL-8-SHARE CAPITAL SCHEDULE Share CapitalL-9-PATTERN OF SHAREHOLDING SCHEDULE Pattern of ShareholdingL-10-RESERVE AND SURPLUS SCHEDULE Reserves and SurplusL-11-BORROWINGS SCHEDULE BorrowingsL-12-INVESTMENT SHAREHOLDERS SCHEDULE Investment-ShareholdersL-13-INVESTMENT POLICYHOLDERS SCHEDULE Investment-PolicyholdersL-14-INVESTMENT-ASSETS HELD TO COVER LINKED LIABILITIES SCHEDULE
Investment-Assets Held to Cover Linked Liabilities
L-15-LOANS SCHEDULE LoansL-16-FIXED ASSETS SCHEDULE Fixed AssetsL-17-CASH AND BANK BALANCE SCHEDULE Cash and Bank BalanceL-18-ADVANCES AND OTHER ASSETS SCHEDULE Advances & Other AssetsL-19-CURRENT LIABILITIES SCHEDULE Current LiabilitiesL-20-PROVISIONS SCHEDULE ProvisionsL-21-MISC EXPENDITURE SCHEDULE Misc Expenditure L-22-ANALYTICAL RATIOS Analytical Ratios L-23-RECEIPTS AND PAYMENTS SCHEDULE Receipts & Payment StatementL-24-VALUATION OF NET LIABILITIES Valuation of Net LiablitiesL-25-GEOGRAPHICAL DISTN OF BSNS- Group & Individuals
Geographical Distribution of Business (Rural / Urban & Statewise)
L-26-INVESTMENT ASSETS Asset ClassL-27-ULIP LINKED BSNS ULIP FundL-28-ULIP NAV ULIP NAVL-29-DEBT SECURITIES Debt SecuritiesL-30-RELATED PARTY TRANSACTIONS Related Party TransanctionsL-31-BOD Board of Directors & Key PersonsL-32-SOLVENCY MARGIN SolvencyL-33-NPAs NPAsL-34-YIELD ON INVESTMENT Investment break down by class and Yield on InvestmentL-35-DOWNGRADING OF INVESTMENT Downgrading of InvestmentL-36-BSNS NUMBERS Premium and number of lives covered by policy typeL-37-BSNS ACQUSITION (GROUP) Detail of the business procured -Distribution Channel wiseL-38-BSNS ACQUSITION (INDIVIUDAL) Detail of the business procured -Distribution Channel wiseL-39-CLAIMS AGEING Ageing of ClaimsL-40-CLAIMS DATA Claims DataL-41-GRIEVANCES (LIFE) Grievance DisposalL-42- Valuation Basis (Life) Main Parameters of Valuation
Disclosures - LIFE INSURANCE COMPANIES- web-site
Form NO. Description
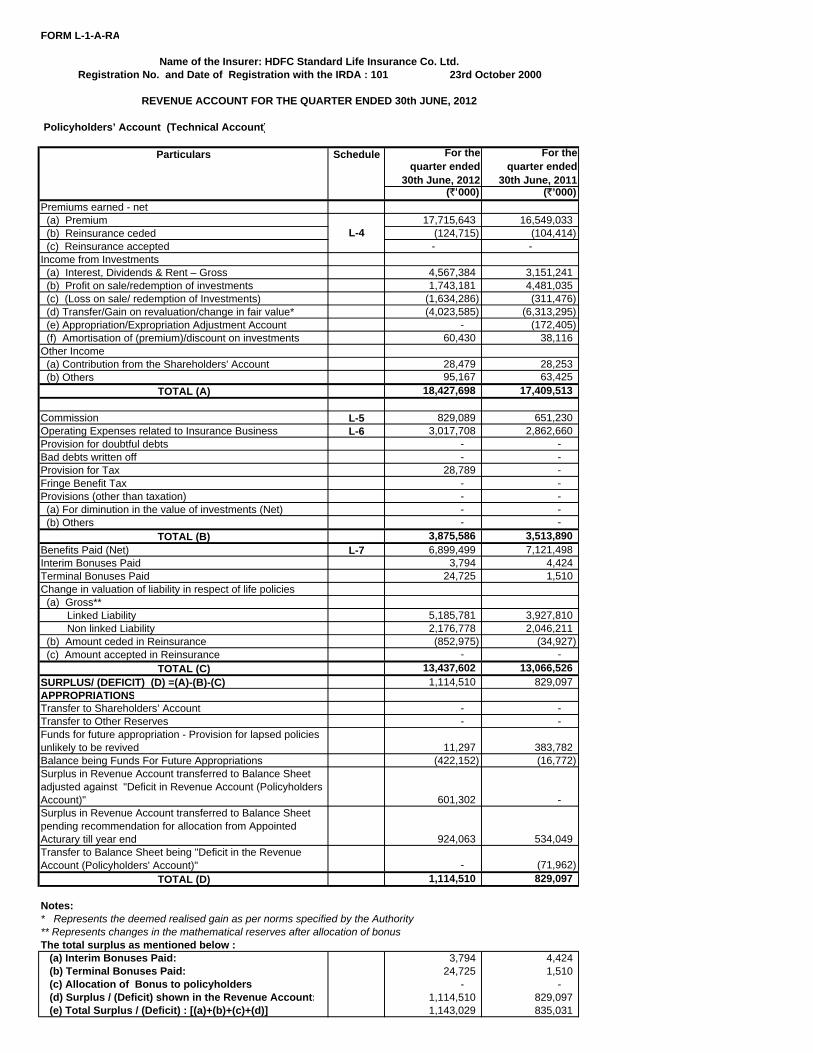
FORM L-1-A-RA
Policyholders’ Account (Technical Account)
For the quarter ended
30th June, 2012
For the quarter ended
30th June, 2011(`'000) (`’000)
Premiums earned - net (a) Premium 17,715,643 16,549,033 (b) Reinsurance ceded (124,715) (104,414) (c) Reinsurance accepted - -Income from Investments (a) Interest, Dividends & Rent – Gross 4,567,384 3,151,241 (b) Profit on sale/redemption of investments 1,743,181 4,481,035 (c) (Loss on sale/ redemption of Investments) (1,634,286) (311,476) (d) Transfer/Gain on revaluation/change in fair value* (4,023,585) (6,313,295) (e) Appropriation/Expropriation Adjustment Account - (172,405) (f) Amortisation of (premium)/discount on investments 60,430 38,116 Other Income (a) Contribution from the Shareholders' Account 28,479 28,253 (b) Others 95,167 63,425
TOTAL (A) 18,427,698 17,409,513
Commission L-5 829,089 651,230 Operating Expenses related to Insurance Business L-6 3,017,708 2,862,660 Provision for doubtful debts - - Bad debts written off - - Provision for Tax 28,789 - Fringe Benefit Tax - - Provisions (other than taxation) - - (a) For diminution in the value of investments (Net) - - (b) Others - -
TOTAL (B) 3,875,586 3,513,890 Benefits Paid (Net) L-7 6,899,499 7,121,498 Interim Bonuses Paid 3,794 4,424 Terminal Bonuses Paid 24,725 1,510 Change in valuation of liability in respect of life policies (a) Gross** Linked Liability 5,185,781 3,927,810 Non linked Liability 2,176,778 2,046,211 (b) Amount ceded in Reinsurance (852,975) (34,927) (c) Amount accepted in Reinsurance - -
TOTAL (C) 13,437,602 13,066,526 SURPLUS/ (DEFICIT) (D) =(A)-(B)-(C) 1,114,510 829,097 APPROPRIATIONSTransfer to Shareholders’ Account - - Transfer to Other Reserves - - Funds for future appropriation - Provision for lapsed policies unlikely to be revived 11,297 383,782 Balance being Funds For Future Appropriations (422,152) (16,772) Surplus in Revenue Account transferred to Balance Sheet adjusted against "Deficit in Revenue Account (Policyholders Account)" 601,302 - Surplus in Revenue Account transferred to Balance Sheet pending recommendation for allocation from Appointed Acturary till year end 924,063 534,049 Transfer to Balance Sheet being "Deficit in the Revenue Account (Policyholders' Account)" - (71,962)
TOTAL (D) 1,114,510 829,097
Notes:* Represents the deemed realised gain as per norms specified by the Authority** Represents changes in the mathematical reserves after allocation of bonusThe total surplus as mentioned below : (a) Interim Bonuses Paid: 3,794 4,424 (b) Terminal Bonuses Paid: 24,725 1,510 (c) Allocation of Bonus to policyholders: - - (d) Surplus / (Deficit) shown in the Revenue Account: 1,114,510 829,097 (e) Total Surplus / (Deficit) : [(a)+(b)+(c)+(d)] 1,143,029 835,031
Name of the Insurer: HDFC Standard Life Insurance Co. Ltd.Registration No. and Date of Registration with the IRDA : 101 23rd October 2000
REVENUE ACCOUNT FOR THE QUARTER ENDED 30th JUNE, 2012
L-4
Particulars Schedule
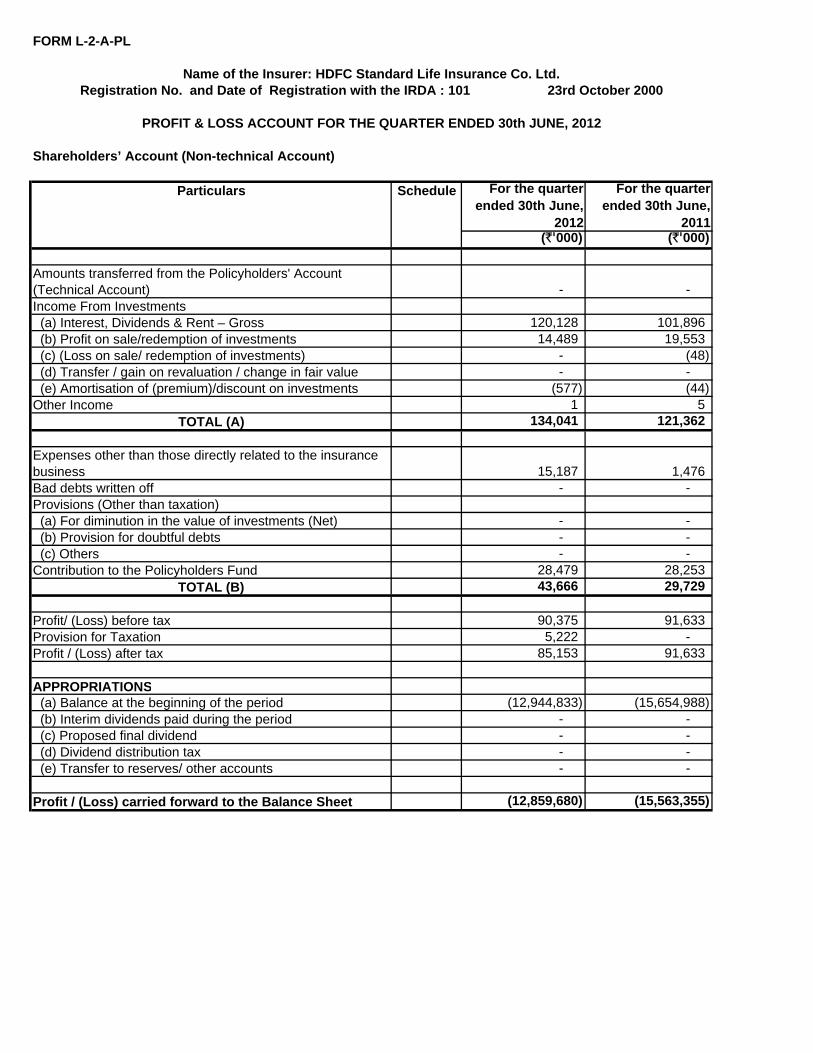
FORM L-2-A-PL
Shareholders’ Account (Non-technical Account)
For the quarter ended 30th June,
2012
For the quarter ended 30th June,
2011(`'000) (`'000)
Amounts transferred from the Policyholders' Account (Technical Account) - - Income From Investments (a) Interest, Dividends & Rent – Gross 120,128 101,896 (b) Profit on sale/redemption of investments 14,489 19,553 (c) (Loss on sale/ redemption of investments) - (48) (d) Transfer / gain on revaluation / change in fair value - - (e) Amortisation of (premium)/discount on investments (577) (44) Other Income 1 5
TOTAL (A) 134,041 121,362
Expenses other than those directly related to the insurance business 15,187 1,476 Bad debts written off - - Provisions (Other than taxation) (a) For diminution in the value of investments (Net) - - (b) Provision for doubtful debts - - (c) Others - - Contribution to the Policyholders Fund 28,479 28,253
TOTAL (B) 43,666 29,729
Profit/ (Loss) before tax 90,375 91,633 Provision for Taxation 5,222 - Profit / (Loss) after tax 85,153 91,633
APPROPRIATIONS (a) Balance at the beginning of the period (12,944,833) (15,654,988) (b) Interim dividends paid during the period - - (c) Proposed final dividend - - (d) Dividend distribution tax - - (e) Transfer to reserves/ other accounts - -
Profit / (Loss) carried forward to the Balance Sheet (12,859,680) (15,563,355)
ScheduleParticulars
Name of the Insurer: HDFC Standard Life Insurance Co. Ltd.Registration No. and Date of Registration with the IRDA : 101 23rd October 2000
PROFIT & LOSS ACCOUNT FOR THE QUARTER ENDED 30th JUNE, 2012
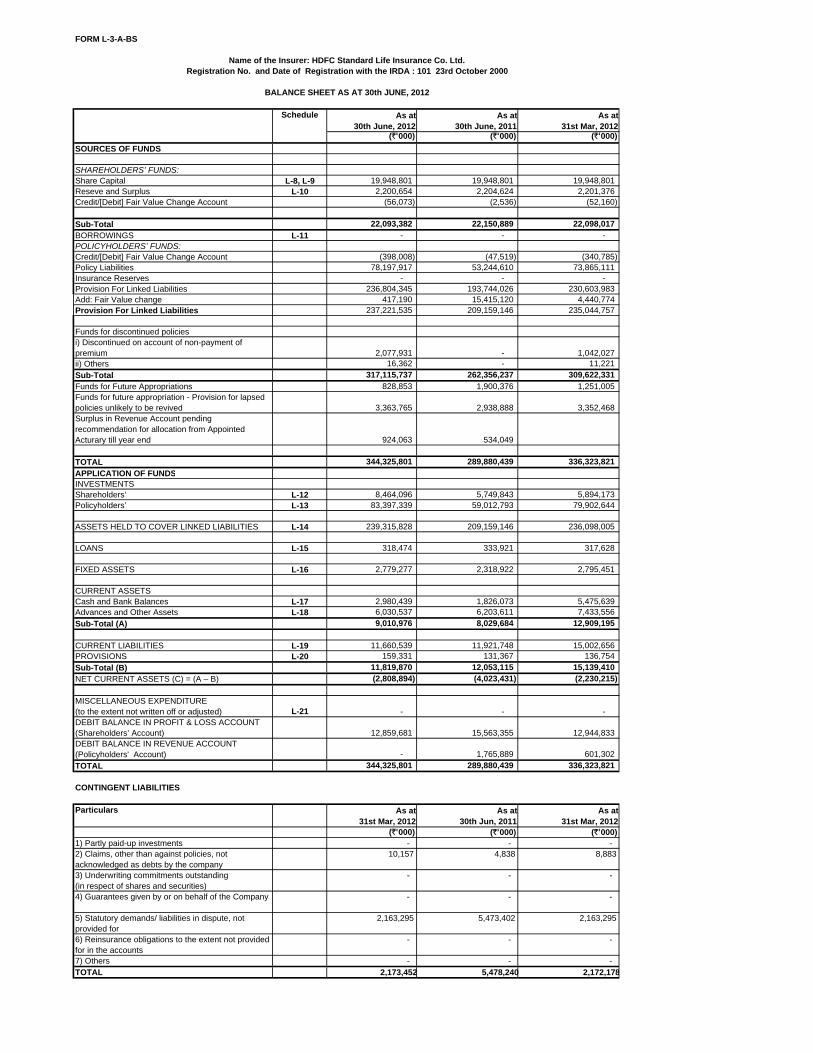
FORM L-3-A-BS
Schedule As at 30th June, 2012
As at 30th June, 2011
As at 31st Mar, 2012
(`'000) (`'000) (`'000)
SOURCES OF FUNDS
SHAREHOLDERS’ FUNDS:Share Capital L-8, L-9 19,948,801 19,948,801 19,948,801 Reseve and Surplus L-10 2,200,654 2,204,624 2,201,376 Credit/[Debit] Fair Value Change Account (56,073) (2,536) (52,160)
Sub-Total 22,093,382 22,150,889 22,098,017
BORROWINGS L-11 - - - POLICYHOLDERS’ FUNDS:Credit/[Debit] Fair Value Change Account (398,008) (47,519) (340,785) Policy Liabilities 78,197,917 53,244,610 73,865,111 Insurance Reserves - - - Provision For Linked Liabilities 236,804,345 193,744,026 230,603,983 Add: Fair Value change 417,190 15,415,120 4,440,774 Provision For Linked Liabilities 237,221,535 209,159,146 235,044,757
Funds for discontinued policiesi) Discontinued on account of non-payment of premium 2,077,931 - 1,042,027 ii) Others 16,362 - 11,221
Sub-Total 317,115,737 262,356,237 309,622,331
Funds for Future Appropriations 828,853 1,900,376 1,251,005 Funds for future appropriation - Provision for lapsed policies unlikely to be revived 3,363,765 2,938,888 3,352,468 Surplus in Revenue Account pending recommendation for allocation from Appointed Acturary till year end 924,063 534,049
TOTAL 344,325,801 289,880,439 336,323,821
APPLICATION OF FUNDSINVESTMENTSShareholders’ L-12 8,464,096 5,749,843 5,894,173 Policyholders’ L-13 83,397,339 59,012,793 79,902,644
ASSETS HELD TO COVER LINKED LIABILITIES L-14 239,315,828 209,159,146 236,098,005
LOANS L-15 318,474 333,921 317,628
FIXED ASSETS L-16 2,779,277 2,318,922 2,795,451
CURRENT ASSETSCash and Bank Balances L-17 2,980,439 1,826,073 5,475,639 Advances and Other Assets L-18 6,030,537 6,203,611 7,433,556
Sub-Total (A) 9,010,976 8,029,684 12,909,195
CURRENT LIABILITIES L-19 11,660,539 11,921,748 15,002,656 PROVISIONS L-20 159,331 131,367 136,754
Sub-Total (B) 11,819,870 12,053,115 15,139,410
NET CURRENT ASSETS (C) = (A – B) (2,808,894) (4,023,431) (2,230,215)
MISCELLANEOUS EXPENDITURE (to the extent not written off or adjusted) L-21 - - - DEBIT BALANCE IN PROFIT & LOSS ACCOUNT (Shareholders’ Account) 12,859,681 15,563,355 12,944,833 DEBIT BALANCE IN REVENUE ACCOUNT(Policyholders' Account) - 1,765,889 601,302
TOTAL 344,325,801 289,880,439 336,323,821
CONTINGENT LIABILITIES
Particulars As at 31st Mar, 2012
As at 30th Jun, 2011
As at 31st Mar, 2012
(`'000) (`'000) (`'000)1) Partly paid-up investments - - - 2) Claims, other than against policies, not acknowledged as debts by the company
10,157 4,838 8,883
3) Underwriting commitments outstanding (in respect of shares and securities)
- - -
4) Guarantees given by or on behalf of the Company - - -
5) Statutory demands/ liabilities in dispute, not provided for
2,163,295 5,473,402 2,163,295
6) Reinsurance obligations to the extent not provided for in the accounts
- - -
7) Others - - - TOTAL 2,173,452 5,478,240 2,172,178
Name of the Insurer: HDFC Standard Life Insurance Co. Ltd.
BALANCE SHEET AS AT 30th JUNE, 2012
Registration No. and Date of Registration with the IRDA : 101 23rd October 2000
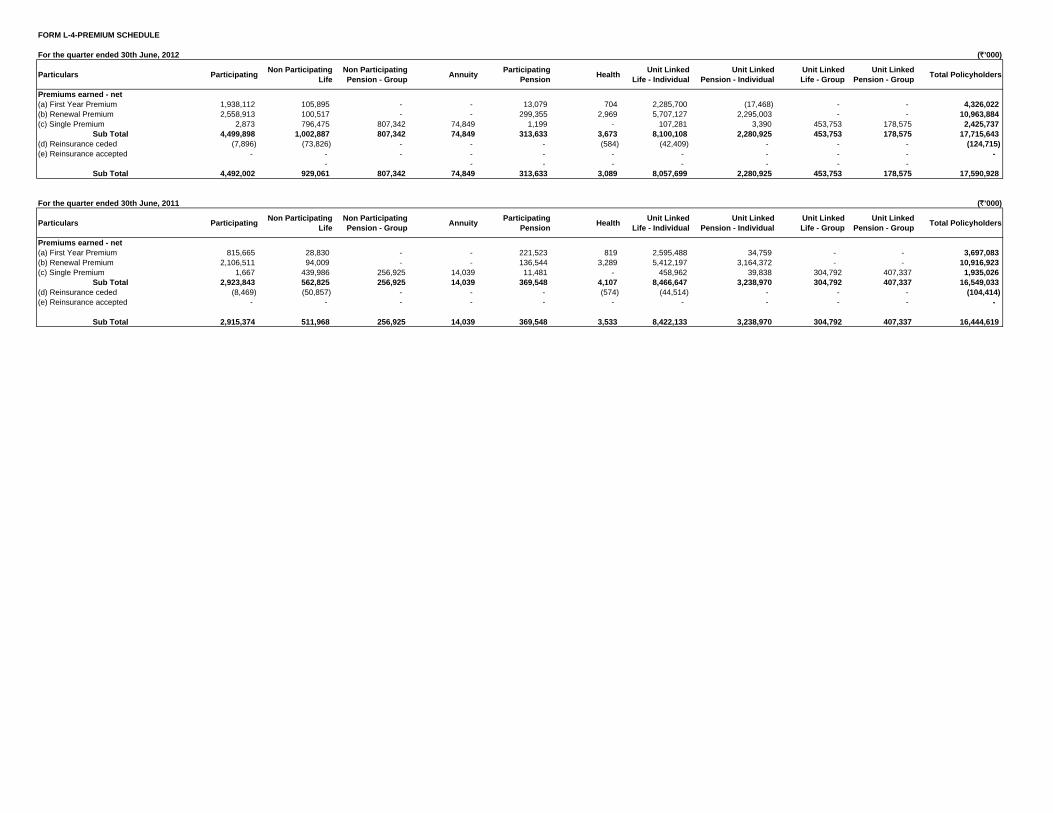
FORM L-4-PREMIUM SCHEDULE
For the quarter ended 30th June, 2012 (`’000)
Particulars ParticipatingNon Participating
LifeNon Participating Pension - Group
AnnuityParticipating
PensionHealth
Unit Linked Life - Individual
Unit Linked Pension - Individual
Unit Linked Life - Group
Unit Linked Pension - Group
Total Policyholders
Premiums earned - net(a) First Year Premium 1,938,112 105,895 - - 13,079 704 2,285,700 (17,468) - - 4,326,022 (b) Renewal Premium 2,558,913 100,517 - - 299,355 2,969 5,707,127 2,295,003 - - 10,963,884 (c) Single Premium 2,873 796,475 807,342 74,849 1,199 - 107,281 3,390 453,753 178,575 2,425,737
Sub Total 4,499,898 1,002,887 807,342 74,849 313,633 3,673 8,100,108 2,280,925 453,753 178,575 17,715,643 (d) Reinsurance ceded (7,896) (73,826) - - - (584) (42,409) - - - (124,715)(e) Reinsurance accepted - - - - - - - - - - -
- - - - - - - - Sub Total 4,492,002 929,061 807,342 74,849 313,633 3,089 8,057,699 2,280,925 453,753 178,575 17,590,928
For the quarter ended 30th June, 2011 (`’000)
Particulars ParticipatingNon Participating
LifeNon Participating Pension - Group
AnnuityParticipating
PensionHealth
Unit Linked Life - Individual
Unit Linked Pension - Individual
Unit Linked Life - Group
Unit Linked Pension - Group
Total Policyholders
Premiums earned - net(a) First Year Premium 815,665 28,830 - - 221,523 819 2,595,488 34,759 - - 3,697,083 (b) Renewal Premium 2,106,511 94,009 - - 136,544 3,289 5,412,197 3,164,372 - - 10,916,923 (c) Single Premium 1,667 439,986 256,925 14,039 11,481 - 458,962 39,838 304,792 407,337 1,935,026
Sub Total 2,923,843 562,825 256,925 14,039 369,548 4,107 8,466,647 3,238,970 304,792 407,337 16,549,033 (d) Reinsurance ceded (8,469) (50,857) - - - (574) (44,514) - - - (104,414)(e) Reinsurance accepted - - - - - - - - - - -
Sub Total 2,915,374 511,968 256,925 14,039 369,548 3,533 8,422,133 3,238,970 304,792 407,337 16,444,619
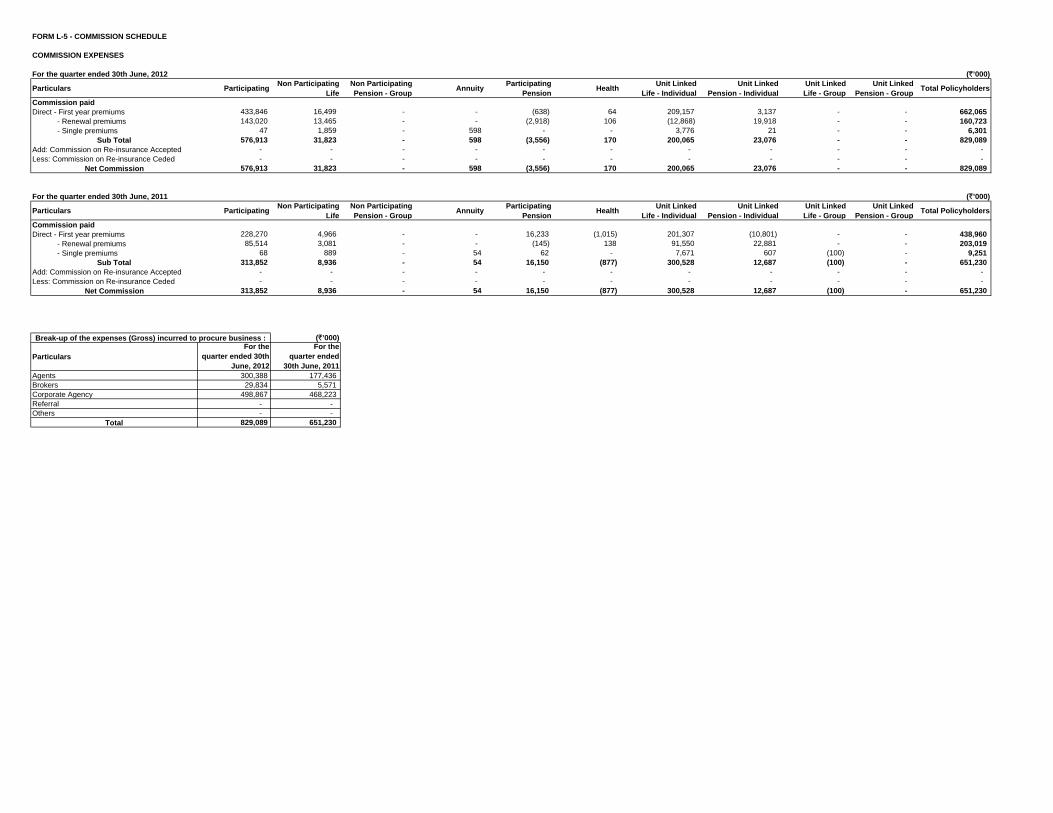
FORM L-5 - COMMISSION SCHEDULE
COMMISSION EXPENSES
For the quarter ended 30th June, 2012 (`’000)
Particulars ParticipatingNon Participating
LifeNon Participating Pension - Group
AnnuityParticipating
PensionHealth
Unit Linked Life - Individual
Unit Linked Pension - Individual
Unit Linked Life - Group
Unit LinkedPension - Group
Total Policyholders
Commission paidDirect - First year premiums 433,846 16,499 - - (638) 64 209,157 3,137 - - 662,065 - Renewal premiums 143,020 13,465 - - (2,918) 106 (12,868) 19,918 - - 160,723 - Single premiums 47 1,859 - 598 - - 3,776 21 - - 6,301
Sub Total 576,913 31,823 - 598 (3,556) 170 200,065 23,076 - - 829,089 Add: Commission on Re-insurance Accepted - - - - - - - - - - - Less: Commission on Re-insurance Ceded - - - - - - - - - - -
Net Commission 576,913 31,823 - 598 (3,556) 170 200,065 23,076 - - 829,089
For the quarter ended 30th June, 2011 (`’000)
Particulars ParticipatingNon Participating
LifeNon Participating Pension - Group
AnnuityParticipating
PensionHealth
Unit Linked Life - Individual
Unit Linked Pension - Individual
Unit Linked Life - Group
Unit LinkedPension - Group
Total Policyholders
Commission paidDirect - First year premiums 228,270 4,966 - - 16,233 (1,015) 201,307 (10,801) - - 438,960 - Renewal premiums 85,514 3,081 - - (145) 138 91,550 22,881 - - 203,019 - Single premiums 68 889 - 54 62 - 7,671 607 (100) - 9,251
Sub Total 313,852 8,936 - 54 16,150 (877) 300,528 12,687 (100) - 651,230 Add: Commission on Re-insurance Accepted - - - - - - - - - - - Less: Commission on Re-insurance Ceded - - - - - - - - - - -
Net Commission 313,852 8,936 - 54 16,150 (877) 300,528 12,687 (100) - 651,230
(`’000)
ParticularsFor the
quarter ended 30th June, 2012
For the quarter ended
30th June, 2011Agents 300,388 177,436 Brokers 29,834 5,571 Corporate Agency 498,867 468,223 Referral - - Others - -
Total 829,089 651,230
Break-up of the expenses (Gross) incurred to procure business :
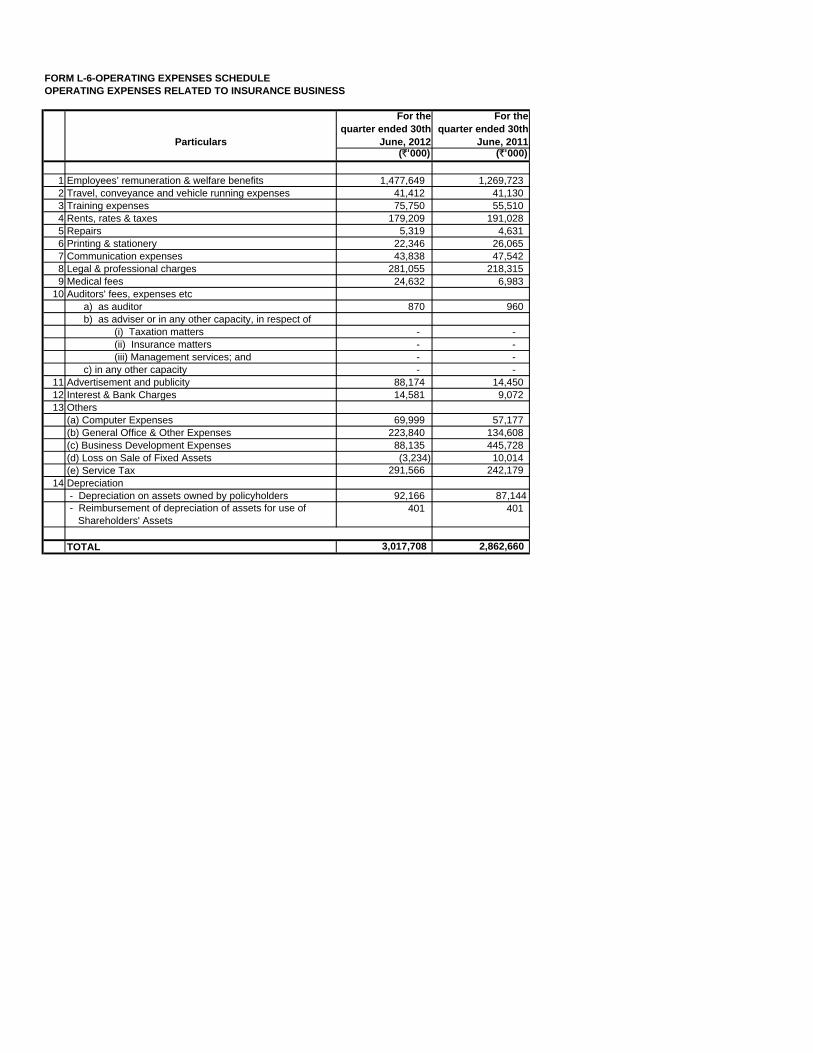
FORM L-6-OPERATING EXPENSES SCHEDULEOPERATING EXPENSES RELATED TO INSURANCE BUSINESS
Particulars
For the quarter ended 30th
June, 2012
For the quarter ended 30th
June, 2011(`'000) (`'000)
1 Employees’ remuneration & welfare benefits 1,477,649 1,269,723 2 Travel, conveyance and vehicle running expenses 41,412 41,130 3 Training expenses 75,750 55,510 4 Rents, rates & taxes 179,209 191,028 5 Repairs 5,319 4,631 6 Printing & stationery 22,346 26,065 7 Communication expenses 43,838 47,542 8 Legal & professional charges 281,055 218,315 9 Medical fees 24,632 6,983
10 Auditors' fees, expenses etc a) as auditor 870 960 b) as adviser or in any other capacity, in respect of (i) Taxation matters - - (ii) Insurance matters - - (iii) Management services; and - - c) in any other capacity - -
11 Advertisement and publicity 88,174 14,450 12 Interest & Bank Charges 14,581 9,072 13 Others
(a) Computer Expenses 69,999 57,177 (b) General Office & Other Expenses 223,840 134,608 (c) Business Development Expenses 88,135 445,728 (d) Loss on Sale of Fixed Assets (3,234) 10,014 (e) Service Tax 291,566 242,179
14 Depreciation - Depreciation on assets owned by policyholders 92,166 87,144 - Reimbursement of depreciation of assets for use of Shareholders' Assets
401 401
TOTAL 3,017,708 2,862,660
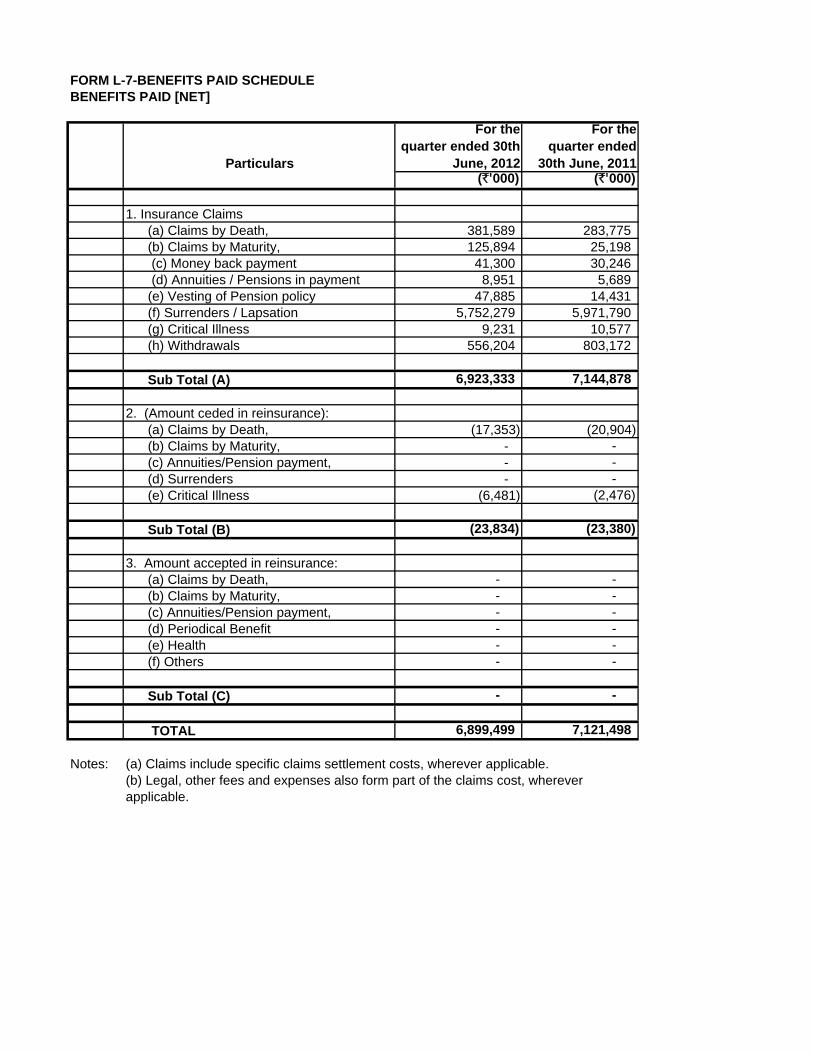
FORM L-7-BENEFITS PAID SCHEDULEBENEFITS PAID [NET]
Particulars
For the quarter ended 30th
June, 2012
For the quarter ended
30th June, 2011(`'000) (`'000)
1. Insurance Claims(a) Claims by Death, 381,589 283,775 (b) Claims by Maturity, 125,894 25,198
(c) Money back payment 41,300 30,246 (d) Annuities / Pensions in payment 8,951 5,689
(e) Vesting of Pension policy 47,885 14,431 (f) Surrenders / Lapsation 5,752,279 5,971,790 (g) Critical Illness 9,231 10,577 (h) Withdrawals 556,204 803,172
Sub Total (A) 6,923,333 7,144,878
2. (Amount ceded in reinsurance):(a) Claims by Death, (17,353) (20,904)(b) Claims by Maturity, - - (c) Annuities/Pension payment, - - (d) Surrenders - - (e) Critical Illness (6,481) (2,476)
Sub Total (B) (23,834) (23,380)
3. Amount accepted in reinsurance:(a) Claims by Death, - - (b) Claims by Maturity, - - (c) Annuities/Pension payment, - - (d) Periodical Benefit - - (e) Health - - (f) Others - -
Sub Total (C) - -
TOTAL 6,899,499 7,121,498
Notes: (a) Claims include specific claims settlement costs, wherever applicable.(b) Legal, other fees and expenses also form part of the claims cost, wherever applicable.
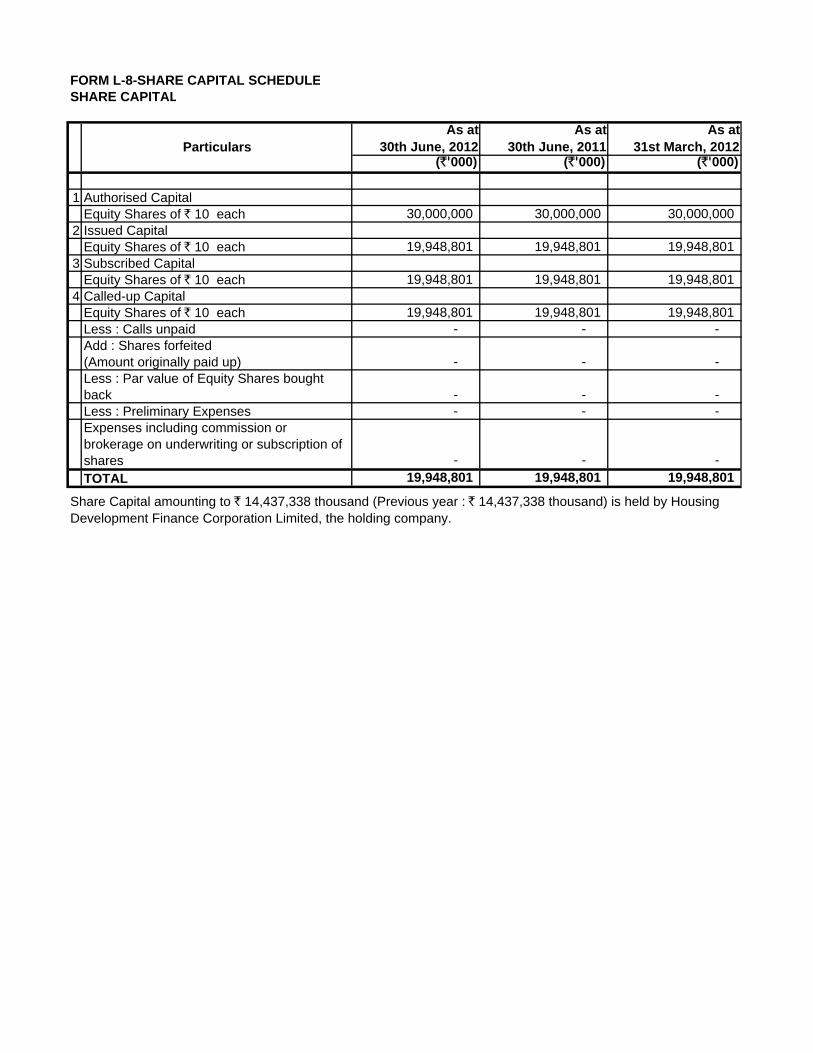
FORM L-8-SHARE CAPITAL SCHEDULESHARE CAPITAL
ParticularsAs at
30th June, 2012As at
30th June, 2011As at
31st March, 2012(`'000) (`'000) (`'000)
1 Authorised CapitalEquity Shares of ` 10 each 30,000,000 30,000,000 30,000,000
2 Issued CapitalEquity Shares of ` 10 each 19,948,801 19,948,801 19,948,801
3 Subscribed CapitalEquity Shares of ` 10 each 19,948,801 19,948,801 19,948,801
4 Called-up CapitalEquity Shares of ` 10 each 19,948,801 19,948,801 19,948,801 Less : Calls unpaid - - - Add : Shares forfeited (Amount originally paid up) - - - Less : Par value of Equity Shares bought back - - - Less : Preliminary Expenses - - - Expenses including commission or brokerage on underwriting or subscription of shares - - -
TOTAL 19,948,801 19,948,801 19,948,801
Share Capital amounting to ` 14,437,338 thousand (Previous year : ̀ 14,437,338 thousand) is held by Housing Development Finance Corporation Limited, the holding company.
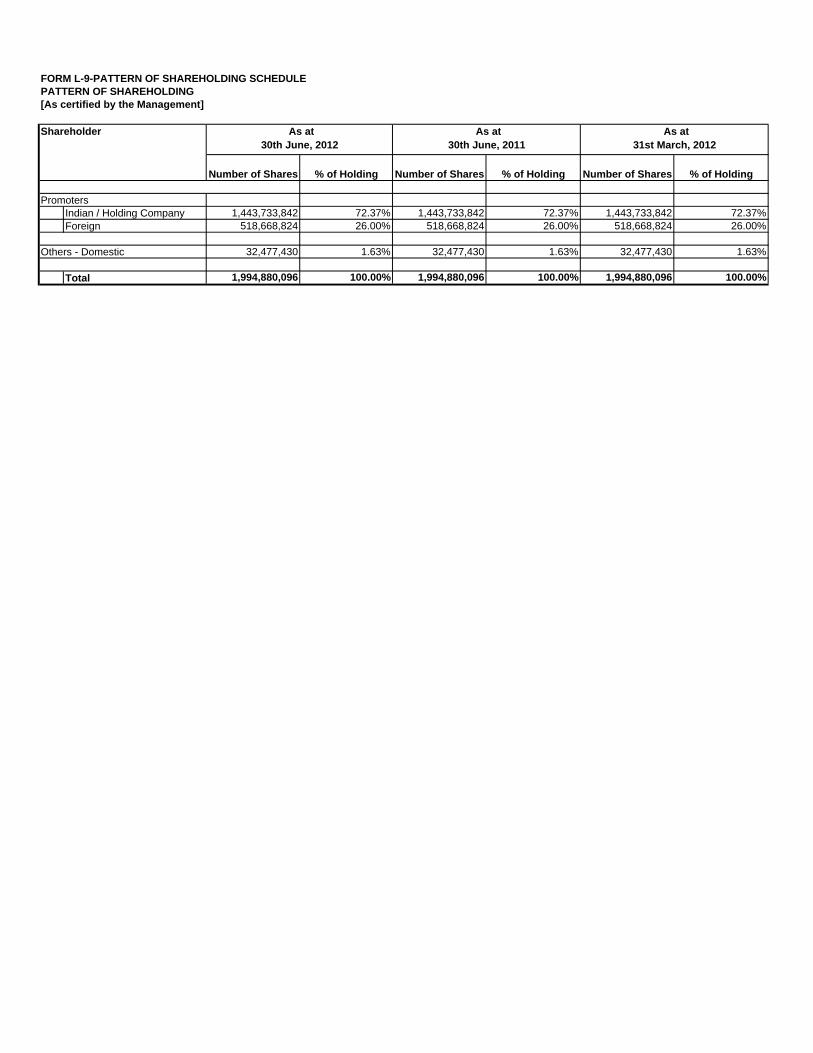
FORM L-9-PATTERN OF SHAREHOLDING SCHEDULEPATTERN OF SHAREHOLDING [As certified by the Management]
Number of Shares % of Holding Number of Shares % of Holding Number of Shares % of Holding
PromotersIndian / Holding Company 1,443,733,842 72.37% 1,443,733,842 72.37% 1,443,733,842 72.37%Foreign 518,668,824 26.00% 518,668,824 26.00% 518,668,824 26.00%
Others - Domestic 32,477,430 1.63% 32,477,430 1.63% 32,477,430 1.63%
Total 1,994,880,096 100.00% 1,994,880,096 100.00% 1,994,880,096 100.00%
Shareholder As at 30th June, 2012
As at 31st March, 2012
As at 30th June, 2011
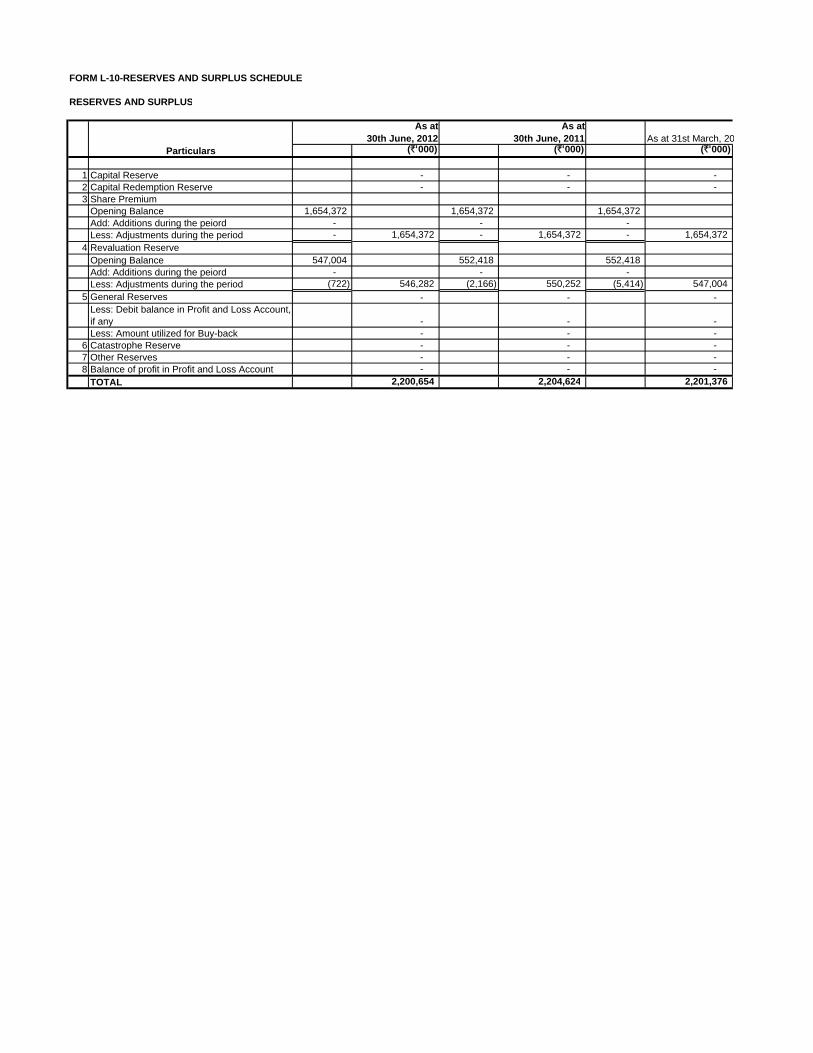
FORM L-10-RESERVES AND SURPLUS SCHEDULE
RESERVES AND SURPLUS
As at 30th June, 2012
As at 30th June, 2011 As at 31st March, 20
Particulars (`'000) (`'000) (`'000)
1 Capital Reserve - - - 2 Capital Redemption Reserve - - - 3 Share Premium
Opening Balance 1,654,372 1,654,372 1,654,372 Add: Additions during the peiord - - - Less: Adjustments during the period - 1,654,372 - 1,654,372 - 1,654,372
4 Revaluation Reserve Opening Balance 547,004 552,418 552,418 Add: Additions during the peiord - - - Less: Adjustments during the period (722) 546,282 (2,166) 550,252 (5,414) 547,004
5 General Reserves - - - Less: Debit balance in Profit and Loss Account, if any - - - Less: Amount utilized for Buy-back - - -
6 Catastrophe Reserve - - - 7 Other Reserves - - - 8 Balance of profit in Profit and Loss Account - - -
TOTAL 2,200,654 2,204,624 2,201,376
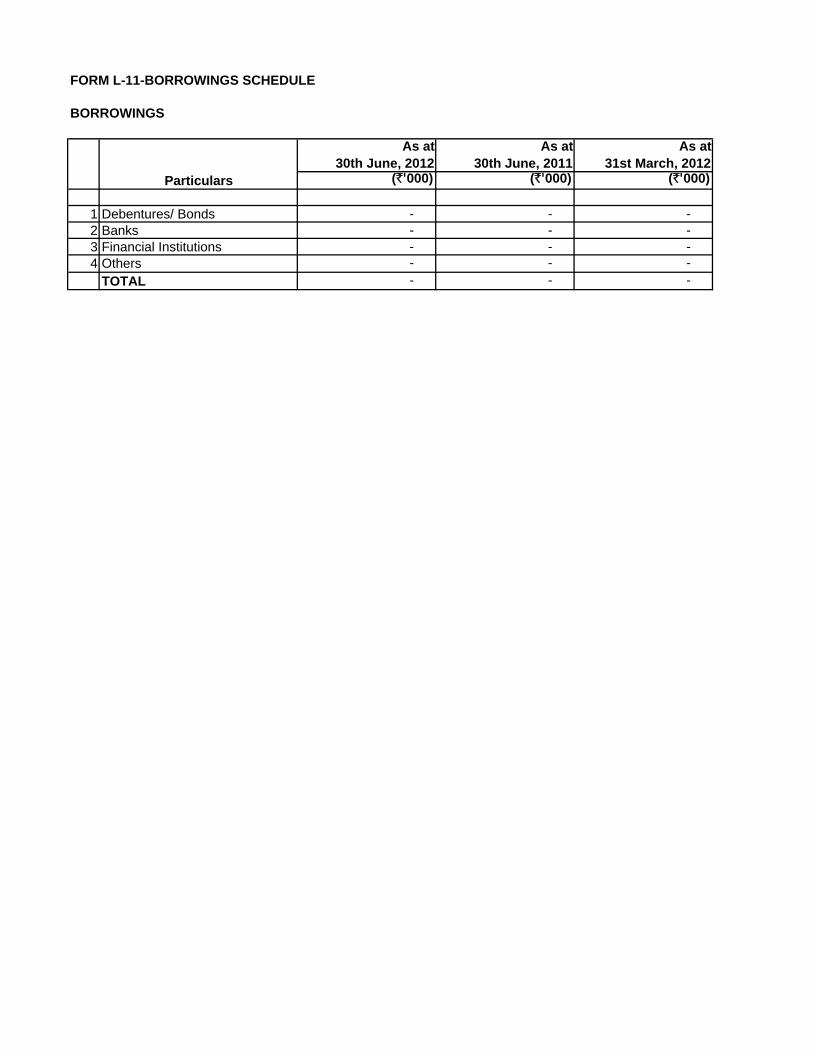
FORM L-11-BORROWINGS SCHEDULE
BORROWINGS
As at 30th June, 2012
As at 30th June, 2011
As at 31st March, 2012
Particulars (`'000) (`'000) (`'000)
1 Debentures/ Bonds - - - 2 Banks - - - 3 Financial Institutions - - - 4 Others - - -
TOTAL - - -
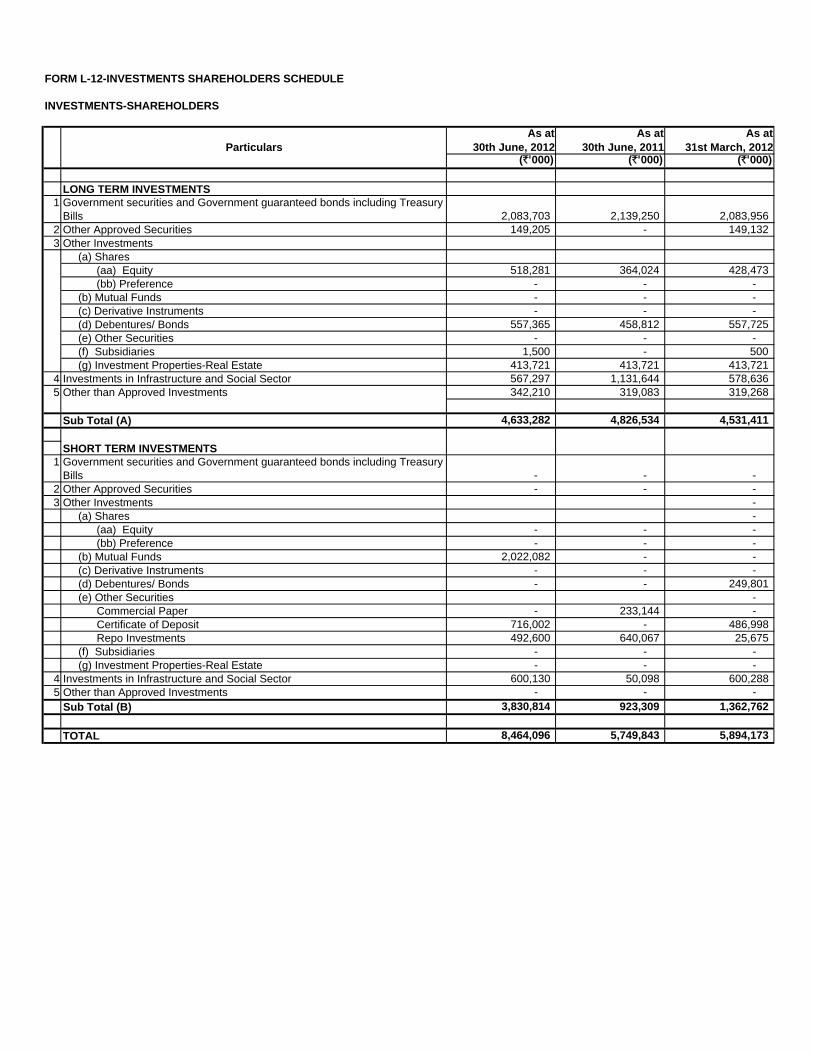
FORM L-12-INVESTMENTS SHAREHOLDERS SCHEDULE
INVESTMENTS-SHAREHOLDERS
ParticularsAs at
30th June, 2012As at
30th June, 2011As at
31st March, 2012(`'000) (`'000) (`'000)
LONG TERM INVESTMENTS1 Government securities and Government guaranteed bonds including Treasury
Bills 2,083,703 2,139,250 2,083,956 2 Other Approved Securities 149,205 - 149,132 3 Other Investments
(a) Shares (aa) Equity 518,281 364,024 428,473 (bb) Preference - - - (b) Mutual Funds - - - (c) Derivative Instruments - - - (d) Debentures/ Bonds 557,365 458,812 557,725 (e) Other Securities - - - (f) Subsidiaries 1,500 - 500 (g) Investment Properties-Real Estate 413,721 413,721 413,721
4 Investments in Infrastructure and Social Sector 567,297 1,131,644 578,636 5 Other than Approved Investments 342,210 319,083 319,268
Sub Total (A) 4,633,282 4,826,534 4,531,411
SHORT TERM INVESTMENTS1 Government securities and Government guaranteed bonds including Treasury
Bills - - - 2 Other Approved Securities - - - 3 Other Investments -
(a) Shares - (aa) Equity - - - (bb) Preference - - - (b) Mutual Funds 2,022,082 - - (c) Derivative Instruments - - - (d) Debentures/ Bonds - - 249,801 (e) Other Securities - Commercial Paper - 233,144 - Certificate of Deposit 716,002 - 486,998 Repo Investments 492,600 640,067 25,675 (f) Subsidiaries - - - (g) Investment Properties-Real Estate - - -
4 Investments in Infrastructure and Social Sector 600,130 50,098 600,288 5 Other than Approved Investments - - -
Sub Total (B) 3,830,814 923,309 1,362,762
TOTAL 8,464,096 5,749,843 5,894,173
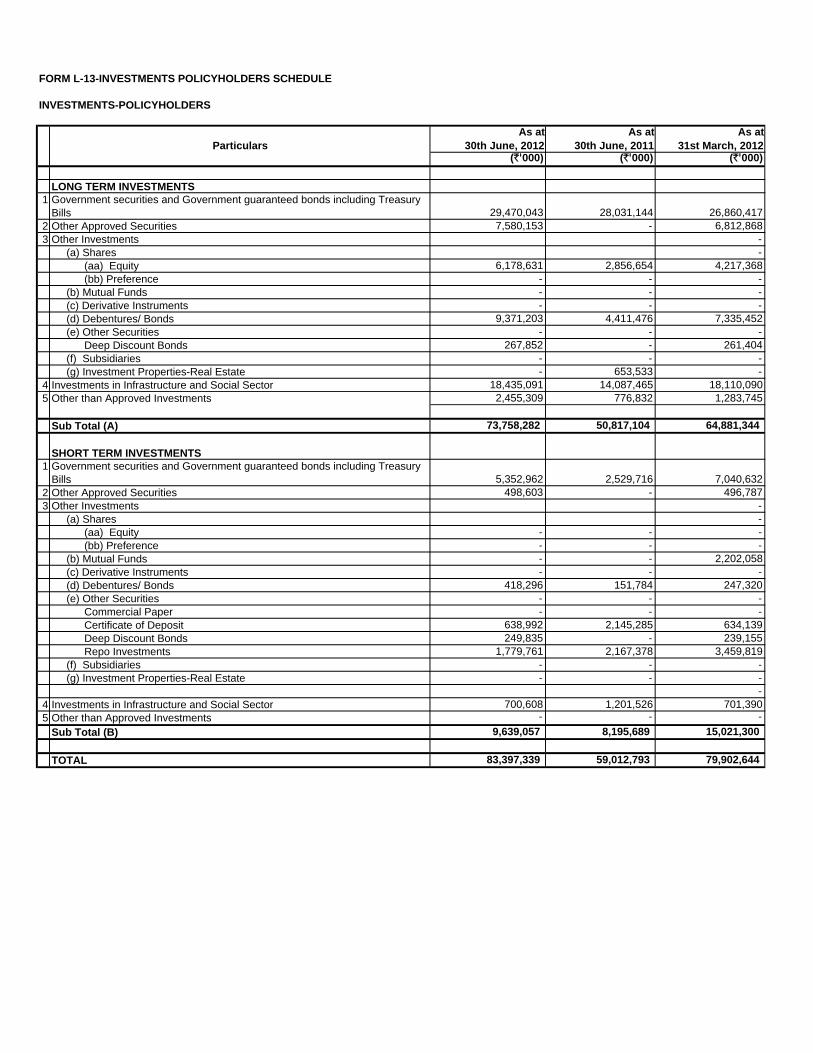
FORM L-13-INVESTMENTS POLICYHOLDERS SCHEDULE
INVESTMENTS-POLICYHOLDERS
ParticularsAs at
30th June, 2012As at
30th June, 2011As at
31st March, 2012(`'000) (`'000) (`'000)
LONG TERM INVESTMENTS1 Government securities and Government guaranteed bonds including Treasury
Bills 29,470,043 28,031,144 26,860,417 2 Other Approved Securities 7,580,153 - 6,812,868 3 Other Investments -
(a) Shares - (aa) Equity 6,178,631 2,856,654 4,217,368 (bb) Preference - - - (b) Mutual Funds - - - (c) Derivative Instruments - - - (d) Debentures/ Bonds 9,371,203 4,411,476 7,335,452 (e) Other Securities - - - Deep Discount Bonds 267,852 - 261,404 (f) Subsidiaries - - - (g) Investment Properties-Real Estate - 653,533 -
4 Investments in Infrastructure and Social Sector 18,435,091 14,087,465 18,110,090 5 Other than Approved Investments 2,455,309 776,832 1,283,745
Sub Total (A) 73,758,282 50,817,104 64,881,344
SHORT TERM INVESTMENTS1 Government securities and Government guaranteed bonds including Treasury
Bills 5,352,962 2,529,716 7,040,632 2 Other Approved Securities 498,603 - 496,787 3 Other Investments -
(a) Shares - (aa) Equity - - - (bb) Preference - - - (b) Mutual Funds - - 2,202,058 (c) Derivative Instruments - - - (d) Debentures/ Bonds 418,296 151,784 247,320 (e) Other Securities - - - Commercial Paper - - - Certificate of Deposit 638,992 2,145,285 634,139 Deep Discount Bonds 249,835 - 239,155 Repo Investments 1,779,761 2,167,378 3,459,819 (f) Subsidiaries - - - (g) Investment Properties-Real Estate - - -
- 4 Investments in Infrastructure and Social Sector 700,608 1,201,526 701,390 5 Other than Approved Investments - - -
Sub Total (B) 9,639,057 8,195,689 15,021,300
TOTAL 83,397,339 59,012,793 79,902,644
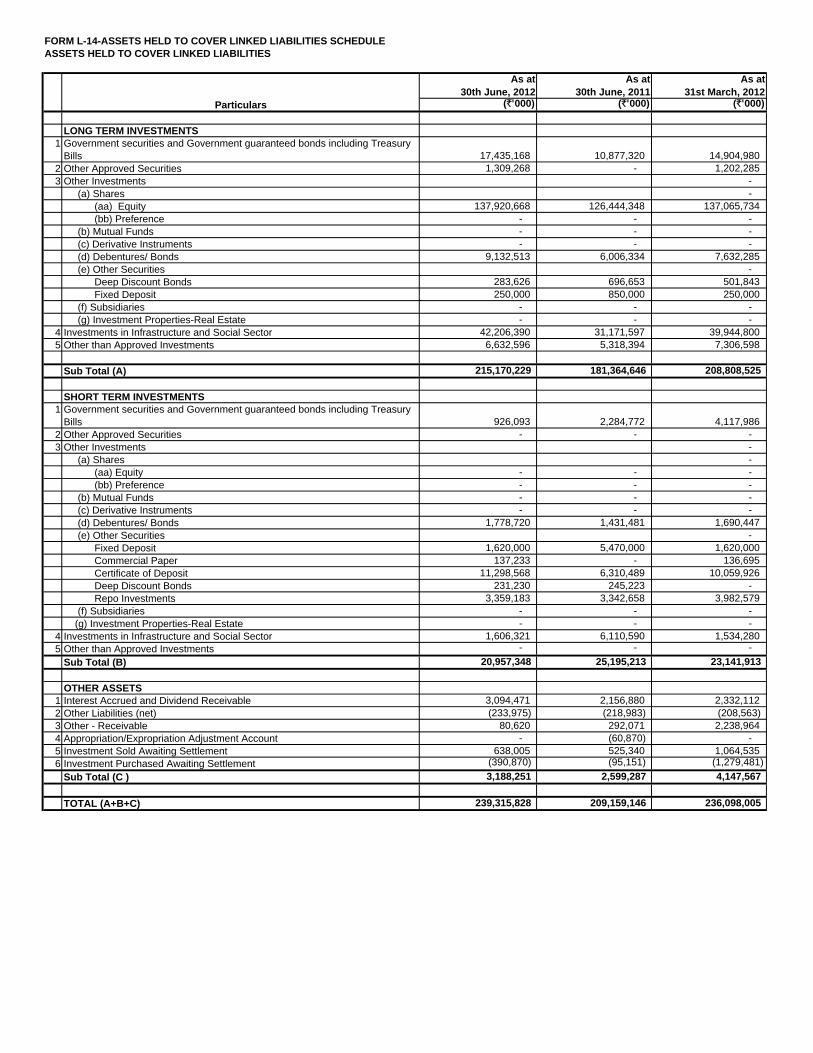
FORM L-14-ASSETS HELD TO COVER LINKED LIABILITIES SCHEDULEASSETS HELD TO COVER LINKED LIABILITIES
As at 30th June, 2012
As at 30th June, 2011
As at 31st March, 2012
Particulars (`'000) (`'000) (`'000)
LONG TERM INVESTMENTS1 Government securities and Government guaranteed bonds including Treasury
Bills 17,435,168 10,877,320 14,904,980 2 Other Approved Securities 1,309,268 - 1,202,285 3 Other Investments -
(a) Shares - (aa) Equity 137,920,668 126,444,348 137,065,734 (bb) Preference - - - (b) Mutual Funds - - - (c) Derivative Instruments - - - (d) Debentures/ Bonds 9,132,513 6,006,334 7,632,285 (e) Other Securities - Deep Discount Bonds 283,626 696,653 501,843 Fixed Deposit 250,000 850,000 250,000 (f) Subsidiaries - - - (g) Investment Properties-Real Estate - - -
4 Investments in Infrastructure and Social Sector 42,206,390 31,171,597 39,944,800 5 Other than Approved Investments 6,632,596 5,318,394 7,306,598
Sub Total (A) 215,170,229 181,364,646 208,808,525
SHORT TERM INVESTMENTS1 Government securities and Government guaranteed bonds including Treasury
Bills 926,093 2,284,772 4,117,986 2 Other Approved Securities - - - 3 Other Investments -
(a) Shares - (aa) Equity - - - (bb) Preference - - - (b) Mutual Funds - - - (c) Derivative Instruments - - - (d) Debentures/ Bonds 1,778,720 1,431,481 1,690,447 (e) Other Securities - Fixed Deposit 1,620,000 5,470,000 1,620,000 Commercial Paper 137,233 - 136,695 Certificate of Deposit 11,298,568 6,310,489 10,059,926 Deep Discount Bonds 231,230 245,223 - Repo Investments 3,359,183 3,342,658 3,982,579 (f) Subsidiaries - - - (g) Investment Properties-Real Estate - - -
4 Investments in Infrastructure and Social Sector 1,606,321 6,110,590 1,534,280 5 Other than Approved Investments - - -
Sub Total (B) 20,957,348 25,195,213 23,141,913
OTHER ASSETS1 Interest Accrued and Dividend Receivable 3,094,471 2,156,880 2,332,112 2 Other Liabilities (net) (233,975) (218,983) (208,563)3 Other - Receivable 80,620 292,071 2,238,964 4 Appropriation/Expropriation Adjustment Account - (60,870) - 5 Investment Sold Awaiting Settlement 638,005 525,340 1,064,535 6 Investment Purchased Awaiting Settlement (390,870) (95,151) (1,279,481)
Sub Total (C ) 3,188,251 2,599,287 4,147,567
TOTAL (A+B+C) 239,315,828 209,159,146 236,098,005
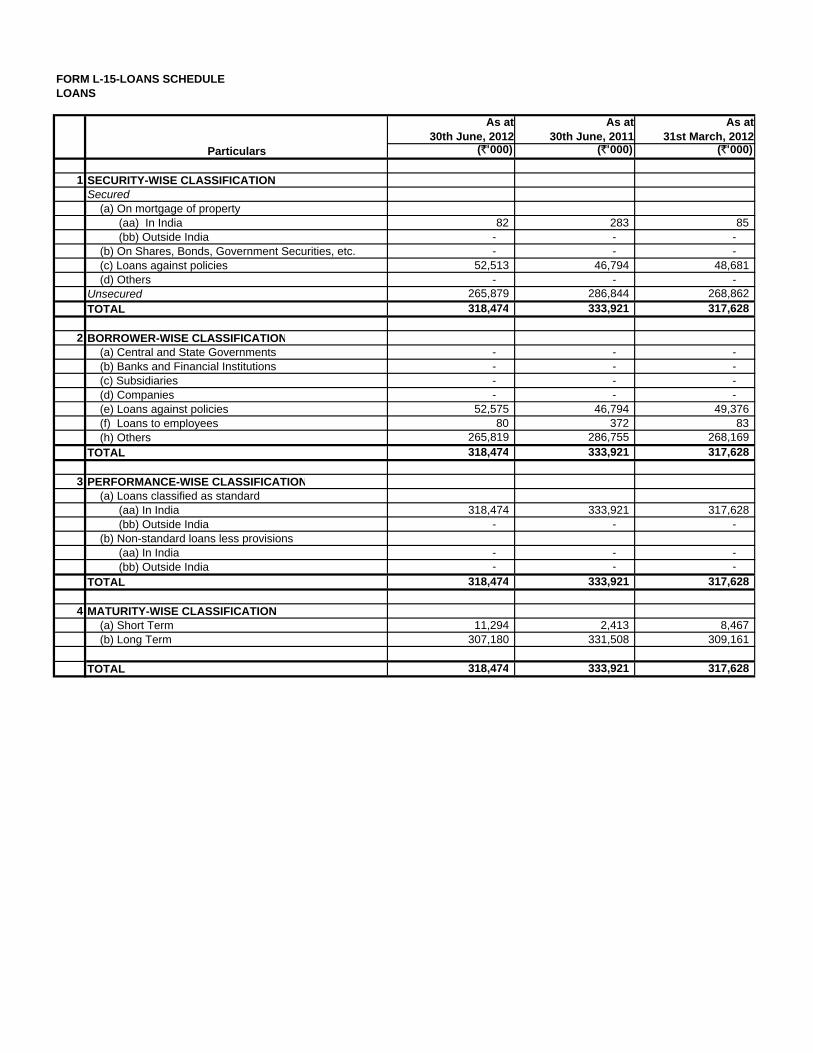
FORM L-15-LOANS SCHEDULELOANS
As at 30th June, 2012
As at 30th June, 2011
As at 31st March, 2012
Particulars (`'000) (`'000) (`'000)
1 SECURITY-WISE CLASSIFICATIONSecured (a) On mortgage of property (aa) In India 82 283 85 (bb) Outside India - - - (b) On Shares, Bonds, Government Securities, etc. - - - (c) Loans against policies 52,513 46,794 48,681 (d) Others - - - Unsecured 265,879 286,844 268,862 TOTAL 318,474 333,921 317,628
2 BORROWER-WISE CLASSIFICATION (a) Central and State Governments - - - (b) Banks and Financial Institutions - - - (c) Subsidiaries - - - (d) Companies - - - (e) Loans against policies 52,575 46,794 49,376 (f) Loans to employees 80 372 83 (h) Others 265,819 286,755 268,169 TOTAL 318,474 333,921 317,628
3 PERFORMANCE-WISE CLASSIFICATION (a) Loans classified as standard (aa) In India 318,474 333,921 317,628 (bb) Outside India - - - (b) Non-standard loans less provisions (aa) In India - - - (bb) Outside India - - - TOTAL 318,474 333,921 317,628
4 MATURITY-WISE CLASSIFICATION (a) Short Term 11,294 2,413 8,467 (b) Long Term 307,180 331,508 309,161
TOTAL 318,474 333,921 317,628
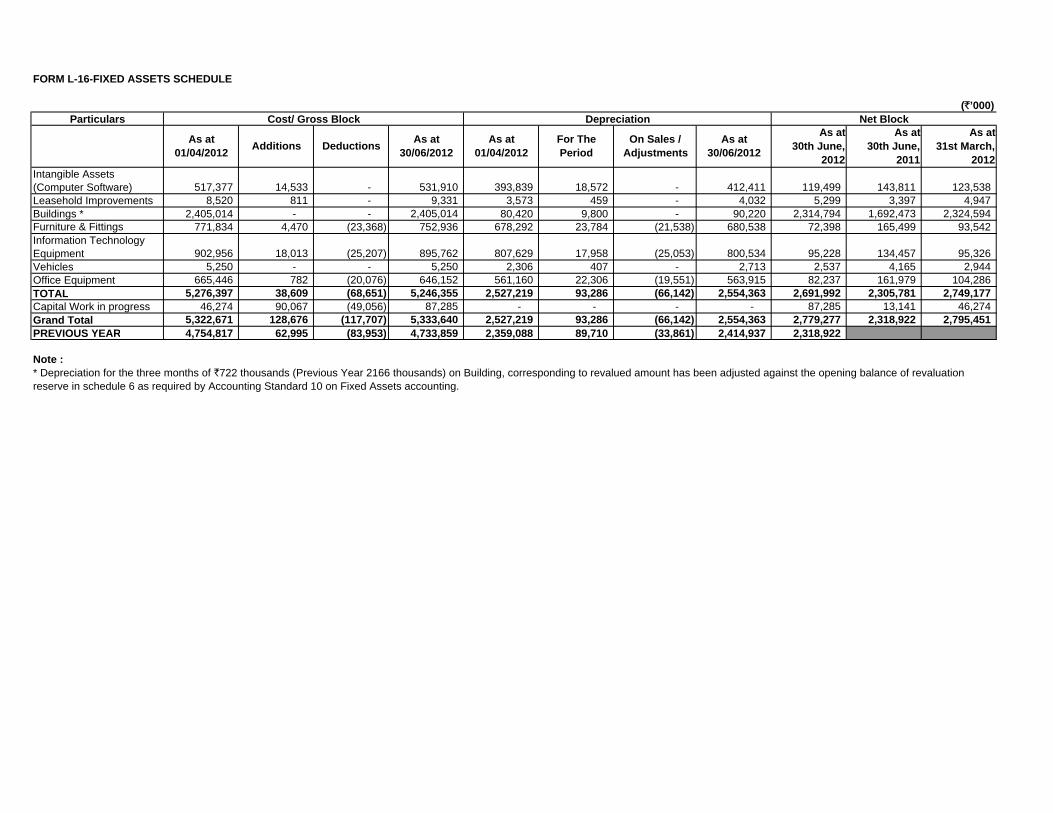
FORM L-16-FIXED ASSETS SCHEDULE
(`’000)Particulars
Intangible Assets (Computer Software) 517,377 14,533 - 531,910 393,839 18,572 - 412,411 119,499 143,811 123,538 Leasehold Improvements 8,520 811 - 9,331 3,573 459 - 4,032 5,299 3,397 4,947 Buildings * 2,405,014 - - 2,405,014 80,420 9,800 - 90,220 2,314,794 1,692,473 2,324,594 Furniture & Fittings 771,834 4,470 (23,368) 752,936 678,292 23,784 (21,538) 680,538 72,398 165,499 93,542 Information Technology Equipment 902,956 18,013 (25,207) 895,762 807,629 17,958 (25,053) 800,534 95,228 134,457 95,326 Vehicles 5,250 - - 5,250 2,306 407 - 2,713 2,537 4,165 2,944 Office Equipment 665,446 782 (20,076) 646,152 561,160 22,306 (19,551) 563,915 82,237 161,979 104,286 TOTAL 5,276,397 38,609 (68,651) 5,246,355 2,527,219 93,286 (66,142) 2,554,363 2,691,992 2,305,781 2,749,177 Capital Work in progress 46,274 90,067 (49,056) 87,285 - - - - 87,285 13,141 46,274 Grand Total 5,322,671 128,676 (117,707) 5,333,640 2,527,219 93,286 (66,142) 2,554,363 2,779,277 2,318,922 2,795,451 PREVIOUS YEAR 4,754,817 62,995 (83,953) 4,733,859 2,359,088 89,710 (33,861) 2,414,937 2,318,922
Note :
Net BlockAs at
30th June, 2012
Cost/ Gross Block Depreciation
For The Period
As at 30/06/2012
On Sales / Adjustments
As at 30th June,
2011
* Depreciation for the three months of `722 thousands (Previous Year 2166 thousands) on Building, corresponding to revalued amount has been adjusted against the opening balance of revaluation reserve in schedule 6 as required by Accounting Standard 10 on Fixed Assets accounting.
As at 30/06/2012
As at 01/04/2012
As at 31st March,
2012
As at 01/04/2012
Additions Deductions
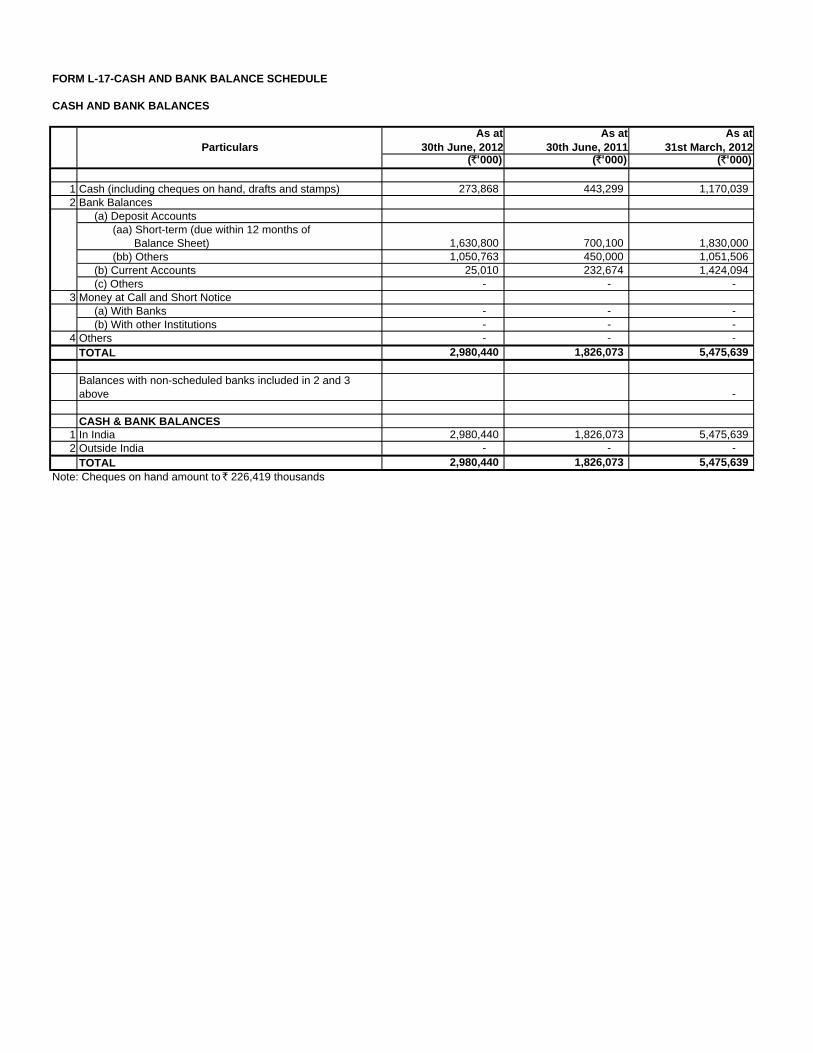
FORM L-17-CASH AND BANK BALANCE SCHEDULE
CASH AND BANK BALANCES
ParticularsAs at
30th June, 2012As at
30th June, 2011As at
31st March, 2012(`'000) (`'000) (`'000)
1 Cash (including cheques on hand, drafts and stamps) 273,868 443,299 1,170,039 2 Bank Balances
(a) Deposit Accounts (aa) Short-term (due within 12 months of Balance Sheet) 1,630,800 700,100 1,830,000 (bb) Others 1,050,763 450,000 1,051,506 (b) Current Accounts 25,010 232,674 1,424,094 (c) Others - - -
3 Money at Call and Short Notice (a) With Banks - - - (b) With other Institutions - - -
4 Others - - - TOTAL 2,980,440 1,826,073 5,475,639
Balances with non-scheduled banks included in 2 and 3 above -
CASH & BANK BALANCES1 In India 2,980,440 1,826,073 5,475,639 2 Outside India - - -
TOTAL 2,980,440 1,826,073 5,475,639 Note: Cheques on hand amount to ̀ 226,419 thousands
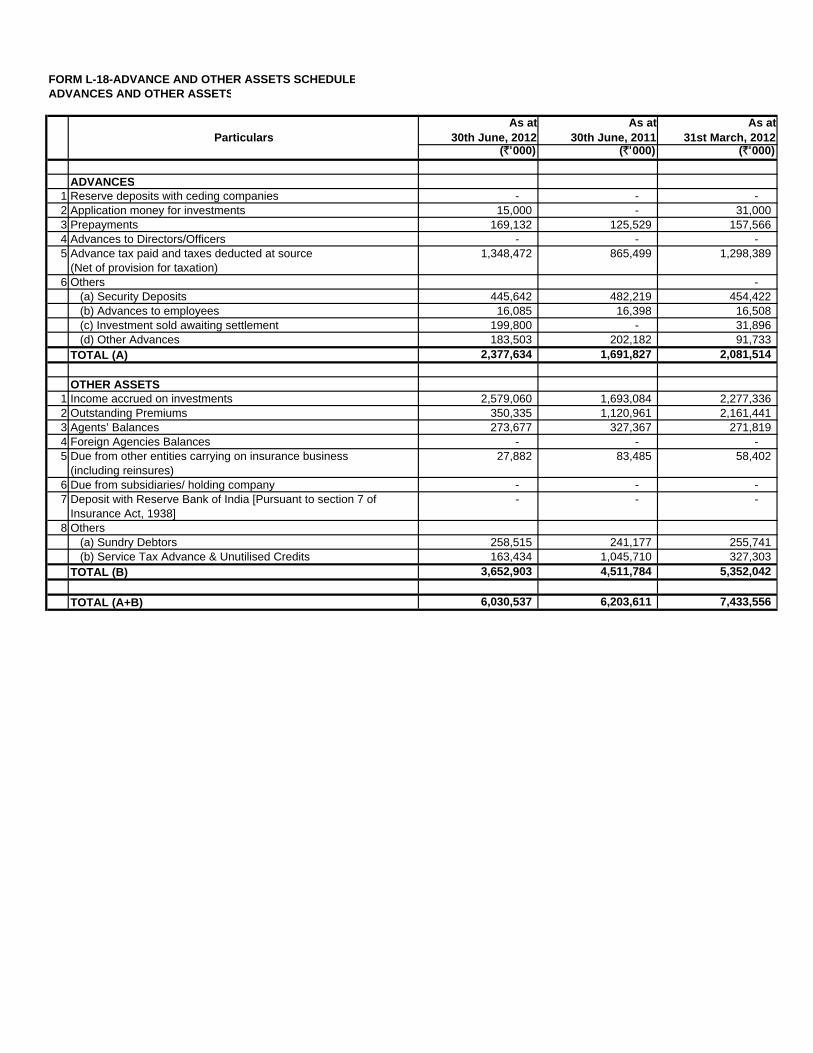
FORM L-18-ADVANCE AND OTHER ASSETS SCHEDULEADVANCES AND OTHER ASSETS
ParticularsAs at
30th June, 2012As at
30th June, 2011As at
31st March, 2012(`'000) (`'000) (`'000)
ADVANCES1 Reserve deposits with ceding companies - - - 2 Application money for investments 15,000 - 31,000 3 Prepayments 169,132 125,529 157,566 4 Advances to Directors/Officers - - - 5 Advance tax paid and taxes deducted at source
(Net of provision for taxation) 1,348,472 865,499 1,298,389
6 Others - (a) Security Deposits 445,642 482,219 454,422 (b) Advances to employees 16,085 16,398 16,508 (c) Investment sold awaiting settlement 199,800 - 31,896 (d) Other Advances 183,503 202,182 91,733 TOTAL (A) 2,377,634 1,691,827 2,081,514
OTHER ASSETS1 Income accrued on investments 2,579,060 1,693,084 2,277,336 2 Outstanding Premiums 350,335 1,120,961 2,161,441 3 Agents’ Balances 273,677 327,367 271,819 4 Foreign Agencies Balances - - - 5 Due from other entities carrying on insurance business
(including reinsures)27,882 83,485 58,402
6 Due from subsidiaries/ holding company - - - 7 Deposit with Reserve Bank of India [Pursuant to section 7 of
Insurance Act, 1938]- - -
8 Others (a) Sundry Debtors 258,515 241,177 255,741 (b) Service Tax Advance & Unutilised Credits 163,434 1,045,710 327,303 TOTAL (B) 3,652,903 4,511,784 5,352,042
TOTAL (A+B) 6,030,537 6,203,611 7,433,556
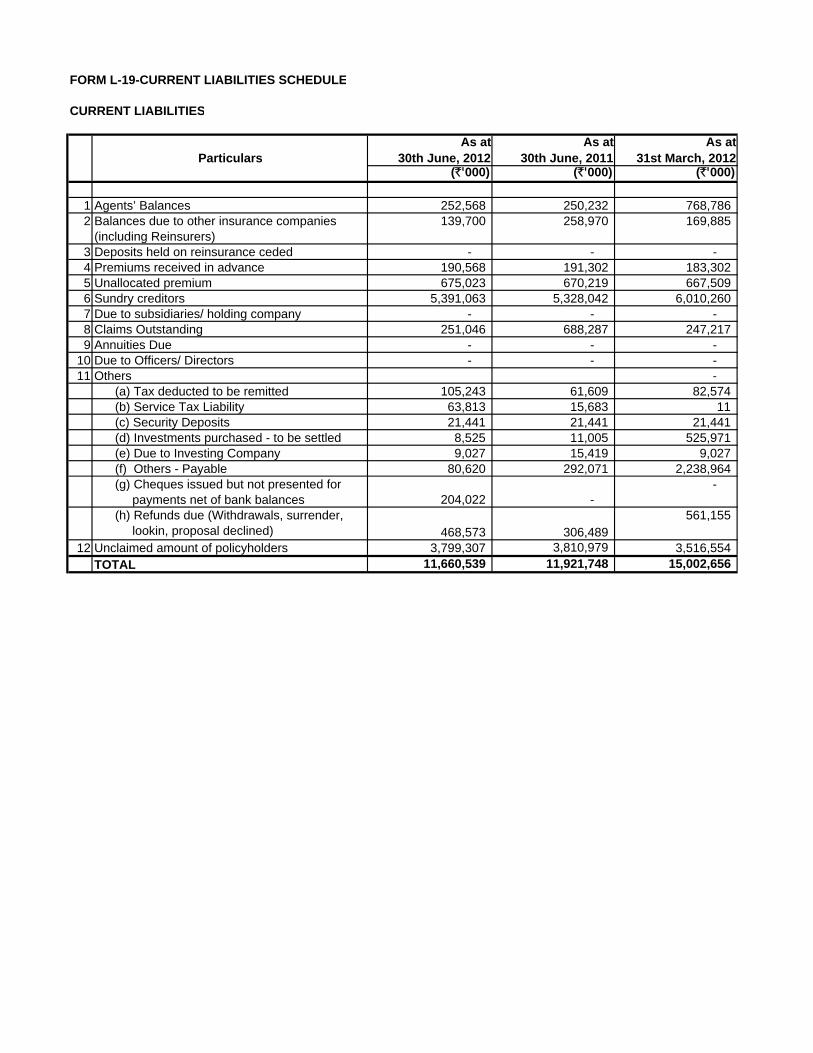
FORM L-19-CURRENT LIABILITIES SCHEDULE
CURRENT LIABILITIES
ParticularsAs at
30th June, 2012As at
30th June, 2011As at
31st March, 2012(`'000) (`'000) (`'000)
1 Agents’ Balances 252,568 250,232 768,786 2 Balances due to other insurance companies
(including Reinsurers)139,700 258,970 169,885
3 Deposits held on reinsurance ceded - - - 4 Premiums received in advance 190,568 191,302 183,302 5 Unallocated premium 675,023 670,219 667,509 6 Sundry creditors 5,391,063 5,328,042 6,010,260 7 Due to subsidiaries/ holding company - - - 8 Claims Outstanding 251,046 688,287 247,217 9 Annuities Due - - -
10 Due to Officers/ Directors - - - 11 Others -
(a) Tax deducted to be remitted 105,243 61,609 82,574 (b) Service Tax Liability 63,813 15,683 11 (c) Security Deposits 21,441 21,441 21,441 (d) Investments purchased - to be settled 8,525 11,005 525,971 (e) Due to Investing Company 9,027 15,419 9,027 (f) Others - Payable 80,620 292,071 2,238,964 (g) Cheques issued but not presented for payments net of bank balances 204,022 -
-
(h) Refunds due (Withdrawals, surrender, lookin, proposal declined) 468,573 306,489
561,155
12 Unclaimed amount of policyholders 3,799,307 3,810,979 3,516,554 TOTAL 11,660,539 11,921,748 15,002,656
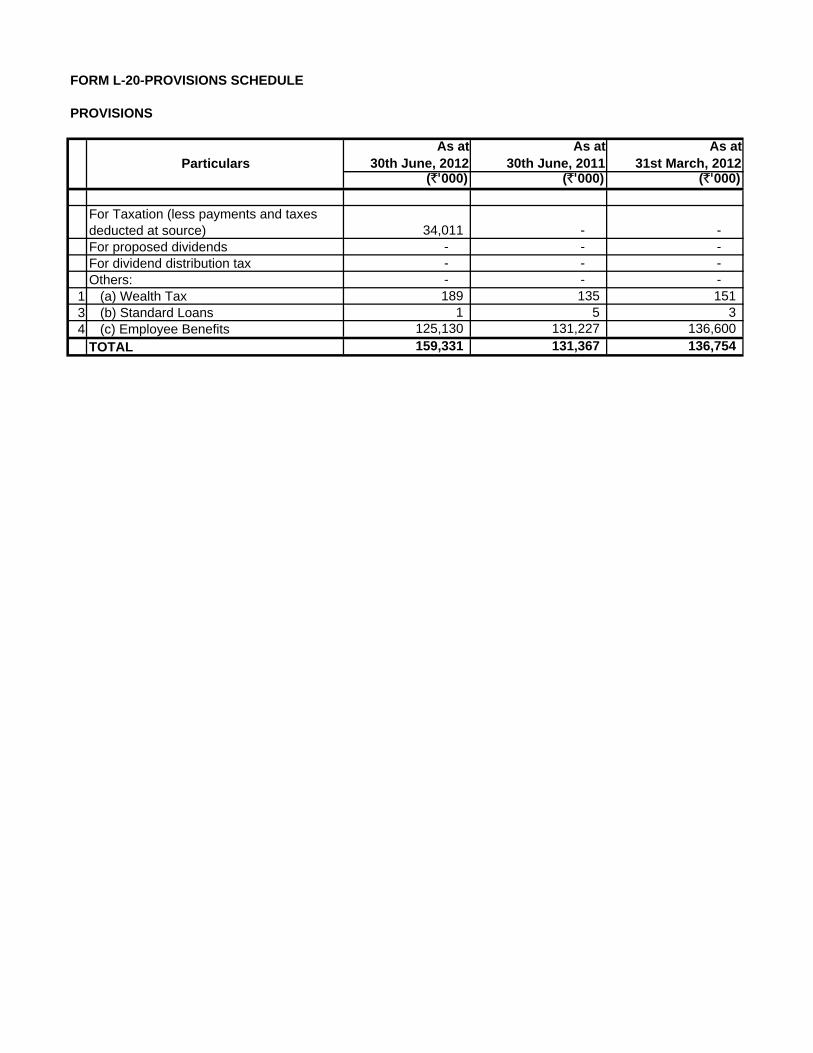
FORM L-20-PROVISIONS SCHEDULE
PROVISIONS
ParticularsAs at
30th June, 2012As at
30th June, 2011As at
31st March, 2012(`'000) (`'000) (`'000)
For Taxation (less payments and taxes deducted at source) 34,011 - - For proposed dividends - - - For dividend distribution tax - - - Others: - - -
1 (a) Wealth Tax 189 135 151 3 (b) Standard Loans 1 5 3 4 (c) Employee Benefits 125,130 131,227 136,600
TOTAL 159,331 131,367 136,754
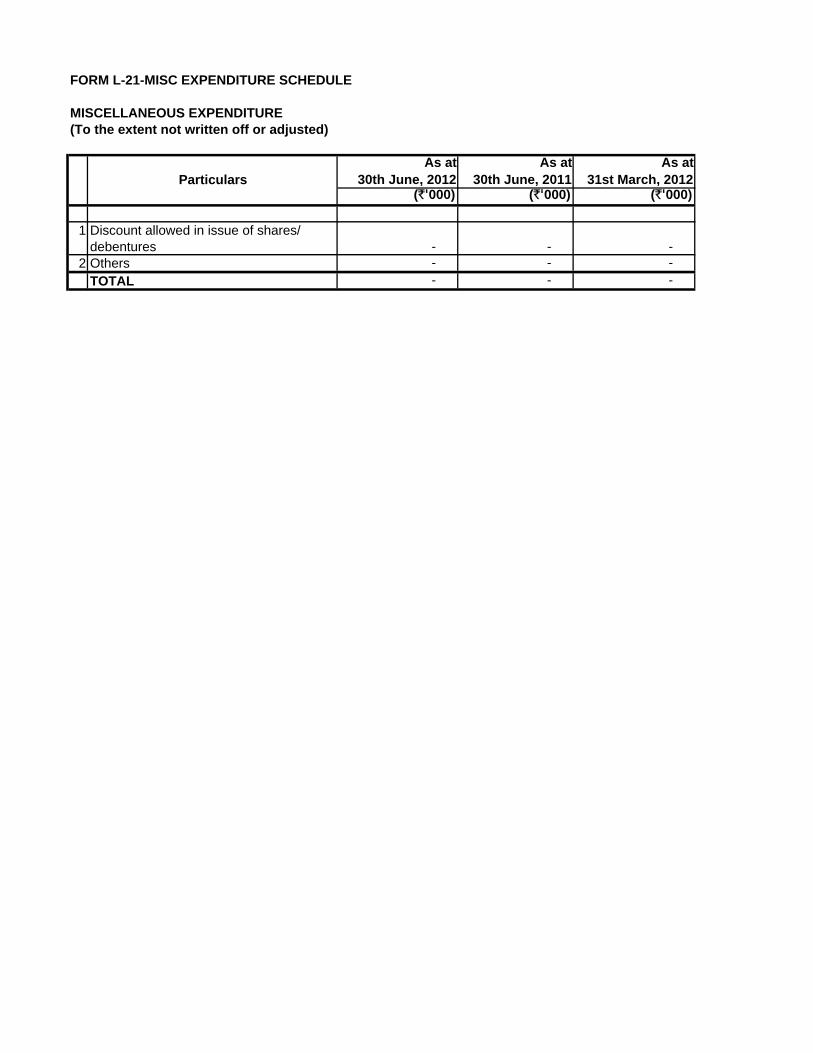
FORM L-21-MISC EXPENDITURE SCHEDULE
MISCELLANEOUS EXPENDITURE(To the extent not written off or adjusted)
ParticularsAs at
30th June, 2012As at
30th June, 2011As at
31st March, 2012(`'000) (`'000) (`'000)
1 Discount allowed in issue of shares/ debentures - - -
2 Others - - -
TOTAL - - -
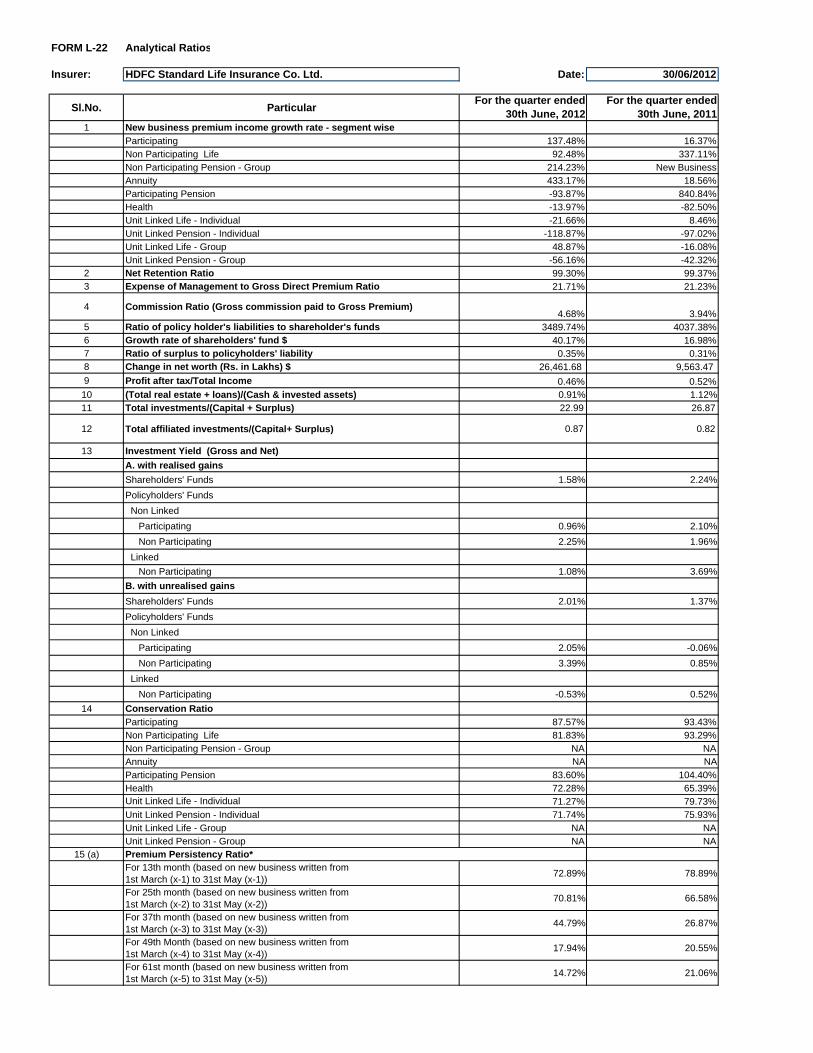
FORM L-22 Analytical Ratios
Insurer: HDFC Standard Life Insurance Co. Ltd. Date: 30/06/2012
Sl.No. ParticularFor the quarter ended
30th June, 2012For the quarter ended
30th June, 20111 New business premium income growth rate - segment wise
Participating 137.48% 16.37%Non Participating Life 92.48% 337.11%Non Participating Pension - Group 214.23% New BusinessAnnuity 433.17% 18.56%Participating Pension -93.87% 840.84%Health -13.97% -82.50%Unit Linked Life - Individual -21.66% 8.46%Unit Linked Pension - Individual -118.87% -97.02%Unit Linked Life - Group 48.87% -16.08%Unit Linked Pension - Group -56.16% -42.32%
2 Net Retention Ratio 99.30% 99.37%3 Expense of Management to Gross Direct Premium Ratio 21.71% 21.23%
4 Commission Ratio (Gross commission paid to Gross Premium)4.68% 3.94%
5 Ratio of policy holder's liabilities to shareholder's funds 3489.74% 4037.38%6 Growth rate of shareholders' fund $ 40.17% 16.98%7 Ratio of surplus to policyholders' liability 0.35% 0.31%8 Change in net worth (Rs. in Lakhs) $ 26,461.68 9,563.47
9 Profit after tax/Total Income 0.46% 0.52%10 (Total real estate + loans)/(Cash & invested assets) 0.91% 1.12%11 Total investments/(Capital + Surplus) 22.99 26.87
12 Total affiliated investments/(Capital+ Surplus) 0.87 0.82
13 Investment Yield (Gross and Net)
A. with realised gains
Shareholders' Funds 1.58% 2.24%
Policyholders' Funds
Non Linked
Participating 0.96% 2.10%
Non Participating 2.25% 1.96%
Linked
Non Participating 1.08% 3.69%
B. with unrealised gains
Shareholders' Funds 2.01% 1.37%
Policyholders' Funds
Non Linked
Participating 2.05% -0.06%
Non Participating 3.39% 0.85%
Linked
Non Participating -0.53% 0.52%
14 Conservation Ratio
Participating 87.57% 93.43%Non Participating Life 81.83% 93.29%Non Participating Pension - Group NA NAAnnuity NA NA
Participating Pension 83.60% 104.40%Health 72.28% 65.39%Unit Linked Life - Individual 71.27% 79.73%Unit Linked Pension - Individual 71.74% 75.93%Unit Linked Life - Group NA NAUnit Linked Pension - Group NA NA
15 (a) Premium Persistency Ratio*For 13th month (based on new business written from 1st March (x-1) to 31st May (x-1))
72.89% 78.89%
For 25th month (based on new business written from 1st March (x-2) to 31st May (x-2))
70.81% 66.58%
For 37th month (based on new business written from 1st March (x-3) to 31st May (x-3))
44.79% 26.87%
For 49th Month (based on new business written from 1st March (x-4) to 31st May (x-4))
17.94% 20.55%
For 61st month (based on new business written from 1st March (x-5) to 31st May (x-5))
14.72% 21.06%
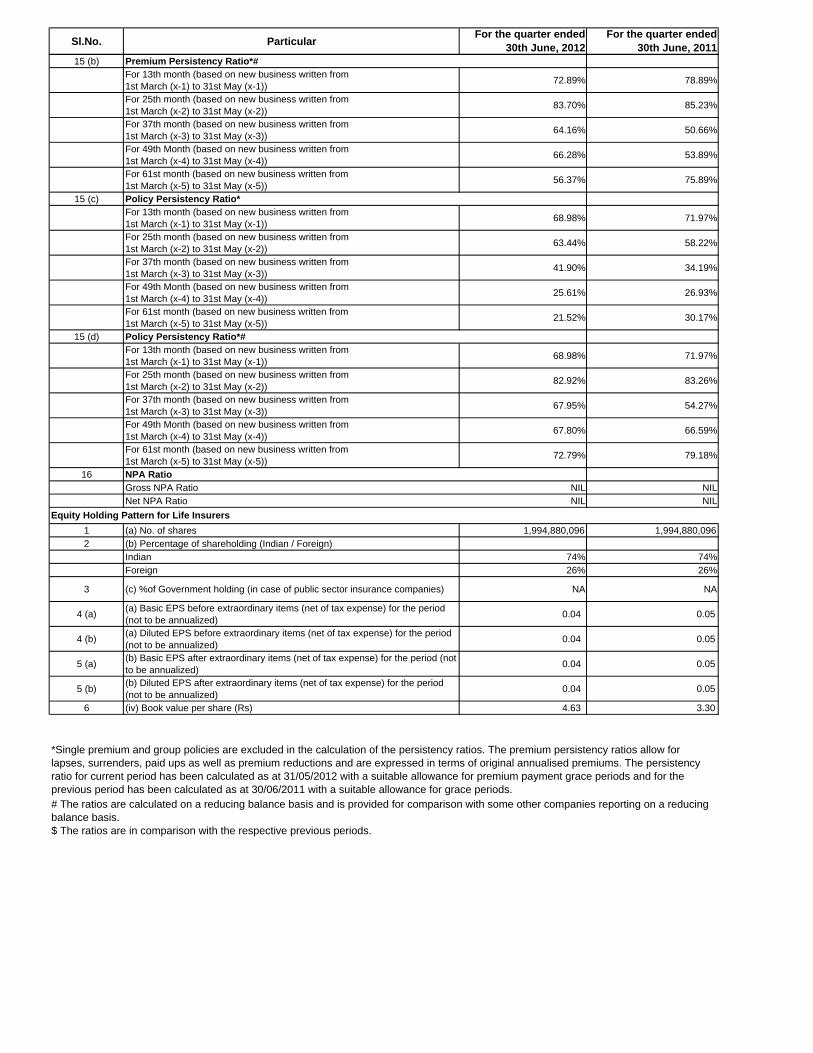
Sl.No. ParticularFor the quarter ended
30th June, 2012For the quarter ended
30th June, 201115 (b) Premium Persistency Ratio*#
For 13th month (based on new business written from 1st March (x-1) to 31st May (x-1))
72.89% 78.89%
For 25th month (based on new business written from 1st March (x-2) to 31st May (x-2))
83.70% 85.23%
For 37th month (based on new business written from 1st March (x-3) to 31st May (x-3))
64.16% 50.66%
For 49th Month (based on new business written from 1st March (x-4) to 31st May (x-4))
66.28% 53.89%
For 61st month (based on new business written from 1st March (x-5) to 31st May (x-5))
56.37% 75.89%
15 (c) Policy Persistency Ratio*For 13th month (based on new business written from 1st March (x-1) to 31st May (x-1))
68.98% 71.97%
For 25th month (based on new business written from 1st March (x-2) to 31st May (x-2))
63.44% 58.22%
For 37th month (based on new business written from 1st March (x-3) to 31st May (x-3))
41.90% 34.19%
For 49th Month (based on new business written from 1st March (x-4) to 31st May (x-4))
25.61% 26.93%
For 61st month (based on new business written from 1st March (x-5) to 31st May (x-5))
21.52% 30.17%
15 (d) Policy Persistency Ratio*#For 13th month (based on new business written from 1st March (x-1) to 31st May (x-1))
68.98% 71.97%
For 25th month (based on new business written from 1st March (x-2) to 31st May (x-2))
82.92% 83.26%
For 37th month (based on new business written from 1st March (x-3) to 31st May (x-3))
67.95% 54.27%
For 49th Month (based on new business written from 1st March (x-4) to 31st May (x-4))
67.80% 66.59%
For 61st month (based on new business written from 1st March (x-5) to 31st May (x-5))
72.79% 79.18%
16 NPA RatioGross NPA Ratio NIL NILNet NPA Ratio NIL NIL
1 (a) No. of shares 1,994,880,096 1,994,880,096 2 (b) Percentage of shareholding (Indian / Foreign)
Indian 74% 74%Foreign 26% 26%
3 (c) %of Government holding (in case of public sector insurance companies) NA NA
4 (a)(a) Basic EPS before extraordinary items (net of tax expense) for the period (not to be annualized)
0.04 0.05
4 (b)(a) Diluted EPS before extraordinary items (net of tax expense) for the period (not to be annualized)
0.04 0.05
5 (a)(b) Basic EPS after extraordinary items (net of tax expense) for the period (not to be annualized)
0.04 0.05
5 (b)(b) Diluted EPS after extraordinary items (net of tax expense) for the period (not to be annualized)
0.04 0.05
6 (iv) Book value per share (Rs) 4.63 3.30
$ The ratios are in comparison with the respective previous periods.
Equity Holding Pattern for Life Insurers
*Single premium and group policies are excluded in the calculation of the persistency ratios. The premium persistency ratios allow for lapses, surrenders, paid ups as well as premium reductions and are expressed in terms of original annualised premiums. The persistency ratio for current period has been calculated as at 31/05/2012 with a suitable allowance for premium payment grace periods and for the previous period has been calculated as at 30/06/2011 with a suitable allowance for grace periods.# The ratios are calculated on a reducing balance basis and is provided for comparison with some other companies reporting on a reducing balance basis.
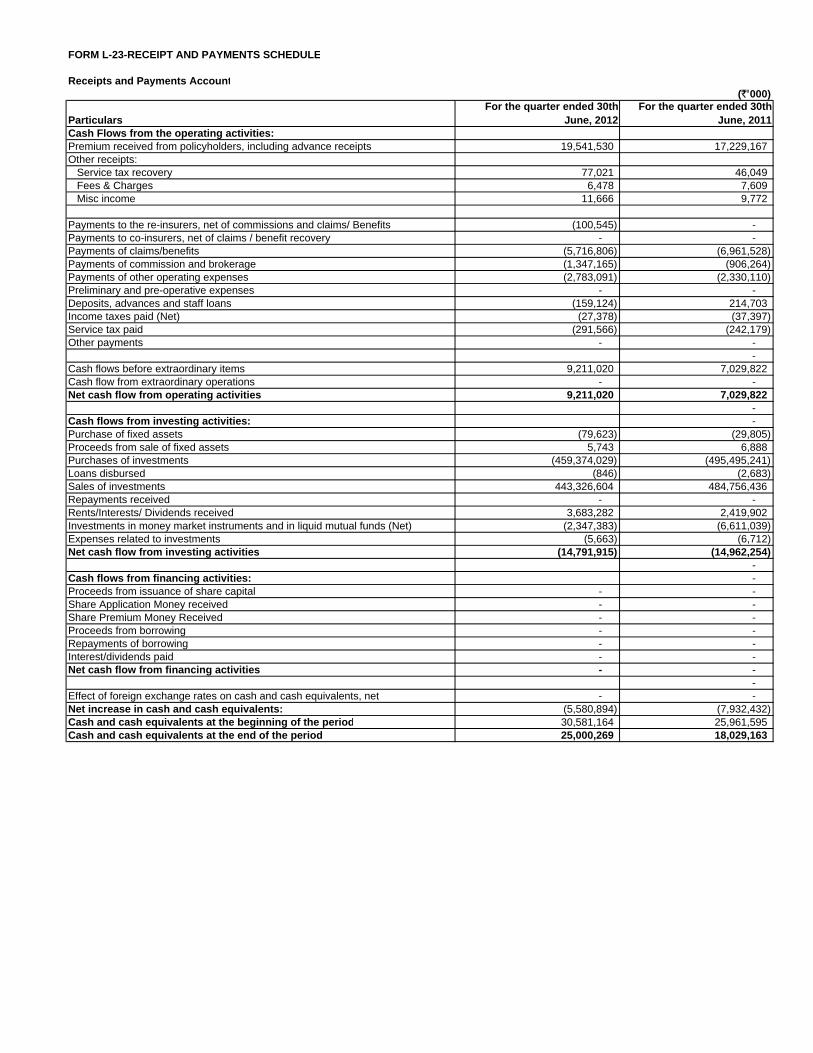
FORM L-23-RECEIPT AND PAYMENTS SCHEDULE
Receipts and Payments Account(`'000)
ParticularsFor the quarter ended 30th
June, 2012For the quarter ended 30th
June, 2011Cash Flows from the operating activities:Premium received from policyholders, including advance receipts 19,541,530 17,229,167 Other receipts: Service tax recovery 77,021 46,049 Fees & Charges 6,478 7,609 Misc income 11,666 9,772
Payments to the re-insurers, net of commissions and claims/ Benefits (100,545) - Payments to co-insurers, net of claims / benefit recovery - - Payments of claims/benefits (5,716,806) (6,961,528) Payments of commission and brokerage (1,347,165) (906,264) Payments of other operating expenses (2,783,091) (2,330,110) Preliminary and pre-operative expenses - - Deposits, advances and staff loans (159,124) 214,703 Income taxes paid (Net) (27,378) (37,397) Service tax paid (291,566) (242,179) Other payments - -
- Cash flows before extraordinary items 9,211,020 7,029,822 Cash flow from extraordinary operations - - Net cash flow from operating activities 9,211,020 7,029,822
- Cash flows from investing activities: - Purchase of fixed assets (79,623) (29,805) Proceeds from sale of fixed assets 5,743 6,888 Purchases of investments (459,374,029) (495,495,241) Loans disbursed (846) (2,683) Sales of investments 443,326,604 484,756,436 Repayments received - - Rents/Interests/ Dividends received 3,683,282 2,419,902 Investments in money market instruments and in liquid mutual funds (Net) (2,347,383) (6,611,039) Expenses related to investments (5,663) (6,712) Net cash flow from investing activities (14,791,915) (14,962,254)
- Cash flows from financing activities: - Proceeds from issuance of share capital - - Share Application Money received - - Share Premium Money Received - - Proceeds from borrowing - - Repayments of borrowing - - Interest/dividends paid - - Net cash flow from financing activities - -
- Effect of foreign exchange rates on cash and cash equivalents, net - - Net increase in cash and cash equivalents: (5,580,894) (7,932,432) Cash and cash equivalents at the beginning of the period 30,581,164 25,961,595 Cash and cash equivalents at the end of the period 25,000,269 18,029,163
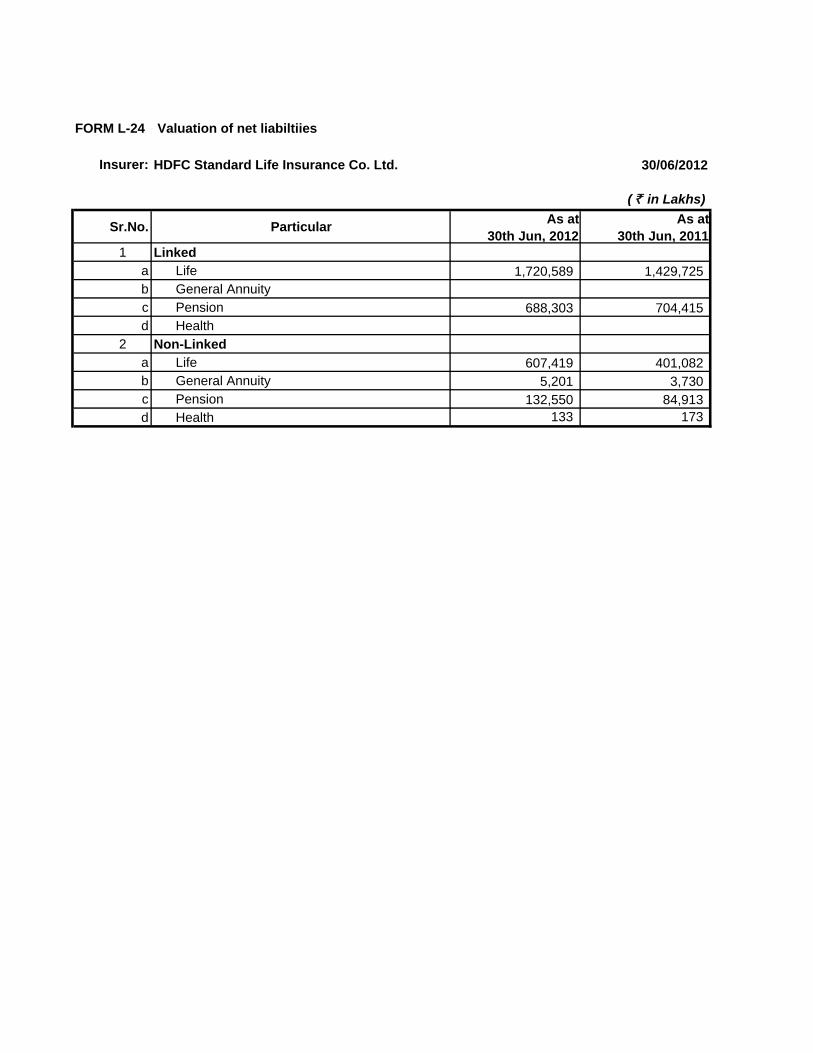
FORM L-24 Valuation of net liabiltiies
Insurer: HDFC Standard Life Insurance Co. Ltd. 30/06/2012
( ` in Lakhs)
Sr.No. ParticularAs at
30th Jun, 2012As at
30th Jun, 20111 Linked
a Life 1,720,589 1,429,725 b General Annuityc Pension 688,303 704,415 d Health
2 Non-Linkeda Life 607,419 401,082 b General Annuity 5,201 3,730 c Pension 132,550 84,913 d Health 133 173
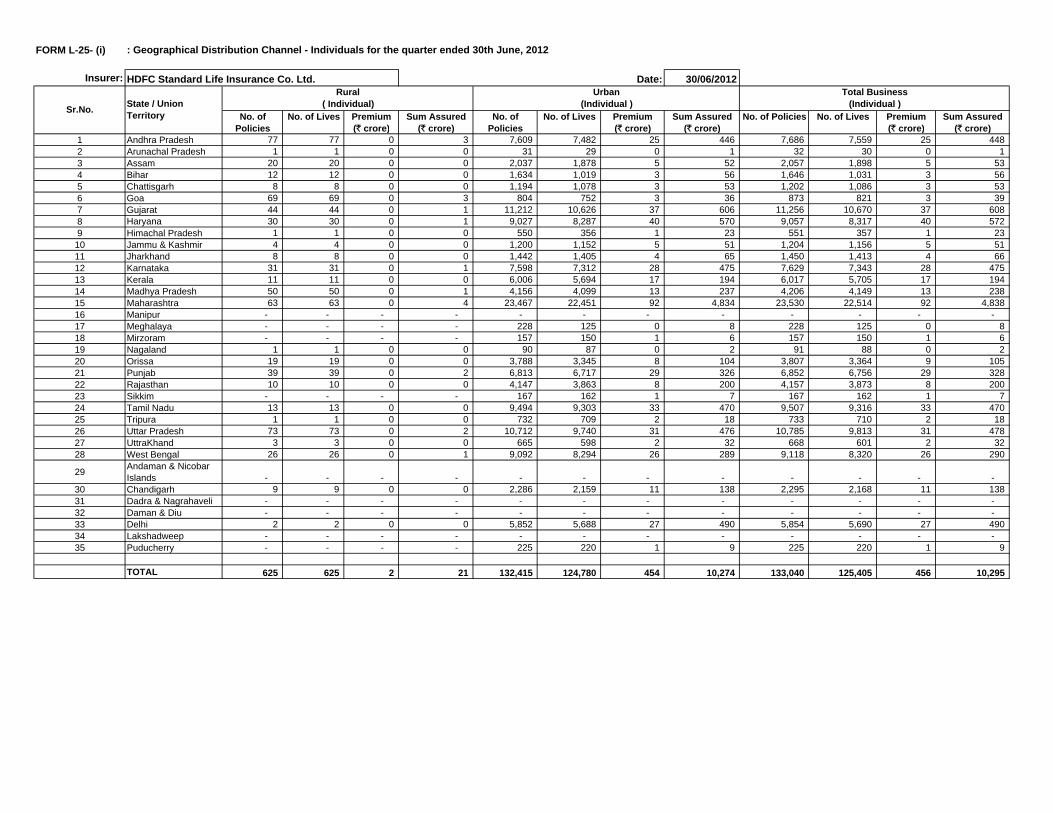
FORM L-25- (i) : Geographical Distribution Channel - Individuals for the quarter ended 30th June, 2012
Insurer: Date: 30/06/2012
No. of Policies
No. of Lives Premium (` crore)
Sum Assured (` crore)
No. of Policies
No. of Lives Premium (` crore)
Sum Assured (` crore)
No. of Policies No. of Lives Premium (` crore)
Sum Assured (` crore)
1 Andhra Pradesh 77 77 0 3 7,609 7,482 25 446 7,686 7,559 25 448 2 Arunachal Pradesh 1 1 0 0 31 29 0 1 32 30 0 1 3 Assam 20 20 0 0 2,037 1,878 5 52 2,057 1,898 5 53 4 Bihar 12 12 0 0 1,634 1,019 3 56 1,646 1,031 3 56 5 Chattisgarh 8 8 0 0 1,194 1,078 3 53 1,202 1,086 3 53 6 Goa 69 69 0 3 804 752 3 36 873 821 3 39 7 Gujarat 44 44 0 1 11,212 10,626 37 606 11,256 10,670 37 608 8 Haryana 30 30 0 1 9,027 8,287 40 570 9,057 8,317 40 572 9 Himachal Pradesh 1 1 0 0 550 356 1 23 551 357 1 23 10 Jammu & Kashmir 4 4 0 0 1,200 1,152 5 51 1,204 1,156 5 51 11 Jharkhand 8 8 0 0 1,442 1,405 4 65 1,450 1,413 4 66 12 Karnataka 31 31 0 1 7,598 7,312 28 475 7,629 7,343 28 475 13 Kerala 11 11 0 0 6,006 5,694 17 194 6,017 5,705 17 194 14 Madhya Pradesh 50 50 0 1 4,156 4,099 13 237 4,206 4,149 13 238 15 Maharashtra 63 63 0 4 23,467 22,451 92 4,834 23,530 22,514 92 4,838 16 Manipur - - - - - - - - - - - - 17 Meghalaya - - - - 228 125 0 8 228 125 0 8 18 Mirzoram - - - - 157 150 1 6 157 150 1 6 19 Nagaland 1 1 0 0 90 87 0 2 91 88 0 2 20 Orissa 19 19 0 0 3,788 3,345 8 104 3,807 3,364 9 105 21 Punjab 39 39 0 2 6,813 6,717 29 326 6,852 6,756 29 328 22 Rajasthan 10 10 0 0 4,147 3,863 8 200 4,157 3,873 8 200 23 Sikkim - - - - 167 162 1 7 167 162 1 7 24 Tamil Nadu 13 13 0 0 9,494 9,303 33 470 9,507 9,316 33 470 25 Tripura 1 1 0 0 732 709 2 18 733 710 2 18 26 Uttar Pradesh 73 73 0 2 10,712 9,740 31 476 10,785 9,813 31 478 27 UttraKhand 3 3 0 0 665 598 2 32 668 601 2 32 28 West Bengal 26 26 0 1 9,092 8,294 26 289 9,118 8,320 26 290
29Andaman & Nicobar Islands - - - - - - - - - - - -
30 Chandigarh 9 9 0 0 2,286 2,159 11 138 2,295 2,168 11 138 31 Dadra & Nagrahaveli - - - - - - - - - - - - 32 Daman & Diu - - - - - - - - - - - - 33 Delhi 2 2 0 0 5,852 5,688 27 490 5,854 5,690 27 490 34 Lakshadweep - - - - - - - - - - - - 35 Puducherry - - - - 225 220 1 9 225 220 1 9
TOTAL 625 625 2 21 132,415 124,780 454 10,274 133,040 125,405 456 10,295
HDFC Standard Life Insurance Co. Ltd.
Sr.No.State / Union Territory
Rural( Individual)
Urban(Individual )
Total Business(Individual )
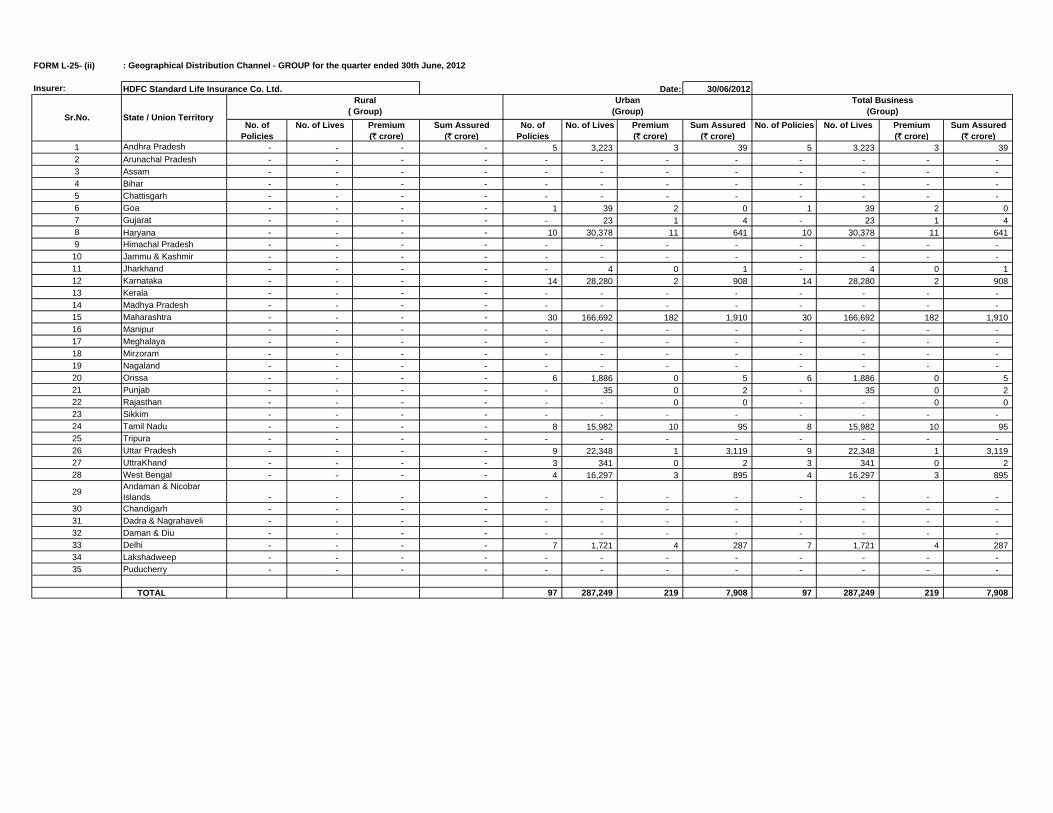
FORM L-25- (ii) : Geographical Distribution Channel - GROUP for the quarter ended 30th June, 2012
Insurer: Date: 30/06/2012
No. of Policies
No. of Lives Premium (` crore)
Sum Assured (` crore)
No. of Policies
No. of Lives Premium (` crore)
Sum Assured (` crore)
No. of Policies No. of Lives Premium (` crore)
Sum Assured (` crore)
1 Andhra Pradesh - - - - 5 3,223 3 39 5 3,223 3 39 2 Arunachal Pradesh - - - - - - - - - - - - 3 Assam - - - - - - - - - - - - 4 Bihar - - - - - - - - - - - - 5 Chattisgarh - - - - - - - - - - - - 6 Goa - - - - 1 39 2 0 1 39 2 0 7 Gujarat - - - - - 23 1 4 - 23 1 4 8 Haryana - - - - 10 30,378 11 641 10 30,378 11 641 9 Himachal Pradesh - - - - - - - - - - - - 10 Jammu & Kashmir - - - - - - - - - - - - 11 Jharkhand - - - - - 4 0 1 - 4 0 1 12 Karnataka - - - - 14 28,280 2 908 14 28,280 2 908 13 Kerala - - - - - - - - - - - - 14 Madhya Pradesh - - - - - - - - - - - - 15 Maharashtra - - - - 30 166,692 182 1,910 30 166,692 182 1,910 16 Manipur - - - - - - - - - - - - 17 Meghalaya - - - - - - - - - - - - 18 Mirzoram - - - - - - - - - - - - 19 Nagaland - - - - - - - - - - - - 20 Orissa - - - - 6 1,886 0 5 6 1,886 0 5 21 Punjab - - - - - 35 0 2 - 35 0 2 22 Rajasthan - - - - - - 0 0 - - 0 0 23 Sikkim - - - - - - - - - - - - 24 Tamil Nadu - - - - 8 15,982 10 95 8 15,982 10 95 25 Tripura - - - - - - - - - - - - 26 Uttar Pradesh - - - - 9 22,348 1 3,119 9 22,348 1 3,119 27 UttraKhand - - - - 3 341 0 2 3 341 0 2 28 West Bengal - - - - 4 16,297 3 895 4 16,297 3 895
29Andaman & Nicobar Islands - - - - - - - - - - - -
30 Chandigarh - - - - - - - - - - - - 31 Dadra & Nagrahaveli - - - - - - - - - - - - 32 Daman & Diu - - - - - - - - - - - - 33 Delhi - - - - 7 1,721 4 287 7 1,721 4 287 34 Lakshadweep - - - - - - - - - - - - 35 Puducherry - - - - - - - - - - - -
TOTAL 97 287,249 219 7,908 97 287,249 219 7,908
HDFC Standard Life Insurance Co. Ltd.
Sr.No. State / Union Territory
Rural( Group)
Urban(Group)
Total Business(Group)
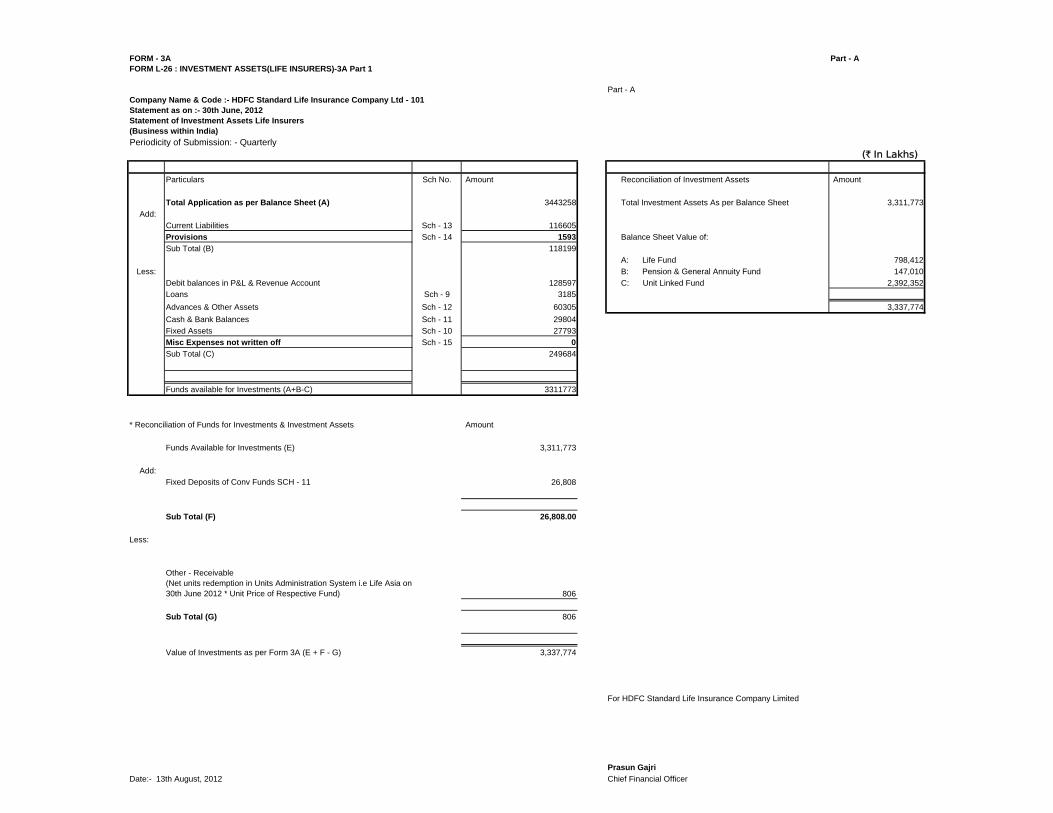
FORM - 3A Part - AFORM L-26 : INVESTMENT ASSETS(LIFE INSURERS)-3A Part 1
Part - ACompany Name & Code :- HDFC Standard Life Insurance Company Ltd - 101Statement as on :- 30th June, 2012Statement of Investment Assets Life Insurers(Business within India)
Periodicity of Submission: - Quarterly(` In Lakhs)
Particulars Sch No. Amount Reconciliation of Investment Assets Amount
Total Application as per Balance Sheet (A) 3443258 Total Investment Assets As per Balance Sheet 3,311,773
Add:
Current Liabilities Sch - 13 116605
Provisions Sch - 14 1593 Balance Sheet Value of:
Sub Total (B) 118199
A: Life Fund 798,412
Less: B: Pension & General Annuity Fund 147,010
Debit balances in P&L & Revenue Account 128597 C: Unit Linked Fund 2,392,352Loans Sch - 9 3185
Advances & Other Assets Sch - 12 60305 3,337,774
Cash & Bank Balances Sch - 11 29804
Fixed Assets Sch - 10 27793
Misc Expenses not written off Sch - 15 0
Sub Total (C) 249684
Funds available for Investments (A+B-C) 3311773
* Reconciliation of Funds for Investments & Investment Assets Amount
Funds Available for Investments (E) 3,311,773
Add:Fixed Deposits of Conv Funds SCH - 11 26,808
Sub Total (F) 26,808.00
Less:
Other - Receivable(Net units redemption in Units Administration System i.e Life Asia on30th June 2012 * Unit Price of Respective Fund) 806
Sub Total (G) 806
Value of Investments as per Form 3A (E + F - G) 3,337,774
For HDFC Standard Life Insurance Company Limited
Prasun Gajri
Date:- 13th August, 2012 Chief Financial Officer
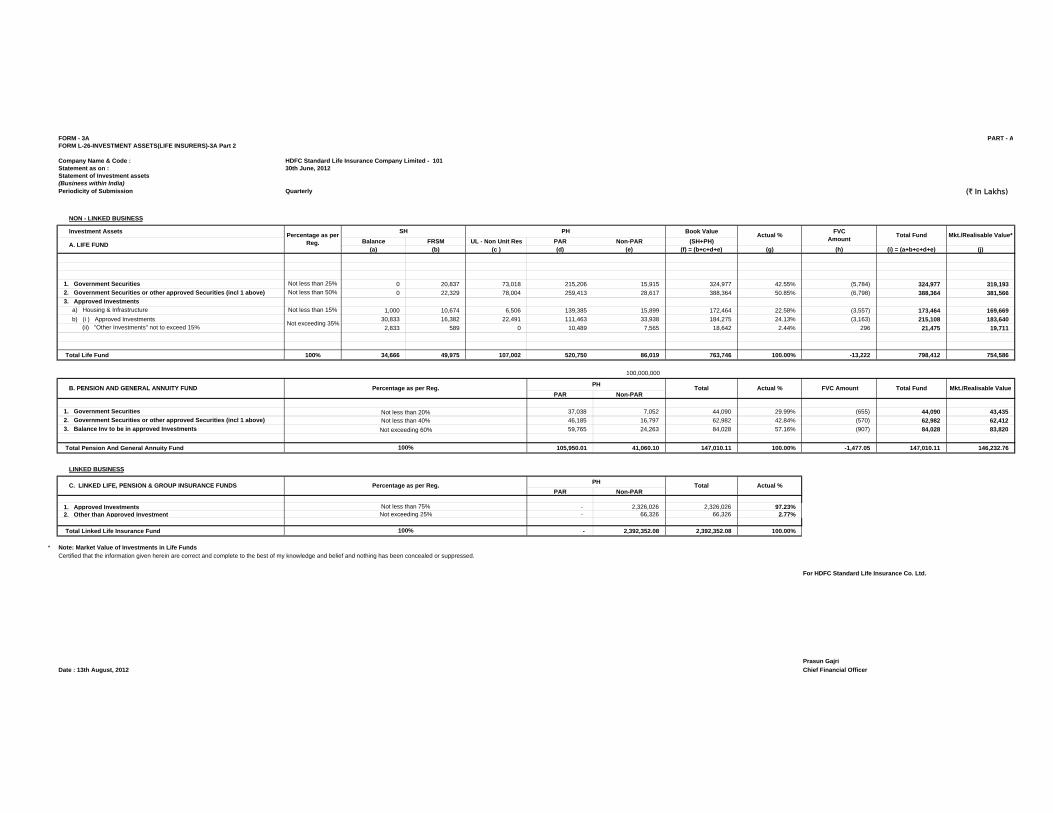
FORM - 3A PART - AFORM L-26-INVESTMENT ASSETS(LIFE INSURERS)-3A Part 2
Company Name & Code : HDFC Standard Life Insurance Company Limited - 101Statement as on : 30th June, 2012
Periodicity of Submission Quarterly (` In Lakhs)
NON - LINKED BUSINESS
Investment Assets Book Value
Balance FRSM UL - Non Unit Res PAR Non-PAR (SH+PH)(a) (b) (c ) (d) (e) (f) = (b+c+d+e) (g) (h) (i) = (a+b+c+d+e) (j)
1. Government Securities Not less than 25% 0 20,837 73,018 215,206 15,915 324,977 42.55% (5,784) 324,977 319,1932. Government Securities or other approved Securities (incl 1 above) Not less than 50% 0 22,329 78,004 259,413 28,617 388,364 50.85% (6,798) 388,364 381,5663. Approved Investments
a) Housing & Infrastructure Not less than 15% 1,000 10,674 6,506 139,385 15,899 172,464 22.58% (3,557) 173,464 169,669
b) (i ) Approved Investments 30,833 16,382 22,491 111,463 33,938 184,275 24.13% (3,163) 215,108 183,640 (ii) "Other Investments" not to exceed 15% 2,833 589 0 10,489 7,565 18,642 2.44% 296 21,475 19,711
Total Life Fund 100% 34,666 49,975 107,002 520,750 86,019 763,746 100.00% -13,222 798,412 754,586
100,000,000
PAR Non-PAR
1. Government Securities 37,038 7,052 44,090 29.99% (655) 44,090 43,4352. Government Securities or other approved Securities (incl 1 above) 46,185 16,797 62,982 42.84% (570) 62,982 62,4123. Balance Inv to be in approved Investments 59,765 24,263 84,028 57.16% (907) 84,028 83,820
Total Pension And General Annuity Fund 105,950.01 41,060.10 147,010.11 100.00% -1,477.05 147,010.11 146,232.76
LINKED BUSINESS
PAR Non-PAR
1. Approved Investments - 2,326,026 2,326,026 97.23%2. Other than Approved Investment - 66,326 66,326 2.77%
Total Linked Life Insurance Fund - 2,392,352.08 2,392,352.08 100.00%
* Note: Market Value of Investments in Life FundsCertified that the information given herein are correct and complete to the best of my knowledge and belief and nothing has been concealed or suppressed.
For HDFC Standard Life Insurance Co. Ltd.
Prasun Gajri
Date : 13th August, 2012 Chief Financial Officer
PH
100%
Total Actual %
Not less than 75%Not exceeding 25%
Mkt./Realisable Value
Not less than 20%Not less than 40%
Total
100%
C. LINKED LIFE, PENSION & GROUP INSURANCE FUNDS Percentage as per Reg.
B. PENSION AND GENERAL ANNUITY FUND Percentage as per Reg.PH
Not exceeding 60%
Actual % FVC Amount Total Fund
Not exceeding 35%
Statement of Investment assets(Business within India)
Percentage as per Reg.
SH PHActual %
FVC Amount
Total Fund Mkt./Realisable Value*
A. LIFE FUND
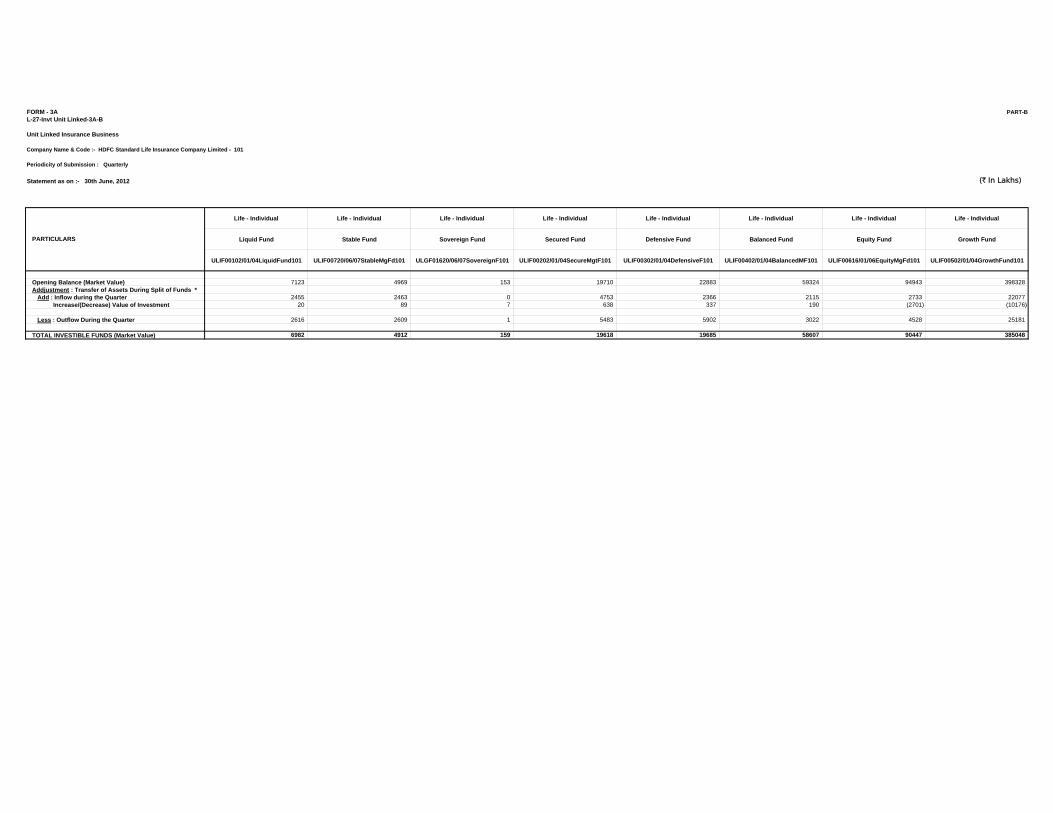
FORM - 3A PART-BL-27-Invt Unit Linked-3A-B
Unit Linked Insurance Business
Company Name & Code :- HDFC Standard Life Insurance Company Limited - 101
Periodicity of Submission : Quarterly
Statement as on :- 30th June, 2012 (` In Lakhs)
Life - Individual Life - Individual Life - Individual Life - Individual Life - Individual Life - Individual Life - Individual Life - Individual
Liquid Fund Stable Fund Sovereign Fund Secured Fund Defensive Fund Balanced Fund Equity Fund Growth Fund
ULIF00102/01/04LiquidFund101 ULIF00720/06/07StableMgFd101 ULGF01620/06/07SovereignF101 ULIF00202/01/04SecureMgtF101 ULIF00302/01/04DefensiveF101 ULIF00402/01/04BalancedMF101 ULIF00616/01/06EquityMgFd101 ULIF00502/01/04GrowthFund101
Opening Balance (Market Value) 7123 4969 153 19710 22883 59324 94943 398328Addjustment : Transfer of Assets During Split of Funds *
Add : Inflow during the Quarter 2455 2463 0 4753 2366 2115 2733 22077Increase/(Decrease) Value of Investment 20 89 7 638 337 190 (2701) (10176)
Less : Outflow During the Quarter 2616 2609 1 5483 5902 3022 4528 25181
TOTAL INVESTIBLE FUNDS (Market Value) 6982 4912 159 19618 19685 58607 90447 385048
PARTICULARS
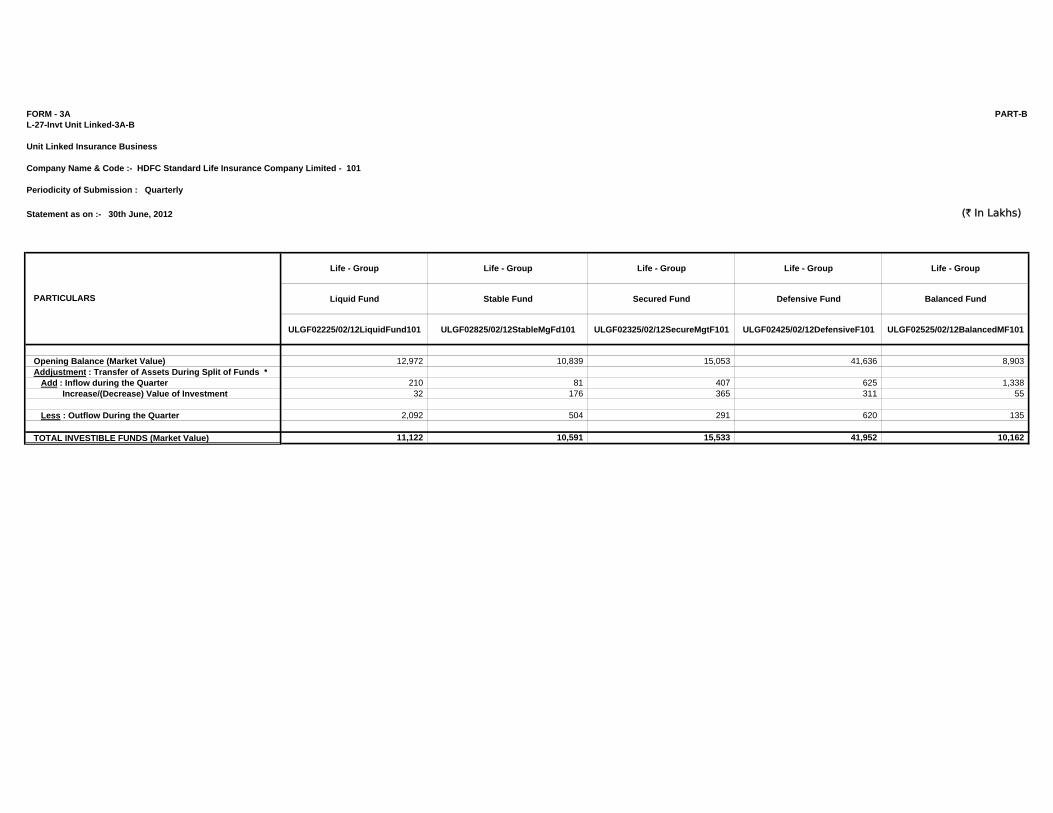
FORM - 3A PART-BL-27-Invt Unit Linked-3A-B
Unit Linked Insurance Business
Company Name & Code :- HDFC Standard Life Insurance Company Limited - 101
Periodicity of Submission : Quarterly
Statement as on :- 30th June, 2012 (` In Lakhs)
Life - Group Life - Group Life - Group Life - Group Life - Group
Liquid Fund Stable Fund Secured Fund Defensive Fund Balanced Fund
ULGF02225/02/12LiquidFund101 ULGF02825/02/12StableMgFd101 ULGF02325/02/12SecureMgtF101 ULGF02425/02/12DefensiveF101 ULGF02525/02/12BalancedMF101
Opening Balance (Market Value) 12,972 10,839 15,053 41,636 8,903Addjustment : Transfer of Assets During Split of Funds *
Add : Inflow during the Quarter 210 81 407 625 1,338Increase/(Decrease) Value of Investment 32 176 365 311 55
Less : Outflow During the Quarter 2,092 504 291 620 135
TOTAL INVESTIBLE FUNDS (Market Value) 11,122 10,591 15,533 41,952 10,162
PARTICULARS
FORM - 3A PART-BL-27-Invt Unit Linked-3A-B
Unit Linked Insurance Business
Company Name & Code :- HDFC Standard Life Insurance Company Limited - 101
Periodicity of Submission : Quarterly
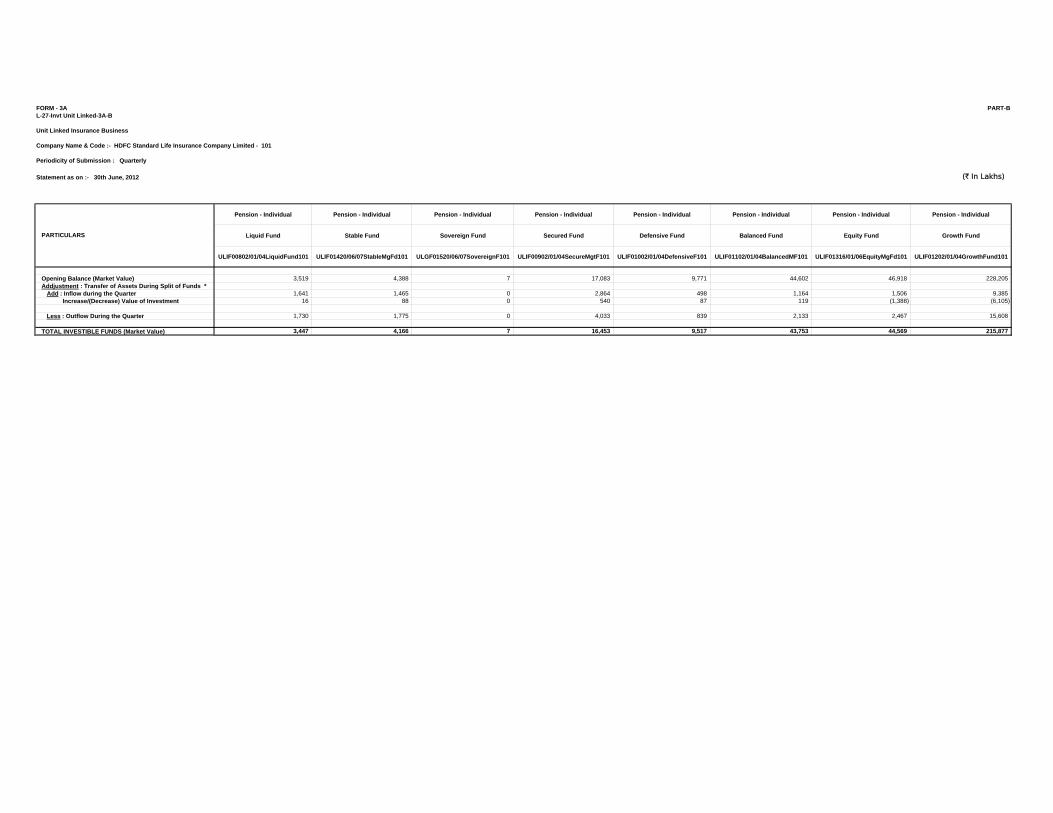
Statement as on :- 30th June, 2012 (` In Lakhs)
Pension - Individual Pension - Individual Pension - Individual Pension - Individual Pension - Individual Pension - Individual Pension - Individual Pension - Individual
Liquid Fund Stable Fund Sovereign Fund Secured Fund Defensive Fund Balanced Fund Equity Fund Growth Fund
ULIF00802/01/04LiquidFund101 ULIF01420/06/07StableMgFd101 ULGF01520/06/07SovereignF101 ULIF00902/01/04SecureMgtF101 ULIF01002/01/04DefensiveF101 ULIF01102/01/04BalancedMF101 ULIF01316/01/06EquityMgFd101 ULIF01202/01/04GrowthFund101
Opening Balance (Market Value) 3,519 4,388 7 17,083 9,771 44,602 46,918 228,205Addjustment : Transfer of Assets During Split of Funds *
Add : Inflow during the Quarter 1,641 1,465 0 2,864 498 1,164 1,506 9,385Increase/(Decrease) Value of Investment 16 88 0 540 87 119 (1,388) (6,105)
Less : Outflow During the Quarter 1,730 1,775 0 4,033 839 2,133 2,467 15,608
TOTAL INVESTIBLE FUNDS (Market Value) 3,447 4,166 7 16,453 9,517 43,753 44,569 215,877
PARTICULARS
FORM - 3A PART-BL-27-Invt Unit Linked-3A-B
Unit Linked Insurance Business
Company Name & Code :- HDFC Standard Life Insurance Company Limited - 101
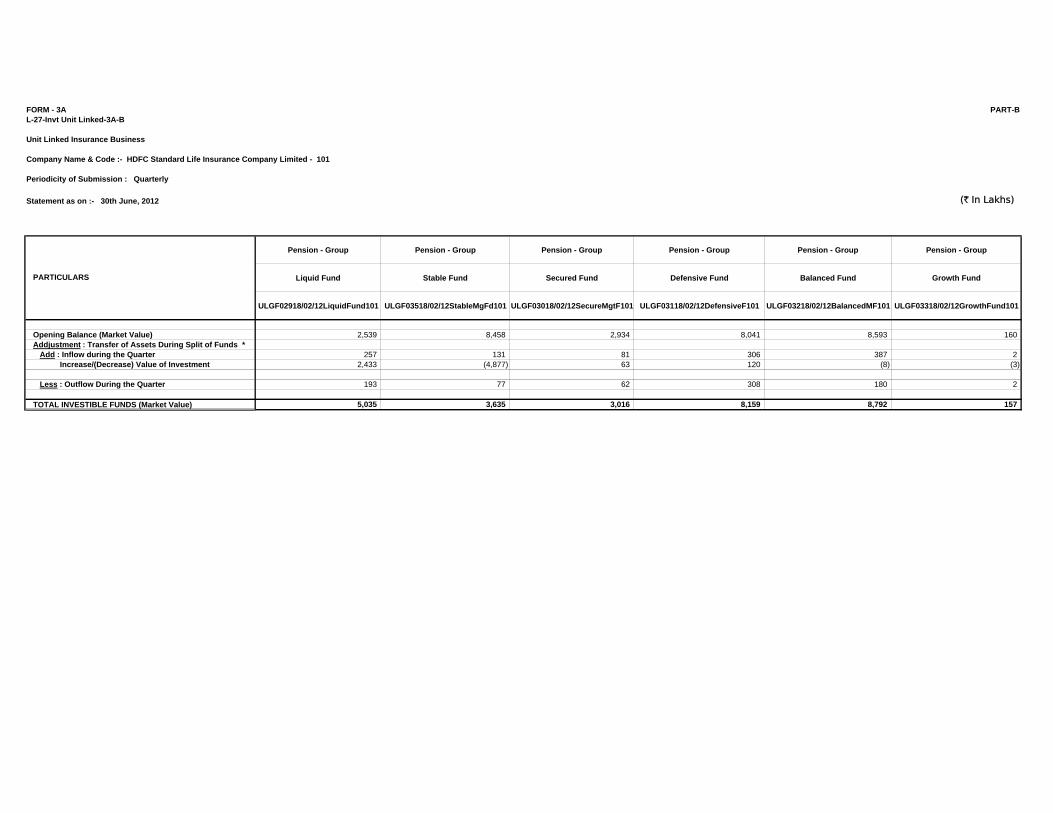
Periodicity of Submission : Quarterly
Statement as on :- 30th June, 2012 (` In Lakhs)
Pension - Group Pension - Group Pension - Group Pension - Group Pension - Group Pension - Group
Liquid Fund Stable Fund Secured Fund Defensive Fund Balanced Fund Growth Fund
ULGF02918/02/12LiquidFund101 ULGF03518/02/12StableMgFd101 ULGF03018/02/12SecureMgtF101 ULGF03118/02/12DefensiveF101 ULGF03218/02/12BalancedMF101 ULGF03318/02/12GrowthFund101
Opening Balance (Market Value) 2,539 8,458 2,934 8,041 8,593 160Addjustment : Transfer of Assets During Split of Funds *
Add : Inflow during the Quarter 257 131 81 306 387 2Increase/(Decrease) Value of Investment 2,433 (4,877) 63 120 (8) (3)
Less : Outflow During the Quarter 193 77 62 308 180 2
TOTAL INVESTIBLE FUNDS (Market Value) 5,035 3,635 3,016 8,159 8,792 157
PARTICULARS
FORM - 3A PART-BL-27-Invt Unit Linked-3A-B
Unit Linked Insurance Business
Company Name & Code :- HDFC Standard Life Insurance Company Limited - 101
Periodicity of Submission : Quarterly
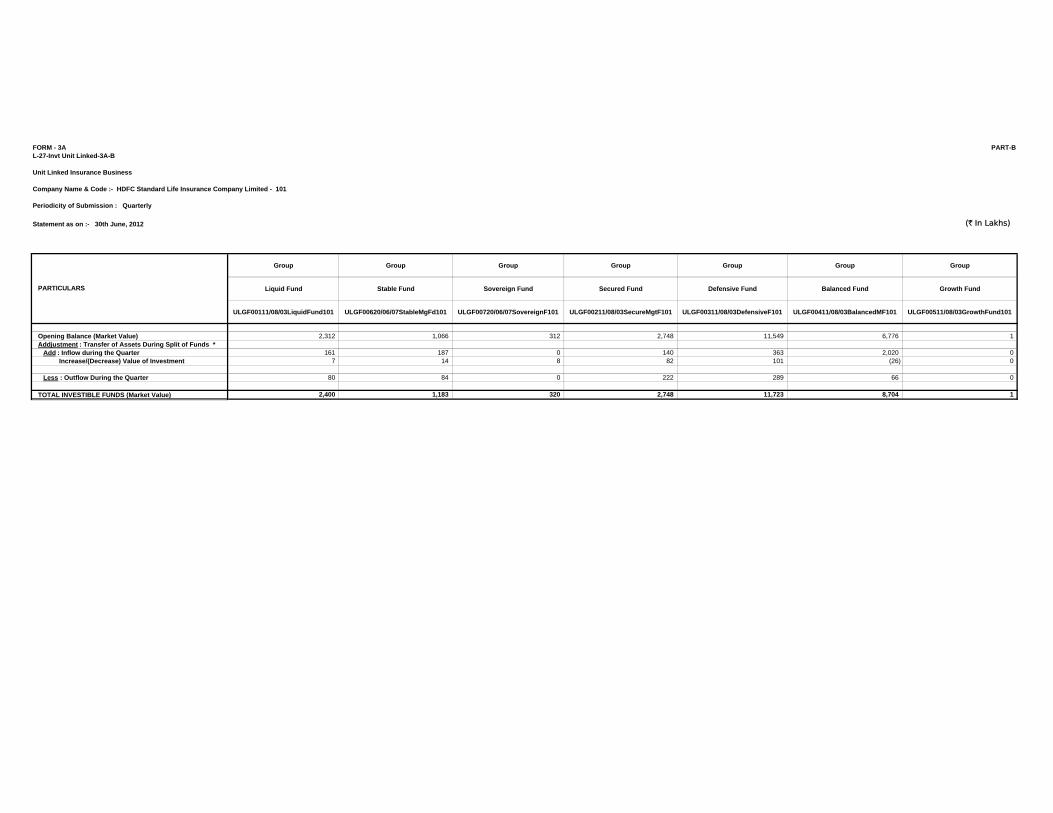
Statement as on :- 30th June, 2012 (` In Lakhs)
Group Group Group Group Group Group Group
Liquid Fund Stable Fund Sovereign Fund Secured Fund Defensive Fund Balanced Fund Growth Fund
ULGF00111/08/03LiquidFund101 ULGF00620/06/07StableMgFd101 ULGF00720/06/07SovereignF101 ULGF00211/08/03SecureMgtF101 ULGF00311/08/03DefensiveF101 ULGF00411/08/03BalancedMF101 ULGF00511/08/03GrowthFund101
Opening Balance (Market Value) 2,312 1,066 312 2,748 11,549 6,776 1Addjustment : Transfer of Assets During Split of Funds *
Add : Inflow during the Quarter 161 187 0 140 363 2,020 0Increase/(Decrease) Value of Investment 7 14 8 82 101 (26) 0
Less : Outflow During the Quarter 80 84 0 222 289 66 0
TOTAL INVESTIBLE FUNDS (Market Value) 2,400 1,183 320 2,748 11,723 8,704 1
PARTICULARS
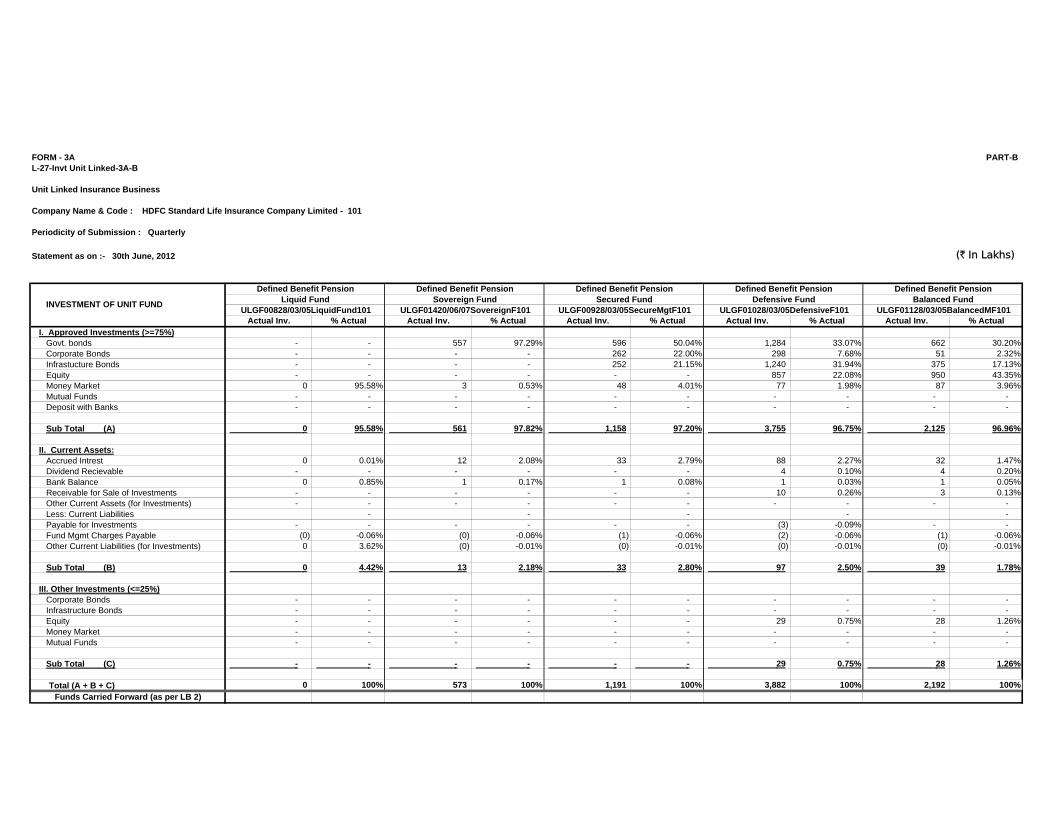
FORM - 3A PART-BL-27-Invt Unit Linked-3A-B
Unit Linked Insurance Business
Company Name & Code :- HDFC Standard Life Insurance Company Limited - 101
Periodicity of Submission : Quarterly
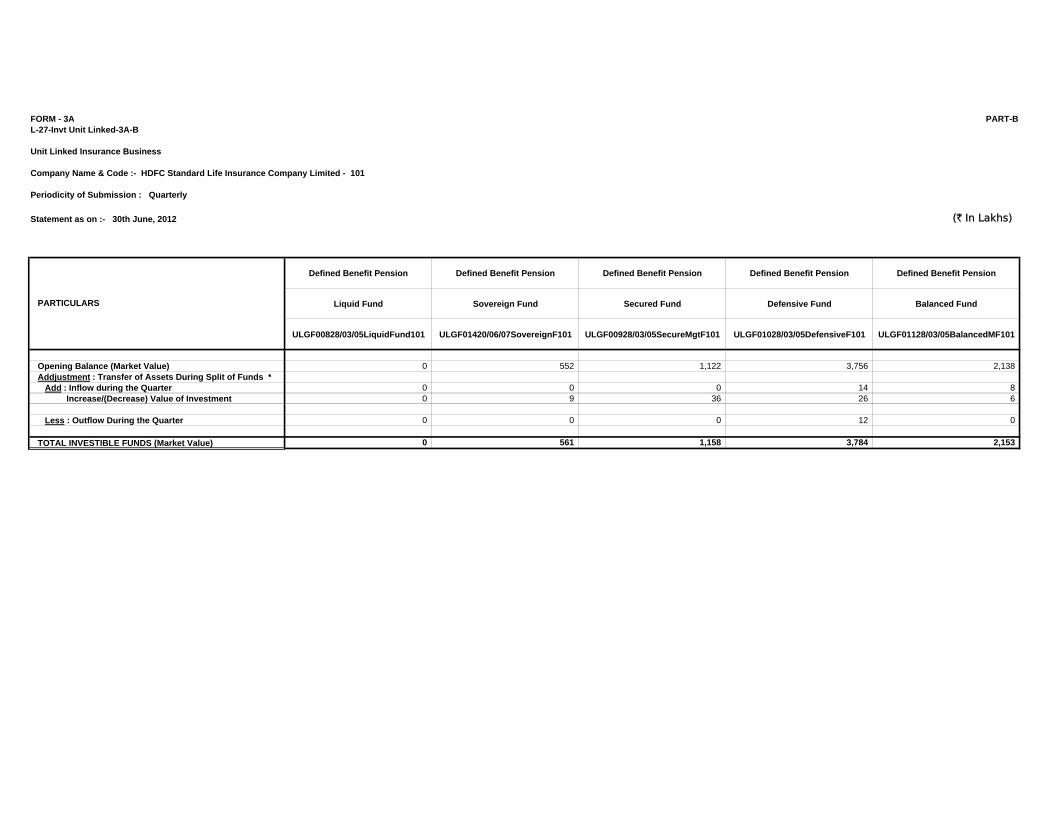
Statement as on :- 30th June, 2012 (` In Lakhs)
Defined Benefit Pension Defined Benefit Pension Defined Benefit Pension Defined Benefit Pension Defined Benefit Pension
Liquid Fund Sovereign Fund Secured Fund Defensive Fund Balanced Fund
ULGF00828/03/05LiquidFund101 ULGF01420/06/07SovereignF101 ULGF00928/03/05SecureMgtF101 ULGF01028/03/05DefensiveF101 ULGF01128/03/05BalancedMF101
Opening Balance (Market Value) 0 552 1,122 3,756 2,138Addjustment : Transfer of Assets During Split of Funds *
Add : Inflow during the Quarter 0 0 0 14 8Increase/(Decrease) Value of Investment 0 9 36 26 6
Less : Outflow During the Quarter 0 0 0 12 0
TOTAL INVESTIBLE FUNDS (Market Value) 0 561 1,158 3,784 2,153
PARTICULARS
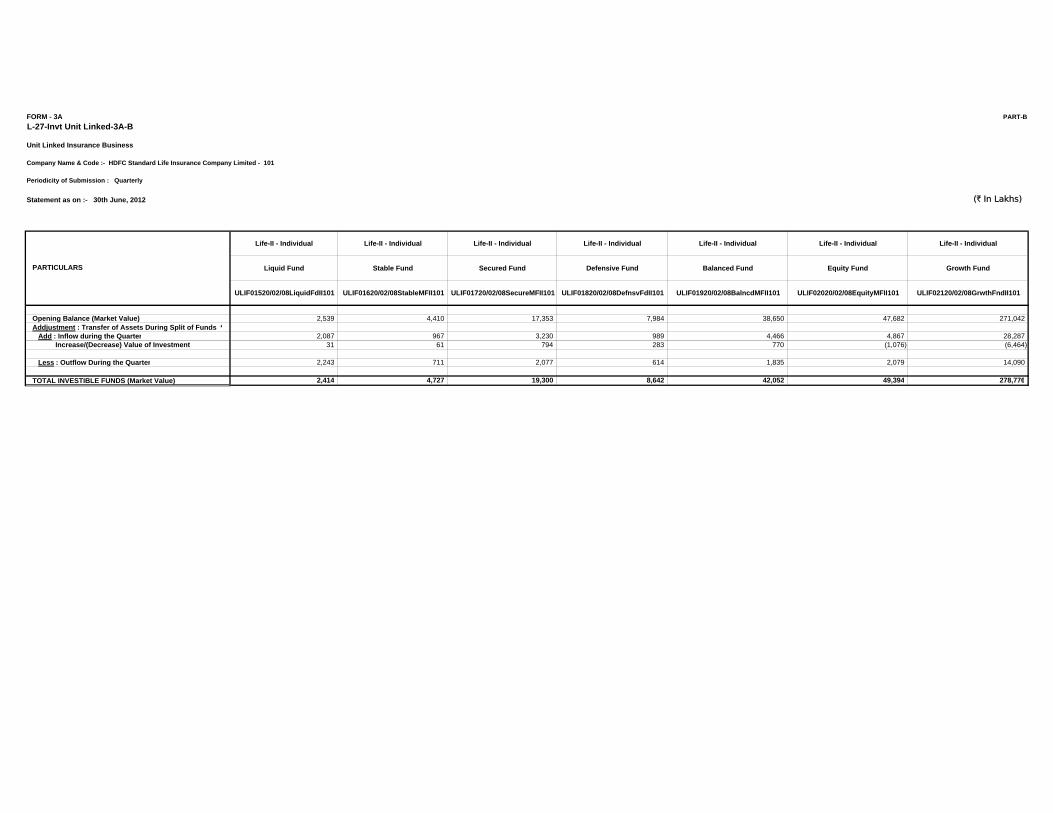
FORM - 3A PART-B
L-27-Invt Unit Linked-3A-B
Unit Linked Insurance Business
Company Name & Code :- HDFC Standard Life Insurance Company Limited - 101
Periodicity of Submission : Quarterly
Statement as on :- 30th June, 2012 (` In Lakhs)
Life-II - Individual Life-II - Individual Life-II - Individual Life-II - Individual Life-II - Individual Life-II - Individual Life-II - Individual
Liquid Fund Stable Fund Secured Fund Defensive Fund Balanced Fund Equity Fund Growth Fund
ULIF01520/02/08LiquidFdII101 ULIF01620/02/08StableMFII101 ULIF01720/02/08SecureMFII101 ULIF01820/02/08DefnsvFdII101 ULIF01920/02/08BalncdMFII101 ULIF02020/02/08EquityMFII101 ULIF02120/02/08GrwthFndII101
Opening Balance (Market Value) 2,539 4,410 17,353 7,984 38,650 47,682 271,042Addjustment : Transfer of Assets During Split of Funds *
Add : Inflow during the Quarter 2,087 967 3,230 989 4,466 4,867 28,287Increase/(Decrease) Value of Investment 31 61 794 283 770 (1,076) (6,464)
Less : Outflow During the Quarter 2,243 711 2,077 614 1,835 2,079 14,090
TOTAL INVESTIBLE FUNDS (Market Value) 2,414 4,727 19,300 8,642 42,052 49,394 278,776
PARTICULARS
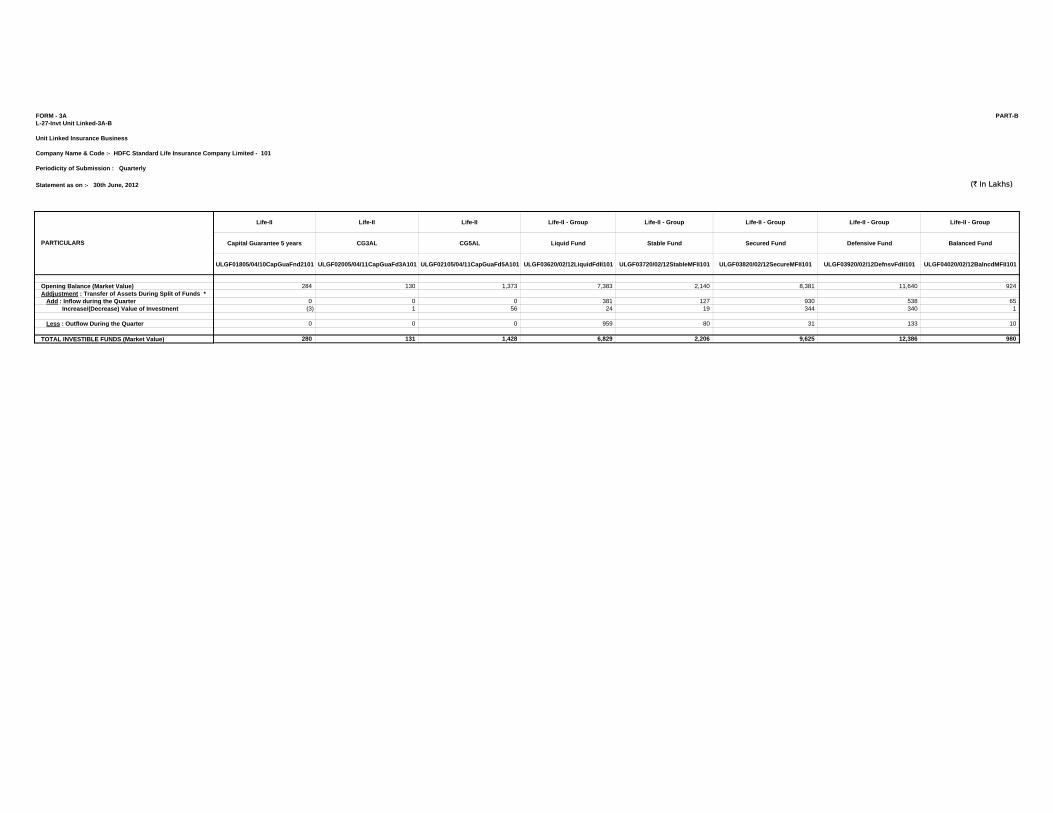
FORM - 3A PART-BL-27-Invt Unit Linked-3A-B
Unit Linked Insurance Business
Company Name & Code :- HDFC Standard Life Insurance Company Limited - 101
Periodicity of Submission : Quarterly
Statement as on :- 30th June, 2012 (` In Lakhs)
Life-II Life-II Life-II Life-II - Group Life-II - Group Life-II - Group Life-II - Group Life-II - Group
Capital Guarantee 5 years CG3AL CG5AL Liquid Fund Stable Fund Secured Fund Defensive Fund Balanced Fund
ULGF01805/04/10CapGuaFnd2101 ULGF02005/04/11CapGuaFd3A101 ULGF02105/04/11CapGuaFd5A101 ULGF03620/02/12LiquidFdII101 ULGF03720/02/12StableMFII101 ULGF03820/02/12SecureMFII101 ULGF03920/02/12DefnsvFdII101 ULGF04020/02/12BalncdMFII101
Opening Balance (Market Value) 284 130 1,373 7,383 2,140 8,381 11,640 924Addjustment : Transfer of Assets During Split of Funds *
Add : Inflow during the Quarter 0 0 0 381 127 930 538 65Increase/(Decrease) Value of Investment (3) 1 56 24 19 344 340 1
Less : Outflow During the Quarter 0 0 0 959 80 31 133 10
TOTAL INVESTIBLE FUNDS (Market Value) 280 131 1,428 6,829 2,206 9,625 12,386 980
PARTICULARS
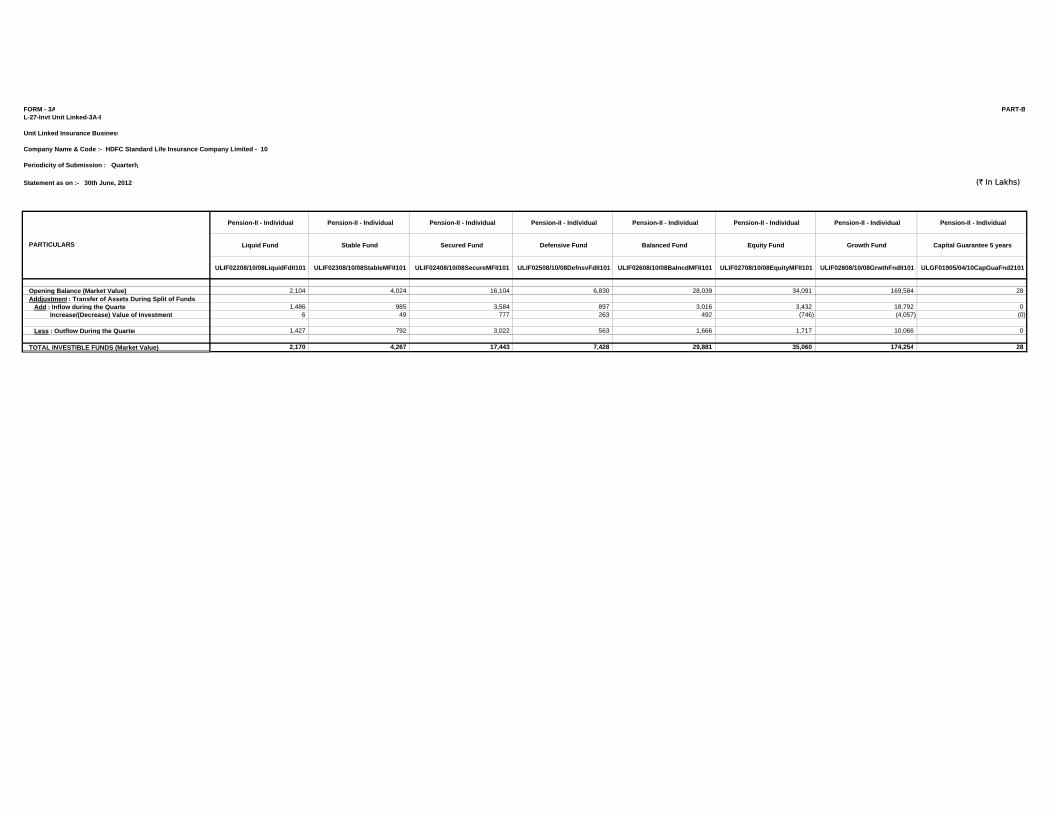
FORM - 3A PART-BL-27-Invt Unit Linked-3A-B
Unit Linked Insurance Business
Company Name & Code :- HDFC Standard Life Insurance Company Limited - 101
Periodicity of Submission : Quarterly
Statement as on :- 30th June, 2012 (` In Lakhs)
Pension-II - Individual Pension-II - Individual Pension-II - Individual Pension-II - Individual Pension-II - Individual Pension-II - Individual Pension-II - Individual Pension-II - Individual
Liquid Fund Stable Fund Secured Fund Defensive Fund Balanced Fund Equity Fund Growth Fund Capital Guarantee 5 years
ULIF02208/10/08LiquidFdII101 ULIF02308/10/08StableMFII101 ULIF02408/10/08SecureMFII101 ULIF02508/10/08DefnsvFdII101 ULIF02608/10/08BalncdMFII101 ULIF02708/10/08EquityMFII101 ULIF02808/10/08GrwthFndII101 ULGF01905/04/10CapGuaFnd2101
Opening Balance (Market Value) 2,104 4,024 16,104 6,830 28,039 34,091 169,584 28Addjustment : Transfer of Assets During Split of Funds *
Add : Inflow during the Quarter 1,486 985 3,584 897 3,016 3,432 18,792 0Increase/(Decrease) Value of Investment 6 49 777 263 492 (746) (4,057) (0)
Less : Outflow During the Quarter 1,427 792 3,022 563 1,666 1,717 10,066 0
TOTAL INVESTIBLE FUNDS (Market Value) 2,170 4,267 17,443 7,428 29,881 35,060 174,254 28
PARTICULARS
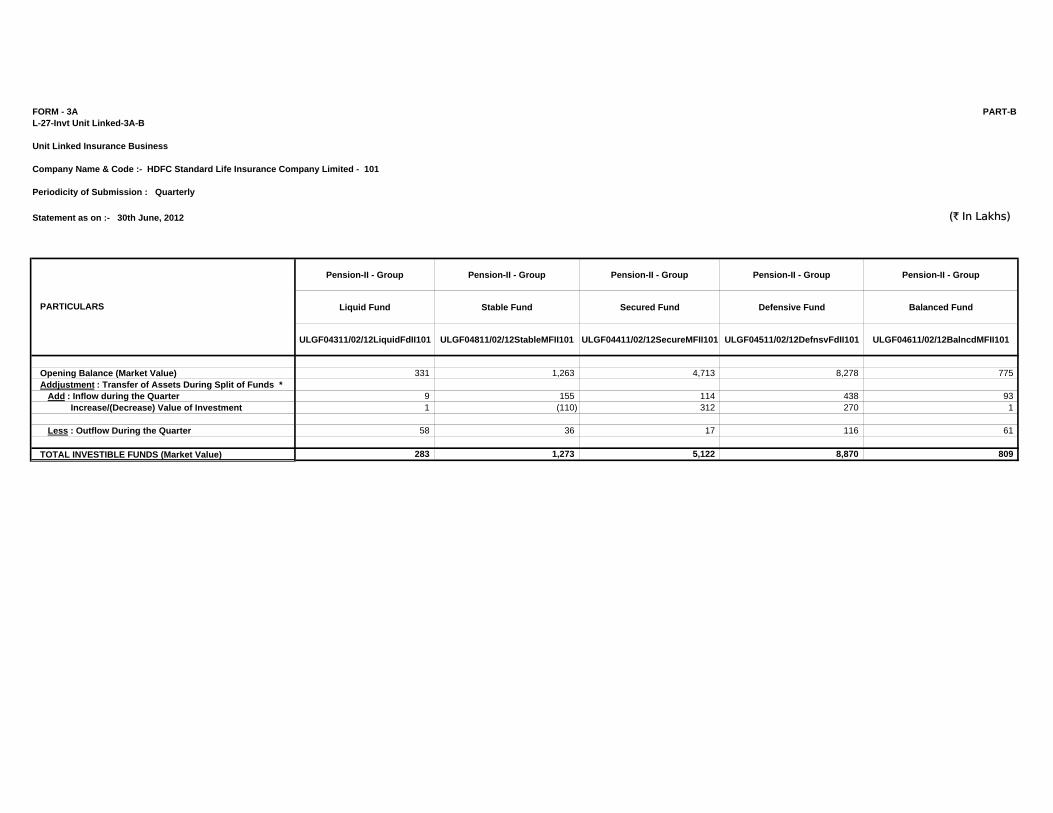
FORM - 3A PART-BL-27-Invt Unit Linked-3A-B
Unit Linked Insurance Business
Company Name & Code :- HDFC Standard Life Insurance Company Limited - 101
Periodicity of Submission : Quarterly
Statement as on :- 30th June, 2012 (` In Lakhs)
Pension-II - Group Pension-II - Group Pension-II - Group Pension-II - Group Pension-II - Group
Liquid Fund Stable Fund Secured Fund Defensive Fund Balanced Fund
ULGF04311/02/12LiquidFdII101 ULGF04811/02/12StableMFII101 ULGF04411/02/12SecureMFII101 ULGF04511/02/12DefnsvFdII101 ULGF04611/02/12BalncdMFII101
Opening Balance (Market Value) 331 1,263 4,713 8,278 775Addjustment : Transfer of Assets During Split of Funds *
Add : Inflow during the Quarter 9 155 114 438 93Increase/(Decrease) Value of Investment 1 (110) 312 270 1
Less : Outflow During the Quarter 58 36 17 116 61
TOTAL INVESTIBLE FUNDS (Market Value) 283 1,273 5,122 8,870 809
PARTICULARS
FORM - 3A PART-BL-27-Invt Unit Linked-3A-B
Unit Linked Insurance Business
Company Name & Code :- HDFC Standard Life Insurance Company Limited - 101
Periodicity of Submission : Quarterly
Statement as on :- 30th June, 2012 (` In Lakhs)
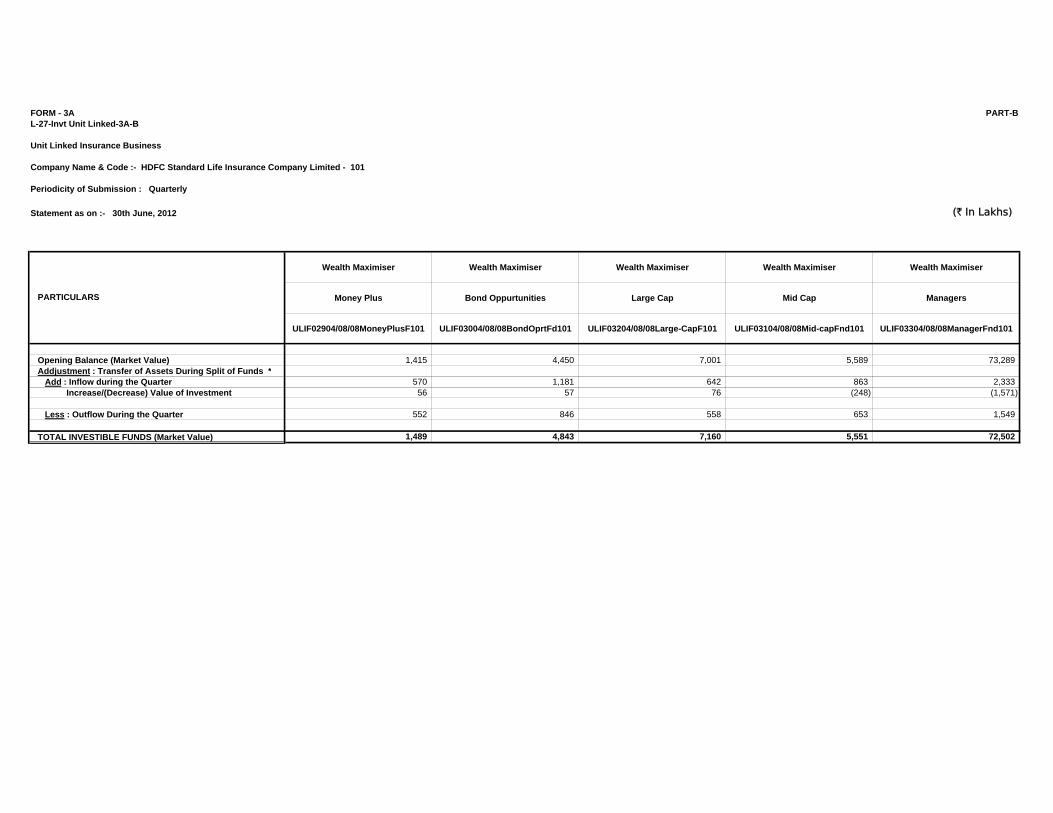
Wealth Maximiser Wealth Maximiser Wealth Maximiser Wealth Maximiser Wealth Maximiser
Money Plus Bond Oppurtunities Large Cap Mid Cap Managers
ULIF02904/08/08MoneyPlusF101 ULIF03004/08/08BondOprtFd101 ULIF03204/08/08Large-CapF101 ULIF03104/08/08Mid-capFnd101 ULIF03304/08/08ManagerFnd101
Opening Balance (Market Value) 1,415 4,450 7,001 5,589 73,289Addjustment : Transfer of Assets During Split of Funds *
Add : Inflow during the Quarter 570 1,181 642 863 2,333Increase/(Decrease) Value of Investment 56 57 76 (248) (1,571)
Less : Outflow During the Quarter 552 846 558 653 1,549
TOTAL INVESTIBLE FUNDS (Market Value) 1,489 4,843 7,160 5,551 72,502
PARTICULARS
FORM - 3A PART-BL-27-Invt Unit Linked-3A-B
Unit Linked Insurance Business
Company Name & Code :- HDFC Standard Life Insurance Company Limited - 101
Periodicity of Submission : Quarterly
Statement as on :- 30th June, 2012 (` In Lakhs)
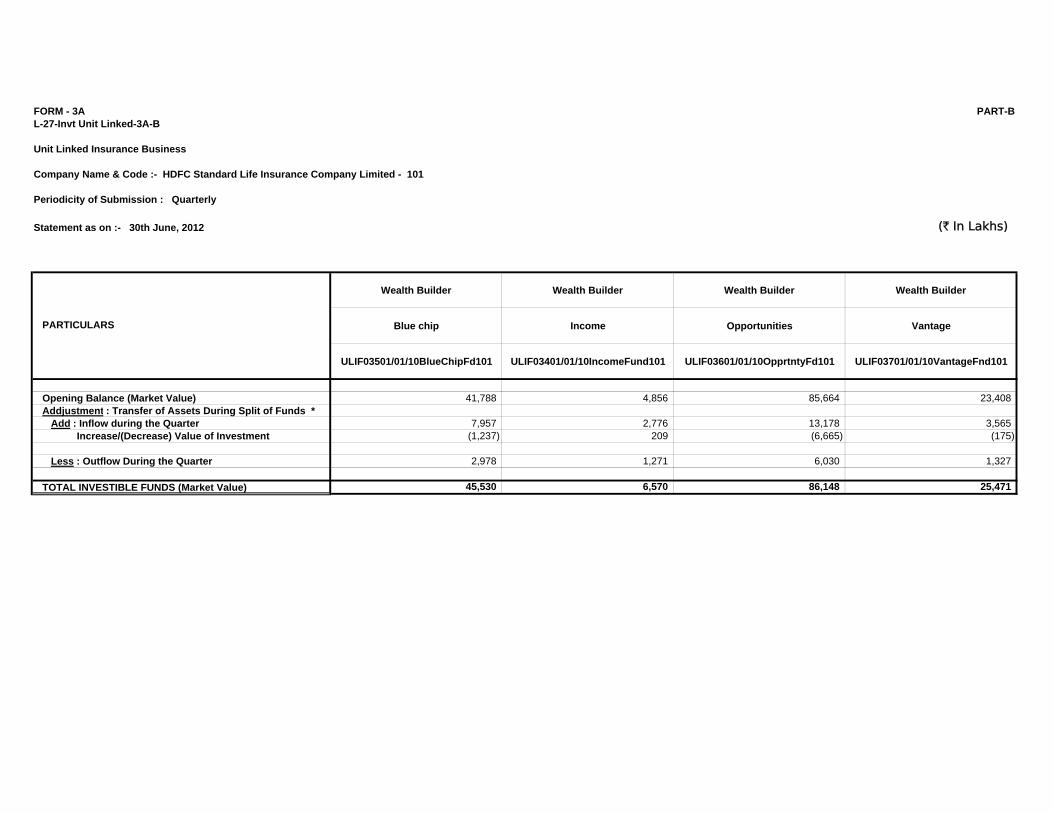
Wealth Builder Wealth Builder Wealth Builder Wealth Builder
Blue chip Income Opportunities Vantage
ULIF03501/01/10BlueChipFd101 ULIF03401/01/10IncomeFund101 ULIF03601/01/10OpprtntyFd101 ULIF03701/01/10VantageFnd101
Opening Balance (Market Value) 41,788 4,856 85,664 23,408Addjustment : Transfer of Assets During Split of Funds *
Add : Inflow during the Quarter 7,957 2,776 13,178 3,565Increase/(Decrease) Value of Investment (1,237) 209 (6,665) (175)
Less : Outflow During the Quarter 2,978 1,271 6,030 1,327
TOTAL INVESTIBLE FUNDS (Market Value) 45,530 6,570 86,148 25,471
PARTICULARS
FORM - 3A PART-BL-27-Invt Unit Linked-3A-B
Unit Linked Insurance Business
Company Name & Code :- HDFC Standard Life Insurance Company Limited - 101
Periodicity of Submission : Quarterly
Statement as on :- 30th June, 2012 (` In Lakhs)
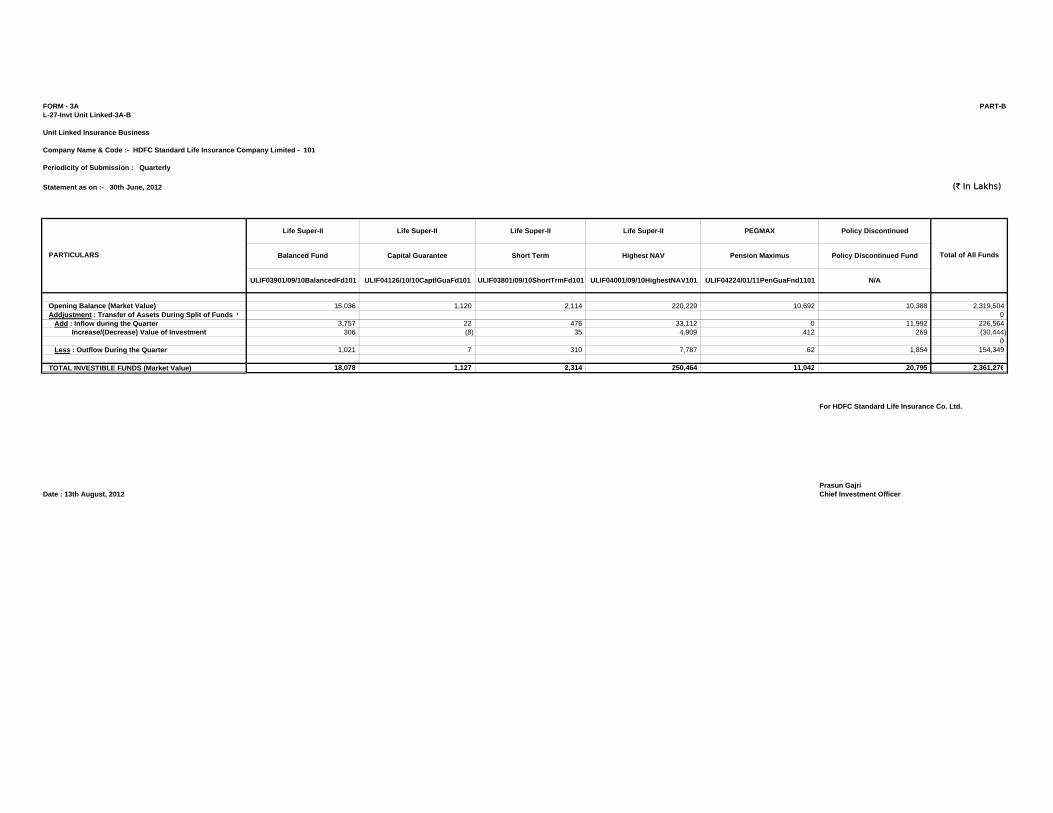
Life Super-II Life Super-II Life Super-II Life Super-II PEGMAX Policy Discontinued
Balanced Fund Capital Guarantee Short Term Highest NAV Pension Maximus Policy Discontinued Fund
ULIF03901/09/10BalancedFd101 ULIF04126/10/10CaptlGuaFd101 ULIF03801/09/10ShortTrmFd101 ULIF04001/09/10HighestNAV101 ULIF04224/01/11PenGuaFnd1101 N/A
Opening Balance (Market Value) 15,036 1,120 2,114 220,229 10,692 10,388 2,319,504Addjustment : Transfer of Assets During Split of Funds * 0
Add : Inflow during the Quarter 3,757 22 476 33,112 0 11,992 226,564Increase/(Decrease) Value of Investment 306 (8) 35 4,909 412 269 (30,444)
0Less : Outflow During the Quarter 1,021 7 310 7,787 62 1,854 154,349
TOTAL INVESTIBLE FUNDS (Market Value) 18,078 1,127 2,314 250,464 11,042 20,795 2,361,276
For HDFC Standard Life Insurance Co. Ltd.
Prasun GajriDate : 13th August, 2012 Chief Investment Officer
PARTICULARS Total of All Funds
FORM - 3A PART-BL-27-Invt Unit Linked-3A-B
Unit Linked Insurance Business
Company Name & Code : HDFC Standard Life Insurance Company Limited - 101
Periodicity of Submission : Quarterly
Statement as on :- 30th June, 2012 (` In Lakhs)
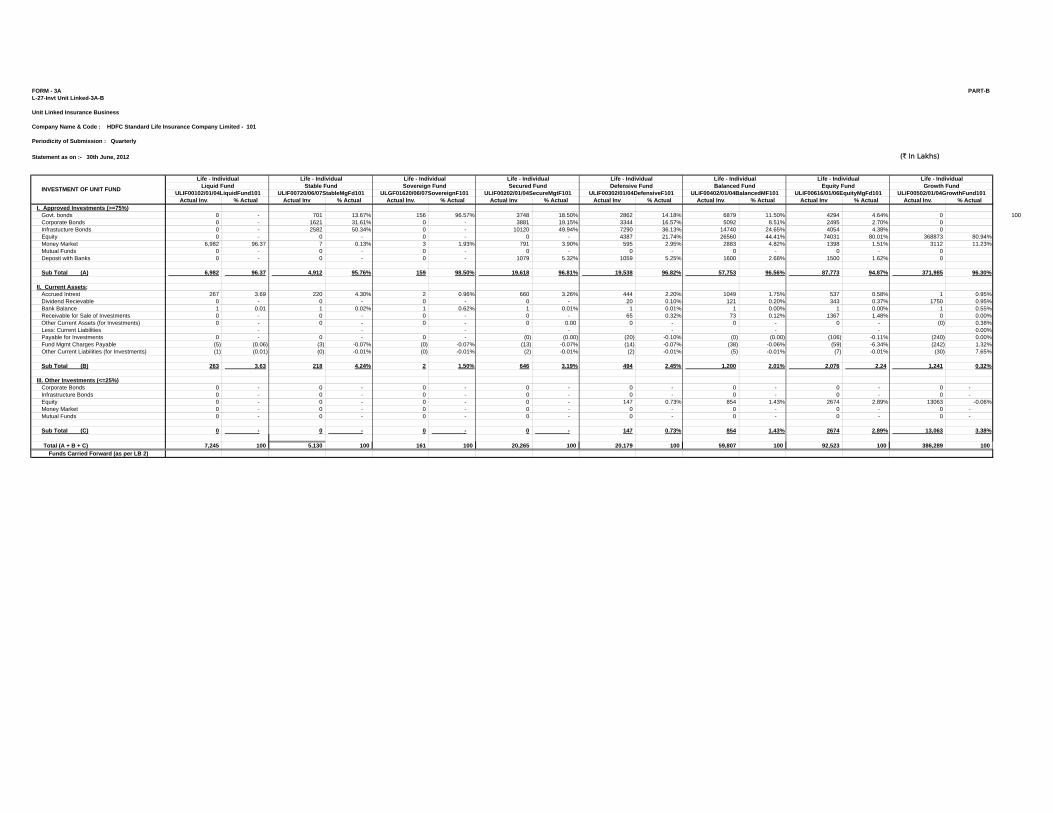
Actual Inv. % Actual Actual Inv. % Actual Actual Inv. % Actual Actual Inv. % Actual Actual Inv. % Actual Actual Inv. % Actual Actual Inv. % Actual Actual Inv. % ActualI. Approved Investments (>=75%)
Govt. bonds 0 - 701 13.67% 156 96.57% 3748 18.50% 2862 14.18% 6879 11.50% 4294 4.64% 0 100Corporate Bonds 0 - 1621 31.61% 0 - 3881 19.15% 3344 16.57% 5092 8.51% 2495 2.70% 0Infrastucture Bonds 0 - 2582 50.34% 0 - 10120 49.94% 7290 36.13% 14740 24.65% 4054 4.38% 0Equity 0 - 0 - 0 - 0 - 4387 21.74% 26560 44.41% 74031 80.01% 368873 80.94%Money Market 6,982 96.37 7 0.13% 3 1.93% 791 3.90% 595 2.95% 2883 4.82% 1398 1.51% 3112 11.23%Mutual Funds 0 - 0 - 0 - 0 - 0 - 0 - 0 - 0Deposit with Banks 0 - 0 - 0 - 1079 5.32% 1059 5.25% 1600 2.68% 1500 1.62% 0
Sub Total (A) 6,982 96.37 4,912 95.76% 159 98.50% 19,618 96.81% 19,538 96.82% 57,753 96.56% 87,773 94.87% 371,985 96.30%
II. Current Assets:Accrued Intrest 267 3.69 220 4.30% 2 0.96% 660 3.26% 444 2.20% 1049 1.75% 537 0.58% 1 0.95%Dividend Recievable 0 - 0 - 0 - 0 - 20 0.10% 121 0.20% 343 0.37% 1750 0.95%Bank Balance 1 0.01 1 0.02% 1 0.62% 1 0.01% 1 0.01% 1 0.00% 1 0.00% 1 0.55%Receivable for Sale of Investments 0 - 0 - 0 - 0 - 65 0.32% 73 0.12% 1367 1.48% 0 0.00%Other Current Assets (for Investments) 0 - 0 - 0 - 0 0.00 0 - 0 - 0 - (0) 0.38%Less: Current Liabilities - - - - - - - 0.00%Payable for Investments 0 - 0 - 0 - (0) (0.00) (20) -0.10% (0) (0.00) (106) -0.11% (240) 0.00%Fund Mgmt Charges Payable (5) (0.06) (3) -0.07% (0) -0.07% (13) -0.07% (14) -0.07% (38) -0.06% (59) -6.34% (242) 1.32%Other Current Liabilities (for Investments) (1) (0.01) (0) -0.01% (0) -0.01% (2) -0.01% (2) -0.01% (5) -0.01% (7) -0.01% (30) 7.65%
Sub Total (B) 263 3.63 218 4.24% 2 1.50% 646 3.19% 494 2.45% 1,200 2.01% 2,076 2.24 1,241 0.32%
III. Other Investments (<=25%)Corporate Bonds 0 - 0 - 0 - 0 - 0 - 0 - 0 - 0 -Infrastructure Bonds 0 - 0 - 0 - 0 - 0 - 0 - 0 - 0 -Equity 0 - 0 - 0 - 0 - 147 0.73% 854 1.43% 2674 2.89% 13063 -0.06%Money Market 0 - 0 - 0 - 0 - 0 - 0 - 0 - 0 -Mutual Funds 0 - 0 - 0 - 0 - 0 - 0 - 0 - 0 -
Sub Total (C) 0 - 0 - 0 - 0 - 147 0.73% 854 1.43% 2674 2.89% 13,063 3.38%
Total (A + B + C) 7,245 100 5,130 100 161 100 20,265 100 20,179 100 59,807 100 92,523 100 386,289 100 Funds Carried Forward (as per LB 2)
Life - Individual Life - IndividualStable Fund Sovereign Fund Secured Fund Defensive Fund
Life - Individual Life - Individual Life - IndividualEquity Fund Growth FundBalanced Fund
ULIF00502/01/04GrowthFund101ULIF00202/01/04SecureMgtF101 ULIF00302/01/04DefensiveF101 ULIF00402/01/04BalancedMF101 ULIF00616/01/06EquityMgFd101INVESTMENT OF UNIT FUND
Life - Individual Life - Individual Life - Individual
ULIF00102/01/04LiquidFund101 ULIF00720/06/07StableMgFd101 ULGF01620/06/07SovereignF101Liquid Fund
FORM - 3A PART-BL-27-Invt Unit Linked-3A-B
Unit Linked Insurance Business
Company Name & Code : HDFC Standard Life Insurance Company Limited - 101
Periodicity of Submission : Quarterly
Statement as on :- 30th June, 2012 (` In Lakhs)
Actual Inv. % Actual Actual Inv. % Actual Actual Inv. % Actual Actual Inv. % Actual Actual Inv. % ActualI. Approved Investments (>=75%)
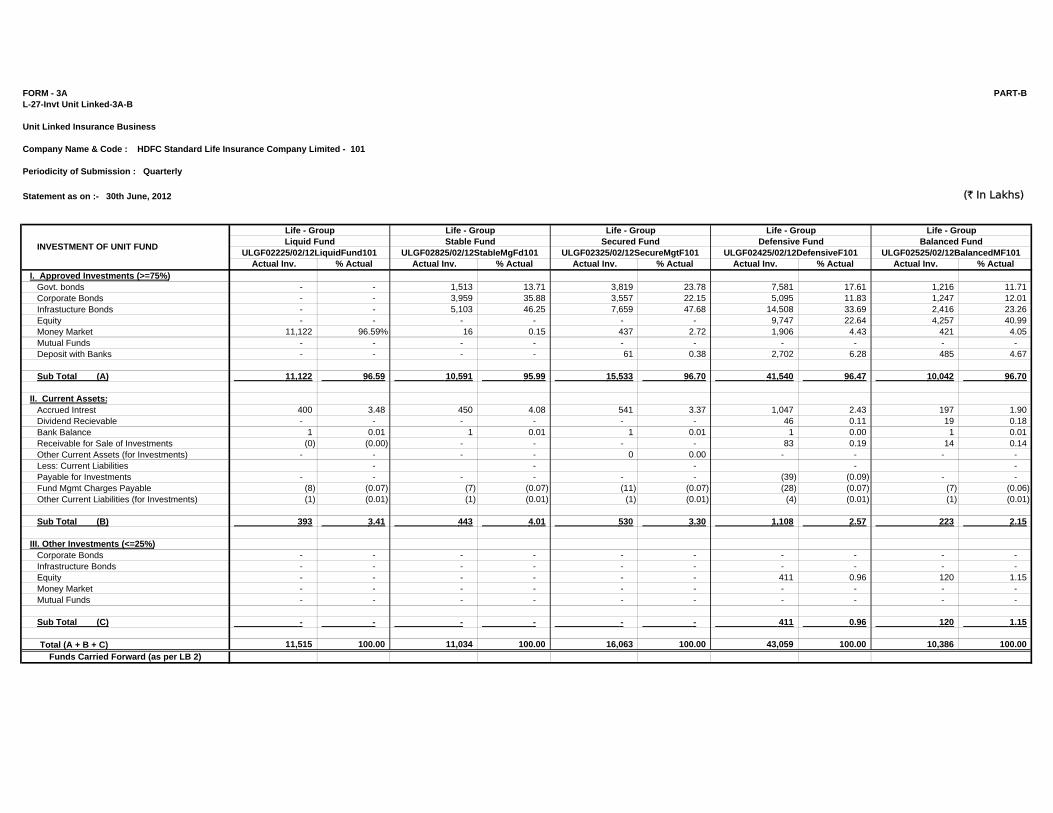
Govt. bonds - - 1,513 13.71 3,819 23.78 7,581 17.61 1,216 11.71 Corporate Bonds - - 3,959 35.88 3,557 22.15 5,095 11.83 1,247 12.01 Infrastucture Bonds - - 5,103 46.25 7,659 47.68 14,508 33.69 2,416 23.26 Equity - - - - - - 9,747 22.64 4,257 40.99 Money Market 11,122 96.59% 16 0.15 437 2.72 1,906 4.43 421 4.05 Mutual Funds - - - - - - - - - - Deposit with Banks - - - - 61 0.38 2,702 6.28 485 4.67
Sub Total (A) 11,122 96.59 10,591 95.99 15,533 96.70 41,540 96.47 10,042 96.70
II. Current Assets:Accrued Intrest 400 3.48 450 4.08 541 3.37 1,047 2.43 197 1.90 Dividend Recievable - - - - - - 46 0.11 19 0.18 Bank Balance 1 0.01 1 0.01 1 0.01 1 0.00 1 0.01 Receivable for Sale of Investments (0) (0.00) - - - - 83 0.19 14 0.14 Other Current Assets (for Investments) - - - - 0 0.00 - - - - Less: Current Liabilities - - - - - Payable for Investments - - - - - - (39) (0.09) - - Fund Mgmt Charges Payable (8) (0.07) (7) (0.07) (11) (0.07) (28) (0.07) (7) (0.06) Other Current Liabilities (for Investments) (1) (0.01) (1) (0.01) (1) (0.01) (4) (0.01) (1) (0.01)
Sub Total (B) 393 3.41 443 4.01 530 3.30 1,108 2.57 223 2.15
III. Other Investments (<=25%)Corporate Bonds - - - - - - - - - - Infrastructure Bonds - - - - - - - - - - Equity - - - - - - 411 0.96 120 1.15 Money Market - - - - - - - - - - Mutual Funds - - - - - - - - - -
Sub Total (C) - - - - - - 411 0.96 120 1.15
Total (A + B + C) 11,515 100.00 11,034 100.00 16,063 100.00 43,059 100.00 10,386 100.00
Funds Carried Forward (as per LB 2)
ULGF02425/02/12DefensiveF101 ULGF02525/02/12BalancedMF101
Life - Group Life - GroupDefensive Fund Balanced Fund
INVESTMENT OF UNIT FUND
Life - Group Life - Group Life - Group
ULGF02225/02/12LiquidFund101 ULGF02825/02/12StableMgFd101 ULGF02325/02/12SecureMgtF101Liquid Fund Stable Fund Secured Fund
FORM - 3A PART-BL-27-Invt Unit Linked-3A-B
Unit Linked Insurance Business
Company Name & Code : HDFC Standard Life Insurance Company Limited - 101
Periodicity of Submission : Quarterly
Statement as on :- 30th June, 2012 (` In Lakhs)
Actual Inv. % Actual Actual Inv. % Actual Actual Inv. % Actual Actual Inv. % Actual Actual Inv. % Actual Actual Inv. % Actual Actual Inv. % Actual Actual Inv. % ActualI. Approved Investments (>=75%)
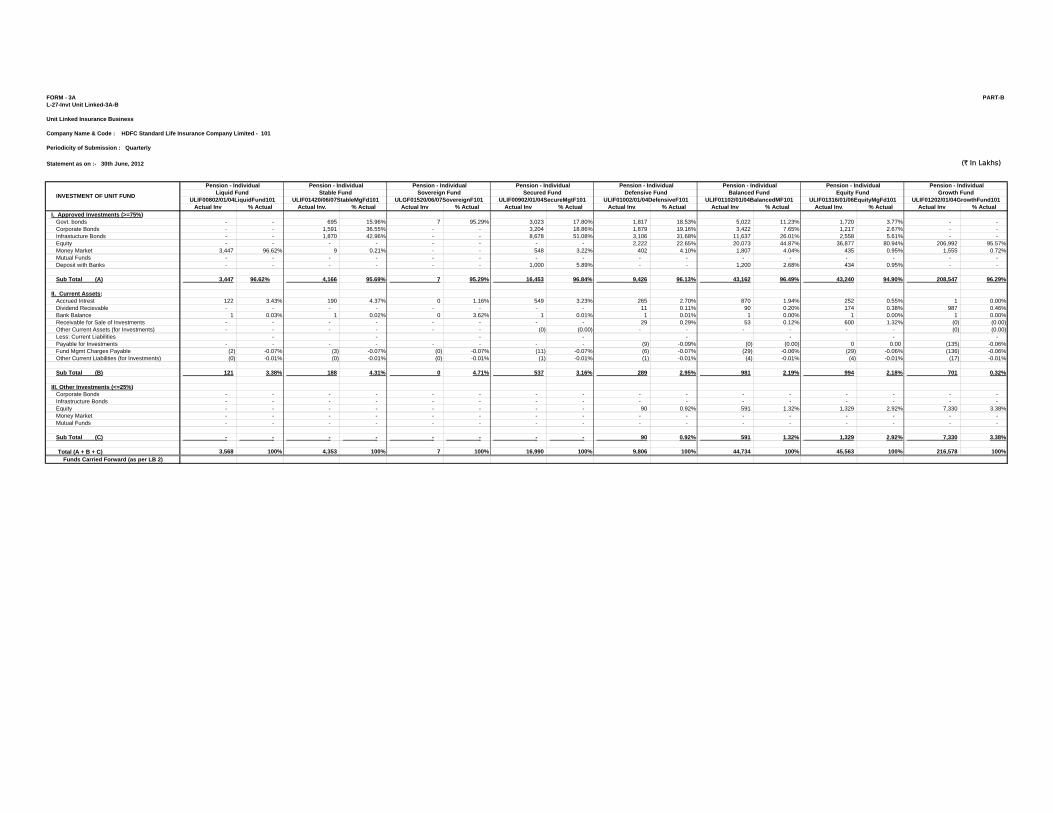
Govt. bonds - - 695 15.96% 7 95.29% 3,023 17.80% 1,817 18.53% 5,022 11.23% 1,720 3.77% - - Corporate Bonds - - 1,591 36.55% - - 3,204 18.86% 1,879 19.16% 3,422 7.65% 1,217 2.67% - - Infrastucture Bonds - - 1,870 42.96% - - 8,678 51.08% 3,106 31.68% 11,637 26.01% 2,558 5.61% - - Equity - - - - - - - - 2,222 22.65% 20,073 44.87% 36,877 80.94% 206,992 95.57%Money Market 3,447 96.62% 9 0.21% - - 548 3.22% 402 4.10% 1,807 4.04% 435 0.95% 1,555 0.72%Mutual Funds - - - - - - - - - - - - - - - - Deposit with Banks - - - - - - 1,000 5.89% - - 1,200 2.68% 434 0.95% - -
Sub Total (A) 3,447 96.62% 4,166 95.69% 7 95.29% 16,453 96.84% 9,426 96.13% 43,162 96.49% 43,240 94.90% 208,547 96.29%
II. Current Assets:Accrued Intrest 122 3.43% 190 4.37% 0 1.16% 549 3.23% 265 2.70% 870 1.94% 252 0.55% 1 0.00%Dividend Recievable - - - - - - - - 11 0.11% 90 0.20% 174 0.38% 987 0.46%Bank Balance 1 0.03% 1 0.02% 0 3.62% 1 0.01% 1 0.01% 1 0.00% 1 0.00% 1 0.00%Receivable for Sale of Investments - - - - - - - - 29 0.29% 53 0.12% 600 1.32% (0) (0.00) Other Current Assets (for Investments) - - - - - - (0) (0.00) - - - - - - (0) (0.00) Less: Current Liabilities - - - - - - - - Payable for Investments - - - - - - - - (9) -0.09% (0) (0.00) 0 0.00 (135) -0.06%Fund Mgmt Charges Payable (2) -0.07% (3) -0.07% (0) -0.07% (11) -0.07% (6) -0.07% (29) -0.06% (29) -0.06% (136) -0.06%Other Current Liabilities (for Investments) (0) -0.01% (0) -0.01% (0) -0.01% (1) -0.01% (1) -0.01% (4) -0.01% (4) -0.01% (17) -0.01%
Sub Total (B) 121 3.38% 188 4.31% 0 4.71% 537 3.16% 289 2.95% 981 2.19% 994 2.18% 701 0.32%
III. Other Investments (<=25%)Corporate Bonds - - - - - - - - - - - - - - - - Infrastructure Bonds - - - - - - - - - - - - - - - - Equity - - - - - - - - 90 0.92% 591 1.32% 1,329 2.92% 7,330 3.38%Money Market - - - - - - - - - - - - - - - - Mutual Funds - - - - - - - - - - - - - - - -
Sub Total (C) - - - - - - - - 90 0.92% 591 1.32% 1,329 2.92% 7,330 3.38%
Total (A + B + C) 3,568 100% 4,353 100% 7 100% 16,990 100% 9,806 100% 44,734 100% 45,563 100% 216,578 100%Funds Carried Forward (as per LB 2)
Pension - Individual Pension - IndividualStable Fund Sovereign Fund Secured Fund Defensive Fund
Pension - Individual Pension - Individual Pension - IndividualEquity Fund Growth FundBalanced Fund
ULIF01202/01/04GrowthFund101ULIF00902/01/04SecureMgtF101 ULIF01002/01/04DefensiveF101 ULIF01102/01/04BalancedMF101 ULIF01316/01/06EquityMgFd101INVESTMENT OF UNIT FUND
Pension - Individual Pension - Individual Pension - Individual
ULIF00802/01/04LiquidFund101 ULIF01420/06/07StableMgFd101 ULGF01520/06/07SovereignF101Liquid Fund
FORM - 3A PART-BL-27-Invt Unit Linked-3A-B
Unit Linked Insurance Business
Company Name & Code : HDFC Standard Life Insurance Company Limited - 101
Periodicity of Submission : Quarterly
Statement as on :- 30th June, 2012 (` In Lakhs)
Actual Inv. % Actual Actual Inv. % Actual Actual Inv. % Actual Actual Inv. % Actual Actual Inv. % Actual Actual Inv. % ActualI. Approved Investments (>=75%)
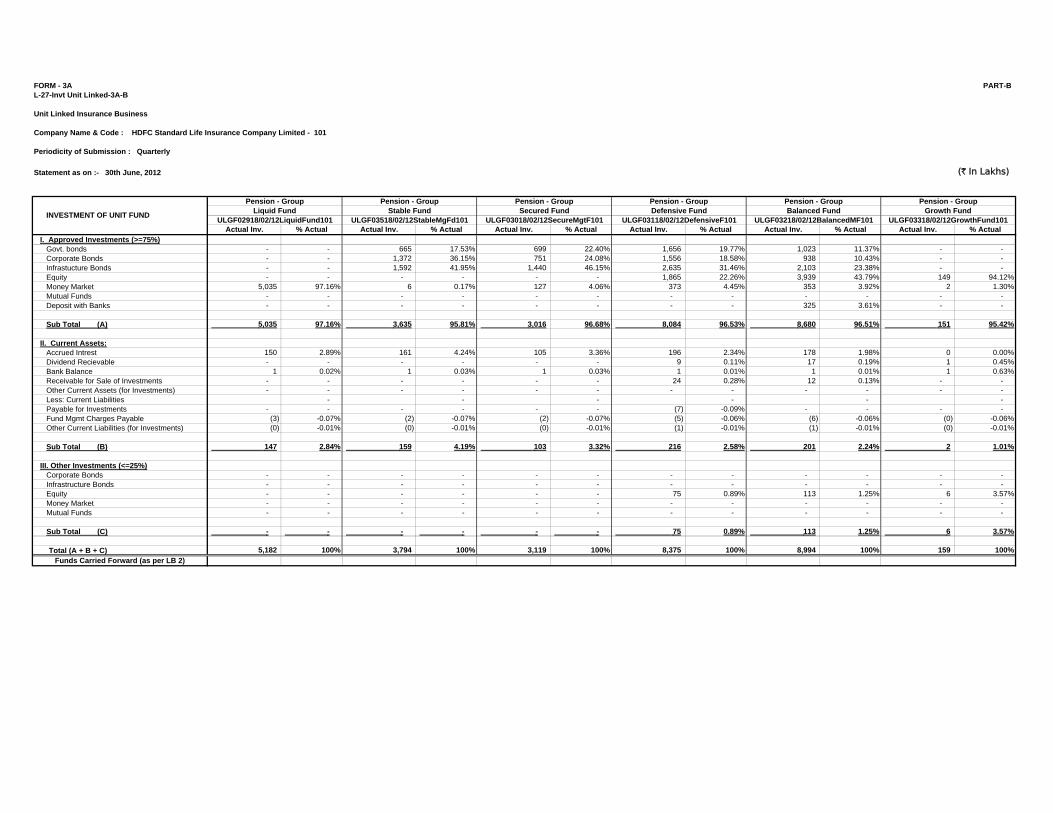
Govt. bonds - - 665 17.53% 699 22.40% 1,656 19.77% 1,023 11.37% - - Corporate Bonds - - 1,372 36.15% 751 24.08% 1,556 18.58% 938 10.43% - - Infrastucture Bonds - - 1,592 41.95% 1,440 46.15% 2,635 31.46% 2,103 23.38% - - Equity - - - - - - 1,865 22.26% 3,939 43.79% 149 94.12%Money Market 5,035 97.16% 6 0.17% 127 4.06% 373 4.45% 353 3.92% 2 1.30%Mutual Funds - - - - - - - - - - - - Deposit with Banks - - - - - - - - 325 3.61% - -
Sub Total (A) 5,035 97.16% 3,635 95.81% 3,016 96.68% 8,084 96.53% 8,680 96.51% 151 95.42%
II. Current Assets:Accrued Intrest 150 2.89% 161 4.24% 105 3.36% 196 2.34% 178 1.98% 0 0.00%Dividend Recievable - - - - - - 9 0.11% 17 0.19% 1 0.45%Bank Balance 1 0.02% 1 0.03% 1 0.03% 1 0.01% 1 0.01% 1 0.63%Receivable for Sale of Investments - - - - - - 24 0.28% 12 0.13% - - Other Current Assets (for Investments) - - - - - - - - - - - - Less: Current Liabilities - - - - - - Payable for Investments - - - - - - (7) -0.09% - - - - Fund Mgmt Charges Payable (3) -0.07% (2) -0.07% (2) -0.07% (5) -0.06% (6) -0.06% (0) -0.06%Other Current Liabilities (for Investments) (0) -0.01% (0) -0.01% (0) -0.01% (1) -0.01% (1) -0.01% (0) -0.01%
Sub Total (B) 147 2.84% 159 4.19% 103 3.32% 216 2.58% 201 2.24% 2 1.01%
III. Other Investments (<=25%)Corporate Bonds - - - - - - - - - - - - Infrastructure Bonds - - - - - - - - - - - - Equity - - - - - - 75 0.89% 113 1.25% 6 3.57%Money Market - - - - - - - - - - - - Mutual Funds - - - - - - - - - - - -
Sub Total (C) - - - - - - 75 0.89% 113 1.25% 6 3.57%
Total (A + B + C) 5,182 100% 3,794 100% 3,119 100% 8,375 100% 8,994 100% 159 100%
Funds Carried Forward (as per LB 2)
ULGF03318/02/12GrowthFund101
Pension - GroupLiquid Fund Stable Fund Secured Fund Defensive Fund Balanced Fund Growth Fund
Pension - Group Pension - Group
ULGF03218/02/12BalancedMF101INVESTMENT OF UNIT FUND
Pension - Group Pension - Group Pension - Group
ULGF02918/02/12LiquidFund101 ULGF03518/02/12StableMgFd101 ULGF03018/02/12SecureMgtF101 ULGF03118/02/12DefensiveF101
FORM - 3A PART-BL-27-Invt Unit Linked-3A-B
Unit Linked Insurance Business
Company Name & Code : HDFC Standard Life Insurance Company Limited - 101
Periodicity of Submission : Quarterly
Statement as on :- 30th June, 2012 (` In Lakhs)
Actual Inv. % Actual Actual Inv. % Actual Actual Inv. % Actual Actual Inv. % Actual Actual Inv. % Actual Actual Inv. % Actual Actual Inv. % ActualI. Approved Investments (>=75%)
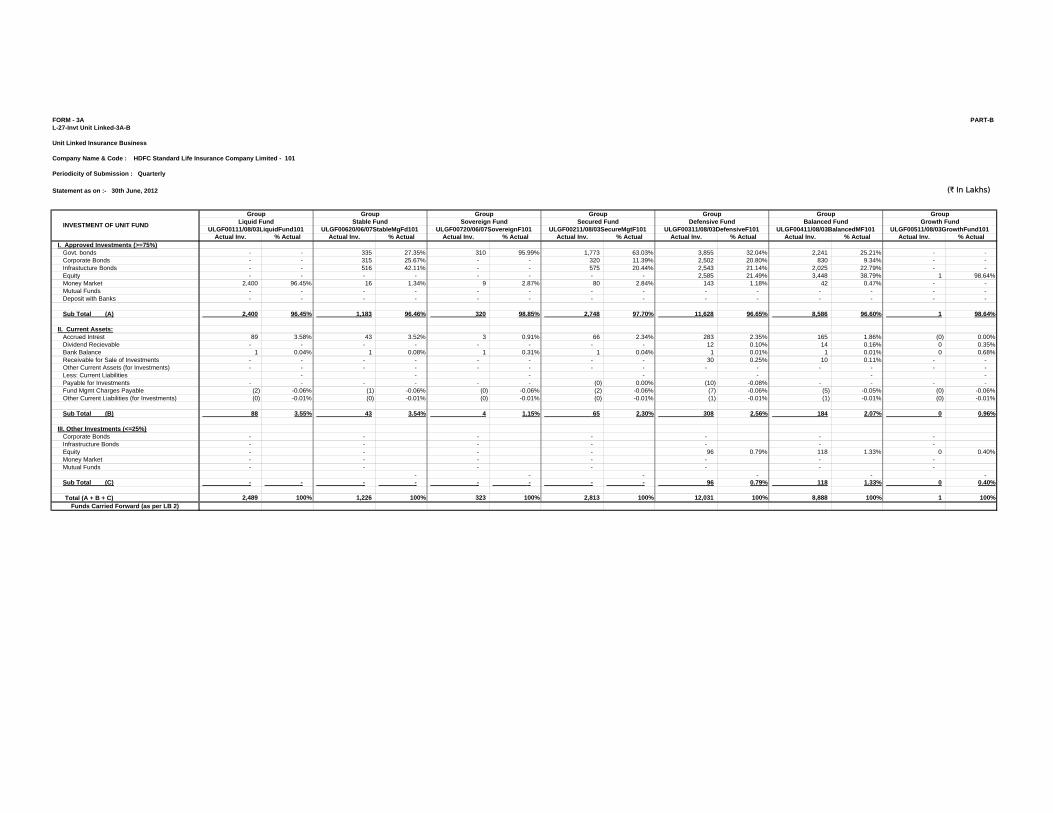
Govt. bonds - - 335 27.35% 310 95.99% 1,773 63.03% 3,855 32.04% 2,241 25.21% - - Corporate Bonds - - 315 25.67% - - 320 11.39% 2,502 20.80% 830 9.34% - - Infrastucture Bonds - - 516 42.11% - - 575 20.44% 2,543 21.14% 2,025 22.79% - - Equity - - - - - - - - 2,585 21.49% 3,448 38.79% 1 98.64%Money Market 2,400 96.45% 16 1.34% 9 2.87% 80 2.84% 143 1.18% 42 0.47% - - Mutual Funds - - - - - - - - - - - - - - Deposit with Banks - - - - - - - - - - - - - -
Sub Total (A) 2,400 96.45% 1,183 96.46% 320 98.85% 2,748 97.70% 11,628 96.65% 8,586 96.60% 1 98.64%
II. Current Assets:Accrued Intrest 89 3.58% 43 3.52% 3 0.91% 66 2.34% 283 2.35% 165 1.86% (0) 0.00%Dividend Recievable - - - - - - - - 12 0.10% 14 0.16% 0 0.35%Bank Balance 1 0.04% 1 0.08% 1 0.31% 1 0.04% 1 0.01% 1 0.01% 0 0.68%Receivable for Sale of Investments - - - - - - - - 30 0.25% 10 0.11% - - Other Current Assets (for Investments) - - - - - - - - - - - - - - Less: Current Liabilities - - - - - - - Payable for Investments - - - - - - (0) 0.00% (10) -0.08% - - - - Fund Mgmt Charges Payable (2) -0.06% (1) -0.06% (0) -0.06% (2) -0.06% (7) -0.06% (5) -0.05% (0) -0.06%Other Current Liabilities (for Investments) (0) -0.01% (0) -0.01% (0) -0.01% (0) -0.01% (1) -0.01% (1) -0.01% (0) -0.01%
Sub Total (B) 88 3.55% 43 3.54% 4 1.15% 65 2.30% 308 2.56% 184 2.07% 0 0.96%
III. Other Investments (<=25%)Corporate Bonds - - - - - - - Infrastructure Bonds - - - - - - - Equity - - - - 96 0.79% 118 1.33% 0 0.40%Money Market - - - - - - - Mutual Funds - - - - - - -
- - - - - - Sub Total (C) - - - - - - - - 96 0.79% 118 1.33% 0 0.40%
Total (A + B + C) 2,489 100% 1,226 100% 323 100% 2,813 100% 12,031 100% 8,888 100% 1 100%Funds Carried Forward (as per LB 2)
Group GroupLiquid Fund Stable Fund Sovereign Fund Secured Fund Defensive Fund
Group GroupBalanced Fund
INVESTMENT OF UNIT FUND
Group Group Group
ULGF00720/06/07SovereignF101Growth Fund
ULGF00411/08/03BalancedMF101 ULGF00511/08/03GrowthFund101ULGF00111/08/03LiquidFund101 ULGF00620/06/07StableMgFd101 ULGF00311/08/03DefensiveF101ULGF00211/08/03SecureMgtF101
FORM - 3A PART-BL-27-Invt Unit Linked-3A-B
Unit Linked Insurance Business
Company Name & Code : HDFC Standard Life Insurance Company Limited - 101
Periodicity of Submission : Quarterly
Statement as on :- 30th June, 2012 (` In Lakhs)
Actual Inv. % Actual Actual Inv. % Actual Actual Inv. % Actual Actual Inv. % Actual Actual Inv. % ActualI. Approved Investments (>=75%)
Govt. bonds - - 557 97.29% 596 50.04% 1,284 33.07% 662 30.20%Corporate Bonds - - - - 262 22.00% 298 7.68% 51 2.32%Infrastucture Bonds - - - - 252 21.15% 1,240 31.94% 375 17.13%Equity - - - - - - 857 22.08% 950 43.35%Money Market 0 95.58% 3 0.53% 48 4.01% 77 1.98% 87 3.96%Mutual Funds - - - - - - - - - - Deposit with Banks - - - - - - - - - -
Sub Total (A) 0 95.58% 561 97.82% 1,158 97.20% 3,755 96.75% 2,125 96.96%
II. Current Assets:Accrued Intrest 0 0.01% 12 2.08% 33 2.79% 88 2.27% 32 1.47%Dividend Recievable - - - - - - 4 0.10% 4 0.20%Bank Balance 0 0.85% 1 0.17% 1 0.08% 1 0.03% 1 0.05%Receivable for Sale of Investments - - - - - - 10 0.26% 3 0.13%Other Current Assets (for Investments) - - - - - - - - - - Less: Current Liabilities - - - - - Payable for Investments - - - - - - (3) -0.09% - - Fund Mgmt Charges Payable (0) -0.06% (0) -0.06% (1) -0.06% (2) -0.06% (1) -0.06%Other Current Liabilities (for Investments) 0 3.62% (0) -0.01% (0) -0.01% (0) -0.01% (0) -0.01%
Sub Total (B) 0 4.42% 13 2.18% 33 2.80% 97 2.50% 39 1.78%
III. Other Investments (<=25%)Corporate Bonds - - - - - - - - - - Infrastructure Bonds - - - - - - - - - - Equity - - - - - - 29 0.75% 28 1.26%Money Market - - - - - - - - - - Mutual Funds - - - - - - - - - -
Sub Total (C) - - - - - - 29 0.75% 28 1.26%
Total (A + B + C) 0 100% 573 100% 1,191 100% 3,882 100% 2,192 100%
Funds Carried Forward (as per LB 2)
ULGF01028/03/05DefensiveF101 ULGF01128/03/05BalancedMF101
Defined Benefit Pension Defined Benefit PensionDefensive Fund Balanced Fund
INVESTMENT OF UNIT FUND
Defined Benefit Pension Defined Benefit Pension Defined Benefit Pension
ULGF00828/03/05LiquidFund101 ULGF01420/06/07SovereignF101 ULGF00928/03/05SecureMgtF101Liquid Fund Sovereign Fund Secured Fund
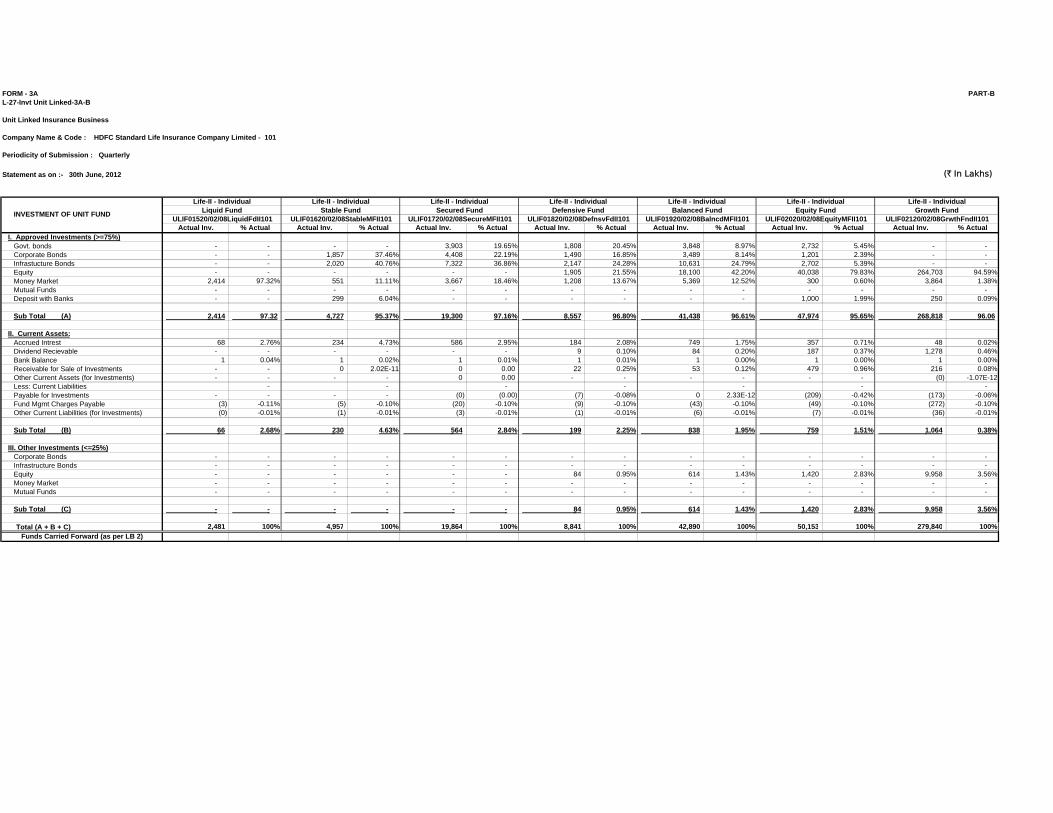
FORM - 3A PART-BL-27-Invt Unit Linked-3A-B
Unit Linked Insurance Business
Company Name & Code : HDFC Standard Life Insurance Company Limited - 101
Periodicity of Submission : Quarterly
Statement as on :- 30th June, 2012 (` In Lakhs)
Actual Inv. % Actual Actual Inv. % Actual Actual Inv. % Actual Actual Inv. % Actual Actual Inv. % Actual Actual Inv. % Actual Actual Inv. % ActualI. Approved Investments (>=75%)
Govt. bonds - - - - 3,903 19.65% 1,808 20.45% 3,848 8.97% 2,732 5.45% - - Corporate Bonds - - 1,857 37.46% 4,408 22.19% 1,490 16.85% 3,489 8.14% 1,201 2.39% - - Infrastucture Bonds - - 2,020 40.76% 7,322 36.86% 2,147 24.28% 10,631 24.79% 2,702 5.39% - - Equity - - - - - - 1,905 21.55% 18,100 42.20% 40,038 79.83% 264,703 94.59%Money Market 2,414 97.32% 551 11.11% 3,667 18.46% 1,208 13.67% 5,369 12.52% 300 0.60% 3,864 1.38%Mutual Funds - - - - - - - - - - - - - - Deposit with Banks - - 299 6.04% - - - - - - 1,000 1.99% 250 0.09%
Sub Total (A) 2,414 97.32 4,727 95.37% 19,300 97.16% 8,557 96.80% 41,438 96.61% 47,974 95.65% 268,818 96.06
II. Current Assets:Accrued Intrest 68 2.76% 234 4.73% 586 2.95% 184 2.08% 749 1.75% 357 0.71% 48 0.02%Dividend Recievable - - - - - - 9 0.10% 84 0.20% 187 0.37% 1,278 0.46%Bank Balance 1 0.04% 1 0.02% 1 0.01% 1 0.01% 1 0.00% 1 0.00% 1 0.00%Receivable for Sale of Investments - - 0 2.02E-11 0 0.00 22 0.25% 53 0.12% 479 0.96% 216 0.08%Other Current Assets (for Investments) - - - - 0 0.00 - - - - - - (0) -1.07E-12Less: Current Liabilities - - - - - - - Payable for Investments - - - - (0) (0.00) (7) -0.08% 0 2.33E-12 (209) -0.42% (173) -0.06%Fund Mgmt Charges Payable (3) -0.11% (5) -0.10% (20) -0.10% (9) -0.10% (43) -0.10% (49) -0.10% (272) -0.10%Other Current Liabilities (for Investments) (0) -0.01% (1) -0.01% (3) -0.01% (1) -0.01% (6) -0.01% (7) -0.01% (36) -0.01%
Sub Total (B) 66 2.68% 230 4.63% 564 2.84% 199 2.25% 838 1.95% 759 1.51% 1,064 0.38%
III. Other Investments (<=25%)Corporate Bonds - - - - - - - - - - - - - - Infrastructure Bonds - - - - - - - - - - - - - - Equity - - - - - - 84 0.95% 614 1.43% 1,420 2.83% 9,958 3.56%Money Market - - - - - - - - - - - - - - Mutual Funds - - - - - - - - - - - - - -
Sub Total (C) - - - - - - 84 0.95% 614 1.43% 1,420 2.83% 9,958 3.56%
Total (A + B + C) 2,481 100% 4,957 100% 19,864 100% 8,841 100% 42,890 100% 50,153 100% 279,840 100%Funds Carried Forward (as per LB 2)
Life-II - Individual Life-II - IndividualLiquid Fund Stable Fund Secured Fund Defensive Fund Balanced Fund
Life-II - Individual Life-II - IndividualEquity Fund
INVESTMENT OF UNIT FUND
Life-II - Individual Life-II - Individual Life-II - Individual
ULIF01720/02/08SecureMFII101Growth Fund
ULIF02020/02/08EquityMFII101 ULIF02120/02/08GrwthFndII101ULIF01520/02/08LiquidFdII101 ULIF01620/02/08StableMFII101 ULIF01920/02/08BalncdMFII101ULIF01820/02/08DefnsvFdII101
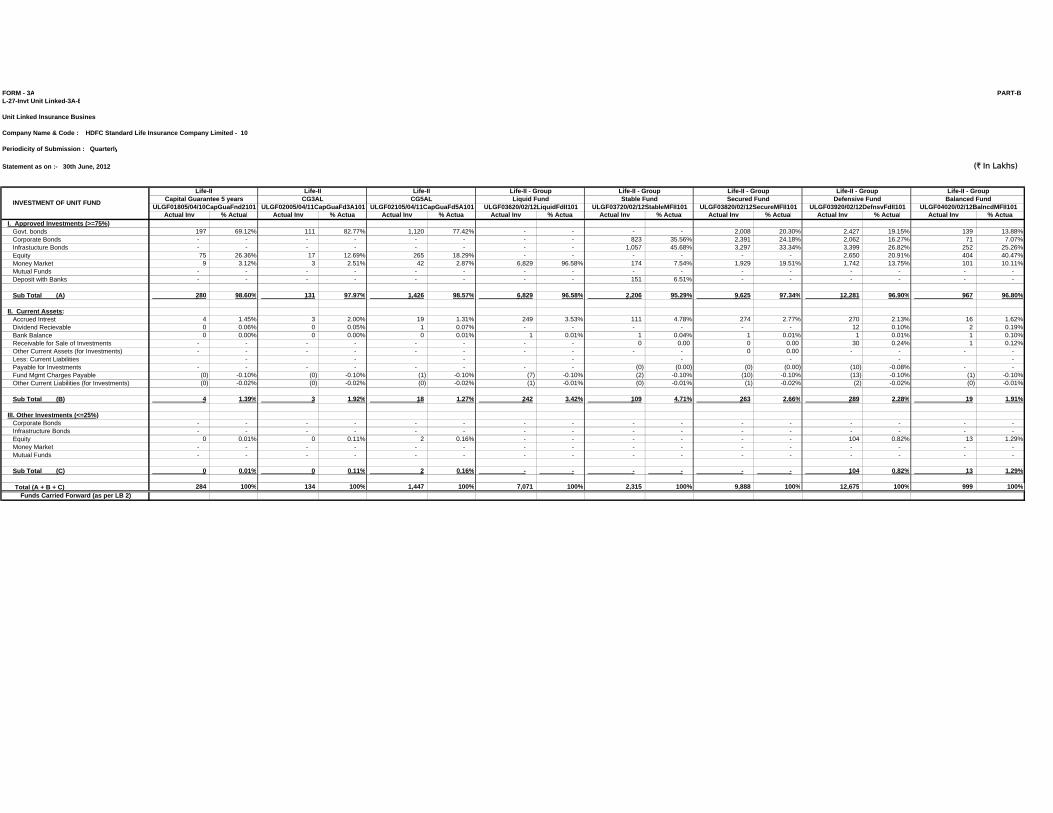
FORM - 3A PART-BL-27-Invt Unit Linked-3A-B
Unit Linked Insurance Business
Company Name & Code : HDFC Standard Life Insurance Company Limited - 101
Periodicity of Submission : Quarterly
Statement as on :- 30th June, 2012 (` In Lakhs)
Actual Inv % Actual Actual Inv % Actual Actual Inv % Actual Actual Inv % Actual Actual Inv % Actual Actual Inv % Actual Actual Inv % Actual Actual Inv % ActualI. Approved Investments (>=75%)
Govt. bonds 197 69.12% 111 82.77% 1,120 77.42% - - - - 2,008 20.30% 2,427 19.15% 139 13.88%Corporate Bonds - - - - - - - - 823 35.56% 2,391 24.18% 2,062 16.27% 71 7.07%Infrastucture Bonds - - - - - - - - 1,057 45.68% 3,297 33.34% 3,399 26.82% 252 25.26%Equity 75 26.36% 17 12.69% 265 18.29% - - - - - - 2,650 20.91% 404 40.47%Money Market 9 3.12% 3 2.51% 42 2.87% 6,829 96.58% 174 7.54% 1,929 19.51% 1,742 13.75% 101 10.11%Mutual Funds - - - - - - - - - - - - - - - - Deposit with Banks - - - - - - - - 151 6.51% - - - - - -
Sub Total (A) 280 98.60% 131 97.97% 1,426 98.57% 6,829 96.58% 2,206 95.29% 9,625 97.34% 12,281 96.90% 967 96.80%
II. Current Assets:Accrued Intrest 4 1.45% 3 2.00% 19 1.31% 249 3.53% 111 4.78% 274 2.77% 270 2.13% 16 1.62%Dividend Recievable 0 0.06% 0 0.05% 1 0.07% - - - - - - 12 0.10% 2 0.19%Bank Balance 0 0.00% 0 0.00% 0 0.01% 1 0.01% 1 0.04% 1 0.01% 1 0.01% 1 0.10%Receivable for Sale of Investments - - - - - - - - 0 0.00 0 0.00 30 0.24% 1 0.12%Other Current Assets (for Investments) - - - - - - - - - - 0 0.00 - - - - Less: Current Liabilities - - - - - - - - Payable for Investments - - - - - - - - (0) (0.00) (0) (0.00) (10) -0.08% - - Fund Mgmt Charges Payable (0) -0.10% (0) -0.10% (1) -0.10% (7) -0.10% (2) -0.10% (10) -0.10% (13) -0.10% (1) -0.10%Other Current Liabilities (for Investments) (0) -0.02% (0) -0.02% (0) -0.02% (1) -0.01% (0) -0.01% (1) -0.02% (2) -0.02% (0) -0.01%
Sub Total (B) 4 1.39% 3 1.92% 18 1.27% 242 3.42% 109 4.71% 263 2.66% 289 2.28% 19 1.91%
III. Other Investments (<=25%)Corporate Bonds - - - - - - - - - - - - - - - - Infrastructure Bonds - - - - - - - - - - - - - - - - Equity 0 0.01% 0 0.11% 2 0.16% - - - - - - 104 0.82% 13 1.29%Money Market - - - - - - - - - - - - - - - - Mutual Funds - - - - - - - - - - - - - - - -
Sub Total (C) 0 0.01% 0 0.11% 2 0.16% - - - - - - 104 0.82% 13 1.29%
Total (A + B + C) 284 100% 134 100% 1,447 100% 7,071 100% 2,315 100% 9,888 100% 12,675 100% 999 100%
Funds Carried Forward (as per LB 2)
Life-II - Group Life-II - GroupCG3AL CG5AL Liquid Fund Stable Fund
Life-II - Group Life-II - Group Life-II - GroupDefensive Fund Balanced FundSecured Fund
ULGF04020/02/12BalncdMFII101ULGF03620/02/12LiquidFdII101 ULGF03720/02/12StableMFII101 ULGF03820/02/12SecureMFII101 ULGF03920/02/12DefnsvFdII101INVESTMENT OF UNIT FUND
Life-II Life-II Life-II
ULGF01805/04/10CapGuaFnd2101 ULGF02005/04/11CapGuaFd3A101 ULGF02105/04/11CapGuaFd5A101Capital Guarantee 5 years
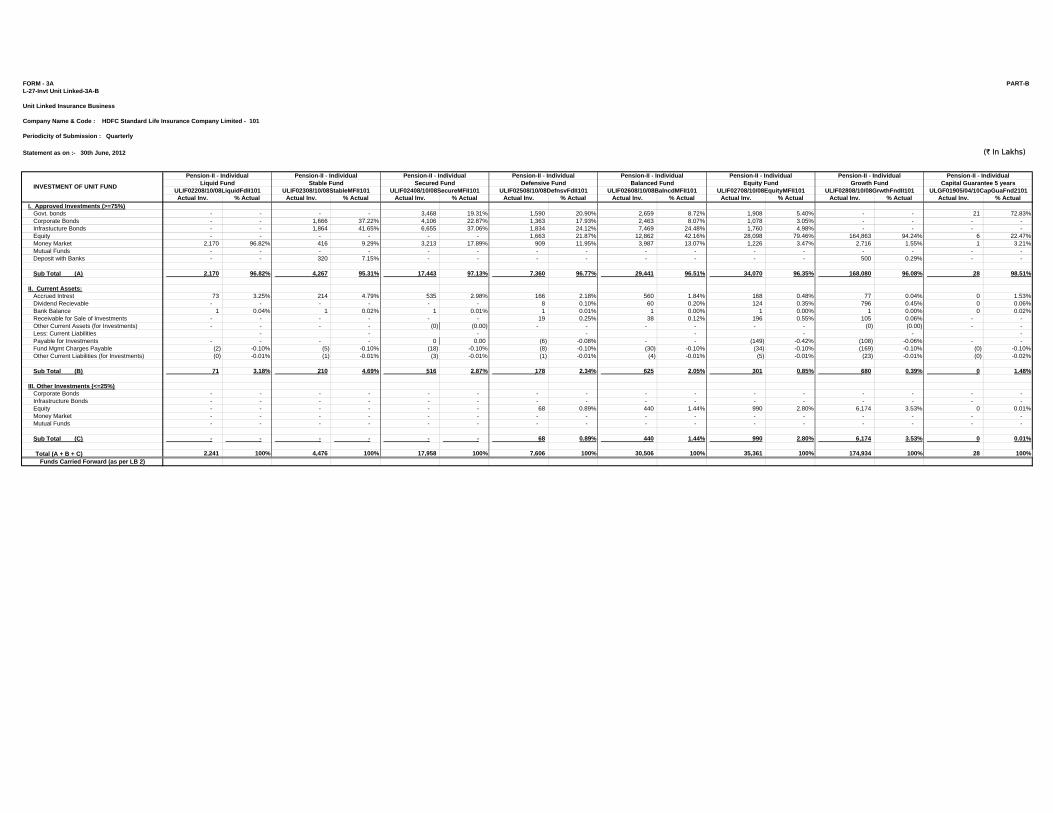
FORM - 3A PART-BL-27-Invt Unit Linked-3A-B
Unit Linked Insurance Business
Company Name & Code : HDFC Standard Life Insurance Company Limited - 101
Periodicity of Submission : Quarterly
Statement as on :- 30th June, 2012 (` In Lakhs)
Actual Inv. % Actual Actual Inv. % Actual Actual Inv. % Actual Actual Inv. % Actual Actual Inv. % Actual Actual Inv. % Actual Actual Inv. % Actual Actual Inv. % ActualI. Approved Investments (>=75%)
Govt. bonds - - - - 3,468 19.31% 1,590 20.90% 2,659 8.72% 1,908 5.40% - - 21 72.83%Corporate Bonds - - 1,666 37.22% 4,106 22.87% 1,363 17.93% 2,463 8.07% 1,078 3.05% - - - - Infrastucture Bonds - - 1,864 41.65% 6,655 37.06% 1,834 24.12% 7,469 24.48% 1,760 4.98% - - - - Equity - - - - - - 1,663 21.87% 12,862 42.16% 28,098 79.46% 164,863 94.24% 6 22.47%Money Market 2,170 96.82% 416 9.29% 3,213 17.89% 909 11.95% 3,987 13.07% 1,226 3.47% 2,716 1.55% 1 3.21%Mutual Funds - - - - - - - - - - - - - - - - Deposit with Banks - - 320 7.15% - - - - - - - - 500 0.29% - -
Sub Total (A) 2,170 96.82% 4,267 95.31% 17,443 97.13% 7,360 96.77% 29,441 96.51% 34,070 96.35% 168,080 96.08% 28 98.51%
II. Current Assets:Accrued Intrest 73 3.25% 214 4.79% 535 2.98% 166 2.18% 560 1.84% 168 0.48% 77 0.04% 0 1.53%Dividend Recievable - - - - - - 8 0.10% 60 0.20% 124 0.35% 796 0.45% 0 0.06%Bank Balance 1 0.04% 1 0.02% 1 0.01% 1 0.01% 1 0.00% 1 0.00% 1 0.00% 0 0.02%Receivable for Sale of Investments - - - - - - 19 0.25% 38 0.12% 196 0.55% 105 0.06% - - Other Current Assets (for Investments) - - - - (0) (0.00) - - - - - - (0) (0.00) - - Less: Current Liabilities - - - - - - - - Payable for Investments - - - - 0 0.00 (6) -0.08% - - (149) -0.42% (108) -0.06% - - Fund Mgmt Charges Payable (2) -0.10% (5) -0.10% (18) -0.10% (8) -0.10% (30) -0.10% (34) -0.10% (169) -0.10% (0) -0.10%Other Current Liabilities (for Investments) (0) -0.01% (1) -0.01% (3) -0.01% (1) -0.01% (4) -0.01% (5) -0.01% (23) -0.01% (0) -0.02%
Sub Total (B) 71 3.18% 210 4.69% 516 2.87% 178 2.34% 625 2.05% 301 0.85% 680 0.39% 0 1.48%
III. Other Investments (<=25%)Corporate Bonds - - - - - - - - - - - - - - - - Infrastructure Bonds - - - - - - - - - - - - - - - - Equity - - - - - - 68 0.89% 440 1.44% 990 2.80% 6,174 3.53% 0 0.01%Money Market - - - - - - - - - - - - - - - - Mutual Funds - - - - - - - - - - - - - - - -
Sub Total (C) - - - - - - 68 0.89% 440 1.44% 990 2.80% 6,174 3.53% 0 0.01%
Total (A + B + C) 2,241 100% 4,476 100% 17,958 100% 7,606 100% 30,506 100% 35,361 100% 174,934 100% 28 100%Funds Carried Forward (as per LB 2)
Pension-II - Individual Pension-II - IndividualStable Fund Secured Fund Defensive Fund Balanced Fund
Pension-II - Individual Pension-II - Individual Pension-II - IndividualGrowth Fund Capital Guarantee 5 yearsEquity Fund
ULGF01905/04/10CapGuaFnd2101ULIF02508/10/08DefnsvFdII101 ULIF02608/10/08BalncdMFII101 ULIF02708/10/08EquityMFII101 ULIF02808/10/08GrwthFndII101INVESTMENT OF UNIT FUND
Pension-II - Individual Pension-II - Individual Pension-II - Individual
ULIF02208/10/08LiquidFdII101 ULIF02308/10/08StableMFII101 ULIF02408/10/08SecureMFII101Liquid Fund
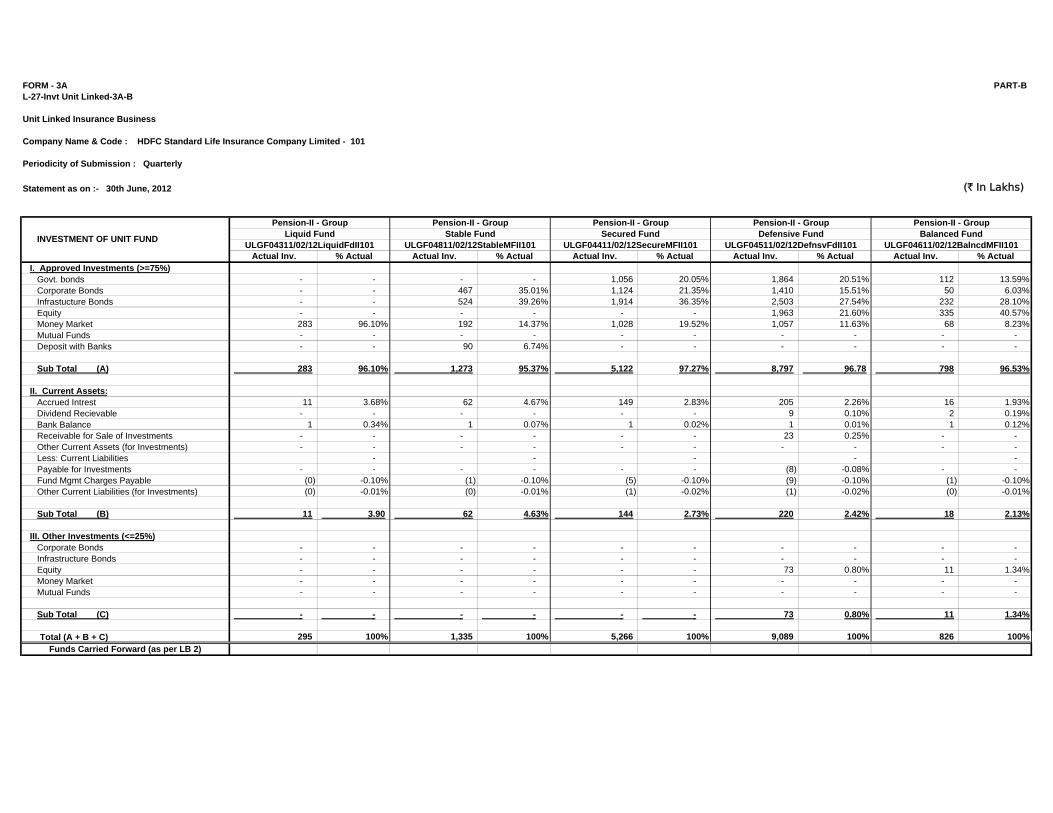
FORM - 3A PART-BL-27-Invt Unit Linked-3A-B
Unit Linked Insurance Business
Company Name & Code : HDFC Standard Life Insurance Company Limited - 101
Periodicity of Submission : Quarterly
Statement as on :- 30th June, 2012 (` In Lakhs)
Actual Inv. % Actual Actual Inv. % Actual Actual Inv. % Actual Actual Inv. % Actual Actual Inv. % ActualI. Approved Investments (>=75%)
Govt. bonds - - - - 1,056 20.05% 1,864 20.51% 112 13.59%Corporate Bonds - - 467 35.01% 1,124 21.35% 1,410 15.51% 50 6.03%Infrastucture Bonds - - 524 39.26% 1,914 36.35% 2,503 27.54% 232 28.10%Equity - - - - - - 1,963 21.60% 335 40.57%Money Market 283 96.10% 192 14.37% 1,028 19.52% 1,057 11.63% 68 8.23%Mutual Funds - - - - - - - - - - Deposit with Banks - - 90 6.74% - - - - - -
Sub Total (A) 283 96.10% 1,273 95.37% 5,122 97.27% 8,797 96.78 798 96.53%
II. Current Assets:Accrued Intrest 11 3.68% 62 4.67% 149 2.83% 205 2.26% 16 1.93%Dividend Recievable - - - - - - 9 0.10% 2 0.19%Bank Balance 1 0.34% 1 0.07% 1 0.02% 1 0.01% 1 0.12%Receivable for Sale of Investments - - - - - - 23 0.25% - - Other Current Assets (for Investments) - - - - - - - - - - Less: Current Liabilities - - - - - Payable for Investments - - - - - - (8) -0.08% - - Fund Mgmt Charges Payable (0) -0.10% (1) -0.10% (5) -0.10% (9) -0.10% (1) -0.10%Other Current Liabilities (for Investments) (0) -0.01% (0) -0.01% (1) -0.02% (1) -0.02% (0) -0.01%
Sub Total (B) 11 3.90 62 4.63% 144 2.73% 220 2.42% 18 2.13%
III. Other Investments (<=25%)Corporate Bonds - - - - - - - - - - Infrastructure Bonds - - - - - - - - - - Equity - - - - - - 73 0.80% 11 1.34%Money Market - - - - - - - - - - Mutual Funds - - - - - - - - - -
Sub Total (C) - - - - - - 73 0.80% 11 1.34%
Total (A + B + C) 295 100% 1,335 100% 5,266 100% 9,089 100% 826 100%
Funds Carried Forward (as per LB 2)
ULGF04511/02/12DefnsvFdII101 ULGF04611/02/12BalncdMFII101
Pension-II - Group Pension-II - GroupDefensive Fund Balanced Fund
INVESTMENT OF UNIT FUND
Pension-II - Group Pension-II - Group Pension-II - Group
ULGF04311/02/12LiquidFdII101 ULGF04811/02/12StableMFII101 ULGF04411/02/12SecureMFII101Liquid Fund Stable Fund Secured Fund
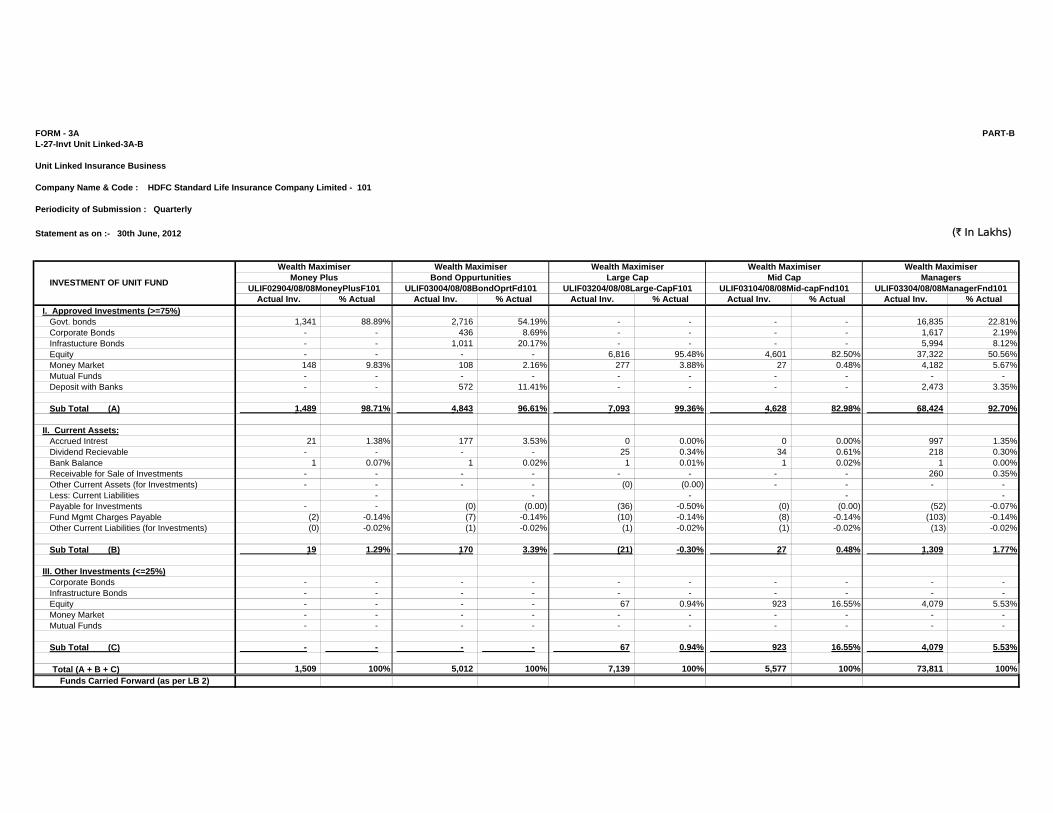
FORM - 3A PART-BL-27-Invt Unit Linked-3A-B
Unit Linked Insurance Business
Company Name & Code : HDFC Standard Life Insurance Company Limited - 101
Periodicity of Submission : Quarterly
Statement as on :- 30th June, 2012 (` In Lakhs)
Actual Inv. % Actual Actual Inv. % Actual Actual Inv. % Actual Actual Inv. % Actual Actual Inv. % ActualI. Approved Investments (>=75%)
Govt. bonds 1,341 88.89% 2,716 54.19% - - - - 16,835 22.81%Corporate Bonds - - 436 8.69% - - - - 1,617 2.19%Infrastucture Bonds - - 1,011 20.17% - - - - 5,994 8.12%Equity - - - - 6,816 95.48% 4,601 82.50% 37,322 50.56%Money Market 148 9.83% 108 2.16% 277 3.88% 27 0.48% 4,182 5.67%Mutual Funds - - - - - - - - - - Deposit with Banks - - 572 11.41% - - - - 2,473 3.35%
Sub Total (A) 1,489 98.71% 4,843 96.61% 7,093 99.36% 4,628 82.98% 68,424 92.70%
II. Current Assets:Accrued Intrest 21 1.38% 177 3.53% 0 0.00% 0 0.00% 997 1.35%Dividend Recievable - - - - 25 0.34% 34 0.61% 218 0.30%Bank Balance 1 0.07% 1 0.02% 1 0.01% 1 0.02% 1 0.00%Receivable for Sale of Investments - - - - - - - - 260 0.35%Other Current Assets (for Investments) - - - - (0) (0.00) - - - - Less: Current Liabilities - - - - - Payable for Investments - - (0) (0.00) (36) -0.50% (0) (0.00) (52) -0.07%Fund Mgmt Charges Payable (2) -0.14% (7) -0.14% (10) -0.14% (8) -0.14% (103) -0.14%Other Current Liabilities (for Investments) (0) -0.02% (1) -0.02% (1) -0.02% (1) -0.02% (13) -0.02%
Sub Total (B) 19 1.29% 170 3.39% (21) -0.30% 27 0.48% 1,309 1.77%
III. Other Investments (<=25%)Corporate Bonds - - - - - - - - - - Infrastructure Bonds - - - - - - - - - - Equity - - - - 67 0.94% 923 16.55% 4,079 5.53%Money Market - - - - - - - - - - Mutual Funds - - - - - - - - - -
Sub Total (C) - - - - 67 0.94% 923 16.55% 4,079 5.53%
Total (A + B + C) 1,509 100% 5,012 100% 7,139 100% 5,577 100% 73,811 100%
Funds Carried Forward (as per LB 2)
ULIF03104/08/08Mid-capFnd101 ULIF03304/08/08ManagerFnd101
Wealth Maximiser Wealth MaximiserMid Cap Managers
INVESTMENT OF UNIT FUND
Wealth Maximiser Wealth Maximiser Wealth Maximiser
ULIF02904/08/08MoneyPlusF101 ULIF03004/08/08BondOprtFd101 ULIF03204/08/08Large-CapF101Money Plus Bond Oppurtunities Large Cap
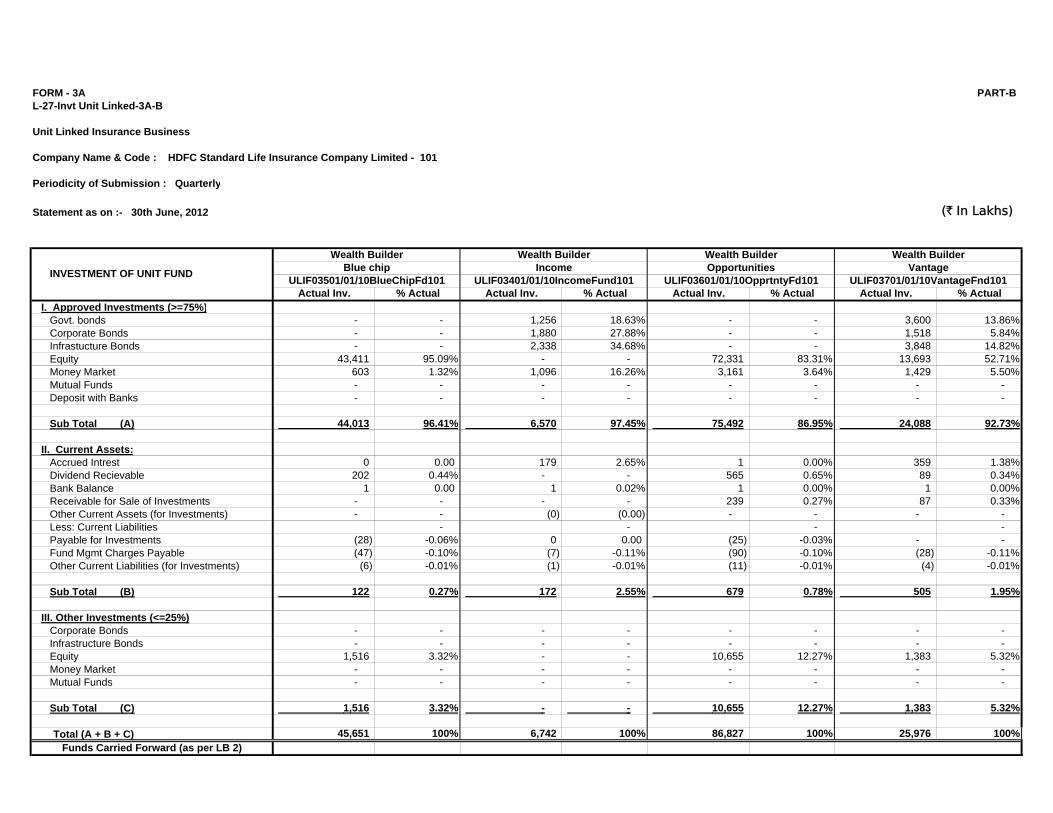
FORM - 3A PART-BL-27-Invt Unit Linked-3A-B
Unit Linked Insurance Business
Company Name & Code : HDFC Standard Life Insurance Company Limited - 101
Periodicity of Submission : Quarterly
Statement as on :- 30th June, 2012 (` In Lakhs)
Actual Inv. % Actual Actual Inv. % Actual Actual Inv. % Actual Actual Inv. % ActualI. Approved Investments (>=75%)
Govt. bonds - - 1,256 18.63% - - 3,600 13.86%Corporate Bonds - - 1,880 27.88% - - 1,518 5.84%Infrastucture Bonds - - 2,338 34.68% - - 3,848 14.82%Equity 43,411 95.09% - - 72,331 83.31% 13,693 52.71%Money Market 603 1.32% 1,096 16.26% 3,161 3.64% 1,429 5.50%Mutual Funds - - - - - - - - Deposit with Banks - - - - - - - -
Sub Total (A) 44,013 96.41% 6,570 97.45% 75,492 86.95% 24,088 92.73%
II. Current Assets:Accrued Intrest 0 0.00 179 2.65% 1 0.00% 359 1.38%Dividend Recievable 202 0.44% - - 565 0.65% 89 0.34%Bank Balance 1 0.00 1 0.02% 1 0.00% 1 0.00%Receivable for Sale of Investments - - - - 239 0.27% 87 0.33%Other Current Assets (for Investments) - - (0) (0.00) - - - - Less: Current Liabilities - - - - Payable for Investments (28) -0.06% 0 0.00 (25) -0.03% - - Fund Mgmt Charges Payable (47) -0.10% (7) -0.11% (90) -0.10% (28) -0.11%Other Current Liabilities (for Investments) (6) -0.01% (1) -0.01% (11) -0.01% (4) -0.01%
Sub Total (B) 122 0.27% 172 2.55% 679 0.78% 505 1.95%
III. Other Investments (<=25%)Corporate Bonds - - - - - - - - Infrastructure Bonds - - - - - - - - Equity 1,516 3.32% - - 10,655 12.27% 1,383 5.32%Money Market - - - - - - - - Mutual Funds - - - - - - - -
Sub Total (C) 1,516 3.32% - - 10,655 12.27% 1,383 5.32%
Total (A + B + C) 45,651 100% 6,742 100% 86,827 100% 25,976 100%Funds Carried Forward (as per LB 2)
ULIF03401/01/10IncomeFund101 ULIF03601/01/10OpprtntyFd101 ULIF03701/01/10VantageFnd101
Wealth BuilderBlue chip Income
INVESTMENT OF UNIT FUND
Wealth Builder Wealth Builder Wealth BuilderOpportunities Vantage
ULIF03501/01/10BlueChipFd101
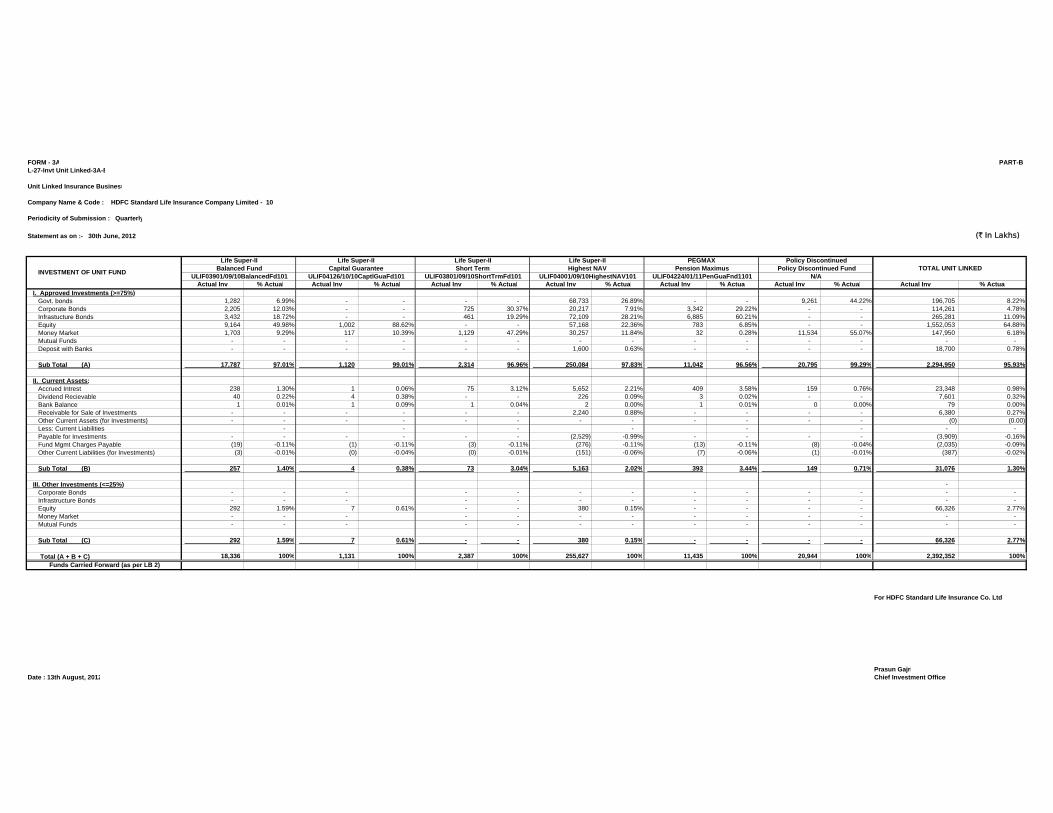
FORM - 3A PART-BL-27-Invt Unit Linked-3A-B
Unit Linked Insurance Business
Company Name & Code : HDFC Standard Life Insurance Company Limited - 101
Periodicity of Submission : Quarterly
Statement as on :- 30th June, 2012 (` In Lakhs)
Actual Inv % Actual Actual Inv % Actual Actual Inv % Actual Actual Inv % Actual Actual Inv % Actual Actual Inv % Actual Actual Inv % ActualI. Approved Investments (>=75%)
Govt. bonds 1,282 6.99% - - - - 68,733 26.89% - - 9,261 44.22% 196,705 8.22%Corporate Bonds 2,205 12.03% - - 725 30.37% 20,217 7.91% 3,342 29.22% - - 114,261 4.78%Infrastucture Bonds 3,432 18.72% - - 461 19.29% 72,109 28.21% 6,885 60.21% - - 265,281 11.09%Equity 9,164 49.98% 1,002 88.62% - - 57,168 22.36% 783 6.85% - - 1,552,053 64.88%Money Market 1,703 9.29% 117 10.39% 1,129 47.29% 30,257 11.84% 32 0.28% 11,534 55.07% 147,950 6.18%Mutual Funds - - - - - - - - - - - - - - Deposit with Banks - - - - - - 1,600 0.63% - - - - 18,700 0.78%
Sub Total (A) 17,787 97.01% 1,120 99.01% 2,314 96.96% 250,084 97.83% 11,042 96.56% 20,795 99.29% 2,294,950 95.93%
II. Current Assets:Accrued Intrest 238 1.30% 1 0.06% 75 3.12% 5,652 2.21% 409 3.58% 159 0.76% 23,348 0.98%Dividend Recievable 40 0.22% 4 0.38% - - 226 0.09% 3 0.02% - - 7,601 0.32%Bank Balance 1 0.01% 1 0.09% 1 0.04% 2 0.00% 1 0.01% 0 0.00% 79 0.00%Receivable for Sale of Investments - - - - - - 2,240 0.88% - - - - 6,380 0.27%Other Current Assets (for Investments) - - - - - - - - - - - - (0) (0.00) Less: Current Liabilities - - - - - - - - Payable for Investments - - - - - - (2,529) -0.99% - - - - (3,909) -0.16%Fund Mgmt Charges Payable (19) -0.11% (1) -0.11% (3) -0.11% (276) -0.11% (13) -0.11% (8) -0.04% (2,035) -0.09%Other Current Liabilities (for Investments) (3) -0.01% (0) -0.04% (0) -0.01% (151) -0.06% (7) -0.06% (1) -0.01% (387) -0.02%
Sub Total (B) 257 1.40% 4 0.38% 73 3.04% 5,163 2.02% 393 3.44% 149 0.71% 31,076 1.30%
III. Other Investments (<=25%) - Corporate Bonds - - - - - - - - - - - - - Infrastructure Bonds - - - - - - - - - - - - - Equity 292 1.59% 7 0.61% - - 380 0.15% - - - - 66,326 2.77%Money Market - - - - - - - - - - - - - Mutual Funds - - - - - - - - - - - - -
Sub Total (C) 292 1.59% 7 0.61% - - 380 0.15% - - - - 66,326 2.77%
Total (A + B + C) 18,336 100% 1,131 100% 2,387 100% 255,627 100% 11,435 100% 20,944 100% 2,392,352 100%
Funds Carried Forward (as per LB 2)
For HDFC Standard Life Insurance Co. Ltd
Prasun GajriDate : 13th August, 2012 Chief Investment Officer
N/A
Policy DiscontinuedTOTAL UNIT LINKEDBalanced Fund Capital Guarantee Short Term Highest NAV Pension Maximus Policy Discontinued Fund
ULIF03901/09/10BalancedFd101
PEGMAX
ULIF03801/09/10ShortTrmFd101 ULIF04001/09/10HighestNAV101 ULIF04224/01/11PenGuaFnd1101
Life Super-II Life Super-II
ULIF04126/10/10CaptlGuaFd101INVESTMENT OF UNIT FUND
Life Super-II Life Super-II
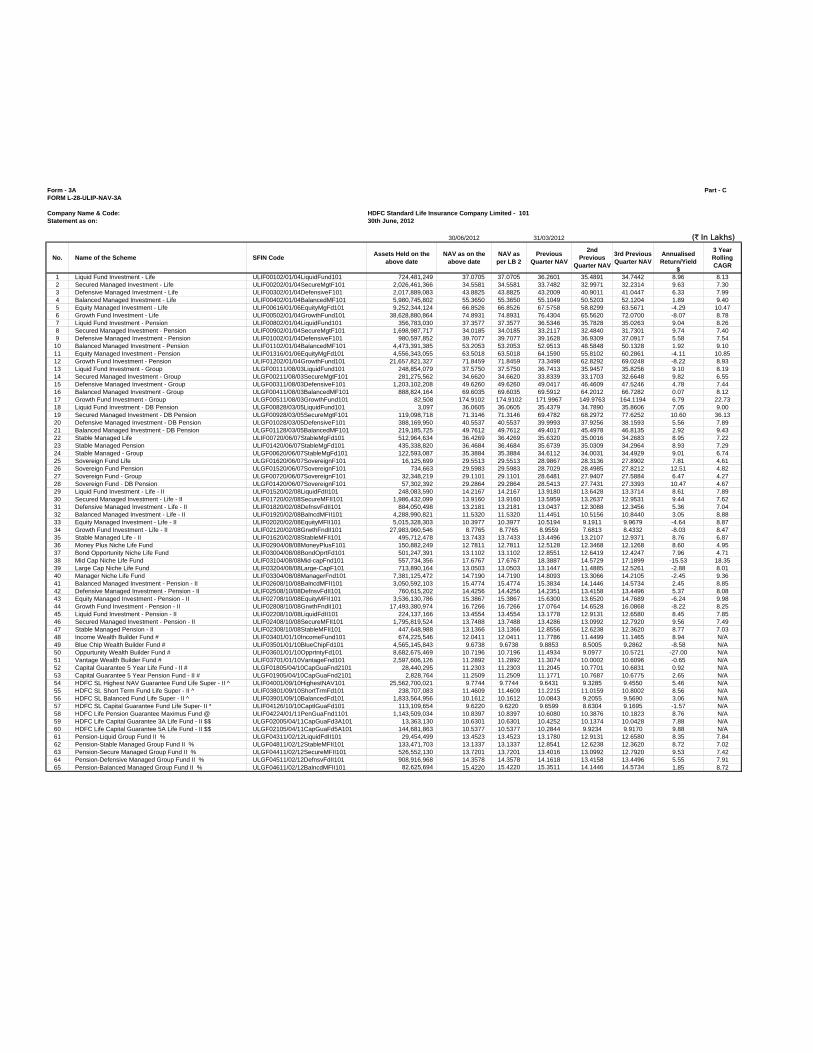
Form - 3A Part - CFORM L-28-ULIP-NAV-3A
Company Name & Code: HDFC Standard Life Insurance Company Limited - 101Statement as on: 30th June, 2012
30/06/2012 31/03/2012 (` In Lakhs)
No. Name of the Scheme SFIN CodeAssets Held on the
above dateNAV as on the
above dateNAV as
per LB 2Previous
Quarter NAV
2nd Previous
Quarter NAV
3rd Previous Quarter NAV
Annualised Return/Yield
$
3 Year Rolling CAGR
1 Liquid Fund Investment - Life ULIF00102/01/04LiquidFund101 724,481,249 37.0705 37.0705 36.2601 35.4891 34.7442 8.96 8.132 Secured Managed Investment - Life ULIF00202/01/04SecureMgtF101 2,026,461,366 34.5581 34.5581 33.7482 32.9971 32.2314 9.63 7.303 Defensive Managed Investment - Life ULIF00302/01/04DefensiveF101 2,017,889,083 43.8825 43.8825 43.2009 40.9011 41.0447 6.33 7.994 Balanced Managed Investment - Life ULIF00402/01/04BalancedMF101 5,980,745,802 55.3650 55.3650 55.1049 50.5203 52.1204 1.89 9.405 Equity Managed Investment - Life ULIF00616/01/06EquityMgFd101 9,252,344,124 66.8526 66.8526 67.5758 58.8299 63.5671 -4.29 10.476 Growth Fund Investment - Life ULIF00502/01/04GrowthFund101 38,628,880,864 74.8931 74.8931 76.4304 65.5620 72.0700 -8.07 8.787 Liquid Fund Investment - Pension ULIF00802/01/04LiquidFund101 356,783,030 37.3577 37.3577 36.5346 35.7828 35.0263 9.04 8.268 Secured Managed Investment - Pension ULIF00902/01/04SecureMgtF101 1,698,987,717 34.0185 34.0185 33.2117 32.4840 31.7301 9.74 7.409 Defensive Managed Investment - Pension ULIF01002/01/04DefensiveF101 980,597,852 39.7077 39.7077 39.1628 36.9309 37.0917 5.58 7.54
10 Balanced Managed Investment - Pension ULIF01102/01/04BalancedMF101 4,473,391,385 53.2053 53.2053 52.9513 48.5848 50.1328 1.92 9.1011 Equity Managed Investment - Pension ULIF01316/01/06EquityMgFd101 4,556,343,055 63.5018 63.5018 64.1590 55.8102 60.2861 -4.11 10.8512 Growth Fund Investment - Pension ULIF01202/01/04GrowthFund101 21,657,821,327 71.8459 71.8459 73.3498 62.8292 69.0248 -8.22 8.9313 Liquid Fund Investment - Group ULGF00111/08/03LiquidFund101 248,854,079 37.5750 37.5750 36.7413 35.9457 35.8256 9.10 8.1914 Secured Managed Investment - Group ULGF00211/08/03SecureMgtF101 281,275,562 34.6620 34.6620 33.8339 33.1703 32.6648 9.82 6.5515 Defensive Managed Investment - Group ULGF00311/08/03DefensiveF101 1,203,102,208 49.6260 49.6260 49.0417 46.4609 47.5246 4.78 7.4416 Balanced Managed Investment - Group ULGF00411/08/03BalancedMF101 888,824,164 69.6035 69.6035 69.5912 64.2012 66.7282 0.07 8.1217 Growth Fund Investment - Group ULGF00511/08/03GrowthFund101 82,508 174.9102 174.9102 171.9967 149.9763 164.1194 6.79 22.7318 Liquid Fund Investment - DB Pension ULGF00828/03/05LiquidFund101 3,097 36.0605 36.0605 35.4379 34.7890 35.8606 7.05 9.0019 Secured Managed Investment - DB Pension ULGF00928/03/05SecureMgtF101 119,098,718 71.3146 71.3146 69.4782 68.2972 77.6252 10.60 36.1320 Defensive Managed Investment - DB Pension ULGF01028/03/05DefensiveF101 388,169,950 40.5537 40.5537 39.9993 37.9256 38.1593 5.56 7.8921 Balanced Managed Investment - DB Pension ULGF01128/03/05BalancedMF101 219,185,725 49.7612 49.7612 49.4017 45.4978 46.8135 2.92 9.4322 Stable Managed Life ULIF00720/06/07StableMgFd101 512,964,634 36.4269 36.4269 35.6320 35.0016 34.2683 8.95 7.2223 Stable Managed Pension ULIF01420/06/07StableMgFd101 435,338,820 36.4684 36.4684 35.6739 35.0309 34.2964 8.93 7.2924 Stable Managed - Group ULGF00620/06/07StableMgFd101 122,593,087 35.3884 35.3884 34.6112 34.0031 34.4929 9.01 6.7425 Sovereign Fund Life ULGF01620/06/07SovereignF101 16,125,699 29.5513 29.5513 28.9867 28.3136 27.8902 7.81 4.6126 Sovereign Fund Pension ULGF01520/06/07SovereignF101 734,663 29.5983 29.5983 28.7029 28.4985 27.8212 12.51 4.8227 Sovereign Fund - Group ULGF00720/06/07SovereignF101 32,348,219 29.1101 29.1101 28.6481 27.9407 27.5884 6.47 4.2728 Sovereign Fund - DB Pension ULGF01420/06/07SovereignF101 57,302,392 29.2864 29.2864 28.5413 27.7431 27.3393 10.47 4.6729 Liquid Fund Investment - Life - II ULIF01520/02/08LiquidFdII101 248,083,590 14.2167 14.2167 13.9180 13.6428 13.3714 8.61 7.8930 Secured Managed Investment - Life - II ULIF01720/02/08SecureMFII101 1,986,432,099 13.9160 13.9160 13.5959 13.2637 12.9531 9.44 7.6231 Defensive Managed Investment - Life - II ULIF01820/02/08DefnsvFdII101 884,050,498 13.2181 13.2181 13.0437 12.3088 12.3456 5.36 7.0432 Balanced Managed Investment - Life - II ULIF01920/02/08BalncdMFII101 4,288,990,821 11.5320 11.5320 11.4451 10.5156 10.8440 3.05 8.8833 Equity Managed Investment - Life - II ULIF02020/02/08EquityMFII101 5,015,328,303 10.3977 10.3977 10.5194 9.1911 9.9679 -4.64 8.8734 Growth Fund Investment - Life - II ULIF02120/02/08GrwthFndII101 27,983,960,546 8.7765 8.7765 8.9559 7.6813 8.4332 -8.03 8.4735 Stable Managed Life - II ULIF01620/02/08StableMFII101 495,712,478 13.7433 13.7433 13.4496 13.2107 12.9371 8.76 6.8736 Money Plus Niche Life Fund ULIF02904/08/08MoneyPlusF101 150,882,249 12.7811 12.7811 12.5128 12.3468 12.1268 8.60 4.9537 Bond Opportunity Niche Life Fund ULIF03004/08/08BondOprtFd101 501,247,391 13.1102 13.1102 12.8551 12.6419 12.4247 7.96 4.7138 Mid Cap Niche Life Fund ULIF03104/08/08Mid-capFnd101 557,734,356 17.6767 17.6767 18.3887 14.5729 17.1899 -15.53 18.3539 Large Cap Niche Life Fund ULIF03204/08/08Large-CapF101 713,890,164 13.0503 13.0503 13.1447 11.4885 12.5261 -2.88 8.0140 Manager Niche Life Fund ULIF03304/08/08ManagerFnd101 7,381,125,472 14.7190 14.7190 14.8093 13.3066 14.2105 -2.45 9.3641 Balanced Managed Investment - Pension - II ULIF02608/10/08BalncdMFII101 3,050,592,103 15.4774 15.4774 15.3834 14.1446 14.5734 2.45 8.8542 Defensive Managed Investment - Pension - II ULIF02508/10/08DefnsvFdII101 760,615,202 14.4256 14.4256 14.2351 13.4158 13.4496 5.37 8.0843 Equity Managed Investment - Pension - II ULIF02708/10/08EquityMFII101 3,536,130,786 15.3867 15.3867 15.6300 13.6520 14.7689 -6.24 9.9844 Growth Fund Investment - Pension - II ULIF02808/10/08GrwthFndII101 17,493,380,974 16.7266 16.7266 17.0764 14.6528 16.0868 -8.22 8.2545 Liquid Fund Investment - Pension - II ULIF02208/10/08LiquidFdII101 224,137,166 13.4554 13.4554 13.1778 12.9131 12.6580 8.45 7.8546 Secured Managed Investment - Pension - II ULIF02408/10/08SecureMFII101 1,795,819,524 13.7488 13.7488 13.4286 13.0992 12.7920 9.56 7.4947 Stable Managed Pension - II ULIF02308/10/08StableMFII101 447,648,988 13.1366 13.1366 12.8556 12.6238 12.3620 8.77 7.0348 Income Wealth Builder Fund # ULIF03401/01/10IncomeFund101 674,225,546 12.0411 12.0411 11.7786 11.4499 11.1465 8.94 N/A49 Blue Chip Wealth Builder Fund # ULIF03501/01/10BlueChipFd101 4,565,145,843 9.6738 9.6738 9.8853 8.5005 9.2862 -8.58 N/A50 Oppurtunity Wealth Builder Fund # ULIF03601/01/10OpprtntyFd101 8,682,675,469 10.7196 10.7196 11.4934 9.0977 10.5721 -27.00 N/A51 Vantage Wealth Builder Fund # ULIF03701/01/10VantageFnd101 2,597,606,126 11.2892 11.2892 11.3074 10.0002 10.6096 -0.65 N/A52 Capital Guarantee 5 Year Life Fund - II # ULGF01805/04/10CapGuaFnd2101 28,440,295 11.2303 11.2303 11.2045 10.7701 10.6831 0.92 N/A53 Capital Guarantee 5 Year Pension Fund - II # ULGF01905/04/10CapGuaFnd2101 2,828,764 11.2509 11.2509 11.1771 10.7687 10.6775 2.65 N/A54 HDFC SL Highest NAV Guarantee Fund Life Super - II ^ ULIF04001/09/10HighestNAV101 25,562,700,021 9.7744 9.7744 9.6431 9.3285 9.4550 5.46 N/A55 HDFC SL Short Term Fund Life Super - II ^ ULIF03801/09/10ShortTrmFd101 238,707,083 11.4609 11.4609 11.2215 11.0159 10.8002 8.56 N/A56 HDFC SL Balanced Fund Life Super - II ^ ULIF03901/09/10BalancedFd101 1,833,564,956 10.1612 10.1612 10.0843 9.2055 9.5690 3.06 N/A57 HDFC SL Capital Guarantee Fund Life Super- II * ULIF04126/10/10CaptlGuaFd101 113,109,654 9.6220 9.6220 9.6599 8.6304 9.1695 -1.57 N/A58 HDFC Life Pension Guarantee Maximus Fund @ ULIF04224/01/11PenGuaFnd1101 1,143,509,034 10.8397 10.8397 10.6080 10.3876 10.1823 8.76 N/A59 HDFC Life Capital Guarantee 3A Life Fund - II $$ ULGF02005/04/11CapGuaFd3A101 13,363,130 10.6301 10.6301 10.4252 10.1374 10.0428 7.88 N/A60 HDFC Life Capital Guarantee 5A Life Fund - II $$ ULGF02105/04/11CapGuaFd5A101 144,681,863 10.5377 10.5377 10.2844 9.9234 9.9170 9.88 N/A61 Pension-Liquid Group Fund II % ULGF04311/02/12LiquidFdII101 29,454,499 13.4523 13.4523 13.1780 12.9131 12.6580 8.35 7.8462 Pension-Stable Managed Group Fund II % ULGF04811/02/12StableMFII101 133,471,703 13.1337 13.1337 12.8541 12.6238 12.3620 8.72 7.0263 Pension-Secure Managed Group Fund II % ULGF04411/02/12SecureMFII101 526,552,130 13.7201 13.7201 13.4016 13.0992 12.7920 9.53 7.4264 Pension-Defensive Managed Group Fund II % ULGF04511/02/12DefnsvFdII101 908,916,968 14.3578 14.3578 14.1618 13.4158 13.4496 5.55 7.9165 Pension-Balanced Managed Group Fund II % ULGF04611/02/12BalncdMFII101 82,625,694 15.4220 15.4220 15.3511 14.1446 14.5734 1.85 8.72
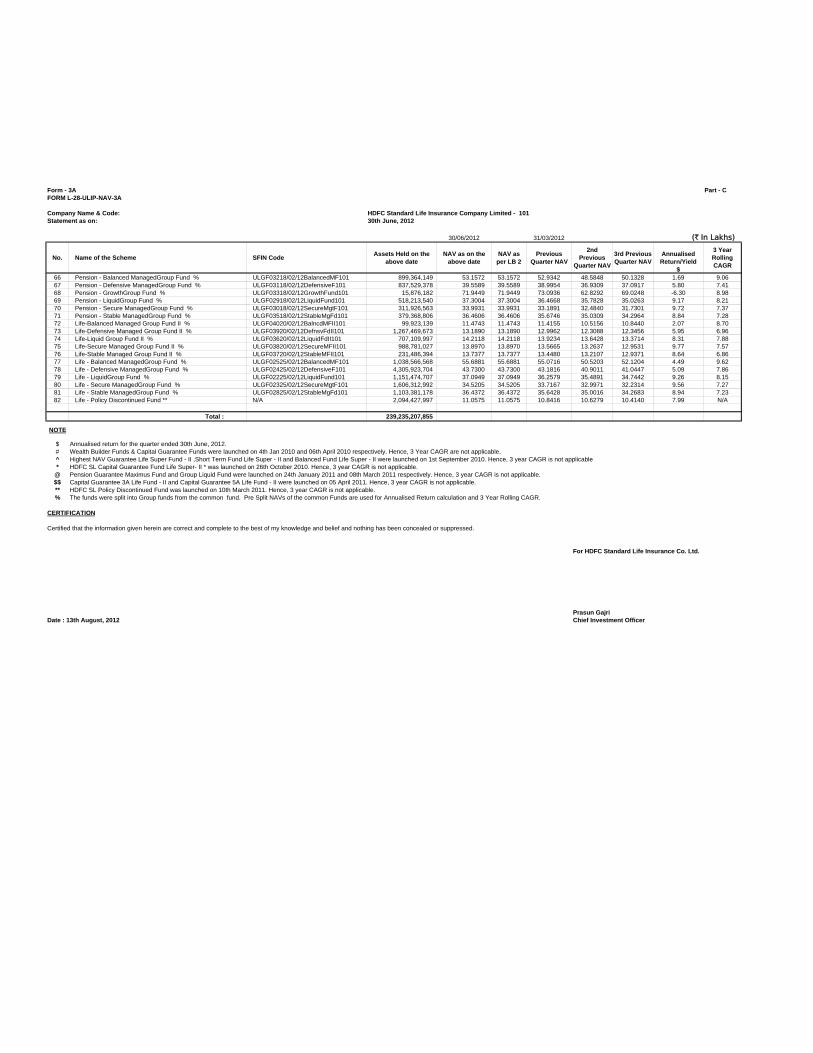
Form - 3A Part - CFORM L-28-ULIP-NAV-3A
Company Name & Code: HDFC Standard Life Insurance Company Limited - 101Statement as on: 30th June, 2012
30/06/2012 31/03/2012 (` In Lakhs)
No. Name of the Scheme SFIN CodeAssets Held on the
above dateNAV as on the
above dateNAV as
per LB 2Previous
Quarter NAV
2nd Previous
Quarter NAV
3rd Previous Quarter NAV
Annualised Return/Yield
$
3 Year Rolling CAGR
66 Pension - Balanced ManagedGroup Fund % ULGF03218/02/12BalancedMF101 899,364,149 53.1572 53.1572 52.9342 48.5848 50.1328 1.69 9.0667 Pension - Defensive ManagedGroup Fund % ULGF03118/02/12DefensiveF101 837,529,378 39.5589 39.5589 38.9954 36.9309 37.0917 5.80 7.4168 Pension - GrowthGroup Fund % ULGF03318/02/12GrowthFund101 15,876,182 71.9449 71.9449 73.0936 62.8292 69.0248 -6.30 8.9869 Pension - LiquidGroup Fund % ULGF02918/02/12LiquidFund101 518,213,540 37.3004 37.3004 36.4668 35.7828 35.0263 9.17 8.2170 Pension - Secure ManagedGroup Fund % ULGF03018/02/12SecureMgtF101 311,926,563 33.9931 33.9931 33.1891 32.4840 31.7301 9.72 7.3771 Pension - Stable ManagedGroup Fund % ULGF03518/02/12StableMgFd101 379,368,806 36.4606 36.4606 35.6746 35.0309 34.2964 8.84 7.2872 Life-Balanced Managed Group Fund II % ULGF04020/02/12BalncdMFII101 99,923,139 11.4743 11.4743 11.4155 10.5156 10.8440 2.07 8.7073 Life-Defensive Managed Group Fund II % ULGF03920/02/12DefnsvFdII101 1,267,469,673 13.1890 13.1890 12.9962 12.3088 12.3456 5.95 6.9674 Life-Liquid Group Fund II % ULGF03620/02/12LiquidFdII101 707,109,997 14.2118 14.2118 13.9234 13.6428 13.3714 8.31 7.8875 Life-Secure Managed Group Fund II % ULGF03820/02/12SecureMFII101 988,781,027 13.8970 13.8970 13.5665 13.2637 12.9531 9.77 7.5776 Life-Stable Managed Group Fund II % ULGF03720/02/12StableMFII101 231,486,394 13.7377 13.7377 13.4480 13.2107 12.9371 8.64 6.8677 Life - Balanced ManagedGroup Fund % ULGF02525/02/12BalancedMF101 1,038,566,568 55.6881 55.6881 55.0716 50.5203 52.1204 4.49 9.6278 Life - Defensive ManagedGroup Fund % ULGF02425/02/12DefensiveF101 4,305,923,704 43.7300 43.7300 43.1816 40.9011 41.0447 5.09 7.8679 Life - LiquidGroup Fund % ULGF02225/02/12LiquidFund101 1,151,474,707 37.0949 37.0949 36.2579 35.4891 34.7442 9.26 8.1580 Life - Secure ManagedGroup Fund % ULGF02325/02/12SecureMgtF101 1,606,312,992 34.5205 34.5205 33.7167 32.9971 32.2314 9.56 7.2781 Life - Stable ManagedGroup Fund % ULGF02825/02/12StableMgFd101 1,103,381,178 36.4372 36.4372 35.6428 35.0016 34.2683 8.94 7.2382 Life - Policy Discontinued Fund ** N/A 2,094,427,997 11.0575 11.0575 10.8416 10.6279 10.4140 7.99 N/A
Total : 239,235,207,855
NOTE
$ Annualised return for the quarter ended 30th June, 2012.# Wealth Builder Funds & Capital Guarantee Funds were launched on 4th Jan 2010 and 06th April 2010 respectively. Hence, 3 Year CAGR are not applicable.^ Highest NAV Guarantee Life Super Fund - II ,Short Term Fund Life Super - II and Balanced Fund Life Super - II were launched on 1st September 2010. Hence, 3 year CAGR is not applicable* HDFC SL Capital Guarantee Fund Life Super- II * was launched on 26th October 2010. Hence, 3 year CAGR is not applicable.
@ Pension Guarantee Maximus Fund and Group Liquid Fund were launched on 24th January 2011 and 08th March 2011 respectively. Hence, 3 year CAGR is not applicable.$$ Capital Guarantee 3A Life Fund - II and Capital Guarantee 5A Life Fund - II were launched on 05 April 2011. Hence, 3 year CAGR is not applicable.** HDFC SL Policy Discontinued Fund was launched on 10th March 2011. Hence, 3 year CAGR is not applicable.% The funds were split into Group funds from the common fund. Pre Split NAVs of the common Funds are used for Annualised Return calculation and 3 Year Rolling CAGR.
CERTIFICATION
Certified that the information given herein are correct and complete to the best of my knowledge and belief and nothing has been concealed or suppressed.
For HDFC Standard Life Insurance Co. Ltd.
Prasun GajriDate : 13th August, 2012 Chief Investment Officer
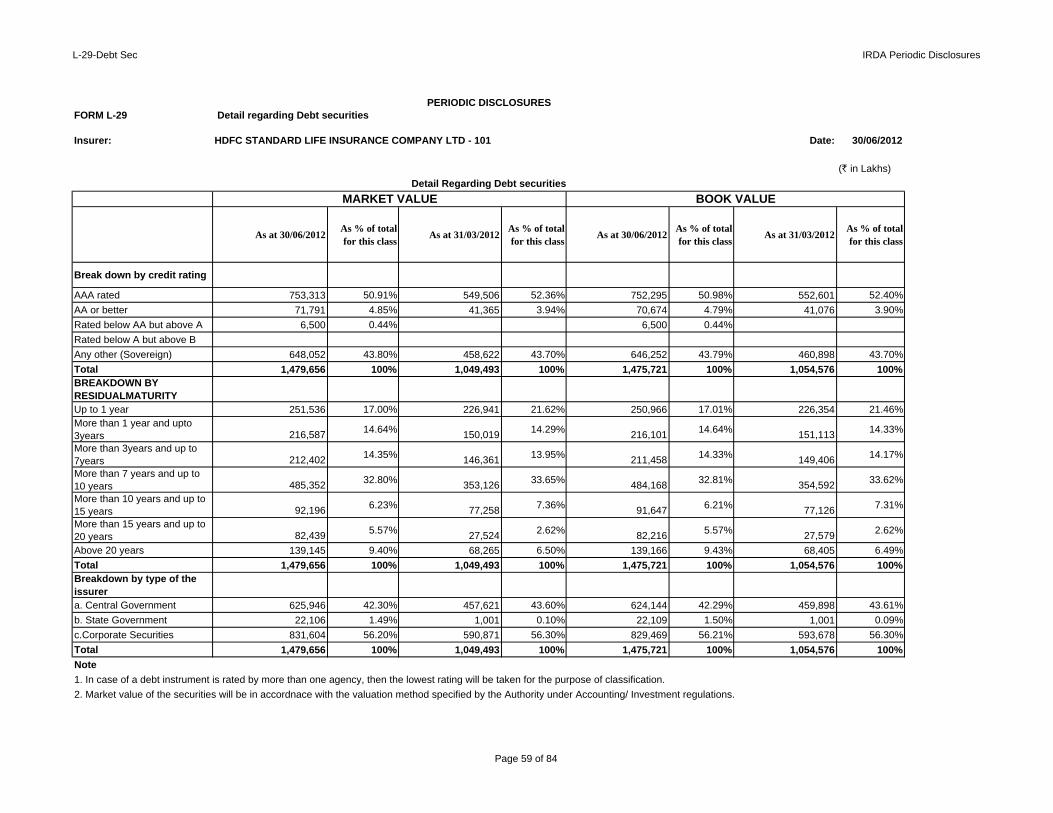
L-29-Debt Sec IRDA Periodic Disclosures
FORM L-29 Detail regarding Debt securities
Insurer: HDFC STANDARD LIFE INSURANCE COMPANY LTD - 101 Date: 30/06/2012
100000 (` in Lakhs)
As at 30/06/2012As % of total for this class
As at 31/03/2012As % of total for this class
As at 30/06/2012As % of total for this class
As at 31/03/2012As % of total for this class
Break down by credit rating
AAA rated 753,313 50.91% 549,506 52.36% 752,295 50.98% 552,601 52.40%
AA or better 71,791 4.85% 41,365 3.94% 70,674 4.79% 41,076 3.90%
Rated below AA but above A 6,500 0.44% 6,500 0.44%
Rated below A but above B
Any other (Sovereign) 648,052 43.80% 458,622 43.70% 646,252 43.79% 460,898 43.70%
Total 1,479,656 100% 1,049,493 100% 1,475,721 100% 1,054,576 100%BREAKDOWN BY RESIDUALMATURITYUp to 1 year 251,536 17.00% 226,941 21.62% 250,966 17.01% 226,354 21.46%More than 1 year and upto 3years 216,587 14.64% 150,019 14.29% 216,101 14.64% 151,113 14.33%
More than 3years and up to 7years 212,402 14.35% 146,361 13.95% 211,458 14.33% 149,406 14.17%
More than 7 years and up to 10 years 485,352 32.80% 353,126 33.65% 484,168 32.81% 354,592 33.62%
More than 10 years and up to 15 years 92,196 6.23% 77,258 7.36% 91,647 6.21% 77,126 7.31%
More than 15 years and up to 20 years 82,439 5.57% 27,524 2.62% 82,216 5.57% 27,579 2.62%
Above 20 years 139,145 9.40% 68,265 6.50% 139,166 9.43% 68,405 6.49%
Total 1,479,656 100% 1,049,493 100% 1,475,721 100% 1,054,576 100%Breakdown by type of the issurera. Central Government 625,946 42.30% 457,621 43.60% 624,144 42.29% 459,898 43.61%
b. State Government 22,106 1.49% 1,001 0.10% 22,109 1.50% 1,001 0.09%
c.Corporate Securities 831,604 56.20% 590,871 56.30% 829,469 56.21% 593,678 56.30%
Total 1,479,656 100% 1,049,493 100% 1,475,721 100% 1,054,576 100%
Note
1. In case of a debt instrument is rated by more than one agency, then the lowest rating will be taken for the purpose of classification.
2. Market value of the securities will be in accordnace with the valuation method specified by the Authority under Accounting/ Investment regulations.
PERIODIC DISCLOSURES
Detail Regarding Debt securities
MARKET VALUE BOOK VALUE
Page 59 of 84
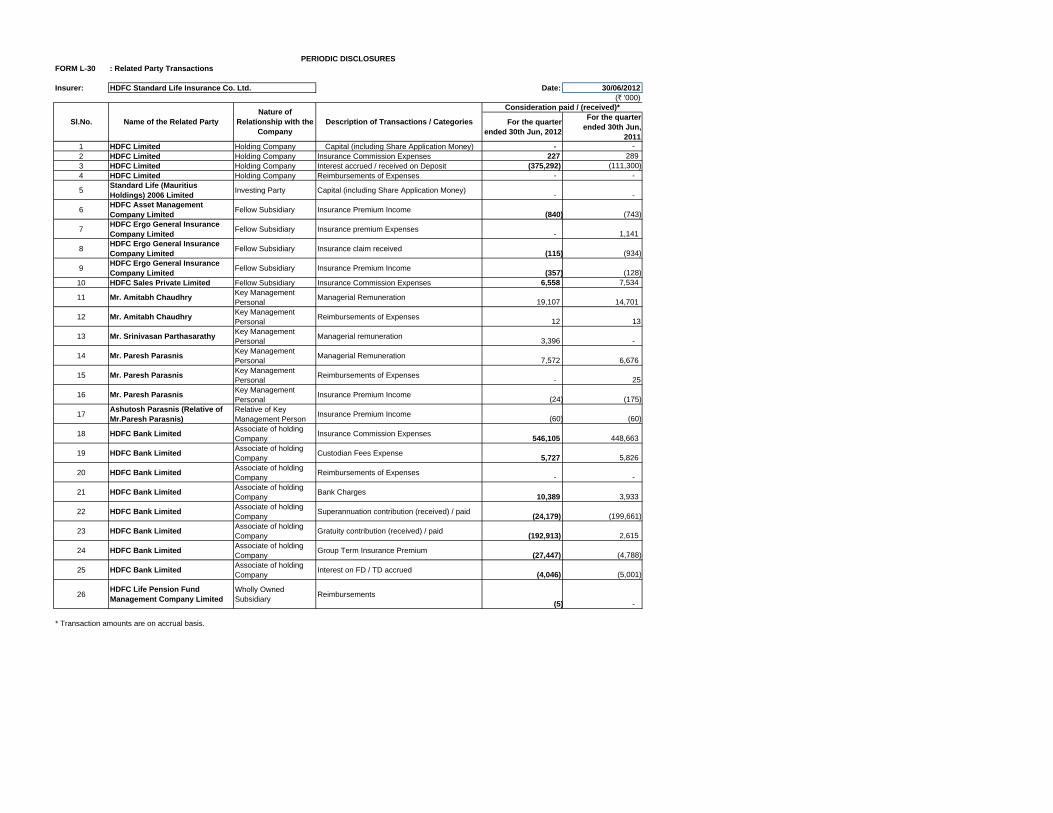
FORM L-30 : Related Party Transactions
Insurer: Date: 30/06/2012(` '000)
For the quarter ended 30th Jun, 2012
For the quarter ended 30th Jun,
20111 HDFC Limited Holding Company Capital (including Share Application Money) - - 2 HDFC Limited Holding Company Insurance Commission Expenses 227 289 3 HDFC Limited Holding Company Interest accrued / received on Deposit (375,292) (111,300)4 HDFC Limited Holding Company Reimbursements of Expenses - -
5Standard Life (Mauritius Holdings) 2006 Limited
Investing Party Capital (including Share Application Money) - -
6HDFC Asset Management Company Limited
Fellow Subsidiary Insurance Premium Income (840) (743)
7HDFC Ergo General Insurance Company Limited
Fellow Subsidiary Insurance premium Expenses - 1,141
8HDFC Ergo General Insurance Company Limited
Fellow Subsidiary Insurance claim received (115) (934)
9HDFC Ergo General Insurance Company Limited
Fellow Subsidiary Insurance Premium Income (357) (128)
10 HDFC Sales Private Limited Fellow Subsidiary Insurance Commission Expenses 6,558 7,534
11 Mr. Amitabh ChaudhryKey Management Personal
Managerial Remuneration 19,107 14,701
12 Mr. Amitabh ChaudhryKey Management Personal
Reimbursements of Expenses 12 13
13 Mr. Srinivasan ParthasarathyKey Management Personal
Managerial remuneration 3,396 -
14 Mr. Paresh ParasnisKey Management Personal
Managerial Remuneration 7,572 6,676
15 Mr. Paresh ParasnisKey Management Personal
Reimbursements of Expenses - 25
16 Mr. Paresh ParasnisKey Management Personal
Insurance Premium Income (24) (175)
17Ashutosh Parasnis (Relative of Mr.Paresh Parasnis)
Relative of Key Management Person
Insurance Premium Income (60) (60)
18 HDFC Bank LimitedAssociate of holding Company
Insurance Commission Expenses 546,105 448,663
19 HDFC Bank LimitedAssociate of holding Company
Custodian Fees Expense 5,727 5,826
20 HDFC Bank LimitedAssociate of holding Company
Reimbursements of Expenses - -
21 HDFC Bank LimitedAssociate of holding Company
Bank Charges 10,389 3,933
22 HDFC Bank LimitedAssociate of holding Company
Superannuation contribution (received) / paid (24,179) (199,661)
23 HDFC Bank LimitedAssociate of holding Company
Gratuity contribution (received) / paid (192,913) 2,615
24 HDFC Bank LimitedAssociate of holding Company
Group Term Insurance Premium (27,447) (4,788)
25 HDFC Bank LimitedAssociate of holding Company
Interest on FD / TD accrued (4,046) (5,001)
26HDFC Life Pension Fund Management Company Limited
Wholly Owned Subsidiary
Reimbursements (5) -
* Transaction amounts are on accrual basis.
PERIODIC DISCLOSURES
HDFC Standard Life Insurance Co. Ltd.
Sl.No. Name of the Related PartyNature of
Relationship with the Company
Description of Transactions / Categories
Consideration paid / (received)*
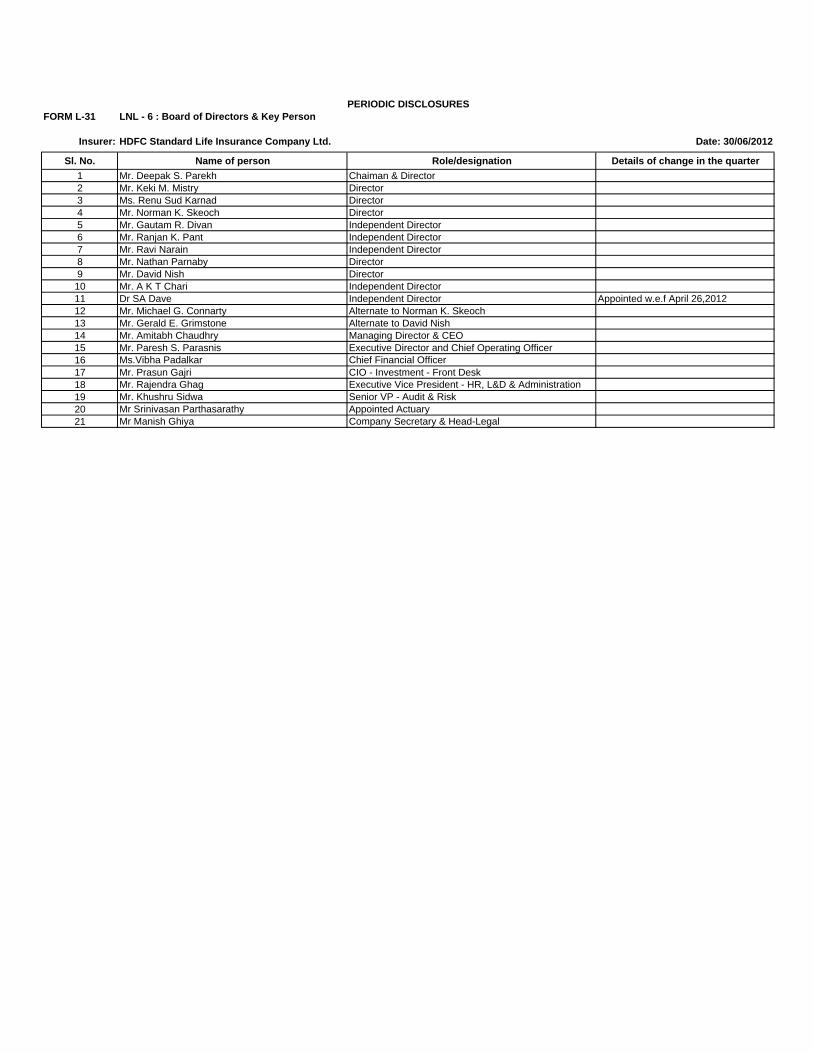
FORM L-31 LNL - 6 : Board of Directors & Key Person
Insurer: Date: 30/06/2012
Sl. No. Name of person Role/designation Details of change in the quarter
1 Mr. Deepak S. Parekh Chaiman & Director2 Mr. Keki M. Mistry Director3 Ms. Renu Sud Karnad Director4 Mr. Norman K. Skeoch Director5 Mr. Gautam R. Divan Independent Director6 Mr. Ranjan K. Pant Independent Director7 Mr. Ravi Narain Independent Director8 Mr. Nathan Parnaby Director9 Mr. David Nish Director10 Mr. A K T Chari Independent Director11 Dr SA Dave Independent Director Appointed w.e.f April 26,201212 Mr. Michael G. Connarty Alternate to Norman K. Skeoch13 Mr. Gerald E. Grimstone Alternate to David Nish14 Mr. Amitabh Chaudhry Managing Director & CEO15 Mr. Paresh S. Parasnis Executive Director and Chief Operating Officer16 Ms.Vibha Padalkar Chief Financial Officer17 Mr. Prasun Gajri CIO - Investment - Front Desk18 Mr. Rajendra Ghag Executive Vice President - HR, L&D & Administration19 Mr. Khushru Sidwa Senior VP - Audit & Risk20 Mr Srinivasan Parthasarathy Appointed Actuary21 Mr Manish Ghiya Company Secretary & Head-Legal
PERIODIC DISCLOSURES
HDFC Standard Life Insurance Company Ltd.
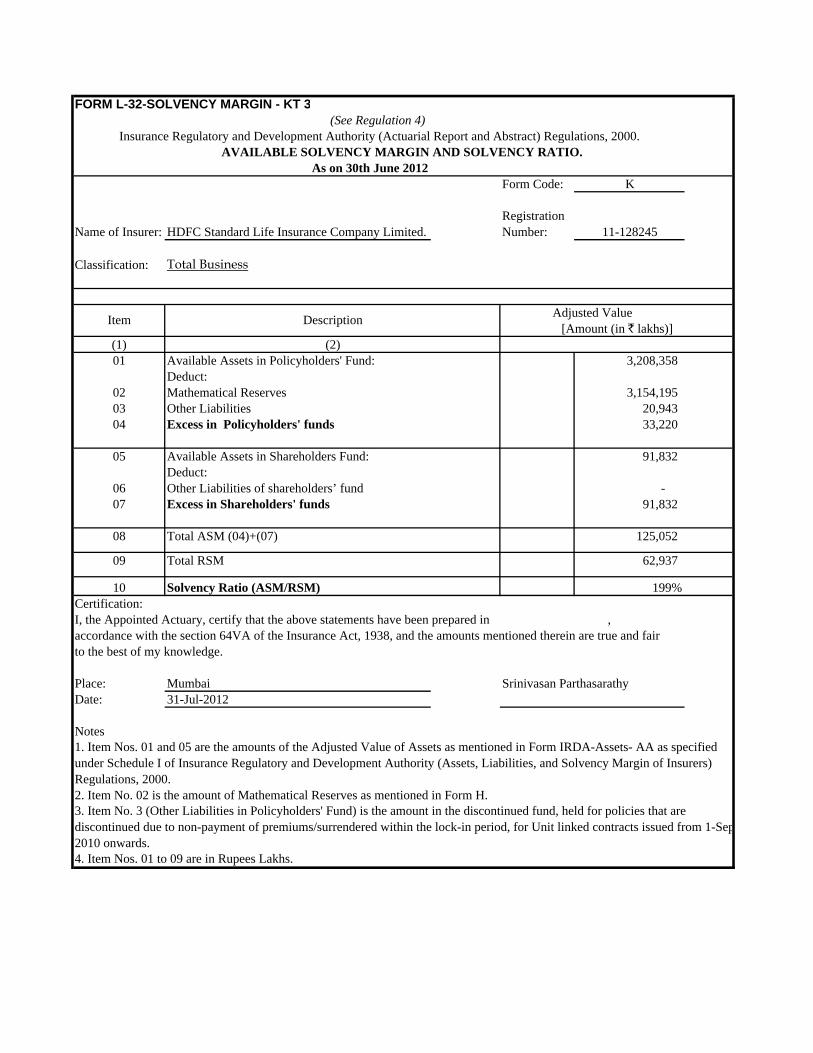
FORM L-32-SOLVENCY MARGIN - KT 3
AVAILABLE SOLVENCY MARGIN AND SOLVENCY RATIO.
Form Code: K
Name of Insurer: HDFC Standard Life Insurance Company Limited.Registration Number: 11-128245
Classification: Total Business
(1)01 Available Assets in Policyholders' Fund: 3,208,358
Deduct:02 Mathematical Reserves 3,154,195 03 Other Liabilities 20,943 04 Excess in Policyholders' funds 33,220
05 Available Assets in Shareholders Fund: 91,832 Deduct:
06 Other Liabilities of shareholders’ fund - 07 Excess in Shareholders' funds 91,832
08 Total ASM (04)+(07) 125,052
09 Total RSM 62,937
10 Solvency Ratio (ASM/RSM) 199%Certification:I, the Appointed Actuary, certify that the above statements have been prepared in ,accordance with the section 64VA of the Insurance Act, 1938, and the amounts mentioned therein are true and fair to the best of my knowledge.
Place: Mumbai Srinivasan ParthasarathyDate: 31-Jul-2012
Notes
2. Item No. 02 is the amount of Mathematical Reserves as mentioned in Form H.
4. Item Nos. 01 to 09 are in Rupees Lakhs.
(2)
1. Item Nos. 01 and 05 are the amounts of the Adjusted Value of Assets as mentioned in Form IRDA-Assets- AA as specified under Schedule I of Insurance Regulatory and Development Authority (Assets, Liabilities, and Solvency Margin of Insurers) Regulations, 2000.
3. Item No. 3 (Other Liabilities in Policyholders' Fund) is the amount in the discontinued fund, held for policies that are discontinued due to non-payment of premiums/surrendered within the lock-in period, for Unit linked contracts issued from 1-Sep2010 onwards.
(See Regulation 4)Insurance Regulatory and Development Authority (Actuarial Report and Abstract) Regulations, 2000.
As on 30th June 2012
Item Description[Amount (in ` lakhs)]
Adjusted Value
L- 33 NPAs - Form 7A Shareholder Non Solvency Fund
Company Name & Code: HDFC Standard Life Insurance Company Limited - 101
Statement date as on: 30th June, 2012
Periodicity of Submission : Quarterly
(` In Lakhs)
%Has there
been Revision?
AmountBoard Approval
Ref
CERTIFICATION
Certified that the inforamtion given herein are correct and complete to the best of my knowledge and belief and nothing has been concealed or supressed.For HDFC Standard Life Insurance Co. Ltd.
Prasun GajriDate: 13th August, 2012 Chief Investment Officer
Classification Provision (%) Provision Principal Due
FromInterest Due
FromDeferred Principal
Deferred Interest
Rolled Over?
Has there been any Principal Waiver?
FORM - 7AName of the Fund
Details of Investment Portfolio
COI Company NameInstrument
Type
Interest RateTotal O/S (Book
Value)Default Principal
(Book Value)Default Interest
(Book Value)
L- 33 NPAs - Form 7A
Company Name & Code: HDFC Standard Life Insurance Company Limited - 101
Statement date as on: 30th June, 2012
Periodicity of Submission : Quarterly
(` In Lakhs)
%Has there
been Revision?
AmountBoard Approval
Ref
CERTIFICATION
Certified that the inforamtion given herein are correct and complete to the best of my knowledge and belief and nothing has been concealed or supressed.For HDFC Standard Life Insurance Co. Ltd.
Prasun GajriDate: 13th August, 2012 Chief Investment Officer
Provision Default Interest
(Book Value)Principal Due
FromInterest Due
FromDeferred Principal
Deferred Interest
Life Funds
Details of Investment Portfolio
COI Company NameInstrument
Type
Interest RateTotal O/S (Book
Value)Rolled Over?
Classification Provision (%)
Has there been any Principal Waiver?
Default Principal (Book Value)
FORM - 7AName of the Fund
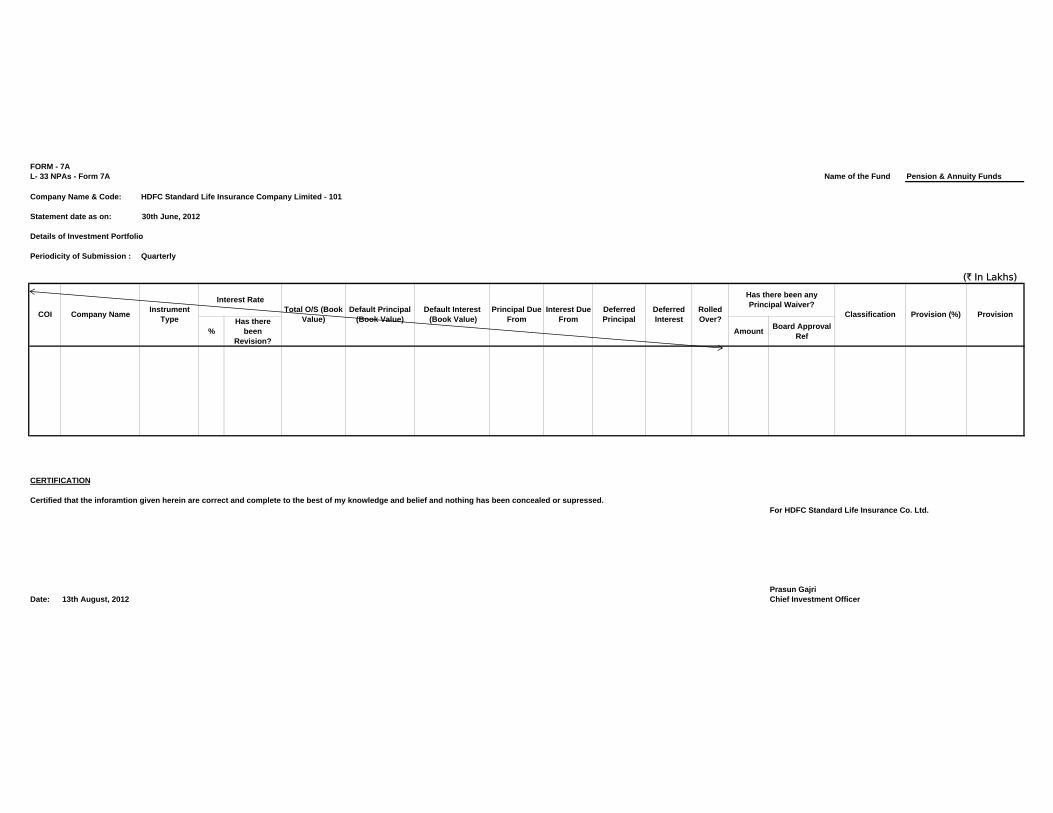
L- 33 NPAs - Form 7A Pension & Annuity Funds
Company Name & Code: HDFC Standard Life Insurance Company Limited - 101
Statement date as on: 30th June, 2012
Periodicity of Submission : Quarterly
(` In Lakhs)
%Has there
been Revision?
AmountBoard Approval
Ref
CERTIFICATION
Certified that the inforamtion given herein are correct and complete to the best of my knowledge and belief and nothing has been concealed or supressed.For HDFC Standard Life Insurance Co. Ltd.
Prasun GajriDate: 13th August, 2012 Chief Investment Officer
Classification Provision (%) Provision Principal Due
FromInterest Due
FromDeferred Principal
Deferred Interest
Rolled Over?
Has there been any Principal Waiver?
FORM - 7AName of the Fund
Details of Investment Portfolio
COI Company NameInstrument
Type
Interest RateTotal O/S (Book
Value)Default Principal
(Book Value)Default Interest (Book Value)
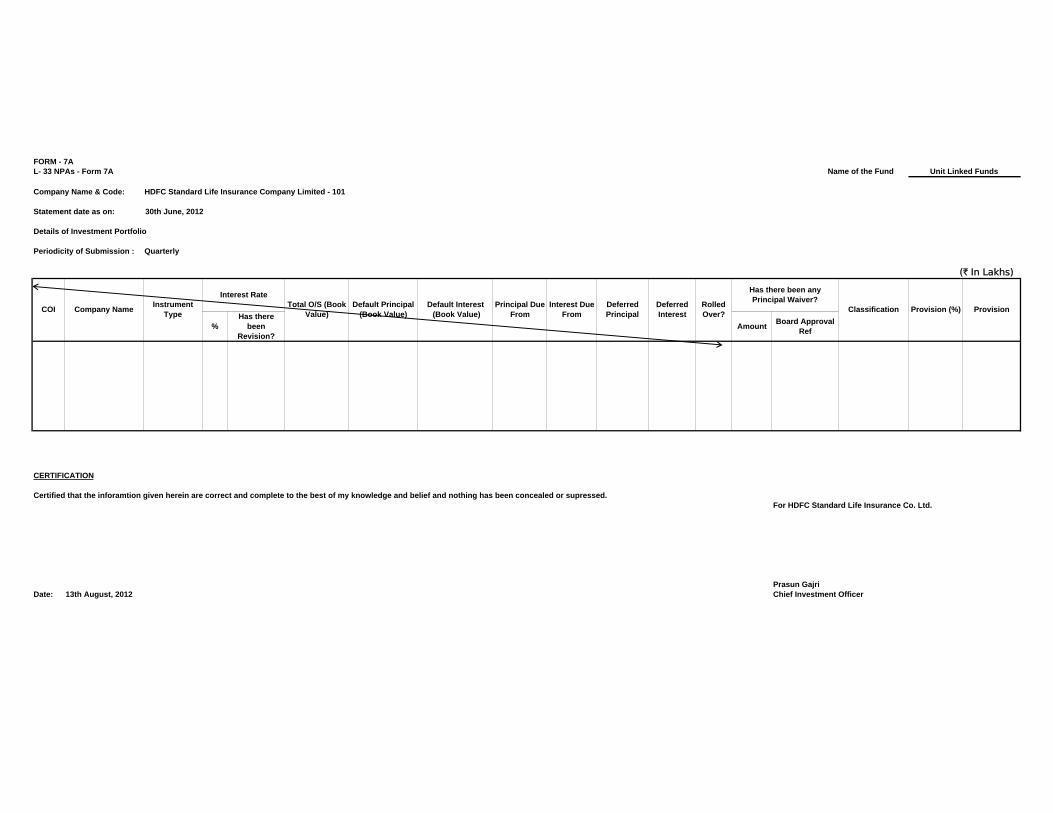
L- 33 NPAs - Form 7A
Company Name & Code: HDFC Standard Life Insurance Company Limited - 101
Statement date as on: 30th June, 2012
Periodicity of Submission : Quarterly
(` In Lakhs)
%Has there
been Revision?
AmountBoard Approval
Ref
CERTIFICATION
Certified that the inforamtion given herein are correct and complete to the best of my knowledge and belief and nothing has been concealed or supressed.For HDFC Standard Life Insurance Co. Ltd.
Prasun GajriDate: 13th August, 2012 Chief Investment Officer
ProvisionDefault Interest (Book Value)
Principal Due From
Interest Due From
Deferred Principal
Deferred Interest
Unit Linked Funds
Details of Investment Portfolio
COI Company NameInstrument
Type
Interest RateTotal O/S (Book
Value)Rolled Over?
Classification Provision (%)
Has there been any Principal Waiver?
Default Principal (Book Value)
FORM - 7AName of the Fund
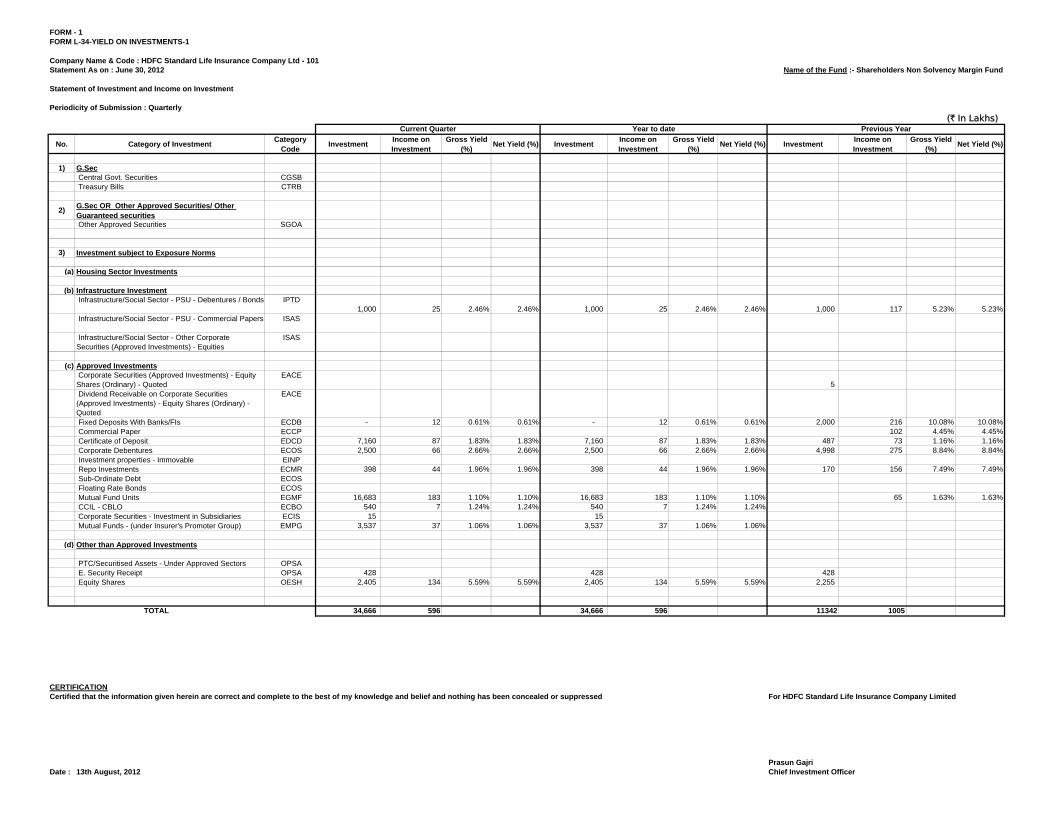
FORM - 1FORM L-34-YIELD ON INVESTMENTS-1
Company Name & Code : HDFC Standard Life Insurance Company Ltd - 101Statement As on : June 30, 2012 Name of the Fund :- Shareholders Non Solvency Margin Fund
Periodicity of Submission : Quarterly
(` In Lakhs)
No. Category of InvestmentCategory
CodeInvestment
Income on Investment
Gross Yield (%)
Net Yield (%) Investment Income on Investment
Gross Yield (%)
Net Yield (%) Investment Income on Investment
Gross Yield (%)
Net Yield (%)
1) G.Sec Central Govt. Securities CGSB Treasury Bills CTRB
2)G.Sec OR Other Approved Securities/ Other Guaranteed securities Other Approved Securities SGOA
3) Investment subject to Exposure Norms
(a) Housing Sector Investments
(b) Infrastructure Investment Infrastructure/Social Sector - PSU - Debentures / Bonds IPTD
1,000 25 2.46% 2.46% 1,000 25 2.46% 2.46% 1,000 117 5.23% 5.23% Infrastructure/Social Sector - PSU - Commercial Papers ISAS
Infrastructure/Social Sector - Other Corporate Securities (Approved Investments) - Equities
ISAS
(c) Approved Investments Corporate Securities (Approved Investments) - Equity Shares (Ordinary) - Quoted
EACE 5
Dividend Receivable on Corporate Securities (Approved Investments) - Equity Shares (Ordinary) - Quoted
EACE
Fixed Deposits With Banks/FIs ECDB - 12 0.61% 0.61% - 12 0.61% 0.61% 2,000 216 10.08% 10.08% Commercial Paper ECCP 102 4.45% 4.45% Certificate of Deposit EDCD 7,160 87 1.83% 1.83% 7,160 87 1.83% 1.83% 487 73 1.16% 1.16% Corporate Debentures ECOS 2,500 66 2.66% 2.66% 2,500 66 2.66% 2.66% 4,998 275 8.84% 8.84% Investment properties - Immovable EINP Repo Investments ECMR 398 44 1.96% 1.96% 398 44 1.96% 1.96% 170 156 7.49% 7.49% Sub-Ordinate Debt ECOS Floating Rate Bonds ECOS Mutual Fund Units EGMF 16,683 183 1.10% 1.10% 16,683 183 1.10% 1.10% 65 1.63% 1.63% CCIL - CBLO ECBO 540 7 1.24% 1.24% 540 7 1.24% 1.24% Corporate Securities - Investment in Subsidiaries ECIS 15 15 Mutual Funds - (under Insurer's Promoter Group) EMPG 3,537 37 1.06% 1.06% 3,537 37 1.06% 1.06%
(d) Other than Approved Investments
PTC/Securitised Assets - Under Approved Sectors OPSA E. Security Receipt OPSA 428 428 428 Equity Shares OESH 2,405 134 5.59% 5.59% 2,405 134 5.59% 5.59% 2,255
34,666 596 34,666 596 11342 1005
CERTIFICATIONCertified that the information given herein are correct and complete to the best of my knowledge and belief and nothing has been concealed or suppressed For HDFC Standard Life Insurance Company Limited
Prasun GajriDate : 13th August, 2012 Chief Investment Officer
TOTAL
Statement of Investment and Income on Investment
Current Quarter Year to date Previous Year
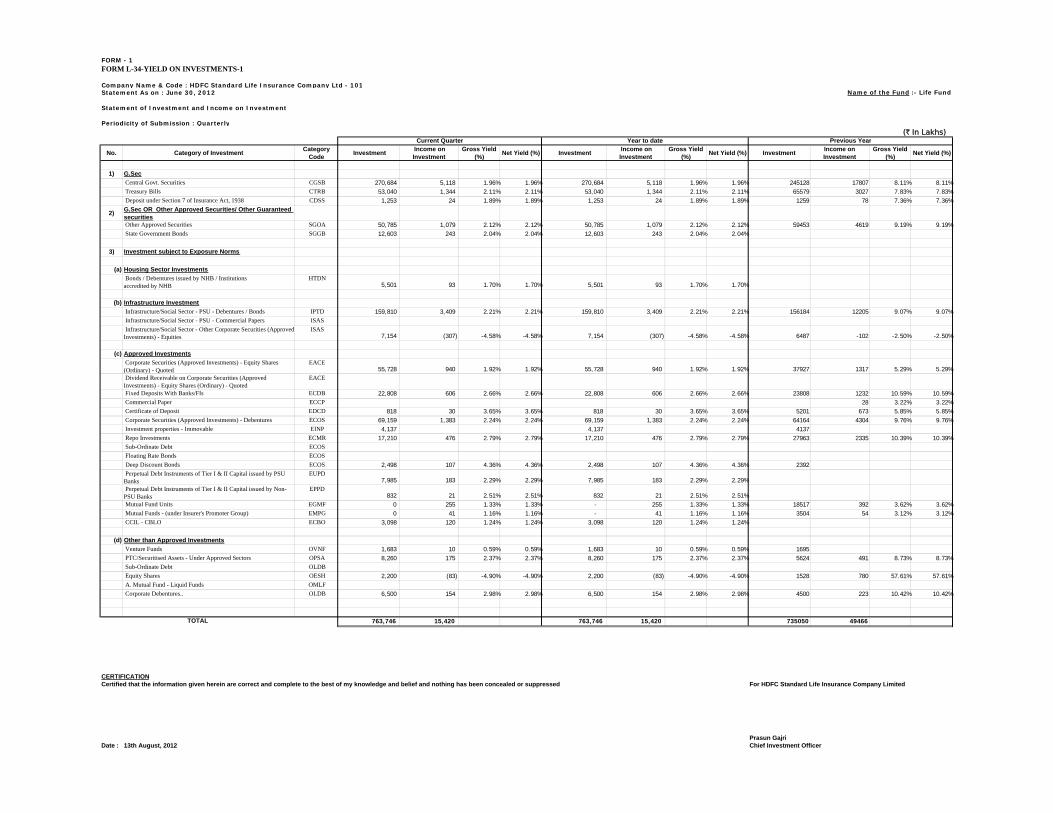
FORM - 1FORM L-34-YIELD ON INVESTMENTS-1
Company Name & Code : HDFC Standard Life Insurance Company Ltd - 101Statement As on : June 30, 2012 Name of the Fund :- Life Fund
Periodicity of Submission : Quarterly(` In Lakhs)
No. Category of InvestmentCategory
Code Investment
Income on Investment
Gross Yield (%)
Net Yield (%) Investment Income on Investment
Gross Yield (%)
Net Yield (%) Investment Income on Investment
Gross Yield (%)
Net Yield (%)
1) G.Sec
Central Govt. Securities CGSB 270,684 5,118 1.96% 1.96% 270,684 5,118 1.96% 1.96% 245128 17807 8.11% 8.11% Treasury Bills CTRB 53,040 1,344 2.11% 2.11% 53,040 1,344 2.11% 2.11% 65579 3027 7.83% 7.83% Deposit under Section 7 of Insurance Act, 1938 CDSS 1,253 24 1.89% 1.89% 1,253 24 1.89% 1.89% 1259 78 7.36% 7.36%
2)G.Sec OR Other Approved Securities/ Other Guaranteed securities Other Approved Securities SGOA 50,785 1,079 2.12% 2.12% 50,785 1,079 2.12% 2.12% 59453 4619 9.19% 9.19% State Government Bonds SGGB 12,603 243 2.04% 2.04% 12,603 243 2.04% 2.04%
3) Investment subject to Exposure Norms
(a) Housing Sector Investments
Bonds / Debentures issued by NHB / Institutions accredited by NHB
HTDN 5,501 93 1.70% 1.70% 5,501 93 1.70% 1.70%
(b) Infrastructure Investment
Infrastructure/Social Sector - PSU - Debentures / Bonds IPTD 159,810 3,409 2.21% 2.21% 159,810 3,409 2.21% 2.21% 156184 12205 9.07% 9.07% Infrastructure/Social Sector - PSU - Commercial Papers ISAS
Infrastructure/Social Sector - Other Corporate Securities (Approved Investments) - Equities
ISAS 7,154 (307) -4.58% -4.58% 7,154 (307) -4.58% -4.58% 6487 -102 -2.50% -2.50%
(c) Approved Investments
Corporate Securities (Approved Investments) - Equity Shares (Ordinary) - Quoted
EACE 55,728 940 1.92% 1.92% 55,728 940 1.92% 1.92% 37927 1317 5.29% 5.29%
Dividend Receivable on Corporate Securities (Approved Investments) - Equity Shares (Ordinary) - Quoted
EACE
Fixed Deposits With Banks/FIs ECDB 22,808 606 2.66% 2.66% 22,808 606 2.66% 2.66% 23808 1232 10.59% 10.59% Commercial Paper ECCP 28 3.22% 3.22% Certificate of Deposit EDCD 818 30 3.65% 3.65% 818 30 3.65% 3.65% 5201 673 5.85% 5.85% Corporate Securities (Approved Investments) - Debentures ECOS 69,159 1,383 2.24% 2.24% 69,159 1,383 2.24% 2.24% 64164 4304 9.76% 9.76% Investment properties - Immovable EINP 4,137 4,137 4137 Repo Investments ECMR 17,210 476 2.79% 2.79% 17,210 476 2.79% 2.79% 27963 2335 10.39% 10.39% Sub-Ordinate Debt ECOS
Floating Rate Bonds ECOS
Deep Discount Bonds ECOS 2,498 107 4.36% 4.36% 2,498 107 4.36% 4.36% 2392 Perpetual Debt Instruments of Tier I & II Capital issued by PSU Banks
EUPD 7,985 183 2.29% 2.29% 7,985 183 2.29% 2.29%
Perpetual Debt Instruments of Tier I & II Capital issued by Non-PSU Banks
EPPD 832 21 2.51% 2.51% 832 21 2.51% 2.51%
Mutual Fund Units EGMF 0 255 1.33% 1.33% - 255 1.33% 1.33% 18517 392 3.62% 3.62% Mutual Funds - (under Insurer's Promoter Group) EMPG 0 41 1.16% 1.16% - 41 1.16% 1.16% 3504 54 3.12% 3.12% CCIL - CBLO ECBO 3,098 120 1.24% 1.24% 3,098 120 1.24% 1.24%
(d) Other than Approved Investments
Venture Funds OVNF 1,683 10 0.59% 0.59% 1,683 10 0.59% 0.59% 1695 PTC/Securitised Assets - Under Approved Sectors OPSA 8,260 175 2.37% 2.37% 8,260 175 2.37% 2.37% 5624 491 8.73% 8.73% Sub-Ordinate Debt OLDB
Equity Shares OESH 2,200 (83) -4.90% -4.90% 2,200 (83) -4.90% -4.90% 1528 780 57.61% 57.61% A. Mutual Fund - Liquid Funds OMLF
Corporate Debentures.. OLDB 6,500 154 2.98% 2.98% 6,500 154 2.98% 2.98% 4500 223 10.42% 10.42%
763,746 15,420 763,746 15,420 735050 49466
CERTIFICATIONCertified that the information given herein are correct and complete to the best of my knowledge and belief and nothing has been concealed or suppressed For HDFC Standard Life Insurance Company Limited
Prasun GajriDate : 13th August, 2012 Chief Investment Officer
TOTAL
Statement of Investment and Income on Investment
Current Quarter Year to date Previous Year
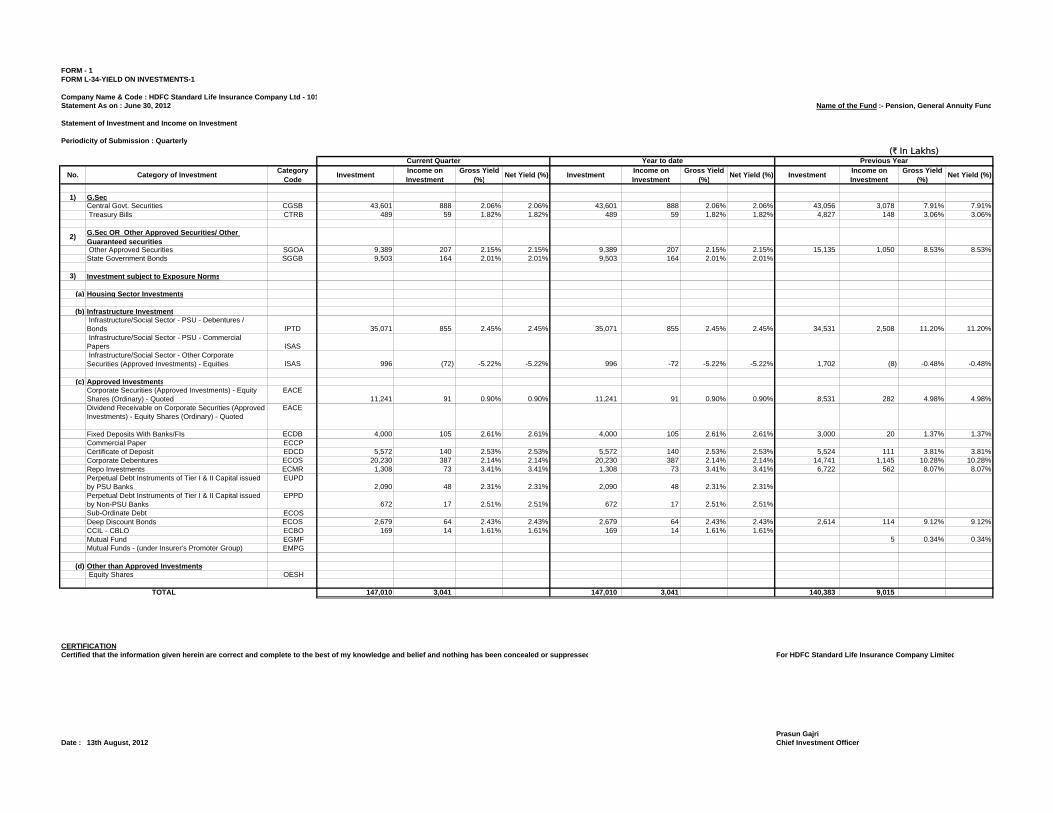
FORM - 1FORM L-34-YIELD ON INVESTMENTS-1
Company Name & Code : HDFC Standard Life Insurance Company Ltd - 101Statement As on : June 30, 2012 Name of the Fund :- Pension, General Annuity Fund
Periodicity of Submission : Quarterly
(` In Lakhs)
No. Category of InvestmentCategory
CodeInvestment
Income on Investment
Gross Yield (%)
Net Yield (%) Investment Income on Investment
Gross Yield (%)
Net Yield (%) Investment Income on Investment
Gross Yield (%)
Net Yield (%)
1) G.SecCentral Govt. Securities CGSB 43,601 888 2.06% 2.06% 43,601 888 2.06% 2.06% 43,056 3,078 7.91% 7.91% Treasury Bills CTRB 489 59 1.82% 1.82% 489 59 1.82% 1.82% 4,827 148 3.06% 3.06%
2)G.Sec OR Other Approved Securities/ Other Guaranteed securities Other Approved Securities SGOA 9,389 207 2.15% 2.15% 9,389 207 2.15% 2.15% 15,135 1,050 8.53% 8.53%State Government Bonds SGGB 9,503 164 2.01% 2.01% 9,503 164 2.01% 2.01%
3) Investment subject to Exposure Norms
(a) Housing Sector Investments
(b) Infrastructure Investment Infrastructure/Social Sector - PSU - Debentures / Bonds IPTD 35,071 855 2.45% 2.45% 35,071 855 2.45% 2.45% 34,531 2,508 11.20% 11.20% Infrastructure/Social Sector - PSU - Commercial Papers ISAS Infrastructure/Social Sector - Other Corporate Securities (Approved Investments) - Equities ISAS 996 (72) -5.22% -5.22% 996 -72 -5.22% -5.22% 1,702 (8) -0.48% -0.48%
(c) Approved InvestmentsCorporate Securities (Approved Investments) - Equity Shares (Ordinary) - Quoted
EACE11,241 91 0.90% 0.90% 11,241 91 0.90% 0.90% 8,531 282 4.98% 4.98%
Dividend Receivable on Corporate Securities (Approved Investments) - Equity Shares (Ordinary) - Quoted
EACE
Fixed Deposits With Banks/FIs ECDB 4,000 105 2.61% 2.61% 4,000 105 2.61% 2.61% 3,000 20 1.37% 1.37%Commercial Paper ECCP Certificate of Deposit EDCD 5,572 140 2.53% 2.53% 5,572 140 2.53% 2.53% 5,524 111 3.81% 3.81%Corporate Debentures ECOS 20,230 387 2.14% 2.14% 20,230 387 2.14% 2.14% 14,741 1,145 10.28% 10.28%Repo Investments ECMR 1,308 73 3.41% 3.41% 1,308 73 3.41% 3.41% 6,722 562 8.07% 8.07%Perpetual Debt Instruments of Tier I & II Capital issued by PSU Banks
EUPD 2,090 48 2.31% 2.31% 2,090 48 2.31% 2.31%
Perpetual Debt Instruments of Tier I & II Capital issued by Non-PSU Banks
EPPD 672 17 2.51% 2.51% 672 17 2.51% 2.51%
Sub-Ordinate Debt ECOS Deep Discount Bonds ECOS 2,679 64 2.43% 2.43% 2,679 64 2.43% 2.43% 2,614 114 9.12% 9.12%CCIL - CBLO ECBO 169 14 1.61% 1.61% 169 14 1.61% 1.61%Mutual Fund EGMF 5 0.34% 0.34%Mutual Funds - (under Insurer's Promoter Group) EMPG
(d) Other than Approved Investments Equity Shares OESH
147,010 3,041 147,010 3,041 140,383 9,015
CERTIFICATIONCertified that the information given herein are correct and complete to the best of my knowledge and belief and nothing has been concealed or suppressed For HDFC Standard Life Insurance Company Limited
Prasun GajriDate : 13th August, 2012 Chief Investment Officer
Previous Year
TOTAL
Statement of Investment and Income on Investment
Current Quarter Year to date
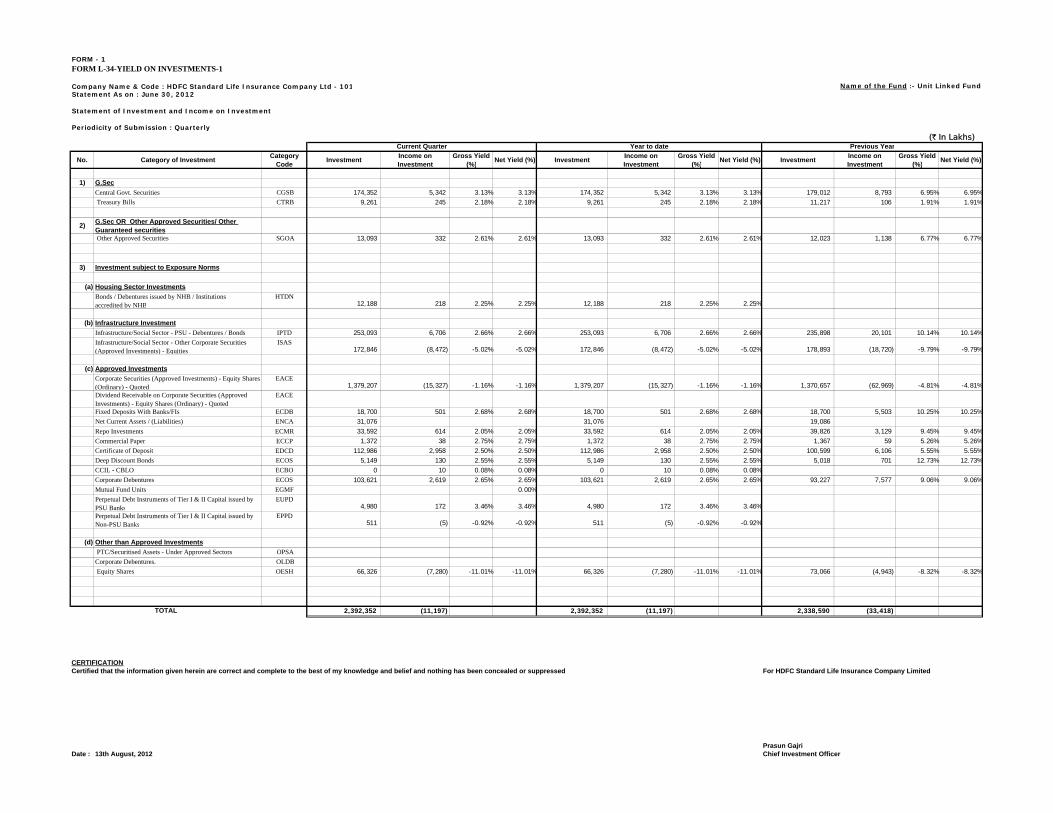
FORM - 1FORM L-34-YIELD ON INVESTMENTS-1
Company Name & Code : HDFC Standard Life Insurance Company Ltd - 101 Name of the Fund :- Unit Linked FundStatement As on : June 30, 2012
Periodicity of Submission : Quarterly(` In Lakhs)
No. Category of InvestmentCategory
CodeInvestment
Income on Investment
Gross Yield (%)
Net Yield (%) Investment Income on Investment
Gross Yield (%)
Net Yield (%) Investment Income on Investment
Gross Yield (%)
Net Yield (%)
1) G.Sec
Central Govt. Securities CGSB 174,352 5,342 3.13% 3.13% 174,352 5,342 3.13% 3.13% 179,012 8,793 6.95% 6.95% Treasury Bills CTRB 9,261 245 2.18% 2.18% 9,261 245 2.18% 2.18% 11,217 106 1.91% 1.91%
2)G.Sec OR Other Approved Securities/ Other Guaranteed securities Other Approved Securities SGOA 13,093 332 2.61% 2.61% 13,093 332 2.61% 2.61% 12,023 1,138 6.77% 6.77%
3) Investment subject to Exposure Norms
(a) Housing Sector Investments
Bonds / Debentures issued by NHB / Institutions accredited by NHB
HTDN12,188 218 2.25% 2.25% 12,188 218 2.25% 2.25%
(b) Infrastructure Investment
Infrastructure/Social Sector - PSU - Debentures / Bonds IPTD 253,093 6,706 2.66% 2.66% 253,093 6,706 2.66% 2.66% 235,898 20,101 10.14% 10.14%Infrastructure/Social Sector - Other Corporate Securities (Approved Investments) - Equities
ISAS172,846 (8,472) -5.02% -5.02% 172,846 (8,472) -5.02% -5.02% 178,893 (18,720) -9.79% -9.79%
(c) Approved Investments
Corporate Securities (Approved Investments) - Equity Shares (Ordinary) - Quoted
EACE1,379,207 (15,327) -1.16% -1.16% 1,379,207 (15,327) -1.16% -1.16% 1,370,657 (62,969) -4.81% -4.81%
Dividend Receivable on Corporate Securities (Approved Investments) - Equity Shares (Ordinary) - Quoted
EACE
Fixed Deposits With Banks/FIs ECDB 18,700 501 2.68% 2.68% 18,700 501 2.68% 2.68% 18,700 5,503 10.25% 10.25%Net Current Assets / (Liabilities) ENCA 31,076 31,076 19,086
Repo Investments ECMR 33,592 614 2.05% 2.05% 33,592 614 2.05% 2.05% 39,826 3,129 9.45% 9.45%
Commercial Paper ECCP 1,372 38 2.75% 2.75% 1,372 38 2.75% 2.75% 1,367 59 5.26% 5.26%Certificate of Deposit EDCD 112,986 2,958 2.50% 2.50% 112,986 2,958 2.50% 2.50% 100,599 6,106 5.55% 5.55%Deep Discount Bonds ECOS 5,149 130 2.55% 2.55% 5,149 130 2.55% 2.55% 5,018 701 12.73% 12.73%CCIL - CBLO ECBO 0 10 0.08% 0.08% 0 10 0.08% 0.08%Corporate Debentures ECOS 103,621 2,619 2.65% 2.65% 103,621 2,619 2.65% 2.65% 93,227 7,577 9.06% 9.06%Mutual Fund Units EGMF 0.00%Perpetual Debt Instruments of Tier I & II Capital issued by PSU Banks
EUPD4,980 172 3.46% 3.46% 4,980 172 3.46% 3.46%
Perpetual Debt Instruments of Tier I & II Capital issued by Non-PSU Banks
EPPD511 (5) -0.92% -0.92% 511 (5) -0.92% -0.92%
(d) Other than Approved Investments
PTC/Securitised Assets - Under Approved Sectors OPSA
Corporate Debentures. OLDB
Equity Shares OESH 66,326 (7,280) -11.01% -11.01% 66,326 (7,280) -11.01% -11.01% 73,066 (4,943) -8.32% -8.32%
2,392,352 (11,197) 2,392,352 (11,197) 2,338,590 (33,418)
CERTIFICATIONCertified that the information given herein are correct and complete to the best of my knowledge and belief and nothing has been concealed or suppressed For HDFC Standard Life Insurance Company Limited
Prasun GajriDate : 13th August, 2012 Chief Investment Officer
Previous Year
TOTAL
Statement of Investment and Income on Investment
Current Quarter Year to date
L - 35 DOWNGRADING OF INVESTMENT
Company Name & Code: HDFC Standard Life Insurance Company Limited - 101
Statement as on: 30th June, 2012 Name of the Fund : -Shareholders Non Solvency Margin Fund
Statement of Down Graded Investments
Periodicity of Submission: Quarterly
(` In Lakhs)
NO. NAME OF THE SECURITY COI AMOUNT DATE Of
PURCHASERATING AGENCY
ORIGINAL GRADE
CURRENT GRADE
DATE Of DOWNGRADE
REMARKS
A. DURING THE QUARTER
Central Government Securities
State Government/ Other Approved Securities/Other guaranteed securities
Housing Sector Investments
Infrastructure / Social Sector Security
Investment subject to Exposure Norms
Other than Approved Investments
B. AS ON DATE
Central Government Securities
State Government/ Other Approved Securities/Other guaranteed securities
Housing Sector Investments
Infrastructure / Social Sector Security
Investment subject to Exposure Norms
Other than Approved Investments
For HDFC Standard Life Insurance Co. Ltd.
Prasun GajriDate : 13th August, 2012 Chief Investment Officer
Certified that the information given herein are correct and complete to the best of my knowledge and belief and nothing has been concealed or suppressed.
FORM - 2
CERTIFICATION
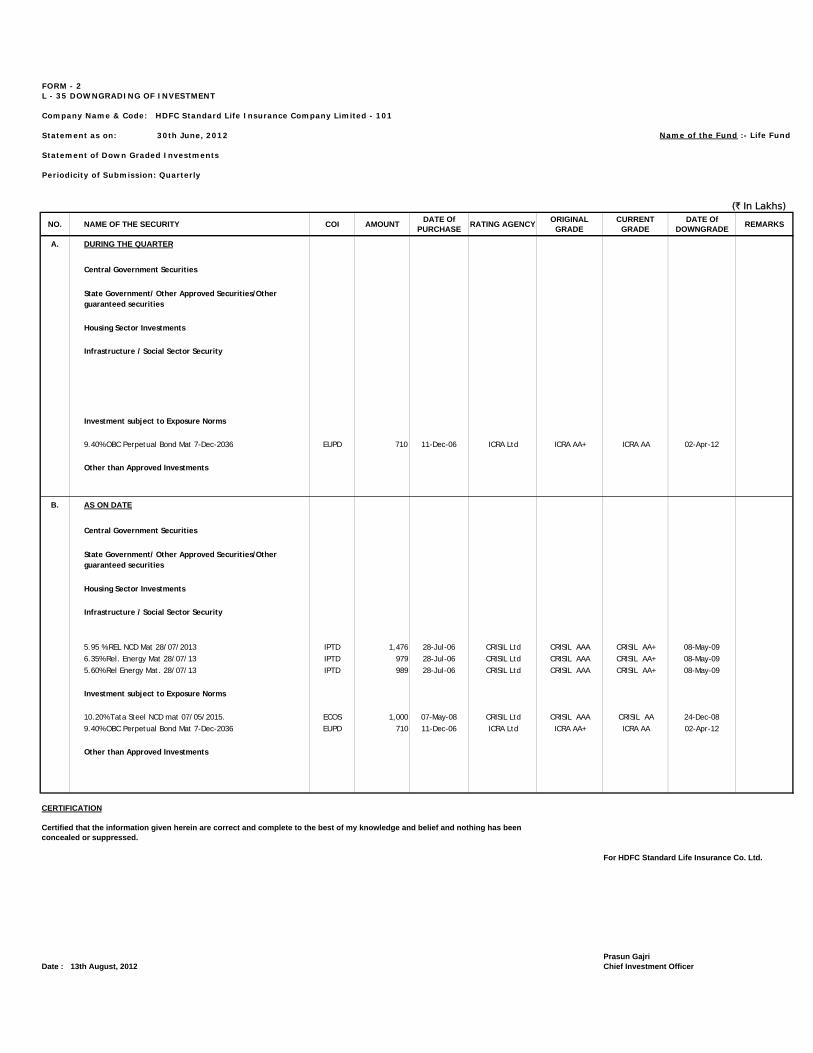
L - 35 DOWNGRADING OF INVESTMENT
Company Name & Code: HDFC Standard Life Insurance Company Limited - 101
Statement as on: 30th June, 2012 Name of the Fund :- Life Fund
Statement of Down Graded Investments
Periodicity of Submission: Quarterly
(` In Lakhs)
NO. NAME OF THE SECURITY COI AMOUNT DATE Of
PURCHASERATING AGENCY
ORIGINAL GRADE
CURRENT GRADE
DATE Of DOWNGRADE
REMARKS
A. DURING THE QUARTER
Central Government Securities
State Government/ Other Approved Securities/Other guaranteed securities
Housing Sector Investments
Infrastructure / Social Sector Security
Investment subject to Exposure Norms
9.40% OBC Perpetual Bond Mat 7-Dec-2036 EUPD 710 11-Dec-06 ICRA Ltd ICRA AA+ ICRA AA 02-Apr-12
Other than Approved Investments
B. AS ON DATE
Central Government Securities
State Government/ Other Approved Securities/Other guaranteed securities
Housing Sector Investments
Infrastructure / Social Sector Security
5.95 % REL NCD Mat 28/07/2013 IPTD 1,476 28-Jul-06 CRISIL Ltd CRISIL AAA CRISIL AA+ 08-May-09
6.35% Rel. Energy Mat 28/07/13 IPTD 979 28-Jul-06 CRISIL Ltd CRISIL AAA CRISIL AA+ 08-May-09
5.60% Rel Energy Mat. 28/07/13 IPTD 989 28-Jul-06 CRISIL Ltd CRISIL AAA CRISIL AA+ 08-May-09
Investment subject to Exposure Norms
10.20% Tata Steel NCD mat 07/05/2015. ECOS 1,000 07-May-08 CRISIL Ltd CRISIL AAA CRISIL AA 24-Dec-08
9.40% OBC Perpetual Bond Mat 7-Dec-2036 EUPD 710 11-Dec-06 ICRA Ltd ICRA AA+ ICRA AA 02-Apr-12
Other than Approved Investments
For HDFC Standard Life Insurance Co. Ltd.
Prasun GajriDate : 13th August, 2012 Chief Investment Officer
Certified that the information given herein are correct and complete to the best of my knowledge and belief and nothing has been concealed or suppressed.
FORM - 2
CERTIFICATION
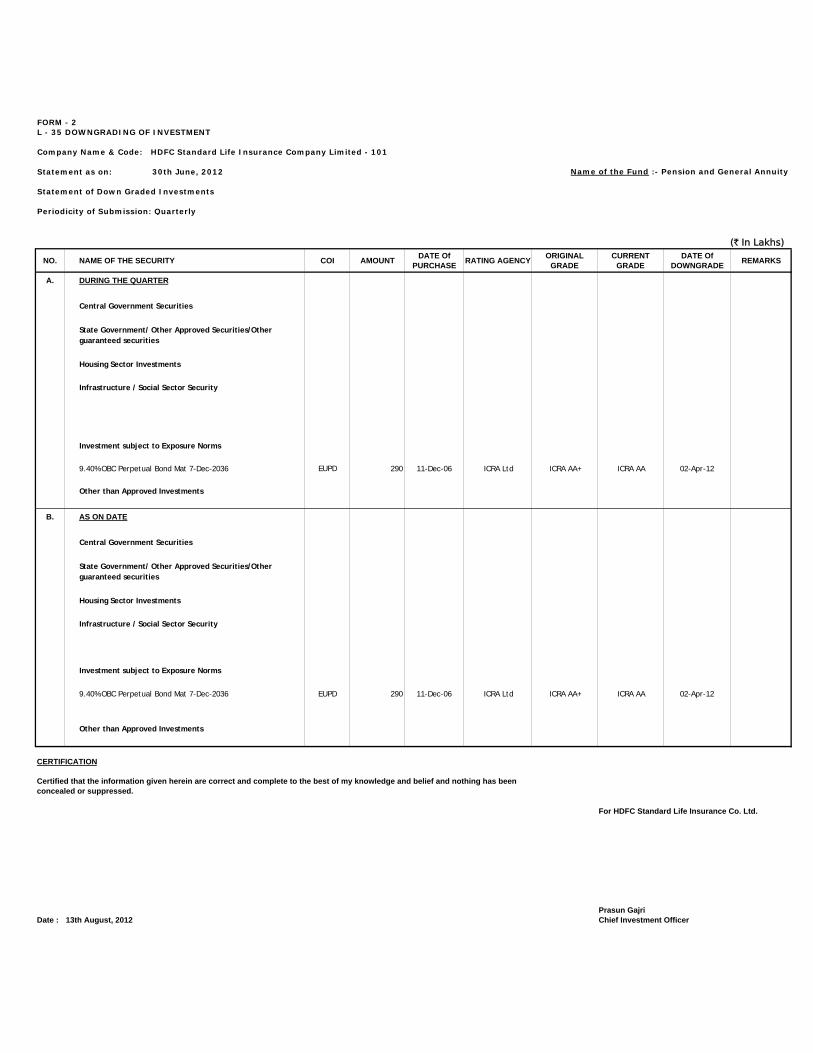
L - 35 DOWNGRADING OF INVESTMENT
Company Name & Code: HDFC Standard Life Insurance Company Limited - 101
Statement as on: 30th June, 2012 Name of the Fund :- Pension and General Annuity
Statement of Down Graded Investments
Periodicity of Submission: Quarterly
(` In Lakhs)
NO. NAME OF THE SECURITY COI AMOUNT DATE Of
PURCHASERATING AGENCY
ORIGINAL GRADE
CURRENT GRADE
DATE Of DOWNGRADE
REMARKS
A. DURING THE QUARTER
Central Government Securities
State Government/ Other Approved Securities/Other guaranteed securities
Housing Sector Investments
Infrastructure / Social Sector Security
Investment subject to Exposure Norms
9.40% OBC Perpetual Bond Mat 7-Dec-2036 EUPD 290 11-Dec-06 ICRA Ltd ICRA AA+ ICRA AA 02-Apr-12
Other than Approved Investments
B. AS ON DATE
Central Government Securities
State Government/ Other Approved Securities/Other guaranteed securities
Housing Sector Investments
Infrastructure / Social Sector Security
Investment subject to Exposure Norms
9.40% OBC Perpetual Bond Mat 7-Dec-2036 EUPD 290 11-Dec-06 ICRA Ltd ICRA AA+ ICRA AA 02-Apr-12
Other than Approved Investments
For HDFC Standard Life Insurance Co. Ltd.
Prasun GajriDate : 13th August, 2012 Chief Investment Officer
Certified that the information given herein are correct and complete to the best of my knowledge and belief and nothing has been concealed or suppressed.
FORM - 2
CERTIFICATION
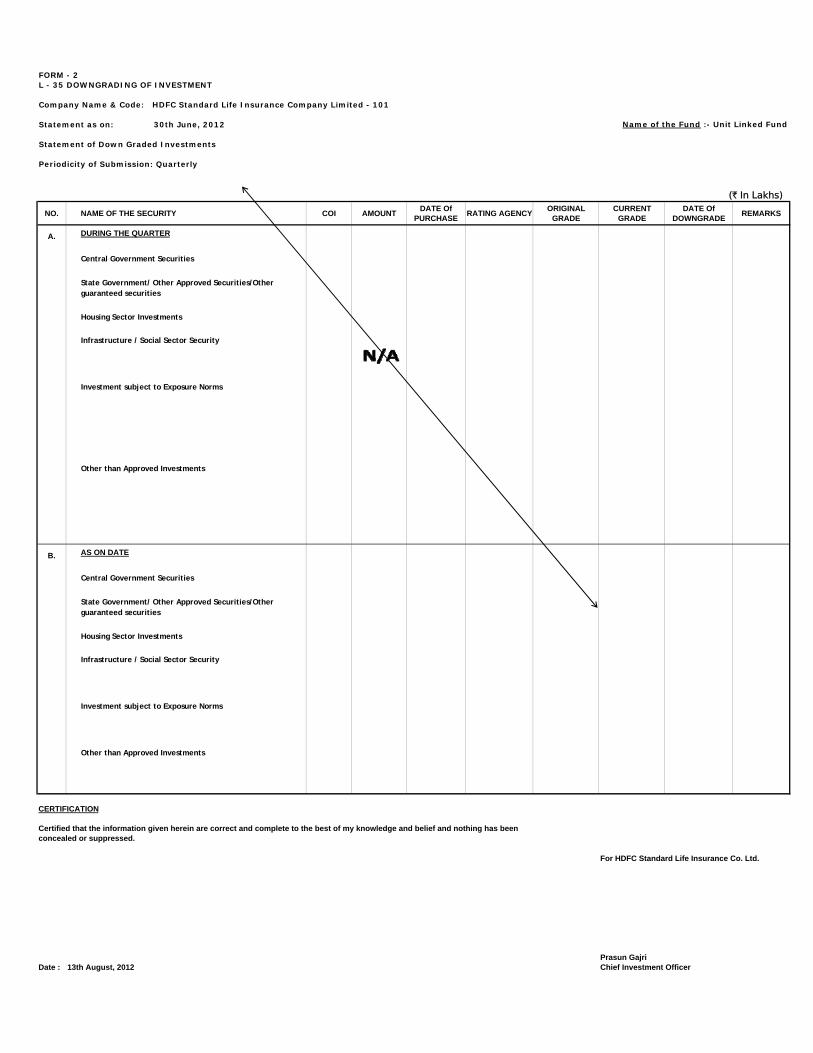
L - 35 DOWNGRADING OF INVESTMENT
Company Name & Code: HDFC Standard Life Insurance Company Limited - 101
Statement as on: 30th June, 2012 Name of the Fund :- Unit Linked Fund
Statement of Down Graded Investments
Periodicity of Submission: Quarterly
(` In Lakhs)
NO. NAME OF THE SECURITY COI AMOUNT DATE Of
PURCHASERATING AGENCY
ORIGINAL GRADE
CURRENT GRADE
DATE Of DOWNGRADE
REMARKS
A. DURING THE QUARTER
Central Government Securities
State Government/ Other Approved Securities/Other guaranteed securities
Housing Sector Investments
Infrastructure / Social Sector Security
Investment subject to Exposure Norms
Other than Approved Investments
B. AS ON DATE
Central Government Securities
State Government/ Other Approved Securities/Other guaranteed securities
Housing Sector Investments
Infrastructure / Social Sector Security
Investment subject to Exposure Norms
Other than Approved Investments
For HDFC Standard Life Insurance Co. Ltd.
Prasun GajriDate : 13th August, 2012 Chief Investment Officer
CERTIFICATION
Certified that the information given herein are correct and complete to the best of my knowledge and belief and nothing has been concealed or suppressed.
FORM - 2
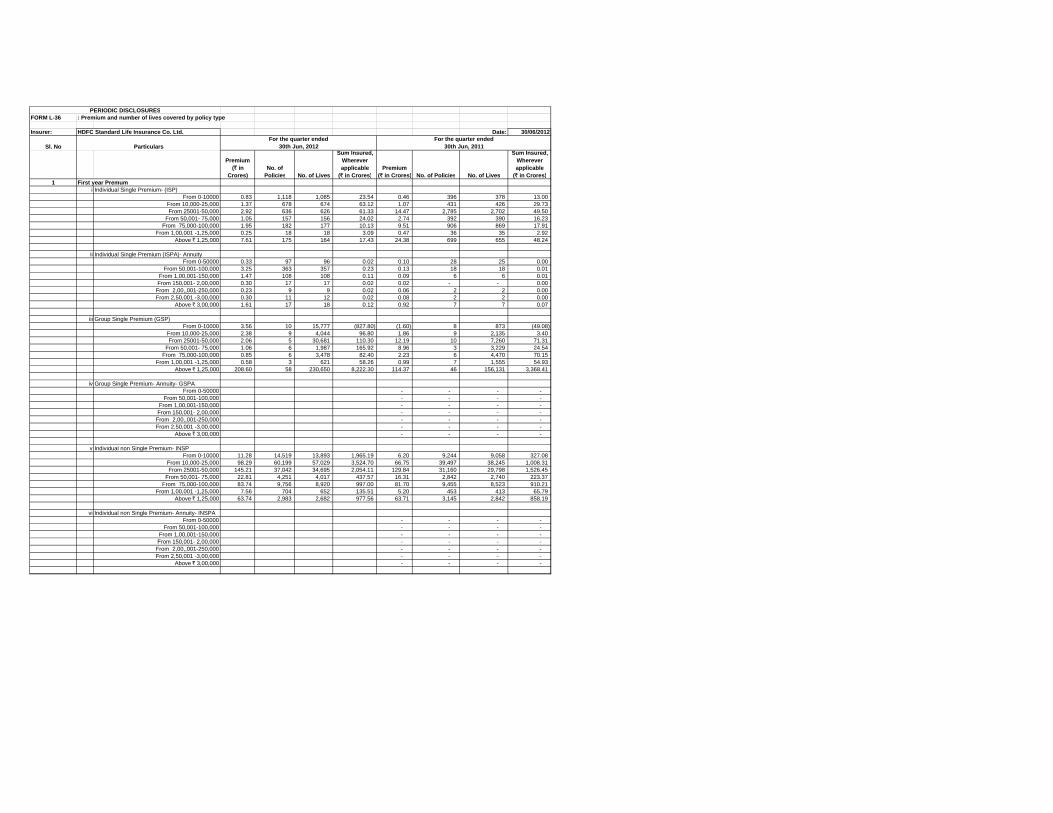
PERIODIC DISCLOSURESFORM L-36 : Premium and number of lives covered by policy type
Insurer: HDFC Standard Life Insurance Co. Ltd. Date: 30/06/2012
Sl. No Particulars
Premium (` in
Crores)No. of
Policies No. of Lives
Sum Insured, Wherever applicable
(` in Crores)Premium
(` in Crores) No. of Policies No. of Lives
Sum Insured, Wherever applicable
(` in Crores)1 First year Premum
i Individual Single Premium- (ISP)From 0-10000 0.83 1,118 1,085 23.54 0.46 396 378 13.00
From 10,000-25,000 1.37 678 674 63.12 1.07 431 426 29.73 From 25001-50,000 2.92 636 626 61.33 14.47 2,785 2,702 49.50
From 50,001- 75,000 1.05 157 156 24.02 2.74 392 390 16.23 From 75,000-100,000 1.95 182 177 10.13 9.51 906 869 17.91
From 1,00,001 -1,25,000 0.25 18 18 3.09 0.47 36 35 2.92 Above ̀ 1,25,000 7.61 175 164 17.43 24.38 699 655 48.24
ii Individual Single Premium (ISPA)- AnnuityFrom 0-50000 0.33 97 96 0.02 0.10 28 25 0.00
From 50,001-100,000 3.25 363 357 0.23 0.13 18 18 0.01 From 1,00,001-150,000 1.47 108 108 0.11 0.09 6 6 0.01
From 150,001- 2,00,000 0.30 17 17 0.02 0.02 - - 0.00 From 2,00,,001-250,000 0.23 9 9 0.02 0.06 2 2 0.00 From 2,50,001 -3,00,000 0.30 11 12 0.02 0.08 2 2 0.00
Above ̀ 3,00,000 1.61 17 18 0.12 0.92 7 7 0.07
iii Group Single Premium (GSP)From 0-10000 3.56 10 15,777 (827.80) (1.60) 8 873 (49.08)
From 10,000-25,000 2.38 9 4,044 96.80 1.86 9 2,135 3.40 From 25001-50,000 2.06 5 30,681 110.30 12.19 10 7,260 71.31
From 50,001- 75,000 1.06 6 1,987 165.92 8.96 3 3,229 24.54 From 75,000-100,000 0.85 6 3,478 82.40 2.23 6 4,470 70.15
From 1,00,001 -1,25,000 0.58 3 621 58.26 0.99 7 1,555 54.93 Above ̀ 1,25,000 208.60 58 230,650 8,222.30 114.37 46 156,131 3,368.41
iv Group Single Premium- Annuity- GSPAFrom 0-50000 - - - -
From 50,001-100,000 - - - - From 1,00,001-150,000 - - - - From 150,001- 2,00,000 - - - - From 2,00,,001-250,000 - - - - From 2,50,001 -3,00,000 - - - -
Above ̀ 3,00,000 - - - -
v Individual non Single Premium- INSPFrom 0-10000 11.28 14,519 13,893 1,965.19 6.20 9,244 9,058 327.08
From 10,000-25,000 98.29 60,199 57,029 3,524.70 66.75 39,497 38,245 1,008.31 From 25001-50,000 145.21 37,042 34,695 2,054.11 129.84 31,160 29,798 1,526.45
From 50,001- 75,000 22.81 4,251 4,017 437.57 16.31 2,842 2,740 223.37 From 75,000-100,000 83.74 9,756 8,920 997.00 81.70 9,455 8,523 910.21
From 1,00,001 -1,25,000 7.56 704 652 135.51 5.20 453 413 65.79 Above ̀ 1,25,000 63.74 2,983 2,682 977.56 63.71 3,145 2,842 858.19
vi Individual non Single Premium- Annuity- INSPAFrom 0-50000 - - - -
From 50,001-100,000 - - - - From 1,00,001-150,000 - - - -
From 150,001- 2,00,000 - - - - From 2,00,,001-250,000 - - - - From 2,50,001 -3,00,000 - - - -
Above ̀ 3,00,000 - - - -
For the quarter ended 30th Jun, 2012
For the quarter ended 30th Jun, 2011
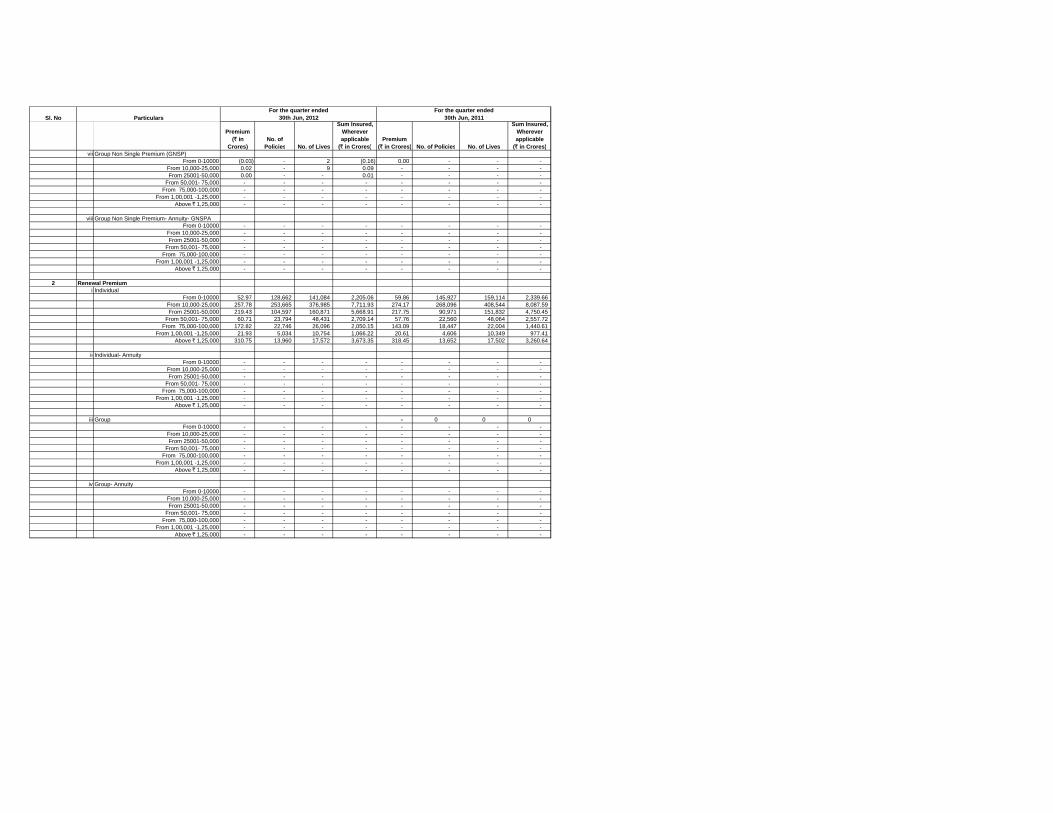
Sl. No Particulars
Premium (` in
Crores)No. of
Policies No. of Lives
Sum Insured, Wherever applicable
(` in Crores)Premium
(` in Crores) No. of Policies No. of Lives
Sum Insured, Wherever applicable
(` in Crores)
For the quarter ended 30th Jun, 2012
For the quarter ended 30th Jun, 2011
vii Group Non Single Premium (GNSP)From 0-10000 (0.03) - 2 (0.16) 0.00 - - -
From 10,000-25,000 0.02 - 9 0.09 - - - - From 25001-50,000 0.00 - - 0.01 - - - -
From 50,001- 75,000 - - - - - - - - From 75,000-100,000 - - - - - - - -
From 1,00,001 -1,25,000 - - - - - - - - Above ̀ 1,25,000 - - - - - - - -
viii Group Non Single Premium- Annuity- GNSPAFrom 0-10000 - - - - - - - -
From 10,000-25,000 - - - - - - - - From 25001-50,000 - - - - - - - -
From 50,001- 75,000 - - - - - - - - From 75,000-100,000 - - - - - - - -
From 1,00,001 -1,25,000 - - - - - - - - Above ̀ 1,25,000 - - - - - - - -
2 Renewal Premiumi Individual
From 0-10000 52.97 128,662 141,084 2,205.06 59.86 145,927 159,114 2,339.66 From 10,000-25,000 257.78 253,665 376,985 7,711.93 274.17 268,096 408,544 8,087.59 From 25001-50,000 219.43 104,597 160,871 5,668.91 217.75 90,971 151,832 4,750.45
From 50,001- 75,000 60.71 23,794 48,431 2,709.14 57.76 22,560 48,064 2,557.72 From 75,000-100,000 172.82 22,746 26,096 2,050.15 143.09 18,447 22,004 1,440.61
From 1,00,001 -1,25,000 21.93 5,034 10,754 1,066.22 20.61 4,606 10,349 977.41 Above ̀ 1,25,000 310.75 13,960 17,572 3,673.35 318.45 13,652 17,502 3,260.64
ii Individual- AnnuityFrom 0-10000 - - - - - - - -
From 10,000-25,000 - - - - - - - - From 25001-50,000 - - - - - - - -
From 50,001- 75,000 - - - - - - - - From 75,000-100,000 - - - - - - - -
From 1,00,001 -1,25,000 - - - - - - - - Above ̀ 1,25,000 - - - - - - - -
iii Group - 0 0 0From 0-10000 - - - - - - - -
From 10,000-25,000 - - - - - - - - From 25001-50,000 - - - - - - - -
From 50,001- 75,000 - - - - - - - - From 75,000-100,000 - - - - - - - -
From 1,00,001 -1,25,000 - - - - - - - - Above ̀ 1,25,000 - - - - - - - -
iv Group- AnnuityFrom 0-10000 - - - - - - - -
From 10,000-25,000 - - - - - - - - From 25001-50,000 - - - - - - - -
From 50,001- 75,000 - - - - - - - - From 75,000-100,000 - - - - - - - -
From 1,00,001 -1,25,000 - - - - - - - - Above ̀ 1,25,000 - - - - - - - -
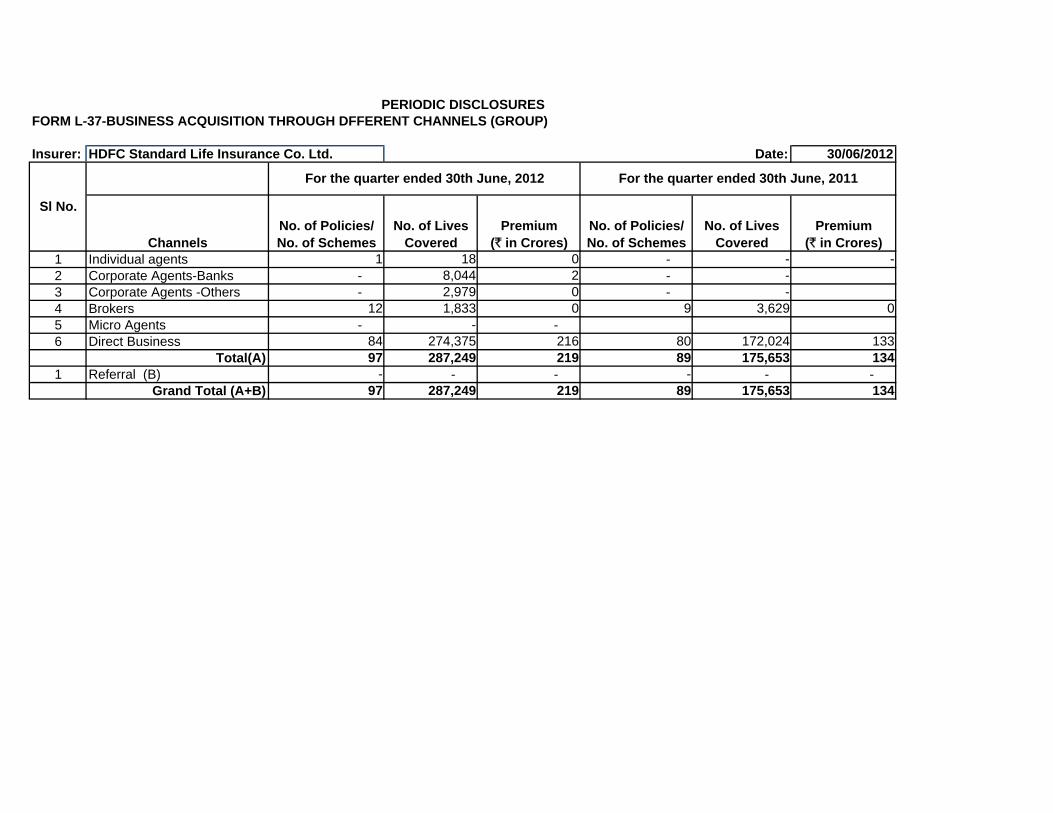
FORM L-37-BUSINESS ACQUISITION THROUGH DFFERENT CHANNELS (GROUP)
Insurer: Date: 30/06/2012
1 Individual agents 1 18 0 - - - 2 Corporate Agents-Banks - 8,044 2 - - 3 Corporate Agents -Others - 2,979 0 - - 4 Brokers 12 1,833 0 9 3,629 0 5 Micro Agents - - - 6 Direct Business 84 274,375 216 80 172,024 133
Total(A) 97 287,249 219 89 175,653 134 1 Referral (B) - - - - - -
Grand Total (A+B) 97 287,249 219 89 175,653 134
ChannelsPremium
(` in Crores)No. of Lives
CoveredNo. of Policies/ No. of Schemes
Premium (` in Crores)
For the quarter ended 30th June, 2011
PERIODIC DISCLOSURES
HDFC Standard Life Insurance Co. Ltd.
Sl No.
For the quarter ended 30th June, 2012
No. of Policies/ No. of Schemes
No. of Lives Covered
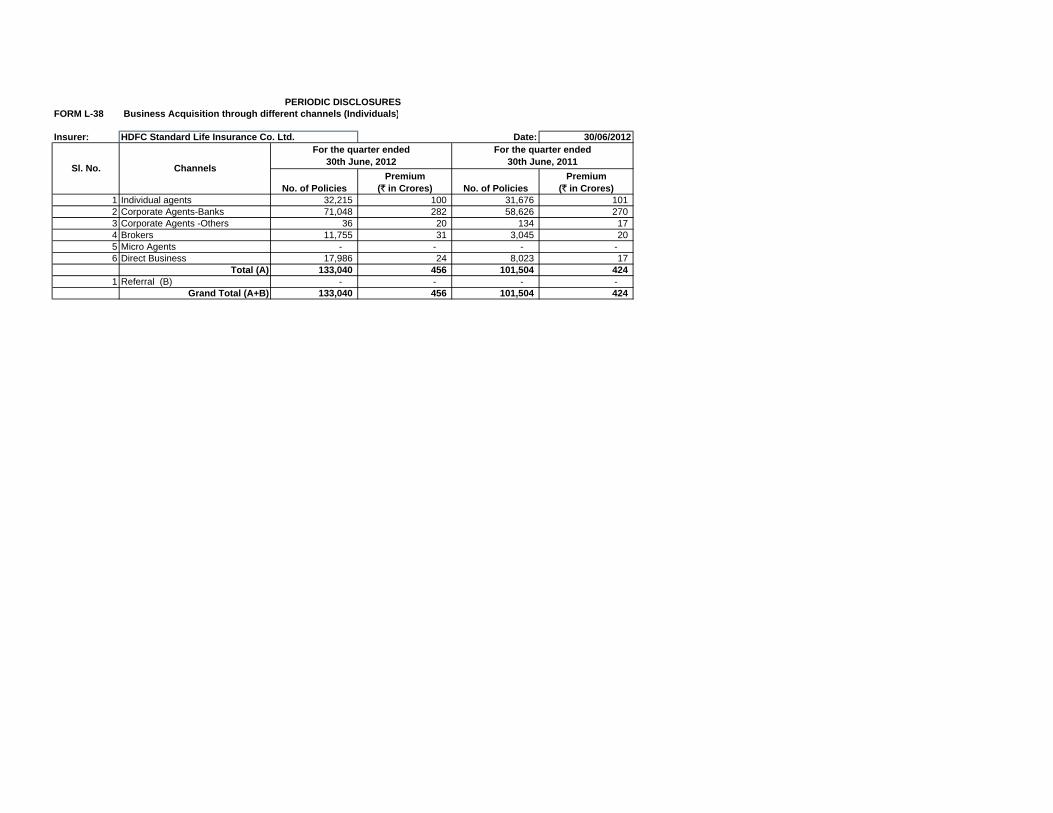
FORM L-38 Business Acquisition through different channels (Individuals)
Insurer: Date: 30/06/2012
1 Individual agents 32,215 100 31,676 101 2 Corporate Agents-Banks 71,048 282 58,626 270 3 Corporate Agents -Others 36 20 134 17 4 Brokers 11,755 31 3,045 20 5 Micro Agents - - - - 6 Direct Business 17,986 24 8,023 17
Total (A) 133,040 456 101,504 424 1 Referral (B) - - - -
Grand Total (A+B) 133,040 456 101,504 424
No. of PoliciesPremium
(` in Crores)
PERIODIC DISCLOSURES
HDFC Standard Life Insurance Co. Ltd.
Sl. No. Channels
For the quarter ended 30th June, 2012
For the quarter ended 30th June, 2011
No. of PoliciesPremium
(` in Crores)
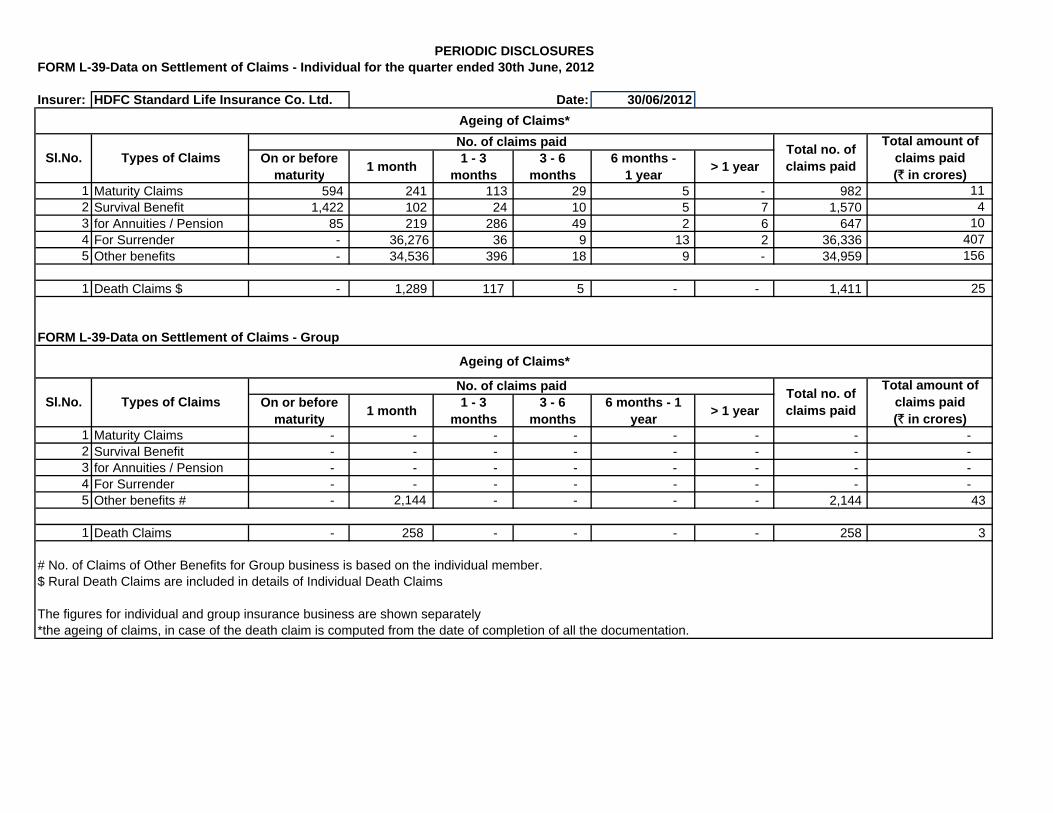
FORM L-39-Data on Settlement of Claims - Individual for the quarter ended 30th June, 2012
Insurer: HDFC Standard Life Insurance Co. Ltd. Date: 30/06/2012
On or before maturity
1 month1 - 3
months3 - 6
months6 months -
1 year> 1 year
1 Maturity Claims 594 241 113 29 5 - 982 11 2 Survival Benefit 1,422 102 24 10 5 7 1,570 4 3 for Annuities / Pension 85 219 286 49 2 6 647 10 4 For Surrender - 36,276 36 9 13 2 36,336 407 5 Other benefits - 34,536 396 18 9 - 34,959 156
1 Death Claims $ - 1,289 117 5 - - 1,411 25
FORM L-39-Data on Settlement of Claims - Group
On or before maturity
1 month1 - 3
months3 - 6
months6 months - 1
year> 1 year
1 Maturity Claims - - - - - - - - 2 Survival Benefit - - - - - - - - 3 for Annuities / Pension - - - - - - - - 4 For Surrender - - - - - - - - 5 Other benefits # - 2,144 - - - - 2,144 43
1 Death Claims - 258 - - - - 258 3
# No. of Claims of Other Benefits for Group business is based on the individual member.$ Rural Death Claims are included in details of Individual Death Claims
The figures for individual and group insurance business are shown separately *the ageing of claims, in case of the death claim is computed from the date of completion of all the documentation.
Ageing of Claims*
Sl.No. Types of ClaimsNo. of claims paid
Total no. of claims paid
Total amount of claims paid (` in crores)
PERIODIC DISCLOSURES
Ageing of Claims*
Sl.No. Types of ClaimsTotal no. of claims paid
Total amount of claims paid (` in crores)
No. of claims paid
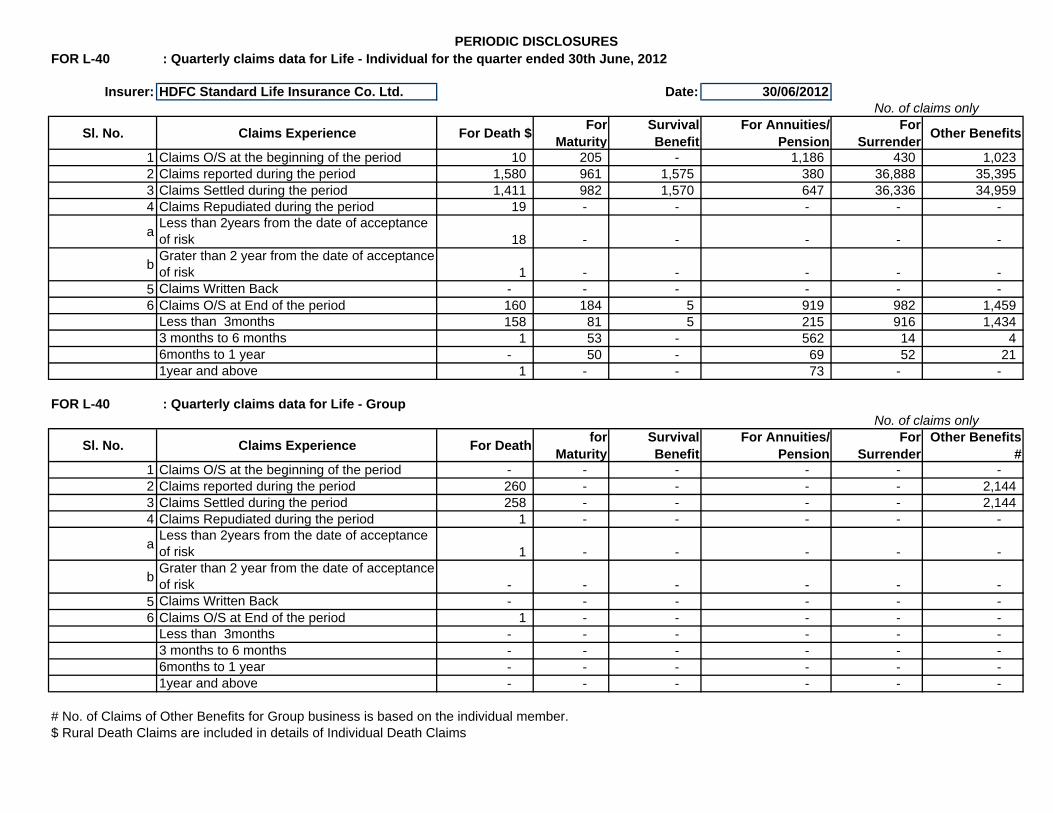
FOR L-40 : Quarterly claims data for Life - Individual for the quarter ended 30th June, 2012
Insurer: HDFC Standard Life Insurance Co. Ltd. Date: 30/06/2012
Sl. No. Claims Experience For Death $For
MaturitySurvival Benefit
For Annuities/ Pension
For Surrender
Other Benefits
1 Claims O/S at the beginning of the period 10 205 - 1,186 430 1,023 2 Claims reported during the period 1,580 961 1,575 380 36,888 35,395 3 Claims Settled during the period 1,411 982 1,570 647 36,336 34,959 4 Claims Repudiated during the period 19 - - - - -
aLess than 2years from the date of acceptance of risk 18 - - - - -
bGrater than 2 year from the date of acceptance of risk 1 - - - - -
5 Claims Written Back - - - - - - 6 Claims O/S at End of the period 160 184 5 919 982 1,459
Less than 3months 158 81 5 215 916 1,434 3 months to 6 months 1 53 - 562 14 4 6months to 1 year - 50 - 69 52 21 1year and above 1 - - 73 - -
FOR L-40 : Quarterly claims data for Life - Group
Sl. No. Claims Experience For Deathfor
MaturitySurvival Benefit
For Annuities/ Pension
For Surrender
Other Benefits #
1 Claims O/S at the beginning of the period - - - - - - 2 Claims reported during the period 260 - - - - 2,144 3 Claims Settled during the period 258 - - - - 2,144 4 Claims Repudiated during the period 1 - - - - -
aLess than 2years from the date of acceptance of risk 1 - - - - -
bGrater than 2 year from the date of acceptance of risk - - - - - -
5 Claims Written Back - - - - - - 6 Claims O/S at End of the period 1 - - - - -
Less than 3months - - - - - - 3 months to 6 months - - - - - - 6months to 1 year - - - - - - 1year and above - - - - - -
# No. of Claims of Other Benefits for Group business is based on the individual member.$ Rural Death Claims are included in details of Individual Death Claims
No. of claims only
No. of claims only
PERIODIC DISCLOSURES
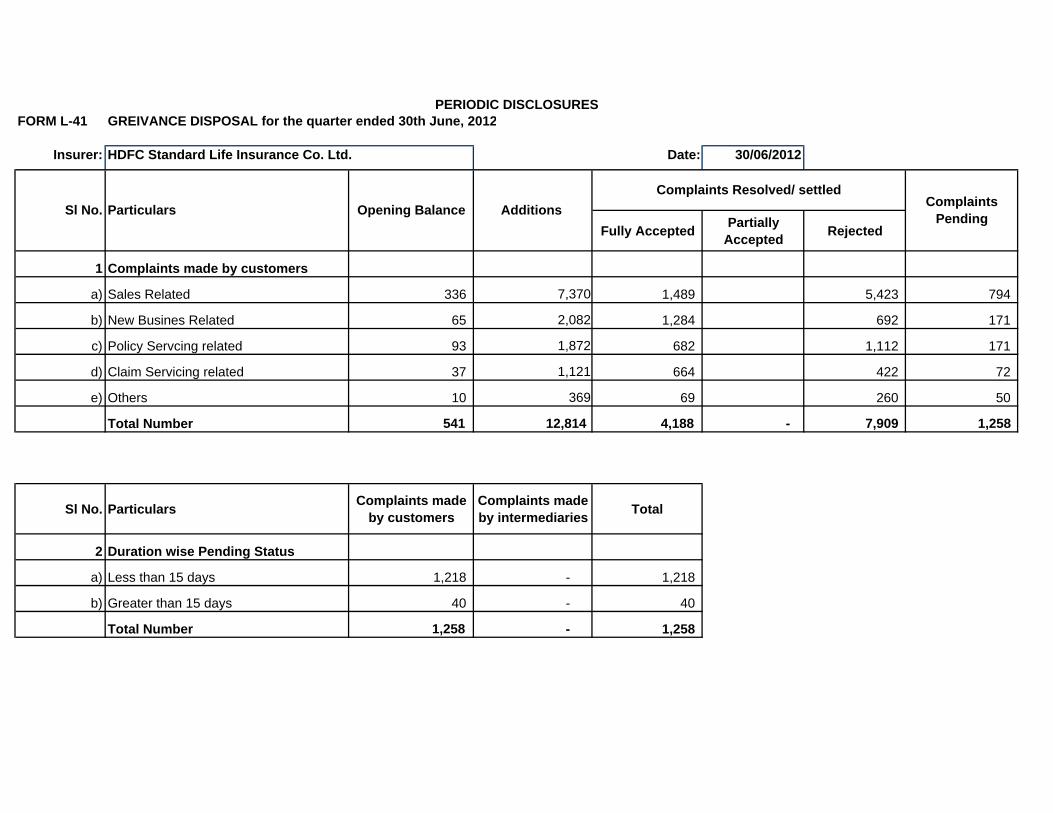
FORM L-41 GREIVANCE DISPOSAL for the quarter ended 30th June, 2012
Insurer: Date: 30/06/2012
Fully AcceptedPartially
AcceptedRejected
1 Complaints made by customers
a) Sales Related 336 7,370 1,489 5,423 794
b) New Busines Related 65 2,082 1,284 692 171
c) Policy Servcing related 93 1,872 682 1,112 171
d) Claim Servicing related 37 1,121 664 422 72
e) Others 10 369 69 260 50
Total Number 541 12,814 4,188 - 7,909 1,258
Sl No. ParticularsComplaints made
by customersComplaints made by intermediaries
Total
2 Duration wise Pending Status
a) Less than 15 days 1,218 - 1,218
b) Greater than 15 days 40 - 40
Total Number 1,258 - 1,258
PERIODIC DISCLOSURES
Sl No. Particulars Opening Balance Additions Complaints
Pending
Complaints Resolved/ settled
HDFC Standard Life Insurance Co. Ltd.
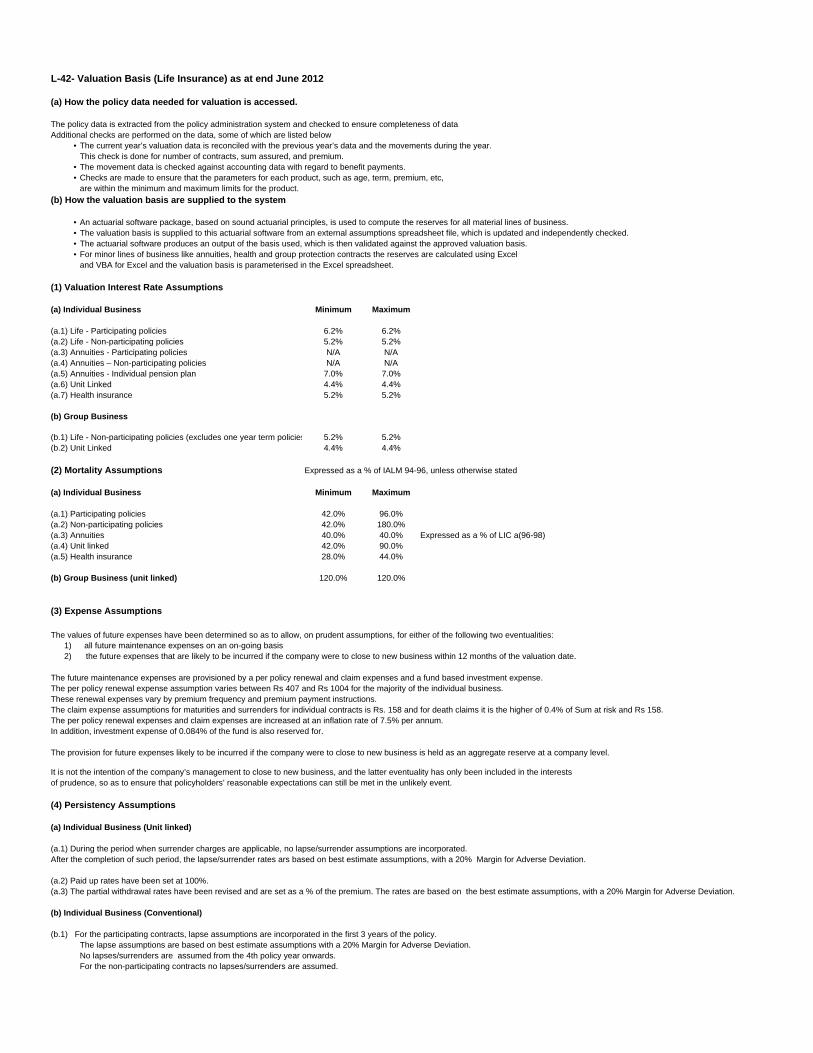
L-42- Valuation Basis (Life Insurance) as at end June 2012
(a) How the policy data needed for valuation is accessed.
The policy data is extracted from the policy administration system and checked to ensure completeness of dataAdditional checks are performed on the data, some of which are listed below
• The current year’s valuation data is reconciled with the previous year’s data and the movements during the year. This check is done for number of contracts, sum assured, and premium.
• The movement data is checked against accounting data with regard to benefit payments.• Checks are made to ensure that the parameters for each product, such as age, term, premium, etc,
are within the minimum and maximum limits for the product.
(b) How the valuation basis are supplied to the system
• An actuarial software package, based on sound actuarial principles, is used to compute the reserves for all material lines of business.• The valuation basis is supplied to this actuarial software from an external assumptions spreadsheet file, which is updated and independently checked.• The actuarial software produces an output of the basis used, which is then validated against the approved valuation basis.• For minor lines of business like annuities, health and group protection contracts the reserves are calculated using Excel
and VBA for Excel and the valuation basis is parameterised in the Excel spreadsheet.
(1) Valuation Interest Rate Assumptions
(a) Individual Business Minimum Maximum
(a.1) Life - Participating policies 6.2% 6.2%(a.2) Life - Non-participating policies 5.2% 5.2%(a.3) Annuities - Participating policies N/A N/A(a.4) Annuities – Non-participating policies N/A N/A(a.5) Annuities - Individual pension plan 7.0% 7.0%(a.6) Unit Linked 4.4% 4.4%(a.7) Health insurance 5.2% 5.2%
(b) Group Business
(b.1) Life - Non-participating policies (excludes one year term policies 5.2% 5.2%(b.2) Unit Linked 4.4% 4.4%
(2) Mortality Assumptions Expressed as a % of IALM 94-96, unless otherwise stated
(a) Individual Business Minimum Maximum
(a.1) Participating policies 42.0% 96.0%(a.2) Non-participating policies 42.0% 180.0%(a.3) Annuities 40.0% 40.0% Expressed as a % of LIC a(96-98)(a.4) Unit linked 42.0% 90.0%(a.5) Health insurance 28.0% 44.0%
(b) Group Business (unit linked) 120.0% 120.0%
(3) Expense Assumptions
The values of future expenses have been determined so as to allow, on prudent assumptions, for either of the following two eventualities:1) all future maintenance expenses on an on-going basis2) the future expenses that are likely to be incurred if the company were to close to new business within 12 months of the valuation date.
The future maintenance expenses are provisioned by a per policy renewal and claim expenses and a fund based investment expense.The per policy renewal expense assumption varies between Rs 407 and Rs 1004 for the majority of the individual business.These renewal expenses vary by premium frequency and premium payment instructions.The claim expense assumptions for maturities and surrenders for individual contracts is Rs. 158 and for death claims it is the higher of 0.4% of Sum at risk and Rs 158.The per policy renewal expenses and claim expenses are increased at an inflation rate of 7.5% per annum. In addition, investment expense of 0.084% of the fund is also reserved for.
The provision for future expenses likely to be incurred if the company were to close to new business is held as an aggregate reserve at a company level.
(4) Persistency Assumptions
(a) Individual Business (Unit linked)
(a.1) During the period when surrender charges are applicable, no lapse/surrender assumptions are incorporated.After the completion of such period, the lapse/surrender rates ars based on best estimate assumptions, with a 20% Margin for Adverse Deviation.
(a.2) Paid up rates have been set at 100%.(a.3) The partial withdrawal rates have been revised and are set as a % of the premium. The rates are based on the best estimate assumptions, with a 20% Margin for Adverse Deviation.
(b) Individual Business (Conventional)
(b.1) For the participating contracts, lapse assumptions are incorporated in the first 3 years of the policy. The lapse assumptions are based on best estimate assumptions with a 20% Margin for Adverse Deviation.No lapses/surrenders are assumed from the 4th policy year onwards.For the non-participating contracts no lapses/surrenders are assumed.
It is not the intention of the company’s management to close to new business, and the latter eventuality has only been included in the interests of prudence, so as to ensure that policyholders’ reasonable expectations can still be met in the unlikely event.
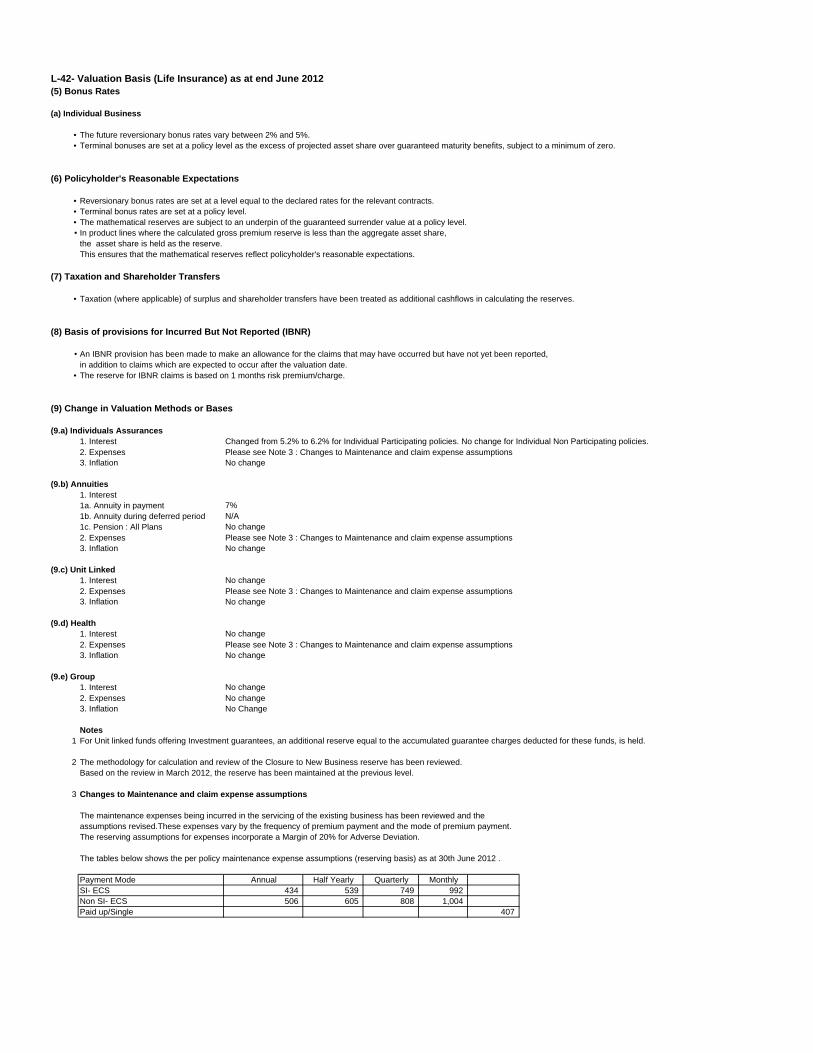
L-42- Valuation Basis (Life Insurance) as at end June 2012(5) Bonus Rates
(a) Individual Business
• The future reversionary bonus rates vary between 2% and 5%.• Terminal bonuses are set at a policy level as the excess of projected asset share over guaranteed maturity benefits, subject to a minimum of zero.
(6) Policyholder's Reasonable Expectations
• Reversionary bonus rates are set at a level equal to the declared rates for the relevant contracts.• Terminal bonus rates are set at a policy level.••
the asset share is held as the reserve.This ensures that the mathematical reserves reflect policyholder's reasonable expectations.
(7) Taxation and Shareholder Transfers
• Taxation (where applicable) of surplus and shareholder transfers have been treated as additional cashflows in calculating the reserves.
(8) Basis of provisions for Incurred But Not Reported (IBNR)
•in addition to claims which are expected to occur after the valuation date.
• The reserve for IBNR claims is based on 1 months risk premium/charge.
(9) Change in Valuation Methods or Bases
(9.a) Individuals Assurances1. Interest Changed from 5.2% to 6.2% for Individual Participating policies. No change for Individual Non Participating policies.2. Expenses3. Inflation No change
(9.b) Annuities1. Interest1a. Annuity in payment 7%1b. Annuity during deferred period N/A1c. Pension : All Plans No change2. Expenses3. Inflation No change
(9.c) Unit Linked1. Interest No change2. Expenses3. Inflation No change
(9.d) Health1. Interest No change2. Expenses3. Inflation No change
(9.e) Group1. Interest No change2. Expenses3. Inflation No Change
Notes1 For Unit linked funds offering Investment guarantees, an additional reserve equal to the accumulated guarantee charges deducted for these funds, is held.
2 The methodology for calculation and review of the Closure to New Business reserve has been reviewed. Based on the review in March 2012, the reserve has been maintained at the previous level.
3 Changes to Maintenance and claim expense assumptions
The tables below shows the per policy maintenance expense assumptions (reserving basis) as at 30th June 2012 .
Payment Mode Annual Half Yearly Quarterly MonthlySI- ECS 434 539 749 992 Non SI- ECS 506 605 808 1,004 Paid up/Single 407
The maintenance expenses being incurred in the servicing of the existing business has been reviewed and the assumptions revised.These expenses vary by the frequency of premium payment and the mode of premium payment. The reserving assumptions for expenses incorporate a Margin of 20% for Adverse Deviation.
The mathematical reserves are subject to an underpin of the guaranteed surrender value at a policy level.
An IBNR provision has been made to make an allowance for the claims that may have occurred but have not yet been reported,
Please see Note 3 : Changes to Maintenance and claim expense assumptions
Please see Note 3 : Changes to Maintenance and claim expense assumptions
Please see Note 3 : Changes to Maintenance and claim expense assumptions
Please see Note 3 : Changes to Maintenance and claim expense assumptions
No change
In product lines where the calculated gross premium reserve is less than the aggregate asset share,