Embed Size (px)
Citation preview

HDV Greenhouse Gas
Technologies, Costs and
Benefits
Kate Blumberg & ICCT Heavy Duty Vehicle Team
Foro de Eficiencia Energética en el Transporte
29 de septiembre, 2015
Hotel Sevilla Palace, Ciudad de México

About the ICCT
Mission: To dramatically improve environmental performance
and efficiency of motor vehicles (cars, trucks, marine, aviation)
and fuels by supporting government regulatory agencies in
world’s top vehicle markets.
International Council Composed
of top government regulators (~25)
in major markets founded in 2001.
Non-profit Organization
ICCT incorporated to serve
International Council, staff of 35
technical experts on vehicles and
fuels, half with background /
nationality outside US founded in
2005. Offices in DC, San
Francisco and Berlin. China office
coming later this year.
Funding
California philanthropies plus
government grants and contracts.
Geographic scope: China, US,
EU, Japan, Brazil, India, Canada,
Korea, Indonesia, Australia,
Mexico plus
smaller markets by request.
2
3
G20
Transport assessment
Focus on HDVs
ICCT research
DOE Supertruck program
Class 8 technology potential and payback
Trailers
Pickups and Vans (2bs and 3s)
Observations and conclusions for Mexico
Outline
G20 Transport assessment
Focus on HDVs
4
5
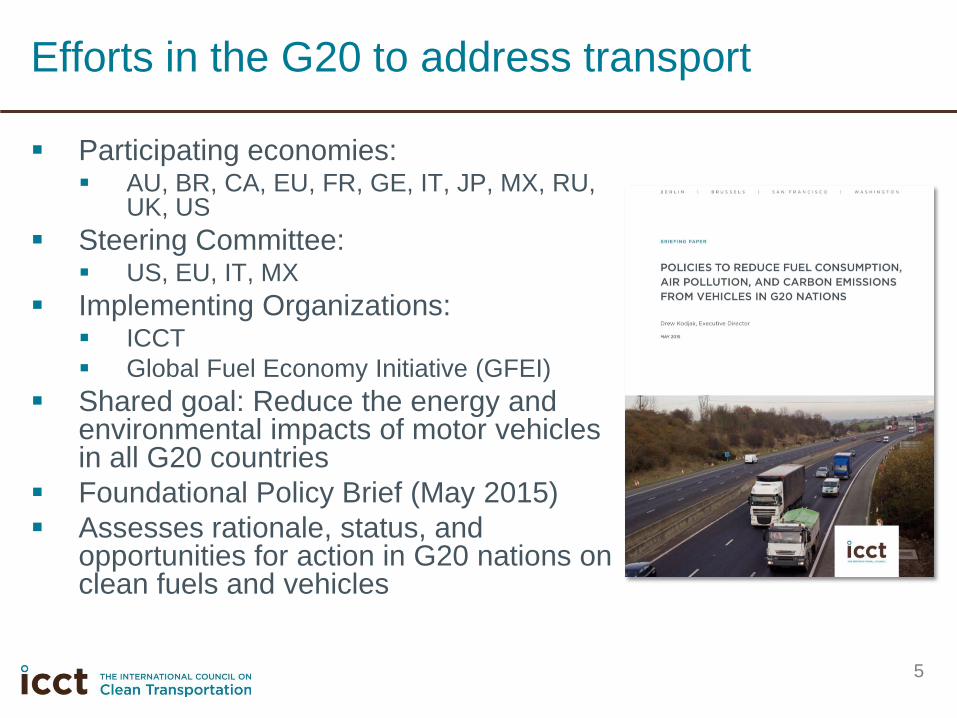
Participating economies: AU, BR, CA, EU, FR, GE, IT, JP, MX, RU,
UK, US
Steering Committee: US, EU, IT, MX
Implementing Organizations: ICCT
Global Fuel Economy Initiative (GFEI)
Shared goal: Reduce the energy and environmental impacts of motor vehicles in all G20 countries
Foundational Policy Brief (May 2015)
Assesses rationale, status, and opportunities for action in G20 nations on clean fuels and vehicles
Efforts in the G20 to address transport

6
Emissions from the transport sector are
significant…especially from heavy-duty vehicles
The transport sector, in particular heavy-duty vehicles, are significant contributors to global CO2 emissions and local air pollutant emissions.
Worldwide, heavy-duty vehicles (trucks and buses) represent just 11% of motor vehicles, but they are responsible for almost half of vehicle CO2 emissions and over two-thirds of vehicle particulate emissions.
7
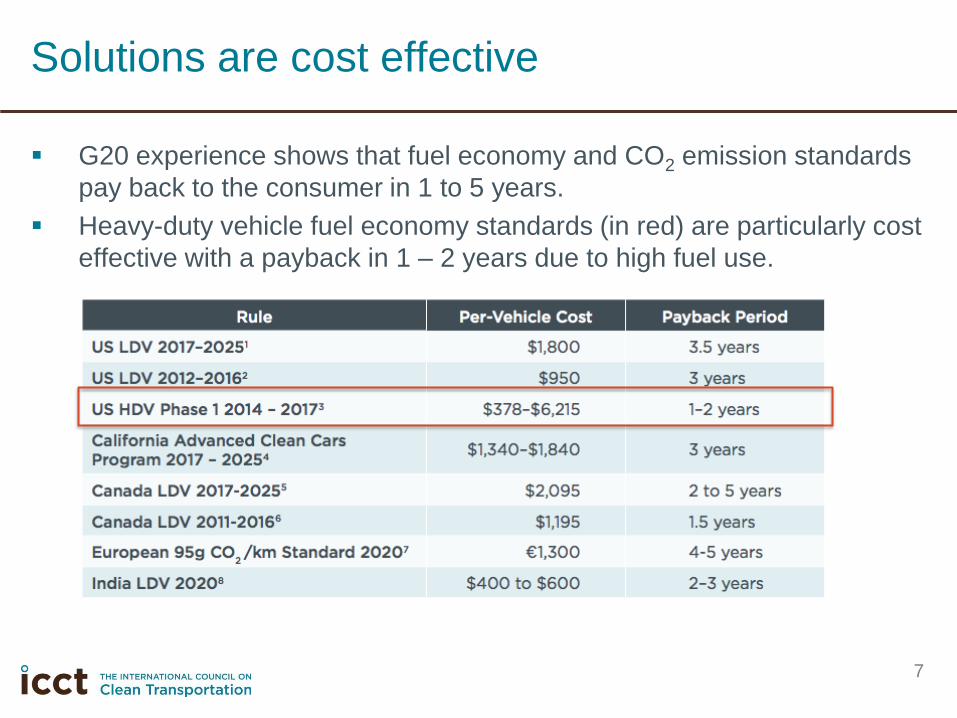
G20 experience shows that fuel economy and CO2 emission standards
pay back to the consumer in 1 to 5 years.
Heavy-duty vehicle fuel economy standards (in red) are particularly cost
effective with a payback in 1 – 2 years due to high fuel use.
Solutions are cost effective
ICCT research
Background
Trailers
Engines
DOE Supertruck
8
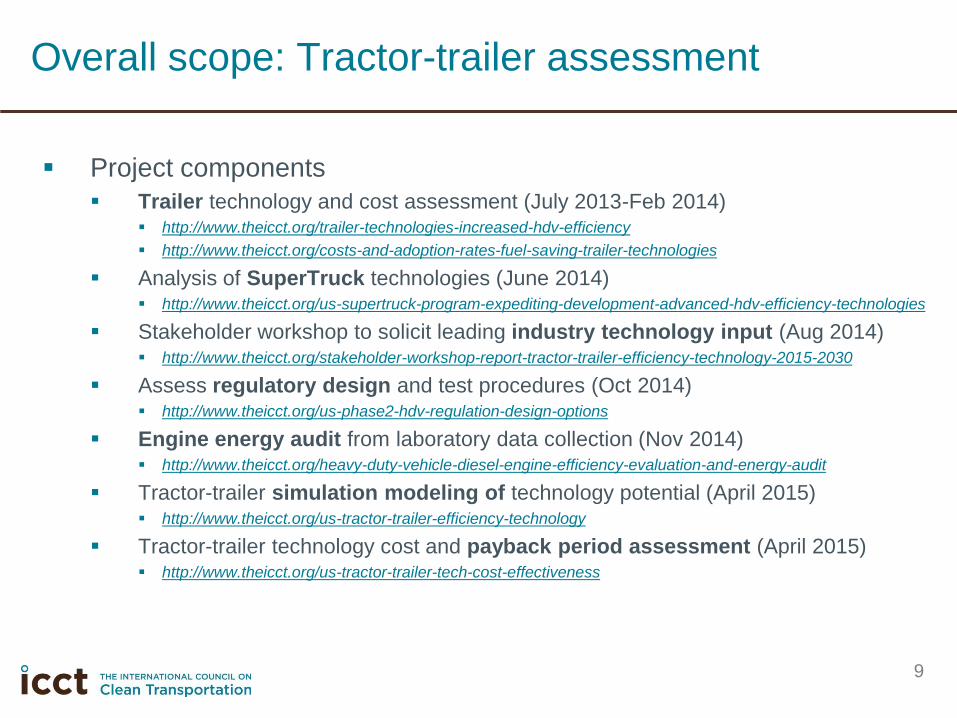
Project components
Trailer technology and cost assessment (July 2013-Feb 2014) http://www.theicct.org/trailer-technologies-increased-hdv-efficiency
http://www.theicct.org/costs-and-adoption-rates-fuel-saving-trailer-technologies
Analysis of SuperTruck technologies (June 2014) http://www.theicct.org/us-supertruck-program-expediting-development-advanced-hdv-efficiency-technologies
Stakeholder workshop to solicit leading industry technology input (Aug 2014) http://www.theicct.org/stakeholder-workshop-report-tractor-trailer-efficiency-technology-2015-2030
Assess regulatory design and test procedures (Oct 2014) http://www.theicct.org/us-phase2-hdv-regulation-design-options
Engine energy audit from laboratory data collection (Nov 2014) http://www.theicct.org/heavy-duty-vehicle-diesel-engine-efficiency-evaluation-and-energy-audit
Tractor-trailer simulation modeling of technology potential (April 2015) http://www.theicct.org/us-tractor-trailer-efficiency-technology
Tractor-trailer technology cost and payback period assessment (April 2015) http://www.theicct.org/us-tractor-trailer-tech-cost-effectiveness
Overall scope: Tractor-trailer assessment
9
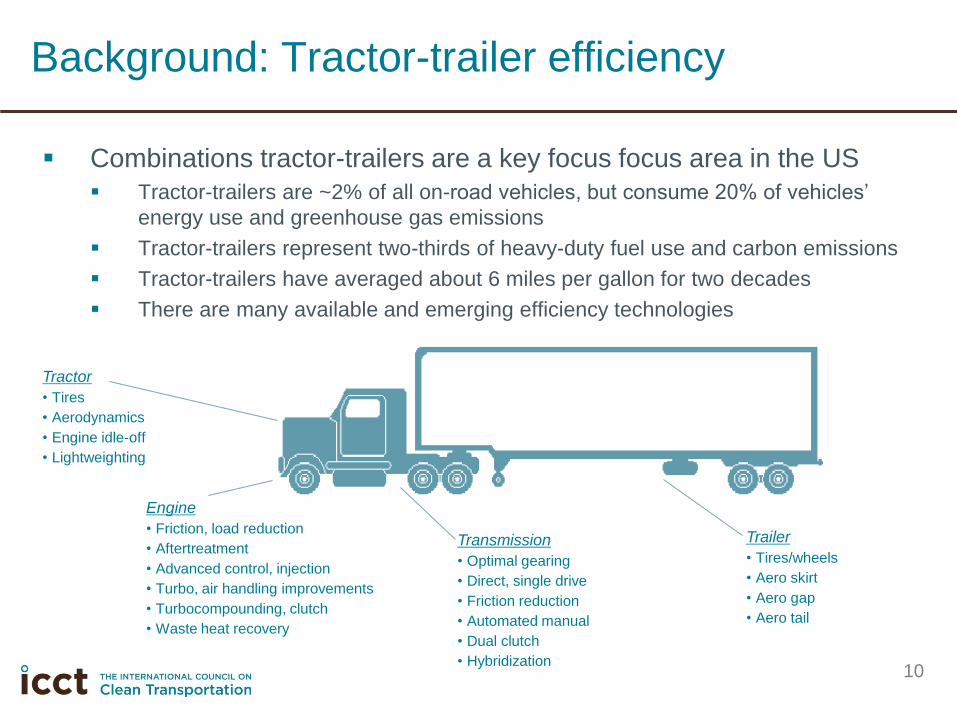
Trailer
• Tires/wheels
• Aero skirt
• Aero gap
• Aero tail
Combinations tractor-trailers are a key focus focus area in the US
Tractor-trailers are ~2% of all on-road vehicles, but consume 20% of vehicles’
energy use and greenhouse gas emissions
Tractor-trailers represent two-thirds of heavy-duty fuel use and carbon emissions
Tractor-trailers have averaged about 6 miles per gallon for two decades
There are many available and emerging efficiency technologies
Background: Tractor-trailer efficiency
10
Tractor
• Tires
• Aerodynamics
• Engine idle-off
• Lightweighting
Engine
• Friction, load reduction
• Aftertreatment
• Advanced control, injection
• Turbo, air handling improvements
• Turbocompounding, clutch
• Waste heat recovery
Transmission
• Optimal gearing
• Direct, single drive
• Friction reduction
• Automated manual
• Dual clutch
• Hybridization
11
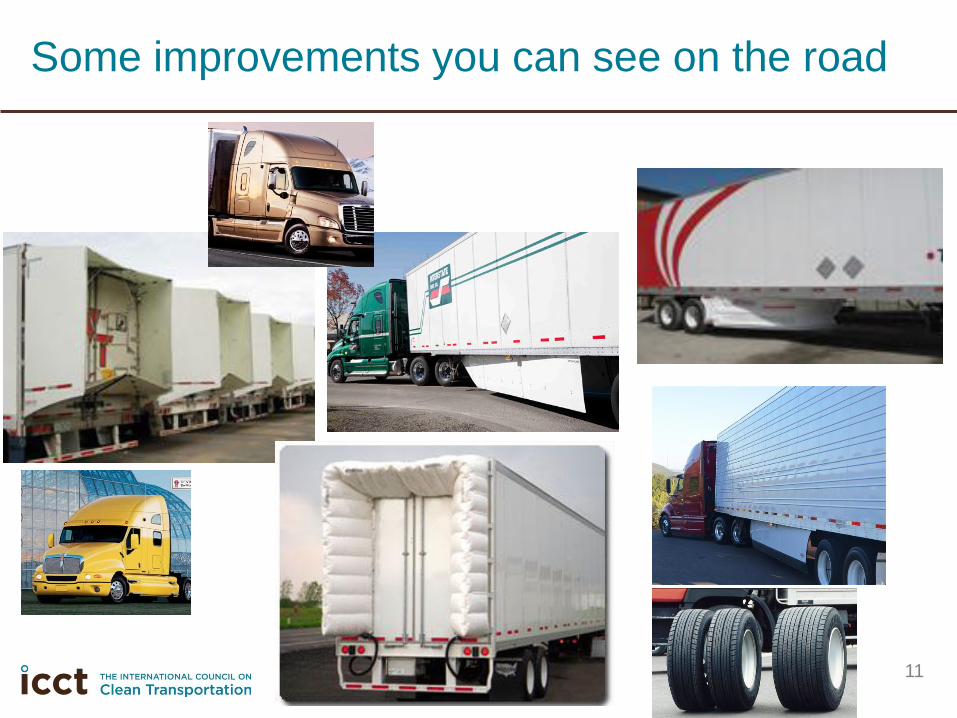
Some improvements you can see on the road
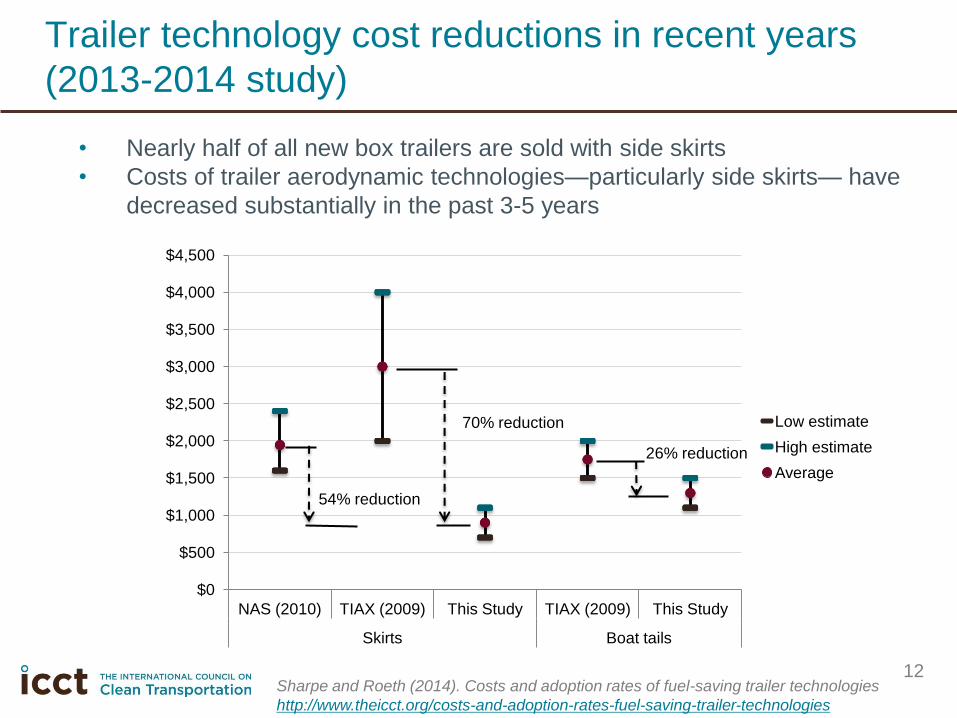
Trailer technology cost reductions in recent years
(2013-2014 study)
12
• Nearly half of all new box trailers are sold with side skirts
• Costs of trailer aerodynamic technologies—particularly side skirts— have
decreased substantially in the past 3-5 years
$0
$500
$1,000
$1,500
$2,000
$2,500
$3,000
$3,500
$4,000
$4,500
NAS (2010) TIAX (2009) This Study TIAX (2009) This Study
Skirts Boat tails
Low estimate
High estimate
Average
26% reduction
70% reduction
54% reduction
Sharpe and Roeth (2014). Costs and adoption rates of fuel-saving trailer technologies
http://www.theicct.org/costs-and-adoption-rates-fuel-saving-trailer-technologies
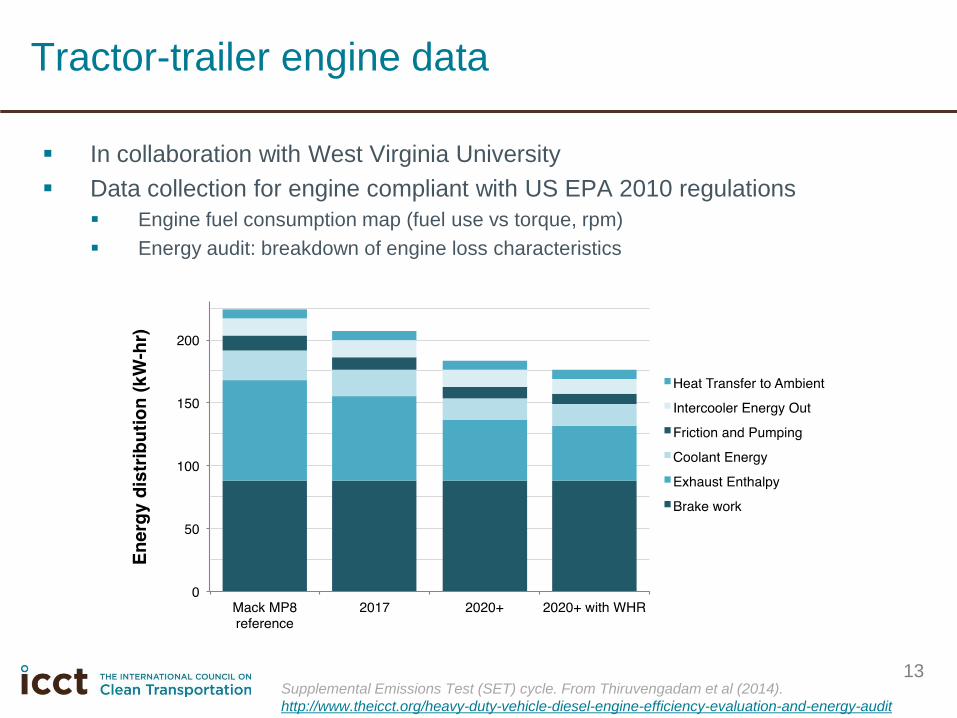
In collaboration with West Virginia University
Data collection for engine compliant with US EPA 2010 regulations
Engine fuel consumption map (fuel use vs torque, rpm)
Energy audit: breakdown of engine loss characteristics
Tractor-trailer engine data
13 Supplemental Emissions Test (SET) cycle. From Thiruvengadam et al (2014).
http://www.theicct.org/heavy-duty-vehicle-diesel-engine-efficiency-evaluation-and-energy-audit
14
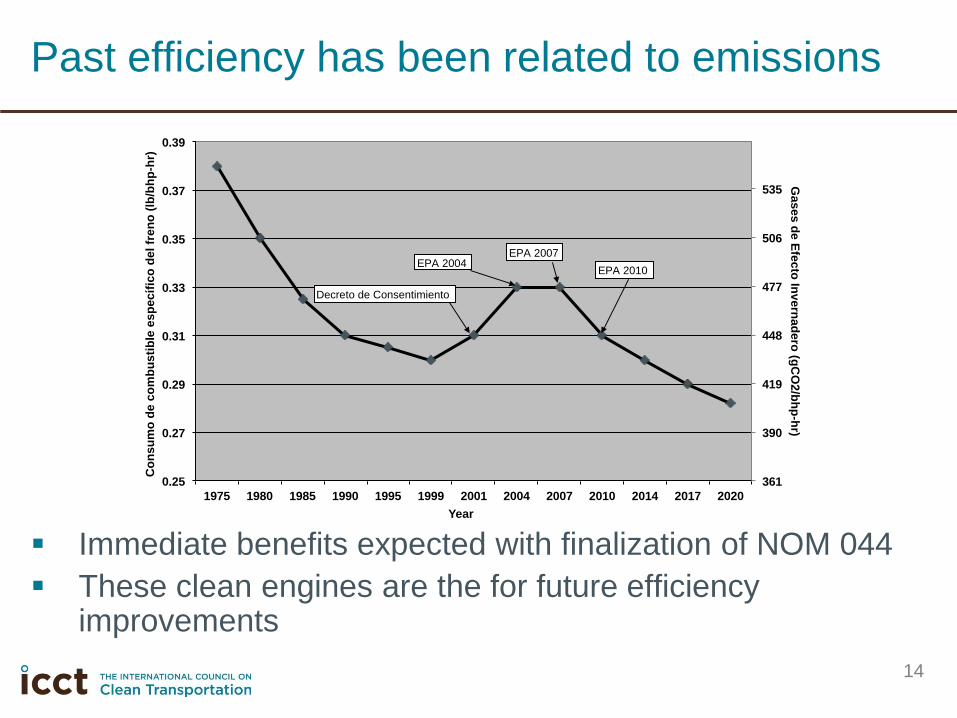
Immediate benefits expected with finalization of NOM 044
These clean engines are the for future efficiency improvements
Past efficiency has been related to emissions
361
390
419
448
477
506
535
0.25
0.27
0.29
0.31
0.33
0.35
0.37
0.39
1975 1980 1985 1990 1995 1999 2001 2004 2007 2010 2014 2017 2020
Gases
de
Efe
cto
Invern
ad
ero
(gC
O2/b
hp
-hr)
Co
nsu
mo
de c
om
bu
sti
ble
es
pecíf
ico
del
fren
o (
lb/b
hp
-hr)
Year
Decreto de Consentimiento
EPA 2004 EPA 2007
EPA 2010
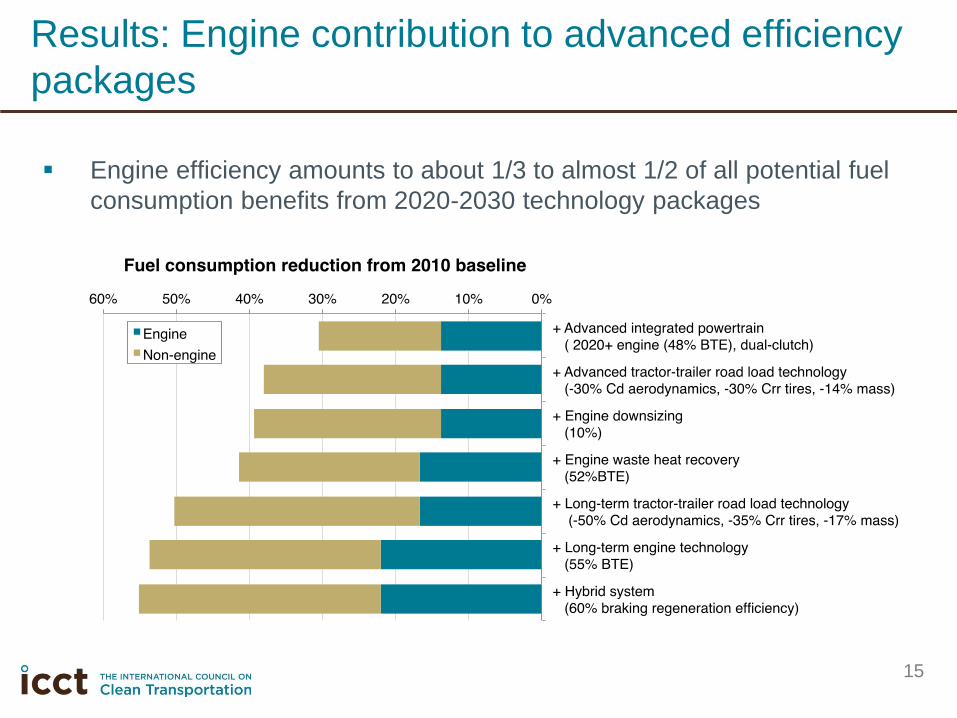
Results: Engine contribution to advanced efficiency
packages
Engine efficiency amounts to about 1/3 to almost 1/2 of all potential fuel
consumption benefits from 2020-2030 technology packages
15

Tractor-trailer efficiency technologies
16 From July 22, 2014 HDV stakeholder workshop with OEMs, suppliers, research groups, NGOs, government agencies.
Lutsey et al (2014). http://www.theicct.org/stakeholder-workshop-report-tractor-trailer-efficiency-technology-2015-2030
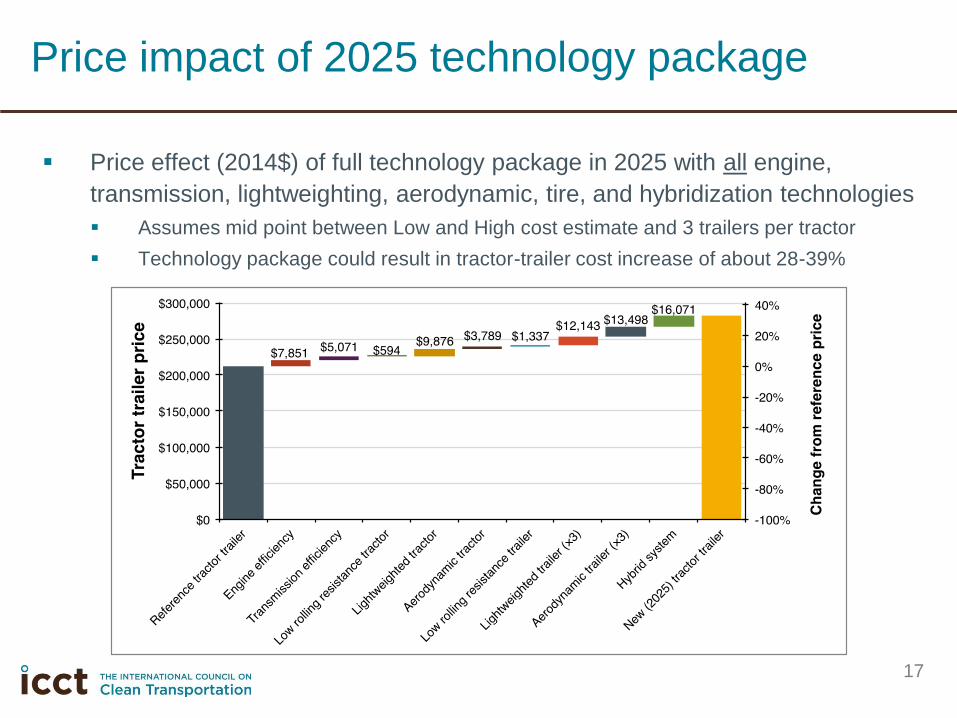
Price effect (2014$) of full technology package in 2025 with all engine,
transmission, lightweighting, aerodynamic, tire, and hybridization technologies
Assumes mid point between Low and High cost estimate and 3 trailers per tractor
Technology package could result in tractor-trailer cost increase of about 28-39%
Price impact of 2025 technology package
17

Simulation modeling of tractor-trailer fuel consumption
Incorporate interactions between the technologies
Engine, transmission, aerodynamics, tire, mass reduction, etc
Modeled in US DOE Autonomie framework
Evaluate energy loads and losses over various drive cycles across
Tractor-trailer modeling
18
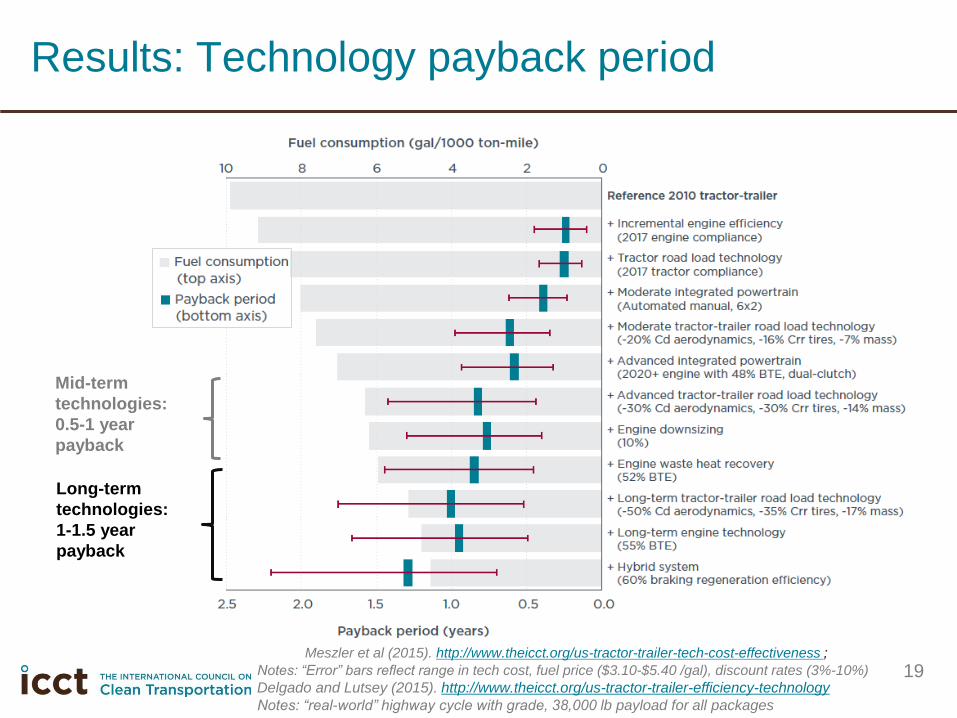
Results: Technology payback period
Meszler et al (2015). http://www.theicct.org/us-tractor-trailer-tech-cost-effectiveness ;
Notes: “Error” bars reflect range in tech cost, fuel price ($3.10-$5.40 /gal), discount rates (3%-10%)
Delgado and Lutsey (2015). http://www.theicct.org/us-tractor-trailer-efficiency-technology
Notes: “real-world” highway cycle with grade, 38,000 lb payload for all packages
19
Mid-term
technologies:
0.5-1 year
payback
Long-term
technologies:
1-1.5 year
payback
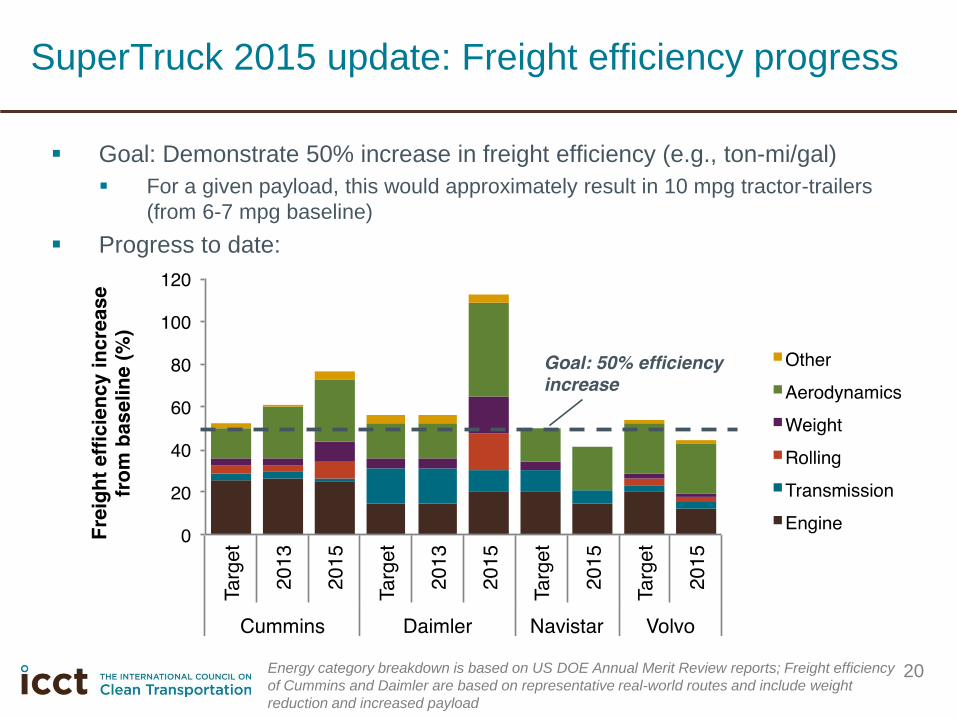
SuperTruck 2015 update: Freight efficiency progress
Goal: Demonstrate 50% increase in freight efficiency (e.g., ton-mi/gal)
For a given payload, this would approximately result in 10 mpg tractor-trailers
(from 6-7 mpg baseline)
Progress to date:
20 Energy category breakdown is based on US DOE Annual Merit Review reports; Freight efficiency
of Cummins and Daimler are based on representative real-world routes and include weight
reduction and increased payload
Other themes Pickups and Vans
Natural gas
21
22
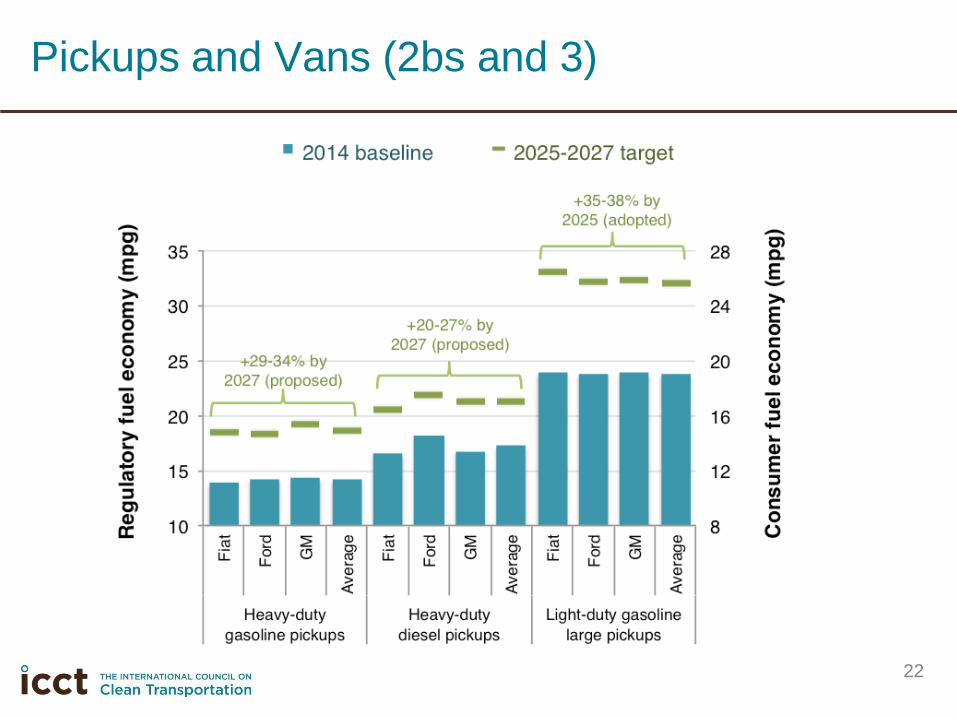
Pickups and Vans (2bs and 3)
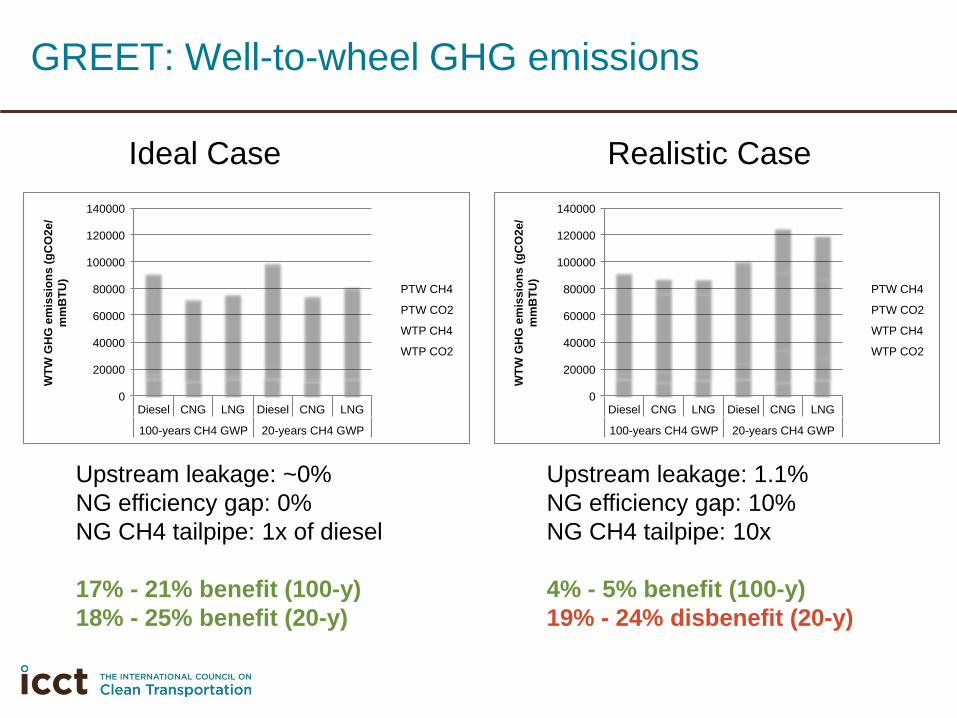
GREET: Well-to-wheel GHG emissions
0
20000
40000
60000
80000
100000
120000
140000
Diesel CNG LNG Diesel CNG LNG
100-years CH4 GWP 20-years CH4 GWP
WT
W G
HG
em
issio
ns (
gC
O2e
/
mm
BT
U)
PTW CH4
PTW CO2
WTP CH4
WTP CO2
0
20000
40000
60000
80000
100000
120000
140000
Diesel CNG LNG Diesel CNG LNG
100-years CH4 GWP 20-years CH4 GWP
WT
W G
HG
em
issio
ns (
gC
O2e
/
mm
BT
U)
PTW CH4
PTW CO2
WTP CH4
WTP CO2
Upstream leakage: 1.1%
NG efficiency gap: 10%
NG CH4 tailpipe: 10x
4% - 5% benefit (100-y)
19% - 24% disbenefit (20-y)
Upstream leakage: ~0%
NG efficiency gap: 0%
NG CH4 tailpipe: 1x of diesel
17% - 21% benefit (100-y)
18% - 25% benefit (20-y)
Ideal Case Realistic Case
Conclusions for
Mexico
24
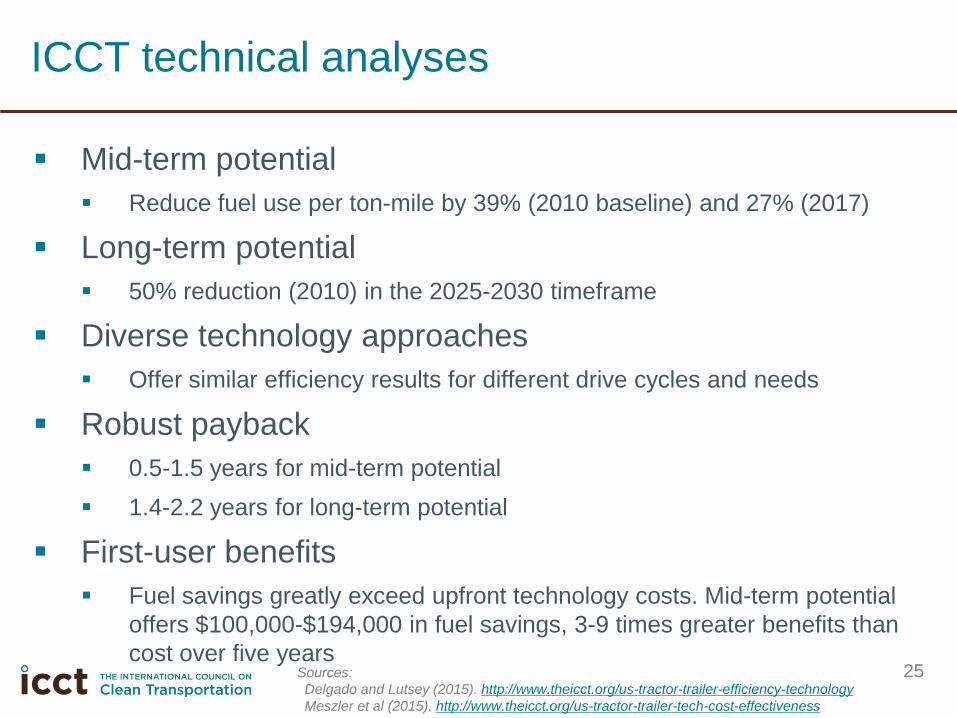
Mid-term potential
Reduce fuel use per ton-mile by 39% (2010 baseline) and 27% (2017)
Long-term potential
50% reduction (2010) in the 2025-2030 timeframe
Diverse technology approaches
Offer similar efficiency results for different drive cycles and needs
Robust payback
0.5-1.5 years for mid-term potential
1.4-2.2 years for long-term potential
First-user benefits
Fuel savings greatly exceed upfront technology costs. Mid-term potential
offers $100,000-$194,000 in fuel savings, 3-9 times greater benefits than
cost over five years
ICCT technical analyses
25 Sources:
Delgado and Lutsey (2015). http://www.theicct.org/us-tractor-trailer-efficiency-technology
Meszler et al (2015). http://www.theicct.org/us-tractor-trailer-tech-cost-effectiveness
26
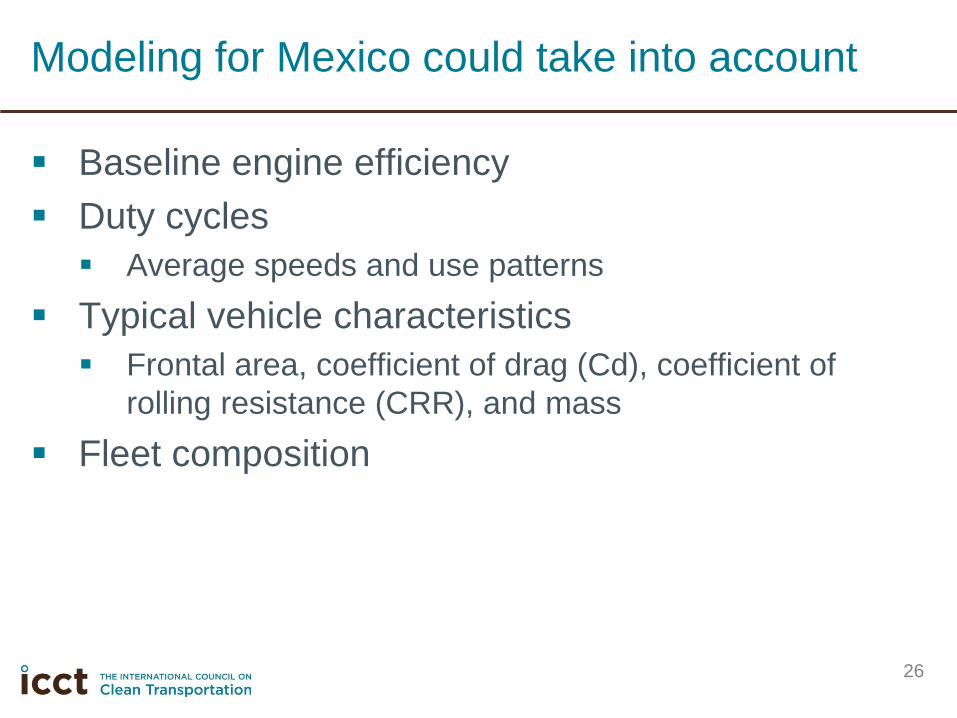
Baseline engine efficiency
Duty cycles
Average speeds and use patterns
Typical vehicle characteristics
Frontal area, coefficient of drag (Cd), coefficient of
rolling resistance (CRR), and mass
Fleet composition
Modeling for Mexico could take into account
27
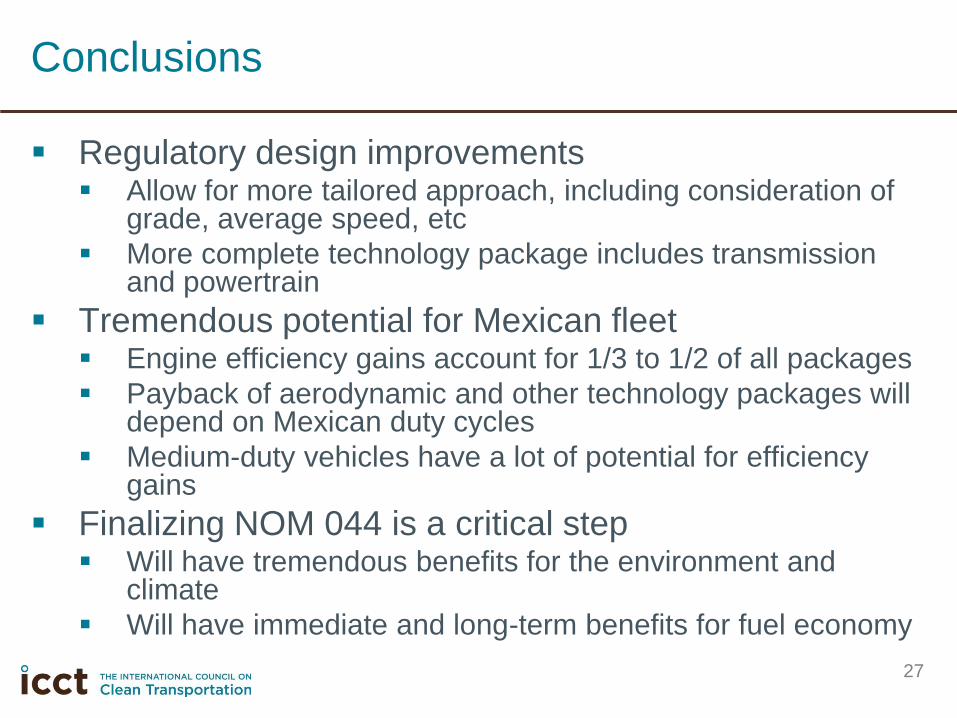
Regulatory design improvements Allow for more tailored approach, including consideration of
grade, average speed, etc
More complete technology package includes transmission and powertrain
Tremendous potential for Mexican fleet Engine efficiency gains account for 1/3 to 1/2 of all packages
Payback of aerodynamic and other technology packages will depend on Mexican duty cycles
Medium-duty vehicles have a lot of potential for efficiency gains
Finalizing NOM 044 is a critical step Will have tremendous benefits for the environment and
climate
Will have immediate and long-term benefits for fuel economy
Conclusions
¡Gracias!
Oscar Delgado [email protected]
Drew Kodjak [email protected]
Nic Lutsey [email protected]
Dan Meszler [email protected]
Rachel Muncrief [email protected]
Ben Sharpe [email protected]
and me:
Kate Blumberg [email protected]
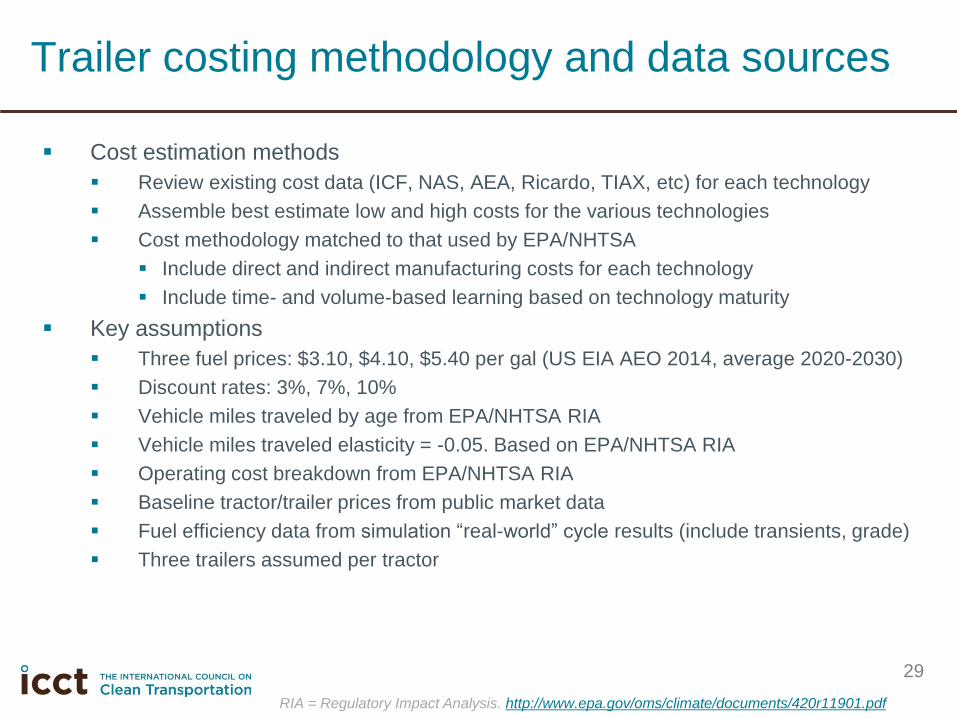
Cost estimation methods
Review existing cost data (ICF, NAS, AEA, Ricardo, TIAX, etc) for each technology
Assemble best estimate low and high costs for the various technologies
Cost methodology matched to that used by EPA/NHTSA
Include direct and indirect manufacturing costs for each technology
Include time- and volume-based learning based on technology maturity
Key assumptions
Three fuel prices: $3.10, $4.10, $5.40 per gal (US EIA AEO 2014, average 2020-2030)
Discount rates: 3%, 7%, 10%
Vehicle miles traveled by age from EPA/NHTSA RIA
Vehicle miles traveled elasticity = -0.05. Based on EPA/NHTSA RIA
Operating cost breakdown from EPA/NHTSA RIA
Baseline tractor/trailer prices from public market data
Fuel efficiency data from simulation “real-world” cycle results (include transients, grade)
Three trailers assumed per tractor
Trailer costing methodology and data sources
29
RIA = Regulatory Impact Analysis. http://www.epa.gov/oms/climate/documents/420r11901.pdf