Embed Size (px)
Citation preview

1
Dr. Konstantin Romanov
Head of Division
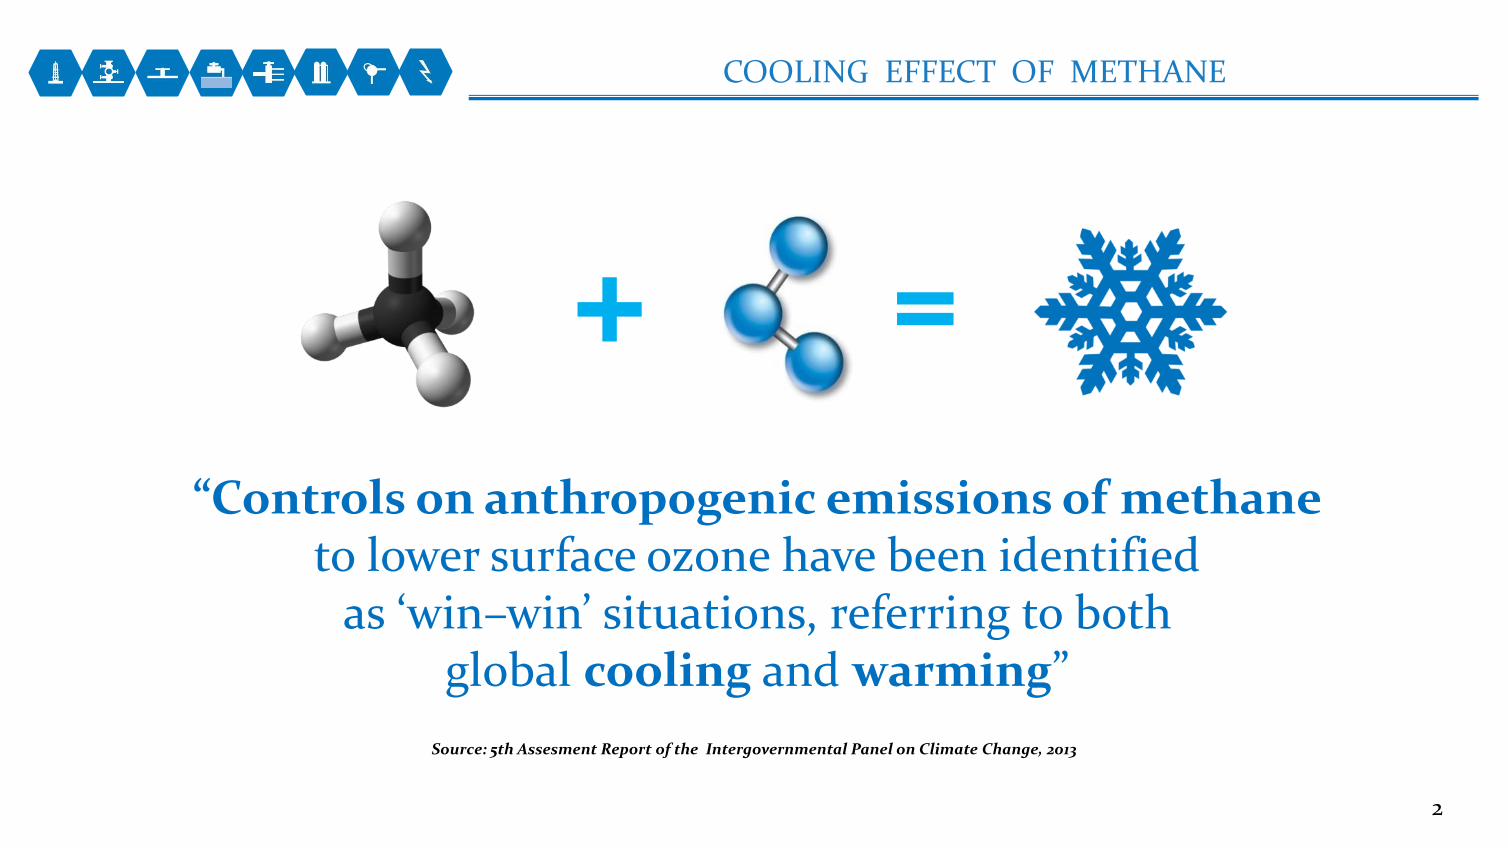
“Controls on anthropogenic emissions of methane to lower surface ozone have been identified
as ‘win–win’ situations, referring to both global cooling and warming”
COOLING EFFECT OF METHANE
Source: 5th Assesment Report of the Intergovernmental Panel on Climate Change, 2013
2

DIFFERENT EMISSIONS METRICS
3
on the cumulative radiative forcing over a particular time horizon
the change in global mean surface temperature at a chosen point in time
Various metrics can be used to compare the contributions to climate change of emissions of different substances. No single metric can accurately compare all consequences of different emissions, and all have limitations and uncertainties
“There is now increasing focus on the Global Temperature change Potential” “The GTP metric is better suited to target-based policies”
Up to 4th IPCC report , the most common metric has been the Global Warming Potential (GWP)
Source: 5th Assesment Report of the Intergovernmental Panel on Climate Change, 2013
“The uncertainty in the GWP increases with time horizon, and for the 100-year GWP of
well-mixed greenhouse gases the uncertainty can be as large as ±40%”
Global Warming Potential GWP
Global Temperature change Potential GTP
based on
IPCC‘s research on the global warming effect
“Several studies also point out that GWP is not well suited for policies with a
maximum temperature target” - like in Paris agreement
Sources: Fifth Assessment Report of the IPCC (2013)
25*
(28** or 34 with ccf ***)
6 (13 with with ccf ***)
* 4 Assessment IPCC Report (value implemented in Inventories) ** 5 Assessment IPCC Report *** carbon-climate feedback
values for fossil methane for 100 years

GLOBAL WARMING POTENTIAL VS GLOBAL TEMPERATURE CHANGE POTENTIAL
Assessment Reports of the Intergovernmental Panel on Climate Change
1990 1995 2001 2007 2013
500
100
6.5 7.0 7.6
21 23 28
20
56 62
72
86
1 2 3 4
84
67
GWP GTP
70
11 4*
Years
21 25
Implementation in National Inventories
* 6-13 for fossil methane
5
34
20
Years
100
GTP
GTP
GWP
GWP
GWP
4
Uncertainties in GTP arise from the same factors contributing to GWP uncertainties

GLOBAL ANNUAL NATURAL AND ANTHROPOGENIC METHANE EMISSIONS, Mt (2000-2009)
5
NATURAL METHANE EMISSIONS ANTHROPOGENIC METHANE EMISSIONS
Source: 4th and 5th Assesment Report s of the Intergovernmental Panel on Climate Change, 2007, 2013
* Range of estimations
217 (177-284)*
Swamps
54 (33-75)
Ocean
40(8-73)
Lakes and rivers
15 Wild animals
11 (2-22)
Termites
6 (2-9) Hydrates
3 (1-5) Fires 1 (0-1)
Permafrost
89 (87-94)
Ruminants
75 (67-90) Wastes
36 (33-40) Rice 35 (32-39)
Biomass combustion
50 (36-64) (biofuel included)
Oil and gas industry

DYNAMICS OF METHANE CONCENTRATION INCREASE/DECREASE IN THE ATMOSPHERE
6
Rates of methane
concentration changes in the
atmosphere
1985 1990 1995 2000 2005 2010 15
10
5
0
-5 pp
b/год
natural
~ 347 (238-484) Mt
~ 678 (542-852) Mt
total methane emissions into the atmosphere (average 2000-2009)
anthropogenic
~ 331 (304-368) Mt
Including:
~5,000 Mt
total methane in the Earth’s
atmosphere
~ 632 (592-785) Mt
methane removal from the atmosphere (average 2000-2009)
Removal mechanisms:
- ОН hydroxyl radical (tropospheric, stratospheric),
- tropospheric Cl,
- oxidation in soils.
Source: 5th Assesment Report of the Intergovernmental Panel on Climate Change, 2013
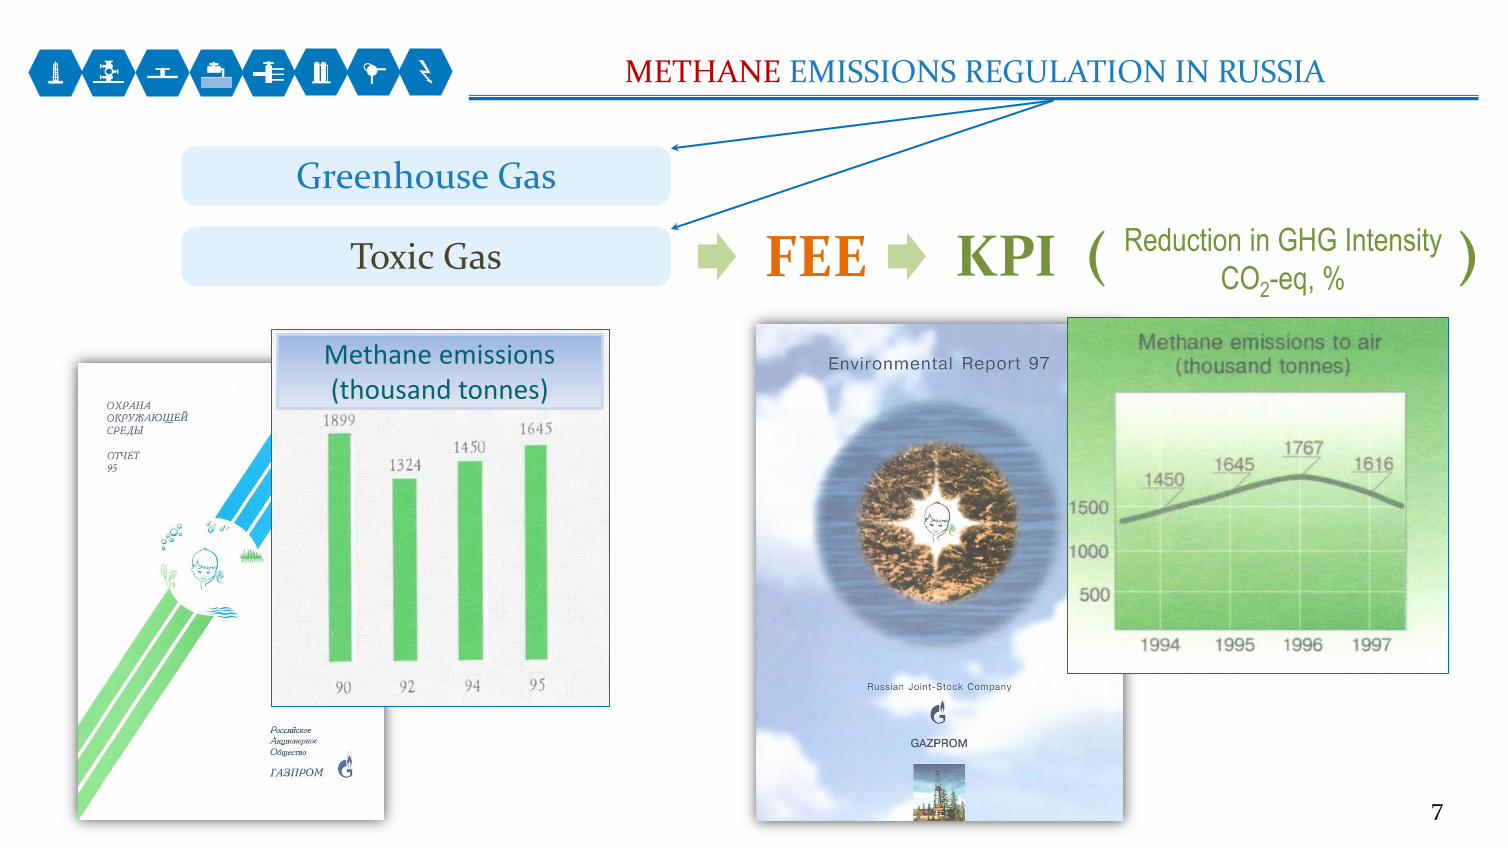
METHANE EMISSIONS REGULATION IN RUSSIA
Greenhouse Gas
KPI ( ) Toxic Gas FEE Reduction in GHG Intensity
CO2-eq, %
7
Methane emissions (thousand tonnes)

STATE SYSTEM
PERMITTING SUPERVISION FEE COLLECTION
LIMITATIONS OF EMISSIONS
FOR EVERY FACILITY
BY STATE BODIES
Official reporting
5 % FEDERAL BUDGET
40 % REGIONAL BUDGET
55 % MUNICIPAL BUDGET
ENVIRONMRNTAL AND TAX AUTHORITIES
(EMISSIONS MONITORING AND PAYMENT CONTROL)
2012 2013 2014 2015
3,241.3 3,382.3 3,221.8 3,302.0
All methane emissions in Russia, kt
Source: Rosstat, 2016
State Environmental bulletins http://www.gks.ru/wps/wcm/connect/rosstat_main/rosstat/ru/statistics/publications/catalog/5e901c0042cb5cc99b49bf307f2fa3f8
8

METHANE EMISSIONS DETECTION, MEASUREMENT AND ELIMINATION
CONTINUOUS MONITORING OF NATURAL GAS CONСENTRATION ON COMPRESSOR STATIONS BY LASER TECHNOLOGIES
CH4
DISTANT PERIODIC MONITORING OF METHANE EMISSIONS WITH TOTAL
QUANTITATIVE ASSESSMENT
LOCALIZATION OF LEAKAGES BY
PORTABLE INSTRUMENTS
PERIODIC MONITORING OF
NATURAL GAS EMISSIONS
ON COMPRESSOR
STATIONS BY
HAND-HELD
CONTROL DEVICES
INSPECTION
Replacement of leaky facilities
Bandaging
Sealing of shut-off valves
DISCOVERED LEAKAGE ELIMINATION
9

EVALUATING METHANE EMISSIONS AT GAZPROM FACILITIES WITH FOREIGN PARTNERS
YEAR PARTNERS SUBJECT OF INVESTIGATIONS
1995 US EPA 1 compressor station; 1 compressor shop
1996-1997 Ruhrgas (Open Grid Europe) 3 complex gas treatment plants; 2 well clusters; 3 compressor stations; 6 compressor shops; 5,000 km of linear routes of mains
2002-2003 Ruhrgas (Open Grid Europe), Wuppertal Institute for Climate, Environment and Energy, Max Planck Institute for Chemistry
5 compressor stations; 10 compressor shops; 4,000 km of linear routes of mains
2004-2005 Sumitomo Corporation, Agra 1 compressor station; 3 compressor shops; 750 km of linear routes of mains; 5 pipeline branches; 5 gas distribution stations
2006, 2008 Sojitz Corporation 2 compressor stations; 4 compressor shops; 600 km of linear routes of mains; 100 valve nodes; 80 valve nodes of pipeline branches; 32 gas distribution stations, 4 gas measuring stations
2010 Global methane initiative, US EPA 162 km of gas main pipeline; 2 compressor shops; 41 valve nodes
2011 GDF-SUEZ (ENGIE) 1 compressor shop; 2 junction points
2013 Gasunie 1 shop; 10 valve nodes
10

2 STATE INVENTORY SYSTEMS
activity type * IPCC coefficients
National Inventory Report (Federal Service for Hydrometeorology
and Environmental Monitoring)
Basis for accusing Russian gas industry of major leaks
Corporate Report
emission fees, CDP, scientific papers
3.4 Mt
Stationary sources of all industries (Federal State Statistic
Service, 2013)
measurements + fuel and energy balance
ACTUAL VALUES CALCULATED VALUES
12.7 Mt
Energy industry of Russia: gas sector (2013) Gazprom (2013)
1.5 Mt
41.8 Mt
All national emissions (National Inventory Report, 2013)
(for developing countries and countries in transition)
State Report
11

METHANE EMISSIONS E
mis
sio
ns,
Mt
2
4
6
8
10
12
14
0
199
0
199
1 19
92
199
3 19
94
19
95
199
6
199
7 19
98
19
99
20
00
20
01
200
2 20
03
200
4
200
5 20
06
20
07
200
8
200
9
2010
20
11
2012
20
13
Russian GHG Inventory Submissions 2015 2016
199
0
199
1 19
92
199
3 19
94
19
95
199
6
199
7 19
98
19
99
20
00
20
01
200
2 20
03
200
4
200
5 20
06
20
07
200
8
200
9
2010
20
11
2012
20
13
2014
12.6
5.8
- 53.7 % Production
Transportation, storage
Distribution
Processing Mt
Mt
2
4
6
8
10
12
14
0
Em
issi
on
s, M
t
12
13
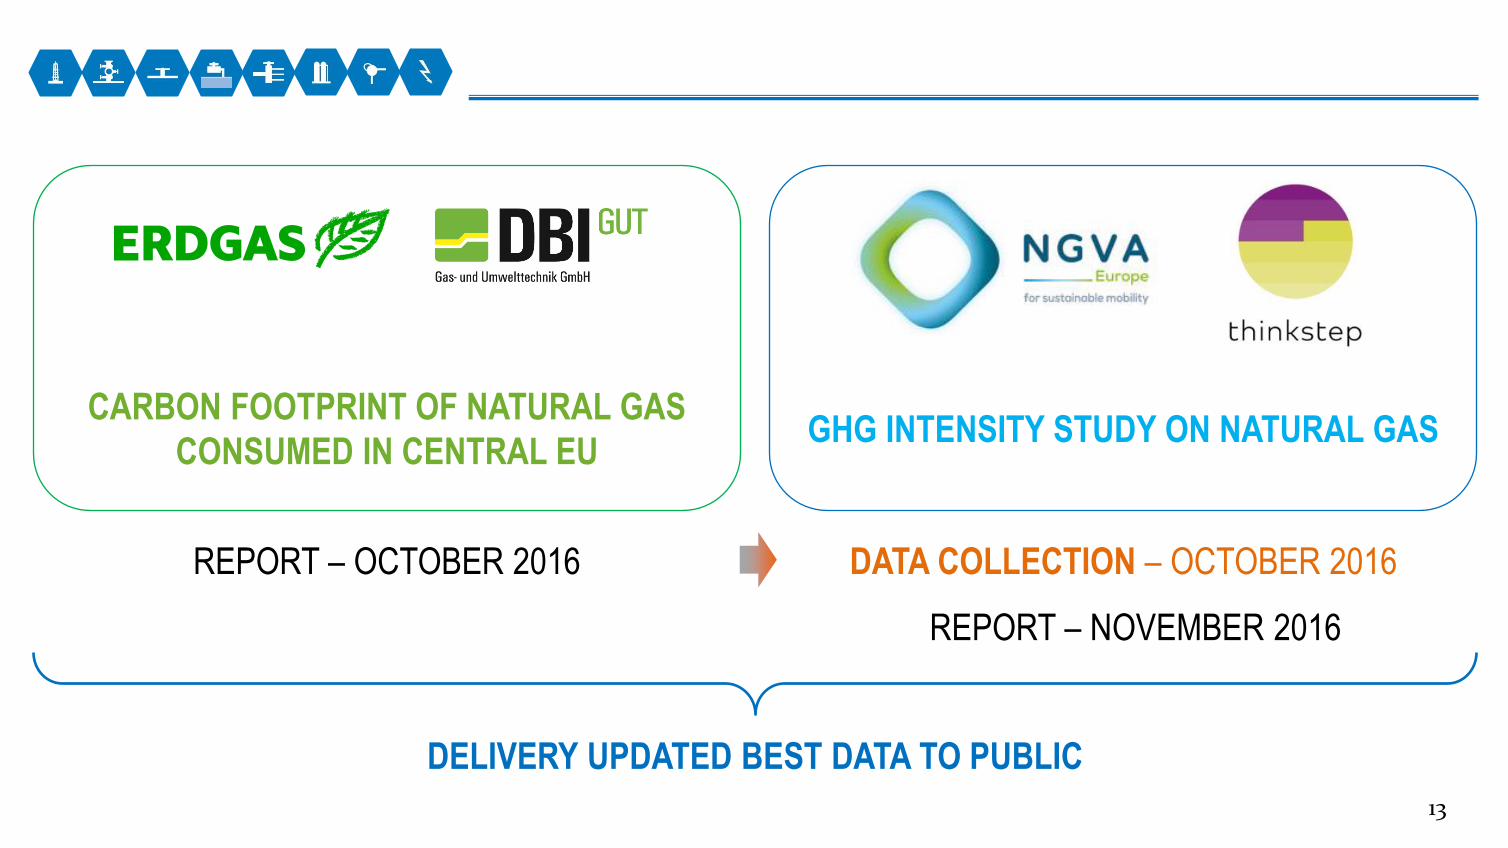
CARBON FOOTPRINT OF NATURAL GAS
CONSUMED IN CENTRAL EU GHG INTENSITY STUDY ON NATURAL GAS
DATA COLLECTION – OCTOBER 2016 REPORT – OCTOBER 2016
REPORT – NOVEMBER 2016
DELIVERY UPDATED BEST DATA TO PUBLIC

14
THANK YOU FOR YOUR ATTENTION!

GAZPROM KEY PERFORMANCE INDICATORS
15
133.4 123.8 122.2 110.7 102.6
2011 2012 2013 2014 2015
Greenhouse gas emissions CO2-eq., mln ton
REDUCTION OF SPECIFIC FUEL CONSUMPTION FOR TECHNOLOGICAL NEEDS (RELATIVE TO 2010), %
%
8.3 12.0
15.8 17.8
ACTUAL
REDUCTION OF SPECIFIC EMISSIONS OF GREENHOUSE GASES (CO2-EQ.) (RELATIVE TO 2010), %
2011 2012 2013 2014
%
2.0 6.7
9.1
19.7
ACTUAL
2011 2012 2013 2014 2015 2015
31.4
25.6
0
10
20
30
0
10
20
30
KPI 3 KPI 4
2.8
5.0 7.3
9.8
12.6
2011 2012 2013 2014 2015
Energy-saving (cumulative), mln tce