Embed Size (px)
Citation preview
0
Dr. Bobby E. Brown, Executive Director
Head Start Parent Survey Results
2010 – 2011 School Year
1
2010 – 2011 Annual Parent Survey
Conducted and Prepared by the Office of Research and Development
Dr. Peggy S. Johnson Director of Research and Development
Mrs. Demetra Mallett-Lewis Senior Research Coordinator
Mrs. Keri Ellis
Research Support Specialist
Ms. Malika Griffin Enrollment Coordinator
Ms. Claudia Johnson
Administrative Assistant
Ms. Jade E. Adams Summer Intern Worker
Ms. Blanche J. Young
Summer Intern Worker
2
Mississippi Action for Progress, Inc.
Head Start Parent Satisfaction Survey
2010-2011 School Year
Mississippi Action for Progress (MAP), INC Head Start is a multi-purpose,
comprehensive, community-based child development and family services
program. MAP is committed to providing high quality services to
disadvantaged children and communities. MAP provides Head Start and Early
Head Start services. MAP also partnership and collaborate with institutions of
higher learning, local community colleges, State Agencies and local agencies to
enhance and provide additional services to meet the needs of children and
families.
Active participation and decision-making opportunities by the parent as well as
community persons are major thrusts of MAP. Parent involvement has been a
major facet in MAP’s success in providing quality comprehensive services to
children and families since the program’s inception 45 years ago. The Agency
continues to seek diverse and innovative strategies to meet the needs of
enrolled children and families. MAP’s principle belief that parents are the
primary educators of their children dictates that parents have an opportunity
to provide feedback and assessment of services offered to their families.
Parents and program staff collaborate in various efforts to ensure positive
outcomes for children. Research has shown a significant correlation between
parent involvement and positive outcomes in children’s cognitive, social,
emotional and physical development. This survey examines enrolled children’s
parents opinions of services provided to their families during the 2010-2011
school year.
Guided by its philosophy and mission, MAP, Inc. has become a stellar
organization providing a wide and diverse range of programs and Head Start
services to more than six thousand (6000) children in twenty-five (25) counties
3
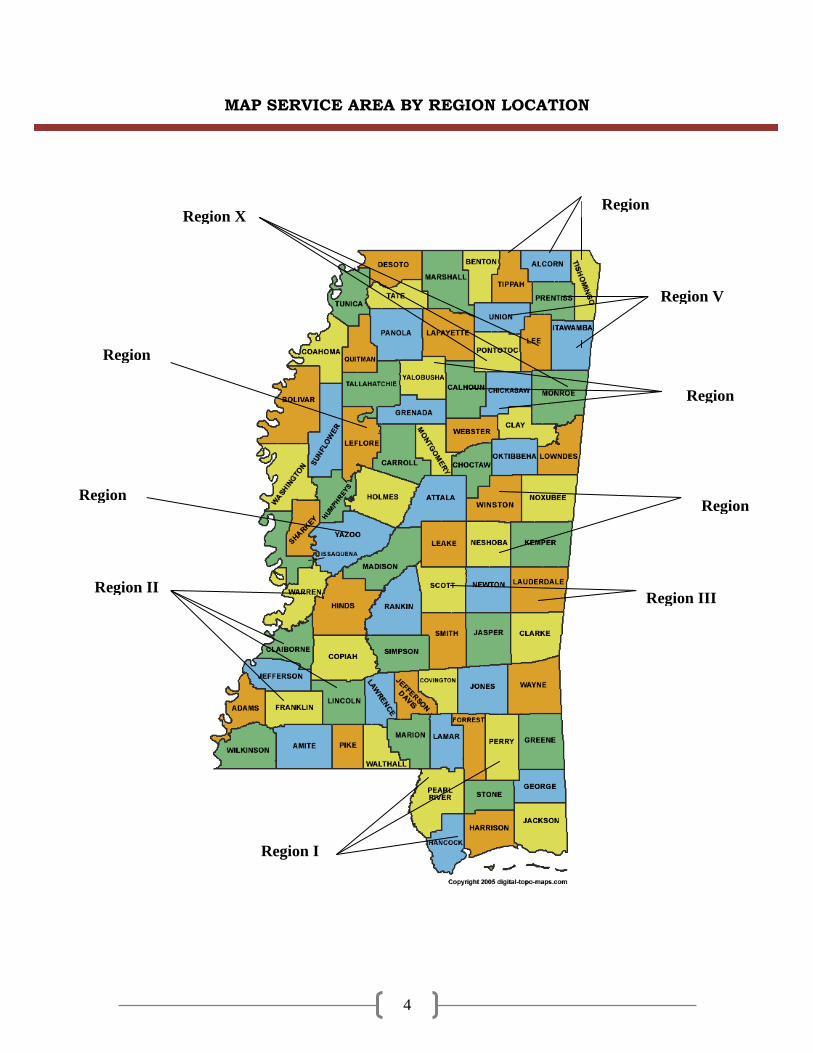
in the State of Mississippi. MAP’s service area extends north to the Tennessee
State line, south and west to the Louisiana State line, and east to the Alabama
State line. MAP service area is divided into ten (10) regions across the State.
Participating counties in the extreme northeast corner of the State include:
Alcorn, Itawamba, Lee, Monroe, Pontotoc, Prentiss, Tippah, Tishomingo and
Union. In the southern portion of the State, Pearl River and Hancock counties
border the Louisiana State line, as well as Franklin, Lincoln, and Claiborne
counties in the southwest and Perry County east to the Alabama State line.
Leflore and Yazoo Counties lies to the northwest in the Delta region and
Warren County along the Mississippi River, which is also west. To the eastern
section of the state line lies Lauderdale, Neshoba, Scott and Winston Counties,
which are bordered by the Alabama State line. MAP also serves, Calhoun,
Chickasaw, and Yalobusha Counties in the Central part of the State.
4
MAP SERVICE AREA BY REGION LOCATION
Region II
Region I
Region III
Region
IV
Region V
Region
VI
Region
VII
Region
VIII
Region
IX Region X
5
METHODOLOGY
In this research study, a twenty-one (21) item Likert-Scale survey instrument
was developed to examine parents of enrolled children opinions of services
provided by MAP Head Start Program. A total of nineteen (19) questions were
asked where the responses were based on a yes response “YES, I AGREE” and
no response “NO, I DISAGREE”. Some parents did not respond to certain
questions, which is illustrated in the “NO RESPONSE” category. The study
also asked the parent to describe how they feel parental involvement affects
their child’s education (question #20) and if needed, what changes would they
like to see implemented within the MAP’s Head Start program (question #21).
Parent’s verbatim responses from questions #20 and #21 can be found in the
APPENDIX section of this document.
Parents of children enrolled during the 2010-2011 school year participated in
this research project. MAP’s actual number of children served at the time
(April 2011) of the survey was 6,002 children. Two-thousand nine hundred and
two (2,902) parents completed and returned surveys which represent a return
rate of 48.3%. According to Gay, L. R., & Airasian, P. (2000), in descriptive
research, it is common to sample ten to twenty percent of the total population.
Therefore, the response rate documented in this study exceeded the accepted
response rates used in implementing descriptive research designs.
A letter of the survey purpose and survey were distributed to all parents of
currently enrolled children. Parents were instructed to call the centers if they
had any questions. The survey was strictly voluntary and confidential. They
were asked to complete and return the surveys to the Center. The Center
Administrator or designee forwarded the surveys to the Office of Research and
Development in a self addressed envelope identifying the Center’s name. Once
the surveys were received in the Office of Research and Development, staff
coded each survey, entered the date received in this office, date entered into the
system and listed the name of the data entry person.
DEMOGRAPHICS
6
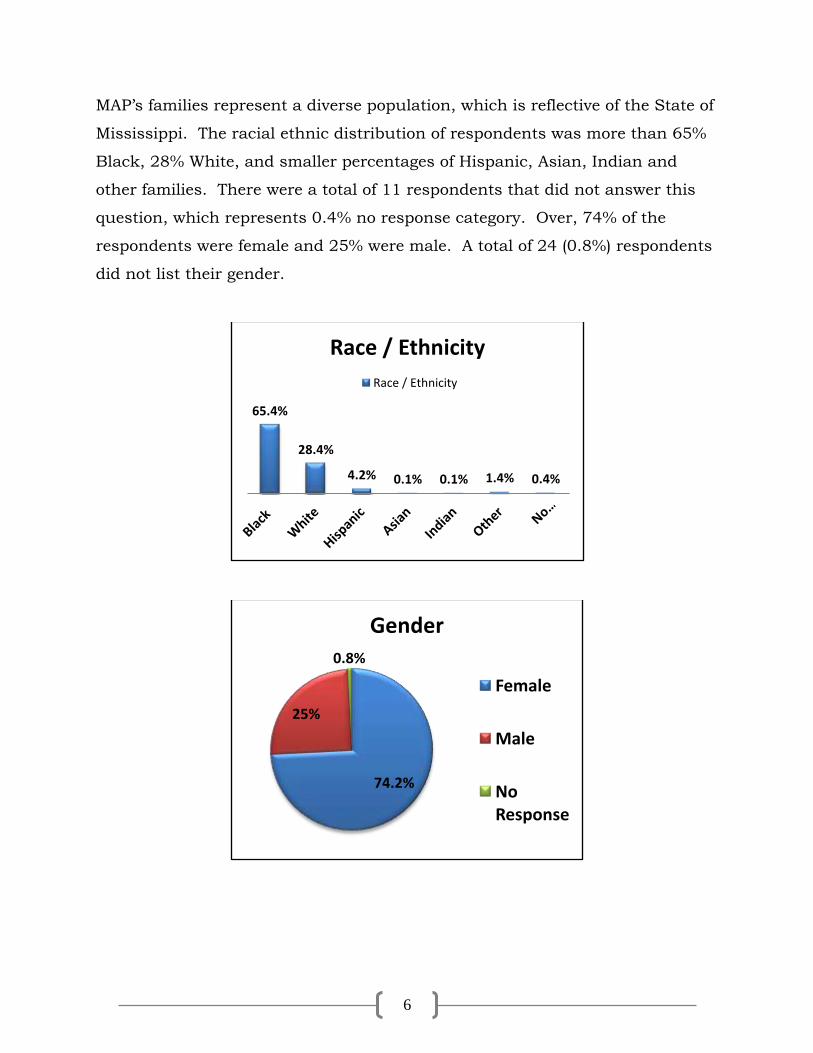
MAP’s families represent a diverse population, which is reflective of the State of
Mississippi. The racial ethnic distribution of respondents was more than 65%
Black, 28% White, and smaller percentages of Hispanic, Asian, Indian and
other families. There were a total of 11 respondents that did not answer this
question, which represents 0.4% no response category. Over, 74% of the
respondents were female and 25% were male. A total of 24 (0.8%) respondents
did not list their gender.
65.4%
28.4%
4.2% 0.1% 0.1% 1.4% 0.4%
Race / Ethnicity
Race / Ethnicity
74.2%
25%
0.8%
Gender
Female
Male
No Response
7
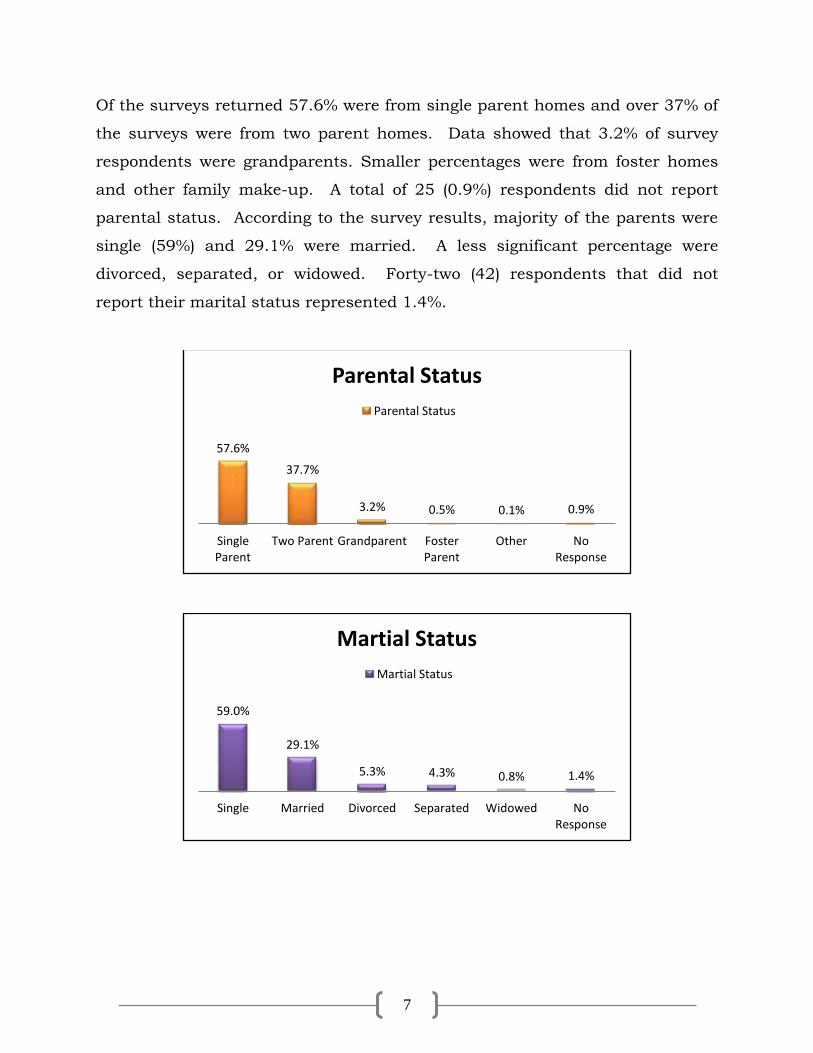
Of the surveys returned 57.6% were from single parent homes and over 37% of
the surveys were from two parent homes. Data showed that 3.2% of survey
respondents were grandparents. Smaller percentages were from foster homes
and other family make-up. A total of 25 (0.9%) respondents did not report
parental status. According to the survey results, majority of the parents were
single (59%) and 29.1% were married. A less significant percentage were
divorced, separated, or widowed. Forty-two (42) respondents that did not
report their marital status represented 1.4%.
57.6%
37.7%
3.2% 0.5% 0.1% 0.9%
Single Parent
Two Parent Grandparent Foster Parent
Other No Response
Parental Status
Parental Status
59.0%
29.1%
5.3% 4.3% 0.8% 1.4%
Single Married Divorced Separated Widowed No Response
Martial Status
Martial Status
8
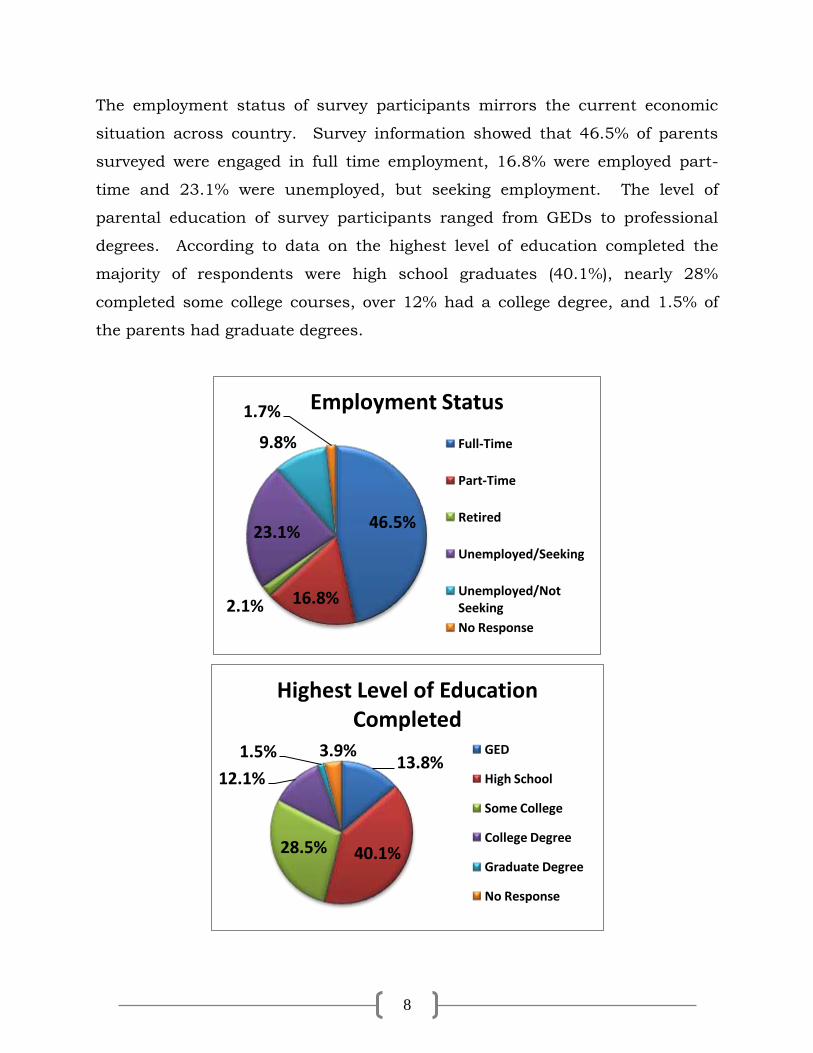
The employment status of survey participants mirrors the current economic
situation across country. Survey information showed that 46.5% of parents
surveyed were engaged in full time employment, 16.8% were employed part-
time and 23.1% were unemployed, but seeking employment. The level of
parental education of survey participants ranged from GEDs to professional
degrees. According to data on the highest level of education completed the
majority of respondents were high school graduates (40.1%), nearly 28%
completed some college courses, over 12% had a college degree, and 1.5% of
the parents had graduate degrees.
46.5%
16.8% 2.1%
23.1%
9.8%
1.7% Employment Status
Full-Time
Part-Time
Retired
Unemployed/Seeking
Unemployed/Not Seeking
No Response
13.8%
40.1% 28.5%
12.1%
1.5% 3.9%
Highest Level of Education Completed
GED
High School
Some College
College Degree
Graduate Degree
No Response
9
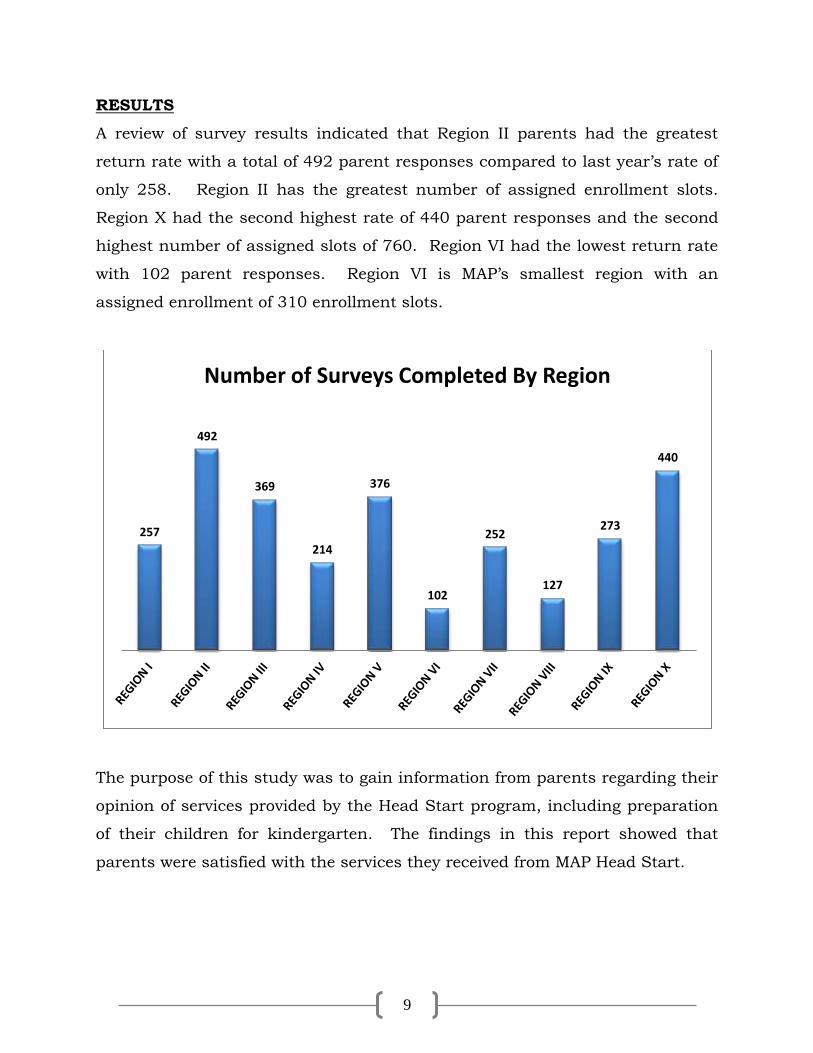
RESULTS
A review of survey results indicated that Region II parents had the greatest
return rate with a total of 492 parent responses compared to last year’s rate of
only 258. Region II has the greatest number of assigned enrollment slots.
Region X had the second highest rate of 440 parent responses and the second
highest number of assigned slots of 760. Region VI had the lowest return rate
with 102 parent responses. Region VI is MAP’s smallest region with an
assigned enrollment of 310 enrollment slots.
The purpose of this study was to gain information from parents regarding their
opinion of services provided by the Head Start program, including preparation
of their children for kindergarten. The findings in this report showed that
parents were satisfied with the services they received from MAP Head Start.
257
492
369
214
376
102
252
127
273
440
Number of Surveys Completed By Region
10
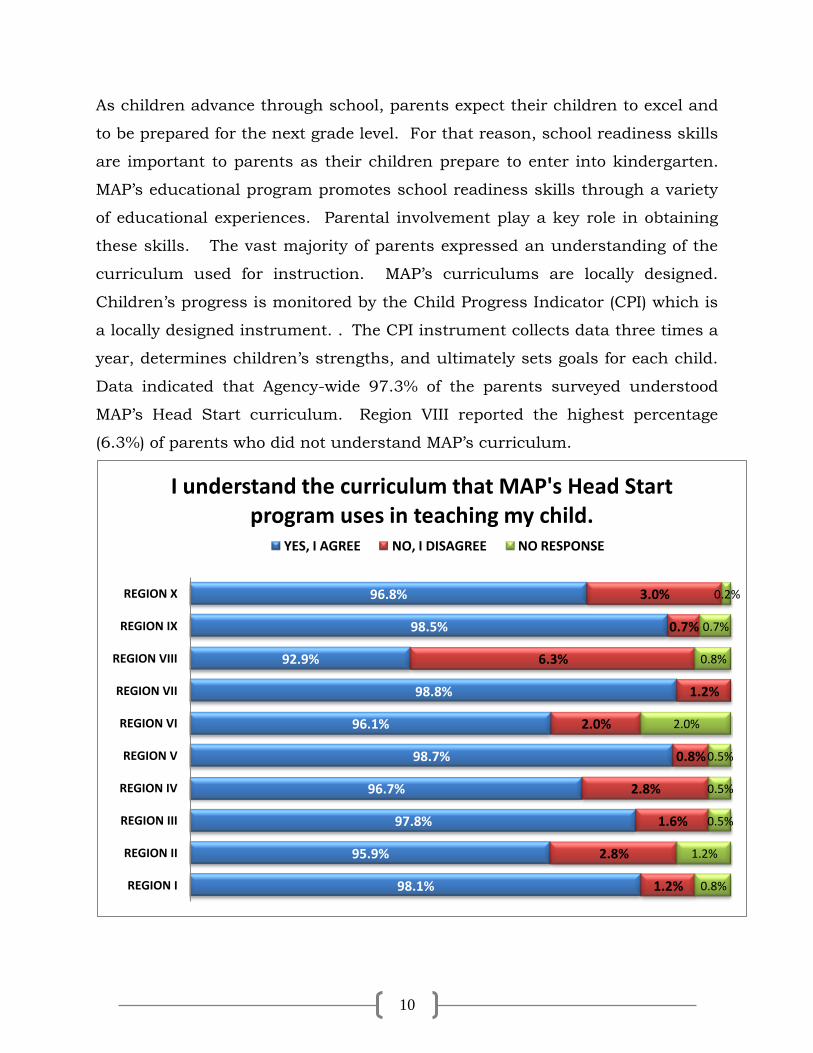
As children advance through school, parents expect their children to excel and
to be prepared for the next grade level. For that reason, school readiness skills
are important to parents as their children prepare to enter into kindergarten.
MAP’s educational program promotes school readiness skills through a variety
of educational experiences. Parental involvement play a key role in obtaining
these skills. The vast majority of parents expressed an understanding of the
curriculum used for instruction. MAP’s curriculums are locally designed.
Children’s progress is monitored by the Child Progress Indicator (CPI) which is
a locally designed instrument. . The CPI instrument collects data three times a
year, determines children’s strengths, and ultimately sets goals for each child.
Data indicated that Agency-wide 97.3% of the parents surveyed understood
MAP’s Head Start curriculum. Region VIII reported the highest percentage
(6.3%) of parents who did not understand MAP’s curriculum.
98.1%
95.9%
97.8%
96.7%
98.7%
96.1%
98.8%
92.9%
98.5%
96.8%
1.2%
2.8%
1.6%
2.8%
0.8%
2.0%
1.2%
6.3%
0.7%
3.0%
0.8%
1.2%
0.5%
0.5%
0.5%
2.0%
0.8%
0.7%
0.2%
REGION I
REGION II
REGION III
REGION IV
REGION V
REGION VI
REGION VII
REGION VIII
REGION IX
REGION X
I understand the curriculum that MAP's Head Start program uses in teaching my child.
YES, I AGREE NO, I DISAGREE NO RESPONSE
11
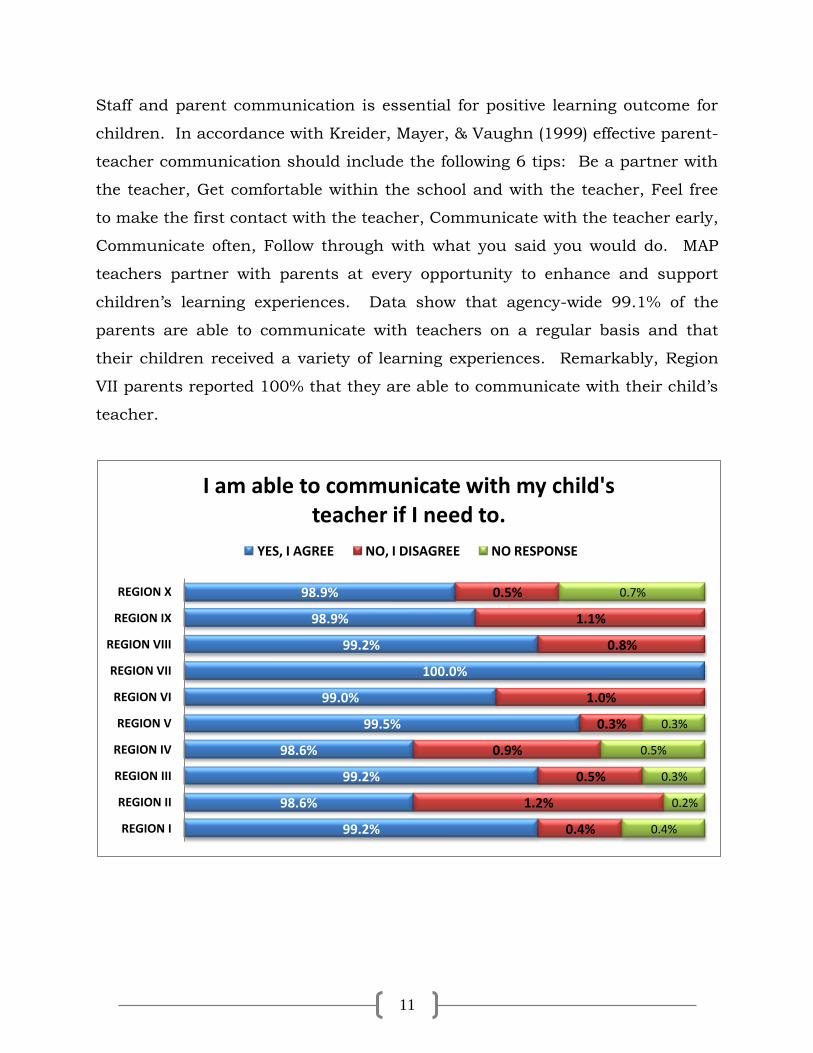
Staff and parent communication is essential for positive learning outcome for
children. In accordance with Kreider, Mayer, & Vaughn (1999) effective parent-
teacher communication should include the following 6 tips: Be a partner with
the teacher, Get comfortable within the school and with the teacher, Feel free
to make the first contact with the teacher, Communicate with the teacher early,
Communicate often, Follow through with what you said you would do. MAP
teachers partner with parents at every opportunity to enhance and support
children’s learning experiences. Data show that agency-wide 99.1% of the
parents are able to communicate with teachers on a regular basis and that
their children received a variety of learning experiences. Remarkably, Region
VII parents reported 100% that they are able to communicate with their child’s
teacher.
99.2%
98.6%
99.2%
98.6%
99.5%
99.0%
100.0%
99.2%
98.9%
98.9%
0.4%
1.2%
0.5%
0.9%
0.3%
1.0%
0.8%
1.1%
0.5%
0.4%
0.2%
0.3%
0.5%
0.3%
0.7%
REGION I
REGION II
REGION III
REGION IV
REGION V
REGION VI
REGION VII
REGION VIII
REGION IX
REGION X
I am able to communicate with my child's teacher if I need to.
YES, I AGREE NO, I DISAGREE NO RESPONSE
12
School readiness skills have been the main focus for early childhood education
since its existence. According to the National Head Start Association (NHSA),
The Head Start Act of 2007 requires Head Start programs to establish ongoing
communication between the Head Start agency and LEAs to develop
“continuity of developmentally appropriate curricular objectives for enhancing
school readiness of children.” Recently, the National Association for the
Accreditation of Youth Children (NAEYC) and the National Heat Start
Association have developed a day-long session to examine a resource that
aligns the Head Start Framework with the Common Core State Standards
(CCSS) for Kindergarten. This session, called “Connections for Success:
Ready, Set, Go”, looks at the importance, challenges, and benefits of aligning
early education with the continuum of Common Core State Standards.
Participants work in small groups give viewpoints and expertise to ensure the
resource illustrates a continuity of learning outcomes. Head Start program will
be able to “use this resource as a foundation to communicate a cohesive
system of curricular objectives, school readiness goals, and appropriate K-12
expectations.” The Common Core State Standards for K-12 education, adopted
by Mississippi on June 28, 2010, provide a platform for “high quality and
consistent” education regardless of “school or state” which the student lives.
(Taken from www.costandards.com/frequentlyaskedquestions)
MAP uses the Child Progress Indicator (CPI) as a program assessment tool for
its Head Start program to evaluate the Head Start Framework and school
readiness skills. CPI is used to measure the children’s progress and level of
school readiness skills. The Head Start Framework is organized into 11
domains. The Literacy Knowledge & Skills domain examines the book
appreciation, phonological awareness, alphabet knowledge, print concepts and
early writing elements. As reported in MAP 2010-2011 Community Assessment
report, children score lower in the Literacy domain when compared to the other
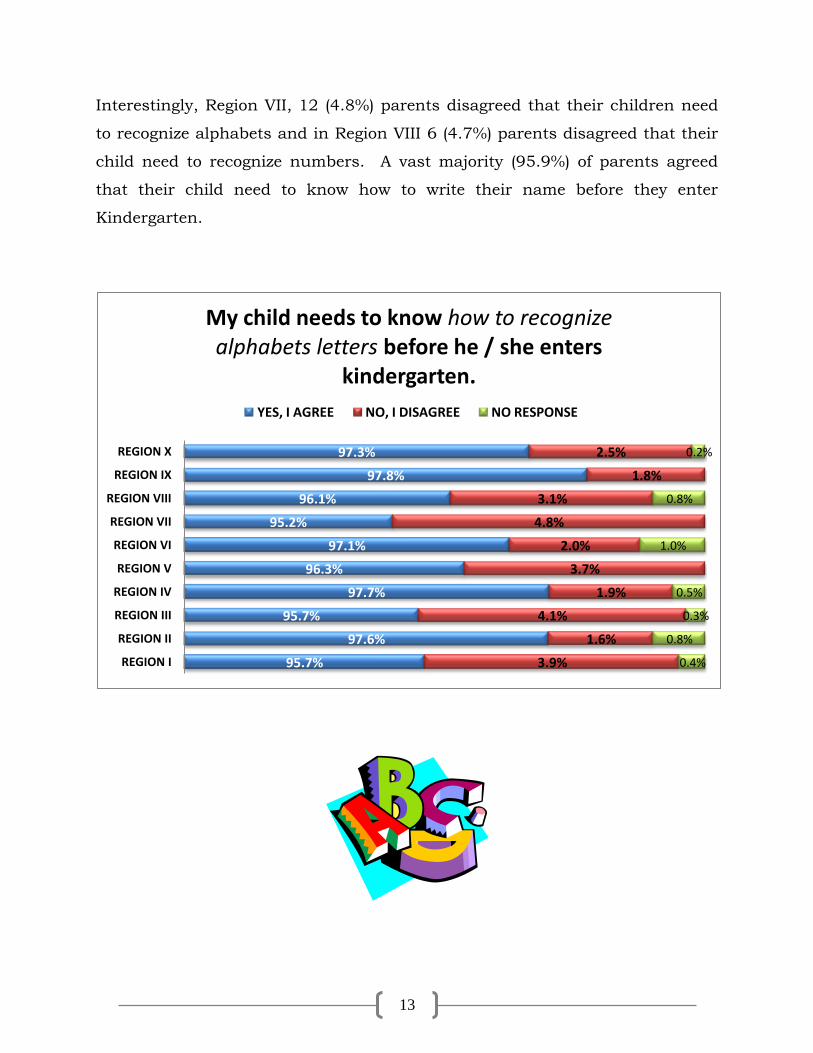
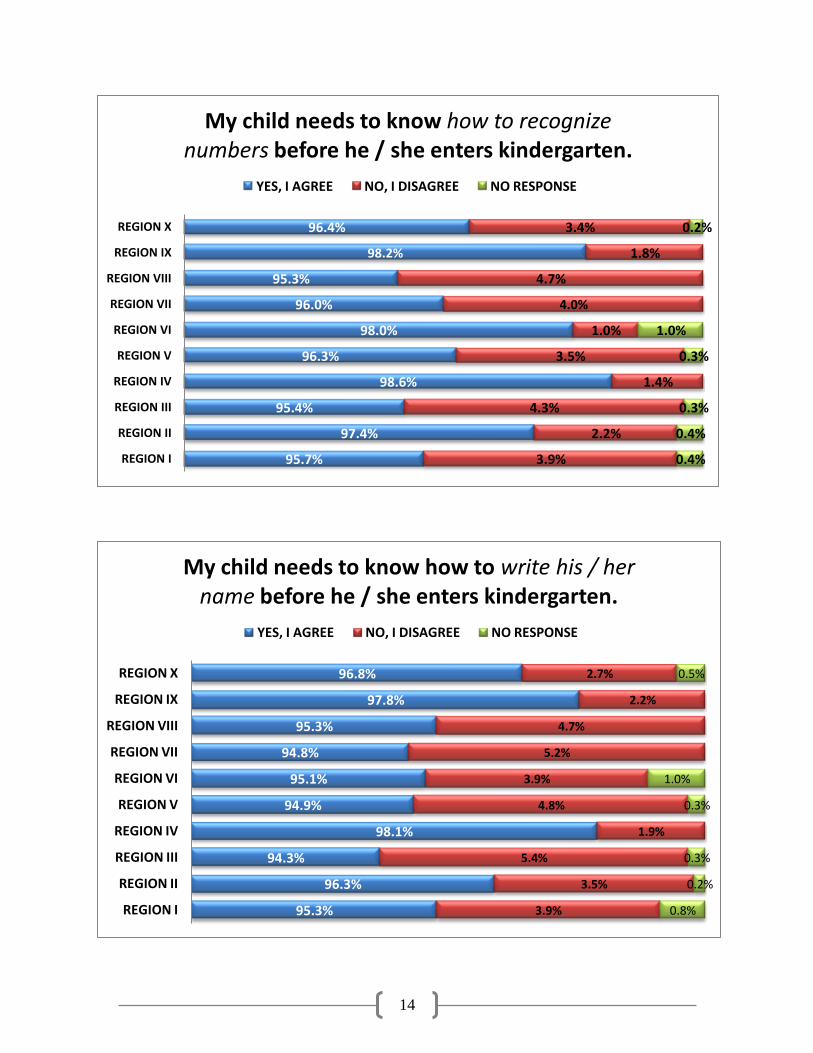
10 domains. Agency-wide 96.7% parents agree that their child need to know
how to recognize alphabets and numbers before the child enters kindergarten.
13
Interestingly, Region VII, 12 (4.8%) parents disagreed that their children need
to recognize alphabets and in Region VIII 6 (4.7%) parents disagreed that their
child need to recognize numbers. A vast majority (95.9%) of parents agreed
that their child need to know how to write their name before they enter
Kindergarten.
95.7%
97.6%
95.7%
97.7%
96.3%
97.1%
95.2%
96.1%
97.8%
97.3%
3.9%
1.6%
4.1%
1.9%
3.7%
2.0%
4.8%
3.1%
1.8%
2.5%
0.4%
0.8%
0.3%
0.5%
1.0%
0.8%
0.2%
REGION I
REGION II
REGION III
REGION IV
REGION V
REGION VI
REGION VII
REGION VIII
REGION IX
REGION X
My child needs to know how to recognize alphabets letters before he / she enters
kindergarten.
YES, I AGREE NO, I DISAGREE NO RESPONSE
14
95.3%
96.3%
94.3%
98.1%
94.9%
95.1%
94.8%
95.3%
97.8%
96.8%
3.9%
3.5%
5.4%
1.9%
4.8%
3.9%
5.2%
4.7%
2.2%
2.7%
0.8%
0.2%
0.3%
0.3%
1.0%
0.5%
REGION I
REGION II
REGION III
REGION IV
REGION V
REGION VI
REGION VII
REGION VIII
REGION IX
REGION X
My child needs to know how to write his / her name before he / she enters kindergarten.
YES, I AGREE NO, I DISAGREE NO RESPONSE
95.7%
97.4%
95.4%
98.6%
96.3%
98.0%
96.0%
95.3%
98.2%
96.4%
3.9%
2.2%
4.3%
1.4%
3.5%
1.0%
4.0%
4.7%
1.8%
3.4%
0.4%
0.4%
0.3%
0.3%
1.0%
0.2%
REGION I
REGION II
REGION III
REGION IV
REGION V
REGION VI
REGION VII
REGION VIII
REGION IX
REGION X
My child needs to know how to recognize numbers before he / she enters kindergarten.
YES, I AGREE NO, I DISAGREE NO RESPONSE
15
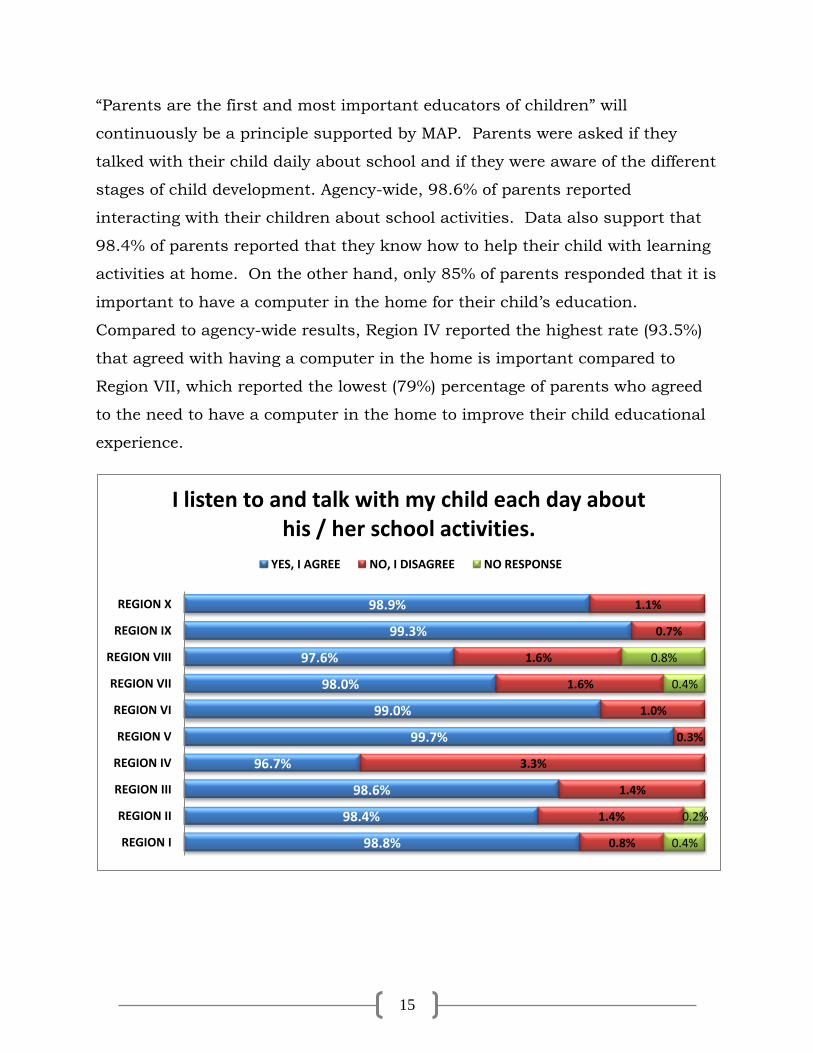
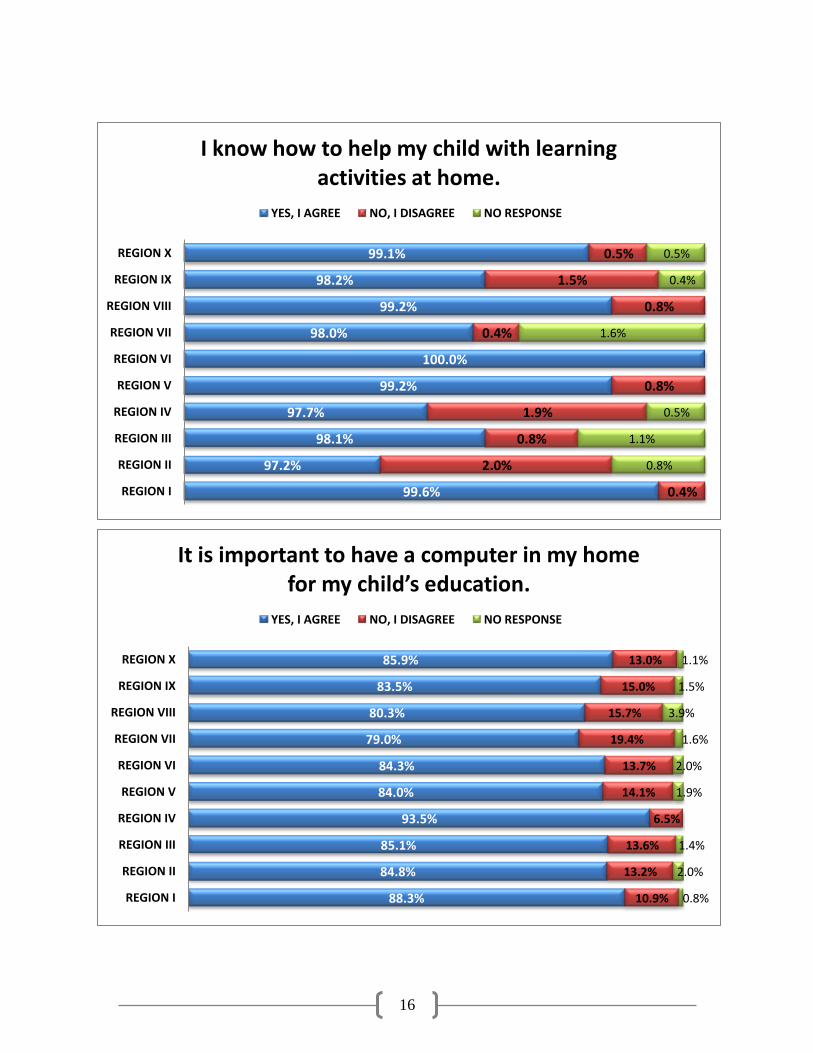
“Parents are the first and most important educators of children” will
continuously be a principle supported by MAP. Parents were asked if they
talked with their child daily about school and if they were aware of the different
stages of child development. Agency-wide, 98.6% of parents reported
interacting with their children about school activities. Data also support that
98.4% of parents reported that they know how to help their child with learning
activities at home. On the other hand, only 85% of parents responded that it is
important to have a computer in the home for their child’s education.
Compared to agency-wide results, Region IV reported the highest rate (93.5%)
that agreed with having a computer in the home is important compared to
Region VII, which reported the lowest (79%) percentage of parents who agreed
to the need to have a computer in the home to improve their child educational
experience.
98.8%
98.4%
98.6%
96.7%
99.7%
99.0%
98.0%
97.6%
99.3%
98.9%
0.8%
1.4%
1.4%
3.3%
0.3%
1.0%
1.6%
1.6%
0.7%
1.1%
0.4%
0.2%
0.4%
0.8%
REGION I
REGION II
REGION III
REGION IV
REGION V
REGION VI
REGION VII
REGION VIII
REGION IX
REGION X
I listen to and talk with my child each day about his / her school activities.
YES, I AGREE NO, I DISAGREE NO RESPONSE
16
99.6%
97.2%
98.1%
97.7%
99.2%
100.0%
98.0%
99.2%
98.2%
99.1%
0.4%
2.0%
0.8%
1.9%
0.8%
0.4%
0.8%
1.5%
0.5%
0.8%
1.1%
0.5%
1.6%
0.4%
0.5%
REGION I
REGION II
REGION III
REGION IV
REGION V
REGION VI
REGION VII
REGION VIII
REGION IX
REGION X
I know how to help my child with learning activities at home.
YES, I AGREE NO, I DISAGREE NO RESPONSE
88.3%
84.8%
85.1%
93.5%
84.0%
84.3%
79.0%
80.3%
83.5%
85.9%
10.9%
13.2%
13.6%
6.5%
14.1%
13.7%
19.4%
15.7%
15.0%
13.0%
0.8%
2.0%
1.4%
1.9%
2.0%
1.6%
3.9%
1.5%
1.1%
REGION I
REGION II
REGION III
REGION IV
REGION V
REGION VI
REGION VII
REGION VIII
REGION IX
REGION X
It is important to have a computer in my home for my child’s education.
YES, I AGREE NO, I DISAGREE NO RESPONSE
17
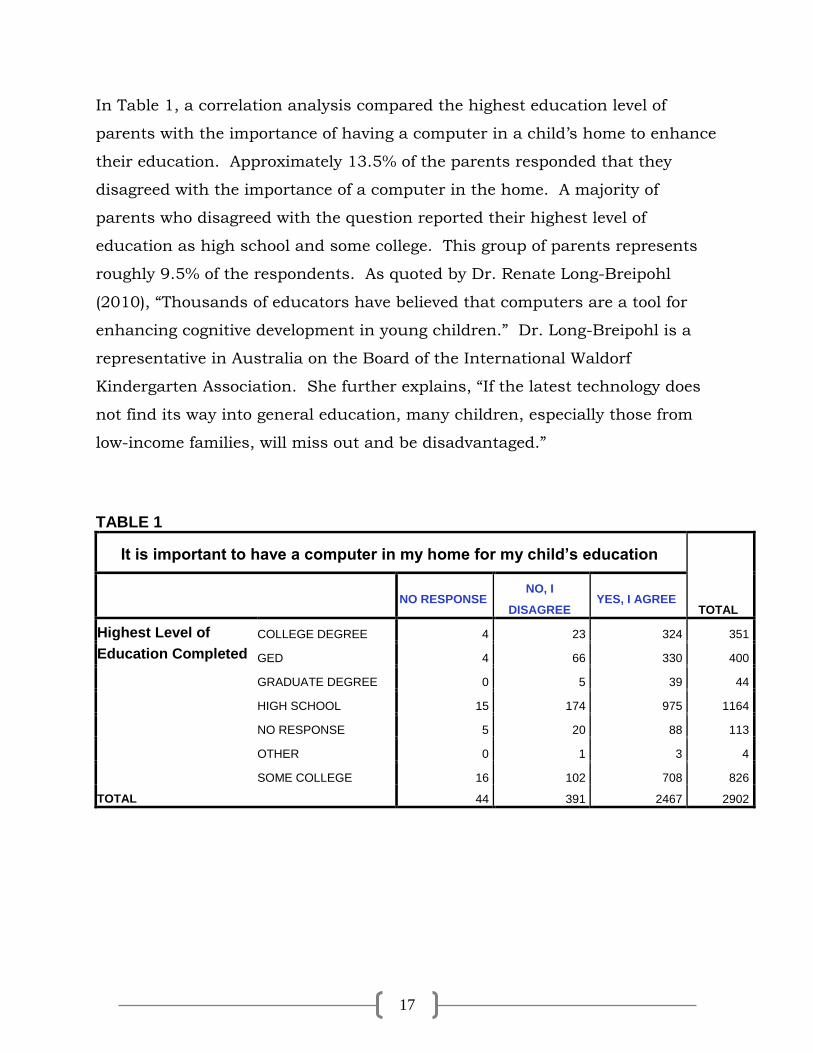
In Table 1, a correlation analysis compared the highest education level of
parents with the importance of having a computer in a child’s home to enhance
their education. Approximately 13.5% of the parents responded that they
disagreed with the importance of a computer in the home. A majority of
parents who disagreed with the question reported their highest level of
education as high school and some college. This group of parents represents
roughly 9.5% of the respondents. As quoted by Dr. Renate Long-Breipohl
(2010), “Thousands of educators have believed that computers are a tool for
enhancing cognitive development in young children.” Dr. Long-Breipohl is a
representative in Australia on the Board of the International Waldorf
Kindergarten Association. She further explains, “If the latest technology does
not find its way into general education, many children, especially those from
low-income families, will miss out and be disadvantaged.”
TABLE 1
It is important to have a computer in my home for my child’s education
TOTAL
NO RESPONSE NO, I
DISAGREE YES, I AGREE
Highest Level of
Education Completed
COLLEGE DEGREE 4 23 324 351
GED 4 66 330 400
GRADUATE DEGREE 0 5 39 44
HIGH SCHOOL 15 174 975 1164
NO RESPONSE 5 20 88 113
OTHER 0 1 3 4
SOME COLLEGE 16 102 708 826
TOTAL 44 391 2467 2902
18
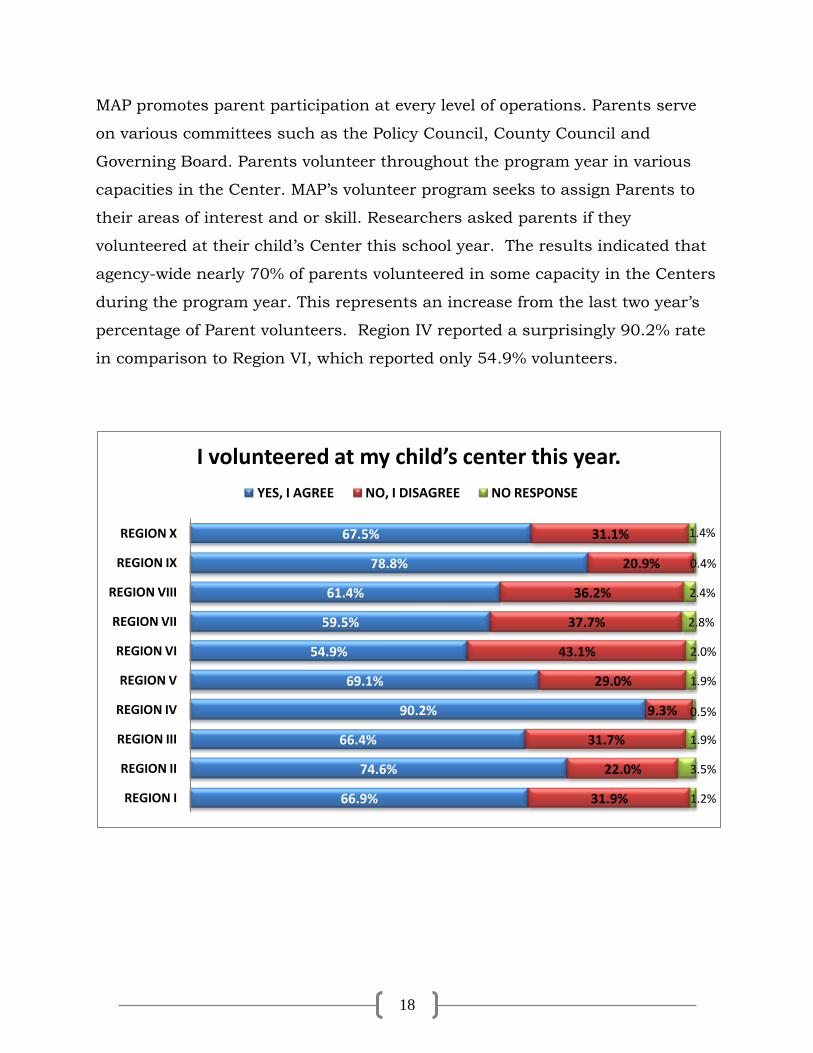
MAP promotes parent participation at every level of operations. Parents serve
on various committees such as the Policy Council, County Council and
Governing Board. Parents volunteer throughout the program year in various
capacities in the Center. MAP’s volunteer program seeks to assign Parents to
their areas of interest and or skill. Researchers asked parents if they
volunteered at their child’s Center this school year. The results indicated that
agency-wide nearly 70% of parents volunteered in some capacity in the Centers
during the program year. This represents an increase from the last two year’s
percentage of Parent volunteers. Region IV reported a surprisingly 90.2% rate
in comparison to Region VI, which reported only 54.9% volunteers.
66.9%
74.6%
66.4%
90.2%
69.1%
54.9%
59.5%
61.4%
78.8%
67.5%
31.9%
22.0%
31.7%
9.3%
29.0%
43.1%
37.7%
36.2%
20.9%
31.1%
1.2%
3.5%
1.9%
0.5%
1.9%
2.0%
2.8%
2.4%
0.4%
1.4%
REGION I
REGION II
REGION III
REGION IV
REGION V
REGION VI
REGION VII
REGION VIII
REGION IX
REGION X
I volunteered at my child’s center this year.
YES, I AGREE NO, I DISAGREE NO RESPONSE
19
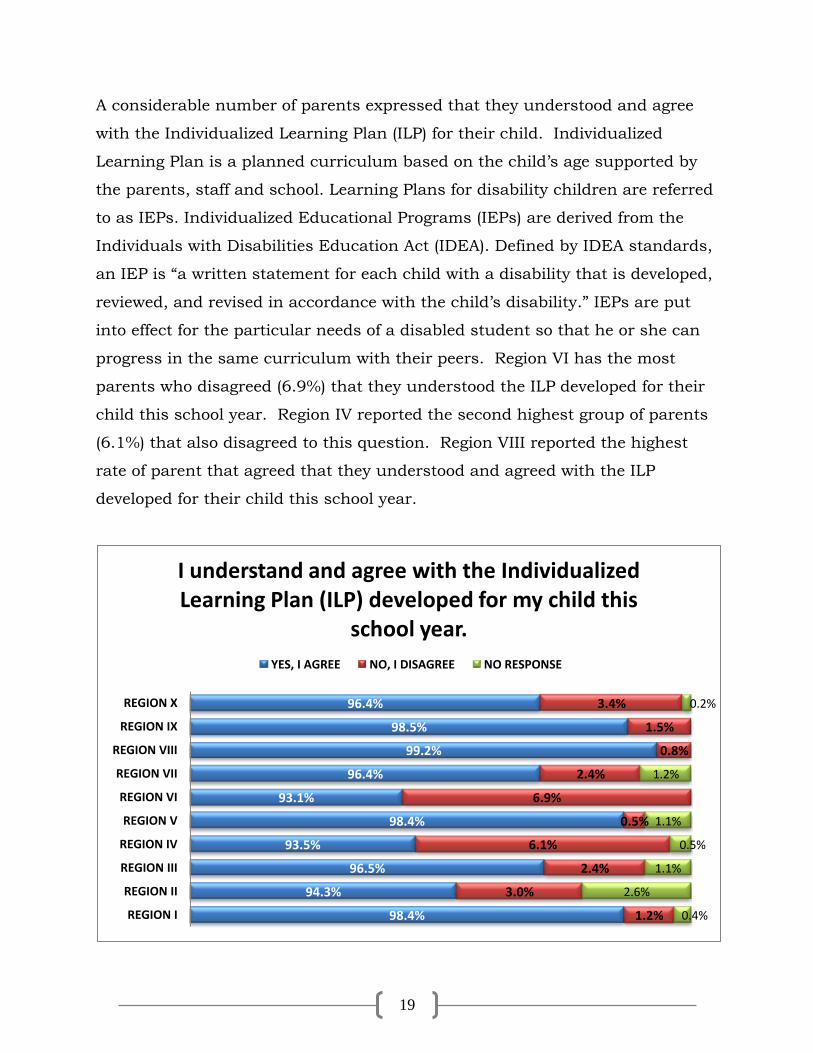
A considerable number of parents expressed that they understood and agree
with the Individualized Learning Plan (ILP) for their child. Individualized
Learning Plan is a planned curriculum based on the child’s age supported by
the parents, staff and school. Learning Plans for disability children are referred
to as IEPs. Individualized Educational Programs (IEPs) are derived from the
Individuals with Disabilities Education Act (IDEA). Defined by IDEA standards,
an IEP is “a written statement for each child with a disability that is developed,
reviewed, and revised in accordance with the child’s disability.” IEPs are put
into effect for the particular needs of a disabled student so that he or she can
progress in the same curriculum with their peers. Region VI has the most
parents who disagreed (6.9%) that they understood the ILP developed for their
child this school year. Region IV reported the second highest group of parents
(6.1%) that also disagreed to this question. Region VIII reported the highest
rate of parent that agreed that they understood and agreed with the ILP
developed for their child this school year.
98.4%
94.3%
96.5%
93.5%
98.4%
93.1%
96.4%
99.2%
98.5%
96.4%
1.2%
3.0%
2.4%
6.1%
0.5%
6.9%
2.4%
0.8%
1.5%
3.4%
0.4%
2.6%
1.1%
0.5%
1.1%
1.2%
0.2%
REGION I
REGION II
REGION III
REGION IV
REGION V
REGION VI
REGION VII
REGION VIII
REGION IX
REGION X
I understand and agree with the Individualized Learning Plan (ILP) developed for my child this
school year.
YES, I AGREE NO, I DISAGREE NO RESPONSE
20
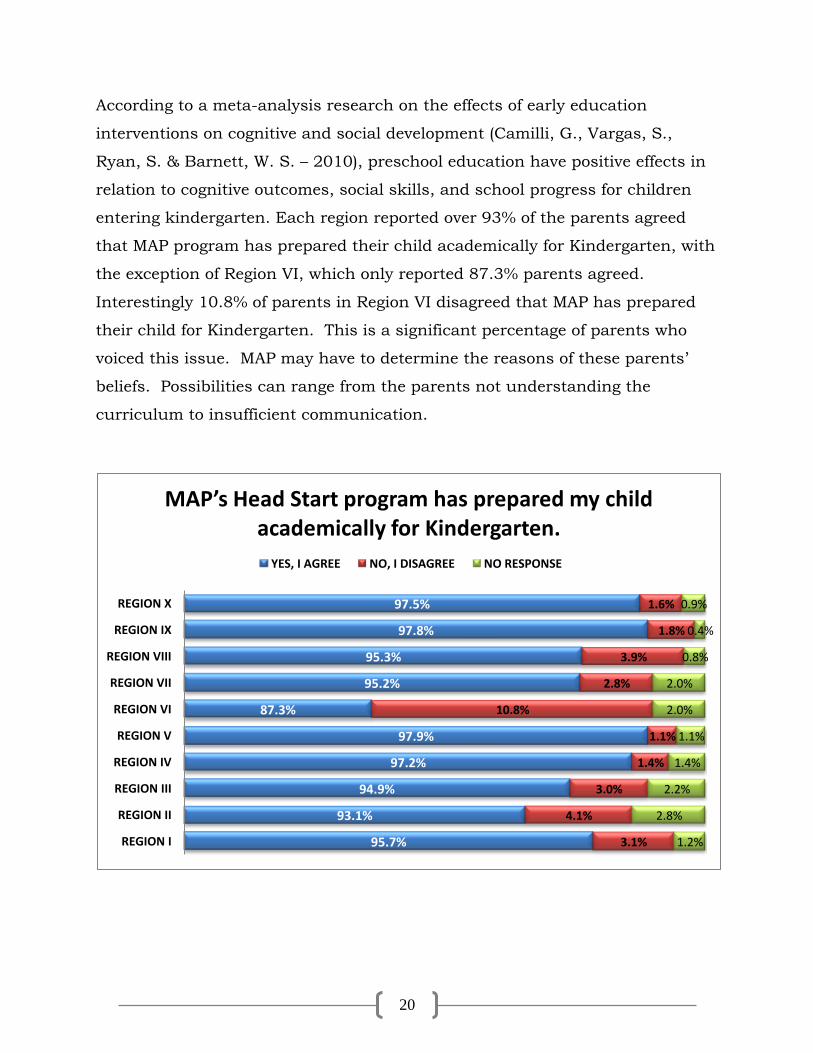
According to a meta-analysis research on the effects of early education
interventions on cognitive and social development (Camilli, G., Vargas, S.,
Ryan, S. & Barnett, W. S. – 2010), preschool education have positive effects in
relation to cognitive outcomes, social skills, and school progress for children
entering kindergarten. Each region reported over 93% of the parents agreed
that MAP program has prepared their child academically for Kindergarten, with
the exception of Region VI, which only reported 87.3% parents agreed.
Interestingly 10.8% of parents in Region VI disagreed that MAP has prepared
their child for Kindergarten. This is a significant percentage of parents who
voiced this issue. MAP may have to determine the reasons of these parents’
beliefs. Possibilities can range from the parents not understanding the
curriculum to insufficient communication.
95.7%
93.1%
94.9%
97.2%
97.9%
87.3%
95.2%
95.3%
97.8%
97.5%
3.1%
4.1%
3.0%
1.4%
1.1%
10.8%
2.8%
3.9%
1.8%
1.6%
1.2%
2.8%
2.2%
1.4%
1.1%
2.0%
2.0%
0.8%
0.4%
0.9%
REGION I
REGION II
REGION III
REGION IV
REGION V
REGION VI
REGION VII
REGION VIII
REGION IX
REGION X
MAP’s Head Start program has prepared my child academically for Kindergarten.
YES, I AGREE NO, I DISAGREE NO RESPONSE
21
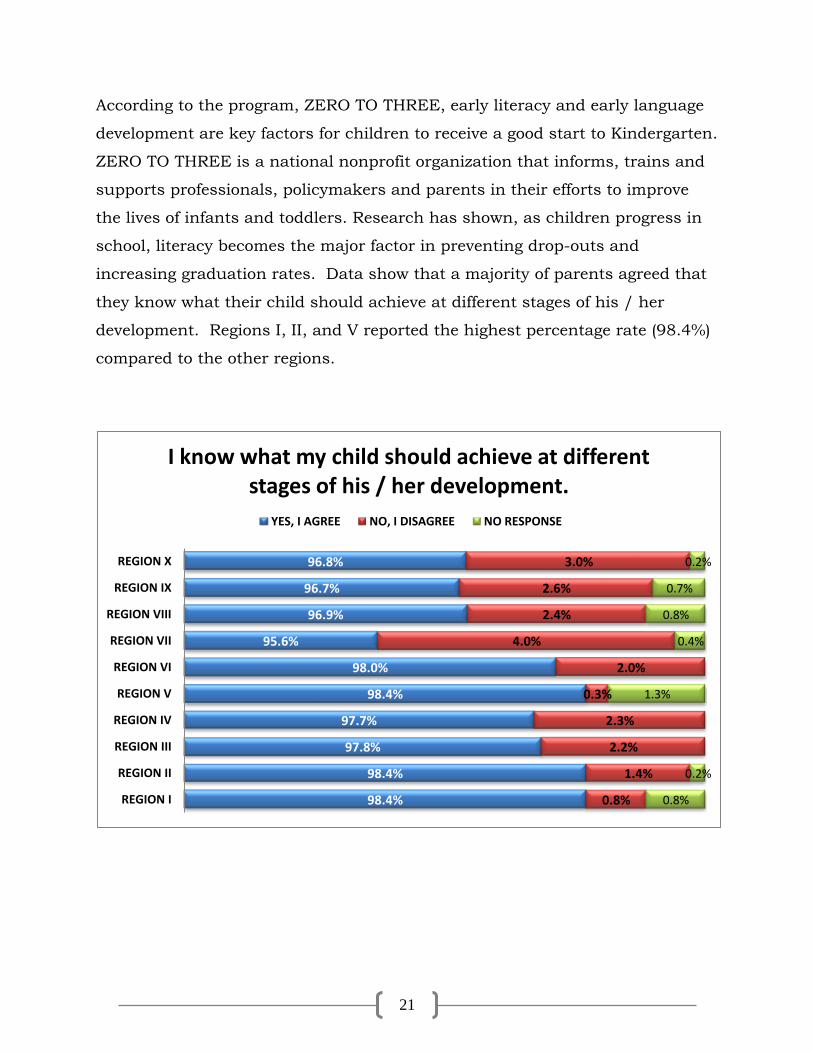
According to the program, ZERO TO THREE, early literacy and early language
development are key factors for children to receive a good start to Kindergarten.
ZERO TO THREE is a national nonprofit organization that informs, trains and
supports professionals, policymakers and parents in their efforts to improve
the lives of infants and toddlers. Research has shown, as children progress in
school, literacy becomes the major factor in preventing drop-outs and
increasing graduation rates. Data show that a majority of parents agreed that
they know what their child should achieve at different stages of his / her
development. Regions I, II, and V reported the highest percentage rate (98.4%)
compared to the other regions.
98.4%
98.4%
97.8%
97.7%
98.4%
98.0%
95.6%
96.9%
96.7%
96.8%
0.8%
1.4%
2.2%
2.3%
0.3%
2.0%
4.0%
2.4%
2.6%
3.0%
0.8%
0.2%
1.3%
0.4%
0.8%
0.7%
0.2%
REGION I
REGION II
REGION III
REGION IV
REGION V
REGION VI
REGION VII
REGION VIII
REGION IX
REGION X
I know what my child should achieve at different stages of his / her development.
YES, I AGREE NO, I DISAGREE NO RESPONSE
22
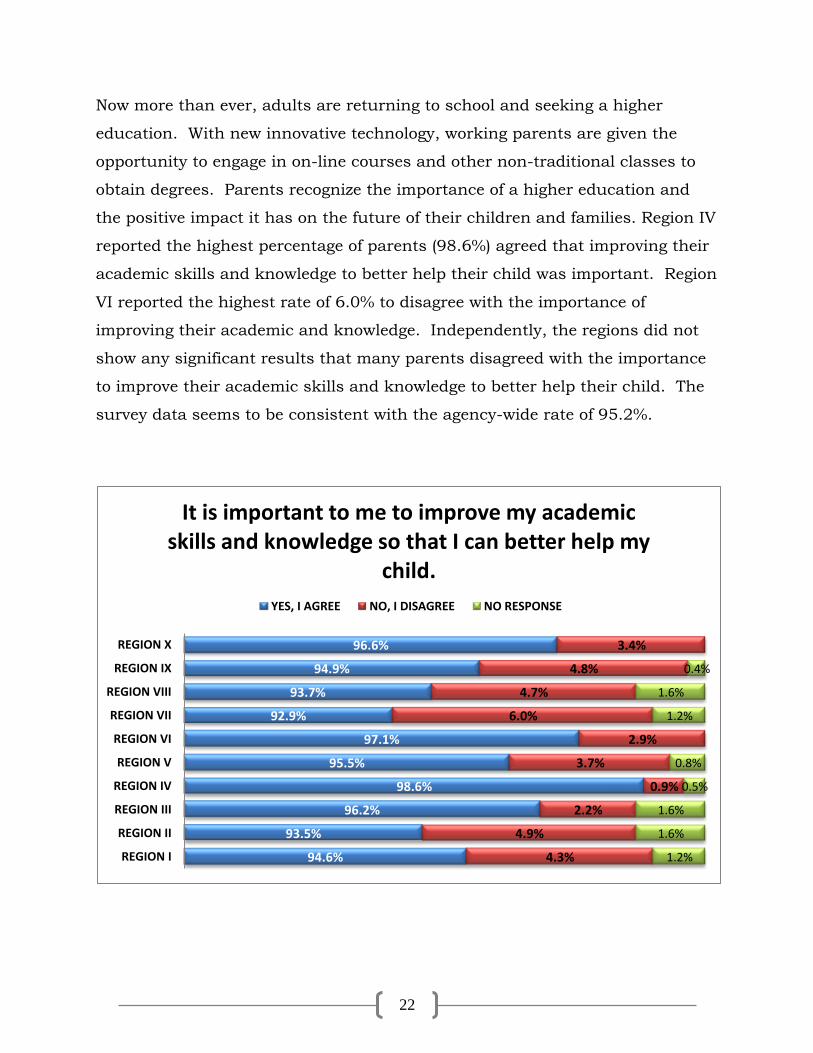
Now more than ever, adults are returning to school and seeking a higher
education. With new innovative technology, working parents are given the
opportunity to engage in on-line courses and other non-traditional classes to
obtain degrees. Parents recognize the importance of a higher education and
the positive impact it has on the future of their children and families. Region IV
reported the highest percentage of parents (98.6%) agreed that improving their
academic skills and knowledge to better help their child was important. Region
VI reported the highest rate of 6.0% to disagree with the importance of
improving their academic and knowledge. Independently, the regions did not
show any significant results that many parents disagreed with the importance
to improve their academic skills and knowledge to better help their child. The
survey data seems to be consistent with the agency-wide rate of 95.2%.
94.6%
93.5%
96.2%
98.6%
95.5%
97.1%
92.9%
93.7%
94.9%
96.6%
4.3%
4.9%
2.2%
0.9%
3.7%
2.9%
6.0%
4.7%
4.8%
3.4%
1.2%
1.6%
1.6%
0.5%
0.8%
1.2%
1.6%
0.4%
REGION I
REGION II
REGION III
REGION IV
REGION V
REGION VI
REGION VII
REGION VIII
REGION IX
REGION X
It is important to me to improve my academic skills and knowledge so that I can better help my
child.
YES, I AGREE NO, I DISAGREE NO RESPONSE
23
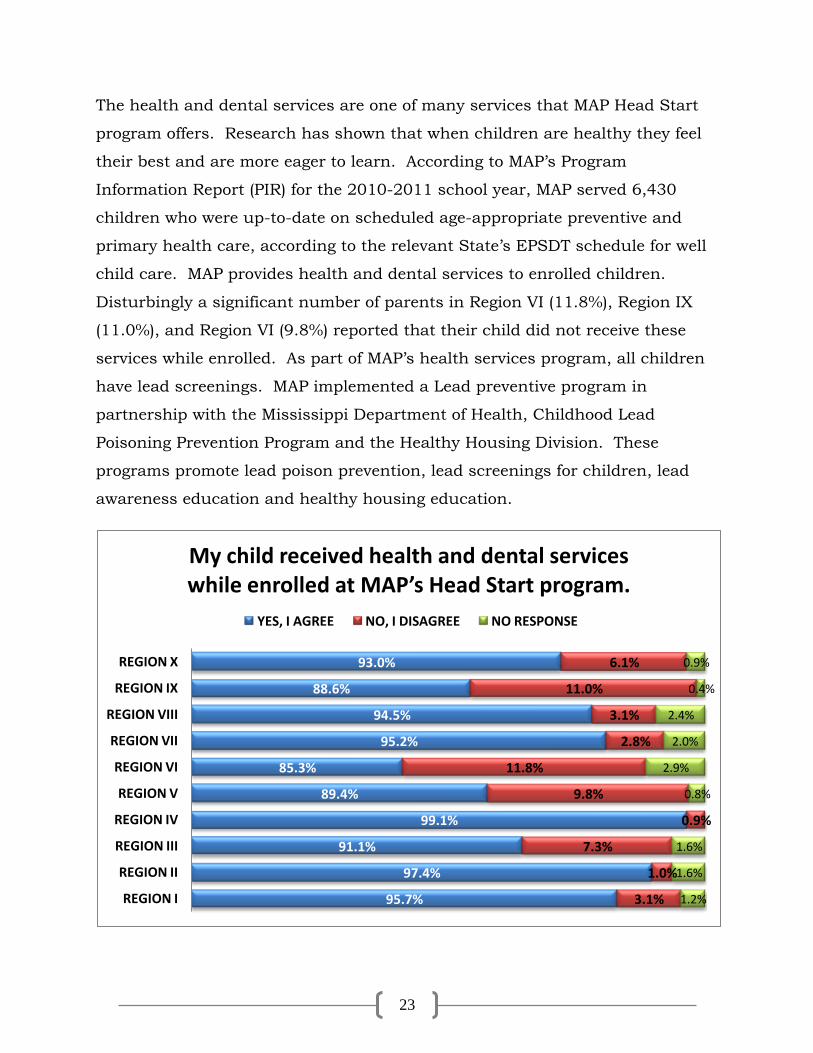
The health and dental services are one of many services that MAP Head Start
program offers. Research has shown that when children are healthy they feel
their best and are more eager to learn. According to MAP’s Program
Information Report (PIR) for the 2010-2011 school year, MAP served 6,430
children who were up-to-date on scheduled age-appropriate preventive and
primary health care, according to the relevant State’s EPSDT schedule for well
child care. MAP provides health and dental services to enrolled children.
Disturbingly a significant number of parents in Region VI (11.8%), Region IX
(11.0%), and Region VI (9.8%) reported that their child did not receive these
services while enrolled. As part of MAP’s health services program, all children
have lead screenings. MAP implemented a Lead preventive program in
partnership with the Mississippi Department of Health, Childhood Lead
Poisoning Prevention Program and the Healthy Housing Division. These
programs promote lead poison prevention, lead screenings for children, lead
awareness education and healthy housing education.
95.7%
97.4%
91.1%
99.1%
89.4%
85.3%
95.2%
94.5%
88.6%
93.0%
3.1%
1.0%
7.3%
0.9%
9.8%
11.8%
2.8%
3.1%
11.0%
6.1%
1.2%
1.6%
1.6%
0.8%
2.9%
2.0%
2.4%
0.4%
0.9%
REGION I
REGION II
REGION III
REGION IV
REGION V
REGION VI
REGION VII
REGION VIII
REGION IX
REGION X
My child received health and dental services while enrolled at MAP’s Head Start program.
YES, I AGREE NO, I DISAGREE NO RESPONSE
24
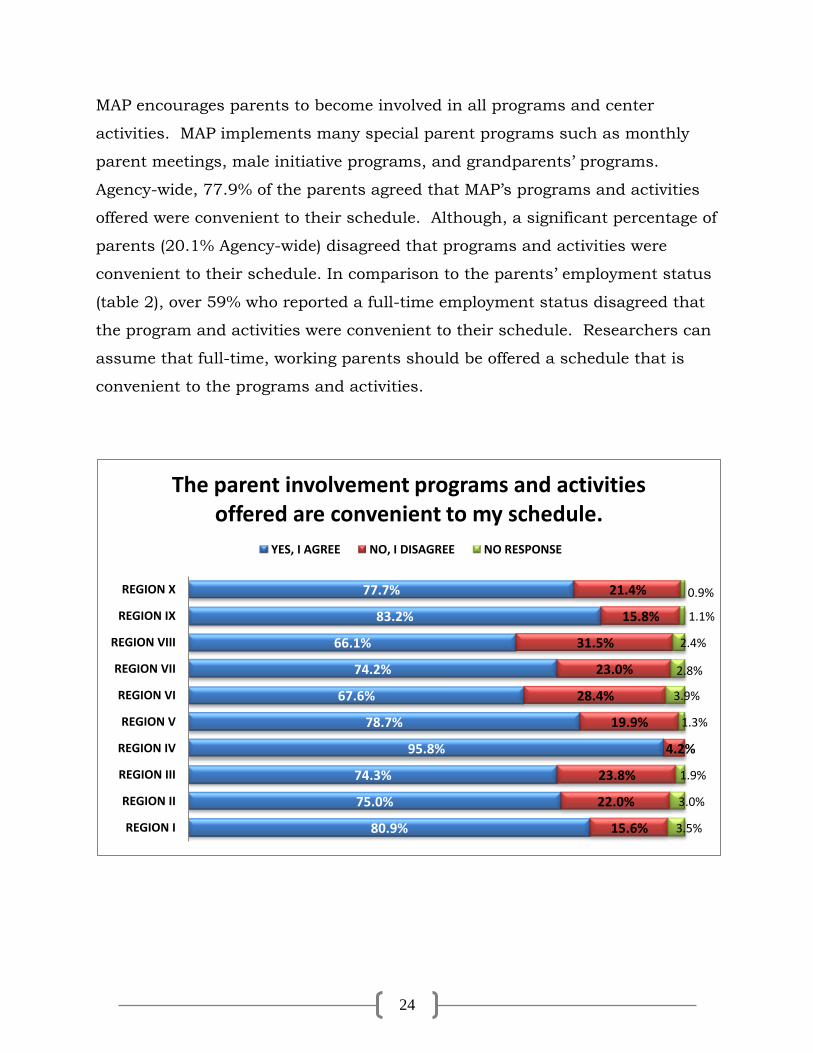
MAP encourages parents to become involved in all programs and center
activities. MAP implements many special parent programs such as monthly
parent meetings, male initiative programs, and grandparents’ programs.
Agency-wide, 77.9% of the parents agreed that MAP’s programs and activities
offered were convenient to their schedule. Although, a significant percentage of
parents (20.1% Agency-wide) disagreed that programs and activities were
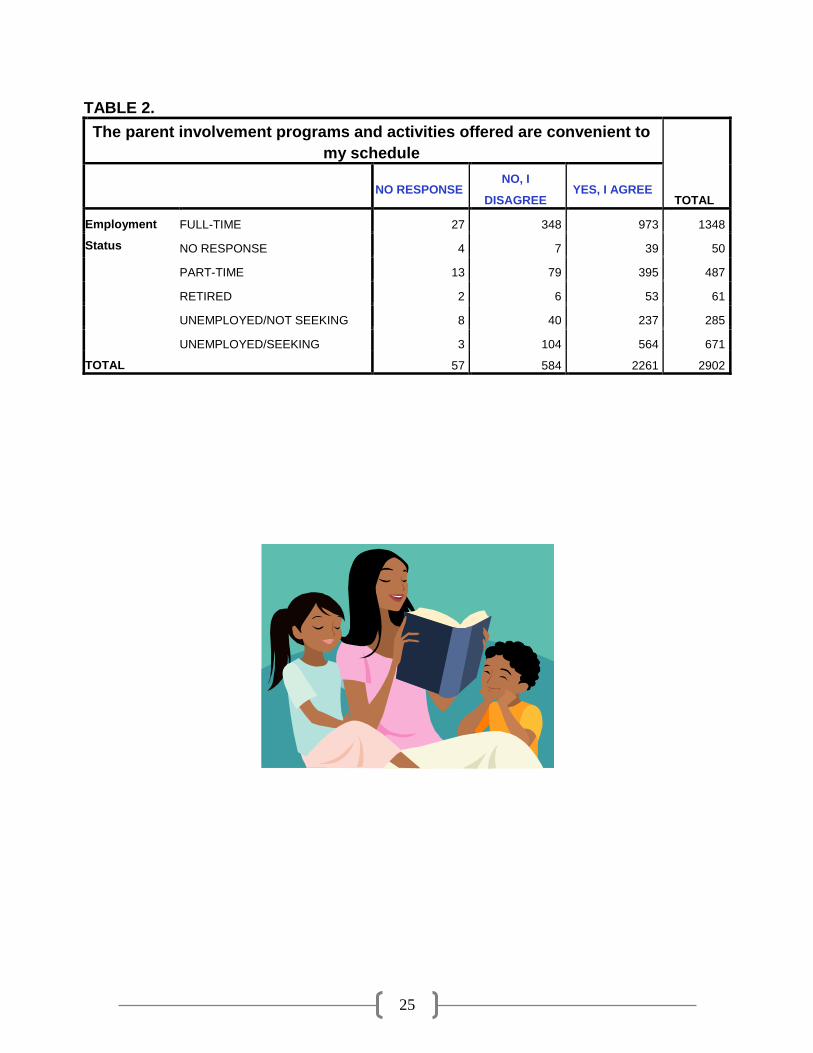
convenient to their schedule. In comparison to the parents’ employment status
(table 2), over 59% who reported a full-time employment status disagreed that
the program and activities were convenient to their schedule. Researchers can
assume that full-time, working parents should be offered a schedule that is
convenient to the programs and activities.
80.9%
75.0%
74.3%
95.8%
78.7%
67.6%
74.2%
66.1%
83.2%
77.7%
15.6%
22.0%
23.8%
4.2%
19.9%
28.4%
23.0%
31.5%
15.8%
21.4%
3.5%
3.0%
1.9%
1.3%
3.9%
2.8%
2.4%
1.1%
0.9%
REGION I
REGION II
REGION III
REGION IV
REGION V
REGION VI
REGION VII
REGION VIII
REGION IX
REGION X
The parent involvement programs and activities offered are convenient to my schedule.
YES, I AGREE NO, I DISAGREE NO RESPONSE
25
TABLE 2.
The parent involvement programs and activities offered are convenient to
my schedule
TOTAL
NO RESPONSE NO, I
DISAGREE YES, I AGREE
Employment
Status
FULL-TIME 27 348 973 1348
NO RESPONSE 4 7 39 50
PART-TIME 13 79 395 487
RETIRED 2 6 53 61
UNEMPLOYED/NOT SEEKING 8 40 237 285
UNEMPLOYED/SEEKING 3 104 564 671
TOTAL 57 584 2261 2902
26
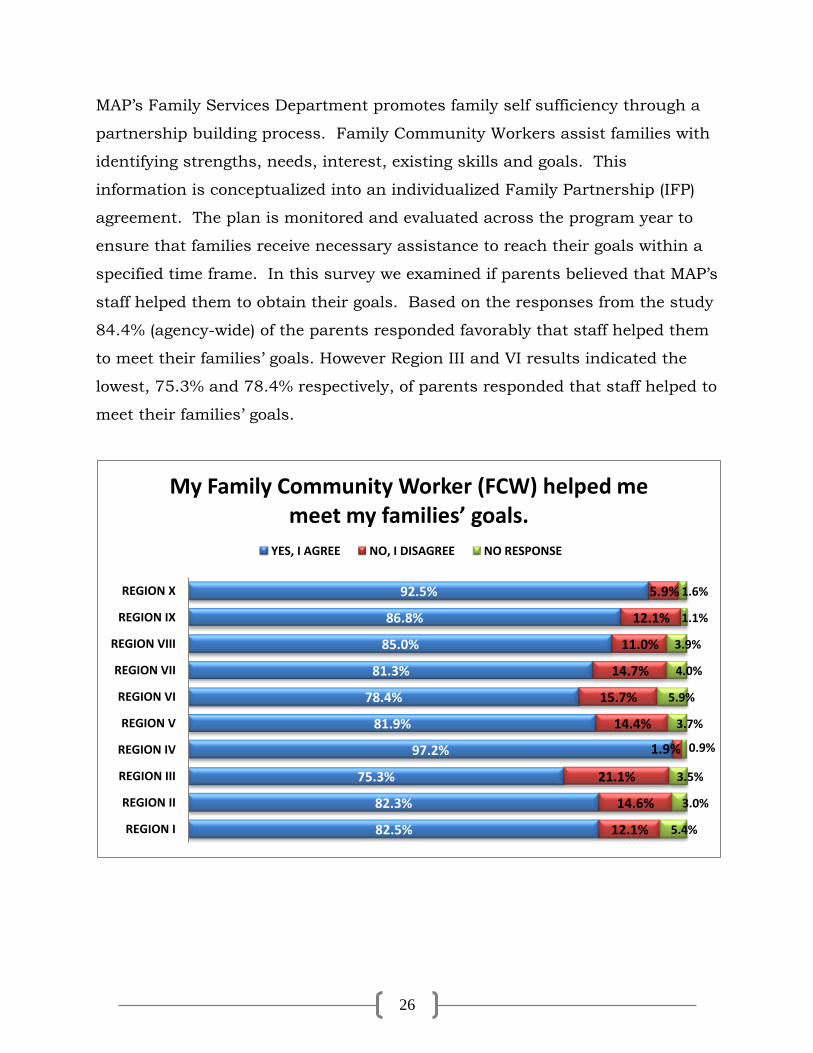
MAP’s Family Services Department promotes family self sufficiency through a
partnership building process. Family Community Workers assist families with
identifying strengths, needs, interest, existing skills and goals. This
information is conceptualized into an individualized Family Partnership (IFP)
agreement. The plan is monitored and evaluated across the program year to
ensure that families receive necessary assistance to reach their goals within a
specified time frame. In this survey we examined if parents believed that MAP’s
staff helped them to obtain their goals. Based on the responses from the study
84.4% (agency-wide) of the parents responded favorably that staff helped them
to meet their families’ goals. However Region III and VI results indicated the
lowest, 75.3% and 78.4% respectively, of parents responded that staff helped to
meet their families’ goals.
82.5%
82.3%
75.3%
97.2%
81.9%
78.4%
81.3%
85.0%
86.8%
92.5%
12.1%
14.6%
21.1%
1.9%
14.4%
15.7%
14.7%
11.0%
12.1%
5.9%
5.4%
3.0%
3.5%
0.9%
3.7%
5.9%
4.0%
3.9%
1.1%
1.6%
REGION I
REGION II
REGION III
REGION IV
REGION V
REGION VI
REGION VII
REGION VIII
REGION IX
REGION X
My Family Community Worker (FCW) helped me meet my families’ goals.
YES, I AGREE NO, I DISAGREE NO RESPONSE
27
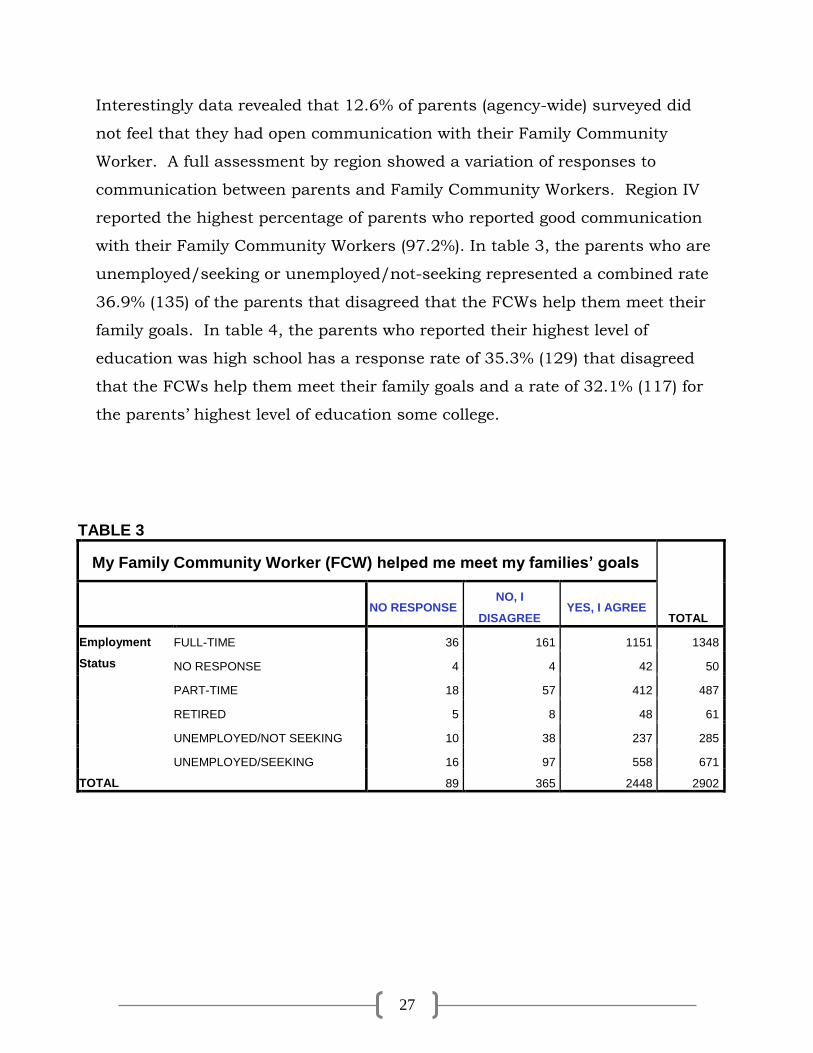
Interestingly data revealed that 12.6% of parents (agency-wide) surveyed did
not feel that they had open communication with their Family Community
Worker. A full assessment by region showed a variation of responses to
communication between parents and Family Community Workers. Region IV
reported the highest percentage of parents who reported good communication
with their Family Community Workers (97.2%). In table 3, the parents who are
unemployed/seeking or unemployed/not-seeking represented a combined rate
36.9% (135) of the parents that disagreed that the FCWs help them meet their
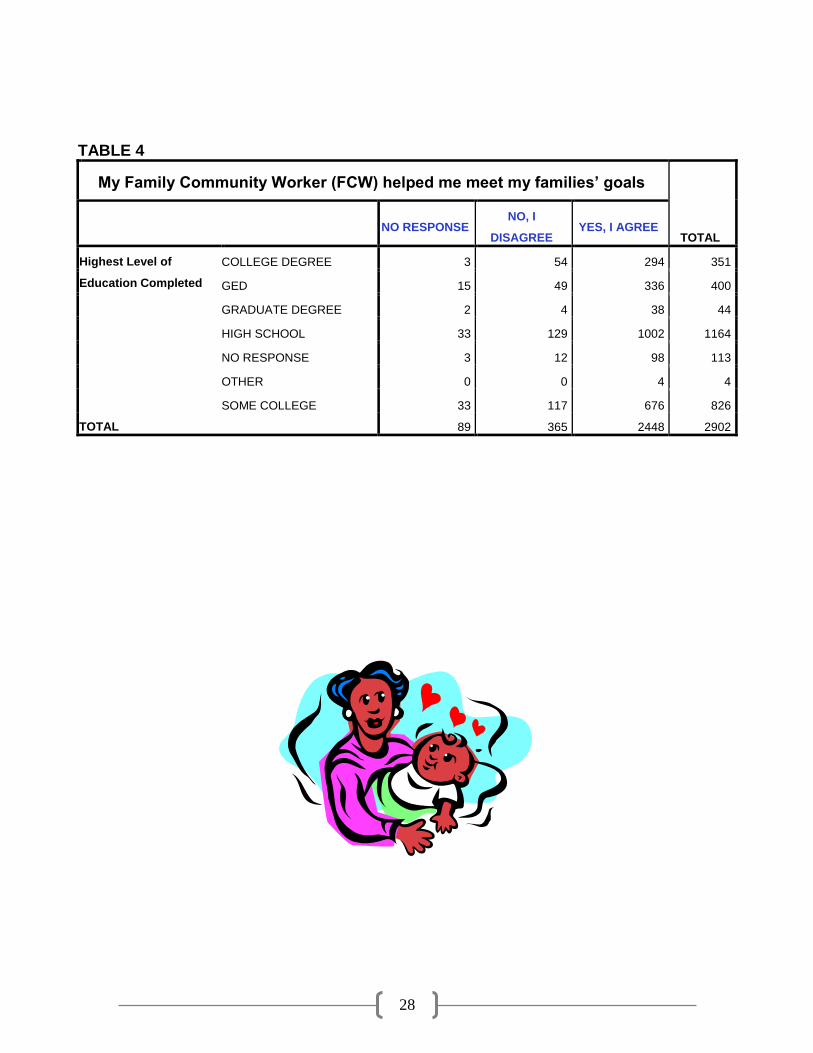
family goals. In table 4, the parents who reported their highest level of
education was high school has a response rate of 35.3% (129) that disagreed
that the FCWs help them meet their family goals and a rate of 32.1% (117) for
the parents’ highest level of education some college.
TABLE 3
My Family Community Worker (FCW) helped me meet my families’ goals
TOTAL
NO RESPONSE NO, I
DISAGREE YES, I AGREE
Employment
Status
FULL-TIME 36 161 1151 1348
NO RESPONSE 4 4 42 50
PART-TIME 18 57 412 487
RETIRED 5 8 48 61
UNEMPLOYED/NOT SEEKING 10 38 237 285
UNEMPLOYED/SEEKING 16 97 558 671
TOTAL 89 365 2448 2902
28
TABLE 4
My Family Community Worker (FCW) helped me meet my families’ goals
TOTAL
NO RESPONSE NO, I
DISAGREE YES, I AGREE
Highest Level of
Education Completed
COLLEGE DEGREE 3 54 294 351
GED 15 49 336 400
GRADUATE DEGREE 2 4 38 44
HIGH SCHOOL 33 129 1002 1164
NO RESPONSE 3 12 98 113
OTHER 0 0 4 4
SOME COLLEGE 33 117 676 826
TOTAL 89 365 2448 2902
29
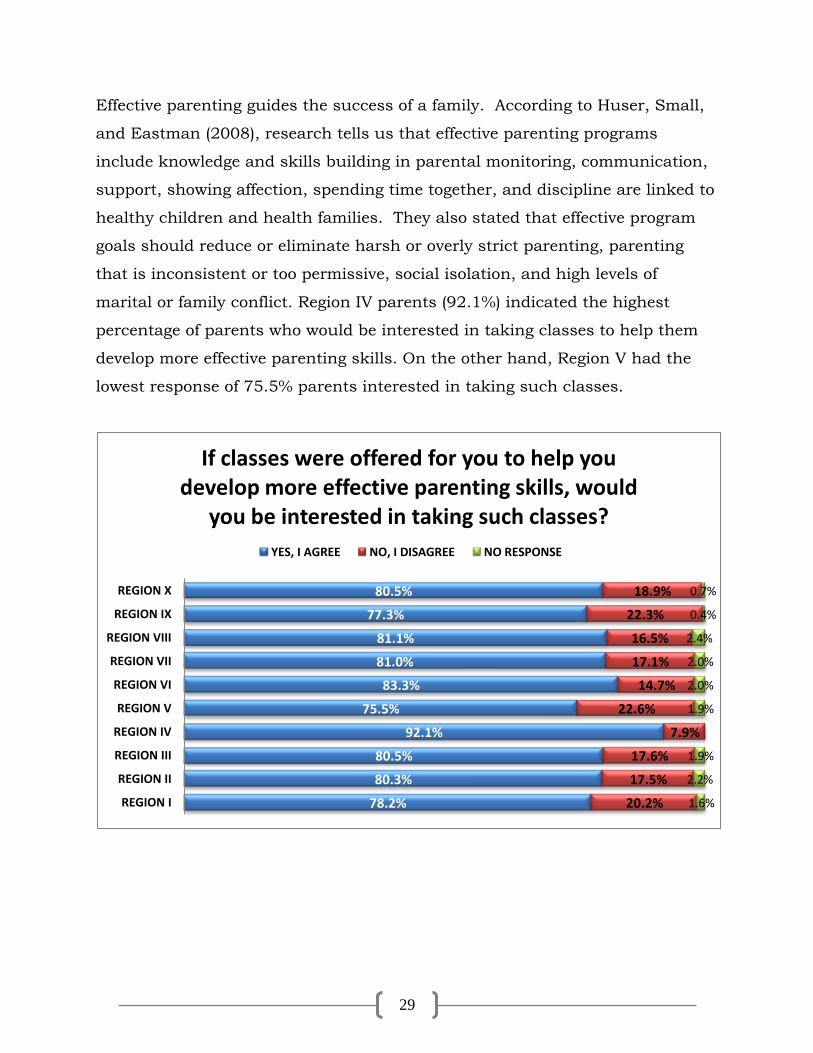
Effective parenting guides the success of a family. According to Huser, Small,
and Eastman (2008), research tells us that effective parenting programs
include knowledge and skills building in parental monitoring, communication,
support, showing affection, spending time together, and discipline are linked to
healthy children and health families. They also stated that effective program
goals should reduce or eliminate harsh or overly strict parenting, parenting
that is inconsistent or too permissive, social isolation, and high levels of
marital or family conflict. Region IV parents (92.1%) indicated the highest
percentage of parents who would be interested in taking classes to help them
develop more effective parenting skills. On the other hand, Region V had the
lowest response of 75.5% parents interested in taking such classes.
78.2%
80.3%
80.5%
92.1%
75.5%
83.3%
81.0%
81.1%
77.3%
80.5%
20.2%
17.5%
17.6%
7.9%
22.6%
14.7%
17.1%
16.5%
22.3%
18.9%
1.6%
2.2%
1.9%
1.9%
2.0%
2.0%
2.4%
0.4%
0.7%
REGION I
REGION II
REGION III
REGION IV
REGION V
REGION VI
REGION VII
REGION VIII
REGION IX
REGION X
If classes were offered for you to help you develop more effective parenting skills, would
you be interested in taking such classes?
YES, I AGREE NO, I DISAGREE NO RESPONSE
30
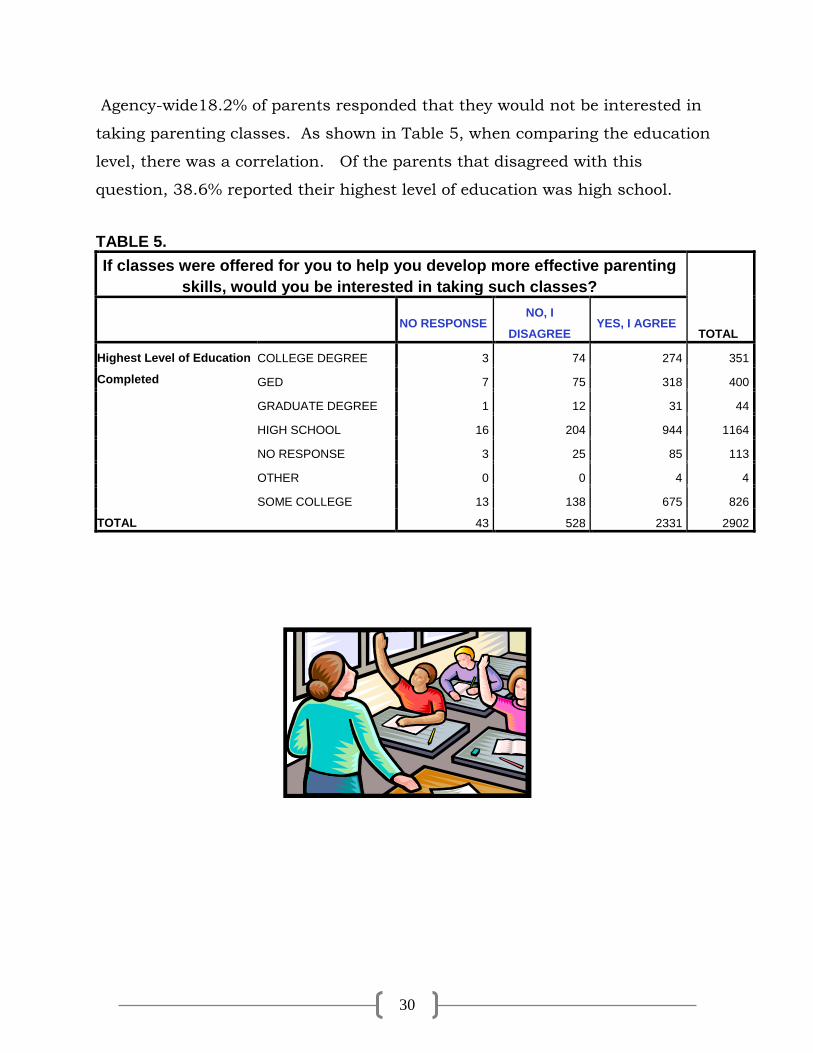
Agency-wide18.2% of parents responded that they would not be interested in
taking parenting classes. As shown in Table 5, when comparing the education
level, there was a correlation. Of the parents that disagreed with this
question, 38.6% reported their highest level of education was high school.
TABLE 5.
If classes were offered for you to help you develop more effective parenting
skills, would you be interested in taking such classes?
TOTAL
NO RESPONSE NO, I
DISAGREE YES, I AGREE
Highest Level of Education
Completed
COLLEGE DEGREE 3 74 274 351
GED 7 75 318 400
GRADUATE DEGREE 1 12 31 44
HIGH SCHOOL 16 204 944 1164
NO RESPONSE 3 25 85 113
OTHER 0 0 4 4
SOME COLLEGE 13 138 675 826
TOTAL 43 528 2331 2902
31
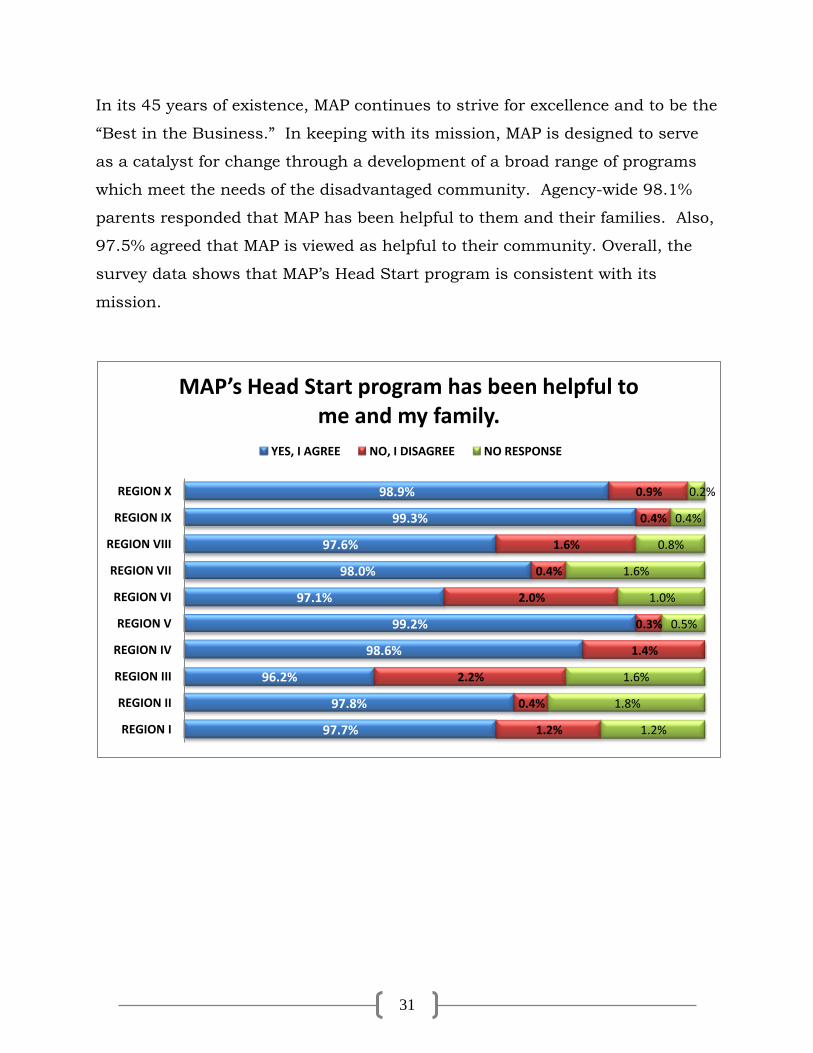
In its 45 years of existence, MAP continues to strive for excellence and to be the
“Best in the Business.” In keeping with its mission, MAP is designed to serve
as a catalyst for change through a development of a broad range of programs
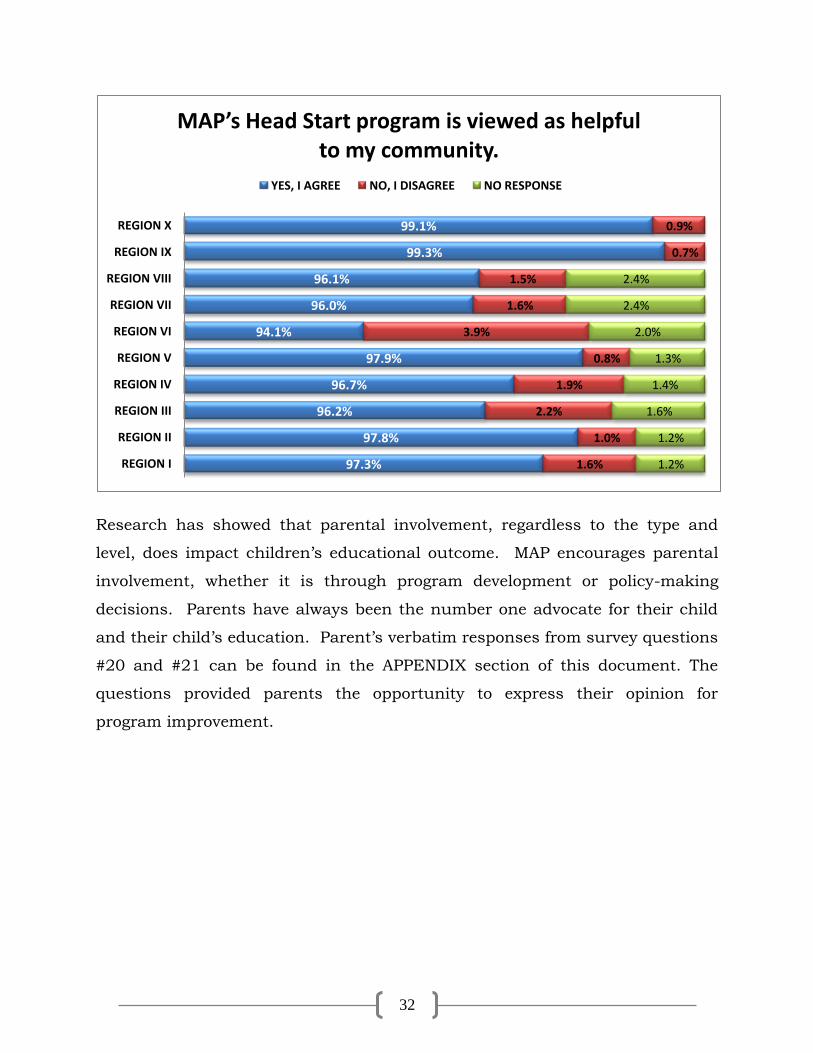
which meet the needs of the disadvantaged community. Agency-wide 98.1%
parents responded that MAP has been helpful to them and their families. Also,
97.5% agreed that MAP is viewed as helpful to their community. Overall, the
survey data shows that MAP’s Head Start program is consistent with its
mission.
97.7%
97.8%
96.2%
98.6%
99.2%
97.1%
98.0%
97.6%
99.3%
98.9%
1.2%
0.4%
2.2%
1.4%
0.3%
2.0%
0.4%
1.6%
0.4%
0.9%
1.2%
1.8%
1.6%
0.5%
1.0%
1.6%
0.8%
0.4%
0.2%
REGION I
REGION II
REGION III
REGION IV
REGION V
REGION VI
REGION VII
REGION VIII
REGION IX
REGION X
MAP’s Head Start program has been helpful to me and my family.
YES, I AGREE NO, I DISAGREE NO RESPONSE
32
Research has showed that parental involvement, regardless to the type and
level, does impact children’s educational outcome. MAP encourages parental
involvement, whether it is through program development or policy-making
decisions. Parents have always been the number one advocate for their child
and their child’s education. Parent’s verbatim responses from survey questions
#20 and #21 can be found in the APPENDIX section of this document. The
questions provided parents the opportunity to express their opinion for
program improvement.
97.3%
97.8%
96.2%
96.7%
97.9%
94.1%
96.0%
96.1%
99.3%
99.1%
1.6%
1.0%
2.2%
1.9%
0.8%
3.9%
1.6%
1.5%
0.7%
0.9%
1.2%
1.2%
1.6%
1.4%
1.3%
2.0%
2.4%
2.4%
REGION I
REGION II
REGION III
REGION IV
REGION V
REGION VI
REGION VII
REGION VIII
REGION IX
REGION X
MAP’s Head Start program is viewed as helpful to my community.
YES, I AGREE NO, I DISAGREE NO RESPONSE
33
RECOMMENDATIONS
1. To continue to increase parent’s awareness of the educational
benefits of having a computer in the home, or stressing the
importance of computer usage at the local library or public school,
for parents who cannot afford computers. Agency-wide 13.5%
disagreed it was important to have a computer in their home for their
child’s education. Region IV reported the highest rate of 6.5% who did
not see the benefits of having a computer in the home.
2. To encourage parents to volunteer at their child’s center. Agency-
wide 28.1% disagreed that they volunteered at their child’s center.
Region IV had a much lower rate of 9.3% in comparison to agency-wide.
3. To continue to increase parent participation in program activities,
including meetings and surveys to promote awareness and
involvement. Agency-wide 20.1% disagreed that the parent involvement
activities and programs offered were convenient to their schedule. Of
those that disagreed, 59% reported a full-time employment status.
Therefore, it is also recommended that other time frames should be
considered to make it convenient for the full-time working parents.
Region IV had a much lower rate of 4.2% in comparison to agency-wide.
4. To provide additional training and skill development for Family
Community Workers (FCWs). Agency-wide 12.6% disagreed that the
FCWs helped them meet their families’ goals. Region IV had a much
lower rate of 1.9% in comparison to agency-wide.
34
RECOMMENDATIONS (…..Continued)
5. To continue to address Parenting Skill development in the Family
Services Department. Agency-wide18.2% of parents responded that
they would not be interested in taking parenting classes. Region IV had
a much lower rate of 7.9% in comparison to agency-wide.
6. To increase the number of children who receive health and dental
services while enrolled in MAP Head Start. A significant number of
parents in Region VI (11.8%), Region IX (11.0%), and Region VI (9.8%)
reported that their child did not receive these services while enrolled.
35
CONCLUSION
This study asked Parents to describe services provided to their families
and their opinions on certain topics during the 2010-2011school year.
Research have shown that the early years are very important in a child learning
and development. Therefore, Parents are very concerned about the learning
experiences that their children are exposed to in an early educational setting.
Parents expect for their children to receive quality comprehensive services that
will enhance their school readiness skills. MAP staff work collaboratively with
Parents to maximize children’s learning opportunities in the Centers and at
home.
The majority of the survey participants were female (74.2%), Black
(65.4%), Single Parent (57.6%), Never Married (59%), working Full-time
(46.5%), and the highest level of education was High School (40.1%). This year
survey data showed an increase in Parent Volunteers across the Agency.
Results indicated that nearly 70% of parents surveyed volunteered in the
Center during the program year. Included in this report are parents’ comments
as it relates to friendliness of the staff and recommended changes for Center
improvement.
The results of this year’s study show there were a significant percentage of
parents, agency-wide, who disagreed with 6 important issues as presented in
this survey. First, a major percentage disagreed with the importance of having
a computer in the home for the child’s education. Research show educators
believed that computers are a tool for enhancing cognitive development in
young children. Second, a significant percentage of parents did not volunteer
at their child’s center. At MAP, parents can volunteer by participating at every
level of operations and through various positions. Next, parental involvement
programs and activities were not convenient for full-time working parents. The
Agency may need to review the schedule of activities to agree with parent
availability when feasible. Additionally, a significant percentage of Family
36
Community Workers were not helping families meet their families’ goals.
Communication is essential to the development of a realistic Family Plan,
which is contingent upon trust, family information identification of strengths
and resources. A significant number of parents indicated that they did not have
open communication with their Family Community Worker. The survey also
indicated that a significant rate of parents would not take the opportunity to
take classes to develop more effective parenting skills. Finally, three regions
had a significant percentage of parents that reported their child did not receive
health and dental services while enrolled. MAP has a timeframe which all
enrolled children are screened within 30 to 45 days.
Although, the results indicated that overall Parents of enrolled children were
satisfied with the services they received and that the program was beneficial for
their families. Typically parents are concerned about their child’s preparation
for school. MAP staff understands this concern and work with parents to
ensure that children have the necessary school readiness skills to succeed
academically. Data from the survey support that parents believed that the
program had prepared their child academically. Overall Parents responded
positively to questions related to MAP’s educational programs including the
program curriculum.
37
REFERENCES
Edwards, Mark C., Ph.D. (2000) Effective Parent Teacher Communication.
Center for Effective Parenting. Arkansas Children’s Hospital.
Rafoth, M. A., Buchenauer, E. L., Crissman, K. K., Halko, J. L. (2004) School Readiness – Preparing Children for Kindergarten and Beyond: Information for Parents: Ensuring a healthy start. Promoting a bright future. National
Association of School Psychologists. Mississippi Action for Progress, INC. (2010) Head Start Program Information
Report. Jackson, Mississippi.
Long-Breipohl, Dr. Renate, (2010) Computers In Early Childhood Education: A Jump Start for the Future. Board of the International Waldorf Kindergarten Association.
Huser, M., Small, S. A., and Eastman, G. (2008) What research tells us about
effective parenting education programs. A What Works, Wisconsin Fact Sheet. University of Wisconsin-Madison/Extension. January, 2008.
Lopez, William (2004) Successful Parenting Skills that Shape Children’s Behaviors. AllPsych Journal. AllPsych Online: The Virtual Psychology
Classroom. http://allpsych.com/journal/parentingskills.html Michigan State University. (2004) Parent Involvement in Schools. Best Practice
Briefs. University Outreach & Engagement, Board of Trustees of Michigan State University. June, 2004. No. 30-R.
Kreider, Holly. (2002) Getting Parents “Ready” for Kindergarten: The Role of Early Childhood Education. Family Involvement Network of Educators (FINE).
Harvard Family Research Project. April, 2002. Camilli, G., Vargas, S., Ryan, S. & Barnett, W. S. (2010) Meta-Analysis of the
Effects of Early Education Interventions on Cognitive and Social Development. Teachers College Record. Volume 112 Number 3, 2010. ID Number 15440.
National Governors Association Center for Best Practices (NGA Center) and the Council of Chief State School Officers (CCSSO). Common Core State Standards
Initiative. 2011. www.costandards.com/frequentlyaskedquestions ZERO TO THREE. (2003) Early Literacy. BrainWonders is a joint project by
Boston University Medical Center, Erikson Institute, and ZERO TO THREE. www.zerotothree.org/BrainWonders