Embed Size (px)
Citation preview
NSEL Report SeriesReport No. NSEL-013
April 2009
Headed Steel Stud Anchorsin Composite Structures: Part I – Shear
Luis PallarésJerome F. Hajjarjj
Department of Civil and Environmental EngineeringUniversity of Illinois at Urbana-Champaign
UILU-ENG-2009-1801
ISSN: 1940-9826
© The Newmark Structural Engineering Laboratory
The Newmark Structural Engineering Laboratory (NSEL) of the Department of Civil and Environmental Engineering at the University of Illinois at Urbana-Champaign has a long history of excellence in research and education that has contributed greatly to the state-of-the-art in civil engineering. Completed in 1967 and extended in 1971, the structural testing area of the laboratory has a versatile strong-floor/wall and a three-story clear height that can be used to carry out a wide range of tests of building materials, models, and structural systems. The laboratory is named for Dr. Nathan M. Newmark, an internationally known educator and engineer, who was the Head of the Department of Civil Engineering at the University of Illinois [1956-73] and the Chair of the Digital Computing Laboratory [1947-57]. He developed simple, yet powerful and widely used, methods for analyzing complex structures and assemblages subjected to a variety of static, dynamic, blast, and earthquake loadings. Dr. Newmark received numerous honors and awards for his achievements, including the prestigious National Medal of Science awarded in 1968 by President Lyndon B. Johnson. He was also one of the founding members of the National Academy of Engineering.
Contact:
Prof. B.F. Spencer, Jr. Director, Newmark Structural Engineering Laboratory 2213 NCEL, MC-250 205 North Mathews Ave. Urbana, IL 61801 Telephone (217) 333-8630 E-mail: [email protected]
This research was sponsored by the Fundación Caja Madrid and the University of Illinois at Urbana-Champaign. The authors thank Mr. C. Champney, Mr. D. Merker, and Mr. D. Sues of Nelson Stud Company and Mr. M. Denavit of the University of Illinois at Urbana-Champaign for their contributions to this work. The authors thank the members of the American Institute of Steel Construction Committee on Specifications Task Committee 5 on Composite Construction for their comments on this research. The cover photographs are used with permission. The Trans-Alaska Pipeline photograph was provided by Terra Galleria Photography (http://www.terragalleria.com/).
ABSTRACT
The formula in the 2005 American Institute of Steel Construction Specification to compute the strength of headed steel stud anchors (shear connectors) in composite steel/concrete structures has been used in the United States since 1993 after being proposed based primarily on the results of push-out tests. In the past several decades, the range of members used in composite structures has increased significantly, as has the number of tests in the literature on the monotonic and cyclic behavior of headed studs in composite construction. This work reviews 391 monotonic and cyclic tests from the literature on experiments of headed stud anchors and proposes formulas for the limit states of steel failure and concrete failure of headed stud anchors subjected to shear force without the use of metal deck. Detailing provisions to prevent premature pryout failure are also discussed. This work also reviews proposals from several authors and provides recommended shear strength values for seismic behavior of headed studs. The limit state formulas are proposed within the context of the 2005 AISC Specification, and comparisons are made to the provisions in the ACI 318-08 Building Code and the PCI Handbook, 6th Edition. The scope of this research includes composite beam-columns [typically concrete-encased steel shapes (SRC) or concrete-filled steel tubes (CFT)], concrete-encased and concrete-filled beams, boundary elements of composite wall systems, composite connections, composite column base conditions, and related forms of composite construction.
KEYWORDS
Composite Construction; Composite Column; Steel Anchor; Shear Stud; Headed Stud; Shear Connector

CONTENTS CHAPTER 1. INTRODUCTION....................................................................................1 CHAPTER 2. OBJECTIVES...........................................................................................4 CHAPTER 3. MONOTONIC BEHAVIOR OF HEADED STUDS SUBJECTED TO SHEAR FORCES........................................................................................................5
3.1 Comparison of AISC 2005, ACI 318-08, and PCI 6th Edition .............................8 3.2 Reassessment of headed steel stud strength in the AISC Specification .............11 3.3 Formulas for concrete failure. ............................................................................13 3.4 Headed steel stud shear strength for . .............................................16 / 4.efh d > 5
CHAPTER 4. SEISMIC BEHAVIOR OF HEADED STUD IN TENSION .............21
CHAPTER 5. CONCLUSIONS.....................................................................................22 REFERENCES ................................................................................................................24 LYST OF SYMBOLS
CHAPTER 1
INTRODUCTION
Headed steel stud anchors (shear connectors) welded to a steel base and encased in concrete have been the most common method for transferring forces between the steel and concrete materials in composite construction. This type of anchor has been investigated by numerous researchers worldwide. For steel and composite steel/concrete construction, the focus of the work has been predominantly on composite beams with and without metal deck. Much less comprehensive assessment has been conducted for the strength of headed steel anchors in composite components.
For such alternative configurations, the focus of much prior work has been on
reinforced or prestressed concrete construction. The main approaches regarding anchors in reinforced concrete are outlined in CEB (1997) and Appendix D of ACI 318-08 (ACI, 2008). Recently, Anderson and Meinheit (2000, 2005, 2007) developed a comprehensive research program to assess the shear strength of headed studs in prestressed concrete. As a result of this work, the 6th Edition of the PCI Handbook (PCI, 2004) incorporated new alternative approaches for computing the shear strength of headed studs.
Research on headed studs in composite structures extends back to the 1950’s.
A brief summary is presented here. The first push out test for studying the behavior of the headed studs was conducted by Viest (1956), who performed 12 tests at the University of Illinois with varying ratios of effective depth-to-stud diameter (hef/d), where hef is the stud height from its base to the underside of the stud head. Viest (1956) observed three types of failure: steel failures, where the stud diameter reached its yield point and failed; concrete failures, where concrete surrounding the headed stud crushed; and mixed failures that included failure of both materials. Furthermore, Viest proposed one of the first formulas to assess the shear strength of headed studs of composite structures (see Table 1).
Driscoll and Slutter (1961) proposed a modification of Viest’s equation (Table
1) and observed that the total height-to-diameter ratio (h/d) for studs embedded in normal-weight concrete should be equal or larger than 4.2 if the full shear strength of the anchor had to be developed. Chinn (1965) and Steele (1967) developed push-out tests on lightweight composite slabs. Davies (1967) studied group effects for several headed studs in push-out tests. Mainstone and Menzies (1967) carried out eighty-three push-out specimens covering the behavior of headed anchors under both static and fatigue loads. Goble (1967) investigated the effects of flange thickness on the strength of composite specimens. Topkaya et al. (2004) tested 24 specimens in order to describe the behavior of headed studs at early concrete ages.
Ollgaard et al. (1971) proposed the first formula adopted by AISC Manual
1993 to compute the shear strength of headed studs (see Table 1). They tested 48 push out tests in lightweight and normal-weight concrete with an effective embedment depth ratio, hef/d, of 3.26. Failures were noted in both steel and concrete material.
1

Table 1. Proposed equations for headed steel anchor strength in composites structures.
Author Equationa
Viest (1955) If 1 .d in< then
ccnv f
fdQ'
4000'25.5 2=
If then 1 .d in>c
cnv fdfQ
'4000'5=
Driscoll and Slutter (1961) Long studs ( h d ):/ 4.2>
s
cnv A
fd '932 2
=
h d
Q
Short studs ( / 4.2s
cnv A
fhdQ
'222=< ):
Baldwin et al. (1965) , Buttry (1965), Dallam (1968)
Steel failure: ssnvs fAQ '=
Concrete failure: 80.6'0157.0 , += spcnvc hdfQ
Ollgaard et al. (1971) usccsnvs FAEfAQ <= '5.0
a Units: pounds, inches for Viest (1955); Units: kips, inches for Driscoll and Slutter (1961), Baldwin et al. (1965), Buttry (1965),
Dallam (1968), Ollgaard et al. (1971). The AISC Specification has included provisions for composite structures since
1936. Tables providing allowable horizontal shear load of headed studs as a function of the stud diameter and concrete strength appeared in AISC Specification of 1961 (AISC, 1961). Effects of metal deck on shear strength of the headed studs were added in 1978 (AISC, 1978) and the AISC Specification adopted Ollgaard’s formula (Ollgaard et al., 1971) to compute the shear strength of headed steel studs in 1993 (AISC, 1993).
Composite beams, specifically hot-rolled steel shapes with a concrete floor
slab either with metal deck formwork, have received extensive coverage in the literature [e.g., Driscoll and Slutter (1961), Buttry (1965), Baldwin et al. (1965), Dallam (1968), Baldwin (1970), Jayas and Hosain (1989); Easterling et al. (1993); Johnson (2004); Easterling (2005)] and are not within the scope of this work.
This work reviews 391 monotonic and cyclic tests from the literature on
experiments of headed stud anchors and proposes formulas for the limit states of steel failure and concrete failure of headed stud anchors subjected to shear force without the use of metal deck. Detailing provisions to prevent premature pryout failure are also discussed. This work also reviews proposals from several authors and provides recommended shear strength values for the cyclic seismic behavior of headed studs. The limit state formulas are proposed within the context of the AISC Specification (AISC, 2005a, 2005b), and comparisons are made to the provisions in the ACI 318-08 Building Code (ACI, 2008) and the PCI Handbook, 6th Edition (PCI, 2004). The scope of this research includes composite beam-columns [typically concrete-encased steel shapes (SRC) or concrete-filled steel tubes (CFT)], concrete-encased and concrete-filled beams, boundary elements of composite wall systems, composite connections, composite column base conditions, and related forms of composite
2

construction. Pallarés and Hajjar (2009) cover the response of steel stud anchors subjected to tension force and combined tension and shear.
This work also reviews cyclic tests under high amplitude loading simulating
seismic excitation. Hawkins and Mitchell (1984), Gattesco and Giuriani (1996), Bursi and Gramola (1999), Zandonini and Bursi (2002), and Civjan and Singh (2003) performed a range of different types of push–pull tests on headed steel studs under high amplitude cyclic shear loading for slabs in composite beams. Saari et al. (2004) reported the headed stud anchor behavior of partially-restrained steel frames with reinforced concrete infill walls, looking at both static and cyclic loads. Saari et al. (2004) studied shear, tension, and shear/tension interaction response for headed studs with two types of confining reinforcing patterns. These tests showed that if sufficient confinement is included, concrete failure is precluded.
3
CHAPTER 2
OBJECTIVES
This work reports on the behavior of headed studs embedded in solid concrete slabs subjected to shear force, including both static and large-amplitude cyclic (i.e., seismic) forces, without steel profile sheeting or metal deck. Results given in this work are applicable to composite elements including steel reinforced concrete columns (SRCs) or concrete filled tubes (CFTs), concrete-encased and concrete-filled beams, boundary elements of composite wall systems, composite connections, composite column base conditions, and related forms of composite construction. An extensive set of test results of headed steel anchors in configurations applicable to composite construction has been collected and analyzed relative to the design provisions put forward in AISC (2005), ACI 318-08 Appendix D (ACI, 2008), and PCI 6th Ed. (PCI, 2004). Recommendations and design guidelines are then proposed for headed steel anchors subjected to shear force in composite construction. Approximately 27% of the test results utilized in this work include lightweight concrete so as to get a comprehensive set of test results for composite construction.
4
CHAPTER 3
MONOTONIC BEHAVIOR OF HEADED STUDS SUBJECTED TO SHEAR FORCES
A comprehensive collection of headed steel anchors tests under static loads
may be found in Anderson and Meinheit (2005). The present work is based mainly on that collection with added test data found in the literature, including Shoup and Singleton (1963), Chapman (1964), Mainstone and Menzies (1967), Menzies (1971), Saari et al. (2004), and Shim et al (2004). In total, 391 tests were considered when examining the monotonic behavior of headed steel anchors.
There are three main failures that may occur in a headed stud anchor for
composite structures, namely: steel failure, weld failure, and failure of the concrete surrounding the headed stud. In this work, weld failure is included as a steel failure, since the distinction between weld and steel failure is often difficult to ascertain in the experiments.
Of the 391 tests on headed steel studs, 114 tests were classified as concrete
failure and 202 were classified as steel failure. The rest of the failures were not reported by the author or were classified as mixed failure. Within this data set, 286 tests used normal strength concrete and 105 of the tests used lightweight concrete.
Schematics of the tests are presented in Table 2. Generally, there are three
types of tests. The first type is a push out test [e.g., Viest (1956), Ollgaard et al. (1971), etc.]. The second type is conducted horizontally with edge conditions far away from the tested steel anchor [e.g., Gattesco and Giuriani (1996), Anderson and Meinheit (2005)]. The third type takes into account special conditions such as in infill walls (e.g., Saari et al. (2004)). The push out test usually simulates well the conditions in composite structures, producing pryout or steel failure of the anchor between the steel and concrete.
5
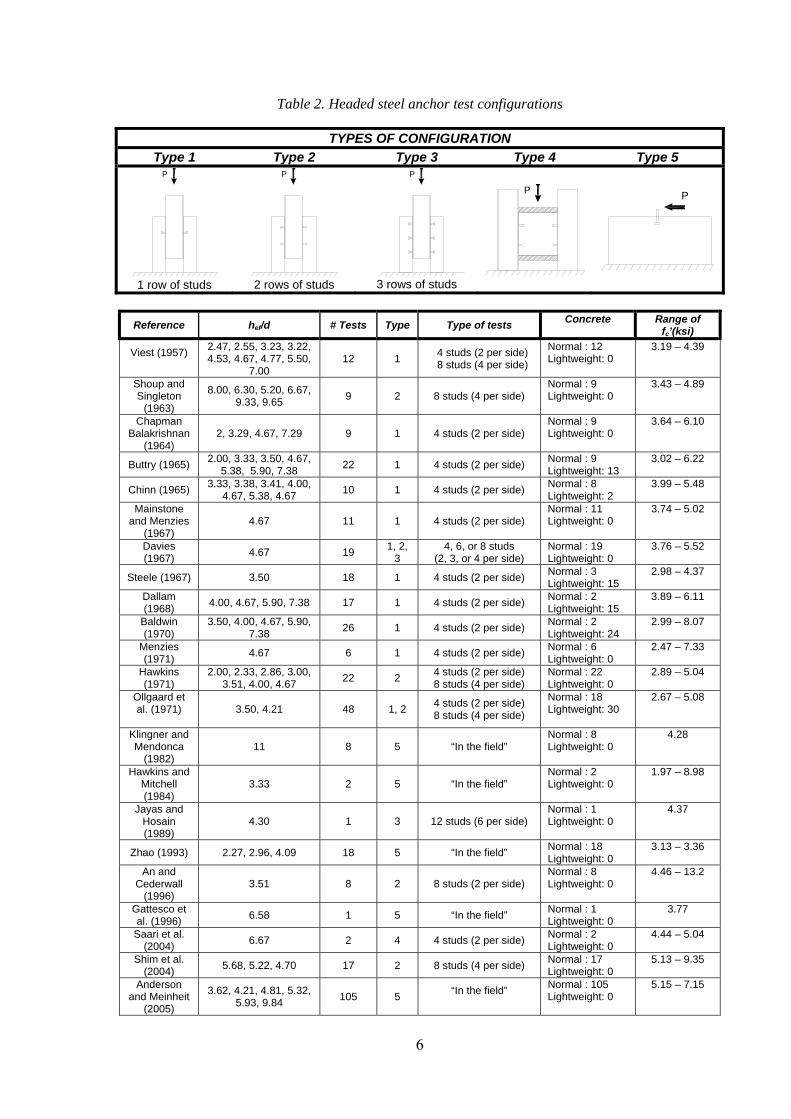
Table 2. Headed steel anchor test configurations
TYPES OF CONFIGURATION Type 1 Type 2 Type 3 Type 4 Type 5
P
1 row of studs
P
2 rows of studs
P
3 rows of studs
P
P
Reference hef/d # Tests Type Type of tests Concrete Range of
fc’(ksi)
Viest (1957)
2.47, 2.55, 3.23, 3.22, 4.53, 4.67, 4.77, 5.50,
7.00 12 1 4 studs (2 per side)
8 studs (4 per side)
Normal : 12 Lightweight: 0
3.19 – 4.39
Shoup and Singleton
(1963)
8.00, 6.30, 5.20, 6.67, 9.33, 9.65 9 2 8 studs (4 per side)
Normal : 9 Lightweight: 0
3.43 – 4.89
Chapman Balakrishnan
(1964) 2, 3.29, 4.67, 7.29 9 1 4 studs (2 per side)
Normal : 9 Lightweight: 0
3.64 – 6.10
Buttry (1965) 2.00, 3.33, 3.50, 4.67, 5.38, 5.90, 7.38 22 1 4 studs (2 per side) Normal : 9
Lightweight: 13 3.02 – 6.22
Chinn (1965) 3.33, 3.38, 3.41, 4.00, 4.67, 5.38, 4.67 10 1 4 studs (2 per side) Normal : 8
Lightweight: 2 3.99 – 5.48
Mainstone and Menzies
(1967) 4.67 11 1 4 studs (2 per side)
Normal : 11 Lightweight: 0
3.74 – 5.02
Davies (1967) 4.67 19 1, 2,
3 4, 6, or 8 studs
(2, 3, or 4 per side) Normal : 19 Lightweight: 0
3.76 – 5.52
Steele (1967) 3.50 18 1 4 studs (2 per side) Normal : 3 Lightweight: 15
2.98 – 4.37
Dallam (1968) 4.00, 4.67, 5.90, 7.38 17 1 4 studs (2 per side) Normal : 2
Lightweight: 15 3.89 – 6.11
Baldwin (1970)
3.50, 4.00, 4.67, 5.90, 7.38 26 1 4 studs (2 per side) Normal : 2
Lightweight: 24 2.99 – 8.07
Menzies (1971) 4.67 6 1 4 studs (2 per side) Normal : 6
Lightweight: 0 2.47 – 7.33
Hawkins (1971)
2.00, 2.33, 2.86, 3.00, 3.51, 4.00, 4.67 22 2 4 studs (2 per side)
8 studs (4 per side) Normal : 22 Lightweight: 0
2.89 – 5.04
Ollgaard et al. (1971)
3.50, 4.21 48 1, 2 4 studs (2 per side)
8 studs (4 per side)
Normal : 18 Lightweight: 30
2.67 – 5.08
Klingner and Mendonca
(1982) 11 8 5 “In the field”
Normal : 8 Lightweight: 0
4.28
Hawkins and Mitchell (1984)
3.33 2 5 “In the field” Normal : 2 Lightweight: 0
1.97 – 8.98
Jayas and Hosain (1989)
4.30 1 3 12 studs (6 per side) Normal : 1 Lightweight: 0
4.37
Zhao (1993) 2.27, 2.96, 4.09 18 5 “In the field” Normal : 18 Lightweight: 0
3.13 – 3.36
An and Cederwall
(1996) 3.51 8 2 8 studs (2 per side)
Normal : 8 Lightweight: 0
4.46 – 13.2
Gattesco et al. (1996) 6.58 1 5 “In the field” Normal : 1
Lightweight: 0 3.77
Saari et al. (2004) 6.67 2 4 4 studs (2 per side) Normal : 2
Lightweight: 0 4.44 – 5.04
Shim et al. (2004) 5.68, 5.22, 4.70 17 2 8 studs (4 per side) Normal : 17
Lightweight: 0 5.13 – 9.35
Anderson and Meinheit
(2005)
3.62, 4.21, 4.81, 5.32, 5.93, 9.84 105 5 “In the field”
Normal : 105 Lightweight: 0
5.15 – 7.15
6
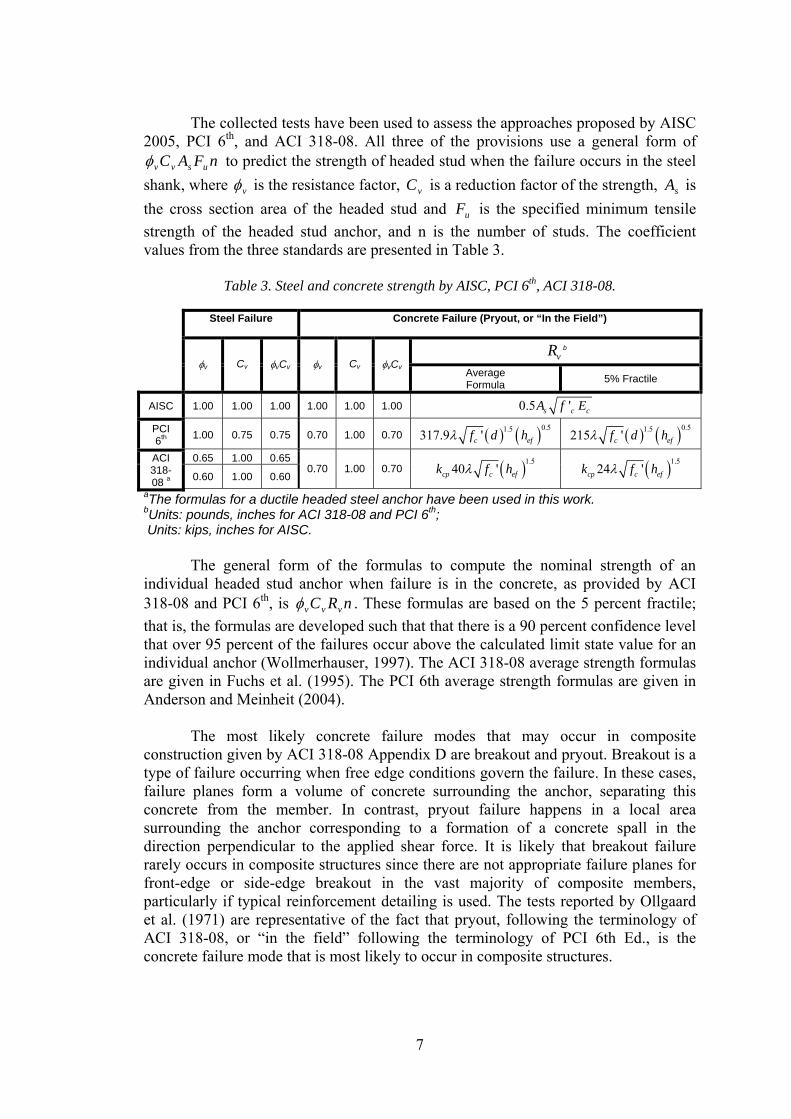
The collected tests have been used to assess the approaches proposed by AISC
2005, PCI 6th, and ACI 318-08. All three of the provisions use a general form of nFAC usvvφ to predict the strength of headed stud when the failure occurs in the steel
shank, where vφ is the resistance factor, is a reduction factor of the strength, is the cross section area of the headed stud and is the specified minimum tensile strength of the headed stud anchor, and n is the number of studs. The coefficient values from the three standards are presented in Table 3.
vC sA
uF
Table 3. Steel and concrete strength by AISC, PCI 6th, ACI 318-08.
Steel Failure Concrete Failure (Pryout, or “In the Field”)
vR b
Cv Cv φv φvCv φv φvCv Average Formula 5% Fractile
AISC 1.00 1.00 1.00 1.00 1.00 1.00 0.5 'sA c cf E
( ) ( )0.51.5317.9 'c eff d hλ ( ) ( )0.51.5215 'c eff d hλPCI 6th 1.00 0.75 0.75 0.70 1.00 0.70
0.65 1.00 0.65 ACI ( )1.5
40 'cp c efk f hλ ( )1.524 'cp c efk f hλ318-
08 a 0.60 1.00 0.60 0.70 1.00 0.70
aThe formulas for a ductile headed steel anchor have been used in this work. bUnits: pounds, inches for ACI 318-08 and PCI 6th; Units: kips, inches for AISC.
The general form of the formulas to compute the nominal strength of an
individual headed stud anchor when failure is in the concrete, as provided by ACI 318-08 and PCI 6th, is nRC vvvφ . These formulas are based on the 5 percent fractile; that is, the formulas are developed such that that there is a 90 percent confidence level that over 95 percent of the failures occur above the calculated limit state value for an individual anchor (Wollmerhauser, 1997). The ACI 318-08 average strength formulas are given in Fuchs et al. (1995). The PCI 6th average strength formulas are given in Anderson and Meinheit (2004).
The most likely concrete failure modes that may occur in composite
construction given by ACI 318-08 Appendix D are breakout and pryout. Breakout is a type of failure occurring when free edge conditions govern the failure. In these cases, failure planes form a volume of concrete surrounding the anchor, separating this concrete from the member. In contrast, pryout failure happens in a local area surrounding the anchor corresponding to a formation of a concrete spall in the direction perpendicular to the applied shear force. It is likely that breakout failure rarely occurs in composite structures since there are not appropriate failure planes for front-edge or side-edge breakout in the vast majority of composite members, particularly if typical reinforcement detailing is used. The tests reported by Ollgaard et al. (1971) are representative of the fact that pryout, following the terminology of ACI 318-08, or “in the field” following the terminology of PCI 6th Ed., is the concrete failure mode that is most likely to occur in composite structures.
7
ACI 318-08 proposes a formula to compute the pryout failure ( ) based on the basic concrete breakout strength in tension ( ), which necessitates the computation of several intermediate quantities. However, PCI 6th provides a direct formula to compute the pryout failure when the ratio
cpV
bN
dhef is less than 4.5. This assumes that when the ratio dhef is larger than 4.5, the most likely failure is in the steel shank. The formulas from ACI 318-08 and PCI 6th to compute pryout failure are summarized in Table 3.
AISC (2005) provides a formula to compute the shear strength in composite
components other than composite beams. This formula is an adaptation of the formula for headed steel anchors in composite beams proposed by Ollgaard et al. (1971), who calibrated it adjusting different models to the forty-eight test results developed in their research. Currently, reliability of the headed steel anchor against premature failure is taken into account as a part of the design of the composite component, such as a composite column; hence, the headed steel anchor strength typically does not have its own resistance factor in AISC (2005). The resulting formula [Equation I2-12 in AISC (2005)] is presented in Table 1 [as Ollgaard et al. (1971)].
3.1. Comparison of AISC 2005, ACI 318-08, and PCI 6th Edition
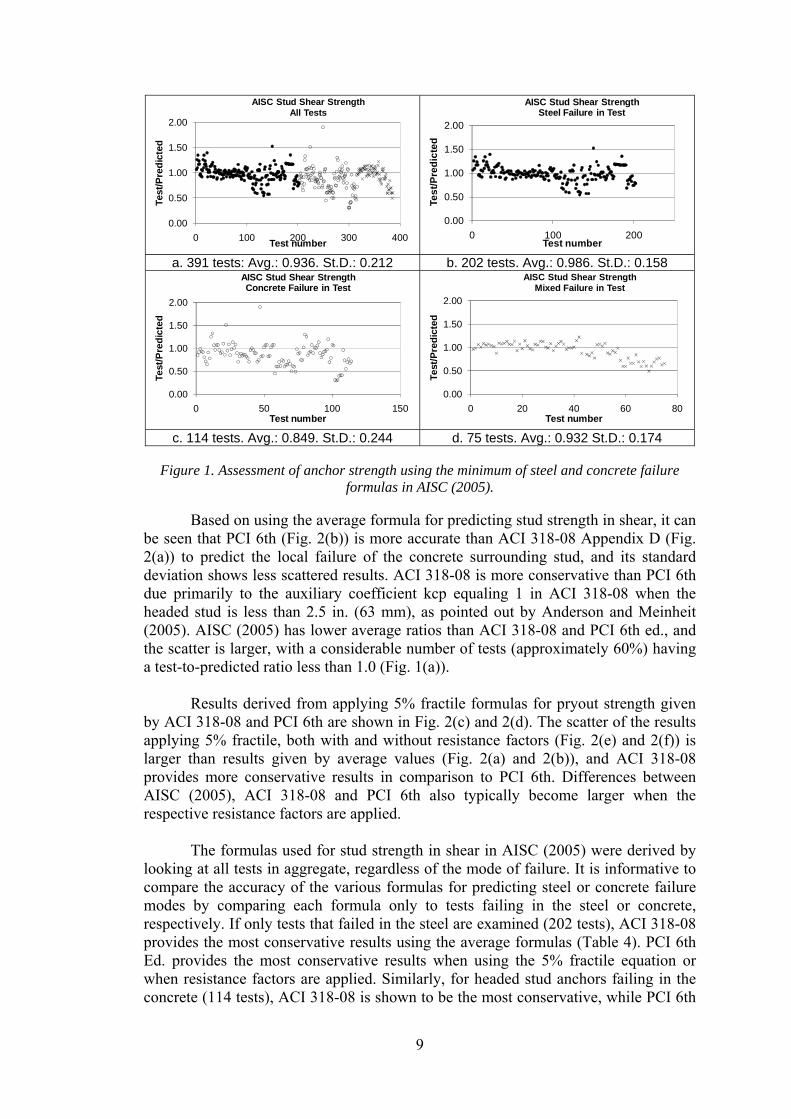
The current formula for the nominal shear strength of a steel anchor (other than in composite beams) in AISC 2005 ( usccs FAEfA <'5.0 ) was computed for each of the 391 tests (using the minimum value of the steel and concrete failure modes) and compared to the experimentally obtained load. The results are shown in Fig. 1(a)1. The ratio of experimental strength to predicted strength, Vtest/Vpredicted, was less than one for 235 of the 391 tests, indicating that the formula is unsafe for 60% of the tests. Measured values were not always provided by the authors. In these cases, for this study, the nominal values given by the authors were used.
uF
Additional insight can be gained by separating the tests based on failure mode
before computing the average test-to-predicted ratio. For steel failures, the AISC 2005 prediction is accurate and safe (Fig. 1(b)). For tests in which the concrete failed, the scatter is much larger and many test-to-predicted ratios are less than one (Fig. 1(c)).
The comparison between the different provisions for concrete failure modes
has been carried out using the average formula, the 5% fractile formula provided by ACI 318-08 and PCI 6th Ed., and taking into account the resistance factors specified in Table 3, in order to assess the accuracy of the different approaches. The test-to-predicted ratios for ACI 318-08 Appendix D and PCI 6th Ed. are shown in Fig. 2. The headed stud strength plotted in Fig. 2 is the minimum of the strength of the steel ( ) and the strength computed for pryout (“in the field”) failure mode. us FA
1 The legend for the markers in the figures is identified in the list of notation.
8
0.00
0.50
1.00
1.50
2.00
0 100 200
Test
/Pre
dict
ed
Test number
AISC Stud Shear StrengthSteel Failure in Test
º
0.00
0.50
1.00
1.50
2.00
0 100 200 300 400
Test
/Pre
dict
ed
Test number
AISC Stud Shear Strength All Tests
a. 391 tests: Avg.: 0.936. St.D.: 0.212 b. 202 tests. Avg.: 0.986. St.D.: 0.158
0.00
0.50
1.00
1.50
2.00
0 50 100 150
Test
/Pre
dict
ed
Test number
AISC Stud Shear StrengthConcrete Failure in Test
0.00
0.50
1.00
1.50
2.00
0 20 40 60 8
Test
/Pre
dict
edTest number
AISC Stud Shear StrengthMixed Failure in Test
0
c. 114 tests. Avg.: 0.849. St.D.: 0.244 d. 75 tests. Avg.: 0.932 St.D.: 0.174
Figure 1. Assessment of anchor strength using the minimum of steel and concrete failure formulas in AISC (2005).
Based on using the average formula for predicting stud strength in shear, it can
be seen that PCI 6th (Fig. 2(b)) is more accurate than ACI 318-08 Appendix D (Fig. 2(a)) to predict the local failure of the concrete surrounding stud, and its standard deviation shows less scattered results. ACI 318-08 is more conservative than PCI 6th due primarily to the auxiliary coefficient kcp equaling 1 in ACI 318-08 when the headed stud is less than 2.5 in. (63 mm), as pointed out by Anderson and Meinheit (2005). AISC (2005) has lower average ratios than ACI 318-08 and PCI 6th ed., and the scatter is larger, with a considerable number of tests (approximately 60%) having a test-to-predicted ratio less than 1.0 (Fig. 1(a)).
Results derived from applying 5% fractile formulas for pryout strength given
by ACI 318-08 and PCI 6th are shown in Fig. 2(c) and 2(d). The scatter of the results applying 5% fractile, both with and without resistance factors (Fig. 2(e) and 2(f)) is larger than results given by average values (Fig. 2(a) and 2(b)), and ACI 318-08 provides more conservative results in comparison to PCI 6th. Differences between AISC (2005), ACI 318-08 and PCI 6th also typically become larger when the respective resistance factors are applied.
The formulas used for stud strength in shear in AISC (2005) were derived by
looking at all tests in aggregate, regardless of the mode of failure. It is informative to compare the accuracy of the various formulas for predicting steel or concrete failure modes by comparing each formula only to tests failing in the steel or concrete, respectively. If only tests that failed in the steel are examined (202 tests), ACI 318-08 provides the most conservative results using the average formulas (Table 4). PCI 6th Ed. provides the most conservative results when using the 5% fractile equation or when resistance factors are applied. Similarly, for headed stud anchors failing in the concrete (114 tests), ACI 318-08 is shown to be the most conservative, while PCI 6th
9

is accurate with small scatter (Table 5). AISC (2005) is seen to unsafe for both groups of tests.
0.00
3.00
6.00
9.00
0 100 200 300 400
Test
/Pre
dict
ed
Test number
ACI 318-08 Stud Shear Strength (Average)All Tests
0.00
1.00
2.00
3.00
4.00
0 100 200 300 400
Test
/Pre
dict
ed
Test number
PCI 6th Stud Shear Strength (Average)All Tests
a. 391 tests: Avg.: 1.352. St.D.: 0.644 b. 391 tests. Avg.: 1.033. St.D.: 0.166
0.00
3.00
6.00
9.00
0 100 200 300 400
Test
/Pre
dict
ed
Test number
ACI 318-08 Stud Shear Strength (5% Frac. Concrete Formula)
All Tests
0.00
1.00
2.00
3.00
4.00
0 100 200 300 400
Test
/Pre
dict
ed
Test number
PCI 6th Stud Shear Strength (5% Frac. Concrete Formula)
All Tests
c. 391 tests. Avg.: 1.884. St.D.: 1.012 d. 391 tests. Avg.: 1.494. St.D.: 0.269
0.00
3.00
6.00
9.00
0 100 200 300 400
Test
/Pre
dict
ed
Test number
ACI 318-08 Stud Shear Strength (5% Frac. Concrete Formula, φ Factor)
All Tests
0.00
1.00
2.00
3.00
4.00
0 100 200 300 400
Test
/Pre
dict
ed
Test number
PCI 6th Stud Shear Strength (5% Frac. Concrete Formula, φ Factor)
All Tests
e. 391 tests. Avg.: 2.753. St.D.: 1.458 f. 391 tests. Avg.: 2.135. St.D.: 0.382
Figure 2. Assessment of anchor strength using the minimum of steel and concrete failure formulas in ACI 318-08 (2008) Appendix D and PCI 6th (2004).
Table 4. Test-to-predicted ratios for steel failure in tests using the minimum strength provided by the Standards.
Without Resistance Factor With Resistance Factor Shear Forces
202 Tests AISC ACI 318-08 PCI 6th AISC ACI 318-08 PCI 6th
Average 0.986 1.150/1.344a 1.051/1.498 a 0.986 1.974 2.142 0.560/0.815 a 0.183/0.311 a Stand. Dev. 0.158 0.158 1.141 0.441
a γ1/γ2: γ1: uses the average value; γ2: uses the 5% fractile formula.
The strength prediction ( ) for steel failure (202 tests) may be seen in Fig. 3. This formula becomes more conservative when the nominal values of the steel strength are used rather than measured values.
us FA
10
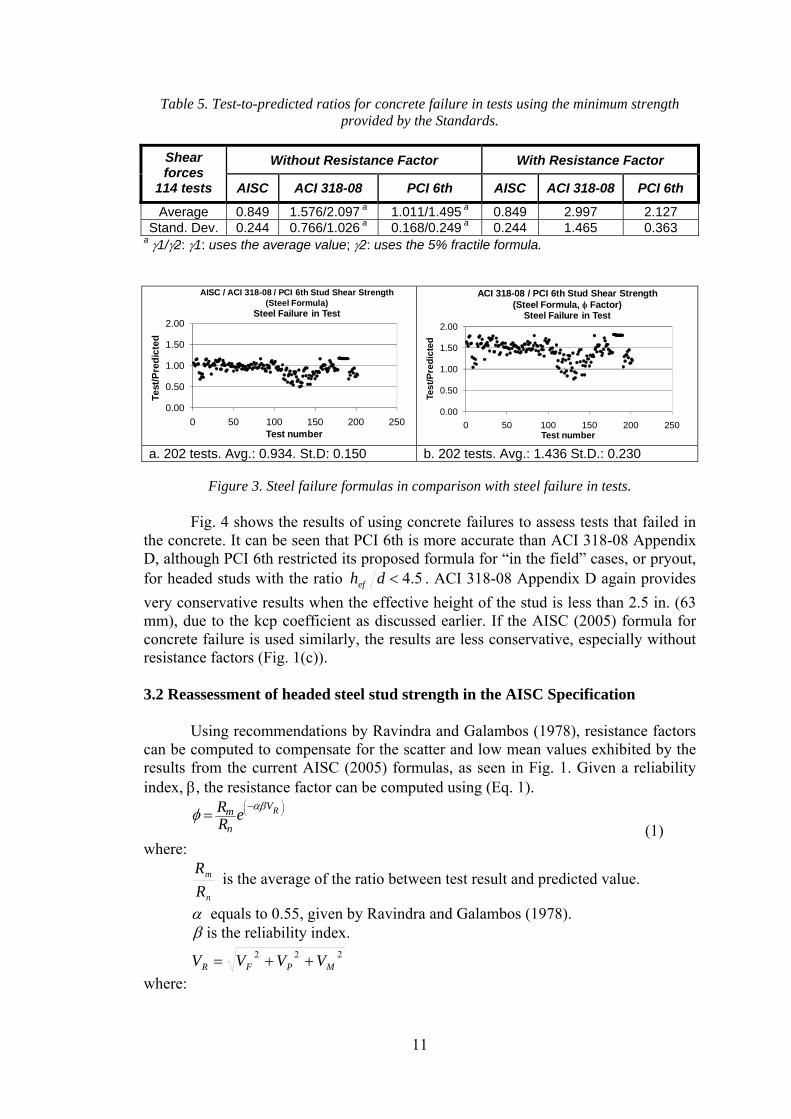
Table 5. Test-to-predicted ratios for concrete failure in tests using the minimum strength provided by the Standards.
Without Resistance Factor With Resistance Factor Shear forces
114 tests AISC ACI 318-08 PCI 6th AISC ACI 318-08 PCI 6th
Average 0.849 1.576/2.097 a 1.011/1.495 a 0.849 2.997 2.127 0.766/1.026 a 0.168/0.249 a Stand. Dev. 0.244 0.244 1.465 0.363
a γ1/γ2: γ1: uses the average value; γ2: uses the 5% fractile formula.
0.00
0.50
1.00
1.50
2.00
0 50 100 150 200 250
Test
/Pre
dict
ed
Test number
AISC / ACI 318-08 / PCI 6th Stud Shear Strength (Steel Formula)
Steel Failure in Test
º
0.00
0.50
1.00
1.50
2.00
0 50 100 150 200 250Te
st/P
redi
cted
Test number
ACI 318-08 / PCI 6th Stud Shear Strength (Steel Formula, φ Factor)
Steel Failure in Test
º
a. 202 tests. Avg.: 0.934. St.D: 0.150 b. 202 tests. Avg.: 1.436 St.D.: 0.230
Figure 3. Steel failure formulas in comparison with steel failure in tests.
Fig. 4 shows the results of using concrete failures to assess tests that failed in
the concrete. It can be seen that PCI 6th is more accurate than ACI 318-08 Appendix D, although PCI 6th restricted its proposed formula for “in the field” cases, or pryout, for headed studs with the ratio 5.4<dhef . ACI 318-08 Appendix D again provides very conservative results when the effective height of the stud is less than 2.5 in. (63 mm), due to the kcp coefficient as discussed earlier. If the AISC (2005) formula for concrete failure is used similarly, the results are less conservative, especially without resistance factors (Fig. 1(c)).
3.2 Reassessment of headed steel stud strength in the AISC Specification
Using recommendations by Ravindra and Galambos (1978), resistance factors can be computed to compensate for the scatter and low mean values exhibited by the results from the current AISC (2005) formulas, as seen in Fig. 1. Given a reliability index, β, the resistance factor can be computed using (Eq. 1).
RVmn
R eRαβφ
⎛ ⎞⎜ ⎟⎝ ⎠−
= (1)
where:
n
m
RR
is the average of the ratio between test result and predicted value.
α equals to 0.55, given by Ravindra and Galambos (1978). β is the reliability index.
222MPFR VVVV ++=
where:
11

FV is the coefficient of variation on fabrication and is taken as zero since variation is embedded in the test results because tests from numerous experimentalists have been used in this work;
n
m
RR
is the coefficient of variation of ; PV
MV is the coefficient of the variation of the materials and is take as cero since the variation is embedded in tests results, for which the measured material properties were reported for the vast majority of the tests.
Ravindra and Galambos (1978) recommend a reliability index β of 3 for members and 4.5 for connections. In this work, a reliability index of 4 has been targeted to compute the resistance factors.
0.00
3.00
6.00
9.00
0 50 100 15
Test
/Pre
dict
ed
Test number
ACI 318-08 Stud Shear Strength (Avg. Concrete Formula)Concrete Failure in Test
0 0.00
1.00
2.00
3.00
4.00
0 50 100 150
Test
/Pre
dict
ed
Test number
PCI 6th Stud Shear Strength (Avg. Concrete Formula)Concrete Failure in Test
a. 114 tests. Avg.: 1.572. St.D.: 0.770 b. 114 tests. Avg.: 1.006. St.D.: 0.173
0.00
3.00
6.00
9.00
0 50 100 1
Test
/Pre
dict
ed
Test number
ACI 318-08 Stud Shear Strength (5% Frac. Concrete Formula)
Concrete Failure in Test
500.00
1.00
2.00
3.00
4.00
0 50 100 150
Test
/Pre
dict
ed
Test number
PCI 6th Stud Shear Strength (5% Frac. Concrete Formula)
Concrete Failure in Test
c. 114 tests. Avg.: 2.097. St.D.: 1.026 d. 114 tests. Avg.: 1.488. St.D.: 0.256
0.00
3.00
6.00
9.00
0 50 100 150
Test
/Pre
dict
ed
Test number
ACI 318-08 Stud Shear Strength (5% Frac. Concrete Formula, φ Factor)
Concrete Failure in Test
0.00
1.00
2.00
3.00
4.00
0 50 100 150
Test
/Pre
dict
ed
Test number
PCI 6th Stud Shear Strength (5% Frac. Concrete Formula, φ Factor)
Concrete Failure in Test
e. 114 tests. Avg.: 2.995. St.D.: 1.466 f. 114 tests. Avg.: 2.126. St.D.: 0.366
Figure 4. Concrete failure formulas in comparison with concrete failure in tests. Resistance factors for steel strength prediction using only tests that failed in
the steel are computed for values of the Cv coefficient equal to 1.00, 0.75 and 0.65 (Table 6). Values of the resistance factor for a β value of both 3 and 4 are presented. Equation 2 presents a sample calculation for Cv = 1.00 and β = 4.
12
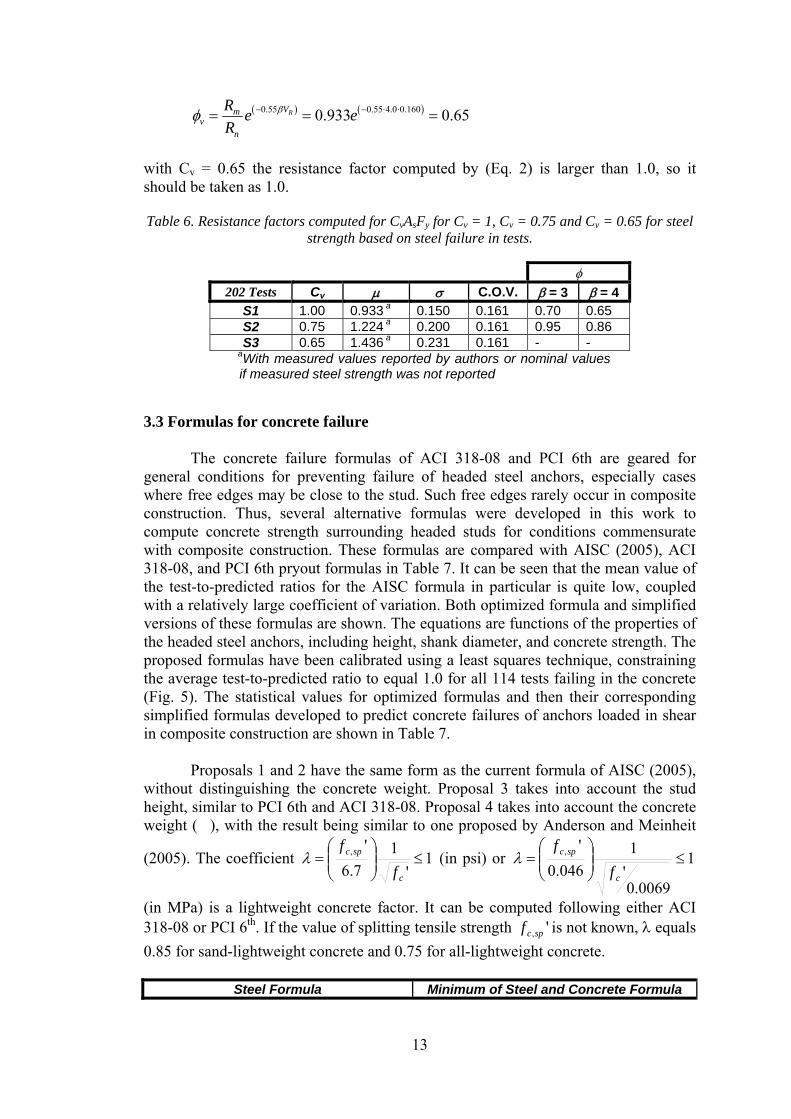
( ) ( )0.55 0.55·4.0·0.1600.933 0.65RVmv
n
R e eR
βφ − −= = =
stance factor computed by (Eq. 2) is larger than 1.0, so it should be taken as 1.0.
Table 6. Resistance factors 75 and Cv = 0.65 for steel strength based on steel failure in tests.
φ
with Cv = 0.65 the resi
computed for CvAsFy for Cv = 1, Cv = 0.
20 s 2 Test C.O.V.Cv μ σ β = 3 β = 41.00 0.933 a 0.150 0.161 0.70 0.65 S1 0.75 1.224 a 0.200 0.161 0.95 86 0.S2
S3 0.65 1.436 a 0.231 0.161 - - aWith measured values reported by authors or nominal values if measured steel strength was not reported
3.3 Formulas for concrete failure
ailures of anchors loaded in shear in com n in Table 7.
weight (�), with the result being sim
(2005). The coefficient
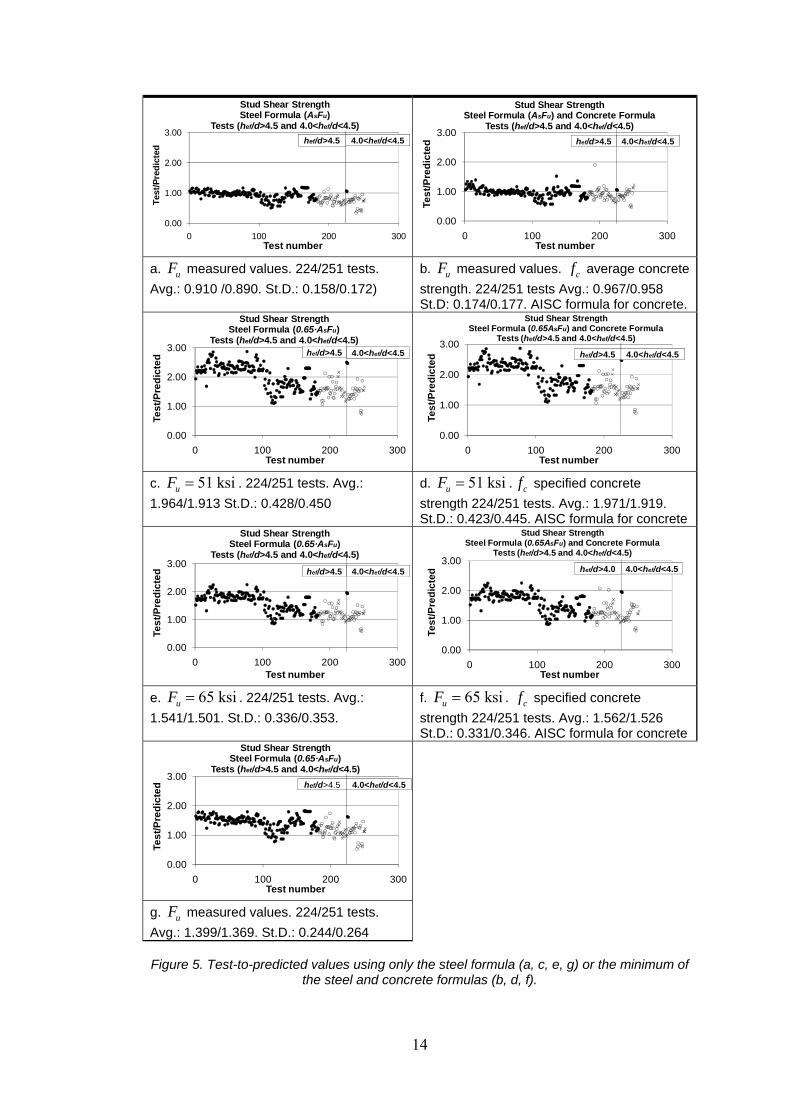
The concrete failure formulas of ACI 318-08 and PCI 6th are geared for general conditions for preventing failure of headed steel anchors, especially cases where free edges may be close to the stud. Such free edges rarely occur in composite construction. Thus, several alternative formulas were developed in this work to compute concrete strength surrounding headed studs for conditions commensurate with composite construction. These formulas are compared with AISC (2005), ACI 318-08, and PCI 6th pryout formulas in Table 7. It can be seen that the mean value of the test-to-predicted ratios for the AISC formula in particular is quite low, coupled with a relatively large coefficient of variation. Both optimized formula and simplified versions of these formulas are shown. The equations are functions of the properties of the headed steel anchors, including height, shank diameter, and concrete strength. The proposed formulas have been calibrated using a least squares technique, constraining the average test-to-predicted ratio to equal 1.0 for all 114 tests failing in the concrete (Fig. 5). The statistical values for optimized formulas and then their corresponding simplified formulas developed to predict concrete f
posite construction are show Proposals 1 and 2 have the same form as the current formula of AISC (2005),
without distinguishing the concrete weight. Proposal 3 takes into account the stud height, similar to PCI 6th and ACI 318-08. Proposal 4 takes into account the concrete
ilar to one proposed by Anderson and Meinheit
1'
17.6
', ≤⎟⎟⎠
⎞⎜⎜⎝
⎛= spc
f
fλ (in psi) or
c
1'1
046.0', ≤⎟⎟⎠
⎞⎜⎜⎝
⎛= spc
f
fλ
utedwn, λ equals
0.85 for sand-lightweight concrete and 0.75 for all-lightweight concrete.
Steel Formula Minimum of Steel and Concrete Formula
0069.0c
(in MPa) is a lightweight concrete factor. It can be comp following either ACI 318-08 or PCI 6th. If the value of splitting tensile strength ',spcf is not kno
13
0.00
1.00
2.00
3.00
0 100 200 300
Test
/Pre
dict
ed
Test number
Stud Shear StrengthSteel Formula (AsFu)
Tests (hef/d>4.5 and 4.0<hef/d<4.5)hef/d>4.5 4.0<hef/d<4.5
0.00
1.00
2.00
3.00
0 100 200 300
Test
/Pre
dict
ed
Test number
Stud Shear StrengthSteel Formula (AsFu) and Concrete Formula
Tests (hef/d>4.5 and 4.0<hef/d<4.5)hef/d>4.5 4.0<hef/d<4.5
a. measured values. 224/251 tests. Avg.: 0.910 /0.890. St.D.: 0.158/0.172)
uF b. measured values. uF cf average concrete strength. 224/251 tests Avg.: 0.967/0.958 St.D: 0.174/0.177. AISC formula for concrete.
0.00
1.00
2.00
3.00
0 100 200 300
Test
/Pre
dict
ed
Test number
Stud Shear StrengthSteel Formula (0.65·AsFu)
Tests (hef/d>4.5 and 4.0<hef/d<4.5)hef/d>4.5 4.0<hef/d<4.5
0.00
1.00
2.00
3.00
0 100 200 300
Test
/Pre
dict
ed
Test number
Stud Shear StrengthSteel Formula (0.65AsFu) and Concrete Formula
Tests (hef/d>4.5 and 4.0<hef/d<4.5)
hef/d>4.5 4.0<hef/d<4.5
c. . 224/251 tests. Avg.: 1.964/1.913 St.D.: 0.428/0.450
51 ksiuF = 51 ksiuF = cfd. . specified concrete strength 224/251 tests. Avg.: 1.971/1.919. St.D.: 0.423/0.445. AISC formula for concrete
0.00
1.00
2.00
3.00
0 100 200 300
Test
/Pre
dict
ed
Test number
Stud Shear StrengthSteel Formula (0.65·AsFu)
Tests (hef/d>4.5 and 4.0<hef/d<4.5)
hef/d>4.5 4.0<hef/d<4.5
0.00
1.00
2.00
3.00
0 100 200 300
Test
/Pre
dict
ed
Test number
Stud Shear StrengthSteel Formula (0.65AsFu) and Concrete Formula
Tests (hef/d>4.5 and 4.0<hef/d<4.5)
hef/d>4.0 4.0<hef/d<4.5
e. . 224/251 tests. Avg.: 1.541/1.501. St.D.: 0.336/0.353.
65 ksiuF = 65 ksiuF = cff. . specified concrete strength 224/251 tests. Avg.: 1.562/1.526 St.D.: 0.331/0.346. AISC formula for concrete
0.00
1.00
2.00
3.00
0 100 200 300
Test
/Pre
dict
ed
Test number
Stud Shear StrengthSteel Formula (0.65·AsFu)
Tests (hef/d>4.5 and 4.0<hef/d<4.5)hef/d>4.5 4.0<hef/d<4.5
g. measured values. 224/251 tests. Avg.: 1.399/1.369. St.D.: 0.244/0.264
uF
Figure 5. Test-to-predicted values using only the steel formula (a, c, e, g) or the minimum of
the steel and concrete formulas (b, d, f).
14
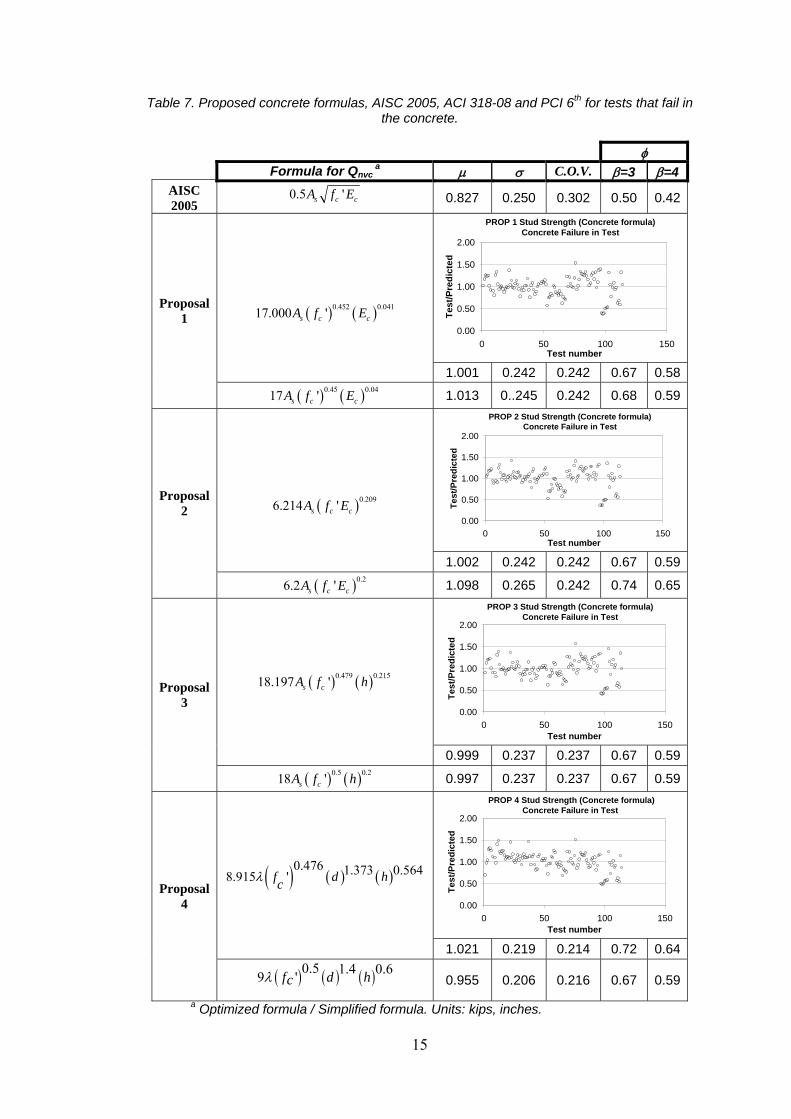
Table 7. Proposed concrete formulas, AISC 2005, ACI 318-08 and PCI 6th for tests that fail in the concrete.
φ
Formula for Qnvc a C.O.V. μ σ β=3 β=4
AISC 2005
0.5 's c cA f E 0.827 0.250 0.302 0.50 0.42
PROP 1 Stud Strength (Concrete formula)Concrete Failure in Test
0.00
0.50
1.00
1.50
2.00
0 50 100Test number
Test
/Pre
dict
ed
150
Proposal 1 ( ) ( )0.452 0.04117.000 's c cA f E
1.001 0.242 0.242 0.67 0.58
( ) ( )0.45 0.0417 's c cA f E 1.013 0..245 0.242 0.68 0.59PROP 2 Stud Strength (Concrete formula)
Concrete Failure in Test
0.00
0.50
1.00
1.50
2.00
0 50 100 150Test number
Test
/Pre
dict
ed
Proposal 2 ( )0.2096.214 's c cA f E
1.002 0.242 0.242 0.67 0.59
( )0.26.2 's c cA f E 1.098 0.265 0.242 0.74 0.65PROP 3 Stud Strength (Concrete formula)
Concrete Failure in Test
0.00
0.50
1.00
1.50
2.00
0 50 100 150Test number
Test
/Pre
dict
ed
( ) ( )0.479 0.21518.197 's cA f h Proposal 3
0.999 0.237 0.237 0.67 0.59
( ) ( )0.5 0.218 's cA f h 0.997 0.237 0.237 0.67 0.59 PROP 4 Stud Strength (Concrete formula)
Concrete Failure in Test
0.00
0.50
1.00
1.50
2.00
0 50 100 150Test number
Test
/Pre
dict
ed
( ) ( ) ( )0.476 1.373 0.5648.915 'f d hcλ
Proposal 4
1.021 0.219 0.214 0.72 0.64
( ) ( ) ( )0.5 1.4 0.69 'f d hcλ 0.955 0.206 0.216 0.67 0.59
a Optimized formula / Simplified formula. Units: kips, inches.
15
Table 7 shows resistance factors (φ) for reliability indices of 3 and 4 for the
tests that failed by the concrete. It can be seen that all four proposals result in similar resistance factors, equaling approximately 0.60 for a reliability index of 4 and 0.70 for reliability index of 3.
3.4. Headed steel stud shear strength for / 4.efh d > 5
From the earliest tests carried out by Viest (1955), it has been seen that dhef is a significant parameter that often delineates the type of failure that occurs in
tests that do not have free edge conditions. In the tests by Viest (1955), for example, the failure normally occurred in the steel stud when dhef was larger than 4.53. Driscoll and Slutter (1961) observed that if dh was greater than 4.2, they could develop all the strength in tension (i.e., AsFu) rather than shear, and the tensile strength then determined the ultimate strength of the studs in their push-out tests. It was further noted that for studs shorter than 2.4=dh , the strength must be reduced because of the possibility of the ultimate strength being reduced by fracture of the concrete. Ollgaard et al. (1971) tested studs with an effective embedment depth of 3.50 and 4.20. They indicated that in many tests both steel and concrete failures were observed in the same specimen.
A summary of failures found in the tests in the database classified as having
studs that are greater than or less than a given dhef ratio (including ratios of 4.00, 4.50, 5.50, and 6.50) is given in Table 8. AISC (2005) states that headed steel studs shall not be less than four stud diameters in length after installation. Recognizing the
limitation in AISC (2005) and assuming that h is a few percent larger than hef to account for the depth of the stud head, it can be reasoned that for a headed stud whose
value is right at the limit, approximately 73% of the failures are likely to occur in the steel. In contrast, 81% of the tests having a ratio
/h d
/h ddhef larger than 4.50 failed
in the steel, and 91% failed in the steel for dhef larger than 5.50. Based on these results, if the minimum dh ratio limit of 4 in AISC (2005) is
recommended for increase to 5 (i.e., dhef equaling 4.5 for a 3/4 in. (19 mm) diameter headed stud having a 3/8 in. (9.5 mm) depth of the head), 81% of the 224 tests with ratios larger than this limit failed in the steel. In order to predict the failure of the remaining 19% of the tests that failed in the concrete, one of the proposed formulas in the prior section could be used, taking the minimum value of steel and concrete failures. However, as discussed below, checking the steel formula alone may be adequate for this minimum ratio of dhef .
16
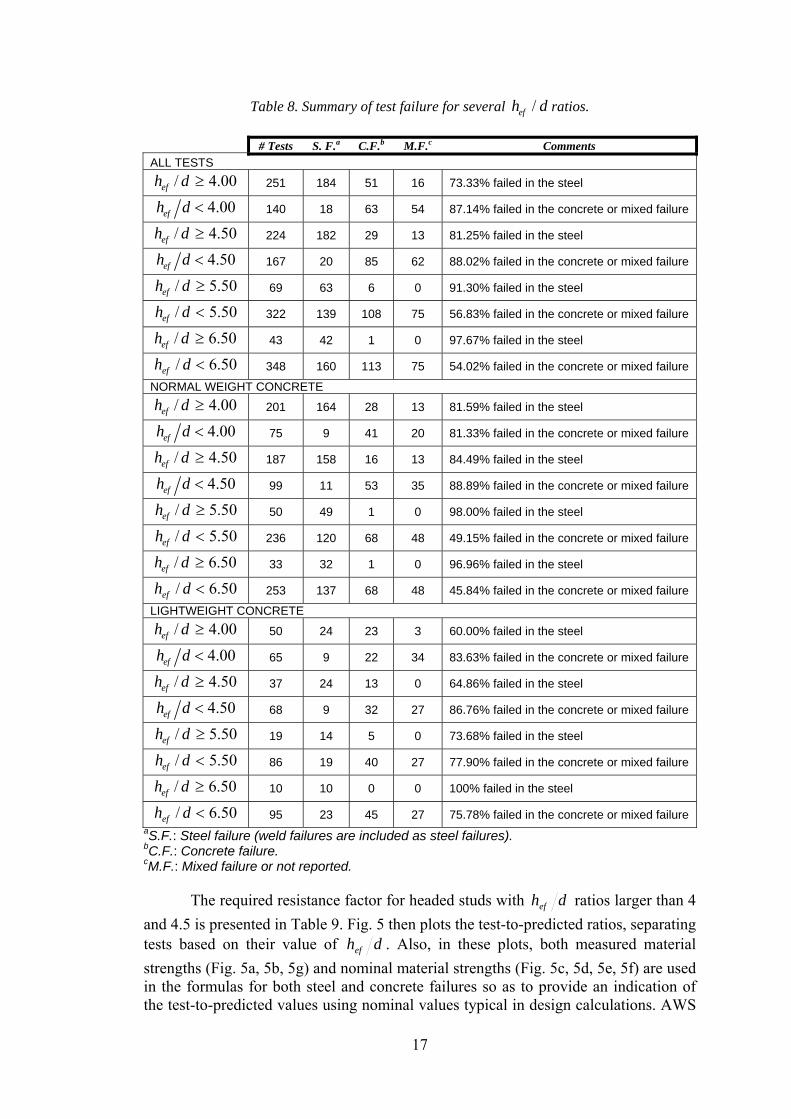
Table 8. Summary of test failure for several ratios. /efh d
S. F.a C.F.b M.F.c Comments # Tests ALL TESTS
00.4/ ≥dhef 251 184 51 16 73.33% failed in the steel
4.00efh d < 140 18 63 54 87.14% failed in the concrete or mixed failure
50.4/ ≥dhef 224 182 29 13 81.25% failed in the steel
4.50efh d < 167 20 85 62 88.02% failed in the concrete or mixed failure
50.5/ ≥dhef 69 63 6 0 91.30% failed in the steel
50.5/ <dhef 322 139 108 75 56.83% failed in the concrete or mixed failure
50.6/ ≥dhef 43 42 1 0 97.67% failed in the steel
50.6/ <dhef 348 160 113 75 54.02% failed in the concrete or mixed failure
NORMAL WEIGHT CONCRETE 00.4/ ≥dhef 201 164 28 13 81.59% failed in the steel
4.00efh d < 75 9 41 20 81.33% failed in the concrete or mixed failure
50.4/ ≥dhef 187 158 16 13 84.49% failed in the steel
4.50efh d < 99 11 53 35 88.89% failed in the concrete or mixed failure
50.5/ ≥dhef 50 49 1 0 98.00% failed in the steel
50.5/ <dhef 236 120 68 48 49.15% failed in the concrete or mixed failure
50.6/ ≥dhef 33 32 1 0 96.96% failed in the steel
50.6/ <dhef 253 137 68 48 45.84% failed in the concrete or mixed failure
LIGHTWEIGHT CONCRETE 00.4/ ≥dhef 50 24 23 3 60.00% failed in the steel
4.00efh d < 65 9 22 34 83.63% failed in the concrete or mixed failure
50.4/ ≥dhef 37 24 13 0 64.86% failed in the steel
4.50efh d < 68 9 32 27 86.76% failed in the concrete or mixed failure
50.5/ ≥dhef 19 14 5 0 73.68% failed in the steel
50.5/ <dhef 86 19 40 27 77.90% failed in the concrete or mixed failure
50.6/ ≥dhef 10 10 0 0 100% failed in the steel
50.6/ <dhef 95 23 45 27 75.78% failed in the concrete or mixed failure aS.F.: Steel failure (weld failures are included as steel failures). bC.F.: Concrete failure. cM.F.: Mixed failure or not reported.
dhefThe required resistance factor for headed studs with ratios larger than 4 and 4.5 is presented in Table 9. Fig. 5 then plots the test-to-predicted ratios, separating tests based on their value of dhef . Also, in these plots, both measured material strengths (Fig. 5a, 5b, 5g) and nominal material strengths (Fig. 5c, 5d, 5e, 5f) are used in the formulas for both steel and concrete failures so as to provide an indication of the test-to-predicted values using nominal values typical in design calculations. AWS
17
D1.1/D1.1:2006 Structural Welding Code-Steel (AWS, 2006) specifies two types of headed studs, type A and type B, for use in composite systems depending on their function within the structure. The main difference between them is the ultimate tensile strength of the headed stud. Type A [Fu = 61 ksi (420 MPa)] are general purpose headed studs of any type and size used for purposes other than shear transfer in composite beam design and construction. Type B [Fu = 65 ksi (450 MPa)] are studs that are headed, bent, or of other configuration, with diameter of 3/8 in. (9.5 mm), 1/2 in. (12.5 mm), 5/8 in. (16 mm), 3/4 in. (19 mm), 7/8 in. (22 mm) or 1 in. (25 mm), and that are used commonly in composite beam design and construction. The AISC (2005) commentary provides steel anchor material specifications that include nominal yield and tensile strengths of typical ASTM A108 (1999) Type B studs as 51 ksi (350 MPa) and 65 ksi (450 MPa), respectively (AWS 2004).
Table 9. Resistance factors for tests with hef/d ratios larger than 4.5 and 4.0.
224 Tests, / 4.efh d > 5 0φ Factor 251 Tests, / 4.efh d > φ Factor
Cv C.O.V. Cv C.O.V. μ σ β=3 μ σ β=3 β=4 β=4 1.00 0.910 0.158 0.174 0.68 0.62 1.00 0.890 0.172 0.193 0.64 0.58 Opt
1 0.75 1.213 0.211 0.174 0.91 0.83 0.75 1.186 0.229 0.193 0.86 0.77 Opt
2 0.65 1.399 0.244 0.174 - 0.95 0.65 1.369 0.264 0.193 0.99 0.89 Opt
3 ACI 301-08 (2008) provides formulas for the average measured concrete
( ' ) strength given the specified concrete strength ( ); for example, (in psi), for a specified concrete strength between 3000 and 5000 psi.
In Fig. 5, the stud strength has then been computed using the specified concrete strength derived from the average measured concrete strength reported in the test. An important conclusion from this figure is that if
crf 'cf1200'' += ccr ff
dhef is restricted to being larger than 4.5 (or, comparably, dh is restricted to being larger than 5), using the steel formula alone is adequate to safely predict the shear strengths of the studs. Even those tests that fail in the concrete are generally seen to have test-to-predicted ratios larger than one, with little difference than in the case where both the steel and concrete formulas are checked, and the minimum used (as seen in Fig. 5(d) and 5(f)). In Fig. 5(c) and 5(e), using only the steel formula with nominal strength values results in test-to-predicted ratios of 1.964 for studs with Fu of 51 ksi (350 MPa) and 1.541 for studs with Fu of 65 ksi (450 MPa), based on using 0.65AsFu as the design strength of the headed stud failing in shear.
Fig. 6 plots the test-to-predicted ratios for all tests using the minimum of the
steel strength (0.65AsFu) and concrete strength formulas for several different concrete strength formulas. The figure compares steel ( ) and concrete ( ) formula predictions, distinguishing type of failure in the top of each figure (C.F means concrete failure, M.F means mixed failure, and no mark means steel failure). It may be seen that the concrete formula always controls the strength prediction for
5.4<dhef , which is commensurate with the type of failure (concrete failure or mixed failure) found in most of those tests. In contrast, the concrete formulas of Proposals 1 through 3 (Figs. 6(a), 6(b), 6(c)) incorrectly control for 5.4>dhef , even
18
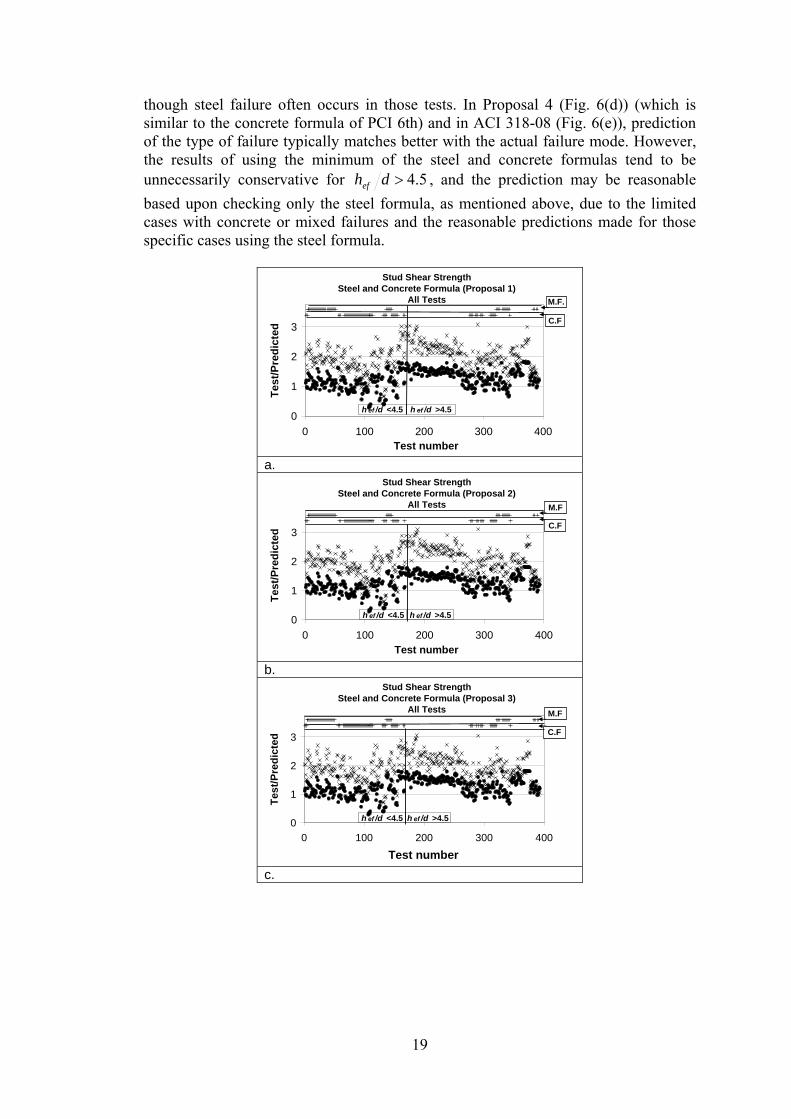
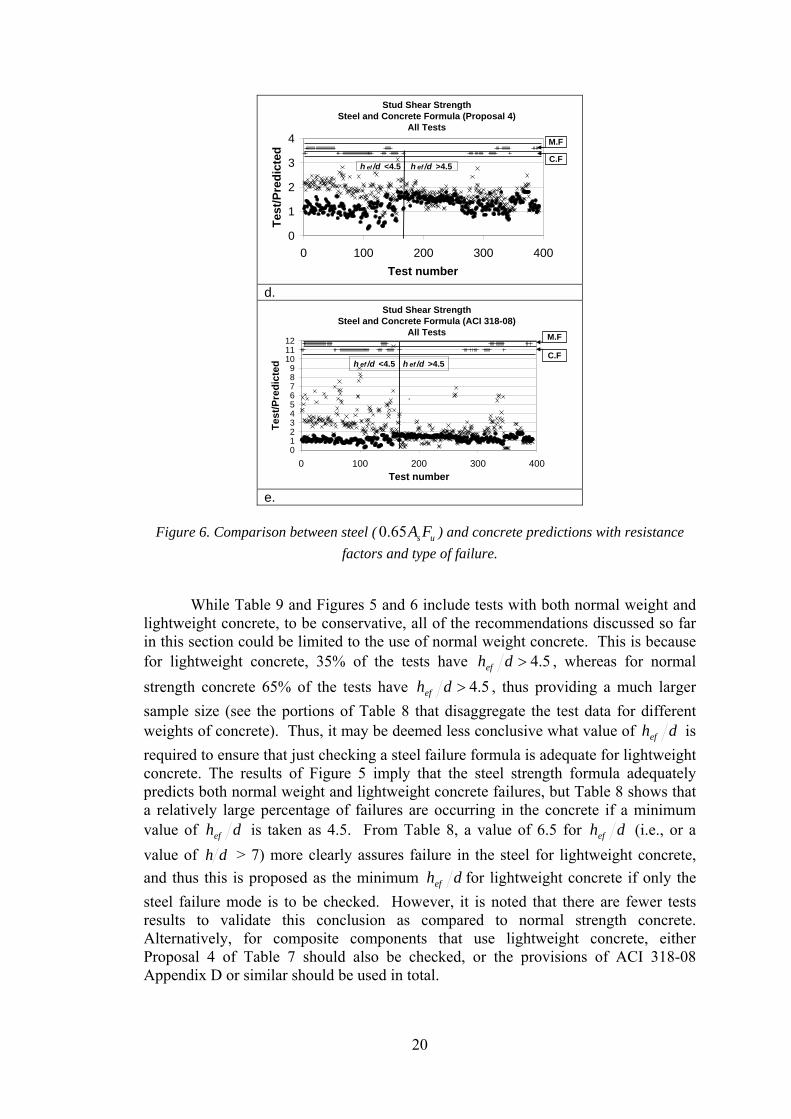
though steel failure often occurs in those tests. In Proposal 4 (Fig. 6(d)) (which is similar to the concrete formula of PCI 6th) and in ACI 318-08 (Fig. 6(e)), prediction of the type of failure typically matches better with the actual failure mode. However, the results of using the minimum of the steel and concrete formulas tend to be unnecessarily conservative for 5.4>dhef , and the prediction may be reasonable based upon checking only the steel formula, as mentioned above, due to the limited cases with concrete or mixed failures and the reasonable predictions made for those specific cases using the steel formula.
Stud Shear Strength
Steel and Concrete Formula (Proposal 1)All Tests
0
1
2
3
0 100 200 300 400Test number
Test
/Pre
dict
ed
º
h ef /d <4.5 h ef /d >4.5
C.F
M.F.
a.
Stud Shear StrengthSteel and Concrete Formula (Proposal 2)
All Tests
0
1
2
3
0 100 200 300 400Test number
Test
/Pre
dict
ed
º
h ef /d <4.5 h ef /d >4.5
C.F
M.F
b.
Stud Shear StrengthSteel and Concrete Formula (Proposal 3)
All Tests
0
1
2
3
0 100 200 300 400
Test number
Test
/Pre
dict
ed
º
h ef /d <4.5 h ef /d >4.5
C.F
M.F
c.
19
Stud Shear StrengthSteel and Concrete Formula (Proposal 4)
All Tests
0
1
2
3
4
0 100 200 300 400Test number
Test
/Pre
dict
ed
º
h ef /d <4.5 h ef /d >4.5C.F
M.F
d.
Stud Shear StrengthSteel and Concrete Formula (ACI 318-08)
All Tests
0123456789
101112
0 100 200 300 400Test number
Test
/Pre
dict
ed
º
h ef /d <4.5 h ef /d >4.5C.F
M.F
e.
s uA FFigure 6. Comparison between steel ( 0.65 ) and concrete predictions with resistance factors and type of failure.
While Table 9 and Figures 5 and 6 include tests with both normal weight and
lightweight concrete, to be conservative, all of the recommendations discussed so far in this section could be limited to the use of normal weight concrete. This is because for lightweight concrete, 35% of the tests have 5.4>dhef , whereas for normal strength concrete 65% of the tests have 5.4>dhef , thus providing a much larger sample size (see the portions of Table 8 that disaggregate the test data for different weights of concrete). Thus, it may be deemed less conclusive what value of dhef is required to ensure that just checking a steel failure formula is adequate for lightweight concrete. The results of Figure 5 imply that the steel strength formula adequately predicts both normal weight and lightweight concrete failures, but Table 8 shows that a relatively large percentage of failures are occurring in the concrete if a minimum value of dhef dhef is taken as 4.5. From Table 8, a value of 6.5 for (i.e., or a value of dh > 7) more clearly assures failure in the steel for lightweight concrete, and thus this is proposed as the minimum dhef for lightweight concrete if only the steel failure mode is to be checked. However, it is noted that there are fewer tests results to validate this conclusion as compared to normal strength concrete. Alternatively, for composite components that use lightweight concrete, either Proposal 4 of Table 7 should also be checked, or the provisions of ACI 318-08 Appendix D or similar should be used in total.
20
CHAPTER 4
SEISMIC BEHAVIOR OF STEEL ANCHORS IN SHEAR Results from the literature generally show that push–out specimens having
headed steel stud anchors subjected to cyclic shear force exhibited lower strength and ductility than corresponding monotonic push specimens. A number of experiments on headed steel anchors subjected to cyclic loading have been conducted to study the behavior of steel frames with reinforced concrete infills. For example, Makino (1984) conducted experiments were performed on single story, single bay steel frames with reinforced concrete infills at approximately a one-third scale. They estimated that the cyclic strength of the studs was approximately 50% of the predicted strength from the formulas of Ollgaard et al. (1971) .Civjan an Singh (2003) conducted 7 cyclic tests and concluded that reversed cyclic loading resulted in nearly a 40% reduction in the stud shear strength compared to monotonic strengths computed by AISC 2005, attributing this reduction to low-cycle fatigue of the stud and weld materials as well as concrete degradation. Gattesco and Giuriani (1996) tested 2 specimens under cyclic loading and concluded that the accumulated damage during cycles reduced the measured monotonic strength by almost 10%. Saari et al. (2004) carried out 8 tests under different combinations of shear and tension loads and both monotonic and cyclic loads with different amounts of confining reinforcement around the anchors within a specimen modeling an infill wall. From their tests they determined that when good detailing is provided surrounding the studs in the specimen, the cyclic failure always occurred in the steel. Also, under shear forces, a 21% reduction in measured monotonic stud shear strength was found.
These reduction factors for cyclic loading (ξ) for conditions representing either
infill wall specimens or composite slabs without metal decking are summarized in the Table 10, along with the values assumed in several design provisions. While there is variation in the recommendations (for example, ACI 318-08 does not require a reduction for cyclic loading on the shear strength of steel anchors), it may generally be concluded that the 25% reduction in monotonic shear strength to account for cyclic loading is reasonable so long as the monotonic shear strength is predicted within reasonable statistical accuracy. For example, a reduction factor of 0.75 is appropriate when used in conjunction with a Cv coefficient or resistance factor of 0.65 applied to the nominal shear strength AsFu of a headed stud anchor with dhef ratios larger than 4.5.
Table 10. Cyclic shear strength of headed studs.
CODE REFERENCE ξ ξ AISC 341-05 0.75 Makino (1985) 0.50
ACI 318-08b 0.60 a, b 0.75 Civjan and Singh (2003) 0.90 a Gattesco and Giuriani (1996) NEHRP (2003) 0.75 0.79 a Saari et al. (2004)
a Failure of the steel. b Failure of the concrete.
21
CHAPTER 5
CONCLUSIONS In this work, limit state formulas for headed stud anchors in shear specifically
in composite construction have been assessed versus 391 monotonic and cyclic experiments from the literature within the context of the AISC Specification (AISC, 2005a, 2005b), and comparisons have been made to the provisions in the ACI 318-08 Building Code (ACI, 2008) and the PCI Handbook, 6th Edition (PCI, 2004). New formulas are proposed to predict concrete failure and existing formulas for steel failure are evaluated based upon the comprehensive experimental data set. The experimental results are disaggregated to highlight tests that failed in the steel shank or weld, tests that failed in the concrete, or tests that are identified as having mixed failure. The scope of this research includes composite beam-columns [typically concrete-encased steel shapes (SRC) or concrete-filled steel tubes (CFT)], concrete-encased and concrete-filled beams, boundary elements of composite wall systems, composite connections, composite column base conditions, and related forms of composite construction; composite beams consisting of steel girders with composite lightweight concrete slab (with decking) are out of the scope of this work. Several conclusions can be drawn from this work:
• The AISC (2005) formula for predicting the steel failure mode in headed
stud anchors (AsFu) is accurate for steel failures in anchors only if a resistance factor is included to ensure an acceptable level of reliability, comparable to what is used in PCI 6th and ACI 318-08. A resistance factor of 0.65 provides a reliability index β of approximately 4. Alternatively, a resistance factor of 1.0 may be used if a reduction factor such as 0.65 is applied to AsFu.
• The most likely concrete failure mode in composite construction is pryout failure, rather than breakout failure (with these failure modes being as described in ACI 318-08) since there are not appropriate failure planes for front-edge or side-edge breakout in majority of composite structures.
• PCI 6th and ACI 318-08 provide more conservative prediction for concrete
failures than AISC 2005, with PCI 6th being the most accurate. AISC 2005 is generally unconservative when anchors fail in the concrete.
• A selection of formulas to estimate pryout concrete failures are proposed as
an alternative to the current prediction of concrete failure in AISC 2005. The choice of formula is dependent on which types of parameters are deemed appropriate to govern the concrete failure strength.
• After assessing the literature regarding headed studs subjected to shear, it
was deemed that the steel strength formula with a resistance factor equal to 0.65, is the only formula that needs to be checked for headed stud anchors that do not have edge conditions if normal strength concrete is used and if the effective height-to-depth ratio
us FA
dhef is larger than 4.5 (where hef is measured to the underside of the stud head; a comparable minimum value
22
of dh is 5, where h is the total height of the stud). For the few experiments in this category that fail in the concrete, the steel strength formula proved to be conservative. For composite components with lightweight concrete, a larger minimum value of the anchor height is recommended because there is less data available for these longer lengths, and what data is available shows that the failure tends to occur more in the concrete than for normal strength concrete if dhef is just above 4.5. Based on the limited data available to date, a value of dhef > 6.5 (or a comparable value of dh > 7) more clearly assures that failure will occur in the steel, and thus this value is recommended for lightweight concrete if only a steel strength formula is to be checked. Additional test results could validate using a lower value of this minimum ratio in future research.
• A reduction factor of 0.75 is adequate to design headed stud anchors in shear subjected to seismic loads, so long as the monotonic steel strength of headed studs has a resistance factor on that is in the range of the values proposed in this work
us FA
23
REFERENCES
[1] American Concrete Institute Committee 318 (ACI) (2008). Building Code
Requirements for Structural Concrete (ACI 318-08) and Commentary (ACI 318R-08), American Concrete Institute, Farmington Hills, Michigan.
[2] American Concrete Institute Committee 301 (ACI 301-08) (2008). Specifications for Structural Concrete, American Concrete Institute, Farmington Hills, Michigan.
[3] American Institute for Steel Construction (AISC) (1961). Specification for the Design, Fabrication and Erection of Structural Steel Buildings, American Institute for Steel Construction, New York, New York.
[4] American Institute for Steel Construction (AISC) (1978). Specification for the Design, Fabrication and Erection of Structural Steel Buildings, American Institute for Steel Construction, Chicago, Illinois.
[5] American Institute for Steel Construction (AISC) (1993). Load and Resistance Factor Design Specification for Structural Steel Buildings, American Institute for Steel Construction, Chicago, Illinois.
[6] American Institute for Steel Construction (AISC) (2005a). Specification for Structural Steel Buildings, ANSI/AISC 360-05, American Institute for Steel Construction,Chicago, Illinois.
[7] American Institute for Steel Construction (AISC) (2005b). Seismic Provisions for Structural Steel Buildings, ANSI/AISC 341-05, American Institute for Steel Construction, Chicago, Illinois.
[8] American Welding Society (AWS) (2006). Structural Welding Code, ANSI/D1.1/D1.1:2006, 19th Edition, American Welding Society, Miami, Florida.
[9] An, L. and Cederwall, K. (1996). “Push-out Tests on Studs in High Strength and Normal Strength Concrete,” Journal of Constructional Steel Research, Vol. 36, No. 1, pp. 15-29.
[10] Anderson, N. fS. and Meinheit, D. F. (2000). “Design Criteria for Headed Stud Groups in Shear: Part 1 - Steel Capacity and Back Edge Effects,” PCI Journal, Vol. 45, No. 45, pp. 46-75.
[11] Anderson, N. S. and Meinheit, D. F. (2005). “Pryout Capacity of Cast-in Headed Stud Anchors,” PCI Journal, Vol. 50, No. 2, pp. 90-112.
[12] Anderson, N. S. and Meinheit, D. F. (2007). “A Review of Headed-Stud Design Criteria in the Sixth Edition of the PCI Design Handbook,” PCI Journal, Vol. 1, No. 4, pp. 1-20.
[13] American Society of Testing and Materials (ASTM) (1999). Standard Specification for Steel Bars, Carbon, Cold-Finished, Standard Quality (ASTM A108-99), Volume 04.07, American Society of Testing and Materials, West Conshohocken, Pennsylvania.
[14] Baldwin, Jr., J. W., Henry, J. R., and Sweeney, G. M. (1965). “Study of Composite Bridge Stringers -- Phase II,” Technical Report, Department of Civil Engineering, University of Missouri-Columbia, Columbia, Missouri.
[15] Baldwin, Jr., J. W. (1970). “Composite Bridge Stringers -- Final Report,” Report No. 69-4, Missouri Cooperative Highway Research Program, Missouri State Highway Department and University of Missouri-Columbia, Columbia, Missouri.
24
[16] Bursi, O. S., and Gramola, G. (1999). “Behavior of Headed Stud Shear Connectors under Low-Cycle High Amplitude Displacements,” Material Structures, Vol. 32, pp. 290–297.
[17] Buttry, K. E. (1965). “Behavior of Stud Shear Connectors in Lightweight and Normal-Weight Concrete,” Report 68-6, Missouri Cooperative Highway Research Program, Missouri State Highway Department and University of Missouri-Columbia, Columbia, Missouri.
[18] Chapman, J. C. and Balakrishnan, S. (1964). “Experiments on Composite Beams,” The Structural Engineer, Vol. 42. No 11, pp. 369-383.
[19] Chinn, J. (1965). “Pushout Tests on Lightweight Composite Slabs,” Engineering Journal, AISC, Vol. 2, No. 4, pp. 129-134.
[20] Civjan S. A., Singh P. (2003). “Behavior of Shear Studs Subjected to Fully Reversed Cyclic Loading,” Journal of Structural Engineering, ASCE, Vol. 129, No. 11, pp. 1466–74.
[21] Comité Euro-International Du Béton (CEB) (1997). Design of Fastenings in Concrete: Design Guide, Thomas Telford, Ltd., Lausanne, Switzerland.
[22] Dallam, L. N. (1968). “Push-Out Tests of Stud and Channel Shear Connectors in Normal-Weight and Lightweight Concrete Slabs,” Bulletin Series No. 66, Engineering Experiment Station Bulletin, University of Missouri-Columbia, Columbia, Missouri.
[23] Davies, C. (1967). “Small-Scale Push-Out Tests on Welded Stud Shear Connectors,” Concrete, Vol. 1, No. 9, pp. 311-316.
[24] Driscoll, G. G. and Slutter, R. G. (1961). “Research on Composite Design at Lehigh University,” Proceedings of the National Engineering Conference, American Institute of Steel Construction, Chicago, Illinois, pp. 18-24.
[25] Easterling, W. S., Gibbins, D. R., and Murray, T. M. (1993). “Strength of Shear Studs in Steel Deck on Composite Beams and Joists,” Engineering Journal, AISC, Vol. 30, No. 2, 2nd
Quarter, pp. 44-55.
[26] Easterling, W. S. (2005). “New Shear Stud Provisions for Composite Beam Design,” Proceedings of the 2005 ASCE Structures Congress, April 20-24, 2005, New York, New York, American Society of Civil Engineers, Reston, Virginia.
[27] Fuchs, W., Eligehausen, R. and Breen, J. E. (1995). “Concrete Capacity Design Approach for Fastening to Concrete,” ACI Structural Journal, Vol. 92, No. 1, pp. 73-94.
[28] Gattesco, N., and Giuriani, E. (1996). “Experimental Study on Stud Shear Connectors Subjected to Cyclic Loading,” Journal Constructional Steel Research, Vol. 38. No.1, pp. 1–21.
[29] Goble, G. G. (1968). “Shear Strength of Thin Flange Composite Specimen,” Engineering Journal, AISC, Vol. 5, No. 2, 2nd
Quarter, pp. 62-65.
[30] Hawkins, N. (1987). “Strength in Shear and Tension of Cast-in-Place Anchor Bolts,” Anchorage to Concrete, SP-103, American Concrete Institute, Detroit, Michigan, pp. 233-255.
[31] Hawkins, N. M. (1971). “The Strength of Stud Shear Connectors,” Research Report No. R141, Department of Civil Engineering, University of Sydney, Sydney, Australia, 34 pp.
[32] Hawkins N. M., and Mitchell D. (1984). “Seismic Response of Composite Shear Connections,” Journal of Structural Engineering, ASCE, Vol. 110. No. 9, pp. 1–10.
25
[33] Jayas, B. S., and Hosain, M. U. (1989). “Behavior of Headed Studs in Composite Beams: Full-Size Tests,” Canadian Journal Civil Engineering, Vol. 16. No. 5, pp. 712-724.
[34] Johnson R. P. (2004). “Composite Structures of Steel and Concrete – Beams, Slabs, Columns, and Frames for Buildings,” 3rd ed. Blackwell Scientific Publics, Oxford, United Kingdom.
[35] Klingner, K. E. and Mendonca, J. A. (1982). “Effect of Reinforcing Details on the Shear Resistance of Anchor Bolts Under Reversed Cyclic Loading,” ACI Journal, Vol. 79. No.1, pp. 3-12.
[36] Mainstone R. J. and Menzies J. B. (1967). “Shear Connectors in Steel-Concrete Composite Beams for Bridges,” Concrete, Vol. 1, No. 9, pp. 291-302.
[37] Makino, M. (1984). “Design of Frame Steel Structures with Infill Reinforced Concrete Walls,” Roeder, C.W. editor. Composite and Mixed Construction, ASCE, New York, New York, pp. 279-287.
[38] Menzies, J. B. (1971). “CP 117 and Shear Connectors in Steel-Concrete Composite Beams Made With Normal-Density or Lightweight Concrete,” The Structural Engineer, Vol. 49. No. 3, pp. 137-154.
[39] Ollgaard, J. G., Slutter R. G., and Fisher, J. W. (1971). “Shear Strength of Stud Connectors in Lightweight and Normal-Weight Concrete,” Engineering Journal, AISC, Vol. 8, No. 2, pp. 55–64.
[40] Pallarés, L. and Hajjar, J. F. (2009). “Headed Steel Stud Anchors in Composite Structures: Part II. Tension and Interaction,” Report No. NSEL-014, Newmark Structural Laboratory Report Series (ISSN 1940-9826), Department of Civil and Environmental Engineering, University of Illinois at Urbana-Champaign, Urbana, Illinois, April.
[41] Precast /Prestressed Concrete Institute (PCI) (2004). PCI Design Handbook: Precast and Prestressed Concrete, Sixth Edition, Precast/Prestressed Concrete Insitute, Chicago, Illinois.
[42] Ravindra M. K., and Galambos T. V. (1978) “Load and Resistance Factor Design for Steel,” Journal of the Structural Division, ASCE, Vol. 104, No. ST9, pp. 1337-1353.
[43] Robinson, H. (1969). “Composite Beam Incorporating Cellular Steel Decking,” Journal of the Structural Division, ASCE, Vol. 95, No. ST3, pp. 355-380.
[44] Saari, W. K., Hajjar, J. F., Schultz, A. E. and Shield, C. K. (2004). “Behavior of Shear Studs in Steel Frames with Reinforced Concrete Infill Walls,” Journal of Constructional Steel Research, Vol. 60, pp. 1453-1480.
[45] Shim, C. S., Lee, P. G. and Yoon, T. Y (2004). “Static Behavior of Large Stud Shear Connectors,” Engineering Structures, Vol. 26, pp. 1853-1860.
[46] Shoup, T. E. and Singleton R. C. (1963). “Headed Concrete Anchors,” Journal of the American Concrete Institute, Vol. 60, No. 9, pp. 1229-1235.
[47] Steele, D. H. (1967). “The Use of Nelson Studs With Lightweight Aggregate Concrete in Composite Construction,” M.S. Thesis, University of Colorado, Boulder, Colorado.
[48] Topkaya, C., Yura, J. A. and Williamson, E. B. (2004). “Composite Shear Stud Strength at Early Concrete Ages,” Journal of Structural Division, ASCE, Vol. 130, No. 6, pp. 952-960.
[49] Viest, I. M. (1956). “Investigation of Stud Shear Connectors for Composite Concrete and Steel T-Beams,” Journal of the American Concrete Institute, Vol. 27, No. 8, pp. 875-891
26
[50] Wollmershauser, R. E. (1997). “Anchor Performance and the 5% Fractile.” Hilti Technical Services Bulletin, Hilti, Inc., Tulsa, Oklahoma.
[51] Zandonini, R, and Bursi, O. S. (2002). “Cyclic Behavior of Headed Shear Stud Connectors,” Composite Construction in Steel and Concrete IV. ASCE, Reston, Virginia, pp. 470–482.
[52] Zhao, G. (1993). Tragverhalten von randfernen Kopfbolzenverankerungen bei betonbruch, Ph.D. dissertation, University of Stuttgart, Stuttgart, Germany.
27
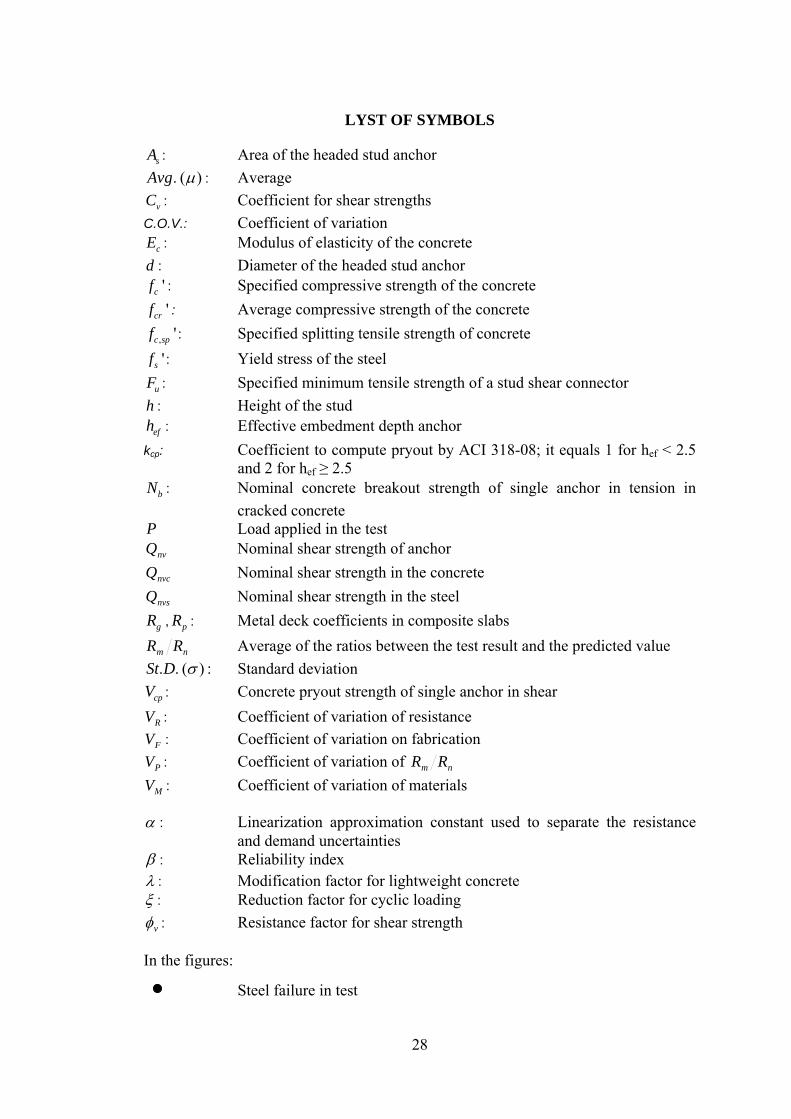
LYST OF SYMBOLS
sA : Area of the headed stud anchor . ( )Avg μ : Average
vC : Coefficient for shear strengths
C.O.V.: Coefficient of variation
cE : Modulus of elasticity of the concrete
: Diameter of the headed stud anchor d'cf : Specified compressive strength of the concrete
'crf : Average compressive strength of the concrete
, 'c spf : Specified splitting tensile strength of concrete
sf ' : Yield stress of the steel
uF : Specified minimum tensile strength of a stud shear connector : Height of the stud h
efh : Effective embedment depth anchor kcp: Coefficient to compute pryout by ACI 318-08; it equals 1 for hef < 2.5
and 2 for hef ≥ 2.5 bN : Nominal concrete breakout strength of single anchor in tension in
cracked concrete P Load applied in the test
nvQ Nominal shear strength of anchor
nvcQ Nominal shear strength in the concrete
nvsQ Nominal shear strength in the steel
gR pR : Metal deck coefficients in composite slabs ,
nm RR Average of the ratios between the test result and the predicted value
. . ( ) :St D σ Standard deviation
cpV : Concrete pryout strength of single anchor in shear : Coefficient of variation of resistance RV: Coefficient of variation on fabrication FV
nm RR: Coefficient of variation of PV
: Coefficient of variation of materials MV α : Linearization approximation constant used to separate the resistance
and demand uncertainties β : Reliability index λ : Modification factor for lightweight concrete ξ : Reduction factor for cyclic loading
: Resistance factor for shear strength vφ In the figures:
Steel failure in test
28

Concrete failure in test
Mixed failure in test
29
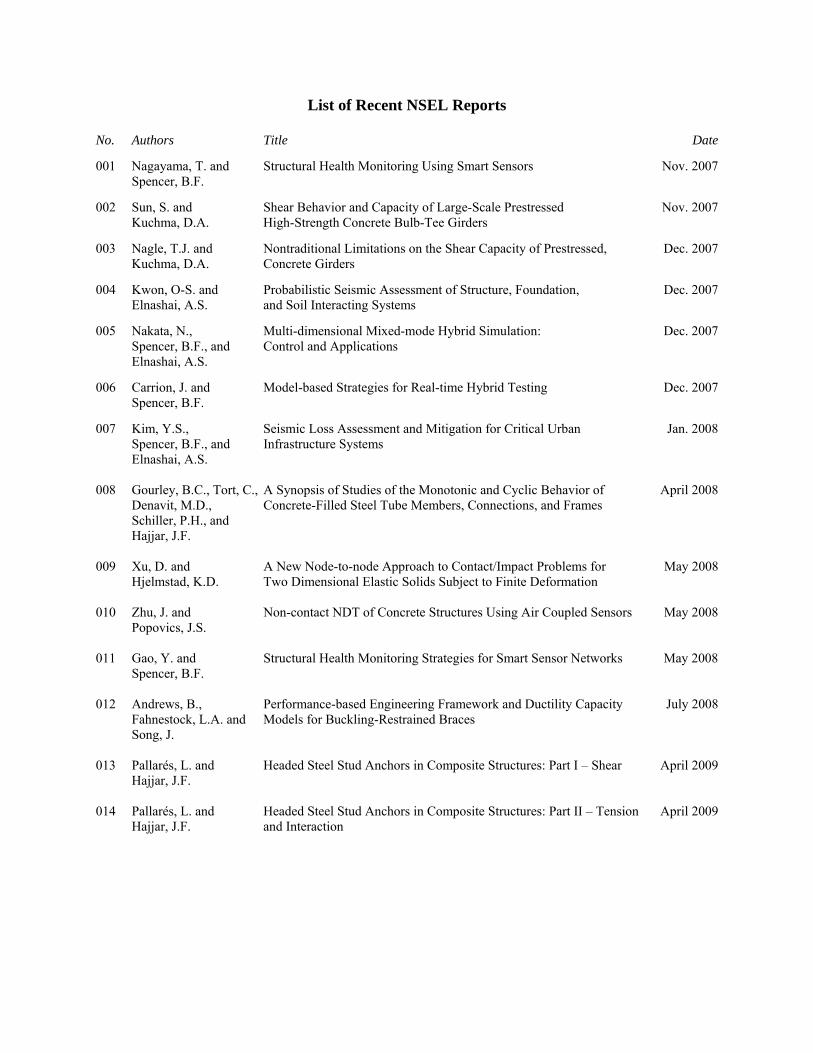
List of Recent NSEL Reports
No. Authors Title Date
001 Nagayama, T. and Structural Health Monitoring Using Smart Sensors Nov. 2007 Spencer, B.F.
002 Sun, S. and Shear Behavior and Capacity of Large-Scale Prestressed Nov. 2007 Kuchma, D.A. High-Strength Concrete Bulb-Tee Girders
003 Nagle, T.J. and Nontraditional Limitations on the Shear Capacity of Prestressed, Dec. 2007 Kuchma, D.A. Concrete Girders
004 Kwon, O-S. and Probabilistic Seismic Assessment of Structure, Foundation, Dec. 2007 Elnashai, A.S. and Soil Interacting Systems
005 Nakata, N., Multi-dimensional Mixed-mode Hybrid Simulation: Dec. 2007 Spencer, B.F., and Control and Applications Elnashai, A.S.
006 Carrion, J. and Model-based Strategies for Real-time Hybrid Testing Dec. 2007 Spencer, B.F.
007 Kim, Y.S., Seismic Loss Assessment and Mitigation for Critical Urban Jan. 2008 Spencer, B.F., and Infrastructure Systems Elnashai, A.S. 008 Gourley, B.C., Tort, C., A Synopsis of Studies of the Monotonic and Cyclic Behavior of April 2008 Denavit, M.D., Concrete-Filled Steel Tube Members, Connections, and Frames Schiller, P.H., and Hajjar, J.F. 009 Xu, D. and A New Node-to-node Approach to Contact/Impact Problems for May 2008 Hjelmstad, K.D. Two Dimensional Elastic Solids Subject to Finite Deformation 010 Zhu, J. and Non-contact NDT of Concrete Structures Using Air Coupled Sensors May 2008 Popovics, J.S. 011 Gao, Y. and Structural Health Monitoring Strategies for Smart Sensor Networks May 2008 Spencer, B.F. 012 Andrews, B., Performance-based Engineering Framework and Ductility Capacity July 2008 Fahnestock, L.A. and Models for Buckling-Restrained Braces Song, J. 013 Pallarés, L. and Headed Steel Stud Anchors in Composite Structures: Part I – Shear April 2009 Hajjar, J.F. 014 Pallarés, L. and Headed Steel Stud Anchors in Composite Structures: Part II – Tension April 2009 Hajjar, J.F. and Interaction


![[Economic Survey] Ch8_ National Market for Agriculture, NSEL Crisis](https://img.pdfslide.net/doc/110x75/55cf94a1550346f57ba35209/economic-survey-ch8-national-market-for-agriculture-nsel-crisis.jpg)